UNITED STATES
SECURITIES AND EXCHANGE COMMISSION
Washington, D.C. 20549
FORM N-CSR
CERTIFIED SHAREHOLDER REPORT OF REGISTERED
MANAGEMENT INVESTMENT COMPANIES
Investment Company Act file number 811-05251
Fidelity Concord Street Trust
(Exact name of registrant as specified in charter)
245 Summer St., Boston, MA 02210
(Address of principal executive offices) (Zip code)
Cynthia Lo Bessette, Secretary
245 Summer St.
Boston, Massachusetts 02210
(Name and address of agent for service)
Registrant's telephone number, including area code:
617-563-7000
Date of fiscal year end: | April 30 |
Date of reporting period: | October 31, 2021 |
Item 1.
Reports to Stockholders
Fidelity® Mid-Cap Stock Fund
Semi-Annual Report
October 31, 2021

Contents
Board Approval of Investment Advisory Contracts and Management Fees |
To view a fund's proxy voting guidelines and proxy voting record for the 12-month period ended June 30, visit http://www.fidelity.com/proxyvotingresults or visit the Securities and Exchange Commission's (SEC) web site at http://www.sec.gov.
You may also call 1-800-544-8544 if you’re an individual investing directly with Fidelity, call 1-800-835-5092 if you’re a plan sponsor or participant with Fidelity as your recordkeeper or call 1-877-208-0098 on institutional accounts or if you’re an advisor or invest through one to request a free copy of the proxy voting guidelines.
Standard & Poor's, S&P and S&P 500 are registered service marks of The McGraw-Hill Companies, Inc. and have been licensed for use by Fidelity Distributors Corporation.
Other third-party marks appearing herein are the property of their respective owners.
All other marks appearing herein are registered or unregistered trademarks or service marks of FMR LLC or an affiliated company. © 2021 FMR LLC. All rights reserved.
This report and the financial statements contained herein are submitted for the general information of the shareholders of the Fund. This report is not authorized for distribution to prospective investors in the Fund unless preceded or accompanied by an effective prospectus.
A fund files its complete schedule of portfolio holdings with the SEC for the first and third quarters of each fiscal year on Form N-PORT. Forms N-PORT are available on the SEC’s web site at http://www.sec.gov. A fund's Forms N-PORT may be reviewed and copied at the SEC’s Public Reference Room in Washington, DC. Information regarding the operation of the SEC's Public Reference Room may be obtained by calling 1-800-SEC-0330.
For a complete list of a fund's portfolio holdings, view the most recent holdings listing, semiannual report, or annual report on Fidelity's web site at http://www.fidelity.com, http://www.institutional.fidelity.com, or http://www.401k.com, as applicable.
NOT FDIC INSURED •MAY LOSE VALUE •NO BANK GUARANTEE
Neither the Fund nor Fidelity Distributors Corporation is a bank.
Note to Shareholders:
Early in 2020, the outbreak and spread of COVID-19 emerged as a public health emergency that had a major influence on financial markets, primarily based on its impact on the global economy and corporate earnings. On March 11, 2020, the World Health Organization declared the COVID-19 outbreak a pandemic, citing sustained risk of further global spread. The pandemic prompted a number of measures to limit the spread of COVID-19, including travel and border restrictions, quarantines, and restrictions on large gatherings. In turn, these resulted in lower consumer activity, diminished demand for a wide range of products and services, disruption in manufacturing and supply chains, and – given the wide variability in outcomes regarding the outbreak – significant market uncertainty and volatility. To help stem the turmoil, the U.S. government took unprecedented action – in concert with the U.S. Federal Reserve and central banks around the world – to help support consumers, businesses, and the broader economy, and to limit disruption to the financial system.
In general, the overall impact of the pandemic lessened in 2021, amid a resilient economy and widespread distribution of three COVID-19 vaccines granted emergency use authorization from the U.S. Food and Drug Administration (FDA) early in the year. Still, the situation remains dynamic, and the extent and duration of its influence on financial markets and the economy is highly uncertain, due in part to a recent spike in cases based on highly contagious variants of the coronavirus.
Extreme events such as the COVID-19 crisis are exogenous shocks that can have significant adverse effects on mutual funds and their investments. Although multiple asset classes may be affected by market disruption, the duration and impact may not be the same for all types of assets. Fidelity is committed to helping you stay informed amid news about COVID-19 and during increased market volatility, and we continue to take extra steps to be responsive to customer needs. We encourage you to visit us online, where we offer ongoing updates, commentary, and analysis on the markets and our funds.
Investment Summary (Unaudited)
Top Ten Stocks as of October 31, 2021
| % of fund's net assets | |
| Molina Healthcare, Inc. | 2.0 |
| American Financial Group, Inc. | 1.5 |
| First Horizon National Corp. | 1.4 |
| WNS Holdings Ltd. sponsored ADR | 1.4 |
| Arch Capital Group Ltd. | 1.3 |
| Wintrust Financial Corp. | 1.3 |
| Huntington Bancshares, Inc. | 1.2 |
| Cheniere Energy, Inc. | 1.2 |
| Hess Corp. | 1.2 |
| Brunello Cucinelli SpA | 1.2 |
| 13.7 |
Top Five Market Sectors as of October 31, 2021
| % of fund's net assets | |
| Financials | 19.1 |
| Industrials | 19.1 |
| Consumer Discretionary | 13.5 |
| Real Estate | 7.8 |
| Health Care | 7.3 |
Asset Allocation (% of fund's net assets)
| As of October 31, 2021* | ||
| Stocks | 95.7% | |
| Convertible Securities | 1.5% | |
| Other Investments | 0.1% | |
| Short-Term Investments and Net Other Assets (Liabilities) | 2.7% | |

* Foreign investments - 18.1%
Schedule of Investments October 31, 2021 (Unaudited)
Showing Percentage of Net Assets
| Common Stocks - 95.0% | |||
| Shares | Value (000s) | ||
| COMMUNICATION SERVICES - 2.6% | |||
| Entertainment - 0.7% | |||
| Endeavor Group Holdings, Inc. (a) | 903,765 | $24,293 | |
| Endeavor Group Holdings, Inc. Class A (b) | 1,042,411 | 28,020 | |
| 52,313 | |||
| Media - 1.9% | |||
| Interpublic Group of Companies, Inc. | 2,505,218 | 91,616 | |
| Omnicom Group, Inc. | 919,533 | 62,602 | |
| 154,218 | |||
| TOTAL COMMUNICATION SERVICES | 206,531 | ||
| CONSUMER DISCRETIONARY - 12.2% | |||
| Auto Components - 0.2% | |||
| Magna International, Inc. Class A (sub. vtg.) | 231,720 | 18,849 | |
| Automobiles - 0.4% | |||
| Aston Martin Lagonda Global Holdings PLC (a)(c) | 1,283,187 | 29,994 | |
| Hotels, Restaurants & Leisure - 3.9% | |||
| Boyd Gaming Corp. (c) | 544,410 | 34,722 | |
| Caesars Entertainment, Inc. (c) | 446,323 | 48,855 | |
| Churchill Downs, Inc. | 284,345 | 65,399 | |
| Elior SA (a)(c) | 3,188,777 | 25,140 | |
| MGM Resorts International | 925,200 | 43,632 | |
| Wyndham Hotels & Resorts, Inc. | 1,040,338 | 87,877 | |
| 305,625 | |||
| Household Durables - 3.1% | |||
| D.R. Horton, Inc. | 810,113 | 72,319 | |
| Lennar Corp. Class A | 378,572 | 37,831 | |
| Mohawk Industries, Inc. (c) | 240,009 | 42,532 | |
| NVR, Inc. (c) | 18,149 | 88,836 | |
| 241,518 | |||
| Internet & Direct Marketing Retail - 0.9% | |||
| Coupang, Inc. Class A (c) | 1,932,188 | 57,502 | |
| Farfetch Ltd. Class A (c) | 390,647 | 15,317 | |
| 72,819 | |||
| Specialty Retail - 1.1% | |||
| Best Buy Co., Inc. | 262,858 | 32,132 | |
| National Vision Holdings, Inc. (c)(d) | 419,895 | 25,882 | |
| Ross Stores, Inc. | 229,762 | 26,009 | |
| 84,023 | |||
| Textiles, Apparel & Luxury Goods - 2.6% | |||
| Allbirds, Inc. (b)(c) | 53,875 | 727 | |
| Brunello Cucinelli SpA (c) | 1,533,631 | 92,899 | |
| PVH Corp. | 387,769 | 42,395 | |
| Tapestry, Inc. | 1,266,710 | 49,376 | |
| Under Armour, Inc. Class A (sub. vtg.) (c) | 1,022,197 | 22,447 | |
| 207,844 | |||
| TOTAL CONSUMER DISCRETIONARY | 960,672 | ||
| CONSUMER STAPLES - 2.6% | |||
| Food & Staples Retailing - 0.9% | |||
| BJ's Wholesale Club Holdings, Inc. (c) | 1,220,732 | 71,340 | |
| Food Products - 1.7% | |||
| Bunge Ltd. | 418,779 | 38,796 | |
| Greencore Group PLC (c) | 24,936,194 | 44,091 | |
| JDE Peet's BV | 191,846 | 5,586 | |
| Lamb Weston Holdings, Inc. | 484,911 | 27,373 | |
| Nomad Foods Ltd. (c) | 665,154 | 18,112 | |
| 133,958 | |||
| TOTAL CONSUMER STAPLES | 205,298 | ||
| ENERGY - 7.0% | |||
| Energy Equipment & Services - 0.3% | |||
| Noble Corp. (a) | 2,886 | 73 | |
| Oceaneering International, Inc. (c) | 1,841,593 | 25,046 | |
| 25,119 | |||
| Oil, Gas & Consumable Fuels - 6.7% | |||
| Canadian Natural Resources Ltd. | 1,395,015 | 59,290 | |
| Cheniere Energy, Inc. | 930,663 | 96,231 | |
| Energy Transfer LP | 6,959,158 | 66,182 | |
| EQT Corp. (c) | 3,837,039 | 76,395 | |
| Golar LNG Ltd. (c) | 1,827,476 | 23,812 | |
| Harbour Energy PLC (c) | 4,751,884 | 22,852 | |
| Hess Corp. | 1,146,991 | 94,707 | |
| Imperial Oil Ltd. (d) | 1,629,071 | 55,154 | |
| Range Resources Corp. (c) | 1,369,619 | 31,940 | |
| 526,563 | |||
| TOTAL ENERGY | 551,682 | ||
| FINANCIALS - 19.1% | |||
| Banks - 8.3% | |||
| BOK Financial Corp. | 296,578 | 30,005 | |
| Comerica, Inc. | 1,069,790 | 91,028 | |
| Cullen/Frost Bankers, Inc. | 465,281 | 60,254 | |
| First Horizon National Corp. | 6,423,855 | 109,013 | |
| Huntington Bancshares, Inc. | 6,291,396 | 99,027 | |
| M&T Bank Corp. | 569,941 | 83,850 | |
| UMB Financial Corp. | 566,170 | 55,949 | |
| WesBanco, Inc. | 656,611 | 22,830 | |
| Wintrust Financial Corp. | 1,147,114 | 101,520 | |
| 653,476 | |||
| Capital Markets - 1.9% | |||
| Cboe Global Markets, Inc. | 199,055 | 26,263 | |
| Lazard Ltd. Class A | 782,571 | 38,338 | |
| Raymond James Financial, Inc. | 404,738 | 39,903 | |
| Sixth Street Specialty Lending, Inc. | 1,799,645 | 42,904 | |
| 147,408 | |||
| Diversified Financial Services - 0.2% | |||
| WeWork, Inc. (c) | 1,535,194 | 15,674 | |
| Insurance - 7.5% | |||
| American Financial Group, Inc. | 862,410 | 117,322 | |
| American International Group, Inc. | 982,624 | 58,063 | |
| Arch Capital Group Ltd. (c) | 2,430,602 | 101,648 | |
| Assurant, Inc. | 223,409 | 36,038 | |
| Beazley PLC (c) | 4,256,122 | 22,716 | |
| First American Financial Corp. | 942,276 | 68,918 | |
| Hartford Financial Services Group, Inc. | 685,905 | 50,023 | |
| Hiscox Ltd. | 2,833,022 | 32,297 | |
| RenaissanceRe Holdings Ltd. | 487,173 | 69,081 | |
| The Travelers Companies, Inc. | 240,243 | 38,650 | |
| 594,756 | |||
| Thrifts & Mortgage Finance - 1.2% | |||
| Radian Group, Inc. | 3,836,122 | 91,568 | |
| TOTAL FINANCIALS | 1,502,882 | ||
| HEALTH CARE - 6.9% | |||
| Health Care Equipment & Supplies - 1.5% | |||
| Butterfly Network, Inc. (b) | 1,616,474 | 16,682 | |
| Butterfly Network, Inc. Class A (c)(d) | 3,387,020 | 34,954 | |
| Hologic, Inc. (c) | 917,134 | 67,235 | |
| 118,871 | |||
| Health Care Providers & Services - 3.7% | |||
| Centene Corp. (c) | 641,733 | 45,717 | |
| Guardant Health, Inc. (c) | 144,285 | 16,851 | |
| Molina Healthcare, Inc. (c) | 544,971 | 161,162 | |
| Oak Street Health, Inc. (c) | 654,499 | 30,912 | |
| Universal Health Services, Inc. Class B | 312,380 | 38,766 | |
| 293,408 | |||
| Life Sciences Tools & Services - 0.7% | |||
| 10X Genomics, Inc. (c) | 88,900 | 14,337 | |
| Bruker Corp. | 514,624 | 41,324 | |
| 55,661 | |||
| Pharmaceuticals - 1.0% | |||
| Recordati SpA | 464,365 | 29,052 | |
| UCB SA | 209,100 | 24,921 | |
| Viatris, Inc. | 1,549,840 | 20,690 | |
| 74,663 | |||
| TOTAL HEALTH CARE | 542,603 | ||
| INDUSTRIALS - 19.0% | |||
| Aerospace & Defense - 1.7% | |||
| BWX Technologies, Inc. | 475,952 | 27,006 | |
| Huntington Ingalls Industries, Inc. | 234,497 | 47,540 | |
| Space Exploration Technologies Corp.: | |||
| Class A (b)(c)(e) | 139,629 | 58,643 | |
| Class C (b)(c)(e) | 2,034 | 854 | |
| 134,043 | |||
| Air Freight & Logistics - 0.7% | |||
| GXO Logistics, Inc. (c) | 626,878 | 55,667 | |
| Airlines - 0.1% | |||
| JetBlue Airways Corp. (c) | 523,444 | 7,344 | |
| Building Products - 2.4% | |||
| Builders FirstSource, Inc. (c) | 1,316,439 | 76,709 | |
| Fortune Brands Home & Security, Inc. | 317,056 | 32,149 | |
| Jeld-Wen Holding, Inc. (c) | 723,614 | 19,834 | |
| Owens Corning | 677,888 | 63,322 | |
| 192,014 | |||
| Commercial Services & Supplies - 1.1% | |||
| CoreCivic, Inc. (c) | 1,961,460 | 16,888 | |
| GFL Environmental, Inc. | 626,600 | 25,766 | |
| Stericycle, Inc. (c) | 623,876 | 41,750 | |
| 84,404 | |||
| Construction & Engineering - 1.5% | |||
| AECOM (c) | 1,316,608 | 90,016 | |
| Dycom Industries, Inc. (c) | 375,945 | 29,858 | |
| 119,874 | |||
| Electrical Equipment - 2.5% | |||
| Acuity Brands, Inc. | 323,267 | 66,409 | |
| Regal Rexnord Corp. | 443,506 | 67,559 | |
| Sensata Technologies, Inc. PLC (c) | 670,265 | 36,932 | |
| Vertiv Holdings Co. | 919,541 | 23,614 | |
| 194,514 | |||
| Industrial Conglomerates - 0.4% | |||
| Melrose Industries PLC | 14,723,014 | 31,795 | |
| Machinery - 4.8% | |||
| Allison Transmission Holdings, Inc. | 896,885 | 29,920 | |
| Donaldson Co., Inc. | 1,193,964 | 71,650 | |
| Fortive Corp. | 655,123 | 49,599 | |
| Kornit Digital Ltd. (c) | 187,742 | 31,405 | |
| Oshkosh Corp. | 540,626 | 57,847 | |
| Otis Worldwide Corp. | 285,186 | 22,903 | |
| PACCAR, Inc. | 359,100 | 32,183 | |
| Pentair PLC | 472,679 | 34,964 | |
| Woodward, Inc. | 429,793 | 48,545 | |
| 379,016 | |||
| Marine - 0.2% | |||
| Goodbulk Ltd. (c) | 1,449,666 | 12,870 | |
| Professional Services - 1.2% | |||
| Clarivate Analytics PLC (c) | 662,195 | 15,528 | |
| Leidos Holdings, Inc. | 425,367 | 42,528 | |
| Science Applications Internati | 407,699 | 36,603 | |
| 94,659 | |||
| Road & Rail - 1.7% | |||
| Knight-Swift Transportation Holdings, Inc. Class A | 1,372,936 | 77,832 | |
| XPO Logistics, Inc. (c) | 626,878 | 53,786 | |
| 131,618 | |||
| Trading Companies & Distributors - 0.7% | |||
| Beacon Roofing Supply, Inc. (c) | 1,011,088 | 53,456 | |
| TOTAL INDUSTRIALS | 1,491,274 | ||
| INFORMATION TECHNOLOGY - 7.1% | |||
| Communications Equipment - 0.2% | |||
| Ericsson (B Shares) | 1,809,429 | 19,751 | |
| Electronic Equipment & Components - 3.0% | |||
| Arrow Electronics, Inc. (c) | 761,240 | 88,114 | |
| CDW Corp. | 203,813 | 38,042 | |
| Fabrinet (c) | 709,041 | 68,068 | |
| Keysight Technologies, Inc. (c) | 238,735 | 42,977 | |
| 237,201 | |||
| IT Services - 2.7% | |||
| Akamai Technologies, Inc. (c) | 229,073 | 24,158 | |
| Euronet Worldwide, Inc. (c) | 135,785 | 15,234 | |
| Gartner, Inc. (c) | 125,125 | 41,530 | |
| Verra Mobility Corp. (c) | 1,748,729 | 26,021 | |
| WNS Holdings Ltd. sponsored ADR (c) | 1,190,615 | 105,739 | |
| 212,682 | |||
| Semiconductors & Semiconductor Equipment - 0.3% | |||
| SiTime Corp. (c) | 84,700 | 22,436 | |
| Software - 0.9% | |||
| Aspen Technology, Inc. (c) | 218,808 | 34,285 | |
| Black Knight, Inc. (c) | 282,897 | 19,834 | |
| Citrix Systems, Inc. | 155,298 | 14,711 | |
| 68,830 | |||
| TOTAL INFORMATION TECHNOLOGY | 560,900 | ||
| MATERIALS - 7.1% | |||
| Chemicals - 2.2% | |||
| CF Industries Holdings, Inc. | 496,000 | 28,173 | |
| LG Chemical Ltd. | 57,360 | 40,948 | |
| Nutrien Ltd. | 437,158 | 30,554 | |
| Olin Corp. | 1,243,807 | 70,872 | |
| 170,547 | |||
| Containers & Packaging - 1.0% | |||
| Avery Dennison Corp. | 148,835 | 32,404 | |
| O-I Glass, Inc. (c) | 3,827,734 | 49,952 | |
| 82,356 | |||
| Metals & Mining - 3.9% | |||
| Commercial Metals Co. | 1,328,573 | 42,753 | |
| Franco-Nevada Corp. | 324,412 | 46,290 | |
| Freeport-McMoRan, Inc. | 1,168,000 | 44,057 | |
| Lundin Mining Corp. | 5,207,791 | 45,320 | |
| Newcrest Mining Ltd. | 1,145,010 | 21,439 | |
| Novagold Resources, Inc. (c) | 3,676,549 | 26,855 | |
| Steel Dynamics, Inc. | 1,164,794 | 76,970 | |
| 303,684 | |||
| TOTAL MATERIALS | 556,587 | ||
| REAL ESTATE - 7.8% | |||
| Equity Real Estate Investment Trusts (REITs) - 6.9% | |||
| Apartment Income (REIT) Corp. | 811,906 | 43,526 | |
| Cousins Properties, Inc. | 1,175,511 | 46,562 | |
| Equity Residential (SBI) | 549,231 | 47,454 | |
| Gaming & Leisure Properties | 1,222,516 | 59,280 | |
| Healthcare Realty Trust, Inc. | 1,542,981 | 51,011 | |
| Healthcare Trust of America, Inc. | 1,481,495 | 49,467 | |
| National Retail Properties, Inc. | 1,269,046 | 57,564 | |
| Spirit Realty Capital, Inc. | 1,077,152 | 52,705 | |
| Tanger Factory Outlet Centers, Inc. (d) | 1,306,262 | 21,945 | |
| VEREIT, Inc. | 1,099,869 | 55,323 | |
| VICI Properties, Inc. (d) | 1,903,456 | 55,866 | |
| 540,703 | |||
| Real Estate Management & Development - 0.9% | |||
| Jones Lang LaSalle, Inc. (c) | 274,909 | 70,990 | |
| TOTAL REAL ESTATE | 611,693 | ||
| UTILITIES - 3.6% | |||
| Electric Utilities - 2.8% | |||
| Alliant Energy Corp. | 1,116,700 | 63,172 | |
| FirstEnergy Corp. | 1,008,871 | 38,872 | |
| IDACORP, Inc. | 501,100 | 52,275 | |
| OGE Energy Corp. | 1,898,185 | 64,671 | |
| 218,990 | |||
| Gas Utilities - 0.5% | |||
| Atmos Energy Corp. | 429,779 | 39,591 | |
| Multi-Utilities - 0.3% | |||
| NiSource, Inc. | 1,179,118 | 29,089 | |
| TOTAL UTILITIES | 287,670 | ||
| TOTAL COMMON STOCKS | |||
| (Cost $4,983,814) | 7,477,792 | ||
| Preferred Stocks - 2.2% | |||
| Convertible Preferred Stocks - 1.5% | |||
| CONSUMER DISCRETIONARY - 0.6% | |||
| Textiles, Apparel & Luxury Goods - 0.6% | |||
| Allbirds, Inc.: | |||
| Series A (b)(c) | 21,265 | 287 | |
| Series B (b)(c) | 3,735 | 50 | |
| Series C (b)(c) | 35,700 | 482 | |
| Series D (b)(c) | 68,801 | 929 | |
| Series Seed (b)(c) | 101,339 | 1,368 | |
| Bolt Threads, Inc.: | |||
| Series D (b)(c)(e) | 976,285 | 18,497 | |
| Series E (b)(e) | 1,419,309 | 26,890 | |
| 48,503 | |||
| CONSUMER STAPLES - 0.4% | |||
| Food & Staples Retailing - 0.1% | |||
| Sweetgreen, Inc.: | |||
| Series C (b)(c) | 3,889 | 98 | |
| Series D (b)(c) | 62,561 | 1,577 | |
| Series I (b)(c) | 147,450 | 3,716 | |
| 5,391 | |||
| Food Products - 0.3% | |||
| Bowery Farming, Inc. Series C1 (b)(e) | 466,468 | 28,104 | |
| TOTAL CONSUMER STAPLES | 33,495 | ||
| HEALTH CARE - 0.4% | |||
| Biotechnology - 0.4% | |||
| National Resilience, Inc. Series B (b)(e) | 711,831 | 31,612 | |
| INDUSTRIALS - 0.1% | |||
| Aerospace & Defense - 0.1% | |||
| Space Exploration Technologies Corp. Series H (b)(c)(e) | 18,837 | 7,911 | |
| TOTAL CONVERTIBLE PREFERRED STOCKS | 121,521 | ||
| Nonconvertible Preferred Stocks - 0.7% | |||
| CONSUMER DISCRETIONARY - 0.7% | |||
| Automobiles - 0.7% | |||
| Porsche Automobil Holding SE (Germany) | 511,528 | 53,238 | |
| TOTAL PREFERRED STOCKS | |||
| (Cost $117,961) | 174,759 | ||
| Other - 0.1% | |||
| Energy - 0.1% | |||
| Oil, Gas & Consumable Fuels - 0.1% | |||
| Utica Shale Drilling Program (non-operating revenue interest) (b)(e)(f) | |||
| (Cost $20,398) | 20,397,834 | 7,349 | |
| Money Market Funds - 3.0% | |||
| Fidelity Cash Central Fund 0.06% (g) | 126,528,303 | 126,554 | |
| Fidelity Securities Lending Cash Central Fund 0.06% (g)(h) | 106,926,447 | 106,937 | |
| TOTAL MONEY MARKET FUNDS | |||
| (Cost $233,489) | 233,491 | ||
| TOTAL INVESTMENT IN SECURITIES - 100.3% | |||
| (Cost $5,355,662) | 7,893,391 | ||
| NET OTHER ASSETS (LIABILITIES) - (0.3)% | (27,081) | ||
| NET ASSETS - 100% | $7,866,310 |
Legend
(a) Security exempt from registration under Rule 144A of the Securities Act of 1933. These securities may be resold in transactions exempt from registration, normally to qualified institutional buyers. At the end of the period, the value of these securities amounted to $79,500,000 or 1.0% of net assets.
(b) Restricted securities (including private placements) - Investment in securities not registered under the Securities Act of 1933 (excluding 144A issues). At the end of the period, the value of restricted securities (excluding 144A issues) amounted to $233,796,000 or 3.0% of net assets.
(c) Non-income producing
(d) Security or a portion of the security is on loan at period end.
(e) Level 3 security
(f) Investment is owned by a wholly-owned subsidiary (Subsidiary) that is treated as a corporation for U.S. tax purposes.
(g) Affiliated fund that is generally available only to investment companies and other accounts managed by Fidelity Investments. The rate quoted is the annualized seven-day yield of the fund at period end. A complete unaudited listing of the fund's holdings as of its most recent quarter end is available upon request. In addition, each Fidelity Central Fund's financial statements are available on the SEC's website or upon request.
(h) Investment made with cash collateral received from securities on loan.
Additional information on each restricted holding is as follows:
| Security | Acquisition Date | Acquisition Cost (000s) |
| Allbirds, Inc. | 10/9/18 | $591 |
| Allbirds, Inc. Series A | 10/9/18 | $233 |
| Allbirds, Inc. Series B | 10/9/18 | $41 |
| Allbirds, Inc. Series C | 10/9/18 | $392 |
| Allbirds, Inc. Series D | 12/23/19 | $887 |
| Allbirds, Inc. Series Seed | 10/9/18 - 1/23/20 | $1,012 |
| Bolt Threads, Inc. Series D | 12/13/17 | $15,659 |
| Bolt Threads, Inc. Series E | 2/7/20 - 9/2/21 | $25,230 |
| Bowery Farming, Inc. Series C1 | 5/18/21 | $28,104 |
| Butterfly Network, Inc. | 2/12/21 | $16,165 |
| Endeavor Group Holdings, Inc. Class A | 3/29/21 | $25,018 |
| National Resilience, Inc. Series B | 12/1/20 | $9,724 |
| Space Exploration Technologies Corp. Class A | 4/8/16 - 9/11/17 | $14,283 |
| Space Exploration Technologies Corp. Class C | 9/11/17 | $275 |
| Space Exploration Technologies Corp. Series H | 8/4/17 | $2,543 |
| Sweetgreen, Inc. Series C | 9/13/19 | $67 |
| Sweetgreen, Inc. Series D | 9/13/19 | $1,070 |
| Sweetgreen, Inc. Series I | 9/13/19 | $2,521 |
| Utica Shale Drilling Program (non-operating revenue interest) | 10/5/16 - 9/1/17 | $20,398 |
Affiliated Central Funds
Fiscal year to date information regarding the Fund's investments in Fidelity Central Funds, including the ownership percentage, is presented below.
| Fund (Amounts in thousands) | Value, beginning of period | Purchases | Sales Proceeds | Dividend Income | Realized Gain/Loss | Change in Unrealized appreciation (depreciation) | Value, end of period | % ownership, end of period |
| Fidelity Cash Central Fund 0.06% | $226,552 | $718,293 | $818,290 | $39 | $-- | $(1) | $126,554 | 0.2% |
| Fidelity Securities Lending Cash Central Fund 0.06% | 122,089 | 507,893 | 523,045 | 132 | -- | -- | 106,937 | 0.3% |
| Total | $348,641 | $1,226,186 | $1,341,335 | $171 | $-- | $(1) | $233,491 |
Amounts in the income column in the above table include any capital gain distributions from underlying funds, which are presented in the corresponding line-item in the Statement of Operations, if applicable. Amount for Fidelity Securities Lending Cash Central Fund represents the income earned on investing cash collateral, less rebates paid to borrowers and any lending agent fees associated with the loan, plus any premium payments received for lending certain types of securities.
Investment Valuation
The following is a summary of the inputs used, as of October 31, 2021, involving the Fund's assets and liabilities carried at fair value. The inputs or methodology used for valuing securities may not be an indication of the risk associated with investing in those securities. For more information on valuation inputs, and their aggregation into the levels used below, please refer to the Investment Valuation section in the accompanying Notes to Financial Statements.
| Valuation Inputs at Reporting Date: | ||||
| Description | Total | Level 1 | Level 2 | Level 3 |
| (Amounts in thousands) | ||||
| Investments in Securities: | ||||
| Equities: | ||||
| Communication Services | $206,531 | $206,531 | $-- | $-- |
| Consumer Discretionary | 1,062,413 | 959,945 | 57,081 | 45,387 |
| Consumer Staples | 238,793 | 205,298 | 5,391 | 28,104 |
| Energy | 551,682 | 551,682 | -- | -- |
| Financials | 1,502,882 | 1,502,882 | -- | -- |
| Health Care | 574,215 | 542,603 | -- | 31,612 |
| Industrials | 1,499,185 | 1,431,777 | -- | 67,408 |
| Information Technology | 560,900 | 541,149 | 19,751 | -- |
| Materials | 556,587 | 515,639 | 40,948 | -- |
| Real Estate | 611,693 | 611,693 | -- | -- |
| Utilities | 287,670 | 287,670 | -- | -- |
| Other | 7,349 | -- | -- | 7,349 |
| Money Market Funds | 233,491 | 233,491 | -- | -- |
| Total Investments in Securities: | $7,893,391 | $7,590,360 | $123,171 | $179,860 |
The following is a reconciliation of Investments in Securities for which Level 3 inputs were used in determining value:
| (Amounts in thousands) | |
| Investments in Securities: | |
| Beginning Balance | $119,261 |
| Net Realized Gain (Loss) on Investment Securities | (460) |
| Net Unrealized Gain (Loss) on Investment Securities | 29,385 |
| Cost of Purchases | 46,178 |
| Proceeds of Sales | (7,180) |
| Amortization/Accretion | 6 |
| Transfers into Level 3 | 7,161 |
| Transfers out of Level 3 | (14,491) |
| Ending Balance | $179,860 |
| The change in unrealized gain (loss) for the period attributable to Level 3 securities held at October 31, 2021 | $28,936 |
The information used in the above reconciliation represents fiscal year to date activity for any Investments in Securities identified as using Level 3 inputs at either the beginning or the end of the current fiscal period. Cost of purchases and proceeds of sales may include securities received and/or delivered through in-kind transactions. Transfers in or out of Level 3 represent the beginning value of any Security or Instrument where a change in the pricing level occurred from the beginning to the end of the period. The cost of purchases and the proceeds of sales may include securities received or delivered through corporate actions or exchanges. Realized and unrealized gains (losses) disclosed in the reconciliation are included in Net Gain (Loss) on the Fund's Statement of Operations.
Other Information
Distribution of investments by country or territory of incorporation, as a percentage of Total Net Assets, is as follows (Unaudited):
| United States of America | 81.9% |
| Bermuda | 4.1% |
| Canada | 3.9% |
| United Kingdom | 1.9% |
| Italy | 1.6% |
| Bailiwick of Jersey | 1.6% |
| Ireland | 1.1% |
| Others (Individually Less Than 1%) | 3.9% |
| 100.0% |
See accompanying notes which are an integral part of the financial statements.
Financial Statements
Statement of Assets and Liabilities
| Amounts in thousands (except per-share amounts) | October 31, 2021 (Unaudited) | |
| Assets | ||
| Investment in securities, at value (including securities loaned of $102,645) — See accompanying schedule: Unaffiliated issuers (cost $5,122,173) | $7,659,900 | |
| Fidelity Central Funds (cost $233,489) | 233,491 | |
| Total Investment in Securities (cost $5,355,662) | $7,893,391 | |
| Cash | 6 | |
| Restricted cash | 339 | |
| Receivable for investments sold | 114,013 | |
| Receivable for fund shares sold | 3,144 | |
| Dividends receivable | 2,923 | |
| Distributions receivable from Fidelity Central Funds | 22 | |
| Prepaid expenses | 11 | |
| Other receivables | 1,633 | |
| Total assets | 8,015,482 | |
| Liabilities | ||
| Payable for investments purchased | $33,081 | |
| Payable for fund shares redeemed | 3,941 | |
| Accrued management fee | 3,735 | |
| Other affiliated payables | 811 | |
| Other payables and accrued expenses | 687 | |
| Collateral on securities loaned | 106,917 | |
| Total liabilities | 149,172 | |
| Net Assets | $7,866,310 | |
| Net Assets consist of: | ||
| Paid in capital | $4,940,788 | |
| Total accumulated earnings (loss) | 2,925,522 | |
| Net Assets | $7,866,310 | |
| Net Asset Value and Maximum Offering Price | ||
| Mid-Cap Stock: | ||
| Net Asset Value, offering price and redemption price per share ($6,351,122 ÷ 147,191 shares) | $43.15 | |
| Class K: | ||
| Net Asset Value, offering price and redemption price per share ($1,515,188 ÷ 35,071 shares) | $43.20 |
See accompanying notes which are an integral part of the financial statements.
Statement of Operations
| Amounts in thousands | Six months ended October 31, 2021 (Unaudited) | |
| Investment Income | ||
| Dividends | $79,693 | |
| Income from Fidelity Central Funds (including $132 from security lending) | 171 | |
| Total income | 79,864 | |
| Expenses | ||
| Management fee | ||
| Basic fee | $20,919 | |
| Performance adjustment | 4,194 | |
| Transfer agent fees | 4,400 | |
| Accounting fees | 601 | |
| Custodian fees and expenses | 69 | |
| Independent trustees' fees and expenses | 14 | |
| Registration fees | 83 | |
| Audit | 41 | |
| Legal | 5 | |
| Interest | 1 | |
| Miscellaneous | 21 | |
| Total expenses before reductions | 30,348 | |
| Expense reductions | (113) | |
| Total expenses after reductions | 30,235 | |
| Net investment income (loss) | 49,629 | |
| Realized and Unrealized Gain (Loss) | ||
| Net realized gain (loss) on: | ||
| Investment securities: | ||
| Unaffiliated issuers | 330,999 | |
| Foreign currency transactions | (76) | |
| Total net realized gain (loss) | 330,923 | |
| Change in net unrealized appreciation (depreciation) on: | ||
| Investment securities: | ||
| Unaffiliated issuers | (52,929) | |
| Fidelity Central Funds | (1) | |
| Assets and liabilities in foreign currencies | 2 | |
| Total change in net unrealized appreciation (depreciation) | (52,928) | |
| Net gain (loss) | 277,995 | |
| Net increase (decrease) in net assets resulting from operations | $327,624 |
See accompanying notes which are an integral part of the financial statements.
Statement of Changes in Net Assets
| Amounts in thousands | Six months ended October 31, 2021 (Unaudited) | Year ended April 30, 2021 |
| Increase (Decrease) in Net Assets | ||
| Operations | ||
| Net investment income (loss) | $49,629 | $66,028 |
| Net realized gain (loss) | 330,923 | 922,757 |
| Change in net unrealized appreciation (depreciation) | (52,928) | 2,344,917 |
| Net increase (decrease) in net assets resulting from operations | 327,624 | 3,333,702 |
| Distributions to shareholders | (595,996) | (464,243) |
| Share transactions - net increase (decrease) | 152,546 | (508,597) |
| Total increase (decrease) in net assets | (115,826) | 2,360,862 |
| Net Assets | ||
| Beginning of period | 7,982,136 | 5,621,274 |
| End of period | $7,866,310 | $7,982,136 |
See accompanying notes which are an integral part of the financial statements.
Financial Highlights
Fidelity Mid-Cap Stock Fund
| Six months ended (Unaudited) October 31, | Years endedApril 30, | |||||
| 2021 | 2021 | 2020 | 2019 | 2018 | 2017 | |
| Selected Per–Share Data | ||||||
| Net asset value, beginning of period | $44.52 | $28.96 | $35.31 | $38.38 | $36.62 | $34.07 |
| Income from Investment Operations | ||||||
| Net investment income (loss)A | .26 | .35 | .31 | .34 | .22 | .22 |
| Net realized and unrealized gain (loss) | 1.64 | 17.71 | (4.29) | 2.26 | 4.30 | 5.19 |
| Total from investment operations | 1.90 | 18.06 | (3.98) | 2.60 | 4.52 | 5.41 |
| Distributions from net investment income | – | (.39)B | (.35) | (.29) | (.22) | (.27) |
| Distributions from net realized gain | (3.27) | (2.10)B | (2.02) | (5.38) | (2.55) | (2.59) |
| Total distributions | (3.27) | (2.50)C | (2.37) | (5.67) | (2.76)C | (2.86) |
| Redemption fees added to paid in capitalA | – | – | – | – | – | –D |
| Net asset value, end of period | $43.15 | $44.52 | $28.96 | $35.31 | $38.38 | $36.62 |
| Total ReturnE,F | 4.36% | 64.86% | (12.42)% | 7.90% | 12.66% | 16.80% |
| Ratios to Average Net AssetsG,H | ||||||
| Expenses before reductions | .78%I | .77% | .86% | .68% | .61% | .58% |
| Expenses net of fee waivers, if any | .78%I | .77% | .86% | .67% | .61% | .58% |
| Expenses net of all reductions | .78%I | .76% | .86% | .67% | .61% | .58% |
| Net investment income (loss) | 1.23%I | .97% | .90% | .93% | .58% | .64% |
| Supplemental Data | ||||||
| Net assets, end of period (in millions) | $6,351 | $6,020 | $4,125 | $5,373 | $5,629 | $5,622 |
| Portfolio turnover rateJ | 16%I,K | 30%K | 36%K | 29% | 22% | 27%K |
A Calculated based on average shares outstanding during the period.
B The amount shown reflects reclassifications related to book to tax differences that were made in the year shown.
C Total distributions per share do not sum due to rounding.
D Amount represents less than $.005 per share.
E Total returns for periods of less than one year are not annualized.
F Total returns would have been lower if certain expenses had not been reduced during the applicable periods shown.
G Fees and expenses of any underlying mutual funds or exchange-traded funds (ETFs) are not included in the Fund's expense ratio. The Fund indirectly bears its proportionate share of these expenses. For additional expense information related to investments in Fidelity Central Funds, please refer to the "Investments in Fidelity Central Funds" note found in the Notes to Financial Statements section of the most recent Annual or Semi-Annual report.
H Expense ratios reflect operating expenses of the class. Expenses before reductions do not reflect amounts reimbursed, waived, or reduced through arrangements with the investment adviser, brokerage services, or other offset arrangements, if applicable, and do not represent the amount paid by the class during periods when reimbursements, waivers or reductions occur.
I Annualized
J Amount does not include the portfolio activity of any underlying mutual funds or exchange-traded funds (ETFs).
K Portfolio turnover rate excludes securities received or delivered in-kind.
See accompanying notes which are an integral part of the financial statements.
Fidelity Mid-Cap Stock Fund Class K
| Six months ended (Unaudited) October 31, | Years endedApril 30, | |||||
| 2021 | 2021 | 2020 | 2019 | 2018 | 2017 | |
| Selected Per–Share Data | ||||||
| Net asset value, beginning of period | $44.55 | $28.98 | $35.32 | $38.40 | $36.64 | $34.08 |
| Income from Investment Operations | ||||||
| Net investment income (loss)A | .28 | .38 | .34 | .37 | .26 | .26 |
| Net realized and unrealized gain (loss) | 1.65 | 17.72 | (4.27) | 2.26 | 4.30 | 5.20 |
| Total from investment operations | 1.93 | 18.10 | (3.93) | 2.63 | 4.56 | 5.46 |
| Distributions from net investment income | – | (.43)B | (.39) | (.33) | (.26) | (.31) |
| Distributions from net realized gain | (3.28) | (2.10)B | (2.02) | (5.38) | (2.55) | (2.59) |
| Total distributions | (3.28) | (2.53) | (2.41) | (5.71) | (2.80)C | (2.90) |
| Redemption fees added to paid in capitalA | – | – | – | – | – | –D |
| Net asset value, end of period | $43.20 | $44.55 | $28.98 | $35.32 | $38.40 | $36.64 |
| Total ReturnE,F | 4.44% | 65.01% | (12.30)% | 7.99% | 12.78% | 16.96% |
| Ratios to Average Net AssetsG,H | ||||||
| Expenses before reductions | .69%I | .67% | .76% | .57% | .51% | .46% |
| Expenses net of fee waivers, if any | .69%I | .67% | .76% | .57% | .51% | .46% |
| Expenses net of all reductions | .69%I | .66% | .76% | .57% | .50% | .46% |
| Net investment income (loss) | 1.31%I | 1.07% | 1.00% | 1.03% | .69% | .76% |
| Supplemental Data | ||||||
| Net assets, end of period (in millions) | $1,515 | $1,962 | $1,496 | $2,348 | $2,354 | $2,213 |
| Portfolio turnover rateJ | 16%I,K | 30%K | 36%K | 29% | 22% | 27%K |
A Calculated based on average shares outstanding during the period.
B The amount shown reflects reclassifications related to book to tax differences that were made in the year shown.
C Total distributions per share do not sum due to rounding.
D Amount represents less than $.005 per share.
E Total returns for periods of less than one year are not annualized.
F Total returns would have been lower if certain expenses had not been reduced during the applicable periods shown.
G Fees and expenses of any underlying mutual funds or exchange-traded funds (ETFs) are not included in the Fund's expense ratio. The Fund indirectly bears its proportionate share of these expenses. For additional expense information related to investments in Fidelity Central Funds, please refer to the "Investments in Fidelity Central Funds" note found in the Notes to Financial Statements section of the most recent Annual or Semi-Annual report.
H Expense ratios reflect operating expenses of the class. Expenses before reductions do not reflect amounts reimbursed, waived, or reduced through arrangements with the investment adviser, brokerage services, or other offset arrangements, if applicable, and do not represent the amount paid by the class during periods when reimbursements, waivers or reductions occur.
I Annualized
J Amount does not include the portfolio activity of any underlying mutual funds or exchange-traded funds (ETFs).
K Portfolio turnover rate excludes securities received or delivered in-kind.
See accompanying notes which are an integral part of the financial statements.
Notes to Financial Statements (Unaudited)
For the period ended October 31, 2021
(Amounts in thousands except percentages)
1. Organization.
Fidelity Mid-Cap Stock Fund (the Fund) is a fund of Fidelity Concord Street Trust (the Trust) and is authorized to issue an unlimited number of shares. The Trust is registered under the Investment Company Act of 1940, as amended (the 1940 Act), as an open-end management investment company organized as a Massachusetts business trust. The Fund offers Mid-Cap Stock and Class K shares, each of which has equal rights as to assets and voting privileges. Each class has exclusive voting rights with respect to matters that affect that class.
2. Investments in Fidelity Central Funds.
Funds may invest in Fidelity Central Funds, which are open-end investment companies generally available only to other investment companies and accounts managed by the investment adviser and its affiliates. The Schedule of Investments lists any Fidelity Central Funds held as an investment as of period end, but does not include the underlying holdings of each Fidelity Central Fund. An investing fund indirectly bears its proportionate share of the expenses of the underlying Fidelity Central Funds.
Based on its investment objective, each Fidelity Central Fund may invest or participate in various investment vehicles or strategies that are similar to those of the investing fund. These strategies are consistent with the investment objectives of the investing fund and may involve certain economic risks which may cause a decline in value of each of the Fidelity Central Funds and thus a decline in the value of the investing fund.
| Fidelity Central Fund | Investment Manager | Investment Objective | Investment Practices | Expense Ratio(a) |
| Fidelity Money Market Central Funds | Fidelity Management & Research Company LLC (FMR) | Each fund seeks to obtain a high level of current income consistent with the preservation of capital and liquidity. | Short-term Investments | Less than .005% |
(a) Expenses expressed as a percentage of average net assets and are as of each underlying Central Fund's most recent annual or semi-annual shareholder report.
A complete unaudited list of holdings for each Fidelity Central Fund is available upon request or at the Securities and Exchange Commission website at www.sec.gov. In addition, the financial statements of the Fidelity Central Funds which contain the significant accounting policies (including investment valuation policies) of those funds, and are not covered by the Report of Independent Registered Public Accounting Firm, are available on the Securities and Exchange Commission website or upon request.
3. Significant Accounting Policies.
The Fund is an investment company and applies the accounting and reporting guidance of the Financial Accounting Standards Board (FASB) Accounting Standards Codification Topic 946 Financial Services - Investment Companies. The financial statements have been prepared in conformity with accounting principles generally accepted in the United States of America (GAAP), which require management to make certain estimates and assumptions at the date of the financial statements. Actual results could differ from those estimates. Subsequent events, if any, through the date that the financial statements were issued have been evaluated in the preparation of the financial statements. The Fund's Schedule of Investments lists any underlying mutual funds or exchange-traded funds (ETFs) but does not include the underlying holdings of these funds. The following summarizes the significant accounting policies of the Fund:
Investment Valuation. Investments are valued as of 4:00 p.m. Eastern time on the last calendar day of the period. The Board of Trustees (the Board) has delegated the day to day responsibility for the valuation of the Fund's investments to the Fair Value Committee (the Committee) established by the Fund's investment adviser. In accordance with valuation policies and procedures approved by the Board, the Fund attempts to obtain prices from one or more third party pricing vendors or brokers to value its investments. When current market prices, quotations or currency exchange rates are not readily available or reliable, investments will be fair valued in good faith by the Committee, in accordance with procedures adopted by the Board. Factors used in determining fair value vary by investment type and may include market or investment specific events. The frequency with which these procedures are used cannot be predicted and they may be utilized to a significant extent. The Committee oversees the Fund's valuation policies and procedures and reports to the Board on the Committee's activities and fair value determinations. The Board monitors the appropriateness of the procedures used in valuing the Fund's investments and ratifies the fair value determinations of the Committee.
The Fund categorizes the inputs to valuation techniques used to value its investments into a disclosure hierarchy consisting of three levels as shown below:
- Level 1 – quoted prices in active markets for identical investments
- Level 2 – other significant observable inputs (including quoted prices for similar investments, interest rates, prepayment speeds, etc.)
- Level 3 – unobservable inputs (including the Fund's own assumptions based on the best information available)
Valuation techniques used to value the Fund's investments by major category are as follows:
Equity securities, including restricted securities, for which market quotations are readily available, are valued at the last reported sale price or official closing price as reported by a third party pricing vendor on the primary market or exchange on which they are traded and are categorized as Level 1 in the hierarchy. In the event there were no sales during the day or closing prices are not available, securities are valued at the last quoted bid price or may be valued using the last available price and are generally categorized as Level 2 in the hierarchy. For foreign equity securities, when market or security specific events arise, comparisons to the valuation of American Depositary Receipts (ADRs), futures contracts, Exchange-Traded Funds (ETFs) and certain indexes as well as quoted prices for similar securities may be used and would be categorized as Level 2 in the hierarchy. For equity securities, including restricted securities, where observable inputs are limited, assumptions about market activity and risk are used and these securities may be categorized as Level 3 in the hierarchy. Securities, including private placements or other restricted securities, for which observable inputs are not available are valued using alternate valuation approaches, including the market approach, the income approach and cost approach, and are categorized as Level 3 in the hierarchy. The market approach considers factors including the price of recent investments in the same or a similar security or financial metrics of comparable securities. The income approach considers factors including expected future cash flows, security specific risks and corresponding discount rates. The cost approach considers factors including the value of the security's underlying assets and liabilities.
Investments in open-end mutual funds, including the Fidelity Central Funds, are valued at their closing net asset value (NAV) each business day and are categorized as Level 1 in the hierarchy.
The following provides information on Level 3 securities held by the Fund that were valued at period end based on unobservable inputs. These amounts exclude valuations provided by a broker.
| Asset Type | Fair Value | Valuation Technique(s) | Unobservable Input | Amount or Range/Weighted Average | Impact to Valuation from an Increase in Input(a) |
| Equities | $172,511 | Market approach | Transaction price | $18.95 - $419.99 / $187.05 | Increase |
| Other | $ 7,349 | Discounted cash flow | Discount rate | 12.3% | Decrease |
(a) Represents the directional change in the fair value of the Level 3 investments that could have resulted from an increase in the corresponding input as of period end. A decrease to the unobservable input would have had the opposite effect. Significant changes in these inputs may have resulted in a significantly higher or lower fair value measurement at period end.
Changes in valuation techniques may result in transfers in or out of an assigned level within the disclosure hierarchy. The aggregate value of investments by input level as of October 31, 2021, as well as a roll forward of Level 3 investments, is included at the end of the Fund's Schedule of Investments.
Foreign Currency. Certain Funds may use foreign currency contracts to facilitate transactions in foreign-denominated securities. Gains and losses from these transactions may arise from changes in the value of the foreign currency or if the counterparties do not perform under the contracts' terms.
Foreign-denominated assets, including investment securities, and liabilities are translated into U.S. dollars at the exchange rates at period end. Purchases and sales of investment securities, income and dividends received, and expenses denominated in foreign currencies are translated into U.S. dollars at the exchange rate in effect on the transaction date.
The effects of exchange rate fluctuations on investments are included with the net realized and unrealized gain (loss) on investment securities. Other foreign currency transactions resulting in realized and unrealized gain (loss) are disclosed separately.
Investment Transactions and Income. For financial reporting purposes, the Fund's investment holdings and NAV include trades executed through the end of the last business day of the period. The NAV per share for processing shareholder transactions is calculated as of the close of business of the New York Stock Exchange (NYSE), normally 4:00 p.m. Eastern time and includes trades executed through the end of the prior business day. Gains and losses on securities sold are determined on the basis of identified cost and include proceeds received from litigation. Commissions paid to certain brokers with whom the investment adviser, or its affiliates, places trades on behalf of a fund include an amount in addition to trade execution, which may be rebated back to a fund. Any such rebates are included in net realized gain (loss) on investments in the Statement of Operations. Dividend income is recorded on the ex-dividend date, except for certain dividends from foreign securities where the ex-dividend date may have passed, which are recorded as soon as the Fund is informed of the ex-dividend date. Non-cash dividends included in dividend income, if any, are recorded at the fair market value of the securities received. Income and capital gain distributions from Fidelity Central Funds, if any, are recorded on the ex-dividend date. Certain distributions received by the Fund represent a return of capital or capital gain. The Fund determines the components of these distributions subsequent to the ex-dividend date, based upon receipt of tax filings or other correspondence relating to the underlying investment. These distributions are recorded as a reduction of cost of investments and/or as a realized gain. Investment income is recorded net of foreign taxes withheld where recovery of such taxes is uncertain. Funds may file withholding tax reclaims in certain jurisdictions to recover a portion of amounts previously withheld. Any withholding tax reclaims income is included in the Statement of Operations in dividends. Any receivables for withholding tax reclaims are included in the Statement of Assets and Liabilities in dividends receivable.
Class Allocations and Expenses. Investment income, realized and unrealized capital gains and losses, common expenses of a fund, and certain fund-level expense reductions, if any, are allocated daily on a pro-rata basis to each class based on the relative net assets of each class to the total net assets of a fund. Each class differs with respect to transfer agent and distribution and service plan fees incurred, as applicable. Certain expense reductions may also differ by class, if applicable. For the reporting period, the allocated portion of income and expenses to each class as a percent of its average net assets may vary due to the timing of recording these transactions in relation to fluctuating net assets of the classes. Expenses directly attributable to a fund are charged to that fund. Expenses attributable to more than one fund are allocated among the respective funds on the basis of relative net assets or other appropriate methods. Expenses included in the accompanying financial statements reflect the expenses of that fund and do not include any expenses associated with any underlying mutual funds or exchange-traded funds. Although not included in a fund's expenses, a fund indirectly bears its proportionate share of these expenses through the net asset value of each underlying mutual fund or exchange-traded fund. Expense estimates are accrued in the period to which they relate and adjustments are made when actual amounts are known.
Deferred Trustee Compensation. Under a Deferred Compensation Plan (the Plan) for certain Funds, certain independent Trustees have elected to defer receipt of a portion of their annual compensation. Deferred amounts are invested in affiliated mutual funds, are marked-to-market and remain in a fund until distributed in accordance with the Plan. The investment of deferred amounts and the offsetting payable to the Trustees presented below are included in the accompanying Statement of Assets and Liabilities in other receivables and other payables and accrued expenses, as applicable.
| Fidelity Mid-Cap Stock Fund | $632 |
Income Tax Information and Distributions to Shareholders. Each year, the Fund intends to qualify as a regulated investment company under Subchapter M of the Internal Revenue Code, including distributing substantially all of its taxable income and realized gains. As a result, no provision for U.S. Federal income taxes is required. The Fund files a U.S. federal tax return, in addition to state and local tax returns as required. The Fund's federal income tax returns are subject to examination by the Internal Revenue Service (IRS) for a period of three fiscal years after they are filed. State and local tax returns may be subject to examination for an additional fiscal year depending on the jurisdiction. Foreign taxes are provided for based on the Fund's understanding of the tax rules and rates that exist in the foreign markets in which it invests.
Distributions are declared and recorded on the ex-dividend date. Income and capital gain distributions are declared separately for each class. Income and capital gain distributions are determined in accordance with income tax regulations, which may differ from GAAP.
Capital accounts within the financial statements are adjusted for permanent book-tax differences. These adjustments have no impact on net assets or the results of operations. Capital accounts are not adjusted for temporary book-tax differences which will reverse in a subsequent period.
Book-tax differences are primarily due foreign currency transactions, passive foreign investment companies (PFIC), partnerships, deferred trustees compensation, redemptions in-kind and losses deferred due to wash sales.
As of period end, the cost and unrealized appreciation (depreciation) in securities, and derivatives if applicable, for federal income tax purposes were as follows:
| Gross unrealized appreciation | $2,808,525 |
| Gross unrealized depreciation | (273,013) |
| Net unrealized appreciation (depreciation) | $2,535,512 |
| Tax cost | $5,357,879 |
Restricted Securities (including Private Placements). Funds may invest in securities that are subject to legal or contractual restrictions on resale. These securities generally may be resold in transactions exempt from registration or to the public if the securities are registered. Disposal of these securities may involve time-consuming negotiations and expense, and prompt sale at an acceptable price may be difficult. Information regarding restricted securities held at period end is included at the end of the Schedule of Investments, if applicable.
Consolidated Subsidiary. The Funds included in the table below hold certain investments through a wholly-owned subsidiary ("Subsidiary"), which may be subject to federal and state taxes upon disposition.
As of period end, investments in Subsidiaries were as follows:
| $ Amount | % of Net Assets | |
| Fidelity Mid-Cap Stock Fund | 7,688 | .10 |
The financial statements have been consolidated to include the Subsidiary accounts where applicable. Accordingly, all inter-company transactions and balances have been eliminated.
At period end, any estimated tax liability for these investments is presented as "Deferred taxes" in the Statement of Assets and Liabilities and included in "Change in net unrealized appreciation (depreciation) on investment securities" in the Statement of Operations. The tax liability incurred may differ materially depending on conditions when these investments are disposed. Any cash held by a Subsidiary is restricted as to its use and is presented as "Restricted cash" in the Statement of Assets and Liabilities, if applicable.
4. Purchases and Sales of Investments.
Purchases and sales of securities, other than short-term securities and in-kind transactions, as applicable, are noted in the table below.
| Purchases ($) | Sales ($) | |
| Fidelity Mid-Cap Stock Fund | 625,374 | 1,039,589 |
Unaffiliated Redemptions In-Kind. Shares that were redeemed in-kind for investments, including accrued interest and cash, if any, are shown in the table below. The net realized gain or loss on investments delivered through in-kind redemptions is included in the accompanying Statement of Operations. The amount of the in-kind redemptions is included in share transactions in the accompanying Statement of Changes in Net Assets. There was no gain or loss for federal income tax purposes.
| Shares | Total net realized gain or loss ($) | Total Proceeds ($) | Participating classes | |
| Fidelity Mid-Cap Stock Fund | 1,960 | 31,263 | 80,553 | Class K |
Prior Fiscal Year Unaffiliated Redemptions In-Kind. Shares that were redeemed in-kind for investments, including accrued interest and cash, if any, are shown in the table below; along with realized gain or loss on investments delivered through in-kind redemptions. The amount of the in-kind redemptions is included in share transactions in the accompanying Statement of Changes in Net Assets. There was no gain or loss for federal income tax purposes.
| Shares | Total net realized gain or loss ($) | Total Proceeds ($) | Participating classes | |
| Fidelity Mid-Cap Stock Fund | 3,001 | 43,747 | 117,754 | Class K |
5. Fees and Other Transactions with Affiliates.
Management Fee. Fidelity Management & Research Company LLC (the investment adviser) and its affiliates provide the Fund with investment management related services for which the Fund pays a monthly management fee. The management fee is the sum of an individual fund fee rate that is based on an annual rate of .30% of the Fund's average net assets and an annualized group fee rate that averaged .23% during the period. The group fee rate is based upon the monthly average net assets of a group of registered investment companies with which the investment adviser has management contracts. The group fee rate decreases as assets under management increase and increases as assets under management decrease. In addition, the management fee is subject to a performance adjustment (up to a maximum of +/- .20% of the Fund's average net assets over a 36 month performance period). The upward or downward adjustment to the management fee is based on the relative investment performance of the Fund as compared to its benchmark index, the S&P MidCap 400 Index, over the same 36 month performance period. For the reporting period, the total annualized management fee rate, including the performance adjustment, was .63% of the Fund's average net assets. The performance adjustment included in the management fee rate may be higher or lower than the maximum performance adjustment rate due to the difference between the average net assets for the reporting and performance periods.
Transfer Agent Fees. Fidelity Investments Institutional Operations Company LLC (FIIOC), an affiliate of the investment adviser, is the transfer, dividend disbursing and shareholder servicing agent for each class of the Fund. FIIOC receives account fees and asset-based fees that vary according to the account size and type of account of the shareholders of Mid-Cap Stock, except for Class K. FIIOC receives an asset-based fee of Class K's average net assets. FIIOC pays for typesetting, printing and mailing of shareholder reports, except proxy statements.
For the period, transfer agent fees for each class were as follows:
| Amount | % of Class-Level Average Net Assets(a) | |
| Mid-Cap Stock | $4,028 | .13 |
| Class K | 372 | .04 |
| $4,400 |
(a) Annualized
Accounting Fees. Fidelity Service Company, Inc. (FSC), an affiliate of the investment adviser, maintains the Fund's accounting records. The accounting fee is based on the level of average net assets for each month. For the period, the fees were equivalent to the following annualized rates:
| % of Average Net Assets | |
| Fidelity Mid-Cap Stock Fund | .02 |
Brokerage Commissions. A portion of portfolio transactions were placed with brokerage firms which are affiliates of the investment adviser. Brokerage commissions are included in net realized gain (loss) and change in net unrealized appreciation (depreciation) in the Statement of Operations. The commissions paid to these affiliated firms were as follows:
| Amount | |
| Fidelity Mid-Cap Stock Fund | $24 |
Interfund Lending Program. Pursuant to an Exemptive Order issued by the Securities and Exchange Commission (the SEC), the Fund, along with other registered investment companies having management contracts with Fidelity Management & Research Company LLC (FMR), or other affiliated entities of FMR, may participate in an interfund lending program. This program provides an alternative credit facility allowing the Fund to borrow from, or lend money to, other participating affiliated funds. At period end, there were no interfund loans outstanding. Activity in this program during the period for which loans were outstanding was as follows:
| Borrower or Lender | Average Loan Balance | Weighted Average Interest Rate | Interest Expense | |
| Fidelity Mid-Cap Stock Fund | Borrower | $49,905 | .31% | $1 |
Interfund Trades. Funds may purchase from or sell securities to other Fidelity Funds under procedures adopted by the Board. The procedures have been designed to ensure these interfund trades are executed in accordance with Rule 17a-7 of the 1940 Act. Any interfund trades are included within the respective purchases and sales amounts shown in the Purchases and Sales of Investments note. Interfund trades during the period are noted in the table below.
| Purchases ($) | Sales ($) | Realized Gain (Loss) ($) | |
| Fidelity Mid-Cap Stock Fund | 70,542 | 40,815 | (4,192) |
Other. During the period, the investment adviser reimbursed the Fund for certain losses as follows:
| Amount ($) | |
| Fidelity Mid-Cap Stock Fund | 902 |
6. Committed Line of Credit.
Certain Funds participate with other funds managed by the investment adviser or an affiliate in a $4.25 billion credit facility (the "line of credit") to be utilized for temporary or emergency purposes to fund shareholder redemptions or for other short-term liquidity purposes. The participating funds have agreed to pay commitment fees on their pro-rata portion of the line of credit, which are reflected in Miscellaneous expenses on the Statement of Operations, and are listed below. During the period, there were no borrowings on this line of credit.
| Amount | |
| Fidelity Mid-Cap Stock Fund | $6 |
7. Security Lending.
Funds lend portfolio securities from time to time in order to earn additional income. Lending agents are used, including National Financial Services (NFS), an affiliate of the investment adviser. Pursuant to a securities lending agreement, NFS will receive a fee, which is capped at 9.9% of a fund's daily lending revenue, for its services as lending agent. A fund may lend securities to certain qualified borrowers, including NFS. On the settlement date of the loan, a fund receives collateral (in the form of U.S. Treasury obligations, letters of credit and/or cash) against the loaned securities and maintains collateral in an amount not less than 100% of the market value of the loaned securities during the period of the loan. The market value of the loaned securities is determined at the close of business of a fund and any additional required collateral is delivered to a fund on the next business day. A fund or borrower may terminate the loan at any time, and if the borrower defaults on its obligation to return the securities loaned because of insolvency or other reasons, a fund may apply collateral received from the borrower against the obligation. A fund may experience delays and costs in recovering the securities loaned. Any cash collateral received is invested in the Fidelity Securities Lending Cash Central Fund. Any loaned securities are identified as such in the Schedule of Investments, and the value of loaned securities and cash collateral at period end, as applicable, are presented in the Statement of Assets and Liabilities. Security lending income represents the income earned on investing cash collateral, less rebates paid to borrowers and any lending agent fees associated with the loan, plus any premium payments received for lending certain types of securities. Security lending income is presented in the Statement of Operations as a component of income from Fidelity Central Funds. Affiliated security lending activity, if any, was as follows:
| Total Security Lending Fees Paid to NFS | Security Lending Income From Securities Loaned to NFS | Value of Securities Loaned to NFS at Period End | |
| Fidelity Mid-Cap Stock Fund | $14 | $–(a) | $– |
(a) Amount represents less than five hundred dollars.
8. Expense Reductions.
In addition, during the period the investment adviser or an affiliate reimbursed and/or waived a portion of fund-level operating expenses in the amount of $113.
9. Distributions to Shareholders.
Distributions to shareholders of each class were as follows:
| Six months ended October 31, 2021 | Year ended April 30, 2021 | |
| Fidelity Mid-Cap Stock Fund | ||
| Distributions to shareholders | ||
| Mid-Cap Stock | $453,887 | $339,188 |
| Class K | 142,109 | 125,055 |
| Total | $595,996 | $464,243 |
10. Share Transactions.
Share transactions for each class were as follows and may contain in-kind transactions, automatic conversions between classes or exchanges between affiliated funds:
| Shares | Shares | Dollars | Dollars | |
| Six months ended October 31, 2021 | Year ended April 30, 2021 | Six months ended October 31, 2021 | Year ended April 30, 2021 | |
| Fidelity Mid-Cap Stock Fund | ||||
| Mid-Cap Stock | ||||
| Shares sold | 10,206 | 9,015 | $444,246 | $330,874 |
| Reinvestment of distributions | 10,041 | 9,132 | 427,023 | 320,090 |
| Shares redeemed | (8,273) | (25,353) | (349,513) | (878,738) |
| Net increase (decrease) | 11,974 | (7,206) | $521,756 | $(227,774) |
| Class K | ||||
| Shares sold | 2,548 | 8,322 | $109,962 | $294,555 |
| Reinvestment of distributions | 3,340 | 3,563 | 142,109 | 125,055 |
| Shares redeemed | (14,858) | (19,469) | (621,280) | (700,433) |
| Net increase (decrease) | (8,970) | (7,584) | $(369,209) | $(280,823) |
11. Other.
Fund's organizational documents provide former and current trustees and officers with a limited indemnification against liabilities arising in connection with the performance of their duties to the fund. In the normal course of business, the fund may also enter into contracts that provide general indemnifications. The fund's maximum exposure under these arrangements is unknown as this would be dependent on future claims that may be made against the fund. The risk of material loss from such claims is considered remote.
12. Coronavirus (COVID-19) Pandemic.
An outbreak of COVID-19 first detected in China during December 2019 has since spread globally and was declared a pandemic by the World Health Organization during March 2020. Developments that disrupt global economies and financial markets, such as the COVID-19 pandemic, may magnify factors that affect the Fund's performance.
Shareholder Expense Example
As a shareholder, you incur two types of costs: (1) transaction costs, which may include sales charges (loads) on purchase payments or redemption proceeds, as applicable and (2) ongoing costs, which generally include management fees, distribution and/or service (12b-1) fees and other Fund expenses. This Example is intended to help you understand your ongoing costs (in dollars) of investing in a fund and to compare these costs with the ongoing costs of investing in other mutual funds.
The Example is based on an investment of $1,000 invested at the beginning of the period and held for the entire period (May 1, 2021 to October 31, 2021).
Actual Expenses
The first line of the accompanying table provides information about actual account values and actual expenses. You may use the information in this line, together with the amount you invested, to estimate the expenses that you paid over the period. Simply divide your account value by $1,000.00 (for example, an $8,600 account value divided by $1,000.00 = 8.6), then multiply the result by the number in the first line for a class/Fund under the heading entitled "Expenses Paid During Period" to estimate the expenses you paid on your account during this period. If any fund is a shareholder of any underlying mutual funds or exchange-traded funds (ETFs) (the Underlying Funds), such fund indirectly bears its proportional share of the expenses of the Underlying Funds in addition to the direct expenses incurred presented in the table. These fees and expenses are not included in the annualized expense ratio used to calculate the expense estimate in the table below.
Hypothetical Example for Comparison Purposes
The second line of the accompanying table provides information about hypothetical account values and hypothetical expenses based on the actual expense ratio and an assumed rate of return of 5% per year before expenses, which is not the actual return. The hypothetical account values and expenses may not be used to estimate the actual ending account balance or expenses you paid for the period. You may use this information to compare the ongoing costs of investing in the Fund and other funds. To do so, compare this 5% hypothetical example with the 5% hypothetical examples that appear in the shareholder reports of the other funds. If any fund is a shareholder of any Underlying Funds, such fund indirectly bears its proportional share of the expenses of the Underlying Funds in addition to the direct expenses as presented in the table. These fees and expenses are not included in the annualized expense ratio used to calculate the expense estimate in the table below.
Please note that the expenses shown in the table are meant to highlight your ongoing costs only and do not reflect any transaction costs. Therefore, the second line of the table is useful in comparing ongoing costs only, and will not help you determine the relative total costs of owning different funds. In addition, if these transactional costs were included, your costs would have been higher.
| Annualized Expense Ratio-A | Beginning Account Value May 1, 2021 | Ending Account Value October 31, 2021 | Expenses Paid During Period-B May 1, 2021 to October 31, 2021 | |
| Fidelity Mid-Cap Stock Fund | ||||
| Mid-Cap Stock | .78% | |||
| Actual | $1,000.00 | $1,043.60 | $4.02 | |
| Hypothetical-C | $1,000.00 | $1,021.27 | $3.97 | |
| Class K | .69% | |||
| Actual | $1,000.00 | $1,044.40 | $3.56 | |
| Hypothetical-C | $1,000.00 | $1,021.73 | $3.52 |
A Annualized expense ratio reflects expenses net of applicable fee waivers.
B Expenses are equal to the annualized expense ratio, multiplied by the average account value over the period, multiplied by 184/ 365 (to reflect the one-half year period). The fees and expenses of any Underlying Funds are not included in each annualized expense ratio.
C 5% return per year before expenses
Board Approval of Investment Advisory Contracts and Management Fees
Fidelity Mid-Cap Stock Fund
Each year, the Board of Trustees, including the Independent Trustees (together, the Board), votes on the renewal of the management contract with Fidelity Management & Research Company LLC (FMR) and the sub-advisory agreements (together, the Advisory Contracts) for the fund. FMR and the sub-advisers are referred to herein as the Investment Advisers. The Board, assisted by the advice of fund counsel and Independent Trustees' counsel, requests and considers a broad range of information relevant to the renewal of the Advisory Contracts throughout the year.The Board meets regularly and, at each of its meetings, covers an extensive agenda of topics and materials and considers factors that are relevant to its annual consideration of the renewal of the fund's Advisory Contracts, including the services and support provided to the fund and its shareholders. The Board has established various standing committees (Committees), each composed of and chaired by Independent Trustees with varying backgrounds, to which the Board has assigned specific subject matter responsibilities in order to enhance effective decision-making by the Board. The Board, acting directly and through its Committees, requests and receives information concerning the annual consideration of the renewal of the fund's Advisory Contracts. The Board also meets as needed to review matters specifically related to the Board's annual consideration of the renewal of the Advisory Contracts. Members of the Board may also meet with trustees of other Fidelity funds through joint ad hoc committees to discuss certain matters relevant to all of the Fidelity funds.At its May 2021 meeting, the Board unanimously determined to renew the fund's Advisory Contracts. In reaching its determination, the Board considered all factors it believed relevant, including (i) the nature, extent, and quality of the services provided to the fund and its shareholders (including the investment performance of the fund); (ii) the competitiveness of the fund's management fee and total expense ratio relative to peer funds; (iii) the total costs of the services provided by and the profits realized by Fidelity from its relationships with the fund; and (iv) the extent to which, if any, economies of scale exist and are realized as the fund grows, and whether any economies of scale are appropriately shared with fund shareholders.In considering whether to renew the Advisory Contracts for the fund, the Board reached a determination, with the assistance of fund counsel and Independent Trustees' counsel and through the exercise of its business judgment, that the renewal of the Advisory Contracts was in the best interests of the fund and its shareholders and that the compensation payable under the Advisory Contracts was fair and reasonable. The Board's decision to renew the Advisory Contracts was not based on any single factor, but rather was based on a comprehensive consideration of all the information provided to the Board at its meetings throughout the year. The Board, in reaching its determination to renew the Advisory Contracts, was aware that shareholders of the fund have a broad range of investment choices available to them, including a wide choice among funds offered by Fidelity's competitors, and that the fund's shareholders, who have the opportunity to review and weigh the disclosure provided by the fund in its prospectus and other public disclosures, have chosen to invest in this fund, which is part of the Fidelity family of funds.Nature, Extent, and Quality of Services Provided. The Board considered Fidelity's staffing as it relates to the fund, including the backgrounds of investment personnel of Fidelity, and also considered the fund's investment objective, strategies, and related investment philosophy. The Independent Trustees also had discussions with senior management of Fidelity's investment operations and investment groups. The Board considered the structure of the investment personnel compensation program and whether this structure provides appropriate incentives to act in the best interests of the fund. Additionally, the Board considered the portfolio managers' investments, if any, in the funds that they manage.Resources Dedicated to Investment Management and Support Services. The Board and the Fund Oversight and Research Committees reviewed the general qualifications and capabilities of Fidelity's investment staff, including its size, education, experience, and resources, as well as Fidelity's approach to recruiting, training, managing, and compensating investment personnel. The Board noted that Fidelity has continued to increase the resources devoted to non-U.S. offices, including expansion of Fidelity's global investment organization. The Board also noted that Fidelity's analysts have extensive resources, tools and capabilities that allow them to conduct sophisticated quantitative and fundamental analysis, as well as credit analysis of issuers, counterparties and guarantors. Further, the Board considered that Fidelity's investment professionals have sufficient access to global information and data so as to provide competitive investment results over time, and that those professionals also have access to sophisticated tools that permit them to assess portfolio construction and risk and performance attribution characteristics continuously, as well as to transmit new information and research conclusions rapidly around the world. Additionally, in its deliberations, the Board considered Fidelity's trading, risk management, compliance, and technology and operations capabilities and resources, which are integral parts of the investment management process. The Board also considered Fidelity's investments in business continuity planning, and its success in continuously providing services to the fund notwithstanding the severe disruptions caused by the COVID-19 pandemic.Shareholder and Administrative Services. The Board considered (i) the nature, extent, quality, and cost of advisory, administrative, and shareholder services performed by the Investment Advisers and their affiliates under the Advisory Contracts and under separate agreements covering transfer agency, pricing and bookkeeping, and securities lending services for the fund; (ii) the nature and extent of the supervision of third party service providers, principally custodians, subcustodians, and pricing vendors; and (iii) the resources devoted to, and the record of compliance with, the fund's compliance policies and procedures. The Board also reviewed the allocation of fund brokerage, including allocations to brokers affiliated with the Investment Advisers, the use of brokerage commissions to pay fund expenses, and the use of "soft" commission dollars to pay for research services.The Board noted that the growth of fund assets over time across the complex allows Fidelity to reinvest in the development of services designed to enhance the value and convenience of the Fidelity funds as investment vehicles. These services include 24-hour access to account information and market information over the Internet and through telephone representatives, investor education materials and asset allocation tools, and the expanded availability of Fidelity Investor Centers.The Board noted that, in the past, it and the boards of certain other Fidelity funds had formed an ad hoc Committee on Transfer Agency Fees to review the variety of transfer agency fee structures throughout the industry and Fidelity's competitive positioning with respect to industry participants.Investment in a Large Fund Family. The Board considered the benefits to shareholders of investing in a Fidelity fund, including the benefits of investing in a fund that is part of a large family of funds offering a variety of investment disciplines and providing a large variety of mutual fund investor services. The Board noted that Fidelity had taken, or had made recommendations that resulted in the Fidelity funds taking, a number of actions over the previous year that benefited particular funds, including: (i) continuing to dedicate additional resources to Fidelity's investment research process, which includes meetings with management of issuers of securities in which the funds invest, and to the support of the senior management team that oversees asset management; (ii) continuing efforts to enhance Fidelity's global research capabilities; (iii) launching new funds and ETFs with innovative structures, strategies and pricing and making other enhancements to meet client needs; (iv) launching new share classes of existing funds; (v) eliminating purchase minimums and broadening eligibility requirements for certain funds and share classes; (vi) approving the reduction in the holding period for the Class C to Class A conversion policy; (vii) reducing management fees and total expenses for certain target date funds and classes and index funds; (viii) lowering expenses for certain existing funds and classes by implementing or lowering expense caps; (ix) rationalizing product lines and gaining increased efficiencies from fund mergers, liquidations, and share class consolidations; (x) continuing to develop, acquire and implement systems and technology to improve services to the funds and shareholders, strengthen information security, and increase efficiency; and (xi) continuing to implement enhancements to further strengthen Fidelity's product line to increase investors' probability of success in achieving their investment goals, including retirement income goals.Investment Performance. The Board considered whether the fund has operated in accordance with its investment objective, as well as its record of compliance with its investment restrictions and its performance history.The Board took into account discussions that occur at Board meetings throughout the year with representatives of the Investment Advisers about fund investment performance. In this regard the Board noted that as part of regularly scheduled fund reviews and other reports to the Board on fund performance, the Board considers annualized return information for the fund for different time periods, measured against an appropriate securities market index (benchmark index) and an appropriate peer group of funds with similar objectives (peer group). In its evaluation of fund investment performance, the Board gave particular attention to information indicating changes in performance of certain Fidelity funds for specific time periods and discussed with the Investment Advisers the reasons for any overperformance or underperformance.In addition to reviewing absolute and relative fund performance, the Independent Trustees periodically consider the appropriateness of fund performance metrics in evaluating the results achieved. In general, the Independent Trustees believe that fund performance should be evaluated based on net performance (after fees and expenses) of both the highest performing and lowest performing fund share classes, where applicable, compared to appropriate benchmark indices, over appropriate time periods that may include full market cycles, and compared to peer groups, as applicable, over the same periods, taking into account relevant factors including the following: general market conditions; issuer-specific information; and fund cash flows and other factors.The Independent Trustees recognize that shareholders evaluate performance on a net basis over their own holding periods, for which one-, three-, and five-year periods are often used as a proxy. For this reason, the performance information reviewed by the Board also included net cumulative total return information for the fund and an appropriate benchmark index and peer group for the most recent one-, three-, and five-year periods ended September 30, 2020, as shown below. Returns are shown compared to the 25th percentile (top of box, 75% beaten) and 75th percentile (bottom of box, 25% beaten) of the peer universe.Fidelity Mid-Cap Stock Fund
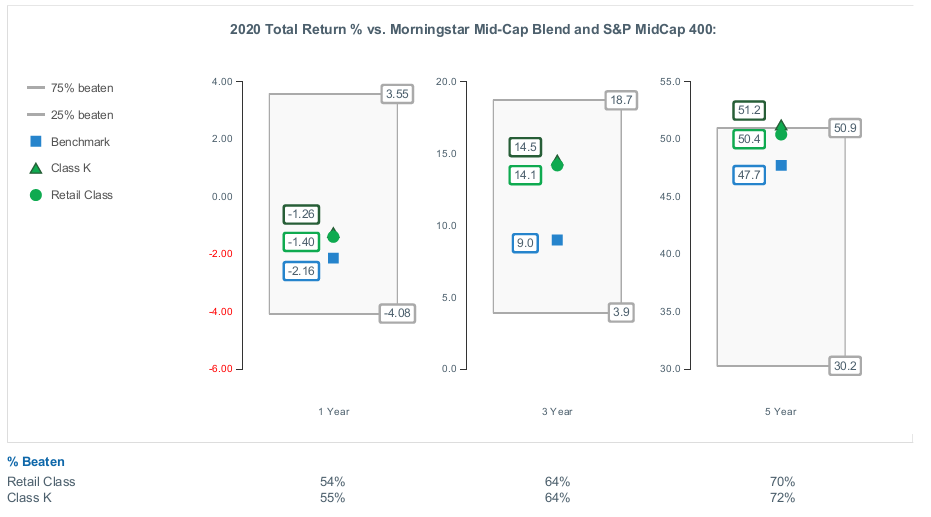
Fidelity Mid-Cap Stock Fund
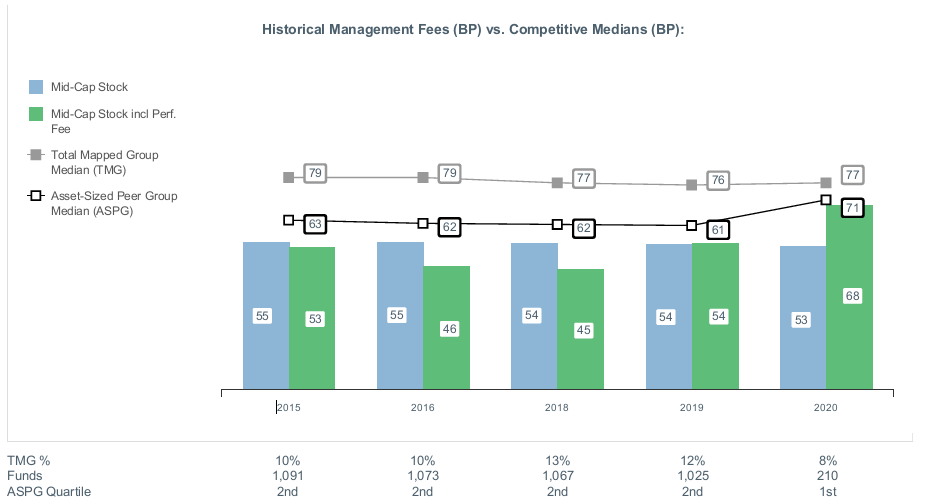
![]()
MCS-SANN-1221
1.538556.124
Fidelity® Large Cap Stock Fund
Semi-Annual Report
October 31, 2021
Contents
Board Approval of Investment Advisory Contracts and Management Fees |
To view a fund's proxy voting guidelines and proxy voting record for the 12-month period ended June 30, visit http://www.fidelity.com/proxyvotingresults or visit the Securities and Exchange Commission's (SEC) web site at http://www.sec.gov.
You may also call 1-800-544-8544 to request a free copy of the proxy voting guidelines.
Standard & Poor's, S&P and S&P 500 are registered service marks of The McGraw-Hill Companies, Inc. and have been licensed for use by Fidelity Distributors Corporation.
Other third-party marks appearing herein are the property of their respective owners.
All other marks appearing herein are registered or unregistered trademarks or service marks of FMR LLC or an affiliated company. © 2021 FMR LLC. All rights reserved.
This report and the financial statements contained herein are submitted for the general information of the shareholders of the Fund. This report is not authorized for distribution to prospective investors in the Fund unless preceded or accompanied by an effective prospectus.
A fund files its complete schedule of portfolio holdings with the SEC for the first and third quarters of each fiscal year on Form N-PORT. Forms N-PORT are available on the SEC’s web site at http://www.sec.gov. A fund's Forms N-PORT may be reviewed and copied at the SEC’s Public Reference Room in Washington, DC. Information regarding the operation of the SEC's Public Reference Room may be obtained by calling 1-800-SEC-0330.
For a complete list of a fund's portfolio holdings, view the most recent holdings listing, semiannual report, or annual report on Fidelity's web site at http://www.fidelity.com, http://www.institutional.fidelity.com, or http://www.401k.com, as applicable.
NOT FDIC INSURED •MAY LOSE VALUE •NO BANK GUARANTEE
Neither the Fund nor Fidelity Distributors Corporation is a bank.
Note to Shareholders:
Early in 2020, the outbreak and spread of COVID-19 emerged as a public health emergency that had a major influence on financial markets, primarily based on its impact on the global economy and corporate earnings. On March 11, 2020, the World Health Organization declared the COVID-19 outbreak a pandemic, citing sustained risk of further global spread. The pandemic prompted a number of measures to limit the spread of COVID-19, including travel and border restrictions, quarantines, and restrictions on large gatherings. In turn, these resulted in lower consumer activity, diminished demand for a wide range of products and services, disruption in manufacturing and supply chains, and – given the wide variability in outcomes regarding the outbreak – significant market uncertainty and volatility. To help stem the turmoil, the U.S. government took unprecedented action – in concert with the U.S. Federal Reserve and central banks around the world – to help support consumers, businesses, and the broader economy, and to limit disruption to the financial system.
In general, the overall impact of the pandemic lessened in 2021, amid a resilient economy and widespread distribution of three COVID-19 vaccines granted emergency use authorization from the U.S. Food and Drug Administration (FDA) early in the year. Still, the situation remains dynamic, and the extent and duration of its influence on financial markets and the economy is highly uncertain, due in part to a recent spike in cases based on highly contagious variants of the coronavirus.
Extreme events such as the COVID-19 crisis are exogenous shocks that can have significant adverse effects on mutual funds and their investments. Although multiple asset classes may be affected by market disruption, the duration and impact may not be the same for all types of assets. Fidelity is committed to helping you stay informed amid news about COVID-19 and during increased market volatility, and we continue to take extra steps to be responsive to customer needs. We encourage you to visit us online, where we offer ongoing updates, commentary, and analysis on the markets and our funds.
Investment Summary (Unaudited)
Top Ten Stocks as of October 31, 2021
| % of fund's net assets | |
| Microsoft Corp. | 7.3 |
| General Electric Co. | 6.6 |
| Wells Fargo & Co. | 5.2 |
| Exxon Mobil Corp. | 4.6 |
| Bank of America Corp. | 3.9 |
| Apple, Inc. | 3.2 |
| Comcast Corp. Class A | 2.8 |
| Altria Group, Inc. | 2.3 |
| United Parcel Service, Inc. Class B | 1.9 |
| Bristol-Myers Squibb Co. | 1.7 |
| 39.5 |
Top Five Market Sectors as of October 31, 2021
| % of fund's net assets | |
| Financials | 19.7 |
| Information Technology | 19.4 |
| Industrials | 15.5 |
| Health Care | 13.5 |
| Energy | 8.9 |
Asset Allocation (% of fund's net assets)
| As of October 31, 2021* | ||
| Stocks | 99.6% | |
| Other Investments | 0.1% | |
| Short-Term Investments and Net Other Assets (Liabilities) | 0.3% | |

* Foreign investments - 10.3%
Schedule of Investments October 31, 2021 (Unaudited)
Showing Percentage of Net Assets
| Common Stocks - 99.5% | |||
| Shares | Value (000s) | ||
| COMMUNICATION SERVICES - 8.3% | |||
| Diversified Telecommunication Services - 0.4% | |||
| Cellnex Telecom SA (a) | 34,600 | $2,127 | |
| Verizon Communications, Inc. | 183,006 | 9,697 | |
| 11,824 | |||
| Entertainment - 2.1% | |||
| Activision Blizzard, Inc. | 86,232 | 6,742 | |
| Nintendo Co. Ltd. ADR | 129,500 | 7,155 | |
| The Walt Disney Co. (b) | 197,804 | 33,443 | |
| Universal Music Group NV | 581,720 | 16,889 | |
| 64,229 | |||
| Interactive Media & Services - 2.5% | |||
| Alphabet, Inc.: | |||
| Class A (b) | 10,464 | 30,983 | |
| Class C (b) | 9,486 | 28,130 | |
| Match Group, Inc. (b) | 49,860 | 7,518 | |
| Meta Platforms, Inc. Class A (b) | 32,000 | 10,354 | |
| Snap, Inc. Class A (b) | 11,300 | 594 | |
| 77,579 | |||
| Media - 3.3% | |||
| Comcast Corp. Class A | 1,698,947 | 87,377 | |
| Interpublic Group of Companies, Inc. | 435,116 | 15,912 | |
| 103,289 | |||
| TOTAL COMMUNICATION SERVICES | 256,921 | ||
| CONSUMER DISCRETIONARY - 5.3% | |||
| Auto Components - 0.5% | |||
| BorgWarner, Inc. | 367,617 | 16,568 | |
| Automobiles - 0.5% | |||
| General Motors Co. (b) | 293,400 | 15,970 | |
| Distributors - 0.0% | |||
| LKQ Corp. | 6,063 | 334 | |
| Hotels, Restaurants & Leisure - 1.5% | |||
| Booking Holdings, Inc. (b) | 10,388 | 25,147 | |
| Elior SA (a)(b) | 305,800 | 2,411 | |
| Expedia, Inc. (b) | 54,200 | 8,911 | |
| Marriott International, Inc. Class A (b) | 44,400 | 7,105 | |
| Starbucks Corp. | 30,200 | 3,203 | |
| 46,777 | |||
| Household Durables - 1.3% | |||
| Mohawk Industries, Inc. (b) | 104,941 | 18,597 | |
| Sony Group Corp. sponsored ADR | 43,100 | 4,991 | |
| Whirlpool Corp. | 79,675 | 16,798 | |
| 40,386 | |||
| Internet & Direct Marketing Retail - 0.1% | |||
| Chewy, Inc. (b) | 16,100 | 1,220 | |
| Specialty Retail - 1.4% | |||
| Lowe's Companies, Inc. | 177,853 | 41,586 | |
| TOTAL CONSUMER DISCRETIONARY | 162,841 | ||
| CONSUMER STAPLES - 5.4% | |||
| Beverages - 1.6% | |||
| Anheuser-Busch InBev SA NV ADR | 13,000 | 796 | |
| Diageo PLC sponsored ADR | 72,800 | 14,536 | |
| Keurig Dr. Pepper, Inc. | 253,000 | 9,131 | |
| The Coca-Cola Co. | 443,972 | 25,027 | |
| 49,490 | |||
| Food & Staples Retailing - 1.0% | |||
| Costco Wholesale Corp. | 9,600 | 4,719 | |
| Ocado Group PLC (b) | 18,800 | 464 | |
| Performance Food Group Co. (b) | 104,346 | 4,720 | |
| Sysco Corp. | 264,300 | 20,325 | |
| U.S. Foods Holding Corp. (b) | 56,600 | 1,962 | |
| 32,190 | |||
| Food Products - 0.1% | |||
| Lamb Weston Holdings, Inc. | 60,700 | 3,427 | |
| Household Products - 0.3% | |||
| Colgate-Palmolive Co. | 6,800 | 518 | |
| Procter & Gamble Co. | 2,300 | 329 | |
| Spectrum Brands Holdings, Inc. | 76,298 | 7,153 | |
| 8,000 | |||
| Tobacco - 2.4% | |||
| Altria Group, Inc. | 1,617,715 | 71,357 | |
| Swedish Match Co. AB | 350,000 | 3,080 | |
| 74,437 | |||
| TOTAL CONSUMER STAPLES | 167,544 | ||
| ENERGY - 8.8% | |||
| Energy Equipment & Services - 0.2% | |||
| Subsea 7 SA | 485,500 | 4,354 | |
| Oil, Gas & Consumable Fuels - 8.6% | |||
| Canadian Natural Resources Ltd. | 100,300 | 4,263 | |
| Cenovus Energy, Inc. (Canada) | 2,764,741 | 33,063 | |
| Exxon Mobil Corp. | 2,196,600 | 141,615 | |
| Harbour Energy PLC (b) | 867,000 | 4,169 | |
| Hess Corp. | 615,147 | 50,793 | |
| Imperial Oil Ltd. | 112,400 | 3,805 | |
| Kosmos Energy Ltd. (b) | 2,733,983 | 9,842 | |
| Phillips 66 Co. | 97,800 | 7,313 | |
| Tourmaline Oil Corp. | 327,011 | 11,819 | |
| 266,682 | |||
| TOTAL ENERGY | 271,036 | ||
| FINANCIALS - 19.7% | |||
| Banks - 13.7% | |||
| Bank of America Corp. | 2,548,670 | 121,775 | |
| JPMorgan Chase & Co. | 235,990 | 40,092 | |
| M&T Bank Corp. | 37,003 | 5,444 | |
| PNC Financial Services Group, Inc. | 207,212 | 43,728 | |
| Truist Financial Corp. | 460,354 | 29,219 | |
| U.S. Bancorp | 393,543 | 23,758 | |
| Wells Fargo & Co. | 3,115,098 | 159,368 | |
| 423,384 | |||
| Capital Markets - 3.9% | |||
| KKR & Co. LP | 285,858 | 22,774 | |
| Morgan Stanley | 195,845 | 20,129 | |
| Northern Trust Corp. | 308,812 | 37,996 | |
| Raymond James Financial, Inc. | 83,895 | 8,271 | |
| State Street Corp. | 305,289 | 30,086 | |
| 119,256 | |||
| Consumer Finance - 0.6% | |||
| Discover Financial Services | 157,100 | 17,803 | |
| Diversified Financial Services - 0.2% | |||
| Mirion Technologies, Inc. (c) | 671,520 | 6,756 | |
| Insurance - 0.2% | |||
| Chubb Ltd. | 40,811 | 7,974 | |
| Thrifts & Mortgage Finance - 1.1% | |||
| MGIC Investment Corp. | 596,211 | 9,635 | |
| Radian Group, Inc. | 1,014,289 | 24,211 | |
| 33,846 | |||
| TOTAL FINANCIALS | 609,019 | ||
| HEALTH CARE - 13.5% | |||
| Biotechnology - 0.6% | |||
| ADC Therapeutics SA (b) | 38,800 | 1,125 | |
| Alnylam Pharmaceuticals, Inc. (b) | 33,955 | 5,418 | |
| Crinetics Pharmaceuticals, Inc. (b) | 94,800 | 2,363 | |
| Gritstone Bio, Inc. (b) | 62,687 | 689 | |
| Heron Therapeutics, Inc. (b) | 28,816 | 317 | |
| Insmed, Inc. (b) | 135,654 | 4,090 | |
| Intercept Pharmaceuticals, Inc. (b)(d) | 198,942 | 3,354 | |
| Vaxcyte, Inc. (b) | 35,000 | 819 | |
| Verve Therapeutics, Inc. | 27,200 | 1,262 | |
| 19,437 | |||
| Health Care Equipment & Supplies - 1.7% | |||
| Abbott Laboratories | 15,600 | 2,011 | |
| Becton, Dickinson & Co. | 31,384 | 7,519 | |
| Boston Scientific Corp. (b) | 797,828 | 34,410 | |
| Danaher Corp. | 11,600 | 3,617 | |
| iRhythm Technologies, Inc. (b) | 300 | 21 | |
| Koninklijke Philips Electronics NV (depositary receipt) (NY Reg.) | 79,100 | 3,737 | |
| 51,315 | |||
| Health Care Providers & Services - 5.6% | |||
| Cardinal Health, Inc. | 276,096 | 13,200 | |
| Centene Corp. (b) | 37,800 | 2,693 | |
| Cigna Corp. | 152,333 | 32,540 | |
| Covetrus, Inc. (b) | 87,319 | 1,763 | |
| CVS Health Corp. | 438,493 | 39,149 | |
| Guardant Health, Inc. (b) | 22,400 | 2,616 | |
| Humana, Inc. | 4,600 | 2,131 | |
| McKesson Corp. | 162,605 | 33,802 | |
| UnitedHealth Group, Inc. | 93,523 | 43,065 | |
| 170,959 | |||
| Health Care Technology - 0.0% | |||
| Castlight Health, Inc. Class B (b) | 269,429 | 485 | |
| Pharmaceuticals - 5.6% | |||
| Bayer AG | 480,262 | 27,066 | |
| Bristol-Myers Squibb Co. | 872,425 | 50,950 | |
| Eli Lilly & Co. | 36,200 | 9,222 | |
| GlaxoSmithKline PLC sponsored ADR | 823,998 | 34,880 | |
| Intra-Cellular Therapies, Inc. (b) | 29,500 | 1,271 | |
| Johnson & Johnson | 247,338 | 40,286 | |
| Merck & Co., Inc. | 17,800 | 1,567 | |
| Pliant Therapeutics, Inc. (b) | 44,300 | 706 | |
| Sanofi SA sponsored ADR | 107,900 | 5,441 | |
| TherapeuticsMD, Inc. (b)(d) | 1,522,947 | 1,109 | |
| Viatris, Inc. | 34,700 | 463 | |
| 172,961 | |||
| TOTAL HEALTH CARE | 415,157 | ||
| INDUSTRIALS - 15.4% | |||
| Aerospace & Defense - 2.4% | |||
| Airbus Group NV (b) | 100,600 | 12,905 | |
| General Dynamics Corp. | 39,016 | 7,910 | |
| Huntington Ingalls Industries, Inc. | 25,001 | 5,068 | |
| Maxar Technologies, Inc. | 15,300 | 406 | |
| MTU Aero Engines AG | 8,600 | 1,912 | |
| Raytheon Technologies Corp. | 48,781 | 4,335 | |
| Rolls-Royce Holdings PLC (b) | 2,880,900 | 5,200 | |
| Safran SA | 17,600 | 2,369 | |
| The Boeing Co. (b) | 162,288 | 33,598 | |
| 73,703 | |||
| Air Freight & Logistics - 2.4% | |||
| FedEx Corp. | 61,373 | 14,455 | |
| United Parcel Service, Inc. Class B | 281,661 | 60,126 | |
| 74,581 | |||
| Airlines - 0.1% | |||
| Copa Holdings SA Class A (b) | 9,300 | 688 | |
| Ryanair Holdings PLC sponsored ADR (b) | 28,000 | 3,178 | |
| 3,866 | |||
| Building Products - 0.2% | |||
| Johnson Controls International PLC | 75,000 | 5,503 | |
| Electrical Equipment - 1.3% | |||
| Acuity Brands, Inc. | 54,428 | 11,181 | |
| Hubbell, Inc. Class B | 34,255 | 6,829 | |
| Regal Rexnord Corp. | 4,200 | 640 | |
| Vertiv Holdings Co. | 812,300 | 20,860 | |
| 39,510 | |||
| Industrial Conglomerates - 6.8% | |||
| 3M Co. | 41,467 | 7,409 | |
| General Electric Co. | 1,943,786 | 203,845 | |
| 211,254 | |||
| Machinery - 1.3% | |||
| Caterpillar, Inc. | 10,700 | 2,183 | |
| Cummins, Inc. | 17,700 | 4,245 | |
| Epiroc AB (A Shares) | 82,500 | 2,053 | |
| Flowserve Corp. | 171,470 | 5,765 | |
| Fortive Corp. | 80,700 | 6,110 | |
| Otis Worldwide Corp. | 56,440 | 4,533 | |
| PACCAR, Inc. | 18,000 | 1,613 | |
| Stanley Black & Decker, Inc. | 26,900 | 4,835 | |
| Westinghouse Air Brake Tech Co. | 85,892 | 7,793 | |
| 39,130 | |||
| Professional Services - 0.1% | |||
| Acacia Research Corp. (b) | 24,000 | 138 | |
| Equifax, Inc. | 10,900 | 3,024 | |
| 3,162 | |||
| Road & Rail - 0.8% | |||
| Knight-Swift Transportation Holdings, Inc. Class A | 328,532 | 18,624 | |
| Lyft, Inc. (b) | 77,616 | 3,560 | |
| Ryder System, Inc. | 34,700 | 2,948 | |
| 25,132 | |||
| Trading Companies & Distributors - 0.0% | |||
| Beijer Ref AB (B Shares) | 47,400 | 974 | |
| TOTAL INDUSTRIALS | 476,815 | ||
| INFORMATION TECHNOLOGY - 19.4% | |||
| Electronic Equipment & Components - 0.3% | |||
| CDW Corp. | 11,500 | 2,146 | |
| Vontier Corp. | 181,720 | 6,148 | |
| 8,294 | |||
| IT Services - 3.4% | |||
| Amadeus IT Holding SA Class A (b) | 76,600 | 5,122 | |
| Edenred SA | 114,400 | 6,185 | |
| Fidelity National Information Services, Inc. | 122,000 | 13,510 | |
| Genpact Ltd. | 122,200 | 6,031 | |
| IBM Corp. | 33,200 | 4,153 | |
| MasterCard, Inc. Class A | 22,992 | 7,714 | |
| Sabre Corp. (b) | 630,200 | 6,541 | |
| Snowflake Computing, Inc. (b) | 1,900 | 672 | |
| Twilio, Inc. Class A (b) | 4,200 | 1,224 | |
| Unisys Corp. (b) | 385,922 | 9,868 | |
| Visa, Inc. Class A | 210,684 | 44,617 | |
| 105,637 | |||
| Semiconductors & Semiconductor Equipment - 3.0% | |||
| Analog Devices, Inc. | 32,990 | 5,723 | |
| Applied Materials, Inc. | 64,952 | 8,876 | |
| Intel Corp. | 277,000 | 13,573 | |
| Lam Research Corp. | 9,500 | 5,354 | |
| Marvell Technology, Inc. | 114,577 | 7,849 | |
| Qualcomm, Inc. | 381,654 | 50,775 | |
| 92,150 | |||
| Software - 9.4% | |||
| Autodesk, Inc. (b) | 25,209 | 8,007 | |
| Dynatrace, Inc. (b) | 74,914 | 5,619 | |
| Elastic NV (b) | 68,700 | 11,920 | |
| Microsoft Corp. | 682,247 | 226,251 | |
| PTC, Inc. (b) | 32,700 | 4,164 | |
| Salesforce.com, Inc. (b) | 9,200 | 2,757 | |
| SAP SE sponsored ADR | 201,719 | 29,205 | |
| Workday, Inc. Class A (b) | 9,300 | 2,697 | |
| 290,620 | |||
| Technology Hardware, Storage & Peripherals - 3.3% | |||
| Apple, Inc. | 662,972 | 99,313 | |
| Samsung Electronics Co. Ltd. | 65,110 | 3,878 | |
| 103,191 | |||
| TOTAL INFORMATION TECHNOLOGY | 599,892 | ||
| MATERIALS - 2.4% | |||
| Chemicals - 0.8% | |||
| DuPont de Nemours, Inc. | 280,300 | 19,509 | |
| Livent Corp. (b) | 11,000 | 310 | |
| PPG Industries, Inc. | 32,300 | 5,186 | |
| 25,005 | |||
| Metals & Mining - 1.6% | |||
| Anglo American PLC (United Kingdom) | 153,730 | 5,848 | |
| First Quantum Minerals Ltd. | 343,200 | 8,125 | |
| Freeport-McMoRan, Inc. | 712,887 | 26,890 | |
| Glencore Xstrata PLC | 910,900 | 4,555 | |
| Lundin Mining Corp. | 511,300 | 4,449 | |
| 49,867 | |||
| TOTAL MATERIALS | 74,872 | ||
| REAL ESTATE - 0.9% | |||
| Equity Real Estate Investment Trusts (REITs) - 0.9% | |||
| American Tower Corp. | 30,746 | 8,669 | |
| Equinix, Inc. | 1,124 | 941 | |
| Simon Property Group, Inc. | 122,600 | 17,971 | |
| 27,581 | |||
| UTILITIES - 0.4% | |||
| Electric Utilities - 0.3% | |||
| Entergy Corp. | 26,500 | 2,730 | |
| Southern Co. | 81,400 | 5,073 | |
| 7,803 | |||
| Multi-Utilities - 0.1% | |||
| CenterPoint Energy, Inc. | 92,200 | 2,401 | |
| Sempra Energy | 7,264 | 927 | |
| 3,328 | |||
| TOTAL UTILITIES | 11,131 | ||
| TOTAL COMMON STOCKS | |||
| (Cost $2,007,953) | 3,072,809 | ||
| Preferred Stocks - 0.1% | |||
| Convertible Preferred Stocks - 0.0% | |||
| CONSUMER DISCRETIONARY - 0.0% | |||
| Internet & Direct Marketing Retail - 0.0% | |||
| Reddit, Inc. Series E (c)(e) | 3,600 | 222 | |
| Nonconvertible Preferred Stocks - 0.1% | |||
| INDUSTRIALS - 0.1% | |||
| Aerospace & Defense - 0.1% | |||
| Embraer SA sponsored ADR (b) | 248,700 | 3,862 | |
| TOTAL PREFERRED STOCKS | |||
| (Cost $2,893) | 4,084 | ||
| Other - 0.1% | |||
| Energy - 0.1% | |||
| Oil, Gas & Consumable Fuels - 0.1% | |||
| Utica Shale Drilling Program (non-operating revenue interest) (c)(e)(f) | |||
| (Cost $6,968) | 6,967,758 | 2,510 | |
| Money Market Funds - 0.4% | |||
| Fidelity Cash Central Fund 0.06% (g) | 8,745,622 | 8,747 | |
| Fidelity Securities Lending Cash Central Fund 0.06% (g)(h) | 3,355,514 | 3,356 | |
| TOTAL MONEY MARKET FUNDS | |||
| (Cost $12,103) | 12,103 | ||
| TOTAL INVESTMENT IN SECURITIES - 100.1% | |||
| (Cost $2,029,917) | 3,091,506 | ||
| NET OTHER ASSETS (LIABILITIES) - (0.1)% | (2,722) | ||
| NET ASSETS - 100% | $3,088,784 |
Legend
(a) Security exempt from registration under Rule 144A of the Securities Act of 1933. These securities may be resold in transactions exempt from registration, normally to qualified institutional buyers. At the end of the period, the value of these securities amounted to $4,538,000 or 0.1% of net assets.
(b) Non-income producing
(c) Restricted securities (including private placements) - Investment in securities not registered under the Securities Act of 1933 (excluding 144A issues). At the end of the period, the value of restricted securities (excluding 144A issues) amounted to $9,488,000 or 0.3% of net assets.
(d) Security or a portion of the security is on loan at period end.
(e) Level 3 security
(f) Investment is owned by a wholly-owned subsidiary (Subsidiary) that is treated as a corporation for U.S. tax purposes.
(g) Affiliated fund that is generally available only to investment companies and other accounts managed by Fidelity Investments. The rate quoted is the annualized seven-day yield of the fund at period end. A complete unaudited listing of the fund's holdings as of its most recent quarter end is available upon request. In addition, each Fidelity Central Fund's financial statements are available on the SEC's website or upon request.
(h) Investment made with cash collateral received from securities on loan.
Additional information on each restricted holding is as follows:
| Security | Acquisition Date | Acquisition Cost (000s) |
| Mirion Technologies, Inc. | 6/16/21 | $6,715 |
| Reddit, Inc. Series E | 5/18/21 | $153 |
| Utica Shale Drilling Program (non-operating revenue interest) | 10/5/16 - 9/1/17 | $6,968 |
Affiliated Central Funds
Fiscal year to date information regarding the Fund's investments in Fidelity Central Funds, including the ownership percentage, is presented below.
| Fund (Amounts in thousands) | Value, beginning of period | Purchases | Sales Proceeds | Dividend Income | Realized Gain/Loss | Change in Unrealized appreciation (depreciation) | Value, end of period | % ownership, end of period |
| Fidelity Cash Central Fund 0.06% | $21,341 | $123,370 | $135,964 | $3 | $-- | $-- | $8,747 | 0.0% |
| Fidelity Securities Lending Cash Central Fund 0.06% | 39,925 | 325,732 | 362,301 | 1,889 | -- | -- | 3,356 | 0.0% |
| Total | $61,266 | $449,102 | $498,265 | $1,892 | $-- | $-- | $12,103 |
Amounts in the income column in the above table include any capital gain distributions from underlying funds, which are presented in the corresponding line-item in the Statement of Operations, if applicable. Amount for Fidelity Securities Lending Cash Central Fund represents the income earned on investing cash collateral, less rebates paid to borrowers and any lending agent fees associated with the loan, plus any premium payments received for lending certain types of securities.
Investment Valuation
The following is a summary of the inputs used, as of October 31, 2021, involving the Fund's assets and liabilities carried at fair value. The inputs or methodology used for valuing securities may not be an indication of the risk associated with investing in those securities. For more information on valuation inputs, and their aggregation into the levels used below, please refer to the Investment Valuation section in the accompanying Notes to Financial Statements.
| Valuation Inputs at Reporting Date: | ||||
| Description | Total | Level 1 | Level 2 | Level 3 |
| (Amounts in thousands) | ||||
| Investments in Securities: | ||||
| Equities: | ||||
| Communication Services | $256,921 | $256,921 | $-- | $-- |
| Consumer Discretionary | 163,063 | 162,841 | -- | 222 |
| Consumer Staples | 167,544 | 167,544 | -- | -- |
| Energy | 271,036 | 271,036 | -- | -- |
| Financials | 609,019 | 602,263 | 6,756 | -- |
| Health Care | 415,157 | 388,091 | 27,066 | -- |
| Industrials | 480,677 | 460,203 | 20,474 | -- |
| Information Technology | 599,892 | 596,014 | 3,878 | -- |
| Materials | 74,872 | 64,469 | 10,403 | -- |
| Real Estate | 27,581 | 27,581 | -- | -- |
| Utilities | 11,131 | 11,131 | -- | -- |
| Other | 2,510 | -- | -- | 2,510 |
| Money Market Funds | 12,103 | 12,103 | -- | -- |
| Total Investments in Securities: | $3,091,506 | $3,020,197 | $68,577 | $2,732 |
Other Information
Distribution of investments by country or territory of incorporation, as a percentage of Total Net Assets, is as follows (Unaudited):
| United States of America | 89.7% |
| Canada | 2.1% |
| United Kingdom | 2.1% |
| Germany | 1.9% |
| Netherlands | 1.5% |
| Others (Individually Less Than 1%) | 2.7% |
| 100.0% |
See accompanying notes which are an integral part of the financial statements.
Financial Statements
Statement of Assets and Liabilities
| Amounts in thousands (except per-share amount) | October 31, 2021 (Unaudited) | |
| Assets | ||
| Investment in securities, at value (including securities loaned of $2,962) — See accompanying schedule: Unaffiliated issuers (cost $2,017,814) | $3,079,403 | |
| Fidelity Central Funds (cost $12,103) | 12,103 | |
| Total Investment in Securities (cost $2,029,917) | $3,091,506 | |
| Restricted cash | 115 | |
| Receivable for investments sold | 3,592 | |
| Receivable for fund shares sold | 1,748 | |
| Dividends receivable | 2,537 | |
| Distributions receivable from Fidelity Central Funds | 3 | |
| Prepaid expenses | 4 | |
| Other receivables | 333 | |
| Total assets | 3,099,838 | |
| Liabilities | ||
| Payable for investments purchased | $1,444 | |
| Payable for fund shares redeemed | 4,897 | |
| Accrued management fee | 891 | |
| Other affiliated payables | 418 | |
| Other payables and accrued expenses | 46 | |
| Collateral on securities loaned | 3,358 | |
| Total liabilities | 11,054 | |
| Net Assets | $3,088,784 | |
| Net Assets consist of: | ||
| Paid in capital | $1,959,970 | |
| Total accumulated earnings (loss) | 1,128,814 | |
| Net Assets | $3,088,784 | |
| Net Asset Value, offering price and redemption price per share ($3,088,784 ÷ 71,820 shares) | $43.01 |
See accompanying notes which are an integral part of the financial statements.
Statement of Operations
| Amounts in thousands | Six months ended October 31, 2021 (Unaudited) | |
| Investment Income | ||
| Dividends | $25,137 | |
| Non-Cash dividends | 17,258 | |
| Income from Fidelity Central Funds (including $1,889 from security lending) | 1,892 | |
| Total income | 44,287 | |
| Expenses | ||
| Management fee | ||
| Basic fee | $7,859 | |
| Performance adjustment | (2,522) | |
| Transfer agent fees | 2,097 | |
| Accounting fees | 440 | |
| Custodian fees and expenses | 16 | |
| Independent trustees' fees and expenses | 5 | |
| Registration fees | 46 | |
| Audit | 30 | |
| Legal | 3 | |
| Miscellaneous | 7 | |
| Total expenses before reductions | 7,981 | |
| Expense reductions | (42) | |
| Total expenses after reductions | 7,939 | |
| Net investment income (loss) | 36,348 | |
| Realized and Unrealized Gain (Loss) | ||
| Net realized gain (loss) on: | ||
| Investment securities: | ||
| Unaffiliated issuers | 46,407 | |
| Total net realized gain (loss) | 46,407 | |
| Change in net unrealized appreciation (depreciation) on: | ||
| Investment securities: | ||
| Unaffiliated issuers | 111,049 | |
| Unfunded commitments | (1,251) | |
| Assets and liabilities in foreign currencies | (20) | |
| Total change in net unrealized appreciation (depreciation) | 109,778 | |
| Net gain (loss) | 156,185 | |
| Net increase (decrease) in net assets resulting from operations | $192,533 |
See accompanying notes which are an integral part of the financial statements.
Statement of Changes in Net Assets
| Amounts in thousands | Six months ended October 31, 2021 (Unaudited) | Year ended April 30, 2021 |
| Increase (Decrease) in Net Assets | ||
| Operations | ||
| Net investment income (loss) | $36,348 | $43,004 |
| Net realized gain (loss) | 46,407 | 87,979 |
| Change in net unrealized appreciation (depreciation) | 109,778 | 959,927 |
| Net increase (decrease) in net assets resulting from operations | 192,533 | 1,090,910 |
| Distributions to shareholders | (54,949) | (102,667) |
| Share transactions | ||
| Proceeds from sales of shares | 267,544 | 535,535 |
| Reinvestment of distributions | 41,359 | 83,076 |
| Cost of shares redeemed | (326,843) | (810,677) |
| Net increase (decrease) in net assets resulting from share transactions | (17,940) | (192,066) |
| Total increase (decrease) in net assets | 119,644 | 796,177 |
| Net Assets | ||
| Beginning of period | 2,969,140 | 2,172,963 |
| End of period | $3,088,784 | $2,969,140 |
| Other Information | ||
| Shares | ||
| Sold | 6,445 | 16,432 |
| Issued in reinvestment of distributions | 991 | 2,540 |
| Redeemed | (7,878) | (24,878) |
| Net increase (decrease) | (442) | (5,906) |
See accompanying notes which are an integral part of the financial statements.
Financial Highlights
Fidelity Large Cap Stock Fund
| Six months ended (Unaudited) October 31, | Years endedApril 30, | |||||
| 2021 | 2021 | 2020 | 2019 | 2018 | 2017 | |
| Selected Per–Share Data | ||||||
| Net asset value, beginning of period | $41.09 | $27.80 | $32.11 | $33.02 | $30.85 | $26.62 |
| Income from Investment Operations | ||||||
| Net investment income (loss)A | .50B | .57 | .63 | .63 | .47 | .38 |
| Net realized and unrealized gain (loss) | 2.19 | 14.10 | (3.12) | 2.17 | 2.87 | 4.91 |
| Total from investment operations | 2.69 | 14.67 | (2.49) | 2.80 | 3.34 | 5.29 |
| Distributions from net investment income | (.16) | (.65) | (.62) | (.53)C | (.38) | (.41) |
| Distributions from net realized gain | (.61) | (.73) | (1.20) | (3.18)C | (.79) | (.65) |
| Total distributions | (.77) | (1.38) | (1.82) | (3.71) | (1.17) | (1.06) |
| Net asset value, end of period | $43.01 | $41.09 | $27.80 | $32.11 | $33.02 | $30.85 |
| Total ReturnD,E | 6.59% | 54.08% | (8.41)% | 9.57% | 10.96% | 20.37% |
| Ratios to Average Net AssetsF,G | ||||||
| Expenses before reductions | .53%H | .48% | .47% | .63% | .67% | .62% |
| Expenses net of fee waivers, if any | .53%H | .48% | .47% | .63% | .67% | .62% |
| Expenses net of all reductions | .53%H | .48% | .47% | .62% | .66% | .62% |
| Net investment income (loss) | 2.43%B,H | 1.73% | 2.05% | 1.96% | 1.44% | 1.33% |
| Supplemental Data | ||||||
| Net assets, end of period (in millions) | $3,089 | $2,969 | $2,173 | $2,796 | $3,864 | $4,656 |
| Portfolio turnover rateI | 11%H | 18% | 32%J | 35%J | 40%J | 32%J |
A Calculated based on average shares outstanding during the period.
B Net investment income per share reflects one or more large, non-recurring dividend(s) which amounted to $.24 per share. Such dividends are not annualized in the ratio of net investment income (loss) to average net assets. Excluding such non-recurring dividend(s) the ratio of net investment income (loss) to average net assets would have been 1.28%.
C The amounts shown reflect certain reclassifications related to book to tax differences that were made in the year shown.
D Total returns for periods of less than one year are not annualized.
E Total returns would have been lower if certain expenses had not been reduced during the applicable periods shown.
F Fees and expenses of any underlying mutual funds or exchange-traded funds (ETFs) are not included in the Fund's expense ratio. The Fund indirectly bears its proportionate share of these expenses. For additional expense information related to investments in Fidelity Central Funds, please refer to the "Investments in Fidelity Central Funds" note found in the Notes to Financial Statements section of the most recent Annual or Semi-Annual report.
G Expense ratios reflect operating expenses of the class. Expenses before reductions do not reflect amounts reimbursed, waived, or reduced through arrangements with the investment adviser, brokerage services, or other offset arrangements, if applicable, and do not represent the amount paid by the class during periods when reimbursements, waivers or reductions occur.
H Annualized
I Amount does not include the portfolio activity of any underlying mutual funds or exchange-traded funds (ETFs).
J Portfolio turnover rate excludes securities received or delivered in-kind.
See accompanying notes which are an integral part of the financial statements.
Notes to Financial Statements (Unaudited)
For the period ended October 31, 2021
(Amounts in thousands except percentages)
1. Organization.
Fidelity Large Cap Stock Fund (the Fund) is a fund of Fidelity Concord Street Trust (the Trust) and is authorized to issue an unlimited number of shares. Share transactions on the Statement of Changes in Net Assets may contain exchanges between affiliated funds. The Trust is registered under the Investment Company Act of 1940, as amended (the 1940 Act), as an open-end management investment company organized as a Massachusetts business trust.
2. Investments in Fidelity Central Funds.
Funds may invest in Fidelity Central Funds, which are open-end investment companies generally available only to other investment companies and accounts managed by the investment adviser and its affiliates. The Schedule of Investments lists any Fidelity Central Funds held as an investment as of period end, but does not include the underlying holdings of each Fidelity Central Fund. An investing fund indirectly bears its proportionate share of the expenses of the underlying Fidelity Central Funds.
Based on its investment objective, each Fidelity Central Fund may invest or participate in various investment vehicles or strategies that are similar to those of the investing fund. These strategies are consistent with the investment objectives of the investing fund and may involve certain economic risks which may cause a decline in value of each of the Fidelity Central Funds and thus a decline in the value of the investing fund.
| Fidelity Central Fund | Investment Manager | Investment Objective | Investment Practices | Expense Ratio(a) |
| Fidelity Money Market Central Funds | Fidelity Management & Research Company LLC (FMR) | Each fund seeks to obtain a high level of current income consistent with the preservation of capital and liquidity. | Short-term Investments | Less than .005% |
(a) Expenses expressed as a percentage of average net assets and are as of each underlying Central Fund's most recent annual or semi-annual shareholder report.
A complete unaudited list of holdings for each Fidelity Central Fund is available upon request or at the Securities and Exchange Commission website at www.sec.gov. In addition, the financial statements of the Fidelity Central Funds which contain the significant accounting policies (including investment valuation policies) of those funds, and are not covered by the Report of Independent Registered Public Accounting Firm, are available on the Securities and Exchange Commission website or upon request.
3. Significant Accounting Policies.
The Fund is an investment company and applies the accounting and reporting guidance of the Financial Accounting Standards Board (FASB) Accounting Standards Codification Topic 946 Financial Services - Investment Companies. The financial statements have been prepared in conformity with accounting principles generally accepted in the United States of America (GAAP), which require management to make certain estimates and assumptions at the date of the financial statements. Actual results could differ from those estimates. Subsequent events, if any, through the date that the financial statements were issued have been evaluated in the preparation of the financial statements. The Fund's Schedule of Investments lists any underlying mutual funds or exchange-traded funds (ETFs) but does not include the underlying holdings of these funds. The following summarizes the significant accounting policies of the Fund:
Investment Valuation. Investments are valued as of 4:00 p.m. Eastern time on the last calendar day of the period. The Board of Trustees (the Board) has delegated the day to day responsibility for the valuation of the Fund's investments to the Fair Value Committee (the Committee) established by the Fund's investment adviser. In accordance with valuation policies and procedures approved by the Board, the Fund attempts to obtain prices from one or more third party pricing vendors or brokers to value its investments. When current market prices, quotations or currency exchange rates are not readily available or reliable, investments will be fair valued in good faith by the Committee, in accordance with procedures adopted by the Board. Factors used in determining fair value vary by investment type and may include market or investment specific events. The frequency with which these procedures are used cannot be predicted and they may be utilized to a significant extent. The Committee oversees the Fund's valuation policies and procedures and reports to the Board on the Committee's activities and fair value determinations. The Board monitors the appropriateness of the procedures used in valuing the Fund's investments and ratifies the fair value determinations of the Committee.
The Fund categorizes the inputs to valuation techniques used to value its investments into a disclosure hierarchy consisting of three levels as shown below:
- Level 1 – quoted prices in active markets for identical investments
- Level 2 – other significant observable inputs (including quoted prices for similar investments, interest rates, prepayment speeds, etc.)
- Level 3 – unobservable inputs (including the Fund's own assumptions based on the best information available)
Valuation techniques used to value the Fund's investments by major category are as follows:
Equity securities, including restricted securities, for which market quotations are readily available, are valued at the last reported sale price or official closing price as reported by a third party pricing vendor on the primary market or exchange on which they are traded and are categorized as Level 1 in the hierarchy. In the event there were no sales during the day or closing prices are not available, securities are valued at the last quoted bid price or may be valued using the last available price and are generally categorized as Level 2 in the hierarchy. For foreign equity securities, when market or security specific events arise, comparisons to the valuation of American Depositary Receipts (ADRs), futures contracts, Exchange-Traded Funds (ETFs) and certain indexes as well as quoted prices for similar securities may be used and would be categorized as Level 2 in the hierarchy. For equity securities, including restricted securities, where observable inputs are limited, assumptions about market activity and risk are used and these securities may be categorized as Level 3 in the hierarchy.
Investments in open-end mutual funds, including the Fidelity Central Funds, are valued at their closing net asset value (NAV) each business day and are categorized as Level 1 in the hierarchy.
Changes in valuation techniques may result in transfers in or out of an assigned level within the disclosure hierarchy. The aggregate value of investments by input level as of October 31, 2021 is included at the end of the Fund's Schedule of Investments.
Foreign Currency. Certain Funds may use foreign currency contracts to facilitate transactions in foreign-denominated securities. Gains and losses from these transactions may arise from changes in the value of the foreign currency or if the counterparties do not perform under the contracts' terms.
Foreign-denominated assets, including investment securities, and liabilities are translated into U.S. dollars at the exchange rates at period end. Purchases and sales of investment securities, income and dividends received, and expenses denominated in foreign currencies are translated into U.S. dollars at the exchange rate in effect on the transaction date.
The effects of exchange rate fluctuations on investments are included with the net realized and unrealized gain (loss) on investment securities. Other foreign currency transactions resulting in realized and unrealized gain (loss) are disclosed separately.
Investment Transactions and Income. For financial reporting purposes, the Fund's investment holdings and NAV include trades executed through the end of the last business day of the period. The NAV per share for processing shareholder transactions is calculated as of the close of business of the New York Stock Exchange (NYSE), normally 4:00 p.m. Eastern time and includes trades executed through the end of the prior business day. Gains and losses on securities sold are determined on the basis of identified cost and include proceeds received from litigation. Commissions paid to certain brokers with whom the investment adviser, or its affiliates, places trades on behalf of a fund include an amount in addition to trade execution, which may be rebated back to a fund. Any such rebates are included in net realized gain (loss) on investments in the Statement of Operations. Dividend income is recorded on the ex-dividend date, except for certain dividends from foreign securities where the ex-dividend date may have passed, which are recorded as soon as the Fund is informed of the ex-dividend date. Non-cash dividends included in dividend income, if any, are recorded at the fair market value of the securities received. Income and capital gain distributions from Fidelity Central Funds, if any, are recorded on the ex-dividend date. Certain distributions received by the Fund represent a return of capital or capital gain. The Fund determines the components of these distributions subsequent to the ex-dividend date, based upon receipt of tax filings or other correspondence relating to the underlying investment. These distributions are recorded as a reduction of cost of investments and/or as a realized gain. Investment income is recorded net of foreign taxes withheld where recovery of such taxes is uncertain. Funds may file withholding tax reclaims in certain jurisdictions to recover a portion of amounts previously withheld. Any withholding tax reclaims income is included in the Statement of Operations in dividends. Any receivables for withholding tax reclaims are included in the Statement of Assets and Liabilities in dividends receivable.
Expenses. Expenses directly attributable to a fund are charged to that fund. Expenses attributable to more than one fund are allocated among the respective funds on the basis of relative net assets or other appropriate methods. Expenses included in the accompanying financial statements reflect the expenses of that fund and do not include any expenses associated with any underlying mutual funds or exchange-traded funds. Although not included in a fund's expenses, a fund indirectly bears its proportionate share of these expenses through the net asset value of each underlying mutual fund or exchange-traded fund. Expense estimates are accrued in the period to which they relate and adjustments are made when actual amounts are known.
Income Tax Information and Distributions to Shareholders. Each year, the Fund intends to qualify as a regulated investment company under Subchapter M of the Internal Revenue Code, including distributing substantially all of its taxable income and realized gains. As a result, no provision for U.S. Federal income taxes is required. The Fund files a U.S. federal tax return, in addition to state and local tax returns as required. The Fund's federal income tax returns are subject to examination by the Internal Revenue Service (IRS) for a period of three fiscal years after they are filed. State and local tax returns may be subject to examination for an additional fiscal year depending on the jurisdiction. Foreign taxes are provided for based on the Fund's understanding of the tax rules and rates that exist in the foreign markets in which it invests.
Distributions are declared and recorded on the ex-dividend date. Income and capital gain distributions are determined in accordance with income tax regulations, which may differ from GAAP.
Capital accounts within the financial statements are adjusted for permanent book-tax differences. These adjustments have no impact on net assets or the results of operations. Capital accounts are not adjusted for temporary book-tax differences which will reverse in a subsequent period.
Book-tax differences are primarily due to foreign currency transactions, partnerships and losses deferred due to wash sales.
As of period end, the cost and unrealized appreciation (depreciation) in securities, and derivatives if applicable, for federal income tax purposes were as follows:
| Gross unrealized appreciation | $1,191,453 |
| Gross unrealized depreciation | (146,032) |
| Net unrealized appreciation (depreciation) | $1,045,421 |
| Tax cost | $2,046,085 |
Restricted Securities (including Private Placements). Funds may invest in securities that are subject to legal or contractual restrictions on resale. These securities generally may be resold in transactions exempt from registration or to the public if the securities are registered. Disposal of these securities may involve time-consuming negotiations and expense, and prompt sale at an acceptable price may be difficult. Information regarding restricted securities held at period end is included at the end of the Schedule of Investments, if applicable.
Special Purpose Acquisition Companies. Funds may invest in stock, warrants, and other securities of special purpose acquisition companies (SPACs) or similar special purpose entities. A SPAC is a publicly traded company that raises investment capital via an initial public offering (IPO) for the purpose of acquiring the equity securities of one or more existing companies via merger, business combination, acquisition or other similar transactions within a designated time frame.
Private Investment in Public Equity. Funds may acquire equity securities of an issuer through a private investment in a public equity (PIPE) transaction, including through commitments to purchase securities on a when-issued basis. A PIPE typically involves the purchase of securities directly from a publicly traded company in a private placement transaction. Securities purchased through PIPE transactions will be restricted from trading and considered illiquid until a resale registration statement for the shares is filed and declared effective.
At period end, the Fund had commitments to purchase when-issued securities through PIPE transactions with SPACs. The commitments are contingent upon the SPACs acquiring the securities of target companies. Unrealized appreciation (depreciation) on these commitments is separately presented in the Statements of Assets and Liabilities as Unrealized appreciation (depreciation) on unfunded commitments, and in the Statement of Operations as Change in unrealized appreciation (depreciation) on unfunded commitments.
Consolidated Subsidiary. The Funds included in the table below hold certain investments through a wholly-owned subsidiary ("Subsidiary"), which may be subject to federal and state taxes upon disposition.
As of period end, investments in Subsidiaries were as follows:
| $ Amount | % of Net Assets | |
| Fidelity Large Cap Stock Fund | 2,625 | .08 |
The financial statements have been consolidated to include the Subsidiary accounts where applicable. Accordingly, all inter-company transactions and balances have been eliminated.
At period end, any estimated tax liability for these investments is presented as "Deferred taxes" in the Statement of Assets and Liabilities and included in "Change in net unrealized appreciation (depreciation) on investment securities" in the Statement of Operations. The tax liability incurred may differ materially depending on conditions when these investments are disposed. Any cash held by a Subsidiary is restricted as to its use and is presented as "Restricted cash" in the Statement of Assets and Liabilities, if applicable.
4. Purchases and Sales of Investments.
Purchases and sales of securities, other than short-term securities and in-kind transactions, as applicable, are noted in the table below.
| Purchases ($) | Sales ($) | |
| Fidelity Large Cap Stock Fund | 167,550 | 183,890 |
5. Fees and Other Transactions with Affiliates.
Management Fee. Fidelity Management & Research Company LLC (the investment adviser) and its affiliates provide the Fund with investment management related services for which the Fund pays a monthly management fee. The management fee is the sum of an individual fund fee rate that is based on an annual rate of .30% of the Fund's average net assets and an annualized group fee rate that averaged .23% during the period. The group fee rate is based upon the monthly average net assets of a group of registered investment companies with which the investment adviser has management contracts. The group fee rate decreases as assets under management increase and increases as assets under management decrease. In addition, the management fee is subject to a performance adjustment (up to a maximum of +/- .20% of the Fund's average net assets over a 36 month performance period). The upward or downward adjustment to the management fee is based on the Fund's relative investment performance as compared to its benchmark index, the S&P 500 Index, over the same 36 month performance period. For the reporting period, the total annualized management fee rate, including the performance adjustment, was .36% of the Fund's average net assets. The performance adjustment included in the management fee rate may be higher or lower than the maximum performance adjustment rate due to the difference between the average net assets for the reporting and performance periods.
Transfer Agent Fees. Fidelity Investments Institutional Operations Company LLC (FIIOC), an affiliate of the investment adviser, is the Fund's transfer, dividend disbursing and shareholder servicing agent. FIIOC receives account fees and asset-based fees that vary according to account size and type of account. FIIOC pays for typesetting, printing and mailing of shareholder reports, except proxy statements. For the period, the transfer agent fees were equivalent to an annualized rate of .14% of average net assets.
Accounting Fees. Fidelity Service Company, Inc. (FSC), an affiliate of the investment adviser, maintains the Fund's accounting records. The accounting fee is based on the level of average net assets for each month. For the period, the fees were equivalent to the following annualized rates:
| % of Average Net Assets | |
| Fidelity Large Cap Stock Fund | .03 |
Brokerage Commissions. A portion of portfolio transactions were placed with brokerage firms which are affiliates of the investment adviser. Brokerage commissions are included in net realized gain (loss) and change in net unrealized appreciation (depreciation) in the Statement of Operations. The commissions paid to these affiliated firms were as follows:
| Amount | |
| Fidelity Large Cap Stock Fund | $2 |
Interfund Lending Program. Pursuant to an Exemptive Order issued by the Securities and Exchange Commission (the SEC), the Fund, along with other registered investment companies having management contracts with Fidelity Management & Research Company LLC (FMR), or other affiliated entities of FMR, may participate in an interfund lending program. This program provides an alternative credit facility allowing the Fund to borrow from, or lend money to, other participating affiliated funds. At period end, there were no interfund loans outstanding. Activity in this program during the period for which loans were outstanding was as follows:
| Borrower or Lender | Average Loan Balance | Weighted Average Interest Rate | Interest Expense | |
| Fidelity Large Cap Stock Fund | Borrower | $9,259 | .29% | $-* |
* Amount represents less than five hundred dollars.
Interfund Trades. Funds may purchase from or sell securities to other Fidelity Funds under procedures adopted by the Board. The procedures have been designed to ensure these interfund trades are executed in accordance with Rule 17a-7 of the 1940 Act. Any interfund trades are included within the respective purchases and sales amounts shown in the Purchases and Sales of Investments note. Interfund trades during the period are noted in the table below.
| Purchases ($) | Sales ($) | Realized Gain (Loss) ($) | |
| Fidelity Large Cap Stock Fund | 10,003 | 11,014 | 3,796 |
Other. During the period, the investment adviser reimbursed the Fund for certain losses as follows:
| Amount ($) | |
| Fidelity Large Cap Stock Fund | 333 |
6. Committed Line of Credit.
Certain Funds participate with other funds managed by the investment adviser or an affiliate in a $4.25 billion credit facility (the "line of credit") to be utilized for temporary or emergency purposes to fund shareholder redemptions or for other short-term liquidity purposes. The participating funds have agreed to pay commitment fees on their pro-rata portion of the line of credit, which are reflected in Miscellaneous expenses on the Statement of Operations, and are listed below. During the period, there were no borrowings on this line of credit.
| Amount | |
| Fidelity Large Cap Stock Fund | $2 |
7. Security Lending.
Funds lend portfolio securities from time to time in order to earn additional income. Lending agents are used, including National Financial Services (NFS), an affiliate of the investment adviser. Pursuant to a securities lending agreement, NFS will receive a fee, which is capped at 9.9% of a fund's daily lending revenue, for its services as lending agent. A fund may lend securities to certain qualified borrowers, including NFS. On the settlement date of the loan, a fund receives collateral (in the form of U.S. Treasury obligations, letters of credit and/or cash) against the loaned securities and maintains collateral in an amount not less than 100% of the market value of the loaned securities during the period of the loan. The market value of the loaned securities is determined at the close of business of a fund and any additional required collateral is delivered to a fund on the next business day. A fund or borrower may terminate the loan at any time, and if the borrower defaults on its obligation to return the securities loaned because of insolvency or other reasons, a fund may apply collateral received from the borrower against the obligation. A fund may experience delays and costs in recovering the securities loaned. Any cash collateral received is invested in the Fidelity Securities Lending Cash Central Fund. Any loaned securities are identified as such in the Schedule of Investments, and the value of loaned securities and cash collateral at period end, as applicable, are presented in the Statement of Assets and Liabilities. Security lending income represents the income earned on investing cash collateral, less rebates paid to borrowers and any lending agent fees associated with the loan, plus any premium payments received for lending certain types of securities. Security lending income is presented in the Statement of Operations as a component of income from Fidelity Central Funds. Affiliated security lending activity, if any, was as follows:
| Total Security Lending Fees Paid to NFS | Security Lending Income From Securities Loaned to NFS | Value of Securities Loaned to NFS at Period End | |
| Fidelity Large Cap Stock Fund | $116 | $2 | $658 |
8. Expense Reductions.
During the period the investment adviser or an affiliate reimbursed and/or waived a portion of operating expenses in the amount of $42.
9. Other.
Fund's organizational documents provide former and current trustees and officers with a limited indemnification against liabilities arising in connection with the performance of their duties to the fund. In the normal course of business, the fund may also enter into contracts that provide general indemnifications. The fund's maximum exposure under these arrangements is unknown as this would be dependent on future claims that may be made against the fund. The risk of material loss from such claims is considered remote.
10. Coronavirus (COVID-19) Pandemic.
An outbreak of COVID-19 first detected in China during December 2019 has since spread globally and was declared a pandemic by the World Health Organization during March 2020. Developments that disrupt global economies and financial markets, such as the COVID-19 pandemic, may magnify factors that affect the Fund's performance.
Shareholder Expense Example
As a shareholder, you incur two types of costs: (1) transaction costs, which may include sales charges (loads) on purchase payments or redemption proceeds, as applicable and (2) ongoing costs, which generally include management fees, distribution and/or service (12b-1) fees and other Fund expenses. This Example is intended to help you understand your ongoing costs (in dollars) of investing in a fund and to compare these costs with the ongoing costs of investing in other mutual funds.
The Example is based on an investment of $1,000 invested at the beginning of the period and held for the entire period (May 1, 2021 to October 31, 2021).
Actual Expenses
The first line of the accompanying table provides information about actual account values and actual expenses. You may use the information in this line, together with the amount you invested, to estimate the expenses that you paid over the period. Simply divide your account value by $1,000.00 (for example, an $8,600 account value divided by $1,000.00 = 8.6), then multiply the result by the number in the first line for a class/Fund under the heading entitled "Expenses Paid During Period" to estimate the expenses you paid on your account during this period. If any fund is a shareholder of any underlying mutual funds or exchange-traded funds (ETFs) (the Underlying Funds), such fund indirectly bears its proportional share of the expenses of the Underlying Funds in addition to the direct expenses incurred presented in the table. These fees and expenses are not included in the annualized expense ratio used to calculate the expense estimate in the table below.
Hypothetical Example for Comparison Purposes
The second line of the accompanying table provides information about hypothetical account values and hypothetical expenses based on the actual expense ratio and an assumed rate of return of 5% per year before expenses, which is not the actual return. The hypothetical account values and expenses may not be used to estimate the actual ending account balance or expenses you paid for the period. You may use this information to compare the ongoing costs of investing in the Fund and other funds. To do so, compare this 5% hypothetical example with the 5% hypothetical examples that appear in the shareholder reports of the other funds. If any fund is a shareholder of any Underlying Funds, such fund indirectly bears its proportional share of the expenses of the Underlying Funds in addition to the direct expenses as presented in the table. These fees and expenses are not included in the annualized expense ratio used to calculate the expense estimate in the table below.
Please note that the expenses shown in the table are meant to highlight your ongoing costs only and do not reflect any transaction costs. Therefore, the second line of the table is useful in comparing ongoing costs only, and will not help you determine the relative total costs of owning different funds. In addition, if these transactional costs were included, your costs would have been higher.
| Annualized Expense Ratio-A | Beginning Account Value May 1, 2021 | Ending Account Value October 31, 2021 | Expenses Paid During Period-B May 1, 2021 to October 31, 2021 | |
| Fidelity Large Cap Stock Fund | .53% | |||
| Actual | $1,000.00 | $1,065.90 | $2.76 | |
| Hypothetical-C | $1,000.00 | $1,022.53 | $2.70 |
A Annualized expense ratio reflects expenses net of applicable fee waivers.
B Expenses are equal to the annualized expense ratio, multiplied by the average account value over the period, multiplied by 184/ 365 (to reflect the one-half year period). The fees and expenses of any Underlying Funds are not included in each annualized expense ratio.
C 5% return per year before expenses
Board Approval of Investment Advisory Contracts and Management Fees
Fidelity Large Cap Stock Fund
Each year, the Board of Trustees, including the Independent Trustees (together, the Board), votes on the renewal of the management contract with Fidelity Management & Research Company LLC (FMR) and the sub-advisory agreements (together, the Advisory Contracts) for the fund. FMR and the sub-advisers are referred to herein as the Investment Advisers. The Board, assisted by the advice of fund counsel and Independent Trustees' counsel, requests and considers a broad range of information relevant to the renewal of the Advisory Contracts throughout the year.The Board meets regularly and, at each of its meetings, covers an extensive agenda of topics and materials and considers factors that are relevant to its annual consideration of the renewal of the fund's Advisory Contracts, including the services and support provided to the fund and its shareholders. The Board has established various standing committees (Committees), each composed of and chaired by Independent Trustees with varying backgrounds, to which the Board has assigned specific subject matter responsibilities in order to enhance effective decision-making by the Board. The Board, acting directly and through its Committees, requests and receives information concerning the annual consideration of the renewal of the fund's Advisory Contracts. The Board also meets as needed to review matters specifically related to the Board's annual consideration of the renewal of the Advisory Contracts. Members of the Board may also meet with trustees of other Fidelity funds through joint ad hoc committees to discuss certain matters relevant to all of the Fidelity funds.At its May 2021 meeting, the Board unanimously determined to renew the fund's Advisory Contracts. In reaching its determination, the Board considered all factors it believed relevant, including (i) the nature, extent, and quality of the services provided to the fund and its shareholders (including the investment performance of the fund); (ii) the competitiveness of the fund's management fee and total expense ratio relative to peer funds; (iii) the total costs of the services provided by and the profits realized by Fidelity from its relationships with the fund; and (iv) the extent to which, if any, economies of scale exist and are realized as the fund grows, and whether any economies of scale are appropriately shared with fund shareholders.In considering whether to renew the Advisory Contracts for the fund, the Board reached a determination, with the assistance of fund counsel and Independent Trustees' counsel and through the exercise of its business judgment, that the renewal of the Advisory Contracts was in the best interests of the fund and its shareholders and that the compensation payable under the Advisory Contracts was fair and reasonable. The Board's decision to renew the Advisory Contracts was not based on any single factor, but rather was based on a comprehensive consideration of all the information provided to the Board at its meetings throughout the year. The Board, in reaching its determination to renew the Advisory Contracts, was aware that shareholders of the fund have a broad range of investment choices available to them, including a wide choice among funds offered by Fidelity's competitors, and that the fund's shareholders, who have the opportunity to review and weigh the disclosure provided by the fund in its prospectus and other public disclosures, have chosen to invest in this fund, which is part of the Fidelity family of funds.Nature, Extent, and Quality of Services Provided. The Board considered Fidelity's staffing as it relates to the fund, including the backgrounds of investment personnel of Fidelity, and also considered the fund's investment objective, strategies, and related investment philosophy. The Independent Trustees also had discussions with senior management of Fidelity's investment operations and investment groups. The Board considered the structure of the investment personnel compensation program and whether this structure provides appropriate incentives to act in the best interests of the fund. Additionally, the Board considered the portfolio managers' investments, if any, in the funds that they manage.Resources Dedicated to Investment Management and Support Services. The Board and the Fund Oversight and Research Committees reviewed the general qualifications and capabilities of Fidelity's investment staff, including its size, education, experience, and resources, as well as Fidelity's approach to recruiting, training, managing, and compensating investment personnel. The Board noted that Fidelity has continued to increase the resources devoted to non-U.S. offices, including expansion of Fidelity's global investment organization. The Board also noted that Fidelity's analysts have extensive resources, tools and capabilities that allow them to conduct sophisticated quantitative and fundamental analysis, as well as credit analysis of issuers, counterparties and guarantors. Further, the Board considered that Fidelity's investment professionals have sufficient access to global information and data so as to provide competitive investment results over time, and that those professionals also have access to sophisticated tools that permit them to assess portfolio construction and risk and performance attribution characteristics continuously, as well as to transmit new information and research conclusions rapidly around the world. Additionally, in its deliberations, the Board considered Fidelity's trading, risk management, compliance, and technology and operations capabilities and resources, which are integral parts of the investment management process. The Board also considered Fidelity's investments in business continuity planning, and its success in continuously providing services to the fund notwithstanding the severe disruptions caused by the COVID-19 pandemic.Shareholder and Administrative Services. The Board considered (i) the nature, extent, quality, and cost of advisory, administrative, and shareholder services performed by the Investment Advisers and their affiliates under the Advisory Contracts and under separate agreements covering transfer agency, pricing and bookkeeping, and securities lending services for the fund; (ii) the nature and extent of the supervision of third party service providers, principally custodians, subcustodians, and pricing vendors; and (iii) the resources devoted to, and the record of compliance with, the fund's compliance policies and procedures. The Board also reviewed the allocation of fund brokerage, including allocations to brokers affiliated with the Investment Advisers, the use of brokerage commissions to pay fund expenses, and the use of "soft" commission dollars to pay for research services.The Board noted that the growth of fund assets over time across the complex allows Fidelity to reinvest in the development of services designed to enhance the value and convenience of the Fidelity funds as investment vehicles. These services include 24-hour access to account information and market information over the Internet and through telephone representatives, investor education materials and asset allocation tools, and the expanded availability of Fidelity Investor Centers.The Board noted that, in the past, it and the boards of certain other Fidelity funds had formed an ad hoc Committee on Transfer Agency Fees to review the variety of transfer agency fee structures throughout the industry and Fidelity's competitive positioning with respect to industry participants.Investment in a Large Fund Family. The Board considered the benefits to shareholders of investing in a Fidelity fund, including the benefits of investing in a fund that is part of a large family of funds offering a variety of investment disciplines and providing a large variety of mutual fund investor services. The Board noted that Fidelity had taken, or had made recommendations that resulted in the Fidelity funds taking, a number of actions over the previous year that benefited particular funds, including: (i) continuing to dedicate additional resources to Fidelity's investment research process, which includes meetings with management of issuers of securities in which the funds invest, and to the support of the senior management team that oversees asset management; (ii) continuing efforts to enhance Fidelity's global research capabilities; (iii) launching new funds and ETFs with innovative structures, strategies and pricing and making other enhancements to meet client needs; (iv) launching new share classes of existing funds; (v) eliminating purchase minimums and broadening eligibility requirements for certain funds and share classes; (vi) approving the reduction in the holding period for the Class C to Class A conversion policy; (vii) reducing management fees and total expenses for certain target date funds and classes and index funds; (viii) lowering expenses for certain existing funds and classes by implementing or lowering expense caps; (ix) rationalizing product lines and gaining increased efficiencies from fund mergers, liquidations, and share class consolidations; (x) continuing to develop, acquire and implement systems and technology to improve services to the funds and shareholders, strengthen information security, and increase efficiency; and (xi) continuing to implement enhancements to further strengthen Fidelity's product line to increase investors' probability of success in achieving their investment goals, including retirement income goals.Investment Performance. The Board considered whether the fund has operated in accordance with its investment objective, as well as its record of compliance with its investment restrictions and its performance history.The Board took into account discussions that occur at Board meetings throughout the year with representatives of the Investment Advisers about fund investment performance. In this regard the Board noted that as part of regularly scheduled fund reviews and other reports to the Board on fund performance, the Board considers annualized return information for the fund for different time periods, measured against an appropriate securities market index (benchmark index) and an appropriate peer group of funds with similar objectives (peer group). In its evaluation of fund investment performance, the Board gave particular attention to information indicating changes in performance of certain Fidelity funds for specific time periods and discussed with the Investment Advisers the reasons for any overperformance or underperformance.In addition to reviewing absolute and relative fund performance, the Independent Trustees periodically consider the appropriateness of fund performance metrics in evaluating the results achieved. In general, the Independent Trustees believe that fund performance should be evaluated based on net performance (after fees and expenses) of both the highest performing and lowest performing fund share classes, where applicable, compared to appropriate benchmark indices, over appropriate time periods that may include full market cycles, and compared to peer groups, as applicable, over the same periods, taking into account relevant factors including the following: general market conditions; issuer-specific information; and fund cash flows and other factors.The Independent Trustees recognize that shareholders evaluate performance on a net basis over their own holding periods, for which one-, three-, and five-year periods are often used as a proxy. For this reason, the performance information reviewed by the Board also included net cumulative total return information for the fund and an appropriate benchmark index and peer group for the most recent one-, three-, and five-year periods ended September 30, 2020, as shown below. Returns are shown compared to the 25th percentile (top of box, 75% beaten) and 75th percentile (bottom of box, 25% beaten) of the peer universe.Fidelity Large Cap Stock Fund

Fidelity Large Cap Stock Fund

![]()
LCS-SANN-1221
1.465347.124
Fidelity® Small Cap Stock Fund
Semi-Annual Report
October 31, 2021
Contents
Board Approval of Investment Advisory Contracts and Management Fees |
To view a fund's proxy voting guidelines and proxy voting record for the 12-month period ended June 30, visit http://www.fidelity.com/proxyvotingresults or visit the Securities and Exchange Commission's (SEC) web site at http://www.sec.gov.
You may also call 1-800-544-8544 to request a free copy of the proxy voting guidelines.
Standard & Poor's, S&P and S&P 500 are registered service marks of The McGraw-Hill Companies, Inc. and have been licensed for use by Fidelity Distributors Corporation.
Other third-party marks appearing herein are the property of their respective owners.
All other marks appearing herein are registered or unregistered trademarks or service marks of FMR LLC or an affiliated company. © 2021 FMR LLC. All rights reserved.
This report and the financial statements contained herein are submitted for the general information of the shareholders of the Fund. This report is not authorized for distribution to prospective investors in the Fund unless preceded or accompanied by an effective prospectus.
A fund files its complete schedule of portfolio holdings with the SEC for the first and third quarters of each fiscal year on Form N-PORT. Forms N-PORT are available on the SEC’s web site at http://www.sec.gov. A fund's Forms N-PORT may be reviewed and copied at the SEC’s Public Reference Room in Washington, DC. Information regarding the operation of the SEC's Public Reference Room may be obtained by calling 1-800-SEC-0330.
For a complete list of a fund's portfolio holdings, view the most recent holdings listing, semiannual report, or annual report on Fidelity's web site at http://www.fidelity.com, http://www.institutional.fidelity.com, or http://www.401k.com, as applicable.
NOT FDIC INSURED •MAY LOSE VALUE •NO BANK GUARANTEE
Neither the Fund nor Fidelity Distributors Corporation is a bank.
Note to Shareholders:
Early in 2020, the outbreak and spread of COVID-19 emerged as a public health emergency that had a major influence on financial markets, primarily based on its impact on the global economy and corporate earnings. On March 11, 2020, the World Health Organization declared the COVID-19 outbreak a pandemic, citing sustained risk of further global spread. The pandemic prompted a number of measures to limit the spread of COVID-19, including travel and border restrictions, quarantines, and restrictions on large gatherings. In turn, these resulted in lower consumer activity, diminished demand for a wide range of products and services, disruption in manufacturing and supply chains, and – given the wide variability in outcomes regarding the outbreak – significant market uncertainty and volatility. To help stem the turmoil, the U.S. government took unprecedented action – in concert with the U.S. Federal Reserve and central banks around the world – to help support consumers, businesses, and the broader economy, and to limit disruption to the financial system.
In general, the overall impact of the pandemic lessened in 2021, amid a resilient economy and widespread distribution of three COVID-19 vaccines granted emergency use authorization from the U.S. Food and Drug Administration (FDA) early in the year. Still, the situation remains dynamic, and the extent and duration of its influence on financial markets and the economy is highly uncertain, due in part to a recent spike in cases based on highly contagious variants of the coronavirus.
Extreme events such as the COVID-19 crisis are exogenous shocks that can have significant adverse effects on mutual funds and their investments. Although multiple asset classes may be affected by market disruption, the duration and impact may not be the same for all types of assets. Fidelity is committed to helping you stay informed amid news about COVID-19 and during increased market volatility, and we continue to take extra steps to be responsive to customer needs. We encourage you to visit us online, where we offer ongoing updates, commentary, and analysis on the markets and our funds.
Investment Summary (Unaudited)
Top Ten Stocks as of October 31, 2021
| % of fund's net assets | |
| Insperity, Inc. | 2.5 |
| Builders FirstSource, Inc. | 2.4 |
| Medpace Holdings, Inc. | 2.3 |
| Walker & Dunlop, Inc. | 2.3 |
| GMS, Inc. | 2.2 |
| LPL Financial | 2.1 |
| Jones Lang LaSalle, Inc. | 2.0 |
| TriNet Group, Inc. | 2.0 |
| Concentrix Corp. | 1.8 |
| Semler Scientific, Inc. | 1.7 |
| 21.3 |
Top Five Market Sectors as of October 31, 2021
| % of fund's net assets | |
| Financials | 18.8 |
| Industrials | 18.5 |
| Health Care | 15.5 |
| Information Technology | 13.6 |
| Consumer Discretionary | 10.8 |
Asset Allocation (% of fund's net assets)
| As of October 31, 2021* | ||
| Stocks | 99.1% | |
| Short-Term Investments and Net Other Assets (Liabilities) | 0.9% | |

* Foreign investments - 15.8%
Schedule of Investments October 31, 2021 (Unaudited)
Showing Percentage of Net Assets
| Common Stocks - 99.1% | |||
| Shares | Value (000s) | ||
| COMMUNICATION SERVICES - 3.5% | |||
| Diversified Telecommunication Services - 1.2% | |||
| IDT Corp. Class B (a) | 305,689 | $14,786 | |
| LICT Corp. (a) | 159 | 3,975 | |
| 18,761 | |||
| Entertainment - 0.0% | |||
| Lions Gate Entertainment Corp. Class A (a)(b) | 24,654 | 319 | |
| Interactive Media & Services - 1.1% | |||
| Outbrain, Inc. | 344,100 | 5,829 | |
| Synchro Food Co. Ltd. (a) | 90,700 | 311 | |
| Trustpilot Group PLC (a)(c) | 120,523 | 522 | |
| ZipRecruiter, Inc. (a) | 414,993 | 11,529 | |
| 18,191 | |||
| Media - 1.2% | |||
| Lee Enterprises, Inc. (a) | 199,319 | 4,176 | |
| Nexstar Broadcasting Group, Inc. Class A | 52,708 | 7,903 | |
| Tegna, Inc. | 410,000 | 8,061 | |
| 20,140 | |||
| TOTAL COMMUNICATION SERVICES | 57,411 | ||
| CONSUMER DISCRETIONARY - 10.8% | |||
| Diversified Consumer Services - 0.4% | |||
| Houghton Mifflin Harcourt Co. (a)(b) | 501,500 | 7,116 | |
| Hotels, Restaurants & Leisure - 0.9% | |||
| Angler Gaming PLC | 786,816 | 1,182 | |
| Potbelly Corp. (a) | 588,737 | 3,544 | |
| RCI Hospitality Holdings, Inc. | 140,414 | 9,520 | |
| 14,246 | |||
| Household Durables - 0.1% | |||
| Cavco Industries, Inc. (a) | 6,000 | 1,442 | |
| Dream Finders Homes, Inc. (b) | 45,042 | 715 | |
| 2,157 | |||
| Internet & Direct Marketing Retail - 4.5% | |||
| a.k.a. Brands Holding Corp. | 542,899 | 5,521 | |
| BHG Group AB (a) | 1,026,879 | 11,820 | |
| Global-e Online Ltd. (a) | 87,929 | 5,088 | |
| Home24 AG (a)(b) | 320,335 | 4,181 | |
| Kogan.Com Ltd. (b) | 1,986,034 | 14,850 | |
| Liquidity Services, Inc. (a) | 197,259 | 4,355 | |
| Porch Group, Inc. Class A (a) | 368,511 | 7,750 | |
| Poshmark, Inc. (b) | 281,334 | 6,845 | |
| Temple & Webster Group Ltd. (a) | 1,232,722 | 11,749 | |
| Vente-Unique.Com SA | 56,573 | 1,069 | |
| 73,228 | |||
| Leisure Products - 0.2% | |||
| Vista Outdoor, Inc. (a) | 83,387 | 3,489 | |
| Multiline Retail - 0.1% | |||
| Tuesday Morning Corp. (a)(b) | 506,407 | 1,150 | |
| Specialty Retail - 4.1% | |||
| Camping World Holdings, Inc. (b) | 557,944 | 20,783 | |
| JOANN, Inc. (b) | 189,696 | 1,939 | |
| Lyko Group AB (A Shares) (a) | 131,292 | 4,365 | |
| Musti Group OYJ | 529,977 | 20,818 | |
| OneWater Marine, Inc. Class A | 330,553 | 14,657 | |
| Tile Shop Holdings, Inc. (a)(b) | 534,570 | 4,458 | |
| 67,020 | |||
| Textiles, Apparel & Luxury Goods - 0.5% | |||
| Rocky Brands, Inc. | 137,265 | 7,488 | |
| TOTAL CONSUMER DISCRETIONARY | 175,894 | ||
| CONSUMER STAPLES - 3.3% | |||
| Food & Staples Retailing - 2.0% | |||
| BJ's Wholesale Club Holdings, Inc. (a) | 433,031 | 25,306 | |
| Cake Box Holdings PLC | 1,471,380 | 7,410 | |
| 32,716 | |||
| Personal Products - 0.4% | |||
| MediFast, Inc. | 34,018 | 6,677 | |
| Tobacco - 0.9% | |||
| Turning Point Brands, Inc. | 358,512 | 13,684 | |
| TOTAL CONSUMER STAPLES | 53,077 | ||
| ENERGY - 6.5% | |||
| Energy Equipment & Services - 0.7% | |||
| Liberty Oilfield Services, Inc. Class A (a) | 816,368 | 10,547 | |
| Profire Energy, Inc. (a) | 332,863 | 396 | |
| 10,943 | |||
| Oil, Gas & Consumable Fuels - 5.8% | |||
| Bonanza Creek Energy, Inc. | 279,269 | 15,678 | |
| Brigham Minerals, Inc. Class A | 286,857 | 6,649 | |
| Enviva Partners LP | 179,185 | 11,998 | |
| Evolution Petroleum Corp. | 880,567 | 5,231 | |
| Extraction Oil & Gas, Inc. (a) | 148,774 | 9,913 | |
| Gulfport Energy Corp. (a) | 178,104 | 14,612 | |
| Northern Oil & Gas, Inc. | 635,000 | 14,707 | |
| Oasis Petroleum, Inc. | 89,000 | 10,733 | |
| SilverBow Resources, Inc. (a) | 170,414 | 4,703 | |
| 94,224 | |||
| TOTAL ENERGY | 105,167 | ||
| FINANCIALS - 18.8% | |||
| Banks - 0.3% | |||
| Parke Bancorp, Inc. | 144,435 | 3,202 | |
| Union Bankshares, Inc. | 87,061 | 2,786 | |
| 5,988 | |||
| Capital Markets - 7.0% | |||
| Bridge Investment Group Holdings, Inc. | 915,754 | 17,354 | |
| Bridgepoint Group Holdings Ltd. (c) | 891,599 | 6,052 | |
| Gresham House PLC | 473,455 | 5,572 | |
| Impax Asset Management Group PLC | 1,642,018 | 24,629 | |
| Liontrust Asset Management PLC | 273,763 | 8,168 | |
| LPL Financial | 205,517 | 33,709 | |
| OTC Markets Group, Inc. Class A | 44,053 | 2,225 | |
| P10, Inc. (a)(b) | 388,700 | 4,859 | |
| P10, Inc. Class B (a) | 12,663 | 158 | |
| StepStone Group, Inc. Class A | 98,985 | 4,650 | |
| Titanium OYJ | 184,242 | 3,301 | |
| Westwood Holdings Group, Inc. | 171,564 | 2,985 | |
| 113,662 | |||
| Consumer Finance - 2.9% | |||
| Atlanticus Holdings Corp. (a) | 90,981 | 7,050 | |
| First Cash Financial Services, Inc. | 250,208 | 22,136 | |
| Nelnet, Inc. Class A | 217,146 | 17,943 | |
| 47,129 | |||
| Insurance - 2.4% | |||
| GoHealth, Inc. (a) | 2,180,000 | 11,772 | |
| HCI Group, Inc. (b) | 131,132 | 17,573 | |
| Tiptree, Inc. | 605,872 | 9,458 | |
| 38,803 | |||
| Thrifts & Mortgage Finance - 6.2% | |||
| Axos Financial, Inc. (a) | 474,075 | 25,126 | |
| Enact Holdings, Inc. | 361,266 | 8,302 | |
| Hingham Institution for Savings | 21,840 | 7,889 | |
| NMI Holdings, Inc. (a) | 531,512 | 12,905 | |
| Southern Missouri Bancorp, Inc. | 189,446 | 10,306 | |
| Walker & Dunlop, Inc. | 281,563 | 36,623 | |
| 101,151 | |||
| TOTAL FINANCIALS | 306,733 | ||
| HEALTH CARE - 15.5% | |||
| Biotechnology - 1.3% | |||
| Bioventix PLC | 12,270 | 605 | |
| Emergent BioSolutions, Inc. (a) | 258,856 | 12,340 | |
| Organogenesis Holdings, Inc. Class A (a) | 770,000 | 8,455 | |
| 21,400 | |||
| Health Care Equipment & Supplies - 4.7% | |||
| Axonics Modulation Technologies, Inc. (a) | 193,000 | 14,157 | |
| Medistim ASA | 50,598 | 2,276 | |
| OrthoPediatrics Corp. (a)(b) | 140,716 | 10,015 | |
| Pro-Dex, Inc. (a) | 73,856 | 1,792 | |
| Sanara Medtech, Inc. (a)(b) | 58,836 | 2,053 | |
| Semler Scientific, Inc. (a) | 184,353 | 27,651 | |
| TransMedics Group, Inc. (a) | 228,862 | 6,278 | |
| Tristel PLC (b) | 949,146 | 6,365 | |
| Utah Medical Products, Inc. (b) | 52,986 | 5,131 | |
| 75,718 | |||
| Health Care Providers & Services - 1.2% | |||
| Acadia Healthcare Co., Inc. (a) | 16,552 | 1,026 | |
| ATI Physical Therapy, Inc. (b) | 117,017 | 336 | |
| The Ensign Group, Inc. | 44,145 | 3,444 | |
| The Joint Corp. (a)(b) | 140,428 | 12,285 | |
| Viemed Healthcare, Inc. (a) | 543,017 | 3,115 | |
| 20,206 | |||
| Health Care Technology - 4.6% | |||
| Evolent Health, Inc. (a)(b) | 673,643 | 19,718 | |
| Health Catalyst, Inc. (a) | 312,126 | 16,430 | |
| Omnicell, Inc. (a) | 50,105 | 8,926 | |
| Phreesia, Inc. (a) | 343,618 | 24,239 | |
| Schrodinger, Inc. (a) | 94,827 | 5,176 | |
| 74,489 | |||
| Life Sciences Tools & Services - 3.2% | |||
| Addlife AB | 376,200 | 15,384 | |
| Medpace Holdings, Inc. (a) | 163,916 | 37,135 | |
| 52,519 | |||
| Pharmaceuticals - 0.5% | |||
| Harrow Health, Inc. (a) | 808,233 | 8,155 | |
| TOTAL HEALTH CARE | 252,487 | ||
| INDUSTRIALS - 18.5% | |||
| Building Products - 2.5% | |||
| Builders FirstSource, Inc. (a) | 672,990 | 39,215 | |
| Reliance Worldwide Corp. Ltd. | 496,394 | 2,155 | |
| 41,370 | |||
| Commercial Services & Supplies - 0.8% | |||
| Qleanair Holding AB (d) | 809,027 | 6,086 | |
| Sdiptech AB (a) | 139,097 | 7,248 | |
| 13,334 | |||
| Construction & Engineering - 1.5% | |||
| NV5 Global, Inc. (a) | 232,939 | 24,256 | |
| Electrical Equipment - 0.2% | |||
| Orion Energy Systems, Inc. (a) | 57,277 | 234 | |
| Powell Industries, Inc. | 114,872 | 2,971 | |
| 3,205 | |||
| Industrial Conglomerates - 0.2% | |||
| Volati AB | 171,177 | 3,827 | |
| Machinery - 0.7% | |||
| Hurco Companies, Inc. | 321,465 | 10,432 | |
| Twin Disc, Inc. (a) | 86,855 | 1,179 | |
| 11,611 | |||
| Professional Services - 9.7% | |||
| CACI International, Inc. Class A (a) | 47,915 | 13,782 | |
| First Advantage Corp. (b) | 751,559 | 14,054 | |
| Franklin Covey Co. (a) | 392,978 | 16,603 | |
| Insperity, Inc. | 323,867 | 40,484 | |
| Kelly Partners Group Holdings Ltd. | 961,703 | 2,619 | |
| MISTRAS Group, Inc. (a) | 486,033 | 4,773 | |
| Red Violet, Inc. (a)(b) | 530,061 | 16,882 | |
| SHL-JAPAN Ltd. | 36,981 | 813 | |
| Sterling Check Corp. | 363,000 | 7,786 | |
| Talenom OYJ | 460,023 | 7,392 | |
| TriNet Group, Inc. (a) | 317,462 | 32,143 | |
| 157,331 | |||
| Trading Companies & Distributors - 2.9% | |||
| DXP Enterprises, Inc. (a) | 212,599 | 7,007 | |
| GMS, Inc. (a) | 707,976 | 35,066 | |
| Teqnion AB (a) | 315,700 | 4,963 | |
| 47,036 | |||
| TOTAL INDUSTRIALS | 301,970 | ||
| INFORMATION TECHNOLOGY - 13.6% | |||
| Electronic Equipment & Components - 1.4% | |||
| Insight Enterprises, Inc. (a) | 150,891 | 14,289 | |
| TD SYNNEX Corp. | 78,310 | 8,223 | |
| 22,512 | |||
| IT Services - 5.3% | |||
| Cass Information Systems, Inc. | 187,072 | 7,668 | |
| Concentrix Corp. | 166,018 | 29,498 | |
| Cyxtera Technologies, Inc.: | |||
| warrants 9/10/27 (a) | 214,878 | 501 | |
| Class A (a)(b) | 876,471 | 8,712 | |
| Dlocal Ltd. | 19,000 | 922 | |
| ECIT A/S (a) | 4,839,684 | 5,557 | |
| MoneyGram International, Inc. (a) | 1,726,985 | 10,310 | |
| Paya Holdings, Inc. (a)(b) | 1,463,309 | 13,331 | |
| Paymentus Holdings, Inc. (a) | 3,000 | 77 | |
| Priority Technology Holdings, Inc. (a) | 1,264,651 | 6,677 | |
| TaskUs, Inc. | 47,900 | 2,773 | |
| 86,026 | |||
| Software - 6.2% | |||
| 24sevenoffice Scandinavia AB (a) | 1,247,162 | 2,454 | |
| Admicom OYJ | 37,342 | 3,971 | |
| CCC Intelligent Solutions Holdings, Inc. Class A (a) | 476,564 | 5,709 | |
| ChannelAdvisor Corp. (a) | 798,921 | 20,380 | |
| Cint Group AB | 168,279 | 2,539 | |
| E2open Parent Holdings, Inc. (a)(b) | 1,000,000 | 12,500 | |
| EcoOnline Holding A/S (a) | 439,456 | 1,144 | |
| Elmo Software Ltd. (a)(b) | 744,793 | 2,969 | |
| EverCommerce, Inc. | 450,000 | 9,306 | |
| GetBusy PLC (a) | 2,309,434 | 2,133 | |
| Intapp, Inc. | 202,282 | 5,462 | |
| Intelligent Systems Corp. (a)(b) | 170,540 | 7,219 | |
| LeadDesk Oyj (a) | 122,505 | 3,413 | |
| MSL Solutions Ltd. (a) | 9,224,955 | 1,527 | |
| Orn Software A/S (a) | 1,906,169 | 2,236 | |
| Park City Group, Inc. (a)(b) | 714,638 | 4,052 | |
| Paycor HCM, Inc. | 5,900 | 191 | |
| SecureWorks Corp. (a) | 326,354 | 6,011 | |
| Sikri Holding A/S (a) | 261,758 | 3,796 | |
| Upsales Technology AB (a) | 513,877 | 5,026 | |
| 102,038 | |||
| Technology Hardware, Storage & Peripherals - 0.7% | |||
| Avid Technology, Inc. (a) | 412,700 | 11,820 | |
| TOTAL INFORMATION TECHNOLOGY | 222,396 | ||
| MATERIALS - 1.4% | |||
| Chemicals - 0.8% | |||
| Ciner Resources LP (a) | 4,122 | 67 | |
| Hawkins, Inc. | 46,272 | 1,697 | |
| Intrepid Potash, Inc. (a) | 82,370 | 4,012 | |
| Nanophase Technologies Corp. (a) | 297,148 | 951 | |
| The Chemours Co. LLC | 210,000 | 5,884 | |
| 12,611 | |||
| Containers & Packaging - 0.3% | |||
| UFP Technologies, Inc. (a) | 80,397 | 4,976 | |
| Metals & Mining - 0.3% | |||
| Steel Dynamics, Inc. | 66,416 | 4,389 | |
| TOTAL MATERIALS | 21,976 | ||
| REAL ESTATE - 6.6% | |||
| Equity Real Estate Investment Trusts (REITs) - 2.2% | |||
| Essential Properties Realty Trust, Inc. (b) | 512,633 | 15,271 | |
| Plymouth Industrial REIT, Inc. | 300,000 | 7,668 | |
| Retail Value, Inc. | 70 | 0 | |
| Spirit Realty Capital, Inc. | 260,000 | 12,722 | |
| 35,661 | |||
| Real Estate Management & Development - 4.4% | |||
| BBX Capital, Inc. (a) | 249,685 | 2,494 | |
| Cushman & Wakefield PLC (a) | 761,201 | 13,998 | |
| Jones Lang LaSalle, Inc. (a) | 124,730 | 32,209 | |
| Marcus & Millichap, Inc. (a) | 251,208 | 11,832 | |
| Newmark Group, Inc. | 810,777 | 12,064 | |
| 72,597 | |||
| TOTAL REAL ESTATE | 108,258 | ||
| UTILITIES - 0.6% | |||
| Independent Power and Renewable Electricity Producers - 0.6% | |||
| NextEra Energy Partners LP | 108,593 | 9,372 | |
| TOTAL COMMON STOCKS | |||
| (Cost $1,254,277) | 1,614,741 | ||
| Money Market Funds - 6.1% | |||
| Fidelity Cash Central Fund 0.06% (e) | 5,328,626 | 5,330 | |
| Fidelity Securities Lending Cash Central Fund 0.06% (e)(f) | 94,182,567 | 94,192 | |
| TOTAL MONEY MARKET FUNDS | |||
| (Cost $99,522) | 99,522 | ||
| TOTAL INVESTMENT IN SECURITIES - 105.2% | |||
| (Cost $1,353,799) | 1,714,263 | ||
| NET OTHER ASSETS (LIABILITIES) - (5.2)% | (84,206) | ||
| NET ASSETS - 100% | $1,630,057 |
Values shown as $0 in the Schedule of Investments may reflect amounts less than $500.
Legend
(a) Non-income producing
(b) Security or a portion of the security is on loan at period end.
(c) Security exempt from registration under Rule 144A of the Securities Act of 1933. These securities may be resold in transactions exempt from registration, normally to qualified institutional buyers. At the end of the period, the value of these securities amounted to $6,574,000 or 0.4% of net assets.
(d) Affiliated company
(e) Affiliated fund that is generally available only to investment companies and other accounts managed by Fidelity Investments. The rate quoted is the annualized seven-day yield of the fund at period end. A complete unaudited listing of the fund's holdings as of its most recent quarter end is available upon request. In addition, each Fidelity Central Fund's financial statements are available on the SEC's website or upon request.
(f) Investment made with cash collateral received from securities on loan.
Affiliated Central Funds
Fiscal year to date information regarding the Fund's investments in Fidelity Central Funds, including the ownership percentage, is presented below.
| Fund (Amounts in thousands) | Value, beginning of period | Purchases | Sales Proceeds | Dividend Income | Realized Gain/Loss | Change in Unrealized appreciation (depreciation) | Value, end of period | % ownership, end of period |
| Fidelity Cash Central Fund 0.06% | $5,087 | $203,925 | $203,682 | $3 | $-- | $-- | $5,330 | 0.0% |
| Fidelity Securities Lending Cash Central Fund 0.06% | 112,864 | 268,294 | 286,966 | 1,148 | -- | -- | 94,192 | 0.3% |
| Total | $117,951 | $472,219 | $490,648 | $1,151 | $-- | $-- | $99,522 |
Amounts in the income column in the above table include any capital gain distributions from underlying funds, which are presented in the corresponding line-item in the Statement of Operations, if applicable. Amount for Fidelity Securities Lending Cash Central Fund represents the income earned on investing cash collateral, less rebates paid to borrowers and any lending agent fees associated with the loan, plus any premium payments received for lending certain types of securities.
Other Affiliated Issuers
An affiliated company is a company in which the Fund has ownership of at least 5% of the voting securities. Fiscal year to date transactions with companies which are or were affiliates are as follows:
| Affiliate (Amounts in thousands) | Value, beginning of period | Purchases | Sales Proceeds | Dividend Income | Realized Gain (loss) | Change in Unrealized appreciation (depreciation) | Value, end of period |
| Qleanair Holding AB | $6,218 | $-- | $126 | $109 | $12 | $(18) | $6,086 |
| Total | $6,218 | $-- | $126 | $109 | $12 | $(18) | $6,086 |
Investment Valuation
The following is a summary of the inputs used, as of October 31, 2021, involving the Fund's assets and liabilities carried at fair value. The inputs or methodology used for valuing securities may not be an indication of the risk associated with investing in those securities. For more information on valuation inputs, and their aggregation into the levels used below, please refer to the Investment Valuation section in the accompanying Notes to Financial Statements.
| Valuation Inputs at Reporting Date: | ||||
| Description | Total | Level 1 | Level 2 | Level 3 |
| (Amounts in thousands) | ||||
| Investments in Securities: | ||||
| Equities: | ||||
| Communication Services | $57,411 | $57,100 | $311 | $-- |
| Consumer Discretionary | 175,894 | 175,894 | -- | -- |
| Consumer Staples | 53,077 | 53,077 | -- | -- |
| Energy | 105,167 | 105,167 | -- | -- |
| Financials | 306,733 | 306,733 | -- | -- |
| Health Care | 252,487 | 252,487 | -- | -- |
| Industrials | 301,970 | 301,157 | 813 | -- |
| Information Technology | 222,396 | 222,396 | -- | -- |
| Materials | 21,976 | 21,976 | -- | -- |
| Real Estate | 108,258 | 108,258 | -- | -- |
| Utilities | 9,372 | 9,372 | -- | -- |
| Money Market Funds | 99,522 | 99,522 | -- | -- |
| Total Investments in Securities: | $1,714,263 | $1,713,139 | $1,124 | $-- |
Other Information
Distribution of investments by country or territory of incorporation, as a percentage of Total Net Assets, is as follows (Unaudited):
| United States of America | 84.2% |
| United Kingdom | 4.6% |
| Sweden | 3.8% |
| Finland | 2.4% |
| Australia | 2.2% |
| Norway | 1.0% |
| Others (Individually Less Than 1%) | 1.8% |
| 100.0% |
See accompanying notes which are an integral part of the financial statements.
Financial Statements
Statement of Assets and Liabilities
| Amounts in thousands (except per-share amount) | October 31, 2021 (Unaudited) | |
| Assets | ||
| Investment in securities, at value (including securities loaned of $90,652) — See accompanying schedule: Unaffiliated issuers (cost $1,248,586) | $1,608,655 | |
| Fidelity Central Funds (cost $99,522) | 99,522 | |
| Other affiliated issuers (cost $5,691) | 6,086 | |
| Total Investment in Securities (cost $1,353,799) | $1,714,263 | |
| Receivable for investments sold | 18,196 | |
| Receivable for fund shares sold | 194 | |
| Dividends receivable | 329 | |
| Distributions receivable from Fidelity Central Funds | 179 | |
| Prepaid expenses | 2 | |
| Other receivables | 75 | |
| Total assets | 1,733,238 | |
| Liabilities | ||
| Payable to custodian bank | $740 | |
| Payable for investments purchased | 6,395 | |
| Payable for fund shares redeemed | 585 | |
| Accrued management fee | 976 | |
| Other affiliated payables | 228 | |
| Other payables and accrued expenses | 70 | |
| Collateral on securities loaned | 94,187 | |
| Total liabilities | 103,181 | |
| Net Assets | $1,630,057 | |
| Net Assets consist of: | ||
| Paid in capital | $1,082,381 | |
| Total accumulated earnings (loss) | 547,676 | |
| Net Assets | $1,630,057 | |
| Net Asset Value, offering price and redemption price per share ($1,630,057 ÷ 71,423 shares) | $22.82 |
See accompanying notes which are an integral part of the financial statements.
Statement of Operations
| Amounts in thousands | Six months ended October 31, 2021 (Unaudited) | |
| Investment Income | ||
| Dividends (including $109 earned from other affiliated issuers) | $6,054 | |
| Special dividends | 1,569 | |
| Income from Fidelity Central Funds (including $1,148 from security lending) | 1,151 | |
| Total income | 8,774 | |
| Expenses | ||
| Management fee | ||
| Basic fee | $5,417 | |
| Performance adjustment | 442 | |
| Transfer agent fees | 1,133 | |
| Accounting fees | 249 | |
| Custodian fees and expenses | 42 | |
| Independent trustees' fees and expenses | 3 | |
| Registration fees | 8 | |
| Audit | 29 | |
| Legal | 2 | |
| Miscellaneous | 3 | |
| Total expenses before reductions | 7,328 | |
| Expense reductions | (23) | |
| Total expenses after reductions | 7,305 | |
| Net investment income (loss) | 1,469 | |
| Realized and Unrealized Gain (Loss) | ||
| Net realized gain (loss) on: | ||
| Investment securities: | ||
| Unaffiliated issuers | 187,649 | |
| Affiliated issuers | 12 | |
| Foreign currency transactions | 121 | |
| Total net realized gain (loss) | 187,782 | |
| Change in net unrealized appreciation (depreciation) on: | ||
| Investment securities: | ||
| Unaffiliated issuers | (107,856) | |
| Affiliated issuers | (18) | |
| Unfunded commitments | 22 | |
| Assets and liabilities in foreign currencies | (2) | |
| Total change in net unrealized appreciation (depreciation) | (107,854) | |
| Net gain (loss) | 79,928 | |
| Net increase (decrease) in net assets resulting from operations | $81,397 |
See accompanying notes which are an integral part of the financial statements.
Statement of Changes in Net Assets
| Amounts in thousands | Six months ended October 31, 2021 (Unaudited) | Year ended April 30, 2021 |
| Increase (Decrease) in Net Assets | ||
| Operations | ||
| Net investment income (loss) | $1,469 | $(731) |
| Net realized gain (loss) | 187,782 | 227,421 |
| Change in net unrealized appreciation (depreciation) | (107,854) | 466,004 |
| Net increase (decrease) in net assets resulting from operations | 81,397 | 692,694 |
| Distributions to shareholders | (130,437) | – |
| Share transactions | ||
| Proceeds from sales of shares | 25,528 | 85,348 |
| Reinvestment of distributions | 125,798 | – |
| Cost of shares redeemed | (81,503) | (265,746) |
| Net increase (decrease) in net assets resulting from share transactions | 69,823 | (180,398) |
| Total increase (decrease) in net assets | 20,783 | 512,296 |
| Net Assets | ||
| Beginning of period | 1,609,274 | 1,096,978 |
| End of period | $1,630,057 | $1,609,274 |
| Other Information | ||
| Shares | ||
| Sold | 1,135 | 4,424 |
| Issued in reinvestment of distributions | 5,679 | – |
| Redeemed | (3,642) | (14,529) |
| Net increase (decrease) | 3,172 | (10,105) |
See accompanying notes which are an integral part of the financial statements.
Financial Highlights
Fidelity Small Cap Stock Fund
| Six months ended (Unaudited) October 31, | Years endedApril 30, | |||||
| 2021 | 2021 | 2020 | 2019 | 2018 | 2017 | |
| Selected Per–Share Data | ||||||
| Net asset value, beginning of period | $23.58 | $14.00 | $16.89 | $19.56 | $19.38 | $17.48 |
| Income from Investment Operations | ||||||
| Net investment income (loss)A | .02B | (.01) | .05 | .12C | .08D | .03 |
| Net realized and unrealized gain (loss) | 1.14 | 9.59 | (2.88) | .90 | 1.86 | 2.60 |
| Total from investment operations | 1.16 | 9.58 | (2.83) | 1.02 | 1.94 | 2.63 |
| Distributions from net investment income | – | – | (.06) | (.06) | (.07) | –E |
| Distributions from net realized gain | (1.92) | – | – | (3.64) | (1.69) | (.72) |
| Total distributions | (1.92) | – | (.06) | (3.69)F | (1.76) | (.73)F |
| Redemption fees added to paid in capitalA | – | – | – | – | –E | –E |
| Net asset value, end of period | $22.82 | $23.58 | $14.00 | $16.89 | $19.56 | $19.38 |
| Total ReturnG,H | 5.16% | 68.43% | (16.85)% | 6.66% | 10.39% | 15.44% |
| Ratios to Average Net AssetsI,J | ||||||
| Expenses before reductions | .91%K | .88% | .91% | .67% | .82% | 1.02% |
| Expenses net of fee waivers, if any | .91%K | .88% | .91% | .67% | .82% | 1.02% |
| Expenses net of all reductions | .91%K | .86% | .90% | .67% | .81% | 1.02% |
| Net investment income (loss) | .09%B,K | (.05)% | .27% | .66%C | .39%D | .14% |
| Supplemental Data | ||||||
| Net assets, end of period (in millions) | $1,630 | $1,609 | $1,097 | $1,515 | $1,595 | $1,777 |
| Portfolio turnover rateL | 113%K | 123%M | 65%M | 66%M | 63%M | 48% |
A Calculated based on average shares outstanding during the period.
B Net investment income per share reflects one or more large, non-recurring dividend(s) which amounted to $.02 per share. Such dividends are not annualized in the ratio of net investment income (loss) to average net assets. Excluding such non-recurring dividend(s) the ratio of net investment income (loss) to average net assets would have been (.01) %.
C Net investment income per share reflects one or more large, non-recurring dividend(s) which amounted to $.04 per share. Excluding such non-recurring dividend(s), the ratio of net investment income (loss) to average net assets would have been .41%.
D Net investment income per share reflects one or more large, non-recurring dividend(s) which amounted to $.02 per share. Excluding such non-recurring dividend(s), the ratio of net investment income (loss) to average net assets would have been .27%.
E Amount represents less than $.005 per share.
F Total distributions per share do not sum due to rounding.
G Total returns for periods of less than one year are not annualized.
H Total returns would have been lower if certain expenses had not been reduced during the applicable periods shown.
I Fees and expenses of any underlying mutual funds or exchange-traded funds (ETFs) are not included in the Fund's expense ratio. The Fund indirectly bears its proportionate share of these expenses. For additional expense information related to investments in Fidelity Central Funds, please refer to the "Investments in Fidelity Central Funds" note found in the Notes to Financial Statements section of the most recent Annual or Semi-Annual report.
J Expense ratios reflect operating expenses of the class. Expenses before reductions do not reflect amounts reimbursed, waived, or reduced through arrangements with the investment adviser, brokerage services, or other offset arrangements, if applicable, and do not represent the amount paid by the class during periods when reimbursements, waivers or reductions occur.
K Annualized
L Amount does not include the portfolio activity of any underlying mutual funds or exchange-traded funds (ETFs).
M Portfolio turnover rate excludes securities received or delivered in-kind.
See accompanying notes which are an integral part of the financial statements.
Notes to Financial Statements (Unaudited)
For the period ended October 31, 2021
(Amounts in thousands except percentages)
1. Organization.
Fidelity Small Cap Stock Fund (the Fund) is a fund of Fidelity Concord Street Trust (the Trust) and is authorized to issue an unlimited number of shares. Share transactions on the Statement of Changes in Net Assets may contain exchanges between affiliated funds. The Trust is registered under the Investment Company Act of 1940, as amended (the 1940 Act), as an open-end management investment company organized as a Massachusetts business trust.
2. Investments in Fidelity Central Funds.
Funds may invest in Fidelity Central Funds, which are open-end investment companies generally available only to other investment companies and accounts managed by the investment adviser and its affiliates. The Schedule of Investments lists any Fidelity Central Funds held as an investment as of period end, but does not include the underlying holdings of each Fidelity Central Fund. An investing fund indirectly bears its proportionate share of the expenses of the underlying Fidelity Central Funds.
Based on its investment objective, each Fidelity Central Fund may invest or participate in various investment vehicles or strategies that are similar to those of the investing fund. These strategies are consistent with the investment objectives of the investing fund and may involve certain economic risks which may cause a decline in value of each of the Fidelity Central Funds and thus a decline in the value of the investing fund.
| Fidelity Central Fund | Investment Manager | Investment Objective | Investment Practices | Expense Ratio(a) |
| Fidelity Money Market Central Funds | Fidelity Management & Research Company LLC (FMR) | Each fund seeks to obtain a high level of current income consistent with the preservation of capital and liquidity. | Short-term Investments | Less than .005% to .01% |
(a) Expenses expressed as a percentage of average net assets and are as of each underlying Central Fund's most recent annual or semi-annual shareholder report.
A complete unaudited list of holdings for each Fidelity Central Fund is available upon request or at the Securities and Exchange Commission website at www.sec.gov. In addition, the financial statements of the Fidelity Central Funds which contain the significant accounting policies (including investment valuation policies) of those funds, and are not covered by the Report of Independent Registered Public Accounting Firm, are available on the Securities and Exchange Commission website or upon request.
3. Significant Accounting Policies.
The Fund is an investment company and applies the accounting and reporting guidance of the Financial Accounting Standards Board (FASB) Accounting Standards Codification Topic 946 Financial Services - Investment Companies. The financial statements have been prepared in conformity with accounting principles generally accepted in the United States of America (GAAP), which require management to make certain estimates and assumptions at the date of the financial statements. Actual results could differ from those estimates. Subsequent events, if any, through the date that the financial statements were issued have been evaluated in the preparation of the financial statements. The Fund's Schedule of Investments lists any underlying mutual funds or exchange-traded funds (ETFs) but does not include the underlying holdings of these funds. The following summarizes the significant accounting policies of the Fund:
Investment Valuation. Investments are valued as of 4:00 p.m. Eastern time on the last calendar day of the period. The Board of Trustees (the Board) has delegated the day to day responsibility for the valuation of the Fund's investments to the Fair Value Committee (the Committee) established by the Fund's investment adviser. In accordance with valuation policies and procedures approved by the Board, the Fund attempts to obtain prices from one or more third party pricing vendors or brokers to value its investments. When current market prices, quotations or currency exchange rates are not readily available or reliable, investments will be fair valued in good faith by the Committee, in accordance with procedures adopted by the Board. Factors used in determining fair value vary by investment type and may include market or investment specific events. The frequency with which these procedures are used cannot be predicted and they may be utilized to a significant extent. The Committee oversees the Fund's valuation policies and procedures and reports to the Board on the Committee's activities and fair value determinations. The Board monitors the appropriateness of the procedures used in valuing the Fund's investments and ratifies the fair value determinations of the Committee.
The Fund categorizes the inputs to valuation techniques used to value its investments into a disclosure hierarchy consisting of three levels as shown below:
- Level 1 – quoted prices in active markets for identical investments
- Level 2 – other significant observable inputs (including quoted prices for similar investments, interest rates, prepayment speeds, etc.)
- Level 3 – unobservable inputs (including the Fund's own assumptions based on the best information available)
Valuation techniques used to value the Fund's investments by major category are as follows:
Equity securities, including restricted securities, for which market quotations are readily available, are valued at the last reported sale price or official closing price as reported by a third party pricing vendor on the primary market or exchange on which they are traded and are categorized as Level 1 in the hierarchy. In the event there were no sales during the day or closing prices are not available, securities are valued at the last quoted bid price or may be valued using the last available price and are generally categorized as Level 2 in the hierarchy. For foreign equity securities, when market or security specific events arise, comparisons to the valuation of American Depositary Receipts (ADRs), futures contracts, Exchange-Traded Funds (ETFs) and certain indexes as well as quoted prices for similar securities may be used and would be categorized as Level 2 in the hierarchy. For equity securities, including restricted securities, where observable inputs are limited, assumptions about market activity and risk are used and these securities may be categorized as Level 3 in the hierarchy.
Investments in open-end mutual funds, including the Fidelity Central Funds, are valued at their closing net asset value (NAV) each business day and are categorized as Level 1 in the hierarchy.
Changes in valuation techniques may result in transfers in or out of an assigned level within the disclosure hierarchy. The aggregate value of investments by input level as of October 31, 2021 is included at the end of the Fund's Schedule of Investments.
Foreign Currency. Certain Funds may use foreign currency contracts to facilitate transactions in foreign-denominated securities. Gains and losses from these transactions may arise from changes in the value of the foreign currency or if the counterparties do not perform under the contracts' terms.
Foreign-denominated assets, including investment securities, and liabilities are translated into U.S. dollars at the exchange rates at period end. Purchases and sales of investment securities, income and dividends received, and expenses denominated in foreign currencies are translated into U.S. dollars at the exchange rate in effect on the transaction date.
The effects of exchange rate fluctuations on investments are included with the net realized and unrealized gain (loss) on investment securities. Other foreign currency transactions resulting in realized and unrealized gain (loss) are disclosed separately.
Investment Transactions and Income. For financial reporting purposes, the Fund's investment holdings and NAV include trades executed through the end of the last business day of the period. The NAV per share for processing shareholder transactions is calculated as of the close of business of the New York Stock Exchange (NYSE), normally 4:00 p.m. Eastern time and includes trades executed through the end of the prior business day. Gains and losses on securities sold are determined on the basis of identified cost and include proceeds received from litigation. Commissions paid to certain brokers with whom the investment adviser, or its affiliates, places trades on behalf of a fund include an amount in addition to trade execution, which may be rebated back to a fund. Any such rebates are included in net realized gain (loss) on investments in the Statement of Operations. Dividend income is recorded on the ex-dividend date, except for certain dividends from foreign securities where the ex-dividend date may have passed, which are recorded as soon as the Fund is informed of the ex-dividend date. Non-cash dividends included in dividend income, if any, are recorded at the fair market value of the securities received. Income and capital gain distributions from Fidelity Central Funds, if any, are recorded on the ex-dividend date. Certain distributions received by the Fund represent a return of capital or capital gain. The Fund determines the components of these distributions subsequent to the ex-dividend date, based upon receipt of tax filings or other correspondence relating to the underlying investment. These distributions are recorded as a reduction of cost of investments and/or as a realized gain. Large, non-recurring dividends recognized by the Fund are presented separately on the Statement of Operations as "Special Dividends" and the impact of these dividends is presented in the Financial Highlights. Investment income is recorded net of foreign taxes withheld where recovery of such taxes is uncertain. Funds may file withholding tax reclaims in certain jurisdictions to recover a portion of amounts previously withheld. Any withholding tax reclaims income is included in the Statement of Operations in dividends. Any receivables for withholding tax reclaims are included in the Statement of Assets and Liabilities in dividends receivable.
Expenses. Expenses directly attributable to a fund are charged to that fund. Expenses attributable to more than one fund are allocated among the respective funds on the basis of relative net assets or other appropriate methods. Expenses included in the accompanying financial statements reflect the expenses of that fund and do not include any expenses associated with any underlying mutual funds or exchange-traded funds. Although not included in a fund's expenses, a fund indirectly bears its proportionate share of these expenses through the net asset value of each underlying mutual fund or exchange-traded fund. Expense estimates are accrued in the period to which they relate and adjustments are made when actual amounts are known.
Income Tax Information and Distributions to Shareholders. Each year, the Fund intends to qualify as a regulated investment company under Subchapter M of the Internal Revenue Code, including distributing substantially all of its taxable income and realized gains. As a result, no provision for U.S. Federal income taxes is required. The Fund files a U.S. federal tax return, in addition to state and local tax returns as required. The Fund's federal income tax returns are subject to examination by the Internal Revenue Service (IRS) for a period of three fiscal years after they are filed. State and local tax returns may be subject to examination for an additional fiscal year depending on the jurisdiction. Foreign taxes are provided for based on the Fund's understanding of the tax rules and rates that exist in the foreign markets in which it invests.
Distributions are declared and recorded on the ex-dividend date. Income and capital gain distributions are determined in accordance with income tax regulations, which may differ from GAAP.
Capital accounts within the financial statements are adjusted for permanent book-tax differences. These adjustments have no impact on net assets or the results of operations. Capital accounts are not adjusted for temporary book-tax differences which will reverse in a subsequent period.
Book-tax differences are primarily due to the short-term gain distributions from the underlying mutual funds or exchange-traded funds (ETFs), foreign currency transactions, passive foreign investment companies (PFIC), redemptions in kind, partnerships, capital loss carryforwards and losses deferred due to wash sales and excise tax regulations.
As of period end, the cost and unrealized appreciation (depreciation) in securities, and derivatives if applicable, for federal income tax purposes were as follows:
| Gross unrealized appreciation | $410,534 |
| Gross unrealized depreciation | (50,776) |
| Net unrealized appreciation (depreciation) | $359,758 |
| Tax cost | $1,354,505 |
Restricted Securities (including Private Placements). Funds may invest in securities that are subject to legal or contractual restrictions on resale. These securities generally may be resold in transactions exempt from registration or to the public if the securities are registered. Disposal of these securities may involve time-consuming negotiations and expense, and prompt sale at an acceptable price may be difficult. Information regarding restricted securities held at period end is included at the end of the Schedule of Investments, if applicable.
4. Purchases and Sales of Investments.
Purchases and sales of securities, other than short-term securities, and in-kind transactions, as applicable, are noted in the table below.
| Purchases ($) | Sales ($) | |
| Fidelity Small Cap Stock Fund | 903,678 | 965,078 |
Special Purpose Acquisition Companies. Funds may invest in stock, warrants, and other securities of special purpose acquisition companies (SPACs) or similar special purpose entities. A SPAC is a publicly traded company that raises investment capital via an initial public offering (IPO) for the purpose of acquiring the equity securities of one or more existing companies via merger, business combination, acquisition or other similar transactions within a designated time frame.
Private Investment in Public Equity. Funds may acquire equity securities of an issuer through a private investment in a public equity (PIPE) transaction, including through commitments to purchase securities on a when-issued basis. A PIPE typically involves the purchase of securities directly from a publicly traded company in a private placement transaction. Securities purchased through PIPE transactions will be restricted from trading and considered illiquid until a resale registration statement for the shares is filed and declared effective.
At period end, the Fund had commitments to purchase when-issued securities through PIPE transactions with SPACs. The commitments are contingent upon the SPACs acquiring the securities of target companies. Unrealized appreciation (depreciation) on these commitments is separately presented in the Statements of Assets and Liabilities as Unrealized appreciation (depreciation) on unfunded commitments, and in the Statement of Operations as Change in unrealized appreciation (depreciation) on unfunded commitments.
Prior Fiscal Year Unaffiliated Redemptions In-Kind. Shares that were redeemed in-kind for investments, including accrued interest and cash, if any, are shown in the table below; along with realized gain or loss on investments delivered through in-kind redemptions. The amount of the in-kind redemptions is included in share transactions in the accompanying Statement of Changes in Net Assets. There was no gain or loss for federal income tax purposes.
| Shares | Total net realized gain or loss ($) | Total Proceeds ($) | |
| Fidelity Small Cap Stock Fund | 171 | 1,250 | 3,201 |
5. Fees and Other Transactions with Affiliates.
Management Fee. Fidelity Management & Research Company LLC (the investment adviser) and its affiliates provide the Fund with investment management related services for which the Fund pays a monthly management fee. The management fee is the sum of an individual fund fee rate that is based on an annual rate of .45% of the Fund's average net assets and an annualized group fee rate that averaged .23% during the period. The group fee rate is based upon the monthly average net assets of a group of registered investment companies with which the investment adviser has management contracts. The group fee rate decreases as assets under management increase and increases as assets under management decrease. In addition, the management fee is subject to a performance adjustment (up to a maximum of +/- .20% of the Fund's average net assets over a 36 month performance period). The upward or downward adjustment to the management fee is based on the Fund's relative investment performance as compared to its benchmark index, the Russell 2000 Index, over the same 36 month performance period. For the reporting period, the total annualized management fee rate, including the performance adjustment, was .73% of the Fund's average net assets. The performance adjustment included in the management fee rate may be higher or lower than the maximum performance adjustment rate due to the difference between the average net assets for the reporting and performance periods.
Transfer Agent Fees. Fidelity Investments Institutional Operations Company LLC (FIIOC), an affiliate of the investment adviser, is the Fund's transfer, dividend disbursing and shareholder servicing agent. FIIOC receives account fees and asset-based fees that vary according to account size and type of account. FIIOC pays for typesetting, printing and mailing of shareholder reports, except proxy statements. For the period, the transfer agent fees were equivalent to an annualized rate of .14% of average net assets.
Accounting Fees. Fidelity Service Company, Inc. (FSC), an affiliate of the investment adviser, maintains the Fund's accounting records. The accounting fee is based on the level of average net assets for each month. For the period, the fees were equivalent to the following annualized rates:
| % of Average Net Assets | |
| Fidelity Small Cap Stock Fund | .03 |
Brokerage Commissions. A portion of portfolio transactions were placed with brokerage firms which are affiliates of the investment adviser. Brokerage commissions are included in net realized gain (loss) and change in net unrealized appreciation (depreciation) in the Statement of Operations. The commissions paid to these affiliated firms were as follows:
| Amount | |
| Fidelity Small Cap Stock Fund | $45 |
Interfund Trades. Funds may purchase from or sell securities to other Fidelity Funds under procedures adopted by the Board. The procedures have been designed to ensure these interfund trades are executed in accordance with Rule 17a-7 of the 1940 Act. Any interfund trades are included within the respective purchases and sales amounts shown in the Purchases and Sales of Investments note. Interfund trades during the period are noted in the table below.
| Purchases ($) | Sales ($) | Realized Gain (Loss) ($) | |
| Fidelity Small Cap Stock Fund | 29,799 | 61,344 | 15,955 |
6. Committed Line of Credit.
Certain Funds participate with other funds managed by the investment adviser or an affiliate in a $4.25 billion credit facility (the "line of credit") to be utilized for temporary or emergency purposes to fund shareholder redemptions or for other short-term liquidity purposes. The participating funds have agreed to pay commitment fees on their pro-rata portion of the line of credit, which are reflected in Miscellaneous expenses on the Statement of Operations, and are listed below. During the period, there were no borrowings on this line of credit.
| Amount | |
| Fidelity Small Cap Stock Fund | $1 |
7. Security Lending.
Funds lend portfolio securities from time to time in order to earn additional income. Lending agents are used, including National Financial Services (NFS), an affiliate of the investment adviser. Pursuant to a securities lending agreement, NFS will receive a fee, which is capped at 9.9% of a fund's daily lending revenue, for its services as lending agent. A fund may lend securities to certain qualified borrowers, including NFS. On the settlement date of the loan, a fund receives collateral (in the form of U.S. Treasury obligations, letters of credit and/or cash) against the loaned securities and maintains collateral in an amount not less than 100% of the market value of the loaned securities during the period of the loan. The market value of the loaned securities is determined at the close of business of a fund and any additional required collateral is delivered to a fund on the next business day. A fund or borrower may terminate the loan at any time, and if the borrower defaults on its obligation to return the securities loaned because of insolvency or other reasons, a fund may apply collateral received from the borrower against the obligation. A fund may experience delays and costs in recovering the securities loaned. Any cash collateral received is invested in the Fidelity Securities Lending Cash Central Fund. Any loaned securities are identified as such in the Schedule of Investments, and the value of loaned securities and cash collateral at period end, as applicable, are presented in the Statement of Assets and Liabilities. Security lending income represents the income earned on investing cash collateral, less rebates paid to borrowers and any lending agent fees associated with the loan, plus any premium payments received for lending certain types of securities. Security lending income is presented in the Statement of Operations as a component of income from Fidelity Central Funds. Affiliated security lending activity, if any, was as follows:
| Total Security Lending Fees Paid to NFS | Security Lending Income From Securities Loaned to NFS | Value of Securities Loaned to NFS at Period End | |
| Fidelity Small Cap Stock Fund | $115 | $3 | $760 |
8. Expense Reductions.
During the period the investment adviser or an affiliate reimbursed and/or waived a portion of operating expenses in the amount of $23.
9. Other.
Fund's organizational documents provide former and current trustees and officers with a limited indemnification against liabilities arising in connection with the performance of their duties to the fund. In the normal course of business, the fund may also enter into contracts that provide general indemnifications. The fund's maximum exposure under these arrangements is unknown as this would be dependent on future claims that may be made against the fund. The risk of material loss from such claims is considered remote.
10. Coronavirus (COVID-19) Pandemic.
An outbreak of COVID-19 first detected in China during December 2019 has since spread globally and was declared a pandemic by the World Health Organization during March 2020. Developments that disrupt global economies and financial markets, such as the COVID-19 pandemic, may magnify factors that affect the Fund's performance.
Shareholder Expense Example
As a shareholder, you incur two types of costs: (1) transaction costs, which may include sales charges (loads) on purchase payments or redemption proceeds, as applicable and (2) ongoing costs, which generally include management fees, distribution and/or service (12b-1) fees and other Fund expenses. This Example is intended to help you understand your ongoing costs (in dollars) of investing in a fund and to compare these costs with the ongoing costs of investing in other mutual funds.
The Example is based on an investment of $1,000 invested at the beginning of the period and held for the entire period (May 1, 2021 to October 31, 2021).
Actual Expenses
The first line of the accompanying table provides information about actual account values and actual expenses. You may use the information in this line, together with the amount you invested, to estimate the expenses that you paid over the period. Simply divide your account value by $1,000.00 (for example, an $8,600 account value divided by $1,000.00 = 8.6), then multiply the result by the number in the first line for a class/Fund under the heading entitled "Expenses Paid During Period" to estimate the expenses you paid on your account during this period. If any fund is a shareholder of any underlying mutual funds or exchange-traded funds (ETFs) (the Underlying Funds), such fund indirectly bears its proportional share of the expenses of the Underlying Funds in addition to the direct expenses incurred presented in the table. These fees and expenses are not included in the annualized expense ratio used to calculate the expense estimate in the table below.
Hypothetical Example for Comparison Purposes
The second line of the accompanying table provides information about hypothetical account values and hypothetical expenses based on the actual expense ratio and an assumed rate of return of 5% per year before expenses, which is not the actual return. The hypothetical account values and expenses may not be used to estimate the actual ending account balance or expenses you paid for the period. You may use this information to compare the ongoing costs of investing in the Fund and other funds. To do so, compare this 5% hypothetical example with the 5% hypothetical examples that appear in the shareholder reports of the other funds. If any fund is a shareholder of any Underlying Funds, such fund indirectly bears its proportional share of the expenses of the Underlying Funds in addition to the direct expenses as presented in the table. These fees and expenses are not included in the annualized expense ratio used to calculate the expense estimate in the table below.
Please note that the expenses shown in the table are meant to highlight your ongoing costs only and do not reflect any transaction costs. Therefore, the second line of the table is useful in comparing ongoing costs only, and will not help you determine the relative total costs of owning different funds. In addition, if these transactional costs were included, your costs would have been higher.
| Annualized Expense Ratio-A | Beginning Account Value May 1, 2021 | Ending Account Value October 31, 2021 | Expenses Paid During Period-B May 1, 2021 to October 31, 2021 | |
| Fidelity Small Cap Stock Fund | .91% | |||
| Actual | $1,000.00 | $1,051.60 | $4.71 | |
| Hypothetical-C | $1,000.00 | $1,020.62 | $4.63 |
A Annualized expense ratio reflects expenses net of applicable fee waivers.
B Expenses are equal to the annualized expense ratio, multiplied by the average account value over the period, multiplied by 184/ 365 (to reflect the one-half year period). The fees and expenses of any Underlying Funds are not included in each annualized expense ratio.
C 5% return per year before expenses
Board Approval of Investment Advisory Contracts and Management Fees
Fidelity Small Cap Stock Fund
Each year, the Board of Trustees, including the Independent Trustees (together, the Board), votes on the renewal of the management contract with Fidelity Management & Research Company LLC (FMR) and the sub-advisory agreements (together, the Advisory Contracts) for the fund. FMR and the sub-advisers are referred to herein as the Investment Advisers. The Board, assisted by the advice of fund counsel and Independent Trustees' counsel, requests and considers a broad range of information relevant to the renewal of the Advisory Contracts throughout the year.The Board meets regularly and, at each of its meetings, covers an extensive agenda of topics and materials and considers factors that are relevant to its annual consideration of the renewal of the fund's Advisory Contracts, including the services and support provided to the fund and its shareholders. The Board has established various standing committees (Committees), each composed of and chaired by Independent Trustees with varying backgrounds, to which the Board has assigned specific subject matter responsibilities in order to enhance effective decision-making by the Board. The Board, acting directly and through its Committees, requests and receives information concerning the annual consideration of the renewal of the fund's Advisory Contracts. The Board also meets as needed to review matters specifically related to the Board's annual consideration of the renewal of the Advisory Contracts. Members of the Board may also meet with trustees of other Fidelity funds through joint ad hoc committees to discuss certain matters relevant to all of the Fidelity funds.At its May 2021 meeting, the Board unanimously determined to renew the fund's Advisory Contracts. In reaching its determination, the Board considered all factors it believed relevant, including (i) the nature, extent, and quality of the services provided to the fund and its shareholders (including the investment performance of the fund); (ii) the competitiveness of the fund's management fee and total expense ratio relative to peer funds; (iii) the total costs of the services provided by and the profits realized by Fidelity from its relationships with the fund; and (iv) the extent to which, if any, economies of scale exist and are realized as the fund grows, and whether any economies of scale are appropriately shared with fund shareholders.In considering whether to renew the Advisory Contracts for the fund, the Board reached a determination, with the assistance of fund counsel and Independent Trustees' counsel and through the exercise of its business judgment, that the renewal of the Advisory Contracts was in the best interests of the fund and its shareholders and that the compensation payable under the Advisory Contracts was fair and reasonable. The Board's decision to renew the Advisory Contracts was not based on any single factor, but rather was based on a comprehensive consideration of all the information provided to the Board at its meetings throughout the year. The Board, in reaching its determination to renew the Advisory Contracts, was aware that shareholders of the fund have a broad range of investment choices available to them, including a wide choice among funds offered by Fidelity's competitors, and that the fund's shareholders, who have the opportunity to review and weigh the disclosure provided by the fund in its prospectus and other public disclosures, have chosen to invest in this fund, which is part of the Fidelity family of funds.Nature, Extent, and Quality of Services Provided. The Board considered Fidelity's staffing as it relates to the fund, including the backgrounds of investment personnel of Fidelity, and also considered the fund's investment objective, strategies, and related investment philosophy. The Independent Trustees also had discussions with senior management of Fidelity's investment operations and investment groups. The Board considered the structure of the investment personnel compensation program and whether this structure provides appropriate incentives to act in the best interests of the fund. Additionally, the Board considered the portfolio managers' investments, if any, in the funds that they manage.Resources Dedicated to Investment Management and Support Services. The Board and the Fund Oversight and Research Committees reviewed the general qualifications and capabilities of Fidelity's investment staff, including its size, education, experience, and resources, as well as Fidelity's approach to recruiting, training, managing, and compensating investment personnel. The Board noted that Fidelity has continued to increase the resources devoted to non-U.S. offices, including expansion of Fidelity's global investment organization. The Board also noted that Fidelity's analysts have extensive resources, tools and capabilities that allow them to conduct sophisticated quantitative and fundamental analysis, as well as credit analysis of issuers, counterparties and guarantors. Further, the Board considered that Fidelity's investment professionals have sufficient access to global information and data so as to provide competitive investment results over time, and that those professionals also have access to sophisticated tools that permit them to assess portfolio construction and risk and performance attribution characteristics continuously, as well as to transmit new information and research conclusions rapidly around the world. Additionally, in its deliberations, the Board considered Fidelity's trading, risk management, compliance, and technology and operations capabilities and resources, which are integral parts of the investment management process. The Board also considered Fidelity's investments in business continuity planning, and its success in continuously providing services to the fund notwithstanding the severe disruptions caused by the COVID-19 pandemic.Shareholder and Administrative Services. The Board considered (i) the nature, extent, quality, and cost of advisory, administrative, and shareholder services performed by the Investment Advisers and their affiliates under the Advisory Contracts and under separate agreements covering transfer agency, pricing and bookkeeping, and securities lending services for the fund; (ii) the nature and extent of the supervision of third party service providers, principally custodians, subcustodians, and pricing vendors; and (iii) the resources devoted to, and the record of compliance with, the fund's compliance policies and procedures. The Board also reviewed the allocation of fund brokerage, including allocations to brokers affiliated with the Investment Advisers, the use of brokerage commissions to pay fund expenses, and the use of "soft" commission dollars to pay for research services.The Board noted that the growth of fund assets over time across the complex allows Fidelity to reinvest in the development of services designed to enhance the value and convenience of the Fidelity funds as investment vehicles. These services include 24-hour access to account information and market information over the Internet and through telephone representatives, investor education materials and asset allocation tools, and the expanded availability of Fidelity Investor Centers.The Board noted that, in the past, it and the boards of certain other Fidelity funds had formed an ad hoc Committee on Transfer Agency Fees to review the variety of transfer agency fee structures throughout the industry and Fidelity's competitive positioning with respect to industry participants.Investment in a Large Fund Family. The Board considered the benefits to shareholders of investing in a Fidelity fund, including the benefits of investing in a fund that is part of a large family of funds offering a variety of investment disciplines and providing a large variety of mutual fund investor services. The Board noted that Fidelity had taken, or had made recommendations that resulted in the Fidelity funds taking, a number of actions over the previous year that benefited particular funds, including: (i) continuing to dedicate additional resources to Fidelity's investment research process, which includes meetings with management of issuers of securities in which the funds invest, and to the support of the senior management team that oversees asset management; (ii) continuing efforts to enhance Fidelity's global research capabilities; (iii) launching new funds and ETFs with innovative structures, strategies and pricing and making other enhancements to meet client needs; (iv) launching new share classes of existing funds; (v) eliminating purchase minimums and broadening eligibility requirements for certain funds and share classes; (vi) approving the reduction in the holding period for the Class C to Class A conversion policy; (vii) reducing management fees and total expenses for certain target date funds and classes and index funds; (viii) lowering expenses for certain existing funds and classes by implementing or lowering expense caps; (ix) rationalizing product lines and gaining increased efficiencies from fund mergers, liquidations, and share class consolidations; (x) continuing to develop, acquire and implement systems and technology to improve services to the funds and shareholders, strengthen information security, and increase efficiency; and (xi) continuing to implement enhancements to further strengthen Fidelity's product line to increase investors' probability of success in achieving their investment goals, including retirement income goals.Investment Performance. The Board considered whether the fund has operated in accordance with its investment objective, as well as its record of compliance with its investment restrictions and its performance history.The Board took into account discussions that occur at Board meetings throughout the year with representatives of the Investment Advisers about fund investment performance. In this regard the Board noted that as part of regularly scheduled fund reviews and other reports to the Board on fund performance, the Board considers annualized return information for the fund for different time periods, measured against an appropriate securities market index (benchmark index) and an appropriate peer group of funds with similar objectives (peer group). In its evaluation of fund investment performance, the Board gave particular attention to information indicating changes in performance of certain Fidelity funds for specific time periods and discussed with the Investment Advisers the reasons for any overperformance or underperformance.In addition to reviewing absolute and relative fund performance, the Independent Trustees periodically consider the appropriateness of fund performance metrics in evaluating the results achieved. In general, the Independent Trustees believe that fund performance should be evaluated based on net performance (after fees and expenses) of both the highest performing and lowest performing fund share classes, where applicable, compared to appropriate benchmark indices, over appropriate time periods that may include full market cycles, and compared to peer groups, as applicable, over the same periods, taking into account relevant factors including the following: general market conditions; issuer-specific information; and fund cash flows and other factors.The Independent Trustees recognize that shareholders evaluate performance on a net basis over their own holding periods, for which one-, three-, and five-year periods are often used as a proxy. For this reason, the performance information reviewed by the Board also included net cumulative total return information for the fund and an appropriate benchmark index and peer group for the most recent one-, three-, and five-year periods ended September 30, 2020, as shown below. Returns are shown compared to the 25th percentile (top of box, 75% beaten) and 75th percentile (bottom of box, 25% beaten) of the peer universe.Fidelity Small Cap Stock Fund
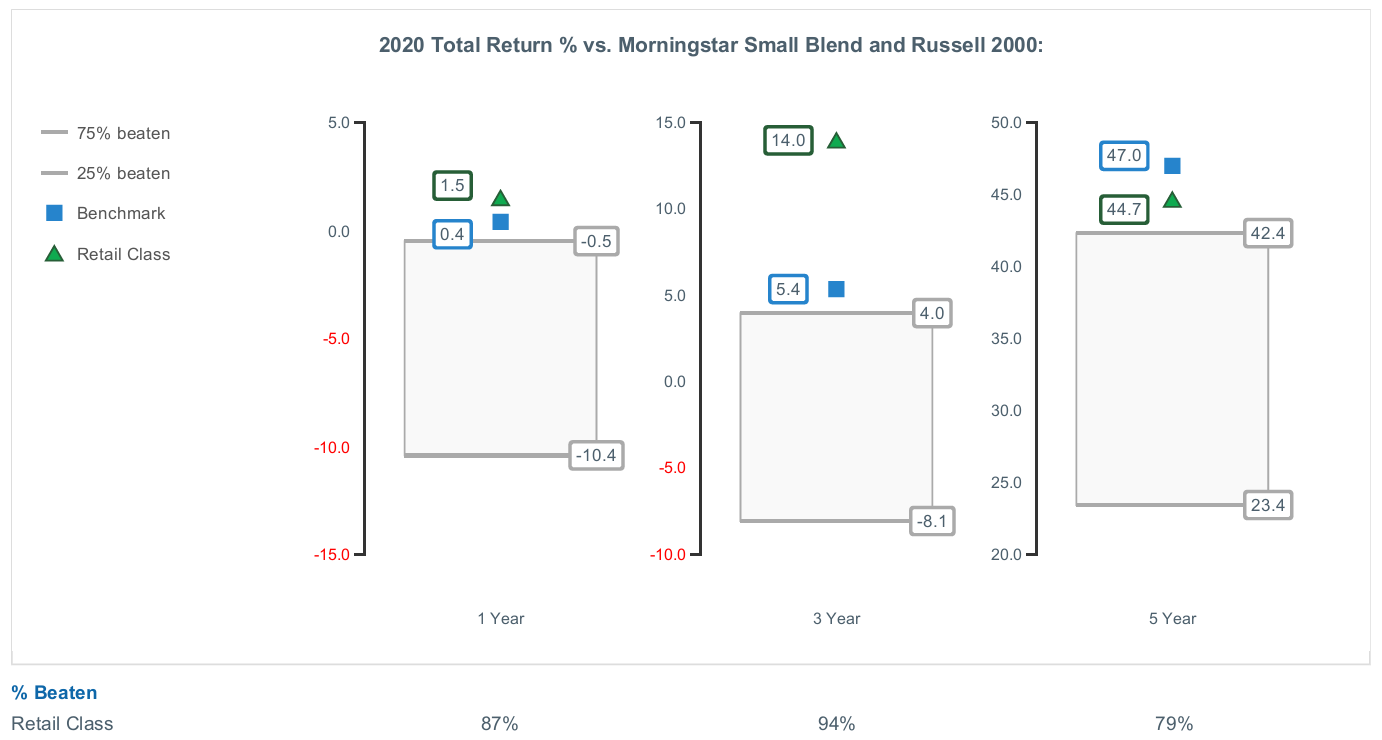
Fidelity Small Cap Stock Fund
The Board noted that the comparisons for 2015 and later reflect a revised Total Mapped Group that no longer includes funds with micro-cap objectives and that FMR believes this Total Mapped Group is a more appropriate comparison because the fund does not have a micro-cap objective.
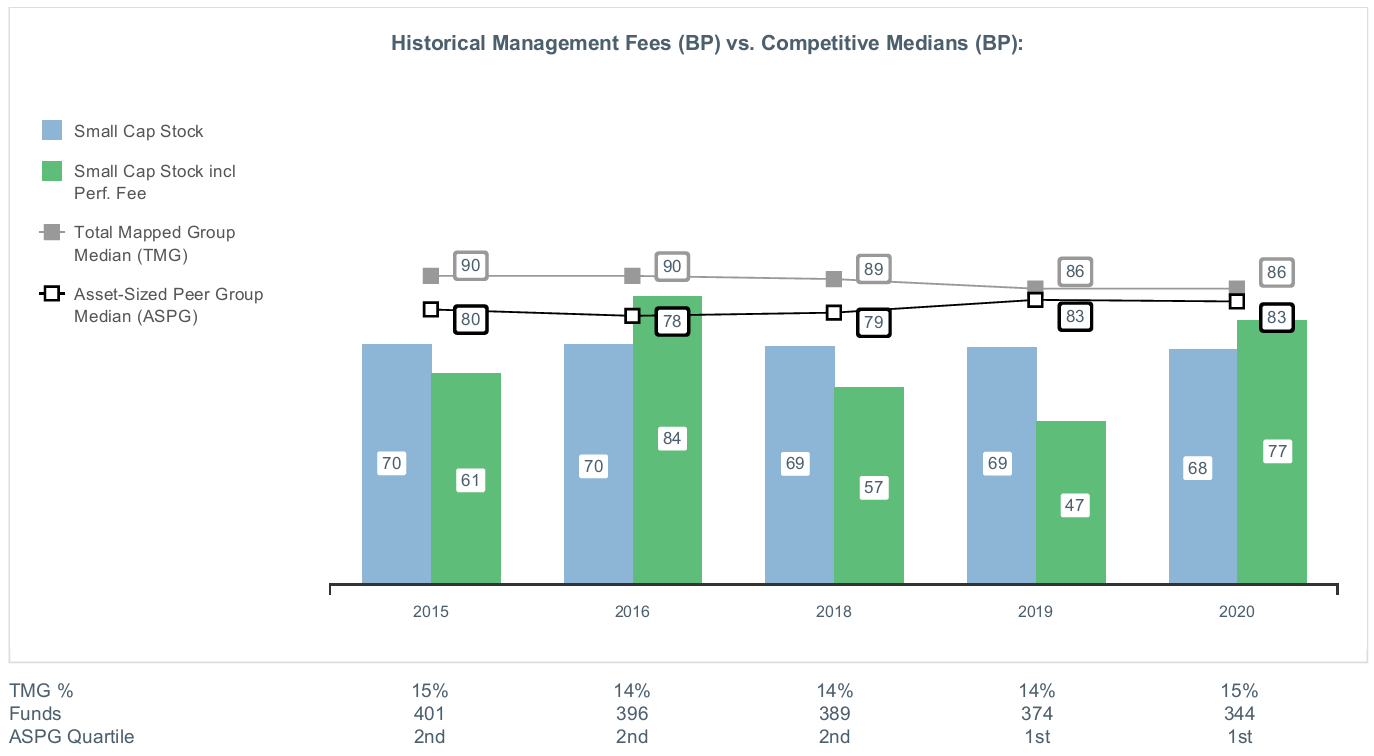
![]()
SLCX-SANN-1221
1.711817.123
Fidelity® Small Cap Discovery Fund
Semi-Annual Report
October 31, 2021
Contents
Board Approval of Investment Advisory Contracts and Management Fees |
To view a fund's proxy voting guidelines and proxy voting record for the 12-month period ended June 30, visit http://www.fidelity.com/proxyvotingresults or visit the Securities and Exchange Commission's (SEC) web site at http://www.sec.gov.
You may also call 1-800-544-8544 to request a free copy of the proxy voting guidelines.
Standard & Poor's, S&P and S&P 500 are registered service marks of The McGraw-Hill Companies, Inc. and have been licensed for use by Fidelity Distributors Corporation.
Other third-party marks appearing herein are the property of their respective owners.
All other marks appearing herein are registered or unregistered trademarks or service marks of FMR LLC or an affiliated company. © 2021 FMR LLC. All rights reserved.
This report and the financial statements contained herein are submitted for the general information of the shareholders of the Fund. This report is not authorized for distribution to prospective investors in the Fund unless preceded or accompanied by an effective prospectus.
A fund files its complete schedule of portfolio holdings with the SEC for the first and third quarters of each fiscal year on Form N-PORT. Forms N-PORT are available on the SEC’s web site at http://www.sec.gov. A fund's Forms N-PORT may be reviewed and copied at the SEC’s Public Reference Room in Washington, DC. Information regarding the operation of the SEC's Public Reference Room may be obtained by calling 1-800-SEC-0330.
For a complete list of a fund's portfolio holdings, view the most recent holdings listing, semiannual report, or annual report on Fidelity's web site at http://www.fidelity.com, http://www.institutional.fidelity.com, or http://www.401k.com, as applicable.
NOT FDIC INSURED •MAY LOSE VALUE •NO BANK GUARANTEE
Neither the Fund nor Fidelity Distributors Corporation is a bank.
Note to Shareholders:
Early in 2020, the outbreak and spread of COVID-19 emerged as a public health emergency that had a major influence on financial markets, primarily based on its impact on the global economy and corporate earnings. On March 11, 2020, the World Health Organization declared the COVID-19 outbreak a pandemic, citing sustained risk of further global spread. The pandemic prompted a number of measures to limit the spread of COVID-19, including travel and border restrictions, quarantines, and restrictions on large gatherings. In turn, these resulted in lower consumer activity, diminished demand for a wide range of products and services, disruption in manufacturing and supply chains, and – given the wide variability in outcomes regarding the outbreak – significant market uncertainty and volatility. To help stem the turmoil, the U.S. government took unprecedented action – in concert with the U.S. Federal Reserve and central banks around the world – to help support consumers, businesses, and the broader economy, and to limit disruption to the financial system.
In general, the overall impact of the pandemic lessened in 2021, amid a resilient economy and widespread distribution of three COVID-19 vaccines granted emergency use authorization from the U.S. Food and Drug Administration (FDA) early in the year. Still, the situation remains dynamic, and the extent and duration of its influence on financial markets and the economy is highly uncertain, due in part to a recent spike in cases based on highly contagious variants of the coronavirus.
Extreme events such as the COVID-19 crisis are exogenous shocks that can have significant adverse effects on mutual funds and their investments. Although multiple asset classes may be affected by market disruption, the duration and impact may not be the same for all types of assets. Fidelity is committed to helping you stay informed amid news about COVID-19 and during increased market volatility, and we continue to take extra steps to be responsive to customer needs. We encourage you to visit us online, where we offer ongoing updates, commentary, and analysis on the markets and our funds.
Investment Summary (Unaudited)
Top Ten Stocks as of October 31, 2021
| % of fund's net assets | |
| Jones Lang LaSalle, Inc. | 3.9 |
| ASGN, Inc. | 3.6 |
| Insight Enterprises, Inc. | 3.5 |
| Valvoline, Inc. | 3.0 |
| First American Financial Corp. | 2.8 |
| Syneos Health, Inc. | 2.8 |
| Cullen/Frost Bankers, Inc. | 2.7 |
| Charles River Laboratories International, Inc. | 2.5 |
| Enstar Group Ltd. | 2.4 |
| Concentrix Corp. | 2.3 |
| 29.5 |
Top Five Market Sectors as of October 31, 2021
| % of fund's net assets | |
| Financials | 19.4 |
| Industrials | 18.5 |
| Information Technology | 13.3 |
| Health Care | 12.9 |
| Real Estate | 10.1 |
Asset Allocation (% of fund's net assets)
| As of October 31, 2021* | ||
| Stocks | 98.6% | |
| Short-Term Investments and Net Other Assets (Liabilities) | 1.4% | |

* Foreign investments - 24.1%
Schedule of Investments October 31, 2021 (Unaudited)
Showing Percentage of Net Assets
| Common Stocks - 98.6% | |||
| Shares | Value | ||
| COMMUNICATION SERVICES - 3.3% | |||
| Interactive Media & Services - 2.2% | |||
| Dip Corp. | 1,000,000 | $35,879,314 | |
| Ziff Davis, Inc. (a)(b) | 300,000 | 38,481,000 | |
| 74,360,314 | |||
| Media - 1.1% | |||
| Cogeco Communications, Inc. | 250,000 | 21,470,992 | |
| Emerald Holding, Inc. (a)(c) | 3,750,000 | 15,187,500 | |
| 36,658,492 | |||
| TOTAL COMMUNICATION SERVICES | 111,018,806 | ||
| CONSUMER DISCRETIONARY - 9.8% | |||
| Auto Components - 2.4% | |||
| Adient PLC (a) | 650,000 | 27,053,000 | |
| Linamar Corp. | 400,000 | 22,000,646 | |
| Patrick Industries, Inc. | 400,000 | 31,164,000 | |
| 80,217,646 | |||
| Diversified Consumer Services - 2.3% | |||
| Adtalem Global Education, Inc. (a) | 1,200,000 | 44,316,000 | |
| OneSpaWorld Holdings Ltd. (a)(b) | 1,500,000 | 16,200,000 | |
| Perdoceo Education Corp. (a) | 1,500,000 | 15,930,000 | |
| 76,446,000 | |||
| Hotels, Restaurants & Leisure - 1.3% | |||
| Hilton Grand Vacations, Inc. (a) | 900,000 | 45,252,000 | |
| Household Durables - 2.1% | |||
| Helen of Troy Ltd. (a)(b) | 200,000 | 44,990,000 | |
| LGI Homes, Inc. (a)(b) | 175,000 | 26,127,500 | |
| 71,117,500 | |||
| Multiline Retail - 1.0% | |||
| Ollie's Bargain Outlet Holdings, Inc. (a)(b) | 500,000 | 33,830,000 | |
| Specialty Retail - 0.7% | |||
| America's Car Mart, Inc. (a) | 67,816 | 8,103,334 | |
| Rent-A-Center, Inc. | 66,353 | 3,533,961 | |
| Winmark Corp. | 50,000 | 11,641,000 | |
| 23,278,295 | |||
| TOTAL CONSUMER DISCRETIONARY | 330,141,441 | ||
| CONSUMER STAPLES - 1.4% | |||
| Food & Staples Retailing - 1.0% | |||
| BJ's Wholesale Club Holdings, Inc. (a) | 600,000 | 35,064,000 | |
| Food Products - 0.4% | |||
| TreeHouse Foods, Inc. (a) | 350,000 | 12,649,000 | |
| TOTAL CONSUMER STAPLES | 47,713,000 | ||
| ENERGY - 2.1% | |||
| Energy Equipment & Services - 0.5% | |||
| Championx Corp. (a) | 250,000 | 6,557,500 | |
| ShawCor Ltd. Class A (a) | 2,500,000 | 10,766,807 | |
| 17,324,307 | |||
| Oil, Gas & Consumable Fuels - 1.6% | |||
| Brigham Minerals, Inc. Class A | 2,200,000 | 50,996,000 | |
| TOTAL ENERGY | 68,320,307 | ||
| FINANCIALS - 19.4% | |||
| Banks - 7.3% | |||
| BOK Financial Corp. | 750,000 | 75,877,500 | |
| Cullen/Frost Bankers, Inc. | 700,000 | 90,650,000 | |
| First Citizens Bancshares, Inc. (b) | 10,000 | 8,139,000 | |
| First Hawaiian, Inc. | 1,500,000 | 41,385,000 | |
| Wintrust Financial Corp. | 350,000 | 30,975,000 | |
| 247,026,500 | |||
| Capital Markets - 1.8% | |||
| BrightSphere Investment Group, Inc. | 2,000,000 | 59,960,000 | |
| Consumer Finance - 2.5% | |||
| Encore Capital Group, Inc. (a) | 300,000 | 16,206,000 | |
| First Cash Financial Services, Inc. | 750,000 | 66,352,500 | |
| 82,558,500 | |||
| Diversified Financial Services - 1.0% | |||
| Cannae Holdings, Inc. (a) | 1,000,000 | 34,100,000 | |
| Insurance - 6.8% | |||
| Assurant, Inc. | 175,000 | 28,229,250 | |
| BRP Group, Inc. (a) | 250,000 | 9,125,000 | |
| Enstar Group Ltd. (a) | 350,000 | 80,773,000 | |
| First American Financial Corp. | 1,300,000 | 95,082,000 | |
| Primerica, Inc. | 100,000 | 16,824,000 | |
| 230,033,250 | |||
| TOTAL FINANCIALS | 653,678,250 | ||
| HEALTH CARE - 12.9% | |||
| Biotechnology - 0.4% | |||
| Emergent BioSolutions, Inc. (a) | 250,000 | 11,917,500 | |
| Health Care Equipment & Supplies - 3.6% | |||
| Envista Holdings Corp. (a) | 2,000,000 | 78,200,000 | |
| Hill-Rom Holdings, Inc. | 250,000 | 38,725,000 | |
| Utah Medical Products, Inc. | 50,000 | 4,841,500 | |
| 121,766,500 | |||
| Health Care Providers & Services - 2.3% | |||
| Premier, Inc. | 1,350,000 | 52,582,500 | |
| R1 RCM, Inc. (a) | 1,150,000 | 24,955,000 | |
| 77,537,500 | |||
| Life Sciences Tools & Services - 5.3% | |||
| Charles River Laboratories International, Inc. (a) | 190,000 | 85,249,200 | |
| Syneos Health, Inc. (a) | 1,000,000 | 93,340,000 | |
| 178,589,200 | |||
| Pharmaceuticals - 1.3% | |||
| Prestige Brands Holdings, Inc. (a) | 750,000 | 44,992,500 | |
| TOTAL HEALTH CARE | 434,803,200 | ||
| INDUSTRIALS - 18.5% | |||
| Aerospace & Defense - 0.3% | |||
| Ultra Electronics Holdings PLC | 250,000 | 11,092,098 | |
| Commercial Services & Supplies - 2.3% | |||
| Cimpress PLC (a) | 500,000 | 44,660,000 | |
| The Brink's Co. | 450,000 | 30,996,000 | |
| 75,656,000 | |||
| Industrial Conglomerates - 0.7% | |||
| Rheinmetall AG | 250,000 | 24,229,760 | |
| Professional Services - 9.2% | |||
| ASGN, Inc. (a) | 1,000,000 | 119,660,000 | |
| BGSF, Inc. | 6,216 | 74,778 | |
| Insperity, Inc. | 500,000 | 62,500,000 | |
| Intertrust NV (a)(d) | 2,500,000 | 37,801,200 | |
| Kforce, Inc. | 750,000 | 48,570,000 | |
| Persol Holdings Co. Ltd. | 1,500,000 | 40,317,987 | |
| 308,923,965 | |||
| Road & Rail - 3.9% | |||
| TFI International, Inc. | 700,000 | 77,581,000 | |
| TFI International, Inc. (Canada) | 475,000 | 52,669,885 | |
| 130,250,885 | |||
| Trading Companies & Distributors - 2.1% | |||
| Beacon Roofing Supply, Inc. (a) | 1,200,000 | 63,444,000 | |
| MRC Global, Inc. (a) | 1,000,000 | 8,300,000 | |
| 71,744,000 | |||
| TOTAL INDUSTRIALS | 621,896,708 | ||
| INFORMATION TECHNOLOGY - 13.3% | |||
| Electronic Equipment & Components - 6.1% | |||
| Insight Enterprises, Inc. (a) | 1,250,000 | 118,375,000 | |
| Methode Electronics, Inc. Class A | 346,105 | 14,560,637 | |
| TD SYNNEX Corp. | 333,000 | 34,965,000 | |
| TTM Technologies, Inc. (a)(b) | 2,750,000 | 36,410,000 | |
| 204,310,637 | |||
| IT Services - 4.9% | |||
| Computer Services, Inc. | 350,000 | 19,250,000 | |
| Concentrix Corp. | 444,000 | 78,889,920 | |
| Genpact Ltd. | 1,000,000 | 49,350,000 | |
| Poletowin Pitcrew Holdings, Inc. | 228,100 | 2,056,711 | |
| Tucows, Inc. (a)(b) | 200,000 | 16,460,000 | |
| 166,006,631 | |||
| Semiconductors & Semiconductor Equipment - 1.6% | |||
| Cirrus Logic, Inc. (a) | 248,300 | 20,065,123 | |
| CMC Materials, Inc. | 175,000 | 22,464,750 | |
| Ichor Holdings Ltd. (a) | 300,000 | 13,116,000 | |
| 55,645,873 | |||
| Software - 0.2% | |||
| Consensus Cloud Solutions, Inc. (a) | 99,999 | 6,332,937 | |
| Technology Hardware, Storage & Peripherals - 0.5% | |||
| Elecom Co. Ltd. | 1,000,000 | 15,295,587 | |
| TOTAL INFORMATION TECHNOLOGY | 447,591,665 | ||
| MATERIALS - 6.2% | |||
| Chemicals - 3.0% | |||
| Valvoline, Inc. | 3,000,000 | 101,880,000 | |
| Construction Materials - 2.8% | |||
| Eagle Materials, Inc. | 175,000 | 25,963,000 | |
| RHI Magnesita NV | 700,000 | 32,169,136 | |
| Wienerberger AG | 1,000,000 | 35,396,720 | |
| 93,528,856 | |||
| Metals & Mining - 0.4% | |||
| ERO Copper Corp. (a) | 750,000 | 13,992,809 | |
| TOTAL MATERIALS | 209,401,665 | ||
| REAL ESTATE - 10.1% | |||
| Equity Real Estate Investment Trusts (REITs) - 4.1% | |||
| CareTrust (REIT), Inc. | 1,000,000 | 20,750,000 | |
| Corporate Office Properties Trust (SBI) | 1,000,000 | 27,120,000 | |
| Douglas Emmett, Inc. | 2,000,000 | 65,360,000 | |
| iStar Financial, Inc. | 1,000,000 | 25,240,000 | |
| 138,470,000 | |||
| Real Estate Management & Development - 6.0% | |||
| Cushman & Wakefield PLC (a) | 3,900,000 | 71,721,000 | |
| Jones Lang LaSalle, Inc. (a) | 500,000 | 129,115,000 | |
| 200,836,000 | |||
| TOTAL REAL ESTATE | 339,306,000 | ||
| UTILITIES - 1.6% | |||
| Electric Utilities - 0.2% | |||
| Portland General Electric Co. | 100,000 | 4,931,000 | |
| Gas Utilities - 1.4% | |||
| Brookfield Infrastructure Corp. A Shares (b) | 800,000 | 48,512,000 | |
| TOTAL UTILITIES | 53,443,000 | ||
| TOTAL COMMON STOCKS | |||
| (Cost $2,235,579,105) | 3,317,314,042 | ||
| Money Market Funds - 2.8% | |||
| Fidelity Cash Central Fund 0.06% (e) | 49,661,867 | 49,671,800 | |
| Fidelity Securities Lending Cash Central Fund 0.06% (e)(f) | 45,675,900 | 45,680,467 | |
| TOTAL MONEY MARKET FUNDS | |||
| (Cost $95,352,267) | 95,352,267 | ||
| TOTAL INVESTMENT IN SECURITIES - 101.4% | |||
| (Cost $2,330,931,372) | 3,412,666,309 | ||
| NET OTHER ASSETS (LIABILITIES) - (1.4)% | (48,138,714) | ||
| NET ASSETS - 100% | $3,364,527,595 |
Legend
(a) Non-income producing
(b) Security or a portion of the security is on loan at period end.
(c) Affiliated company
(d) Security exempt from registration under Rule 144A of the Securities Act of 1933. These securities may be resold in transactions exempt from registration, normally to qualified institutional buyers. At the end of the period, the value of these securities amounted to $37,801,200 or 1.1% of net assets.
(e) Affiliated fund that is generally available only to investment companies and other accounts managed by Fidelity Investments. The rate quoted is the annualized seven-day yield of the fund at period end. A complete unaudited listing of the fund's holdings as of its most recent quarter end is available upon request. In addition, each Fidelity Central Fund's financial statements are available on the SEC's website or upon request.
(f) Investment made with cash collateral received from securities on loan.
Affiliated Central Funds
Fiscal year to date information regarding the Fund's investments in Fidelity Central Funds, including the ownership percentage, is presented below.
| Fund | Value, beginning of period | Purchases | Sales Proceeds | Dividend Income | Realized Gain/Loss | Change in Unrealized appreciation (depreciation) | Value, end of period | % ownership, end of period |
| Fidelity Cash Central Fund 0.06% | $28,804,687 | $237,154,054 | $216,286,941 | $8,127 | $-- | $-- | $49,671,800 | 0.1% |
| Fidelity Securities Lending Cash Central Fund 0.06% | 90,852,362 | 258,667,300 | 303,839,195 | 69,783 | -- | -- | 45,680,467 | 0.1% |
| Total | $119,657,049 | $495,821,354 | $520,126,136 | $77,910 | $-- | $-- | $95,352,267 |
Amounts in the income column in the above table include any capital gain distributions from underlying funds, which are presented in the corresponding line-item in the Statement of Operations, if applicable. Amount for Fidelity Securities Lending Cash Central Fund represents the income earned on investing cash collateral, less rebates paid to borrowers and any lending agent fees associated with the loan, plus any premium payments received for lending certain types of securities.
Other Affiliated Issuers
An affiliated company is a company in which the Fund has ownership of at least 5% of the voting securities. Fiscal year to date transactions with companies which are or were affiliates are as follows:
| Affiliate | Value, beginning of period | Purchases | Sales Proceeds | Dividend Income | Realized Gain (loss) | Change in Unrealized appreciation (depreciation) | Value, end of period |
| Emerald Holding, Inc. | $23,281,500 | $-- | $2,257,177 | $-- | $(6,202,540) | $365,717 | $15,187,500 |
| Total | $23,281,500 | $-- | $2,257,177 | $-- | $(6,202,540) | $365,717 | $15,187,500 |
Investment Valuation
The following is a summary of the inputs used, as of October 31, 2021, involving the Fund's assets and liabilities carried at fair value. The inputs or methodology used for valuing securities may not be an indication of the risk associated with investing in those securities. For more information on valuation inputs, and their aggregation into the levels used below, please refer to the Investment Valuation section in the accompanying Notes to Financial Statements.
| Valuation Inputs at Reporting Date: | ||||
| Description | Total | Level 1 | Level 2 | Level 3 |
| Investments in Securities: | ||||
| Equities: | ||||
| Communication Services | $111,018,806 | $75,139,492 | $35,879,314 | $-- |
| Consumer Discretionary | 330,141,441 | 330,141,441 | -- | -- |
| Consumer Staples | 47,713,000 | 47,713,000 | -- | -- |
| Energy | 68,320,307 | 68,320,307 | -- | -- |
| Financials | 653,678,250 | 653,678,250 | -- | -- |
| Health Care | 434,803,200 | 434,803,200 | -- | -- |
| Industrials | 621,896,708 | 581,578,721 | 40,317,987 | -- |
| Information Technology | 447,591,665 | 430,239,367 | 17,352,298 | -- |
| Materials | 209,401,665 | 209,401,665 | -- | -- |
| Real Estate | 339,306,000 | 339,306,000 | -- | -- |
| Utilities | 53,443,000 | 53,443,000 | -- | -- |
| Money Market Funds | 95,352,267 | 95,352,267 | -- | -- |
| Total Investments in Securities: | $3,412,666,309 | $3,319,116,710 | $93,549,599 | $-- |
Other Information
Distribution of investments by country or territory of incorporation, as a percentage of Total Net Assets, is as follows (Unaudited):
| United States of America | 75.9% |
| Canada | 7.3% |
| Bermuda | 5.2% |
| Japan | 2.8% |
| United Kingdom | 2.4% |
| Ireland | 2.2% |
| Netherlands | 2.1% |
| Austria | 1.0% |
| Others (Individually Less Than 1%) | 1.1% |
| 100.0% |
See accompanying notes which are an integral part of the financial statements.
Financial Statements
Statement of Assets and Liabilities
| October 31, 2021 (Unaudited) | ||
| Assets | ||
| Investment in securities, at value (including securities loaned of $44,435,253) — See accompanying schedule: Unaffiliated issuers (cost $2,178,098,285) | $3,302,126,542 | |
| Fidelity Central Funds (cost $95,352,267) | 95,352,267 | |
| Other affiliated issuers (cost $57,480,820) | 15,187,500 | |
| Total Investment in Securities (cost $2,330,931,372) | $3,412,666,309 | |
| Cash | 31,410 | |
| Foreign currency held at value (cost $2) | 2 | |
| Receivable for fund shares sold | 1,153,864 | |
| Dividends receivable | 1,557,632 | |
| Distributions receivable from Fidelity Central Funds | 7,785 | |
| Prepaid expenses | 4,212 | |
| Other receivables | 21,281 | |
| Total assets | 3,415,442,495 | |
| Liabilities | ||
| Payable for investments purchased | $1,385,553 | |
| Payable for fund shares redeemed | 1,205,975 | |
| Accrued management fee | 2,148,052 | |
| Other affiliated payables | 450,684 | |
| Other payables and accrued expenses | 47,567 | |
| Collateral on securities loaned | 45,677,069 | |
| Total liabilities | 50,914,900 | |
| Net Assets | $3,364,527,595 | |
| Net Assets consist of: | ||
| Paid in capital | $2,174,971,689 | |
| Total accumulated earnings (loss) | 1,189,555,906 | |
| Net Assets | $3,364,527,595 | |
| Net Asset Value, offering price and redemption price per share ($3,364,527,595 ÷ 109,809,713 shares) | $30.64 |
See accompanying notes which are an integral part of the financial statements.
Statement of Operations
| Six months ended October 31, 2021 (Unaudited) | ||
| Investment Income | ||
| Dividends | $14,457,479 | |
| Income from Fidelity Central Funds (including $69,783 from security lending) | 77,910 | |
| Total income | 14,535,389 | |
| Expenses | ||
| Management fee | ||
| Basic fee | $10,909,459 | |
| Performance adjustment | 1,434,105 | |
| Transfer agent fees | 2,249,040 | |
| Accounting fees | 473,179 | |
| Custodian fees and expenses | 19,169 | |
| Independent trustees' fees and expenses | 5,645 | |
| Registration fees | 42,879 | |
| Audit | 26,156 | |
| Legal | 1,774 | |
| Interest | 107 | |
| Miscellaneous | 7,179 | |
| Total expenses before reductions | 15,168,692 | |
| Expense reductions | (45,188) | |
| Total expenses after reductions | 15,123,504 | |
| Net investment income (loss) | (588,115) | |
| Realized and Unrealized Gain (Loss) | ||
| Net realized gain (loss) on: | ||
| Investment securities: | ||
| Unaffiliated issuers | 115,449,540 | |
| Affiliated issuers | (6,202,540) | |
| Foreign currency transactions | (28,134) | |
| Total net realized gain (loss) | 109,218,866 | |
| Change in net unrealized appreciation (depreciation) on: | ||
| Investment securities: | ||
| Unaffiliated issuers | 105,810,188 | |
| Affiliated issuers | 365,717 | |
| Assets and liabilities in foreign currencies | (47,680) | |
| Total change in net unrealized appreciation (depreciation) | 106,128,225 | |
| Net gain (loss) | 215,347,091 | |
| Net increase (decrease) in net assets resulting from operations | $214,758,976 |
See accompanying notes which are an integral part of the financial statements.
Statement of Changes in Net Assets
| Six months ended October 31, 2021 (Unaudited) | Year ended April 30, 2021 | |
| Increase (Decrease) in Net Assets | ||
| Operations | ||
| Net investment income (loss) | $(588,115) | $8,229,433 |
| Net realized gain (loss) | 109,218,866 | 232,719,322 |
| Change in net unrealized appreciation (depreciation) | 106,128,225 | 1,186,275,077 |
| Net increase (decrease) in net assets resulting from operations | 214,758,976 | 1,427,223,832 |
| Distributions to shareholders | (95,791,064) | (71,928,795) |
| Share transactions | ||
| Proceeds from sales of shares | 189,131,038 | 546,900,503 |
| Reinvestment of distributions | 88,435,292 | 68,198,120 |
| Cost of shares redeemed | (202,595,365) | (680,544,829) |
| Net increase (decrease) in net assets resulting from share transactions | 74,970,965 | (65,446,206) |
| Total increase (decrease) in net assets | 193,938,877 | 1,289,848,831 |
| Net Assets | ||
| Beginning of period | 3,170,588,718 | 1,880,739,887 |
| End of period | $3,364,527,595 | $3,170,588,718 |
| Other Information | ||
| Shares | ||
| Sold | 6,342,161 | 25,028,945 |
| Issued in reinvestment of distributions | 3,017,240 | 2,841,592 |
| Redeemed | (6,841,350) | (30,486,651) |
| Net increase (decrease) | 2,518,051 | (2,616,114) |
See accompanying notes which are an integral part of the financial statements.
Financial Highlights
Fidelity Small Cap Discovery Fund
| Six months ended (Unaudited) October 31, | Years endedApril 30, | |||||
| 2021 | 2021 | 2020 | 2019 | 2018 | 2017 | |
| Selected Per–Share Data | ||||||
| Net asset value, beginning of period | $29.55 | $17.11 | $23.60 | $29.61 | $32.05 | $27.81 |
| Income from Investment Operations | ||||||
| Net investment income (loss)A | (.01) | .08 | .18 | .32B | .19 | .20 |
| Net realized and unrealized gain (loss) | 1.99 | 13.03 | (4.94) | .68 | 1.53 | 4.18 |
| Total from investment operations | 1.98 | 13.11 | (4.76) | 1.00 | 1.72 | 4.38 |
| Distributions from net investment income | – | (.07)C | (.19) | (.22) | (.19) | (.14) |
| Distributions from net realized gain | (.89) | (.60)C | (1.54) | (6.78) | (3.97) | – |
| Total distributions | (.89) | (.67) | (1.73) | (7.01)D | (4.16) | (.14) |
| Redemption fees added to paid in capitalA | – | – | – | – | –E | –E |
| Net asset value, end of period | $30.64 | $29.55 | $17.11 | $23.60 | $29.61 | $32.05 |
| Total ReturnF,G | 6.84% | 77.54% | (21.89)% | 4.96% | 5.46% | 15.76% |
| Ratios to Average Net AssetsH,I | ||||||
| Expenses before reductions | .94%J | .62% | .61% | .61% | .69% | .87% |
| Expenses net of fee waivers, if any | .94%J | .62% | .61% | .61% | .69% | .87% |
| Expenses net of all reductions | .94%J | .61% | .61% | .60% | .68% | .87% |
| Net investment income (loss) | (.04)%J | .33% | .81% | 1.29%B | .61% | .66% |
| Supplemental Data | ||||||
| Net assets, end of period (000 omitted) | $3,364,528 | $3,170,589 | $1,880,740 | $3,019,025 | $4,507,452 | $5,632,973 |
| Portfolio turnover rateK | 16%J | 33% | 52% | 32% | 41% | 18% |
A Calculated based on average shares outstanding during the period.
B Net investment income per share reflects one or more large, non-recurring dividend(s) which amounted to $.06 per share. Excluding such non-recurring dividend(s), the ratio of net investment income (loss) to average net assets would have been 1.05%.
C The amounts shown reflect certain reclassifications related to book to tax differences that were made in the year shown.
D Total distributions per share do not sum due to rounding.
E Amount represents less than $.005 per share.
F Total returns for periods of less than one year are not annualized.
G Total returns would have been lower if certain expenses had not been reduced during the applicable periods shown.
H Fees and expenses of any underlying mutual funds or exchange-traded funds (ETFs) are not included in the Fund's expense ratio. The Fund indirectly bears its proportionate share of these expenses. For additional expense information related to investments in Fidelity Central Funds, please refer to the "Investments in Fidelity Central Funds" note found in the Notes to Financial Statements section of the most recent Annual or Semi-Annual report.
I Expense ratios reflect operating expenses of the class. Expenses before reductions do not reflect amounts reimbursed, waived, or reduced through arrangements with the investment adviser, brokerage services, or other offset arrangements, if applicable, and do not represent the amount paid by the class during periods when reimbursements, waivers or reductions occur.
J Annualized
K Amount does not include the portfolio activity of any underlying mutual funds or exchange-traded funds (ETFs).
See accompanying notes which are an integral part of the financial statements.
Notes to Financial Statements (Unaudited)
For the period ended October 31, 2021
1. Organization.
Fidelity Small Cap Discovery Fund (the Fund) is a fund of Fidelity Concord Street Trust (the Trust) and is authorized to issue an unlimited number of shares. Share transactions on the Statement of Changes in Net Assets may contain exchanges between affiliated funds. The Trust is registered under the Investment Company Act of 1940, as amended (the 1940 Act), as an open-end management investment company organized as a Massachusetts business trust.
2. Investments in Fidelity Central Funds.
Funds may invest in Fidelity Central Funds, which are open-end investment companies generally available only to other investment companies and accounts managed by the investment adviser and its affiliates. The Schedule of Investments lists any Fidelity Central Funds held as an investment as of period end, but does not include the underlying holdings of each Fidelity Central Fund. An investing fund indirectly bears its proportionate share of the expenses of the underlying Fidelity Central Funds.
Based on its investment objective, each Fidelity Central Fund may invest or participate in various investment vehicles or strategies that are similar to those of the investing fund. These strategies are consistent with the investment objectives of the investing fund and may involve certain economic risks which may cause a decline in value of each of the Fidelity Central Funds and thus a decline in the value of the investing fund.
| Fidelity Central Fund | Investment Manager | Investment Objective | Investment Practices | Expense Ratio(a) |
| Fidelity Money Market Central Funds | Fidelity Management & Research Company LLC (FMR) | Each fund seeks to obtain a high level of current income consistent with the preservation of capital and liquidity. | Short-term Investments | Less than .005% |
(a) Expenses expressed as a percentage of average net assets and are as of each underlying Central Fund's most recent annual or semi-annual shareholder report.
A complete unaudited list of holdings for each Fidelity Central Fund is available upon request or at the Securities and Exchange Commission website at www.sec.gov. In addition, the financial statements of the Fidelity Central Funds which contain the significant accounting policies (including investment valuation policies) of those funds, and are not covered by the Report of Independent Registered Public Accounting Firm, are available on the Securities and Exchange Commission website or upon request.
3. Significant Accounting Policies.
The Fund is an investment company and applies the accounting and reporting guidance of the Financial Accounting Standards Board (FASB) Accounting Standards Codification Topic 946 Financial Services - Investment Companies. The financial statements have been prepared in conformity with accounting principles generally accepted in the United States of America (GAAP), which require management to make certain estimates and assumptions at the date of the financial statements. Actual results could differ from those estimates. Subsequent events, if any, through the date that the financial statements were issued have been evaluated in the preparation of the financial statements. The Fund's Schedule of Investments lists any underlying mutual funds or exchange-traded funds (ETFs) but does not include the underlying holdings of these funds. The following summarizes the significant accounting policies of the Fund:
Investment Valuation. Investments are valued as of 4:00 p.m. Eastern time on the last calendar day of the period. The Board of Trustees (the Board) has delegated the day to day responsibility for the valuation of the Fund's investments to the Fair Value Committee (the Committee) established by the Fund's investment adviser. In accordance with valuation policies and procedures approved by the Board, the Fund attempts to obtain prices from one or more third party pricing vendors or brokers to value its investments. When current market prices, quotations or currency exchange rates are not readily available or reliable, investments will be fair valued in good faith by the Committee, in accordance with procedures adopted by the Board. Factors used in determining fair value vary by investment type and may include market or investment specific events. The frequency with which these procedures are used cannot be predicted and they may be utilized to a significant extent. The Committee oversees the Fund's valuation policies and procedures and reports to the Board on the Committee's activities and fair value determinations. The Board monitors the appropriateness of the procedures used in valuing the Fund's investments and ratifies the fair value determinations of the Committee.
The Fund categorizes the inputs to valuation techniques used to value its investments into a disclosure hierarchy consisting of three levels as shown below:
- Level 1 – quoted prices in active markets for identical investments
- Level 2 – other significant observable inputs (including quoted prices for similar investments, interest rates, prepayment speeds, etc.)
- Level 3 – unobservable inputs (including the Fund's own assumptions based on the best information available)
Valuation techniques used to value the Fund's investments by major category are as follows:
Equity securities, including restricted securities, for which market quotations are readily available, are valued at the last reported sale price or official closing price as reported by a third party pricing vendor on the primary market or exchange on which they are traded and are categorized as Level 1 in the hierarchy. In the event there were no sales during the day or closing prices are not available, securities are valued at the last quoted bid price or may be valued using the last available price and are generally categorized as Level 2 in the hierarchy. For foreign equity securities, when market or security specific events arise, comparisons to the valuation of American Depositary Receipts (ADRs), futures contracts, Exchange-Traded Funds (ETFs) and certain indexes as well as quoted prices for similar securities may be used and would be categorized as Level 2 in the hierarchy. For equity securities, including restricted securities, where observable inputs are limited, assumptions about market activity and risk are used and these securities may be categorized as Level 3 in the hierarchy.
Investments in open-end mutual funds, including the Fidelity Central Funds, are valued at their closing net asset value (NAV) each business day and are categorized as Level 1 in the hierarchy.
Changes in valuation techniques may result in transfers in or out of an assigned level within the disclosure hierarchy. The aggregate value of investments by input level as of October 31, 2021 is included at the end of the Fund's Schedule of Investments.
Foreign Currency. Certain Funds may use foreign currency contracts to facilitate transactions in foreign-denominated securities. Gains and losses from these transactions may arise from changes in the value of the foreign currency or if the counterparties do not perform under the contracts' terms.
Foreign-denominated assets, including investment securities, and liabilities are translated into U.S. dollars at the exchange rates at period end. Purchases and sales of investment securities, income and dividends received, and expenses denominated in foreign currencies are translated into U.S. dollars at the exchange rate in effect on the transaction date.
The effects of exchange rate fluctuations on investments are included with the net realized and unrealized gain (loss) on investment securities. Other foreign currency transactions resulting in realized and unrealized gain (loss) are disclosed separately.
Investment Transactions and Income. For financial reporting purposes, the Fund's investment holdings and NAV include trades executed through the end of the last business day of the period. The NAV per share for processing shareholder transactions is calculated as of the close of business of the New York Stock Exchange (NYSE), normally 4:00 p.m. Eastern time and includes trades executed through the end of the prior business day. Gains and losses on securities sold are determined on the basis of identified cost and include proceeds received from litigation. Commissions paid to certain brokers with whom the investment adviser, or its affiliates, places trades on behalf of a fund include an amount in addition to trade execution, which may be rebated back to a fund. Any such rebates are included in net realized gain (loss) on investments in the Statement of Operations. Dividend income is recorded on the ex-dividend date, except for certain dividends from foreign securities where the ex-dividend date may have passed, which are recorded as soon as the Fund is informed of the ex-dividend date. Non-cash dividends included in dividend income, if any, are recorded at the fair market value of the securities received. Income and capital gain distributions from Fidelity Central Funds, if any, are recorded on the ex-dividend date. Certain distributions received by the Fund represent a return of capital or capital gain. The Fund determines the components of these distributions subsequent to the ex-dividend date, based upon receipt of tax filings or other correspondence relating to the underlying investment. These distributions are recorded as a reduction of cost of investments and/or as a realized gain. Investment income is recorded net of foreign taxes withheld where recovery of such taxes is uncertain. Funds may file withholding tax reclaims in certain jurisdictions to recover a portion of amounts previously withheld. Any withholding tax reclaims income is included in the Statement of Operations in dividends. Any receivables for withholding tax reclaims are included in the Statement of Assets and Liabilities in dividends receivable.
Expenses. Expenses directly attributable to a fund are charged to that fund. Expenses attributable to more than one fund are allocated among the respective funds on the basis of relative net assets or other appropriate methods. Expenses included in the accompanying financial statements reflect the expenses of that fund and do not include any expenses associated with any underlying mutual funds or exchange-traded funds. Although not included in a fund's expenses, a fund indirectly bears its proportionate share of these expenses through the net asset value of each underlying mutual fund or exchange-traded fund. Expense estimates are accrued in the period to which they relate and adjustments are made when actual amounts are known.
Income Tax Information and Distributions to Shareholders. Each year, the Fund intends to qualify as a regulated investment company under Subchapter M of the Internal Revenue Code, including distributing substantially all of its taxable income and realized gains. As a result, no provision for U.S. Federal income taxes is required. The Fund files a U.S. federal tax return, in addition to state and local tax returns as required. The Fund's federal income tax returns are subject to examination by the Internal Revenue Service (IRS) for a period of three fiscal years after they are filed. State and local tax returns may be subject to examination for an additional fiscal year depending on the jurisdiction. Foreign taxes are provided for based on the Fund's understanding of the tax rules and rates that exist in the foreign markets in which it invests.
Distributions are declared and recorded on the ex-dividend date. Income and capital gain distributions are determined in accordance with income tax regulations, which may differ from GAAP.
Capital accounts within the financial statements are adjusted for permanent book-tax differences. These adjustments have no impact on net assets or the results of operations. Capital accounts are not adjusted for temporary book-tax differences which will reverse in a subsequent period.
Book-tax differences are primarily due to foreign currency transactions, partnerships and losses deferred due to wash sales and excise tax regulations.
As of period end, the cost and unrealized appreciation (depreciation) in securities, and derivatives if applicable, for federal income tax purposes were as follows:
| Gross unrealized appreciation | $1,223,852,123 |
| Gross unrealized depreciation | (142,741,224) |
| Net unrealized appreciation (depreciation) | $1,081,110,899 |
| Tax cost | $2,331,555,410 |
Restricted Securities (including Private Placements). Funds may invest in securities that are subject to legal or contractual restrictions on resale. These securities generally may be resold in transactions exempt from registration or to the public if the securities are registered. Disposal of these securities may involve time-consuming negotiations and expense, and prompt sale at an acceptable price may be difficult. Information regarding restricted securities held at period end is included at the end of the Schedule of Investments, if applicable.
4. Purchases and Sales of Investments.
Purchases and sales of securities, other than short-term securities and in-kind transactions, as applicable, are noted in the table below.
| Purchases ($) | Sales ($) | |
| Fidelity Small Cap Discovery Fund | 250,725,842 | 292,969,140 |
5. Fees and Other Transactions with Affiliates.
Management Fee. Fidelity Management & Research Company LLC (the investment adviser) and its affiliates provide the Fund with investment management related services for which the Fund pays a monthly management fee. The management fee is the sum of an individual fund fee rate that is based on an annual rate of .45% of the Fund's average net assets and an annualized group fee rate that averaged .23% during the period. The group fee rate is based upon the monthly average net assets of a group of registered investment companies with which the investment adviser has management contracts. The group fee rate decreases as assets under management increase and increases as assets under management decrease. In addition, the management fee is subject to a performance adjustment (up to a maximum of +/- .20% of the Fund's average net assets over a 36 month performance period). The upward or downward adjustment to the management fee is based on the Fund's relative investment performance as compared to its benchmark index, the Russell 2000 Index, over the same 36 month performance period. For the reporting period, the total annualized management fee rate, including the performance adjustment, was .76% of the Fund's average net assets. The performance adjustment included in the management fee rate may be higher or lower than the maximum performance adjustment rate due to the difference between the average net assets for the reporting and performance periods.
Transfer Agent Fees. Fidelity Investments Institutional Operations Company LLC (FIIOC), an affiliate of the investment adviser, is the Fund's transfer, dividend disbursing and shareholder servicing agent. FIIOC receives account fees and asset-based fees that vary according to account size and type of account. FIIOC pays for typesetting, printing and mailing of shareholder reports, except proxy statements. For the period, the transfer agent fees were equivalent to an annualized rate of .14% of average net assets.
Accounting Fees. Fidelity Service Company, Inc. (FSC), an affiliate of the investment adviser, maintains the Fund's accounting records. The accounting fee is based on the level of average net assets for each month. For the period, the fees were equivalent to the following annualized rates:
| % of Average Net Assets | |
| Fidelity Small Cap Discovery Fund | .03 |
Brokerage Commissions. A portion of portfolio transactions were placed with brokerage firms which are affiliates of the investment adviser. Brokerage commissions are included in net realized gain (loss) and change in net unrealized appreciation (depreciation) in the Statement of Operations. The commissions paid to these affiliated firms were as follows:
| Amount | |
| Fidelity Small Cap Discovery Fund | $6,917 |
Interfund Lending Program. Pursuant to an Exemptive Order issued by the Securities and Exchange Commission (the SEC), the Fund, along with other registered investment companies having management contracts with Fidelity Management & Research Company LLC (FMR), or other affiliated entities of FMR, may participate in an interfund lending program. This program provides an alternative credit facility allowing the Fund to borrow from, or lend money to, other participating affiliated funds. At period end, there were no interfund loans outstanding. Activity in this program during the period for which loans were outstanding was as follows:
| Borrower or Lender | Average Loan Balance | Weighted Average Interest Rate | Interest Expense | |
| Fidelity Small Cap Discovery Fund | Borrower | $3,954,667 | .33% | $107 |
Interfund Trades. Funds may purchase from or sell securities to other Fidelity Funds under procedures adopted by the Board. The procedures have been designed to ensure these interfund trades are executed in accordance with Rule 17a-7 of the 1940 Act. Any interfund trades are included within the respective purchases and sales amounts shown in the Purchases and Sales of Investments note. Interfund trades during the period are noted in the table below.
| Purchases ($) | Sales ($) | Realized Gain (Loss) ($) | |
| Fidelity Small Cap Discovery Fund | 45,239,285 | 1,455,035 | 916,370 |
6. Committed Line of Credit.
Certain Funds participate with other funds managed by the investment adviser or an affiliate in a $4.25 billion credit facility (the "line of credit") to be utilized for temporary or emergency purposes to fund shareholder redemptions or for other short-term liquidity purposes. The participating funds have agreed to pay commitment fees on their pro-rata portion of the line of credit, which are reflected in Miscellaneous expenses on the Statement of Operations, and are listed below. During the period, there were no borrowings on this line of credit.
| Amount | |
| Fidelity Small Cap Discovery Fund | $2,598 |
7. Security Lending.
Funds lend portfolio securities from time to time in order to earn additional income. Lending agents are used, including National Financial Services (NFS), an affiliate of the investment adviser. Pursuant to a securities lending agreement, NFS will receive a fee, which is capped at 9.9% of a fund's daily lending revenue, for its services as lending agent. A fund may lend securities to certain qualified borrowers, including NFS. On the settlement date of the loan, a fund receives collateral (in the form of U.S. Treasury obligations, letters of credit and/or cash) against the loaned securities and maintains collateral in an amount not less than 100% of the market value of the loaned securities during the period of the loan. The market value of the loaned securities is determined at the close of business of a fund and any additional required collateral is delivered to a fund on the next business day. A fund or borrower may terminate the loan at any time, and if the borrower defaults on its obligation to return the securities loaned because of insolvency or other reasons, a fund may apply collateral received from the borrower against the obligation. A fund may experience delays and costs in recovering the securities loaned. Any cash collateral received is invested in the Fidelity Securities Lending Cash Central Fund. Any loaned securities are identified as such in the Schedule of Investments, and the value of loaned securities and cash collateral at period end, as applicable, are presented in the Statement of Assets and Liabilities. Security lending income represents the income earned on investing cash collateral, less rebates paid to borrowers and any lending agent fees associated with the loan, plus any premium payments received for lending certain types of securities. Security lending income is presented in the Statement of Operations as a component of income from Fidelity Central Funds. Affiliated security lending activity, if any, was as follows:
| Total Security Lending Fees Paid to NFS | Security Lending Income From Securities Loaned to NFS | Value of Securities Loaned to NFS at Period End | |
| Fidelity Small Cap Discovery Fund | $7,218 | $3 | $– |
8. Expense Reductions.
Through arrangements with the Fund's custodian, credits realized as a result of certain uninvested cash balances were used to reduce the Fund's expenses by $17.
In addition, during the period the investment adviser or an affiliate reimbursed and/or waived a portion of operating expenses in the amount of $45,171.
9. Other.
Fund's organizational documents provide former and current trustees and officers with a limited indemnification against liabilities arising in connection with the performance of their duties to the fund. In the normal course of business, the fund may also enter into contracts that provide general indemnifications. The fund's maximum exposure under these arrangements is unknown as this would be dependent on future claims that may be made against the fund. The risk of material loss from such claims is considered remote.
At the end of the period, the following mutual funds managed by the investment adviser or its affiliates were the owners of record of 10% or more of the total outstanding shares.
| Strategic Advisers Fidelity U.S. Total Stock Fund | |
| Fidelity Small Cap Discovery Fund | 16% |
10. Coronavirus (COVID-19) Pandemic.
An outbreak of COVID-19 first detected in China during December 2019 has since spread globally and was declared a pandemic by the World Health Organization during March 2020. Developments that disrupt global economies and financial markets, such as the COVID-19 pandemic, may magnify factors that affect the Fund's performance.
Shareholder Expense Example
As a shareholder, you incur two types of costs: (1) transaction costs, which may include sales charges (loads) on purchase payments or redemption proceeds, as applicable and (2) ongoing costs, which generally include management fees, distribution and/or service (12b-1) fees and other Fund expenses. This Example is intended to help you understand your ongoing costs (in dollars) of investing in a fund and to compare these costs with the ongoing costs of investing in other mutual funds.
The Example is based on an investment of $1,000 invested at the beginning of the period and held for the entire period (May 1, 2021 to October 31, 2021).
Actual Expenses
The first line of the accompanying table provides information about actual account values and actual expenses. You may use the information in this line, together with the amount you invested, to estimate the expenses that you paid over the period. Simply divide your account value by $1,000.00 (for example, an $8,600 account value divided by $1,000.00 = 8.6), then multiply the result by the number in the first line for a class/Fund under the heading entitled "Expenses Paid During Period" to estimate the expenses you paid on your account during this period. If any fund is a shareholder of any underlying mutual funds or exchange-traded funds (ETFs) (the Underlying Funds), such fund indirectly bears its proportional share of the expenses of the Underlying Funds in addition to the direct expenses incurred presented in the table. These fees and expenses are not included in the annualized expense ratio used to calculate the expense estimate in the table below.
Hypothetical Example for Comparison Purposes
The second line of the accompanying table provides information about hypothetical account values and hypothetical expenses based on the actual expense ratio and an assumed rate of return of 5% per year before expenses, which is not the actual return. The hypothetical account values and expenses may not be used to estimate the actual ending account balance or expenses you paid for the period. You may use this information to compare the ongoing costs of investing in the Fund and other funds. To do so, compare this 5% hypothetical example with the 5% hypothetical examples that appear in the shareholder reports of the other funds. If any fund is a shareholder of any Underlying Funds, such fund indirectly bears its proportional share of the expenses of the Underlying Funds in addition to the direct expenses as presented in the table. These fees and expenses are not included in the annualized expense ratio used to calculate the expense estimate in the table below.
Please note that the expenses shown in the table are meant to highlight your ongoing costs only and do not reflect any transaction costs. Therefore, the second line of the table is useful in comparing ongoing costs only, and will not help you determine the relative total costs of owning different funds. In addition, if these transactional costs were included, your costs would have been higher.
| Annualized Expense Ratio-A | Beginning Account Value May 1, 2021 | Ending Account Value October 31, 2021 | Expenses Paid During Period-B May 1, 2021 to October 31, 2021 | |
| Fidelity Small Cap Discovery Fund | .94% | |||
| Actual | $1,000.00 | $1,068.40 | $4.90 | |
| Hypothetical-C | $1,000.00 | $1,020.47 | $4.79 |
A Annualized expense ratio reflects expenses net of applicable fee waivers.
B Expenses are equal to the annualized expense ratio, multiplied by the average account value over the period, multiplied by 184/ 365 (to reflect the one-half year period). The fees and expenses of any Underlying Funds are not included in each annualized expense ratio.
C 5% return per year before expenses
Board Approval of Investment Advisory Contracts and Management Fees
Fidelity Small Cap Discovery Fund
Each year, the Board of Trustees, including the Independent Trustees (together, the Board), votes on the renewal of the management contract with Fidelity Management & Research Company LLC (FMR) and the sub-advisory agreements (together, the Advisory Contracts) for the fund. FMR and the sub-advisers are referred to herein as the Investment Advisers. The Board, assisted by the advice of fund counsel and Independent Trustees' counsel, requests and considers a broad range of information relevant to the renewal of the Advisory Contracts throughout the year.The Board meets regularly and, at each of its meetings, covers an extensive agenda of topics and materials and considers factors that are relevant to its annual consideration of the renewal of the fund's Advisory Contracts, including the services and support provided to the fund and its shareholders. The Board has established various standing committees (Committees), each composed of and chaired by Independent Trustees with varying backgrounds, to which the Board has assigned specific subject matter responsibilities in order to enhance effective decision-making by the Board. The Board, acting directly and through its Committees, requests and receives information concerning the annual consideration of the renewal of the fund's Advisory Contracts. The Board also meets as needed to review matters specifically related to the Board's annual consideration of the renewal of the Advisory Contracts. Members of the Board may also meet with trustees of other Fidelity funds through joint ad hoc committees to discuss certain matters relevant to all of the Fidelity funds.At its May 2021 meeting, the Board unanimously determined to renew the fund's Advisory Contracts. In reaching its determination, the Board considered all factors it believed relevant, including (i) the nature, extent, and quality of the services provided to the fund and its shareholders (including the investment performance of the fund); (ii) the competitiveness of the fund's management fee and total expense ratio relative to peer funds; (iii) the total costs of the services provided by and the profits realized by Fidelity from its relationships with the fund; and (iv) the extent to which, if any, economies of scale exist and are realized as the fund grows, and whether any economies of scale are appropriately shared with fund shareholders.In considering whether to renew the Advisory Contracts for the fund, the Board reached a determination, with the assistance of fund counsel and Independent Trustees' counsel and through the exercise of its business judgment, that the renewal of the Advisory Contracts was in the best interests of the fund and its shareholders and that the compensation payable under the Advisory Contracts was fair and reasonable. The Board's decision to renew the Advisory Contracts was not based on any single factor, but rather was based on a comprehensive consideration of all the information provided to the Board at its meetings throughout the year. The Board, in reaching its determination to renew the Advisory Contracts, was aware that shareholders of the fund have a broad range of investment choices available to them, including a wide choice among funds offered by Fidelity's competitors, and that the fund's shareholders, who have the opportunity to review and weigh the disclosure provided by the fund in its prospectus and other public disclosures, have chosen to invest in this fund, which is part of the Fidelity family of funds.Nature, Extent, and Quality of Services Provided. The Board considered Fidelity's staffing as it relates to the fund, including the backgrounds of investment personnel of Fidelity, and also considered the fund's investment objective, strategies, and related investment philosophy. The Independent Trustees also had discussions with senior management of Fidelity's investment operations and investment groups. The Board considered the structure of the investment personnel compensation program and whether this structure provides appropriate incentives to act in the best interests of the fund. Additionally, the Board considered the portfolio managers' investments, if any, in the funds that they manage.Resources Dedicated to Investment Management and Support Services. The Board and the Fund Oversight and Research Committees reviewed the general qualifications and capabilities of Fidelity's investment staff, including its size, education, experience, and resources, as well as Fidelity's approach to recruiting, training, managing, and compensating investment personnel. The Board noted that Fidelity has continued to increase the resources devoted to non-U.S. offices, including expansion of Fidelity's global investment organization. The Board also noted that Fidelity's analysts have extensive resources, tools and capabilities that allow them to conduct sophisticated quantitative and fundamental analysis, as well as credit analysis of issuers, counterparties and guarantors. Further, the Board considered that Fidelity's investment professionals have sufficient access to global information and data so as to provide competitive investment results over time, and that those professionals also have access to sophisticated tools that permit them to assess portfolio construction and risk and performance attribution characteristics continuously, as well as to transmit new information and research conclusions rapidly around the world. Additionally, in its deliberations, the Board considered Fidelity's trading, risk management, compliance, and technology and operations capabilities and resources, which are integral parts of the investment management process. The Board also considered Fidelity's investments in business continuity planning, and its success in continuously providing services to the fund notwithstanding the severe disruptions caused by the COVID-19 pandemic.Shareholder and Administrative Services. The Board considered (i) the nature, extent, quality, and cost of advisory, administrative, and shareholder services performed by the Investment Advisers and their affiliates under the Advisory Contracts and under separate agreements covering transfer agency, pricing and bookkeeping, and securities lending services for the fund; (ii) the nature and extent of the supervision of third party service providers, principally custodians, subcustodians, and pricing vendors; and (iii) the resources devoted to, and the record of compliance with, the fund's compliance policies and procedures. The Board also reviewed the allocation of fund brokerage, including allocations to brokers affiliated with the Investment Advisers, the use of brokerage commissions to pay fund expenses, and the use of "soft" commission dollars to pay for research services.The Board noted that the growth of fund assets over time across the complex allows Fidelity to reinvest in the development of services designed to enhance the value and convenience of the Fidelity funds as investment vehicles. These services include 24-hour access to account information and market information over the Internet and through telephone representatives, investor education materials and asset allocation tools, and the expanded availability of Fidelity Investor Centers.The Board noted that, in the past, it and the boards of certain other Fidelity funds had formed an ad hoc Committee on Transfer Agency Fees to review the variety of transfer agency fee structures throughout the industry and Fidelity's competitive positioning with respect to industry participants.Investment in a Large Fund Family. The Board considered the benefits to shareholders of investing in a Fidelity fund, including the benefits of investing in a fund that is part of a large family of funds offering a variety of investment disciplines and providing a large variety of mutual fund investor services. The Board noted that Fidelity had taken, or had made recommendations that resulted in the Fidelity funds taking, a number of actions over the previous year that benefited particular funds, including: (i) continuing to dedicate additional resources to Fidelity's investment research process, which includes meetings with management of issuers of securities in which the funds invest, and to the support of the senior management team that oversees asset management; (ii) continuing efforts to enhance Fidelity's global research capabilities; (iii) launching new funds and ETFs with innovative structures, strategies and pricing and making other enhancements to meet client needs; (iv) launching new share classes of existing funds; (v) eliminating purchase minimums and broadening eligibility requirements for certain funds and share classes; (vi) approving the reduction in the holding period for the Class C to Class A conversion policy; (vii) reducing management fees and total expenses for certain target date funds and classes and index funds; (viii) lowering expenses for certain existing funds and classes by implementing or lowering expense caps; (ix) rationalizing product lines and gaining increased efficiencies from fund mergers, liquidations, and share class consolidations; (x) continuing to develop, acquire and implement systems and technology to improve services to the funds and shareholders, strengthen information security, and increase efficiency; and (xi) continuing to implement enhancements to further strengthen Fidelity's product line to increase investors' probability of success in achieving their investment goals, including retirement income goals.Investment Performance. The Board considered whether the fund has operated in accordance with its investment objective, as well as its record of compliance with its investment restrictions and its performance history. The Board noted that there were portfolio management changes for the fund in January 2018 and June 2018. The Board will continue to monitor closely the fund's performance, taking into account the portfolio management changes.The Board took into account discussions that occur at Board meetings throughout the year with representatives of the Investment Advisers about fund investment performance. In this regard the Board noted that as part of regularly scheduled fund reviews and other reports to the Board on fund performance, the Board considers annualized return information for the fund for different time periods, measured against an appropriate securities market index (benchmark index) and an appropriate peer group of funds with similar objectives (peer group). In its evaluation of fund investment performance, the Board gave particular attention to information indicating changes in performance of certain Fidelity funds for specific time periods and discussed with the Investment Advisers the reasons for any overperformance or underperformance.In addition to reviewing absolute and relative fund performance, the Independent Trustees periodically consider the appropriateness of fund performance metrics in evaluating the results achieved. In general, the Independent Trustees believe that fund performance should be evaluated based on net performance (after fees and expenses) of both the highest performing and lowest performing fund share classes, where applicable, compared to appropriate benchmark indices, over appropriate time periods that may include full market cycles, and compared to peer groups, as applicable, over the same periods, taking into account relevant factors including the following: general market conditions; issuer-specific information; and fund cash flows and other factors.The Independent Trustees recognize that shareholders evaluate performance on a net basis over their own holding periods, for which one-, three-, and five-year periods are often used as a proxy. For this reason, the performance information reviewed by the Board also included net cumulative total return information for the fund and an appropriate benchmark index and peer group for the most recent one-, three-, and five-year periods ended September 30, 2020, as shown below. Returns are shown compared to the 25th percentile (top of box, 75% beaten) and 75th percentile (bottom of box, 25% beaten) of the peer universe.Fidelity Small Cap Discovery Fund

Fidelity Small Cap Discovery Fund
The Board noted that the comparisons for 2015 and later reflect a revised Total Mapped Group that no longer includes funds with micro-cap objectives and that FMR believes this Total Mapped Group is a more appropriate comparison because the fund does not have a micro-cap objective.
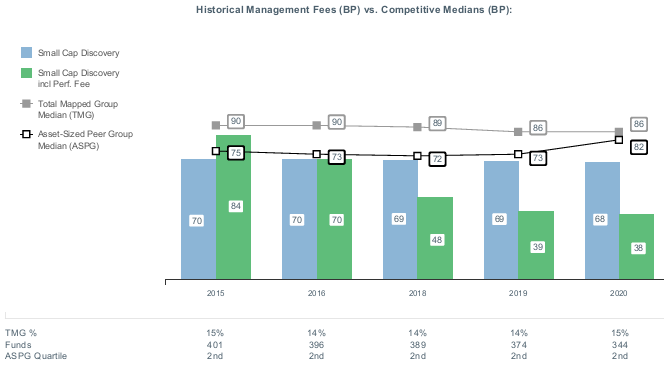
![]()
SMR-SANN-1221
1.749363.121
Fidelity® Series Small Cap Discovery Fund
Semi-Annual Report
October 31, 2021
Contents
Board Approval of Investment Advisory Contracts and Management Fees |
To view a fund's proxy voting guidelines and proxy voting record for the 12-month period ended June 30, visit http://www.fidelity.com/proxyvotingresults or visit the Securities and Exchange Commission's (SEC) web site at http://www.sec.gov.
You may also call 1-800-544-8544 to request a free copy of the proxy voting guidelines.
Standard & Poor's, S&P and S&P 500 are registered service marks of The McGraw-Hill Companies, Inc. and have been licensed for use by Fidelity Distributors Corporation.
Other third-party marks appearing herein are the property of their respective owners.
All other marks appearing herein are registered or unregistered trademarks or service marks of FMR LLC or an affiliated company. © 2021 FMR LLC. All rights reserved.
This report and the financial statements contained herein are submitted for the general information of the shareholders of the Fund. This report is not authorized for distribution to prospective investors in the Fund unless preceded or accompanied by an effective prospectus.
A fund files its complete schedule of portfolio holdings with the SEC for the first and third quarters of each fiscal year on Form N-PORT. Forms N-PORT are available on the SEC’s web site at http://www.sec.gov. A fund's Forms N-PORT may be reviewed and copied at the SEC’s Public Reference Room in Washington, DC. Information regarding the operation of the SEC's Public Reference Room may be obtained by calling 1-800-SEC-0330.
For a complete list of a fund's portfolio holdings, view the most recent holdings listing, semiannual report, or annual report on Fidelity's web site at http://www.fidelity.com, http://www.institutional.fidelity.com, or http://www.401k.com, as applicable.
NOT FDIC INSURED •MAY LOSE VALUE •NO BANK GUARANTEE
Neither the Fund nor Fidelity Distributors Corporation is a bank.
Note to Shareholders:
Early in 2020, the outbreak and spread of COVID-19 emerged as a public health emergency that had a major influence on financial markets, primarily based on its impact on the global economy and corporate earnings. On March 11, 2020, the World Health Organization declared the COVID-19 outbreak a pandemic, citing sustained risk of further global spread. The pandemic prompted a number of measures to limit the spread of COVID-19, including travel and border restrictions, quarantines, and restrictions on large gatherings. In turn, these resulted in lower consumer activity, diminished demand for a wide range of products and services, disruption in manufacturing and supply chains, and – given the wide variability in outcomes regarding the outbreak – significant market uncertainty and volatility. To help stem the turmoil, the U.S. government took unprecedented action – in concert with the U.S. Federal Reserve and central banks around the world – to help support consumers, businesses, and the broader economy, and to limit disruption to the financial system.
In general, the overall impact of the pandemic lessened in 2021, amid a resilient economy and widespread distribution of three COVID-19 vaccines granted emergency use authorization from the U.S. Food and Drug Administration (FDA) early in the year. Still, the situation remains dynamic, and the extent and duration of its influence on financial markets and the economy is highly uncertain, due in part to a recent spike in cases based on highly contagious variants of the coronavirus.
Extreme events such as the COVID-19 crisis are exogenous shocks that can have significant adverse effects on mutual funds and their investments. Although multiple asset classes may be affected by market disruption, the duration and impact may not be the same for all types of assets. Fidelity is committed to helping you stay informed amid news about COVID-19 and during increased market volatility, and we continue to take extra steps to be responsive to customer needs. We encourage you to visit us online, where we offer ongoing updates, commentary, and analysis on the markets and our funds.
Investment Summary (Unaudited)
Top Ten Stocks as of October 31, 2021
| % of fund's net assets | |
| Insight Enterprises, Inc. | 3.4 |
| First American Financial Corp. | 3.3 |
| Jones Lang LaSalle, Inc. | 3.2 |
| ASGN, Inc. | 3.1 |
| Envista Holdings Corp. | 3.1 |
| Syneos Health, Inc. | 3.0 |
| Concentrix Corp. | 2.9 |
| Valvoline, Inc. | 2.8 |
| First Cash Financial Services, Inc. | 2.6 |
| Cullen/Frost Bankers, Inc. | 2.5 |
| 29.9 |
Top Five Market Sectors as of October 31, 2021
| % of fund's net assets | |
| Industrials | 18.3 |
| Financials | 17.7 |
| Information Technology | 15.3 |
| Health Care | 13.0 |
| Real Estate | 10.1 |
Asset Allocation (% of fund's net assets)
| As of October 31, 2021* | ||
| Stocks | 98.3% | |
| Short-Term Investments and Net Other Assets (Liabilities) | 1.7% | |

* Foreign investments - 23.8%
Schedule of Investments October 31, 2021 (Unaudited)
Showing Percentage of Net Assets
| Common Stocks - 98.3% | |||
| Shares | Value | ||
| COMMUNICATION SERVICES - 3.3% | |||
| Interactive Media & Services - 1.9% | |||
| Dip Corp. | 375,000 | $13,454,743 | |
| Ziff Davis, Inc. (a) | 125,000 | 16,033,750 | |
| 29,488,493 | |||
| Media - 1.4% | |||
| Cogeco Communications, Inc. | 150,000 | 12,882,595 | |
| Emerald Holding, Inc. (a)(b) | 1,923,000 | 7,788,150 | |
| 20,670,745 | |||
| TOTAL COMMUNICATION SERVICES | 50,159,238 | ||
| CONSUMER DISCRETIONARY - 9.6% | |||
| Auto Components - 2.3% | |||
| Adient PLC (a) | 500,000 | 20,810,000 | |
| Linamar Corp. | 50,000 | 2,750,081 | |
| Patrick Industries, Inc. | 150,000 | 11,686,500 | |
| 35,246,581 | |||
| Diversified Consumer Services - 2.4% | |||
| Adtalem Global Education, Inc. (a)(b) | 552,282 | 20,395,774 | |
| OneSpaWorld Holdings Ltd. (a)(b) | 750,000 | 8,100,000 | |
| Perdoceo Education Corp. (a) | 850,000 | 9,027,000 | |
| 37,522,774 | |||
| Hotels, Restaurants & Leisure - 1.0% | |||
| Hilton Grand Vacations, Inc. (a) | 300,000 | 15,084,000 | |
| Household Durables - 1.7% | |||
| Helen of Troy Ltd. (a) | 85,000 | 19,120,750 | |
| LGI Homes, Inc. (a)(b) | 50,000 | 7,465,000 | |
| 26,585,750 | |||
| Multiline Retail - 1.3% | |||
| Ollie's Bargain Outlet Holdings, Inc. (a)(b) | 300,000 | 20,298,000 | |
| Specialty Retail - 0.9% | |||
| America's Car Mart, Inc. (a)(b) | 35,422 | 4,232,575 | |
| Rent-A-Center, Inc. | 36,812 | 1,960,607 | |
| Winmark Corp. (b) | 30,000 | 6,984,600 | |
| 13,177,782 | |||
| TOTAL CONSUMER DISCRETIONARY | 147,914,887 | ||
| CONSUMER STAPLES - 1.3% | |||
| Food & Staples Retailing - 0.9% | |||
| BJ's Wholesale Club Holdings, Inc. (a) | 250,000 | 14,610,000 | |
| Food Products - 0.4% | |||
| TreeHouse Foods, Inc. (a) | 150,000 | 5,421,000 | |
| TOTAL CONSUMER STAPLES | 20,031,000 | ||
| ENERGY - 2.4% | |||
| Energy Equipment & Services - 0.6% | |||
| ShawCor Ltd. Class A (a) | 650,000 | 2,799,370 | |
| Total Energy Services, Inc. (a) | 1,415,230 | 5,740,510 | |
| 8,539,880 | |||
| Oil, Gas & Consumable Fuels - 1.8% | |||
| Brigham Minerals, Inc. Class A | 1,200,000 | 27,816,000 | |
| TOTAL ENERGY | 36,355,880 | ||
| FINANCIALS - 17.7% | |||
| Banks - 6.0% | |||
| BOK Financial Corp. | 300,000 | 30,351,000 | |
| Cullen/Frost Bankers, Inc. | 300,000 | 38,850,000 | |
| First Hawaiian, Inc. | 775,000 | 21,382,250 | |
| Wintrust Financial Corp. | 25,000 | 2,212,500 | |
| 92,795,750 | |||
| Capital Markets - 1.4% | |||
| BrightSphere Investment Group, Inc. | 700,000 | 20,986,000 | |
| Consumer Finance - 3.3% | |||
| Encore Capital Group, Inc. (a) | 200,000 | 10,804,000 | |
| First Cash Financial Services, Inc. | 450,000 | 39,811,500 | |
| 50,615,500 | |||
| Diversified Financial Services - 1.1% | |||
| Cannae Holdings, Inc. (a) | 500,000 | 17,050,000 | |
| Insurance - 5.9% | |||
| Assurant, Inc. | 50,000 | 8,065,500 | |
| Enstar Group Ltd. (a) | 100,000 | 23,078,000 | |
| First American Financial Corp. | 700,000 | 51,198,000 | |
| Primerica, Inc. | 50,000 | 8,412,000 | |
| 90,753,500 | |||
| TOTAL FINANCIALS | 272,200,750 | ||
| HEALTH CARE - 13.0% | |||
| Biotechnology - 0.4% | |||
| Emergent BioSolutions, Inc. (a) | 125,000 | 5,958,750 | |
| Health Care Equipment & Supplies - 3.8% | |||
| Envista Holdings Corp. (a) | 1,200,000 | 46,920,000 | |
| Hill-Rom Holdings, Inc. | 50,000 | 7,745,000 | |
| Utah Medical Products, Inc. | 32,219 | 3,119,766 | |
| 57,784,766 | |||
| Health Care Providers & Services - 2.8% | |||
| Premier, Inc. | 750,000 | 29,212,500 | |
| R1 RCM, Inc. (a) | 650,000 | 14,105,000 | |
| 43,317,500 | |||
| Life Sciences Tools & Services - 4.5% | |||
| Charles River Laboratories International, Inc. (a) | 50,000 | 22,434,000 | |
| Syneos Health, Inc. (a) | 500,000 | 46,670,000 | |
| 69,104,000 | |||
| Pharmaceuticals - 1.5% | |||
| Prestige Brands Holdings, Inc. (a) | 400,000 | 23,996,000 | |
| TOTAL HEALTH CARE | 200,161,016 | ||
| INDUSTRIALS - 18.3% | |||
| Commercial Services & Supplies - 2.7% | |||
| Cimpress PLC (a) | 300,000 | 26,796,000 | |
| The Brink's Co. | 200,000 | 13,776,000 | |
| 40,572,000 | |||
| Industrial Conglomerates - 0.6% | |||
| Rheinmetall AG | 100,000 | 9,691,904 | |
| Professional Services - 9.4% | |||
| ASGN, Inc. (a) | 400,000 | 47,864,000 | |
| BGSF, Inc. | 4,124 | 49,612 | |
| Insperity, Inc. | 200,000 | 25,000,000 | |
| Intertrust NV (a)(c) | 1,000,000 | 15,120,480 | |
| Kforce, Inc. | 450,000 | 29,142,000 | |
| Persol Holdings Co. Ltd. | 1,000,000 | 26,878,658 | |
| 144,054,750 | |||
| Road & Rail - 3.4% | |||
| TFI International, Inc. | 300,000 | 33,249,000 | |
| TFI International, Inc. (Canada) | 175,000 | 19,404,695 | |
| 52,653,695 | |||
| Trading Companies & Distributors - 2.2% | |||
| Beacon Roofing Supply, Inc. (a) | 600,000 | 31,722,000 | |
| MRC Global, Inc. (a) | 250,000 | 2,075,000 | |
| 33,797,000 | |||
| TOTAL INDUSTRIALS | 280,769,349 | ||
| INFORMATION TECHNOLOGY - 15.3% | |||
| Electronic Equipment & Components - 5.9% | |||
| Insight Enterprises, Inc. (a) | 550,000 | 52,084,998 | |
| Methode Electronics, Inc. Class A (b) | 175,000 | 7,362,250 | |
| TD SYNNEX Corp. | 175,000 | 18,375,000 | |
| TTM Technologies, Inc. (a) | 1,000,000 | 13,240,000 | |
| 91,062,248 | |||
| IT Services - 7.4% | |||
| Computer Services, Inc. (b) | 600,000 | 33,000,000 | |
| Concentrix Corp. | 250,000 | 44,420,000 | |
| Genpact Ltd. | 500,000 | 24,675,000 | |
| Poletowin Pitcrew Holdings, Inc. | 136,000 | 1,226,272 | |
| Tucows, Inc. (a)(b) | 125,000 | 10,287,500 | |
| 113,608,772 | |||
| Semiconductors & Semiconductor Equipment - 1.4% | |||
| Cirrus Logic, Inc. (a) | 149,000 | 12,040,690 | |
| CMC Materials, Inc. | 40,000 | 5,134,800 | |
| Ichor Holdings Ltd. (a) | 100,000 | 4,372,000 | |
| 21,547,490 | |||
| Software - 0.2% | |||
| Consensus Cloud Solutions, Inc. (a)(b) | 41,666 | 2,638,708 | |
| Technology Hardware, Storage & Peripherals - 0.4% | |||
| Elecom Co. Ltd. | 340,000 | 5,200,500 | |
| TOTAL INFORMATION TECHNOLOGY | 234,057,718 | ||
| MATERIALS - 5.9% | |||
| Chemicals - 2.8% | |||
| Valvoline, Inc. | 1,250,000 | 42,450,000 | |
| Construction Materials - 2.7% | |||
| Eagle Materials, Inc. | 75,000 | 11,127,000 | |
| RHI Magnesita NV | 300,000 | 13,786,773 | |
| Wienerberger AG | 450,000 | 15,928,524 | |
| 40,842,297 | |||
| Metals & Mining - 0.4% | |||
| ERO Copper Corp. (a) | 350,000 | 6,529,977 | |
| TOTAL MATERIALS | 89,822,274 | ||
| REAL ESTATE - 10.1% | |||
| Equity Real Estate Investment Trusts (REITs) - 4.5% | |||
| CareTrust (REIT), Inc. | 350,000 | 7,262,500 | |
| Corporate Office Properties Trust (SBI) | 500,000 | 13,560,000 | |
| Douglas Emmett, Inc. | 1,100,000 | 35,948,000 | |
| iStar Financial, Inc. | 500,000 | 12,620,000 | |
| 69,390,500 | |||
| Real Estate Management & Development - 5.6% | |||
| Cushman & Wakefield PLC (a)(b) | 2,000,000 | 36,780,000 | |
| Jones Lang LaSalle, Inc. (a) | 190,000 | 49,063,700 | |
| 85,843,700 | |||
| TOTAL REAL ESTATE | 155,234,200 | ||
| UTILITIES - 1.4% | |||
| Gas Utilities - 1.4% | |||
| Brookfield Infrastructure Corp. A Shares | 350,000 | 21,224,000 | |
| TOTAL COMMON STOCKS | |||
| (Cost $1,012,916,377) | 1,507,930,312 | ||
| Money Market Funds - 3.1% | |||
| Fidelity Cash Central Fund 0.06% (d) | 16,587,706 | 16,591,024 | |
| Fidelity Securities Lending Cash Central Fund 0.06% (d)(e) | 31,456,000 | 31,459,145 | |
| TOTAL MONEY MARKET FUNDS | |||
| (Cost $48,050,169) | 48,050,169 | ||
| TOTAL INVESTMENT IN SECURITIES - 101.4% | |||
| (Cost $1,060,966,546) | 1,555,980,481 | ||
| NET OTHER ASSETS (LIABILITIES) - (1.4)% | (21,017,891) | ||
| NET ASSETS - 100% | $1,534,962,590 |
Legend
(a) Non-income producing
(b) Security or a portion of the security is on loan at period end.
(c) Security exempt from registration under Rule 144A of the Securities Act of 1933. These securities may be resold in transactions exempt from registration, normally to qualified institutional buyers. At the end of the period, the value of these securities amounted to $15,120,480 or 1.0% of net assets.
(d) Affiliated fund that is generally available only to investment companies and other accounts managed by Fidelity Investments. The rate quoted is the annualized seven-day yield of the fund at period end. A complete unaudited listing of the fund's holdings as of its most recent quarter end is available upon request. In addition, each Fidelity Central Fund's financial statements are available on the SEC's website or upon request.
(e) Investment made with cash collateral received from securities on loan.
Affiliated Central Funds
Fiscal year to date information regarding the Fund's investments in Fidelity Central Funds, including the ownership percentage, is presented below.
| Fund | Value, beginning of period | Purchases | Sales Proceeds | Dividend Income | Realized Gain/Loss | Change in Unrealized appreciation (depreciation) | Value, end of period | % ownership, end of period |
| Fidelity Cash Central Fund 0.06% | $25,339,770 | $137,135,290 | $145,884,036 | $1,979 | $-- | $-- | $16,591,024 | 0.0% |
| Fidelity Securities Lending Cash Central Fund 0.06% | 29,199,568 | 165,168,245 | 162,908,668 | 24,298 | -- | -- | 31,459,145 | 0.1% |
| Total | $54,539,338 | $302,303,535 | $308,792,704 | $26,277 | $-- | $-- | $48,050,169 |
Amounts in the income column in the above table include any capital gain distributions from underlying funds, which are presented in the corresponding line-item in the Statement of Operations, if applicable. Amount for Fidelity Securities Lending Cash Central Fund represents the income earned on investing cash collateral, less rebates paid to borrowers and any lending agent fees associated with the loan, plus any premium payments received for lending certain types of securities.
Investment Valuation
The following is a summary of the inputs used, as of October 31, 2021, involving the Fund's assets and liabilities carried at fair value. The inputs or methodology used for valuing securities may not be an indication of the risk associated with investing in those securities. For more information on valuation inputs, and their aggregation into the levels used below, please refer to the Investment Valuation section in the accompanying Notes to Financial Statements.
| Valuation Inputs at Reporting Date: | ||||
| Description | Total | Level 1 | Level 2 | Level 3 |
| Investments in Securities: | ||||
| Equities: | ||||
| Communication Services | $50,159,238 | $36,704,495 | $13,454,743 | $-- |
| Consumer Discretionary | 147,914,887 | 147,914,887 | -- | -- |
| Consumer Staples | 20,031,000 | 20,031,000 | -- | -- |
| Energy | 36,355,880 | 36,355,880 | -- | -- |
| Financials | 272,200,750 | 272,200,750 | -- | -- |
| Health Care | 200,161,016 | 200,161,016 | -- | -- |
| Industrials | 280,769,349 | 253,890,691 | 26,878,658 | -- |
| Information Technology | 234,057,718 | 227,630,946 | 6,426,772 | -- |
| Materials | 89,822,274 | 89,822,274 | -- | -- |
| Real Estate | 155,234,200 | 155,234,200 | -- | -- |
| Utilities | 21,224,000 | 21,224,000 | -- | -- |
| Money Market Funds | 48,050,169 | 48,050,169 | -- | -- |
| Total Investments in Securities: | $1,555,980,481 | $1,509,220,308 | $46,760,173 | $-- |
Other Information
Distribution of investments by country or territory of incorporation, as a percentage of Total Net Assets, is as follows (Unaudited):
| United States of America | 76.2% |
| Canada | 6.9% |
| Bermuda | 4.3% |
| Japan | 3.2% |
| Ireland | 3.1% |
| United Kingdom | 2.4% |
| Netherlands | 1.9% |
| Austria | 1.1% |
| Others (Individually Less Than 1%) | 0.9% |
| 100.0% |
See accompanying notes which are an integral part of the financial statements.
Financial Statements
Statement of Assets and Liabilities
| October 31, 2021 (Unaudited) | ||
| Assets | ||
| Investment in securities, at value (including securities loaned of $30,572,989) — See accompanying schedule: Unaffiliated issuers (cost $1,012,916,377) | $1,507,930,312 | |
| Fidelity Central Funds (cost $48,050,169) | 48,050,169 | |
| Total Investment in Securities (cost $1,060,966,546) | $1,555,980,481 | |
| Cash | 1,194 | |
| Receivable for investments sold | 3,288,553 | |
| Receivable for fund shares sold | 10,329,596 | |
| Dividends receivable | 698,716 | |
| Distributions receivable from Fidelity Central Funds | 2,712 | |
| Total assets | 1,570,301,252 | |
| Liabilities | ||
| Payable for investments purchased | $635,750 | |
| Payable for fund shares redeemed | 3,238,270 | |
| Other payables and accrued expenses | 10,466 | |
| Collateral on securities loaned | 31,454,176 | |
| Total liabilities | 35,338,662 | |
| Net Assets | $1,534,962,590 | |
| Net Assets consist of: | ||
| Paid in capital | $946,007,976 | |
| Total accumulated earnings (loss) | 588,954,614 | |
| Net Assets | $1,534,962,590 | |
| Net Asset Value, offering price and redemption price per share ($1,534,962,590 ÷ 104,553,161 shares) | $14.68 |
See accompanying notes which are an integral part of the financial statements.
Statement of Operations
| Six months ended October 31, 2021 (Unaudited) | ||
| Investment Income | ||
| Dividends | $7,077,540 | |
| Income from Fidelity Central Funds (including $24,298 from security lending) | 26,277 | |
| Total income | 7,103,817 | |
| Expenses | ||
| Custodian fees and expenses | $10,467 | |
| Independent trustees' fees and expenses | 2,744 | |
| Interest | 357 | |
| Total expenses before reductions | 13,568 | |
| Expense reductions | (2) | |
| Total expenses after reductions | 13,566 | |
| Net investment income (loss) | 7,090,251 | |
| Realized and Unrealized Gain (Loss) | ||
| Net realized gain (loss) on: | ||
| Investment securities: | ||
| Unaffiliated issuers | 87,482,363 | |
| Foreign currency transactions | 9,556 | |
| Total net realized gain (loss) | 87,491,919 | |
| Change in net unrealized appreciation (depreciation) on: | ||
| Investment securities: | ||
| Unaffiliated issuers | 11,655,698 | |
| Assets and liabilities in foreign currencies | (23,095) | |
| Total change in net unrealized appreciation (depreciation) | 11,632,603 | |
| Net gain (loss) | 99,124,522 | |
| Net increase (decrease) in net assets resulting from operations | $106,214,773 |
See accompanying notes which are an integral part of the financial statements.
Statement of Changes in Net Assets
| Six months ended October 31, 2021 (Unaudited) | Year ended April 30, 2021 | |
| Increase (Decrease) in Net Assets | ||
| Operations | ||
| Net investment income (loss) | $7,090,251 | $14,474,209 |
| Net realized gain (loss) | 87,491,919 | 228,816,940 |
| Change in net unrealized appreciation (depreciation) | 11,632,603 | 565,350,903 |
| Net increase (decrease) in net assets resulting from operations | 106,214,773 | 808,642,052 |
| Distributions to shareholders | (152,144,723) | (39,141,065) |
| Share transactions | ||
| Proceeds from sales of shares | 42,783,234 | 57,902,454 |
| Reinvestment of distributions | 152,144,723 | 39,141,065 |
| Cost of shares redeemed | (124,590,900) | (508,195,446) |
| Net increase (decrease) in net assets resulting from share transactions | 70,337,057 | (411,151,927) |
| Total increase (decrease) in net assets | 24,407,107 | 358,349,060 |
| Net Assets | ||
| Beginning of period | 1,510,555,483 | 1,152,206,423 |
| End of period | $1,534,962,590 | $1,510,555,483 |
| Other Information | ||
| Shares | ||
| Sold | 2,972,220 | 4,810,989 |
| Issued in reinvestment of distributions | 10,867,480 | 3,244,336 |
| Redeemed | (8,637,894) | (40,612,429) |
| Net increase (decrease) | 5,201,806 | (32,557,104) |
See accompanying notes which are an integral part of the financial statements.
Financial Highlights
Fidelity Series Small Cap Discovery Fund
| Six months ended (Unaudited) October 31, | Years endedApril 30, | |||||
| 2021 | 2021 | 2020 | 2019 | 2018 | 2017 | |
| Selected Per–Share Data | ||||||
| Net asset value, beginning of period | $15.20 | $8.73 | $11.70 | $12.40 | $11.69 | $10.16 |
| Income from Investment Operations | ||||||
| Net investment income (loss)A | .07 | .12 | .15 | .20B | .14 | .09C |
| Net realized and unrealized gain (loss) | .96 | 6.68 | (2.35) | .59 | .71 | 1.49 |
| Total from investment operations | 1.03 | 6.80 | (2.20) | .79 | .85 | 1.58 |
| Distributions from net investment income | (.03) | (.12) | (.16) | (.19) | (.14) | (.05) |
| Distributions from net realized gain | (1.52) | (.21) | (.61) | (1.30) | – | – |
| Total distributions | (1.55) | (.33) | (.77) | (1.49) | (.14) | (.05) |
| Net asset value, end of period | $14.68 | $15.20 | $8.73 | $11.70 | $12.40 | $11.69 |
| Total ReturnD,E | 7.25% | 78.91% | (20.16)% | 7.68% | 7.33% | 15.60% |
| Ratios to Average Net AssetsF,G | ||||||
| Expenses before reductions | - %H,I | - %I | - %I | - %I | .06% | .87% |
| Expenses net of fee waivers, if any | - %H,I | - %I | - %I | - %I | .06% | .87% |
| Expenses net of all reductions | - %H,I | - %I | - %I | - %I | .05% | .86% |
| Net investment income (loss) | .93%H | 1.03% | 1.38% | 1.73%B | 1.15% | .80%C |
| Supplemental Data | ||||||
| Net assets, end of period (000 omitted) | $1,534,963 | $1,510,555 | $1,152,206 | $1,707,498 | $1,714,454 | $652,818 |
| Portfolio turnover rateJ | 14%H | 28% | 51% | 41% | 44% | 24% |
A Calculated based on average shares outstanding during the period.
B Net investment income per share reflects one or more large, non-recurring dividend(s) which amounted to $.02 per share. Excluding such non-recurring dividend(s), the ratio of net investment income (loss) to average net assets would have been 1.54%.
C Net investment income per share reflects one or more large, non-recurring dividend(s) which amounted to $.04 per share. Excluding such non-recurring dividend(s), the ratio of net investment income (loss) to average net assets would have been .40%.
D Total returns for periods of less than one year are not annualized.
E Total returns would have been lower if certain expenses had not been reduced during the applicable periods shown.
F Fees and expenses of any underlying mutual funds or exchange-traded funds (ETFs) are not included in the Fund's expense ratio. The Fund indirectly bears its proportionate share of these expenses. For additional expense information related to investments in Fidelity Central Funds, please refer to the "Investments in Fidelity Central Funds" note found in the Notes to Financial Statements section of the most recent Annual or Semi-Annual report.
G Expense ratios reflect operating expenses of the class. Expenses before reductions do not reflect amounts reimbursed, waived, or reduced through arrangements with the investment adviser, brokerage services, or other offset arrangements, if applicable, and do not represent the amount paid by the class during periods when reimbursements, waivers or reductions occur.
H Annualized
I Amount represents less than .005%.
J Amount does not include the portfolio activity of any underlying mutual funds or exchange-traded funds (ETFs).
See accompanying notes which are an integral part of the financial statements.
Notes to Financial Statements (Unaudited)
For the period ended October 31, 2021
1. Organization.
Fidelity Series Small Cap Discovery Fund (the Fund) is a fund of Fidelity Concord Street Trust (the Trust) and is authorized to issue an unlimited number of shares. Shares are offered only to certain other Fidelity funds and Fidelity managed 529 plans. The Trust is registered under the Investment Company Act of 1940, as amended (the 1940 Act), as an open-end management investment company organized as a Massachusetts business trust.
2. Investments in Fidelity Central Funds.
Funds may invest in Fidelity Central Funds, which are open-end investment companies generally available only to other investment companies and accounts managed by the investment adviser and its affiliates. The Schedule of Investments lists any Fidelity Central Funds held as an investment as of period end, but does not include the underlying holdings of each Fidelity Central Fund. An investing fund indirectly bears its proportionate share of the expenses of the underlying Fidelity Central Funds.
Based on its investment objective, each Fidelity Central Fund may invest or participate in various investment vehicles or strategies that are similar to those of the investing fund. These strategies are consistent with the investment objectives of the investing fund and may involve certain economic risks which may cause a decline in value of each of the Fidelity Central Funds and thus a decline in the value of the investing fund.
| Fidelity Central Fund | Investment Manager | Investment Objective | Investment Practices | Expense Ratio(a) |
| Fidelity Money Market Central Funds | Fidelity Management & Research Company LLC (FMR) | Each fund seeks to obtain a high level of current income consistent with the preservation of capital and liquidity. | Short-term Investments | Less than .005% |
(a) Expenses expressed as a percentage of average net assets and are as of each underlying Central Fund's most recent annual or semi-annual shareholder report.
A complete unaudited list of holdings for each Fidelity Central Fund is available upon request or at the Securities and Exchange Commission website at www.sec.gov. In addition, the financial statements of the Fidelity Central Funds which contain the significant accounting policies (including investment valuation policies) of those funds, and are not covered by the Report of Independent Registered Public Accounting Firm, are available on the Securities and Exchange Commission website or upon request.
3. Significant Accounting Policies.
The Fund is an investment company and applies the accounting and reporting guidance of the Financial Accounting Standards Board (FASB) Accounting Standards Codification Topic 946 Financial Services - Investment Companies. The financial statements have been prepared in conformity with accounting principles generally accepted in the United States of America (GAAP), which require management to make certain estimates and assumptions at the date of the financial statements. Actual results could differ from those estimates. Subsequent events, if any, through the date that the financial statements were issued have been evaluated in the preparation of the financial statements. The Fund's Schedule of Investments lists any underlying mutual funds or exchange-traded funds (ETFs) but does not include the underlying holdings of these funds. The following summarizes the significant accounting policies of the Fund:
Investment Valuation. Investments are valued as of 4:00 p.m. Eastern time on the last calendar day of the period. The Board of Trustees (the Board) has delegated the day to day responsibility for the valuation of the Fund's investments to the Fair Value Committee (the Committee) established by the Fund's investment adviser. In accordance with valuation policies and procedures approved by the Board, the Fund attempts to obtain prices from one or more third party pricing vendors or brokers to value its investments. When current market prices, quotations or currency exchange rates are not readily available or reliable, investments will be fair valued in good faith by the Committee, in accordance with procedures adopted by the Board. Factors used in determining fair value vary by investment type and may include market or investment specific events. The frequency with which these procedures are used cannot be predicted and they may be utilized to a significant extent. The Committee oversees the Fund's valuation policies and procedures and reports to the Board on the Committee's activities and fair value determinations. The Board monitors the appropriateness of the procedures used in valuing the Fund's investments and ratifies the fair value determinations of the Committee.
The Fund categorizes the inputs to valuation techniques used to value its investments into a disclosure hierarchy consisting of three levels as shown below:
- Level 1 – quoted prices in active markets for identical investments
- Level 2 – other significant observable inputs (including quoted prices for similar investments, interest rates, prepayment speeds, etc.)
- Level 3 – unobservable inputs (including the Fund's own assumptions based on the best information available)
Valuation techniques used to value the Fund's investments by major category are as follows:
Equity securities, including restricted securities, for which market quotations are readily available, are valued at the last reported sale price or official closing price as reported by a third party pricing vendor on the primary market or exchange on which they are traded and are categorized as Level 1 in the hierarchy. In the event there were no sales during the day or closing prices are not available, securities are valued at the last quoted bid price or may be valued using the last available price and are generally categorized as Level 2 in the hierarchy. For foreign equity securities, when market or security specific events arise, comparisons to the valuation of American Depositary Receipts (ADRs), futures contracts, Exchange-Traded Funds (ETFs) and certain indexes as well as quoted prices for similar securities may be used and would be categorized as Level 2 in the hierarchy. For equity securities, including restricted securities, where observable inputs are limited, assumptions about market activity and risk are used and these securities may be categorized as Level 3 in the hierarchy.
Investments in open-end mutual funds, including the Fidelity Central Funds, are valued at their closing net asset value (NAV) each business day and are categorized as Level 1 in the hierarchy.
Changes in valuation techniques may result in transfers in or out of an assigned level within the disclosure hierarchy. The aggregate value of investments by input level as of October 31, 2021 is included at the end of the Fund's Schedule of Investments.
Foreign Currency. Certain Funds may use foreign currency contracts to facilitate transactions in foreign-denominated securities. Gains and losses from these transactions may arise from changes in the value of the foreign currency or if the counterparties do not perform under the contracts' terms.
Foreign-denominated assets, including investment securities, and liabilities are translated into U.S. dollars at the exchange rates at period end. Purchases and sales of investment securities, income and dividends received, and expenses denominated in foreign currencies are translated into U.S. dollars at the exchange rate in effect on the transaction date.
The effects of exchange rate fluctuations on investments are included with the net realized and unrealized gain (loss) on investment securities. Other foreign currency transactions resulting in realized and unrealized gain (loss) are disclosed separately.
Investment Transactions and Income. For financial reporting purposes, the Fund's investment holdings and NAV include trades executed through the end of the last business day of the period. The NAV per share for processing shareholder transactions is calculated as of the close of business of the New York Stock Exchange (NYSE), normally 4:00 p.m. Eastern time and includes trades executed through the end of the prior business day. Gains and losses on securities sold are determined on the basis of identified cost and include proceeds received from litigation. Commissions paid to certain brokers with whom the investment adviser, or its affiliates, places trades on behalf of a fund include an amount in addition to trade execution, which may be rebated back to a fund. Any such rebates are included in net realized gain (loss) on investments in the Statement of Operations. Dividend income is recorded on the ex-dividend date, except for certain dividends from foreign securities where the ex-dividend date may have passed, which are recorded as soon as the Fund is informed of the ex-dividend date. Non-cash dividends included in dividend income, if any, are recorded at the fair market value of the securities received. Income and capital gain distributions from Fidelity Central Funds, if any, are recorded on the ex-dividend date. Certain distributions received by the Fund represent a return of capital or capital gain. The Fund determines the components of these distributions subsequent to the ex-dividend date, based upon receipt of tax filings or other correspondence relating to the underlying investment. These distributions are recorded as a reduction of cost of investments and/or as a realized gain. Investment income is recorded net of foreign taxes withheld where recovery of such taxes is uncertain. Funds may file withholding tax reclaims in certain jurisdictions to recover a portion of amounts previously withheld. Any withholding tax reclaims income is included in the Statement of Operations in dividends. Any receivables for withholding tax reclaims are included in the Statement of Assets and Liabilities in dividends receivable.
Expenses. Expenses directly attributable to a fund are charged to that fund. Expenses attributable to more than one fund are allocated among the respective funds on the basis of relative net assets or other appropriate methods. Expenses included in the accompanying financial statements reflect the expenses of that fund and do not include any expenses associated with any underlying mutual funds or exchange-traded funds. Although not included in a fund's expenses, a fund indirectly bears its proportionate share of these expenses through the net asset value of each underlying mutual fund or exchange-traded fund. Expense estimates are accrued in the period to which they relate and adjustments are made when actual amounts are known.
Income Tax Information and Distributions to Shareholders. Each year, the Fund intends to qualify as a regulated investment company under Subchapter M of the Internal Revenue Code, including distributing substantially all of its taxable income and realized gains. As a result, no provision for U.S. Federal income taxes is required. The Fund files a U.S. federal tax return, in addition to state and local tax returns as required. The Fund's federal income tax returns are subject to examination by the Internal Revenue Service (IRS) for a period of three fiscal years after they are filed. State and local tax returns may be subject to examination for an additional fiscal year depending on the jurisdiction. Foreign taxes are provided for based on the Fund's understanding of the tax rules and rates that exist in the foreign markets in which it invests.
Distributions are declared and recorded on the ex-dividend date. Income and capital gain distributions are determined in accordance with income tax regulations, which may differ from GAAP.
Capital accounts within the financial statements are adjusted for permanent book-tax differences. These adjustments have no impact on net assets or the results of operations. Capital accounts are not adjusted for temporary book-tax differences which will reverse in a subsequent period.
Book-tax differences are primarily due to foreign currency transactions, losses deferred due to wash sales and excise tax regulations.
As of period end, the cost and unrealized appreciation (depreciation) in securities, and derivatives if applicable, for federal income tax purposes were as follows:
| Gross unrealized appreciation | $557,149,171 |
| Gross unrealized depreciation | (62,609,208) |
| Net unrealized appreciation (depreciation) | $494,539,963 |
| Tax cost | $1,061,440,518 |
Restricted Securities (including Private Placements). Funds may invest in securities that are subject to legal or contractual restrictions on resale. These securities generally may be resold in transactions exempt from registration or to the public if the securities are registered. Disposal of these securities may involve time-consuming negotiations and expense, and prompt sale at an acceptable price may be difficult. Information regarding restricted securities held at period end is included at the end of the Schedule of Investments, if applicable.
4. Purchases and Sales of Investments.
Purchases and sales of securities, other than short-term securities and in-kind transactions, as applicable, are noted in the table below.
| Purchases ($) | Sales ($) | |
| Fidelity Series Small Cap Discovery Fund | 106,948,335 | 207,514,679 |
5. Fees and Other Transactions with Affiliates.
Management Fee. Fidelity Management & Research Company LLC (the investment adviser) and its affiliates provide the Fund with investment management related services for which the Fund does not pay a management fee. Under the management contract, the investment adviser or an affiliate pays all ordinary operating expenses of the Fund, except custody fees, fees and expenses of the independent Trustees, and certain miscellaneous expenses such as proxy and shareholder meeting expenses.
Brokerage Commissions. A portion of portfolio transactions were placed with brokerage firms which are affiliates of the investment adviser. Brokerage commissions are included in net realized gain (loss) and change in net unrealized appreciation (depreciation) in the Statement of Operations. The commissions paid to these affiliated firms were as follows:
| Amount | |
| Fidelity Series Small Cap Discovery Fund | $3,976 |
Interfund Lending Program. Pursuant to an Exemptive Order issued by the Securities and Exchange Commission (the SEC), the Fund, along with other registered investment companies having management contracts with Fidelity Management & Research Company LLC (FMR), or other affiliated entities of FMR, may participate in an interfund lending program. This program provides an alternative credit facility allowing the Fund to borrow from, or lend money to, other participating affiliated funds. At period end, there were no interfund loans outstanding. Activity in this program during the period for which loans were outstanding was as follows:
| Borrower or Lender | Average Loan Balance | Weighted Average Interest Rate | Interest Expense | |
| Fidelity Series Small Cap Discovery Fund | Borrower | $7,033,000 | .30% | $357 |
Interfund Trades. Funds may purchase from or sell securities to other Fidelity Funds under procedures adopted by the Board. The procedures have been designed to ensure these interfund trades are executed in accordance with Rule 17a-7 of the 1940 Act. Any interfund trades are included within the respective purchases and sales amounts shown in the Purchases and Sales of Investments note. Interfund trades during the period are noted in the table below.
| Purchases ($) | Sales ($) | Realized Gain (Loss) ($) | |
| Fidelity Series Small Cap Discovery Fund | 24,013,145 | 6,371,980 | 4,138,301 |
6. Committed Line of Credit.
Certain Funds participate with other funds managed by the investment adviser or an affiliate in a $4.25 billion credit facility (the "line of credit") to be utilized for temporary or emergency purposes to fund shareholder redemptions or for other short-term liquidity purposes. The commitment fees on the pro-rata portion of the line of credit are borne by the investment adviser. During the period, there were no borrowings on this line of credit.
7. Security Lending.
Funds lend portfolio securities from time to time in order to earn additional income. Lending agents are used, including National Financial Services (NFS), an affiliate of the investment adviser. Pursuant to a securities lending agreement, NFS will receive a fee, which is capped at 9.9% of a fund's daily lending revenue, for its services as lending agent. A fund may lend securities to certain qualified borrowers, including NFS. On the settlement date of the loan, a fund receives collateral (in the form of U.S. Treasury obligations, letters of credit and/or cash) against the loaned securities and maintains collateral in an amount not less than 100% of the market value of the loaned securities during the period of the loan. The market value of the loaned securities is determined at the close of business of a fund and any additional required collateral is delivered to a fund on the next business day. A fund or borrower may terminate the loan at any time, and if the borrower defaults on its obligation to return the securities loaned because of insolvency or other reasons, a fund may apply collateral received from the borrower against the obligation. A fund may experience delays and costs in recovering the securities loaned. Any cash collateral received is invested in the Fidelity Securities Lending Cash Central Fund. Any loaned securities are identified as such in the Schedule of Investments, and the value of loaned securities and cash collateral at period end, as applicable, are presented in the Statement of Assets and Liabilities. Security lending income represents the income earned on investing cash collateral, less rebates paid to borrowers and any lending agent fees associated with the loan, plus any premium payments received for lending certain types of securities. Security lending income is presented in the Statement of Operations as a component of income from Fidelity Central Funds. Affiliated security lending activity, if any, was as follows:
| Total Security Lending Fees Paid to NFS | Security Lending Income From Securities Loaned to NFS | Value of Securities Loaned to NFS at Period End | |
| Fidelity Series Small Cap Discovery Fund | $2,547 | $313 | $– |
8. Expense Reductions.
Through arrangements with the Fund's custodian, credits realized as a result of certain uninvested cash balances were used to reduce the Fund's expenses by $2.
9. Other.
Fund's organizational documents provide former and current trustees and officers with a limited indemnification against liabilities arising in connection with the performance of their duties to the fund. In the normal course of business, the fund may also enter into contracts that provide general indemnifications. The fund's maximum exposure under these arrangements is unknown as this would be dependent on future claims that may be made against the fund. The risk of material loss from such claims is considered remote.
At the end of the period, mutual funds and accounts managed by the investment adviser or its affiliates were the owners of record of all of the outstanding shares of the Fund.
10. Coronavirus (COVID-19) Pandemic.
An outbreak of COVID-19 first detected in China during December 2019 has since spread globally and was declared a pandemic by the World Health Organization during March 2020. Developments that disrupt global economies and financial markets, such as the COVID-19 pandemic, may magnify factors that affect the Fund's performance.
Shareholder Expense Example
As a shareholder, you incur two types of costs: (1) transaction costs, which may include sales charges (loads) on purchase payments or redemption proceeds, as applicable and (2) ongoing costs, which generally include management fees, distribution and/or service (12b-1) fees and other Fund expenses. This Example is intended to help you understand your ongoing costs (in dollars) of investing in a fund and to compare these costs with the ongoing costs of investing in other mutual funds.
The Example is based on an investment of $1,000 invested at the beginning of the period and held for the entire period (May 1, 2021 to October 31, 2021).
Actual Expenses
The first line of the accompanying table provides information about actual account values and actual expenses. You may use the information in this line, together with the amount you invested, to estimate the expenses that you paid over the period. Simply divide your account value by $1,000.00 (for example, an $8,600 account value divided by $1,000.00 = 8.6), then multiply the result by the number in the first line for a class/Fund under the heading entitled "Expenses Paid During Period" to estimate the expenses you paid on your account during this period. If any fund is a shareholder of any underlying mutual funds or exchange-traded funds (ETFs) (the Underlying Funds), such fund indirectly bears its proportional share of the expenses of the Underlying Funds in addition to the direct expenses incurred presented in the table. These fees and expenses are not included in the annualized expense ratio used to calculate the expense estimate in the table below.
Hypothetical Example for Comparison Purposes
The second line of the accompanying table provides information about hypothetical account values and hypothetical expenses based on the actual expense ratio and an assumed rate of return of 5% per year before expenses, which is not the actual return. The hypothetical account values and expenses may not be used to estimate the actual ending account balance or expenses you paid for the period. You may use this information to compare the ongoing costs of investing in the Fund and other funds. To do so, compare this 5% hypothetical example with the 5% hypothetical examples that appear in the shareholder reports of the other funds. If any fund is a shareholder of any Underlying Funds, such fund indirectly bears its proportional share of the expenses of the Underlying Funds in addition to the direct expenses as presented in the table. These fees and expenses are not included in the annualized expense ratio used to calculate the expense estimate in the table below.
Please note that the expenses shown in the table are meant to highlight your ongoing costs only and do not reflect any transaction costs. Therefore, the second line of the table is useful in comparing ongoing costs only, and will not help you determine the relative total costs of owning different funds. In addition, if these transactional costs were included, your costs would have been higher.
| Annualized Expense Ratio-A | Beginning Account Value May 1, 2021 | Ending Account Value October 31, 2021 | Expenses Paid During Period-B May 1, 2021 to October 31, 2021 | |
| Fidelity Series Small Cap Discovery Fund | - %-C | |||
| Actual | $1,000.00 | $1,072.50 | $--D | |
| Hypothetical-E | $1,000.00 | $1,025.21 | $--D |
A Annualized expense ratio reflects expenses net of applicable fee waivers.
B Expenses are equal to the annualized expense ratio, multiplied by the average account value over the period, multiplied by 184/ 365 (to reflect the one-half year period). The fees and expenses of any Underlying Funds are not included in each annualized expense ratio.
C Amount represents less than .005%.
D Amount represents less than $.005.
E 5% return per year before expenses
Board Approval of Investment Advisory Contracts and Management Fees
Fidelity Series Small Cap Discovery Fund
Each year, the Board of Trustees, including the Independent Trustees (together, the Board), votes on the renewal of the management contract with Fidelity Management & Research Company LLC (FMR) and the sub-advisory agreements (together, the Advisory Contracts) for the fund. FMR and the sub-advisers are referred to herein as the Investment Advisers. The Board, assisted by the advice of fund counsel and Independent Trustees' counsel, requests and considers a broad range of information relevant to the renewal of the Advisory Contracts throughout the year.The Board meets regularly and, at each of its meetings, covers an extensive agenda of topics and materials and considers factors that are relevant to its annual consideration of the renewal of the fund's Advisory Contracts, including the services and support provided to the fund and its shareholders. The Board has established various standing committees (Committees), each composed of and chaired by Independent Trustees with varying backgrounds, to which the Board has assigned specific subject matter responsibilities in order to enhance effective decision-making by the Board. The Board, acting directly and through its Committees, requests and receives information concerning the annual consideration of the renewal of the fund's Advisory Contracts. The Board also meets as needed to review matters specifically related to the Board's annual consideration of the renewal of the Advisory Contracts. Members of the Board may also meet with trustees of other Fidelity funds through joint ad hoc committees to discuss certain matters relevant to all of the Fidelity funds.At its May 2021 meeting, the Board unanimously determined to renew the fund's Advisory Contracts. In considering whether to renew the Advisory Contracts for the fund, the Board considered all factors it believed relevant and reached a determination, with the assistance of fund counsel and Independent Trustees' counsel and through the exercise of its business judgment, that the renewal of the Advisory Contracts was in the best interests of the fund and its shareholders and the fact that no fee is payable under the management contract was fair and reasonable.Nature, Extent, and Quality of Services Provided. The Board considered Fidelity's staffing as it relates to the fund, including the backgrounds of investment personnel of Fidelity, and also considered the fund's investment objective, strategies, and related investment philosophy. The Independent Trustees also had discussions with senior management of Fidelity's investment operations and investment groups. The Board considered the structure of the investment personnel compensation program and whether this structure provides appropriate incentives to act in the best interests of the fund.Resources Dedicated to Investment Management and Support Services. The Board and the Fund Oversight and Research Committees reviewed the general qualifications and capabilities of Fidelity's investment staff, including its size, education, experience, and resources, as well as Fidelity's approach to recruiting, training, managing, and compensating investment personnel. The Board noted that Fidelity has continued to increase the resources devoted to non-U.S. offices, including expansion of Fidelity's global investment organization. The Board also noted that Fidelity's analysts have extensive resources, tools and capabilities that allow them to conduct sophisticated quantitative and fundamental analysis, as well as credit analysis of issuers, counterparties and guarantors. Further, the Board considered that Fidelity's investment professionals have sufficient access to global information and data so as to provide competitive investment results over time, and that those professionals also have access to sophisticated tools that permit them to assess portfolio construction and risk and performance attribution characteristics continuously, as well as to transmit new information and research conclusions rapidly around the world. Additionally, in its deliberations, the Board considered Fidelity's trading, risk management, compliance, and technology and operations capabilities and resources, which are integral parts of the investment management process. The Board also considered Fidelity's investments in business continuity planning, and its success in continuously providing services to the fund notwithstanding the severe disruptions caused by the COVID-19 pandemic.Administrative Services. The Board considered (i) the nature, extent, quality, and cost of advisory and administrative services performed by the Investment Advisers and their affiliates under the Advisory Contracts and under separate agreements covering transfer agency, pricing and bookkeeping, and securities lending services for the fund; (ii) the nature and extent of the supervision of third party service providers, principally custodians, subcustodians, and pricing vendors; and (iii) the resources devoted to, and the record of compliance with, the fund's compliance policies and procedures. The Board also reviewed the allocation of fund brokerage, including allocations to brokers affiliated with the Investment Advisers, the use of brokerage commissions to pay fund expenses, and the use of "soft" commission dollars to pay for research services.Investment Performance. The Board considered whether the fund has operated in accordance with its investment objective, as well as its record of compliance with its investment restrictions. The Board reviewed the fund's absolute investment performance, as well as the fund's relative investment performance, but did not consider performance to be a material factor in its decision to renew the fund's Advisory Contracts, as the fund is not publicly offered as a stand-alone investment product. In this regard, the Board noted that the fund is designed to offer an investment option for other investment companies and 529 plans managed by Fidelity and ultimately to enhance the performance of those investment companies and 529 plans.Based on its review, the Board concluded that the nature, extent, and quality of services provided to the fund under the Advisory Contracts should continue to benefit the shareholders of the fund.Competitiveness of Management Fee and Total Expense Ratio. The Board considered that the fund does not pay FMR a management fee for investment advisory services, but that FMR receives fees for providing services to funds that invest in the fund. The Board noted that FMR or an affiliate undertakes to pay all operating expenses of the fund, except transfer agent fees, 12b-1 fees, Independent Trustee fees and expenses, custodian fees and expenses, proxy and shareholder meeting expenses, interest, taxes, and extraordinary expenses (such as litigation expenses). The Board further noted that the fund pays its non-operating expenses, including brokerage commissions and fees and expenses associated with the fund's securities lending program, if applicable.The Board further considered that FMR has contractually agreed to reimburse the fund to the extent that total operating expenses, with certain exceptions, as a percentage of its average net assets, exceed 0.003% through August 31, 2023.Based on its review, the Board considered that the fund does not pay a management fee and concluded that the total expense ratio of each class of the fund was reasonable in light of the services that the fund and its shareholders receive and the other factors considered.Costs of the Services and Profitability. The Board considered the level of Fidelity's profits in respect of all the Fidelity funds.A public accounting firm has been engaged annually by the Board as part of the Board's assessment of Fidelity's profitability analysis. The engagement includes the review and assessment of the methodologies used by Fidelity in determining the revenues and expenses attributable to Fidelity's mutual fund business, and completion of agreed-upon procedures in respect of the mathematical accuracy of certain fund profitability information and its conformity to established allocation methodologies. After considering the reports issued under the engagement and information provided by Fidelity, the Board concluded that while other allocation methods may also be reasonable, Fidelity's profitability methodologies are reasonable in all material respects.The Board also reviewed Fidelity's non-fund businesses and potential indirect benefits such businesses may have received as a result of their association with Fidelity's mutual fund business (i.e., fall-out benefits) as well as cases where Fidelity's affiliates may benefit from the funds' business. The Board considered areas where potential indirect benefits to the Fidelity funds from their relationships with Fidelity may exist. The Board also considered that in 2019 a joint ad hoc committee created by it and the boards of other Fidelity funds evaluated potential fall-out benefits (PFOB Committee). The Board noted that it considered the PFOB Committee's findings in connection with its consideration of the renewal of the Advisory Contracts.The Board concluded that the costs of the services provided by and the profits realized by Fidelity in connection with the operation of the fund were not relevant to the renewal of the Advisory Contracts because the fund pays no advisory fees and FMR bears all expenses of the fund with certain exceptions.Economies of Scale. The Board concluded that because the fund pays no advisory fees and FMR bears all expenses of the fund with certain exceptions, the realization of economies of scale was not a material factor in the Board's decision to renew the fund's Advisory Contracts.Additional Information Requested by the Board. In order to develop fully the factual basis for consideration of the Fidelity funds' advisory contracts, the Board requested and received additional information on certain topics, including: (i) fund flow and performance trends, in particular the underperformance of certain funds and strategies, and Fidelity's long-term strategies for certain funds; (ii) consideration of expanding the use of performance fees for additional funds; (iii) Fidelity's pricing philosophy compared to competitors; (iv) metrics for evaluating index fund and ETF performance and information about ETF trading characteristics; (v) the methodology with respect to evaluating competitive fund data and peer group classifications and fee and expense comparisons; (vi) the expense structures for different funds and classes and information about the differences between various expense structures; (vii) group fee breakpoints; (viii) information regarding other accounts managed by Fidelity and sub-advisory arrangements; and (ix) Fidelity's philosophies and strategies for evaluating funds and classes with lower or declining asset levels.Based on its evaluation of all of the conclusions noted above, and after considering all factors it believed relevant, the Board concluded that the advisory fee arrangements are fair and reasonable, and that the fund's Advisory Contracts should be renewed.![]()
XS4-SANN-1221
1.968032.107
Fidelity® Large Cap Stock K6 Fund
Semi-Annual Report
October 31, 2021
Contents
Board Approval of Investment Advisory Contracts and Management Fees |
To view a fund's proxy voting guidelines and proxy voting record for the 12-month period ended June 30, visit http://www.fidelity.com/proxyvotingresults or visit the Securities and Exchange Commission's (SEC) web site at http://www.sec.gov.
You may also call 1-800-835-5092 to request a free copy of the proxy voting guidelines.
Standard & Poor's, S&P and S&P 500 are registered service marks of The McGraw-Hill Companies, Inc. and have been licensed for use by Fidelity Distributors Corporation.
Other third-party marks appearing herein are the property of their respective owners.
All other marks appearing herein are registered or unregistered trademarks or service marks of FMR LLC or an affiliated company. © 2021 FMR LLC. All rights reserved.
This report and the financial statements contained herein are submitted for the general information of the shareholders of the Fund. This report is not authorized for distribution to prospective investors in the Fund unless preceded or accompanied by an effective prospectus.
A fund files its complete schedule of portfolio holdings with the SEC for the first and third quarters of each fiscal year on Form N-PORT. Forms N-PORT are available on the SEC’s web site at http://www.sec.gov. A fund's Forms N-PORT may be reviewed and copied at the SEC’s Public Reference Room in Washington, DC. Information regarding the operation of the SEC's Public Reference Room may be obtained by calling 1-800-SEC-0330.
For a complete list of a fund's portfolio holdings, view the most recent holdings listing, semiannual report, or annual report on Fidelity's web site at http://www.fidelity.com, http://www.institutional.fidelity.com, or http://www.401k.com, as applicable.
NOT FDIC INSURED •MAY LOSE VALUE •NO BANK GUARANTEE
Neither the Fund nor Fidelity Distributors Corporation is a bank.
Note to Shareholders:
Early in 2020, the outbreak and spread of COVID-19 emerged as a public health emergency that had a major influence on financial markets, primarily based on its impact on the global economy and corporate earnings. On March 11, 2020, the World Health Organization declared the COVID-19 outbreak a pandemic, citing sustained risk of further global spread. The pandemic prompted a number of measures to limit the spread of COVID-19, including travel and border restrictions, quarantines, and restrictions on large gatherings. In turn, these resulted in lower consumer activity, diminished demand for a wide range of products and services, disruption in manufacturing and supply chains, and – given the wide variability in outcomes regarding the outbreak – significant market uncertainty and volatility. To help stem the turmoil, the U.S. government took unprecedented action – in concert with the U.S. Federal Reserve and central banks around the world – to help support consumers, businesses, and the broader economy, and to limit disruption to the financial system.
In general, the overall impact of the pandemic lessened in 2021, amid a resilient economy and widespread distribution of three COVID-19 vaccines granted emergency use authorization from the U.S. Food and Drug Administration (FDA) early in the year. Still, the situation remains dynamic, and the extent and duration of its influence on financial markets and the economy is highly uncertain, due in part to a recent spike in cases based on highly contagious variants of the coronavirus.
Extreme events such as the COVID-19 crisis are exogenous shocks that can have significant adverse effects on mutual funds and their investments. Although multiple asset classes may be affected by market disruption, the duration and impact may not be the same for all types of assets. Fidelity is committed to helping you stay informed amid news about COVID-19 and during increased market volatility, and we continue to take extra steps to be responsive to customer needs. We encourage you to visit us online, where we offer ongoing updates, commentary, and analysis on the markets and our funds.
Investment Summary (Unaudited)
Top Ten Stocks as of October 31, 2021
| % of fund's net assets | |
| Microsoft Corp. | 7.0 |
| General Electric Co. | 6.6 |
| Wells Fargo & Co. | 5.1 |
| Exxon Mobil Corp. | 4.6 |
| Bank of America Corp. | 3.9 |
| Apple, Inc. | 3.1 |
| Comcast Corp. Class A | 2.8 |
| Altria Group, Inc. | 2.2 |
| United Parcel Service, Inc. Class B | 1.9 |
| Hess Corp. | 1.7 |
| 38.9 |
Top Five Market Sectors as of October 31, 2021
| % of fund's net assets | |
| Financials | 19.1 |
| Information Technology | 18.6 |
| Industrials | 15.4 |
| Health Care | 12.9 |
| Energy | 8.7 |
Asset Allocation (% of fund's net assets)
| As of October 31, 2021* | ||
| Stocks | 96.9% | |
| Short-Term Investments and Net Other Assets (Liabilities) | 3.1% | |

* Foreign investments - 10.0%
Schedule of Investments October 31, 2021 (Unaudited)
Showing Percentage of Net Assets
| Common Stocks - 96.8% | |||
| Shares | Value | ||
| COMMUNICATION SERVICES - 8.2% | |||
| Diversified Telecommunication Services - 0.4% | |||
| Cellnex Telecom SA (a) | 900 | $55,328 | |
| Verizon Communications, Inc. | 4,808 | 254,776 | |
| 310,104 | |||
| Entertainment - 2.0% | |||
| Activision Blizzard, Inc. | 2,262 | 176,866 | |
| Nintendo Co. Ltd. ADR | 3,272 | 180,778 | |
| The Walt Disney Co. (b) | 4,695 | 793,784 | |
| Universal Music Group NV | 14,871 | 431,749 | |
| 1,583,177 | |||
| Interactive Media & Services - 2.5% | |||
| Alphabet, Inc.: | |||
| Class A (b) | 282 | 834,979 | |
| Class C (b) | 251 | 744,318 | |
| Match Group, Inc. (b) | 1,276 | 192,395 | |
| Meta Platforms, Inc. Class A (b) | 840 | 271,799 | |
| Snap, Inc. Class A (b) | 300 | 15,774 | |
| 2,059,265 | |||
| Media - 3.3% | |||
| Comcast Corp. Class A | 43,774 | 2,251,297 | |
| Interpublic Group of Companies, Inc. | 11,343 | 414,814 | |
| 2,666,111 | |||
| TOTAL COMMUNICATION SERVICES | 6,618,657 | ||
| CONSUMER DISCRETIONARY - 5.2% | |||
| Auto Components - 0.5% | |||
| BorgWarner, Inc. | 9,161 | 412,886 | |
| Automobiles - 0.5% | |||
| General Motors Co. (b) | 7,685 | 418,295 | |
| Distributors - 0.0% | |||
| LKQ Corp. | 126 | 6,940 | |
| Hotels, Restaurants & Leisure - 1.5% | |||
| Booking Holdings, Inc. (b) | 275 | 665,715 | |
| Elior SA (a)(b) | 8,700 | 68,590 | |
| Expedia, Inc. (b) | 1,233 | 202,718 | |
| Marriott International, Inc. Class A (b) | 1,323 | 211,706 | |
| Starbucks Corp. | 796 | 84,432 | |
| 1,233,161 | |||
| Household Durables - 1.3% | |||
| Mohawk Industries, Inc. (b) | 2,599 | 460,569 | |
| Sony Group Corp. sponsored ADR | 999 | 115,674 | |
| Whirlpool Corp. | 2,024 | 426,720 | |
| 1,002,963 | |||
| Internet & Direct Marketing Retail - 0.1% | |||
| Chewy, Inc. (b)(c) | 500 | 37,900 | |
| Specialty Retail - 1.3% | |||
| Lowe's Companies, Inc. | 4,393 | 1,027,171 | |
| TOTAL CONSUMER DISCRETIONARY | 4,139,316 | ||
| CONSUMER STAPLES - 5.2% | |||
| Beverages - 1.5% | |||
| Anheuser-Busch InBev SA NV ADR | 377 | 23,080 | |
| Diageo PLC sponsored ADR | 1,773 | 354,015 | |
| Keurig Dr. Pepper, Inc. | 6,683 | 241,189 | |
| The Coca-Cola Co. | 10,652 | 600,453 | |
| 1,218,737 | |||
| Food & Staples Retailing - 1.0% | |||
| Costco Wholesale Corp. | 200 | 98,308 | |
| Ocado Group PLC (b) | 463 | 11,425 | |
| Performance Food Group Co. (b) | 2,602 | 117,688 | |
| Sysco Corp. | 6,646 | 511,077 | |
| U.S. Foods Holding Corp.(b) | 1,400 | 48,538 | |
| 787,036 | |||
| Food Products - 0.1% | |||
| Lamb Weston Holdings, Inc. | 1,550 | 87,498 | |
| Household Products - 0.3% | |||
| Colgate-Palmolive Co. | 187 | 14,248 | |
| Spectrum Brands Holdings, Inc. | 1,891 | 177,281 | |
| 191,529 | |||
| Tobacco - 2.3% | |||
| Altria Group, Inc. | 40,569 | 1,789,499 | |
| Swedish Match Co. AB | 9,000 | 79,206 | |
| 1,868,705 | |||
| TOTAL CONSUMER STAPLES | 4,153,505 | ||
| ENERGY - 8.7% | |||
| Energy Equipment & Services - 0.1% | |||
| Subsea 7 SA | 11,279 | 101,149 | |
| Oil, Gas & Consumable Fuels - 8.6% | |||
| Canadian Natural Resources Ltd. | 2,700 | 114,754 | |
| Cenovus Energy, Inc. (Canada) | 70,153 | 838,934 | |
| Exxon Mobil Corp. | 57,199 | 3,687,620 | |
| Harbour Energy PLC (b) | 22,400 | 107,724 | |
| Hess Corp. | 15,984 | 1,319,799 | |
| Imperial Oil Ltd. | 2,900 | 98,182 | |
| Kosmos Energy Ltd. (b) | 62,571 | 225,256 | |
| Phillips 66 Co. | 2,369 | 177,154 | |
| Tourmaline Oil Corp. | 8,500 | 307,212 | |
| 6,876,635 | |||
| TOTAL ENERGY | 6,977,784 | ||
| FINANCIALS - 19.1% | |||
| Banks - 13.5% | |||
| Bank of America Corp. | 66,149 | 3,160,599 | |
| JPMorgan Chase & Co. | 6,165 | 1,047,372 | |
| M&T Bank Corp. | 866 | 127,406 | |
| PNC Financial Services Group, Inc. | 5,155 | 1,087,860 | |
| Truist Financial Corp. | 10,967 | 696,075 | |
| U.S. Bancorp | 9,496 | 573,274 | |
| Wells Fargo & Co. | 80,824 | 4,134,956 | |
| 10,827,542 | |||
| Capital Markets - 3.7% | |||
| KKR & Co. LP | 7,077 | 563,825 | |
| Morgan Stanley | 4,644 | 477,310 | |
| Northern Trust Corp. | 7,609 | 936,211 | |
| Raymond James Financial, Inc. | 2,016 | 198,757 | |
| State Street Corp. | 7,971 | 785,542 | |
| 2,961,645 | |||
| Consumer Finance - 0.6% | |||
| Discover Financial Services | 4,068 | 460,986 | |
| Insurance - 0.2% | |||
| Chubb Ltd. | 965 | 188,542 | |
| Thrifts & Mortgage Finance - 1.1% | |||
| MGIC Investment Corp. | 10,758 | 173,849 | |
| Radian Group, Inc. | 31,343 | 748,157 | |
| 922,006 | |||
| TOTAL FINANCIALS | 15,360,721 | ||
| HEALTH CARE - 12.9% | |||
| Biotechnology - 0.5% | |||
| ADC Therapeutics SA (b) | 1,749 | 50,704 | |
| Alnylam Pharmaceuticals, Inc. (b) | 761 | 121,425 | |
| Crinetics Pharmaceuticals, Inc. (b) | 1,998 | 49,810 | |
| Gritstone Bio, Inc. (b) | 202 | 2,220 | |
| Heron Therapeutics, Inc. (b)(c) | 630 | 6,936 | |
| Insmed, Inc. (b) | 2,745 | 82,762 | |
| Intercept Pharmaceuticals, Inc. (b) | 4,506 | 75,971 | |
| Vaxcyte, Inc. (b) | 956 | 22,370 | |
| 412,198 | |||
| Health Care Equipment & Supplies - 1.6% | |||
| Abbott Laboratories | 400 | 51,556 | |
| Becton, Dickinson & Co. | 715 | 171,307 | |
| Boston Scientific Corp. (b) | 20,100 | 866,913 | |
| Danaher Corp. | 330 | 102,884 | |
| Koninklijke Philips Electronics NV (depositary receipt) (NY Reg.) | 2,200 | 103,950 | |
| 1,296,610 | |||
| Health Care Providers & Services - 5.4% | |||
| Cardinal Health, Inc. | 6,897 | 329,746 | |
| Centene Corp. (b) | 919 | 65,470 | |
| Cigna Corp. | 3,806 | 813,000 | |
| Covetrus, Inc. (b) | 2,060 | 41,591 | |
| CVS Health Corp. | 11,115 | 992,347 | |
| Guardant Health, Inc. (b) | 600 | 70,074 | |
| Humana, Inc. | 150 | 69,474 | |
| McKesson Corp. | 4,108 | 853,971 | |
| UnitedHealth Group, Inc. | 2,414 | 1,111,575 | |
| 4,347,248 | |||
| Health Care Technology - 0.0% | |||
| Castlight Health, Inc. Class B (b) | 9,429 | 16,972 | |
| Pharmaceuticals - 5.4% | |||
| Bayer AG | 11,720 | 660,512 | |
| Bristol-Myers Squibb Co. | 21,987 | 1,284,041 | |
| Eli Lilly & Co. | 800 | 203,808 | |
| GlaxoSmithKline PLC sponsored ADR | 19,998 | 846,515 | |
| Intra-Cellular Therapies, Inc. (b) | 866 | 37,299 | |
| Johnson & Johnson | 6,266 | 1,020,606 | |
| Merck & Co., Inc. | 500 | 44,025 | |
| Pliant Therapeutics, Inc. (b) | 1,415 | 22,541 | |
| Sanofi SA sponsored ADR | 2,617 | 131,975 | |
| TherapeuticsMD, Inc. (b) | 32,665 | 23,780 | |
| Viatris, Inc. | 900 | 12,015 | |
| 4,287,117 | |||
| TOTAL HEALTH CARE | 10,360,145 | ||
| INDUSTRIALS - 15.3% | |||
| Aerospace & Defense - 2.4% | |||
| Airbus Group NV (b) | 2,758 | 353,802 | |
| General Dynamics Corp. | 938 | 190,180 | |
| Huntington Ingalls Industries, Inc. | 677 | 137,248 | |
| Maxar Technologies, Inc. | 400 | 10,620 | |
| MTU Aero Engines AG | 255 | 56,701 | |
| Raytheon Technologies Corp. | 1,090 | 96,857 | |
| Rolls-Royce Holdings PLC (b) | 71,600 | 129,227 | |
| Safran SA | 413 | 55,586 | |
| The Boeing Co. (b) | 4,417 | 914,452 | |
| 1,944,673 | |||
| Air Freight & Logistics - 2.4% | |||
| FedEx Corp. | 1,533 | 361,067 | |
| United Parcel Service, Inc. Class B | 7,280 | 1,554,062 | |
| 1,915,129 | |||
| Airlines - 0.1% | |||
| Copa Holdings SA Class A (b) | 300 | 22,188 | |
| Ryanair Holdings PLC sponsored ADR (b) | 672 | 76,279 | |
| 98,467 | |||
| Building Products - 0.2% | |||
| Johnson Controls International PLC | 1,674 | 122,821 | |
| Electrical Equipment - 1.3% | |||
| Acuity Brands, Inc. | 1,485 | 305,064 | |
| Hubbell, Inc. Class B | 859 | 171,259 | |
| Regal Rexnord Corp. | 200 | 30,466 | |
| Vertiv Holdings Co. | 21,426 | 550,220 | |
| 1,057,009 | |||
| Industrial Conglomerates - 6.8% | |||
| 3M Co. | 1,032 | 184,398 | |
| General Electric Co. | 50,470 | 5,292,789 | |
| 5,477,187 | |||
| Machinery - 1.2% | |||
| Caterpillar, Inc. | 181 | 36,926 | |
| Cummins, Inc. | 418 | 100,253 | |
| Epiroc AB (A Shares) | 2,100 | 52,255 | |
| Flowserve Corp. | 4,096 | 137,708 | |
| Fortive Corp. | 1,784 | 135,067 | |
| Otis Worldwide Corp. | 1,393 | 111,872 | |
| PACCAR, Inc. | 500 | 44,810 | |
| Stanley Black & Decker, Inc. | 594 | 106,760 | |
| Westinghouse Air Brake Tech Co. | 1,989 | 180,462 | |
| 906,113 | |||
| Professional Services - 0.1% | |||
| Equifax, Inc. | 255 | 70,745 | |
| Road & Rail - 0.8% | |||
| Knight-Swift Transportation Holdings, Inc. Class A | 8,367 | 474,325 | |
| Lyft, Inc. (b) | 2,191 | 100,501 | |
| Ryder System, Inc. | 874 | 74,246 | |
| 649,072 | |||
| Trading Companies & Distributors - 0.0% | |||
| Beijer Ref AB (B Shares) | 1,026 | 21,074 | |
| TOTAL INDUSTRIALS | 12,262,290 | ||
| INFORMATION TECHNOLOGY - 18.6% | |||
| Electronic Equipment & Components - 0.2% | |||
| CDW Corp. | 202 | 37,703 | |
| Vontier Corp. | 4,714 | 159,475 | |
| 197,178 | |||
| IT Services - 3.3% | |||
| Amadeus IT Holding SA Class A (b) | 2,000 | 133,726 | |
| Edenred SA | 2,700 | 145,979 | |
| Fidelity National Information Services, Inc. | 3,041 | 336,760 | |
| Genpact Ltd. | 2,735 | 134,972 | |
| IBM Corp. | 714 | 89,321 | |
| MasterCard, Inc. Class A | 562 | 188,562 | |
| Sabre Corp. (b) | 16,300 | 169,194 | |
| Snowflake Computing, Inc. (b) | 41 | 14,507 | |
| Twilio, Inc. Class A (b) | 130 | 37,877 | |
| Unisys Corp. (b) | 8,553 | 218,700 | |
| Visa, Inc. Class A | 5,473 | 1,159,017 | |
| 2,628,615 | |||
| Semiconductors & Semiconductor Equipment - 2.9% | |||
| Analog Devices, Inc. | 700 | 121,443 | |
| Applied Materials, Inc. | 1,609 | 219,870 | |
| Intel Corp. | 6,660 | 326,340 | |
| Lam Research Corp. | 248 | 139,765 | |
| Marvell Technology, Inc. | 2,659 | 182,142 | |
| Qualcomm, Inc. | 9,737 | 1,295,410 | |
| 2,284,970 | |||
| Software - 9.0% | |||
| Autodesk, Inc. (b) | 627 | 199,141 | |
| Dynatrace, Inc. (b) | 1,890 | 141,750 | |
| Elastic NV (b) | 1,604 | 278,310 | |
| Microsoft Corp. | 16,947 | 5,619,956 | |
| PTC, Inc. (b) | 835 | 106,337 | |
| Salesforce.com, Inc. (b) | 295 | 88,409 | |
| SAP SE sponsored ADR | 5,033 | 728,678 | |
| Workday, Inc. Class A (b) | 210 | 60,896 | |
| 7,223,477 | |||
| Technology Hardware, Storage & Peripherals - 3.2% | |||
| Apple, Inc. | 16,757 | 2,510,199 | |
| Samsung Electronics Co. Ltd. | 1,490 | 88,754 | |
| 2,598,953 | |||
| TOTAL INFORMATION TECHNOLOGY | 14,933,193 | ||
| MATERIALS - 2.4% | |||
| Chemicals - 0.8% | |||
| DuPont de Nemours, Inc. | 6,927 | 482,119 | |
| Livent Corp. (b) | 266 | 7,507 | |
| PPG Industries, Inc. | 768 | 123,318 | |
| 612,944 | |||
| Metals & Mining - 1.6% | |||
| Anglo American PLC (United Kingdom) | 3,865 | 147,036 | |
| First Quantum Minerals Ltd. | 9,600 | 227,279 | |
| Freeport-McMoRan, Inc. | 18,466 | 696,538 | |
| Glencore Xstrata PLC | 23,400 | 117,014 | |
| Lundin Mining Corp. | 13,000 | 113,130 | |
| 1,300,997 | |||
| TOTAL MATERIALS | 1,913,941 | ||
| REAL ESTATE - 0.9% | |||
| Equity Real Estate Investment Trusts (REITs) - 0.9% | |||
| American Tower Corp. | 674 | 190,048 | |
| Equinix, Inc. | 45 | 37,668 | |
| Simon Property Group, Inc. | 3,300 | 483,714 | |
| 711,430 | |||
| UTILITIES - 0.3% | |||
| Electric Utilities - 0.2% | |||
| Entergy Corp. | 576 | 59,340 | |
| Southern Co. | 2,143 | 133,552 | |
| 192,892 | |||
| Multi-Utilities - 0.1% | |||
| CenterPoint Energy, Inc. | 2,171 | 56,533 | |
| Sempra Energy | 108 | 13,784 | |
| 70,317 | |||
| TOTAL UTILITIES | 263,209 | ||
| TOTAL COMMON STOCKS | |||
| (Cost $52,835,347) | 77,694,191 | ||
| Preferred Stocks - 0.1% | |||
| Convertible Preferred Stocks - 0.0% | |||
| CONSUMER DISCRETIONARY - 0.0% | |||
| Internet & Direct Marketing Retail - 0.0% | |||
| Reddit, Inc. Series E (d)(e) | 200 | 12,359 | |
| Nonconvertible Preferred Stocks - 0.1% | |||
| INDUSTRIALS - 0.1% | |||
| Aerospace & Defense - 0.1% | |||
| Embraer SA sponsored ADR (b) | 5,900 | 91,627 | |
| TOTAL PREFERRED STOCKS | |||
| (Cost $71,068) | 103,986 | ||
| Money Market Funds - 3.1% | |||
| Fidelity Cash Central Fund 0.06% (f) | 2,499,629 | 2,500,129 | |
| Fidelity Securities Lending Cash Central Fund 0.06% (f)(g) | 21,556 | 21,558 | |
| TOTAL MONEY MARKET FUNDS | |||
| (Cost $2,521,687) | 2,521,687 | ||
| TOTAL INVESTMENT IN SECURITIES - 100.0% | |||
| (Cost $55,428,102) | 80,319,864 | ||
| NET OTHER ASSETS (LIABILITIES) - 0.0% | (32,614) | ||
| NET ASSETS - 100% | $80,287,250 |
Legend
(a) Security exempt from registration under Rule 144A of the Securities Act of 1933. These securities may be resold in transactions exempt from registration, normally to qualified institutional buyers. At the end of the period, the value of these securities amounted to $123,918 or 0.2% of net assets.
(b) Non-income producing
(c) Security or a portion of the security is on loan at period end.
(d) Restricted securities (including private placements) - Investment in securities not registered under the Securities Act of 1933 (excluding 144A issues). At the end of the period, the value of restricted securities (excluding 144A issues) amounted to $12,359 or 0.0% of net assets.
(e) Level 3 security
(f) Affiliated fund that is generally available only to investment companies and other accounts managed by Fidelity Investments. The rate quoted is the annualized seven-day yield of the fund at period end. A complete unaudited listing of the fund's holdings as of its most recent quarter end is available upon request. In addition, each Fidelity Central Fund's financial statements are available on the SEC's website or upon request.
(g) Investment made with cash collateral received from securities on loan.
Additional information on each restricted holding is as follows:
| Security | Acquisition Date | Acquisition Cost |
| Reddit, Inc. Series E | 5/18/21 | $8,495 |
Affiliated Central Funds
Fiscal year to date information regarding the Fund's investments in Fidelity Central Funds, including the ownership percentage, is presented below.
| Fund | Value, beginning of period | Purchases | Sales Proceeds | Dividend Income | Realized Gain/Loss | Change in Unrealized appreciation (depreciation) | Value, end of period | % ownership, end of period |
| Fidelity Cash Central Fund 0.06% | $1,425,941 | $8,305,622 | $7,231,434 | $654 | $-- | $-- | $2,500,129 | 0.0% |
| Fidelity Securities Lending Cash Central Fund 0.06% | 61,708 | 2,099,154 | 2,139,304 | 45,063 | -- | -- | 21,558 | 0.0% |
| Total | $1,487,649 | $10,404,776 | $9,370,738 | $45,717 | $-- | $-- | $2,521,687 |
Amounts in the income column in the above table include any capital gain distributions from underlying funds, which are presented in the corresponding line-item in the Statement of Operations, if applicable. Amount for Fidelity Securities Lending Cash Central Fund represents the income earned on investing cash collateral, less rebates paid to borrowers and any lending agent fees associated with the loan, plus any premium payments received for lending certain types of securities.
Investment Valuation
The following is a summary of the inputs used, as of October 31, 2021, involving the Fund's assets and liabilities carried at fair value. The inputs or methodology used for valuing securities may not be an indication of the risk associated with investing in those securities. For more information on valuation inputs, and their aggregation into the levels used below, please refer to the Investment Valuation section in the accompanying Notes to Financial Statements.
| Valuation Inputs at Reporting Date: | ||||
| Description | Total | Level 1 | Level 2 | Level 3 |
| Investments in Securities: | ||||
| Equities: | ||||
| Communication Services | $6,618,657 | $6,618,657 | $-- | $-- |
| Consumer Discretionary | 4,151,675 | 4,139,316 | -- | 12,359 |
| Consumer Staples | 4,153,505 | 4,153,505 | -- | -- |
| Energy | 6,977,784 | 6,977,784 | -- | -- |
| Financials | 15,360,721 | 15,360,721 | -- | -- |
| Health Care | 10,360,145 | 9,699,633 | 660,512 | -- |
| Industrials | 12,353,917 | 11,815,302 | 538,615 | -- |
| Information Technology | 14,933,193 | 14,844,439 | 88,754 | -- |
| Materials | 1,913,941 | 1,649,891 | 264,050 | -- |
| Real Estate | 711,430 | 711,430 | -- | -- |
| Utilities | 263,209 | 263,209 | -- | -- |
| Money Market Funds | 2,521,687 | 2,521,687 | -- | -- |
| Total Investments in Securities: | $80,319,864 | $78,755,574 | $1,551,931 | $12,359 |
Other Information
Distribution of investments by country or territory of incorporation, as a percentage of Total Net Assets, is as follows (Unaudited):
| United States of America | 90.0% |
| Canada | 2.1% |
| United Kingdom | 2.0% |
| Germany | 1.8% |
| Netherlands | 1.4% |
| Others (Individually Less Than 1%) | 2.7% |
| 100.0% |
See accompanying notes which are an integral part of the financial statements.
Financial Statements
Statement of Assets and Liabilities
| October 31, 2021 (Unaudited) | ||
| Assets | ||
| Investment in securities, at value (including securities loaned of $21,766) — See accompanying schedule: Unaffiliated issuers (cost $52,906,415) | $77,798,177 | |
| Fidelity Central Funds (cost $2,521,687) | 2,521,687 | |
| Total Investment in Securities (cost $55,428,102) | $80,319,864 | |
| Foreign currency held at value (cost $2,953) | 2,923 | |
| Receivable for investments sold | 94,014 | |
| Receivable for fund shares sold | 73,055 | |
| Dividends receivable | 49,484 | |
| Distributions receivable from Fidelity Central Funds | 139 | |
| Other receivables | 503 | |
| Total assets | 80,539,982 | |
| Liabilities | ||
| Payable to custodian bank | $89,052 | |
| Payable for investments purchased | 89,034 | |
| Payable for fund shares redeemed | 23,469 | |
| Accrued management fee | 29,577 | |
| Collateral on securities loaned | 21,600 | |
| Total liabilities | 252,732 | |
| Net Assets | $80,287,250 | |
| Net Assets consist of: | ||
| Paid in capital | $54,236,195 | |
| Total accumulated earnings (loss) | 26,051,055 | |
| Net Assets | $80,287,250 | |
| Net Asset Value, offering price and redemption price per share ($80,287,250 ÷ 5,110,737 shares) | $15.71 |
See accompanying notes which are an integral part of the financial statements.
Statement of Operations
| Six months ended October 31, 2021 (Unaudited) | ||
| Investment Income | ||
| Dividends | $614,582 | |
| Non-Cash dividends | 441,190 | |
| Income from Fidelity Central Funds (including $45,063 from security lending) | 45,717 | |
| Total income | 1,101,489 | |
| Expenses | ||
| Management fee | $171,536 | |
| Independent trustees' fees and expenses | 134 | |
| Total expenses before reductions | 171,670 | |
| Expense reductions | (4) | |
| Total expenses after reductions | 171,666 | |
| Net investment income (loss) | 929,823 | |
| Realized and Unrealized Gain (Loss) | ||
| Net realized gain (loss) on: | ||
| Investment securities: | ||
| Unaffiliated issuers | 463,125 | |
| Foreign currency transactions | (31) | |
| Total net realized gain (loss) | 463,094 | |
| Change in net unrealized appreciation (depreciation) on: | ||
| Investment securities: | ||
| Unaffiliated issuers | 3,481,000 | |
| Unfunded commitments | (34,346) | |
| Assets and liabilities in foreign currencies | (35) | |
| Total change in net unrealized appreciation (depreciation) | 3,446,619 | |
| Net gain (loss) | 3,909,713 | |
| Net increase (decrease) in net assets resulting from operations | $4,839,536 |
See accompanying notes which are an integral part of the financial statements.
Statement of Changes in Net Assets
| Six months ended October 31, 2021 (Unaudited) | Year ended April 30, 2021 | |
| Increase (Decrease) in Net Assets | ||
| Operations | ||
| Net investment income (loss) | $929,823 | $1,302,685 |
| Net realized gain (loss) | 463,094 | 5,372,238 |
| Change in net unrealized appreciation (depreciation) | 3,446,619 | 24,357,216 |
| Net increase (decrease) in net assets resulting from operations | 4,839,536 | 31,032,139 |
| Distributions to shareholders | (3,205,325) | (2,702,588) |
| Share transactions | ||
| Proceeds from sales of shares | 10,752,730 | 15,873,590 |
| Reinvestment of distributions | 3,205,324 | 2,702,588 |
| Cost of shares redeemed | (7,512,964) | (45,439,438) |
| Net increase (decrease) in net assets resulting from share transactions | 6,445,090 | (26,863,260) |
| Total increase (decrease) in net assets | 8,079,301 | 1,466,291 |
| Net Assets | ||
| Beginning of period | 72,207,949 | 70,741,658 |
| End of period | $80,287,250 | $72,207,949 |
| Other Information | ||
| Shares | ||
| Sold | 708,095 | 1,295,616 |
| Issued in reinvestment of distributions | 210,047 | 217,865 |
| Redeemed | (493,759) | (3,651,332) |
| Net increase (decrease) | 424,383 | (2,137,851) |
See accompanying notes which are an integral part of the financial statements.
Financial Highlights
Fidelity Large Cap Stock K6 Fund
| Six months ended (Unaudited) October 31, | Years endedApril 30, | ||||
| 2021 | 2021 | 2020 | 2019 | 2018 A | |
| Selected Per–Share Data | |||||
| Net asset value, beginning of period | $15.41 | $10.37 | $11.61 | $11.00 | $10.00 |
| Income from Investment Operations | |||||
| Net investment income (loss)B | .19C | .22 | .23 | .23 | .16 |
| Net realized and unrealized gain (loss) | .79 | 5.27 | (1.15) | .84 | .91 |
| Total from investment operations | .98 | 5.49 | (.92) | 1.07 | 1.07 |
| Distributions from net investment income | (.07) | (.25) | (.24) | (.20) | (.05) |
| Distributions from net realized gain | (.61) | (.20) | (.08) | (.26) | (.01) |
| Total distributions | (.68) | (.45) | (.32) | (.46) | (.07)D |
| Net asset value, end of period | $15.71 | $15.41 | $10.37 | $11.61 | $11.00 |
| Total ReturnE,F | 6.47% | 54.03% | (8.32)% | 10.12% | 10.65% |
| Ratios to Average Net AssetsG,H | |||||
| Expenses before reductions | .45%I | .45% | .45% | .45% | .45%I |
| Expenses net of fee waivers, if any | .45%I | .45% | .45% | .45% | .45%I |
| Expenses net of all reductions | .45%I | .45% | .45% | .44% | .45%I |
| Net investment income (loss) | 2.44%C,I | 1.80% | 2.05% | 2.09% | 1.55%I |
| Supplemental Data | |||||
| Net assets, end of period (000 omitted) | $80,287 | $72,208 | $70,742 | $87,168 | $84,217 |
| Portfolio turnover rateJ | 7%I | 19%K | 30%K | 49%K | 67%I,K |
A For the period May 25, 2017 (commencement of operations) through April 30, 2018.
B Calculated based on average shares outstanding during the period.
C Net investment income per share reflects one or more large, non-recurring dividend(s) which amounted to $.09 per share. Excluding such non-recurring dividend(s), the ratio of net investment income (loss) to average net assets would have been 1.28%.
D Total distributions per share do not sum due to rounding.
E Total returns for periods of less than one year are not annualized.
F Total returns would have been lower if certain expenses had not been reduced during the applicable periods shown.
G Fees and expenses of any underlying mutual funds or exchange-traded funds (ETFs) are not included in the Fund's expense ratio. The Fund indirectly bears its proportionate share of these expenses. For additional expense information related to investments in Fidelity Central Funds, please refer to the "Investments in Fidelity Central Funds" note found in the Notes to Financial Statements section of the most recent Annual or Semi-Annual report.
H Expense ratios reflect operating expenses of the class. Expenses before reductions do not reflect amounts reimbursed, waived, or reduced through arrangements with the investment adviser, brokerage services, or other offset arrangements, if applicable, and do not represent the amount paid by the class during periods when reimbursements, waivers or reductions occur.
I Annualized
J Amount does not include the portfolio activity of any underlying mutual funds or exchange-traded funds (ETFs).
K Portfolio turnover rate excludes securities received or delivered in-kind.
See accompanying notes which are an integral part of the financial statements.
Notes to Financial Statements (Unaudited)
For the period ended October 31, 2021
1. Organization.
Fidelity Large Cap Stock K6 Fund (the Fund) is a fund of Fidelity Concord Street Trust (the Trust) and is authorized to issue an unlimited number of shares. Share transactions on the Statement of Changes in Net Assets may contain exchanges between affiliated funds. The Trust is registered under the Investment Company Act of 1940, as amended (the 1940 Act), as an open-end management investment company organized as a Massachusetts business trust. Shares generally are available only to employer-sponsored retirement plans that are recordkept by Fidelity, or to certain employer-sponsored retirement plans that are not recordkept by Fidelity.
2. Investments in Fidelity Central Funds.
Funds may invest in Fidelity Central Funds, which are open-end investment companies generally available only to other investment companies and accounts managed by the investment adviser and its affiliates. The Schedule of Investments lists any Fidelity Central Funds held as an investment as of period end, but does not include the underlying holdings of each Fidelity Central Fund. An investing fund indirectly bears its proportionate share of the expenses of the underlying Fidelity Central Funds.
Based on its investment objective, each Fidelity Central Fund may invest or participate in various investment vehicles or strategies that are similar to those of the investing fund. These strategies are consistent with the investment objectives of the investing fund and may involve certain economic risks which may cause a decline in value of each of the Fidelity Central Funds and thus a decline in the value of the investing fund.
| Fidelity Central Fund | Investment Manager | Investment Objective | Investment Practices | Expense Ratio(a) |
| Fidelity Money Market Central Funds | Fidelity Management & Research Company LLC (FMR) | Each fund seeks to obtain a high level of current income consistent with the preservation of capital and liquidity. | Short-term Investments | Less than .005% |
(a) Expenses expressed as a percentage of average net assets and are as of each underlying Central Fund's most recent annual or semi-annual shareholder report.
A complete unaudited list of holdings for each Fidelity Central Fund is available upon request or at the Securities and Exchange Commission website at www.sec.gov. In addition, the financial statements of the Fidelity Central Funds which contain the significant accounting policies (including investment valuation policies) of those funds, and are not covered by the Report of Independent Registered Public Accounting Firm, are available on the Securities and Exchange Commission website or upon request.
3. Significant Accounting Policies.
The Fund is an investment company and applies the accounting and reporting guidance of the Financial Accounting Standards Board (FASB) Accounting Standards Codification Topic 946 Financial Services - Investment Companies. The financial statements have been prepared in conformity with accounting principles generally accepted in the United States of America (GAAP), which require management to make certain estimates and assumptions at the date of the financial statements. Actual results could differ from those estimates. Subsequent events, if any, through the date that the financial statements were issued have been evaluated in the preparation of the financial statements. The Fund's Schedule of Investments lists any underlying mutual funds or exchange-traded funds (ETFs) but does not include the underlying holdings of these funds. The following summarizes the significant accounting policies of the Fund:
Investment Valuation. Investments are valued as of 4:00 p.m. Eastern time on the last calendar day of the period. The Board of Trustees (the Board) has delegated the day to day responsibility for the valuation of the Fund's investments to the Fair Value Committee (the Committee) established by the Fund's investment adviser. In accordance with valuation policies and procedures approved by the Board, the Fund attempts to obtain prices from one or more third party pricing vendors or brokers to value its investments. When current market prices, quotations or currency exchange rates are not readily available or reliable, investments will be fair valued in good faith by the Committee, in accordance with procedures adopted by the Board. Factors used in determining fair value vary by investment type and may include market or investment specific events. The frequency with which these procedures are used cannot be predicted and they may be utilized to a significant extent. The Committee oversees the Fund's valuation policies and procedures and reports to the Board on the Committee's activities and fair value determinations. The Board monitors the appropriateness of the procedures used in valuing the Fund's investments and ratifies the fair value determinations of the Committee.
The Fund categorizes the inputs to valuation techniques used to value its investments into a disclosure hierarchy consisting of three levels as shown below:
- Level 1 – quoted prices in active markets for identical investments
- Level 2 – other significant observable inputs (including quoted prices for similar investments, interest rates, prepayment speeds, etc.)
- Level 3 – unobservable inputs (including the Fund's own assumptions based on the best information available)
Valuation techniques used to value the Fund's investments by major category are as follows:
Equity securities, including restricted securities, for which market quotations are readily available, are valued at the last reported sale price or official closing price as reported by a third party pricing vendor on the primary market or exchange on which they are traded and are categorized as Level 1 in the hierarchy. In the event there were no sales during the day or closing prices are not available, securities are valued at the last quoted bid price or may be valued using the last available price and are generally categorized as Level 2 in the hierarchy. For foreign equity securities, when market or security specific events arise, comparisons to the valuation of American Depositary Receipts (ADRs), futures contracts, Exchange-Traded Funds (ETFs) and certain indexes as well as quoted prices for similar securities may be used and would be categorized as Level 2 in the hierarchy. For equity securities, including restricted securities, where observable inputs are limited, assumptions about market activity and risk are used and these securities may be categorized as Level 3 in the hierarchy.
Investments in open-end mutual funds, including the Fidelity Central Funds, are valued at their closing net asset value (NAV) each business day and are categorized as Level 1 in the hierarchy.
Changes in valuation techniques may result in transfers in or out of an assigned level within the disclosure hierarchy. The aggregate value of investments by input level as of October 31, 2021 is included at the end of the Fund's Schedule of Investments.
Foreign Currency. Certain Funds may use foreign currency contracts to facilitate transactions in foreign-denominated securities. Gains and losses from these transactions may arise from changes in the value of the foreign currency or if the counterparties do not perform under the contracts' terms.
Foreign-denominated assets, including investment securities, and liabilities are translated into U.S. dollars at the exchange rates at period end. Purchases and sales of investment securities, income and dividends received, and expenses denominated in foreign currencies are translated into U.S. dollars at the exchange rate in effect on the transaction date.
The effects of exchange rate fluctuations on investments are included with the net realized and unrealized gain (loss) on investment securities. Other foreign currency transactions resulting in realized and unrealized gain (loss) are disclosed separately.
Investment Transactions and Income. For financial reporting purposes, the Fund's investment holdings and NAV include trades executed through the end of the last business day of the period. The NAV per share for processing shareholder transactions is calculated as of the close of business of the New York Stock Exchange (NYSE), normally 4:00 p.m. Eastern time and includes trades executed through the end of the prior business day. Gains and losses on securities sold are determined on the basis of identified cost. Commissions paid to certain brokers with whom the investment adviser, or its affiliates, places trades on behalf of a fund include an amount in addition to trade execution, which may be rebated back to a fund. Any such rebates are included in net realized gain (loss) on investments in the Statement of Operations. Dividend income is recorded on the ex-dividend date, except for certain dividends from foreign securities where the ex-dividend date may have passed, which are recorded as soon as the Fund is informed of the ex-dividend date. Non-cash dividends included in dividend income, if any, are recorded at the fair market value of the securities received. Income and capital gain distributions from Fidelity Central Funds, if any, are recorded on the ex-dividend date. Certain distributions received by the Fund represent a return of capital or capital gain. The Fund determines the components of these distributions subsequent to the ex-dividend date, based upon receipt of tax filings or other correspondence relating to the underlying investment. These distributions are recorded as a reduction of cost of investments and/or as a realized gain. Large, non-recurring dividends recognized by the Fund are presented separately on the Statement of Operations in "Non-cash dividends" and the impact of these dividends is presented in the Financial Highlights. Investment income is recorded net of foreign taxes withheld where recovery of such taxes is uncertain. Funds may file withholding tax reclaims in certain jurisdictions to recover a portion of amounts previously withheld. Any withholding tax reclaims income is included in the Statement of Operations in dividends. Any receivables for withholding tax reclaims are included in the Statement of Assets and Liabilities in dividends receivable.
Expenses. Expenses directly attributable to a fund are charged to that fund. Expenses attributable to more than one fund are allocated among the respective funds on the basis of relative net assets or other appropriate methods. Expenses included in the accompanying financial statements reflect the expenses of that fund and do not include any expenses associated with any underlying mutual funds or exchange-traded funds. Although not included in a fund's expenses, a fund indirectly bears its proportionate share of these expenses through the net asset value of each underlying mutual fund or exchange-traded fund. Expense estimates are accrued in the period to which they relate and adjustments are made when actual amounts are known.
Income Tax Information and Distributions to Shareholders. Each year, the Fund intends to qualify as a regulated investment company under Subchapter M of the Internal Revenue Code, including distributing substantially all of its taxable income and realized gains. As a result, no provision for U.S. Federal income taxes is required. The Fund files a U.S. federal tax return, in addition to state and local tax returns as required. The Fund's federal income tax returns are subject to examination by the Internal Revenue Service (IRS) for a period of three fiscal years after they are filed. State and local tax returns may be subject to examination for an additional fiscal year depending on the jurisdiction. Foreign taxes are provided for based on the Fund's understanding of the tax rules and rates that exist in the foreign markets in which it invests.
Distributions are declared and recorded on the ex-dividend date. Income and capital gain distributions are determined in accordance with income tax regulations, which may differ from GAAP.
Capital accounts within the financial statements are adjusted for permanent book-tax differences. These adjustments have no impact on net assets or the results of operations. Capital accounts are not adjusted for temporary book-tax differences which will reverse in a subsequent period.
Book-tax differences are primarily due to foreign currency transactions, passive foreign investment companies (PFIC) and losses deferred due to wash sales.
As of period end, the cost and unrealized appreciation (depreciation) in securities, and derivatives if applicable, for federal income tax purposes were as follows:
| Gross unrealized appreciation | $26,807,643 |
| Gross unrealized depreciation | (2,138,104) |
| Net unrealized appreciation (depreciation) | $24,669,539 |
| Tax cost | $55,650,325 |
Restricted Securities (including Private Placements). Funds may invest in securities that are subject to legal or contractual restrictions on resale. These securities generally may be resold in transactions exempt from registration or to the public if the securities are registered. Disposal of these securities may involve time-consuming negotiations and expense, and prompt sale at an acceptable price may be difficult. Information regarding restricted securities held at period end is included at the end of the Schedule of Investments, if applicable.
Special Purpose Acquisition Companies. Funds may invest in stock, warrants, and other securities of special purpose acquisition companies (SPACs) or similar special purpose entities. A SPAC is a publicly traded company that raises investment capital via an initial public offering (IPO) for the purpose of acquiring the equity securities of one or more existing companies via merger, business combination, acquisition or other similar transactions within a designated time frame.
Private Investment in Public Equity. Funds may acquire equity securities of an issuer through a private investment in a public equity (PIPE) transaction, including through commitments to purchase securities on a when-issued basis. A PIPE typically involves the purchase of securities directly from a publicly traded company in a private placement transaction. Securities purchased through PIPE transactions will be restricted from trading and considered illiquid until a resale registration statement for the shares is filed and declared effective.
At period end, the Fund had commitments to purchase when-issued securities through PIPE transactions with SPACs. The commitments are contingent upon the SPACs acquiring the securities of target companies. Unrealized appreciation (depreciation) on these commitments is separately presented in the Statements of Assets and Liabilities as Unrealized appreciation (depreciation) on unfunded commitments, and in the Statement of Operations as Change in unrealized appreciation (depreciation) on unfunded commitments.
4. Purchases and Sales of Investments.
Purchases and sales of securities, other than short-term securities and in-kind transactions, as applicable, are noted in the table below.
| Purchases ($) | Sales ($) | |
| Fidelity Large Cap Stock K6 Fund | 6,072,296 | 2,712,365 |
Prior Fiscal Year Unaffiliated Redemptions In-Kind. Shares that were redeemed in-kind for investments, including accrued interest and cash, if any, are shown in the table below; along with realized gain or loss on investments delivered through in-kind redemptions. The amount of the in-kind redemptions is included in share transactions in the accompanying Statement of Changes in Net Assets. There was no gain or loss for federal income tax purposes.
| Shares | Total net realized gain or loss ($) | Total Proceeds ($) | |
| Fidelity Large Cap Stock K6 Fund | 362,213 | 1,008,338 | 4,150,955 |
5. Fees and Other Transactions with Affiliates.
Management Fee. Fidelity Management & Research Company LLC (the investment adviser) and its affiliates provide the Fund with investment management related services for which the Fund pays a monthly management fee that is based on an annual rate of .45% of average net assets. Under the management contract, the investment adviser or an affiliate pays all other expenses of the Fund, excluding fees and expenses of the independent Trustees, and certain miscellaneous expenses such as proxy and shareholder meeting expenses.
Brokerage Commissions. A portion of portfolio transactions were placed with brokerage firms which are affiliates of the investment adviser. Brokerage commissions are included in net realized gain (loss) and change in net unrealized appreciation (depreciation) in the Statement of Operations. The commissions paid to these affiliated firms were as follows:
| Amount | |
| Fidelity Large Cap Stock K6 Fund | $146 |
Interfund Trades. Funds may purchase from or sell securities to other Fidelity Funds under procedures adopted by the Board. The procedures have been designed to ensure these interfund trades are executed in accordance with Rule 17a-7 of the 1940 Act. Any interfund trades are included within the respective purchases and sales amounts shown in the Purchases and Sales of Investments note. Interfund trades during the period are noted in the table below.
| Purchases ($) | Sales ($) | Realized Gain (Loss) ($) | |
| Fidelity Large Cap Stock K6 Fund | 489,131 | 173,745 | 68,089 |
6. Committed Line of Credit.
Certain Funds participate with other funds managed by the investment adviser or an affiliate in a $4.25 billion credit facility (the "line of credit") to be utilized for temporary or emergency purposes to fund shareholder redemptions or for other short-term liquidity purposes. The commitment fees on the pro-rata portion of the line of credit are borne by the investment adviser. During the period, there were no borrowings on this line of credit.
7. Security Lending.
Funds lend portfolio securities from time to time in order to earn additional income. Lending agents are used, including National Financial Services (NFS), an affiliate of the investment adviser. Pursuant to a securities lending agreement, NFS will receive a fee, which is capped at 9.9% of a fund's daily lending revenue, for its services as lending agent. A fund may lend securities to certain qualified borrowers, including NFS. On the settlement date of the loan, a fund receives collateral (in the form of U.S. Treasury obligations, letters of credit and/or cash) against the loaned securities and maintains collateral in an amount not less than 100% of the market value of the loaned securities during the period of the loan. The market value of the loaned securities is determined at the close of business of a fund and any additional required collateral is delivered to a fund on the next business day. A fund or borrower may terminate the loan at any time, and if the borrower defaults on its obligation to return the securities loaned because of insolvency or other reasons, a fund may apply collateral received from the borrower against the obligation. A fund may experience delays and costs in recovering the securities loaned. Any cash collateral received is invested in the Fidelity Securities Lending Cash Central Fund. Any loaned securities are identified as such in the Schedule of Investments, and the value of loaned securities and cash collateral at period end, as applicable, are presented in the Statement of Assets and Liabilities. Security lending income represents the income earned on investing cash collateral, less rebates paid to borrowers and any lending agent fees associated with the loan, plus any premium payments received for lending certain types of securities. Security lending income is presented in the Statement of Operations as a component of income from Fidelity Central Funds. Affiliated security lending activity, if any, was as follows:
| Total Security Lending Fees Paid to NFS | Security Lending Income From Securities Loaned to NFS | Value of Securities Loaned to NFS at Period End | |
| Fidelity Large Cap Stock K6 Fund | $2,049 | $– | $– |
8. Expense Reductions.
Through arrangements with the Fund's custodian, credits realized as a result of certain uninvested cash balances were used to reduce the Fund's expenses by $4.
9. Other.
Fund's organizational documents provide former and current trustees and officers with a limited indemnification against liabilities arising in connection with the performance of their duties to the fund. In the normal course of business, the fund may also enter into contracts that provide general indemnifications. The fund's maximum exposure under these arrangements is unknown as this would be dependent on future claims that may be made against the fund. The risk of material loss from such claims is considered remote.
10. Coronavirus (COVID-19) Pandemic.
An outbreak of COVID-19 first detected in China during December 2019 has since spread globally and was declared a pandemic by the World Health Organization during March 2020. Developments that disrupt global economies and financial markets, such as the COVID-19 pandemic, may magnify factors that affect the Fund's performance.
Shareholder Expense Example
As a shareholder, you incur two types of costs: (1) transaction costs, which may include sales charges (loads) on purchase payments or redemption proceeds, as applicable and (2) ongoing costs, which generally include management fees, distribution and/or service (12b-1) fees and other Fund expenses. This Example is intended to help you understand your ongoing costs (in dollars) of investing in a fund and to compare these costs with the ongoing costs of investing in other mutual funds.
The Example is based on an investment of $1,000 invested at the beginning of the period and held for the entire period (May 1, 2021 to October 31, 2021).
Actual Expenses
The first line of the accompanying table provides information about actual account values and actual expenses. You may use the information in this line, together with the amount you invested, to estimate the expenses that you paid over the period. Simply divide your account value by $1,000.00 (for example, an $8,600 account value divided by $1,000.00 = 8.6), then multiply the result by the number in the first line for a class/Fund under the heading entitled "Expenses Paid During Period" to estimate the expenses you paid on your account during this period. If any fund is a shareholder of any underlying mutual funds or exchange-traded funds (ETFs) (the Underlying Funds), such fund indirectly bears its proportional share of the expenses of the Underlying Funds in addition to the direct expenses incurred presented in the table. These fees and expenses are not included in the annualized expense ratio used to calculate the expense estimate in the table below.
Hypothetical Example for Comparison Purposes
The second line of the accompanying table provides information about hypothetical account values and hypothetical expenses based on the actual expense ratio and an assumed rate of return of 5% per year before expenses, which is not the actual return. The hypothetical account values and expenses may not be used to estimate the actual ending account balance or expenses you paid for the period. You may use this information to compare the ongoing costs of investing in the Fund and other funds. To do so, compare this 5% hypothetical example with the 5% hypothetical examples that appear in the shareholder reports of the other funds. If any fund is a shareholder of any Underlying Funds, such fund indirectly bears its proportional share of the expenses of the Underlying Funds in addition to the direct expenses as presented in the table. These fees and expenses are not included in the annualized expense ratio used to calculate the expense estimate in the table below.
Please note that the expenses shown in the table are meant to highlight your ongoing costs only and do not reflect any transaction costs. Therefore, the second line of the table is useful in comparing ongoing costs only, and will not help you determine the relative total costs of owning different funds. In addition, if these transactional costs were included, your costs would have been higher.
| Annualized Expense Ratio-A | Beginning Account Value May 1, 2021 | Ending Account Value October 31, 2021 | Expenses Paid During Period-B May 1, 2021 to October 31, 2021 | |
| Fidelity Large Cap Stock K6 Fund | .45% | |||
| Actual | $1,000.00 | $1,064.70 | $2.34 | |
| Hypothetical-C | $1,000.00 | $1,022.94 | $2.29 |
A Annualized expense ratio reflects expenses net of applicable fee waivers.
B Expenses are equal to the annualized expense ratio, multiplied by the average account value over the period, multiplied by 184/ 365 (to reflect the one-half year period). The fees and expenses of any Underlying Funds are not included in each annualized expense ratio.
C 5% return per year before expenses
Board Approval of Investment Advisory Contracts and Management Fees
Fidelity Large Cap Stock K6 Fund
Each year, the Board of Trustees, including the Independent Trustees (together, the Board), votes on the renewal of the management contract with Fidelity Management & Research Company LLC (FMR) and the sub-advisory agreements (together, the Advisory Contracts) for the fund. FMR and the sub-advisers are referred to herein as the Investment Advisers. The Board, assisted by the advice of fund counsel and Independent Trustees' counsel, requests and considers a broad range of information relevant to the renewal of the Advisory Contracts throughout the year.The Board meets regularly and, at each of its meetings, covers an extensive agenda of topics and materials and considers factors that are relevant to its annual consideration of the renewal of the fund's Advisory Contracts, including the services and support provided to the fund and its shareholders. The Board has established various standing committees (Committees), each composed of and chaired by Independent Trustees with varying backgrounds, to which the Board has assigned specific subject matter responsibilities in order to enhance effective decision-making by the Board. The Board, acting directly and through its Committees, requests and receives information concerning the annual consideration of the renewal of the fund's Advisory Contracts. The Board also meets as needed to review matters specifically related to the Board's annual consideration of the renewal of the Advisory Contracts. Members of the Board may also meet with trustees of other Fidelity funds through joint ad hoc committees to discuss certain matters relevant to all of the Fidelity funds.At its May 2021 meeting, the Board unanimously determined to renew the fund's Advisory Contracts. In reaching its determination, the Board considered all factors it believed relevant, including (i) the nature, extent, and quality of the services provided to the fund and its shareholders (including the investment performance of the fund); (ii) the competitiveness of the fund's management fee and total expense ratio relative to peer funds; (iii) the total costs of the services provided by and the profits realized by Fidelity from its relationships with the fund; and (iv) the extent to which, if any, economies of scale exist and are realized as the fund grows, and whether any economies of scale are appropriately shared with fund shareholders.In considering whether to renew the Advisory Contracts for the fund, the Board reached a determination, with the assistance of fund counsel and Independent Trustees' counsel and through the exercise of its business judgment, that the renewal of the Advisory Contracts was in the best interests of the fund and its shareholders and that the compensation payable under the Advisory Contracts was fair and reasonable. The Board's decision to renew the Advisory Contracts was not based on any single factor, but rather was based on a comprehensive consideration of all the information provided to the Board at its meetings throughout the year. The Board, in reaching its determination to renew the Advisory Contracts, was aware that shareholders of the fund have a broad range of investment choices available to them, including a wide choice among funds offered by Fidelity's competitors, and that the fund's shareholders, who have the opportunity to review and weigh the disclosure provided by the fund in its prospectus and other public disclosures, have chosen to invest in this fund, which is part of the Fidelity family of funds.Nature, Extent, and Quality of Services Provided. The Board considered Fidelity's staffing as it relates to the fund, including the backgrounds of investment personnel of Fidelity, and also considered the fund's investment objective, strategies, and related investment philosophy. The Independent Trustees also had discussions with senior management of Fidelity's investment operations and investment groups. The Board considered the structure of the investment personnel compensation program and whether this structure provides appropriate incentives to act in the best interests of the fund. Additionally, the Board considered the portfolio managers' investments, if any, in the funds that they manage.Resources Dedicated to Investment Management and Support Services. The Board and the Fund Oversight and Research Committees reviewed the general qualifications and capabilities of Fidelity's investment staff, including its size, education, experience, and resources, as well as Fidelity's approach to recruiting, training, managing, and compensating investment personnel. The Board noted that Fidelity has continued to increase the resources devoted to non-U.S. offices, including expansion of Fidelity's global investment organization. The Board also noted that Fidelity's analysts have extensive resources, tools and capabilities that allow them to conduct sophisticated quantitative and fundamental analysis, as well as credit analysis of issuers, counterparties and guarantors. Further, the Board considered that Fidelity's investment professionals have sufficient access to global information and data so as to provide competitive investment results over time, and that those professionals also have access to sophisticated tools that permit them to assess portfolio construction and risk and performance attribution characteristics continuously, as well as to transmit new information and research conclusions rapidly around the world. Additionally, in its deliberations, the Board considered Fidelity's trading, risk management, compliance, and technology and operations capabilities and resources, which are integral parts of the investment management process. The Board also considered Fidelity's investments in business continuity planning, and its success in continuously providing services to the fund notwithstanding the severe disruptions caused by the COVID-19 pandemic.Shareholder and Administrative Services. The Board considered (i) the nature, extent, quality, and cost of advisory, administrative, and shareholder services performed by the Investment Advisers and their affiliates under the Advisory Contracts and under separate agreements covering transfer agency, pricing and bookkeeping, and securities lending services for the fund; (ii) the nature and extent of the supervision of third party service providers, principally custodians, subcustodians, and pricing vendors; and (iii) the resources devoted to, and the record of compliance with, the fund's compliance policies and procedures. The Board also reviewed the allocation of fund brokerage, including allocations to brokers affiliated with the Investment Advisers, the use of brokerage commissions to pay fund expenses, and the use of "soft" commission dollars to pay for research services.The Board noted that the growth of fund assets over time across the complex allows Fidelity to reinvest in the development of services designed to enhance the value and convenience of the Fidelity funds as investment vehicles. These services include 24-hour access to account information and market information over the Internet and through telephone representatives, investor education materials and asset allocation tools, and the expanded availability of Fidelity Investor Centers.The Board noted that, in the past, it and the boards of certain other Fidelity funds had formed an ad hoc Committee on Transfer Agency Fees to review the variety of transfer agency fee structures throughout the industry and Fidelity's competitive positioning with respect to industry participants.Investment in a Large Fund Family. The Board considered the benefits to shareholders of investing in a Fidelity fund, including the benefits of investing in a fund that is part of a large family of funds offering a variety of investment disciplines and providing a large variety of mutual fund investor services. The Board noted that Fidelity had taken, or had made recommendations that resulted in the Fidelity funds taking, a number of actions over the previous year that benefited particular funds, including: (i) continuing to dedicate additional resources to Fidelity's investment research process, which includes meetings with management of issuers of securities in which the funds invest, and to the support of the senior management team that oversees asset management; (ii) continuing efforts to enhance Fidelity's global research capabilities; (iii) launching new funds and ETFs with innovative structures, strategies and pricing and making other enhancements to meet client needs; (iv) launching new share classes of existing funds; (v) eliminating purchase minimums and broadening eligibility requirements for certain funds and share classes; (vi) approving the reduction in the holding period for the Class C to Class A conversion policy; (vii) reducing management fees and total expenses for certain target date funds and classes and index funds; (viii) lowering expenses for certain existing funds and classes by implementing or lowering expense caps; (ix) rationalizing product lines and gaining increased efficiencies from fund mergers, liquidations, and share class consolidations; (x) continuing to develop, acquire and implement systems and technology to improve services to the funds and shareholders, strengthen information security, and increase efficiency; and (xi) continuing to implement enhancements to further strengthen Fidelity's product line to increase investors' probability of success in achieving their investment goals, including retirement income goals.Investment Performance. The Board considered whether the fund has operated in accordance with its investment objective, as well as its record of compliance with its investment restrictions and its performance history.The Board took into account discussions that occur at Board meetings throughout the year with representatives of the Investment Advisers about fund investment performance. In this regard the Board noted that as part of regularly scheduled fund reviews and other reports to the Board on fund performance, the Board considers annualized return information for the fund for different time periods, measured against an appropriate securities market index (benchmark index) and an appropriate peer group of funds with similar objectives (peer group). In its evaluation of fund investment performance, the Board gave particular attention to information indicating changes in performance of certain Fidelity funds for specific time periods and discussed with the Investment Advisers the reasons for any overperformance or underperformance.In addition to reviewing absolute and relative fund performance, the Independent Trustees periodically consider the appropriateness of fund performance metrics in evaluating the results achieved. In general, the Independent Trustees believe that fund performance should be evaluated based on net performance (after fees and expenses) of both the highest performing and lowest performing fund share classes, where applicable, compared to appropriate benchmark indices, over appropriate time periods that may include full market cycles, and compared to peer groups, as applicable, over the same periods, taking into account relevant factors including the following: general market conditions; issuer-specific information; and fund cash flows and other factors.The Independent Trustees recognize that shareholders evaluate performance on a net basis over their own holding periods, for which one-, three-, and five-year periods are often used as a proxy. For this reason, the performance information reviewed by the Board also included net cumulative total return information for the fund and an appropriate benchmark index and peer group for the most recent one- and three-year periods ended September 30, 2020, as shown below. Returns are shown compared to the 25th percentile (top of box, 75% beaten) and 75th percentile (bottom of box, 25% beaten) of the peer universe.Fidelity Large Cap Stock K6 Fund
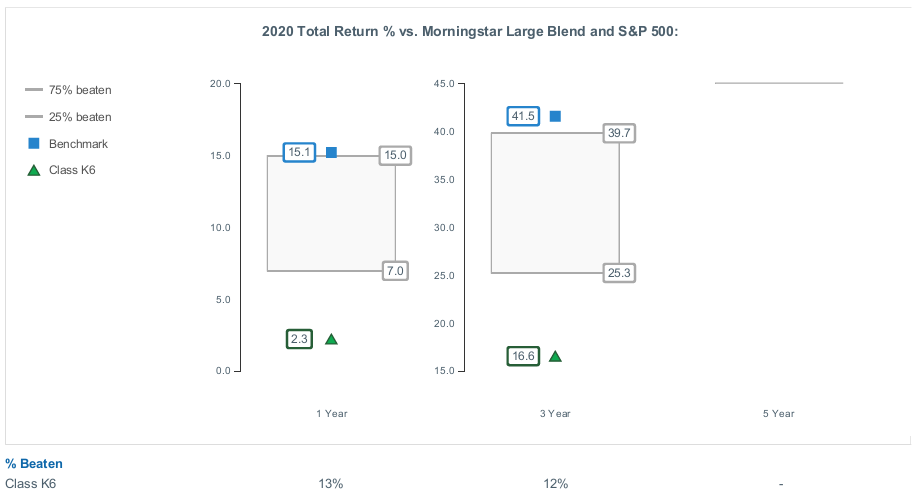
Fidelity Large Cap Stock K6 Fund
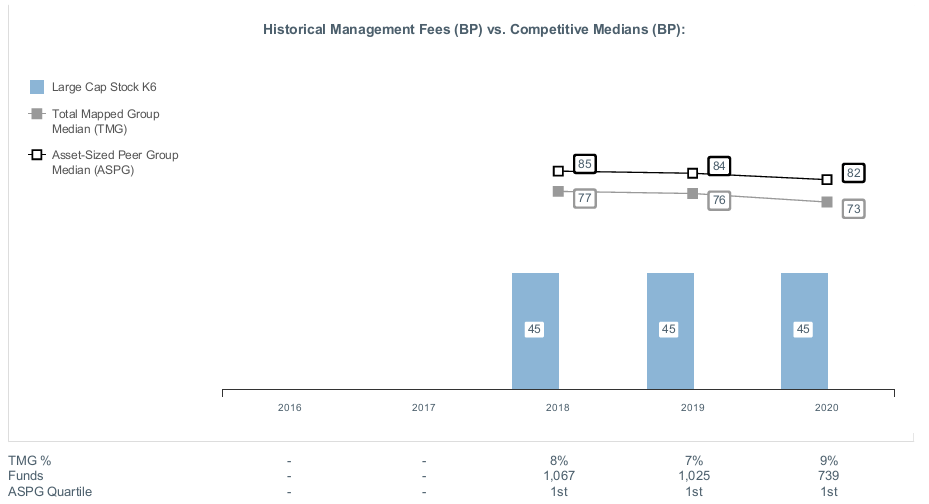
![]()
LCSK6-SANN-1221
1.9883970.104
Fidelity® Small Cap Stock K6 Fund
Semi-Annual Report
October 31, 2021
Contents
Board Approval of Investment Advisory Contracts and Management Fees |
To view a fund's proxy voting guidelines and proxy voting record for the 12-month period ended June 30, visit http://www.fidelity.com/proxyvotingresults or visit the Securities and Exchange Commission's (SEC) web site at http://www.sec.gov.
You may also call 1-800-835-5092 to request a free copy of the proxy voting guidelines.
Standard & Poor's, S&P and S&P 500 are registered service marks of The McGraw-Hill Companies, Inc. and have been licensed for use by Fidelity Distributors Corporation.
Other third-party marks appearing herein are the property of their respective owners.
All other marks appearing herein are registered or unregistered trademarks or service marks of FMR LLC or an affiliated company. © 2021 FMR LLC. All rights reserved.
This report and the financial statements contained herein are submitted for the general information of the shareholders of the Fund. This report is not authorized for distribution to prospective investors in the Fund unless preceded or accompanied by an effective prospectus.
A fund files its complete schedule of portfolio holdings with the SEC for the first and third quarters of each fiscal year on Form N-PORT. Forms N-PORT are available on the SEC’s web site at http://www.sec.gov. A fund's Forms N-PORT may be reviewed and copied at the SEC’s Public Reference Room in Washington, DC. Information regarding the operation of the SEC's Public Reference Room may be obtained by calling 1-800-SEC-0330.
For a complete list of a fund's portfolio holdings, view the most recent holdings listing, semiannual report, or annual report on Fidelity's web site at http://www.fidelity.com, http://www.institutional.fidelity.com, or http://www.401k.com, as applicable.
NOT FDIC INSURED •MAY LOSE VALUE •NO BANK GUARANTEE
Neither the Fund nor Fidelity Distributors Corporation is a bank.
Note to Shareholders:
Early in 2020, the outbreak and spread of COVID-19 emerged as a public health emergency that had a major influence on financial markets, primarily based on its impact on the global economy and corporate earnings. On March 11, 2020, the World Health Organization declared the COVID-19 outbreak a pandemic, citing sustained risk of further global spread. The pandemic prompted a number of measures to limit the spread of COVID-19, including travel and border restrictions, quarantines, and restrictions on large gatherings. In turn, these resulted in lower consumer activity, diminished demand for a wide range of products and services, disruption in manufacturing and supply chains, and – given the wide variability in outcomes regarding the outbreak – significant market uncertainty and volatility. To help stem the turmoil, the U.S. government took unprecedented action – in concert with the U.S. Federal Reserve and central banks around the world – to help support consumers, businesses, and the broader economy, and to limit disruption to the financial system.
In general, the overall impact of the pandemic lessened in 2021, amid a resilient economy and widespread distribution of three COVID-19 vaccines granted emergency use authorization from the U.S. Food and Drug Administration (FDA) early in the year. Still, the situation remains dynamic, and the extent and duration of its influence on financial markets and the economy is highly uncertain, due in part to a recent spike in cases based on highly contagious variants of the coronavirus.
Extreme events such as the COVID-19 crisis are exogenous shocks that can have significant adverse effects on mutual funds and their investments. Although multiple asset classes may be affected by market disruption, the duration and impact may not be the same for all types of assets. Fidelity is committed to helping you stay informed amid news about COVID-19 and during increased market volatility, and we continue to take extra steps to be responsive to customer needs. We encourage you to visit us online, where we offer ongoing updates, commentary, and analysis on the markets and our funds.
Investment Summary (Unaudited)
Top Ten Stocks as of October 31, 2021
| % of fund's net assets | |
| Insperity, Inc. | 2.5 |
| Builders FirstSource, Inc. | 2.4 |
| Medpace Holdings, Inc. | 2.3 |
| Walker & Dunlop, Inc. | 2.2 |
| GMS, Inc. | 2.2 |
| LPL Financial | 2.0 |
| TriNet Group, Inc. | 2.0 |
| Jones Lang LaSalle, Inc. | 2.0 |
| Concentrix Corp. | 1.8 |
| Semler Scientific, Inc. | 1.7 |
| 21.1 |
Top Five Market Sectors as of October 31, 2021
| % of fund's net assets | |
| Financials | 18.6 |
| Industrials | 18.4 |
| Health Care | 15.4 |
| Information Technology | 13.6 |
| Consumer Discretionary | 10.7 |
Asset Allocation (% of fund's net assets)
| As of October 31, 2021* | ||
| Stocks | 98.7% | |
| Short-Term Investments and Net Other Assets (Liabilities) | 1.3% | |

* Foreign investments - 15.1%
Schedule of Investments October 31, 2021 (Unaudited)
Showing Percentage of Net Assets
| Common Stocks - 98.7% | |||
| Shares | Value | ||
| COMMUNICATION SERVICES - 3.5% | |||
| Diversified Telecommunication Services - 1.2% | |||
| IDT Corp. Class B (a) | 13,777 | $666,393 | |
| LICT Corp. (a) | 8 | 200,000 | |
| 866,393 | |||
| Entertainment - 0.0% | |||
| Lions Gate Entertainment Corp. Class A (a) | 1,009 | 13,067 | |
| Interactive Media & Services - 1.1% | |||
| Outbrain, Inc. | 15,275 | 258,759 | |
| Trustpilot Group PLC (a)(b) | 6,200 | 26,847 | |
| ZipRecruiter, Inc. (a)(c) | 19,300 | 536,154 | |
| 821,760 | |||
| Media - 1.2% | |||
| Lee Enterprises, Inc. (a) | 8,760 | 183,522 | |
| Nexstar Broadcasting Group, Inc. Class A | 2,366 | 354,734 | |
| Tegna, Inc. | 18,400 | 361,744 | |
| 900,000 | |||
| TOTAL COMMUNICATION SERVICES | 2,601,220 | ||
| CONSUMER DISCRETIONARY - 10.7% | |||
| Diversified Consumer Services - 0.4% | |||
| Houghton Mifflin Harcourt Co. (a) | 22,800 | 323,532 | |
| Hotels, Restaurants & Leisure - 0.8% | |||
| Angler Gaming PLC | 34,957 | 52,509 | |
| Potbelly Corp. (a) | 26,929 | 162,113 | |
| RCI Hospitality Holdings, Inc. | 6,341 | 429,920 | |
| 644,542 | |||
| Household Durables - 0.1% | |||
| Cavco Industries, Inc. (a) | 300 | 72,114 | |
| Dream Finders Homes, Inc. (c) | 2,400 | 38,088 | |
| 110,202 | |||
| Internet & Direct Marketing Retail - 4.5% | |||
| a.k.a. Brands Holding Corp. | 23,821 | 242,260 | |
| BHG Group AB (a) | 46,835 | 539,082 | |
| Global-e Online Ltd. (a) | 4,000 | 231,440 | |
| Home24 AG (a) | 14,503 | 189,282 | |
| Kogan.Com Ltd. | 89,716 | 670,839 | |
| Liquidity Services, Inc. (a) | 9,447 | 208,590 | |
| Porch Group, Inc. Class A (a) | 17,300 | 363,819 | |
| Poshmark, Inc. | 12,800 | 311,424 | |
| Temple & Webster Group Ltd. (a) | 55,696 | 530,839 | |
| Vente-Unique.Com SA | 2,298 | 43,434 | |
| 3,331,009 | |||
| Leisure Products - 0.2% | |||
| Vista Outdoor, Inc. (a) | 3,543 | 148,239 | |
| Multiline Retail - 0.1% | |||
| Tuesday Morning Corp. (a) | 22,600 | 51,302 | |
| Specialty Retail - 4.1% | |||
| Camping World Holdings, Inc. (c) | 25,415 | 946,709 | |
| JOANN, Inc. (c) | 8,676 | 88,669 | |
| Lyko Group AB (A Shares) (a) | 5,848 | 194,411 | |
| Musti Group OYJ | 24,150 | 948,633 | |
| OneWater Marine, Inc. Class A (c) | 14,804 | 656,409 | |
| Tile Shop Holdings, Inc. (a)(c) | 24,934 | 207,950 | |
| 3,042,781 | |||
| Textiles, Apparel & Luxury Goods - 0.5% | |||
| Rocky Brands, Inc. | 6,364 | 347,156 | |
| TOTAL CONSUMER DISCRETIONARY | 7,998,763 | ||
| CONSUMER STAPLES - 3.3% | |||
| Food & Staples Retailing - 2.0% | |||
| BJ's Wholesale Club Holdings, Inc. (a) | 20,033 | 1,170,729 | |
| Cake Box Holdings PLC | 65,226 | 328,495 | |
| 1,499,224 | |||
| Personal Products - 0.4% | |||
| MediFast, Inc. | 1,588 | 311,677 | |
| Tobacco - 0.9% | |||
| Turning Point Brands, Inc. | 16,236 | 619,728 | |
| TOTAL CONSUMER STAPLES | 2,430,629 | ||
| ENERGY - 6.4% | |||
| Energy Equipment & Services - 0.7% | |||
| Liberty Oilfield Services, Inc. Class A (a)(c) | 37,252 | 481,296 | |
| Profire Energy, Inc. (a) | 10,576 | 12,585 | |
| 493,881 | |||
| Oil, Gas & Consumable Fuels - 5.7% | |||
| Bonanza Creek Energy, Inc. | 12,700 | 712,978 | |
| Brigham Minerals, Inc. Class A | 13,131 | 304,377 | |
| Enviva Partners LP | 7,985 | 534,676 | |
| Evolution Petroleum Corp. | 39,520 | 234,749 | |
| Extraction Oil & Gas, Inc. (a) | 6,651 | 443,156 | |
| Gulfport Energy Corp. (a)(c) | 8,284 | 679,619 | |
| Northern Oil & Gas, Inc. (c) | 29,109 | 674,164 | |
| Oasis Petroleum, Inc. | 3,951 | 476,491 | |
| SilverBow Resources, Inc. (a) | 7,864 | 217,046 | |
| 4,277,256 | |||
| TOTAL ENERGY | 4,771,137 | ||
| FINANCIALS - 18.6% | |||
| Banks - 0.4% | |||
| Parke Bancorp, Inc. | 6,570 | 145,657 | |
| Union Bankshares, Inc. | 3,904 | 124,928 | |
| 270,585 | |||
| Capital Markets - 6.9% | |||
| Bridge Investment Group Holdings, Inc. (c) | 41,717 | 790,537 | |
| Bridgepoint Group Holdings Ltd. (b) | 40,429 | 274,432 | |
| Gresham House PLC | 20,684 | 243,441 | |
| Impax Asset Management Group PLC | 74,209 | 1,113,084 | |
| Liontrust Asset Management PLC | 12,605 | 376,062 | |
| LPL Financial | 9,307 | 1,526,534 | |
| OTC Markets Group, Inc. Class A | 2,000 | 101,000 | |
| P10, Inc. (a)(c) | 17,700 | 221,250 | |
| P10, Inc. Class B (a) | 980 | 12,250 | |
| StepStone Group, Inc. Class A | 4,454 | 209,249 | |
| Titanium OYJ | 8,244 | 147,716 | |
| Westwood Holdings Group, Inc. | 7,659 | 133,267 | |
| 5,148,822 | |||
| Consumer Finance - 2.9% | |||
| Atlanticus Holdings Corp. (a)(c) | 4,300 | 333,207 | |
| First Cash Financial Services, Inc. | 11,143 | 985,821 | |
| Nelnet, Inc. Class A | 9,956 | 822,664 | |
| 2,141,692 | |||
| Insurance - 2.3% | |||
| GoHealth, Inc. (a) | 99,000 | 534,600 | |
| HCI Group, Inc. | 5,886 | 788,783 | |
| Tiptree, Inc. | 27,400 | 427,714 | |
| 1,751,097 | |||
| Thrifts & Mortgage Finance - 6.1% | |||
| Axos Financial, Inc. (a) | 21,339 | 1,130,967 | |
| Enact Holdings, Inc. | 16,486 | 378,848 | |
| Hingham Institution for Savings | 942 | 340,288 | |
| NMI Holdings, Inc. (a) | 23,763 | 576,966 | |
| Southern Missouri Bancorp, Inc. | 8,582 | 466,861 | |
| Walker & Dunlop, Inc. | 12,781 | 1,662,425 | |
| 4,556,355 | |||
| TOTAL FINANCIALS | 13,868,551 | ||
| HEALTH CARE - 15.4% | |||
| Biotechnology - 1.2% | |||
| Emergent BioSolutions, Inc. (a) | 11,465 | 546,537 | |
| Organogenesis Holdings, Inc. Class A (a)(c) | 34,900 | 383,202 | |
| 929,739 | |||
| Health Care Equipment & Supplies - 4.8% | |||
| Axonics Modulation Technologies, Inc. (a) | 8,900 | 652,815 | |
| Medistim ASA | 1,705 | 76,694 | |
| OrthoPediatrics Corp. (a)(c) | 6,510 | 463,317 | |
| Pro-Dex, Inc. (a) | 3,615 | 87,736 | |
| Sanara Medtech, Inc. (a) | 2,379 | 83,027 | |
| Semler Scientific, Inc. (a) | 8,303 | 1,245,367 | |
| TransMedics Group, Inc. (a) | 16,360 | 448,755 | |
| Tristel PLC | 39,847 | 267,210 | |
| Utah Medical Products, Inc. (c) | 2,394 | 231,811 | |
| 3,556,732 | |||
| Health Care Providers & Services - 1.2% | |||
| Acadia Healthcare Co., Inc. (a) | 972 | 60,264 | |
| ATI Physical Therapy, Inc. | 6,396 | 18,357 | |
| The Ensign Group, Inc. | 1,467 | 114,441 | |
| The Joint Corp. (a)(c) | 6,377 | 557,860 | |
| Viemed Healthcare, Inc. (a) | 23,928 | 137,273 | |
| 888,195 | |||
| Health Care Technology - 4.5% | |||
| Evolent Health, Inc. (a)(c) | 30,561 | 894,520 | |
| Health Catalyst, Inc. (a)(c) | 13,800 | 726,432 | |
| Omnicell, Inc. (a) | 2,400 | 427,560 | |
| Phreesia, Inc. (a) | 15,621 | 1,101,905 | |
| Schrodinger, Inc. (a) | 4,216 | 230,109 | |
| 3,380,526 | |||
| Life Sciences Tools & Services - 3.2% | |||
| Addlife AB | 17,100 | 699,292 | |
| Medpace Holdings, Inc. (a) | 7,419 | 1,680,774 | |
| 2,380,066 | |||
| Pharmaceuticals - 0.5% | |||
| Harrow Health, Inc. (a)(c) | 36,678 | 370,081 | |
| TOTAL HEALTH CARE | 11,505,339 | ||
| INDUSTRIALS - 18.4% | |||
| Building Products - 2.5% | |||
| Builders FirstSource, Inc. (a) | 30,374 | 1,769,893 | |
| Reliance Worldwide Corp. Ltd. | 24,083 | 104,532 | |
| 1,874,425 | |||
| Commercial Services & Supplies - 0.8% | |||
| Qleanair Holding AB | 37,400 | 281,327 | |
| Sdiptech AB (a) | 6,290 | 327,757 | |
| 609,084 | |||
| Construction & Engineering - 1.5% | |||
| NV5 Global, Inc. (a)(c) | 10,557 | 1,099,300 | |
| Electrical Equipment - 0.3% | |||
| Orion Energy Systems, Inc. (a) | 2,822 | 11,542 | |
| Powell Industries, Inc. | 8,851 | 228,887 | |
| 240,429 | |||
| Industrial Conglomerates - 0.2% | |||
| Volati AB | 8,100 | 181,090 | |
| Machinery - 0.7% | |||
| Hurco Companies, Inc. | 14,583 | 473,218 | |
| Twin Disc, Inc. (a) | 4,361 | 59,222 | |
| 532,440 | |||
| Professional Services - 9.5% | |||
| CACI International, Inc. Class A (a) | 2,150 | 618,426 | |
| First Advantage Corp. | 34,227 | 640,045 | |
| Franklin Covey Co. (a) | 17,975 | 759,444 | |
| Insperity, Inc. | 14,737 | 1,842,123 | |
| Kelly Partners Group Holdings Ltd. | 27,322 | 74,402 | |
| MISTRAS Group, Inc. (a) | 22,134 | 217,356 | |
| Red Violet, Inc. (a)(c) | 23,791 | 757,743 | |
| Sterling Check Corp. | 16,600 | 356,070 | |
| Talenom OYJ | 20,679 | 332,278 | |
| TriNet Group, Inc. (a) | 14,639 | 1,482,199 | |
| 7,080,086 | |||
| Trading Companies & Distributors - 2.9% | |||
| DXP Enterprises, Inc. (a) | 9,343 | 307,945 | |
| GMS, Inc. (a) | 32,161 | 1,592,934 | |
| Teqnion AB (a) | 14,300 | 224,790 | |
| 2,125,669 | |||
| TOTAL INDUSTRIALS | 13,742,523 | ||
| INFORMATION TECHNOLOGY - 13.6% | |||
| Electronic Equipment & Components - 1.4% | |||
| Insight Enterprises, Inc. (a) | 6,773 | 641,403 | |
| TD SYNNEX Corp. | 3,515 | 369,075 | |
| 1,010,478 | |||
| IT Services - 5.5% | |||
| Cass Information Systems, Inc. | 8,600 | 352,514 | |
| Concentrix Corp. | 7,552 | 1,341,839 | |
| Cyxtera Technologies, Inc.: | |||
| warrants 9/10/27 (a) | 12,727 | 29,654 | |
| Class A (a) | 47,484 | 471,991 | |
| Dlocal Ltd. | 900 | 43,659 | |
| ECIT A/S (a) | 209,894 | 241,003 | |
| MoneyGram International, Inc. (a) | 77,295 | 461,451 | |
| Paya Holdings, Inc. (a) | 66,348 | 604,430 | |
| Paymentus Holdings, Inc. (a) | 300 | 7,680 | |
| Priority Technology Holdings, Inc. (a) | 59,582 | 314,593 | |
| TaskUs, Inc. | 3,600 | 208,440 | |
| 4,077,254 | |||
| Software - 6.0% | |||
| 24sevenoffice Scandinavia AB (a) | 56,506 | 111,196 | |
| Admicom OYJ | 1,284 | 136,556 | |
| CCC Intelligent Solutions Holdings, Inc. Class A (a) | 21,573 | 258,445 | |
| ChannelAdvisor Corp. (a) | 36,458 | 930,044 | |
| Cint Group AB | 7,886 | 119,006 | |
| E2open Parent Holdings, Inc. (a)(c) | 44,946 | 561,825 | |
| EcoOnline Holding A/S (a) | 18,300 | 47,657 | |
| Elmo Software Ltd. (a) | 29,303 | 116,829 | |
| EverCommerce, Inc. | 20,198 | 417,695 | |
| GetBusy PLC (a) | 104,739 | 96,755 | |
| Intapp, Inc. | 9,192 | 248,184 | |
| Intelligent Systems Corp. (a)(c) | 7,745 | 327,846 | |
| LeadDesk Oyj (a) | 5,247 | 146,179 | |
| Orn Software A/S (a) | 88,900 | 104,286 | |
| Park City Group, Inc. (a)(c) | 31,124 | 176,473 | |
| Paycor HCM, Inc. | 300 | 9,732 | |
| SecureWorks Corp. (a)(c) | 14,900 | 274,458 | |
| Sikri Holding A/S (a) | 11,749 | 170,368 | |
| Upsales Technology AB (a) | 23,319 | 228,085 | |
| 4,481,619 | |||
| Technology Hardware, Storage & Peripherals - 0.7% | |||
| Avid Technology, Inc. (a) | 18,825 | 539,148 | |
| TOTAL INFORMATION TECHNOLOGY | 10,108,499 | ||
| MATERIALS - 1.5% | |||
| Chemicals - 0.9% | |||
| Ciner Resources LP (a) | 800 | 13,000 | |
| Hawkins, Inc. | 4,462 | 163,622 | |
| Intrepid Potash, Inc. (a) | 3,786 | 184,416 | |
| Nanophase Technologies Corp. (a) | 13,413 | 42,922 | |
| The Chemours Co. LLC | 9,735 | 272,775 | |
| 676,735 | |||
| Containers & Packaging - 0.3% | |||
| UFP Technologies, Inc. (a) | 3,648 | 225,775 | |
| Metals & Mining - 0.3% | |||
| Steel Dynamics, Inc. | 3,147 | 207,954 | |
| TOTAL MATERIALS | 1,110,464 | ||
| REAL ESTATE - 6.7% | |||
| Equity Real Estate Investment Trusts (REITs) - 2.2% | |||
| Essential Properties Realty Trust, Inc. | 23,429 | 697,950 | |
| Plymouth Industrial REIT, Inc. | 13,500 | 345,060 | |
| Spirit Realty Capital, Inc. | 11,949 | 584,665 | |
| 1,627,675 | |||
| Real Estate Management & Development - 4.5% | |||
| BBX Capital, Inc. (a) | 13,606 | 135,924 | |
| Cushman & Wakefield PLC (a) | 36,023 | 662,463 | |
| Jones Lang LaSalle, Inc. (a) | 5,688 | 1,468,812 | |
| Marcus & Millichap, Inc. (a) | 11,600 | 546,360 | |
| Newmark Group, Inc. | 37,014 | 550,768 | |
| 3,364,327 | |||
| TOTAL REAL ESTATE | 4,992,002 | ||
| UTILITIES - 0.6% | |||
| Independent Power and Renewable Electricity Producers - 0.6% | |||
| NextEra Energy Partners LP | 4,874 | 420,626 | |
| TOTAL COMMON STOCKS | |||
| (Cost $56,604,629) | 73,549,753 | ||
| Money Market Funds - 7.4% | |||
| Fidelity Cash Central Fund 0.06% (d) | 339,707 | 339,775 | |
| Fidelity Securities Lending Cash Central Fund 0.06% (d)(e) | 5,159,848 | 5,160,364 | |
| TOTAL MONEY MARKET FUNDS | |||
| (Cost $5,500,139) | 5,500,139 | ||
| TOTAL INVESTMENT IN SECURITIES - 106.1% | |||
| (Cost $62,104,768) | 79,049,892 | ||
| NET OTHER ASSETS (LIABILITIES) - (6.1)% | (4,520,784) | ||
| NET ASSETS - 100% | $74,529,108 |
Legend
(a) Non-income producing
(b) Security exempt from registration under Rule 144A of the Securities Act of 1933. These securities may be resold in transactions exempt from registration, normally to qualified institutional buyers. At the end of the period, the value of these securities amounted to $301,279 or 0.4% of net assets.
(c) Security or a portion of the security is on loan at period end.
(d) Affiliated fund that is generally available only to investment companies and other accounts managed by Fidelity Investments. The rate quoted is the annualized seven-day yield of the fund at period end. A complete unaudited listing of the fund's holdings as of its most recent quarter end is available upon request. In addition, each Fidelity Central Fund's financial statements are available on the SEC's website or upon request.
(e) Investment made with cash collateral received from securities on loan.
Affiliated Central Funds
Fiscal year to date information regarding the Fund's investments in Fidelity Central Funds, including the ownership percentage, is presented below.
| Fund | Value, beginning of period | Purchases | Sales Proceeds | Dividend Income | Realized Gain/Loss | Change in Unrealized appreciation (depreciation) | Value, end of period | % ownership, end of period |
| Fidelity Cash Central Fund 0.06% | $240,360 | $10,288,647 | $10,189,232 | $70 | $-- | $-- | $339,775 | 0.0% |
| Fidelity Securities Lending Cash Central Fund 0.06% | 2,798,014 | 18,101,626 | 15,739,276 | 33,248 | -- | -- | 5,160,364 | 0.0% |
| Total | $3,038,374 | $28,390,273 | $25,928,508 | $33,318 | $-- | $-- | $5,500,139 |
Amounts in the income column in the above table include any capital gain distributions from underlying funds, which are presented in the corresponding line-item in the Statement of Operations, if applicable. Amount for Fidelity Securities Lending Cash Central Fund represents the income earned on investing cash collateral, less rebates paid to borrowers and any lending agent fees associated with the loan, plus any premium payments received for lending certain types of securities.
Investment Valuation
The following is a summary of the inputs used, as of October 31, 2021, involving the Fund's assets and liabilities carried at fair value. The inputs or methodology used for valuing securities may not be an indication of the risk associated with investing in those securities. For more information on valuation inputs, and their aggregation into the levels used below, please refer to the Investment Valuation section in the accompanying Notes to Financial Statements.
| Valuation Inputs at Reporting Date: | ||||
| Description | Total | Level 1 | Level 2 | Level 3 |
| Investments in Securities: | ||||
| Equities: | ||||
| Communication Services | $2,601,220 | $2,601,220 | $-- | $-- |
| Consumer Discretionary | 7,998,763 | 7,998,763 | -- | -- |
| Consumer Staples | 2,430,629 | 2,430,629 | -- | -- |
| Energy | 4,771,137 | 4,771,137 | -- | -- |
| Financials | 13,868,551 | 13,868,551 | -- | -- |
| Health Care | 11,505,339 | 11,505,339 | -- | -- |
| Industrials | 13,742,523 | 13,742,523 | -- | -- |
| Information Technology | 10,108,499 | 10,108,499 | -- | -- |
| Materials | 1,110,464 | 1,110,464 | -- | -- |
| Real Estate | 4,992,002 | 4,992,002 | -- | -- |
| Utilities | 420,626 | 420,626 | -- | -- |
| Money Market Funds | 5,500,139 | 5,500,139 | -- | -- |
| Total Investments in Securities: | $79,049,892 | $79,049,892 | $-- | $-- |
Other Information
Distribution of investments by country or territory of incorporation, as a percentage of Total Net Assets, is as follows (Unaudited):
| United States of America | 84.9% |
| United Kingdom | 4.5% |
| Sweden | 3.8% |
| Finland | 2.3% |
| Australia | 2.0% |
| Others (Individually Less Than 1%) | 2.5% |
| 100.0% |
See accompanying notes which are an integral part of the financial statements.
Financial Statements
Statement of Assets and Liabilities
| October 31, 2021 (Unaudited) | ||
| Assets | ||
| Investment in securities, at value (including securities loaned of $5,027,081) — See accompanying schedule: Unaffiliated issuers (cost $56,604,629) | $73,549,753 | |
| Fidelity Central Funds (cost $5,500,139) | 5,500,139 | |
| Total Investment in Securities (cost $62,104,768) | $79,049,892 | |
| Cash | 106,842 | |
| Foreign currency held at value (cost $128) | 128 | |
| Receivable for investments sold | 895,421 | |
| Receivable for fund shares sold | 17,666 | |
| Distributions receivable from Fidelity Central Funds | 2,979 | |
| Other receivables | 4,075 | |
| Total assets | 80,077,003 | |
| Liabilities | ||
| Payable for investments purchased | $346,008 | |
| Payable for fund shares redeemed | 4,712 | |
| Accrued management fee | 36,738 | |
| Other payables and accrued expenses | 262 | |
| Collateral on securities loaned | 5,160,175 | |
| Total liabilities | 5,547,895 | |
| Net Assets | $74,529,108 | |
| Net Assets consist of: | ||
| Paid in capital | $48,324,627 | |
| Total accumulated earnings (loss) | 26,204,481 | |
| Net Assets | $74,529,108 | |
| Net Asset Value, offering price and redemption price per share ($74,529,108 ÷ 4,884,658 shares) | $15.26 |
See accompanying notes which are an integral part of the financial statements.
Statement of Operations
| Six months ended October 31, 2021 (Unaudited) | ||
| Investment Income | ||
| Dividends | $343,124 | |
| Income from Fidelity Central Funds (including $33,248 from security lending) | 33,318 | |
| Total income | 376,442 | |
| Expenses | ||
| Management fee | $223,884 | |
| Independent trustees' fees and expenses | 135 | |
| Total expenses before reductions | 224,019 | |
| Expense reductions | (16) | |
| Total expenses after reductions | 224,003 | |
| Net investment income (loss) | 152,439 | |
| Realized and Unrealized Gain (Loss) | ||
| Net realized gain (loss) on: | ||
| Investment securities: | ||
| Unaffiliated issuers | 9,373,708 | |
| Foreign currency transactions | 5,877 | |
| Total net realized gain (loss) | 9,379,585 | |
| Change in net unrealized appreciation (depreciation) on: | ||
| Investment securities: | ||
| Unaffiliated issuers | (5,439,662) | |
| Unfunded commitments | 1,081 | |
| Assets and liabilities in foreign currencies | (42) | |
| Total change in net unrealized appreciation (depreciation) | (5,438,623) | |
| Net gain (loss) | 3,940,962 | |
| Net increase (decrease) in net assets resulting from operations | $4,093,401 |
See accompanying notes which are an integral part of the financial statements.
Statement of Changes in Net Assets
| Six months ended October 31, 2021 (Unaudited) | Year ended April 30, 2021 | |
| Increase (Decrease) in Net Assets | ||
| Operations | ||
| Net investment income (loss) | $152,439 | $209,616 |
| Net realized gain (loss) | 9,379,585 | 17,891,330 |
| Change in net unrealized appreciation (depreciation) | (5,438,623) | 23,503,619 |
| Net increase (decrease) in net assets resulting from operations | 4,093,401 | 41,604,565 |
| Distributions to shareholders | (5,749,704) | (258,445) |
| Share transactions | ||
| Proceeds from sales of shares | 3,497,068 | 13,046,911 |
| Reinvestment of distributions | 5,749,705 | 258,445 |
| Cost of shares redeemed | (8,933,535) | (50,808,620) |
| Net increase (decrease) in net assets resulting from share transactions | 313,238 | (37,503,264) |
| Total increase (decrease) in net assets | (1,343,065) | 3,842,856 |
| Net Assets | ||
| Beginning of period | 75,872,173 | 72,029,317 |
| End of period | $74,529,108 | $75,872,173 |
| Other Information | ||
| Shares | ||
| Sold | 231,629 | 1,036,548 |
| Issued in reinvestment of distributions | 389,546 | 20,758 |
| Redeemed | (597,613) | (3,994,912) |
| Net increase (decrease) | 23,562 | (2,937,606) |
See accompanying notes which are an integral part of the financial statements.
Financial Highlights
Fidelity Small Cap Stock K6 Fund
| Six months ended (Unaudited) October 31, | Years endedApril 30, | ||||
| 2021 | 2021 | 2020 | 2019 | 2018 A | |
| Selected Per–Share Data | |||||
| Net asset value, beginning of period | $15.61 | $9.24 | $11.16 | $11.02 | $10.00 |
| Income from Investment Operations | |||||
| Net investment income (loss)B | .03 | .03 | .06 | .08C | .06 |
| Net realized and unrealized gain (loss) | .80 | 6.38 | (1.88) | .57 | 1.02 |
| Total from investment operations | .83 | 6.41 | (1.82) | .65 | 1.08 |
| Distributions from net investment income | –D | (.04) | (.10) | (.05) | (.03) |
| Distributions from net realized gain | (1.18) | – | – | (.46) | (.04) |
| Total distributions | (1.18) | (.04) | (.10) | (.51) | (.06)E |
| Net asset value, end of period | $15.26 | $15.61 | $9.24 | $11.16 | $11.02 |
| Total ReturnF,G | 5.59% | 69.44% | (16.50)% | 6.43% | 10.83% |
| Ratios to Average Net AssetsH,I | |||||
| Expenses before reductions | .60%J | .60% | .60% | .60% | .60%J |
| Expenses net of fee waivers, if any | .60%J | .60% | .60% | .60% | .60%J |
| Expenses net of all reductions | .60%J | .56% | .60% | .59% | .59%J |
| Net investment income (loss) | .41%J | .27% | .58% | .71%C | .56%J |
| Supplemental Data | |||||
| Net assets, end of period (000 omitted) | $74,529 | $75,872 | $72,029 | $88,686 | $96,525 |
| Portfolio turnover rateK | 125%J | 136%D | 73%D | 75%D | 90%D,J |
A For the period May 25, 2017 (commencement of operations) through April 30, 2018.
B Calculated based on average shares outstanding during the period.
C Net investment income per share reflects one or more large, non-recurring dividend(s) which amounted to $.03 per share. Excluding such non-recurring dividend(s), the ratio of net investment income (loss) to average net assets would have been .47%.
D Portfolio turnover rate excludes securities received or delivered in-kind.
E Total distributions per share do not sum due to rounding.
F Total returns for periods of less than one year are not annualized.
G Total returns would have been lower if certain expenses had not been reduced during the applicable periods shown.
H Fees and expenses of any underlying mutual funds or exchange-traded funds (ETFs) are not included in the Fund's expense ratio. The Fund indirectly bears its proportionate share of these expenses. For additional expense information related to investments in Fidelity Central Funds, please refer to the "Investments in Fidelity Central Funds" note found in the Notes to Financial Statements section of the most recent Annual or Semi-Annual report.
I Expense ratios reflect operating expenses of the class. Expenses before reductions do not reflect amounts reimbursed, waived, or reduced through arrangements with the investment adviser, brokerage services, or other offset arrangements, if applicable, and do not represent the amount paid by the class during periods when reimbursements, waivers or reductions occur.
J Annualized
K Amount does not include the portfolio activity of any underlying mutual funds or exchange-traded funds (ETFs).
See accompanying notes which are an integral part of the financial statements.
Notes to Financial Statements (Unaudited)
For the period ended October 31, 2021
1. Organization.
Fidelity Small Cap Stock K6 Fund (the Fund) is a fund of Fidelity Concord Street Trust (the Trust) and is authorized to issue an unlimited number of shares. Share transactions on the Statement of Changes in Net Assets may contain exchanges between affiliated funds. The Trust is registered under the Investment Company Act of 1940, as amended (the 1940 Act), as an open-end management investment company organized as a Massachusetts business trust. Shares generally are available only to employer-sponsored retirement plans that are recordkept by Fidelity, or to certain employer-sponsored retirement plans that are not recordkept by Fidelity.
2. Investments in Fidelity Central Funds.
Funds may invest in Fidelity Central Funds, which are open-end investment companies generally available only to other investment companies and accounts managed by the investment adviser and its affiliates. The Schedule of Investments lists any Fidelity Central Funds held as an investment as of period end, but does not include the underlying holdings of each Fidelity Central Fund. An investing fund indirectly bears its proportionate share of the expenses of the underlying Fidelity Central Funds.
Based on its investment objective, each Fidelity Central Fund may invest or participate in various investment vehicles or strategies that are similar to those of the investing fund. These strategies are consistent with the investment objectives of the investing fund and may involve certain economic risks which may cause a decline in value of each of the Fidelity Central Funds and thus a decline in the value of the investing fund.
| Fidelity Central Fund | Investment Manager | Investment Objective | Investment Practices | Expense Ratio(a) |
| Fidelity Money Market Central Funds | Fidelity Management & Research Company LLC (FMR) | Each fund seeks to obtain a high level of current income consistent with the preservation of capital and liquidity. | Short-term Investments | Less than .005% to .01% |
(a) Expenses expressed as a percentage of average net assets and are as of each underlying Central Fund's most recent annual or semi-annual shareholder report.
A complete unaudited list of holdings for each Fidelity Central Fund is available upon request or at the Securities and Exchange Commission website at www.sec.gov. In addition, the financial statements of the Fidelity Central Funds which contain the significant accounting policies (including investment valuation policies) of those funds, and are not covered by the Report of Independent Registered Public Accounting Firm, are available on the Securities and Exchange Commission website or upon request.
3. Significant Accounting Policies.
The Fund is an investment company and applies the accounting and reporting guidance of the Financial Accounting Standards Board (FASB) Accounting Standards Codification Topic 946 Financial Services - Investment Companies. The financial statements have been prepared in conformity with accounting principles generally accepted in the United States of America (GAAP), which require management to make certain estimates and assumptions at the date of the financial statements. Actual results could differ from those estimates. Subsequent events, if any, through the date that the financial statements were issued have been evaluated in the preparation of the financial statements. The Fund's Schedule of Investments lists any underlying mutual funds or exchange-traded funds (ETFs) but does not include the underlying holdings of these funds. The following summarizes the significant accounting policies of the Fund:
Investment Valuation. Investments are valued as of 4:00 p.m. Eastern time on the last calendar day of the period. The Board of Trustees (the Board) has delegated the day to day responsibility for the valuation of the Fund's investments to the Fair Value Committee (the Committee) established by the Fund's investment adviser. In accordance with valuation policies and procedures approved by the Board, the Fund attempts to obtain prices from one or more third party pricing vendors or brokers to value its investments. When current market prices, quotations or currency exchange rates are not readily available or reliable, investments will be fair valued in good faith by the Committee, in accordance with procedures adopted by the Board. Factors used in determining fair value vary by investment type and may include market or investment specific events. The frequency with which these procedures are used cannot be predicted and they may be utilized to a significant extent. The Committee oversees the Fund's valuation policies and procedures and reports to the Board on the Committee's activities and fair value determinations. The Board monitors the appropriateness of the procedures used in valuing the Fund's investments and ratifies the fair value determinations of the Committee.
The Fund categorizes the inputs to valuation techniques used to value its investments into a disclosure hierarchy consisting of three levels as shown below:
- Level 1 – quoted prices in active markets for identical investments
- Level 2 – other significant observable inputs (including quoted prices for similar investments, interest rates, prepayment speeds, etc.)
- Level 3 – unobservable inputs (including the Fund's own assumptions based on the best information available)
Valuation techniques used to value the Fund's investments by major category are as follows:
Equity securities, including restricted securities, for which market quotations are readily available, are valued at the last reported sale price or official closing price as reported by a third party pricing vendor on the primary market or exchange on which they are traded and are categorized as Level 1 in the hierarchy. In the event there were no sales during the day or closing prices are not available, securities are valued at the last quoted bid price or may be valued using the last available price and are generally categorized as Level 2 in the hierarchy. For foreign equity securities, when market or security specific events arise, comparisons to the valuation of American Depositary Receipts (ADRs), futures contracts, ETFs and certain indexes as well as quoted prices for similar securities may be used and would be categorized as Level 2 in the hierarchy. For equity securities, including restricted securities, where observable inputs are limited, assumptions about market activity and risk are used and these securities may be categorized as Level 3 in the hierarchy.
Investments in open-end mutual funds, including the Fidelity Central Funds, are valued at their closing net asset value (NAV) each business day and are categorized as Level 1 in the hierarchy.
Changes in valuation techniques may result in transfers in or out of an assigned level within the disclosure hierarchy. The aggregate value of investments by input level as of October 31, 2021 is included at the end of the Fund's Schedule of Investments.
Foreign Currency. Certain Funds may use foreign currency contracts to facilitate transactions in foreign-denominated securities. Gains and losses from these transactions may arise from changes in the value of the foreign currency or if the counterparties do not perform under the contracts' terms.
Foreign-denominated assets, including investment securities, and liabilities are translated into U.S. dollars at the exchange rates at period end. Purchases and sales of investment securities, income and dividends received, and expenses denominated in foreign currencies are translated into U.S. dollars at the exchange rate in effect on the transaction date.
The effects of exchange rate fluctuations on investments are included with the net realized and unrealized gain (loss) on investment securities. Other foreign currency transactions resulting in realized and unrealized gain (loss) are disclosed separately.
Investment Transactions and Income. For financial reporting purposes, the Fund's investment holdings and NAV include trades executed through the end of the last business day of the period. The NAV per share for processing shareholder transactions is calculated as of the close of business of the New York Stock Exchange (NYSE), normally 4:00 p.m. Eastern time and includes trades executed through the end of the prior business day. Gains and losses on securities sold are determined on the basis of identified cost. Commissions paid to certain brokers with whom the investment adviser, or its affiliates, places trades on behalf of a fund include an amount in addition to trade execution, which may be rebated back to a fund. Any such rebates are included in net realized gain (loss) on investments in the Statement of Operations. Dividend income is recorded on the ex-dividend date, except for certain dividends from foreign securities where the ex-dividend date may have passed, which are recorded as soon as the Fund is informed of the ex-dividend date. Non-cash dividends included in dividend income, if any, are recorded at the fair market value of the securities received. Income and capital gain distributions from Fidelity Central Funds, if any, are recorded on the ex-dividend date. Certain distributions received by the Fund represent a return of capital or capital gain. The Fund determines the components of these distributions subsequent to the ex-dividend date, based upon receipt of tax filings or other correspondence relating to the underlying investment. These distributions are recorded as a reduction of cost of investments and/or as a realized gain. Investment income is recorded net of foreign taxes withheld where recovery of such taxes is uncertain. Funds may file withholding tax reclaims in certain jurisdictions to recover a portion of amounts previously withheld. Any withholding tax reclaims income is included in the Statement of Operations in dividends. Any receivables for withholding tax reclaims are included in the Statement of Assets and Liabilities in dividends receivable.
Expenses. Expenses directly attributable to a fund are charged to that fund. Expenses attributable to more than one fund are allocated among the respective funds on the basis of relative net assets or other appropriate methods. Expenses included in the accompanying financial statements reflect the expenses of that fund and do not include any expenses associated with any underlying mutual funds or exchange-traded funds. Although not included in a fund's expenses, a fund indirectly bears its proportionate share of these expenses through the net asset value of each underlying mutual fund or exchange-traded fund. Expense estimates are accrued in the period to which they relate and adjustments are made when actual amounts are known.
Income Tax Information and Distributions to Shareholders. Each year, the Fund intends to qualify as a regulated investment company under Subchapter M of the Internal Revenue Code, including distributing substantially all of its taxable income and realized gains. As a result, no provision for U.S. Federal income taxes is required. The Fund files a U.S. federal tax return, in addition to state and local tax returns as required. The Fund's federal income tax returns are subject to examination by the Internal Revenue Service (IRS) for a period of three fiscal years after they are filed. State and local tax returns may be subject to examination for an additional fiscal year depending on the jurisdiction. Foreign taxes are provided for based on the Fund's understanding of the tax rules and rates that exist in the foreign markets in which it invests.
Distributions are declared and recorded on the ex-dividend date. Income and capital gain distributions are determined in accordance with income tax regulations, which may differ from GAAP.
Capital accounts within the financial statements are adjusted for permanent book-tax differences. These adjustments have no impact on net assets or the results of operations. Capital accounts are not adjusted for temporary book-tax differences which will reverse in a subsequent period.
Book-tax differences are primarily due to foreign currency transactions, passive foreign investment companies (PFIC), redemptions in kind, partnerships, capital loss carryforwards and losses deferred due to wash sales.
As of period end, the cost and unrealized appreciation (depreciation) in securities, and derivatives if applicable, for federal income tax purposes were as follows:
| Gross unrealized appreciation | $18,921,338 |
| Gross unrealized depreciation | (2,218,496) |
| Net unrealized appreciation (depreciation) | $16,702,842 |
| Tax cost | $62,347,050 |
Restricted Securities (including Private Placements). Funds may invest in securities that are subject to legal or contractual restrictions on resale. These securities generally may be resold in transactions exempt from registration or to the public if the securities are registered. Disposal of these securities may involve time-consuming negotiations and expense, and prompt sale at an acceptable price may be difficult. Information regarding restricted securities held at period end is included at the end of the Schedule of Investments, if applicable.
Special Purpose Acquisition Companies. Funds may invest in stock, warrants, and other securities of special purpose acquisition companies (SPACs) or similar special purpose entities. A SPAC is a publicly traded company that raises investment capital via an initial public offering (IPO) for the purpose of acquiring the equity securities of one or more existing companies via merger, business combination, acquisition or other similar transactions within a designated time frame.
Private Investment in Public Equity. Funds may acquire equity securities of an issuer through a private investment in a public equity (PIPE) transaction, including through commitments to purchase securities on a when-issued basis. A PIPE typically involves the purchase of securities directly from a publicly traded company in a private placement transaction. Securities purchased through PIPE transactions will be restricted from trading and considered illiquid until a resale registration statement for the shares is filed and declared effective.
At period end, the Fund had commitments to purchase when-issued securities through PIPE transactions with SPACs. The commitments are contingent upon the SPACs acquiring the securities of target companies. Unrealized appreciation (depreciation) on these commitments is separately presented in the Statements of Assets and Liabilities as Unrealized appreciation (depreciation) on unfunded commitments, and in the Statement of Operations as Change in unrealized appreciation (depreciation) on unfunded commitments.
4. Purchases and Sales of Investments.
Purchases and sales of securities, other than short-term securities and in-kind transactions, as applicable, are noted in the table below.
| Purchases ($) | Sales ($) | |
| Fidelity Small Cap Stock K6 Fund | 46,667,735 | 52,202,718 |
Prior Fiscal Year Unaffiliated Redemptions In-Kind. Shares that were redeemed in-kind for investments, including accrued interest and cash, if any, are shown in the table below; along with realized gain or loss on investments delivered through in-kind redemptions. The amount of the in-kind redemptions is included in share transactions in the accompanying Statement of Changes in Net Assets. There was no gain or loss for federal income tax purposes.
| Shares | Total net realized gain or loss ($) | Total Proceeds ($) | |
| Fidelity Small Cap Stock K6 Fund | 369,492 | 1,380,106 | 4,171,562 |
Prior Year Unaffiliated Exchanges In-Kind. Shares that were exchanged for investments, including accrued interest and cash, if any, are shown in the table below. The amount of in-kind exchanges is included in share transactions in the accompanying Statement of Changes in Net Assets.
| Shares | Total Proceeds ($) | |
| Fidelity Small Cap Stock K6 Fund | 259,151 | 3,200,516 |
5. Fees and Other Transactions with Affiliates.
Management Fee. Fidelity Management & Research Company LLC (the investment adviser) and its affiliates provide the Fund with investment management related services for which the Fund pays a monthly management fee that is based on an annual rate of .60% of average net assets. Under the management contract, the investment adviser or an affiliate pays all other expenses of the Fund, excluding fees and expenses of the independent Trustees, and certain miscellaneous expenses such as proxy and shareholder meeting expenses.
Brokerage Commissions. A portion of portfolio transactions were placed with brokerage firms which are affiliates of the investment adviser. Brokerage commissions are included in net realized gain (loss) and change in net unrealized appreciation (depreciation) in the Statement of Operations. The commissions paid to these affiliated firms were as follows:
| Amount | |
| Fidelity Small Cap Stock K6 Fund | $2,451 |
Interfund Trades. Funds may purchase from or sell securities to other Fidelity Funds under procedures adopted by the Board. The procedures have been designed to ensure these interfund trades are executed in accordance with Rule 17a-7 of the 1940 Act. Any interfund trades are included within the respective purchases and sales amounts shown in the Purchases and Sales of Investments note. Interfund trades during the period are noted in the table below.
| Purchases ($) | Sales ($) | Realized Gain (Loss) ($) | |
| Fidelity Small Cap Stock K6 Fund | 1,390,873 | 2,923,587 | 681,412 |
6. Committed Line of Credit.
Certain Funds participate with other funds managed by the investment adviser or an affiliate in a $4.25 billion credit facility (the "line of credit") to be utilized for temporary or emergency purposes to fund shareholder redemptions or for other short-term liquidity purposes. The commitment fees on the pro-rata portion of the line of credit are borne by the investment adviser. During the period, there were no borrowings on this line of credit.
7. Security Lending.
Funds lend portfolio securities from time to time in order to earn additional income. Lending agents are used, including National Financial Services (NFS), an affiliate of the investment adviser. Pursuant to a securities lending agreement, NFS will receive a fee, which is capped at 9.9% of a fund's daily lending revenue, for its services as lending agent. A fund may lend securities to certain qualified borrowers, including NFS. On the settlement date of the loan, a fund receives collateral (in the form of U.S. Treasury obligations, letters of credit and/or cash) against the loaned securities and maintains collateral in an amount not less than 100% of the market value of the loaned securities during the period of the loan. The market value of the loaned securities is determined at the close of business of a fund and any additional required collateral is delivered to a fund on the next business day. A fund or borrower may terminate the loan at any time, and if the borrower defaults on its obligation to return the securities loaned because of insolvency or other reasons, a fund may apply collateral received from the borrower against the obligation. A fund may experience delays and costs in recovering the securities loaned. Any cash collateral received is invested in the Fidelity Securities Lending Cash Central Fund. Any loaned securities are identified as such in the Schedule of Investments, and the value of loaned securities and cash collateral at period end, as applicable, are presented in the Statement of Assets and Liabilities. Security lending income represents the income earned on investing cash collateral, less rebates paid to borrowers and any lending agent fees associated with the loan, plus any premium payments received for lending certain types of securities. Security lending income is presented in the Statement of Operations as a component of income from Fidelity Central Funds. Affiliated security lending activity, if any, was as follows:
| Total Security Lending Fees Paid to NFS | Security Lending Income From Securities Loaned to NFS | Value of Securities Loaned to NFS at Period End | |
| Fidelity Small Cap Stock K6 Fund | $3,398 | $17 | $9,683 |
8. Expense Reductions.
Through arrangements with the Fund's custodian, credits realized as a result of certain uninvested cash balances were used to reduce the Fund's expenses by $16.
9. Other.
Fund's organizational documents provide former and current trustees and officers with a limited indemnification against liabilities arising in connection with the performance of their duties to the fund. In the normal course of business, the fund may also enter into contracts that provide general indemnifications. The fund's maximum exposure under these arrangements is unknown as this would be dependent on future claims that may be made against the fund. The risk of material loss from such claims is considered remote.
10. Coronavirus (COVID-19) Pandemic.
An outbreak of COVID-19 first detected in China during December 2019 has since spread globally and was declared a pandemic by the World Health Organization during March 2020. Developments that disrupt global economies and financial markets, such as the COVID-19 pandemic, may magnify factors that affect the Fund's performance.
Shareholder Expense Example
As a shareholder, you incur two types of costs: (1) transaction costs, which may include sales charges (loads) on purchase payments or redemption proceeds, as applicable and (2) ongoing costs, which generally include management fees, distribution and/or service (12b-1) fees and other Fund expenses. This Example is intended to help you understand your ongoing costs (in dollars) of investing in a fund and to compare these costs with the ongoing costs of investing in other mutual funds.
The Example is based on an investment of $1,000 invested at the beginning of the period and held for the entire period (May 1, 2021 to October 31, 2021).
Actual Expenses
The first line of the accompanying table provides information about actual account values and actual expenses. You may use the information in this line, together with the amount you invested, to estimate the expenses that you paid over the period. Simply divide your account value by $1,000.00 (for example, an $8,600 account value divided by $1,000.00 = 8.6), then multiply the result by the number in the first line for a class/Fund under the heading entitled "Expenses Paid During Period" to estimate the expenses you paid on your account during this period. If any fund is a shareholder of any underlying mutual funds or exchange-traded funds (ETFs) (the Underlying Funds), such fund indirectly bears its proportional share of the expenses of the Underlying Funds in addition to the direct expenses incurred presented in the table. These fees and expenses are not included in the annualized expense ratio used to calculate the expense estimate in the table below.
Hypothetical Example for Comparison Purposes
The second line of the accompanying table provides information about hypothetical account values and hypothetical expenses based on the actual expense ratio and an assumed rate of return of 5% per year before expenses, which is not the actual return. The hypothetical account values and expenses may not be used to estimate the actual ending account balance or expenses you paid for the period. You may use this information to compare the ongoing costs of investing in the Fund and other funds. To do so, compare this 5% hypothetical example with the 5% hypothetical examples that appear in the shareholder reports of the other funds. If any fund is a shareholder of any Underlying Funds, such fund indirectly bears its proportional share of the expenses of the Underlying Funds in addition to the direct expenses as presented in the table. These fees and expenses are not included in the annualized expense ratio used to calculate the expense estimate in the table below.
Please note that the expenses shown in the table are meant to highlight your ongoing costs only and do not reflect any transaction costs. Therefore, the second line of the table is useful in comparing ongoing costs only, and will not help you determine the relative total costs of owning different funds. In addition, if these transactional costs were included, your costs would have been higher.
| Annualized Expense Ratio-A | Beginning Account Value May 1, 2021 | Ending Account Value October 31, 2021 | Expenses Paid During Period-B May 1, 2021 to October 31, 2021 | |
| Fidelity Small Cap Stock K6 Fund | .60% | |||
| Actual | $1,000.00 | $1,055.90 | $3.11 | |
| Hypothetical-C | $1,000.00 | $1,022.18 | $3.06 |
A Annualized expense ratio reflects expenses net of applicable fee waivers.
B Expenses are equal to the annualized expense ratio, multiplied by the average account value over the period, multiplied by 184/ 365 (to reflect the one-half year period). The fees and expenses of any Underlying Funds are not included in each annualized expense ratio.
C 5% return per year before expenses
Board Approval of Investment Advisory Contracts and Management Fees
Fidelity Small Cap Stock K6 Fund
Each year, the Board of Trustees, including the Independent Trustees (together, the Board), votes on the renewal of the management contract with Fidelity Management & Research Company LLC (FMR) and the sub-advisory agreements (together, the Advisory Contracts) for the fund. FMR and the sub-advisers are referred to herein as the Investment Advisers. The Board, assisted by the advice of fund counsel and Independent Trustees' counsel, requests and considers a broad range of information relevant to the renewal of the Advisory Contracts throughout the year.The Board meets regularly and, at each of its meetings, covers an extensive agenda of topics and materials and considers factors that are relevant to its annual consideration of the renewal of the fund's Advisory Contracts, including the services and support provided to the fund and its shareholders. The Board has established various standing committees (Committees), each composed of and chaired by Independent Trustees with varying backgrounds, to which the Board has assigned specific subject matter responsibilities in order to enhance effective decision-making by the Board. The Board, acting directly and through its Committees, requests and receives information concerning the annual consideration of the renewal of the fund's Advisory Contracts. The Board also meets as needed to review matters specifically related to the Board's annual consideration of the renewal of the Advisory Contracts. Members of the Board may also meet with trustees of other Fidelity funds through joint ad hoc committees to discuss certain matters relevant to all of the Fidelity funds.At its May 2021 meeting, the Board unanimously determined to renew the fund's Advisory Contracts. In reaching its determination, the Board considered all factors it believed relevant, including (i) the nature, extent, and quality of the services provided to the fund and its shareholders (including the investment performance of the fund); (ii) the competitiveness of the fund's management fee and total expense ratio relative to peer funds; (iii) the total costs of the services provided by and the profits realized by Fidelity from its relationships with the fund; and (iv) the extent to which, if any, economies of scale exist and are realized as the fund grows, and whether any economies of scale are appropriately shared with fund shareholders.In considering whether to renew the Advisory Contracts for the fund, the Board reached a determination, with the assistance of fund counsel and Independent Trustees' counsel and through the exercise of its business judgment, that the renewal of the Advisory Contracts was in the best interests of the fund and its shareholders and that the compensation payable under the Advisory Contracts was fair and reasonable. The Board's decision to renew the Advisory Contracts was not based on any single factor, but rather was based on a comprehensive consideration of all the information provided to the Board at its meetings throughout the year. The Board, in reaching its determination to renew the Advisory Contracts, was aware that shareholders of the fund have a broad range of investment choices available to them, including a wide choice among funds offered by Fidelity's competitors, and that the fund's shareholders, who have the opportunity to review and weigh the disclosure provided by the fund in its prospectus and other public disclosures, have chosen to invest in this fund, which is part of the Fidelity family of funds.Nature, Extent, and Quality of Services Provided. The Board considered Fidelity's staffing as it relates to the fund, including the backgrounds of investment personnel of Fidelity, and also considered the fund's investment objective, strategies, and related investment philosophy. The Independent Trustees also had discussions with senior management of Fidelity's investment operations and investment groups. The Board considered the structure of the investment personnel compensation program and whether this structure provides appropriate incentives to act in the best interests of the fund. Additionally, the Board considered the portfolio managers' investments, if any, in the funds that they manage.Resources Dedicated to Investment Management and Support Services. The Board and the Fund Oversight and Research Committees reviewed the general qualifications and capabilities of Fidelity's investment staff, including its size, education, experience, and resources, as well as Fidelity's approach to recruiting, training, managing, and compensating investment personnel. The Board noted that Fidelity has continued to increase the resources devoted to non-U.S. offices, including expansion of Fidelity's global investment organization. The Board also noted that Fidelity's analysts have extensive resources, tools and capabilities that allow them to conduct sophisticated quantitative and fundamental analysis, as well as credit analysis of issuers, counterparties and guarantors. Further, the Board considered that Fidelity's investment professionals have sufficient access to global information and data so as to provide competitive investment results over time, and that those professionals also have access to sophisticated tools that permit them to assess portfolio construction and risk and performance attribution characteristics continuously, as well as to transmit new information and research conclusions rapidly around the world. Additionally, in its deliberations, the Board considered Fidelity's trading, risk management, compliance, and technology and operations capabilities and resources, which are integral parts of the investment management process. The Board also considered Fidelity's investments in business continuity planning, and its success in continuously providing services to the fund notwithstanding the severe disruptions caused by the COVID-19 pandemic.Shareholder and Administrative Services. The Board considered (i) the nature, extent, quality, and cost of advisory, administrative, and shareholder services performed by the Investment Advisers and their affiliates under the Advisory Contracts and under separate agreements covering transfer agency, pricing and bookkeeping, and securities lending services for the fund; (ii) the nature and extent of the supervision of third party service providers, principally custodians, subcustodians, and pricing vendors; and (iii) the resources devoted to, and the record of compliance with, the fund's compliance policies and procedures. The Board also reviewed the allocation of fund brokerage, including allocations to brokers affiliated with the Investment Advisers, the use of brokerage commissions to pay fund expenses, and the use of "soft" commission dollars to pay for research services.The Board noted that the growth of fund assets over time across the complex allows Fidelity to reinvest in the development of services designed to enhance the value and convenience of the Fidelity funds as investment vehicles. These services include 24-hour access to account information and market information over the Internet and through telephone representatives, investor education materials and asset allocation tools, and the expanded availability of Fidelity Investor Centers.The Board noted that, in the past, it and the boards of certain other Fidelity funds had formed an ad hoc Committee on Transfer Agency Fees to review the variety of transfer agency fee structures throughout the industry and Fidelity's competitive positioning with respect to industry participants.Investment in a Large Fund Family. The Board considered the benefits to shareholders of investing in a Fidelity fund, including the benefits of investing in a fund that is part of a large family of funds offering a variety of investment disciplines and providing a large variety of mutual fund investor services. The Board noted that Fidelity had taken, or had made recommendations that resulted in the Fidelity funds taking, a number of actions over the previous year that benefited particular funds, including: (i) continuing to dedicate additional resources to Fidelity's investment research process, which includes meetings with management of issuers of securities in which the funds invest, and to the support of the senior management team that oversees asset management; (ii) continuing efforts to enhance Fidelity's global research capabilities; (iii) launching new funds and ETFs with innovative structures, strategies and pricing and making other enhancements to meet client needs; (iv) launching new share classes of existing funds; (v) eliminating purchase minimums and broadening eligibility requirements for certain funds and share classes; (vi) approving the reduction in the holding period for the Class C to Class A conversion policy; (vii) reducing management fees and total expenses for certain target date funds and classes and index funds; (viii) lowering expenses for certain existing funds and classes by implementing or lowering expense caps; (ix) rationalizing product lines and gaining increased efficiencies from fund mergers, liquidations, and share class consolidations; (x) continuing to develop, acquire and implement systems and technology to improve services to the funds and shareholders, strengthen information security, and increase efficiency; and (xi) continuing to implement enhancements to further strengthen Fidelity's product line to increase investors' probability of success in achieving their investment goals, including retirement income goals.Investment Performance. The Board considered whether the fund has operated in accordance with its investment objective, as well as its record of compliance with its investment restrictions and its performance history.The Board took into account discussions that occur at Board meetings throughout the year with representatives of the Investment Advisers about fund investment performance. In this regard the Board noted that as part of regularly scheduled fund reviews and other reports to the Board on fund performance, the Board considers annualized return information for the fund for different time periods, measured against an appropriate securities market index (benchmark index) and an appropriate peer group of funds with similar objectives (peer group). In its evaluation of fund investment performance, the Board gave particular attention to information indicating changes in performance of certain Fidelity funds for specific time periods and discussed with the Investment Advisers the reasons for any overperformance or underperformance.In addition to reviewing absolute and relative fund performance, the Independent Trustees periodically consider the appropriateness of fund performance metrics in evaluating the results achieved. In general, the Independent Trustees believe that fund performance should be evaluated based on net performance (after fees and expenses) of both the highest performing and lowest performing fund share classes, where applicable, compared to appropriate benchmark indices, over appropriate time periods that may include full market cycles, and compared to peer groups, as applicable, over the same periods, taking into account relevant factors including the following: general market conditions; issuer-specific information; and fund cash flows and other factors.The Independent Trustees recognize that shareholders evaluate performance on a net basis over their own holding periods, for which one-, three-, and five-year periods are often used as a proxy. For this reason, the performance information reviewed by the Board also included net total return information for the fund and an appropriate benchmark index and peer group for the most recent one- and three-year period ended September 30, 2020, as shown below. Returns are shown compared to the 25th percentile (top of box, 75% beaten) and 75th percentile (bottom of box, 25% beaten) of the peer universe.Fidelity Small Cap Stock K6 Fund
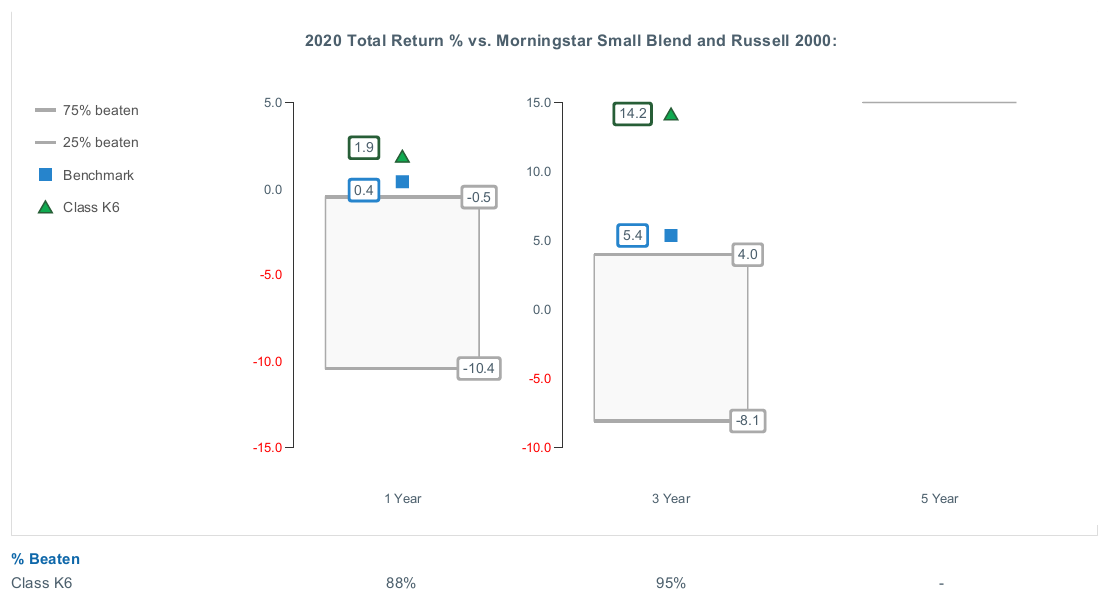
Fidelity Small Cap Stock K6 Fund
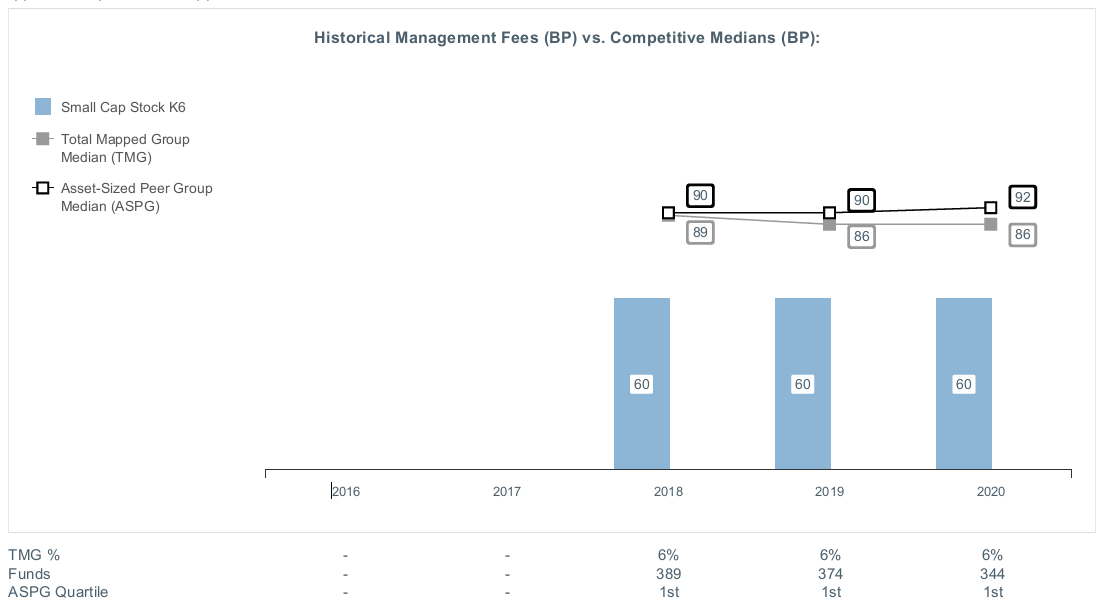
![]()
SLCXK6-SANN-1221
1.9883974.104
Fidelity Flex® Funds
Fidelity Flex® Large Cap Value Fund
Semi-Annual Report
October 31, 2021
Contents
Board Approval of Investment Advisory Contracts and Management Fees |
To view a fund's proxy voting guidelines and proxy voting record for the 12-month period ended June 30, visit http://www.fidelity.com/proxyvotingresults or visit the Securities and Exchange Commission's (SEC) web site at http://www.sec.gov.
You may also call 1-800-544-3455 (for managed account clients) or 1-800-835-5092 (for retirement plan participants) to request a free copy of the proxy voting guidelines.
Standard & Poor's, S&P and S&P 500 are registered service marks of The McGraw-Hill Companies, Inc. and have been licensed for use by Fidelity Distributors Corporation.
Other third-party marks appearing herein are the property of their respective owners.
All other marks appearing herein are registered or unregistered trademarks or service marks of FMR LLC or an affiliated company. © 2021 FMR LLC. All rights reserved.
This report and the financial statements contained herein are submitted for the general information of the shareholders of the Fund. This report is not authorized for distribution to prospective investors in the Fund unless preceded or accompanied by an effective prospectus.
A fund files its complete schedule of portfolio holdings with the SEC for the first and third quarters of each fiscal year on Form N-PORT. Forms N-PORT are available on the SEC’s web site at http://www.sec.gov. A fund's Forms N-PORT may be reviewed and copied at the SEC’s Public Reference Room in Washington, DC. Information regarding the operation of the SEC's Public Reference Room may be obtained by calling 1-800-SEC-0330.
For a complete list of a fund's portfolio holdings, view the most recent holdings listing, semiannual report, or annual report on Fidelity's web site at http://www.fidelity.com, http://www.institutional.fidelity.com, or http://www.401k.com, as applicable.
NOT FDIC INSURED •MAY LOSE VALUE •NO BANK GUARANTEE
Neither the Fund nor Fidelity Distributors Corporation is a bank.
Note to Shareholders:
Early in 2020, the outbreak and spread of COVID-19 emerged as a public health emergency that had a major influence on financial markets, primarily based on its impact on the global economy and corporate earnings. On March 11, 2020, the World Health Organization declared the COVID-19 outbreak a pandemic, citing sustained risk of further global spread. The pandemic prompted a number of measures to limit the spread of COVID-19, including travel and border restrictions, quarantines, and restrictions on large gatherings. In turn, these resulted in lower consumer activity, diminished demand for a wide range of products and services, disruption in manufacturing and supply chains, and – given the wide variability in outcomes regarding the outbreak – significant market uncertainty and volatility. To help stem the turmoil, the U.S. government took unprecedented action – in concert with the U.S. Federal Reserve and central banks around the world – to help support consumers, businesses, and the broader economy, and to limit disruption to the financial system.
In general, the overall impact of the pandemic lessened in 2021, amid a resilient economy and widespread distribution of three COVID-19 vaccines granted emergency use authorization from the U.S. Food and Drug Administration (FDA) early in the year. Still, the situation remains dynamic, and the extent and duration of its influence on financial markets and the economy is highly uncertain, due in part to a recent spike in cases based on highly contagious variants of the coronavirus.
Extreme events such as the COVID-19 crisis are exogenous shocks that can have significant adverse effects on mutual funds and their investments. Although multiple asset classes may be affected by market disruption, the duration and impact may not be the same for all types of assets. Fidelity is committed to helping you stay informed amid news about COVID-19 and during increased market volatility, and we continue to take extra steps to be responsive to customer needs. We encourage you to visit us online, where we offer ongoing updates, commentary, and analysis on the markets and our funds.
Investment Summary (Unaudited)
Top Ten Stocks as of October 31, 2021
| % of fund's net assets | |
| Berkshire Hathaway, Inc. Class B | 2.9 |
| JPMorgan Chase & Co. | 2.4 |
| Johnson & Johnson | 2.2 |
| UnitedHealth Group, Inc. | 1.9 |
| Bank of America Corp. | 1.8 |
| Procter & Gamble Co. | 1.6 |
| Walmart, Inc. | 1.5 |
| Intel Corp. | 1.3 |
| Wells Fargo & Co. | 1.3 |
| Exxon Mobil Corp. | 1.3 |
| 18.2 |
Top Five Market Sectors as of October 31, 2021
| % of fund's net assets | |
| Financials | 20.7 |
| Health Care | 17.8 |
| Information Technology | 11.2 |
| Industrials | 9.5 |
| Consumer Discretionary | 6.3 |
Asset Allocation (% of fund's net assets)
| As of October 31, 2021* | ||
| Stocks and Equity Futures | 100.0% | |

* Foreign investments - 4.4%
Schedule of Investments October 31, 2021 (Unaudited)
Showing Percentage of Net Assets
| Common Stocks - 95.7% | |||
| Shares | Value | ||
| COMMUNICATION SERVICES - 6.2% | |||
| Diversified Telecommunication Services - 1.8% | |||
| AT&T, Inc. | 29,082 | $734,611 | |
| Lumen Technologies, Inc. | 1,589 | 18,846 | |
| Verizon Communications, Inc. | 20,947 | 1,109,982 | |
| 1,863,439 | |||
| Entertainment - 1.8% | |||
| Activision Blizzard, Inc. | 6,454 | 504,638 | |
| Electronic Arts, Inc. | 3,302 | 463,106 | |
| The Walt Disney Co. (a) | 5,365 | 907,061 | |
| 1,874,805 | |||
| Interactive Media & Services - 1.3% | |||
| Alphabet, Inc.: | |||
| Class A (a) | 199 | 589,223 | |
| Class C (a) | 231 | 685,010 | |
| 1,274,233 | |||
| Media - 1.3% | |||
| Comcast Corp. Class A | 20,258 | 1,041,869 | |
| Liberty Media Corp.: | |||
| Liberty SiriusXM Series A (a) | 1,549 | 77,109 | |
| Liberty SiriusXM Series C (a) | 882 | 43,500 | |
| News Corp. Class A | 6,527 | 149,468 | |
| 1,311,946 | |||
| Wireless Telecommunication Services - 0.0% | |||
| Telephone & Data Systems, Inc. | 2,296 | 43,027 | |
| TOTAL COMMUNICATION SERVICES | 6,367,450 | ||
| CONSUMER DISCRETIONARY - 6.3% | |||
| Auto Components - 0.0% | |||
| The Goodyear Tire & Rubber Co. (a) | 1,634 | 31,242 | |
| Automobiles - 0.4% | |||
| Ford Motor Co. | 19,006 | 324,622 | |
| Thor Industries, Inc. | 410 | 41,804 | |
| 366,426 | |||
| Distributors - 0.6% | |||
| Genuine Parts Co. | 3,256 | 426,894 | |
| LKQ Corp. | 4,347 | 239,433 | |
| 666,327 | |||
| Diversified Consumer Services - 0.1% | |||
| Grand Canyon Education, Inc. (a) | 297 | 23,671 | |
| Service Corp. International | 1,084 | 74,243 | |
| 97,914 | |||
| Hotels, Restaurants & Leisure - 2.0% | |||
| Carnival Corp. (a) | 1,978 | 43,832 | |
| International Game Technology PLC (a) | 12,164 | 358,716 | |
| McDonald's Corp. | 4,371 | 1,073,299 | |
| Royal Caribbean Cruises Ltd. (a) | 419 | 35,376 | |
| Scientific Games Corp. Class A (a) | 1,214 | 97,181 | |
| Travel+Leisure Co. | 1,338 | 72,707 | |
| Wendy's Co. | 14,806 | 330,174 | |
| Yum! Brands, Inc. | 212 | 26,487 | |
| 2,037,772 | |||
| Household Durables - 1.2% | |||
| D.R. Horton, Inc. | 2,766 | 246,921 | |
| Lennar Corp. Class A | 1,150 | 114,920 | |
| Meritage Homes Corp. (a) | 2,685 | 291,886 | |
| PulteGroup, Inc. | 2,692 | 129,431 | |
| Toll Brothers, Inc. | 2,397 | 144,227 | |
| TopBuild Corp. (a) | 116 | 29,809 | |
| Whirlpool Corp. | 1,362 | 287,150 | |
| 1,244,344 | |||
| Internet & Direct Marketing Retail - 0.0% | |||
| eBay, Inc. | 325 | 24,934 | |
| Leisure Products - 0.2% | |||
| Brunswick Corp. | 1,425 | 132,653 | |
| Polaris, Inc. | 614 | 70,579 | |
| 203,232 | |||
| Multiline Retail - 0.7% | |||
| Dollar General Corp. | 1,289 | 285,539 | |
| Kohl's Corp. | 1,103 | 53,529 | |
| Target Corp. | 1,288 | 334,391 | |
| 673,459 | |||
| Specialty Retail - 1.0% | |||
| Academy Sports & Outdoors, Inc. | 1,902 | 81,368 | |
| AutoNation, Inc. (a) | 1,450 | 175,624 | |
| Best Buy Co., Inc. | 1,386 | 169,425 | |
| Dick's Sporting Goods, Inc. | 684 | 84,960 | |
| Foot Locker, Inc. | 4,600 | 219,282 | |
| O'Reilly Automotive, Inc. (a) | 204 | 126,953 | |
| Signet Jewelers Ltd. | 377 | 33,621 | |
| Ulta Beauty, Inc. (a) | 451 | 165,679 | |
| 1,056,912 | |||
| Textiles, Apparel & Luxury Goods - 0.1% | |||
| PVH Corp. | 581 | 63,521 | |
| TOTAL CONSUMER DISCRETIONARY | 6,466,083 | ||
| CONSUMER STAPLES - 6.2% | |||
| Beverages - 0.7% | |||
| Keurig Dr. Pepper, Inc. | 479 | 17,287 | |
| Molson Coors Beverage Co. Class B | 2,925 | 128,963 | |
| The Coca-Cola Co. | 10,947 | 617,082 | |
| 763,332 | |||
| Food & Staples Retailing - 1.7% | |||
| Casey's General Stores, Inc. | 115 | 22,027 | |
| Costco Wholesale Corp. | 200 | 98,308 | |
| Kroger Co. | 2,578 | 103,172 | |
| Walmart, Inc. | 10,099 | 1,508,993 | |
| 1,732,500 | |||
| Food Products - 1.6% | |||
| Archer Daniels Midland Co. | 1,579 | 101,435 | |
| Bunge Ltd. | 188 | 17,416 | |
| Conagra Brands, Inc. | 1,523 | 49,041 | |
| General Mills, Inc. | 3,479 | 215,002 | |
| Ingredion, Inc. | 241 | 22,950 | |
| Mondelez International, Inc. | 6,975 | 423,662 | |
| The Kraft Heinz Co. | 8,980 | 322,292 | |
| Tyson Foods, Inc. Class A | 5,758 | 460,467 | |
| 1,612,265 | |||
| Household Products - 1.8% | |||
| Colgate-Palmolive Co. | 2,747 | 209,294 | |
| Procter & Gamble Co. | 11,213 | 1,603,347 | |
| 1,812,641 | |||
| Tobacco - 0.4% | |||
| Altria Group, Inc. | 5,197 | 229,240 | |
| Philip Morris International, Inc. | 2,435 | 230,205 | |
| 459,445 | |||
| TOTAL CONSUMER STAPLES | 6,380,183 | ||
| ENERGY - 6.0% | |||
| Energy Equipment & Services - 0.8% | |||
| Halliburton Co. | 9,602 | 239,954 | |
| Schlumberger Ltd. | 16,131 | 520,386 | |
| 760,340 | |||
| Oil, Gas & Consumable Fuels - 5.2% | |||
| Antero Resources Corp. (a) | 2,962 | 58,855 | |
| APA Corp. | 703 | 18,426 | |
| Chesapeake Energy Corp. | 168 | 10,708 | |
| Chevron Corp. | 10,014 | 1,146,503 | |
| ConocoPhillips Co. | 10,560 | 786,614 | |
| Continental Resources, Inc. | 942 | 45,979 | |
| Coterra Energy, Inc. | 1,281 | 27,311 | |
| Devon Energy Corp. | 2,793 | 111,943 | |
| EOG Resources, Inc. | 6,386 | 590,450 | |
| EQT Corp. (a) | 4,105 | 81,731 | |
| Exxon Mobil Corp. | 20,685 | 1,333,562 | |
| Hess Corp. | 1,693 | 139,791 | |
| HollyFrontier Corp. | 688 | 23,254 | |
| Kinder Morgan, Inc. | 6,802 | 113,934 | |
| Marathon Oil Corp. | 21,503 | 350,929 | |
| Murphy Oil Corp. | 306 | 8,516 | |
| Occidental Petroleum Corp. | 5,623 | 188,539 | |
| Pioneer Natural Resources Co. | 1,491 | 278,787 | |
| 5,315,832 | |||
| TOTAL ENERGY | 6,076,172 | ||
| FINANCIALS - 20.7% | |||
| Banks - 9.0% | |||
| Bank of America Corp. | 37,426 | 1,788,214 | |
| Bank of Hawaii Corp. | 96 | 8,112 | |
| Citigroup, Inc. | 15,353 | 1,061,813 | |
| Citizens Financial Group, Inc. | 8,162 | 386,716 | |
| Comerica, Inc. | 2,401 | 204,301 | |
| East West Bancorp, Inc. | 474 | 37,674 | |
| Eastern Bankshares, Inc. | 2,742 | 56,951 | |
| First Republic Bank | 567 | 122,659 | |
| FNB Corp., Pennsylvania | 3,088 | 35,975 | |
| Hancock Whitney Corp. | 2,645 | 130,875 | |
| Huntington Bancshares, Inc. | 4,727 | 74,403 | |
| JPMorgan Chase & Co. | 14,149 | 2,403,774 | |
| M&T Bank Corp. | 320 | 47,078 | |
| PacWest Bancorp | 1,373 | 65,176 | |
| PNC Financial Services Group, Inc. | 2,035 | 429,446 | |
| Popular, Inc. | 1,468 | 119,554 | |
| Regions Financial Corp. | 19,864 | 470,380 | |
| Synovus Financial Corp. | 1,905 | 88,754 | |
| Truist Financial Corp. | 1,134 | 71,975 | |
| U.S. Bancorp | 4,127 | 249,147 | |
| Wells Fargo & Co. | 26,682 | 1,365,051 | |
| 9,218,028 | |||
| Capital Markets - 4.5% | |||
| Ameriprise Financial, Inc. | 830 | 250,768 | |
| BlackRock, Inc. Class A | 107 | 100,950 | |
| Charles Schwab Corp. | 3,031 | 248,633 | |
| CME Group, Inc. | 512 | 112,922 | |
| Goldman Sachs Group, Inc. | 2,322 | 959,799 | |
| Intercontinental Exchange, Inc. | 1,371 | 189,829 | |
| Jefferies Financial Group, Inc. | 12,512 | 538,016 | |
| Morgan Stanley | 10,936 | 1,124,002 | |
| NASDAQ, Inc. | 300 | 62,961 | |
| Northern Trust Corp. | 534 | 65,703 | |
| Raymond James Financial, Inc. | 3,173 | 312,826 | |
| SEI Investments Co. | 239 | 15,067 | |
| State Street Corp. | 5,309 | 523,202 | |
| Stifel Financial Corp. | 2,127 | 154,994 | |
| 4,659,672 | |||
| Consumer Finance - 1.1% | |||
| Capital One Financial Corp. | 4,180 | 631,305 | |
| Discover Financial Services | 445 | 50,427 | |
| OneMain Holdings, Inc. | 1,683 | 88,879 | |
| SLM Corp. | 1,479 | 27,140 | |
| Synchrony Financial | 6,167 | 286,457 | |
| 1,084,208 | |||
| Diversified Financial Services - 2.9% | |||
| Berkshire Hathaway, Inc. Class B (a) | 10,178 | 2,921,188 | |
| Insurance - 3.1% | |||
| Allstate Corp. | 392 | 48,479 | |
| American International Group, Inc. | 1,757 | 103,821 | |
| Aon PLC | 817 | 261,375 | |
| Arthur J. Gallagher & Co. | 146 | 24,480 | |
| Brown & Brown, Inc. | 866 | 54,653 | |
| Chubb Ltd. | 1,336 | 261,028 | |
| Everest Re Group Ltd. | 25 | 6,538 | |
| Fidelity National Financial, Inc. | 7,392 | 354,151 | |
| First American Financial Corp. | 5,996 | 438,547 | |
| Hartford Financial Services Group, Inc. | 153 | 11,158 | |
| Loews Corp. | 1,039 | 58,257 | |
| MetLife, Inc. | 10,981 | 689,607 | |
| Primerica, Inc. | 1,130 | 190,111 | |
| Reinsurance Group of America, Inc. | 1,822 | 215,142 | |
| Selective Insurance Group, Inc. | 646 | 50,627 | |
| The Travelers Companies, Inc. | 938 | 150,905 | |
| W.R. Berkley Corp. | 3,579 | 284,888 | |
| Willis Towers Watson PLC | 30 | 7,268 | |
| 3,211,035 | |||
| Thrifts & Mortgage Finance - 0.1% | |||
| New York Community Bancorp, Inc. | 7,289 | 90,602 | |
| TOTAL FINANCIALS | 21,184,733 | ||
| HEALTH CARE - 17.8% | |||
| Biotechnology - 1.9% | |||
| Amgen, Inc. | 2,114 | 437,535 | |
| Biogen, Inc. (a) | 903 | 240,812 | |
| Gilead Sciences, Inc. | 11,298 | 733,014 | |
| Incyte Corp. (a) | 847 | 56,732 | |
| Regeneron Pharmaceuticals, Inc. (a) | 386 | 247,017 | |
| Sage Therapeutics, Inc. (a) | 920 | 37,131 | |
| United Therapeutics Corp. (a) | 789 | 150,510 | |
| Vertex Pharmaceuticals, Inc. (a) | 384 | 71,013 | |
| 1,973,764 | |||
| Health Care Equipment & Supplies - 3.3% | |||
| Abbott Laboratories | 3,423 | 441,190 | |
| Baxter International, Inc. | 4,660 | 367,954 | |
| Boston Scientific Corp. (a) | 5,853 | 252,440 | |
| Danaher Corp. | 3,123 | 973,658 | |
| Dentsply Sirona, Inc. | 616 | 35,241 | |
| Envista Holdings Corp. (a) | 2,452 | 95,873 | |
| Hologic, Inc. (a) | 523 | 38,341 | |
| Medtronic PLC | 6,916 | 828,952 | |
| Ortho Clinical Diagnostics Holdings PLC | 5,753 | 113,737 | |
| Quidel Corp. (a) | 186 | 24,695 | |
| STERIS PLC | 437 | 102,144 | |
| West Pharmaceutical Services, Inc. | 95 | 40,839 | |
| 3,315,064 | |||
| Health Care Providers & Services - 4.4% | |||
| Amedisys, Inc. (a) | 52 | 8,806 | |
| Anthem, Inc. | 2,382 | 1,036,480 | |
| CVS Health Corp. | 10,860 | 969,581 | |
| Encompass Health Corp. | 368 | 23,390 | |
| Humana, Inc. | 98 | 45,390 | |
| Laboratory Corp. of America Holdings (a) | 655 | 187,998 | |
| Molina Healthcare, Inc. (a) | 138 | 40,809 | |
| Quest Diagnostics, Inc. | 494 | 72,509 | |
| Select Medical Holdings Corp. | 3,238 | 107,566 | |
| UnitedHealth Group, Inc. | 4,248 | 1,956,077 | |
| 4,448,606 | |||
| Health Care Technology - 0.3% | |||
| Veeva Systems, Inc. Class A (a) | 1,039 | 329,373 | |
| Life Sciences Tools & Services - 2.1% | |||
| Agilent Technologies, Inc. | 2,068 | 325,689 | |
| Bio-Rad Laboratories, Inc. Class A (a) | 454 | 360,785 | |
| Medpace Holdings, Inc. (a) | 93 | 21,069 | |
| PerkinElmer, Inc. | 353 | 62,442 | |
| QIAGEN NV (a) | 451 | 25,148 | |
| Thermo Fisher Scientific, Inc. | 2,079 | 1,316,153 | |
| Waters Corp. (a) | 214 | 78,656 | |
| 2,189,942 | |||
| Pharmaceuticals - 5.8% | |||
| Bristol-Myers Squibb Co. | 18,121 | 1,058,266 | |
| Johnson & Johnson | 13,597 | 2,214,679 | |
| Merck & Co., Inc. | 13,882 | 1,222,310 | |
| Organon & Co. | 3,253 | 119,548 | |
| Pfizer, Inc. | 27,578 | 1,206,262 | |
| Viatris, Inc. | 8,678 | 115,851 | |
| 5,936,916 | |||
| TOTAL HEALTH CARE | 18,193,665 | ||
| INDUSTRIALS - 9.5% | |||
| Aerospace & Defense - 1.9% | |||
| Curtiss-Wright Corp. | 1,487 | 189,860 | |
| Lockheed Martin Corp. | 345 | 114,650 | |
| Mercury Systems, Inc. (a) | 4,359 | 224,663 | |
| Moog, Inc. Class A | 2,621 | 197,964 | |
| Northrop Grumman Corp. | 1,097 | 391,870 | |
| Parsons Corp. (a) | 2,311 | 80,053 | |
| Raytheon Technologies Corp. | 4,683 | 416,131 | |
| Textron, Inc. | 2,069 | 152,796 | |
| The Boeing Co. (a) | 1,051 | 217,589 | |
| 1,985,576 | |||
| Air Freight & Logistics - 0.1% | |||
| FedEx Corp. | 533 | 125,537 | |
| Airlines - 0.1% | |||
| Alaska Air Group, Inc. (a) | 1,598 | 84,374 | |
| Building Products - 0.6% | |||
| Johnson Controls International PLC | 4,477 | 328,477 | |
| Owens Corning | 1,213 | 113,306 | |
| Simpson Manufacturing Co. Ltd. | 367 | 38,935 | |
| UFP Industries, Inc. | 1,038 | 84,940 | |
| 565,658 | |||
| Commercial Services & Supplies - 0.9% | |||
| Clean Harbors, Inc. (a) | 1,456 | 163,858 | |
| Republic Services, Inc. | 4,997 | 672,596 | |
| Waste Management, Inc. | 347 | 55,600 | |
| 892,054 | |||
| Construction & Engineering - 0.3% | |||
| EMCOR Group, Inc. | 2,402 | 291,819 | |
| Electrical Equipment - 1.2% | |||
| AMETEK, Inc. | 742 | 98,241 | |
| Eaton Corp. PLC | 3,808 | 627,406 | |
| Emerson Electric Co. | 2,486 | 241,167 | |
| nVent Electric PLC | 6,549 | 232,162 | |
| Regal Rexnord Corp. | 261 | 39,758 | |
| 1,238,734 | |||
| Industrial Conglomerates - 1.1% | |||
| 3M Co. | 99 | 17,689 | |
| General Electric Co. | 5,042 | 528,755 | |
| Honeywell International, Inc. | 2,093 | 457,572 | |
| Roper Technologies, Inc. | 331 | 161,485 | |
| 1,165,501 | |||
| Machinery - 1.4% | |||
| AGCO Corp. | 2,379 | 290,738 | |
| Allison Transmission Holdings, Inc. | 704 | 23,485 | |
| Caterpillar, Inc. | 1,833 | 373,950 | |
| Cummins, Inc. | 1,016 | 243,677 | |
| Deere & Co. | 644 | 220,448 | |
| Fortive Corp. | 2,505 | 189,654 | |
| Gates Industrial Corp. PLC (a) | 4,695 | 77,186 | |
| 1,419,138 | |||
| Professional Services - 0.4% | |||
| CACI International, Inc. Class A (a) | 343 | 98,661 | |
| CoStar Group, Inc. (a) | 173 | 14,887 | |
| IHS Markit Ltd. | 923 | 120,655 | |
| Manpower, Inc. | 1,877 | 181,412 | |
| TriNet Group, Inc. (a) | 127 | 12,859 | |
| 428,474 | |||
| Road & Rail - 1.4% | |||
| CSX Corp. | 8,819 | 318,983 | |
| Knight-Swift Transportation Holdings, Inc. Class A | 1,098 | 62,246 | |
| Norfolk Southern Corp. | 568 | 166,452 | |
| Ryder System, Inc. | 1,520 | 129,124 | |
| Schneider National, Inc. Class B | 5,860 | 146,148 | |
| Union Pacific Corp. | 1,329 | 320,821 | |
| Werner Enterprises, Inc. | 3,183 | 144,254 | |
| XPO Logistics, Inc. (a) | 1,778 | 152,552 | |
| 1,440,580 | |||
| Trading Companies & Distributors - 0.1% | |||
| MSC Industrial Direct Co., Inc. Class A | 1,080 | 90,796 | |
| TOTAL INDUSTRIALS | 9,728,241 | ||
| INFORMATION TECHNOLOGY - 11.2% | |||
| Communications Equipment - 1.5% | |||
| Ciena Corp. (a) | 1,895 | 102,880 | |
| Cisco Systems, Inc. | 22,339 | 1,250,314 | |
| Juniper Networks, Inc. | 7,665 | 226,271 | |
| 1,579,465 | |||
| Electronic Equipment & Components - 0.7% | |||
| Avnet, Inc. | 836 | 31,860 | |
| National Instruments Corp. | 8,661 | 367,833 | |
| Teledyne Technologies, Inc. (a) | 311 | 139,707 | |
| Vontier Corp. | 3,838 | 129,840 | |
| 669,240 | |||
| IT Services - 2.4% | |||
| Alliance Data Systems Corp. | 1,103 | 94,031 | |
| Amdocs Ltd. | 6,149 | 478,638 | |
| Automatic Data Processing, Inc. | 339 | 76,102 | |
| Cognizant Technology Solutions Corp. Class A | 1,648 | 128,692 | |
| DXC Technology Co. (a) | 2,190 | 71,328 | |
| EPAM Systems, Inc. (a) | 177 | 119,163 | |
| FleetCor Technologies, Inc. (a) | 1,435 | 355,033 | |
| Gartner, Inc. (a) | 465 | 154,338 | |
| Global Payments, Inc. | 1,213 | 173,447 | |
| IBM Corp. | 5,378 | 672,788 | |
| SolarWinds, Inc. | 1,399 | 22,524 | |
| The Western Union Co. | 5,411 | 98,588 | |
| 2,444,672 | |||
| Semiconductors & Semiconductor Equipment - 2.9% | |||
| Broadcom, Inc. | 648 | 344,522 | |
| Cirrus Logic, Inc. (a) | 2,711 | 219,076 | |
| Intel Corp. | 27,884 | 1,366,316 | |
| Micron Technology, Inc. | 969 | 66,958 | |
| NXP Semiconductors NV | 378 | 75,925 | |
| Qorvo, Inc. (a) | 745 | 125,331 | |
| Qualcomm, Inc. | 3,780 | 502,891 | |
| Semtech Corp. (a) | 651 | 55,355 | |
| Texas Instruments, Inc. | 1,134 | 212,602 | |
| 2,968,976 | |||
| Software - 3.4% | |||
| Adobe, Inc. (a) | 647 | 420,783 | |
| Black Knight, Inc. (a) | 6,356 | 445,619 | |
| Box, Inc. Class A (a) | 10,215 | 263,853 | |
| Citrix Systems, Inc. | 312 | 29,556 | |
| Dropbox, Inc. Class A (a) | 16,377 | 499,335 | |
| Mandiant, Inc. (a) | 2,145 | 37,409 | |
| Nutanix, Inc. Class A (a) | 2,950 | 101,215 | |
| Qualys, Inc. (a) | 298 | 37,095 | |
| Salesforce.com, Inc. (a) | 2,123 | 636,242 | |
| SS&C Technologies Holdings, Inc. | 4,793 | 380,900 | |
| Synopsys, Inc. (a) | 1,817 | 605,388 | |
| 3,457,395 | |||
| Technology Hardware, Storage & Peripherals - 0.3% | |||
| NetApp, Inc. | 1,955 | 174,582 | |
| Western Digital Corp. (a) | 2,462 | 128,738 | |
| 303,320 | |||
| TOTAL INFORMATION TECHNOLOGY | 11,423,068 | ||
| MATERIALS - 3.5% | |||
| Chemicals - 2.0% | |||
| CF Industries Holdings, Inc. | 5,801 | 329,497 | |
| Corteva, Inc. | 12,875 | 555,556 | |
| Dow, Inc. | 3,703 | 207,257 | |
| DuPont de Nemours, Inc. | 7,228 | 503,069 | |
| Eastman Chemical Co. | 2,065 | 214,822 | |
| FMC Corp. | 500 | 45,505 | |
| NewMarket Corp. | 174 | 59,162 | |
| Olin Corp. | 1,340 | 76,353 | |
| 1,991,221 | |||
| Construction Materials - 0.2% | |||
| Vulcan Materials Co. | 1,260 | 239,551 | |
| Containers & Packaging - 0.3% | |||
| International Paper Co. | 1,230 | 61,094 | |
| WestRock Co. | 5,601 | 269,408 | |
| 330,502 | |||
| Metals & Mining - 1.0% | |||
| Alcoa Corp. | 6,788 | 311,909 | |
| Freeport-McMoRan, Inc. | 7,746 | 292,179 | |
| Reliance Steel & Aluminum Co. | 1,657 | 242,187 | |
| United States Steel Corp. | 7,400 | 195,286 | |
| 1,041,561 | |||
| Paper & Forest Products - 0.0% | |||
| Sylvamo Corp. (a) | 111 | 3,126 | |
| TOTAL MATERIALS | 3,605,961 | ||
| REAL ESTATE - 4.8% | |||
| Equity Real Estate Investment Trusts (REITs) - 4.6% | |||
| American Homes 4 Rent Class A | 7,417 | 301,130 | |
| American Tower Corp. | 532 | 150,008 | |
| Apartment Income (REIT) Corp. | 5,799 | 310,884 | |
| Brixmor Property Group, Inc. | 2,142 | 50,208 | |
| Camden Property Trust (SBI) | 660 | 107,646 | |
| Crown Castle International Corp. | 1,039 | 187,332 | |
| CubeSmart | 1,406 | 77,344 | |
| Equity Commonwealth | 744 | 19,292 | |
| Extra Space Storage, Inc. | 428 | 84,474 | |
| First Industrial Realty Trust, Inc. | 1,334 | 77,679 | |
| Gaming & Leisure Properties | 1,002 | 48,587 | |
| Healthcare Realty Trust, Inc. | 3,622 | 119,743 | |
| Highwoods Properties, Inc. (SBI) | 4,121 | 184,786 | |
| Hudson Pacific Properties, Inc. | 1,279 | 32,934 | |
| Invitation Homes, Inc. | 8,726 | 359,948 | |
| JBG SMITH Properties | 2,246 | 64,820 | |
| Kilroy Realty Corp. | 748 | 50,400 | |
| Life Storage, Inc. | 1,461 | 195,496 | |
| National Retail Properties, Inc. | 1,253 | 56,836 | |
| National Storage Affiliates Trust | 4,213 | 263,144 | |
| Prologis (REIT), Inc. | 1,978 | 286,731 | |
| PS Business Parks, Inc. | 819 | 145,536 | |
| Public Storage | 1,157 | 384,332 | |
| Realty Income Corp. | 3,666 | 261,862 | |
| SBA Communications Corp. Class A | 753 | 260,033 | |
| Stag Industrial, Inc. | 3,018 | 131,374 | |
| Sun Communities, Inc. | 88 | 17,246 | |
| Terreno Realty Corp. | 1,532 | 112,035 | |
| Ventas, Inc. | 1,378 | 73,544 | |
| Weyerhaeuser Co. | 7,087 | 253,148 | |
| 4,668,532 | |||
| Real Estate Management & Development - 0.2% | |||
| Opendoor Technologies, Inc. (a) | 8,883 | 210,616 | |
| TOTAL REAL ESTATE | 4,879,148 | ||
| UTILITIES - 3.5% | |||
| Electric Utilities - 2.1% | |||
| American Electric Power Co., Inc. | 1,299 | 110,038 | |
| Duke Energy Corp. | 4,371 | 445,886 | |
| Hawaiian Electric Industries, Inc. | 4,640 | 188,198 | |
| IDACORP, Inc. | 1,392 | 145,213 | |
| NextEra Energy, Inc. | 10,661 | 909,703 | |
| NRG Energy, Inc. | 1,293 | 51,578 | |
| OGE Energy Corp. | 2,385 | 81,257 | |
| Portland General Electric Co. | 2,948 | 145,366 | |
| 2,077,239 | |||
| Gas Utilities - 0.0% | |||
| UGI Corp. | 551 | 23,919 | |
| Independent Power and Renewable Electricity Producers - 0.0% | |||
| Clearway Energy, Inc. Class C | 397 | 14,086 | |
| Multi-Utilities - 1.2% | |||
| Ameren Corp. | 487 | 41,049 | |
| DTE Energy Co. | 206 | 23,350 | |
| MDU Resources Group, Inc. | 8,228 | 252,846 | |
| NiSource, Inc. | 1,273 | 31,405 | |
| Public Service Enterprise Group, Inc. | 5,385 | 343,563 | |
| Sempra Energy | 2,235 | 285,253 | |
| WEC Energy Group, Inc. | 3,079 | 277,295 | |
| 1,254,761 | |||
| Water Utilities - 0.2% | |||
| American Water Works Co., Inc. | 978 | 170,348 | |
| TOTAL UTILITIES | 3,540,353 | ||
| TOTAL COMMON STOCKS | |||
| (Cost $84,539,917) | 97,845,057 | ||
| Money Market Funds - 4.1% | |||
| Fidelity Cash Central Fund 0.06% (b) | |||
| (Cost $4,188,081) | 4,187,243 | 4,188,081 | |
| TOTAL INVESTMENT IN SECURITIES - 99.8% | |||
| (Cost $88,727,998) | 102,033,138 | ||
| NET OTHER ASSETS (LIABILITIES) - 0.2% | 235,393 | ||
| NET ASSETS - 100% | $102,268,531 |
| Futures Contracts | |||||
| Number of contracts | Expiration Date | Notional Amount | Value | Unrealized Appreciation/(Depreciation) | |
| Purchased | |||||
| Equity Index Contracts | |||||
| CME E-mini S&P 500 Index Contracts (United States) | 19 | Dec. 2021 | $4,367,150 | $161,049 | $161,049 |
The notional amount of futures purchased as a percentage of Net Assets is 4.3%
Legend
(a) Non-income producing
(b) Affiliated fund that is generally available only to investment companies and other accounts managed by Fidelity Investments. The rate quoted is the annualized seven-day yield of the fund at period end. A complete unaudited listing of the fund's holdings as of its most recent quarter end is available upon request. In addition, each Fidelity Central Fund's financial statements are available on the SEC's website or upon request.
Affiliated Central Funds
Fiscal year to date information regarding the Fund's investments in Fidelity Central Funds, including the ownership percentage, is presented below.
| Fund | Value, beginning of period | Purchases | Sales Proceeds | Dividend Income | Realized Gain/Loss | Change in Unrealized appreciation (depreciation) | Value, end of period | % ownership, end of period |
| Fidelity Cash Central Fund 0.06% | $3,800,863 | $16,965,249 | $16,578,031 | $549 | $-- | $-- | $4,188,081 | 0.0% |
| Total | $3,800,863 | $16,965,249 | $16,578,031 | $549 | $-- | $-- | $4,188,081 |
Amounts in the income column in the above table include any capital gain distributions from underlying funds, which are presented in the corresponding line-item in the Statement of Operations, if applicable.
Investment Valuation
The following is a summary of the inputs used, as of October 31, 2021, involving the Fund's assets and liabilities carried at fair value. The inputs or methodology used for valuing securities may not be an indication of the risk associated with investing in those securities. For more information on valuation inputs, and their aggregation into the levels used below, please refer to the Investment Valuation section in the accompanying Notes to Financial Statements.
| Valuation Inputs at Reporting Date: | ||||
| Description | Total | Level 1 | Level 2 | Level 3 |
| Investments in Securities: | ||||
| Equities: | ||||
| Communication Services | $6,367,450 | $6,367,450 | $-- | $-- |
| Consumer Discretionary | 6,466,083 | 6,466,083 | -- | -- |
| Consumer Staples | 6,380,183 | 6,380,183 | -- | -- |
| Energy | 6,076,172 | 6,076,172 | -- | -- |
| Financials | 21,184,733 | 21,184,733 | -- | -- |
| Health Care | 18,193,665 | 18,193,665 | -- | -- |
| Industrials | 9,728,241 | 9,728,241 | -- | -- |
| Information Technology | 11,423,068 | 11,423,068 | -- | -- |
| Materials | 3,605,961 | 3,605,961 | -- | -- |
| Real Estate | 4,879,148 | 4,879,148 | -- | -- |
| Utilities | 3,540,353 | 3,540,353 | -- | -- |
| Money Market Funds | 4,188,081 | 4,188,081 | -- | -- |
| Total Investments in Securities: | $102,033,138 | $102,033,138 | $-- | $-- |
| Derivative Instruments: | ||||
| Assets | ||||
| Futures Contracts | $161,049 | $161,049 | $-- | $-- |
| Total Assets | $161,049 | $161,049 | $-- | $-- |
| Total Derivative Instruments: | $161,049 | $161,049 | $-- | $-- |
Value of Derivative Instruments
The following table is a summary of the Fund's value of derivative instruments by primary risk exposure as of October 31, 2021. For additional information on derivative instruments, please refer to the Derivative Instruments section in the accompanying Notes to Financial Statements.
| Primary Risk Exposure / Derivative Type | Value | |
| Asset | Liability | |
| Equity Risk | ||
| Futures Contracts(a) | $161,049 | $0 |
| Total Equity Risk | 161,049 | 0 |
| Total Value of Derivatives | $161,049 | $0 |
(a) Reflects gross cumulative appreciation (depreciation) on futures contracts as presented in the Schedule of Investments. In the Statement of Assets and Liabilities, the period end daily variation margin is included in receivable or payable for daily variation margin on futures contracts, and the net cumulative appreciation (depreciation) is included in Total accumulated earnings (loss).
See accompanying notes which are an integral part of the financial statements.
Financial Statements
Statement of Assets and Liabilities
| October 31, 2021 (Unaudited) | ||
| Assets | ||
| Investment in securities, at value — See accompanying schedule: Unaffiliated issuers (cost $84,539,917) | $97,845,057 | |
| Fidelity Central Funds (cost $4,188,081) | 4,188,081 | |
| Total Investment in Securities (cost $88,727,998) | $102,033,138 | |
| Segregated cash with brokers for derivative instruments | 230,000 | |
| Receivable for investments sold | 889,898 | |
| Receivable for fund shares sold | 35,621 | |
| Dividends receivable | 109,408 | |
| Distributions receivable from Fidelity Central Funds | 164 | |
| Receivable for daily variation margin on futures contracts | 7,823 | |
| Total assets | 103,306,052 | |
| Liabilities | ||
| Payable for investments purchased | $973,366 | |
| Payable for fund shares redeemed | 64,155 | |
| Total liabilities | 1,037,521 | |
| Net Assets | $102,268,531 | |
| Net Assets consist of: | ||
| Paid in capital | $83,888,452 | |
| Total accumulated earnings (loss) | 18,380,079 | |
| Net Assets | $102,268,531 | |
| Net Asset Value, offering price and redemption price per share ($102,268,531 ÷ 7,431,973 shares) | $13.76 |
See accompanying notes which are an integral part of the financial statements.
Statement of Operations
| Six months ended October 31, 2021 (Unaudited) | ||
| Investment Income | ||
| Dividends | $936,935 | |
| Income from Fidelity Central Funds | 549 | |
| Total income | 937,484 | |
| Expenses | ||
| Independent trustees' fees and expenses | $157 | |
| Total expenses | 157 | |
| Net investment income (loss) | 937,327 | |
| Realized and Unrealized Gain (Loss) | ||
| Net realized gain (loss) on: | ||
| Investment securities: | ||
| Unaffiliated issuers | 4,208,066 | |
| Futures contracts | 190,806 | |
| Total net realized gain (loss) | 4,398,872 | |
| Change in net unrealized appreciation (depreciation) on: | ||
| Investment securities: | ||
| Unaffiliated issuers | 563,232 | |
| Futures contracts | 29,971 | |
| Total change in net unrealized appreciation (depreciation) | 593,203 | |
| Net gain (loss) | 4,992,075 | |
| Net increase (decrease) in net assets resulting from operations | $5,929,402 |
See accompanying notes which are an integral part of the financial statements.
Statement of Changes in Net Assets
| Six months ended October 31, 2021 (Unaudited) | Year ended April 30, 2021 | |
| Increase (Decrease) in Net Assets | ||
| Operations | ||
| Net investment income (loss) | $937,327 | $770,355 |
| Net realized gain (loss) | 4,398,872 | 895,239 |
| Change in net unrealized appreciation (depreciation) | 593,203 | 14,268,995 |
| Net increase (decrease) in net assets resulting from operations | 5,929,402 | 15,934,589 |
| Distributions to shareholders | (1,450,913) | (409,418) |
| Share transactions | ||
| Proceeds from sales of shares | 21,017,747 | 69,977,231 |
| Reinvestment of distributions | 1,450,913 | 409,418 |
| Cost of shares redeemed | (15,692,965) | (12,876,031) |
| Net increase (decrease) in net assets resulting from share transactions | 6,775,695 | 57,510,618 |
| Total increase (decrease) in net assets | 11,254,184 | 73,035,789 |
| Net Assets | ||
| Beginning of period | 91,014,347 | 17,978,558 |
| End of period | $102,268,531 | $91,014,347 |
| Other Information | ||
| Shares | ||
| Sold | 1,566,253 | 6,090,967 |
| Issued in reinvestment of distributions | 108,116 | 37,945 |
| Redeemed | (1,172,659) | (1,214,727) |
| Net increase (decrease) | 501,710 | 4,914,185 |
See accompanying notes which are an integral part of the financial statements.
Financial Highlights
Fidelity Flex Large Cap Value Fund
| Six months ended (Unaudited) October 31, | Years endedApril 30, | ||
| 2021 | 2021 | 2020 A | |
| Selected Per–Share Data | |||
| Net asset value, beginning of period | $13.13 | $8.92 | $10.00 |
| Income from Investment Operations | |||
| Net investment income (loss)B | .13 | .23 | .22 |
| Net realized and unrealized gain (loss) | .71 | 4.13 | (1.10) |
| Total from investment operations | .84 | 4.36 | (.88) |
| Distributions from net investment income | (.06) | (.15) | (.18) |
| Distributions from net realized gain | (.15) | – | (.03) |
| Total distributions | (.21) | (.15) | (.20)C |
| Net asset value, end of period | $13.76 | $13.13 | $8.92 |
| Total ReturnD,E | 6.42% | 49.29% | (9.15)% |
| Ratios to Average Net AssetsF,G | |||
| Expenses before reductions | - %H,I | - %I | .01%H |
| Expenses net of fee waivers, if anyI | - %H | -% | - %H |
| Expenses net of all reductionsI | - %H | -% | - %H |
| Net investment income (loss) | 1.97%H | 2.09% | 2.63%H |
| Supplemental Data | |||
| Net assets, end of period (000 omitted) | $102,269 | $91,014 | $17,979 |
| Portfolio turnover rateJ | 107%H | 65% | 134%H |
A For the period June 27, 2019 (commencement of operations) through April 30, 2020.
B Calculated based on average shares outstanding during the period.
C Total distributions per share do not sum due to rounding.
D Total returns for periods of less than one year are not annualized.
E Total returns would have been lower if certain expenses had not been reduced during the applicable periods shown.
F Fees and expenses of any underlying mutual funds or exchange-traded funds (ETFs) are not included in the Fund's expense ratio. The Fund indirectly bears its proportionate share of these expenses. For additional expense information related to investments in Fidelity Central Funds, please refer to the "Investments in Fidelity Central Funds" note found in the Notes to Financial Statements section of the most recent Annual or Semi-Annual report.
G Expense ratios reflect operating expenses of the class. Expenses before reductions do not reflect amounts reimbursed, waived, or reduced through arrangements with the investment adviser, brokerage services, or other offset arrangements, if applicable, and do not represent the amount paid by the class during periods when reimbursements, waivers or reductions occur.
H Annualized
I Amount represents less than .005%.
J Amount does not include the portfolio activity of any underlying mutual funds or exchange-traded funds (ETFs).
See accompanying notes which are an integral part of the financial statements.
Notes to Financial Statements (Unaudited)
For the period ended October 31, 2021
1. Organization.
Fidelity Flex Large Cap Value Fund (the Fund) is a fund of Fidelity Concord Street Trust (the Trust) and is authorized to issue an unlimited number of shares. Share transactions on the Statement of Changes in Net Assets may contain exchanges between affiliated funds. The Trust is registered under the Investment Company Act of 1940, as amended (the 1940 Act), as an open-end management investment company organized as a Massachusetts business trust. The Fund is available only to certain fee-based accounts and advisory programs offered by Fidelity.
2. Investments in Fidelity Central Funds.
Funds may invest in Fidelity Central Funds, which are open-end investment companies generally available only to other investment companies and accounts managed by the investment adviser and its affiliates. The Schedule of Investments lists any Fidelity Central Funds held as an investment as of period end, but does not include the underlying holdings of each Fidelity Central Fund. An investing fund indirectly bears its proportionate share of the expenses of the underlying Fidelity Central Funds.
Based on its investment objective, each Fidelity Central Fund may invest or participate in various investment vehicles or strategies that are similar to those of the investing fund. These strategies are consistent with the investment objectives of the investing fund and may involve certain economic risks which may cause a decline in value of each of the Fidelity Central Funds and thus a decline in the value of the investing fund.
| Fidelity Central Fund | Investment Manager | Investment Objective | Investment Practices | Expense Ratio(a) |
| Fidelity Money Market Central Funds | Fidelity Management & Research Company LLC (FMR) | Each fund seeks to obtain a high level of current income consistent with the preservation of capital and liquidity. | Short-term Investments | Less than .005% |
(a) Expenses expressed as a percentage of average net assets and are as of each underlying Central Fund's most recent annual or semi-annual shareholder report.
A complete unaudited list of holdings for each Fidelity Central Fund is available upon request or at the Securities and Exchange Commission website at www.sec.gov. In addition, the financial statements of the Fidelity Central Funds which contain the significant accounting policies (including investment valuation policies) of those funds, and are not covered by the Report of Independent Registered Public Accounting Firm, are available on the Securities and Exchange Commission website or upon request.
3. Significant Accounting Policies.
The Fund is an investment company and applies the accounting and reporting guidance of the Financial Accounting Standards Board (FASB) Accounting Standards Codification Topic 946 Financial Services - Investment Companies. The financial statements have been prepared in conformity with accounting principles generally accepted in the United States of America (GAAP), which require management to make certain estimates and assumptions at the date of the financial statements. Actual results could differ from those estimates. Subsequent events, if any, through the date that the financial statements were issued have been evaluated in the preparation of the financial statements. The Fund's Schedule of Investments lists any underlying mutual funds or exchange-traded funds (ETFs) but does not include the underlying holdings of these funds. The following summarizes the significant accounting policies of the Fund:
Investment Valuation. Investments are valued as of 4:00 p.m. Eastern time on the last calendar day of the period. The Board of Trustees (the Board) has delegated the day to day responsibility for the valuation of the Fund's investments to the Fair Value Committee (the Committee) established by the Fund's investment adviser. In accordance with valuation policies and procedures approved by the Board, the Fund attempts to obtain prices from one or more third party pricing vendors or brokers to value its investments. When current market prices, quotations or currency exchange rates are not readily available or reliable, investments will be fair valued in good faith by the Committee, in accordance with procedures adopted by the Board. Factors used in determining fair value vary by investment type and may include market or investment specific events. The frequency with which these procedures are used cannot be predicted and they may be utilized to a significant extent. The Committee oversees the Fund's valuation policies and procedures and reports to the Board on the Committee's activities and fair value determinations. The Board monitors the appropriateness of the procedures used in valuing the Fund's investments and ratifies the fair value determinations of the Committee.
The Fund categorizes the inputs to valuation techniques used to value its investments into a disclosure hierarchy consisting of three levels as shown below:
- Level 1 – quoted prices in active markets for identical investments
- Level 2 – other significant observable inputs (including quoted prices for similar investments, interest rates, prepayment speeds, etc.)
- Level 3 – unobservable inputs (including the Fund's own assumptions based on the best information available)
Valuation techniques used to value the Fund's investments by major category are as follows:
Equity securities, including restricted securities, for which market quotations are readily available, are valued at the last reported sale price or official closing price as reported by a third party pricing vendor on the primary market or exchange on which they are traded and are categorized as Level 1 in the hierarchy. In the event there were no sales during the day or closing prices are not available, securities are valued at the last quoted bid price or may be valued using the last available price and are generally categorized as Level 2 in the hierarchy. For foreign equity securities, when market or security specific events arise, comparisons to the valuation of American Depositary Receipts (ADRs), futures contracts, Exchange-Traded Funds (ETFs) and certain indexes as well as quoted prices for similar securities may be used and would be categorized as Level 2 in the hierarchy. For equity securities, including restricted securities, where observable inputs are limited, assumptions about market activity and risk are used and these securities may be categorized as Level 3 in the hierarchy.
Futures contracts are valued at the settlement price established each day by the board of trade or exchange on which they are traded and are categorized as Level 1 in the hierarchy. Investments in open-end mutual funds, including the Fidelity Central Funds, are valued at their closing net asset value (NAV) each business day and are categorized as Level 1 in the hierarchy.
Changes in valuation techniques may result in transfers in or out of an assigned level within the disclosure hierarchy. The aggregate value of investments by input level as of October 31, 2021 is included at the end of the Fund's Schedule of Investments.
Investment Transactions and Income. For financial reporting purposes, the Fund's investment holdings and NAV include trades executed through the end of the last business day of the period. The NAV per share for processing shareholder transactions is calculated as of the close of business of the New York Stock Exchange (NYSE), normally 4:00 p.m. Eastern time and includes trades executed through the end of the prior business day. Gains and losses on securities sold are determined on the basis of identified cost. Commissions paid to certain brokers with whom the investment adviser, or its affiliates, places trades on behalf of a fund include an amount in addition to trade execution, which may be rebated back to a fund. Any such rebates are included in net realized gain (loss) on investments in the Statement of Operations. Dividend income is recorded on the ex-dividend date, except for certain dividends from foreign securities where the ex-dividend date may have passed, which are recorded as soon as the Fund is informed of the ex-dividend date. Non-cash dividends included in dividend income, if any, are recorded at the fair market value of the securities received. Income and capital gain distributions from Fidelity Central Funds, if any, are recorded on the ex-dividend date. Certain distributions received by the Fund represent a return of capital or capital gain. The Fund determines the components of these distributions subsequent to the ex-dividend date, based upon receipt of tax filings or other correspondence relating to the underlying investment. These distributions are recorded as a reduction of cost of investments and/or as a realized gain.
Expenses. Expenses directly attributable to a fund are charged to that fund. Expenses attributable to more than one fund are allocated among the respective funds on the basis of relative net assets or other appropriate methods. Expenses included in the accompanying financial statements reflect the expenses of that fund and do not include any expenses associated with any underlying mutual funds or exchange-traded funds. Although not included in a fund's expenses, a fund indirectly bears its proportionate share of these expenses through the net asset value of each underlying mutual fund or exchange-traded fund. Expense estimates are accrued in the period to which they relate and adjustments are made when actual amounts are known.
Income Tax Information and Distributions to Shareholders. Each year, the Fund intends to qualify as a regulated investment company under Subchapter M of the Internal Revenue Code, including distributing substantially all of its taxable income and realized gains. As a result, no provision for U.S. Federal income taxes is required. The Fund files a U.S. federal tax return, in addition to state and local tax returns as required. The Fund's federal income tax returns are subject to examination by the Internal Revenue Service (IRS) for a period of three fiscal years after they are filed. State and local tax returns may be subject to examination for an additional fiscal year depending on the jurisdiction.
Distributions are declared and recorded on the ex-dividend date. Income and capital gain distributions are determined in accordance with income tax regulations, which may differ from GAAP.
Capital accounts within the financial statements are adjusted for permanent book-tax differences. These adjustments have no impact on net assets or the results of operations. Capital accounts are not adjusted for temporary book-tax differences which will reverse in a subsequent period.
Book-tax differences are primarily due to futures contracts and losses deferred due to wash sales and excise tax regulations.
As of period end, the cost and unrealized appreciation (depreciation) in securities, and derivatives if applicable, for federal income tax purposes were as follows:
| Gross unrealized appreciation | $14,992,354 |
| Gross unrealized depreciation | (1,758,772) |
| Net unrealized appreciation (depreciation) | $13,233,582 |
| Tax cost | $88,960,605 |
4. Derivative Instruments.
Risk Exposures and the Use of Derivative Instruments. The Fund's investment objective allows the Fund to enter into various types of derivative contracts, including futures contracts. Derivatives are investments whose value is primarily derived from underlying assets, indices or reference rates and may be transacted on an exchange or over-the-counter (OTC). Derivatives may involve a future commitment to buy or sell a specified asset based on specified terms, to exchange future cash flows at periodic intervals based on a notional principal amount, or for one party to make one or more payments upon the occurrence of specified events in exchange for periodic payments from the other party.
The Fund used derivatives to increase returns and to manage exposure to certain risks as defined below. The success of any strategy involving derivatives depends on analysis of numerous economic factors, and if the strategies for investment do not work as intended, the Fund may not achieve its objectives.
The Fund's use of derivatives increased or decreased its exposure to the following risk:
| Equity Risk | Equity risk relates to the fluctuations in the value of financial instruments as a result of changes in market prices (other than those arising from interest rate risk or foreign exchange risk), whether caused by factors specific to an individual investment, its issuer, or all factors affecting all instruments traded in a market or market segment. |
The Fund is also exposed to additional risks from investing in derivatives, such as liquidity risk and counterparty credit risk. Liquidity risk is the risk that the Fund will be unable to close out the derivative in the open market in a timely manner. Counterparty credit risk is the risk that the counterparty will not be able to fulfill its obligation to the Fund. Counterparty credit risk related to exchange-traded futures contracts may be mitigated by the protection provided by the exchange on which they trade
Investing in derivatives may involve greater risks than investing in the underlying assets directly and, to varying degrees, may involve risk of loss in excess of any initial investment and collateral received and amounts recognized in the Statement of Assets and Liabilities. In addition, there may be the risk that the change in value of the derivative contract does not correspond to the change in value of the underlying instrument.
Futures Contracts. A futures contract is an agreement between two parties to buy or sell a specified underlying instrument for a fixed price at a specified future date. The Fund used futures contracts to manage its exposure to the stock market.
Upon entering into a futures contract, a fund is required to deposit either cash or securities (initial margin) with a clearing broker in an amount equal to a certain percentage of the face value of the contract. Futures contracts are marked-to-market daily and subsequent daily payments (variation margin) are made or received by a fund depending on the daily fluctuations in the value of the futures contracts and are recorded as unrealized appreciation or (depreciation). This receivable and/or payable, if any, is included in daily variation margin on futures contracts in the Statement of Assets and Liabilities. Realized gain or (loss) is recorded upon the expiration or closing of a futures contract. The net realized gain (loss) and change in net unrealized appreciation (depreciation) on futures contracts during the period is presented in the Statement of Operations.
Any open futures contracts at period end are presented in the Schedule of Investments under the caption "Futures Contracts". The notional amount at value reflects each contract's exposure to the underlying instrument or index at period end and is representative of volume of activity during the period. Cash deposited to meet initial margin requirements is presented as segregated cash with brokers for derivative instruments in the Statement of Assets and Liabilities.
5. Purchases and Sales of Investments.
Purchases and sales of securities, other than short-term securities and in-kind transactions, as applicable, are noted in the table below.
| Purchases ($) | Sales ($) | |
| Fidelity Flex Large Cap Value Fund | 55,625,005 | 49,476,493 |
6. Fees and Other Transactions with Affiliates.
Management Fee. Fidelity Management & Research Company LLC (the investment adviser) and its affiliates provide the Fund with investment management related services and the Fund does not pay any fees for these services. Under the management contract, the investment adviser or an affiliate pays all other expenses of the Fund, excluding fees and expenses of the independent Trustees, and certain miscellaneous expenses such as proxy and shareholder meeting expenses.
Interfund Trades. Funds may purchase from or sell securities to other Fidelity Funds under procedures adopted by the Board. The procedures have been designed to ensure these interfund trades are executed in accordance with Rule 17a-7 of the 1940 Act. Any interfund trades are included within the respective purchases and sales amounts shown in the Purchases and Sales of Investments note. During the period there were no interfund trades.
7. Committed Line of Credit.
Certain Funds participate with other funds managed by the investment adviser or an affiliate in a $4.25 billion credit facility (the "line of credit") to be utilized for temporary or emergency purposes to fund shareholder redemptions or for other short-term liquidity purposes. The commitment fees on the pro-rata portion of the line of credit are borne by the investment adviser. During the period, there were no borrowings on this line of credit.
8. Other.
Fund's organizational documents provide former and current trustees and officers with a limited indemnification against liabilities arising in connection with the performance of their duties to the fund. In the normal course of business, the fund may also enter into contracts that provide general indemnifications. The fund's maximum exposure under these arrangements is unknown as this would be dependent on future claims that may be made against the fund. The risk of material loss from such claims is considered remote.
9. Coronavirus (COVID-19) Pandemic.
An outbreak of COVID-19 first detected in China during December 2019 has since spread globally and was declared a pandemic by the World Health Organization during March 2020. Developments that disrupt global economies and financial markets, such as the COVID-19 pandemic, may magnify factors that affect the Fund's performance.
Shareholder Expense Example
As a shareholder, you incur two types of costs: (1) transaction costs, which may include sales charges (loads) on purchase payments or redemption proceeds, as applicable and (2) ongoing costs, which generally include management fees, distribution and/or service (12b-1) fees and other Fund expenses. This Example is intended to help you understand your ongoing costs (in dollars) of investing in a fund and to compare these costs with the ongoing costs of investing in other mutual funds.
The Example is based on an investment of $1,000 invested at the beginning of the period and held for the entire period (May 1, 2021 to October 31, 2021).
Actual Expenses
The first line of the accompanying table provides information about actual account values and actual expenses. You may use the information in this line, together with the amount you invested, to estimate the expenses that you paid over the period. Simply divide your account value by $1,000.00 (for example, an $8,600 account value divided by $1,000.00 = 8.6), then multiply the result by the number in the first line for a class/Fund under the heading entitled "Expenses Paid During Period" to estimate the expenses you paid on your account during this period. If any fund is a shareholder of any underlying mutual funds or exchange-traded funds (ETFs) (the Underlying Funds), such fund indirectly bears its proportional share of the expenses of the Underlying Funds in addition to the direct expenses incurred presented in the table. These fees and expenses are not included in the annualized expense ratio used to calculate the expense estimate in the table below.
Hypothetical Example for Comparison Purposes
The second line of the accompanying table provides information about hypothetical account values and hypothetical expenses based on the actual expense ratio and an assumed rate of return of 5% per year before expenses, which is not the actual return. The hypothetical account values and expenses may not be used to estimate the actual ending account balance or expenses you paid for the period. You may use this information to compare the ongoing costs of investing in the Fund and other funds. To do so, compare this 5% hypothetical example with the 5% hypothetical examples that appear in the shareholder reports of the other funds. If any fund is a shareholder of any Underlying Funds, such fund indirectly bears its proportional share of the expenses of the Underlying Funds in addition to the direct expenses as presented in the table. These fees and expenses are not included in the annualized expense ratio used to calculate the expense estimate in the table below.
Please note that the expenses shown in the table are meant to highlight your ongoing costs only and do not reflect any transaction costs. Therefore, the second line of the table is useful in comparing ongoing costs only, and will not help you determine the relative total costs of owning different funds. In addition, if these transactional costs were included, your costs would have been higher.
| Annualized Expense Ratio-A | Beginning Account Value May 1, 2021 | Ending Account Value October 31, 2021 | Expenses Paid During Period-B May 1, 2021 to October 31, 2021 | |
| Fidelity Flex Large Cap Value Fund | - %-C | |||
| Actual | $1,000.00 | $1,064.20 | $--D | |
| Hypothetical-E | $1,000.00 | $1,025.21 | $--D |
A Annualized expense ratio reflects expenses net of applicable fee waivers.
B Expenses are equal to the annualized expense ratio, multiplied by the average account value over the period, multiplied by 184/ 365 (to reflect the one-half year period). The fees and expenses of any Underlying Funds are not included in each annualized expense ratio.
C Amount represents less than .005%.
D Amount represents less than $.005.
E 5% return per year before expenses
Board Approval of Investment Advisory Contracts and Management Fees
Fidelity Flex Large Cap Value Fund
Each year, the Board of Trustees, including the Independent Trustees (together, the Board), votes on the renewal of the management contract with Fidelity Management & Research Company LLC (FMR) and the sub-advisory agreements (together, the Advisory Contracts) for the fund, including the fund's sub-advisory agreement (Sub-Advisory Agreement) with Geode Capital Management, LLC (Geode). FMR and the sub-advisers are referred to herein as the Investment Advisers. The Board, assisted by the advice of fund counsel and Independent Trustees' counsel, requests and considers a broad range of information relevant to the renewal of the Advisory Contracts throughout the year.The Board meets regularly and, at each of its meetings, covers an extensive agenda of topics and materials and considers factors that are relevant to its annual consideration of the renewal of the fund's Advisory Contracts, including the services and support provided to the fund and its shareholders. The Board has established various standing committees (Committees), each composed of and chaired by Independent Trustees with varying backgrounds, to which the Board has assigned specific subject matter responsibilities in order to enhance effective decision-making by the Board. The Board, acting directly and through its Committees, requests and receives information concerning the annual consideration of the renewal of the fund's Advisory Contracts. The Board also meets as needed to review matters specifically related to the Board's annual consideration of the renewal of the Advisory Contracts. Members of the Board may also meet with trustees of other Fidelity funds through joint ad hoc committees to discuss certain matters relevant to all of the Fidelity funds.At its May 2021 meeting, the Board unanimously determined to renew the fund's Advisory Contracts. In considering whether to renew the Advisory Contracts for the fund, the Board considered all factors it believed relevant and reached a determination, with the assistance of fund counsel and Independent Trustees' counsel and through the exercise of its business judgment, that the renewal of the Advisory Contracts was in the best interests of the fund and its shareholders and the fact that no fee is payable under the management contract was fair and reasonable.Nature, Extent, and Quality of Services Provided. The Board considered staffing as it relates to the fund, including the backgrounds of investment personnel of Fidelity and Geode, and also considered the fund's investment objective, strategies, and related investment philosophy. The Independent Trustees also had discussions with senior management of Fidelity's investment operations and investment groups and with senior representatives of Geode. The Board considered the structure of the investment personnel compensation programs and whether the structures provide appropriate incentives to act in the best interests of the fund. Additionally, the Board considered the portfolio managers' investments, if any, in the funds that they manage.The Trustees also discussed with representatives of Fidelity, at meetings throughout the year, Fidelity's role in, among other things, overseeing compliance with federal securities laws and other applicable requirements by Geode with respect to the fund and monitoring and overseeing the performance and investment capabilities of Geode. The Trustees considered that the Board had received from Fidelity periodic reports about its oversight and due diligence processes, as well as periodic reports regarding the performance of Geode.The Board also considered the nature, extent and quality of services provided by Geode. The Trustees noted that under the Sub-Advisory Agreement, subject to oversight by Fidelity, Geode is responsible for, among other things, identifying investments and arranging for execution of portfolio transactions to implement the fund's investment strategy. In addition, the Trustees noted that Geode is responsible for providing such reporting as may be requested by Fidelity to fulfill its oversight responsibilities discussed above.Resources Dedicated to Investment Management and Support Services. The Board and the Fund Oversight and Research Committees reviewed the general qualifications and capabilities of Fidelity's and Geode's investment staffs, including their size, education, experience, and resources, as well as Fidelity's and Geode's approach to recruiting, training, managing, and compensating investment personnel. The Board noted that Fidelity has continued to increase the resources devoted to non-U.S. offices, including expansion of Fidelity's global investment organization. The Board also noted that Fidelity's and Geode's analysts have extensive resources, tools and capabilities that allow them to conduct sophisticated quantitative and fundamental analysis, as well as credit analysis of issuers, counterparties and guarantors. Further, the Board considered that Fidelity's and Geode's investment professionals have sufficient access to information and data so as to provide competitive investment results over time, and that those professionals also have access to sophisticated tools that permit them to assess portfolio construction and risk and performance attribution characteristics continuously. Additionally, in its deliberations, the Board considered Fidelity's and Geode's trading, risk management, compliance, and technology and operations capabilities and resources, which are integral parts of the investment management process. The Board also considered Fidelity's and Geode's investments in business continuity planning, and their success in continuously providing services to the fund notwithstanding the severe disruptions caused by the COVID-19 pandemic.Shareholder and Administrative Services. The Board considered (i) the nature, extent, quality, and cost of advisory, administrative, and shareholder services performed by the Investment Advisers and their affiliates under the Advisory Contracts and by FMR's affiliates under separate agreements covering transfer agency, pricing and bookkeeping, and securities lending services for the fund; (ii) the nature and extent of the supervision of third party service providers, principally custodians, subcustodians, and pricing vendors; and (iii) the resources devoted to, and the record of compliance with, the fund's compliance policies and procedures. The Board also reviewed the allocation of fund brokerage, including allocations to brokers affiliated with the Investment Advisers, the use of brokerage commissions to pay fund expenses, and the use of "soft" commission dollars to pay for research services.The Board noted that the growth of fund assets over time across the complex allows Fidelity to reinvest in the development of services designed to enhance the value and convenience of the Fidelity funds as investment vehicles. These services include 24-hour access to account information and market information over the Internet and through telephone representatives, investor education materials and asset allocation tools, and the expanded availability of Fidelity Investor Centers.Investment in a Large Fund Family. The Board considered the benefits to shareholders of investing in a Fidelity fund, including the benefits of investing in a fund that is part of a large family of funds offering a variety of investment disciplines and providing a large variety of mutual fund investor services. The Board noted that Fidelity had taken, or had made recommendations that resulted in the Fidelity funds taking, a number of actions over the previous year that benefited particular funds, including: (i) continuing to dedicate additional resources to Fidelity's investment research process, which includes meetings with management of issuers of securities in which the funds invest, and to the support of the senior management team that oversees asset management; (ii) continuing efforts to enhance Fidelity's global research capabilities; (iii) launching new funds and ETFs with innovative structures, strategies and pricing and making other enhancements to meet client needs; (iv) launching new share classes of existing funds; (v) eliminating purchase minimums and broadening eligibility requirements for certain funds and share classes; (vi) approving the reduction in the holding period for the Class C to Class A conversion policy; (vii) reducing management fees and total expenses for certain target date funds and classes and index funds; (viii) lowering expenses for certain existing funds and classes by implementing or lowering expense caps; (ix) rationalizing product lines and gaining increased efficiencies from fund mergers, liquidations, and share class consolidations; (x) continuing to develop, acquire and implement systems and technology to improve services to the funds and shareholders, strengthen information security, and increase efficiency; and (xi) continuing to implement enhancements to further strengthen Fidelity's product line to increase investors' probability of success in achieving their investment goals, including retirement income goals.Investment Performance. The Board considered whether the fund has operated in accordance with its investment objective, as well as its record of compliance with its investment restrictions. The Board reviewed the fund's absolute investment performance, as well as the fund's relative investment performance. The Board did not consider performance to be a material factor in its decision to renew the fund's Advisory Contracts, as the fund is not publicly offered as a stand-alone investment product. In this regard, the Board noted that the fund is available exclusively to certain fee-based accounts and advisor programs offered by Fidelity, including certain employer-sponsored plans and discretionary investment programs.Based on its review, the Board concluded that the nature, extent, and quality of services provided to the fund under the Advisory Contracts should continue to benefit the shareholders of the fund.Competitiveness of Management Fee and Total Expense Ratio. The Board noted that the fund is available exclusively through certain Fidelity fee-based accounts and advisory programs. The Board considered that the fund does not pay FMR a management fee for investment advisory services, but that FMR is indirectly compensated for its services out of Fidelity fee-based account and advisory program fees. The Board also noted that FMR or an affiliate undertakes to pay all operating expenses of the fund, except Independent Trustee fees and expenses, proxy and shareholder meeting expenses, interest, taxes, and extraordinary expenses (such as litigation expenses). The Board further noted that the fund pays its non-operating expenses, including brokerage commissions and fees and expenses associated with the fund's securities lending program, if applicable.Based on its review, the Board considered that the fund does not pay a management fee and concluded that the total expense ratio of the fund was reasonable in light of the services that the fund and its shareholders receive and the other factors considered.Costs of the Services and Profitability. The Board considered the level of Fidelity's profits in respect of all the Fidelity funds.A public accounting firm has been engaged annually by the Board as part of the Board's assessment of Fidelity's profitability analysis. The engagement includes the review and assessment of the methodologies used by Fidelity in determining the revenues and expenses attributable to Fidelity's mutual fund business, and completion of agreed-upon procedures in respect of the mathematical accuracy of certain fund profitability information and its conformity to established allocation methodologies. After considering the reports issued under the engagement and information provided by Fidelity, the Board concluded that while other allocation methods may also be reasonable, Fidelity's profitability methodologies are reasonable in all material respects.The Board also reviewed Fidelity's and Geode's non-fund businesses and potential indirect benefits such businesses may have received as a result of their association with Fidelity's mutual fund business (i.e., fall-out benefits) as well as cases where Fidelity's and Geode's affiliates may benefit from the funds' business. The Board considered areas where potential indirect benefits to the Fidelity funds from their relationships with Fidelity may exist. The Board also considered that in 2019 a joint ad hoc committee created by it and the boards of other Fidelity funds evaluated potential fall-out benefits (PFOB Committee). The Board noted that it considered the PFOB Committee's findings in connection with its consideration of the renewal of the Advisory Contracts.The Board concluded that the costs of the services provided by and the profits realized by Fidelity and Geode in connection with the operation of the fund were not relevant to the renewal of the Advisory Contracts because the fund pays no advisory fees and FMR or an affiliate bears all expenses of the fund with limited exceptions.The Board also considered information regarding the profitability of Geode's relationship with the fund.Economies of Scale. The Board concluded that because the fund pays no advisory fees and FMR or an affiliate bears all expenses of the fund with limited exceptions, the realization of economies of scale was not a material factor in the Board's decision to renew the fund's Advisory Contracts.Additional Information Requested by the Board. In order to develop fully the factual basis for consideration of the Fidelity funds' advisory contracts, the Board requested and received additional information on certain topics, including: (i) fund flow and performance trends, in particular the underperformance of certain funds and strategies, and Fidelity's long-term strategies for certain funds; (ii) consideration of expanding the use of performance fees for additional funds; (iii) Fidelity's pricing philosophy compared to competitors; (iv) metrics for evaluating index fund and ETF performance and information about ETF trading characteristics; (v) the methodology with respect to evaluating competitive fund data and peer group classifications and fee and expense comparisons; (vi) the expense structures for different funds and classes and information about the differences between various expense structures; (vii) group fee breakpoints; (viii) information regarding other accounts managed by Fidelity and sub-advisory arrangements; and (ix) Fidelity's philosophies and strategies for evaluating funds and classes with lower or declining asset levels.Based on its evaluation of all of the conclusions noted above, and after considering all factors it believed relevant, the Board concluded that the advisory and sub-advisory fee arrangements are fair and reasonable, and that the fund's Advisory Contracts should be renewed.![]()
FLV-SANN-1221
1.9893833.102
Fidelity® Mid-Cap Stock K6 Fund
Semi-Annual Report
October 31, 2021
Contents
Board Approval of Investment Advisory Contracts and Management Fees |
To view a fund's proxy voting guidelines and proxy voting record for the 12-month period ended June 30, visit http://www.fidelity.com/proxyvotingresults or visit the Securities and Exchange Commission's (SEC) web site at http://www.sec.gov.
You may also call 1-800-835-5092 to request a free copy of the proxy voting guidelines.
Standard & Poor's, S&P and S&P 500 are registered service marks of The McGraw-Hill Companies, Inc. and have been licensed for use by Fidelity Distributors Corporation.
Other third-party marks appearing herein are the property of their respective owners.
All other marks appearing herein are registered or unregistered trademarks or service marks of FMR LLC or an affiliated company. © 2021 FMR LLC. All rights reserved.
This report and the financial statements contained herein are submitted for the general information of the shareholders of the Fund. This report is not authorized for distribution to prospective investors in the Fund unless preceded or accompanied by an effective prospectus.
A fund files its complete schedule of portfolio holdings with the SEC for the first and third quarters of each fiscal year on Form N-PORT. Forms N-PORT are available on the SEC’s web site at http://www.sec.gov. A fund's Forms N-PORT may be reviewed and copied at the SEC’s Public Reference Room in Washington, DC. Information regarding the operation of the SEC's Public Reference Room may be obtained by calling 1-800-SEC-0330.
For a complete list of a fund's portfolio holdings, view the most recent holdings listing, semiannual report, or annual report on Fidelity's web site at http://www.fidelity.com, http://www.institutional.fidelity.com, or http://www.401k.com, as applicable.
NOT FDIC INSURED •MAY LOSE VALUE •NO BANK GUARANTEE
Neither the Fund nor Fidelity Distributors Corporation is a bank.
Note to Shareholders:
Early in 2020, the outbreak and spread of COVID-19 emerged as a public health emergency that had a major influence on financial markets, primarily based on its impact on the global economy and corporate earnings. On March 11, 2020, the World Health Organization declared the COVID-19 outbreak a pandemic, citing sustained risk of further global spread. The pandemic prompted a number of measures to limit the spread of COVID-19, including travel and border restrictions, quarantines, and restrictions on large gatherings. In turn, these resulted in lower consumer activity, diminished demand for a wide range of products and services, disruption in manufacturing and supply chains, and – given the wide variability in outcomes regarding the outbreak – significant market uncertainty and volatility. To help stem the turmoil, the U.S. government took unprecedented action – in concert with the U.S. Federal Reserve and central banks around the world – to help support consumers, businesses, and the broader economy, and to limit disruption to the financial system.
In general, the overall impact of the pandemic lessened in 2021, amid a resilient economy and widespread distribution of three COVID-19 vaccines granted emergency use authorization from the U.S. Food and Drug Administration (FDA) early in the year. Still, the situation remains dynamic, and the extent and duration of its influence on financial markets and the economy is highly uncertain, due in part to a recent spike in cases based on highly contagious variants of the coronavirus.
Extreme events such as the COVID-19 crisis are exogenous shocks that can have significant adverse effects on mutual funds and their investments. Although multiple asset classes may be affected by market disruption, the duration and impact may not be the same for all types of assets. Fidelity is committed to helping you stay informed amid news about COVID-19 and during increased market volatility, and we continue to take extra steps to be responsive to customer needs. We encourage you to visit us online, where we offer ongoing updates, commentary, and analysis on the markets and our funds.
Investment Summary (Unaudited)
Top Ten Stocks as of October 31, 2021
| % of fund's net assets | |
| Molina Healthcare, Inc. | 2.1 |
| American Financial Group, Inc. | 1.5 |
| First Horizon National Corp. | 1.4 |
| WNS Holdings Ltd. sponsored ADR | 1.4 |
| Arch Capital Group Ltd. | 1.3 |
| Wintrust Financial Corp. | 1.3 |
| Huntington Bancshares, Inc. | 1.3 |
| Cheniere Energy, Inc. | 1.2 |
| Hess Corp. | 1.2 |
| Radian Group, Inc. | 1.2 |
| 13.9 |
Top Five Market Sectors as of October 31, 2021
| % of fund's net assets | |
| Financials | 19.6 |
| Industrials | 18.6 |
| Consumer Discretionary | 13.1 |
| Real Estate | 7.9 |
| Information Technology | 7.3 |
Asset Allocation (% of fund's net assets)
| As of October 31, 2021* | ||
| Stocks | 97.0% | |
| Convertible Securities | 0.4% | |
| Short-Term Investments and Net Other Assets (Liabilities) | 2.6% | |

* Foreign investments - 18.0%
Schedule of Investments October 31, 2021 (Unaudited)
Showing Percentage of Net Assets
| Common Stocks - 96.3% | |||
| Shares | Value | ||
| COMMUNICATION SERVICES - 2.7% | |||
| Entertainment - 0.7% | |||
| Endeavor Group Holdings, Inc. (a) | 70,400 | $1,892,352 | |
| Endeavor Group Holdings, Inc. Class A (b) | 40,374 | 1,085,253 | |
| 2,977,605 | |||
| Media - 2.0% | |||
| Interpublic Group of Companies, Inc. | 144,052 | 5,267,982 | |
| Omnicom Group, Inc. | 52,618 | 3,582,233 | |
| 8,850,215 | |||
| TOTAL COMMUNICATION SERVICES | 11,827,820 | ||
| CONSUMER DISCRETIONARY - 12.4% | |||
| Auto Components - 0.3% | |||
| Magna International, Inc. Class A (sub. vtg.) | 12,941 | 1,052,659 | |
| Automobiles - 0.4% | |||
| Aston Martin Lagonda Global Holdings PLC (a)(c) | 75,671 | 1,768,797 | |
| Hotels, Restaurants & Leisure - 3.9% | |||
| Boyd Gaming Corp. (a) | 31,208 | 1,990,446 | |
| Caesars Entertainment, Inc. (a) | 25,322 | 2,771,746 | |
| Churchill Downs, Inc. | 16,472 | 3,788,560 | |
| Elior SA (a)(c) | 167,423 | 1,319,950 | |
| MGM Resorts International | 52,462 | 2,474,108 | |
| Wyndham Hotels & Resorts, Inc. | 59,508 | 5,026,641 | |
| 17,371,451 | |||
| Household Durables - 3.1% | |||
| D.R. Horton, Inc. | 46,996 | 4,195,333 | |
| Lennar Corp. Class A | 21,426 | 2,141,100 | |
| Mohawk Industries, Inc. (a) | 13,614 | 2,412,537 | |
| NVR, Inc. (a) | 1,041 | 5,095,487 | |
| 13,844,457 | |||
| Internet & Direct Marketing Retail - 1.0% | |||
| Coupang, Inc. Class A (a)(d) | 110,473 | 3,287,676 | |
| Farfetch Ltd. Class A (a) | 22,235 | 871,834 | |
| 4,159,510 | |||
| Specialty Retail - 1.1% | |||
| Best Buy Co., Inc. | 15,528 | 1,898,143 | |
| National Vision Holdings, Inc. (a)(d) | 24,839 | 1,531,076 | |
| Ross Stores, Inc. | 13,551 | 1,533,973 | |
| 4,963,192 | |||
| Textiles, Apparel & Luxury Goods - 2.6% | |||
| Brunello Cucinelli SpA (a) | 78,469 | 4,753,213 | |
| PVH Corp. | 22,656 | 2,476,980 | |
| Tapestry, Inc. | 72,700 | 2,833,846 | |
| Under Armour, Inc. Class A (sub. vtg.) (a) | 59,885 | 1,315,075 | |
| 11,379,114 | |||
| TOTAL CONSUMER DISCRETIONARY | 54,539,180 | ||
| CONSUMER STAPLES - 2.7% | |||
| Food & Staples Retailing - 0.9% | |||
| BJ's Wholesale Club Holdings, Inc. (a) | 70,093 | 4,096,235 | |
| Food Products - 1.8% | |||
| Bunge Ltd. | 24,097 | 2,232,346 | |
| Greencore Group PLC (a) | 1,424,933 | 2,519,519 | |
| JDE Peet's BV | 11,605 | 337,933 | |
| Lamb Weston Holdings, Inc. | 28,349 | 1,600,301 | |
| Nomad Foods Ltd. (a) | 39,554 | 1,077,055 | |
| 7,767,154 | |||
| TOTAL CONSUMER STAPLES | 11,863,389 | ||
| ENERGY - 7.1% | |||
| Energy Equipment & Services - 0.3% | |||
| Noble Corp. (c) | 67 | 1,686 | |
| Oceaneering International, Inc. (a) | 109,066 | 1,483,298 | |
| 1,484,984 | |||
| Oil, Gas & Consumable Fuels - 6.8% | |||
| Canadian Natural Resources Ltd. | 79,250 | 3,368,253 | |
| Cheniere Energy, Inc. | 53,321 | 5,513,391 | |
| Energy Transfer LP | 396,210 | 3,767,957 | |
| EQT Corp. (a) | 220,462 | 4,389,398 | |
| Golar LNG Ltd. (a) | 107,914 | 1,406,119 | |
| Harbour Energy PLC (a) | 264,538 | 1,272,186 | |
| Hess Corp. | 65,625 | 5,418,656 | |
| Imperial Oil Ltd. | 92,439 | 3,129,601 | |
| Range Resources Corp. (a) | 77,595 | 1,809,515 | |
| 30,075,076 | |||
| TOTAL ENERGY | 31,560,060 | ||
| FINANCIALS - 19.6% | |||
| Banks - 8.5% | |||
| BOK Financial Corp. | 17,547 | 1,775,230 | |
| Comerica, Inc. | 61,225 | 5,209,635 | |
| Cullen/Frost Bankers, Inc. | 26,639 | 3,449,751 | |
| First Horizon National Corp. | 369,061 | 6,262,965 | |
| Huntington Bancshares, Inc. | 361,144 | 5,684,407 | |
| M&T Bank Corp. | 32,601 | 4,796,259 | |
| UMB Financial Corp. | 32,387 | 3,200,483 | |
| WesBanco, Inc. | 39,029 | 1,357,038 | |
| Wintrust Financial Corp. | 65,732 | 5,817,282 | |
| 37,553,050 | |||
| Capital Markets - 1.9% | |||
| Cboe Global Markets, Inc. | 11,790 | 1,555,573 | |
| Lazard Ltd. Class A | 44,249 | 2,167,759 | |
| Raymond James Financial, Inc. | 23,763 | 2,342,794 | |
| Sixth Street Specialty Lending, Inc. | 102,184 | 2,436,067 | |
| 8,502,193 | |||
| Diversified Financial Services - 0.2% | |||
| WeWork, Inc. (a) | 90,512 | 924,128 | |
| Insurance - 7.8% | |||
| American Financial Group, Inc. | 49,446 | 6,726,634 | |
| American International Group, Inc. | 55,939 | 3,305,436 | |
| Arch Capital Group Ltd. (a) | 139,308 | 5,825,861 | |
| Assurant, Inc. | 13,172 | 2,124,775 | |
| Beazley PLC (a) | 251,022 | 1,339,791 | |
| First American Financial Corp. | 53,661 | 3,924,766 | |
| Hartford Financial Services Group, Inc. | 39,147 | 2,854,991 | |
| Hiscox Ltd. | 161,490 | 1,840,989 | |
| RenaissanceRe Holdings Ltd. | 28,283 | 4,010,529 | |
| The Travelers Companies, Inc. | 13,569 | 2,182,981 | |
| 34,136,753 | |||
| Thrifts & Mortgage Finance - 1.2% | |||
| Radian Group, Inc. | 221,666 | 5,291,167 | |
| TOTAL FINANCIALS | 86,407,291 | ||
| HEALTH CARE - 7.1% | |||
| Health Care Equipment & Supplies - 1.6% | |||
| Butterfly Network, Inc. (b) | 35,568 | 367,062 | |
| Butterfly Network, Inc. Class A (a)(d) | 250,959 | 2,589,897 | |
| Hologic, Inc. (a) | 53,333 | 3,909,842 | |
| 6,866,801 | |||
| Health Care Providers & Services - 3.8% | |||
| Centene Corp. (a) | 36,444 | 2,596,271 | |
| Guardant Health, Inc. (a) | 8,129 | 949,386 | |
| Molina Healthcare, Inc. (a) | 31,248 | 9,240,656 | |
| Oak Street Health, Inc. (a)(d) | 38,598 | 1,822,984 | |
| Universal Health Services, Inc. Class B | 17,819 | 2,211,338 | |
| 16,820,635 | |||
| Life Sciences Tools & Services - 0.7% | |||
| 10X Genomics, Inc. (a) | 4,900 | 790,223 | |
| Bruker Corp. | 30,127 | 2,419,198 | |
| 3,209,421 | |||
| Pharmaceuticals - 1.0% | |||
| Recordati SpA | 26,121 | 1,634,201 | |
| UCB SA | 12,300 | 1,465,958 | |
| Viatris, Inc. | 90,274 | 1,205,158 | |
| 4,305,317 | |||
| TOTAL HEALTH CARE | 31,202,174 | ||
| INDUSTRIALS - 18.6% | |||
| Aerospace & Defense - 1.0% | |||
| BWX Technologies, Inc. | 28,138 | 1,596,550 | |
| Huntington Ingalls Industries, Inc. | 13,326 | 2,701,580 | |
| 4,298,130 | |||
| Air Freight & Logistics - 0.8% | |||
| GXO Logistics, Inc. (a) | 36,664 | 3,255,763 | |
| Airlines - 0.1% | |||
| JetBlue Airways Corp. (a) | 29,437 | 413,001 | |
| Building Products - 2.5% | |||
| Builders FirstSource, Inc. (a) | 76,361 | 4,449,555 | |
| Fortune Brands Home & Security, Inc. | 18,697 | 1,895,876 | |
| Jeld-Wen Holding, Inc. (a) | 39,073 | 1,070,991 | |
| Owens Corning | 39,491 | 3,688,854 | |
| 11,105,276 | |||
| Commercial Services & Supplies - 1.1% | |||
| CoreCivic, Inc. (a) | 113,140 | 974,135 | |
| GFL Environmental, Inc. | 35,300 | 1,451,533 | |
| Stericycle, Inc. (a) | 35,288 | 2,361,473 | |
| 4,787,141 | |||
| Construction & Engineering - 1.6% | |||
| AECOM (a) | 75,204 | 5,141,697 | |
| Dycom Industries, Inc. (a) | 21,296 | 1,691,328 | |
| 6,833,025 | |||
| Electrical Equipment - 2.5% | |||
| Acuity Brands, Inc. | 18,214 | 3,741,702 | |
| Regal Rexnord Corp. | 25,581 | 3,896,754 | |
| Sensata Technologies, Inc. PLC (a) | 38,023 | 2,095,067 | |
| Vertiv Holdings Co. | 54,129 | 1,390,033 | |
| 11,123,556 | |||
| Industrial Conglomerates - 0.4% | |||
| Melrose Industries PLC | 833,302 | 1,799,576 | |
| Machinery - 4.9% | |||
| Allison Transmission Holdings, Inc. | 47,974 | 1,600,413 | |
| Donaldson Co., Inc. | 68,260 | 4,096,283 | |
| Fortive Corp. | 37,434 | 2,834,128 | |
| Kornit Digital Ltd. (a) | 11,034 | 1,845,768 | |
| Oshkosh Corp. | 31,546 | 3,375,422 | |
| Otis Worldwide Corp. | 16,714 | 1,342,301 | |
| PACCAR, Inc. | 21,200 | 1,899,944 | |
| Pentair PLC | 26,979 | 1,995,637 | |
| Woodward, Inc. | 24,780 | 2,798,901 | |
| 21,788,797 | |||
| Marine - 0.1% | |||
| Goodbulk Ltd. (a) | 45,656 | 405,332 | |
| Professional Services - 1.2% | |||
| Clarivate Analytics PLC (a) | 39,910 | 935,890 | |
| Leidos Holdings, Inc. | 24,183 | 2,417,816 | |
| Science Applications Internati | 23,138 | 2,077,330 | |
| 5,431,036 | |||
| Road & Rail - 1.7% | |||
| Knight-Swift Transportation Holdings, Inc. Class A | 79,685 | 4,517,343 | |
| XPO Logistics, Inc. (a) | 36,508 | 3,132,386 | |
| 7,649,729 | |||
| Trading Companies & Distributors - 0.7% | |||
| Beacon Roofing Supply, Inc. (a) | 57,922 | 3,062,336 | |
| TOTAL INDUSTRIALS | 81,952,698 | ||
| INFORMATION TECHNOLOGY - 7.3% | |||
| Communications Equipment - 0.3% | |||
| Ericsson (B Shares) | 105,557 | 1,152,198 | |
| Electronic Equipment & Components - 3.0% | |||
| Arrow Electronics, Inc. (a) | 43,548 | 5,040,681 | |
| CDW Corp. | 11,565 | 2,158,607 | |
| Fabrinet (a) | 39,800 | 3,820,800 | |
| Keysight Technologies, Inc. (a) | 13,657 | 2,458,533 | |
| 13,478,621 | |||
| IT Services - 2.8% | |||
| Akamai Technologies, Inc. (a) | 13,596 | 1,433,834 | |
| Euronet Worldwide, Inc. (a) | 8,009 | 898,530 | |
| Gartner, Inc. (a) | 7,337 | 2,435,224 | |
| Verra Mobility Corp. (a) | 98,965 | 1,472,599 | |
| WNS Holdings Ltd. sponsored ADR (a) | 68,711 | 6,102,224 | |
| 12,342,411 | |||
| Semiconductors & Semiconductor Equipment - 0.3% | |||
| SiTime Corp. (a) | 5,100 | 1,350,939 | |
| Software - 0.9% | |||
| Aspen Technology, Inc. (a) | 12,863 | 2,015,503 | |
| Black Knight, Inc. (a) | 16,417 | 1,150,996 | |
| Citrix Systems, Inc. | 8,621 | 816,667 | |
| 3,983,166 | |||
| TOTAL INFORMATION TECHNOLOGY | 32,307,335 | ||
| MATERIALS - 7.2% | |||
| Chemicals - 2.2% | |||
| CF Industries Holdings, Inc. | 28,500 | 1,618,800 | |
| LG Chemical Ltd. | 3,266 | 2,331,523 | |
| Nutrien Ltd. | 25,778 | 1,801,711 | |
| Olin Corp. | 71,451 | 4,071,278 | |
| 9,823,312 | |||
| Containers & Packaging - 1.1% | |||
| Avery Dennison Corp. | 8,768 | 1,908,969 | |
| O-I Glass, Inc. (a) | 217,691 | 2,840,868 | |
| 4,749,837 | |||
| Metals & Mining - 3.9% | |||
| Commercial Metals Co. | 75,749 | 2,437,603 | |
| Franco-Nevada Corp. | 16,837 | 2,402,429 | |
| Freeport-McMoRan, Inc. | 68,300 | 2,576,276 | |
| Lundin Mining Corp. | 294,804 | 2,565,481 | |
| Newcrest Mining Ltd. | 64,454 | 1,206,805 | |
| Novagold Resources, Inc. (a) | 209,086 | 1,527,260 | |
| Steel Dynamics, Inc. | 66,388 | 4,386,919 | |
| 17,102,773 | |||
| TOTAL MATERIALS | 31,675,922 | ||
| REAL ESTATE - 7.9% | |||
| Equity Real Estate Investment Trusts (REITs) - 7.0% | |||
| Apartment Income (REIT) Corp. | 46,079 | 2,470,295 | |
| Cousins Properties, Inc. | 67,019 | 2,654,623 | |
| Equity Residential (SBI) | 31,290 | 2,703,456 | |
| Gaming & Leisure Properties | 70,196 | 3,403,804 | |
| Healthcare Realty Trust, Inc. | 87,991 | 2,908,982 | |
| Healthcare Trust of America, Inc. | 84,264 | 2,813,575 | |
| National Retail Properties, Inc. | 72,187 | 3,274,402 | |
| Spirit Realty Capital, Inc. | 61,722 | 3,020,057 | |
| Tanger Factory Outlet Centers, Inc. | 73,638 | 1,237,118 | |
| VEREIT, Inc. | 63,059 | 3,171,868 | |
| VICI Properties, Inc. (d) | 109,348 | 3,209,364 | |
| 30,867,544 | |||
| Real Estate Management & Development - 0.9% | |||
| Jones Lang LaSalle, Inc. (a) | 16,013 | 4,135,037 | |
| TOTAL REAL ESTATE | 35,002,581 | ||
| UTILITIES - 3.7% | |||
| Electric Utilities - 2.8% | |||
| Alliant Energy Corp. | 63,556 | 3,595,363 | |
| FirstEnergy Corp. | 57,096 | 2,199,909 | |
| IDACORP, Inc. | 28,651 | 2,988,872 | |
| OGE Energy Corp. | 110,101 | 3,751,141 | |
| 12,535,285 | |||
| Gas Utilities - 0.5% | |||
| Atmos Energy Corp. | 24,446 | 2,251,966 | |
| Multi-Utilities - 0.4% | |||
| NiSource, Inc. | 69,536 | 1,715,453 | |
| TOTAL UTILITIES | 16,502,704 | ||
| TOTAL COMMON STOCKS | |||
| (Cost $355,031,117) | 424,841,154 | ||
| Preferred Stocks - 1.1% | |||
| Convertible Preferred Stocks - 0.4% | |||
| CONSUMER STAPLES - 0.3% | |||
| Food Products - 0.3% | |||
| Bowery Farming, Inc. Series C1 (b)(e) | 19,457 | 1,172,271 | |
| HEALTH CARE - 0.1% | |||
| Biotechnology - 0.1% | |||
| National Resilience, Inc. Series B (b)(e) | 15,539 | 690,087 | |
| TOTAL CONVERTIBLE PREFERRED STOCKS | 1,862,358 | ||
| Nonconvertible Preferred Stocks - 0.7% | |||
| CONSUMER DISCRETIONARY - 0.7% | |||
| Automobiles - 0.7% | |||
| Porsche Automobil Holding SE (Germany) | 29,266 | 3,045,902 | |
| TOTAL PREFERRED STOCKS | |||
| (Cost $3,659,709) | 4,908,260 | ||
| Money Market Funds - 3.8% | |||
| Fidelity Cash Central Fund 0.06% (f) | 6,960,780 | 6,962,172 | |
| Fidelity Securities Lending Cash Central Fund 0.06% (f)(g) | 9,941,729 | 9,942,723 | |
| TOTAL MONEY MARKET FUNDS | |||
| (Cost $16,904,895) | 16,904,895 | ||
| TOTAL INVESTMENT IN SECURITIES - 101.2% | |||
| (Cost $375,595,721) | 446,654,309 | ||
| NET OTHER ASSETS (LIABILITIES) - (1.2)% | (5,387,064) | ||
| NET ASSETS - 100% | $441,267,245 |
Legend
(a) Non-income producing
(b) Restricted securities (including private placements) - Investment in securities not registered under the Securities Act of 1933 (excluding 144A issues). At the end of the period, the value of restricted securities (excluding 144A issues) amounted to $3,314,673 or 0.8% of net assets.
(c) Security exempt from registration under Rule 144A of the Securities Act of 1933. These securities may be resold in transactions exempt from registration, normally to qualified institutional buyers. At the end of the period, the value of these securities amounted to $3,090,433 or 0.7% of net assets.
(d) Security or a portion of the security is on loan at period end.
(e) Level 3 security
(f) Affiliated fund that is generally available only to investment companies and other accounts managed by Fidelity Investments. The rate quoted is the annualized seven-day yield of the fund at period end. A complete unaudited listing of the fund's holdings as of its most recent quarter end is available upon request. In addition, each Fidelity Central Fund's financial statements are available on the SEC's website or upon request.
(g) Investment made with cash collateral received from securities on loan.
Additional information on each restricted holding is as follows:
| Security | Acquisition Date | Acquisition Cost |
| Bowery Farming, Inc. Series C1 | 5/18/21 | $1,172,271 |
| Butterfly Network, Inc. | 2/12/21 | $355,680 |
| Endeavor Group Holdings, Inc. Class A | 3/29/21 | $968,976 |
| National Resilience, Inc. Series B | 12/1/20 | $212,263 |
Affiliated Central Funds
Fiscal year to date information regarding the Fund's investments in Fidelity Central Funds, including the ownership percentage, is presented below.
| Fund | Value, beginning of period | Purchases | Sales Proceeds | Dividend Income | Realized Gain/Loss | Change in Unrealized appreciation (depreciation) | Value, end of period | % ownership, end of period |
| Fidelity Cash Central Fund 0.06% | $9,763,495 | $81,431,447 | $84,232,770 | $2,079 | $-- | $-- | $6,962,172 | 0.0% |
| Fidelity Securities Lending Cash Central Fund 0.06% | 4,752,459 | 56,456,803 | 51,266,539 | 19,661 | -- | -- | 9,942,723 | 0.0% |
| Total | $14,515,954 | $137,888,250 | $135,499,309 | $21,740 | $-- | $-- | $16,904,895 |
Amounts in the income column in the above table include any capital gain distributions from underlying funds, which are presented in the corresponding line-item in the Statement of Operations, if applicable. Amount for Fidelity Securities Lending Cash Central Fund represents the income earned on investing cash collateral, less rebates paid to borrowers and any lending agent fees associated with the loan, plus any premium payments received for lending certain types of securities.
Investment Valuation
The following is a summary of the inputs used, as of October 31, 2021, involving the Fund's assets and liabilities carried at fair value. The inputs or methodology used for valuing securities may not be an indication of the risk associated with investing in those securities. For more information on valuation inputs, and their aggregation into the levels used below, please refer to the Investment Valuation section in the accompanying Notes to Financial Statements.
| Valuation Inputs at Reporting Date: | ||||
| Description | Total | Level 1 | Level 2 | Level 3 |
| Investments in Securities: | ||||
| Equities: | ||||
| Communication Services | $11,827,820 | $11,827,820 | $-- | $-- |
| Consumer Discretionary | 57,585,082 | 54,539,180 | 3,045,902 | -- |
| Consumer Staples | 13,035,660 | 11,863,389 | -- | 1,172,271 |
| Energy | 31,560,060 | 31,560,060 | -- | -- |
| Financials | 86,407,291 | 86,407,291 | -- | -- |
| Health Care | 31,892,261 | 31,202,174 | -- | 690,087 |
| Industrials | 81,952,698 | 81,952,698 | -- | -- |
| Information Technology | 32,307,335 | 31,155,137 | 1,152,198 | -- |
| Materials | 31,675,922 | 29,344,399 | 2,331,523 | -- |
| Real Estate | 35,002,581 | 35,002,581 | -- | -- |
| Utilities | 16,502,704 | 16,502,704 | -- | -- |
| Money Market Funds | 16,904,895 | 16,904,895 | -- | -- |
| Total Investments in Securities: | $446,654,309 | $438,262,328 | $6,529,623 | $1,862,358 |
Other Information
Distribution of investments by country or territory of incorporation, as a percentage of Total Net Assets, is as follows (Unaudited):
| United States of America | 82.0% |
| Bermuda | 4.0% |
| Canada | 3.9% |
| United Kingdom | 1.9% |
| Bailiwick of Jersey | 1.6% |
| Italy | 1.5% |
| Ireland | 1.1% |
| Others (Individually Less Than 1%) | 4.0% |
| 100.0% |
See accompanying notes which are an integral part of the financial statements.
Financial Statements
Statement of Assets and Liabilities
| October 31, 2021 (Unaudited) | ||
| Assets | ||
| Investment in securities, at value (including securities loaned of $9,701,490) — See accompanying schedule: Unaffiliated issuers (cost $358,690,826) | $429,749,414 | |
| Fidelity Central Funds (cost $16,904,895) | 16,904,895 | |
| Total Investment in Securities (cost $375,595,721) | $446,654,309 | |
| Foreign currency held at value (cost $662) | 662 | |
| Receivable for investments sold | 6,564,003 | |
| Receivable for fund shares sold | 112,235 | |
| Dividends receivable | 139,296 | |
| Distributions receivable from Fidelity Central Funds | 3,188 | |
| Other receivables | 7,894 | |
| Total assets | 453,481,587 | |
| Liabilities | ||
| Payable for investments purchased | $1,900,098 | |
| Payable for fund shares redeemed | 208,157 | |
| Accrued management fee | 163,798 | |
| Collateral on securities loaned | 9,942,289 | |
| Total liabilities | 12,214,342 | |
| Net Assets | $441,267,245 | |
| Net Assets consist of: | ||
| Paid in capital | $366,247,927 | |
| Total accumulated earnings (loss) | 75,019,318 | |
| Net Assets | $441,267,245 | |
| Net Asset Value, offering price and redemption price per share ($441,267,245 ÷ 30,801,620 shares) | $14.33 |
See accompanying notes which are an integral part of the financial statements.
Statement of Operations
| Six months ended October 31, 2021 (Unaudited) | ||
| Investment Income | ||
| Dividends | $4,030,758 | |
| Income from Fidelity Central Funds (including $19,661 from security lending) | 21,740 | |
| Total income | 4,052,498 | |
| Expenses | ||
| Management fee | $909,446 | |
| Independent trustees' fees and expenses | 639 | |
| Total expenses before reductions | 910,085 | |
| Expense reductions | (8) | |
| Total expenses after reductions | 910,077 | |
| Net investment income (loss) | 3,142,421 | |
| Realized and Unrealized Gain (Loss) | ||
| Net realized gain (loss) on: | ||
| Investment securities: | ||
| Unaffiliated issuers | 2,053,962 | |
| Foreign currency transactions | (2,286) | |
| Total net realized gain (loss) | 2,051,676 | |
| Change in net unrealized appreciation (depreciation) on: | ||
| Investment securities: | ||
| Unaffiliated issuers | 12,492,895 | |
| Assets and liabilities in foreign currencies | 698 | |
| Total change in net unrealized appreciation (depreciation) | 12,493,593 | |
| Net gain (loss) | 14,545,269 | |
| Net increase (decrease) in net assets resulting from operations | $17,687,690 |
See accompanying notes which are an integral part of the financial statements.
Statement of Changes in Net Assets
| Six months ended October 31, 2021 (Unaudited) | Year ended April 30, 2021 | |
| Increase (Decrease) in Net Assets | ||
| Operations | ||
| Net investment income (loss) | $3,142,421 | $2,314,877 |
| Net realized gain (loss) | 2,051,676 | 11,280,555 |
| Change in net unrealized appreciation (depreciation) | 12,493,593 | 71,909,385 |
| Net increase (decrease) in net assets resulting from operations | 17,687,690 | 85,504,817 |
| Distributions to shareholders | (9,812,168) | (2,240,902) |
| Share transactions | ||
| Proceeds from sales of shares | 148,856,293 | 176,141,257 |
| Reinvestment of distributions | 9,812,168 | 2,240,902 |
| Cost of shares redeemed | (45,200,764) | (50,156,612) |
| Net increase (decrease) in net assets resulting from share transactions | 113,467,697 | 128,225,547 |
| Total increase (decrease) in net assets | 121,343,219 | 211,489,462 |
| Net Assets | ||
| Beginning of period | 319,924,026 | 108,434,564 |
| End of period | $441,267,245 | $319,924,026 |
| Other Information | ||
| Shares | ||
| Sold | 10,724,845 | 14,380,726 |
| Issued in reinvestment of distributions | 692,950 | 198,040 |
| Redeemed | (3,251,753) | (4,297,584) |
| Net increase (decrease) | 8,166,042 | 10,281,182 |
See accompanying notes which are an integral part of the financial statements.
Financial Highlights
Fidelity Mid-Cap Stock K6 Fund
| Six months ended (Unaudited) October 31, | Years endedApril 30, | ||
| 2021 | 2021 | 2020 A | |
| Selected Per–Share Data | |||
| Net asset value, beginning of period | $14.13 | $8.78 | $10.00 |
| Income from Investment Operations | |||
| Net investment income (loss)B | .11 | .15 | .11 |
| Net realized and unrealized gain (loss) | .48 | 5.37 | (1.27) |
| Total from investment operations | .59 | 5.52 | (1.16) |
| Distributions from net investment income | (.02) | (.17) | (.06) |
| Distributions from net realized gain | (.37) | – | – |
| Total distributions | (.39) | (.17) | (.06) |
| Net asset value, end of period | $14.33 | $14.13 | $8.78 |
| Total ReturnC,D | 4.19% | 63.39% | (11.74)% |
| Ratios to Average Net AssetsE,F | |||
| Expenses before reductions | .45%G | .45% | .45%G |
| Expenses net of fee waivers, if any | .45%G | .45% | .45%G |
| Expenses net of all reductions | .45%G | .44% | .45%G |
| Net investment income (loss) | 1.55%G | 1.35% | 1.29%G |
| Supplemental Data | |||
| Net assets, end of period (000 omitted) | $441,267 | $319,924 | $108,435 |
| Portfolio turnover rateH | 40%G,I | 61%I | 52%G,I |
A For the period June 13, 2019 (commencement of operations) through April 30, 2020.
B Calculated based on average shares outstanding during the period.
C Total returns for periods of less than one year are not annualized.
D Total returns would have been lower if certain expenses had not been reduced during the applicable periods shown.
E Fees and expenses of any underlying mutual funds or exchange-traded funds (ETFs) are not included in the Fund's expense ratio. The Fund indirectly bears its proportionate share of these expenses. For additional expense information related to investments in Fidelity Central Funds, please refer to the "Investments in Fidelity Central Funds" note found in the Notes to Financial Statements section of the most recent Annual or Semi-Annual report.
F Expense ratios reflect operating expenses of the class. Expenses before reductions do not reflect amounts reimbursed, waived, or reduced through arrangements with the investment adviser, brokerage services, or other offset arrangements, if applicable, and do not represent the amount paid by the class during periods when reimbursements, waivers or reductions occur.
G Annualized
H Amount does not include the portfolio activity of any underlying mutual funds or exchange-traded funds (ETFs).
I Portfolio turnover rate excludes securities received or delivered in-kind.
See accompanying notes which are an integral part of the financial statements.
Notes to Financial Statements (Unaudited)
For the period ended October 31, 2021
1. Organization.
Fidelity Mid-Cap Stock K6 Fund (the Fund) is a fund of Fidelity Concord Street Trust (the Trust) and is authorized to issue an unlimited number of shares. Share transactions on the Statement of Changes in Net Assets may contain exchanges between affiliated funds. The Trust is registered under the Investment Company Act of 1940, as amended (the 1940 Act), as an open-end management investment company organized as a Massachusetts business trust. Shares generally are available only to employer-sponsored retirement plans that are recordkept by Fidelity, or to certain employer-sponsored retirement plans that are not recordkept by Fidelity.
2. Investments in Fidelity Central Funds.
Funds may invest in Fidelity Central Funds, which are open-end investment companies generally available only to other investment companies and accounts managed by the investment adviser and its affiliates. The Schedule of Investments lists any Fidelity Central Funds held as an investment as of period end, but does not include the underlying holdings of each Fidelity Central Fund. An investing fund indirectly bears its proportionate share of the expenses of the underlying Fidelity Central Funds.
Based on its investment objective, each Fidelity Central Fund may invest or participate in various investment vehicles or strategies that are similar to those of the investing fund. These strategies are consistent with the investment objectives of the investing fund and may involve certain economic risks which may cause a decline in value of each of the Fidelity Central Funds and thus a decline in the value of the investing fund.
| Fidelity Central Fund | Investment Manager | Investment Objective | Investment Practices | Expense Ratio(a) |
| Fidelity Money Market Central Funds | Fidelity Management & Research Company LLC (FMR) | Each fund seeks to obtain a high level of current income consistent with the preservation of capital and liquidity. | Short-term Investments | Less than .005% |
(a) Expenses expressed as a percentage of average net assets and are as of each underlying Central Fund's most recent annual or semi-annual shareholder report.
A complete unaudited list of holdings for each Fidelity Central Fund is available upon request or at the Securities and Exchange Commission website at www.sec.gov. In addition, the financial statements of the Fidelity Central Funds which contain the significant accounting policies (including investment valuation policies) of those funds, and are not covered by the Report of Independent Registered Public Accounting Firm, are available on the Securities and Exchange Commission website or upon request.
3. Significant Accounting Policies.
The Fund is an investment company and applies the accounting and reporting guidance of the Financial Accounting Standards Board (FASB) Accounting Standards Codification Topic 946 Financial Services - Investment Companies. The financial statements have been prepared in conformity with accounting principles generally accepted in the United States of America (GAAP), which require management to make certain estimates and assumptions at the date of the financial statements. Actual results could differ from those estimates. Subsequent events, if any, through the date that the financial statements were issued have been evaluated in the preparation of the financial statements. The Fund's Schedule of Investments lists any underlying mutual funds or exchange-traded funds (ETFs) but does not include the underlying holdings of these funds. The following summarizes the significant accounting policies of the Fund:
Investment Valuation. Investments are valued as of 4:00 p.m. Eastern time on the last calendar day of the period. The Board of Trustees (the Board) has delegated the day to day responsibility for the valuation of the Fund's investments to the Fair Value Committee (the Committee) established by the Fund's investment adviser. In accordance with valuation policies and procedures approved by the Board, the Fund attempts to obtain prices from one or more third party pricing vendors or brokers to value its investments. When current market prices, quotations or currency exchange rates are not readily available or reliable, investments will be fair valued in good faith by the Committee, in accordance with procedures adopted by the Board. Factors used in determining fair value vary by investment type and may include market or investment specific events. The frequency with which these procedures are used cannot be predicted and they may be utilized to a significant extent. The Committee oversees the Fund's valuation policies and procedures and reports to the Board on the Committee's activities and fair value determinations. The Board monitors the appropriateness of the procedures used in valuing the Fund's investments and ratifies the fair value determinations of the Committee.
The Fund categorizes the inputs to valuation techniques used to value its investments into a disclosure hierarchy consisting of three levels as shown below:
- Level 1 – quoted prices in active markets for identical investments
- Level 2 – other significant observable inputs (including quoted prices for similar investments, interest rates, prepayment speeds, etc.)
- Level 3 – unobservable inputs (including the Fund's own assumptions based on the best information available)
Valuation techniques used to value the Fund's investments by major category are as follows:
Equity securities, including restricted securities, for which market quotations are readily available, are valued at the last reported sale price or official closing price as reported by a third party pricing vendor on the primary market or exchange on which they are traded and are categorized as Level 1 in the hierarchy. In the event there were no sales during the day or closing prices are not available, securities are valued at the last quoted bid price or may be valued using the last available price and are generally categorized as Level 2 in the hierarchy. For foreign equity securities, when market or security specific events arise, comparisons to the valuation of American Depositary Receipts (ADRs), futures contracts, Exchange-Traded Funds (ETFs) and certain indexes as well as quoted prices for similar securities may be used and would be categorized as Level 2 in the hierarchy. For equity securities, including restricted securities, where observable inputs are limited, assumptions about market activity and risk are used and these securities may be categorized as Level 3 in the hierarchy.
Investments in open-end mutual funds, including the Fidelity Central Funds, are valued at their closing net asset value (NAV) each business day and are categorized as Level 1 in the hierarchy.
Changes in valuation techniques may result in transfers in or out of an assigned level within the disclosure hierarchy. The aggregate value of investments by input level as of October 31, 2021 is included at the end of the Fund's Schedule of Investments.
Foreign Currency. Certain Funds may use foreign currency contracts to facilitate transactions in foreign-denominated securities. Gains and losses from these transactions may arise from changes in the value of the foreign currency or if the counterparties do not perform under the contracts' terms.
Foreign-denominated assets, including investment securities, and liabilities are translated into U.S. dollars at the exchange rates at period end. Purchases and sales of investment securities, income and dividends received, and expenses denominated in foreign currencies are translated into U.S. dollars at the exchange rate in effect on the transaction date.
The effects of exchange rate fluctuations on investments are included with the net realized and unrealized gain (loss) on investment securities. Other foreign currency transactions resulting in realized and unrealized gain (loss) are disclosed separately.
Investment Transactions and Income. For financial reporting purposes, the Fund's investment holdings and NAV include trades executed through the end of the last business day of the period. The NAV per share for processing shareholder transactions is calculated as of the close of business of the New York Stock Exchange (NYSE), normally 4:00 p.m. Eastern time and includes trades executed through the end of the prior business day. Gains and losses on securities sold are determined on the basis of identified cost. Commissions paid to certain brokers with whom the investment adviser, or its affiliates, places trades on behalf of a fund include an amount in addition to trade execution, which may be rebated back to a fund. Any such rebates are included in net realized gain (loss) on investments in the Statement of Operations. Dividend income is recorded on the ex-dividend date, except for certain dividends from foreign securities where the ex-dividend date may have passed, which are recorded as soon as the Fund is informed of the ex-dividend date. Non-cash dividends included in dividend income, if any, are recorded at the fair market value of the securities received. Income and capital gain distributions from Fidelity Central Funds, if any, are recorded on the ex-dividend date. Certain distributions received by the Fund represent a return of capital or capital gain. The Fund determines the components of these distributions subsequent to the ex-dividend date, based upon receipt of tax filings or other correspondence relating to the underlying investment. These distributions are recorded as a reduction of cost of investments and/or as a realized gain. Investment income is recorded net of foreign taxes withheld where recovery of such taxes is uncertain. Funds may file withholding tax reclaims in certain jurisdictions to recover a portion of amounts previously withheld. Any withholding tax reclaims income is included in the Statement of Operations in dividends. Any receivables for withholding tax reclaims are included in the Statement of Assets and Liabilities in dividends receivable.
Expenses. Expenses directly attributable to a fund are charged to that fund. Expenses attributable to more than one fund are allocated among the respective funds on the basis of relative net assets or other appropriate methods. Expenses included in the accompanying financial statements reflect the expenses of that fund and do not include any expenses associated with any underlying mutual funds or exchange-traded funds. Although not included in a fund's expenses, a fund indirectly bears its proportionate share of these expenses through the net asset value of each underlying mutual fund or exchange-traded fund. Expense estimates are accrued in the period to which they relate and adjustments are made when actual amounts are known.
Income Tax Information and Distributions to Shareholders. Each year, the Fund intends to qualify as a regulated investment company under Subchapter M of the Internal Revenue Code, including distributing substantially all of its taxable income and realized gains. As a result, no provision for U.S. Federal income taxes is required. The Fund files a U.S. federal tax return, in addition to state and local tax returns as required. The Fund's federal income tax returns are subject to examination by the Internal Revenue Service (IRS) for a period of three fiscal years after they are filed. State and local tax returns may be subject to examination for an additional fiscal year depending on the jurisdiction. Foreign taxes are provided for based on the Fund's understanding of the tax rules and rates that exist in the foreign markets in which it invests.
Distributions are declared and recorded on the ex-dividend date. Income and capital gain distributions are determined in accordance with income tax regulations, which may differ from GAAP.
Capital accounts within the financial statements are adjusted for permanent book-tax differences. These adjustments have no impact on net assets or the results of operations. Capital accounts are not adjusted for temporary book-tax differences which will reverse in a subsequent period.
Book-tax differences are primarily due to foreign currency transactions, capital loss carryforwards, partnerships and losses deferred due to wash sales.
As of period end, the cost and unrealized appreciation (depreciation) in securities, and derivatives if applicable, for federal income tax purposes were as follows:
| Gross unrealized appreciation | $80,771,032 |
| Gross unrealized depreciation | (11,840,591) |
| Net unrealized appreciation (depreciation) | $68,930,441 |
| Tax cost | $377,723,868 |
Restricted Securities (including Private Placements). Funds may invest in securities that are subject to legal or contractual restrictions on resale. These securities generally may be resold in transactions exempt from registration or to the public if the securities are registered. Disposal of these securities may involve time-consuming negotiations and expense, and prompt sale at an acceptable price may be difficult. Information regarding restricted securities held at period end is included at the end of the Schedule of Investments, if applicable.
4. Purchases and Sales of Investments.
Purchases and sales of securities, other than short-term securities and in-kind transactions, as applicable, are noted in the table below.
| Purchases ($) | Sales ($) | |
| Fidelity Mid-Cap Stock K6 Fund | 96,606,723 | 74,643,484 |
Unaffiliated Exchanges In-Kind. Shares that were exchanged for investments, including accrued interest and cash, if any, are shown in the table below. The amount of in-kind exchanges is included in share transactions in the accompanying Statement of Changes in Net Assets.
| Shares | Total Proceeds ($) | |
| Fidelity Mid-Cap Stock K6 Fund | 5,911,744 | 80,552,634 |
Prior Year Unaffiliated Exchanges In-Kind. Shares that were exchanged for investments, including accrued interest and cash, if any, are shown in the table below. The amount of in-kind exchanges is included in share transactions in the accompanying Statement of Changes in Net Assets.
| Shares | Total Proceeds ($) | |
| Fidelity Mid-Cap Stock K6 Fund | 9,393,028 | 117,754,233 |
5. Fees and Other Transactions with Affiliates.
Management Fee. Fidelity Management & Research Company LLC (the investment adviser) and its affiliates provide the Fund with investment management related services for which the Fund pays a monthly management fee that is based on an annual rate of .45% of average net assets. Under the management contract, the investment adviser or an affiliate pays all other expenses of the Fund, excluding fees and expenses of the independent Trustees, and certain miscellaneous expenses such as proxy and shareholder meeting expenses.
Brokerage Commissions. A portion of portfolio transactions were placed with brokerage firms which are affiliates of the investment adviser. Brokerage commissions are included in net realized gain (loss) and change in net unrealized appreciation (depreciation) in the Statement of Operations. The commissions paid to these affiliated firms were as follows:
| Amount | |
| Fidelity Mid-Cap Stock K6 Fund | $1,709 |
Interfund Trades. Funds may purchase from or sell securities to other Fidelity Funds under procedures adopted by the Board. The procedures have been designed to ensure these interfund trades are executed in accordance with Rule 17a-7 of the 1940 Act. Any interfund trades are included within the respective purchases and sales amounts shown in the Purchases and Sales of Investments note. Interfund trades during the period are noted in the table below.
| Purchases ($) | Sales ($) | Realized Gain (Loss) ($) | |
| Fidelity Mid-Cap Stock K6 Fund | 6,179,702 | 2,444,761 | (325,262) |
6. Committed Line of Credit.
Certain Funds participate with other funds managed by the investment adviser or an affiliate in a $4.25 billion credit facility (the "line of credit") to be utilized for temporary or emergency purposes to fund shareholder redemptions or for other short-term liquidity purposes. The commitment fees on the pro-rata portion of the line of credit are borne by the investment adviser. During the period, there were no borrowings on this line of credit.
7. Security Lending.
Funds lend portfolio securities from time to time in order to earn additional income. Lending agents are used, including National Financial Services (NFS), an affiliate of the investment adviser. Pursuant to a securities lending agreement, NFS will receive a fee, which is capped at 9.9% of a fund's daily lending revenue, for its services as lending agent. A fund may lend securities to certain qualified borrowers, including NFS. On the settlement date of the loan, a fund receives collateral (in the form of U.S. Treasury obligations, letters of credit and/or cash) against the loaned securities and maintains collateral in an amount not less than 100% of the market value of the loaned securities during the period of the loan. The market value of the loaned securities is determined at the close of business of a fund and any additional required collateral is delivered to a fund on the next business day. A fund or borrower may terminate the loan at any time, and if the borrower defaults on its obligation to return the securities loaned because of insolvency or other reasons, a fund may apply collateral received from the borrower against the obligation. A fund may experience delays and costs in recovering the securities loaned. Any cash collateral received is invested in the Fidelity Securities Lending Cash Central Fund. Any loaned securities are identified as such in the Schedule of Investments, and the value of loaned securities and cash collateral at period end, as applicable, are presented in the Statement of Assets and Liabilities. Security lending income represents the income earned on investing cash collateral, less rebates paid to borrowers and any lending agent fees associated with the loan, plus any premium payments received for lending certain types of securities. Security lending income is presented in the Statement of Operations as a component of income from Fidelity Central Funds. Affiliated security lending activity, if any, was as follows:
| Total Security Lending Fees Paid to NFS | Security Lending Income From Securities Loaned to NFS | Value of Securities Loaned to NFS at Period End | |
| Fidelity Mid-Cap Stock K6 Fund | $2,050 | $798 | $– |
8. Expense Reductions.
Through arrangements with the Fund's custodian, credits realized as a result of certain uninvested cash balances were used to reduce the Fund's expenses by $8.
9. Other.
Fund's organizational documents provide former and current trustees and officers with a limited indemnification against liabilities arising in connection with the performance of their duties to the fund. In the normal course of business, the fund may also enter into contracts that provide general indemnifications. The fund's maximum exposure under these arrangements is unknown as this would be dependent on future claims that may be made against the fund. The risk of material loss from such claims is considered remote.
10. Coronavirus (COVID-19) Pandemic.
An outbreak of COVID-19 first detected in China during December 2019 has since spread globally and was declared a pandemic by the World Health Organization during March 2020. Developments that disrupt global economies and financial markets, such as the COVID-19 pandemic, may magnify factors that affect the Fund's performance.
Shareholder Expense Example
As a shareholder, you incur two types of costs: (1) transaction costs, which may include sales charges (loads) on purchase payments or redemption proceeds, as applicable and (2) ongoing costs, which generally include management fees, distribution and/or service (12b-1) fees and other Fund expenses. This Example is intended to help you understand your ongoing costs (in dollars) of investing in a fund and to compare these costs with the ongoing costs of investing in other mutual funds.
The Example is based on an investment of $1,000 invested at the beginning of the period and held for the entire period (May 1, 2021 to October 31, 2021).
Actual Expenses
The first line of the accompanying table provides information about actual account values and actual expenses. You may use the information in this line, together with the amount you invested, to estimate the expenses that you paid over the period. Simply divide your account value by $1,000.00 (for example, an $8,600 account value divided by $1,000.00 = 8.6), then multiply the result by the number in the first line for a class/Fund under the heading entitled "Expenses Paid During Period" to estimate the expenses you paid on your account during this period. If any fund is a shareholder of any underlying mutual funds or exchange-traded funds (ETFs) (the Underlying Funds), such fund indirectly bears its proportional share of the expenses of the Underlying Funds in addition to the direct expenses incurred presented in the table. These fees and expenses are not included in the annualized expense ratio used to calculate the expense estimate in the table below.
Hypothetical Example for Comparison Purposes
The second line of the accompanying table provides information about hypothetical account values and hypothetical expenses based on the actual expense ratio and an assumed rate of return of 5% per year before expenses, which is not the actual return. The hypothetical account values and expenses may not be used to estimate the actual ending account balance or expenses you paid for the period. You may use this information to compare the ongoing costs of investing in the Fund and other funds. To do so, compare this 5% hypothetical example with the 5% hypothetical examples that appear in the shareholder reports of the other funds. If any fund is a shareholder of any Underlying Funds, such fund indirectly bears its proportional share of the expenses of the Underlying Funds in addition to the direct expenses as presented in the table. These fees and expenses are not included in the annualized expense ratio used to calculate the expense estimate in the table below.
Please note that the expenses shown in the table are meant to highlight your ongoing costs only and do not reflect any transaction costs. Therefore, the second line of the table is useful in comparing ongoing costs only, and will not help you determine the relative total costs of owning different funds. In addition, if these transactional costs were included, your costs would have been higher.
| Annualized Expense Ratio-A | Beginning Account Value May 1, 2021 | Ending Account Value October 31, 2021 | Expenses Paid During Period-B May 1, 2021 to October 31, 2021 | |
| Fidelity Mid-Cap Stock K6 Fund | .45% | |||
| Actual | $1,000.00 | $1,041.90 | $2.32 | |
| Hypothetical-C | $1,000.00 | $1,022.94 | $2.29 |
A Annualized expense ratio reflects expenses net of applicable fee waivers.
B Expenses are equal to the annualized expense ratio, multiplied by the average account value over the period, multiplied by 184/ 365 (to reflect the one-half year period). The fees and expenses of any Underlying Funds are not included in each annualized expense ratio.
C 5% return per year before expenses
Board Approval of Investment Advisory Contracts and Management Fees
Fidelity Mid-Cap Stock K6 Fund
Each year, the Board of Trustees, including the Independent Trustees (together, the Board), votes on the renewal of the management contract with Fidelity Management & Research Company LLC (FMR) and the sub-advisory agreements (together, the Advisory Contracts) for the fund. FMR and the sub-advisers are referred to herein as the Investment Advisers. The Board, assisted by the advice of fund counsel and Independent Trustees' counsel, requests and considers a broad range of information relevant to the renewal of the Advisory Contracts throughout the year.The Board meets regularly and, at each of its meetings, covers an extensive agenda of topics and materials and considers factors that are relevant to its annual consideration of the renewal of the fund's Advisory Contracts, including the services and support provided to the fund and its shareholders. The Board has established various standing committees (Committees), each composed of and chaired by Independent Trustees with varying backgrounds, to which the Board has assigned specific subject matter responsibilities in order to enhance effective decision-making by the Board. The Board, acting directly and through its Committees, requests and receives information concerning the annual consideration of the renewal of the fund's Advisory Contracts. The Board also meets as needed to review matters specifically related to the Board's annual consideration of the renewal of the Advisory Contracts. Members of the Board may also meet with trustees of other Fidelity funds through joint ad hoc committees to discuss certain matters relevant to all of the Fidelity funds.At its May 2021 meeting, the Board unanimously determined to renew the fund's Advisory Contracts. In reaching its determination, the Board considered all factors it believed relevant, including (i) the nature, extent, and quality of the services provided to the fund and its shareholders (including the investment performance of the fund); (ii) the competitiveness of the fund's management fee and total expense ratio relative to peer funds; (iii) the total costs of the services provided by and the profits realized by Fidelity from its relationships with the fund; and (iv) the extent to which, if any, economies of scale exist and are realized as the fund grows, and whether any economies of scale are appropriately shared with fund shareholders.In considering whether to renew the Advisory Contracts for the fund, the Board reached a determination, with the assistance of fund counsel and Independent Trustees' counsel and through the exercise of its business judgment, that the renewal of the Advisory Contracts was in the best interests of the fund and its shareholders and that the compensation payable under the Advisory Contracts was fair and reasonable. The Board's decision to renew the Advisory Contracts was not based on any single factor, but rather was based on a comprehensive consideration of all the information provided to the Board at its meetings throughout the year. The Board, in reaching its determination to renew the Advisory Contracts, was aware that shareholders of the fund have a broad range of investment choices available to them, including a wide choice among funds offered by Fidelity's competitors, and that the fund's shareholders, who have the opportunity to review and weigh the disclosure provided by the fund in its prospectus and other public disclosures, have chosen to invest in this fund, which is part of the Fidelity family of funds.Nature, Extent, and Quality of Services Provided. The Board considered Fidelity's staffing as it relates to the fund, including the backgrounds of investment personnel of Fidelity, and also considered the fund's investment objective, strategies, and related investment philosophy. The Independent Trustees also had discussions with senior management of Fidelity's investment operations and investment groups. The Board considered the structure of the investment personnel compensationprogram and whether this structure provides appropriate incentives to act in the best interests of the fund.Additionally, the Board considered the portfolio managers' investments, if any, in the funds that they manage.Resources Dedicated to Investment Management and Support Services. The Board and the Fund Oversight and Research Committees reviewed the general qualifications and capabilities of Fidelity's investment staff, including its size, education, experience, and resources, as well as Fidelity's approach to recruiting, training, managing, and compensating investment personnel. The Board noted that Fidelity has continued to increase the resources devoted to non-U.S. offices, including expansion of Fidelity's global investment organization. The Board also noted that Fidelity's analysts have extensive resources, tools and capabilities that allow them to conduct sophisticated quantitative and fundamental analysis, as well as credit analysis of issuers, counterparties and guarantors. Further, the Board considered that Fidelity's investment professionals have sufficient access to global information and data so as to provide competitive investment results over time, and that those professionals also have access to sophisticated tools that permit them to assess portfolio construction and risk and performance attribution characteristics continuously, as well as to transmit new information and research conclusions rapidly around the world. Additionally, in its deliberations, the Board considered Fidelity's trading, risk management, compliance, and technology and operations capabilities and resources, which are integral parts of the investment management process. The Board also considered Fidelity's investments in business continuity planning, and its success in continuously providing services to the fund notwithstanding the severe disruptions caused by the COVID-19 pandemic.Shareholder and Administrative Services. The Board considered (i) the nature, extent, quality, and cost of advisory, administrative, and shareholder services performed by the Investment Advisers and their affiliates under the Advisory Contracts and under separate agreements covering transfer agency, pricing and bookkeeping, and securities lending services for the fund; (ii) the nature and extent of the supervision of third party service providers, principally custodians, subcustodians, and pricing vendors; and (iii) the resources devoted to, and the record of compliance with, the fund's compliance policies and procedures. The Board also reviewed the allocation of fund brokerage, including allocations to brokers affiliated with the Investment Advisers, the use of brokerage commissions to pay fund expenses, and the use of "soft" commission dollars to pay for research services.The Board noted that the growth of fund assets over time across the complex allows Fidelity to reinvest in the development of services designed to enhance the value and convenience of the Fidelity funds as investment vehicles. These services include 24-hour access to account information and market information over the Internet and through telephone representatives, investor education materials and asset allocation tools, and the expanded availability of Fidelity Investor Centers.The Board noted that, in the past, it and the boards of certain other Fidelity funds had formed an ad hoc Committee on Transfer Agency Fees to review the variety of transfer agency fee structures throughout the industry and Fidelity's competitive positioning with respect to industry participants.Investment in a Large Fund Family. The Board considered the benefits to shareholders of investing in a Fidelity fund, including the benefits of investing in a fund that is part of a large family of funds offering a variety of investment disciplines and providing a large variety of mutual fund investor services. The Board noted that Fidelity had taken, or had made recommendations that resulted in the Fidelity funds taking, a number of actions over the previous year that benefited particular funds, including: (i) continuing to dedicate additional resources to Fidelity's investment research process, which includes meetings with management of issuers of securities in which the funds invest, and to the support of the senior management team that oversees asset management; (ii) continuing efforts to enhance Fidelity's global research capabilities; (iii) launching new funds and ETFs with innovative structures, strategies and pricing and making other enhancements to meet client needs; (iv) launching new share classes of existing funds; (v) eliminating purchase minimums and broadening eligibility requirements for certain funds and share classes; (vi) approving the reduction in the holding period for the Class C to Class A conversion policy; (vii) reducing management fees and total expenses for certain target date funds and classes and index funds; (viii) lowering expenses for certain existing funds and classes by implementing or lowering expense caps; (ix) rationalizing product lines and gaining increased efficiencies from fund mergers, liquidations, and share class consolidations; (x) continuing to develop, acquire and implement systems and technology to improve services to the funds and shareholders, strengthen information security, and increase efficiency; and (xi) continuing to implement enhancements to further strengthen Fidelity's product line to increase investors' probability of success in achieving their investment goals, including retirement income goals.Investment Performance. The Board considered whether the fund has operated in accordance with its investment objective, as well as its record of compliance with its investment restrictions and its performance history.The Board took into account discussions that occur at Board meetings throughout the year with representatives of the Investment Advisers about fund investment performance. In this regard the Board noted that as part of regularly scheduled fund reviews and other reports to the Board on fund performance, the Board considers annualized return information for the fund for different time periods, measured against an appropriate securities market index (benchmark index) and an appropriate peer group of funds with similar objectives (peer group). In its evaluation of fund investment performance, the Board gave particular attention to information indicating changes in performance of certain Fidelity funds for specific time periods and discussed with the Investment Advisers the reasons for any overperformance or underperformance.In addition to reviewing absolute and relative fund performance, the Independent Trustees periodically consider the appropriateness of fund performance metrics in evaluating the results achieved. In general, the Independent Trustees believe that fund performance should be evaluated based on net performance (after fees and expenses) of both the highest performing and lowest performing fund share classes, where applicable, compared to appropriate benchmark indices, over appropriate time periods that may include full market cycles, and compared to peer groups, as applicable, over the same periods, taking into account relevant factors including the following: general market conditions; issuer-specific information; and fund cash flows and other factors.The Independent Trustees recognize that shareholders evaluate performance on a net basis over their own holding periods, for which one-, three-, and five-year periods are often used as a proxy. For this reason, the performance information reviewed by the Board also included net total return information for the fund and an appropriate benchmark index and peer group for the most recent one-year period ended September 30, 2020, as shown below. Returns are shown compared to the 25th percentile (top of box, 75% beaten) and 75th percentile (bottom of box, 25% beaten) of the peer universe.Fidelity Mid-Cap Stock K6 Fund
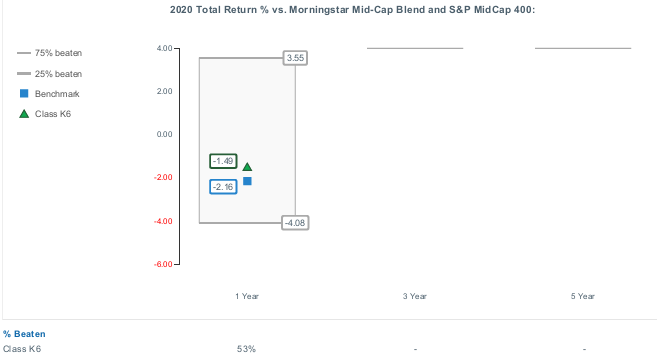
Fidelity Mid-Cap Stock K6 Fund

![]()
MCS-K6-SANN-1221
1.9893889.102
Fidelity® Founders Fund
Semi-Annual Report
October 31, 2021
Includes Fidelity and Fidelity Advisor share classes
Contents
Board Approval of Investment Advisory Contracts and Management Fees |
To view a fund's proxy voting guidelines and proxy voting record for the 12-month period ended June 30, visit http://www.fidelity.com/proxyvotingresults or visit the Securities and Exchange Commission's (SEC) web site at http://www.sec.gov.
You may also call 1-800-544-8544 if you’re an individual investing directly with Fidelity, call 1-800-835-5092 if you’re a plan sponsor or participant with Fidelity as your recordkeeper or call 1-877-208-0098 on institutional accounts or if you’re an advisor or invest through one to request a free copy of the proxy voting guidelines.
Standard & Poor's, S&P and S&P 500 are registered service marks of The McGraw-Hill Companies, Inc. and have been licensed for use by Fidelity Distributors Corporation.
Other third-party marks appearing herein are the property of their respective owners.
All other marks appearing herein are registered or unregistered trademarks or service marks of FMR LLC or an affiliated company. © 2021 FMR LLC. All rights reserved.
This report and the financial statements contained herein are submitted for the general information of the shareholders of the Fund. This report is not authorized for distribution to prospective investors in the Fund unless preceded or accompanied by an effective prospectus.
A fund files its complete schedule of portfolio holdings with the SEC for the first and third quarters of each fiscal year on Form N-PORT. Forms N-PORT are available on the SEC’s web site at http://www.sec.gov. A fund's Forms N-PORT may be reviewed and copied at the SEC’s Public Reference Room in Washington, DC. Information regarding the operation of the SEC's Public Reference Room may be obtained by calling 1-800-SEC-0330.
For a complete list of a fund's portfolio holdings, view the most recent holdings listing, semiannual report, or annual report on Fidelity's web site at http://www.fidelity.com, http://www.institutional.fidelity.com, or http://www.401k.com, as applicable.
NOT FDIC INSURED •MAY LOSE VALUE •NO BANK GUARANTEE
Neither the Fund nor Fidelity Distributors Corporation is a bank.
Note to Shareholders:
Early in 2020, the outbreak and spread of COVID-19 emerged as a public health emergency that had a major influence on financial markets, primarily based on its impact on the global economy and corporate earnings. On March 11, 2020, the World Health Organization declared the COVID-19 outbreak a pandemic, citing sustained risk of further global spread. The pandemic prompted a number of measures to limit the spread of COVID-19, including travel and border restrictions, quarantines, and restrictions on large gatherings. In turn, these resulted in lower consumer activity, diminished demand for a wide range of products and services, disruption in manufacturing and supply chains, and – given the wide variability in outcomes regarding the outbreak – significant market uncertainty and volatility. To help stem the turmoil, the U.S. government took unprecedented action – in concert with the U.S. Federal Reserve and central banks around the world – to help support consumers, businesses, and the broader economy, and to limit disruption to the financial system.
In general, the overall impact of the pandemic lessened in 2021, amid a resilient economy and widespread distribution of three COVID-19 vaccines granted emergency use authorization from the U.S. Food and Drug Administration (FDA) early in the year. Still, the situation remains dynamic, and the extent and duration of its influence on financial markets and the economy is highly uncertain, due in part to a recent spike in cases based on highly contagious variants of the coronavirus.
Extreme events such as the COVID-19 crisis are exogenous shocks that can have significant adverse effects on mutual funds and their investments. Although multiple asset classes may be affected by market disruption, the duration and impact may not be the same for all types of assets. Fidelity is committed to helping you stay informed amid news about COVID-19 and during increased market volatility, and we continue to take extra steps to be responsive to customer needs. We encourage you to visit us online, where we offer ongoing updates, commentary, and analysis on the markets and our funds.
Investment Summary (Unaudited)
Top Five Stocks as of October 31, 2021
| % of fund's net assets | |
| Alphabet, Inc. Class C | 9.1 |
| Microsoft Corp. | 5.0 |
| Amazon.com, Inc. | 4.6 |
| NVIDIA Corp. | 4.5 |
| Hess Corp. | 3.2 |
| 26.4 |
Top Five Market Sectors as of October 31, 2021
| % of fund's net assets | |
| Information Technology | 25.6 |
| Consumer Discretionary | 19.3 |
| Communication Services | 15.7 |
| Financials | 12.1 |
| Energy | 8.3 |
Asset Allocation (% of fund's net assets)
| As of October 31, 2021* | ||
| Stocks | 98.6% | |
| Convertible Securities | 0.4% | |
| Short-Term Investments and Net Other Assets (Liabilities) | 1.0% | |

* Foreign investments - 14.7%
Schedule of Investments October 31, 2021 (Unaudited)
Showing Percentage of Net Assets
| Common Stocks - 98.6% | |||
| Shares | Value | ||
| COMMUNICATION SERVICES - 15.7% | |||
| Entertainment - 3.0% | |||
| CTS Eventim AG (a) | 4,928 | $358,099 | |
| Endeavor Group Holdings, Inc. (a) | 27,629 | 742,668 | |
| Netflix, Inc. (a) | 2,350 | 1,622,229 | |
| Roblox Corp. (a) | 5,642 | 474,041 | |
| Sea Ltd. ADR (a) | 2,570 | 882,975 | |
| Spotify Technology SA (a) | 1,000 | 289,400 | |
| 4,369,412 | |||
| Interactive Media & Services - 12.7% | |||
| Alphabet, Inc. Class C (a) | 4,489 | 13,311,724 | |
| Meta Platforms, Inc. Class A (a) | 12,042 | 3,896,430 | |
| Snap, Inc. Class A (a) | 22,880 | 1,203,030 | |
| VerticalScope Holdings, Inc. | 7,292 | 156,139 | |
| 18,567,323 | |||
| TOTAL COMMUNICATION SERVICES | 22,936,735 | ||
| CONSUMER DISCRETIONARY - 19.3% | |||
| Hotels, Restaurants & Leisure - 3.4% | |||
| Airbnb, Inc. Class A | 13,485 | 2,301,350 | |
| Dutch Bros, Inc. | 300 | 22,872 | |
| Marriott International, Inc. Class A (a) | 14,606 | 2,337,252 | |
| Monarch Casino & Resort, Inc. (a) | 754 | 54,454 | |
| Penn National Gaming, Inc. (a) | 3,400 | 243,440 | |
| 4,959,368 | |||
| Household Durables - 2.5% | |||
| D.R. Horton, Inc. | 29,935 | 2,672,297 | |
| Garmin Ltd. | 812 | 116,603 | |
| Lennar Corp. Class A | 3,360 | 335,765 | |
| Toll Brothers, Inc. | 9,479 | 570,351 | |
| 3,695,016 | |||
| Internet & Direct Marketing Retail - 5.9% | |||
| Amazon.com, Inc. (a) | 1,992 | 6,717,881 | |
| Farfetch Ltd. Class A (a) | 9,750 | 382,298 | |
| Global-e Online Ltd. (a) | 7,314 | 423,188 | |
| Revolve Group, Inc. (a) | 6,300 | 472,752 | |
| thredUP, Inc. (a) | 400 | 8,656 | |
| Wayfair LLC Class A (a) | 2,097 | 522,363 | |
| 8,527,138 | |||
| Specialty Retail - 4.4% | |||
| Aritzia, Inc. (a) | 50,083 | 1,972,403 | |
| Auto1 Group SE (b) | 5,171 | 203,241 | |
| Industria de Diseno Textil SA | 98,176 | 3,545,473 | |
| Pop Mart International Group Ltd. (b) | 10,000 | 59,058 | |
| RH (a) | 845 | 557,387 | |
| 6,337,562 | |||
| Textiles, Apparel & Luxury Goods - 3.1% | |||
| Capri Holdings Ltd. (a) | 15,299 | 814,519 | |
| LVMH Moet Hennessy Louis Vuitton SE | 1,354 | 1,061,701 | |
| Moncler SpA | 11,161 | 801,479 | |
| On Holding AG | 300 | 10,248 | |
| Prada SpA | 124,105 | 778,398 | |
| Ralph Lauren Corp. | 8,567 | 1,089,465 | |
| 4,555,810 | |||
| TOTAL CONSUMER DISCRETIONARY | 28,074,894 | ||
| CONSUMER STAPLES - 1.2% | |||
| Beverages - 0.8% | |||
| Monster Beverage Corp. (a) | 14,727 | 1,251,795 | |
| Personal Products - 0.4% | |||
| Estee Lauder Companies, Inc. Class A | 1,670 | 541,631 | |
| TOTAL CONSUMER STAPLES | 1,793,426 | ||
| ENERGY - 8.3% | |||
| Oil, Gas & Consumable Fuels - 8.3% | |||
| Hess Corp. | 56,430 | 4,659,425 | |
| Pioneer Natural Resources Co. | 18,419 | 3,443,985 | |
| Reliance Industries Ltd. | 12,030 | 407,059 | |
| Tourmaline Oil Corp. | 96,937 | 3,503,549 | |
| 12,014,018 | |||
| FINANCIALS - 12.1% | |||
| Banks - 1.5% | |||
| First Foundation, Inc. | 11,275 | 300,028 | |
| First Republic Bank | 8,594 | 1,859,140 | |
| Starling Bank Ltd. Series D (a)(c)(d) | 40,900 | 72,450 | |
| 2,231,618 | |||
| Capital Markets - 5.5% | |||
| Antin Infrastructure Partners SA | 980 | 37,272 | |
| BlackRock, Inc. Class A | 4,451 | 4,199,340 | |
| Blackstone, Inc. | 11,272 | 1,560,270 | |
| Charles Schwab Corp. | 8,667 | 710,954 | |
| Coinbase Global, Inc. (a) | 1,623 | 518,419 | |
| EQT AB | 3,279 | 172,808 | |
| Morningstar, Inc. | 2,525 | 799,794 | |
| 7,998,857 | |||
| Consumer Finance - 2.4% | |||
| Capital One Financial Corp. | 21,425 | 3,235,818 | |
| Upstart Holdings, Inc. | 932 | 300,141 | |
| 3,535,959 | |||
| Diversified Financial Services - 0.9% | |||
| Berkshire Hathaway, Inc. Class B (a) | 4,314 | 1,238,161 | |
| Insurance - 1.8% | |||
| American Financial Group, Inc. | 15,386 | 2,093,111 | |
| Arthur J. Gallagher & Co. | 722 | 121,058 | |
| BRP Group, Inc. (a) | 12,663 | 462,200 | |
| 2,676,369 | |||
| TOTAL FINANCIALS | 17,680,964 | ||
| HEALTH CARE - 7.2% | |||
| Biotechnology - 2.2% | |||
| Argenx SE ADR (a) | 842 | 254,250 | |
| Blueprint Medicines Corp. (a) | 872 | 98,091 | |
| Celldex Therapeutics, Inc. (a) | 5,436 | 231,247 | |
| Instil Bio, Inc. (a) | 4,814 | 98,061 | |
| Prelude Therapeutics, Inc. (a) | 300 | 5,274 | |
| Regeneron Pharmaceuticals, Inc. (a) | 3,234 | 2,069,566 | |
| TG Therapeutics, Inc. (a) | 13,114 | 409,419 | |
| 3,165,908 | |||
| Health Care Equipment & Supplies - 1.4% | |||
| Danaher Corp. | 3,624 | 1,129,854 | |
| Hologic, Inc. (a) | 5,192 | 380,626 | |
| Penumbra, Inc. (a) | 2,224 | 615,047 | |
| 2,125,527 | |||
| Health Care Providers & Services - 2.4% | |||
| Guardant Health, Inc. (a) | 2,678 | 312,764 | |
| The Joint Corp. (a) | 1,173 | 102,614 | |
| UnitedHealth Group, Inc. | 6,641 | 3,057,981 | |
| 3,473,359 | |||
| Life Sciences Tools & Services - 1.2% | |||
| Bio-Rad Laboratories, Inc. Class A (a) | 800 | 635,744 | |
| Bruker Corp. | 12,991 | 1,043,177 | |
| Stevanato Group SpA | 1,800 | 46,206 | |
| 1,725,127 | |||
| TOTAL HEALTH CARE | 10,489,921 | ||
| INDUSTRIALS - 4.2% | |||
| Aerospace & Defense - 1.7% | |||
| Axon Enterprise, Inc. (a) | 5,529 | 994,999 | |
| HEICO Corp. Class A | 2,919 | 366,860 | |
| TransDigm Group, Inc. (a) | 1,725 | 1,076,090 | |
| 2,437,949 | |||
| Commercial Services & Supplies - 0.5% | |||
| Cintas Corp. | 1,549 | 670,872 | |
| Waste Connections, Inc. (United States) | 933 | 126,897 | |
| 797,769 | |||
| Machinery - 0.1% | |||
| Hydrogen Refueling Solutions | 4,875 | 180,618 | |
| Road & Rail - 1.9% | |||
| Lyft, Inc. (a) | 14,376 | 659,427 | |
| Uber Technologies, Inc. (a) | 47,091 | 2,063,528 | |
| 2,722,955 | |||
| TOTAL INDUSTRIALS | 6,139,291 | ||
| INFORMATION TECHNOLOGY - 25.2% | |||
| Electronic Equipment & Components - 0.0% | |||
| Vontier Corp. | 1,091 | 36,909 | |
| IT Services - 2.9% | |||
| Affirm Holdings, Inc. | 300 | 48,750 | |
| Afterpay Ltd. (a) | 3,169 | 293,574 | |
| CGI, Inc. Class A (sub. vtg.) (a) | 963 | 86,029 | |
| EPAM Systems, Inc. (a) | 1,744 | 1,174,131 | |
| Globant SA (a) | 690 | 220,241 | |
| Nuvei Corp. (a)(b) | 190 | 22,835 | |
| Remitly Global, Inc. | 200 | 6,124 | |
| Snowflake Computing, Inc. (a) | 2,073 | 733,510 | |
| Square, Inc. (a) | 3,583 | 911,874 | |
| TDCX, Inc. ADR | 300 | 8,604 | |
| Twilio, Inc. Class A (a) | 2,572 | 749,378 | |
| 4,255,050 | |||
| Semiconductors & Semiconductor Equipment - 5.3% | |||
| Analog Devices, Inc. | 6,804 | 1,180,426 | |
| NVIDIA Corp. | 25,392 | 6,491,973 | |
| 7,672,399 | |||
| Software - 17.0% | |||
| Adobe, Inc. (a) | 3,682 | 2,394,626 | |
| Atlassian Corp. PLC (a) | 4,240 | 1,942,471 | |
| Black Knight, Inc. (a) | 4,092 | 286,890 | |
| BlackLine, Inc. (a) | 1,973 | 250,315 | |
| Crowdstrike Holdings, Inc. (a) | 3,761 | 1,059,850 | |
| EngageSmart, Inc. | 500 | 16,765 | |
| GitLab, Inc. | 100 | 11,220 | |
| HubSpot, Inc. (a) | 2,779 | 2,251,629 | |
| Intuit, Inc. | 4,889 | 3,060,465 | |
| Microsoft Corp. | 22,037 | 7,307,910 | |
| Momentive Global, Inc. (a) | 5,903 | 135,297 | |
| nCino, Inc. (a) | 84 | 6,103 | |
| Paycom Software, Inc. (a) | 632 | 346,241 | |
| Salesforce.com, Inc. (a) | 7,564 | 2,266,855 | |
| ServiceNow, Inc. (a) | 1,846 | 1,288,065 | |
| Tenable Holdings, Inc. (a) | 4,092 | 217,899 | |
| The Trade Desk, Inc. (a) | 6,385 | 478,300 | |
| Workday, Inc. Class A (a) | 3,045 | 882,989 | |
| Zscaler, Inc. (a) | 1,534 | 489,131 | |
| 24,693,021 | |||
| TOTAL INFORMATION TECHNOLOGY | 36,657,379 | ||
| MATERIALS - 3.4% | |||
| Chemicals - 0.6% | |||
| Westlake Chemical Corp. | 8,513 | 828,655 | |
| Metals & Mining - 2.8% | |||
| ArcelorMittal SA Class A unit | 57,030 | 1,948,715 | |
| First Quantum Minerals Ltd. | 17,225 | 407,799 | |
| Steel Dynamics, Inc. | 26,656 | 1,761,428 | |
| 4,117,942 | |||
| TOTAL MATERIALS | 4,946,597 | ||
| REAL ESTATE - 2.0% | |||
| Equity Real Estate Investment Trusts (REITs) - 2.0% | |||
| Alexandria Real Estate Equities, Inc. | 2,152 | 439,309 | |
| Camden Property Trust (SBI) | 3,961 | 646,039 | |
| Equity Residential (SBI) | 18,369 | 1,587,082 | |
| Public Storage | 842 | 279,696 | |
| 2,952,126 | |||
| TOTAL COMMON STOCKS | |||
| (Cost $99,984,092) | 143,685,351 | ||
| Convertible Preferred Stocks - 0.4% | |||
| CONSUMER DISCRETIONARY - 0.0% | |||
| Internet & Direct Marketing Retail - 0.0% | |||
| Reddit, Inc. Series E (c)(d) | 200 | 12,359 | |
| INFORMATION TECHNOLOGY - 0.4% | |||
| IT Services - 0.4% | |||
| ByteDance Ltd. Series E1 (c)(d) | 638 | 79,316 | |
| Yanka Industries, Inc.: | |||
| Series E (a)(c)(d) | 2,484 | 79,182 | |
| Series F (c)(d) | 12,743 | 406,206 | |
| 564,704 | |||
| Software - 0.0% | |||
| Evozyne LLC Series A (c)(d) | 1,000 | 22,470 | |
| TOTAL INFORMATION TECHNOLOGY | 587,174 | ||
| TOTAL CONVERTIBLE PREFERRED STOCKS | |||
| (Cost $537,084) | 599,533 | ||
| Money Market Funds - 1.2% | |||
| Fidelity Cash Central Fund 0.06% (e) | |||
| (Cost $1,767,070) | 1,766,717 | 1,767,070 | |
| TOTAL INVESTMENT IN SECURITIES - 100.2% | |||
| (Cost $102,288,246) | 146,051,954 | ||
| NET OTHER ASSETS (LIABILITIES) - (0.2)% | (342,069) | ||
| NET ASSETS - 100% | $145,709,885 |
Legend
(a) Non-income producing
(b) Security exempt from registration under Rule 144A of the Securities Act of 1933. These securities may be resold in transactions exempt from registration, normally to qualified institutional buyers. At the end of the period, the value of these securities amounted to $285,134 or 0.2% of net assets.
(c) Restricted securities (including private placements) - Investment in securities not registered under the Securities Act of 1933 (excluding 144A issues). At the end of the period, the value of restricted securities (excluding 144A issues) amounted to $671,983 or 0.5% of net assets.
(d) Level 3 security
(e) Affiliated fund that is generally available only to investment companies and other accounts managed by Fidelity Investments. The rate quoted is the annualized seven-day yield of the fund at period end. A complete unaudited listing of the fund's holdings as of its most recent quarter end is available upon request. In addition, each Fidelity Central Fund's financial statements are available on the SEC's website or upon request.
Additional information on each restricted holding is as follows:
| Security | Acquisition Date | Acquisition Cost |
| ByteDance Ltd. Series E1 | 11/18/20 | $69,908 |
| Evozyne LLC Series A | 4/9/21 | $22,470 |
| Reddit, Inc. Series E | 5/18/21 | $8,495 |
| Starling Bank Ltd. Series D | 6/18/21 | $73,125 |
| Yanka Industries, Inc. Series E | 5/15/20 | $30,005 |
| Yanka Industries, Inc. Series F | 4/8/21 | $406,206 |
Affiliated Central Funds
Fiscal year to date information regarding the Fund's investments in Fidelity Central Funds, including the ownership percentage, is presented below.
| Fund | Value, beginning of period | Purchases | Sales Proceeds | Dividend Income | Realized Gain/Loss | Change in Unrealized appreciation (depreciation) | Value, end of period | % ownership, end of period |
| Fidelity Cash Central Fund 0.06% | $585,108 | $18,544,280 | $17,362,318 | $271 | $-- | $-- | $1,767,070 | 0.0% |
| Fidelity Securities Lending Cash Central Fund 0.06% | 1,248,050 | 16,476,756 | 17,724,806 | 9,142 | -- | -- | -- | 0.0% |
| Total | $1,833,158 | $35,021,036 | $35,087,124 | $9,413 | $-- | $-- | $1,767,070 |
Amounts in the income column in the above table include any capital gain distributions from underlying funds, which are presented in the corresponding line-item in the Statement of Operations, if applicable. Amount for Fidelity Securities Lending Cash Central Fund represents the income earned on investing cash collateral, less rebates paid to borrowers and any lending agent fees associated with the loan, plus any premium payments received for lending certain types of securities.
Investment Valuation
The following is a summary of the inputs used, as of October 31, 2021, involving the Fund's assets and liabilities carried at fair value. The inputs or methodology used for valuing securities may not be an indication of the risk associated with investing in those securities. For more information on valuation inputs, and their aggregation into the levels used below, please refer to the Investment Valuation section in the accompanying Notes to Financial Statements.
| Valuation Inputs at Reporting Date: | ||||
| Description | Total | Level 1 | Level 2 | Level 3 |
| Investments in Securities: | ||||
| Equities: | ||||
| Communication Services | $22,936,735 | $22,936,735 | $-- | $-- |
| Consumer Discretionary | 28,087,253 | 27,013,193 | 1,061,701 | 12,359 |
| Consumer Staples | 1,793,426 | 1,793,426 | -- | -- |
| Energy | 12,014,018 | 12,014,018 | -- | -- |
| Financials | 17,680,964 | 17,608,514 | -- | 72,450 |
| Health Care | 10,489,921 | 10,489,921 | -- | -- |
| Industrials | 6,139,291 | 6,139,291 | -- | -- |
| Information Technology | 37,244,553 | 36,363,805 | 293,574 | 587,174 |
| Materials | 4,946,597 | 4,946,597 | -- | -- |
| Real Estate | 2,952,126 | 2,952,126 | -- | -- |
| Money Market Funds | 1,767,070 | 1,767,070 | -- | -- |
| Total Investments in Securities: | $146,051,954 | $144,024,696 | $1,355,275 | $671,983 |
Other Information
Distribution of investments by country or territory of incorporation, as a percentage of Total Net Assets, is as follows (Unaudited):
| United States of America | 85.3% |
| Canada | 4.4% |
| Spain | 2.4% |
| Luxembourg | 1.7% |
| United Kingdom | 1.3% |
| Italy | 1.1% |
| Others (Individually Less Than 1%) | 3.8% |
| 100.0% |
See accompanying notes which are an integral part of the financial statements.
Financial Statements
Statement of Assets and Liabilities
| October 31, 2021 (Unaudited) | ||
| Assets | ||
| Investment in securities, at value — See accompanying schedule: Unaffiliated issuers (cost $100,521,176) | $144,284,884 | |
| Fidelity Central Funds (cost $1,767,070) | 1,767,070 | |
| Total Investment in Securities (cost $102,288,246) | $146,051,954 | |
| Receivable for investments sold | 276,539 | |
| Receivable for fund shares sold | 112,800 | |
| Dividends receivable | 47,942 | |
| Distributions receivable from Fidelity Central Funds | 1,300 | |
| Prepaid expenses | 181 | |
| Receivable from investment adviser for expense reductions | 63 | |
| Other receivables | 3,254 | |
| Total assets | 146,494,033 | |
| Liabilities | ||
| Payable for investments purchased | $443,169 | |
| Payable for fund shares redeemed | 224,394 | |
| Accrued management fee | 67,283 | |
| Distribution and service plan fees payable | 8,617 | |
| Other affiliated payables | 23,279 | |
| Other payables and accrued expenses | 17,406 | |
| Total liabilities | 784,148 | |
| Net Assets | $145,709,885 | |
| Net Assets consist of: | ||
| Paid in capital | $99,261,499 | |
| Total accumulated earnings (loss) | 46,448,386 | |
| Net Assets | $145,709,885 | |
| Net Asset Value and Maximum Offering Price | ||
| Class A: | ||
| Net Asset Value and redemption price per share ($13,894,983 ÷ 703,275 shares)(a) | $19.76 | |
| Maximum offering price per share (100/94.25 of $19.76) | $20.97 | |
| Class M: | ||
| Net Asset Value and redemption price per share ($9,923,764 ÷ 505,008 shares)(a) | $19.65 | |
| Maximum offering price per share (100/96.50 of $19.65) | $20.36 | |
| Class C: | ||
| Net Asset Value and offering price per share ($2,309,668 ÷ 118,691 shares)(a) | $19.46 | |
| Fidelity Founders Fund: | ||
| Net Asset Value, offering price and redemption price per share ($93,496,026 ÷ 4,707,778 shares) | $19.86 | |
| Class I: | ||
| Net Asset Value, offering price and redemption price per share ($1,407,654 ÷ 70,877 shares) | $19.86 | |
| Class Z: | ||
| Net Asset Value, offering price and redemption price per share ($24,677,790 ÷ 1,238,888 shares) | $19.92 |
(a) Redemption price per share is equal to net asset value less any applicable contingent deferred sales charge.
See accompanying notes which are an integral part of the financial statements.
Statement of Operations
| Six months ended October 31, 2021 (Unaudited) | ||
| Investment Income | ||
| Dividends | $615,389 | |
| Special dividends | 253,568 | |
| Income from Fidelity Central Funds (including $9,142 from security lending) | 9,413 | |
| Total income | 878,370 | |
| Expenses | ||
| Management fee | ||
| Basic fee | $365,321 | |
| Performance adjustment | 32,649 | |
| Transfer agent fees | 114,067 | |
| Distribution and service plan fees | 47,736 | |
| Accounting fees | 27,086 | |
| Custodian fees and expenses | 5,580 | |
| Independent trustees' fees and expenses | 244 | |
| Registration fees | 28,040 | |
| Audit | 17,421 | |
| Legal | 76 | |
| Miscellaneous | 227 | |
| Total expenses before reductions | 638,447 | |
| Expense reductions | (2,285) | |
| Total expenses after reductions | 636,162 | |
| Net investment income (loss) | 242,208 | |
| Realized and Unrealized Gain (Loss) | ||
| Net realized gain (loss) on: | ||
| Investment securities: | ||
| Unaffiliated issuers | 2,902,450 | |
| Foreign currency transactions | (25) | |
| Total net realized gain (loss) | 2,902,425 | |
| Change in net unrealized appreciation (depreciation) on: | ||
| Investment securities: | ||
| Unaffiliated issuers | 10,513,661 | |
| Assets and liabilities in foreign currencies | 195 | |
| Total change in net unrealized appreciation (depreciation) | 10,513,856 | |
| Net gain (loss) | 13,416,281 | |
| Net increase (decrease) in net assets resulting from operations | $13,658,489 |
See accompanying notes which are an integral part of the financial statements.
Statement of Changes in Net Assets
| Six months ended October 31, 2021 (Unaudited) | Year ended April 30, 2021 | |
| Increase (Decrease) in Net Assets | ||
| Operations | ||
| Net investment income (loss) | $242,208 | $(555,043) |
| Net realized gain (loss) | 2,902,425 | 8,419,458 |
| Change in net unrealized appreciation (depreciation) | 10,513,856 | 28,606,543 |
| Net increase (decrease) in net assets resulting from operations | 13,658,489 | 36,470,958 |
| Distributions to shareholders | (5,786,589) | – |
| Share transactions - net increase (decrease) | (2,627,259) | 71,623,021 |
| Total increase (decrease) in net assets | 5,244,641 | 108,093,979 |
| Net Assets | ||
| Beginning of period | 140,465,244 | 32,371,265 |
| End of period | $145,709,885 | $140,465,244 |
See accompanying notes which are an integral part of the financial statements.
Financial Highlights
Fidelity Founders Fund Class A
| Six months ended (Unaudited) October 31, | Years endedApril 30, | |||
| 2021 | 2021 | 2020 | 2019 A | |
| Selected Per–Share Data | ||||
| Net asset value, beginning of period | $18.71 | $11.85 | $10.85 | $10.00 |
| Income from Investment Operations | ||||
| Net investment income (loss)B | .01C | (.14) | (.05)D | (.02) |
| Net realized and unrealized gain (loss) | 1.80 | 7.00 | 1.05 | .87 |
| Total from investment operations | 1.81 | 6.86 | 1.00 | .85 |
| Distributions from net investment income | – | – | –E | – |
| Distributions from net realized gain | (.76) | – | – | – |
| Total distributions | (.76) | – | –E | – |
| Net asset value, end of period | $19.76 | $18.71 | $11.85 | $10.85 |
| Total ReturnF,G,H | 10.13% | 57.89% | 9.25% | 8.50% |
| Ratios to Average Net AssetsI,J | ||||
| Expenses before reductions | 1.14%K | 1.25% | 2.05% | 4.81%K |
| Expenses net of fee waivers, if any | 1.14%K | 1.25% | 1.25% | 1.25%K |
| Expenses net of all reductions | 1.14%K | 1.24% | 1.25% | 1.25%K |
| Net investment income (loss) | (.06)%C,K | (.83)% | (.47)%D | (.74)%K |
| Supplemental Data | ||||
| Net assets, end of period (000 omitted) | $13,895 | $11,606 | $1,310 | $220 |
| Portfolio turnover rateL | 53%K | 57% | 82% | 4%M |
A For the period February 14, 2019 (commencement of operations) through April 30, 2019.
B Calculated based on average shares outstanding during the period.
C Net investment income per share reflects one or more large, non-recurring dividend(s) which amounted to $.03 per share. Such dividends are not annualized in the ratio of net investment income (loss) to average net assets. Excluding such non-recurring dividend(s) the ratio of net investment income (loss) to average net assets would have been (.24) %.
D Net investment income per share reflects one or more large, non-recurring dividend(s) which amounted to $.03 per share. Excluding such non-recurring dividend(s), the ratio of net investment income (loss) to average net assets would have been (.70) %. These amounts have been revised from previously reported amounts of $.01 per share and (.45) %.
E Amount represents less than $.005 per share.
F Total returns for periods of less than one year are not annualized.
G Total returns would have been lower if certain expenses had not been reduced during the applicable periods shown.
H Total returns do not include the effect of the sales charges.
I Fees and expenses of any underlying mutual funds or exchange-traded funds (ETFs) are not included in the Fund's expense ratio. The Fund indirectly bears its proportionate share of these expenses. For additional expense information related to investments in Fidelity Central Funds, please refer to the "Investments in Fidelity Central Funds" note found in the Notes to Financial Statements section of the most recent Annual or Semi-Annual report.
J Expense ratios reflect operating expenses of the class. Expenses before reductions do not reflect amounts reimbursed, waived, or reduced through arrangements with the investment adviser, brokerage services, or other offset arrangements, if applicable, and do not represent the amount paid by the class during periods when reimbursements, waivers or reductions occur.
K Annualized
L Amount does not include the portfolio activity of any underlying mutual funds or exchange-traded funds (ETFs).
M Amount not annualized.
See accompanying notes which are an integral part of the financial statements.
Fidelity Founders Fund Class M
| Six months ended (Unaudited) October 31, | Years endedApril 30, | |||
| 2021 | 2021 | 2020 | 2019 A | |
| Selected Per–Share Data | ||||
| Net asset value, beginning of period | $18.62 | $11.82 | $10.85 | $10.00 |
| Income from Investment Operations | ||||
| Net investment income (loss)B | (.01)C | (.17) | (.08)D | (.02) |
| Net realized and unrealized gain (loss) | 1.79 | 6.97 | 1.05 | .87 |
| Total from investment operations | 1.78 | 6.80 | .97 | .85 |
| Distributions from net investment income | – | – | – | – |
| Distributions from net realized gain | (.75) | – | – | – |
| Total distributions | (.75) | – | – | – |
| Net asset value, end of period | $19.65 | $18.62 | $11.82 | $10.85 |
| Total ReturnE,F,G | 9.99% | 57.53% | 8.94% | 8.50% |
| Ratios to Average Net AssetsH,I | ||||
| Expenses before reductions | 1.35%J | 1.46% | 2.14% | 5.05%J |
| Expenses net of fee waivers, if any | 1.35%J | 1.46% | 1.50% | 1.50%J |
| Expenses net of all reductions | 1.35%J | 1.45% | 1.50% | 1.50%J |
| Net investment income (loss) | (.27)%C,J | (1.04)% | (.72)%D | (.99)%J |
| Supplemental Data | ||||
| Net assets, end of period (000 omitted) | $9,924 | $7,357 | $695 | $205 |
| Portfolio turnover rateK | 53%J | 57% | 82% | 4%L |
A For the period February 14, 2019 (commencement of operations) through April 30, 2019.
B Calculated based on average shares outstanding during the period.
C Net investment income per share reflects one or more large, non-recurring dividend(s) which amounted to $.03 per share. Such dividends are not annualized in the ratio of net investment income (loss) to average net assets. Excluding such non-recurring dividend(s) the ratio of net investment income (loss) to average net assets would have been (.45) %.
D Net investment income per share reflects one or more large, non-recurring dividend(s) which amounted to $.03 per share. Excluding such non-recurring dividend(s), the ratio of net investment income (loss) to average net assets would have been (.95) %. These amounts have been revised from previously reported amounts of $.03 per share and (1.04) %.
E Total returns for periods of less than one year are not annualized.
F Total returns would have been lower if certain expenses had not been reduced during the applicable periods shown.
G Total returns do not include the effect of the sales charges.
��H Fees and expenses of any underlying mutual funds or exchange-traded funds (ETFs) are not included in the Fund's expense ratio. The Fund indirectly bears its proportionate share of these expenses. For additional expense information related to investments in Fidelity Central Funds, please refer to the "Investments in Fidelity Central Funds" note found in the Notes to Financial Statements section of the most recent Annual or Semi-Annual report.
I Expense ratios reflect operating expenses of the class. Expenses before reductions do not reflect amounts reimbursed, waived, or reduced through arrangements with the investment adviser, brokerage services, or other offset arrangements, if applicable, and do not represent the amount paid by the class during periods when reimbursements, waivers or reductions occur.
J Annualized
K Amount does not include the portfolio activity of any underlying mutual funds or exchange-traded funds (ETFs).
L Amount not annualized.
See accompanying notes which are an integral part of the financial statements.
Fidelity Founders Fund Class C
| Six months ended (Unaudited) October 31, | Years endedApril 30, | |||
| 2021 | 2021 | 2020 | 2019 A | |
| Selected Per–Share Data | ||||
| Net asset value, beginning of period | $18.41 | $11.75 | $10.84 | $10.00 |
| Income from Investment Operations | ||||
| Net investment income (loss)B | (.06)C | (.26) | (.13)D | (.03) |
| Net realized and unrealized gain (loss) | 1.77 | 6.92 | 1.04 | .87 |
| Total from investment operations | 1.71 | 6.66 | .91 | .84 |
| Distributions from net investment income | – | – | – | – |
| Distributions from net realized gain | (.66) | – | – | – |
| Total distributions | (.66) | – | – | – |
| Net asset value, end of period | $19.46 | $18.41 | $11.75 | $10.84 |
| Total ReturnE,F,G | 9.66% | 56.68% | 8.39% | 8.40% |
| Ratios to Average Net AssetsH,I | ||||
| Expenses before reductions | 1.96%J | 2.04% | 2.64% | 5.67%J |
| Expenses net of fee waivers, if any | 1.92%J | 2.00% | 2.00% | 2.00%J |
| Expenses net of all reductions | 1.92%J | 1.99% | 2.00% | 2.00%J |
| Net investment income (loss) | (.84)%C,J | (1.58)% | (1.22)%D | (1.49)%J |
| Supplemental Data | ||||
| Net assets, end of period (000 omitted) | $2,310 | $2,035 | $335 | $173 |
| Portfolio turnover rateK | 53%J | 57% | 82% | 4%L |
A For the period February 14, 2019 (commencement of operations) through April 30, 2019.
B Calculated based on average shares outstanding during the period.
C Net investment income per share reflects one or more large, non-recurring dividend(s) which amounted to $.03 per share. Such dividends are not annualized in the ratio of net investment income (loss) to average net assets. Excluding such non-recurring dividend(s) the ratio of net investment income (loss) to average net assets would have been (1.03) %.
D Net investment income per share reflects one or more large, non-recurring dividend(s) which amounted to $.03 per share. Excluding such non-recurring dividend(s), the ratio of net investment income (loss) to average net assets would have been (1.45) %. These amounts have been revised from previously reported amounts of $.03 per share and (1.51) %.
E Total returns for periods of less than one year are not annualized.
F Total returns would have been lower if certain expenses had not been reduced during the applicable periods shown.
G Total returns do not include the effect of the contingent deferred sales charge.
H Fees and expenses of any underlying mutual funds or exchange-traded funds (ETFs) are not included in the Fund's expense ratio. The Fund indirectly bears its proportionate share of these expenses. For additional expense information related to investments in Fidelity Central Funds, please refer to the "Investments in Fidelity Central Funds" note found in the Notes to Financial Statements section of the most recent Annual or Semi-Annual report.
I Expense ratios reflect operating expenses of the class. Expenses before reductions do not reflect amounts reimbursed, waived, or reduced through arrangements with the investment adviser, brokerage services, or other offset arrangements, if applicable, and do not represent the amount paid by the class during periods when reimbursements, waivers or reductions occur.
J Annualized
K Amount does not include the portfolio activity of any underlying mutual funds or exchange-traded funds (ETFs).
L Amount not annualized.
See accompanying notes which are an integral part of the financial statements.
Fidelity Founders Fund
| Six months ended (Unaudited) October 31, | Years endedApril 30, | |||
| 2021 | 2021 | 2020 | 2019 A | |
| Selected Per–Share Data | ||||
| Net asset value, beginning of period | $18.80 | $11.88 | $10.86 | $10.00 |
| Income from Investment Operations | ||||
| Net investment income (loss)B | .04C | (.09) | (.02)D | (.01) |
| Net realized and unrealized gain (loss) | 1.81 | 7.01 | 1.05 | .87 |
| Total from investment operations | 1.85 | 6.92 | 1.03 | .86 |
| Distributions from net investment income | – | – | (.01) | – |
| Distributions from net realized gain | (.79) | – | – | – |
| Total distributions | (.79) | – | (.01) | – |
| Net asset value, end of period | $19.86 | $18.80 | $11.88 | $10.86 |
| Total ReturnE,F | 10.28% | 58.25% | 9.49% | 8.60% |
| Ratios to Average Net AssetsG,H | ||||
| Expenses before reductions | .87%I | .97% | 1.70% | 3.49%I |
| Expenses net of fee waivers, if any | .87%I | .97% | 1.00% | 1.00%I |
| Expenses net of all reductions | .87%I | .97% | 1.00% | 1.00%I |
| Net investment income (loss) | .21%C,I | (.56)% | (.22)%D | (.48)%I |
| Supplemental Data | ||||
| Net assets, end of period (000 omitted) | $93,496 | $96,052 | $22,724 | $10,595 |
| Portfolio turnover rateJ | 53%I | 57% | 82% | 4%K |
A For the period February 14, 2019 (commencement of operations) through April 30, 2019.
B Calculated based on average shares outstanding during the period.
C Net investment income per share reflects one or more large, non-recurring dividend(s) which amounted to $.03 per share. Such dividends are not annualized in the ratio of net investment income (loss) to average net assets. Excluding such non-recurring dividend(s) the ratio of net investment income (loss) to average net assets would have been .03%.
D Net investment income per share reflects one or more large, non-recurring dividend(s) which amounted to $.03 per share. Excluding such non-recurring dividend(s), the ratio of net investment income (loss) to average net assets would have been (.45) %. These amounts have been revised from previously reported amounts of $.03 per share and (.52) %.
E Total returns for periods of less than one year are not annualized.
F Total returns would have been lower if certain expenses had not been reduced during the applicable periods shown.
G Fees and expenses of any underlying mutual funds or exchange-traded funds (ETFs) are not included in the Fund's expense ratio. The Fund indirectly bears its proportionate share of these expenses. For additional expense information related to investments in Fidelity Central Funds, please refer to the "Investments in Fidelity Central Funds" note found in the Notes to Financial Statements section of the most recent Annual or Semi-Annual report.
H Expense ratios reflect operating expenses of the class. Expenses before reductions do not reflect amounts reimbursed, waived, or reduced through arrangements with the investment adviser, brokerage services, or other offset arrangements, if applicable, and do not represent the amount paid by the class during periods when reimbursements, waivers or reductions occur.
I Annualized
J Amount does not include the portfolio activity of any underlying mutual funds or exchange-traded funds (ETFs).
K Amount not annualized.
See accompanying notes which are an integral part of the financial statements.
Fidelity Founders Fund Class I
| Six months ended (Unaudited) October 31, | Years endedApril 30, | |||
| 2021 | 2021 | 2020 | 2019 A | |
| Selected Per–Share Data | ||||
| Net asset value, beginning of period | $18.81 | $11.88 | $10.86 | $10.00 |
| Income from Investment Operations | ||||
| Net investment income (loss)B | .04C | (.08) | (.02)D | (.01) |
| Net realized and unrealized gain (loss) | 1.81 | 7.01 | 1.05 | .87 |
| Total from investment operations | 1.85 | 6.93 | 1.03 | .86 |
| Distributions from net investment income | – | – | (.01) | – |
| Distributions from net realized gain | (.80) | – | – | – |
| Total distributions | (.80) | – | (.01) | – |
| Net asset value, end of period | $19.86 | $18.81 | $11.88 | $10.86 |
| Total ReturnE,F | 10.28% | 58.33% | 9.49% | 8.60% |
| Ratios to Average Net AssetsG,H | ||||
| Expenses before reductions | .82%I | .93% | 1.63% | 4.10%I |
| Expenses net of fee waivers, if any | .81%I | .93% | 1.00% | 1.00%I |
| Expenses net of all reductions | .81%I | .92% | 1.00% | 1.00%I |
| Net investment income (loss) | .26%C,I | (.51)% | (.22)%D | (.48)%I |
| Supplemental Data | ||||
| Net assets, end of period (000 omitted) | $1,408 | $1,449 | $467 | $831 |
| Portfolio turnover rateJ | 53%I | 57% | 82% | 4%K |
A For the period February 14, 2019 (commencement of operations) through April 30, 2019.
B Calculated based on average shares outstanding during the period.
C Net investment income per share reflects one or more large, non-recurring dividend(s) which amounted to $.03 per share. Such dividends are not annualized in the ratio of net investment income (loss) to average net assets. Excluding such non-recurring dividend(s) the ratio of net investment income (loss) to average net assets would have been .08%.
D Net investment income per share reflects one or more large, non-recurring dividend(s) which amounted to $.03 per share. Excluding such non-recurring dividend(s), the ratio of net investment income (loss) to average net assets would have been (.45) %. These amounts have been revised from previously reported amounts of $.03 per share and (.51) %.
E Total returns for periods of less than one year are not annualized.
F Total returns would have been lower if certain expenses had not been reduced during the applicable periods shown.
G Fees and expenses of any underlying mutual funds or exchange-traded funds (ETFs) are not included in the Fund's expense ratio. The Fund indirectly bears its proportionate share of these expenses. For additional expense information related to investments in Fidelity Central Funds, please refer to the "Investments in Fidelity Central Funds" note found in the Notes to Financial Statements section of the most recent Annual or Semi-Annual report.
H Expense ratios reflect operating expenses of the class. Expenses before reductions do not reflect amounts reimbursed, waived, or reduced through arrangements with the investment adviser, brokerage services, or other offset arrangements, if applicable, and do not represent the amount paid by the class during periods when reimbursements, waivers or reductions occur.
I Annualized
J Amount does not include the portfolio activity of any underlying mutual funds or exchange-traded funds (ETFs).
K Amount not annualized.
See accompanying notes which are an integral part of the financial statements.
Fidelity Founders Fund Class Z
| Six months ended (Unaudited) October 31, | Years endedApril 30, | |||
| 2021 | 2021 | 2020 | 2019 A | |
| Selected Per–Share Data | ||||
| Net asset value, beginning of period | $18.86 | $11.90 | $10.86 | $10.00 |
| Income from Investment Operations | ||||
| Net investment income (loss)B | .05C | (.07) | (.01)D | (.01) |
| Net realized and unrealized gain (loss) | 1.82 | 7.03 | 1.06 | .87 |
| Total from investment operations | 1.87 | 6.96 | 1.05 | .86 |
| Distributions from net investment income | – | – | (.01) | – |
| Distributions from net realized gain | (.81) | – | – | – |
| Total distributions | (.81) | – | (.01) | – |
| Net asset value, end of period | $19.92 | $18.86 | $11.90 | $10.86 |
| Total ReturnE,F | 10.37% | 58.49% | 9.67% | 8.60% |
| Ratios to Average Net AssetsG,H | ||||
| Expenses before reductions | .73%I | .83% | 1.51% | 3.18%I |
| Expenses net of fee waivers, if any | .72%I | .83% | .85% | .85%I |
| Expenses net of all reductions | .72%I | .82% | .85% | .85%I |
| Net investment income (loss) | .36%C,I | (.41)% | (.07)%D | (.34)%I |
| Supplemental Data | ||||
| Net assets, end of period (000 omitted) | $24,678 | $21,966 | $6,839 | $5,745 |
| Portfolio turnover rateJ | 53%I | 57% | 82% | 4%K |
A For the period February 14, 2019 (commencement of operations) through April 30, 2019.
B Calculated based on average shares outstanding during the period.
C Net investment income per share reflects one or more large, non-recurring dividend(s) which amounted to $.03 per share. Such dividends are not annualized in the ratio of net investment income (loss) to average net assets. Excluding such non-recurring dividend(s) the ratio of net investment income (loss) to average net assets would have been .17%.
D Net investment income per share reflects one or more large, non-recurring dividend(s) which amounted to $.03 per share. Excluding such non-recurring dividend(s), the ratio of net investment income (loss) to average net assets would have been (.30) %. These amounts have been revised from previously reported amounts of $.03 per share and (.36) %.
E Total returns for periods of less than one year are not annualized.
F Total returns would have been lower if certain expenses had not been reduced during the applicable periods shown.
G Fees and expenses of any underlying mutual funds or exchange-traded funds (ETFs) are not included in the Fund's expense ratio. The Fund indirectly bears its proportionate share of these expenses. For additional expense information related to investments in Fidelity Central Funds, please refer to the "Investments in Fidelity Central Funds" note found in the Notes to Financial Statements section of the most recent Annual or Semi-Annual report.
H Expense ratios reflect operating expenses of the class. Expenses before reductions do not reflect amounts reimbursed, waived, or reduced through arrangements with the investment adviser, brokerage services, or other offset arrangements, if applicable, and do not represent the amount paid by the class during periods when reimbursements, waivers or reductions occur.
I Annualized
J Amount does not include the portfolio activity of any underlying mutual funds or exchange-traded funds (ETFs).
K Amount not annualized.
See accompanying notes which are an integral part of the financial statements.
Notes to Financial Statements (Unaudited)
For the period ended October 31, 2021
1. Organization.
Fidelity Founders Fund (the Fund) is a fund of Fidelity Concord Street Trust (the Trust) and is authorized to issue an unlimited number of shares. The Trust is registered under the Investment Company Act of 1940, as amended (the 1940 Act), as an open-end management investment company organized as a Massachusetts business trust. The Fund offers Class A, Class M, Class C, Fidelity Founders Fund, Class I and Class Z shares, each of which has equal rights as to assets and voting privileges. Each class has exclusive voting rights with respect to matters that affect that class. Effective June 21, 2021, Class C shares will automatically convert to Class A shares after a holding period of eight years from the initial date of purchase, with certain exceptions. Prior to June 21, 2021, Class C shares automatically converted to Class A shares after a holding period of ten years from the initial date of purchase, with certain exceptions.
2. Investments in Fidelity Central Funds.
Funds may invest in Fidelity Central Funds, which are open-end investment companies generally available only to other investment companies and accounts managed by the investment adviser and its affiliates. The Schedule of Investments lists any Fidelity Central Funds held as an investment as of period end, but does not include the underlying holdings of each Fidelity Central Fund. An investing fund indirectly bears its proportionate share of the expenses of the underlying Fidelity Central Funds.
Based on its investment objective, each Fidelity Central Fund may invest or participate in various investment vehicles or strategies that are similar to those of the investing fund. These strategies are consistent with the investment objectives of the investing fund and may involve certain economic risks which may cause a decline in value of each of the Fidelity Central Funds and thus a decline in the value of the investing fund.
| Fidelity Central Fund | Investment Manager | Investment Objective | Investment Practices | Expense Ratio(a) |
| Fidelity Money Market Central Funds | Fidelity Management & Research Company LLC (FMR) | Each fund seeks to obtain a high level of current income consistent with the preservation of capital and liquidity. | Short-term Investments | Less than .005% |
(a) Expenses expressed as a percentage of average net assets and are as of each underlying Central Fund's most recent annual or semi-annual shareholder report.
A complete unaudited list of holdings for each Fidelity Central Fund is available upon request or at the Securities and Exchange Commission website at www.sec.gov. In addition, the financial statements of the Fidelity Central Funds which contain the significant accounting policies (including investment valuation policies) of those funds, and are not covered by the Report of Independent Registered Public Accounting Firm, are available on the Securities and Exchange Commission website or upon request.
3. Significant Accounting Policies.
The Fund is an investment company and applies the accounting and reporting guidance of the Financial Accounting Standards Board (FASB) Accounting Standards Codification Topic 946 Financial Services - Investment Companies. The financial statements have been prepared in conformity with accounting principles generally accepted in the United States of America (GAAP), which require management to make certain estimates and assumptions at the date of the financial statements. Actual results could differ from those estimates. Subsequent events, if any, through the date that the financial statements were issued have been evaluated in the preparation of the financial statements. The Fund's Schedule of Investments lists any underlying mutual funds or exchange-traded funds (ETFs) but does not include the underlying holdings of these funds. The following summarizes the significant accounting policies of the Fund:
Investment Valuation. Investments are valued as of 4:00 p.m. Eastern time on the last calendar day of the period. The Board of Trustees (the Board) has delegated the day to day responsibility for the valuation of the Fund's investments to the Fair Value Committee (the Committee) established by the Fund's investment adviser. In accordance with valuation policies and procedures approved by the Board, the Fund attempts to obtain prices from one or more third party pricing vendors or brokers to value its investments. When current market prices, quotations or currency exchange rates are not readily available or reliable, investments will be fair valued in good faith by the Committee, in accordance with procedures adopted by the Board. Factors used in determining fair value vary by investment type and may include market or investment specific events. The frequency with which these procedures are used cannot be predicted and they may be utilized to a significant extent. The Committee oversees the Fund's valuation policies and procedures and reports to the Board on the Committee's activities and fair value determinations. The Board monitors the appropriateness of the procedures used in valuing the Fund's investments and ratifies the fair value determinations of the Committee.
The Fund categorizes the inputs to valuation techniques used to value its investments into a disclosure hierarchy consisting of three levels as shown below:
- Level 1 – quoted prices in active markets for identical investments
- Level 2 – other significant observable inputs (including quoted prices for similar investments, interest rates, prepayment speeds, etc.)
- Level 3 – unobservable inputs (including the Fund's own assumptions based on the best information available)
Valuation techniques used to value the Fund's investments by major category are as follows:
Equity securities, including restricted securities, for which market quotations are readily available, are valued at the last reported sale price or official closing price as reported by a third party pricing vendor on the primary market or exchange on which they are traded and are categorized as Level 1 in the hierarchy. In the event there were no sales during the day or closing prices are not available, securities are valued at the last quoted bid price or may be valued using the last available price and are generally categorized as Level 2 in the hierarchy. For foreign equity securities, when market or security specific events arise, comparisons to the valuation of American Depositary Receipts (ADRs), futures contracts, Exchange-Traded Funds (ETFs) and certain indexes as well as quoted prices for similar securities may be used and would be categorized as Level 2 in the hierarchy. For equity securities, including restricted securities, where observable inputs are limited, assumptions about market activity and risk are used and these securities may be categorized as Level 3 in the hierarchy.
Investments in open-end mutual funds, including the Fidelity Central Funds, are valued at their closing net asset value (NAV) each business day and are categorized as Level 1 in the hierarchy.
Changes in valuation techniques may result in transfers in or out of an assigned level within the disclosure hierarchy. The aggregate value of investments by input level as of October 31, 2021 is included at the end of the Fund's Schedule of Investments.
Foreign Currency. Certain Funds may use foreign currency contracts to facilitate transactions in foreign-denominated securities. Gains and losses from these transactions may arise from changes in the value of the foreign currency or if the counterparties do not perform under the contracts' terms.
Foreign-denominated assets, including investment securities, and liabilities are translated into U.S. dollars at the exchange rates at period end. Purchases and sales of investment securities, income and dividends received, and expenses denominated in foreign currencies are translated into U.S. dollars at the exchange rate in effect on the transaction date.
The effects of exchange rate fluctuations on investments are included with the net realized and unrealized gain (loss) on investment securities. Other foreign currency transactions resulting in realized and unrealized gain (loss) are disclosed separately.
Investment Transactions and Income. For financial reporting purposes, the Fund's investment holdings and NAV include trades executed through the end of the last business day of the period. The NAV per share for processing shareholder transactions is calculated as of the close of business of the New York Stock Exchange (NYSE), normally 4:00 p.m. Eastern time and includes trades executed through the end of the prior business day. Gains and losses on securities sold are determined on the basis of identified cost. Commissions paid to certain brokers with whom the investment adviser, or its affiliates, places trades on behalf of a fund include an amount in addition to trade execution, which may be rebated back to a fund. Any such rebates are included in net realized gain (loss) on investments in the Statement of Operations. Dividend income is recorded on the ex-dividend date, except for certain dividends from foreign securities where the ex-dividend date may have passed, which are recorded as soon as the Fund is informed of the ex-dividend date. Non-cash dividends included in dividend income, if any, are recorded at the fair market value of the securities received. Income and capital gain distributions from Fidelity Central Funds, if any, are recorded on the ex-dividend date. Certain distributions received by the Fund represent a return of capital or capital gain. The Fund determines the components of these distributions subsequent to the ex-dividend date, based upon receipt of tax filings or other correspondence relating to the underlying investment. These distributions are recorded as a reduction of cost of investments and/or as a realized gain. Large, non-recurring dividends recognized by the Fund are presented separately on the Statement of Operations as "Special Dividends" and the impact of these dividends is presented in the Financial Highlights. Investment income is recorded net of foreign taxes withheld where recovery of such taxes is uncertain. Funds may file withholding tax reclaims in certain jurisdictions to recover a portion of amounts previously withheld. Any withholding tax reclaims income is included in the Statement of Operations in dividends. Any receivables for withholding tax reclaims are included in the Statement of Assets and Liabilities in dividends receivable.
Class Allocations and Expenses. Investment income, realized and unrealized capital gains and losses, common expenses of a fund, and certain fund-level expense reductions, if any, are allocated daily on a pro-rata basis to each class based on the relative net assets of each class to the total net assets of a fund. Each class differs with respect to transfer agent and distribution and service plan fees incurred, as applicable. Certain expense reductions may also differ by class, if applicable. For the reporting period, the allocated portion of income and expenses to each class as a percent of its average net assets may vary due to the timing of recording these transactions in relation to fluctuating net assets of the classes. Expenses directly attributable to a fund are charged to that fund. Expenses attributable to more than one fund are allocated among the respective funds on the basis of relative net assets or other appropriate methods. Expenses included in the accompanying financial statements reflect the expenses of that fund and do not include any expenses associated with any underlying mutual funds or exchange-traded funds. Although not included in a fund's expenses, a fund indirectly bears its proportionate share of these expenses through the net asset value of each underlying mutual fund or exchange-traded fund. Expense estimates are accrued in the period to which they relate and adjustments are made when actual amounts are known.
Income Tax Information and Distributions to Shareholders. Each year, the Fund intends to qualify as a regulated investment company under Subchapter M of the Internal Revenue Code, including distributing substantially all of its taxable income and realized gains. As a result, no provision for U.S. Federal income taxes is required. The Fund files a U.S. federal tax return, in addition to state and local tax returns as required. The Fund's federal income tax returns are subject to examination by the Internal Revenue Service (IRS) for a period of three fiscal years after they are filed. State and local tax returns may be subject to examination for an additional fiscal year depending on the jurisdiction. Foreign taxes are provided for based on the Fund's understanding of the tax rules and rates that exist in the foreign markets in which it invests.
Distributions are declared and recorded on the ex-dividend date. Income and capital gain distributions are declared separately for each class. Income and capital gain distributions are determined in accordance with income tax regulations, which may differ from GAAP.
Capital accounts within the financial statements are adjusted for permanent book-tax differences. These adjustments have no impact on net assets or the results of operations. Capital accounts are not adjusted for temporary book-tax differences which will reverse in a subsequent period.
Book-tax differences are primarily due to foreign currency transactions, passive foreign investment companies (PFIC) and losses deferred due to wash sales and excise tax regulations.
As of period end, the cost and unrealized appreciation (depreciation) in securities, and derivatives if applicable, for federal income tax purposes were as follows:
| Gross unrealized appreciation | $45,465,602 |
| Gross unrealized depreciation | (2,105,263) |
| Net unrealized appreciation (depreciation) | $43,360,339 |
| Tax cost | $102,691,615 |
Restricted Securities (including Private Placements). Funds may invest in securities that are subject to legal or contractual restrictions on resale. These securities generally may be resold in transactions exempt from registration or to the public if the securities are registered. Disposal of these securities may involve time-consuming negotiations and expense, and prompt sale at an acceptable price may be difficult. Information regarding restricted securities held at period end is included at the end of the Schedule of Investments, if applicable.
4. Purchases and Sales of Investments.
Purchases and sales of securities, other than short-term securities and in-kind transactions, as applicable, are noted in the table below.
| Purchases ($) | Sales ($) | |
| Fidelity Founders Fund | 37,234,956 | 46,921,057 |
5. Fees and Other Transactions with Affiliates.
Management Fee. Fidelity Management & Research Company LLC (the investment adviser) and its affiliates provide the Fund with investment management related services for which the Fund pays a monthly management fee. The management fee is the sum of an individual fund fee rate that is based on an annual rate of .30% of the Fund's average net assets and an annualized group fee rate that averaged .23% during the period. The group fee rate is based upon the monthly average net assets of a group of registered investment companies with which the investment adviser has management contracts. The group fee rate decreases as assets under management increase and increases as assets under management decrease. In addition, the management fee is subject to a performance adjustment (up to a maximum of +/- .10% of the Fund's average net assets over a 36 month performance period). The upward or downward adjustment to the management fee is based on the relative investment performance of Fidelity Founders Fund as compared to its benchmark index, the Russell 3000 Index, over the same 36 month performance period. For the reporting period, the total annualized management fee rate, including the performance adjustment, was .57% of the Fund's average net assets. The performance adjustment included in the management fee rate may be higher or lower than the maximum performance adjustment rate due to the difference between the average net assets for the reporting and performance periods.
Distribution and Service Plan Fees. In accordance with Rule 12b-1 of the 1940 Act, the Fund has adopted separate Distribution and Service Plans for each class of shares. Certain classes pay Fidelity Distributors Company LLC (FDC), an affiliate of the investment adviser, separate Distribution and Service Fees, each of which is based on an annual percentage of each class' average net assets. In addition, FDC may pay financial intermediaries for selling shares of the Fund and providing shareholder support services. For the period, the Distribution and Service Fee rates, total fees and amounts retained by FDC were as follows:
| Distribution Fee | Service Fee | Total Fees | Retained by FDC | |
| Class A | -% | .25% | $15,710 | $1,882 |
| Class M | .25% | .25% | 21,067 | – |
| Class C | .75% | .25% | 10,959 | 4,979 |
| $47,736 | $6,861 |
Sales Load. FDC may receive a front-end sales charge of up to 5.75% for selling Class A shares and 3.50% for selling Class M shares, some of which is paid to financial intermediaries for selling shares of the Fund. Depending on the holding period, FDC may receive contingent deferred sales charges levied on Class A, Class M and Class C redemptions. The deferred sales charges are 1.00% for Class C shares, 1.00% for certain purchases of Class A shares and .25% for certain purchases of Class M shares.
For the period, sales charge amounts retained by FDC were as follows:
| Retained by FDC | |
| Class A | $5,230 |
| Class M | 1,124 |
| Class C(a) | 182 |
| $6,536 |
(a) When Class C shares are initially sold, FDC pays commissions from its own resources to financial intermediaries through which the sales are made.
Transfer Agent Fees. Fidelity Investments Institutional Operations Company LLC (FIIOC), an affiliate of the investment adviser, is the transfer, dividend disbursing and shareholder servicing agent for each class of the Fund. FIIOC receives account fees and asset-based fees that vary according to the account size and type of account of the shareholders of the respective classes of the Fund, except for Class Z. FIIOC receives an asset-based fee of Class Z's average net assets. FIIOC pays for typesetting, printing and mailing of shareholder reports, except proxy statements.
For the period, transfer agent fees for each class were as follows:
| Amount | % of Class-Level Average Net Assets (a) | |
| Class A | $12,859 | .20 |
| Class M | 7,087 | .17 |
| Class C | 3,003 | .27 |
| Fidelity Founders Fund | 85,377 | .19 |
| Class I | 983 | .13 |
| Class Z | 4,758 | .04 |
| $114,067 |
(a) Annualized
Accounting Fees. Fidelity Service Company, Inc. (FSC), an affiliate of the investment adviser, maintains the Fund's accounting records. The accounting fee is based on the level of average net assets for each month. For the period, the fees were equivalent to the following annualized rates:
| % of Average Net Assets | |
| Fidelity Founders Fund | .04 |
Brokerage Commissions. A portion of portfolio transactions were placed with brokerage firms which are affiliates of the investment adviser. Brokerage commissions are included in net realized gain (loss) and change in net unrealized appreciation (depreciation) in the Statement of Operations. The commissions paid to these affiliated firms were as follows:
| Amount | |
| Fidelity Founders Fund | $381 |
Interfund Trades. Funds may purchase from or sell securities to other Fidelity Funds under procedures adopted by the Board. The procedures have been designed to ensure these interfund trades are executed in accordance with Rule 17a-7 of the 1940 Act. Any interfund trades are included within the respective purchases and sales amounts shown in the Purchases and Sales of Investments note. Interfund trades during the period are noted in the table below.
| Purchases ($) | Sales ($) | Realized Gain (Loss) ($) | |
| Fidelity Founders Fund | 1,304,846 | 2,733,342 | 94,294 |
6. Committed Line of Credit.
Certain Funds participate with other funds managed by the investment adviser or an affiliate in a $4.25 billion credit facility (the "line of credit") to be utilized for temporary or emergency purposes to fund shareholder redemptions or for other short-term liquidity purposes. The participating funds have agreed to pay commitment fees on their pro-rata portion of the line of credit, which are reflected in Miscellaneous expenses on the Statement of Operations, and are listed below. During the period, there were no borrowings on this line of credit.
| Amount | |
| Fidelity Founders Fund | $112 |
7. Security Lending.
Funds lend portfolio securities from time to time in order to earn additional income. Lending agents are used, including National Financial Services (NFS), an affiliate of the investment adviser. Pursuant to a securities lending agreement, NFS will receive a fee, which is capped at 9.9% of a fund's daily lending revenue, for its services as lending agent. A fund may lend securities to certain qualified borrowers, including NFS. On the settlement date of the loan, a fund receives collateral (in the form of U.S. Treasury obligations, letters of credit and/or cash) against the loaned securities and maintains collateral in an amount not less than 100% of the market value of the loaned securities during the period of the loan. The market value of the loaned securities is determined at the close of business of a fund and any additional required collateral is delivered to a fund on the next business day. A fund or borrower may terminate the loan at any time, and if the borrower defaults on its obligation to return the securities loaned because of insolvency or other reasons, a fund may apply collateral received from the borrower against the obligation. A fund may experience delays and costs in recovering the securities loaned. Any cash collateral received is invested in the Fidelity Securities Lending Cash Central Fund. Any loaned securities are identified as such in the Schedule of Investments, and the value of loaned securities and cash collateral at period end, as applicable, are presented in the Statement of Assets and Liabilities. Security lending income represents the income earned on investing cash collateral, less rebates paid to borrowers and any lending agent fees associated with the loan, plus any premium payments received for lending certain types of securities. Security lending income is presented in the Statement of Operations as a component of income from Fidelity Central Funds. Affiliated security lending activity, if any, was as follows:
| Total Security Lending Fees Paid to NFS | Security Lending Income From Securities Loaned to NFS | Value of Securities Loaned to NFS at Period End | |
| Fidelity Founders Fund | $951 | $707 | $– |
8. Expense Reductions.
The investment adviser contractually agreed to reimburse expenses of each class to the extent annual operating expenses exceeded certain levels of class-level average net assets as noted in the table below. This reimbursement will remain in place through August 31, 2022. Some expenses, for example the compensation of the independent Trustees, and certain miscellaneous expenses such as proxy and shareholder meeting expenses, are excluded from this reimbursement.
The following classes were in reimbursement during the period:
| Expense Limitations | Reimbursement | |
| Class A | 1.25%/1.15%(a) | $– |
| Class M | 1.50%/1.40%(a) | – |
| Class C | 2.00%/1.90%(a) | 344 |
| Fidelity Founders Fund | 1.00%/.90%(a) | – |
| Class I | 1.00%/.90%(a) | – |
| Class Z | .85%/.75%(a) | – |
| $344 |
(a) Expense limitation effective June 1, 2021.
In addition, during the period the investment adviser or an affiliate reimbursed and/or waived a portion of fund-level operating expenses in the amount of $1,941.
9. Distributions to Shareholders.
Distributions to shareholders of each class were as follows:
| Six months ended October 31, 2021 | Year ended April 30, 2021 | |
| Fidelity Founders Fund | ||
| Distributions to shareholders | ||
| Class A | $485,210 | $ - |
| Class M | 315,695 | – |
| Class C | 75,123 | – |
| Fidelity Founders Fund | 3,897,024 | – |
| Class I | 61,219 | – |
| Class Z | 952,318 | – |
| Total | $5,786,589 | $– |
10. Share Transactions.
Share transactions for each class were as follows and may contain in-kind transactions, automatic conversions between classes or exchanges between affiliated funds:
| Shares | Shares | Dollars | Dollars | |
| Six months ended October 31, 2021 | Year ended April 30, 2021 | Six months ended October 31, 2021 | Year ended April 30, 2021 | |
| Fidelity Founders Fund | ||||
| Class A | ||||
| Shares sold | 145,273 | 675,060 | $2,671,214 | $10,488,392 |
| Reinvestment of distributions | 27,182 | – | 485,199 | – |
| Shares redeemed | (89,501) | (165,308) | (1,639,802) | (2,717,007) |
| Net increase (decrease) | 82,954 | 509,752 | $1,516,611 | $7,771,385 |
| Class M | ||||
| Shares sold | 110,531 | 380,877 | $2,031,300 | $5,983,346 |
| Reinvestment of distributions | 17,437 | – | 309,857 | – |
| Shares redeemed | (18,054) | (44,609) | (333,277) | (726,698) |
| Net increase (decrease) | 109,914 | 336,268 | $2,007,880 | $5,256,648 |
| Class C | ||||
| Shares sold | 39,449 | 143,699 | $720,281 | $2,238,811 |
| Reinvestment of distributions | 4,259 | – | 75,123 | – |
| Shares redeemed | (35,566) | (61,703) | (654,029) | (1,040,624) |
| Net increase (decrease) | 8,142 | 81,996 | $141,375 | $1,198,187 |
| Fidelity Founders Fund | ||||
| Shares sold | 496,579 | 5,694,058 | $9,206,874 | $89,195,197 |
| Reinvestment of distributions | 207,467 | – | 3,717,812 | – |
| Shares redeemed | (1,104,121) | (2,499,360) | (20,481,327) | (40,955,656) |
| Net increase (decrease) | (400,075) | 3,194,698 | $(7,556,641) | $48,239,541 |
| Class I | ||||
| Shares sold | 14,490 | 73,859 | $270,005 | $1,196,566 |
| Reinvestment of distributions | 3,213 | – | 57,572 | – |
| Shares redeemed | (23,869) | (36,170) | (452,484) | (574,950) |
| Net increase (decrease) | (6,166) | 37,689 | $(124,907) | $621,616 |
| Class Z | ||||
| Shares sold | 181,284 | 1,302,508 | $3,417,838 | $19,812,202 |
| Reinvestment of distributions | 51,954 | – | 933,608 | – |
| Shares redeemed | (158,803) | (712,817) | (2,963,023) | (11,276,558) |
| Net increase (decrease) | 74,435 | 589,691 | $1,388,423 | $8,535,644 |
11. Other.
Fund's organizational documents provide former and current trustees and officers with a limited indemnification against liabilities arising in connection with the performance of their duties to the fund. In the normal course of business, the fund may also enter into contracts that provide general indemnifications. The fund's maximum exposure under these arrangements is unknown as this would be dependent on future claims that may be made against the fund. The risk of material loss from such claims is considered remote.
12. Coronavirus (COVID-19) Pandemic.
An outbreak of COVID-19 first detected in China during December 2019 has since spread globally and was declared a pandemic by the World Health Organization during March 2020. Developments that disrupt global economies and financial markets, such as the COVID-19 pandemic, may magnify factors that affect the Fund's performance.
Shareholder Expense Example
As a shareholder, you incur two types of costs: (1) transaction costs, which may include sales charges (loads) on purchase payments or redemption proceeds, as applicable and (2) ongoing costs, which generally include management fees, distribution and/or service (12b-1) fees and other Fund expenses. This Example is intended to help you understand your ongoing costs (in dollars) of investing in a fund and to compare these costs with the ongoing costs of investing in other mutual funds.
The Example is based on an investment of $1,000 invested at the beginning of the period and held for the entire period (May 1, 2021 to October 31, 2021).
Actual Expenses
The first line of the accompanying table provides information about actual account values and actual expenses. You may use the information in this line, together with the amount you invested, to estimate the expenses that you paid over the period. Simply divide your account value by $1,000.00 (for example, an $8,600 account value divided by $1,000.00 = 8.6), then multiply the result by the number in the first line for a class/Fund under the heading entitled "Expenses Paid During Period" to estimate the expenses you paid on your account during this period. If any fund is a shareholder of any underlying mutual funds or exchange-traded funds (ETFs) (the Underlying Funds), such fund indirectly bears its proportional share of the expenses of the Underlying Funds in addition to the direct expenses incurred presented in the table. These fees and expenses are not included in the annualized expense ratio used to calculate the expense estimate in the table below.
Hypothetical Example for Comparison Purposes
The second line of the accompanying table provides information about hypothetical account values and hypothetical expenses based on the actual expense ratio and an assumed rate of return of 5% per year before expenses, which is not the actual return. The hypothetical account values and expenses may not be used to estimate the actual ending account balance or expenses you paid for the period. You may use this information to compare the ongoing costs of investing in the Fund and other funds. To do so, compare this 5% hypothetical example with the 5% hypothetical examples that appear in the shareholder reports of the other funds. If any fund is a shareholder of any Underlying Funds, such fund indirectly bears its proportional share of the expenses of the Underlying Funds in addition to the direct expenses as presented in the table. These fees and expenses are not included in the annualized expense ratio used to calculate the expense estimate in the table below.
Please note that the expenses shown in the table are meant to highlight your ongoing costs only and do not reflect any transaction costs. Therefore, the second line of the table is useful in comparing ongoing costs only, and will not help you determine the relative total costs of owning different funds. In addition, if these transactional costs were included, your costs would have been higher.
| Annualized Expense Ratio-A | Beginning Account Value May 1, 2021 | Ending Account Value October 31, 2021 | Expenses Paid During Period-B May 1, 2021 to October 31, 2021 | |
| Fidelity Founders Fund | ||||
| Class A | 1.14% | |||
| Actual | $1,000.00 | $1,101.30 | $6.04 | |
| Hypothetical-C | $1,000.00 | $1,019.46 | $5.80 | |
| Class M | 1.35% | |||
| Actual | $1,000.00 | $1,099.90 | $7.15 | |
| Hypothetical-C | $1,000.00 | $1,018.40 | $6.87 | |
| Class C | 1.92% | |||
| Actual | $1,000.00 | $1,096.60 | $10.15 | |
| Hypothetical-C | $1,000.00 | $1,015.53 | $9.75 | |
| Fidelity Founders Fund | .87% | |||
| Actual | $1,000.00 | $1,102.80 | $4.61 | |
| Hypothetical-C | $1,000.00 | $1,020.82 | $4.43 | |
| Class I | .81% | |||
| Actual | $1,000.00 | $1,102.80 | $4.29 | |
| Hypothetical-C | $1,000.00 | $1,021.12 | $4.13 | |
| Class Z | .72% | |||
| Actual | $1,000.00 | $1,103.70 | $3.82 | |
| Hypothetical-C | $1,000.00 | $1,021.58 | $3.67 |
A Annualized expense ratio reflects expenses net of applicable fee waivers.
B Expenses are equal to the annualized expense ratio, multiplied by the average account value over the period, multiplied by 184/ 365 (to reflect the one-half year period). The fees and expenses of any Underlying Funds are not included in each annualized expense ratio.
C 5% return per year before expenses
Board Approval of Investment Advisory Contracts and Management Fees
Fidelity Founders Fund
Each year, the Board of Trustees, including the Independent Trustees (together, the Board), votes on the renewal of the management contract with Fidelity Management & Research Company LLC (FMR) and the sub-advisory agreements (together, the Advisory Contracts) for the fund. FMR and the sub-advisers are referred to herein as the Investment Advisers. The Board, assisted by the advice of fund counsel and Independent Trustees' counsel, requests and considers a broad range of information relevant to the renewal of the Advisory Contracts throughout the year.The Board meets regularly and, at each of its meetings, covers an extensive agenda of topics and materials and considers factors that are relevant to its annual consideration of the renewal of the fund's Advisory Contracts, including the services and support provided to the fund and its shareholders. The Board has established various standing committees (Committees), each composed of and chaired by Independent Trustees with varying backgrounds, to which the Board has assigned specific subject matter responsibilities in order to enhance effective decision-making by the Board. The Board, acting directly and through its Committees, requests and receives information concerning the annual consideration of the renewal of the fund's Advisory Contracts. The Board also meets as needed to review matters specifically related to the Board's annual consideration of the renewal of the Advisory Contracts. Members of the Board may also meet with trustees of other Fidelity funds through joint ad hoc committees to discuss certain matters relevant to all of the Fidelity funds.At its May 2021 meeting, the Board unanimously determined to renew the fund's Advisory Contracts. In reaching its determination, the Board considered all factors it believed relevant, including (i) the nature, extent, and quality of the services provided to the fund and its shareholders (including the investment performance of the fund); (ii) the competitiveness of the fund's management fee and total expense ratio relative to peer funds; (iii) the total costs of the services provided by and the profits realized by Fidelity from its relationships with the fund; and (iv) the extent to which, if any, economies of scale exist and are realized as the fund grows, and whether any economies of scale are appropriately shared with fund shareholders.In considering whether to renew the Advisory Contracts for the fund, the Board reached a determination, with the assistance of fund counsel and Independent Trustees' counsel and through the exercise of its business judgment, that the renewal of the Advisory Contracts was in the best interests of the fund and its shareholders and that the compensation payable under the Advisory Contracts was fair and reasonable. The Board's decision to renew the Advisory Contracts was not based on any single factor, but rather was based on a comprehensive consideration of all the information provided to the Board at its meetings throughout the year. The Board, in reaching its determination to renew the Advisory Contracts, was aware that shareholders of the fund have a broad range of investment choices available to them, including a wide choice among funds offered by Fidelity's competitors, and that the fund's shareholders, who have the opportunity to review and weigh the disclosure provided by the fund in its prospectus and other public disclosures, have chosen to invest in this fund, which is part of the Fidelity family of funds.Nature, Extent, and Quality of Services Provided. The Board considered Fidelity's staffing as it relates to the fund, including the backgrounds of investment personnel of Fidelity, and also considered the fund's investment objective, strategies, and related investment philosophy. The Independent Trustees also had discussions with senior management of Fidelity's investment operations and investment groups. The Board considered the structure of the investment personnel compensation program and whether this structure provides appropriate incentives to act in the best interests of the fund. Additionally, the Board considered the portfolio managers' investments, if any, in the funds that they manage.Resources Dedicated to Investment Management and Support Services. The Board and the Fund Oversight and Research Committees reviewed the general qualifications and capabilities of Fidelity's investment staff, including its size, education, experience, and resources, as well as Fidelity's approach to recruiting, training, managing, and compensating investment personnel. The Board noted that Fidelity has continued to increase the resources devoted to non-U.S. offices, including expansion of Fidelity's global investment organization. The Board also noted that Fidelity's analysts have extensive resources, tools and capabilities that allow them to conduct sophisticated quantitative and fundamental analysis, as well as credit analysis of issuers, counterparties and guarantors. Further, the Board considered that Fidelity's investment professionals have sufficient access to global information and data so as to provide competitive investment results over time, and that those professionals also have access to sophisticated tools that permit them to assess portfolio construction and risk and performance attribution characteristics continuously, as well as to transmit new information and research conclusions rapidly around the world. Additionally, in its deliberations, the Board considered Fidelity's trading, risk management, compliance, and technology and operations capabilities and resources, which are integral parts of the investment management process. The Board also considered Fidelity's investments in business continuity planning, and its success in continuously providing services to the fund notwithstanding the severe disruptions caused by the COVID-19 pandemic.Shareholder and Administrative Services. The Board considered (i) the nature, extent, quality, and cost of advisory, administrative, and shareholder services performed by the Investment Advisers and their affiliates under the Advisory Contracts and under separate agreements covering transfer agency, pricing and bookkeeping, and securities lending services for the fund; (ii) the nature and extent of the supervision of third party service providers, principally custodians, subcustodians, and pricing vendors; and (iii) the resources devoted to, and the record of compliance with, the fund's compliance policies and procedures. The Board also reviewed the allocation of fund brokerage, including allocations to brokers affiliated with the Investment Advisers, the use of brokerage commissions to pay fund expenses, and the use of "soft" commission dollars to pay for research services.The Board noted that the growth of fund assets over time across the complex allows Fidelity to reinvest in the development of services designed to enhance the value and convenience of the Fidelity funds as investment vehicles. These services include 24-hour access to account information and market information over the Internet and through telephone representatives, investor education materials and asset allocation tools, and the expanded availability of Fidelity Investor Centers.The Board noted that, in the past, it and the boards of certain other Fidelity funds had formed an ad hoc Committee on Transfer Agency Fees to review the variety of transfer agency fee structures throughout the industry and Fidelity's competitive positioning with respect to industry participants.Investment in a Large Fund Family. The Board considered the benefits to shareholders of investing in a Fidelity fund, including the benefits of investing in a fund that is part of a large family of funds offering a variety of investment disciplines and providing a large variety of mutual fund investor services. The Board noted that Fidelity had taken, or had made recommendations that resulted in the Fidelity funds taking, a number of actions over the previous year that benefited particular funds, including: (i) continuing to dedicate additional resources to Fidelity's investment research process, which includes meetings with management of issuers of securities in which the funds invest, and to the support of the senior management team that oversees asset management; (ii) continuing efforts to enhance Fidelity's global research capabilities; (iii) launching new funds and ETFs with innovative structures, strategies and pricing and making other enhancements to meet client needs; (iv) launching new share classes of existing funds; (v) eliminating purchase minimums and broadening eligibility requirements for certain funds and share classes; (vi) approving the reduction in the holding period for the Class C to Class A conversion policy; (vii) reducing management fees and total expenses for certain target date funds and classes and index funds; (viii) lowering expenses for certain existing funds and classes by implementing or lowering expense caps; (ix) rationalizing product lines and gaining increased efficiencies from fund mergers, liquidations, and share class consolidations; (x) continuing to develop, acquire and implement systems and technology to improve services to the funds and shareholders, strengthen information security, and increase efficiency; and (xi) continuing to implement enhancements to further strengthen Fidelity's product line to increase investors' probability of success in achieving their investment goals, including retirement income goals.Investment Performance. The Board considered whether the fund has operated in accordance with its investment objective, as well as its record of compliance with its investment restrictions and its performance history.The Board took into account discussions that occur at Board meetings throughout the year with representatives of the Investment Advisers about fund investment performance. In this regard the Board noted that as part of regularly scheduled fund reviews and other reports to the Board on fund performance, the Board considers annualized return information for the fund for different time periods, measured against an appropriate securities market index (benchmark index). In its evaluation of fund investment performance, the Board gave particular attention to information indicating changes in performance of certain Fidelity funds for specific time periods and discussed with the Investment Advisers the reasons for any overperformance or underperformance.In addition to reviewing absolute and relative fund performance, the Independent Trustees periodically consider the appropriateness of fund performance metrics in evaluating the results achieved. In general, the Independent Trustees believe that fund performance should be evaluated based on net performance (after fees and expenses) of both the highest performing and lowest performing fund share classes, where applicable, compared to appropriate benchmark indices, over appropriate time periods that may include full market cycles, and compared to peer groups, as applicable, over the same periods, taking into account relevant factors including the following: general market conditions; issuer-specific information; and fund cash flows and other factors.The Independent Trustees recognize that shareholders evaluate performance on a net basis over their own holding periods, for which one-, three-, and five-year periods are often used as a proxy. For this reason, the performance information reviewed by the Board also included net total return information for the fund and an appropriate benchmark index for the most recent one-year period ended September 30, 2020, as shown below. A peer group is not shown below because the fund does not generally utilize a peer group for performance comparison purposes.Fidelity Founders Fund

Fidelity Founders Fund

![]()
RFFF-SANN-1221
1.9892519.102
Item 2.
Code of Ethics
Not applicable.
Item 3.
Audit Committee Financial Expert
Not applicable.
Item 4.
Principal Accountant Fees and Services
Not applicable.
Item 5.
Audit Committee of Listed Registrants
Not applicable.
Item 6.
Investments
(a)
Not applicable.
(b)
Not applicable
Item 7.
Disclosure of Proxy Voting Policies and Procedures for Closed-End Management Investment Companies
Not applicable.
Item 8.
Portfolio Managers of Closed-End Management Investment Companies
Not applicable.
Item 9.
Purchase of Equity Securities by Closed-End Management Investment Company and Affiliated Purchasers
Not applicable.
Item 10.
Submission of Matters to a Vote of Security Holders
There were no material changes to the procedures by which shareholders may recommend nominees to the Fidelity Concord Street Trust’s Board of Trustees.
Item 11.
Controls and Procedures
(a)(i) The President and Treasurer and the Chief Financial Officer have concluded that the Fidelity Concord Street Trust’s (the “Trust”) disclosure controls and procedures (as defined in Rule 30a-3(c) under the Investment Company Act) provide reasonable
assurances that material information relating to the Trust is made known to them by the appropriate persons, based on their evaluation of these controls and procedures as of a date within 90 days of the filing date of this report.
(a)(ii) There was no change in the Trust’s internal control over financial reporting (as defined in Rule 30a-3(d) under the Investment Company Act) that occurred during the period covered by this report that has materially affected, or is reasonably likely to materially affect, the Trust’s internal control over financial reporting.
Item 12.
Disclosure of Securities Lending Activities for Closed-End Management
Investment Companies
Not applicable.
Item 13.
Exhibits
(a) | (1) | Not applicable. |
(a) | (2) | |
(a) | (3) | Not applicable. |
(b) |
SIGNATURES
Pursuant to the requirements of the Securities Exchange Act of 1934 and the Investment Company Act of 1940, the registrant has duly caused this report to be signed on its behalf by the undersigned, thereunto duly authorized.
Fidelity Concord Street Trust
By: | /s/Stacie M. Smith |
Stacie M. Smith | |
President and Treasurer | |
Date: | December 21, 2021 |
Pursuant to the requirements of the Securities Exchange Act of 1934 and the Investment Company Act of 1940, this report has been signed below by the following persons on behalf of the registrant and in the capacities and on the dates indicated.
By: | /s/Stacie M. Smith |
Stacie M. Smith | |
President and Treasurer | |
Date: | December 21, 2021 |
By: | /s/John J. Burke III |
John J. Burke III | |
Chief Financial Officer | |
Date: | December 21, 2021 |