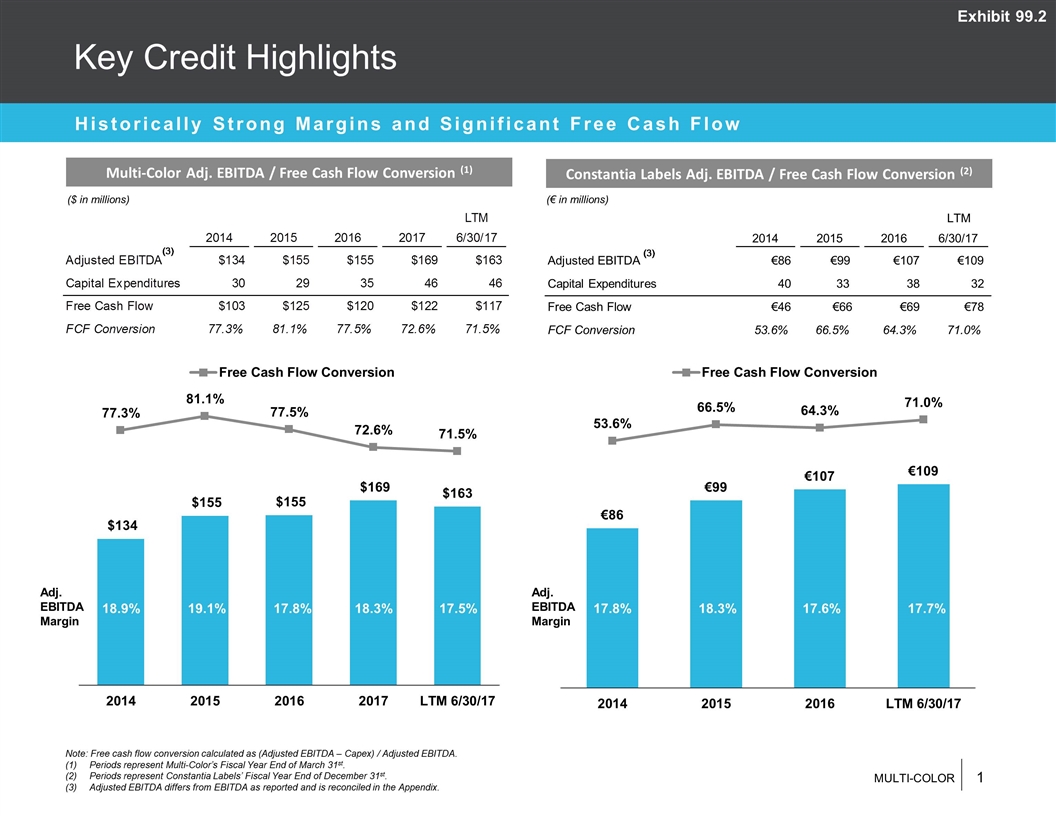
Key Credit Highlights Historically Strong Margins and Significant Free Cash Flow Multi-Color Adj. EBITDA / Free Cash Flow Conversion (1) Constantia Labels Adj. EBITDA / Free Cash Flow Conversion (2) Note: Free cash flow conversion calculated as (Adjusted EBITDA – Capex) / Adjusted EBITDA. Periods represent Multi-Color’s Fiscal Year End of March 31st. Periods represent Constantia Labels’ Fiscal Year End of December 31st. Adjusted EBITDA differs from EBITDA as reported and is reconciled in the Appendix. (€ in millions) ($ in millions) 17.8% 18.3% 17.6% 17.7% 19.1% 17.8% 18.3% 17.5% 18.9% Adj. EBITDA Margin Adj. EBITDA Margin Exhibit 99.2 LTM 2014 2015 2016 6/30/17 Adjusted EBITDA €86 €99 €107 €109 Capital Expenditures 40 33 38 32 Free Cash Flow €46 €66 €69 €78 FCF Conversion 53.6% 66.5% 64.3% 71.0%
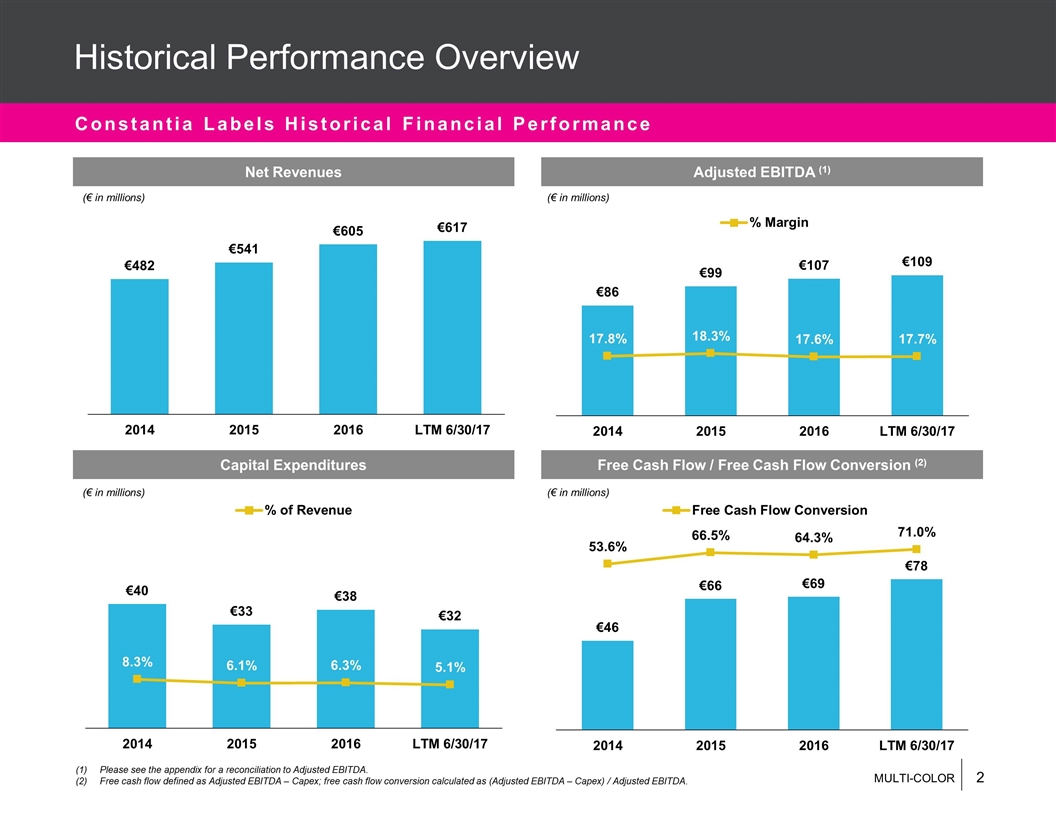
Please see the appendix for a reconciliation to Adjusted EBITDA. Free cash flow defined as Adjusted EBITDA – Capex; free cash flow conversion calculated as (Adjusted EBITDA – Capex) / Adjusted EBITDA. Constantia Labels Historical Financial Performance Historical Performance Overview Net Revenues Adjusted EBITDA (1) Capital Expenditures Free Cash Flow / Free Cash Flow Conversion (2) (€ in millions) (€ in millions) (€ in millions) (€ in millions)
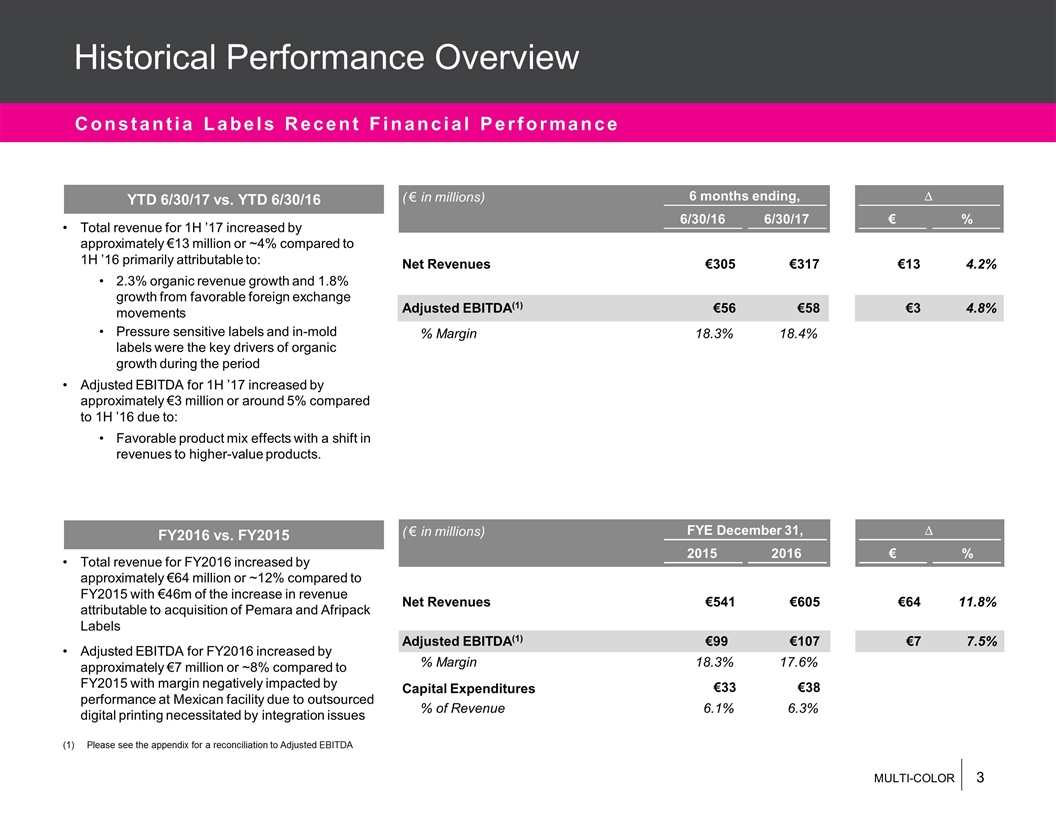
YTD 6/30/17 vs. YTD 6/30/16 FY2016 vs. FY2015 Total revenue for FY2016 increased by approximately €64 million or ~12% compared to FY2015 with €46m of the increase in revenue attributable to acquisition of Pemara and Afripack Labels Adjusted EBITDA for FY2016 increased by approximately €7 million or ~8% compared to FY2015 with margin negatively impacted by performance at Mexican facility due to outsourced digital printing necessitated by integration issues Constantia Labels Recent Financial Performance Historical Performance Overview Total revenue for 1H ’17 increased by approximately €13 million or ~4% compared to 1H ’16 primarily attributable to: 2.3% organic revenue growth and 1.8% growth from favorable foreign exchange movements Pressure sensitive labels and in-mold labels were the key drivers of organic growth during the period Adjusted EBITDA for 1H ’17 increased by approximately €3 million or around 5% compared to 1H ’16 due to: Favorable product mix effects with a shift in revenues to higher-value products. Please see the appendix for a reconciliation to Adjusted EBITDA ( € in millions) FYE December 31, D 2015 2016 € % Net Revenues €541 €605 €64 11.8% Adjusted EBITDA(1) €99 €107 €7 7.5% % Margin 18.3% 17.6% Capital Expenditures €33 €38 % of Revenue 6.1% 6.3% ( € in millions) 6 months ending, D 6/30/16 6/30/17 € % Net Revenues €305 €317 €13 4.2% Adjusted EBITDA(1) €56 €58 €3 4.8% % Margin 18.3% 18.4%
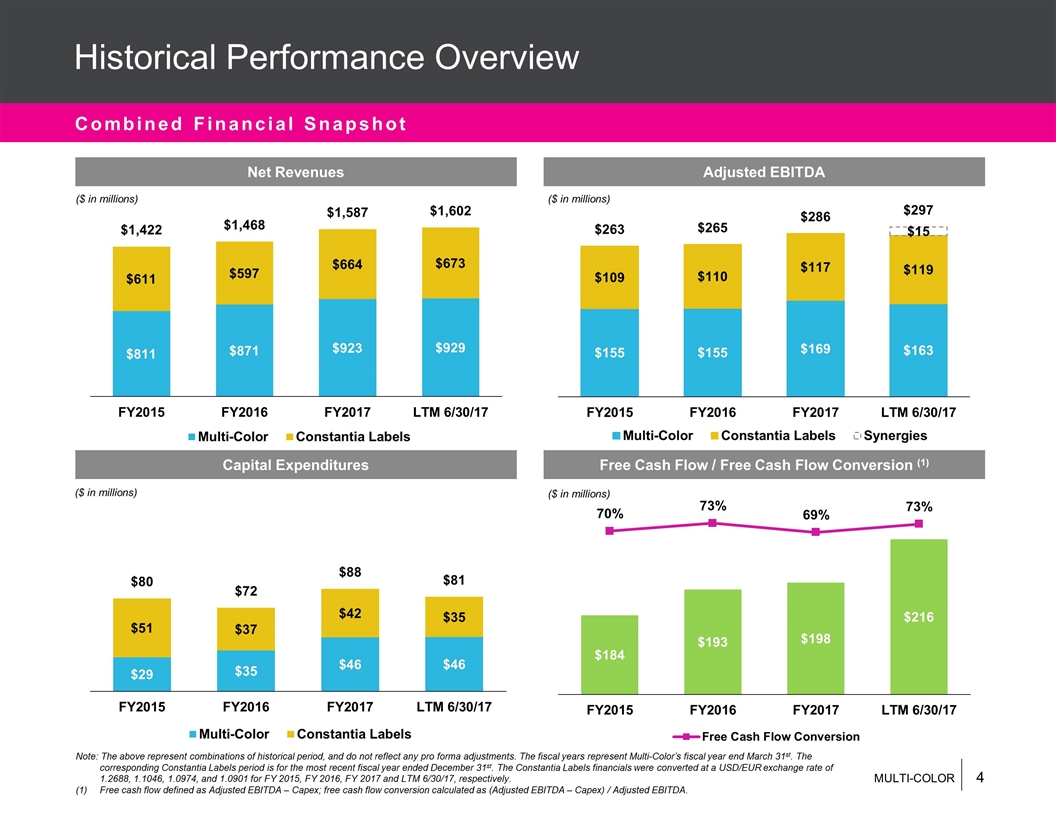
Note: The above represent combinations of historical period, and do not reflect any pro forma adjustments. The fiscal years represent Multi-Color’s fiscal year end March 31st. The corresponding Constantia Labels period is for the most recent fiscal year ended December 31st. The Constantia Labels financials were converted at a USD/EUR exchange rate of 1.2688, 1.1046, 1.0974, and 1.0901 for FY 2015, FY 2016, FY 2017 and LTM 6/30/17, respectively. Free cash flow defined as Adjusted EBITDA – Capex; free cash flow conversion calculated as (Adjusted EBITDA – Capex) / Adjusted EBITDA. Combined Financial Snapshot Historical Performance Overview Net Revenues Adjusted EBITDA Capital Expenditures Free Cash Flow / Free Cash Flow Conversion (1) ($ in millions) ($ in millions) ($ in millions) ($ in millions)
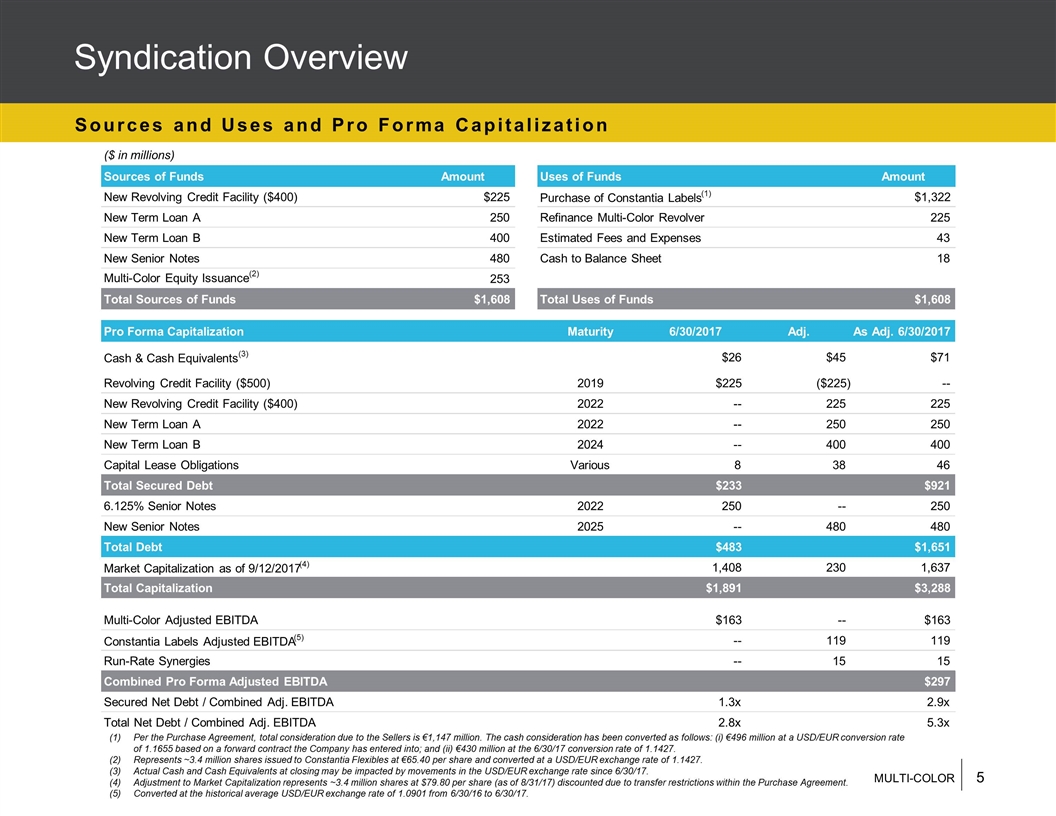
Syndication Overview Sources and Uses and Pro Forma Capitalization Per the Purchase Agreement, total consideration due to the Sellers is €1,147 million. The cash consideration has been converted as follows: (i) €496 million at a USD/EUR conversion rate of 1.1655 based on a forward contract the Company has entered into; and (ii) €430 million at the 6/30/17 conversion rate of 1.1427. Represents ~3.4 million shares issued to Constantia Flexibles at €65.40 per share and converted at a USD/EUR exchange rate of 1.1427. Actual Cash and Cash Equivalents at closing may be impacted by movements in the USD/EUR exchange rate since 6/30/17. Adjustment to Market Capitalization represents ~3.4 million shares at $79.80 per share (as of 8/31/17) discounted due to transfer restrictions within the Purchase Agreement. Converted at the historical average USD/EUR exchange rate of 1.0901 from 6/30/16 to 6/30/17. ($ in millions) Sources of Funds Amount Uses of Funds Amount New Revolving Credit Facility ($400) $225 Purchase of Constantia Labels (1) $1,322 New Term Loan A 250 Refinance Multi-Color Revolver 225 New Term Loan B 400 Estimated Fees and Expenses 43 New Senior Notes 480 Cash to Balance Sheet 18 Multi-Color Equity Issuance (2) 253 Total Sources of Funds $1,608 Total Uses of Funds $1,608 Pro Forma Capitalization Maturity 6/30/2017 Adj. As Adj. 6/30/2017 Cash & Cash Equivalents (3) $26 $45 $71 Revolving Credit Facility ($500) 2019 $225 ($225) -- New Revolving Credit Facility ($400) 2022 -- 225 225 New Term Loan A 2022 -- 250 250 New Term Loan B 2024 -- 400 400 Capital Lease Obligations Various 8 38 46 Total Secured Debt $233 $921 6.125% Senior Notes 2022 250 -- 250 New Senior Notes 2025 -- 480 480 Total Debt $483 $1,651 Market Capitalization as of 9/12/2017 (4) 1,408 230 1,637 Total Capitalization $1,891 $3,288 Multi-Color Adjusted EBITDA $163 -- $163 Constantia Labels Adjusted EBITDA (5) -- 119 119 Run-Rate Synergies -- 15 15 Combined Pro Forma Adjusted EBITDA $297 Secured Net Debt / Combined Adj. EBITDA 1.3x 2.9x Total Net Debt / Combined Adj. EBITDA 2.8x 5.3x
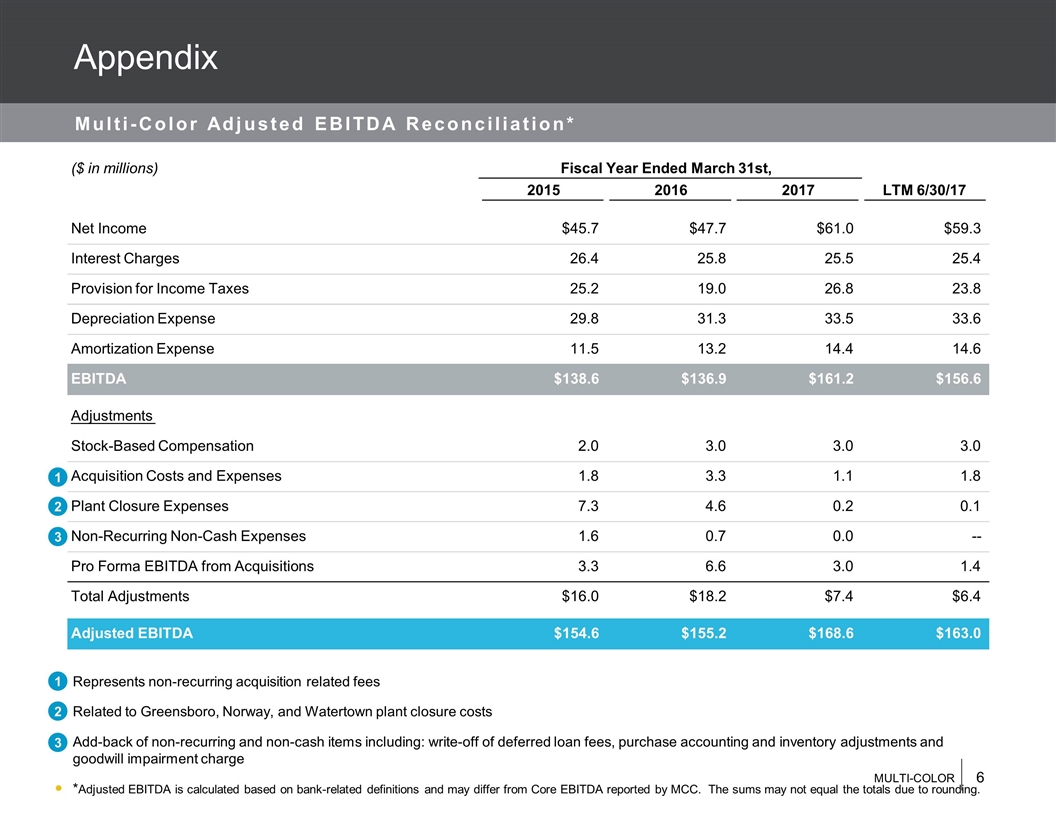
Multi-Color Adjusted EBITDA Reconciliation* Appendix 1 2 3 Represents non-recurring acquisition related fees Related to Greensboro, Norway, and Watertown plant closure costs Add-back of non-recurring and non-cash items including: write-off of deferred loan fees, purchase accounting and inventory adjustments and goodwill impairment charge *Adjusted EBITDA is calculated based on bank-related definitions and may differ from Core EBITDA reported by MCC. The sums may not equal the totals due to rounding. 1 2 3 ($ in millions) Fiscal Year Ended March 31st, 2015 2016 2017 LTM 6/30/17 Net Income $45.7 $47.7 $61.0 $59.3 Interest Charges 26.4 25.8 25.5 25.4 Provision for Income Taxes 25.2 19.0 26.8 23.8 Depreciation Expense 29.8 31.3 33.5 33.6 Amortization Expense 11.5 13.2 14.4 14.6 EBITDA $138.6 $136.9 $161.2 $156.6 Adjustments Stock-Based Compensation 2.0 3.0 3.0 3.0 Acquisition Costs and Expenses 1.8 3.3 1.1 1.8 Plant Closure Expenses 7.3 4.6 0.2 0.1 Non-Recurring Non-Cash Expenses 1.6 0.7 0.0 -- Pro Forma EBITDA from Acquisitions 3.3 6.6 3.0 1.4 Total Adjustments $16.0 $18.2 $7.4 $6.4 Adjusted EBITDA $154.6 $155.2 $168.6 $163.0
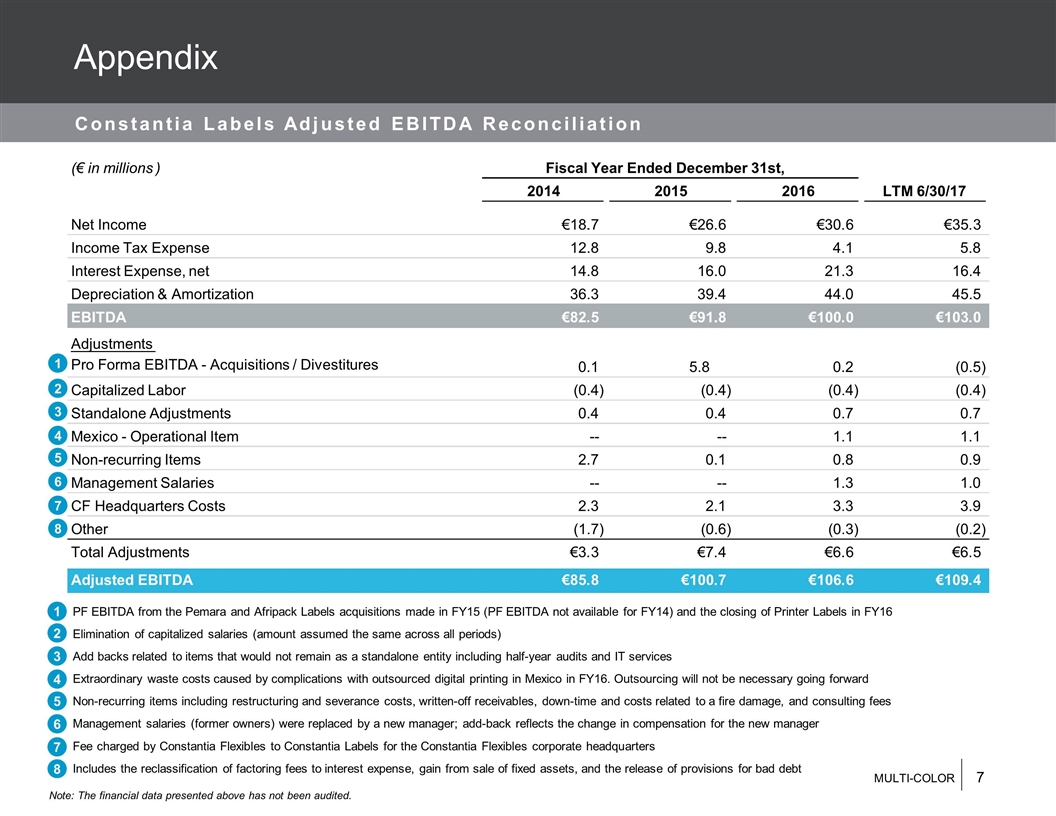
Constantia Labels Adjusted EBITDA Reconciliation Appendix PF EBITDA from the Pemara and Afripack Labels acquisitions made in FY15 (PF EBITDA not available for FY14) and the closing of Printer Labels in FY16 Elimination of capitalized salaries (amount assumed the same across all periods) Add backs related to items that would not remain as a standalone entity including half-year audits and IT services Extraordinary waste costs caused by complications with outsourced digital printing in Mexico in FY16. Outsourcing will not be necessary going forward Non-recurring items including restructuring and severance costs, written-off receivables, down-time and costs related to a fire damage, and consulting fees Management salaries (former owners) were replaced by a new manager; add-back reflects the change in compensation for the new manager Fee charged by Constantia Flexibles to Constantia Labels for the Constantia Flexibles corporate headquarters Includes the reclassification of factoring fees to interest expense, gain from sale of fixed assets, and the release of provisions for bad debt 1 2 3 4 5 6 7 8 1 2 3 4 5 6 7 8 ( € in millions ) Fiscal Year Ended December 31st, 2014 2015 2016 LTM 6/30/17 Net Income € 18. . 7 € 26 . 6 € 30 . 6 € 35 . 3 Income Tax Expense 12.8 9.8 4.1 5.8 Interest Expense, net 14.8 16.0 21.3 16.4 Depreciation & Amortization 36.3 39.4 44.0 45.5 EBITDA € 82 . 5 € 91. . 8 € 100 . 0 € 103 . 0 Adjustments Pro Forma EBITDA - Acquisitions / Divestitures 0.1 5.8 0.2 (0.5) Capitalized Labor (0.4) (0.4) (0.4) (0.4) Standalone Adjustments 0.4 0.4 0.7 0.7 Mexico - Operational Item -- -- 1.1 1.1 Non-recurring Items 2.7 0.1 0.8 0.9 Management Salaries -- -- 1.3 1.0 CF Headquarters Costs 2.3 2.1 3.3 3.9 Other (1.7) (0.6) (0.3) (0.2) Total Adjustments € 3 . 3 € 7 . 4 € 6 . 6 € 6 . 5 Adjusted EBITDA € 85 . 8 € 100 . 7 € 106 . 6 € 109 . 4 Note: The financial data presented above has not been audited.


