Exhibit 99.1
MULTI-COLOR AND PRO FORMA COMBINEDNON-GAAP FINANCIAL MEASURES
This offering memorandum contains financial information with respect to Multi-Color, on a consolidated basis, Constantia Labels, on a combined basis and Multi-Color and Constantia Labels together on a combined basis. Certain of this information is not presented in accordance with US GAAP, such as Multi-Color EBITDA, Multi-Color Adjusted EBITDA, Multi-Color Adjusted EBITDA margin, Pro Forma Combined EBITDA, Pro Forma Combined Adjusted EBITDA-pre-synergies, Pro Forma Combined Adjusted EBITDA-post-synergies, Ratio of Net Secured Debt/Pro Forma Combined Adjusted EBITDA-post-synergies, Ratio of Total Net Debt/Pro Forma Combined Adjusted EBITDA-post synergies (collectively,“Non-GAAP Measures”), none of which is a measurement of financial performance under US GAAP.
We present theNon-GAAP Measures because they, along with our US GAAP results, are measures management uses to assess financial performance. We also believe that such measures provide investors with alternative methods for assessing our operating results in a manner that enables them to more thoroughly evaluate our performance. While providing useful information, theNon-GAAP Measures should not be considered in isolation or as a substitute for consolidated statements of operations or cash flows prepared in accordance with US GAAP and should not be construed as an indication of our operating performance or as a measure of liquidity. TheNon-GAAP Measures may have material limitations as performance measures and analytical tools because they exclude items that are necessary elements of our costs and operations. In addition, certain of theNon-GAAP Measures, including “Adjusted EBITDA” and “EBITDA”, may not be comparable to other similarly titled measures of other companies because each company may define these measures differently, limiting their usefulness as comparative measures.
For a description of how we define EBITDA and Adjusted EBITDA, how these measures are calculated from net income and a reconciliation of Multi-Color EBITDA and Multi-Color Adjusted EBITDA, see Note 2 under “Summary Historical Consolidated Financial Information and Other Data for Multi-Color Corporation” and, with respect to the combined business, for how Pro Forma Combined EBITDA and Pro Forma Combined Adjusted EBITDA are reconciled to pro forma net income, see Note 3 under “Summary Unaudited Pro Forma Combined Financial Data.”
The SEC has adopted rules to regulate the use in filings with the SEC and public disclosures and press releases ofnon-GAAP financial measures, such as EBITDA and Adjusted EBITDA, that are derived on the basis of methodologies other than in accordance with US GAAP.
These rules require, among other things:
| | • | | a presentation with equal or greater prominence of the most comparable financial measure or measures calculated and presented in accordance with US GAAP; and |
| | • | | a statement disclosing the purposes for which our management uses thenon-GAAP financial measure. |
The rules prohibit, among other things:
| | • | | exclusion of charges or liabilities that require cash settlement or would have required cash settlement absent an ability to settle in another manner, fromnon-GAAP liquidity measures; |
| | • | | adjustment of anon-GAAP performance measure to eliminate or smooth items identified as nonrecurring, infrequent or unusual, when the nature of the charge or gain is such that it is reasonably likely to recur; and |
| | • | | presentation ofnon-GAAP financial measures on the face of any financial information. |
NON-IFRS FINANCIAL MEASURES
This offering memorandum contains financial information with respect to Constantia Labels that is not presented in accordance with IFRS, such as Constantia Labels EBITDA and Constantia Labels Adjusted EBITDA (collectively,“Non-IFRS Measures”), none of which is a measurement of financial performance under IFRS.
Constantia Labels presents theNon-IFRS Measures because they, along with its IFRS results, are measures that Constantia Labels’ management uses to assess financial performance. Constantia Labels’ management believes that theNon-IFRS Measures provide investors with alternative methods for assessing Constantia Labels’ operating results in a manner that enables them to more thoroughly evaluate Constantia Labels’ performance. TheNon-IFRS Measures are provided to give investors access to the types of measures that Constantia Labels’ management uses in analyzing its results. While providing useful information, theNon-IFRS Measures should not be considered in isolation or as a substitute for consolidated statements of operations or cash flows prepared in accordance with IFRS and should not be construed as an indication of Constantia Labels’ operating performance or as a measure of liquidity. TheNon-IFRS Measures may have material limitations as performance measures and analytical tools because they exclude items that are necessary elements of Constantia Labels’ costs and operations. In addition, certain measures, including “Adjusted EBITDA” and “EBITDA” may not be comparable to other similarly titled measures of other companies because each company may define measures differently, limiting their usefulness as comparative measures.
For a description of how Constantia Labels defines Constantia Labels EBITDA and Constantia Labels Adjusted EBITDA and how these measures are calculated from Constantia Labels’ net income and a reconciliation of Constantia Labels EBITDA and Constantia Labels Adjusted EBITDA, see Note 2 under “Summary Historical Consolidated Financial Information and Other Data for Constantia Labels.”
The SEC has adopted rules to regulate the use in filings with the SEC and public disclosures and press releases ofnon-IFRS financial measures, such as EBITDA and Adjusted EBITDA, that are derived on the basis of methodologies other than in accordance with IFRS.
These rules require, among other things:
| | • | | a presentation with equal or greater prominence of the most comparable financial measure or measures calculated and presented in accordance with IFRS; and |
| | • | | a statement disclosing the purposes for which management uses thenon-IFRS financial measure. |
The rules prohibit, among other things:
| | • | | exclusion of charges or liabilities that require cash settlement or would have required cash settlement absent an ability to settle in another manner, fromnon-IFRS liquidity measures; |
| | • | | adjustment of anon-IFRS performance measure to eliminate or smooth items identified as nonrecurring, infrequent or unusual, when the nature of the charge or gain is such that it is reasonably likely to recur; and |
| | • | | presentation ofnon-IFRS financial measures on the face of any financial information. |
TheNon-IFRS Measures presented in this offering memorandum may not comply with these rules.
The Combination of Multi-Color and Constantia Labels
Multi-Color Corporation is a leading global provider of label solutions supporting a number of the world’s most prominent brands, including leading producers of wine & spirit, home & personal care, food & beverage, healthcare and specialty consumer products. We manufacture our products in 46 facilities located in 20 countries across North America, South America, Europe, Australia, South Africa and Asia. We have approximately 5,500 employees and serve over 4,000 customers globally. We believe we have established ourselves as a leader in most of our major product lines, with the ability to service customers on a global basis. For the twelve months ended June 30, 2017, Multi-Color generated net revenues and Adjusted EBITDA of approximately $929.2 million and $163.0 million, respectively. The Company’s shares are publicly traded on the NASDAQ Global Select Market (LABL) with a current equity market capitalization of approximately $1.4 billion.
On July 16, 2017, Multi-Color entered into a Sale and Purchase Agreement (as amended, the “Purchase Agreement”) with Constantia Flexibles Germany GmbH and certain of its affiliates pursuant to which Multi-Color agreed to purchase the Labels Division of Constantia Flexibles (“Constantia Labels”) in exchange for cash and shares of Multi-Color having a combined value of approximately $1.3 billion (the “Constantia Labels Acquisition”). Constantia Labels is a global leader in innovative label solutions serving the food, beverage and consumer packaged goods end markets, with leading positions in beer and in-mold labels. For the twelve months ended June 30, 2017, Constantia Labels generated net revenues and Adjusted EBITDA of approximately €617.4 million and €109.4 million, respectively.
For the twelve months ended June 30, 2017, on a pro forma basis after giving effect to the Constantia Labels Acquisition, the Combined Company generated net revenues of approximately $1,602.3 million and Adjusted EBITDA of $300.0 million, inclusive of $15 million of identified run-rate cost synergies.
Combination Rationale
We believe the Constantia Labels Acquisition will create a company with significant scale and geographic, end-market, customer, and product diversification. The combined operations provide a competitive advantage within the label industry, creating a “best in class” global label platform being #1 in food & beverage , #1 in wine & spirit, #2 in home & personal care and an emerging global role in healthcare. We believe that the combined operations will provide increased opportunities in these markets as we leverage Multi-Color’s strong home & personal care customer relationships in North America with Constantia Labels’ European operational
footprint and assets. In addition, we believe we can leverage Constantia’s strong food & beverage customer relationships with Multi-Color’s North American operational footprint and assets in order to accelerate growth opportunities for the Combined Company. The stronger combined footprint in Asia will provide additional opportunities to achieve further revenue synergies. Combining the two companies will allow an increased and more geographically diverse customer base over which our products are currently sold, increasing our end-market share. After giving effect to the Constantia Labels Acquisition, we will have more than 8,000 employees across 69 facilities in 23 countries. Our end-markets will be significantly diversified with no end-market segment representing more than 26% of our pro forma combined net revenues. In addition, the end-markets which the Combined Company will serve, including home & personal care, wine & spirit, food & beverage, and healthcare, encompass a breadth of sectors that have historically been resistant to recessions. The existing customer base of Multi-Color and Constantia Labels are highly complementary and have minimal overlap, and as such we believe the Constantia Labels Acquisition will allow for cross selling opportunities to existing customers.
Increased End Market Diversification
The Constantia Labels Acquisition will significantly increase our end market diversification by bringing together the #1 player in food & beverage, the #1 player in wine & spirits and the #2 player in home and personal care. The transaction will significantly increase our exposure to the stable food & beverage end market which we believe represents approximately 65% of the world label volume including alcoholic beverage.
Net Revenue by End Market for Twelve Months Ended June 30, 2017
| | | | |
Multi-Color Corporation | | Constantia Labels | | Combined Company |
| | 
| | 
|
Geographic Platform Expansion Enhances Ability to Service Customers
We believe that our expanded global platform will increase our geographic diversity, providing benefits to our customers. The Constantia Labels Acquisition broadens the Company’s scale and geographic reach to 69 manufacturing facilities in 23 countries across North America, Europe, South Africa and the Asia Pacific region. This allows us to broaden our support to our current global customers and provides us with an opportunity to serve new customers in new geographic markets. For the twelve months ended June 30, 2017, approximately 63% of Multi-Color’s net revenues were derived from the Americas. After the Constantia Labels Acquisition, net revenues derived from the Americas will be reduced to 51% of the Company’s pro forma net revenues. The Combined Company will also have an increased presence in the anticipated high growth Middle East and Africa regions.
Net Revenue by Geography for Twelve Months Ended June 30, 2017
| | | | |
Multi-Color Corporation | | Constantia Labels | | Combined Company |
| |  | |  |
Combined Global Footprint
Increased Scale and Diversification within Product Offerings
We believe the Combined Company will be the market leader in in-mold labels after combining Multi-Color’s #1 position in blow molded labels in North America with Constantia Label’s #1 position in injection molded labels in Europe. Aluminum will be a new product offering for Multi-Color as a result of the Constantia Labels Acquisition. Our expanded product portfolio will allow us to better serve a breadth of end markets, enhancing our value proposition with existing customers and creating opportunities with new customers.
Net Revenue by Product Offering for Twelve Months Ended June 30, 2017
| | | | |
Multi-Color Corporation | | Constantia Labels | | Combined Company |
| | 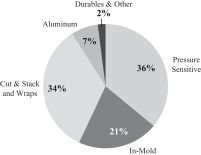
| | 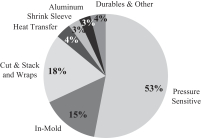
|
Technological Enhancements
The Constantia Labels Acquisition will provide Multi-Color with access to high value technologies, including access to Constantia Label’s proprietary Spear seal process, its proprietary engineering for pressure sensitive label products, and its proprietary engineering for in-mold label products. We believe that the expanded use of high value technologies in combination with our scale will drive innovation and lead to improved product offerings and margins over time.
Enhanced Leadership Team
We expect that Constantia Labels Acquisition will provide us with added depth in our leadership team. It is expected that Mike Henry, Executive Vice President of Constantia Labels, will become Multi-Color’s Chief Executive Officer in January 2018. With more than 18 years of experience in the label industry, Mr. Henry brings a wealth of knowledge and experience to Multi-Color. We believe the combination of two strong and complementary management teams will allow us to combine and continue the growth of the Company.
Synergy Potential
We believe the Constantia Labels Acquisition will result in approximately $15 million of net run-rate cost synergies on an annual basis, which we expect will be realized through cost consolidations and selling, general and administrative expense rationalizations.
| | • | | We believe we will be able to save an estimated $16 million or 2% of acquired revenues from a combination of purchasing synergies, including having access to Constantia Labels’ pressure sensitive label coating capability in North America and Europe which provide lower cost pressure sensitive label substrates that will drive synergy savings for Multi-Color, operating synergies and plant consolidations. |
| | • | | We believe we will be able to leverage SG&A and create an additional $2 million in value from eliminating duplicate functions. |
| | • | | Additionally, we expect to incur an estimated $3 million of additional costs annually related to increased accounting fees, anticipated corporate overhead expenses, and additional compliance and internal audit expenses. |
It is expected that synergies will be phased in evenly over time and will be realized on an annual basis by the end of fiscal year 2020.
Summary Unaudited Pro Forma Combined Financial Data
The following summary unaudited pro forma combined financial information gives effect to the Transactions. The unaudited pro forma combined statements of operations for the period ended June 30, 2017 reflect the Transactions as if they had occurred on April 1, 2016. The unaudited pro forma combined balance sheet as of June 30, 2017 reflects the Transactions as if they had occurred on June 30, 2017. The pro forma adjustments are based on the information available at the time of the preparation of this offering memorandum.
The summary unaudited pro forma combined financial information that follows is presented for informational purposes only and is not intended to represent or be indicative of the consolidated results of operations or financial position that would have been reported had the Transactions been completed as of April 1, 2016 (with respect to the statement of operations data), or as of June 30, 2017 (with respect to balance sheet data), and should not be taken as representative of the future consolidated results of operations or financial position of the Combined Company. In connection with the summary unaudited pro forma combined financial information, we allocated the preliminary purchase price for the Constantia Labels Acquisition to the acquired assets and liabilities based upon their estimated fair value. These estimates are based on financial information available at the time of the preparation of this offering memorandum. Based on the timing of the closing of the Transactions and other factors, we cannot assure you that the actual adjustments will not differ materially from the pro forma adjustments reflected in the summary unaudited pro forma combined financial information. It is expected that, following the consummation of the Transactions, the Combined Company will incur non-recurring expenses associated with the Transactions and integration of the operations of the two companies. These expenses and integration costs are not reflected in this summary unaudited pro forma combined financial information. Except where specified below, the summary unaudited pro forma combined financial information also does not give effect to the potential impact of any anticipated synergies, operating efficiencies or cost savings that may result from the Transactions.
| | | | |
| | | Unaudited Pro
Forma
Twelve Months
Ended
June 30, 2017
($ in millions) | |
Combined statement of operations (1) | | | | |
Net revenue | | $ | 1,602.3 | |
Cost of revenues | | | 1,282.6 | |
| | | | |
Gross Profit | | | 319.7 | |
Selling and administrative expenses | | | 164.5 | |
Facility closure expenses | | | 0.8 | |
| | | | |
Operating Income | | | 154.3 | |
Interest expense | | | 82.1 | |
Other expense (income), net | | | (5.5 | ) |
| | | | |
Income before income taxes | | | 77.7 | |
Income tax expense | | | 14.5 | |
| | | | |
Net Income, inclusive of non-controlling interests | | | 63.2 | |
Less net income attributable to non-controlling interests | | | 0.4 | |
| | | | |
Net income | | $ | 62.8 | |
| | | | |
| |
Certain Balance Sheet Data | | | | |
Cash and cash equivalents (2) | | $ | 70.9 | |
Accounts receivable, net of allowance | | | 275.1 | |
Inventory, net | | | 167.4 | |
Property, plant and equipment | | | 466.2 | |
Total assets | | | 2,791.8 | |
Secured debt, excluding unamortized debt issuance costs (4) | | | 920.6 | |
Total debt, excluding unamortized debt issuance costs (4) | | | 1,650.6 | |
Total shareholder’s equity | | | 617.8 | |
| | | | |
| | | Unaudited Pro
Forma
Twelve Months
Ended
June 30, 2017
($ in millions) | |
| |
Financial and Other Data | | | | |
Pro Forma Combined EBITDA (3) | | $ | 271.6 | |
Pro Forma Combined Adjusted EBITDA-pre-synergies (3) | | | 285.0 | |
Pro Forma Combined Adjusted EBITDA-post-synergies (3) | | | 300.0 | |
Ratio of Net Secured Debt/Pro Forma Combined Adjusted EBITDA-post synergies (4) | | | 2.8x | |
Ratio of Total Net Debt/Pro Forma Combined Adjusted EBITDA-post synergies (4) | | | 5.3x | |
| (1) | Numbers may not foot due to rounding. |
| (2) | The cash consideration payable to the Sellers pursuant to the Purchase Agreement remains subject to closing adjustments as outlined in the Purchase Agreement. Actual cash transferred by Multi-Color will be subject to the final closing adjustment calculations as well as the Euro to U.S. dollar exchange rate, which could have material impact on these unaudited pro forma combined financial statements. In addition, the net cash position will be impacted by the currency forward entered into by the Company to hedge the transfer of Euro on the closing date. |
| (3) | We define “Pro Forma Combined EBITDA” for the periods presented above as earnings before interest, taxes, depreciation and amortization after giving effect to the Transactions. Pro Forma Combined EBITDA does not represent, and should not be considered as, an alternative to net income or cash flows from operating activities, each as determined in accordance with US GAAP. We define “Pro Forma Combined Adjusted EBITDA-pre-synergies” for the periods presented above as Pro Forma Combined EBITDA adjusted for stock-based compensation expense, integration expenses, acquisition-related expenses, purchase accounting adjustments for inventory, non-cash goodwill and asset impairments, plant consolidation expenses and other non-cash items we determine to be non-recurring, unusual or outside the normal scope of operations, but not adjusted for any synergies related to the Transactions. We define “Pro Forma Combined Adjusted EBITDA-post-synergies” as “Pro Forma Combined Adjusted EBITDA-pre-synergies” adjusted to reflect $15 million of expected synergies related to the Transactions. We have presented Pro Forma Combined EBITDA; Pro Forma Combined Adjusted EBITDA-pre-synergies and Pro Forma Combined Adjusted EBITDA-post-synergies in this offering memorandum because we believe they are useful financial measurements for assessing operating performance as they provide investors with additional bases to evaluate our performance. In addition, we use these metrics to further our understanding of our historical and prospective consolidated operating performance. In addition, we use Pro Forma Combined Adjusted EBITDA-pre-synergies and Pro Forma Combined Adjusted EBITDA-post-synergies to evaluate the ordinary course of our operations, before certain selected items, even though those items may be recurring, because we believe to effectively compare our core operating performance from period to period on a historical and prospective basis, this metric should exclude items relating to acquisitions, integration and plant consolidation, and other selected items incurred outside the ordinary course of our operations. Other companies may calculate Pro Forma Combined EBITDA; Pro Forma Combined Adjusted EBITDA-pre-synergies and Pro Forma Combined Adjusted EBITDA-post-synergies differently than we do. Pro Forma Combined EBITDA; Pro Forma Combined Adjusted EBITDA-pre-synergies and Pro Forma Combined Adjusted EBITDA-post-synergies are not measures of performance under US GAAP and should not be considered as a substitute for our net income prepared in accordance with US GAAP. Pro Forma Combined EBITDA; Pro Forma Combined Adjusted EBITDA-pre-synergies and Pro Forma Combined Adjusted EBITDA-post-synergies have limitations as analytical tools, and you should not consider them in isolation or as a substitute for analysis of our results as reported under US GAAP. Some of these limitations are: Pro Forma Combined EBITDA; Pro Forma Combined Adjusted EBITDA-pre-synergies and Pro Forma Combined Adjusted EBITDA-post-synergies do not reflect our cash expenditures, or future requirements, for capital expenditures or contractual commitments; Pro Forma Combined EBITDA; Pro Forma Combined Adjusted EBITDA-pre-synergies and Pro Forma Combined Adjusted EBITDA-post-synergies do not reflect interest expense or the cash requirements necessary to service interest or principal payments on our debt; Pro Forma Combined EBITDA; Pro Forma Combined Adjusted EBITDA-pre-synergies and Pro Forma |
| | Combined Adjusted EBITDA-post-synergies do not reflect income tax expense or the cash requirements necessary to pay for income tax obligations; and although depreciation and amortization are non-cash charges, the assets being depreciated and amortized will often have to be replaced in the future, and Pro Forma Combined EBITDA; Pro Forma Combined Adjusted EBITDA-pre-synergies and Pro Forma Combined Adjusted EBITDA-post-synergies do not reflect any cash requirements for such replacements. In addition, in evaluating Pro Forma Combined Adjusted EBITDA-pre-synergies and Pro Forma Combined Adjusted EBITDA-post-synergies you should be aware that in the future we may incur expenses that are the same as or similar to some of the adjustments in this presentation. Our presentation of Pro Forma Combined Adjusted EBITDA-pre-synergies and Pro Forma Combined Adjusted EBITDA-post-synergies should not be construed as an inference that our future results will not be unaffected by unusual or non-recurring items. |
The following table sets forth the reconciliation of net income to Pro Forma Combined EBITDA and Pro Forma Combined Adjusted EBITDA-pre-synergies and Pro Forma Combined Adjusted EBITDA-post-synergies for the twelve months ended June 30, 2017:
| | | | |
(Dollars in millions) | | Twelve Months
Ended
June 30, 2017 | |
Net income | | $ | 63.2 | |
Income tax expense | | | 14.5 | |
Interest expense | | | 82.1 | |
Depreciation | | | 71.7 | |
Amortization | | | 40.1 | |
Pro Forma Combined EBITDA | | | 271.6 | |
Acquisitions/Divestitures (4) | | $ | 0.9 | |
Stock-Based Compensation | | | 3.0 | |
Acquisition Costs and Expenses | | | 1.8 | |
Plant Closure Expenses | | | 0.1 | |
Capitalized Labor (b) | | | (0.5 | ) |
Standalone Adjustments (c) | | | 0.7 | |
Mexico – Operational Items (d) | | | 1.2 | |
Non-recurring Items (e) | | | 1.0 | |
Management Salaries (f) | | | 1.1 | |
CF Headquarters costs (g) | | | 4.3 | |
Other (h) | | | (0.2 | ) |
| | | | |
Total Adjustments | | $ | 13.4 | |
Pro Forma Combined Adjusted EBITDA-pre-synergies | | $ | 285.0 | |
Estimated Constantia Labels Acquisition Synergies | | | 15.0 | |
| | | | |
Pro Forma Combined Adjusted EBITDA-post-synergies | | $ | 300.0 | |
| | | | |
| | (a) | Pro Forma EBITDA adjusted to give pro forma effect to acquisitions and divestitures. |
| | (b) | Elimination of capitalized salaries. |
| | (c) | Add backs related to items that would not remain as a standalone entity including half-year audits, IT services, holding costs and trading margin. |
| | (d) | Extraordinary waste costs caused by complications with outsourced digital printing in Mexico during the fiscal year ended December 31, 2016. Outsourcing will not be necessary going forward. |
| | (e) | Non-recurring items including restructuring and severance costs, written-off receivables, down-time and costs related to fire damage, financial costs and consulting fees. |
| | (f) | The management team (former owners) was replaced by a new manager; add-back reflects the change in compensation for the new manager. |
| | (g) | Fee charged by Constantia to Constantia Labels for the Constantia corporate headquarter expenses. |
| | (h) | Includes the reclassification of factoring fees to interest expense, gain from sale of fixed assets, and the release of provisions for bad debt. |
| (4) | We define secured debt as total debt that is secured by a lien on our assets. Net Secured Debt and Total Net Debt are defined as total secured debt and total debt, respectively, less cash and cash equivalents after giving pro forma effect to the Transactions. |
Summary Historical Consolidated Financial Information and Other Data for Constantia Labels
The following summary historical consolidated financial information and other data of Constantia Labels, prepared in accordance with IFRS, as of December 31, 2016 and 2015, and for the years ended December 31, 2016 and 2015, have been derived from and should be read together with the audited consolidated combined financial statements and related notes included elsewhere in this offering memorandum. The following summary historical consolidated combined financial information and other data as of June 30, 2017 and for the six months ended June 30, 2017 and 2016 and at June 30, 2017 have been derived from and should be read together with the unaudited consolidated financial statements and related notes included elsewhere in this offering memorandum. The following summary historical consolidated financial information and other data presented for the twelve months ended June 30, 2017, has been derived by taking the amounts from the historical audited consolidated financial statements for the year ended December 31, 2016, subtracting the amounts from the historical unaudited consolidated financial statements for the six months ended June 30, 2016, and adding the amounts from the historical unaudited consolidated financial statements for the six months ended June 30, 2017. The financial statements for Constantia Labels for the fiscal year ended December 31, 2014 are not included in this offering memorandum and, pursuant to a waiver provided by the SEC dated September 1, 2017 with respect to the requirements of Rule 3-05 of Regulation S-X, will not be filed with the SEC on a Current Report on Form 8-K.
The summary historical consolidated financial information and other data for Constantia Labels are not necessarily indicative of future performance. The financial information and data provided in this table are only a summary, do not provide all of the information or data contained in our financial statements.
| | | | | | | | | | | | | | | | | | | | |
| | | Fiscal Year Ended | | | Six Months Ended | | | Twelve
Months
Ended | |
(Euro in millions) (1) | | Dec. 31,
2015 | | | Dec. 31,
2016 | | | June 30,
2016 | | | June 30,
2017 | | | June 30,
2017 | |
Net revenues | | € | 540.8 | | | € | 604.7 | | | € | 304.5 | | | € | 317.3 | | | € | 617.4 | |
Cost of revenues | | | (439.8 | ) | | | (493.7 | ) | | | (244.6 | ) | | | (253.2 | ) | | | (502.3 | ) |
| | | | | | | | | | | | | | | | | | | | |
Gross profit | | | 101.1 | | | | 111.0 | | | | 59.9 | | | | 64.1 | | | | 115.1 | |
Selling, general and administrative expenses and other | | | 48.6 | | | | 55.0 | | | | 28.2 | | | | 30.8 | | | | 57.6 | |
| | | | | | | | | | | | | | | | | | | | |
Operating income | | | 52.4 | | | | 56.0 | | | | 31.7 | | | | 33.3 | | | | 57.5 | |
Interest expense | | | 16.8 | | | | 19.3 | | | | 9.2 | | | | 10.4 | | | | 20.5 | |
Other income (expense), net | | | 0.7 | | | | (2.0 | ) | | | (0.4 | ) | | | 5.7 | | | | 4.2 | |
| | | | | | | | | | | | | | | | | | | | |
Income before income taxes | | | 36.4 | | | | 34.7 | | | | 22.2 | | | | 28.6 | | | | 41.2 | |
Income tax expense | | | 9.8 | | | | 4.1 | | | | 7.5 | | | | 9.2 | | | | 5.8 | |
| | | | | | | | | | | | | | | | | | | | |
Net income | | € | 26.6 | | | € | 30.6 | | | € | 14.7 | | | € | 19.4 | | | € | 35.3 | |
| | | | | | | | | | | | | | | | | | | | |
Net income attributable to Owners of the Company | | € | 18.0 | | | € | 23.2 | | | € | 10.7 | | | € | 14.7 | | | € | 27.2 | |
| | | | | | | | | | | | | | | | | | | | |
Balance sheet data: | | | | | | | | | | | | | | | | | | | | |
Cash and cash equivalents | | € | 10.4 | | | € | 23.6 | | | | | | | € | 23.9 | | | € | 23.9 | |
Net Working capital | | | (64.1 | ) | | | (27.7 | ) | | | | | | | (13.9 | ) | | | (13.9 | ) |
Total assets | | | 645.6 | | | | 692.4 | | | | | | | | 684.2 | | | | 684.2 | |
Total debt | | | 112.6 | | | | 144.2 | | | | | | | | 135.0 | | | | 135.0 | |
Stockholders’ equity (2) | | | 111.1 | | | | 125.4 | | | | | | | | 130.3 | | | | 130.3 | |
| | | | | |
Cash flow data: | | | | | | | | | | | | | | | | | | | | |
Net cash provided by operating activities | | € | 73.9 | | | € | 62.8 | | | € | 23.4 | | | € | 20.1 | | | € | 59.5 | |
Net cash used in investing activities | | | (49.8 | ) | | | (60.8 | ) | | | (44.5 | ) | | | (8.7 | ) | | | (25.0 | ) |
Net cash provided by/(used in) financing activities | | | (19.0 | ) | | | 11.0 | | | | 33.8 | | | | (10.7 | ) | | | (33.5 | ) |
Capital expenditures | | | (33.2 | ) | | | (38.0 | ) | | | (19.4 | ) | | | (13.2 | ) | | | (31.8 | ) |
| | | | | | | | | | | | | | | | | | | | |
| | | Fiscal Year Ended | | | Six Months Ended | | | Twelve
Months
Ended | |
(Euro in millions) (1) | | Dec. 31,
2015 | | | Dec. 31,
2016 | | | June 30,
2016 | | | June 30,
2017 | | | June 30,
2017 | |
| | | | | |
Other financial data: | | | | | | | | | | | | | | | | | | | | |
EBITDA (3) | | € | 91.7 | | | € | 100.0 | | | € | 52.8 | | | € | 55.7 | | | € | 103.0 | |
Adjusted EBITDA (3) | | | 99.1 | | | | 106.6 | | | | 55.7 | | | | 58.4 | | | | 109.4 | |
Adjusted EBITDA margin (4) | | | 18.3 | % | | | 17.6 | % | | | 18.3 | % | | | 18.4 | % | | | 17.7 | % |
| (1) | Numbers may not foot due to rounding. |
| (2) | The number used to report stockholders’ equity is the same as the total invested equity attributable to Constantia Labels. |
| (3) | We define “EBITDA” for the periods presented above as earnings before interest, taxes, depreciation and amortization. EBITDA does not represent, and should not be considered as, an alternative to net income or cash flows from operating activities, each as determined in accordance with GAAP or IFRS. We define “Adjusted EBITDA” for the periods presented above as EBITDA adjusted for stock-based compensation expense, integration expenses, acquisition-related expenses, purchase accounting adjustments for inventory, non-cash goodwill and asset impairments, plant consolidation expenses and other non-cash items we determine to be non-recurring, unusual or outside the normal scope of operations. We have presented EBITDA and Adjusted EBITDA in this offering memorandum because we believe they are useful financial measurements for assessing operating performance as they provide investors with additional bases to evaluate our performance. In addition, we use these metrics to further our understanding of our historical and prospective consolidated operating performance. In addition, we use Adjusted EBITDA to evaluate the ordinary course of our operations, before certain selected items, even though those items may be recurring, because we believe to effectively compare our core operating performance from period to period on a historical and prospective basis, this metric should exclude items relating to acquisitions, integration and plant consolidation, and other selected items incurred outside the ordinary course of our operations. Other companies may calculate EBITDA and Adjusted EBITDA differently than we do. EBITDA and Adjusted EBITDA are not measures of performance under GAAP or IFRS and should not be considered as a substitute for our net income prepared in accordance with GAAP or IFRS. EBITDA and Adjusted EBITDA have limitations as analytical tools, and you should not consider them in isolation or as a substitute for analysis of our results as reported under GAAP or IFRS. Some of these limitations are: EBITDA and Adjusted EBITDA do not reflect our cash expenditures, or future requirements, for capital expenditures or contractual commitments; EBITDA and Adjusted EBITDA do not reflect interest expense or the cash requirements necessary to service interest or principal payments on our debt; EBITDA and Adjusted EBITDA do not reflect income tax expense or the cash requirements necessary to pay for income tax obligations; and although depreciation and amortization are non-cash charges, the assets being depreciated and amortized will often have to be replaced in the future, and EBITDA and Adjusted EBITDA do not reflect any cash requirements for such replacements. In addition, in evaluating Adjusted EBITDA you should be aware that in the future we may incur expenses that are the same as or similar to some of the adjustments in this presentation. Our presentation of Adjusted EBITDA should not be construed as an inference that our future results will not be unaffected by unusual or non-recurring items. |
The following table sets forth the reconciliation of net income to EBITDA and Adjusted EBITDA for the periods indicated:
| | | | | | | | | | | | | | | | | | | | |
| | | Fiscal Year Ended | | | Six Months Ended | | | Twelve Months
Ended | |
| | | | |
(Euro in millions) (a) | | Dec. 31,
2015 | | | Dec. 31,
2016 | | | June 30,
2016 | | | June 30,
2017 | | | June 30,
2017 | |
Net income, as reported | | € | 26.6 | | | € | 30.6 | | | € | 14.7 | | | € | 19.4 | | | € | 35.3 | |
Interest expense, net | | | 16.0 | | | | 21.3 | | | | 9.6 | | | | 4.7 | | | | 16.4 | |
Income tax expense | | | 9.8 | | | | 4.1 | | | | 7.5 | | | | 9.2 | | | | 5.8 | |
Depreciation & Amortization | | | 39.4 | | | | 44.0 | | | | 21.0 | | | | 22.4 | | | | 45.5 | |
| | | | | | | | | | | | | | | | | | | | |
EBITDA | | € | 91.7 | | | € | 100.0 | | | € | 52.8 | | | € | 55.7 | | | € | 103.0 | |
| | | | | |
Acquisitions/Divestitures EBITDA (b) | | € | 5.8 | | | € | 0.2 | | | € | 0.7 | | | € | 0.0 | | | € | (0.5 | ) |
Capitalized Labor (c) | | | (0.4 | ) | | | (0.4 | ) | | | (0.2 | ) | | | (0.2 | ) | | | (0.4 | ) |
Standalone Adjustments (d) | | | 0.4 | | | | 0.7 | | | | 0.2 | | | | 0.2 | | | | 0.7 | |
Mexico—Operational Item (e) | | | — | | | | 1.1 | | | | 0.0 | | | | 0.0 | | | | 1.1 | |
Non-Recurring Items (f) | | | 0.1 | | | | 0.8 | | | | 0.1 | | | | 0.2 | | | | 0.9 | |
Management Salaries (g) | | | — | | | | 1.3 | | | | 0.7 | | | | 0.4 | | | | 1.0 | |
CF Headquarters Costs (h) | | | 2.1 | | | | 3.3 | | | | 1.5 | | | | 2.2 | | | | 3.9 | |
Other (i) | | | (0.6 | ) | | | (0.3 | ) | | | (0.1 | ) | | | (0.1 | ) | | | (0.2 | ) |
| | | | | | | | | | | | | | | | | | | | |
Adjustments | | | 7.4 | | | | 6.6 | | | | 3.0 | | | | 2.7 | | | | 6.5 | |
| | | | | | | | | | | | | | | | | | | | |
Adjusted EBITDA | | € | 99.1 | | | € | 106.6 | | | € | 55.7 | | | € | 58.4 | | | € | 109.4 | |
| | | | | | | | | | | | | | | | | | | | |
| | (a) | Numbers may not foot due to rounding. |
| | (b) | EBITDA adjusted to give pro forma effect to the Pemara and Afripack Labels acquisitions made during the fiscal year ended December 31, 2015 (pro forma adjustments not available for the fiscal year ended December 31, 2014) and the closing of Printer Labels during the fiscal year ended December 31, 2016. |
| | (c) | Elimination of capitalized salaries (amount not assumed the same across all periods). |
| | (d) | Add backs related to items that would not remain as a standalone entity including half-year audits, IT services, holding costs and trading margin. |
| | (e) | Extraordinary waste costs caused by complications with outsourced digital printing in Mexico in during the fiscal year ended December 31, 2016. Outsourcing will not be necessary going forward. |
| | (f) | Non-recurring items including restructuring and severance costs, written-off receivables, down-time and costs related to a fire damage, financial products and consulting fees. |
| | (g) | The management team (former owners) was replaced by a new manager; add-back reflects the change in compensation for the new manager. |
| | (h) | Fee charged by Constantia to Constantia Labels for the Constantia corporate headquarters. |
| | (i) | Includes the reclassification of factoring fees to interest expense, gain from sale of fixed assets, and the release of provisions for bad debt. |
| (4) | We define Adjusted EBITDA margin as Adjusted EBITDA as a percentage of Net revenues. |
UNAUDITED PRO FORMA COMBINED FINANCIAL INFORMATION
(Dollar amounts presented in thousands, except per share amounts)
On July 16, 2017, Multi-Color Corporation, (“MCC” or the “Company”) entered into a Sale and Purchase Agreement (the “Purchase Agreement”) with Constantia Flexibles Holdings GmbH and its subsidiaries (“Constantia”) to purchase the Labels Division of Constantia (the “Acquisition”), with the Acquisition to be effected through the acquisition by the Company of certain of the issued and outstanding capital stock of Constantia’s subsidiaries and certain specified assets of other Constantia subsidiaries. The aggregate consideration to be paid by the Company to the Sellers is approximately $1.3 billion (€1.15 billion) (the “Purchase Price”), payable in cash and approximately 3.4 million shares of the Company’s common stock (based on a price of €65.40 and which shall not exceed 19.9% of the Company’s current stock outstanding). The cash portion of the Purchase Price is subject to adjustments based on matters such as working capital and indebtedness balances at the time of closing.
In connection with the Constantia Labels Acquisition, the Company intends to (i) enter into (A) a $250 million senior secured term loan A facility (the “TLA Facility”), (B) a $400 million senior secured term loan B facility (the “TLB Facility”) and (C) a $400 million senior secured revolving facility (the “Revolving Facility”, and collectively with the TLA Facility and the TLB Facility, the “Senior Secured Credit Facilities”), which Senior Secured Credit Facilities will be secured on a first priority basis by substantially all of the Company’s assets, and (ii) issue the $480 million senior unsecured notes offered hereby.
The unaudited pro forma combined financial information is presented to illustrate the effects of the Acquisition by the Company and the related financing transactions including the Commitment Letter and this Offering Memorandum (collectively, the “Transaction”).
The unaudited pro forma combined balance sheet as of June 30, 2017 and the unaudited pro forma combined statements of income for the year ended March 31, 2017, and the twelve months ended June 30, 2017 are based upon, derived from and should be read in conjunction with the historical audited consolidated financial statements of the Company for the year ended March 31, 2017, the historical unaudited condensed consolidated financial statements of the Company for the three-month period ended June 30, 2017, and the combined financial statements of Constantia Labels.
The Company prepares its financial information in accordance with accounting principles generally accepted in the United States (“US GAAP”) with all amounts stated in U.S. dollars. Constantia Labels prepared its financial information in accordance with International Financial Reporting Standards (“IFRS”) as issued by the International Accounting Standards Board (“IASB”) with historical amounts presented in Euro.
The unaudited pro forma combined statements of income assume that the Transaction occurred on April 1, 2016, the beginning of our fiscal year ended March 31, 2017. The unaudited pro forma combined balance sheet as of June 30, 2017 assumes that the Transaction occurred on June 30, 2017. The historical combined financial information has been adjusted to give effect to pro forma events that are: (1) directly attributable to the Acquisition, (2) factually supportable, and (3) with respect to the statement of operations are expected to have a continuing impact on the combined results. In the opinion of management, all adjustments necessary to present fairly the unaudited pro forma combined financial information have been made. The assumptions underlying the pro forma adjustments are described fully in the accompanying notes, which should be read in conjunction with the unaudited pro forma combined financial information.
For purposes of the pro forma combined balance sheet, we utilized the unaudited combined balance sheet of Constantia Labels as of June 30, 2017. For purposes of the pro forma combined statement of income for the year ended March 31, 2017, results for Constantia Labels were derived from the audited combined statement of income of Constantia Labels for the year ended December 31, 2016.
For purposes of the pro forma combined statement of income for the twelve months ended June 30, 2017, results for Constantia Labels were derived from the audited combined statement of income for the year
ended December 31, 2016, plus the unaudited combined statement of income for the six months ended June 30, 2017, minus the unaudited combined statement of income for the six months ended June 30, 2016. Results for the Company were derived from the audited consolidated statement of income for the year ended March 31, 2017, plus the unaudited consolidated statement of income for the three months ended June 30, 2017, minus the unaudited consolidated statement of income for the three months ended June 30, 2016.
The unaudited pro forma combined financial information is not necessarily indicative of the combined financial position or results of operations that would have been realized had the Transaction occurred as of the dates indicated, nor is it meant to be indicative of any anticipated combined financial position or future results of operations that the Company will experience after the Transaction. In addition, the accompanying unaudited pro forma combined statements of operations do not include any expected cost savings, operating synergies, or revenue enhancements that may be realized subsequent to the Transaction, or the impact of anynon-recurring activity and transaction-related or integration-related costs.
Unaudited Pro Forma Combined Balance Sheet
As of June 30, 2017
| | | | | | | | | | | | | | | | | | | | | | | | | | | | |
| | | As Reported | | | | | | | | | | | | | | | | |
| (In $ thousands) | | Historical
Multi-Color | | | Historical Labels,
Adjusted for US
GAAP and
Reclassifications
(Footnote 2) | | | Adjustments
for the Labels
Division
Acquisition | | | Footnote
Reference | | | Adjustments
for Financing | | | Footnote
Reference | | | Pro Forma | |
ASSETS | | | | | | | | | | | | | | | | | | | | | | | | | | | | |
Current assets: | | | | | | | | | | | | | | | | | | | | | | | | | | | | |
Cash and cash equivalents | | $ | 25,891 | | | $ | 27,299 | | | $ | (1,057,781 | ) | | | 3 | (a) | | $ | 1,322,340 | | | | 4 | (a) | | $ | 70,862 | |
| | | | | | | | | | | (10,448 | ) | | | 3 | (l) | | | (225,139 | ) | | | 4 | (b) | | | | |
| | | | | | | | | | | (11,300 | ) | | | 3 | (n) | | | | | | | | | | | | |
Accounts receivable, net of allowance | | | 144,759 | | | | 189,262 | | | | (58,910 | ) | | | 3 | (d) | | | — | | | | | | | | 275,111 | |
Other receivables | | | 8,144 | | | | 11,653 | | | | (34 | ) | | | 3 | (d) | | | — | | | | | | | | 19,763 | |
Inventories, net | | | 70,418 | | | | 90,392 | | | | 6,608 | | | | 3 | (f) | | | — | | | | | | | | 167,418 | |
Prepaid expenses | | | 11,507 | | | | 3,286 | | | | — | | | | | | | | — | | | | | | | | 14,793 | |
Other current assets | | | 2,032 | | | | 3,866 | | | | — | | | | | | | | — | | | | | | | | 5,898 | |
| | | | | | | | | | | | | | | | | | | | | | | | | | | | |
Total current assets | | | 262,751 | | | | 325,758 | | | | (1,131,865 | ) | | | | | | | 1,097,201 | | | | | | | | 553,845 | |
Assets held for sale | | | — | | | | — | | | | — | | | | | | | | — | | | | | | | | — | |
Property, plant and equipment, net of accumulated depreciation | | | 256,060 | | | | 210,143 | | | | — | | | | 3 | (g) | | | — | | | | | | | | 466,203 | |
Goodwill | | | 420,406 | | | | 168,143 | | | | (168,143 | ) | | | 3 | (e) | | | — | | | | | | | | 1,155,855 | |
| | | | | | | | | | | 735,449 | | | | 3 | (k) | | | | | | | | | | | | |
Intangible assets, net | | | 170,244 | | | | 56,997 | | | | (56,997 | ) | | | 3 | (e) | | | — | | | | | | | | 580,244 | |
| | | | | | | | | | | 410,000 | | | | 3 | (h) | | | | | | | | | | | | |
Othernon-current assets | | | 5,674 | | | | 16,190 | | | | — | | | | | | | | — | | | | | | | | 21,864 | |
Deferred income tax assets | | | 2,859 | | | | 10,957 | | | | — | | | | | | | | — | | | | | | | | 13,816 | |
| | | | | | | | | | | | | | | | | | | | | | | | | | | | |
Total assets | | $ | 1,117,994 | | | $ | 788,188 | | | $ | (211,556 | ) | | | | | | $ | 1,097,201 | | | | | | | $ | 2,791,827 | |
| | | | | | | | | | | | | | | | | | | | | | | | | | | | |
(continued on next page)
Unaudited Pro Forma Combined Balance Sheet
As of June 30, 2017
| | | | | | | | | | | | | | | | | | | | | | | | | | | | |
| | | As Reported | | | | | | | | | | | | | | | | |
| (In $ thousands) | | Historical
Multi-
Color | | | Historical
Labels,
Adjusted for US
GAAP and
Reclassifications
(Footnote 2) | | | Adjustments
for the Labels
Division
Acquisition | | | Footnote
Reference | | | Adjustments
for Financing | | | Footnote
Reference | | | Pro Forma | |
LIABILITIES AND STOCKHOLDERS’ EQUITY | | | | | | | | | | | | | | | | | | | | | | | | | | | | |
Current liabilities: | | | | | | | | | | | | | | | | | | | | | | | | | | | | |
Current portion of long-term debt | | $ | 2,530 | | | $ | 192,800 | | | $ | (186,032 | ) | | | 3 | (d) | | $ | 11,942 | | | | 4 | (a) | | $ | 21,240 | |
Accounts payable | | | 87,933 | | | | 114,307 | | | | (6,925 | ) | | | 3 | (d) | | | — | | | | | | | | 195,315 | |
Accrued expenses and other liabilities | | | 49,086 | | | | 34,505 | | | | 1,085 | | | | 3 | (c) | | | — | | | | | | | | 83,438 | |
| | | | | | | | | | | (1,238 | ) | | | 3 | (d) | | | | | | | | | | | | |
| | | | | | | | | | | | | | | | | | | | | | | | | | | | |
Total current liabilities | | | 139,549 | | | | 341,612 | | | | (193,110 | ) | | | | | | | 11,942 | | | | | | | | 299,993 | |
Long-term debt | | | 474,659 | | | | 147,540 | | | | (116,731 | ) | | | 3 | (d) | | | 1,315,119 | | | | 4 | (a) | | | 1,597,725 | |
| | | | | | | | | | | | | | | | | | | (222,862 | ) | | | 4 | (b) | | | | |
Deferred income tax liabilities | | | 67,473 | | | | 34,322 | | | | 129,148 | | | | 3 | (j) | | | — | | | | | | | | 230,943 | |
Other liabilities | | | 20,433 | | | | 80,824 | | | | (67,279 | ) | | | 3 | (c) | | | — | | | | | | | | 45,395 | |
| | | | | | | | | | | 11,417 | | | | 3 | (c) | | | | | | | | | | | | |
| | | | | | | | | | | | | | | | | | | | | | | | | | | | |
Total liabilities | | | 702,114 | | | | 604,298 | | | | (236,555 | ) | | | | | | | 1,104,199 | | | | | | | | 2,174,056 | |
Commitments and contingencies | | | | | | | | | | | | | | | | | | | | | | | | | | | | |
Shareholders’ equity: | | | | | | | | | | | | | | | | | | | | | | | | | | | | |
Preferred stock | | | — | | | | — | | | | — | | | | | | | | — | | | | | | | | — | |
Common stock | | | 1,059 | | | | — | | | | 338 | | | | 3 | (b) | | | — | | | | | | | | 1,397 | |
Paid-in capital | | | 160,629 | | | | — | | | | 229,199 | | | | 3 | (b) | | | — | | | | | | | | 389,828 | |
Treasury stock | | | (11,420 | ) | | | — | | | | — | | | | | | | | — | | | | | | | | (11,420 | ) |
Retained earnings | | | 329,717 | | | | — | | | | (10,448 | ) | | | 3 | (l) | | | (4,721 | ) | | | 4 | (a) | | | 300,971 | |
| | | | | | | | | | | (11,300 | ) | | | 3 | (n) | | | (2,277 | ) | | | 4 | (b) | | | | |
Accumulated other comprehensive income (loss) | | | (66,665 | ) | | | 14,977 | | | | (14,977 | ) | | | 3 | (m) | | | — | | | | | | | | (66,665 | ) |
Invested equity of LABELS | | | — | | | | 132,272 | | | | (132,272 | ) | | | 3 | (m) | | | — | | | | | | | | — | |
| | | | | | | | | | | | | | | | | | | | | | | | | | | | |
Total stockholders’ equity attributable to Multi-Color Corporation | | | 413,320 | | | | 147,249 | | | | 60,540 | | | | | | | | (6,998 | ) | | | | | | | 614,111 | |
Noncontrolling interests | | | 2,560 | | | | 36,641 | | | | (35,541 | ) | | | 3 | (i) | | | — | | | | | | | | 3,660 | |
| | | | | | | | | | | | | | | | | | | | | | | | | | | | |
Total stockholders’ equity | | | 415,880 | | | | 183,890 | | | | 24,999 | | | | | | | | (6,998 | ) | | | | | | | 617,771 | |
| | | | | | | | | | | | | | | | | | | | | | | | | | | | |
Total liabilities and stockholders’ equity | | $ | 1,117,994 | | | $ | 788,188 | | | $ | (211,556 | ) | | | | | | $ | 1,097,201 | | | | | | | $ | 2,791,827 | |
| | | | | | | | | | | | | | | | | | | | | | | | | | | | |
Unaudited Pro Forma Combined Statements of Income
For the Fiscal Year Ended March 31, 2017
| | | | | | | | | | | | | | | | | | | | | | | | | | | | |
| | | As Reported | | | | | | | | | | | | | | | | |
(In $ thousands, except for per share
amounts) | | Historical
Multi-Color | | | Historical Labels,
Adjusted for US
GAAP and
Reclassifications
(Footnote 2) | | | Adjustments
for the Labels
Division
Acquisition | | | Footnote
Reference | | | Adjustments
for Financing | | | Footnote
Reference | | | Pro Forma | |
Net revenues | | $ | 923,295 | | | $ | 669,359 | | | $ | — | | | | | | | $ | | | | | | | | $ | 1,592,654 | |
Cost of revenues | | | 726,486 | | | | 546,555 | | | | — | | | | | | | | | | | | | | | | 1,273,041 | |
| | | | | | | | | | | | | | | | | | | | | | | | | | | | |
Gross profit | | | 196,809 | | | | 122,804 | | | | — | | | | | | | | — | | | | | | | | 319,613 | |
Selling, general and administrative expenses | | | 84,922 | | | | 64,810 | | | | 13,950 | | | | 5 | (a) | | | | | | | | | | | 163,682 | |
Facility closure expenses | | | 921 | | | | — | | | | — | | | | | | | | | | | | | | | | 921 | |
Goodwill impairment | | | — | | | | — | | | | — | | | | | | | | | | | | | | | | — | |
| | | | | | | | | | | | | | | | | | | | | | | | | | | | |
Operating income | | | 110,966 | | | | 57,994 | | | | (13,950 | ) | | | | | | | — | | | | | | | | 155,010 | |
Interest expense | | | 25,488 | | | | 21,361 | | | | (3,291 | ) | | | 5 | (b) | | | 62,025 | | | | 6 | (a) | | | 82,203 | |
| | | | | | | | | | | | | | | | | | | (23,380 | ) | | | 6 | (b) | | | | |
Other expense (income), net | | | (2,735 | ) | | | (1,469 | ) | | | (2,967 | ) | | | 5 | (b) | | | | | | | | | | | (7,171 | ) |
| | | | | | | | | | | | | | | | | | | | | | | | | | | | |
Income before income taxes | | | 88,213 | | | | 38,102 | | | | (7,692 | ) | | | | | | | (38,645 | ) | | | | | | | 79,978 | |
Income tax expense | | | 26,848 | | | | 4,462 | | | | (2,385 | ) | | | 5 | (c) | | | (11,980 | ) | | | 6 | (c) | | | 16,945 | |
| | | | | | | | | | | | | | | | | | | | | | | | | | | | |
Net income | | | 61,365 | | | | 33,640 | | | | (5,307 | ) | | | | | | | (26,665 | ) | | | | | | | 63,033 | |
Less: Net income attributable to noncontrolling interests | | | 369 | | | | 8,219 | | | | (7,897 | ) | | | 5 | (d) | | | | | | | | | | | 691 | |
| | | | | | | | | | | | | | | | | | | | | | | | | | | | |
Net income attributable to Multi-Color Corporation | | $ | 60,996 | | | $ | 25,421 | | | $ | 2,590 | | | | | | | $ | (26,665 | ) | | | | | | $ | 62,342 | |
| | | | | | | | | | | | | | | | | | | | | | | | | | | | |
Weighted average shares and equivalents outstanding: | | | | | | | | | | | | | | | | | | | | | | | | | | | | |
Basic | | | 16,879 | | | | | | | | | | | | | | | | | | | | | | | | 20,263 | |
Diluted | | | 17,024 | | | | | | | | | | | | | | | | | | | | | | | | 20,408 | |
| | | | | | | | | | | | | | | | | | | | | | | | | | | | |
Basic earnings per common share | | $ | 3.61 | | | | | | | | | | | | | | | | | | | | | | | $ | 3.08 | |
Diluted earnings per common share | | $ | 3.58 | | | | | | | | | | | | | | | | | | | | | | | $ | 3.05 | |
Unaudited Pro Forma Combined Statements of Income
For the Twelve Months Ended June 30, 2017
| | | | | | | | | | | | | | | | | | | | | | | | | | | | |
| | | As Reported | | | | | | | | | | | | | | | | |
(In $ thousands, except for per share
amounts) | | Historical
Multi-Color | | | Historical Labels,
Adjusted for US
GAAP and
Reclassifications
(Footnote 2) | | | Adjustments for
the Labels
Acquisition | | | Footnote
Reference | | | Adjustments
for Financing | | | Footnote
Reference | | | Pro Forma | |
Net revenues | | $ | 929,241 | | | $ | 673,067 | | | $ | | | | | | | | $ | | | | | | | | $ | 1,602,308 | |
Cost of revenues | | | 735,068 | | | | 547,570 | | | | | | | | | | | | | | | | | | | | 1,282,638 | |
| | | | | | | | | | | | | | | | | | | | | | | | | | | | |
Gross profit | | | 194,173 | | | | 125,497 | | | | — | | | | | | | | — | | | | | | | | 319,670 | |
Selling, general and administrative expenses | | | 85,857 | | | | 65,254 | | | | 14,081 | | | | 7 | (a) | | | | | | | | | | | 164,527 | |
| | | | | | | | | | | (665 | ) | | | 7 | (b) | | | | | | | | | | | | |
Facility closure expenses | | | 798 | | | | — | | | | | | | | | | | | | | | | | | | | 798 | |
Goodwill impairment | | | — | | | | — | | | | | | | | | | | | | | | | | | | | — | |
| | | | | | | | | | | | | | | | | | | | | | | | | | | | |
Operating income | | | 107,518 | | | | 60,243 | | | | (13,416 | ) | | | | | | | — | | | | | | | | 154,345 | |
Interest expense | | | 25,367 | | | | 22,386 | | | | (3,257 | ) | | | 7 | (c) | | | 61,869 | | | | 8 | (a) | | | 82,073 | |
| | | | | | | | | | | | | | | | | | | (24,292 | ) | | | 8 | (b) | | | | |
Other expense (income), net | | | (1,266 | ) | | | (6,706 | ) | | | 2,513 | | | | 7 | (c) | | | | | | | | | | | (5,459 | ) |
| | | | | | | | | | | | | | | | | | | | | | | | | | | | |
Income before income taxes | | | 83,417 | | | | 44,563 | | | | (12,672 | ) | | | | | | | (37,577 | ) | | | | | | | 77,731 | |
Income tax expense | | | 23,820 | | | | 6,288 | | | | (3,928 | ) | | | 7 | (d) | | | (11,649 | ) | | | 8 | (c) | | | 14,531 | |
| | | | | | | | | | | | | | | | | | | | | | | | | | | | |
Net income | | | 59,597 | | | | 38,275 | | | | (8,744 | ) | | | | | | | (25,928 | ) | | | | | | | 63,200 | |
Less: Net income attributable to noncontrolling interests | | | 300 | | | | 8,897 | | | | (8,800 | ) | | | 7 | (e) | | | | | | | | | | | 397 | |
| | | | | | | | | | | | | | | | | | | | | | | | | | | | |
Net income attributable to Multi-Color Corporation | | $ | 59,297 | | | $ | 29,378 | | | $ | 56 | | | | | | | $ | (25,928 | ) | | | | | | $ | 62,803 | |
| | | | | | | | | | | | | | | | | | | | | | | | | | | | |
Weighted average shares and equivalents outstanding: | | | | | | | | | | | | | | | | | | | | | | | | | | | | |
Basic | | | 16,909 | | | | | | | | | | | | | | | | | | | | | | | | 20,293 | |
Diluted | | | 17,093 | | | | | | | | | | | | | | | | | | | | | | | | 20,477 | |
| | | | | | | | | | | | | | | | | | | | | | | | | | | | |
Basic earnings per common share | | $ | 3.51 | | | | | | | | | | | | | | | | | | | | | | | $ | 3.09 | |
Diluted earnings per common share | | $ | 3.47 | | | | | | | | | | | | | | | | | | | | | | | $ | 3.07 | |
Multi-Color, Inc.
Notes to the Unaudited Pro Forma Combined Financial Information
1. Basis of Presentation
The Acquisition is being accounted for as a business combination using the acquisition method of accounting under the provisions of Accounting Standards Codification (“ASC”) Topic 805, “Business Combinations” (“ASC 805”), and using the fair value concepts defined in ASC Topic 820, “Fair Value Measurements” (“ASC 820”). ASC 820 defines the term “fair value” and sets forth the valuation requirements for any asset or liability measured at fair value, expands related disclosure requirements and specifies a hierarchy of valuation techniques based on the nature of the inputs used to develop fair value measures. Fair value is defined in ASC 820 as “the price that would be received to sell an asset or paid to transfer a liability in an orderly transaction between market participants at the measurement date”. This is an exit price concept for the valuation of the asset or liability. In addition, market participants are assumed to be buyers and sellers in the principal (or the most advantageous) market for the asset or liability. Many of these fair value measurements can be highly subjective, and it is possible that other professionals, applying reasonable judgment to the same facts and circumstances, could develop and support a range of alternative estimated amounts. Under ASC 805, all assets acquired and liabilities assumed are recorded at their acquisition date fair value.
The allocation of the purchase price as reflected in the unaudited pro forma combined financial information is based upon management’s preliminary estimates of the fair market value of the assets acquired and liabilities assumed, as if the Constantia Labels Acquisition had occurred on the above specified dates. This allocation of the purchase price depends upon certain estimates and assumptions, all of which are preliminary and, in some instances, are incomplete and have been made solely for the purpose of developing the unaudited pro forma combined financial information. Any adjustments to the preliminary estimated fair value amounts could have a significant impact on the unaudited pro forma combined financial information contained herein, and our future results of operations and financial position.
Assets acquired and liabilities assumed in a business combination that arise from contingencies must be recognized at fair value if the fair value can be reasonably estimated. If the fair value of an asset or liability that arises from a contingency cannot be determined, the asset or liability would be recognized in accordance with ASC 450, “Disclosure of Certain Loss Contingencies” (“ASC 450”). If the fair value is not determinable and the ASC 450 criteria are not met, no asset or liability would be recognized. Management is not aware of any material contingencies related to Constantia Labels.
2. Labels Division IFRS to US GAAP Adjustments, Reclassifications, and Foreign Currency Translation
The historical financial information of Constantia Labels was prepared in accordance with IFRS as issued by the IASB with all amounts presented in Euro. Constantia Labels’ unaudited financial information reflected in the pro forma financial information have been adjusted for the identified differences between IFRS and US GAAP and translated from the Euro amounts into U.S. dollars. In addition, certain balances were reclassified from Constantia Labels’ unaudited combined financial statements so that their presentation would be consistent with that of the Company. These adjustments and reclassifications are based on management’s preliminary analysis. When management completes a final review as required by acquisition accounting rules, additional differences or reclassifications may be identified that, when conformed, could have a material impact on the unaudited pro forma combined financial information contained herein and our future results of operations and financial position.
Unaudited Labels Division Balance Sheet presented in US GAAP as of June 30, 2017
The following table reflects the adjustments made to Constantia Labels’ unaudited combined balance sheet as of June 30, 2017 to convert from IFRS to US GAAP and from Euro to U.S. dollars using the spot rate of $1.1427 to €1.00 as of June 30, 2017.
| | | | | | | | | | | | | | | | | | | | |
| (in thousands) | | Labels
IFRS
(Euro) | | | IFRS to
US GAAP
Adjustments and
Reclassifications
(Euro) | | | Footnote | | | Labels
US GAAP
(Euro) | | | Labels
US GAAP
(USD) | |
ASSETS | | | | | | | | | | | | | | | | | | | | |
Current assets: | | | | | | | | | | | | | | | | | | | | |
Cash and cash equivalents | | € | 23,890 | | | € | — | | | | | | | € | 23,890 | | | $ | 27,299 | |
Accounts receivable, net of allowance | | | — | | | | 114,074 | | | | 2 | (a) | | | 165,627 | | | | 189,262 | |
| | | | | | | 51,553 | | | | 2 | (c) | | | | | | | | |
Other receivables | | | 65,134 | | | | (51,553 | ) | | | 2 | (c) | | | 10,198 | | | | 11,653 | |
| | | | | | | (3,383 | ) | | | 2 | (c) | | | | | | | | |
Inventories, net | | | 79,104 | | | | — | | | | | | | | 79,104 | | | | 90,392 | |
Prepaid expenses | | | — | | | | 2,876 | | | | 2 | (b) | | | 2,876 | | | | 3,286 | |
Other current assets | | | — | | | | 3,383 | | | | 2 | (c) | | | 3,383 | | | | 3,866 | |
Trade receivables | | | 114,074 | | | | (114,074 | ) | | | 2 | (a) | | | — | | | | — | |
Tax receivables | | | 2,876 | | | | (2,876 | ) | | | 2 | (b) | | | — | | | | — | |
| | | | | | | | | | | | | | | | | | | | |
Total current assets | | | 285,078 | | | | — | | | | | | | | 285,078 | | | | 325,758 | |
Assets held for sale | | | — | | | | — | | | | | | | | — | | | | — | |
Property, plant and equipment, net of accumulated depreciation | | | — | | | | 183,900 | | | | 2 | (d) | | | 183,900 | | | | 210,143 | |
Goodwill | | | 139,783 | | | | 7,362 | | | | 2 | (k) | | | 147,145 | | | | 168,143 | |
Intangible assets, net | | | 51,704 | | | | (1,825 | ) | | | 2 | (l) | | | 49,879 | | | | 56,997 | |
Othernon-current assets | | | — | | | | 14,168 | | | | 2 | (e) | | | 14,168 | | | | 16,190 | |
Deferred income tax assets | | | 9,589 | | | | — | | | | | | | | 9,589 | | | | 10,957 | |
Tangible assets | | | 183,900 | | | | (183,900 | ) | | | 2 | (d) | | | — | | | | — | |
Other noncurrent and financial assets | | | 14,168 | | | | (14,168 | ) | | | 2 | (e) | | | — | | | | — | |
| | | | | | | | | | | | | | | | | | | | |
Total assets | | € | 684,222 | | | € | 5,537 | | | | | | | € | 689,759 | | | $ | 788,188 | |
| | | | | | | | | | | | | | | | | | | | |
(continued on next page)
| | | | | | | | | | | | | | | | | | | | |
| (in thousands) | | Labels
IFRS
(Euro) | | | IFRS to
US GAAP
Adjustments and
Reclassifications
(Euro) | | | Footnote | | | Labels
US GAAP
(Euro) | | | Labels
US GAAP
(USD) | |
LIABILITIES AND STOCKHOLDERS’ EQUITY | | | | | | | | | | | | | | | | | | | | |
Current liabilities: | | | | | | | | | | | | | | | | | | | | |
Current portion of long-term debt | | € | — | | | € | 5,923 | | | | 2 | (g) | | € | 168,723 | | | $ | 192,800 | |
| | | | | | | 162,800 | | | | 2 | (i) | | | | | | | | |
Accounts payable | | | — | | | | 93,972 | | | | 2 | (a) | | | 100,032 | | | | 114,307 | |
| | | | | | | 6,060 | | | | 2 | (i) | | | | | | | | |
Accrued expenses and other liabilities | | | — | | | | 21,571 | | | | 2 | (i) | | | 30,196 | | | | 34,505 | |
| | | | | | | 8,625 | | | | 2 | (f) | | | | | | | | |
Provisions | | | 202 | | | | (202 | ) | | | 2 | (f) | | | — | | | | — | |
Interest-bearing financial liabilities | | | 5,923 | | | | (5,923 | ) | | | 2 | (g) | | | — | | | | — | |
Trade payables | | | 93,972 | | | | (93,972 | ) | | | 2 | (a) | | | — | | | | — | |
Tax liabilities | | | 8,423 | | | | (8,423 | ) | | | 2 | (f) | | | — | | | | — | |
Other current liabilities | | | 190,431 | | | | (190,431 | ) | | | 2 | (i) | | | — | | | | — | |
| | | | | | | | | | | | | | | | | | | | |
Total current liabilities | | | 298,951 | | | | — | | | | | | | | 298,951 | | | | 341,612 | |
Long-term debt | | | — | | | | 129,115 | | | | 2 | (g) | | | 129,115 | | | | 147,540 | |
Deferred income tax liabilities | | | 30,036 | | | | — | | | | | | | | 30,036 | | | | 34,322 | |
Other liabilities | | | 69,827 | | | | 904 | | | | 2 | (h) | | | 70,731 | | | | 80,824 | |
Provisions | | | 1,304 | | | | (400 | ) | | | 2 | (m) | | | — | | | | — | |
| | | | | | | (904 | ) | | | 2 | (h) | | | | | | | — | |
Interest-bearing financial liabilities | | | 129,115 | | | | (129,115 | ) | | | 2 | (g) | | | — | | | | — | |
| | | | | | | | | | | | | | | | | | | | |
Total liabilities | | | 529,233 | | | | (400 | ) | | | | | | | 528,833 | | | | 604,298 | |
Commitments and contingencies | | | | | | | | | | | | | | | | | | | | |
Shareholders’ equity: | | | | | | | | | | | | | | | | | | | | |
Preferred stock | | | — | | | | — | | | | | | | | — | | | | — | |
Common stock | | | — | | | | — | | | | | | | | — | | | | — | |
Paid-in capital | | | — | | | | — | | | | | | | | — | | | | — | |
Treasury stock | | | — | | | | — | | | | | | | | — | | | | — | |
Retained earnings | | | — | | | | — | | | | | | | | — | | | | — | |
Accumulated other comprehensive income | | | — | | | | 13,107 | | | | 2 | (j) | | | 13,107 | | | | 14,977 | |
Total invested equity attributable to Division LABELS | | | 130,286 | | | | (13,107 | ) | | | 2 | (j) | | | 115,754 | | | | 132,272 | |
| | | | | | | (1,825 | ) | | | 2 | (l) | | | | | | | | |
| | | | | | | 400 | | | | 2 | (m) | | | | | | | | |
| | | | | | | | | | | | | | | | | | | | |
Total stockholders’ equity attributable to Division LABELS | | | 130,286 | | | | (1,425 | ) | | | | | | | 128,861 | | | | 147,249 | |
Noncontrolling interests | | | 24,703 | | | | 7,362 | | | | 2 | (k) | | | 32,065 | | | | 36,641 | |
| | | | | | | | | | | | | | | | | | | | |
Total stockholders’ equity | | | 154,989 | | | | 5,937 | | | | | | | | 160,926 | | | | 183,890 | |
| | | | | | | | | | | | | | | | | | | | |
Total liabilities and stockholders’ equity | | € | 684,222 | | | € | 5,537 | | | | | | | € | 689,759 | | | $ | 788,188 | |
| | | | | | | | | | | | | | | | | | | | |
| 2(a) | To reclassify trade receivables and trade payables to accounts receivable, net of allowance and accounts payable, respectively. |
| 2(b) | To reclassify tax receivables to prepaid expenses. |
| 2(c) | To reclassify certain other receivables. Receivables between Constantia Labels and Constantia of €51,553 were reclassified to accounts receivable, net, and €3,383 of miscellaneous assets were reclassified to other current assets. |
| 2(d) | To reclassify tangible assets to property, plant and equipment, net of accumulated depreciation. |
| 2(e) | To reclassify other noncurrent and financial assets to othernon-current assets. |
| 2(f) | To reclassify current provisions and tax liabilities to accrued expenses and other liabilities. |
| 2(g) | To reclassify current and noncurrent interest-bearing financial liabilities to current portion of long-term debt and long-term debt, respectively. |
| 2(h) | To reclassify noncurrent provisions to other liabilities. |
| 2(i) | To reclassify other current liabilities to various accounts. Payables between Constantia Labels and Constantia of €6,060 were reclassified to accounts payable; €162,800 of loans between Constantia Labels and Constantia were reclassified to current portion of long-term debt; and the remaining balance of €21,571 was reclassified to accrued expenses and other liabilities. |
| 2(j) | To reclassify cumulative translation differences to accumulated other comprehensive income. |
| 2(k) | Represents an adjustment to noncontrolling interest to align IFRS with US GAAP. Upon making an acquisition, Constantia Labels accounted for noncontrolling interest at their proportionate share of the net identifiable assets of the acquiree at the acquisition date. Under US GAAP, noncontrolling interests must be recorded based on their fair value. The approximated difference between the proportionate value versus fair value was recorded to historical goodwill. |
| 2(l) | To eliminate capitalized development costs. Under IFRS, development costs can be capitalized under certain conditions; however, these costs do not qualify for capitalization under US GAAP and will be expensed as incurred. |
| 2(m) | Reflects the elimination of a noncurrent provision that was recognized for an onerous lease contract. Under IFRS, Constantia Labels recorded a provision on a contract for which the unavoidable costs of meeting the contractual obligations exceed the economic benefits expected to be received. Under US GAAP, provisions are generally not recognized for unfavorable contracts unless the entity has ceased using the rights under the contract. There is no adjustment to the unaudited pro forma combined statements of income as the provision was originally recorded prior to the periods being presented. |
Unaudited Labels Division Statement of Income presented in US GAAP for the Year Ended December 31, 2016 and the Twelve Months ended June 30, 2017
The following table reflects the adjustments made to Constantia Labels’ unaudited combined statements of income for the year ended December 31, 2016 to convert from IFRS to US GAAP and from Euro to U.S. dollars using a historical average exchange rate of $1.1070 to €1.00 from January 1, 2016 to December 31, 2016.
Unaudited Labels Division Statement of Income presented in US GAAP for the Year Ended December 31, 2016
| | | | | | | | | | | | | | | | | | | | |
| (In thousands except forper-share amounts) | | Labels
IFRS
(Euro) | | | IFRS to US GAAP
Adjustments and
Reclassifications
(Euro) | | | Footnote | | | Labels
US GAAP
(Euro) | | | Labels
US GAAP
(USD) | |
Net revenues | | € | 604,660 | | | € | — | | | | | | | € | 604,660 | | | $ | 669,359 | |
Cost of revenues | | | 493,726 | | | | — | | | | | | | | 493,726 | | | | 546,555 | |
| | | | | | | | | | | | | | | | | | | | |
Gross profit | | | 110,934 | | | | — | | | | | | | | 110,934 | | | | 122,804 | |
Selling, general and administrative expenses | | | — | | | | 58,546 | | | | 2 | (n) | | | 58,546 | | | | 64,810 | |
Facility closure expenses | | | — | | | | — | | | | | | | | — | | | | — | |
Goodwill impairment | | | — | | | | — | | | | | | | | — | | | | — | |
Selling expenses | | | 30,639 | | | | (30,639 | ) | | | 2 | (n) | | | — | | | | — | |
Other income | | | (5,626 | ) | | | 5,626 | | | | 2 | (p) | | | — | | | | — | |
Other expenses | | | 2,312 | | | | (2,312 | ) | | | 2 | (p) | | | — | | | | — | |
Administration expenses | | | 26,166 | | | | (26,166 | ) | | | 2 | (n) | | | — | | | | — | |
Research and development expenses | | | 1,486 | | | | 255 | | | | 2 | (o) | | | — | | | | — | |
| | | | | | | (1,741 | ) | | | 2 | (n) | | | | | | | — | |
| | | | | | | | | | | | | | | | | | | | |
Operating income | | | 55,957 | | | | (3,569 | ) | | | | | | | 52,388 | | | | 57,994 | |
Interest expense | | | 19,296 | | | | — | | | | | | | | 19,296 | | | | 21,361 | |
Other expense (income), net | | | — | | | | (1,327 | ) | | | 2 | (p) | | | (1,327 | ) | | | (1,469 | ) |
Interest income | | | (289 | ) | | | 289 | | | | 2 | (p) | | | — | | | | — | |
Other financial expense (income) | | | 2,276 | | | | (2,276 | ) | | | 2 | (p) | | | — | | | | — | |
| | | | | | | | | | | | | | | | | | | | |
Income before income taxes | | | 34,674 | | | | (255 | ) | | | | | | | 34,419 | | | | 38,102 | |
Income tax expense | | | 4,095 | | | | (64 | ) | | | 2 | (q) | | | 4,031 | | | | 4,462 | |
| | | | | | | | | | | | | | | | | | | | |
Net income | | | 30,579 | | | | (191 | ) | | | | | | | 30,388 | | | | 33,640 | |
Less: Net income attributable to noncontrolling interests | | | 7,425 | | | | — | | | | | | | | 7,425 | | | | 8,219 | |
| | | | | | | | | | | | | | | | | | | | |
Net income attributable to Division LABELS | | € | 23,154 | | | € | (191 | ) | | | | | | € | 22,963 | | | $ | 25,421 | |
| | | | | | | | | | | | | | | | | | | | |
The following table reflects the adjustments made to Constantia Labels’ unaudited combined statement of income for the twelve months ended June 30, 2017 to convert from IFRS to US GAAP and from Euro to U.S. dollars using a historical average exchange rate of $1.0901 to €1.00 from June 30, 2016 to June 30, 2017.
Unaudited Labels Division Statement of Income presented in US GAAP for the Twelve Months Ended June 30, 2017
| | | | | | | | | | | | | | | | | | | | |
| (In thousands except forper-share amounts) | | Labels
IFRS
(Euro) | | | IFRS to US GAAP
Adjustments and
Reclassifications
(Euro) | | | Footnote | | | Labels
US GAAP
(Euro) | | | Labels
US GAAP
(USD) | |
Net revenues | | € | 617,436 | | | € | — | | | | | | | € | 617,436 | | | $ | 673,067 | |
Cost of revenues | | | 502,312 | | | | — | | | | | | | | 502,312 | | | | 547,570 | |
| | | | | | | | | | | | | | | | | | | | |
Gross profit | | | 115,124 | | | | — | | | | | | | | 115,124 | | | | 125,497 | |
Selling, general and administrative expenses | | | — | | | | 59,860 | | | | 2 | (n) | | | 59,860 | | | | 65,254 | |
Facility closure expenses | | | — | | | | — | | | | | | | | — | | | | — | |
Goodwill impairment | | | — | | | | — | | | | | | | | — | | | | — | |
Selling expenses | | | 31,631 | | | | (31,631 | ) | | | 2 | (n) | | | — | | | | — | |
Administration expenses | | | 26,346 | | | | (26,346 | ) | | | 2 | (n) | | | — | | | | — | |
Other income | | | (4,787 | ) | | | 4,787 | | | | 2 | (p) | | | — | | | | — | |
Other expenses | | | 2,799 | | | | (2,799 | ) | | | 2 | (p) | | | — | | | | — | |
Research and development expenses | | | 1,611 | | | | 272 | | | | 2 | (o) | | | — | | | | — | |
| | | | | | | (1,883 | ) | | | 2 | (n) | | | | | | | — | |
| | | | | | | | | | | | | | | | | | | | |
Operating income | | | 57,524 | | | | (2,260 | ) | | | | | | | 55,264 | | | | 60,243 | |
Interest expense | | | 20,536 | | | | — | | | | | | | | 20,536 | | | | 22,386 | |
Other expense (income), net | | | — | | | | (6,152 | ) | | | 2 | (p) | | | (6,152 | ) | | | (6,706 | ) |
Interest income | | | (305 | ) | | | 305 | | | | 2 | (p) | | | — | | | | — | |
Other financial expense (income) | | | (3,859 | ) | | | 3,859 | | | | 2 | (p) | | | — | | | | — | |
| | | | | | | | | | | | | | | | | | | | |
Income before income taxes | | | 41,152 | | | | (272 | ) | | | | | | | 40,880 | | | | 44,563 | |
Income tax expense | | | 5,836 | | | | (68 | ) | | | 2 | (q) | | | 5,768 | | | | 6,288 | |
| | | | | | | | | | | | | | | | | | | | |
Net income | | | 35,316 | | | | (204 | ) | | | | | | | 35,112 | | | | 38,275 | |
Less: Net income attributable to noncontrolling interests | | | 8,162 | | | | — | | | | | | | | 8,162 | | | | 8,897 | |
| | | | | | | | | | | | | | | | | | | | |
Net income attributable to Division LABELS | | € | 27,154 | | | € | (204 | ) | | | | | | € | 26,950 | | | $ | 29,378 | |
| | | | | | | | | | | | | | | | | | | | |
| 2(n) | To reclassify selling expenses, administrative expenses, and research and development expenses to selling, general and administrative expenses. |
| 2(o) | Represents the net adjustment for the recognition of development costs, which costs were capitalized under IFRS but cannot be capitalized under US GAAP, and the reversal of the amortization charges with respect to the capitalized development costs. |
| 2(p) | To reclassify interest income, other income, other expenses, and other financial expense (income) to other expense (income), net. |
| 2(q) | To tax effect the statement of income adjustments using the 25% statutory corporate tax rate of Austria. |
3. Unaudited Pro Forma Combined Balance Sheet Adjustments Related to the Acquisition
The allocation of the purchase price discussed below is preliminary. The final allocation of the purchase price will be determined at a later date and is dependent on a number of factors, including the final evaluation of the fair value of Constantia Labels’ tangible and identifiable intangible assets acquired and liabilities assumed. Such final adjustments, which may include other increases or decreases to amortization resulting from the allocation of the purchase price to amortizable tangible and intangible assets, along with the related income tax effect, may be material.
The consideration paid and preliminary allocation of the purchase price to the fair value of Constantia Labels’ assets acquired and liabilities assumed, prepared as if the acquisition date were June 30, 2017, is presented in the table below. Amounts which reference the total consideration transferred were translated from Euro to U.S. dollars using the June 30, 2017 spot rate of $1.1427 to €1.00.
| | | | | | |
| (in thousands) | | Note | | Amount | |
Calculation of consideration | | | | | | |
Cash consideration | | 3(a) | | $ | 1,057,781 | |
Fair value of common stock issued to the Sellers | | 3(b) | | | 229,537 | |
Contingent and deferred consideration | | 3(c) | | | 12,502 | |
| | | | | | |
Fair value of total consideration transferred | | | | $ | 1,299,820 | |
| | | | | | |
Recognized amounts of identifiable assets acquired and liabilities assumed | | | | | | |
Book value of Labels Division’s net assets | | 3(m) | | $ | 147,249 | |
Adjusted for: | | | | | | |
Liability for put options on Verstraete noncontrolling interest | | 3(c) | | | 67,279 | |
Settlement or elimination of outstanding balances between Labels Division and Constantia | | 3(d) | | | 251,982 | |
Elimination of existing goodwill and intangible assets | | 3(e) | | | (225,140 | ) |
| | | | | | |
Adjusted book value of net assets acquired | | | | $ | 241,370 | |
| | | | | | |
Fair value adjustments: | | | | | | |
Inventories | | 3(f) | | | 6,608 | |
Property, plant and equipment | | 3(g) | | | — | |
Intangible assets | | 3(h) | | | 410,000 | |
Noncontrolling interests | | 3(i) | | | 35,541 | |
| | | | | | |
Total fair value adjustments | | | | | 452,149 | |
| | | | | | |
Deferred tax liabilities | | 3(j) | | | (129,148 | ) |
| | | | | | |
Goodwill | | 3(k) | | $ | 735,449 | |
| | | | | | |
| 3(a) | Represents estimated cash consideration transferred to the Sellers in the amount of €925,686 translated into U.S. dollars using the June 30, 2017 spot rate of $1.1427 to €1.00. The cash consideration remains subject to closing adjustments as outlined in the Purchase Agreement. Actual cash transferred by Multi-Color will be subject to the final closing adjustment calculations as well as the Euro to U.S. dollar exchange rate, which could have material impact on these unaudited pro forma combined financial statements. In addition, the net cash position will be impacted by the currency forward entered into by the Company to hedge the transfer of Euro on the closing date. Refer to Note 3(o) for more details on the currency forward. |
| 3(b) | The Purchase Agreement contemplates that, on the closing date, the Company will enter into certain other agreements, including an investor rights agreement that provides for restrictions on the transfer of shares issued to Constantia Flexibles and certain registration rights with respect to the shares. The fair value of the 3,384 common shares issued to the Sellers were calculated using a Company share price of $79.80, which was the closing price on August 31, 2017, however, the fair value was discounted to reflect the temporary lack of liquidity. |
| 3(c) | As part of the Transaction, the Company will acquire Constantia Labels’ remaining noncontrolling interest in Verstraete in Mould Labels N.V. (“Verstraete”). An additional contingent and deferred consideration arrangement was granted to the previous owners of Verstraete, and it nullified the existing put option arrangement between Constantia Labels and the previous owners of Verstraete. The result was a $67,279 reduction to other liabilities in the unaudited combined pro forma balance sheet. |
| | The fair value of the contingent and deferred consideration arrangement is $12,502 of which $1,085 is classified within accrued expenses and other liabilities and $11,417 is classified within other liabilities. The future value of the arrangement is dependent upon whether the Verstraete business meets or exceeds certain agreed upon EBITA metrics (earnings before interest, taxes, and amortization) over the next three to five years with a minimum value of $3,094. A portion of the arrangement is classified as deferred consideration |
| | because it involves future cash payments made to the previous owners of Verstraete regardless of the performance of the Verstraete business. |
| 3(d) | Represents certain balances between Constantia Labels and Constantia that are included in the historical financial statements of Constantia Labels will be settled or eliminated on the date of consummation of the Transactions. This includes trade and miscellaneous receivables and payables in addition to loans whereby Constantia Labels is in a payable position to Constantia. |
| | The trade and miscellaneous receivables and payable balances will be netted and settled in cash. The resulting pro forma adjustments are reflected as reductions to accounts receivable $58,910, other receivables $34, accounts payable $6,925, accrued expenses and other current liabilities $1,238. |
| | The Company will assume the loan payables as liabilities, but it will also acquire the loan receivable assets that correspond to the loan payable positions from various other Constantia subsidiaries. The result is that both the acquired loan assets and the assumed loan liabilities will become intercompany arrangements that eliminate upon consolidation. The resulting pro forma adjustment is an elimination of the loan payable balance from current portion of long-term debt $186,032 and long-term debt $116,731. No adjustment was needed to reflect the loan receivable assets as only the loan payable was included in the historical balance sheet of Constantia Labels. |
| 3(e) | Prior to the Acquisition, Constantia Labels’ historical balance sheet included $168,143 of goodwill and $56,997 of intangibles, which were fair valued at $0 as part of purchase accounting. Refer to Note 3(l) for more information on the goodwill to be recognized as a result of the Transaction. Refer to Note 3(i) for more information on the identified intangible assets resulting from the Transaction. |
| 3(f) | Represents an adjustment of $6,608 to increase the carrying value of Constantia Labels’ inventories to its preliminary estimated fair value. The fair value of finished goods andwork-in-process inventory represents the estimated selling price less cost to dispose and a reasonable profit allowance for completing the selling effort. The fair value ofwork-in-process inventory also includes a reasonable profit allowance for completing the manufacturing effort. |
| 3(g) | The Company has not yet determined the fair value of property, plant and equipment to be acquired; therefore, the historical carrying value has been used in the preliminary purchase price allocation reflected in the unaudited pro forma combined balance sheet. Based on information received to date, management does not believe the fair value will be materially different from the historical carrying value. This assertion remains contingent upon receiving additional information and performing procedures to calculate the fair value of property, plant and equipment. No adjustment was made to the unaudited pro forma combined statements of income, but any difference between the fair value and the historical carrying value would have a direct impact to future earnings via depreciation expense. |
| 3(h) | Represents the adjustment of $410,000 to record the preliminary estimated fair value of intangible assets identified upon the acquisition, which includes $390,000 for customer relationship and $20,000 for technology. |
| | The fair value estimate for identifiable intangible assets is preliminary and is determined based on the assumptions that market participants would use in pricing an asset, based on the most advantageous market for the asset (i.e., its highest and best use). This preliminary fair value estimate could include assets that are not intended to be used, may be sold or are intended to be used in a manner other than their best use. The final fair value determination for identified intangibles may differ from this preliminary determination. |
| | Some of the more significant assumptions inherent in the development of the identifiable intangible assets valuations, from the perspective of a market participant, include the estimatedafter-tax cash flows that will be received for the intangible asset, the appropriate discount rate selected in order to measure the risk inherent in each future cash flow stream, the assessment of each asset’s life cycle, and competitive trends impacting the asset and each cash flow stream. No assurances can be given that the underlying assumptions used to prepare the discounted cash flow analysis will not change. For these and other reasons, actual results may vary significantly from estimated results. The methodologies and significant assumptions utilized to value the intangible assets include using a discount rate that reflected the risks inherent in the cash flow stream as well as the nature of the asset. |
| 3(i) | As mentioned in 3(c) above, the Company will acquire Constantia Labels’ remaining noncontrolling interest in Verstraete and will also acquire certain assets of Afripack Consumer Flexibles Pty. Ltd. (“Afripack”), of which Constantia historically held less than 100% ownership. However, the Company will assume Constantia Labels’ noncontrolling interest in Spearsystem Packaging (Africa) (Pty) Ltd. (“Spearsystem”). |
| | This adjustment reflects the elimination of Constantia Labels’ historical noncontrolling interest in Verstraete and Afripack, net of the $14,695 adjustment to recognize the noncontrolling interest in Spearsystem at its fair value. |
| 3(j) | Reflects deferred income tax liabilities resulting from fair value adjustments. The estimates of deferred tax liabilities were determined based on the book and tax basis differences of the net assets acquired at the Company’s global weighted average statutory tax rate of 31%. This estimate of deferred income tax liabilities is preliminary and is subject to change based upon management’s final determination of the fair values of tangible and identifiable intangible assets acquired by jurisdiction. |
| 3(k) | As a result of the Transaction, new goodwill is calculated as the difference between the fair value of the consideration transferred and the fair values assigned to the identifiable tangible and intangible assets acquired and liabilities assumed. |
| 3(l) | To record nonrecurring acquisition-related transaction costs incurred by the Company of $10,448 not reflected in the historical financial statements of the Company. In accordance with ASC 805, acquisition-related transaction costs and certain acquisition restructuring and related charges are not included as a component of consideration transferred but are required to be expensed as incurred. The unaudited pro forma combined balance sheet reflects the $10,448 of costs as a reduction of cash with a corresponding decrease in retained earnings. These costs are not presented in the unaudited pro forma combined consolidated statement of operations because they will not have a continuing impact on the combined results. |
| 3(m) | Elimination of the historical invested equity and accumulated other comprehensive income of Labels Division. |
| 3(n) | Represents the adjustment to cash and retained earnings to reflect the impact of the currency forward entered into by the Company in July 2017. Per the terms of the currency forward, the Company contractually agreed to exchange 495,600 Euros at an exchange rate of $1.1655 to €1.00. The actual gain/loss and impact on cash will depend on the Euro to U.S. dollar exchange rate on the date of consummation; however, for purposes of these unaudited pro forma financial statements, the gain/loss and impact to cash was calculated using the Euro to U.S. dollar exchange rate at June 30, 2017. No adjustment was made to the unaudited pro forma combined statements of income as the gain/loss is nonrecurring in nature. |
4. Unaudited Pro forma Combined Balance Sheet Adjustments Related to the Financing
| 4(a) | As part of the Transaction, the Company plans to draw down on the Senior Secured Facilities and issue the notes offered hereby as displayed in the table below: |
| | | | | | | | | | | | | | | | |
| ($ in thousands) | | Face value | | | Original issue
discount | | | Capitalized debt
issuance costs | | | Net balance | |
Revolver | | $ | 225,000 | | | $ | — | | | $ | 4,613 | | | $ | 220,387 | |
Term Loan A | | | 250,000 | | | | 1,250 | | | | 4,690 | | | | 244,060 | |
Term Loan B | | | 400,000 | | | | 2,000 | | | | 5,690 | | | | 392,310 | |
| | | | | | | | | | | | | | | | |
Senior Secured Facilities | | | 875,000 | | | | 3,250 | | | | 14,993 | | | | 856,757 | |
| | | | | | | | | | | | | | | | |
144A Debt Offering | | | 480,000 | | | | — | | | | 9,696 | | | | 470,304 | |
| | | | | | | | | | | | | | | | |
Total debt | | $ | 1,355,000 | | | $ | 3,250 | | | $ | 24,689 | | | $ | 1,327,061 | |
| | | | | | | | | | | | | | | | |
Less: Current portion of long-term debt | | | | | | | | | | | | | | | 11,942 | |
| | | | | | | | | | | | | | | | |
Long-term debt | | | | | | | | | | | | | | $ | 1,315,119 | |
| | The adjustment to cash of $1,322,340 is calculated by taking the total debt of $1,327,061 less $4,721 of commitment fees associated with the unused Bridge facility. |
| 4(b) | To reflect the payoff of the Company’s existing senior secured credit facility, which had an outstanding balance at June 30, 2017 of $225,139. The associated unamortized debt issuance costs of $2,277 were written off to retained earnings. |
5. Unaudited Pro forma Combined Statement of Operations Adjustments Related to the Acquisition for the Year Ended March 31, 2017
| 5(a) | Represents a net adjustment of $13,950 from the elimination of historic Labels Division intangible asset amortization of $11,576 and the recognition of pro forma amortization expense of $25,526 on the portion of the purchase price allocated to definite-lived intangible assets as follows: |
| | | | | | | | | | | | |
| (in thousands) | | Preliminary
Fair Value | | | Estimated Useful
Life (years) | | | Amortization
Expense | |
Technology | | $ | 20,000 | | | | 4 | | | $ | 5,000 | |
Customer relationships | | | 390,000 | | | | 19 | | | | 20,526 | |
| | | | | | | | | | | | |
| | $ | 410,000 | | | | | | | $ | 25,526 | |
| | | | | | | | | | | | |
Less: Labels Division historical amortization for the 12 months ended March 31, 2017 | | | | | | | | | | | 11,576 | |
| | | | | | | | | | | | |
Total | | | | | | | | | | $ | 13,950 | |
| | | | | | | | | | | | |
| | Amortization expense has been calculated on a preliminary basis, using the straight-line method over the estimated useful lives. The effect of a 10% increase or decrease in preliminary estimated fair value would result in an increase or decrease of amortization expense of $2,553 for the year ended March 31, 2017. |
| 5(b) | As mentioned in Note 3(c) above, the Company acquired Constantia Labels’ remaining noncontrolling interest in the Verstraete entity and the existing put options previously held by Constantia Labels were nullified. As such, this adjustment represents the reversal of the $3,291 interest expense and $2,967 of other expense that was recognized as a result of those put options. |
| 5(c) | Represents the income tax effect of the Acquisition pro forma adjustments using a global weighted average statutory rate of 31%. Because the adjustments contained in this unaudited pro forma combined financial information are based on estimates, the effective tax rate will likely vary from the effective rate in periods subsequent to the Acquisition. Adjustments to established deferred tax assets and liabilities as well as the recognition of additional deferred tax assets and liabilities upon detailed analysis of the acquired assets and assumed liabilities may occur in conjunction with the finalization of the purchase accounting, and these items could be material. |
| 5(d) | As mentioned in Note 3(c) above, the Company is acquiring Constantia Labels’ remaining noncontrolling interest in Verstraete and Afripack; thus, this adjustment represents a reduction in the income attributable to noncontrolling interest on behalf of those entities. |
6. Unaudited Pro forma Combined Statement of Income Adjustments Related to the Financing for the Year Ended March 31, 2017
| 6(a) | To reflect the estimated contractual interest expense, amortization of OID, and amortization of debt issuance cost associated with the Senior Secured Facility and the notes offered hereby. The utilized weighted average contractual interest rate was 4.2%, which resulted in contractual interest expense of $57,467. Additional interest expense of $4,558 was recognized to reflect the amortization of OID and debt issuance costs. |
| | In the event the LIBOR rate rises 1/8%, interest expense recognized for the Senior Secured Facility would increase by approximately $1,101. |
| 6(b) | To reflect the removal of the historical interest expense (including amortized debt issuance cost) recognized by the Company due to the existing senior secured credit facility and the $14,778 of historical interest expense recognized by Constantia Labels due to the financing arrangements with Constantia. |
| | As part of the Transaction, the Company’s existing senior secured credit facility will be paid off, and, as mentioned in Note 3(e), the Company will acquire the loan receivable assets that correspond to the loan payable positions recognized by Constantia Labels from various other Constantia subsidiaries. Thus, the loan receivable and payable (and the resulting interest income and expense) will become an intercompany arrangement that will eliminate upon consolidation. |
| 6(c) | Represents the income tax effect of the Financing pro forma adjustments using a global weighted average statutory rate of 31%. |
7. Unaudited Pro forma Combined Statement of Income Adjustments Related to the Acquisition for the Twelve Months Ended June 30, 2017
| 7(a) | Represents a net adjustment of $14,081 from the elimination of historic Labels Division intangible asset amortization of $11,445 and the recognition of pro forma amortization expense of $25,526 on the portion of the purchase price allocated to definite-lived intangible assets as follows: |
| | | | | | | | | | | | |
| (in thousands) | | Preliminary
Fair Value | | | Estimated Useful
Life (years) | | | Amortization
Expense | |
Technology | | $ | 20,000 | | | | 4 | | | $ | 5,000 | |
Customer relationships | | | 390,000 | | | | 19 | | | | 20,526 | |
| | | | | | | | | | | | |
| | $ | 410,000 | | | | | | | $ | 25,526 | |
| | | | | | | | | | | | |
Less: Labels Division historical amortization for the
12 months ended June 30, 2017 | | | | | | | | | | | 11,445 | |
| | | | | | | | | | | | |
Total | | | | | | | | | | $ | 14,081 | |
| | | | | | | | | | | | |
| | Amortization expense has been calculated on a preliminary basis, using the straight-line method over the estimated useful life. The effect of a 10% increase or decrease in preliminary estimated fair value would result in an increase or decrease of amortization expense of $2,553 for the twelve months ended June 30, 2017. |
| 7(b) | Reflects the elimination of $665 of direct, incremental transaction costs incurred by the Company and Constantia Labels related to the Acquisition that are reflected in the historical statement of operations. The impact of these direct, incremental transaction costs already incurred have been eliminated in the unaudited pro forma combined statement of operations since these costs are nonrecurring in nature. These charges include financial advisory fees, legal, accounting, and other professional fees that are directly related to the Acquisition. |
| 7(c) | As mentioned in Note 3(c) above, the Company acquired Constantia Labels’ remaining noncontrolling interest in the Verstraete entity and the existing put options previously held by Constantia Labels were nullified. As such, this adjustment represents the reversal of the $3,257 interest expense and $2,513 of other income that was recognized as a result of those put options. |
| 7(d) | Represents the income tax effect of the Acquisition pro forma adjustments using a global weighted average statutory rate of 31%. Because the adjustments contained in this unaudited pro forma combined financial information are based on estimates, the effective tax rate will likely vary from the effective rate in periods subsequent to the Acquisition. Adjustments to established deferred tax assets and liabilities as well as the recognition of additional deferred tax assets and liabilities upon detailed analysis of the acquired assets and assumed liabilities may occur in conjunction with the finalization of the purchase accounting, and these items could be material. |
| 7(e) | As mentioned in Note 3(j) above, the Company is acquiring Constantia Labels’ remaining noncontrolling interest in Verstraete and certain assets of Afripack; thus, this adjustment represents a reduction in the income attributable to noncontrolling interest on behalf of those entities. |
8. Unaudited Pro forma Combined Statement of Operations Adjustments Related to the Financing for the Twelve Months Ended June 30, 2017
| 8(a) | To reflect the estimated contractual interest expense, amortization of OID, and amortization of debt issuance cost associated with the Senior Secured Facility and the notes offered hereby. The utilized weighted average contractual interest rate was 4.2%, which resulted in contractual interest expense of $57,318. Additional interest expense of $4,551 was recognized to reflect the amortization of OID and debt issuance costs. |
| | In the event the LIBOR rate rises 1/8%, interest expense recognized for the Senior Secured Facility would increase by approximately $1,096. |
| 8(b) | To reflect the removal of the historical interest expense (including amortized debt issuance cost) recognized by the Company due to the existing senior secured credit facility and the $15,781 of historical interest expense recognized by Constantia Labels due to the financing arrangements with Constantia. |
| | As part of the Transaction, the Company’s existing senior secured credit facility will be paid off, and, as mentioned in Note 3(e), the Company will acquire the loan receivable assets that correspond to the loan payable positions recognized by Constantia Labels from various other Constantia subsidiaries. Thus, the loan receivable and payable (and the resulting interest income and expense) will become an intercompany arrangement that will eliminate upon consolidation. |
| 8(c) | Represents the income tax effect of the Financing pro forma adjustments using a global weighted average statutory rate of 31%. |
9. Earnings per Share
The unaudited pro forma combined basic and diluted earnings per share calculations are based on the consolidated basic and diluted weighted average shares of Multi-Color. The pro forma basic and diluted weighted average shares outstanding are a combination of historic Multi-Color shares and the shares issued as part of the Transaction.
| | | | | | | | |
| (in thousands, except share amounts) | | Fiscal Year Ended
March 31, 2017 | | | Twelve Months Ended
June 30, 2017 | |
Pro forma net income attributable to Multi-Color Corporation | | $ | 62,342 | | | $ | 62,803 | |
Historical weighted-average number of common shares outstanding | | | | | | | | |
Basic | | | 16,879 | | | | 16,909 | |
Diluted | | | 17,024 | | | | 17,093 | |
Common shares issued as part of the Transaction | | | 3,384 | | | | 3,384 | |
Pro forma weighted-average number of common shares outstanding | | | | | | | | |
Basic | | | 20,263 | | | | 20,293 | |
Diluted | | | 20,408 | | | | 20,477 | |
Pro forma net income per common share | | | | | | | | |
Basic | | $ | 3.08 | | | $ | 3.09 | |
Diluted | | $ | 3.05 | | | $ | 3.07 | |
SELECTED HISTORICAL CONSOLIDATED FINANCIAL INFORMATION OF CONSTANTIA LABELS
The following selected historical consolidated financial information and other financial data for the years ended December 31, 2016, and 2015, and as of December 31, 2016 and 2015 have been derived from the audited consolidated financial statements and related notes for Constantia Labels included in this offering memorandum. The following selected historical consolidated financial information and other financial data for the six months ended June 30, 2017 and 2016 and at June 30, 2017 have been derived from the unaudited consolidated financial statements and related notes for Constantia Labels included in this offering memorandum. The following selected historical consolidated financial information and other financial data as of June 30, 2016 have been derived from Constantia Labels’ unaudited consolidated financial statements as of June 30, 2016 which are not included or incorporated by reference in this offering memorandum. Constantia Labels’ selected historical consolidated financial information is not necessarily indicative of the Company’s future performance. The financial information provided in this table is only selected, does not provide all of the information contained in Constantia Labels’ financial statements, and should also be read in conjunction with the sections of this offering memorandum entitled “Use of Proceeds,” “Capitalization” and “Management’s Discussion and Analysis of Financial Condition and Results of Operations of Constantia Labels.”
| | | | | | | | | | | | | | | | |
| | | Year Ended
December 31, | | | Six Months Ended
June 30, | |
| (Euros in thousands) | | 2016 | | | 2015 | | | 2017 | | | 2016 | |
Net revenues | | | 604,660 | | | | 540,837 | | | | 317,318 | | | | 304,542 | |
Gross profit | | | 110,934 | | | | 101,086 | | | | 64,128 | | | | 59,938 | |
Operating income | | | 55,955 | | | | 52,409 | | | | 33,301 | | | | 31,735 | |
Net income | | | 30,578 | | | | 26,580 | | | | 19,422 | | | | 14,686 | |
Net Working capital | | | (27,665 | ) | | | (64,105 | ) | | | (13,873 | ) | | | — | |
Total assets | | | 692,363 | | | | 645,570 | | | | 684,222 | | | | — | |
Stockholders’ equity (1) | | | 125,362 | | | | 111,131 | | | | 130,286 | | | | — | |
| (1) | The number used to report stockholders’ equity is the same as the total invested equity attributable to Constantia Labels. |
INDEX TO FINANCIAL STATEMENTS
| | | | |
| | | Page | |
Constantia Labels and Subsidiaries | | | | |
Audited Consolidated Financial Statements | | | | |
Report of Independent Registered Public Accounting Firm | | | F-2 | |
Consolidated Balance Sheets as of December 31, 2016 and 2015 | | | F-6 | |
Consolidated Statements of Income for Years Ended December 31, 2016 and 2015 | | | F-7 | |
Consolidated Statements of Comprehensive Income for Years Ended December 31, 2016 and 2015 | | | F-8 | |
Consolidated Statements of Cash Flows for Years Ended December 31, 2016 and 2015 | | | F-9 | |
Consolidated Statements of Stockholders’ Equity for Years Ended December 31, 2016 and 2015 | | | F-10 | |
Notes to Consolidated Financial Statements | | | F-11 | |
| |
Unaudited Condensed Consolidated Financial Statements | | | | |
Condensed Consolidated Balance Sheet (Unaudited) as of June 30, 2017 and December 31, 2016 | | | F-73 | |
Condensed Consolidated Statement of Profit or Loss (Unaudited) for the Periods Ending June 30, 2017 and 2016 | | | F-74 | |
Condensed Consolidated Statements of Comprehensive Income (Unaudited) for the Periods Ending June 30, 2017 and 2016 | | | F-75 | |
Condensed Consolidated Statements of Cash Flows (Unaudited) for the Periods Ending June 30, 2017 and 2016 | | | F-76 | |
Condensed Consolidated Statement of Changes in Invested Equity for the Periods Ending June 30, 2017 and 2016 | | | F-77 | |
Notes to Condensed Consolidated Financial Statements (Unaudited) | | | F-78 | |
F-1
Report of Independent Auditors
We have audited the accompanying combined financial statements of the Labels division of Constantia Flexibles Group GmbH, Vienna (the “Company”), which comprise the combined balance sheets as of December 31, 2016 and December 31, 2015 and the related combined statements of profit or loss, the combined statements of other comprehensive income, the combined statements of cash flow and the combined statements of changes in invested equity for the years then ended.
Management’s Responsibility for the Combined Financial Statements
Management is responsible for the preparation and fair presentation of the combined financial statements in accordance with the International Financial Reporting Standards as issued by the International Accounting Standards Board (“IASB”); this includes the design, implementation, and maintenance of internal control relevant to the preparation and fair presentation of combined financial statements that are free from material misstatement, whether due to fraud or error.
Auditor’s Responsibility
Our responsibility is to express an opinion on the combined financial statements based on our audits. We conducted our audits in accordance with auditing standards generally accepted in the United States of America. Those standards require that we plan and perform the audit to obtain reasonable assurance about whether the combined financial statements are free from material misstatement.
An audit involves performing procedures to obtain audit evidence about the amounts and disclosures in the combined financial statements. The procedures selected depend on the auditor’s judgment, including the assessment of the risks of material misstatement of the combined financial statements, whether due to fraud or error. In making those risk assessments, we consider internal control relevant to the Company’s preparation and fair presentation of the combined financial statements in order to design audit procedures that are appropriate in the circumstances, but not for the purpose of expressing an opinion on the effectiveness of the Company’s internal control. Accordingly, we express no such opinion. An audit also includes evaluating the appropriateness of accounting policies used and the reasonableness of significant accounting estimates made by management, as well as evaluating the overall presentation of the combined financial statements. We believe that the audit evidence we have obtained is sufficient and appropriate to provide a basis for our audit opinion.
Opinion
In our opinion, the combined financial statements referred to above present fairly, in all material respects, the financial position of the Company as of December 31, 2016 and December 31, 2015 and the results of its operations and its cash flows for the years then ended in accordance with the International Financial Reporting Standards as issued by the IASB.
F-2
Emphasis of Matter
We draw attention to Note A to the combined financial statements, which describes the basis of accounting. As the Labels division of Constantia Flexibles Group GmbH, Vienna, has not operated as a separate entity, these combined financial statements are, therefore, not necessarily indicative of results that would have occurred if the Labels division of Constantia Flexibles Group GmbH, Vienna, had been a separate stand-alone entity during the years presented or of future results of the Labels division of Constantia Flexibles Group GmbH, Vienna. Our opinion is not modified in respect to this matter.
As discussed in Note M to the combined financial statements, the Company has entered into significant transactions with related parties. Our opinion is not modified with respect to this matter.
Kind regards,
Alexandra Rester
Austrian Certified Public Accountant
PwC Wirtschaftsprüfung GmbH
Vienna, September 7, 2017
F-3

IFRS COMBINED FINANCIAL
STATEMENTS 2015 & 2016
F-4
Content
F-5
COMBINED BALANCE SHEET
| | | | | | | | | | | | |
(in€ thousand) | | Note | | | 12/31/2015 | | | 12/31/2016 | |
Assets | | | | | | | | | | | | |
Goodwill | | | H1 | | | | 128,858 | | | | 149,457 | |
Intangible assets | | | H1 | | | | 62,802 | | | | 59,773 | |
Tangible assets | | | H1 | | | | 176,354 | | | | 196,431 | |
Othernon-current and financial assets | | | H2 | | | | 32,907 | | | | 5,401 | |
Deferred tax assets | | | I8 | | | | 547 | | | | 1,127 | |
| | | | | | | | |
Non-current assets | | | | | | | 401,468 | | | | 412,189 | |
| | | |
Inventories | | | H3 | | | | 63,166 | | | | 72,794 | |
Trade receivables | | | H4 | | | | 81,515 | | | | 98,368 | |
Tax receivables | | | | | | | 2,238 | | | | 3,416 | |
Other receivables | | | H5 | | | | 86,768 | | | | 81,971 | |
Cash and cash equivalents | | | | | | | 10,417 | | | | 23,625 | |
| | | | | | | | |
Current assets | | | | | | | 244,103 | | | | 280,174 | |
| | | | | | | | |
Total assets | | | | | | | 645,570 | | | | 692,363 | |
| | | | | | | | |
| | | |
Equity and liabilities | | | | | | | | | | | | |
Total invested equity attributable to Division LABELS | | | | | | | 111,131 | | | | 125,362 | |
Non-controlling interests | | | | | | | 18,400 | | | | 21,774 | |
| | | | | | | | |
Total invested equity | | | H6 | | | | 129,531 | | | | 147,136 | |
| | | |
Provisions | | | H7 | | | | 971 | | | | 1,338 | |
Interest-bearing financial liabilities | | | H8 | | | | 107,782 | | | | 138,494 | |
Othernon-current liabilities | | | H8 | | | | 70,334 | | | | 74,161 | |
Deferred tax liabilities | | | I8 | | | | 28,745 | | | | 23,396 | |
| | | | | | | | |
Non-current financial liabilities | | | | | | | 207,832 | | | | 237,390 | |
| | | |
Provisions | | | H7 | | | | 258 | | | | 214 | |
Interest-bearing financial liabilities | | | H8 | | | | 4,775 | | | | 5,702 | |
Trade payables | | | H8 | | | | 66,654 | | | | 80,496 | |
Tax liabilities | | | H8 | | | | 6,979 | | | | 5,779 | |
Other current liabilities | | | H8, H9 | | | | 229,542 | | | | 215,648 | |
| | | | | | | | |
Current financial liabilities | | | | | | | 308,208 | | | | 307,839 | |
| | | | | | | | |
Total equity and liabilities | | | | | | | 645,571 | | | | 692,364 | |
| | | | | | | | |
F-6
COMBINED STATEMENTOF PROFITOR LOSS
| | | | | | | | | | |
(in€ thousand) | | Note | | 2015 | | | 2016 | |
Sales | | I1 | | | 540,837 | | | | 604,660 | |
| | | |
Cost of Goods sold | | | | | (439,751 | ) | | | (493,726 | ) |
| | | |
Gross Profit | | | | | 101,086 | | | | 110,934 | |
| | | |
Selling Expenses | | | | | (27,445 | ) | | | (30,639 | ) |
Research and Development Expenses | | | | | (1,289 | ) | | | (1,486 | ) |
Administration Expenses | | | | | (23,405 | ) | | | (26,166 | ) |
Other Income | | I2 | | | 4,678 | | | | 5,626 | |
Other Expenses | | I5 | | | (1,216 | ) | | | (2,312 | ) |
| | | | | | |
| | | |
Earnings before interest and tax (EBIT) | | | | | 52,409 | | | | 55,955 | |
| | | |
Interest income | | | | | 3,327 | | | | 289 | |
Interest expense | | | | | (16,783 | ) | | | (19,296 | ) |
Other financial income and expense | | | | | (2,574 | ) | | | (2,276 | ) |
| | | | | | |
Financial income and expense | | I6 | | | (16,030 | ) | | | (21,282 | ) |
| | | |
Earnings before tax (EBT) | | | | | 36,379 | | | | 34,673 | |
| | | |
Current tax | | I7 | | | (10,553 | ) | | | (13,224 | ) |
Deferred tax | | I8 | | | 754 | | | | 9,129 | |
| | | | | | |
Income tax | | | | | (9,799 | ) | | | (4,095 | ) |
| | | |
Net income after tax | | | | | 26,580 | | | | 30,578 | |
| | | |
Thereof attributable to: | | | | | | | | | | |
Owners of the company | | | | | 18,024 | | | | 23,152 | |
Non-controlling interests | | | | | 8,556 | | | | 7,425 | |
As Division Labels does not represent unified legal group whose securities are publicly traded, there are no earnings per share disclosures, as would be required by IAS 33 “Earnings per Share.”
F-7
COMBINED STATEMENTOF OTHER COMPREHENSIVE INCOME
| | | | | | | | | | | | |
(in€ thousand) | | Note | | | 2015 | | | 2016 | |
Net income after tax | | | | | | | 26,580 | | | | 30,578 | |
| | | |
Items that will be reclassified subsequently
to profit or loss under given circumstances: | | | | | | | 6,394 | | | | 3,560 | |
Effective portion of changes in fair value of cash flow hedges | | | K | | | | 592 | | | | (1,316 | ) |
Gain/(loss) through changes in fair value | | | | | | | 130 | | | | (1,167 | ) |
Transfer to profit and loss account | | | | | | | 462 | | | | (149 | ) |
| | | |
Currency translation differences | | | | | | | 5,845 | | | | 4,906 | |
Changes in exchange differences recognized on
translation of foreign subsidiaries | | | | | | | | | | | | |
Transfer to profit and loss account | | | | | | | | | | | | |
| | | |
apportioned deferred taxes | | | | | | | (43 | ) | | | (30 | ) |
| | | |
Items that will not be | | | | | | | (17 | ) | | | (200 | ) |
reclassified to profit or loss: | | | | | | | | | | | | |
Change in actuarial gains/losses | | | H8 | | | | | | | | | |
Actuarial gains/losses | | | | | | | (9 | ) | | | (281 | ) |
apportioned deferred taxes of actuarial gains/losses | | | | | | | (8 | ) | | | 81 | |
| | | | | | | | | | | | |
Other comprehensive income for the period | | | | | | | 6,377 | | | | 3,360 | |
| | | | | | | | | | | | |
Total comprehensive income for the period | | | | | | | 32,957 | | | | 33,938 | |
| | | |
Thereof attributable to: | | | | | | | | | | | | |
Owners of the company | | | | | | | 25,365 | | | | 25,148 | |
Non-controlling interests | | | | | | | 7,592 | | | | 8,790 | |
F-8
COMBINED STATEMENTOF CASH FLOWS
| | | | | | | | | | | | |
(in€ thousand) | | Note | | | 2015 | | | | 2016 | |
| | | | |
Earnings before tax (EBT) | | | | | 36,379 | | | | 34,673 | |
+/(-) | | Net interest | | | | | 13,456 | | | | 19,007 | |
+/(-) | | Depreciation and amortization/(reversal) of tangible | | | | | | | | | | |
| | and intangible assets | | I4 | | | 39,398 | | | | 44,009 | |
+/(-) | | Gain/(loss) upon disposal of tangible and | | | | | | | | | | |
| | intangible assets | | | | | (222 | ) | | | (215 | ) |
(-) | | Dividend income | | | | | (3,956 | ) | | | (4,740 | ) |
+ | | Carve out push down of expenses | | H6 | | | 1,545 | | | | 0 | |
+/(-) | | Othernon-cash (income)/expenses | | | | | 3,917 | | | | 4,953 | |
| | | | | | | | |
Cashflow from the result | | | | | 90,516 | | | | 97,687 | |
+/(-) | | Inventory | | | | | (5,249 | ) | | | (2,535 | ) |
+/(-) | | Trade receivables | | | | | 9,523 | | | | (7,069 | ) |
+/(-) | | Trade payables | | | | | (1,940 | ) | | | 4,411 | |
+/(-) | | Other receivables | | | | | 3,742 | | | | 48 | |
+/(-) | | Provisions | | | | | 361 | | | | (132 | ) |
+/(-) | | Other liabilities | | | | | (889 | ) | | | 1,477 | |
(-) | | Tax payments | | | | | (8,838 | ) | | | (14,244 | ) |
+ | | Interest received | | | | | 1,885 | | | | 610 | |
(-) | | Interest paid | | | | | (15,192 | ) | | | (17,408 | ) |
| | | | | | | | |
Cash flow from operating activities | | | | | 73,918 | | | | 62,845 | |
+ | | Sales of tangible and intangible assets | | | | | 1,188 | | | | 1,323 | |
(-) | | Investments in tangible and intangible assets | | | | | (33,230 | ) | | | (38,038 | ) |
(-) | | Acquisition of subsidiaries, less cash transferred | | J | | | 0 | | | | (33,600 | ) |
+ | | Dividends received | | | | | 2,399 | | | | 3,956 | |
(-) | | Payments for loans granted | | | | | (14,970 | ) | | | (27,072 | ) |
+ | | Proceeds from loans paid back | | | | | 15,717 | | | | 32,607 | |
+/(-) | | Proceeds/(Payments) other financial investments | | | | | (20,927 | ) | | | 0 | |
| | | | | | | | |
Cash flow from investing activities | | | | | (49,823 | ) | | | (60,822 | ) |
+ | | Increases in financial liabilities | | | | | 31,686 | | | | 60,881 | |
(-) | | Redemption of financial liabilities | | | | | (35,641 | ) | | | (21,079 | ) |
+ | | Capital contribution | | | | | 16,194 | | | | 300 | |
(-) | | Payments tonon-controlling interests | | H6 | | | 0 | | | | 0 | |
(-) | | Dividends paid to company owners | | | | | (21,520 | ) | | | (23,537 | ) |
(-) | | Dividends paid tonon-controlling interests | | H6 | | | (9,691 | ) | | | (5,577 | ) |
| | | | | | | | |
Cash flow from financing activities | | | | | (18,972 | ) | | | 10,987 | |
Change in cash and cash equivalents due to exchange rate differences | | | | | 169 | | | | 197 | |
| | | | | | | | |
Change in cash and cash equivalents | | | | | 5,293 | | | | 13,207 | |
| | | | | | | | |
Cash and cash equivalents at the beginning of the period | | | | | 5,125 | | | | 10,417 | |
| | | | | | | | |
Cash and cash equivalents at the end of the period | | | | | 10,417 | | | | 23,625 | |
| | | | | | | | |
F-9
COMBINED STATEMENTOF CHANGES IN INVESTED EQUITY
| | | | | | | | | | | | | | | | | | | | | | | | | | | | |
(in€ thousand) | | Net assets attributable
toDivision LABELS | | | Currency translation
differences | | | Hedging reserves for
cash flow hedges | | | Actuarial gains and
losses | | | Total invested equity
attributable to
Division LABELS | | | Non-controlling
interests | | | Total invested
equity | |
| | |
Balance at 1 January 2015 | | | 92,782 | | | | 6,208 | | | | (648 | ) | | | (705 | ) | | | 97,638 | | | | 20,499 | | | | 118,137 | |
Net income | | | 18,024 | | | | | | | | | | | | | | | | 18,024 | | | | 8,556 | | | | 26,580 | |
Other comprehensive income (loss), net of tax | | | | | | | 6,847 | | | | 511 | | | | (17 | ) | | | 7,341 | | | | (964 | ) | | | 6,377 | |
Total comprehensive income (loss), net of tax | | | 18,024 | | | | 6,847 | | | | 511 | | | | (17 | ) | | | 25,365 | | | | 7,592 | | | | 32,957 | |
| | |
Capital increase | | | 16,194 | | | | | | | | | | | | | | | | 16,194 | | | | | | | | 16,194 | |
Carve out tax | | | 1,399 | | | | | | | | | | | | | | | | 1,399 | | | | | | | | 1,399 | |
Carve out push down of expenses | | | 1,545 | | | | | | | | | | | | | | | | 1,545 | | | | | | | | 1,545 | |
Dividends | | | (31,010 | ) | | | | | | | | | | | | | | | (31,010 | ) | | | (9,691 | ) | | | (40,701 | ) |
Other transactions | | | (11,872 | ) | | | | | | | | | | | | | | | (11,872 | ) | | | (9,691 | ) | | | (21,563 | ) |
| | |
Balance at 31 December 2015 | | | 98,934 | | | | 13,054 | | | | (137 | ) | | | (722 | ) | | | 111,131 | | | | 18,400 | | | | 129,531 | |
| | |
Balance at 1 January 2016 | | | 98,934 | | | | 13,054 | | | | (137 | ) | | | (722 | ) | | | 111,131 | | | | 18,400 | | | | 129,531 | |
Net income | | | 23,152 | | | | | | | | | | | | | | | | 23,152 | | | | 7,425 | | | | 30,578 | |
Other comprehensive income (loss), net of tax | | | | | | | 3,508 | | | | (1,312 | ) | | | (199 | ) | | | 1,996 | | | | 1,365 | | | | 3,361 | |
Total comprehensive income (loss), net of tax | | | 23,152 | | | | 3,508 | | | | (1,312 | ) | | | (199 | ) | | | 25,149 | | | | 8,790 | | | | 33,939 | |
| | |
First Consolidation Afripack Consumer Flexibles (Labels) Pty. Ltd. | | | 3,072 | | | | | | | | | | | | | | | | 3,072 | | | | 1,392 | | | | 4,463 | |
AcquisitionNon-controlling Interests | | | 1,232 | | | | | | | | | | | | | | | | 1,232 | | | | (1,232 | ) | | | 0 | |
Capital increase | | | 300 | | | | | | | | | | | | | | | | 300 | | | | | | | | 300 | |
Carve out tax | | | 1,498 | | | | | | | | | | | | | | | | 1,498 | | | | | | | | 1,498 | |
Dividends | | | (17,019 | ) | | | | | | | | | | | | | | | (17,019 | ) | | | (5,577 | ) | | | (22,595 | ) |
Other transactions | | | (10,917 | ) | | | 0 | | | | 0 | | | | 0 | | | | (10,917 | ) | | | (5,417 | ) | | | (16,334 | ) |
| | |
Balance at 31 December 2016 | | | 111,170 | | | | 16,562 | | | | (1,449 | ) | | | (921 | ) | | | 125,362 | | | | 21,774 | | | | 147,136 | |
| | |
F-10
NOTESTOTHE COMBINED FINANCIAL STATEMENTS
A. GENERAL
Introduction and Background
Constantia Flexibles Holding GmbH (Constantia Flexibles), headquartered at Handelskai 92, Vienna, with its ultimate parent company Wendel SA, is a global producer of flexible packaging products. The products are mainly based on aluminum (foil), film and paper and the product portfolio includes everyday use products such as food, dairy, pet food, household and personal care products, pharmaceutical and medical products, as well as beverages. Constantia Flexibles classifies its product portfolio into three divisions: Food, Pharma and Labels. The Food division is a global leader in several of its market segments (confectionery packaging, pre-cut seals, and aluminum wrapping). The Pharma division is second-largest manufacturer of foil based blister packs for medication. The Division Labels is the world’s leading manufacturer of beer labels and in-mold labels.
During the first halfyear of 2017, the Managing Board of Constantia Flexibles announced its intent to sell the Division Labels and in July 2017 signed the Share purchase agreement with Multi-Color Corporation. The combined financial statements are prepared on a basis consistent with the planned transaction
The Combined Financial Statements include:
| | • | | Combined Balance Sheet, |
| | • | | Combined Statements of Profit or Loss, |
| | • | | Combined Statements of Other Comprehensive Income, |
| | • | | Combined Statements of Changes in Invested Equity and |
| | • | | the Combined Statements of Cash Flows |
The Combined Financial Statements were prepared in accordance with accounting policies set out in the sections “Basis of Preparation” and “Accounting policies”.
The Combined Financial Statements have been prepared in thousands of euro (€ thousand). Rounding differences may arise when individual amounts or percentages are added together.
During the reporting periods of the Combined Financial Statements, the Division Labels was ultimately centrally managed by the Managing Board of Constantia Flexibles, as well as the members of the Extended Management Board - Labels. Historically, the Division Labels has been reported as a separate segment within the consolidated financial statements of Constantia Flexibles Group GmbH (subsidiary of the Constantia Flexibles Holding GmbH) which were prepared for the Vienna stock exchange purposes for the financial periods 2015 and 2016. The Managing Board of Constantia Flexibles, located in Vienna prepared and authorized the issuance of the Combined Financial Statements on September 7, 2017.
Description of the Division Labels transaction scope
The Division Labels includes pressure-sensitive, in-mould as well as film labels (including sleeve) and cut-and stack labels. The Division Labels focuses on prime labels for beverages (incl. soft drinks, beer and water), HPC and food (mainly within in-mould labels for injection moulding)
An overview of the legal entities that comprise the Labels activities and from which the Labels activities were considered for inclusion in the scope of combination of the Combined Financial Statements is presented in the Chapter N (Division Labels Entities):
Based on a legal view, the Division Labels does not constitute a sub-group. Historically, the Division Labels has been largely operated on a stand-alone basis and comprises legal entities which are fully dedicated to the Division Labels. The only exception is Afripack, where only one plant (Afripack Durban) belongs to the Division Labels. This
F-11
plant is included in the scope of the combined financial statements. In the course of the transaction a carve-out of the plant into a new separate legal entity fully dedicated to the Division Labels is planned. For Afripack Durban exists a separate accounting area, so all financial information is distinct from the remaining Afripack plants and can be assigned clearly to the Division Labels. Further legal reorganization is not needed.
Constantia Labels GmbH is shareholder of two subsidiaries, Constantia Ebert GmbH and Constantia Nusser GmbH, that are fully assigned to other segments and do not operate within the Division Labels. For the Combined Financial Statements the investments in those two subsidiaries were eliminated via Equity directly as of January 1, 2015.
During the reporting periods covered by the combined financial statements, the Division Labels is not a legal entity in its own right. It is an integral part of Constantia Flexibles, and as such, there is no separate share capital in the combined financial statements of the division Labels. Total invested equity attributable to shareholders of the Division Labels represents Constantia’s interest in the recorded net assets of the Division Labels. The Division Labels is therefore still part of Constantia Flexibles during the reporting periods presented within these Combined Financial Statements. The non-Labels activities of Constantia Flexibles are referred to as “Remaining Constantia Flexibles” for purposes of the combined financial statements (as further defined below). Non-Labels activities do not exist to a material extent.
Basis of Preparation
General principles
The Division Labels historically has not prepared separate consolidated financial statements for internal or external reporting purposes. Constantia Flexibles has prepared these Combined Financial Statements for use for an agreed upon transaction with Multi-Color Corporation . These combined financial statements were prepared in accordance with International Financial Reporting Standards (“IFRSs”) as issued by the International Accounting Standards Board (IASB).
The Division Labels used the same accounting policies and valuation methods for the preparation of these Combined Financial Statements as those used by Constantia Flexibles companies for the preparation of the financial information included in Constantia Flexibles consolidated financial statements, unless such accounting policies and valuation methods are not in accordance with IFRS when presenting the Division Labels as a group of companies and operations independent of Constantia Flexibles. The Combined Financial Statements were prepared on the historical carrying amounts as included in Constantia Flexibles Group GmbH consolidated financial statements.
Since IFRS does not provide any guidance for the preparation of Combined Financial Statements, IAS 8.10 and 8.12 have been used for the preparation of the Combined Financial Statements. In the absence of IFRS specific guidance, IAS 8.10 requires management to use judgment in developing and applying accounting policies which produce information that is relevant to users, reliable and free from bias, and complete in all material respects. In addition, IAS 8.12 requires that the latest pronouncements of other standard setters, other accounting literature and accepted industry practice should be considered when developing accounting policies. The developed accounting policies are described in this Note.
The Combined Financial Statements are comprised of the Combined Balance Sheet as of December 31, 2016 and, December 31, 2015 the Combined Statements of Profit or Loss, the Combined Statements of Other Comprehensive Income, the Combined Statements of Changes in Invested Equity and the Combined Statements of Cash Flows for the years ended at December 31, 2016, 2015 and as well as all required notes.
As Constantia Flexibles prepared its Consolidated Statements of Profit or Loss using the cost of sales (function of expense) method in accordance with IAS 1, the Combined Financial Statements of Income for the Division Labels are prepared based on this approach as well.
F-12
The Combined Financial Statements may not be indicative of the Division Labels future performance and do not necessarily reflect what it’s combined results of operations, financial position and cash flows would have been had the Division Labels operated as an independent group/business during the periods presented. In addition to favorable industry and market conditions including raw material costs, the future profitability and cash flows of the Division Labels depends on its ability to receive financing. Historically, financing has been made available via legal entities to the Division Labels by Constantia’s Treasury function.
Carve-out Considerations
Division Labels Combined Financial Statements are presented using the historical purchase price allocation figures. Purchase price allocation effects arising from the first consolidation in the Wendel group (ultimate parent) following the acquisition of the Constantia Flexibles by Wendel as of March 26, 2015 are excluded from the scope to present reported period 2015 and 2016 consistently.
The Combined Financial Statements have been prepared on a “carve-out” basis from the Constantia Flexibles Group GmbH consolidated financial statements using the historical results from operations, assets and liabilities and cash flows attributable to the Division Labels and include allocations of revenue, income, expenses, assets and liabilities from Constantia Flexibles.
As most subsidiaries of the Labels division are fully dedicated to the Labels operations, all financial information is explicitly assignable to the Labels division and further allocation keys are not needed.
Combined Statements of Profit or Loss
The Combined Statements of Profit or Loss reflects the revenue and expenses attributable to the Division Labels. Revenue or operating expenses of the Division Labels were specifically identified as pertaining to the Division Labels without allocation keys and apportionment as each subsidiary or accounting area is fully dedicated to the Division Labels’ activities.
Other income or expenses incurred by Constantia Flexibles were allocated to the Division Labels to the extent that they were related to the Division Labels’ activities. The headquarter services are charged to the group entities through
(i) direct charges, if the services and costs can be determined and directly allocated and
(ii) through management fees.
Constantia Flexibles applies a standard mark-up of 7% on total costs for the services (which Management noted is at arm’s length). Indirect costs are allocated to the group entities based on different allocation keys (mainly external sales, balance sheet total, number of employees).
Constantia Flexibles management services include the following:
The extended management board has overall responsibility, including Constantia’s strategic planning and determination of the overall strategy. The management fee includes the compensation for Mike Henry (EVP Labels), Oliver Apel (FD Labels) 50% of Ottmar Raum (Head of H&N), 50% of Dan Muenzer (VP Marketing Spear) and two controller in the headquarter exclusively working for the Division Labels. The allocation key in use are the external sales of the Division Labels and its total assets.
Accounting and controlling is responsible for internal and external reporting, controlling and consolidation. This services are allocated to the Division Labels based on total sales and total assets of Constantia Flexibles related to the Division Labels.
Corporate development and M&A services manages the process from screening of the potential transaction target from a strategic point of view to the closing of share purchase price agreements. The charges for the Division Labels are determined by Constantia Flexibles total sales and a weighting of total sales, total assets and the number of employees at Constantia Flexibles assignable to the Division Labels.
F-13
Communication and investor relations is responsible for communication related services within the capital market items. Total sales per Labels entity are the allocation key in use to determine the share for the Division Labels.
Constantia Flexibles finance and treasury services performs the finance services (e.g. cash management, risk management, information supply, insurance policies, hedging, liquidity management, etc.). The share allocated to the Division Labels is determined by the weighting the portion of total sales, total assets and outstanding credit limits for each Labels entity.
Legal and tax department is involved in all essential legal and tax issues at a strategic level in relation to M&A, loan agreements, employment contracts, stock exchange, capital market. Furthermore, it is responsible for all strategic tax planning matters of Constantia Flexibles. The allocation key is calculated by the weighting of total external sales, total assets and the number of employees. This allocation key also applies for internal audit, who performs internal audit service for whole Constantia Flexibles on a regular basis.
Human Resource Management is responsible for recruiting, assessing and selecting top managers for Constantia Flexibles and costs are solely allocated by the number of employees.
Sales and product management: As a basic principle, the production entities of the division sell and deliver their products directly to the customers. The sales entities of Constantia Flexibles perform sale support activities either directly or by involving local third party sales representative/agents if necessary. Charges for sales and product management are allocated based on total sales and total assets.
Research and development: Constantia Flexibles has a couple of R&D centers including H&N GmbH for the Division Labels. R&D activities in Constantia Flexibles processes and mainly relate to production processes after the rolling phase. In general, the development of application technology is the most crucial R&D function, while fundamental research represents only a very small portion of the whole R&D activities. The R&D center also covers quality control and regulatory affairs. The R&D activities focus on client-oriented development of the application technology and therefore the R&D centers work closely together with customers. The application engineers of the R&D centers are in regular contact with the sales managers and participate in the sales meetings for information exchange purposes. As H&N is included in the Division Labels, intragroup charges for the Division Labels are not material. Any R&D costs incurred at headquarter would be allocated based on total sales of Constantia Flexibles and sales of the Division Labels.
Procurement and global sourcing: Purchasing has a decentralized organization with a central coordination function at the headquarters. Within each production site, there is a person responsible for local procurements (selection of small volume third party suppliers for local demand, negotiating contractual terms, etc.). All category strategies incl. price negotiations – relevant categories are coordinated and defined by Constantia Flexibles procurement. Raw materials such as aluminum are hedged on Constantia Flexibles level by the treasury department. Charges for procurement and global sourcing are determined by the purchase volume of the Division Labels.
IT – Constantia Flexibles does not have a uniform and centralized IT structure for historical reasons. Since strategic decisions were always taken on division level, the IT strategy differs from division to division. IT costs are charged based on weighted total external sales and number of employees.
The allocation keys are generally consistent with those Constantia Flexibles used to allocate expenses among its segments.
Management considers these allocations to be a reasonable reflection of the utilization of services provided.If the Division Labels would have been a separate, standalone company, its expenses may have differed significantly from amounts reflected in the Combined Statements of Income.
F-14
Combined Balance Sheet
Inventories, accounts receivable, property, plant, and equipment, buildings, land, intangible assets (except for goodwill), accounts payable, employee-related provisions and other accruals were directly attributable to the Division Labels as each subsidiary or accounting area is fully dedicated to the Division Labels’ activities.
In the course of the carve-out of the Division Labels the CGU structure changed. In the Consolidated Financial statements of Constantia Flexibles, the division Labels did constitute a single CGU. The segment reporting did not contain any regional or single plant based information. However, within the Labels division the regional managers did report financial information to the EVP. Thus, there is financial information covering the period of the Combined Financial Statements available and a new CGU structure was set up. Consequently, the goodwill recognized at Group Level needed to be recognized based on the relative values of each new CGU. The relative value is usually based on the recoverable amounts of the CGUs. Therefore, the Labels division calculated its relative values based on the value in use of each CGU. The relative values are calculated based on the total carrying amount and total goodwill as of December 31, 2015. The acquisition of Pemara Labels Group in 2016 resulted in an additional separate CGU and a directly attributable goodwill. The CGU structure and the referring carrying amounts of goodwill are shown in Note (Goodwill).
Total invested equity attributable to shareholders of the Division Labels—Because a direct ownership relationship did not exist among the various operations comprising the Division Labels, total invested equity attributable to shareholders of the Division Labels represents Constantia Flexibles’s interest in the recorded net assets of the Division Labels and is shown in lieu of shareholder’s equity in the Combined Financial Statements. Total invested equity attributable to shareholders of the Division Labels does not includes the settlement of intercompany transactions with the Parent.
Income taxes were determined based on the assumption that the operations in the Division Labels were separately taxable entities. This assumption implies that the current and deferred income taxes of all operations are calculated separately and the recoverability of the deferred tax assets is also assessed accordingly. The operations of the Division Labels did not file standalone tax returns in previous years, as they were not separate legal entities and were integrated into non-Labels tax groups. The respective current tax assets, liabilities and deferred tax assets on loss carry forwards, needed to be allocated to the Division Labels entities, assets and liabilities. For all traditional and reverse carve-out locations this allocation is performed based on the assumption, that either the contribution from or the distribution to the respective tax filing group member, has a corresponding effect in the equity of the tax filing group member as of the end of the fiscal year. For all carve-out locations current taxes, either historically incurred or allocated are deemed to be paid by the respective tax filing group member and hence included in the line item “income taxes paid” in the Combined Statements of Cash Flows.
In order to determine the taxable income, a hypothetical transfer-pricing model was applied, taking into account equalization payments for both, over- and under-utilization to the target margins.
Management considers the separate tax return approach to be reasonable, but not necessarily indicative of the tax income or expenses that would have been incurred if the entities and operations were indeed separate taxable entities.
Non-controlling interest attributable to subsidiary Verstraete in-mould Labels NV was recognized in the full amount despite of fact that put call option was contracted between the Division Labels and the non-controlling shareholder. This accounting treatment is different to the Constantia Flexibles consolidated financial statements where the non-controlling interest is reduced by the recognition of the put call option liability.
Combined Statements of Cash Flows
The Division Labels financing requirements are primarily met by the cash transfers with Constantia Flexibles and are reflected in the financing and the investing section of the Combined Statements of Cash Flows. This
F-15
represents net cash transfers to and from Constantia Flexibles Treasury function for the settlement of various intercompany transactions and financing requirements with Constantia Flexibles.
Financing of the Labels division
Historically, Constantia Flexibles managed the financing of the Division Labels’ business and utilized a centralized approach to cash management. In addition to cash and cash equivalents balances held directly at various locations, the Division Labels pools cash balances, cash deposits and funding directly with the centralized Constantia Flexibles Treasury function.Constantia Flexibles treasury agrees interest rates with each group entity.The financing presented in the Combined Financial Statements may differ significantly from the financing of the future standalone Division Labels.
The capital structure attributed to the Division Labels in connection with the preparation of these Combined Financial Statements is presented as total invested equity attributable to the shareholders of the Division Labels, and as such, is not indicative of the capital structure that the Division Labels would have required had it been a standalone entity during the reporting periods presented.
F-16
B. REPORTING CURRENCY AND CURRENCY TRANSLATION
Functional currency and presentation currency
These combined financial statements are presented in euros, the presentation currency of the parent company. The combined financial statements have been drawn up in thousands of euros. Numerous amounts and percentages reported in the combined financial statements have been rounded, so totals may differ from the amounts presented.
Foreign currency transactions
Foreign currency transactions were translated into the relevant functional currency of the Divisional entities at the transaction date using the exchange rate prevailing at that time. Monetary assets and liabilities denominated in a foreign currency at the closing date were translated into the functional currency at the closing rate. Non-monetary assets and liabilities measured in a foreign currency at fair value were translated at the exchange rate prevailing at the date when fair value was determined. Currency translation differences from the translation of transactions are generally recognized in profit or loss for the period.
In the reporting periods exchange rate differences (operating result and net financial income and expense) in the amount of 2015:€4,904 thousand (expense), 2016:€4,243 thousand (expense), were recognized in the combined statement of profit or loss.
Foreign operations
Assets and liabilities of entities whose functional currency is not the euro, including goodwill and fair value adjustments arising on acquisition, are translated into euros at the closing rate at the reporting date. The income and expenses of foreign operations are translated on a monthly basis using the monthly average exchange rate.
Currency translation differences are recognized in other comprehensive income and presented in the currency translation reserve in equity, to the extent that the currency translation difference is not attributable to non-controlling interest.
Upon the disposal of a foreign operation, the corresponding cumulative amount in the currency translation reserve is reclassified to the statement of profit or loss as part of the disposal gain/loss. In the case of only partial disposal without loss of control of the subsidiary, the corresponding portion of the cumulative amount of the currency translation difference is allocated to non-controlling interest. If the settlement of monetary items in the form of receivables or liabilities from or to a foreign operation is neither planned nor likely to occur in the foreseeable future, the resulting foreign exchange gains and losses are recognized as part of the net investment in the foreign operation.
F-17
Currencies relevant to the Group
The exchange rates of the currencies relevant to Division Labels are as follows:
| | | | | | | | | | | | | | | | | | | | |
| | | | | | Reference rate at the
balance sheet date | | | Annual average rate | |
| | | | | | 12/31/2015 | | | 12/31/2016 | | | 2015 | | | 2016 | |
United Arab Emirates Dirham | | | AED | | | | 3.98810 | | | | 3.86240 | | | | 4.08963 | | | | 4.06427 | |
Australian Dollar | | | AUD | | | | 1.48970 | | | | 1.45960 | | | | 1.48310 | | | | 1.48773 | |
Canadian Dollar | | | CAD | | | | 1.51160 | | | | 1.41880 | | | | 1.41628 | | | | 1.46665 | |
Chinese Yuan Renminbi | | | CNY | | | | 7.06080 | | | | 7.32020 | | | | 6.98666 | | | | 7.31989 | |
Czech Crown | | | CZK | | | | 27.02300 | | | | 27.02100 | | | | 27.32883 | | | | 27.04250 | |
Danish Krone | | | DKK | | | | 7.46260 | | | | 7.43440 | | | | 7.45922 | | | | 7.44743 | |
British Pound | | | GBP | | | | 0.73395 | | | | 0.85618 | | | | 0.72794 | | | | 0.81251 | |
Indonesian Rupiah | | | IDR | | | | n/a* | | | | 14,167.68000 | | | | n/a* | | | | 14,775.34667 | |
Indian Rupee | | | INR | | | | 72.02150 | | | | 71.59350 | | | | 71.40098 | | | | 74.23577 | |
Mexican Peso | | | MXN | | | | 18.91450 | | | | n/a* | | | | 17.58337 | | | | n/a* | |
Malaysian Ringgit | | | MYR | | | | 4.69590 | | | | 4.72870 | | | | 4.30803 | | | | 4.56103 | |
Polish Zloty | | | PLN | | | | 4.52400 | | | | 4.53900 | | | | 4.43730 | | | | 4.49205 | |
New Romanian Leu | | | RON | | | | 4.26390 | | | | 4.41030 | | | | 4.18484 | | | | 4.36220 | |
Russian Ruble | | | RUB | | | | 80.67360 | | | | 64.30000 | | | | 68.07342 | | | | 74.67359 | |
Swedish Crown | | | SEK | | | | 9.18950 | | | | 9.55250 | | | | 9.35410 | | | | 9.44101 | |
Singapore Dollar | | | SGD | | | | 1.54170 | | | | 1.52340 | | | | 1.52771 | | | | 1.52577 | |
Turkish Lira | | | TRY | | | | 3.17650 | | | | 3.70720 | | | | 3.01103 | | | | 3.29841 | |
US Dollar | | | USD | | | | 1.08870 | | | | 1.05410 | | | | 1.11500 | | | | 1.10605 | |
Vietnamese Dong | | | VND | | | | n/a* | | | | 23,945.99000 | | | | n/a* | | | | 24,728.34583 | |
South African Rand | | | ZAR | | | | 16.95300 | | | | 14.45700 | | | | 14.03736 | | | | 16.33687 | |
| * | Not applicable: this currency was not reported in the respective reporting period. |
F-18
C. CONSOLIDATION METHODS
Basis of combined financial statements
The combined financial statements incorporate Division Labels and the companies under the common control and managed together. The Group controls a company in accordance with IFRS 10 if all of the following criteria are met:
| | • | | it has power over the investee; |
| | • | | it is exposed, or has rights, to variable returns from the Group’s involvement in the investee; |
| | • | | it has the ability to use its power over the investee to affect the amount of the Group’s returns. |
The financial statements of subsidiaries are included in the combined financial statements from the date on which control begins and until the date on which control ceases.
If the Group loses control of a subsidiary, it disposes of the assets and liabilities of the subsidiary and any related non-controlling interest and other components of equity. Any gain or loss is recognized in the statement of profit or loss. Any retained interest in the former subsidiary is measured at fair value at the date on which control was lost.
The Group treats transactions with non-controlling interest that do not result in a loss of control as transactions with owners of the Group in their capacity as owners. Any difference between the fair value of the consideration paid and the acquired interest in the carrying amount of the net assets of the subsidiary resulting from the acquisition of a non-controlling interest is recognized in equity. Gains and losses arising on the disposal to non-controlling interest shareholders are also recognized in equity.
The annual financial statements of the combined entities included in the combined financial statements are based on uniform accounting policies. The reporting date for the majority of combined companies is December 31. Entities of the Pemara Group have different reporting dates. Additional financial information as of December 31, has been prepared for combination purposes.
Business combinations
The Group accounts for business acquisitions using the acquisition method, which is the only method permitted by IFRS 3, on the date when the Group obtains control. The consideration transferred for the acquisition and the identifiable net assets acquired are generally measured at fair value. Any resulting goodwill is tested annually for impairment in accordance with IAS 36. A bargain purchase is recognized immediately in profit or loss. Costs related to acquisitions are recognized as expenses in the periods in which they are incurred.
Non-controlling interest
Non-controlling interest are measured at their proportionate share of the net identifiable assets of the acquiree at the acquisition date. Changes in the Group’s investment in a subsidiary that do not result in a loss of control are accounted for as an equity transaction.
Transactions eliminated
Intercompany balances and transactions and any unrealized income and expenses arising from intercompany transactions are eliminated when preparing the combined financial statements. As part of the elimination of intercompany balances, intercompany trade receivables and other receivables are offset against the corresponding intercompany liabilities.
F-19
| D. | ACQUISITIONS AND OTHER CHANGES TO THE SCOPE OF COMBINED FINANCIAL STATEMENTS |
The scope of combined financial statements of the Division Labels changed as follows in the reporting periods:
| | | | |
| | | fully
consolidated
companies | |
Balance as of January 1, 2015 | | | 26 | |
Foundation CF Australia Holding Pty. Ltd. | | | 1 | |
Foundation CF Holding Pty. Ltd. | | | 1 | |
Balance as of December 31, 2015 | | | 28 | |
| |
Balance as of January 1, 2016 | | | 28 | |
First consolidation Afripack Consumer Flexibles (Labels) Pty. Ltd. | | | 1 | |
First consolidation Pemara Labels Group | | | 7 | |
Balance as of December 31, 2016 | | | 36 | |
The material effects of first consolidation are explained in the following.
1. REPORTINGPERIOD 2015
Foundation of Entities
The foundations are associated with the acquisition of the Pemara Labels Group. Their initial consolidation had no significant effects on the combined financial statements 2015.
2. REPORTINGPERIOD 2016
First consolidation of Pemara Labels Group, Australia, on January 1, 2016
Constantia Flexibles acquired 100% of the shares of the Pemara Group, Australia, on November 30, 2015. The equity investment was recognized as of December 31, 2015, as an “other financial instrument”; the entity was first consolidated on January 1, 2016 considering the first consolidation in 2015 as impracticable in terms of the time constraints and considering the first consolidation effects as immaterial for the Division Labels combined financial statements for the financial year 2015.
The Melbourne-based company was founded in 1966 and produces pressure-sensitive labels, in-mold labels, and Fix-a-Form™ folding labels. Pemara operates four plants in Australia, Malaysia, Vietnam, and Indonesia and has distribution offices in Sydney, Australia, and Manila, Philippines. With the purchase of the Pemara Group, Constantia Flexibles is responding to the needs of its globally expanding clients and strengthening its regional presence in Australia and Asia.
A purchase price of€22,127 thousand and contingent consideration at the acquisition date amounting to€7,613 thousand (present value December 31, 2016:€8,318 thousand) were agreed.
Contingent consideration: The Constantia Flexibles has contractually agreed to grant the seller an additional future purchase price based on earnings (earn-out agreement). The contingent component of the purchase price is measured based on Level 3 inputs in the fair value hierarchy.
F-20
The following table shows an overview of the assets and liabilities as of the date of first consolidation.
| | | | |
| (in€ thousand) | | Fair Value, as of
1/1/2016 | |
Intangible assets | | | 6,077 | |
Tangible assets | | | 10,512 | |
Deferred tax assets | | | 20 | |
Other non-current assets | | | 38 | |
Non-current assets | | | 16,647 | |
Inventories | | | 3,123 | |
Trade receivables | | | 5,738 | |
Tax receivables | | | 21 | |
Other receivables | | | 1,110 | |
Cash and cash equivalents | | | 2,686 | |
Current assets | | | 12,679 | |
Total assets | | | 29,326 | |
| |
Provisions (non-current) | | | 143 | |
Interest-bearing financial liabilities(non-current) | | | 2,807 | |
Deferred tax liabilities | | | 2,446 | |
Non-current liabilities | | | 5,396 | |
Interest-bearing financial liabilities(current) | | | 3,130 | |
Trade payables | | | 6,274 | |
Tax liabilities | | | 117 | |
Other current liabilities | | | 1,021 | |
Current liabilities | | | 10,542 | |
Total liabilities | | | 15,938 | |
| |
Acquired net assets | | | 13,387 | |
The fair value of the trade receivables was€5,738 thousand. The gross amount of the trade receivables acquired was€5,873 thousand.
Goodwill
The goodwill from the acquisition amounts to€16,352 thousand. The amount of goodwill changed to€16,689 thousand between the date of initial measurement and the reporting date due to the measurement of foreign currency.
The goodwill is essentially attributable to the expertise of the Pemara Group’s employees and the expected synergy effects from the integration of the company. The goodwill is attributable to the Pemara subgroup CGU. The goodwill is not expected to be tax deductible.
Contribution to the net result
The Pemara Group contributed sales of€34,571 thousand, EBITDA of€3,260 thousand and earnings of€621 thousand to the net result in fiscal year 2016.
First consolidation of Afripack Group, South Africa, on January 1, 2016
The Constantia Flexibles purchased 95% of the shares of the Afripack Group on December 10, 2015. The only plant belonging to Division Labels is Afripack Durban. The equity investment was recognized as of December 31, 2015, as an “other financial instrument”; the entity was initially consolidated on January 1, 2016 considering the first consolidation in 2015 as impracticable in terms of the time constraints and considering the first consolidation effects as immaterial for the Division Labels combined financial statements for the financial year 2015.
F-21
Afripack, which is based in Durban, is the second largest company for flexible packaging in South Africa and sub-Saharan Africa. The company produces flexible food packaging and labels for the local market and for selected African export countries. Afripack operates six plants in South Africa, one in Kenya, and one in Mauritius. With the acquisition of the Afripack Group, Constantia Flexibles continues to expand its position in the African growth market.
The following table shows an overview of the assets and liabilities from Afripack Durban (Labels) as of the date of first consolidation.
| | | | |
| (in€ thousand) | | Fair value as of
01/01/2016 | |
| |
Intangible assets | | | 549 | |
Property, plant and equipment | | | 5,056 | |
Other non-current assets and financial assets | | | 11 | |
Deferred tax assets | | | 0 | |
Non-current assets | | | 5,617 | |
Inventories | | | 1,362 | |
Trade receivables | | | 1,642 | |
Other receivables | | | 309 | |
Cash and cash equivalents | | | 525 | |
Current assets | | | 3,838 | |
Total assets | | | 9,454 | |
Non-current financial liabilities | | | 1,799 | |
Deferred tax liabilities | | | 521 | |
Non-current liabilities | | | 2,320 | |
Current provisions | | | 0 | |
Trade payables | | | 2,109 | |
Other current liabilities | | | 322 | |
Current financial liabilities | | | 240 | |
Current liabilities | | | 2,670 | |
Total liabilities | | | 4,990 | |
Acquired net assets | | | 4,464 | |
| |
Non controlling interest | | | 1,392 | |
F-22
E. ACCOUNTING POLICIES
The following main accounting policies were applied to the preparation of the combined financial statements of Division Labels.
Current and non-current assets and liabilities
Assets and liabilities with a residual term of up to one year were classified as current, those with a residual term of more than a year as non-current. Residual terms are always determined on the basis of the reporting date.
Intangible assets and goodwill
Goodwill
Goodwill arising from business combinations is recognized as an asset at cost less accumulated impairment losses in accordance with IFRS 3. It is tested for impairment each year and whenever there are indications of impairment. Any impairment loss is immediately recognized in the combined statement of profit or loss. Goodwill impairment losses are not reversed.
Other intangible assets
Other intangible assets relate to purchased intellectual property rights, licenses, patents, concessions, trademarks, and capitalized development costs.
Other intangible assets acquired by the Constantia Flexibles and that have finite useful lives are measured at cost less accumulated amortization and impairment losses.
Research and development
Expenditure on research activities is recognized in the statement of profit or loss as incurred.
Development costs are capitalized only if the following can be demonstrated in accordance with IAS 38.57:
| | • | | the technical feasibility of completing the intangible asset so that it will be available for use or sale; |
| | • | | Constantia Flexibles intends to complete the intangible asset and to use or sell it; |
| | • | | Constantia Flexibles is able to use or sell the intangible asset; |
| | • | | the intangible asset will probably generate future economic benefits; |
| | • | | adequate technical, financial, and other resources to complete the development and to use or sell the intangible asset; and |
| | • | | Constantia Flexibles is able to reliably measure the expenditure attributable to the intangible asset during its development. |
Other development expenditures are recognized as expenses for the period. Capitalized development expenditure is measured at acquisition cost less accumulated amortization and accumulated impairment losses.
Overall, expenditure of 2015:€1,289 thousand, 2016:€1,486 thousand on research and development activities were expensed. Development costs of 2015:€812 thousand, 2016:€606 thousand were capitalized in the reporting periods.
Separate acquisitions (additional acquisition costs)
In accordance with IAS 38, separate acquisitions are recognized only when they increase the future economic benefits embodied in the asset to which they relate and they can be reliably measured. All other expenses, including expenses for an internally generated brand name, are recognized in the statement of profit or loss for the period.
F-23
Amortization of intangible assets
Intangible assets are amortized on a straight-line basis over their estimated useful lives. Amortization is recognized in the statement of profit or loss. Goodwill is not amortized.
The estimated useful lives are as follows:
| | |
• Patents, brands, software, capitalized development costs, and other assets | | 1 to 10 years |
• Customer relationships | | 7 to 15 years |
The amortization methods, useful lives, and residual values are reviewed at each reporting date and adjusted as necessary.
Tangible Assets
Recognition and measurement
In accordance with IAS 36 tangible assets are measured at cost less accumulated depreciation and impairment losses. If parts of an item of tangible assets have different useful lives, they are recognized as separate items (major components) of tangible assets. Any gain or loss on the disposal of an item of tangible assets is recognized in profit or loss.
Subsequent costs
Subsequent expenditures are capitalized only when it is probable that future economic benefits associated with the expenditures will flow to the Group.
In accordance with IAS 16.14, costs for regular major maintenance that are a condition for continuing to operate an item of tangible assets are recognized as a replacement in the carrying amount of the asset if the recognition criteria are met. Any remaining carrying amount of the cost of the previous inspection is derecognized.
Depreciation
Depreciation is calculated in order to write off the cost of items of tangible assets, less their estimated residual values, by the straight-line method over their estimated useful lives. Depreciation is recognized in the statement of profit or loss. Leased assets are depreciated over the shorter of the term of the lease or the useful life of the asset unless it is reasonably certain that title will pass to the Group by the end of the lease. The value of land does not depreciate.
For the current fiscal year and comparative years, the estimated useful lives of significant items of tangible assets are as follows:
| | |
• Offices, factories, and other buildings | | 25 to 50 years |
• Technical plant and machinery | | 6 to 50 years |
• Other equipment, operating and office equipment | | 4 to 12 years |
The depreciation methods, useful lives, and residual values are reviewed at each reporting date and adjusted as necessary.
Financial instruments
The Group classifies primary financial assets into the following categories in accordance with IAS 39:
| | • | | measured at fair value through profit or loss, |
| | • | | held-to-maturity investments, |
| | • | | loans and receivables, and |
| | • | | available-for-sale financial assets. |
F-24
Recognition and derecognition of primary financial assets and liabilities
Recognition
The Group recognizes both loans and receivables and issued debt securities as of the date on which they arise. All other financial assets and liabilities are initially recognized at the trade date.
Derecognition
The Group derecognizes afinancial asset when the contractual rights to the cash flows from an asset expire or it transfers the rights to receive the cash flows in a transaction in which substantially all the risks and rewards of ownership of the financial asset. Derecognition also takes place when the Group transfers substantially all the risks and rewards of ownership and does not retain control of the transferred asset.
Financial liabilities are derecognized when the contractual obligations are discharged or canceled, or expire.
Financial assets and liabilities are offset and reported net in the balance sheet if the Group has a legally enforceable right to set off the recognized amounts and intends either to settle on a net basis or to realize the asset and settle the liability simultaneously.
Measurement of primary financial assets
Financial assets measured at fair value through profit or loss
A financial asset is measured at fair value through profit or loss if it is held for trading or designated as such at initial recognition. Attributable transaction costs are recognized in the statement of profit or loss as incurred. Financial assets that are measured at fair value through profit or loss are measured at fair value. Any remeasurement gain or loss is recognized in profit or loss. The recognized net gain or loss includes any dividend or interest earned on the financial asset and is reported in the statement of profit or loss.
Held-to-maturity investments
These assets are initially measured at their fair value plus directly attributable transaction costs. In the course of subsequent measurement, they are measured at amortized cost using the effective interest method.
Loans and receivables
Upon initial recognition, these assets are measured at their fair value plus directly attributable transaction costs. In the course of subsequent measurement, they are measured at amortized cost using the effective interest method.
Trade receivables
These are classified as “loans and receivables” and are carried at amortized cost. If collectability is doubtful, customer receivables are measured at the lower present value of the estimated future cash flows. In addition to the required individual valuation allowances, identified risks from the general credit risk are taken into account by recognizing general valuation allowances.
Cash and cash equivalents
Cash and bank deposits are measured at cost. They include cash on hand, bank call deposits, and other short-term, highly liquid investments with a maximum term of three months at the date of acquisition.
Available-for-sale financial assets
These assets are initially measured at their fair value plus directly attributable transaction costs. In the course of subsequent measurement, available-for-sale financial assets are measured at fair value and corresponding changes in value (with the exception of impairment losses) are recognized in other comprehensive income and presented in the “available-for-sale” reserve in equity. If an asset is derecognized, the accumulated other comprehensive income is reclassified to the statement of profit or loss. Shares in other companies for which no quoted price in an active market is available and whose fair value cannot be determined reliably are measured at cost.
F-25
Measurement of primary financial liabilities
Primary financial liabilities are initially recognized at fair value less directly attributable transaction costs. In the course of subsequent measurement, these financial liabilities are measured at amortized cost using the effective interest method.
Derivative financial instruments and hedge accounting
The Group holds derivative financial instruments to hedge against price, currency, and interest rate risks. Under certain conditions, embedded derivatives are separated from the host contract and recognized separately.
Derivatives are initially recognized at fair value. Attributable transaction costs are recognized in the statement of profit or loss when incurred. Derivatives are subsequently measured at fair value. Any resulting changes are generally recognized in the statement of profit or loss.
Cash flow hedges
For derivatives that are designated as hedges against the risk of variability in cash flows, the effective portion of the derivative’s fair value change is recognized in other comprehensive income and shown in the hedging reserve in equity. The ineffective portion of fair value changes is recognized in the statement of profit or loss for the period.
The cumulative amount recognized in equity initially remains in other comprehensive income and is reclassified to the statement of profit or loss in the same period or periods in which the hedged item affects profit or loss.
Hedge accounting is discontinued insofar as the hedging instrument no longer meets the criteria for hedge accounting, expires or is sold, terminated, exercised, or no longer designated as a hedging instrument. If a forecast transaction is no longer expected to occur, the cumulative amount previously recognized in equity is reclassified to the statement of profit or loss.
Physical aluminum stocks are hedged by means of forward sales on the London Metal Exchange (LME). They are subsequently measured at fair value.
Fair value hedges
In fair value hedges, both the hedged exposure of the hedged item and the derivative hedging instrument are measured at fair value through profit or loss.
Hedge accounting is discontinued if the Group terminates the hedging relationship, the hedging instrument expires or is sold, terminated, or exercised, or no longer qualifies for the purpose of hedging. At this time, the adjustment to the carrying amount of the hedged item attributable to the hedged risk starts being reversed to profit and loss.
Put options
The Constantia Flexibles has entered into obligations in respect of non-controlling interest shareholders of its subsidiaries. As a result of these agreements, the non-controlling interest shareholders have the right to tender their shares for sale at previously established conditions. At the time the agreements were entered into, none of them resulted in the transfer of material opportunities and risks to the Constantia Flexibles. A liability is recognized in the amount of the present value of the probable future exercise price. This amount is reported separately as a liability and as of first consolidation is recognized against the equity of the parent. The unwinding of the discount on the liability is recognized in interest expense, and changes in value are recognized in other net financial income and expense.
Impairment
Non-financial assets
Apart from inventories and deferred tax assets, the carrying amounts of non-financial assets are reviewed at each reporting date in order to determine whether there is evidence of impairment. If this is the case, the recoverable amount of the asset is calculated as capital employed including the Fixed assets and Working capital. Goodwill and intangible assets with an indefinite useful life are tested for impairment annually.
F-26
To determine whether impairment exists, the assets are combined into the smallest group of assets that generates cash inflows from continuing use and that are largely independent of the cash inflows from other assets or cash-generating units (CGUs). Goodwill acquired in a business combination is allocated to CGUs or groups of CGUs that are expected to benefit from the synergies of the merger. As a rule, the lowest level at the Constantia Flexibles corresponds to individual operating companies or groups of operating companies.
The recoverable amount of an asset or CGU is the higher value of its value in use and fair value less cost to sell. In assessing value in use, the estimated future cash flows are discounted to their present value, using a pre-tax discount rate that reflects current market movements of the time value of money and the risks specific to the asset or CGU.
An impairment loss is recognized if the carrying amount of an asset or CGU exceeds its recoverable amount.
Impairment losses are recognized in the statement of profit or loss. Impairment losses that are recognized in respect of CGUs are first allocated to the goodwill attributed to the CGU and subsequently allocated to the carrying amount of the other assets of the CGU on a pro rata basis.
Goodwill impairment losses are not reversed. For other assets, an impairment loss is reversed only to the extent that the carrying amount of the asset does not exceed the carrying amount that would have been determined, net of depreciation or amortization, if no impairment loss had been recognized.
Primary financial assets
A financial asset that is not classified at fair value through profit or loss is reviewed at each reporting date in order to determine whether there is objective evidence of impairment.
Objective indications that impairment losses have occurred in financial assets are:
| | • | | the failure or default of a debtor; |
| | • | | the restructuring of an amount owed to the Group on terms that the Group otherwise would not take into consideration; |
| | • | | notification that a debtor or issuer will enter bankruptcy; |
| | • | | adverse changes in the payment status of borrowers or issuers; |
| | • | | the disappearance of an active market for a security; |
| | • | | observable data pointing to a substantial reduction of expected payments by a group of financial assets. |
For an equity instrument held, a significant or prolonged decline in the fair value below its historical cost is considered an objective indication of impairment.
Financial assets measured at amortized cost
The Group considers evidence of impairment for these financial assets both at the level of the individual asset and at the collective level. All assets that are of significance individually are assessed for specific impairment. Those assets that turn out not to be specifically impaired are then collectively assessed for any impairment that has occurred but has not yet been identified. Assets that are not significant on their own are collectively assessed for impairment by grouping together assets with similar risk characteristics.
In assessing collective impairment, the Group uses historical information about the timing of revenue and the amount of losses incurred, adjusted for the exercise of judgment by the Executive Board as to whether the current economic and credit conditions are such that the actual losses are likely to be greater or less than the losses that would be expected, based on historical trends.
An impairment loss is calculated as the difference between the carrying amount and the present value of estimated future cash flows, discounted at the original effective interest rate of the asset. Losses are recognized in the statement of profit or loss and in other operating expenses. If the corporation has no realistic prospects of
F-27
collectability of the asset, the amounts are derecognized. If an event that occurs after the recognition of the impairment loss results in a reduction of the amount of the impairment loss, the reduction of the impairment loss is recorded in the statement of profit or loss.
Inventories
In accordance with IAS 2, inventories are measured at the lower of cost and net realizable value. The cost of raw materials, consumables, and supplies is based on the moving average price method. In the case of manufactured products (unfinished and finished products), cost includes an appropriate share of the production overheads based on normal operating capacity (pro-rated material and production overheads). General administration and selling expenses are not capitalized.
Net realizable value is the selling price attainable in the normal course of business less the estimated costs required to complete the product and the necessary costs to make the sale. Inventory risks arising from the storage period and from reduced marketability are covered by appropriate valuation allowances.
Capital management
The aim of Constantia Flexibles is to keep a strong capital base so as to maintain investor, creditor, and market confidence and to ensure the sustainable development of the Company. Management regularly monitors the return on capital and seeks a balance between the increase in the rate of return that could be achieved with a higher debt ratio and the advantages of a stable capital base.
Employee benefits
Short-term employee benefits
Obligations under short-term employee benefits are recognized as an expense when the employees render the related service. A liability is recognized for the amount expected to be paid when the Group has a present legal or constructive obligation to pay this amount as a result of service rendered by the employee, and the obligation can be estimated reliably.
Other provisions
In accordance with IAS 37, other provisions are recognized where present legal or constructive obligations to third parties arise from past transactions or events that are expected to result in an outflow of assets, the amount of which can be reliably measured.
The actual amount of non-current provisions is determined by discounting the expected future cash flows using a pre-tax rate that reflects current market conditions with regard to the time value of money and the risks specific to the liability. The unwinding of the discount is presented in net financial income and expense.
Leases
Assets that are held by the Constantia Flexibles under a lease in which all the risks and rewards of ownership are transferred to the Group are classified asfinance leases according to IAS 17. Upon initial recognition, the leased asset is recognized in the amount of the lower of its fair value and the present value of the minimum lease payments. After initial recognition, the asset is measured in accordance with the applicable accounting method for this asset.
Minimum lease payments under finance leases are apportioned between the finance expense and the reduction of outstanding liability. The finance expense is distributed over the term of the lease in such a way as to achieve a constant rate of interest on the remaining debt over the periods.
Assets from other leases are classified asoperating leases and are not recognized in the Group’s balance sheet.
Payments made under operating leases are recognized in the statement of profit or loss on a straight-line basis over the term of the lease.
F-28
Revenue recognition
Revenue is recognized when the significant risks and rewards of ownership have been transferred to the buyer, receipt of the consideration is probable, the associated costs and possible returns can be estimated reliably, there is no continuing managerial involvement in the goods, and the amount of revenue can be measured reliably. Revenue is recorded net of returns, discounts, and rebates.
Government grants compensating the Constantia Flexibles for expenses incurred are recorded as scheduled in the statement of profit or loss in the periods in which the expenses are recognized. Government grants of 2015:€49 thousand, 2016:€177 thousand were recognized in profit or loss.
Government grants for assets are recognized at fair value if there is reasonable certainty that they will be received and the conditions attached to the grant are met. Government grants do not reduce the cost of the assets for which they were granted, but are recognized as deferred income and recognized in other operating income over the expected useful life of the related asset.
Interest income is recognized in the statement of profit or loss using the effective interest method.
Borrowing costs
In determining production costs, borrowing costs are only included if they relate to a qualifying asset in accordance with IAS 23 (Borrowing Costs). A qualifying asset is a non-financial asset that necessarily takes a substantial period of time to get ready for its intended state for use or sale. All other borrowing costs are recognized in the statement of profit or loss in the period in which they occur.
In accordance with IAS 23, Constantia Flexibles has recognized borrowing costs in the statement of profit or loss since the recognition criteria for a qualifying asset were not met.
Income taxes
The tax expense comprises current and deferred taxes. Current and deferred taxes are recognized in profit or loss, except to the extent to which they are associated with a business combination or an item recognized directly in equity or in other comprehensive income.
Current taxes
Current taxes are the expected tax liability or tax receivable on the taxable income for the fiscal year or the tax loss on the basis of the tax rates applicable or substantively applicable at the reporting date, and any adjustment to taxes payable with respect to previous years.
Deferred taxes
Deferred taxes are recognized in respect of temporary differences between the carrying amounts of assets and liabilities for consolidated financial reporting purposes and the amounts used for tax purposes. Deferred taxes are not recognized for:
| | • | | temporary differences on the initial recognition of assets or liabilities in a transaction that is not a business combination and affects neither accounting profit nor taxable profit; |
| | • | | temporary differences in respect of investments in subsidiaries, associates, and jointly controlled entities, if the Group is able to control the timing of the reversal of the temporary differences and it is probable that they will not be reversed in the foreseeable future, and |
| | • | | taxable temporary differences on the initial recognition of goodwill. |
A deferred tax asset is recognized for unused tax losses, unused tax credits, and deductible temporary differences to the extent that it is probable that future taxable profits will be available for which they can be used. Deferred tax assets are reviewed at each reporting date and reduced to the extent to which it is no longer probable that the related tax benefit can be realized.
F-29
Deferred taxes are measured on the basis of the tax rates that are expected to be applied to temporary differences when they reverse, using the tax rates that have been enacted or substantively enacted at the reporting date.
The measurement of deferred taxes reflects the tax consequences that result from the expectations of the Group with regard to the manner of realization of the carrying amounts of its assets and the fulfillment of its liabilities at the reporting date.
Deferred tax assets and deferred tax liabilities are offset if there is a legally enforceable right to set off the recognized amounts in respect of the same tax authority, and the offset of deferred tax assets and liabilities is permitted as part of a corporate tax group.
Summary of selected measurement methods
| | |
| Items | | Measurement methods |
| |
| Assets | | |
| |
| Goodwill | | Historical cost (subsequent measurement: impairment test) |
| Other intangible assets | | |
- Purchased | | Costs less accumulated depreciation, amortization and impairment charges |
- Internally generated | | Cost of development (direct costs and attributable overheads) |
| Tangible assets | | Costs less accumulated depreciation, amortization and impairment charges |
| Other non-current assets and financial assets | | |
- Loans and receivables | | (Amortized) cost |
- Available for sale | | At fair value through OCI or (amortized) cost |
- Held for trading | | At fair value through profit or loss |
| Inventories | | Lower of cost and net realizable value |
| Trade receivables | | (Amortized) cost |
| Other receivables | | (Amortized) cost |
- Loans and receivables | | (Amortized) cost |
- Held for trading | | At fair value through profit or loss |
| Cash and cash equivalents | | (Amortized) cost |
| |
| Liabilities | | |
| |
| Provisions | | |
- Other provisions | | Discounted settlement amount |
| Interest-bearing liabilities | | (Amortized) cost |
| Other financial and other liabilities | | Settlement amount or fair value |
| Trade payables | | (Amortized) cost |
F-30
| F. | APPLICATION OF NEW AND REVISED INTERNATIONAL FINANCIAL REPORTING STANDARDS |
The IASB supplemented, newly issued, adopted or revised a number of other accounting standards and interpretations in fiscal years 2015 and 2016. These implementations are applied in the reporting period depending on effective date as issued by the IASB.
| | | | | | |
Standard Interpretation | | Title | | Effective date
pursuant to
IFRSs 1 | | Application at
Constantia
Flexibles |
IFRS 17 | | Insurance contracts | | 1/1/2021 | | 1/1/2021 |
| | | |
| IFRIC 23 | | Uncertainty over Income Tax Treatments | | 1/1/2019 | | 1/1/2019 |
| | | |
| IFRS 16 | | Leases | | 1/1/2019 | | 1/1/2019 |
| | | |
IFRS 10 and
IAS 28 | | Sale or Contribution of Assets between an Investor and its Associate or Joint Venture (Amendment) | | Postponed
indefinitely | | Postponed
indefinitely |
| | | |
| IAS 12 | | Recognition of Deferred Tax Assets for Unrealized Losses (Amendment) | | 1/1/2017 | | 1/1/2017 |
| | | |
| IAS 7 | | Disclosure Initiative (Amendment) | | 1/1/2017 | | 1/1/2017 |
| | | |
| IFRS 15 | | Revenue from Contracts with Customers (clarification) | | 1/1/2018 | | 1/1/2018 |
| | | |
| IFRS 2 | | Classification and Measurement of Share-based Payment Transactions (Amendment) | | 1/1/2018 | | 1/1/2018 |
| | | |
| IFRS 4 | | Insurance Contracts (Amendment) | | 1/1/2018 | | 1/1/2018 |
| | | |
| Various | | Improvements to IFRSs 2014–2016 | | 1/1/2017 /
1/1/2018 | | 1/1/2017 /
1/1/2018 |
| | | |
IFRIC
Interpretation
22 | | Foreign Currency Transactions and Advance Consideration | | 1/1/2018 | | 1/1/2018 |
| | | |
| IAS 40 | | Investment Property (Amendment) | | 1/1/2018 | | 1/1/2018 |
| | | |
| IFRS 9 | | Financial Instruments | | 1/1/2018 | | 1/1/2018 |
| | | |
| IFRS 15 | | Revenue from Contracts with Customers | | 1/1/2018 | | 1/1/2018 |
| | | |
| IFRS 14 | | Regulatory deferral accruals | | 1/1/2016 | | 1/1/2016 |
| | | |
IFRS 10,
IFRS 12 and
IAS 28 | | Investment companies: Application of consolidation exemption | | 1/1/2016 | | 1/1/2016 |
| | | |
| IAS 1 | | Disclosure initiative | | 1/1/2016 | | 1/1/2016 |
| | | |
| IAS 27 | | Separate Financial Statements (Equity method – Amendment) | | 1/1/2016 | | 1/1/2016 |
| | | |
IAS 16 and
IAS 41 | | Agriculture: Bearer plants (Amendment) | | 1/1/2016 | | 1/1/2016 |
| 1 | Without early application |
F-31
| | | | | | |
Standard Interpretation | | Title | | Effective date
pursuant to
IFRSs 2 | | Application at
Constantia
Flexibles |
IAS 16 and
IAS 38 | | Clarification of acceptable methods of depreciation (Amendment) | | 1/1/2016 | | 1/1/2016 |
| | | |
| IFRS 11 | | Acquisition of interest in joint operations (Amendment) | | 1/1/2016 | | 1/1/2016 |
| | | |
| IAS 19 | | Employee Benefits (Amendment: Defined benefit plans – Employee contributions) | | 1/1/2015 | | 1/1/2015 |
| | | |
| Miscellaneous | | Improvements to IFRSs 2010-2012 (2013) | | 1/1/2015 | | 1/1/2015 |
| | | |
| Miscellaneous | | Improvements to IFRSs 2012-2014 (2014) | | 1/1/2016 | | 1/1/2016 |
In the reporting period 2016 endorsed, but not effective accounting standards
| • | | IFRS 9 (Financial Instruments) |
IFRS 9, issued in July 2014, contains revised guidance for the classification and measurement of financial instruments, including a new expected credit loss model to calculate the impairment of financial assets as well as new general accounting requirements for hedging transactions, and replaces the existing guidance under IAS 39 (Financial Instruments: Recognition and Measurement).
According to IFRS 9, all financial assets are divided into three classification categories – at amortized cost, at fair value through profit or loss (FVTPL), and at fair value through other comprehensive income (FVOCI), depending on the contractual cash flow characteristics (SPPI) and the business model.
Most of the Group’s financial assets are classified as “held to maturity” and consequently measured at amortized cost. It can be assumed that this classification and measurement will be retained under IFRS 9. There are also likely to be no more than immaterial changes in the case of the financial liabilities, since only an insignificant portion of them were designated as FVTPL. Additionally, the derecognition principles in IAS 39 will be retained in IFRS 9, with the result that no effects are expected here either.
IFRS 9 requires the Group to ensure that hedging accounting complies with the objectives and strategies of the Group’s risk management, and that hedge effectiveness is assessed to a greater extent based on a qualitative and forward-looking approach. Under the new model, it is probable that more risk management strategies will meet the criteria for hedge accounting, in particular those that contain a risk hedging component (except for foreign currency risk) of a non-financial item. Under IFRS 9, derivatives that are embedded in host contracts in which the underlying is a financial asset within the scope of the standard are never accounted for separately. Instead, the hybrid financial instrument is assessed in its entirety with regard to its classification.
Hedging transactions are entered into in the Group in order to hedge against risks such as volatile aluminum prices, interest rates, and exchange rates. The Group will perform a more comprehensive analysis, but it can be assumed that the existing hedging relationships will also meet the IFRS 9 hedge accounting requirements. As a result, the Group does not expect any material effects on its hedge accounting.
IFRS 9 replaces the old incurred loss model according to IAS 39 with an expected credit loss model based on a three-tiered classification system (“buckets”) that affects the underlying measurement horizon and interest recognition. This model must be applied to financial assets that are measured at amortized cost or at FVOCI – with the exception of dividend-bearing instruments – and to contractual assets under IFRS 15.
| 2 | Without early application |
F-32
The Group has not yet performed a more comprehensive analysis of the extent to which the expected credit loss model will impact the future recognition of impairment losses. It can be generally assumed that credit losses will be recognized at an earlier stage. The Group’s history indicates a high level of collectability of trade receivables, so the Group does not expect any material impact from the application of the expected credit loss model in this respect.
The new standard entails comprehensive new disclosures and changes in presentation, which will be implemented in the reporting period in which the standard is applied for the first time.
The Group will not apply IFRS 9 prior to the effective date, and hence will apply it for the first time as of the beginning of fiscal year 2018.
| • | | IFRS 15 (Revenue from Contracts with Customers) |
The objective of IFRS 15 is to establish principles to be followed by an entity in reporting decision-useful information to users about the nature, amount, timing, and uncertainty of revenue and cash flows arising from a contract with a customer.
The new standard uses a five-step model to identify the revenue to be recognized. These five steps are: (1.) Identify the contract(s) with a customer, (2.) Identify separate performance obligations, (3.) Determine the transaction price, (4.) Allocate the transaction price (to the performance obligations), and (5.) Determine the point in time or time period when revenue is recognized. IFRS 15 also governs the accounting for the incremental costs to obtain a contract, which must be recognized as an asset and amortized over the term if they are incurred solely because of the contract and it can be presumed that they can be recovered. Costs to fulfil a contract can also be recognized as an asset under IFRS 15 if certain criteria are met, to the extent that they are not already within the scope of another IFRS.
In some cases, customers are supplied by more than one Group subsidiary. The Group is currently examining the extent to which it might be necessary to combine separate contracts into a single contract within the meaning of IFRS 15. However, we do not currently presume that this will be the case.
IFRS 15 describes certain indicators that must be considered when determining separate performance obligations. The separate accounting for performance obligations may result in revenue being recognized at different points in time. In light of this, in particular the terms and conditions of supply (INCOTERMS) will be analyzed in detail in a further stage of the project in order to establish when transportation services must be identified as a separate performance obligation.
There is a range of different bonus and discount agreements in the Group that are currently being analyzed. It is not possible to make any concrete statement at present about any potential impacts on revenue recognition because the ongoing implementation project here is not yet in a quantitative assessment phase.
The Group will not exercise the option to apply IFRS 15 before the effective date at the beginning of fiscal year 2018. The Group will apply the new revenue recognition standard for the first time using the modified retrospective method.
As things stand today, it is not possible to make any quantitative assessment about the extent to which the new requirements of IFRS 15 will impact the net assets, financial position, and results of operations, because the project is not yet in the quantitative assessment phase.
IAS 17 will be superseded when IFRS 16 takes effect. The new standard abolishes the recognition of operating leases, with certain exceptions. From January 1, 2019, when entering into a lease, the lessee must recognize the right of use asset and a lease liability.
F-33
The standard primarily affects the presentation of operating leases. Future minimum lease payments under operating leases amounted in 2015:€24,364 thousand, 2016:€27,034 thousand at the reporting date. Further details on leases are contained in Section H. Notes to the Combined Balance Sheet, Note 1 Combined Asset Table.
The impact on assets, financial liabilities, and the statement of profit or loss is currently being examined. However, the project is still in its early stages and no more far-reaching statements can be made at present.
The Constantia Flexibles does not expect any material effects on the net assets, financial position, and results of operations from the future initial application of the other standards and interpretations.
The effects of amended standards and interpretations on the Group’s combined financial statements and the disclosures in the combined financial statements are continually monitored and analyzed.
F-34
G. MANAGEMENT JUDGMENT AND USE OF ESTIMATES
Preparation of the combined financial statements requires certain estimates and assumptions to be made that affect the reported amount of assets (including goodwill), provisions, and liabilities, the disclosure of other obligations at the reporting date, and the presentation of income and expenses during the reporting period. Actual future results may differ from those estimates, which can lead to significant differences in the combined financial statements.
The Management of Division Labels is convinced that the assumptions it has made are reasonable, such that the combined financial statements give a true and fair view of the net assets, financial position, and results of operations in all material respects.
The estimates and underlying assumptions are subject to considerable uncertainty and their validity is therefore constantly reviewed. Changes to the estimates are recognized in the period in which they are made. The principle assumptions relating to the estimates are described in the disclosures on the corresponding items.
For the measurement of existing provisions for pensions and similar obligations, severance payment obligations, and anniversary benefits, assumptions were made with respect to the discount rate, retirement age, life expectancy, and future salary and pension increases. Any changes in these assumptions will affect the carrying amount of pension obligations.
The Management of Division Labels is required to make judgments relating to the calculation of deferred taxes. Deferred tax assets are recognized to the extent to which a future use is probable. The amount of provisions is based on estimates of whether and to what extent expected income taxes will be due. When calculating taxes, local tax regulations and budgeted financial ratios must be considered. Deviations in these assumptions have an effect on the carrying amount of deferred taxes. Changes are recognized in other comprehensive income or in profit or loss, corresponding to the initial recognition.
Risk-related assumptions and estimates are made in business combinations. Related to this, significant adjustments (earn-out arrangements) may happen in future periods. The initial recognition of identified customer lists uses the multi-period excess earnings method, which considers planning data, company-specific WACC rates, and historically documented movement levels. Production machines are recognized on the basis of replacement cost and depreciated over the remaining economic useful life. Real estate is valued by experts who usually apply the replacement cost approach. The initial recognition of items in connection with acquisitions is disclosed in Section D. Acquisitions and Other Changes in the Scope of Combined financial statements.
Goodwill generated in the context of business combinations is tested for impairment regularly, and at least annually. When testing for impairment, the sum of the carrying amount is compared with the recoverable amount of a cash-generating unit. Recoverable amount is calculated by reference to value in use. The calculation is based on company-specific growth rates, discount rates, and WACC rates. Changes to these inputs have a significant impact on the calculated value in use. The related sensitivities are presented in Section H. Notes to the Combined Balance Sheet, Note 1 Combined Asset Table.
Contingent liabilities, which are not recognized in the balance sheet, are assessed regularly with regard to their likelihood of occurrence. If an outflow of resources embodying economic benefits is neither probable, such that a provision would have to be recognized, nor remote, the relevant obligations are disclosed as contingent liabilities. If estimates cannot be made by the relevant departments or on the basis of market data, external expert opinions are used.
F-35
H. NOTES TO THE COMBINED BALANCE SHEET
1. COMBINED ASSET TABLE
Change in acquisition cost
| | | | | | | | | | | | | | | | | | | | | | | | | | | | |
| (in€ thousand) | | As of
01/01/2015 | | | Currency
Translation
Differences | | | Additions | | | Disposals | | | Change in the
Scope of
Consolidation | | | Transfers | | | As of
31/12/2015 | |
Goodwill | | | 116,558 | | | | 12,301 | | | | 0 | | | | 0 | | | | 0 | | | | 0 | | | | 128,858 | |
| | | | |
| | | | | | | |
Customer lists | | | 99,029 | | | | 3,810 | | | | 0 | | | | 0 | | | | 0 | | | | 0 | | | | 102,839 | |
Software | | | 2,057 | | | | (25 | ) | | | 572 | | | | (48 | ) | | | 0 | | | | 39 | | | | 2,595 | |
Other intangible assets | | | 1,598 | | | | 4 | | | | 369 | | | | 0 | | | | 0 | | | | 531 | | | | 2,502 | |
Own work capitalized | | | 925 | | | | 92 | | | | 812 | | | | 0 | | | | 0 | | | | 0 | | | | 1,829 | |
| | | | |
Intangible Assets | | | 103,610 | | | | 3,881 | | | | 1,753 | | | | (48 | ) | | | 0 | | | | 570 | | | | 109,765 | |
| | | | | | | |
Value of Land | | | 8,753 | | | | 353 | | | | 0 | | | | 0 | | | | 0 | | | | 0 | | | | 9,106 | |
Buildings | | | 51,068 | | | | 1,712 | | | | 3,255 | | | | (18 | ) | | | 0 | | | | 429 | | | | 56,446 | |
Undeveloped Land | | | 19 | | | | 0 | | | | 0 | | | | 0 | | | | 0 | | | | 0 | | | | 19 | |
Machinery and Equipment | | | 166,871 | | | | 2,924 | | | | 11,017 | | | | (2,163 | ) | | | 0 | | | | 9,843 | | | | 188,492 | |
Other equipment, fixtures and furnitures | | | 18,167 | | | | 203 | | | | 5,794 | | | | (1,559 | ) | | | 0 | | | | 302 | | | | 22,906 | |
Construction in Progress | | | 5,108 | | | | 535 | | | | 10,109 | | | | (695 | ) | | | 0 | | | | (11,144 | ) | | | 3,913 | |
| | | | |
Tangible Assets | | | 249,986 | | | | 5,726 | | | | 30,175 | | | | (4,435 | ) | | | 0 | | | | (570 | ) | | | 280,883 | |
| | | | | | | | | | | | | | | | | | | | | | | | | | | | |
| (in€ thousand) | | As of
01/01/2016 | | | Currency
Translation
Differences | | | Additions | | | Disposals | | | Change in the
Scope of
Consolidation | | | Transfers | | | As of
31/12/2016 | |
Goodwill | | | 128,858 | | | | 4,246 | | | | 16,352 | | | | 0 | | | | 0 | | | | 0 | | | | 149,457 | |
| | | | |
| | | | | | | |
Customer lists | | | 102,839 | | | | 1,398 | | | | 0 | | | | 0 | | | | 6,572 | | | | 0 | | | | 110,808 | |
Software | | | 2,595 | | | | 27 | | | | 459 | | | | (1 | ) | | | 54 | | | | 36 | | | | 3,170 | |
Other intangible assets | | | 2,502 | | | | 4 | | | | 46 | | | | 0 | | | | 0 | | | | 168 | | | | 2,721 | |
Own work capitalized | | | 1,829 | | | | 47 | | | | 606 | | | | 0 | | | | 0 | | | | 0 | | | | 2,482 | |
| | | | |
Intangible Assets | | | 109,765 | | | | 1,476 | | | | 1,110 | | | | (1 | ) | | | 6,626 | | | | 204 | | | | 119,182 | |
| | | | | | | |
Value of Land | | | 9,106 | | | | 74 | | | | 38 | | | | 0 | | | | 0 | | | | (535 | ) | | | 8,684 | |
Buildings | | | 56,446 | | | | 720 | | | | 2,078 | | | | (81 | ) | | | 1,103 | | | | 399 | | | | 60,666 | |
Undeveloped Land | | | 19 | | | | 38 | | | | 0 | | | | 0 | | | | 0 | | | | 645 | | | | 702 | |
Machinery and Equipment | | | 188,492 | | | | 3,721 | | | | 23,261 | | | | (6,257 | ) | | | 13,388 | | | | 4,766 | | | | 227,372 | |
Other equipment, fixtures and furnitures | | | 22,906 | | | | 157 | | | | 3,251 | | | | (995 | ) | | | 1,077 | | | | 189 | | | | 26,585 | |
Construction in Progress | | | 3,913 | | | | 47 | | | | 5,777 | | | | 0 | | | | 0 | | | | (5,681 | ) | | | 4,057 | |
| | | | |
Tangible Assets | | | 280,883 | | | | 4,758 | | | | 34,406 | | | | (7,333 | ) | | | 15,568 | | | | (216 | ) | | | 328,066 | |
F-36
Accumulated depreciation and amortization
| | | | | | | | | | | | | | | | | | | | | | | | | | | | |
| (in€ thousand) | | As of
01/01/2015 | | | Currency
Translation
Differences | | | Additions | | | Disposals | | | Change in the
Scope of
Consolidation | | | Transfers | | | As of
31/12/2015 | |
Goodwill | | | 0 | | | | 0 | | | | 0 | | | | 0 | | | | 0 | | | | 0 | | | | 0 | |
| | | | |
| | | | | | | |
Customer lists | | | 33,486 | | | | 465 | | | | 10,014 | | | | 0 | | | | 0 | | | | 0 | | | | 43,965 | |
Software | | | 1,218 | | | | (1 | ) | | | 530 | | | | (48 | ) | | | 0 | | | | 3 | | | | 1,702 | |
Other intangible assets | | | 484 | | | | 2 | | | | 563 | | | | (0 | ) | | | 0 | | | | 0 | | | | 1,048 | |
Own work capitalized | | | 18 | | | | 2 | | | | 227 | | | | 0 | | | | 0 | | | | 0 | | | | 247 | |
| | | | |
Intangible Assets | | | 35,206 | | | | 468 | | | | 11,335 | | | | (49 | ) | | | 0 | | | | 3 | | | | 46,964 | |
| | | | | | | |
Value of Land | | | 0 | | | | 0 | | | | 0 | | | | 0 | | | | 0 | | | | 0 | | | | 0 | |
Buildings | | | 7,407 | | | | 171 | | | | 2,529 | | | | (8 | ) | | | 0 | | | | 1 | | | | 10,099 | |
Undeveloped Land | | | 0 | | | | 0 | | | | 0 | | | | 0 | | | | 0 | | | | 0 | | | | 0 | |
Machinery and Equipment | | | 63,877 | | | | 616 | | | | 22,190 | | | | (1,905 | ) | | | 0 | | | | (1 | ) | | | 84,777 | |
Other equipment, fixtures and furnitures | | | 7,798 | | | | 68 | | | | 3,345 | | | | (1,556 | ) | | | 0 | | | | (3 | ) | | | 9,653 | |
Construction in Progress | | | 0 | | | | 0 | | | | 0 | | | | 0 | | | | 0 | | | | 0 | | | | 0 | |
| | | | |
Tangible Assets | | | 79,082 | | | | 855 | | | | 28,063 | | | | (3,469 | ) | | | 0 | | | | (3 | ) | | | 104,529 | |
| | | | | | | | | | | | | | | | | | | | | | | | | | | | |
| (in€ thousand) | | As of
01/01/2016 | | | Currency
Translation
Differences | | | Additions | | | Disposals | | | Change in
the Scope of
Consolidation | | | Transfers | | | As of
31/12/2016 | |
Goodwill | | | 0 | | | | 0 | | | | 0 | | | | 0 | | | | 0 | | | | 0 | | | | 0 | |
| | | | |
| | | | | | | |
Customer lists | | | 43,965 | | | | 346 | | | | 10,457 | | | | 0 | | | | 0 | | | | 0 | | | | 54,768 | |
Software | | | 1,702 | | | | 14 | | | | 713 | | | | (1 | ) | | | 0 | | | | 0 | | | | 2,429 | |
Other intangible assets | | | 1,048 | | | | 2 | | | | 533 | | | | 0 | | | | 0 | | | | 0 | | | | 1,583 | |
Own work capitalized | | | 248 | | | | 17 | | | | 351 | | | | 0 | | | | 0 | | | | 12 | | | | 628 | |
| | | | |
Intangible Assets | | | 46,964 | | | | 379 | | | | 12,054 | | | | (1 | ) | | | 0 | | | | 12 | | | | 59,409 | |
| | | | | | | |
Value of Land | | | 0 | | | | (0 | ) | | | 0 | | | | (12 | ) | | | 0 | | | | 13 | | | | 0 | |
Buildings | | | 10,099 | | | | 131 | | | | 2,737 | | | | (50 | ) | | | 0 | | | | (13 | ) | | | 12,905 | |
Undeveloped Land | | | 0 | | | | 0 | | | | 0 | | | | 0 | | | | 0 | | | | 0 | | | | 0 | |
Machinery and Equipment | | | 84,777 | | | | 1,160 | | | | 25,216 | | | | (5,166 | ) | | | 0 | | | | (13 | ) | | | 105,974 | |
Other equipment, fixtures and furnitures | | | 9,653 | | | | 85 | | | | 4,002 | | | | (984 | ) | | | 0 | | | | 1 | | | | 12,756 | |
Construction in Progress | | | 0 | | | | 0 | | | | 0 | | | | 0 | | | | 0 | | | | 0 | | | | 0 | |
| | | | |
Tangible Assets | | | 104,529 | | | | 1,376 | | | | 31,955 | | | | (6,212 | ) | | | 0 | | | | (12 | ) | | | 131,635 | |
The following table shows the carrying amounts:
| | | | | | | | | | | | | | | | |
| (in€ thousand) | | Historical cost
12/31/2015 | | | Accumulated
depreciation
and amortization
12/31/2015 | | | Carrying amount
12/31/2015 | | | Carrying amount
12/31/2014 | |
Goodwill | | | 128,858 | | | | 0 | | | | 128,858 | | | | 116,558 | |
| | | | |
| | | | |
Customer lists | | | 102,839 | | | | 43,965 | | | | 58,873 | | | | 65,543 | |
Software | | | 2,595 | | | | 1,702 | | | | 893 | | | | 840 | |
Other intangible assets | | | 2,502 | | | | 1,048 | | | | 1,454 | | | | 1,114 | |
Own work capitalized | | | 1,829 | | | | 247 | | | | 1,582 | | | | 907 | |
| | | | |
Intangible Assets | | | 109,765 | | | | 46,964 | | | | 62,802 | | | | 68,404 | |
| | | | |
Value of Land | | | 9,106 | | | | 0 | | | | 9,106 | | | | 8,753 | |
Buildings | | | 56,446 | | | | 10,099 | | | | 46,347 | | | | 43,661 | |
Undeveloped Land | | | 19 | | | | 0 | | | | 19 | | | | 19 | |
Machinery and Equipment | | | 188,492 | | | | 84,777 | | | | 103,715 | | | | 102,994 | |
Other equipment, fixtures and furnitures | | | 22,906 | | | | 9,653 | | | | 13,254 | | | | 10,369 | |
Construction in Progress | | | 3,913 | | | | 0 | | | | 3,913 | | | | 5,108 | |
| | | | |
Tangible Assets | | | 280,883 | | | | 104,529 | | | | 176,354 | | | | 170,904 | |
F-37
| | | | | | | | | | | | | | | | |
| (in€ thousand) | | Historical cost
12/31/2016 | | | Accumulated
depreciation
and amortization
12/31/2016 | | | Carrying amount
12/31/2016 | | | Carrying amount
12/31/2015 | |
Goodwill | | | 149,457 | | | | 0 | | | | 149,457 | | | | 128,858 | |
| | | | |
| | | | |
Customer lists | | | 110,808 | | | | 54,768 | | | | 56,040 | | | | 58,873 | |
Software | | | 3,170 | | | | 2,429 | | | | 741 | | | | 893 | |
Other intangible assets | | | 2,721 | | | | 1,583 | | | | 1,138 | | | | 1,455 | |
Own work capitalized | | | 2,482 | | | | 628 | | | | 1,854 | | | | 1,582 | |
| | | | |
Intangible Assets | | | 119,182 | | | | 59,409 | | | | 59,773 | | | | 62,802 | |
| | | | |
Value of Land | | | 8,684 | | | | 0 | | | | 8,684 | | | | 9,106 | |
Buildings | | | 60,666 | | | | 12,905 | | | | 47,762 | | | | 46,347 | |
Undeveloped Land | | | 702 | | | | 0 | | | | 702 | | | | 19 | |
Machinery and Equipment | | | 227,372 | | | | 105,974 | | | | 121,398 | | | | 103,715 | |
Other equipment, fixtures and furnitures | | | 26,585 | | | | 12,756 | | | | 13,829 | | | | 13,254 | |
Construction in Progress | | | 4,057 | | | | 0 | | | | 4,057 | | | | 3,913 | |
| | | | |
Tangible Assets | | | 328,066 | | | | 131,635 | | | | 196,431 | | | | 176,354 | |
Finance leases
The Division Labels leases equipment under various finance lease agreements. Lease agreements do not contain restrictions on the Group’s activities concerning dividends, additional debt, or other lease agreements. Individual leases have renewal and bargain purchase options. Specifically, this involves the production buildings of Verstraete in mould labels N.V., Spear Europe Ltd., Spear USA Inc., Precision and Packaging Inc., Afripack Consumer Flexibles (Labels) Pty. Ltd. and the production machinery of Spear Europe Ltd.
The underlying interest rate for finance leases is determined for the entire term when the lease is entered into. The carrying amounts of assets recognized as finance leases are as follows:
| | | | | | | | |
| (in€ thousand) | | 12/31/2015 | | | 12/31/2016 | |
Value of Land | | | 97 | | | | 0 | |
Buildings | | | 19,454 | | | | 19,629 | |
Machinery and Equipment | | | 4,486 | | | | 2,939 | |
| | | | |
| | | 24,037 | | | | 22,568 | |
| | | | |
Outstanding minimum lease payments at the reporting date were as follows:
| | | | | | | | | | | | | | | | |
| | | Minimum
lease
payments | | | Present value
of minimum
lease
payments | | | Minimum
lease
payments | | | Present value
of minimum
lease
payments | |
| (in€ thousand) | | 2015 | | | 2015 | | | 2016 | | | 2016 | |
Up to one year | | | 3,599 | | | | 1,902 | | | | 3,830 | | | | 2,103 | |
Over one and up to five years | | | 11,476 | | | | 6,337 | | | | 13,495 | | | | 7,518 | |
Over five years | | | 25,746 | | | | 20,171 | | | | 26,477 | | | | 21,101 | |
| | | | |
| | | 40,822 | | | | 28,410 | | | | 43,802 | | | | 30,722 | |
| | | | |
Less future finance costs | | | (12,411 | ) | | | | | | | (13,080 | ) | | | | |
| | | | | | | | | | | | | | | | |
Present value of leasing obligations | | | 28,410 | | | | | | | | 30,722 | | | | | |
| | | | | | | | | | | | | | | | |
F-38
Operating leases
The Division Labels has entered into various operating lease agreements as the lessee for buildings, machinery, and office premises. Lease agreements do not contain restrictions on the Group’s activities concerning dividends, additional debt, or other lease agreements. Individual leases have renewal options.
The future minimum lease obligations under operating leases are as follows:
| | | | | | | | |
| (in€ thousand) | | 2015 | | | 2016 | |
Up to one year | | | 6,404 | | | | 7,906 | |
Over one and up to five years | | | 14,714 | | | | 13,829 | |
Over five years | | | 3,247 | | | | 5,298 | |
| | | | |
| | | 24,364 | | | | 27,034 | |
| | | | |
Commitments related to capital expenditure
In 2015 obligations in an amount of€750 thousand and in 2016:€3,943 thousand are related to contracts already awarded for commenced or planned investment projects (purchase commitments).
Restrictions on right of disposal
On December 31, 2015 tangible assets with a carrying amount of€0 thousand and on December 31, 2016€3,018 were pledged to secured loans.
Goodwill
An annual goodwill impairment test is performed based on the requirements of IFRS 3 in conjunction with IAS 36. This is done at the level of a group of cash-generating units (CGUs). In terms of goodwill, this group is basically the subgroup. When testing for impairment, the total carrying amounts of the group of cash-generating units are compared with the recoverable amount. Recoverable amount is calculated by reference to value in use.
A CGU – level summary of the goodwill allocation is presented below:
| | | | | | | | |
| CGUs | | Carrying amount 2015 | | | Carrying amount 2016 | |
Spear | | | 270,510 | | | | 268,700 | |
There of Goodwill | | | 119,093 | | | | 121,914 | |
Pemara | | | n/a | | | | 35,418 | |
There of Goodwill | | | n/a | | | | 17,046 | |
Europe and Other | | | 242,374 | | | | 262,042 | |
There of Goodwill | | | 9,766 | | | | 9,766 | |
Total | | | 512,884 | | | | 566,160 | |
| |
CGU Europe and other represents mainly the entities acquired by One Equity Partner in 2010 as a part of the Constantia Packaging AG. Division Labels management steers this CGU separately from the acquisition CGUs Spear and Pemara.
The group tests whether goodwill has suffered any impairment on an annual basis. The recoverable amount of a CGU is determined based on value-in-use calculations which require the use of assumptions. The expected cash
F-39
flows are based on both a qualified planning process that considers internal corporate experience and on economic data collected outside of the Company. The detailed planning period covers one year. Planning assumptions for two more years are considered in the medium-term plan at a high level. Cash Flows beyond the 3-year period are extrapolated using the estimated growth rates stated below.
These growth rates are consistent with forecasts included in industry reports specific to the industry in which each CGU operates.
The mandatory annual impairment tests confirmed the recoverability of all recognized goodwill as of December 31, 2016 and 2015.
The following table sets out the key assumptions for those CGUs that have significant goodwill allocated to them:
| | | | | | | | | | | | |
| 2015 | | Spear | | | Europe and Other | | | | |
Growth rate | | | 3.0% | | | | 1.5% | | | | | |
Discount rate (WACC) | | | 7.5% | | | | 7.5% | | | | | |
Base interest rate | | | 1.3% | | | | 1.3% | | | | | |
Market risk premium | | | 6.5% | | | | 6.5% | | | | | |
Pre-tax discount | | | 10.5% | | | | 10.1% | | | | | |
| | | |
| 2016 | | Spear | | | Pemara | | | Europe and Other | |
Growth rate | | | 3.0% | | | | 1.5% | | | | 1.5% | |
Discount rate (WACC) | | | 6.6% | | | | 6.6% | | | | 6.9% | |
Base interest rate | | | 1.4% | | | | 1.4% | | | | 1.4% | |
Market risk premium | | | 6.5% | | | | 6.5% | | | | 6.5% | |
Pre-tax discount | | | 9.1% | | | | 9.1% | | | | 9.4% | |
In addition to the impairment test for each CGU, a sensitivity analysis of the key assumptions was conducted. Results are presented in the table below the text. In the first sensitivity analysis, a growth rate reduction by certain percentage points was assumed. In the second sensitivity analysis, the discount rate was increased by certain percentage points for each group of cash-generating units. In the third sensitivity analysis, a reduction of certain percentage points on the EBIT was assumed in the perpetual annuity.
These changes in the underlying assumptions would not result in an impairment for any CGU.
| | | | | | | | | | | | |
| 2015 | | Spear | | | Europe and
Other | | | | |
Growth rate reduction | | | -0.5% | | | | -0.9% | | | | | |
Discount rate (WACC) increase | | | +0.5% | | | | +1.0% | | | | | |
EBIT margin reduction | | | -1.4% | | | | -3.0% | | | | | |
| | | |
| 2016 | | Spear | | | Pemara | | | Europe and
Other | |
Growth rate reduction | | | -1.5% | | | | -1.4% | | | | -0.9% | |
Discount rate (WACC) increase | | | +1.0% | | | | +1.0% | | | | +1.0% | |
EBIT margin reduction | | | -3.0% | | | | -0.9% | | | | -3.0% | |
F-40
2. OTHERNON-CURRENTASSETSANDFINANCIALASSETS
| | | | | | | | |
| (in€ thousand) | | 12/31/2015 | | | 12/31/2016 | |
Loans | | | 19 | | | | 19 | |
Unconsolidated investments | | | 28,869 | | | | 0 | |
Non-current lease receivable | | | 1,245 | | | | 1,077 | |
Prepayments on intangible and tangible assets | | | 2,774 | | | | 4,292 | |
Other financial assets | | | 0 | | | | 13 | |
| | | | |
| | | 32,907 | | | | 5,401 | |
| | | | |
In 2015 the investment in Pemara Group (€28,869 thousand) was reported as the non-consolidated investment.
3. INVENTORIES
| | | | | | | | |
| (in€ thousand) | | 12/31/2015 | | | 12/31/2016 | |
Raw materials and supplies | | | 30,671 | | | | 33,125 | |
Semi-finished products | | | 7,017 | | | | 12,557 | |
Finished goods, merchandise | | | 25,478 | | | | 27,112 | |
| | | | |
Net realizable value (reduced by allowance) | | | 63,166 | | | | 72,794 | |
| | | | |
| | |
Allowance inventories | | | (1,674 | ) | | | (1,614 | ) |
4. TRADERECEIVABLES
| | | | | | | | |
| (in€ thousand) | | 12/31/2015 | | | 12/31/2016 | |
Receivables not due | | | 61,040 | | | | 80,315 | |
Overdue receivables | | | | | | | | |
Due less than 30 days | | | 10,451 | | | | 9,387 | |
Due more than 30 days but less than 60 days | | | 3,679 | | | | 4,779 | |
Due more than 60 days but less than 90 days | | | 1,556 | | | | 1,213 | |
Due more than 90 days but less than 180 days | | | 3,109 | | | | 1,459 | |
Due more than 180 days | | | 3,595 | | | | 2,769 | |
| | |
Allowance for doubtful debt | | | (1,915 | ) | | | (1,553 | ) |
Total | | | 81,515 | | | | 98,368 | |
| | | | | | | | | | | | | | | | |
| (in€ thousand) | | 12/31/2015 | | | 12/31/2016 | |
| | | non-impaired | | | impaired | | | non-impaired | | | impaired | |
Receivables not yet due | | | 60,970 | | | | 70 | | | | 80,314 | | | | 0 | |
| | | | |
Overdue receivables | | | | | | | | | | | | | | | | |
Due less than 30 days | | | 10,423 | | | | 28 | | | | 9,354 | | | | 33 | |
Due more than 30 days but less than 60 days | | | 3,679 | | | | 0 | | | | 4,732 | | | | 47 | |
Due more than 60 days but less than 90 days | | | 1,556 | | | | 0 | | | | 1,213 | | | | 0 | |
Due more than 90 days but less than 180 days | | | 2,061 | | | | 1,048 | | | | 1,349 | | | | 110 | |
Due more than 180 days | | | 2,826 | | | | 769 | | | | 1,408 | | | | 1,363 | |
Total | | | 81,515 | | | | 1,915 | | | | 98,368 | | | | 1,553 | |
F-41
In fiscal year 2016, receivables were sold to a financial institution by certain American, French, German, Austrian, and Malaysian companies of the Division Labels. The sale also transferred the default risk from the Division Labels to the financial institution. The balance of transferred receivables at the reporting date was 2015:€25,866 thousand, 2016:€27,723 thousand.
The transferred receivables were derecognized in accordance with IAS 39. The Division Labels has no further involvement in the trade receivables transferred to the financial institution.
The assessment of credit quality is based on the internal rating guidelines of Constantia Flexibles. Credit insurances were taken out with various insurance companies for a significant part of trade receivables. These insurance policies provide for a deductible in the event of a claim. For such receivables, the deductible is the maximum value adjusted, depending on the assessment of local management.
5. OTHERRECEIVABLES
| | | | | | | | |
| (in€ thousand) | | 12/31/2015 | | | 12/31/2016 | |
Intercompany receivables | | | 78,459 | | | | 72,320 | |
Sub Lease Receivables | | | 176 | | | | 167 | |
Financial assets from derivatives | | | 753 | | | | 279 | |
Receivables social security and taxes | | | 2,932 | | | | 4,840 | |
Current receivables from employees | | | 17 | | | | 33 | |
Receivables from government grants | | | 0 | | | | 233 | |
Prepayments and accrued income | | | 1,727 | | | | 2,641 | |
Miscellaneous other receivables | | | 2,704 | | | | 1,458 | |
| | | | |
| | | 86,768 | | | | 81,971 | |
| | | | |
The main part of intercompany receivables consists of financial receivables from Constantia’s group companies outside the Division Labels and include intercompany financial receivables in the following amounts: 2015:€74,492 thousand, 2016:€67,567 thousand and intercompany dividends in the following amounts 2015:€3,967 thousand, 2016:€4,752 thousand.
Financial assets from derivatives mainly relate to the measurement of Constantia’s FX hedging instruments for FX denominated transactions (only trade, no financing) and aluminum costs.
Receivables from social security and taxes mainly comprise VAT balances.
6. EQUITY
Changes in equity are presented in a separate statement (Combined statement of changes in equity).
Acquisition non-controlling interests
In September 2016, the remaining non-controlling interests (30%) in Constantia CM Labels SDN BHD, Malaysia, was acquired in September 2016 for€2,450 thousand. The amount has been paid by Constantia Flexibles International GmbH. In Division Labels the derecognized non-controlling interest of€1,232 thousand have been moved to equity.
F-42
First consolidation Afripack Consumer Flexibles (Labels) Pty. Ltd.
The amount represents the equity and non-controlling interests of Afripack Consumer Flexibles (Labels) Pty. Ltd. at the time of first consolidation as of January 01, 2016.
Currency translation reserves
The currency translation reserve comprises exchange rate differences (translation effect) from the translation of financial statements of foreign operations amounting to 2015: €23,000 thousand, 2016: € 20,408 thousand and translation differences relating to monetary items that are part of a net investment in a foreign operation amounting to 2015: €(9,946) thousand, 2016: €(3,847) thousand.
Carve out tax
The carve out tax represents the counterpart to the Income statement effects of the tax calculation on stand-alone basis as if the companies Haendler Natermann GmbH and Constantia Labels GmbH were not part of the tax group in Germany as this tax group includes also the entities which are not in scope of the Combined financial statements.
Carve out push down of expenses
The carve out push down of expenses represents M&A advisory expenses for the acquisition of the Pemara Group.
Non-controlling interests
The table below shows the summarized financial information before intercompany eliminations for those Division Lables entities with significant non-controlling interests.
| | | | | | | | | | | | | | | | | | | | | | | | | | | | |
| | | | | | | | | | | | NON-CONTROLLING INTERESTS | |
| | | | | | %
2015 | | | %
2016 | | | Result in
€ thousand
2015 | | | Result in
€ thousand
2016 | | | Balance in
€ thousand
2015 | | | Balance in
€ thousand
2016 | |
Verstraete in mould labels N.V. | | | Belgium | | | | 49.0 | | | | 49.0 | | | | 8,644 | | | | 8,506 | | | | 24,101 | | | | 27,137 | |
Spearsystem Packaging (Africa) (Pty) Ltd. | | | South Africa | | | | 25.1 | | | | 25.1 | | | | (340 | ) | | | (1,372 | ) | | | (6,793 | ) | | | (7,132 | ) |
Constantia CM Labels SDN BHD | | | Malaysia | | | | 30.0 | | | | 0.0 | | | | 252 | | | | 146 | | | | 1,092 | | | | 0 | |
Afripack Consumer Felexibles (Labels) Pty. Ltd. | | | South Africa | | | | 0.0 | | | | 29.7 | | | | 0 | | | | 144 | | | | 0 | | | | 1,769 | |
Other | | | | | | | | | | | | | | | 0 | | | | 0 | | | | 0 | | | | 0 | |
| | | | | | | | | | | | | | | | |
| | | | | | | | | | | | | | | 8,556 | | | | 7,425 | | | | 18,400 | | | | 21,774 | |
F-43
| | | | | | | | | | | | | | | | |
| | | 2015 | | | 2016 | |
| | | Verstraete in
mould labels
N.V. | | | Spearsystem
Packaging
(Africa) (Pty)
Ltd. | | | Verstraete
in
mould labels
N.V. | | | Spearsystem
Packaging
(Africa) (Pty)
Ltd. | |
Non-current assets | | | 53,540 | | | | 4,281 | | | | 52,679 | | | | 4,465 | |
Current assets | | | 24,788 | | | | 10,628 | | | | 31,259 | | | | 15,139 | |
| | | | |
Non-current liabilities | | | 16,686 | | | | 0 | | | | 15,810 | | | | 0 | |
Current liabilities | | | 12,437 | | | | 41,973 | | | | 12,722 | | | | 48,019 | |
| | | | |
Equity attributable to owners of the company | | | 25,104 | | | | (20,271 | ) | | | 28,269 | | | | (21,283 | ) |
Non-controlling interests | | | 24,101 | | | | (6,793 | ) | | | 27,137 | | | | (7,132 | ) |
| | | | |
Income | | | 117,322 | | | | 16,595 | | | | 120,763 | | | | 22,907 | |
Expenses | | | (99,674 | ) | | | (17,950 | ) | | | (103,395 | ) | | | (28,371 | ) |
| | | | |
Net income after tax | | | 17,648 | | | | (1,355 | ) | | | 17,367 | | | | (5,465 | ) |
| | | | |
Attributable to owners of the company | | | 9,004 | | | | (1,015 | ) | | | 8,861 | | | | (4,093 | ) |
Attributable to non-controlling interests | | | 8,644 | | | | (340 | ) | | | 8,506 | | | | (1,372 | ) |
| | | | |
Net income after tax | | | 17,648 | | | | (1,355 | ) | | | 17,367 | | | | (5,465 | ) |
| | | | |
Other comprehensive income, attributable to shareholders | | | 40 | | | | (2,724 | ) | | | (24 | ) | | | 3,081 | |
Other comprehensive income, non-controlling interests | | | 39 | | | | (913 | ) | | | (23 | ) | | | 1,033 | |
| | | | |
Other comprehensive income | | | 79 | | | | (3,636 | ) | | | (47 | ) | | | 4,114 | |
| | | | |
Total comprehensive income, attributable to shareholders | | | 9,044 | | | | (3,738 | ) | | | 8,837 | | | | (1,012 | ) |
Total comprehensive income, non-controlling interests | | | 8,683 | | | | (1,253 | ) | | | 8,483 | | | | (339 | ) |
| | | | |
Total comprehensive income | | | 17,727 | | | | (4,991 | ) | | | 17,320 | | | | (1,351 | ) |
| | | | |
Dividend payments to non-controlling interests | | | 9,355 | | | | 0 | | | | 5,446 | | | | 0 | |
| | | | |
Cash flow from operating activities | | | 32,735 | | | | 6,396 | | | | 27,623 | | | | 2,463 | |
Cash flow from investing activity | | | (13,013 | ) | | | (974 | ) | | | (12,148 | ) | | | (559 | ) |
Cash flow from financing activity | | | (18,462 | ) | | | (5,101 | ) | | | (6,852 | ) | | | (1,339 | ) |
| | | | |
Changes in cash and cash equivalents | | | 1,260 | | | | 321 | | | | 8,623 | | | | 565 | |
F-44
7. PROVISIONS
7.1 Non-current provisions
| | | | | | | | |
| (in€ thousand) | | 12/31/2015 | | | 12/31/2016 | |
Carrying amount as of January 1 | | | 659 | | | | 971 | |
Adjustment prior years | | | 0 | | | | 0 | |
Change in the scope of consolidation | | | 0 | | | | 143 | |
| | | | |
| | | 659 | | | | 1,114 | |
| | |
(Gain)/loss on currency translation differences | | | 7 | | | | 9 | |
| | |
Utilization | | | (962 | ) | | | (974 | ) |
Reversal | | | 0 | | | | 0 | |
Reclassification | | | 0 | | | | 0 | |
Additons (including interest) | | | 1,267 | | | | 1,189 | |
| |
| | | | |
Carrying amount as of December 31 | | | 971 | | | | 1,338 | |
| | | | |
Non-current provisions mainly contain employee provisions.
7.2 Current provisions
| | | | | | | | |
| (in€ thousand) | | 12/31/2015 | | | 12/31/2016 | |
Carrying amount as of January 1 | | | 190 | | | | 258 | |
(Gain)/loss on currency translation differences | | | 2 | | | | 0 | |
Utilization | | | (561 | ) | | | (44 | ) |
Reversal | | | 0 | | | | (214 | ) |
Additions | | | 627 | | | | 214 | |
| | | | |
Carrying amount as of December 31 | | | 258 | | | | 214 | |
| | | | |
Current provisions mainly contain warranty provisions.
8. LIABILITIES
| | | | | | | | | | | | | | | | |
| | | | | | Remaining term | |
12/31/2015 (in€ thousand) | | Total | | | Less than
1 year | | | Over 1
up to
5 years | | | Over
5 years | |
Interest-bearing financial liabilities | | | 112,557 | | | | 4,775 | | | | 88,631 | | | | 19,151 | |
Other non-current liabilities | | | 70,334 | | | | 0 | | | | 69,579 | | | | 755 | |
Trade accounts payables | | | 66,654 | | | | 66,654 | | | | 0 | | | | 0 | |
Tax liabilities | | | 6,979 | | | | 6,979 | | | | 0 | | | | 0 | |
Other liabilities | | | 229,542 | | | | 229,542 | | | | 0 | | | | 0 | |
| | | | |
| | | 486,066 | | | | 307,950 | | | | 158,210 | | | | 19,906 | |
| | | | |
F-45
| | | | | | | | | | | | | | | | |
| | | | | | Remaining term | |
12/31/2016 (in€ thousand) | | Total | | | Less than
1 year | | | Over 1
up to
5 years | | | Over
5 years | |
Interest-bearing financial liabilities | | | 144,196 | | | | 5,702 | | | | 117,128 | | | | 21,366 | |
Other non-current liabilities | | | 74,161 | | | | 0 | | | | 73,384 | | | | 777 | |
Trade accounts payables | | | 80,496 | | | | 80,496 | | | | 0 | | | | 0 | |
Tax liabilities | | | 5,779 | | | | 5,779 | | | | 0 | | | | 0 | |
Other liabilities | | | 215,648 | | | | 215,648 | | | | 0 | | | | 0 | |
| | | | |
| | | 520,280 | | | | 307,625 | | | | 190,512 | | | | 22,143 | |
| | | | |
Interest-bearing financial liabilities include single company financing with Constantia Flexibles Group GmbH. Also finance lease and sublease liabilities in an amount of 2015:€29,113 thousand, 2016:€27,754 thousand.
The other non-current liabilities include the liability from the measurement of the put options to acquire the remaining shares of Verstraete in mould labels N.V. in an amount of 2015:€56,773 thousand, 2016:€62,426 thousand as well as the contingent consideration liability for the Pemara Group in the amount of 2015:€7,944 thousand, 2016:€8,318 thousand and a contingent consideration liability from acquisition of the Spear Group 2015:€35,939 thousand, 2016:€2,385 thousand. They also include the deferred government grants received amounting to 2015:€1,795 thousand and in 2016:€1,516 thousand
Trade payables are attributable to liabilities from capital expenditures in an amount of 2015:€1,976 thousand, 2016:€925 thousand.
Description of other liabilities are detailed in Section H.9.
9. OTHERCURRENTLIABILITIES
| | | | | | | | |
| (in€ thousand) | | 12/31/2015 | | | 12/31/2016 | |
Derivative financial instruments | | | 359 | | | | 1,109 | |
Personnel expenses | | | 6,164 | | | | 7,267 | |
Accrued unused vacations | | | 3,423 | | | | 4,845 | |
Other tax liabilities | | | 1,473 | | | | 1,736 | |
Liabilities to medical insurance funds | | | 998 | | | | 1,292 | |
Deferred income | | | 910 | | | | 1,129 | |
Intercompany payables | | | 177,232 | | | | 192,674 | |
Miscellaneous other liabilities | | | 38,983 | | | | 5,595 | |
| | | | |
| | | 229,542 | | | | 215,648 | |
| | | | |
Personnel expenses mainly include bonuses and overtime credits of 2015: €1,231 thousand, 2016: €2,081 thousand, as well as payroll liabilities of 2015: €2,379 thousand, 2016: €2,442 thousand.
Intercompany payables relate to payables from group-financing payables towards Constantia’s group companies outside the Division Labels and include intercompany loans 2015: €151,906 thousand, 2016: €173,531 thousand, cash pooling 2015: €0 thousand, 2016: €1,224 thousand and other intercompany payables 2015: €25,326 thousand, 2016: €17,919 thousand.
Miscellaneous other liabilities include accruals for a performed tax audit of 2015: €1,676 thousand, 2016: €0 thousand in Haendler & Natermann GmbH (H&N). H&N was in dispute with the tax authorities regarding the acceptance of tax loss carry forwards and therefore accrued potential interest payments relating to the company audit as well as the tax risk. In 2016 H&N settled the issue with the tax office and paid an amount of€1.8 million.
Miscellaneous other liabilities also include prepayments from customers of 2015: €133 thousand, 2016: €407 thousand, a reclaim of government grants for Novis Casa de Editura si Tipografia S.R.L. of€1,079 thousand in 2016.
F-46
I. NOTESTOTHE COMBINED STATEMENTOF PROFITOR LOSS
1. SALESAND COSTOF MATERIALS
Sales amounting to 2015: €540,837 thousand, 2016: €604,660 thousand include intercompany sales of 2015: €2,978 thousand, 2016: €3,679 thousand, waste sales of 2015: €4,109 thousand, 2016: €3,902 thousand and cylinder and tooling sales of 2015: €5,546 thousand, 2016: €6,023 thousand.
Cost of materials amounting to 2015: €284,387 thousand, 2016: €318,182 thousand includes materials expenses of 2015: €244,845 thousand, 2016: €275,695 thousand, energy costs for production of 2015: €10,678 thousand, 2016: €10,889 thousand, costs of cylinders of 2015: €7,823 thousand, 2016: €8,756 thousand, subcontracting of 2015: €9,094 thousand, 2016: €10,086 thousand and expenses for packaging materials of 2015: €5,601 thousand, 2016: €5,737 thousand.
2. OTHERINCOME
| | | | | | | | |
| (in€ thousand) | | 2015 | | | 2016 | |
Proceeds from disposal of tangible and intangible assets | | | 251 | | | | 1,218 | |
Gains from currency translation differences | | | 532 | | | | 1,506 | |
Subsidies and government grants | | | 49 | | | | 177 | |
Insurance proceeds | | | 2,612 | | | | 1,549 | |
Miscellaneous | | | 1,234 | | | | 1,176 | |
| | | | |
| | | 4,678 | | | | 5,626 | |
| | | | |
Currency translation differences result from transactions and FX gains are netted with FX losses, recorded in other expenses. Constantia Flexibles operates an active hedging policy against foreign currency differences. The main foreign currency having an effect on Constantia Flexibles is the USD. Effects from the Group’s hedging transactions are described in Section 5 – Other expenses.
The subsidies and government grants are linked mainly to conditions such as job guarantees or sales target achievements.
The insurance proceeds relate mainly to fire damage at Haendler & Natermann GmbH amounting to 2015: €1,784 thousand, 2016: €1,213 thousand, and at Spearsystem Packaging (Africa) (Pty) Ltd. amounting to, 2015: €772 thousand, 2016: €294 thousand.
Miscellaneous other income includes income from the reversal of public investment grants amounting to 2015: €512 thousand, 2016: €621 thousand and rental income amounting to, 2015: €210 thousand, 2016: €57 thousand.
F-47
3. PERSONNELEXPENSES
| | | | | | | | |
| (in€ thousand) | | 2015 | | | 2016 | |
Wages & Salaries | | | (89,435 | ) | | | (102,607 | ) |
Severance expenses and contributions
to employee benefit funds | | | (419 | ) | | | (393 | ) |
Pension expense | | | (1,010 | ) | | | (983 | ) |
Expenses for mandatory social security contributions,
pay-related charges and compulsory contributions | | | (16,712 | ) | | | (18,290 | ) |
Other social expenses | | | (6,329 | ) | | | (7,080 | ) |
| | | | |
| | | (113,906 | ) | | | (129,353 | ) |
| | | | |
| | |
| Total number of employees as at December 31 (FTE) | | 2015 | | | 2016 | |
Total number of employees | | | 2,367 | | | | 2,769 | |
A Management Equity Program (MEP) was launched at the level of the shareholder, Constantia Lux Parent S.A., Luxembourg, in December 2015. This also covers senior executives at Constantia Flexibles. The value of the MEP is calculated on the basis of the Constantia Lux Parent S.A. equity value. In fiscal year 2016, the MEP was accounted for as equity-settled under IFRS 2. The fair value calculation at the grant date indicated that no recognition as a personnel expense was necessary.
4. DEPRECIATION,AMORTIZATION,ANDIMPAIRMENTLOSSES
| | | | | | | | |
| (in€ thousand) | | 2015 | | | 2016 | |
Ordinary Depreciation / Amortization | | | 39,398 | | | | 44,009 | |
Impairment | | | 0 | | | | 0 | |
| | | | |
| | | 39,398 | | | | 44,009 | |
| | | | |
| | |
Thereof amortization of customer lists | | | 10,014 | | | | 10,457 | |
5. OTHEREXPENSES
| | | | | | | | |
| (in€ thousand) | | 2015 | | | 2016 | |
Losses from currency translation differences | | | (1,150 | ) | | | (1,290 | ) |
Losses from disposal of tangible and intangible assets | | | (30 | ) | | | (1,015 | ) |
Miscellaneous | | | (36 | ) | | | (7 | ) |
| | | | |
| | | (1,216 | ) | | | (2,312 | ) |
| | | | |
Other operating result includes hedging effects from recycled cashflow hedging 2015: expense of€462 thousand, 2016: income of€149 thousand and from currency hedging 2015:€0 thousand, 2016: expense of€10 thousand.
F-48
6. FINANCIALINCOMEANDEXPENSE
| | | | | | | | |
| (in€ thousand) | | 2015 | | | 2016 | |
Interest income | | | 3,327 | | | | 289 | |
Interest expense | | | (14,078 | ) | | | (16,094 | ) |
Interest expense for pension provisions | | | (2 | ) | | | (22 | ) |
Compounding of other non-current liabilities and provisions | | | (2,703 | ) | | | (3,180 | ) |
| | | | |
Interest income and expenses | | | (13,456 | ) | | | (19,007 | ) |
| | | | |
| | |
Gains/(losses) from currency translation difference | | | (4,286 | ) | | | (4,459 | ) |
Ineffective part of hedging | | | (1,791 | ) | | | (6 | ) |
Other | | | 3,503 | | | | 2,189 | |
| | | | |
Other financial income and expense | | | (2,574 | ) | | | (2,276 | ) |
| | | | |
Interest income in fiscal year 2015 included a gain of€2,880 thousand from the reversal of an accrued liability for interest on tax risks. Interest expense includes finance lease expenses of 2015:€1,735 thousand, 2016:€1,860 thousand. The residual part of the interest expenses represents the charges from interest bearing debts. The compounding on other non-current liabilities and provisions mainly represent expenses for the compounding on the discounted liabilities from put options. In 2016 additional€215 thousand are included for the compounding of the contingent purchase price liability from the acquisition of the Pemara Group.
Other financial income and expense contains dividend income of 2015:€3,956 thousand, 2016:€4,740 thousand. In 2016 expenses of€2,680 from the revaluation of the options for the acquisition of the remaining shares in Verstraete in mould labels N.V. are included.
Foreign currency gains/(losses) originated from financing activities and were primarily due to the changes in US dollar and South African Rand.
7. INCOMETAX
In the context of group taxation, the tax expenses were adjusted to the stand-alone basis for all tax groups which includes the entities out of the Division Labels.
| | | | | | | | |
| (in€ thousand) | | 2015 | | | 2016 | |
Current tax | | | (10,553 | ) | | | (13,224 | ) |
Deferred tax | | | 754 | | | | 9,129 | |
| | | | |
| | | (9,799 | ) | | | (4,095 | ) |
| | | | |
F-49
Tax reconciliation
| | | | | | | | |
| (in€ thousand) | | 2015 | | | 2016 | |
Earnings before tax (EBT) | | | 36,379 | | | | 34,673 | |
Tax expense at 25.0% | | | (9,095 | ) | | | (8,668 | ) |
| | |
Transactions subject to a non-Austrian rate | | | (2,070 | ) | | | (2,242 | ) |
Permanent differences | | | 2,665 | | | | 10,509 | |
Losses for the period not capitalised and not charged | | | (1,619 | ) | | | (3,927 | ) |
Changes tax rates | | | 319 | | | | 234 | |
Total tax expense | | | (9,799 | ) | | | (4,095 | ) |
| | |
Effective Tax Rate | | | 26.94% | | | | 11.81% | |
8. DEFERREDTAX
| | | | | | | | | | | | | | | | |
| | | 2015 Deferred Tax | | | 2016 Deferred Tax | |
| (in€ thousand) | | Assets | | | Liabilities | | | Assets | | | Liabilities | |
Tangible, Intangible and Financial Assets | | | 0 | | | | 39,748 | | | | 161 | | | | 38,790 | |
Loss Carry Forwards | | | 2,421 | | | | 0 | | | | 9,670 | | | | 0 | |
Provisions and Liabilities | | | 11,083 | | | | 264 | | | | 8,943 | | | | 296 | |
Untaxed Reserves | | | 0 | | | | 3,033 | | | | 0 | | | | 2,361 | |
Others | | | 1,600 | | | | 259 | | | | 741 | | | | 337 | |
| | | | |
| | | 15,105 | | | | 43,303 | | | | 19,515 | | | | 41,784 | |
| | | | |
Tax credits with the same tax authority | | | (14,558 | ) | | | (14,558 | ) | | | (18,388 | ) | | | (18,388 | ) |
| |
| | | | |
Net deferred tax assets and liabilities | | | 547 | | | | 28,745 | | | | 1,127 | | | | 23,396 | |
On the basis of current tax regulations, it may be assumed that the difference between the taxable investment and the proportional share of equity of the subsidiaries included in the combined financial statements, which results essentially from retained earnings and unabsorbed losses, will remain largely exempt from taxation, so no deferred taxes were recognized.
No deferred tax assets were recognized in respect of corporate income tax loss carryforwards as of 2015 in amount of€86,802 thousand and as of 2016 in amount of€102,763 thousand.
The net position for deferred taxes changed as follows in the respective reporting periods:
| | | | | | | | |
| (in€ thousand) | | 2015 | | | 2016 | |
As at January 1 | | | 27,894 | | | | 28,198 | |
Currency differences | | | 1,007 | | | | 304 | |
Changes recognized directly in equity | | | | | | | | |
First consolidation | | | 0 | | | | 2,947 | |
Changes in equity | | | 51 | | | | (51 | ) |
Changes recognized through profit or loss | | | (754 | ) | | | (9,129 | ) |
As at December 31 | | | 28,198 | | | | 22,269 | |
F-50
J. NOTES TO THE COMBINED STATEMENTOF CASH FLOWS
The statement of cash flows is prepared using the indirect method. The cash flows from operating, investing, and financing activities are presented separately in the statement of cash flows.
Cash and cash equivalents reported in the statement of cash flows are comprised of cash balances and investments with a remaining duration of three months or less at the date of acquisition and therefore correspond to cash and cash equivalents.
Acquisition of subsidiaries, less cash transferred
This item includes a contingent purchase price payment in connection with the acquisition of the Spear Group in fiscal year 2013 in the amount of€35,939 thousand, an additional purchase price payment for the acquisition of the Pemara Group in the amount of€871 thousand, and the balances of cash and cash equivalents acquired from the first consolidation of the Pemara Group.
Payments for other financial investments
Payments for other financial investment in fiscal year 2015 include the purchase price payment of€21,256 thousand for the acquisition of Pemara Group and loans granted to Pemara companies.
Dividends paid to company owners
The following table shows the reconciliation of Dividends recognized in the Combined Statement of Changes in Equity and the Dividend payments recognized in the Combined Statement of cash flows:
| | | | | | | | |
| (in€ thousand) | | 2015 | | | 2016 | |
| |
Profit distribution agreement (German Tax Group) | | | (23,227 | ) | | | (16,710 | ) |
Dividend payments to shareholders | | | (7,783 | ) | | | (308 | ) |
Recognition in consolidated equity | | | (31,010 | ) | | | (17,019 | ) |
| | | | |
Change of liabilities from Profit distribution agreement | | | 9,491 | | | | (6,518 | ) |
| | | | |
Recognition in consolidated cash flow statement | | | (21,520 | ) | | | (23,537 | ) |
| | | | |
Other cash flow disclosures
Investments in tangible and intangible assets presented in the statement of cash flows correspond to the investments reported in the combined asset table, adjusted for the change in liabilities arising from the acquisition of tangible and intangible assets, changes in prepayments on fixed assets which are included in non-current assets as well as non-cash additions for finance leases.
The “Other non-cash income/expenses” item mainly comprises gains and losses from changes in exchange rates and expenses from the fair value measurement of put option liabilities.
F-51
K. FINANCIAL INSTRUMENTS
Risk management strategies
Division Labels is exposed to risks with respect to its assets, liabilities, and forecast transactions arising from changes in exchange rates, interest rates, and quoted market prices. Management of these risks is regulated by policies that apply throughout the Constantia Flexibles. The aim of financial risk management is to mitigate these market risks through ongoing operational and finance-related activities. Derivative financial instruments are only used as hedging instruments. Division Labels participates in the group-wide committed lines, no separate committed lines are available.
Financial concentration risk
The financial concentration or cluster risk describes the risk to the Constantia Flexibles emanating from a dependency upon banks or other financial counterparties. Division Labels follows the principle of financial independence, which is also regulated in group-wide policies. The financial independence of the Division Labels is guaranteed by actively managing the allocation of business. The Division Labels is not exposed to any concentration risks.
Capital risk management
The Division Labels manages its capital with the objective of ensuring that all entities can operate under the going-concern assumption, while concurrently maximizing the income from its equity investments by optimizing the debt-to-equity ratio.
The net debt* at year end was as follows:
| | | | | | | | |
| (in€ thousand) | | 12/31/2015 | | | 12/31/2016 | |
| | |
Non-current financial assets | | | (1,264 | ) | | | (1,096 | ) |
Current financial assets | | | (74,668 | ) | | | (67,734 | ) |
Other current, interest-bearing financial liabilities | | | 151,906 | | | | 174,755 | |
Interest-bearing non-current financial liabilities | | | 107,782 | | | | 138,494 | |
Interest-bearing current financial liabilities | | | 4,775 | | | | 5,702 | |
Debt | | | 188,531 | | | | 250,121 | |
| | |
Cash and cash equivalents | | | (10,417 | ) | | | (23,625 | ) |
| | |
Total | | | 178,114 | | | | 226,497 | |
* Net debt definition excludes intercompany dividend payables and receivables and excluding intercompany accrued interest.
Foreign currency risk
Foreign currency risk arises from the fact that the value of a financial instrument can change due to exchange rate fluctuations. The Division Labels enters into foreign currency derivatives in order to hedge both the foreign exchange risk related to cash flow from operating activities (cash flow hedges) and the risk of fair value changes of assets and liabilities reported in the balance sheet (fair value hedges). No derivatives are used for speculative purposes and the principle applies that only instruments that can be clearly measured and recognized are used.
The transaction risk is calculated for each individual foreign currency. Both foreign currency receivables and liabilities arising from transactions are recognized in the balance sheet at the time that the contract is entered into, as are certain off-balance-sheet items, which above all include recurring operating transactions (forecast material purchases and sales).
F-52
Foreign currency risks for the Division Labels result from the fact that it operates worldwide in a number of countries where it owns production sites and sales its goods and services. Owing to the Division Labels decentralized organizational structure, material purchasing generally takes place in the respective national currencies of the local companies. Similarly, the resulting invoices of the foreign companies are largely billed in the local currency. This results in a closed currency position and a significant reduction in the identifiable currency risk. In the case of positions that cannot be closed through a matching transaction (natural hedge), overhangs are hedged via currency forwards or options that correspond to the risk exposure and horizon.
Primary financial instruments, which include trade receivables and payables, financial receivables and liabilities, and securities, are allocated to the following currency positions at the reporting date:
Primary financial instrument assets
| | | | | | | | | | | | | | | | |
| | | 12/31/2015 | | | | | | 12/31/2016 | | | | |
(in€ thousand) | | | EUR | | | | | % | | | EUR | | | | | % |
EUR | | | 113,575 | | | | 65.1 | % | | | 116,528 | | | | 59.1 | % |
USD | | | 32,672 | | | | 18.7 | % | | | 42,934 | | | | 21.8 | % |
ZAR | | | 5,278 | | | | 3.0 | % | | | 11,626 | | | | 5.9 | % |
MXN | | | 13,789 | | | | 7.9 | % | | | 10,893 | | | | 5.5 | % |
GBP | | | 5,522 | | | | 3.2 | % | | | 5,529 | | | | 2.8 | % |
AUD | | | 0 | | | | 0.0 | % | | | 3,815 | | | | 1.9 | % |
other | | | 3,700 | | | | 2.1 | % | | | 5,721 | | | | 2.9 | % |
Total | | | 174,535 | | | | | | | | 197,047 | | | | | |
Primary financial instrument liabilities
| | | | | | | | | | | | | | | | |
| | | 12/31/2015 | | | | | | 12/31/2016 | | | | |
(in€ thousand) | | | EUR | | | | | % | | | EUR | | | | | % |
USD | | | 237,984 | | | | 52.0 | % | | | 259,811 | | | | 52.9 | % |
EUR | | | 185,291 | | | | 40.5 | % | | | 182,139 | | | | 37.1 | % |
AUD | | | 13,332 | | | | 2.9 | % | | | 18,639 | | | | 3.8 | % |
MXN | | | 6,415 | | | | 1.4 | % | | | 6,756 | | | | 1.4 | % |
ZAR | | | 948 | | | | 0.2 | % | | | 5,605 | | | | 1.1 | % |
GBP | | | 6,610 | | | | 1.4 | % | | | 5,464 | | | | 1.1 | % |
other | | | 7,282 | | | | 1.6 | % | | | 12,833 | | | | 2.6 | % |
Total | | | 457,861 | | | | | | | | 491,247 | | | | | |
Liquidity risk
Liquidity risk is the risk of not having funds available at all times that can be used to settle financial liabilities that are incurred. Accordingly, the Constantia Flexibles and Division Labels ensures that sufficient cash and cash equivalents are available or that necessary funding is secured through corresponding credit lines.
Liquidity risk is determined by the currency-specific liquidity planning carried out across the Constantia Flexibles. Capitalization measures are planned for all Division Labels entities based on the results.
In order to minimize liquidity risk, Constantia Flexibles has committed lines available in the amount of 2015 (at Constantia Flexibles Holding GmbH):€170 million,€155 million of which was free at the reporting date, 2016 (at Constantia Flexibles Holding GmbH):€165 million,€150 million of which was free at the reporting date. Division Labels participates in the Constantia Flexibles group committed lines, no separate committed lines are available.
F-53
Interest rate risk
Interest rate risk occurs in the form of net interest or present value risks. Interest rate risk cannot be eliminated, since an interaction between present value and net interest risk exists. Present value risk adversely impacts the Constantia Flexibles in the fair value of interest-bearing financial instruments and investments, while net interest risk impacts interest expense or interest income.
Liquidity and interest rate risk tables
The average interest rate on borrowings for 2015 is 4.46%, for 2016 is 4.53%.
The following tables show the remaining contractual maturities of theprimary financial liabilities. The tables are based on the undiscounted cash flows from financial liabilities and are based on the earliest date at which the Division Labels can be forced to pay. The table includes both interest and principal payments. If interest payments are based on variable parameters, the undiscounted amount is determined, based on the interest rates at the reporting date. The contractual maturities are based on the earliest date at which the Division Labels can be forced to make payments.
| | | | | | | | | | | | | | | | | | | | | | |
| | | |
| (in€ thousand) | | Carrying
amount | | | Undiscounted Cash Flows | | | | |
| | | Total | | | Weighted
average
effective
interest rate | | Less than
1 year | | | 1-5 years | | | Over 5
years | | | Total | |
12/31/2015 | | | | | | | | | | | | | | | | | | | | | | |
Non-financial liabilities | | | 20,316 | | | | | | 17,868 | | | | 2,448 | | | | 0 | | | | 20,316 | |
Non-interest bearing | | | 193,335 | | | | | | 125,999 | | | | 80,338 | | | | 0 | | | | 206,338 | |
Finance lease liability | | | 28,410 | | | 4.96% | | | 3,599 | | | | 11,476 | | | | 25,746 | | | | 40,822 | |
Variable interest rate instruments | | | 209,266 | | | 4.31% | | | 142,936 | | | | 68,872 | | | | 0 | | | | 211,808 | |
Fixed interest rate instruments | | | 26,850 | | | 5.78% | | | 3,379 | | | | 15,950 | | | | 15,393 | | | | 34,722 | |
| | | | | | | |
| | | 478,177 | | | | | | 293,781 | | | | 179,085 | | | | 41,139 | | | | 514,006 | |
12/31/2016 | | | | | | | | | | | | | | | | | | | | | | |
Non-financial liabilities | | | 21,495 | | | | | | 19,348 | | | | 2,147 | | | | 0 | | | | 21,495 | |
Non-interest bearing | | | 172,295 | | | | | | 100,932 | | | | 81,711 | | | | 0 | | | | 182,643 | |
Finance lease liability | | | 30,722 | | | 4.93% | | | 3,830 | | | | 13,495 | | | | 26,477 | | | | 43,802 | |
Variable interest rate instruments | | | 261,870 | | | 4.42% | | | 169,884 | | | | 101,972 | | | | 0 | | | | 271,856 | |
Fixed interest rate instruments | | | 26,360 | | | 5.76% | | | 3,187 | | | | 15,606 | | | | 13,567 | | | | 32,360 | |
| | | | | | | | | | |
| | | | 512,742 | | | | | | 297,181 | | | | 214,932 | | | | 40,044 | | | | 552,156 | |
The “Non-financial liabilities” item consists of prepaid expenses, prepayments, liabilities to employees and for social security benefits, liabilities to tax authorities, and VAT liabilities.
Non-interest bearing financial instruments include trade payables, call/put option liabilities, contingent consideration liabilities (earn-outs), and other liabilities.
The following table describes the expected maturities of theprimary financial assets. The table below was prepared on the basis of undiscounted contractual maturities of financial assets including interest thereon. The inclusion of information on primary financial assets is necessary in order to understand the liquidity risk management since this is done on a net basis.
F-54
| | | | | | | | | | | | | | | | | | | | | | |
| | | |
| (in€ thousand) | | Carrying
amount | | | Undiscounted Cash Flows | | | | |
| | | Total | | | Weighted
average
effective
interest rate | | Less than
1 year | | | 1-5 years | | | Over 5
years | | | Total | |
12/31/2015 | | | | | | | | | | | | | | | | | | | | | | |
Non-financial assets | | | 36,318 | | | | | | 33,544 | | | | 2,774 | | | | 0 | | | | 36,318 | |
Non-interest bearing | | | 88,185 | | | | | | 88,185 | | | | 0 | | | | 0 | | | | 88,185 | |
Variable interest rate instruments | | | 75,932 | | | 0.04% | | | 74,702 | | | | 1,264 | | | | 0 | | | | 75,965 | |
Variable interest rate deposits | | | 10,416 | | | 0.09% | | | 10,426 | | | | 0 | | | | 0 | | | | 10,426 | |
| | | | | | | | | | |
| | | 210,852 | | | | | | 206,857 | | | | 4,037 | | | | 0 | | | | 210,894 | |
12/31/2016 | | | | | | | | | | | | | | | | | | | | | | |
Non-financial assets | | | 11,766 | | | | | | 7,474 | | | | 4,292 | | | | 0 | | | | 11,766 | |
Non-interest bearing | | | 104,578 | | | | | | 104,578 | | | | 0 | | | | 0 | | | | 104,578 | |
Variable interest rate instruments | | | 68,844 | | | 0.03% | | | 67,759 | | | | 1,108 | | | | 0 | | | | 68,867 | |
Variable interest rate deposits | | | 23,625 | | | 0.03% | | | 23,632 | | | | 0 | | | | 0 | | | | 23,632 | |
| | | | | | | | | | |
| | | | 208,813 | | | | | | 203,443 | | | | 5,401 | | | | 0 | | | | 208,844 | |
The item “Non-financial assets” consists of deferred income, prepayments, and advances to employees and social benefit receivables, receivables from tax authorities, and VAT receivables. other claims. Non-consolidated investments are not included in undiscounted cashflow table.
Non-interest-bearing financial instruments include trade receivables and other receivables.
Variable-rate financial instruments comprise loans receivables, sub-lease receivables, reimbursement claims, and other claims.
Non-consolidated investments are not included in undiscounted cashflow table.
Credit risk
Credit risk or the risk of delayed payment or non-payment by a counterparty is managed by using credit checks, credit limits, and routine audit procedures. Where possible, the Division Labels obtains state export guarantees or guarantees from private credit insurers in order to reduce the risk of payment default. The Division Labels also limits credit risk by only working with financial partners with excellent credit ratings.
On the assets side, the reported amounts of primary financial instruments represent both the maximum credit and the maximum default risks.
Valuation allowances are recognized for all identified risks, with the result that management is of the opinion that no other credit risks will arise.
Commodity price risk
In its business activities, Division Labels is exposed to commodity price risks associated with aluminum. The aluminum risks of the Group are due to the fact that the Division Labels processes aluminum.
The price risks of the commodity listed on the London Metal Exchange (LME) are hedged by standard commodity futures. Hedges of future cash flows from the acquisition of aluminum are classified as cash flow hedges if the criteria for using hedge accounting are met. In other cases, derivatives used to hedge commodity price risk are classified as held for trading. In the area of commodity price hedging, the principle also applies that only derivatives that can be clearly measured and recognized are used.
F-55
Risk analysis
Exchange rate risk
The risk analysis for foreign currencies is carried out based on the net financial position and cash flows in foreign currency operating activities. On average, the risk horizon for this analysis is about six months, since prices can be adjusted after this period. However, some business activities may have longer maturities.
Sensitivity analyses per December 31, 2015
| | | | | | | | | | | | | | | | | | | | |
| (in€ thousand) | | Change | | | EUR | | | USD | | | Other | | | total | |
Exchange rate risks | | | | | | | | | | | | | | | | | | | | |
P&L impact of USD devalutation | | | 10% | | | | 0 | | | | 465 | | | | | | | | 465 | |
P&L impact of USD appreciation | | | 10% | | | | 0 | | | | (465 | ) | | | | | | | (465 | ) |
Interest rate risks | | | | | | | | | | | | | | | | | | | | |
Change in net interest result due to a change in interest rates of | | | 1.00% | | | | (720 | ) | | | (1,203 | ) | | | (81 | ) | | | (2,004 | ) |
| | | | | |
| | | Change | | | | | | | | | | | | AL | |
Commodity price risks | | | | | | | | | | | | | | | | | | | | |
Change in inventory valuation due to an LME aluminium prices cut off | | | 10% | | | | | | | | | | | | | | | | (71 | ) |
Sensitivity analyses per December 31, 2016
| | | | | | | | | | | | | | | | | | | | |
| (in€ thousand) | | Change | | | EUR | | | USD | | | Other | | | total | |
Exchange rate risks | | | | | | | | | | | | | | | | | | | | |
P&L impact of USD devalutation | | | 10% | | | | 0 | | | | 338 | | | | | | | | 338 | |
P&L impact of USD appreciation | | | 10% | | | | 0 | | | | (338 | ) | | | | | | | (338 | ) |
Interest rate risks | | | | | | | | | | | | | | | | | | | | |
Change in net interest result due to a change in interest rates of | | | 1.00% | | | | (668 | ) | | | (1,624 | ) | | | (294 | ) | | | (2,586 | ) |
| | | | | |
| | | Change | | | | | | | | | | | | AL | |
Commodity price risks | | | | | | | | | | | | | | | | | | | | |
Change in inventory valuation due to an LME aluminium prices cut off | | | 10% | | | | | | | | | | | | | | | | (123 | ) |
Derivative financial instruments
Only standard market instruments with sufficient liquidity are used for hedging purposes. All hedging instruments are contracted with Constantia Flexibles Group GmbH which serves as the group trader with hedging derivatives.
Cash flow hedges
Currency derivatives are used to hedge future cash flows on uncompleted and forecast foreign currency transactions.
Commodity derivatives are also used to hedge commodity price risks (aluminum) on highly probable forecast transactions.
Interest rate swaps on a EUR basis are used to hedge interest rate risk. The fair values of the interest rate derivatives result from changes in the yield curve that have occurred since the beginning of their term. To limit the
F-56
interest expense, there are also interest rate caps on a EUR basis. Since the intrinsic value of the interest rate caps is currently set at zero, the fair value (current market value) is recognized in profit or loss under held for trading.
Fair value hedges
Foreign exchange forward contracts were entered into and classified as fair value hedges in order to hedge the financial portfolio. Changes in the fair value of these foreign currency derivatives are reported in net financial income and expense.
Held for trading
Foreign currency and commodity derivatives that do not meet the requirements for hedge accounting under IAS 39 with regard to documentation and effectiveness are classified as held for trading. Changes in the fair value of these derivative financial instruments are recognized in profit or loss in the combined statement of profit or loss.
Derivative financial instruments classified as cash flow hedges and recognized in the hedging reserve:
Cash flow hedges
| | | | | | | | | | | | | | | | | | | | | | | | |
| | | | | | | | | 12/31/2015 | | | 12/31/2016 | |
| (in€ thousand) | | Currency or
Commodity | | | | | | Nominal
value1) | | | Market value
in € thousand | | | Nominal
value1) | | | Market value
in € thousand | |
Currency derivatives | | | | | | | | | | | | | | | | | | | | | | | | |
Forwards | | | USD | | | | Sale | | | | 24,424 | | | | (888) | | | | 20,777 | | | | (1,348) | |
| | | | | | | Buy | | | | N/A | | | | N/A | | | | 6,484 | | | | 207 | |
| | | GBP | | | | Sale | | | | N/A | | | | N/A | | | | 3,200 | | | | 29 | |
| | | EUR | | | | Buy | | | | N/A | | | | N/A | | | | 695 | | | | (39) | |
| | | | | | | Sell | | | | N/A | | | | N/A | | | | N/A | | | | N/A | |
| | | | ZAR | | | | Sale | | | | 55,800 | | | | 736 | | | | 79,200 | | | | (318) | |
Commodity derivatives | | | | | | | | | | | | | | | | | | | | | | | | |
LME-Forward contracts | | | AL | | | | Sale | | | | N/A | | | | N/A | | | | N/A | | | | N/A | |
| | | AL | | | | Buy | | | | 800 | | | | (4) | | | | N/A | | | | N/A | |
| | | | | | | | | | | | | | | | | | | | | | | | |
| | | | | | | | | | | | | | | (156) | | | | | | | | (1,469) | |
| | | | | | | | | | | | | | | | | | | | | | | | |
| 1) | Notional values for currencies reported in thousands, commodities in metric tons of aluminum (AL) |
Derivative financial instruments included in fair value hedges or classified as held for trading and recognized in the combined statement of profit or loss:
Fair value hedges
| | | | | | | | | | | | | | | | | | | | | | | | |
| | | | | | | | | 12/31/2015 | | | | | | 12/31/2016 | |
| (in€ thousand) | | Currency or
Commodity | | | | | | Nominal
value1) | | | Market value
in € thousand | | | Nominal
value 1) | | | Market value
in € thousand | |
Forward contracts | | | | | | | | | | | | | | | | | | | | | | | | |
| | | EUR | | | | Buy | | | | N/A | | | | N/A | | | | 80 | | | | (10) | |
| | | | | | | | | | | | | | | | | | | | | | | | |
| | | | | | | | | | | | | | | 0 | | | | | | | | (10) | |
| | | | | | | | | | | | | | | | | | | | | | | | |
The notional values are derived from the aggregate gross amount of all purchase and sale amounts of derivative financial transactions, and commodity derivatives are recorded in metric tons in the transaction currency.
The fair values are derived from the amounts at which the financial transactions in question are traded on the reporting date. The fair values of commodity derivatives are based on official aluminum prices on the LME at the reporting date. The fair values of currency forward derivatives and interest rate derivatives are determined on the
F-57
basis of market data at the reporting date. The fair value of interest rate derivatives is determined using generally recognized mathematical valuation models.
Additional disclosures on financial instruments pursuant to IFRS 7
Carrying amounts, amounts recognized, and fair values by valuation category:
| | | | | | | | | | | | | | | | | | | | | | | | | | | | | | | | |
| (in € thousand) | | Carrying
amount
12/31/2015 | | | Fair Value
Hedge | | | Cashflow
Hedge | | | Held for
Trading | | | Available
for Sale | | | Loans and
Receivables | | | Cash and
cash
equivalents | | | Other
receivables | |
Assets | | | | | | | | | | | | | | | | | | | | | | | | | | | | | | | | |
Other non-current and financial assets | | | 32,906 | | | | 0 | | | | 0 | | | | 0 | | | | 0 | | | | 1,264 | | | | 0 | | | | 31,643 | |
Trade accounts receivables | | | 81,515 | | | | 0 | | | | 0 | | | | 0 | | | | 0 | | | | 81,515 | | | | 0 | | | | 0 | |
Other receivables | | | 86,768 | | | | 0 | | | | 753 | | | | 0 | | | | 0 | | | | 81,339 | | | | 0 | | | | 4,676 | |
Fixed interest rate instruments | | | 10,417 | | | | 0 | | | | 0 | | | | 0 | | | | 0 | | | | 0 | | | | 10,417 | | | | (0) | |
Total assets | | | 211,606 | | | | 0 | | | | 753 | | | | 0 | | | | 0 | | | | 164,118 | | | | 10,417 | | | | 36,318 | |
| | | | | | | | |
| | | Total per
Level | | | Fair Value
Hedge | | | Cashflow
Hedge | | | Held for
Trading | | | Available
for Sale | | | | | | | | | | |
Fair Value Hierarchy IFRS 13 | | | | | | | | | | | | | | | | | | | | | | | | | | | | | | | | |
Level 1 | | | 0 | | | | 0 | | | | 0 | | | | 0 | | | | 0 | | | | | | | | | | | | | |
Level 2 | | | 753 | | | | 0 | | | | 753 | | | | 0 | | | | 0 | | | | | | | | | | | | | |
Level 3 | | | 0 | | | | 0 | | | | 0 | | | | 0 | | | | 0 | | | | | | | | | | | | | |
Total | | | 753 | | | | 0 | | | | 753 | | | | 0 | | | | 0 | | | | | | | | | | | | | |
| | | | | | | | | | | | | | | | | | | | | | | | | | | | | | | | |
| (in € thousand) | | Carrying
amount
12/31/2016 | | | Fair Value
Hedge | | | Cashflow
Hedge | | | Held for
Trading | | | Available
for Sale | | | Loans and
Receivables | | | Cash and
cash
equivalents | | | Other
receivables | |
Assets | | | | | | | | | | | | | | | | | | | | | | | | | | | | | | | | |
Other non-current and financial assets | | | 5,402 | | | | 0 | | | | 0 | | | | 0 | | | | 1 | | | | 1,108 | | | | 0 | | | | 4,292 | |
Trade accounts receivables | | | 98,368 | | | | 0 | | | | 0 | | | | 0 | | | | 0 | | | | 98,368 | | | | 0 | | | | 0 | |
Other receivables | | | 81,971 | | | | 0 | | | | 279 | | | | 0 | | | | 0 | | | | 73,946 | | | | 0 | | | | 7,747 | |
Fixed interest rate instruments | | | 23,625 | | | | 0 | | | | 0 | | | | 0 | | | | 0 | | | | 0 | | | | 23,625 | | | | 0 | |
Total assets | | | 209,365 | | | | 0 | | | | 279 | | | | 0 | | | | 1 | | | | 173,422 | | | | 23,625 | | | | 12,039 | |
| | | | | | | | |
| | | Total per
Level | | | Fair Value
Hedge | | | Cashflow
Hedge | | | Held for
Trading | | | Available
for Sale | | | | | | | | | | |
Fair Value Hierarchy IFRS 13 | | | | | | | | | | | | | | | | | | | | | | | | | | | | | | | | |
Level 1 | | | 0 | | | | 0 | | | | 0 | | | | 0 | | | | 0 | | | | | | | | | | | | | |
Level 2 | | | 279 | | | | 0 | | | | 279 | | | | 0 | | | | 0 | | | | | | | | | | | | | |
Level 3 | | | 0 | | | | 0 | | | | 0 | | | | 0 | | | | 0 | | | | | | | | | | | | | |
Total | | | 279 | | | | 0 | | | | 279 | | | | 0 | | | | 0 | | | | | | | | | | | | | |
F-58
| | | | | | | | | | | | | | | | | | | | | | | | |
| (in€ thousand) | | Carrying
amount
12/31/2015 | | | Fair Value
Hedge | | | Cashflow
Hedge | | | at FV through
P&L | | | other financial
liabilities | | | accrued and
other liabilities | |
Liabilities | | | | | | | | | | | | | | | | | | | | | | | | |
| | | | | | |
Non-current liabilities | | | 178,116 | | | | 0 | | | | 551 | | | | 10,329 | | | | 164,788 | | | | 2,448 | |
Current liabilities | | | 234,317 | | | | 0 | | | | 359 | | | | 35,939 | | | | 180,151 | | | | 17,868 | |
Trade accounts payables | | | 66,654 | | | | 0 | | | | 0 | | | | 0 | | | | 66,654 | | | | 0 | |
Total liabilities | | | 479,087 | | | | 0 | | | | 909 | | | | 46,268 | | | | 411,593 | | | | 20,316 | |
| | | | | | |
| | | Total per
Level | | | Fair Value
Hedge | | | Cashflow
Hedge | | | at FV through
P&L | | | | | | | |
Fair Value Hierarchy IFRS 13 | | | | | | | | | | | | | | | | | | | | | | | | |
| | | | | | |
Level 1 | | | 0 | | | | 0 | | | | 0 | | | | 0 | | | | | | | | | |
Level 2 | | | 909 | | | | 0 | | | | 909 | | | | 0 | | | | | | | | | |
Level 3 | | | 46,268 | | | | 0 | | | | 0 | | | | 46,268 | | | | | | | | | |
Total liabilities | | | 47,177 | | | | 0 | | | | 909 | | | | 46,268 | | | | | | | | | |
| | | | | | | | | | | | | | | | | | | | | | | | |
| (in€ thousand) | | Carrying
amount
12/31/2016 | | | Fair Value
Hedge | | | Cashflow
Hedge | | | at FV through
P&L | | | other financial
liabilities | | | accrued and
other liabilities | |
Liabilities | | | | | | | | | | | | | | | | | | | | | | | | |
| | | | | | |
Non-current liabilities | | | 212,655 | | | | 0 | | | | 650 | | | | 8,318 | | | | 201,539 | | | | 2,147 | |
Current liabilities | | | 221,349 | | | | 10 | | | | 1,098 | | | | 2,385 | | | | 198,508 | | | | 19,348 | |
Trade accounts payables | | | 80,497 | | | | 0 | | | | 0 | | | | 0 | | | | 80,497 | | | | 0 | |
Total liabilities | | | 514,501 | | | | 10 | | | | 1,749 | | | | 10,703 | | | | 480,543 | | | | 21,495 | |
| | | | | | |
| | | Total per
Level | | | Fair Value
Hedge | | | Cashflow
Hedge | | | at FV through
P&L | | | | | | | |
Fair Value Hierarchy IFRS 13 | | | | | | | | | | | | | | | | | | | | | | | | |
| | | | | | |
Level 1 | | | 0 | | | | 0 | | | | 0 | | | | 0 | | | | | | | | | |
Level 2 | | | 1,759 | | | | 10 | | | | 1,749 | | | | 0 | | | | | | | | | |
Level 3 | | | 10,703 | | | | 0 | | | | 0 | | | | 10,703 | | | | | | | | | |
Total liabilities | | | 12,462 | | | | 10 | | | | 1,749 | | | | 10,703 | | | | | | | | | |
| 1 | The fair value of other financial liabilities is discussed below. |
Other receivables and liabilities are not financial instruments under IFRS 7. In order to ensure comparability with the balance sheet, they were included in the tables.
Other available-for-sale equity instruments for which there is no listed market price in an active market and whose fair value cannot be reliably determined are initially recognized at cost plus transaction costs and are reported at the reporting date, net of any impairment losses.
For financial assets, other financial liabilities, trade receivables, other receivables, cash and cash equivalents, securities, and trade payables, as well as accrued and other liabilities, the carrying amounts are reasonable approximations of their fair values. All Intercompany loan receivables and loan payables are interest bearing based on the variable interest rates reflecting the market conditions.
F-59
Fair value hedges, cash flow hedges, and financial instruments held for trading are classified as Level 2 because the fair values of these financial instruments are based on market-derived inputs.
Disclosures on the “Loans and receivables/payables” measurement category
The fair values of other non-current assets and financial assets and non-current liabilities represent the present value of payments associated with the assets or liabilities in consideration of the current interest rate inputs that reflect market- and counterparty-related changes in conditions and expectations.
The measurement categories of the fair value hierarchy are as follows:
| Level 1: | Fair values are determined based on publicly quoted market prices. |
| Level 2: | Fair values are estimated based on the results of a valuation technique that uses the data from the market and is based as little as possible on company-specific data. |
| Level 3: | Fair value measurements are those that arise from models, using inputs that are not based on observable market data (unobservable inputs, assumptions) to measure assets or liabilities. |
The fair values for Level 2 measurement of simple over-the-counter derivative financial instruments, available-for-sale financial assets, and liabilities held for trading are determined by reference to prices quoted by brokers. These quotations are tested for plausibility by discounting the expected future cash flows using market interest rates for similar instruments relevant at the measurement date. The fair value reflects the credit risk of the instrument and includes adjustments to adequately consider the credit risk of the Group entity and the counterparty where appropriate.
The Division Labels recognizes transfers between measurement levels at the end of the reporting period in which a reclassification occurs. In fiscal years 2015 and 2016, there were no reclassifications between Level 1, Level 2, and Level 3.
Level 3 fair values
The Division Labels has established a control system related to the measurement of fair value. In line with the control system, a measurement team has been nominated that reports directly to the Chief Financial Officer, and which has overall responsibility for all significant fair value measurements, including Level 3 measurements.
The measurement team regularly reviews significant unobservable inputs and measurement adjustments. If third-party data such as broker quotes is used to measure fair value, the measurement team evaluates and documents the evidence obtained from third parties and assesses whether these measurements are consistent with the IFRS requirements. This assessment includes the proper classification in the hierarchy.
F-60
Financial instruments at fair value through profit or loss include contingent purchase prices. Details on the measurement of Level 3 fair values are shown in the following table.
| | | | |
| (in€ thousand) | | Contingent
Consideration
(purchase price) | |
Balance at January 1, 2015 | | | 38,324 | |
| |
Addition through sale / acquisition of companies | | | 7,944 | |
Disposal through payment | | | - | |
| |
Total gains and losses for the period included in other comprehensive income: | | | | |
- Fair value adjustment | | | - | |
| |
Total gains and losses for the period included in profit or loss: | | | | |
- Fair value adjustment | | | - | |
- Net finance income and expense | | | - | |
- Currency translation differences | | | - | |
| |
Balance at December 31, 2015 = January 1, 2016 | | | 46,268 | |
| |
Addition through sale / acquisition of companies | | | - | |
Disposal through payment | | | (35,939 | ) |
| |
Total gains and losses for the period included in other comprehensive income: | | | | |
- Fair value adjustment | | | - | |
| |
Total gains and losses for the period included in profit or loss: | | | | |
- Fair value adjustment | | | - | |
- Net finance income and expense | | | 215 | |
- Currency translation differences | | | 159 | |
| |
Balance at December 31, 2016 | | | 10,703 | |
Contingent purchase prices result from the acquisition of the Spear Group and Pemara Group. Earn Out Payment in 2016 relates to Spear Group Earn Out.
F-61
Sensitivity analysis
The fair values correspond to the expected payments discounted to present value using a risk-adjusted interest rate. The inputs used and the sensitivities of the individual contingent purchase prices are as follows:
| | | | | | |
| |
| | | contingent consideration |
| | | Spear Group
12/31/2015 | | Pemara Group |
| (in€ thousand) | | | 12/31/2015 | | 12/31/2016 |
Base currency | | USD | | AUD | | AUD |
| | | |
Annual sales growth | | | | | | |
Unobservable input parameter used | | 8.0%-9.2% | | 5.8% | | 5.8% |
Effect from +0.5% points adjustment | | (987) | | (41) | | (43) |
Effect from -0.5% points adjustment | | 982 | | 41 | | 43 |
| | | |
Projected EBITDA margin | | | | | | |
Unobservable input parameter used | | 12.6%-14.4% | | 15.3% | | 15.3% |
Effect from +0.5% points adjustment | | (3,829) | | (287) | | (300) |
Effect from -0.5% points adjustment | | 3,637 | | 287 | | 300 |
| | | |
Risk adjusted interest rate | | | | | | |
Unobservable input parameter used | | 3.0% | | 2.4% | | 2.4% |
Effect from +1.0% points adjustment | | 0 | | 272 | | 200 |
Effect from -1.0% points adjustment | | 0 | | (284) | | (207) |
The expected payment by the Pemara Group was calculated based on the forecast EBITDA and net debt. Management is responsible for the exercise date, which was set between 2019 and 2020.
If one or more of the significant unobservable inputs were to be replaced by reasonable possible alternatives, this would have the effects presented on the fair value of the contingent consideration. These effects were calculated by replacing the underlying assumptions with alternative estimates of unobservable inputs that might reasonably have been applied by market participants when measuring the contingent consideration. It is assumed that interactions between the individual unobservable inputs have no significant impact on the range of reasonably possible alternative assumptions.
F-62
L. CONTINGENT LIABILITIES / RECEIVABLES AND CONTINGENCIES
Contingent liabilities are not recognized in the combined balance sheet, except in the case of contingent liabilities accounted for under IFRS 3. They are disclosed when the outflow of resources embodying economic benefits is possible, but the requirements for recognition of a provision are not met.
A contingent asset is not recognized in the combined financial statements but is disclosed when an inflow of economic benefits is probable.
Litigation
2015
The Division Labels is not aware of any significant litigation at the balance sheet date of 12/31/2015 that has a more than negligible probability of occurrence.
2016
The Division Labels is not aware of any significant litigation at the balance sheet date of 12/31/2016 that has a more than negligible probability of occurrence.
Environmental contamination
2015
The Division Labels is not aware of any significant environmental contamination at the balance sheet date of 12/31/2015 that has a more than negligible probability of occurrence.
2016
The Division Labels is not aware of any significant environmental contamination at the balance sheet date of 12/31/2015 that has a more than negligible probability of occurrence.
Other
| | | | | | | | |
(in€ thousand) | | 2015 | | | 2016 | |
Warranties and guarantees | | | 0 | | | | 0 | |
Division Labels as part of Constantia Flexibles has been party to the SFA loan agreement as an additional guarantor since July 1, 2015.
F-63
M. RELATED PARTY DISCLOSURES
The ultimate controlling company of Constantia Division Labels in Austria is Constantia Flexibles Holding GmbH which is based in Vienna, Austria. The consolidated financial statements are published at the Commercial Court in Vienna, Austria. The ultimate controlling company of Constantia Flexibles Holding GmbH is Wendel S.A., which is based in Paris, France. The consolidated financial statements are published at the Commercial Court in Paris, France.
All business transactions between the companies within the Group and related entities and individuals have been conducted on an arm’s length basis.
No other material transactions of any kind, in particular contracts for the sale of significant assets, were entered into.
Division Labels management remunerations:
| | | | | | | | |
(in€ thousand) | | 2015 | | | 2016 | |
Management remuneration | | | 882 | | | | 1,679 | |
Management remuneration represents the annual salaries (short term benefits). There are no receivables or payables open due to or due from the Management board.
For the Constantia Flexibles’ CEO, Constantia Flexibles’ CFO, Mergers and acquisition functions and Supervisory board the remuneration expenses were not recorded in the Income statement of the combined financial statements of the Division Labels in amount of€1,560 thousand for 2015 and in amount of€1,583 thousand for 2016. These remuneration expenses represents the short term employee benefits only.
In fiscal year 2016 earn outs were paid to Randy Spear€12,751 thousand, to Rick Spear€12,751 thousand and to Mike Henry€ 10,437 thousand.
The Supervisory Board of the Group is located at Constantia Flexibles Holding GmbH.
Supply and service relationships with the Group holding companies in fiscal year 2015:
| | | | | | | | | | | | | | | | |
| (in€ thousand) | | received | | | completed | | | Receivables | | | Payables | |
Constantia Shared Services Austria GmbH | | | 193 | | | | (358 | ) | | | 47,244 | | | | (8 | ) |
Aluprint S. de R.L. de C.V. | | | 19 | | | | (699 | ) | | | 30 | | | | (5,642 | ) |
Constantia Flexibles Germany GmbH | | | 214 | | | | (22,461 | ) | | | 589 | | | | (23,688 | ) |
Constantia Flexibles International GmbH | | | 519 | | | | (4,365 | ) | | | 18 | | | | (2,787 | ) |
Aluprint Plegadizos S. de R.L. de C.V. | | | 0 | | | | (20 | ) | | | 0 | | | | (271 | ) |
Constantia Shared Services Germany GmbH | | | 8 | | | | (105 | ) | | | 0 | | | | (25 | ) |
Constantia Ebert GmbH | | | 1,431 | | | | 0 | | | | 1,425 | | | | 0 | |
Constantia St. Petersburg OOO | | | 2,059 | | | | (67 | ) | | | 525 | | | | (16 | ) |
Constantia Flexibles Group GmbH | | | 36 | | | | (10,308 | ) | | | 26,989 | | | | (230,337 | ) |
Constantia Flexibles Bucuresti S.R.L. | | | 3 | | | | (18 | ) | | | 0 | | | | (9 | ) |
Corona Packaging ApS | | | 1 | | | | 0 | | | | 0 | | | | (72 | ) |
Constantia Flexibles Sales LLC | | | 890 | | | | 0 | | | | 245 | | | | 0 | |
Constantia Hueck Folien GmbH & Co KG | | | 1 | | | | (9 | ) | | | 0 | | | | (9 | ) |
Constantia Nusser GmbH | | | 2,531 | | | | 0 | | | | 2,531 | | | | 0 | |
Constantia Teich GmbH | | | 7 | | | | (488 | ) | | | 0 | | | | (0 | ) |
GPC Holdings Coöperatief U.A. | | | 0 | | | | 0 | | | | 0 | | | | (64 | ) |
Constantia Tobepal S.L. | | | 0 | | | | (9,127 | ) | | | 0 | | | | (1,271 | ) |
Constantia Teich Poland | | | 0 | | | | (7 | ) | | | 0 | | | | 0 | |
Constantia Flexibles America Co. | | | 0 | | | | 0 | | | | 1,012 | | | | 0 | |
F-64
The transactions mainly include Financing loans and interest charges with Constantia Flexibles Group GmbH, cash-pooling receivables and loan receivables with Constantia Shared Services Austria GmbH and Constantia Flexibles Group GmbH, dividends payables due to Constantia Flexibles Germany GmbH, dividend receivables due from Constantia Ebert GmbH and Constantia Nusser GmbH, group charges including M&A services from Constantia Flexibles International GmbH, Intercompany Sales to Constantia St. Petersburg OOO and to Constantia Flexibles America Co. as well as Product deliveries from Constantia Tobepal S.L. and Constantia Teich GmbH.
Conditions of Intercompany financing loans are conducted on an arm’s length basis. Interest rates are variable based on the Euribor and US Libor indexes plus margin reflecting the Inflation Differential and Country risk premium in particular entities. Maturity terms at the reporting date for intercompany loans issued by Constantia Flexibles Group GmbH are up to 6,5 years.
At the reporting date following entities of the Division Labels participated in cash pooling agreements:
| | - | Haendler & Natermann GmbH |
Each day the balance of the respective master accounts are cleared to zero. Positive balances are transferred to the cash pool master account and negative balances are funded with monies transferred from the cash pool master account. Interests are charged at arm’s length and calculated according to the external interests charged plus a margin which depends on the participants’ internal rating calculated once a year. The Cash Pool Agreement is concluded for an indefinite term. However, the Pool Master may exclude a Participant with immediate effect at any time for good cause.
All hedging instruments at the Division Labels are contracted with Constantia Flexibles Group GmbH which serves as the group trader with hedging derivatives. Further description is included in the Chapter K – Financial instruments.
F-65
Transactions with the Group companies in fiscal year 2016:
| | | | | | | | | | | | | | | | |
| (in€ thousand) | | received | | | completed | | | Receivables | | | Payables | |
Constantia Flexibles GmbH | | | 0 | | | | (0 | ) | | | 0 | | | | (13 | ) |
Constantia Shared Services Austria GmbH | | | 207 | | | | (415 | ) | | | 37,879 | | | | (8 | ) |
Afripack Consumer Flexibles | | | 91 | | | | (117 | ) | | | 520 | | | | (1 | ) |
Afripack Holdings Pty. Ltd. | | | 0 | | | | (121 | ) | | | 9 | | | | (16 | ) |
Aluprint S. de R.L. de C.V. | | | 41 | | | | (732 | ) | | | 42 | | | | (1,545 | ) |
Constantia Flexibles Germany GmbH | | | 276 | | | | (23,537 | ) | | | 1,798 | | | | (16,722 | ) |
Constantia Flexibles International GmbH | | | 601 | | | | (5,722 | ) | | | 43 | | | | (5,981 | ) |
Aluprint Plegadizos S. de R.L. de C.V. | | | 0 | | | | (12 | ) | | | 0 | | | | 0 | |
Constantia Shared Services Germany GmbH | | | 0 | | | | (138 | ) | | | 0 | | | | (252 | ) |
Constantia Ebert GmbH | | | 1,491 | | | | 0 | | | | 1,486 | | | | 0 | |
Constantia St. Petersburg OOO | | | 2,565 | | | | (69 | ) | | | 712 | | | | (18 | ) |
Constantia Flexibles Group GmbH | | | 1 | | | | (12,811 | ) | | | 27,612 | | | | (286,883 | ) |
Corona Packaging ApS | | | 0 | | | | 0 | | | | 0 | | | | (62 | ) |
Constantia Flexibles Sales LLC | | | 988 | | | | 0 | | | | 267 | | | | 0 | |
Constantia Hueck Folien GmbH & Co KG | | | 0 | | | | (80 | ) | | | 0 | | | | 0 | |
Constantia Flexibles America Co. | | | 0 | | | | (5 | ) | | | 1,841 | | | | (185 | ) |
Constantia Nusser GmbH | | | 3,255 | | | | 0 | | | | 3,255 | | | | 0 | |
Constantia Teich GmbH | | | 6 | | | | (521 | ) | | | 5 | | | | (120 | ) |
Constantia Flexibles Holding GmbH | | | 127 | | | | 0 | | | | 126 | | | | 0 | |
Constantia Tobepal S.L. | | | 0 | | | | (9,794 | ) | | | 0 | | | | (1,497 | ) |
Constantia Flexibles Bucuresti S.R.L. | | | 0 | | | | (3 | ) | | | 0 | | | | 0 | |
The transactions mainly include Financing loans and interest charges with Constantia Flexibles Group GmbH, cash-pooling receivables and loan receivables with Constantia Shared Services Austria GmbH and Constantia Flexibles Group GmbH, dividends payables due to Constantia Flexibles Germany GmbH, dividend receivables due from Constantia Ebert GmbH and Constantia Nusser GmbH, group charges from Constantia Flexibles International GmbH, Intercompany Sales to Constantia St. Petersburg OOO and to Constantia Flexibles America Co. as well as Product deliveries from Constantia Tobepal S.L. and Constantia Teich GmbH.
Conditions of Intercompany financing loans are conducted on an arm’s length basis. Interest rates are variable based on the Euribor and US Libor indexes plus margin reflecting the Inflation Differential and Country risk premium in particular entities. Maturity terms at the reporting date for intercompany loans issued by Constantia Flexibles Group GmbH are up to 5,5 years.
At the reporting date following entities of the Division Labels participated in cash pooling agreements:
| | - | Haendler & Natermann GmbH |
Each day the balance of the respective master accounts are cleared to zero. Positive balances are transferred to the cash pool master account and negative balances are funded with monies transferred from the cash pool master account. Interests are charged at arm’s length and calculated according to the external interests charged plus a margin which depends on the participants’ internal rating calculated once a year. The Cash Pool Agreement
F-66
is concluded for an indefinite term. However, the Pool Master may exclude a Participant with immediate effect at any time for good cause.
All hedging instruments at the Division Labels are contracted with Constantia Flexibles Group GmbH which serves as the group trader with hedging derivatives. Further description is included in the Chapter K – Financial instruments.
F-67
| N. | GROUP ENTITIES (DIVISION LABELS ENTITIES) |
| | | | | | | | | | | | |
2015 | | | | | Percentage interest held | |
| Name | | Registered office | | | Directly* | | | Indirectly** | |
Fully combined | | | | | | | | | | | | |
| | | |
CF Australia Holding Pty. Ltd. | | | Sydney, AU | | | | 100.00 | | | | 100.00 | |
CF Australia Pty. Ltd. | | | Sydney, AU | | | | 100.00 | | | | 100.00 | |
GPC III BV | | | Amsterdam, NL | | | | 100.00 | | | | 100.00 | |
GPC III Packaging Holdings Mexico S de R.L. de C.V. | | | Monterrey, MX | | | | 100.00 | | | | 100.00 | |
Grafo Regia S. de R. L. de C.V. | | | Monterrey, MX | | | | 100.00 | | | | 100.00 | |
Spearsystem Packaging (Africa) (Pty) Ltd. | | | Boksburg, SA | | | | 74.90 | | | | 74.90 | |
Spearsystem Packaging (Asia) PTE Ltd. | | | Singapore, SG | | | | 100.00 | | | | 100.00 | |
Spear Europe Ltd. | | | Cwmbran, GB | | | | 100.00 | | | | 100.00 | |
SGH (No. 2) Ltd. | | | Cwmbran, GB | | | | 100.00 | | | | 100.00 | |
Spear Group Holdings Ltd. | | | Cwmbran, GB | | | | 100.00 | | | | 100.00 | |
Spear Ltd. | | | Cwmbran, GB | | | | 100.00 | | | | 100.00 | |
Spear USA Inc. | | | Mason, USA | | | | 100.00 | | | | 100.00 | |
Gardoc Inc. | | | Milford, USA | | | | 100.00 | | | | 100.00 | |
Precision, Printing and Packaging Inc. | | | Clarksville, USA | | | | 100.00 | | | | 100.00 | |
Haendler et Natermann Benelux SPRL/BVBA | | | Waterloo, B | | | | 100.00 | | | | 100.00 | |
H & N (Suzhou) Packaging Materials Co. Ltd. | | | Taicang, RC | | | | 100.00 | | | | 100.00 | |
Constantia CM Labels SDN BHD | | | Kuala Lumpur, MAL | | | | 70.00 | | | | 70.00 | |
Etipack SARL | | | Vittel, F | | | | 100.00 | | | | 100.00 | |
Exprim SARL | | | Ablis, F | | | | 100.00 | | | | 100.00 | |
Haendler & Natermann GmbH | | | Hann. Münden, D | | | | 100.00 | | | | 100.00 | |
Haendler & Natermann Iberica S.L.U. | | | Sevilla, E | | | | 100.00 | | | | 100.00 | |
SIM’EDIT Imprimeurs SAS | | | Couëron, F | | | | 99.99 | | | | 99.99 | |
Constantia Labels GmbH | | | Heiligenstadt, D | | | | 100.00 | | | | 100.00 | |
Novis Casa de Editura si Tipografia S.R.L. | | | Cluj- Napoca, RO | | | | 100.00 | | | | 100.00 | |
Printer Labels Inc. | | | Ontario, USA | | | | 100.00 | | | | 100.00 | |
Sim’EDIT SAS | | | Ablis, F | | | | 100.00 | | | | 100.00 | |
SIM’Label Inc. | | | Cowansville, CAN | | | | 100.00 | | | | 100.00 | |
Verstraete in mould labels NV | | | Maldegem, B | | | | 51.00 | | | | 51.00 | |
| *) from the perspective of the direct parent companies | |
| **) from the perspective of Constantia Flexibles Holding GmbH | |
F-68
| | | | | | | | | | | | |
2016 | | | | | Percentage interest held | |
| Name | | Registered office | | | Directly* | | | Indirectly** | |
Fully combined | | | | | | | | | | | | |
| | | |
Afripack Consumer Flexibles (Labels) Pty. Ltd. | | | Mobeni, ZA | | | | 74.00 | | | | 70.30 | |
CF Australia Holding Pty. Ltd. | | | Sydney, AU | | | | 100.00 | | | | 100.00 | |
CF Australia Pty. Ltd. | | | Sydney, AU | | | | 100.00 | | | | 100.00 | |
Cunamara Investments Pty. Ltd. | | | Victoria, AU | | | | 100.00 | | | | 100.00 | |
GPC III BV | | | Amsterdam, NL | | | | 100.00 | | | | 100.00 | |
GPC III Packaging Holdings Mexico S de R.L. de C.V. | | | Monterrey, MX | | | | 100.00 | | | | 100.00 | |
Grafo Regia S. de R. L. de C.V. | | | Monterrey, MX | | | | 100.00 | | | | 100.00 | |
Pemara Asia Holding Pte Ltd. | | | Singapore, SG | | | | 100.00 | | | | 100.00 | |
Pemara Pty. Ltd. | | | Victoria, AU | | | | 100.00 | | | | 100.00 | |
PT. Pemara Labels Indonesia | | | Jababeka Cikarang-Bekasi, ID | | | | 100.00 | | | | 100.00 | |
Pemara Labels (Malaysia) SDN. BHD. | | | Selangor, MAL | | | | 100.00 | | | | 100.00 | |
Pemara Labels (Philippines) Inc. | | | Laguna, PH | | | | 100.00 | | | | 100.00 | |
Pemara Labels (Vietnam) Ltd. | | | Binh Duong Province, VN | | | | 100.00 | | | | 100.00 | |
Spearsystem Packaging (Africa) (Pty) Ltd. | | | Boksburg, SA | | | | 74.90 | | | | 74.90 | |
Spearsystem Packaging (Asia) PTE Ltd. | | | Singapur, SG | | | | 100.00 | | | | 100.00 | |
Spear Europe Ltd. | | | Cwmbran, GB | | | | 100.00 | | | | 100.00 | |
SGH (No. 2) Ltd. | | | Cwmbran, GB | | | | 100.00 | | | | 100.00 | |
Spear Group Holdings Ltd. | | | Cwmbran, GB | | | | 100.00 | | | | 100.00 | |
Spear Ltd. | | | Cwmbran, GB | | | | 100.00 | | | | 100.00 | |
Spear USA Inc. | | | Mason, USA | | | | 100.00 | | | | 100.00 | |
Gardoc Inc. | | | Milford, USA | | | | 100.00 | | | | 100.00 | |
Precision, Printing and Packaging Inc. | | | Clarksville, USA | | | | 100.00 | | | | 100.00 | |
Haendler et Natermann Benelux SPRL/BVBA | | | Waterloo, B | | | | 100.00 | | | | 100.00 | |
H & N (Suzhou) Packaging Materials Co. Ltd. | | | Taicang, RC | | | | 100.00 | | | | 100.00 | |
Constantia CM Labels SDN BHD | | | Kuala Lumpur, MAL | | | | 100.00 | | | | 100.00 | |
Etipack SARL | | | Vittel, F | | | | 100.00 | | | | 100.00 | |
Exprim SARL | | | Ablis, F | | | | 100.00 | | | | 100.00 | |
Haendler & Natermann GmbH | | | Hann. Münden, D | | | | 100.00 | | | | 100.00 | |
Haendler & Natermann Iberica S.L.U. | | | Sevilla, E | | | | 100.00 | | | | 100.00 | |
SIM’EDIT Imprimeurs SAS | | | Couëron, F | | | | 99.99 | | | | 99.99 | |
Constantia Labels GmbH | | | Heiligenstadt, D | | | | 100.00 | | | | 100.00 | |
Novis Casa de Editura si Tipografia S.R.L. | | | Cluj- Napoca, RO | | | | 100.00 | | | | 100.00 | |
Printer Labels Inc. | | | Ontario, USA | | | | 100.00 | | | | 100.00 | |
Sim’EDIT SAS | | | Ablis, F | | | | 100.00 | | | | 100.00 | |
SIM’Label Inc. | | | Cowansville, CAN | | | | 100.00 | | | | 100.00 | |
Verstraete in mould labels NV | | | Maldegem, B | | | | 51.00 | | | | 51.00 | |
| *) from the perspective of the direct parent companies | |
| **) from the perspective of Constantia Flexibles Holding GmbH | |
F-69
EVENTS AFTER THE END OF THE REPORTING PERIOD
In July 2017 Constantia Flexibles has signed an agreement to sell its Labels division to Multi-Color Corporation (“Multi-Color”) for an enterprise value of approximately€1.15 billion ($1.3 billion). The transaction is expected to be completed in the fourth quarter of 2017, subject to regulatory approvals.
The majority of the transaction is payable in cash, while Constantia Flexibles will also receive 3.4 million shares in Multi-Color stock. On completion of the transaction, the flexible packaging company will hold 16.6% of Multi-Color, thereby becoming its largest shareholder.
GOVERNING BODIES OF THE PARENT COMPANY CONSTANTIA FLEXIBLES GMBH
The following people were active in the reporting period:
a) on the Management Board
Alexander Baumgartner
Peter Alexander Frauenknecht (until 4/30/2016)
Stephan Kühne (since 10/21/2016)
Gerold Riegler
Franz Reiterer (until 3/31/2016)
b) on the Supervisory Board
Frederic Lemoine, Chairman
Bernard Jean-Pierre Gautier, Deputy Chairman
Roland Lienau, member
Albrecht von Alvensleben, member
Patrick Tanguy, member
Jan Homan, member
Wolfgang Pfarl, member
Ulrich Köstlin, member
Mathias Hlubek, member
For the Management Board
| | |
Chief Executive Officer | | Chief Financial Officer |
Alexander Baumgartner | | Stephan Kühne |
Vienna, September 7, 2017
F-70

IFRS COMBINED FINANCIAL
STATEMENTS HY 2017
Table of Content
| | | | | | |
Combined Balance Sheet as of June 30, 2017 and December 31, 2016 | | | F-73 | |
| |
Combined Statement of Profit or Loss for the Periods Ending June 30, 2017 and June 30, 2016 | | | F-74 | |
| |
| Combined Statement of Other Comprehensive Income for the Periods Ending June 30, 2017 and June 30, 2016 | | | F-75 | |
| |
Combined statement of Cash Flows for the Periods Ending June 30, 2017 and June 30, 2016 | | | F-76 | |
| |
| Combined Statement of Changes in Invested Equity for the Periods Ending June 30, 2017 and June 30, 2016 | | | F-77 | |
| |
Notes to the Combined Financial Statements | | | F-78 | |
| | |
A. | | General Information | | | F-78 | |
| | |
B. | | Accounting Principles | | | F-83 | |
| | |
C. | | Significant Accounting Policies | | | F-83 | |
| | |
D. | | Seasonal Fluctuations | | | F-85 | |
| | |
E. | | Changes in the Scope of Consolidation | | | F-85 | |
| | |
F. | | Notes to the Combined Balance Sheet | | | F-86 | |
| | |
G. | | Notes to the Combined Income Statement | | | F-88 | |
| | |
H. | | Notes to the Combined Statement of Cash Flows | | | F-89 | |
| | |
I. | | Financial Instruments | | | F-90 | |
| | |
J. | | Contingent Liabilities and Other Risks | | | F-94 | |
| | |
K. | | Related Party Disclosures | | | F-95 | |
| | |
L. | | Group Entities (Division Labels Entities) as of June 30, 2017 and December 31, 2016 | | | F-98 | |
| | |
M. | | Other Disclosures | | | F-98 | |
F-72
COMBINED BALANCE SHEETASOF JUNE 30, 2017AND
DECEMBER 31, 2016
| | | | | | | | | | | | |
| (in€ thousand) | | Note | | | 06/30/2017 | | | 12/31/2016 | |
Assets | | | | | | | | | | | | |
Goodwill | | | F1 | | | | 139,783 | | | | 149,457 | |
Intangible assets | | | F1 | | | | 51,704 | | | | 59,773 | |
Tangible assets | | | F1 | | | | 183,900 | | | | 196,431 | |
Othernon-current and financial assets | | | | | | | 14,168 | | | | 5,401 | |
Deferred tax assets | | | | | | | 9,589 | | | | 1,127 | |
| | | | | | | | |
Non-current assets | | | | | | | 399,144 | | | | 412,189 | |
| | | |
Inventories | | | F2 | | | | 79,104 | | | | 72,794 | |
Trade receivables | | | F3 | | | | 114,074 | | | | 98,368 | |
Tax receivables | | | | | | | 2,876 | | | | 3,416 | |
Other receivables | | | F4 | | | | 65,134 | | | | 81,971 | |
Cash and cash equivalents | | | | | | | 23,890 | | | | 23,625 | |
| | | | | | | | |
Current assets | | | | | | | 285,078 | | | | 280,174 | |
| | | | | | | | |
Total assets | | | | | | | 684,222 | | | | 692,363 | |
| | | | | | | | |
| | | |
Equity and liabilities | | | | | | | | | | | | |
Total invested equity attributable to Division LABELS | | | | | | | 130,286 | | | | 125,362 | |
Non-controlling interests | | | | | | | 24,703 | | | | 21,774 | |
| | | | | | | | |
Total invested equity | | | F5 | | | | 154,989 | | | | 147,136 | |
| | | |
Provisions | | | | | | | 1,304 | | | | 1,338 | |
Interest-bearing financial liabilities | | | | | | | 129,115 | | | | 138,494 | |
Othernon-current liabilities | | | | | | | 69,827 | | | | 74,161 | |
Deferred tax liabilities | | | | | | | 30,036 | | | | 23,396 | |
| | | | | | | | |
Non-current financial liabilities | | | | | | | 230,282 | | | | 237,390 | |
| | | |
Provisions | | | | | | | 202 | | | | 214 | |
Interest-bearing financial liabilities | | | | | | | 5,923 | | | | 5,702 | |
Trade payables | | | | | | | 93,972 | | | | 80,496 | |
Tax liabilities | | | | | | | 8,423 | | | | 5,779 | |
Other current liabilities | | | F6 | | | | 190,431 | | | | 215,648 | |
| | | | | | | | |
Current financial liabilities | | | | | | | 298,951 | | | | 307,839 | |
| | | | | | | | |
Total equity and liabilities | | | | | | | 684,222 | | | | 692,364 | |
| | | | | | | | |
F-73
COMBINED STATEMENTOF PROFITOR LOSSFORTHE
PERIODS ENDING JUNE 30, 2017AND JUNE 30, 2016
| | | | | | | | | | | | |
(in€ thousand) | | Note | | | 1-6/2017 | | | 1-6/2016 | |
Sales | | | | | | | 317,318 | | | | 304,542 | |
| | | |
Cost of Goods sold | | | | | | | (253,190 | ) | | | (244,604 | ) |
| | | |
Gross Profit | | | | | | | 64,128 | | | | 59,938 | |
| | | |
Selling Expenses | | | | | | | (16,142 | ) | | | (15,150 | ) |
Research and Development Expenses | | | | | | | (959 | ) | | | (834 | ) |
Administration Expenses | | | | | | | (13,138 | ) | | | (12,958 | ) |
Other Income | | | | | | | 810 | | | | 1,649 | |
Other Expenses | | | | | | | (1,398 | ) | | | (911 | ) |
| | | | | | | | |
| | | |
Earnings before interest and tax (EBIT) | | | | | | | 33,301 | | | | 31,735 | |
| | | |
Interest income | | | | | | | 45 | | | | 29 | |
Interest expense | | | | | | | (10,400 | ) | | | (9,160 | ) |
Other financial income and expense | | | | | | | 5,693 | | | | (442 | ) |
| | | | | | | | |
Net financial income and expense | | | G3 | | | | (4,662 | ) | | | (9,573 | ) |
| | | |
Earnings before tax (EBT) | | | | | | | 28,639 | | | | 22,162 | |
| | | |
Current tax | | | | | | | (10,001 | ) | | | (8,457 | ) |
Deferred tax | | | | | | | 784 | | | | 981 | |
| | | | | | | | |
Income tax | | | | | | | (9,217 | ) | | | (7,477 | ) |
| | | |
Net income after tax | | | | | | | 19,422 | | | | 14,686 | |
| | | |
Thereof attributable to: | | | | | | | | | | | | |
Owners of the company | | | | | | | 14,698 | | | | 10,699 | |
Non-controlling interests | | | | | | | 4,724 | | | | 3,987 | |
As Division Labels does not represent unified legal group whose securities are publicly traded, there are no earnings per share disclosures, as would be required by IAS 33 “Earnings per Share.”
F-74
COMBINED STATEMENTOF OTHER COMPREHENSIVE INCOMEFOR
THE PERIODS ENDING JUNE 30, 2017AND JUNE 30, 2016
| | | | | | | | | | | | |
| (in€ thousand) | | Note | | | 1-6/2017 | | | 1-6/2016 | |
Net income after tax | | | | | | | 19,422 | | | | 14,686 | |
| | | |
Items that will be reclassified subsequently
to profit or loss under given circumstances: | | | | | | | (1,819 | ) | | | (3,278 | ) |
Effective portion of changes in fair value of cash flow hedges | | | | | | | 1,203 | | | | (388 | ) |
Gain/(loss) through changes in fair value | | | | | | | 609 | | | | (68 | ) |
Transfer to profit and loss account | | | | | | | 594 | | | | (320 | ) |
| | | |
Currency translation differences | | | | | | | (3,118 | ) | | | (2,869 | ) |
Changes in exchange differences recognized on
translation of foreign subsidiaries | | | | | | | (3,118 | ) | | | (2,869 | ) |
Transfer to profit and loss account | | | | | | | | | | | | |
| | | |
apportioned deferred taxes | | | | | | | 96 | | | | (21 | ) |
| | | |
Items that will not be | | | | | | | | | | | | |
reclassified to profit or loss: | | | | | | | 4 | | | | 0 | |
Change in actuarial gains/losses | | | | | | | | | | | | |
Actuarial gains/losses | | | | | | | 6 | | | | 0 | |
apportioned deferred taxes of actuarial gains/losses | | | | | | | (2 | ) | | | 0 | |
| | | | | | | | | | | | |
Other comprehensive income for the period | | | | | | | (1,815 | ) | | | (3,278 | ) |
| | | | | | | | | | | | |
Total comprehensive income for the period | | | | | | | 17,607 | | | | 11,408 | |
| | | |
Thereof attributable to: | | | | | | | | | | | | |
Owners of the company | | | | | | | 12,445 | | | | 7,395 | |
Non-controlling interests | | | | | | | 5,163 | | | | 4,013 | |
F-75
COMBINEDSTATEMENTOF CASH FLOWSFORTHE PERIODS ENDING JUNE 30, 2017AND JUNE 30, 2016
| | | | | | | | | | | | |
(in€ thousand) | | Note | | | 1-6/2017 | | | | 1-6/2016 | |
| |
| | | |
Earnings before tax (EBT) | | | | | 28,639 | | | | 22,162 | |
+/(-) | | Net interest | | | | | 10,355 | | | | 9,130 | |
+/(-) | | Depreciation and amortization/(reversal) of tangible and intangible assets | | G2 | | | 22,440 | | | | 20,994 | |
+/(-) | | Gain/(loss) upon disposal of tangible and intangible assets | | | | | (168 | ) | | | (171 | ) |
(-) | | Dividend income | | | | | 0 | | | | 0 | |
+/(-) | | Othernon-cash (income)/expenses | | H | | | (5,655 | ) | | | (1,699 | ) |
| | | | | | | | |
Cashflow from the result | | | | | 55,610 | | | | 50,415 | |
+/(-) | | Inventory | | | | | (9,546 | ) | | | (12,781 | ) |
+/(-) | | Trade receivables | | | | | (19,252 | ) | | | (20,663 | ) |
+/(-) | | Trade payables | | | | | 12,251 | | | | 19,731 | |
+/(-) | | Other receivables | | | | | (4,702 | ) | | | (1,358 | ) |
+/(-) | | Provisions | | | | | (18 | ) | | | 178 | |
+/(-) | | Other liabilities | | | | | 986 | | | | (262 | ) |
(-) | | Tax payments | | | | | (5,935 | ) | | | (4,516 | ) |
+ | | Interest received | | | | | 28 | | | | 303 | |
(-) | | Interest paid | | | | | (9,286 | ) | | | (7,637 | ) |
| | | | | | | | |
Cash flow from operating activities | | | | | 20,135 | | | | 23,411 | |
+ | | Sales of tangible and intangible assets | | | | | 189 | | | | 208 | |
(-) | | Investments in tangible and intangible assets | | | | | (13,168 | ) | | | (19,449 | ) |
(-) | | Acquisition of subsidiaries, less cash transferred | | H | | | (2,480 | ) | | | (32,701 | ) |
+ | | Dividends received | | | | | 4,740 | | | | 3,956 | |
(-) | | Payments for loans granted | | | | | (17,391 | ) | | | (12,276 | ) |
+ | | Proceeds from loans paid back | | | | | 19,417 | | | | 15,798 | |
+/(-) | | Proceeds/(Payments) other financial investments | | | | | 12 | | | | 2 | |
| | | | | | | | |
Cash flow from investing activities | | | | | (8,681 | ) | | | (44,462 | ) |
+ | | Increases in financial liabilities | | | | | 23,164 | | | | 63,766 | |
(-) | | Redemption of financial liabilities | | | | | (11,868 | ) | | | (6,695 | ) |
(-) | | Dividends paid to company owners | | H | | | (19,755 | ) | | | (23,227 | ) |
(-) | | Dividends paid tonon-controlling interests | | | | | (2,234 | ) | | | 0 | |
| | | | | | | | |
Cash flow from financing activities | | | | | (10,693 | ) | | | 33,844 | |
| Change in cash and cash equivalents due to exchange rate differences | | | | | (497 | ) | | | (183 | ) |
| | | | | | | | |
| | | |
Change in cash and cash equivalents | | | | | 265 | | | | 12,610 | |
| | | | | | | | |
| | | |
Cash and cash equivalents at the beginning of the period | | | | | 23,625 | | | | 10,416 | |
| | | | | | | | |
Cash and cash equivalents at the end of the period | | | | | 23,890 | | | | 23,026 | |
| | | | | | | | |
F-76
COMBINED STATEMENTOF CHANGESIN INVESTED EQUITYFORTHE PERIODS ENDING JUNE 30, 2017AND JUNE 30, 2016
| | | | | | | | | | | | | | | | | | | | | | | | | | | | |
(in€ thousand) | | Net assets attributable
toDivision LABELS | | | Currency translation
differences | | | Hedging reserves for
cash flow hedges | | | Actuarial gains and
losses | | | Total invested equity
attributable to
Division LABELS | | | Non-controlling
interests | | | Total invested
equity | |
Balance at 1 January 2017 | | | 111,170 | | | | 16,561 | | | | (1,449 | ) | | | (921 | ) | | | 125,362 | | | | 21,774 | | | | 147,136 | |
Net income | | | 14,698 | | | | | | | | | | | | | | | | 14,698 | | | | 4,724 | | | | 19,422 | |
Other comprehensive income (loss), net of tax | | | | | | | (3,455 | ) | | | 1,196 | | | | 4 | | | | (2,254 | ) | | | 439 | | | | (1,815 | ) |
Total comprehensive income (loss), net of tax | | | 14,698 | | | | (3,455 | ) | | | 1,196 | | | | 4 | | | | 12,444 | | | | 5,163 | | | | 17,607 | |
| |
Carve out tax | | | 863 | | | | | | | | | | | | | | | | 863 | | | | | | | | 863 | |
Dividends | | | (8,383 | ) | | | | | | | | | | | | | | | (8,383 | ) | | | (2,234 | ) | | | (10,617 | ) |
Other transactions | | | (7,521 | ) | | | | | | | | | | | | | | | (7,521 | ) | | | (2,234 | ) | | | (9,754 | ) |
| |
Balance at 30 June 2017 | | | 118,348 | | | | 13,107 | | | | (252 | ) | | | (917 | ) | | | 130,286 | | | | 24,703 | | | | 154,989 | |
| |
| | | | | | | |
Balance at 1 January 2016 | | | 98,935 | | | | 13,054 | | | | (137 | ) | | | (722 | ) | | | 111,131 | | | | 18,400 | | | | 129,531 | |
Net income | | | 10,699 | | | | | | | | | | | | | | | | 10,699 | | | | 3,987 | | | | 14,686 | |
Other comprehensive income (loss), net of tax | | | | | | | (2,893 | ) | | | (411 | ) | | | 0 | | | | (3,304 | ) | | | 26 | | | | (3,278 | ) |
Total comprehensive income (loss), net of tax | | | 10,699 | | | | (2,893 | ) | | | (411 | ) | | | 0 | | | | 7,395 | | | | 4,013 | | | | 11,408 | |
| |
First Consolidation Afripack Consumer Flexibles (Labels) Pty. Ltd. | | | 3,072 | | | | | | | | | | | | | | | | 3,072 | | | | 1,392 | | | | 4,464 | |
Carve out tax | | | 451 | | | | | | | | | | | | | | | | 451 | | | | | | | | 451 | |
Dividends | | | 0 | | | | | | | | | | | | | | | | 0 | | | | (5,446 | ) | | | (5,446 | ) |
Other transactions | | | 3,523 | | | | | | | | | | | | | | | | 3,523 | | | | (4,054 | ) | | | (531 | ) |
| |
Balance at 30 June 2016 | | | 113,157 | | | | 10,162 | | | | (548 | ) | | | (722 | ) | | | 122,049 | | | | 18,359 | | | | 140,408 | |
| |
F-77
NOTESTOTHE COMBINED FINANCIAL STATEMENTS
A. GENERAL INFORMATION
Constantia Flexibles Holding GmbH (Constantia Flexibles), headquartered at Handelskai 92, Vienna, with its ultimate parent company Wendel SA, is a global producer of flexible packaging products. The products are mainly based on aluminum (foil), film and paper and the product portfolio includes everyday use products such as food, dairy, pet food, household and personal care products, pharmaceutical and medical products, as well as beverages. Constantia Flexibles classifies its product portfolio into three divisions: Food, Pharma and Labels. The Food division is a global leader in several of its market segments (confectionery packaging,pre-cut seals, and aluminum wrapping). The Pharma division is second-largest manufacturer of foil based blister packs for medication. The Division Labels is the world’s leading manufacturer of beer labels andin-mold labels.
During the first half year of 2017, the Managing Board of Constantia Flexibles announced its intent to sell the Division Labels and in July 2017 signed the Share purchase agreement with Multi-Color Corporation.
The Combined Financial Statements include:
| | • | | Combined Balance Sheet, |
| | • | | Combined Statements of Profit or Loss, |
| | • | | Combined Statements of Other Comprehensive Income, |
| | • | | Combined Statements of Changes in Invested Equity and |
| | • | | the Combined Statements of Cash Flows |
The Combined Financial Statements were prepared in accordance with accounting policies set out in the sections “Basis of Preparation” and “Accounting policies”.
The Combined Financial Statements have been prepared in thousands of euro (€ thousand). Rounding differences may arise when individual amounts or percentages are added together.
During the reporting periods of the Combined Financial Statements, the Division Labels was ultimately centrally managed by the Managing Board of Constantia Flexibles, as well as the members of the Extended Management Board - Labels. Historically, the Division Labels has been reported as a separate segment within the consolidated financial statements of Constantia Flexibles Group GmbH. The Managing Board of Constantia Flexibles, located in Vienna prepared and authorized the issuance of the Combined Financial Statements on September 7, 2017.
Description of the Division Labels transaction scope
The Division Labels includes pressure-sensitive, in-mould as well as film labels (including sleeve) andcut-and stack labels. The Division Labels focuses on prime labels for beverages (incl. soft drinks, beer and water), HPC and food (mainly within in-mould labels for injection moulding)
An overview of the legal entities that comprise the Labels activities and from which the Labels activities were considered for inclusion in the scope of combination of the Combined Financial Statements is presented in the Chapter L. Group Entities (Division Labels Entities).
Based on a legal view, the Division Labels does not constitute asub-group. Historically, the Division Labels has been largely operated on a stand-alone basis and comprises legal entities which are fully dedicated to the Division Labels. The only exception is Afripack, where only one plant (Afripack Durban) belongs to the Division Labels. This plant is included in the scope of the combined financial statements. In the course of the transaction acarve-out of the plant into a new separate legal entity fully dedicated to the Division Labels is planned. For Afripack Durban exists a separate accounting area, so all financial information is distinct from the remaining Afripack plants and can be assigned clearly to the Division Labels. Further legal reorganization is not needed.
F-78
Constantia Labels GmbH is shareholder of two subsidiaries, Constantia Ebert GmbH and Constantia Nusser GmbH, that are fully assigned to other segments and do not operate within the Division Labels. For the Combined Financial Statements the investments in those two subsidiaries were eliminated via Equity.
During the reporting periods covered by the combined financial statements, the Division Labels is not a legal entity in its own right. It is an integral part of Constantia Flexibles , and as such, there is no separate share capital in the combined financial statements of the division Labels. Total invested equity attributable to shareholders of the Division Labels represents Constantia’s interest in the recorded net assets of the Division Labels. The Division Labels is therefore still part of Constantia Flexibles during the reporting periods presented within these Combined Financial Statements. Thenon-Labels activities of Constantia Flexibles are referred to as “Remaining Constantia Flexibles” for purposes of the combined financial statements (as further defined below).Non-Labels activities do not exist to a material extent.
Basis of Preparation
General principles
The Division Labels historically has not prepared separate consolidated financial statements for internal or external reporting purposes. Constantia Flexibles has prepared these Combined Financial Statements for use for an agreed upon transaction with Multi-Color Corporation These combined financial statements were prepared in accordance with International Financial Reporting Standards (“IFRSs”) as issued by the International Accounting Standards Board (IASB).
The Division Labels used the same accounting policies and valuation methods for the preparation of these Combined Financial Statements as those used by Constantia Flexibles companies for the preparation of the financial information included in Constantia Flexibles consolidated financial statements, unless such accounting policies and valuation methods are not in accordance with IFRS when presenting the Division Labels as a group of companies and operations independent of Constantia Flexibles. The Combined Financial Statements were prepared on the historical carrying amounts as included in Constantia Flexibles Group GmbH consolidated financial statements.
Since IFRS does not provide any guidance for the preparation of Combined Financial Statements, IAS 8.10 and 8.12 have been used for the preparation of the Combined Financial Statements. In the absence of IFRS specific guidance, IAS 8.10 requires management to use judgment in developing and applying accounting policies which produce information that is relevant to users, reliable and free from bias, and complete in all material respects. In addition, IAS 8.12 requires that the latest pronouncements of other standard setters, other accounting literature and accepted industry practice should be considered when developing accounting policies. The developed accounting policies are described in this Note.
The Combined Financial Statements are comprised of the Combined Balance Sheet as of June 30, 2017 and, December 31, 2016 the Combined Statements of Profit or Loss, the Combined Statements of Other Comprehensive Income, the Combined Statements of Changes in Invested Equity and the Combined Statements of Cash Flows for the periods ended at June 30, 2017 and June 30, 2016 as well as all required notes.
As Constantia Flexibles prepared its Consolidated Statements of Profit or Loss using the cost of sales (function of expense) method in accordance with IAS 1, the Combined Financial Statements of Income for the Division Labels are prepared based on this approach as well.
The Combined Financial Statements may not be indicative of the Division Labels future performance and do not necessarily reflect what it’s combined results of operations, financial position and cash flows would have been had the Division Labels operated as an independent group/business during the periods presented. In addition to favorable industry and market conditions including raw material costs, the future profitability and cash flows of the Division Labels depends on its ability to receive financing. Historically, financing has been made available via legal entities to the Division Labels by Constantia’s Treasury function.
F-79
Carve-out Considerations
Division Labels Combined Financial Statements are presented using the historical purchase price allocation figures. Purchase price allocation effects arising from the first consolidation in the Wendel group (ultimate parent) following the acquisition of the Constantia Flexibles by Wendel as of March 26, 2015 are excluded from the scope to present reported periods ending June 30, 2016 and June 30, 2017 consistently to the Labels combined financial statements for theyear-end periods 2014, 2015 and 2016.
The Combined Financial Statements have been prepared on a“carve-out” basis from the Constantia Flexibles consolidated financial statements using the historical results from operations, assets and liabilities and cash flows attributable to the Division Labels and include allocations of revenue, income, expenses, assets and liabilities from Constantia Flexibles.
As most subsidiaries of the Labels division are fully dedicated to the Labels operations, all financial information is explicitly assignable to the Labels division and further allocation keys are not needed.
Combined Statements of Profit or Loss
The Combined Statements of Profit or Loss reflects the revenue and expenses attributable to the Division Labels. Revenue or operating expenses of the Division Labels were specifically identified as pertaining to the Division Labels without allocation keys and apportionment as each subsidiary or accounting area is fully dedicated to the Division Labels’ activities.
Other income or expenses incurred by Constantia Flexibles were allocated to the Division Labels to the extent that they were related to the Division Labels’ activities. The headquarter services are charged to the group entities through
(i) direct charges, if the services and costs can be determined and directly allocated and
(ii) through management fees.
Constantia Flexibles applies a standardmark-up of 7% on total costs for the services (which Management noted is at arm’s length). Indirect costs are allocated to the group entities based on different allocation keys (mainly external sales, balance sheet total, number of employees).
Constantia Flexibles group management services include the following:
The extended management board has overall responsibility, including Constantia’s strategic planning and determination of the overall strategy. The management fee includes the compensation for Mike Henry (Executive Vice President (EVP) Labels), Oliver Apel (Finance Director (FD) Labels) 50% of Ottmar Raum (Head of H&N), 50% of Dan Muenzer (Vice President (VP) Marketing Spear) and two controller in the headquarter exclusively working for the Division Labels. The allocation key in use are the external sales of the Division Labels and its total assets.
Accounting and controlling is responsible for internal and external reporting, controlling and consolidation. This services are allocated to the Division Labels based on total sales and total assets of Constantia Flexibles related to the Division Labels.
Corporate development and M&A services manages the process from screening of the potential transaction target from a strategic point of view to the closing of share purchase price agreements. The charges for the Division Labels are determined by Constantia Flexibles total sales and a weighting of total sales, total assets and the number of employees at Constantia Flexibles assignable to the Division Labels.
Communication and investor relations is responsible for communication related services within the capital market items. Total sales per Labels entity are the allocation key in use to determine the share for the Division Labels.
Constantia Flexibles finance and treasury services performs the finance services (e.g. cash management, risk management, information supply, insurance policies, hedging, liquidity management, etc.). The share allocated to the Division Labels is determined by the weighting the portion of total sales, total assets and outstanding credit limits for each Labels entity.
F-80
Legal and tax department is involved in all essential legal and tax issues at a strategic level in relation to M&A, loan agreements, employment contracts, stock exchange, capital market. Furthermore, it is responsible for all strategic tax planning matters of Constantia Flexibles. The allocation key is calculated by the weighting of total external sales, total assets and the number of employees. This allocation key also applies for internal audit, who performs internal audit service for whole Constantia Flexibles on a regular basis.
Human Resource Management is responsible for recruiting, assessing and selecting top managers for Constantia Flexibles and costs are solely allocated by the number of employees.
Sales and product management: As a basic principle, the production entities of the division sell and deliver their products directly to the customers. The sales entities of Constantia Flexibles perform sale support activities either directly or by involving local third party sales representative/agents if necessary. Charges for sales and product management are allocated based on total sales and total assets.
Research and development: Constantia Flexibles has a couple of R&D centers including H&N GmbH for the Division Labels. R&D activities in Constantia Flexibles processes and mainly relate to production processes after the rolling phase. In general, the development of application technology is the most crucial R&D function, while fundamental research represents only a very small portion of the whole R&D activities. The R&D center also covers quality control and regulatory affairs. The R&D activities focus on client-oriented development of the application technology and therefore the R&D centers work closely together with customers. The application engineers of the R&D centers are in regular contact with the sales managers and participate in the sales meetings for information exchange purposes. As H&N is included in the Division Labels, intragroup charges for the Division Labels are not material. Any R&D costs incurred at headquarter would be allocated based on total sales of Constantia Flexibles and sales of the Division Labels.
Procurement and global sourcing: Purchasing has a decentralized organization with a central coordination function at the headquarters. Within each production site, there is a person responsible for local procurements (selection of small volume third party suppliers for local demand, negotiating contractual terms, etc.). All category strategies incl. price negotiations– relevant categories are coordinated and defined by Constantia Flexibles procurement. Raw materials such as aluminum are hedged on Constantia Flexibles level by the treasury department. Charges for procurement and global sourcing are determined by the purchase volume of the Division Labels.
IT – Constantia Flexibles does not have a uniform and centralized IT structure for historical reasons. Since strategic decisions were always taken on division level, the IT strategy differs from division to division IT licenses are currently held at Group level. IT costs are charged based on weighted total external sales and number of employees.
The allocation keys are generally consistent with those Constantia Flexibles used to allocate expenses among its segments.
Management considers these allocations to be a reasonable reflection of the utilization of services provided.If the Division Labels would have been a separate, standalone company, its expenses may have differed significantly from amounts reflected in the Combined Statements of Income.
Combined Balance Sheet
Inventories, accounts receivable, property, plant, and equipment, buildings, land, intangible assets (except for goodwill), accounts payable, employee-related provisions and other accruals were directly attributable to the Division Labels as each subsidiary or accounting area is fully dedicated to the Division Labels’ activities.
In the course of thecarve-out of the Division Labels the CGU structure changed. In the Consolidated Financial statements of Constantia Flexibles, the division Labels did constitute a single CGU. The segment reporting did not contain any regional or single plant based information. However, within the Labels division the regional managers did report financial information to the EVP. Thus, there is financial information covering the period of the Combined Financial Statements available and a new CGU structure was set up. Consequently, the goodwill recognized at
F-81
Group Level needed to be recognized based on the relative values of each new CGU. The relative value is usually based on the recoverable amounts of the CGUs. Therefore, the Labels division calculated its relative values based on the value in use of each CGU.
Total invested equity attributable to shareholders of the Division Labels - Because a direct ownership relationship did not exist among the various operations comprising the Division Labels, total invested equity attributable to shareholders of the Division Labels represents Constantia Flexibles interest in the recorded net assets of the Division Labels and is shown in lieu of shareholder’s equity in the Combined Financial Statements. Total invested equity attributable to shareholders of the Division Labels does not include the settlement of intercompany transactions with the Parent.
Income taxes were determined based on the assumption that the operations in the Division Labels were separately taxable entities. This assumption implies that the current and deferred income taxes of all operations are calculated separately and the recoverability of the deferred tax assets is also assessed accordingly. The operations of the Division Labels did not file standalone tax returns in previous years, as they were not separate legal entities and were integrated intonon-Labels tax groups. The respective current tax assets, liabilities and deferred tax assets on loss carry forwards, needed to be allocated to the Division Labels entities, assets and liabilities. For all traditional and reversecarve-out locations this allocation is performed based on the assumption, that either the contribution from or the distribution to the respective tax filing group member, has a corresponding effect in the equity of the tax filing group member as of the end of the fiscal year. For allcarve-out locations current taxes, either historically incurred or allocated are deemed to be paid by the respective tax filing group member and hence included in the line item “income taxes paid” in the Combined Statements of Cash Flows.
In order to determine the taxable income, a hypothetical transfer-pricing model was applied, taking into account equalization payments for both, over- and under-utilization to the target margins.
Management considers the separate tax return approach to be reasonable, but not necessarily indicative of the tax income or expenses that would have been incurred if the entities and operations were indeed separate taxable entities.
Non-controlling interest attributable to subsidiary Verstraete in-mould Labels NV was recognized in the full amount despite of fact that put call option was contracted between the Division Labels and thenon-controlling shareholder. This accounting treatment is different to the Constantia Flexibles consolidated financial statements where thenon-controlling interest is reduced by the recognition of the put call option liability.
Combined Statements of Cash Flows
The Division Labels financing requirements are primarily met by the cash transfers with Constantia Flexibles and are reflected in the financing and the investing section of the Combined Statements of Cash Flows. This represents net cash transfers to and from Constantia Flexibles Treasury function for the settlement of various intercompany transactions and financing requirements with Constantia Flexibles.
Financing of the Labels division
Historically, Constantia Flexibles managed the financing of the Division Labels’ business and utilized a centralized approach to cash management. In addition to cash and cash equivalents balances held directly at various locations, the Division Labels pools cash balances, cash deposits and funding directly with the centralized Constantia Flexibles Treasury function. Constantia Flexibles treasury agrees interest rates with each group entity.The financing presented in the Combined Financial Statements may differ significantly from the financing of the future standalone Division Labels.
F-82
The capital structure attributed to the Division Labels in connection with the preparation of these Combined Financial Statements is presented as total invested equity attributable to the shareholders of the Division Labels, and as such, is not indicative of the capital structure that the Division Labels would have required had it been a standalone entity during the reporting periods presented.
B. ACCOUNTING PRINCIPLES
Basis
These combined interim financial statements have been prepared in accordance with IAS 34 “Interim Reporting”. The interim financial statements do not contain all of the information and disclosures that are required for complete combined financial statements pursuant to IFRS and must therefore be read in conjunction with the combined financial statements as of December 31, 2016. Selected disclosures are included in the condensed combined interim financial statements in order to explain significant events and transactions that are essential for understanding the changes to the Constantia Flexibles net assets, financial position, and results of operations since December 31, 2016.
The interim financial statements are prepared in euros (€), the Company’s reporting currency. All amounts are presented in thousands of euros (€ thousand) and rounded off, unless otherwise indicated. The rounding of individual amounts and percentages may lead to deviations in total amounts.
C. SIGNIFICANT ACCOUNTING POLICIES
The accounting methods applied in these combined interim financial statements substantially correspond to those that were applied in the combined financial statements as of December 31, 2016. It is expected that the following changes in accounting policy will also be reflected in the Constantia Flexibles combined financial statements as of December 31, 2017:
New and revised standards and interpretations applied for the first time
The IASB supplemented, newly issued, adopted or revised a number of other accounting standards and interpretations in the reporting period January 1 to June 30, 2017:
| • | | Amendments to IAS 12: Recognition of Deferred Tax Assets for Unrealised Losses |
| • | | Amendments to IAS 7: Disclosure Initiative |
| • | | Annual Improvements to IFRS Standards 2014-2016 Cycle |
The new, revised, or adjusted accounting standards and interpretations that are applicable for the first time in fiscal year 2017 have no material impact on the presentation of the net assets, financial position, or results of operations in these interim combined financial statements.
Not yet effective new IFRSs
Constantia Flexibles has not applied the following new and revised IFRSs that have been issued but are not yet effective. The impact of the application of the new and revised IFRSs is described below:
| • | | IFRS 9 (Financial Instruments) |
IFRS 9, issued in July 2014, contains revised guidance for the classification and measurement of financial instruments, including a new expected credit loss model to calculate the impairment of financial assets as well as new general accounting requirements for hedging transactions, and replaces the existing guidance under IAS 39 (Financial Instruments: Recognition and Measurement).
F-83
According to IFRS 9, all financial assets are divided into three classification categories – at amortized cost, at fair value through profit or loss (FVTPL), and at fair value through other comprehensive income (FVOCI), depending on the contractual cash flow characteristics (SPPI) and the business model.
Most of the Group’s financial assets are classified as “held to maturity” and consequently measured at amortized cost. It can be assumed that this classification and measurement will be retained under IFRS 9. There are also likely to be no more than immaterial changes in the case of the financial liabilities, since only an insignificant portion of them were designated as FVTPL. Additionally, the derecognition principles in IAS 39 will be retained in IFRS 9, with the result that no effects are expected here either.
IFRS 9 requires the Group to ensure that hedging accounting complies with the objectives and strategies of the Group’s risk management, and that hedge effectiveness is assessed to a greater extent based on a qualitative and forward-looking approach. Under the new model, it is probable that more risk management strategies will meet the criteria for hedge accounting, in particular those that contain a risk hedging component (except for foreign currency risk) of anon-financial item. Under IFRS 9, derivatives that are embedded in host contracts in which the underlying is a financial asset within the scope of the standard are never accounted for separately. Instead, the hybrid financial instrument is assessed in its entirety with regard to its classification.
Hedging transactions are entered into in the Group in order to hedge against risks such as volatile aluminum prices, interest rates, and exchange rates. The Group will perform a more comprehensive analysis, but it can be assumed that the existing hedging relationships will also meet the IFRS 9 hedge accounting requirements. As a result, the Group does not expect any material effects on its hedge accounting.
IFRS 9 replaces the old incurred loss model according to IAS 39 with an expected credit loss model based on a three-tiered classification system (“buckets”) that affects the underlying measurement horizon and interest recognition. This model must be applied to financial assets that are measured at amortized cost or at FVOCI – with the exception of dividend-bearing instruments – and to contractual assets under IFRS 15.
The Group has performed an analysis on the extent to which the expected loss credit model will impact the future recognition of impairment losses. The credit losses will be recognized at an earlier stage. The Group’s history indicates a high level of collectability of trade receivables and the Group does not expect any material impact from the application of the expected loss credit model in this respect.
The new standard entails comprehensive new disclosures and changes in presentation, which will be implemented in the reporting period in which the standard is applied for the first time. The Group will not apply IFRS 9 prior to the effective date, and hence will apply it for the first time as of the beginning of fiscal year 2018.
| • | | IFRS 15 (Revenue from Contracts with Customers) |
The objective of IFRS 15 is to establish principles to be followed by an entity in reporting decision-useful information about the nature, amount, timing, and uncertainty of revenue and cash flows arising from a contract with a customer.
The new standard uses a five-step model to identify the revenue to be recognized. These five steps are: (1.) Identify the contract(s) with a customer, (2.) Identify separate performance obligations, (3.) Determine the transaction price, (4.) Allocate the transaction price (to the performance obligations), and (5.) Determine the point in time or time period when revenue is recognized. IFRS 15 also governs the accounting for the incremental costs to obtain a contract, which must be recognized as an asset and amortized over the term if they are incurred solely because of the contract and it can be presumed that they can be recovered. Costs to fulfil a contract can also be recognized as an asset under IFRS 15 if certain criteria are met, to the extent that they are not already within the scope of another IFRS.
F-84
In some cases, customers are supplied by more than one Group subsidiary. The Group analyzed the extent to which is necessary to combine separate contracts into a single contract within the meaning of IFRS 15 and based on this analysis currently presume that no combination of the separate contracts is needed.
IFRS 15 describes certain indicators that must be considered when determining separate performance obligations. The separate accounting for performance obligations may result in revenue being recognized at different points in time. In light of this, in particular the terms and conditions of supply (INCOTERMS) were analyzed in detail and concluded that certain transportation services must be identified as a separate performance obligation. The revenue arising from the transportation services would represent for the first six months of the financial year 2017 the amount of€ 1,1 million and would be presented as Revenue satisfied over the time according to IFRS 15.
There is a range of different bonus and discount agreements in the Group that were analyzed in detail. Most of the bonus agreements are based on a retrospective system. Currently the rebates are offset directly against trade receivables and a reclassification to the “refund liability” is required. Any trade receivables need to be presented on a gross basis. Based on the underlying information a significant impact on year end 2017 financial statements is not expected as the bonuses are agreed on annual basis and settled down till December 31 of the particular year.
The Group will not exercise the option to apply IFRS 15 before the effective date at the beginning of fiscal year 2018. The Group will apply the new revenue recognition standard for the first time using the full retrospective method.
IAS 17 will be superseded when IFRS 16 takes effect. The new standard abolishes the recognition of operating leases, with certain exceptions. From January 1, 2019, when entering into a lease, the lessee must recognize the right of use asset and a lease liability.
The standard primarily affects the presentation of operating leases. Future minimum lease payments under operating leases amounted to€27,034 thousand at the reporting date December 31, 2016.
The impact on assets, financial liabilities, and the statement of profit or loss is currently being examined. However, the project is still in its early stages and no morefar-reaching statements can be made at present.
D. SEASONAL FLUCTUATIONS
Constantia Flexibles operating business is not subject to significant seasonal fluctuations.
E. CHANGESINTHE SCOPEOF CONSOLIDATION
In the first half year 2017 the scope of consolidation has not changed. At the balance sheet date Constantia Flexibles consists of 36 fully consolidated companies.
In the first half year 2016 following acquisitions were firstly consolidated in Division Labels combined statements:
| | – | | First consolidation of Pemara Labels Group, Australia, on January 1, 2016 |
| | – | | Afripack Consumer Flexibles (Labels) Pty. Ltd., South Africa, on January 1, 2016 |
Further details are included in the combined financial statements as of December 31, 2016.
F-85
F. NOTESTOTHE COMBINED BALANCE SHEET
| 1. | PROPERTY, PLANTAND EQUIPMENTAND INTANGIBLE ASSETS |
Investments and disposals
Investments in the first half of 2017 were primarily in the following projects:
| | |
• Constantia Labels GmbH | | Coater for PSL |
| |
• Spear US Mason | | Printing press (digital printing) |
| |
• Spear Europe Ltd. | | Nilpeter Press |
| |
• Verstraete in-mould labels: | | Packing automation |
Investments of€9,419 thousand(1-6/2016: €14,807 thousand) were made in property, plant and equipment and intangible assets in the first six months of fiscal year 2017.
Commitments related to capital expenditure
Commitments from expenditures on plant and equipment based on concluded contracts and purchase orders amounted to€13,844 thousand (June 30, 2016:€9,492 thousand). The investments are expected to be made within one year.
Change in goodwill
Exchange rate differences have resulted in a decrease in goodwill in the amount of (€9,674) thousand.
| | | | | | | | |
| (in€ thousand) | | 06/30/2017 | | | 12/31/2016 | |
Raw materials and supplies | | | 36,478 | | | | 33,125 | |
Semi-finished products | | | 9,303 | | | | 12,557 | |
Finished goods, merchandise | | | 33,323 | | | | 27,112 | |
| | | | |
Net realizable value (reduced by allowance) | | | 79,104 | | | | 72,794 | |
| | | | |
| | |
Allowance inventories | | | (1,034 | ) | | | (1,614 | ) |
Certain companies in the Constantia Flexibles sell receivables to financial institutions. The sale also transfers the default risk to the financial institution. The transferred receivables in the amount of€25,900 thousand (December 31, 2016:€27,723 thousand) were derecognized in accordance with IAS 39. In first half year 2017, accounts receivable were sold to a financial institution by certain German, French, Malaysian and American companies.
| | | | | | | | |
| (in€ thousand) | | 06/30/2017 | | | 12/31/2016 | |
Intercompany receivables | | | 51,583 | | | | 72,320 | |
Sub lease receivables | | | 175 | | | | 167 | |
Financial assets from derivatives | | | 472 | | | | 279 | |
Receivables social security and taxes | | | 5,788 | | | | 4,840 | |
Current receivables from employees | | | 19 | | | | 33 | |
Receivables from government grants | | | 164 | | | | 233 | |
Prepayments and accrued income | | | 2,911 | | | | 2,641 | |
Miscellaneous other receivables | | | 4,022 | | | | 1,458 | |
| | | | |
| | | 65,134 | | | | 81,971 | |
| | | | |
F-86
The main part of intercompany receivables consists of financial receivables from Constantia Flexibles companies outside the Division Labels and include intercompany financial receivables in amount of€51,553 thousand (December 31, 2016:€67,567 thousand and intercompany dividends in amount of€4,752 thousand).
Financial assets from derivatives mainly relate to the measurement of Constantia Flexibles FX hedging instruments for FX denominated transactions (only trade, no financing) and aluminum costs.
Receivables from social security and taxes mainly comprise VAT balances.
| 5. | CHANGESIN INVESTED EQUITY |
Changes in equity are presented in a separate statement (Combined statement of changes in equity).
Currency translation reserves
The currency translation reserve comprises exchange rate differences (translation effect) from the translation of financial statements of foreign operations amounting to€16,471 thousand (June 30, 2016: €19,999 thousand) and translation differences relating to monetary items that are part of a net investment in a foreign operation amounting to (€3,364) thousand (June 30, 2016: (€9,837) thousand).
Carve out tax
The carve out tax represents the counterpart to the Income statement effects of the tax calculation on stand-alone basis as if the companies Haendler Natermann GmbH and Constantia Labels GmbH were not part of the tax group in Germany as this tax group includes also the entities which are not in scope of the Combined financial statements.
First consolidation Afripack Consumer Flexibles (Labels) Pty. Ltd.
The amount represents the equity andnon-controlling interests of Afripack Consumer Flexibles (Labels) Pty. Ltd. at the time of first consolidation as of January 01, 2016.
| 6. | OTHERCURRENTLIABILITIES |
| | | | | | | | |
| (in€ thousand) | | 06/30/2017 | | | 12/31/2016 | |
Derivative financial instruments | | | 676 | | | | 1,109 | |
Personnel expenses | | | 8,528 | | | | 7,267 | |
Accrued unused vacations | | | 4,791 | | | | 4,845 | |
Other tax liabilities | | | 1,763 | | | | 1,736 | |
Liabilities to medical insurance funds | | | 1,205 | | | | 1,292 | |
Deferred income | | | 1,041 | | | | 1,129 | |
Intercompany payables | | | 169,943 | | | | 192,674 | |
Miscellaneous other liabilities | | | 2,484 | | | | 5,595 | |
| | | | |
| | | 190,431 | | | | 215,648 | |
| | | | |
Personnel expenses mainly include bonuses and overtime credits of€2,261 thousand (December 31, 2016: €2,081 thousand), Christmas bonuses of€1,173 thousand (December 31, 2016: €5 thousand) as well as payroll liabilities of€2,648 thousand (December 31, 2016: €2,442 thousand).
Intercompany payables relate to payables from group-financing payables towards Constantia Flexibles companies outside the Division Labels and include intercompany loans€162,800 thousand (December 31, 2016:€173,531 thousand), cash pooling€1,083 thousand, (December 31, 2016:€1,224 thousand) and other intercompany payables€6,060 thousand, (December 31, 2016:€17,919 thousand).
Miscellaneous other liabilities include prepayments from customers of€350 thousand, (December 31, 2016: €407 thousand), a reclaim of government grants for Novis Casa de Editura si Tipografia S.R.L. of€1,076 thousand (December 31, 2016: €1,079 thousand) and a contingent purchase price liability from the acquisition of the Spear Group of€0 thousand (December 31, 2016: €2,385 thousand).
F-87
G. NOTESTOTHE COMBINED INCOME STATEMENT
| | | | | | | | |
| (in€ thousand) | | 1-6/2017 | | | 1-6/2016 | |
Wages & Salaries | | | (54,779 | ) | | | (52,694 | ) |
Severance expenses and payments
to employee benefit funds | | | (71 | ) | | | (191 | ) |
Pension expense | | | (584 | ) | | | (542 | ) |
Expenses for mandatory social security contributions,
pay-related charges and compulsory contributions | | | (11,269 | ) | | | (9,261 | ) |
Other social expenses | | | (1,583 | ) | | | (3,363 | ) |
| | | | |
| | | (68,286 | ) | | | (66,052 | ) |
| | | | |
A Management Equity Program (MEP) was launched at the level of the shareholder, Constantia Lux Parent S.A., Luxembourg, in December 2015. This also covers senior executives at Constantia Flexibles. The value of the MEP is calculated on the basis of the Constantia Lux Parent S.A. equity value. In fiscal year 2017, the MEP was accounted for as equity-settled under IFRS 2. The fair value calculation at the grant date indicated that no recognition as a personnel expense was necessary.
| 2. | DEPRECIATIONAND AMORTIZATION |
| | | | | | | | |
| (in€ thousand) | | 1-6/2017 | | | 1-6/2016 | |
Ordinary Depreciation | | | 22,440 | | | | 20,994 | |
Impairment | | | 0 | | | | 0 | |
| | | | |
| | | 22,440 | | | | 20,994 | |
| | | | |
| | |
Thereof amortization customer lists and technology | | | 5,264 | | | | 5,222 | |
Financial income and expense break down as follows:
| | | | | | | | |
| (in€ thousand) | | 1-6/2017 | | | 1-6/2016 | |
Interest income | | | 45 | | | | 29 | |
Interest expense | | | (8,861 | ) | | | (7,630 | ) |
Interest expense for pension provisions | | | (2 | ) | | | (2 | ) |
Compounding of othernon-current liabilities and provisions | | | (1,537 | ) | | | (1,528 | ) |
| | | | |
Interest income and expenses | | | (10,355 | ) | | | (9,130 | ) |
| | | | |
| | |
Gains/(losses) from currency translation difference | | | 721 | | | | (446 | ) |
Ineffective part of hedging | | | (14 | ) | | | 0 | |
Other | | | 4,985 | | | | 4 | |
| | | | |
Other financial income and expense | | | 5,693 | | | | (442 | ) |
| | | | |
F-88
The interest expense includes finance lease expenses in the amount of (€895) thousand(1-6/2016: (€882) thousand). The compounding on othernon-current liabilities and provisions mainly represent expenses for the compounding on the discounted liabilities from put options.
The “Other” item in other financial result essentially contains income of€4,985 from the revaluation of the options for the acquisition of the remaining shares in Verstraete in mould labels N.V. in 2017.
H. NOTESTOTHE COMBINED STATEMENTOF CASH FLOWS
The cash flow statement is prepared using the indirect method.
The cash flows from operating, investing, and financing activities are presented separately in the cash flow statement.
Cash and cash equivalents reported in the cash flow statement are comprised of cash balances and investments with a remaining duration of three months or less at the date of acquisition and therefore correspond to cash and cash equivalents.
ACQUISITIONOF SUBSIDIARIES LESS CASHAND CASH EQUIVALENTS
This item includes contingent purchase price payments in connection with the acquisition of the Spear Group in fiscal year 2013 in the amount of (€2,480)(1-6/2016: (€35,040) thousand). The prior year value additionally includes a purchase price payment adjustment for the acquisition of the Pemara Group in the amount of (€871) thousand and the balances of cash and cash equivalents acquired from the initial consolidation of the Pemara Labels Group and Afripack Consumer Flexibles (Labels) Pty. Ltd. in the amount of€3,210. The purchase prices for the acquisitions have already been paid at the time of acquisition in November and December 2015.
DIVIDENDSPAIDTOCOMPANYOWNERS
The following table shows the reconciliation of Dividends recognized in the Combined Statement of Changes in Equity and the Dividend payments recognized in the Combined Statement of cash flows:
| | | | | | | | |
| (in€ thousand) | | 1-6/2017 | | | 1-6/2016 | |
Dividends declared to shareholders | | | (8,383 | ) | | | 0 | |
| | | | |
Recognition in combined invested equity | | | (8,383 | ) | | | 0 | |
Change of liabilities from Profit distribution agreement | | | (16,710 | ) | | | (23,227 | ) |
Dividends declared but not yet paid | | | 5,338 | | | | 0 | |
| | | | |
Recognition in combined cash flow statement | | | (19,755 | ) | | | (23,227 | ) |
| | | | |
DIVIDENDSPAIDTONON-CONTROLLINGINTERESTS
In June 2016 a dividend tonon-controlling interests of (€5,446) has been declared but not yet paid.
OTHER NOTESONTHE COMBINED CASH FLOW STATEMENT
The “Othernon-cash transactions” item essentially comprises gains and losses from exchange rate changes.
F-89
I. FINANCIAL INSTRUMENTS
CAPITAL RISK MANAGEMENT
The Division Labels its capital with the objective of ensuring that all Group companies can operate under the going-concern assumption, while concurrently maximizing the income from its equity investments by optimizing the debt-to-equity ratio. The Group’s overall strategy remains unchanged compared to 2016.
The net debt at the end of the reported periods is presented below:
| | | | | | | | |
| (in€ thousand) | | 06/30/2017 | | | 12/31/2016 | |
Non-current financial assets | | | (987 | ) | | | (1,096 | ) |
Current financial assets | | | (51,728 | ) | | | (67,734 | ) |
Other current, interest-bearing financial liabilities | | | 163,883 | | | | 174,755 | |
Interest-bearing non-current financial liabilities | | | 129,115 | | | | 138,494 | |
Interest-bearing current financial liabilities | | | 5,923 | | | | 5,702 | |
| |
Debt | | | 246,206 | | | | 250,121 | |
| | |
Cash and cash equivalents | | | (23,890 | ) | | | (23,625 | ) |
| | |
Total | | | 222,316 | | | | 226,497 | |
* Net debt definition excludes intercompany dividend payables and receivables and excluding intercompany accrued interest.
ADDITIONAL DISCLOSURESON FINANCIAL INSTRUMENTS
Carrying amounts, recognition methods, and fair values by valuation category.
| | | | | | | | | | | | | | | | | | | | | | | | | | | | |
| (in€ thousand) | | Carrying amount 06/30/2017 | | | Fair Value Hedge | | | Cashflow Hedge | | | Available
for Sale | | | Loans and
Receivables | | | Cash and
cash
equivalents | | | Other receivables | |
Assets | | | | | | | | | | | | | | | | | | | | | | | | | | | | |
| | | | | | | |
Other non-current and financial assets | | | 14,168 | | | | 0 | | | | 0 | | | | 1 | | | | 987 | | | | 0 | | | | 13,180 | |
Trade accounts receivables | | | 114,074 | | | | 0 | | | | 0 | | | | 0 | | | | 114,074 | | | | 0 | | | | 0 | |
Other receivables | | | 65,133 | | | | 1 | | | | 472 | | | | 0 | | | | 53,372 | | | | 0 | | | | 11,289 | |
Fixed interest rate instruments | | | 23,890 | | | | 0 | | | | 0 | | | | 0 | | | | 0 | | | | 23,890 | | | | 0 | |
| |
Total assets | | | 217,265 | | | | 1 | | | | 472 | | | | 1 | | | | 168,433 | | | | 23,890 | | | | 24,469 | |
| | | | | | | |
| | | Total per
Level | | | Fair Value
Hedge | | | Cashflow
Hedge | | | Available
for Sale | | | | | | | | | | |
Fair Value Hierarchy IFRS 13 | | | | | | | | | | | | | | | | | | | | | | | | | | | | |
| | | | | | | |
Level 1 | | | 0 | | | | 0 | | | | 0 | | | | 0 | | | | | | | | | | | | | |
Level 2 | | | 472 | | | | 1 | | | | 472 | | | | 0 | | | | | | | | | | | | | |
Level 3 | | | 0 | | | | 0 | | | | 0 | | | | 0 | | | | | | | | | | | | | |
| | | | | | | | | | | | | |
Total | | | 472 | | | | 1 | | | | 472 | | | | 0 | | | | | | | | | | | | | |
| |
F-90
| | | | | | | | | | | | | | | | | | | | | | | | |
| (in€ thousand) | | Carrying amount 06/30/2017 | | | Fair Value Hedge | | | Cashflow Hedge | | | at FV through
P&L | | | other financial
liabilities1 | | | accrued and
other liabilities | |
Liabilities | | | | | | | | | | | | | | | | | | | | | | | | |
| | | | | | |
Non-current liabilities | | | 198,942 | | | | 0 | | | | 68 | | | | 8,273 | | | | 189,148 | | | | 1,453 | |
Current liabilities | | | 196,354 | | | | 1 | | | | 675 | | | | 0 | | | | 176,577 | | | | 19,101 | |
Trade accounts payables | | | 93,972 | | | | 0 | | | | 0 | | | | 0 | | | | 93,972 | | | | 0 | |
| | | | | | |
Total liabilities | | | 489,268 | | | | 1 | | | | 743 | | | | 8,273 | | | | 459,697 | | | | 20,554 | |
| | | | | | |
| | | Total per
Level | | | Fair Value
Hedge | | | Cashflow
Hedge | | | at FV through
P&L | | | | | | | |
Fair Value Hierarchy IFRS 13 | | | | | | | | | | | | | | | | | | | | | | | | |
| | | | | | |
Level 1 | | | 0 | | | | 0 | | | | 0 | | | | 0 | | | | | | | | | |
Level 2 | | | 744 | | | | 1 | | | | 743 | | | | 0 | | | | | | | | | |
Level 3 | | | 8,273 | | | | 0 | | | | 0 | | | | 8,273 | | | | | | | | | |
Total liabilities | | | 9,017 | | | | 1 | | | | 743 | | | | 8,273 | | | | | | | | | |
| 1 | The fair value of other financial liabilities is discussed below. |
| | | | | | | | | | | | | | | | | | | | | | | | | | | | |
| (in€ thousand) | | Carrying amount 12/31/2016 | | | Fair Value Hedge | | | Cashflow Hedge | | | Available
for Sale | | | Loans and
Receivables | | | Cash and
cash
equivalents | | | Other receivables | |
Assets | | | | | | | | | | | | | | | | | | | | | | | | | | | | |
| | | | | | | |
Other non-current and financial assets | | | 5,402 | | | | 0 | | | | 0 | | | | 1 | | | | 1,108 | | | | 0 | | | | 4,292 | |
Trade accounts receivables | | | 98,363 | | | | 0 | | | | 0 | | | | 0 | | | | 98,368 | | | | 0 | | | | 0 | |
Other receivables | | | 81,971 | | | | 0 | | | | 279 | | | | 0 | | | | 73,946 | | | | 0 | | | | 7,747 | |
Fixed interest rate instruments | | | 23,625 | | | | 0 | | | | 0 | | | | 0 | | | | 0 | | | | 23,625 | | | | 0 | |
Total assets | | | 209,365 | | | | 0 | | | | 279 | | | | 1 | | | | 173,422 | | | | 23,625 | | | | 12,039 | |
| | | | | | | |
| | | Total per
Level | | | Fair Value
Hedge | | | Cashflow
Hedge | | | Available
for Sale | | | | | | | | | | |
Fair Value Hierarchy IFRS 13 | | | | | | | | | | | | | | | | | | | | | | | | | | | | |
| | | | | | | |
Level 1 | | | 0 | | | | 0 | | | | 0 | | | | 0 | | | | | | | | | | | | | |
Level 2 | | | 279 | | | | 0 | | | | 279 | | | | 0 | | | | | | | | | | | | | |
Level 3 | | | 0 | | | | 0 | | | | 0 | | | | 0 | | | | | | | | | | | | | |
Total | | | 279 | | | | 0 | | | | 279 | | | | 0 | | | | | | | | | | | | | |
F-91
| | | | | | | | | | | | | | | | | | | | | | | | |
(in€ thousand) | | Carrying amount 12/31/2016 | | | Fair Value Hedge | | | Cashflow Hedge | | | at FV through
P&L | | | other financial
liabilities | | | accrued and
other liabilities | |
Liabilities | | | | | | | | | | | | | | | | | | | | | | | | |
| | | | | | |
Non-current liabilities | | | 212,655 | | | | 0 | | | | 650 | | | | 8,318 | | | | 201,539 | | | | 2,147 | |
Current liabilities | | | 221,349 | | | | 10 | | | | 1,098 | | | | 2,385 | | | | 198,508 | | | | 19,348 | |
Trade accounts payables | | | 80,497 | | | | 0 | | | | 0 | | | | 0 | | | | 80,497 | | | | 0 | |
| | | | | | | | | | | | | | | | | | | | | | | | | |
Total liabilities | | | 514,501 | | | | 10 | | | | 1,749 | | | | 10,703 | | | | 480,543 | | | | 21,495 | |
| | | | | | |
| | | Total per
Level | | | Fair Value
Hedge | | | Cashflow
Hedge | | | at FV through
P&L | | | | | | | |
Fair Value Hierarchy IFRS 13 | | | | | | | | | | | | | | | | | | | | | | | | |
| | | | | | |
Level 1 | | | 0 | | | | 0 | | | | 0 | | | | 0 | | | | | | | | | |
Level 2 | | | 1,759 | | | | 10 | | | | 1,749 | | | | 0 | | | | | | | | | |
Level 3 | | | 10,703 | | | | 0 | | | | 0 | | | | 10,703 | | | | | | | | | |
| | | | | | | | | | | | | | | | | | | | | | | | | |
Total liabilities | | | 12,462 | | | | 10 | | | | 1,749 | | | | 10,703 | | | | | | | | | |
| | | | | | | | | | | | | | | | | | | | | | | | | |
1The fair value of other financial liabilities is discussed below.
Other receivables and liabilities are not financial instruments under IFRS 7. They were included in the tables to create comparability with the balance sheet.
Other available-for-sale equity instruments for which there is no listed market price in an active market and whose fair value cannot be reliably determined are initially recognized at cost plus transaction costs and are reported at the reporting date, net of any impairment losses.
For financial assets, other financial liabilities, trade receivables, other receivables, cash and cash equivalents, securities, and trade payables, as well as accrued and other liabilities, the carrying amounts are reasonable approximations of their fair values. All Intercompany loan receivables and loan payables are interest bearing based on the variable interest rates reflecting the market conditions.
Fair value hedges, cash flow hedges, and financial instruments held for trading are classified as Level 2 because the fair values of these financial instruments are based on market-derived inputs.
NOTESONTHE “LOANSAND RECEIVABLES/LIABILITIES” MEASUREMENT CATEGORY
The fair values of other non-current assets and financial assets and non-current liabilities represent the present values of the payments associated with the assets or liabilities in consideration of the current interest rate parameters that reflect market and partner-related changes in conditions and expectations.
The measurement categories of the fair value hierarchy are as follows:
| Level 1: | The fair values are determined based on publicly quoted market prices. |
| Level 2: | The fair values are estimated based on the results of a valuation technique that uses the data from the market and is based as little as possible on company-specific data. |
| Level 3: | Fair value measurements are those that arise from models, using inputs that are not based on observable market data (unobservable inputs, assumptions) to measure assets or liabilities. |
F-92
The fair values for Level 2 measurements for simple over-the-counter derivative financial instruments, available-for-sale financial assets, and held-for-trading liabilities are determined based on the prices quoted by brokers. These quotations are tested for plausibility by discounting the expected future cash flows with relevant market interest rates for similar instruments at the measurement date. The fair value reflects the credit risk of the instrument and includes adjustments to adequately consider the credit risk of the Group company and the counterparty where appropriate.
The Division Labels recognizes transfers between hierarchy levels at the end of the reporting period in which a reclassification has occurred. There were no reclassifications between the different hierarchy levels in the first six months of fiscal year 2017.
LEVEL 3 FAIR VALUES
The Division Labels has set up a control system related to the measurement of fair value. In accordance with the control system, an evaluation team has been nominated, which reports directly to the Chief Financial Officer, and which has the overall responsibility for all significant fair value measurements, including the Level 3 reviews.
The Division Labels regularly reviews the material unobservable inputs and other measurement adjustments. If third-party data such as broker quotes is used to measure fair value, the evidence obtained is evaluated, documented, and assessed as to whether these measurements are consistent with the IFRS requirements. This assessment includes the proper classification to the individual hierarchy levels.
Contingent consideration
Financial instruments at fair value through profit or loss include contingent purchase prices. Contingent purchase prices result from the acquisition of the Pemara Group. Details on the measurement of Level 3 fair values in the first six months of fiscal year 2017 are presented in the table below.
| | | | |
| (in€ thousand) | | Contingent
Consideration
(purchase price) | |
Balance at 12/31/2016 | | | 10,703 | |
| |
Addition through sale / acquisition of companies | | | - | |
Disposal through payment | | | (2,480) | |
| |
Total gains and losses for the period included in other comprehensive income: | | | | |
- Fair value adjustment | | | - | |
| |
Total gains and losses for the period included in profit or loss: | | | | |
- Fair value adjustment | | | - | |
- Net finance income and expense | | | 101 | |
- Currency translation differences | | | (51) | |
| |
Balance at 06/30/2017 | | | 8,273 | |
F-93
The fair values correspond to the expected payments discounted to present value using a risk-adjusted interest rate. The inputs used and the sensitivities of the individual contingent purchase prices are as follows:
| | | | |
(in€ thousand) | | contingent consideration
Pemara Group | |
Base currency | | | AUD | |
| |
Annual sales growth | | | | |
Unobservable input parameter used | | | 5.8% | |
Effect from +0.5% points adjustment | | | (43) | |
Effect from-0.5% points adjustment | | | 43 | |
| |
Projected EBITDA margin | | | | |
Unobservable input parameter used | | | 15.3% | |
Effect from +0.5% points adjustment | | | (299) | |
Effect from-0.5% points adjustment | | | 299 | |
| |
Risk adjusted interest rate | | | | |
Unobservable input parameter used | | | 2.4% | |
Effect from +1.0% points adjustment | | | 159 | |
Effect from -1.0% points adjustment | | | (164) | |
The expected payment by the Pemara Group was calculated based on the forecast EBITDA and net debt. Management is responsible for the exercise date, which was set between 2019 and 2020.
If one or more of the significant unobservable inputs were to be replaced by reasonable possible alternatives, this would have the effects presented on the fair value of the contingent consideration. These effects were calculated by replacing the underlying assumptions with alternative estimates of unobservable inputs that might reasonably have been applied by market participants when measuring the contingent consideration. It is assumed that interactions between the individual unobservable inputs have no significant impact on the range of reasonably possible alternative assumptions.
FINANCIAL RISK MANAGEMENT - CREDIT RISKFROM TRADEAND OTHER RECEIVABLES
The fundamental objectives and corporate guidelines of the Division Label’s financial risk management are consistent with those that are cited in the combined financial statements as of December 31, 2016.
| J. | CONTINGENT LIABILITIESAND OTHER RISKS |
LITIGATION
The Division Labels is not aware of any significant litigation at the balance sheet date of 06/30/2017 that has a more than negligible probability of occurrence.
ENVIRONMENTAL DAMAGES
The Division Labels is not aware of any significant environmental contamination at the balance sheet date of 06/30/2017 that has a more than negligible probability of occurrence.
OTHER
Division Labels has no warranties and guarantees given as well as no discounted bank drafts at the reporting date.
F-94
Division Labels as part of Constantia Flexibles has been party to the SFA loan agreement as an additional guarantor since July 1, 2015.
| K. | RELATED PARTY DISCLOSURES |
The ultimate controlling company of Constantia Division Labels in Austria is Constantia Flexibles Holding GmbH which is based in Vienna, Austria. The consolidated financial statements are published at the Commercial Court in Vienna, Austria. The ultimate controlling company of Constantia Flexibles Holding GmbH is Wendel S.A., which is based in Paris, France. The consolidated financial statements are published at the Commercial Court in Paris, France.
All business transactions between the companies within the Group and related entities and individuals have been conducted on an arm’s length basis.
No other material transactions of any kind, in particular contracts for the sale of significant assets, were entered into.
Division Labels management remunerations:
| | | | | | | | |
(in€ million) | | 06/30/2017 | | | 06/30/2016 | |
Management Remuneration | | | 663 | | | | 840 | |
| | | | |
| | | 663 | | | | 840 | |
Management remuneration represents the annual salaries (short term benefits).
For the Constantia Flexibles’ CEO, Constantia Flexibles’ CFO, Mergers and acquisition functions and Supervisory board the remuneration expenses were not recorded in the Income statement of the combined financial statements of the Division Labels in the amounts of€819 thousand for the first half year 2016 and in amount of€908 thousand for the first half year 2017. These remuneration expenses represent the short term employee benefits only.
The Supervisory Board of the Group is located at Constantia Flexibles Holding GmbH.
In the first half year earn-outs were paid to Randy Spear€1,240 thousand(1-6/2016:€12,751 thousand), to Rick Spear€1,240 thousand(1-6/2016:€12,751 thousand) and to Mike Henry€ 0 thousand(1-6/2016:€9,538 thousand).
F-95
Supply and service relationships with the Constantia Flexibles holding companies during the first half year 2017:
| | | | | | | | | | | | | | | | |
| (in€ thousand) | | received | | | completed | | | Receivables | | | Payables | |
Afripack Holdings Pty. Ltd. | | | 0 | | | | (84 | ) | | | 9 | | | | (1 | ) |
Aluprint S. de R.L. de C.V. | | | 0 | | | | (252 | ) | | | 142 | | | | (388 | ) |
Constantia Ebert GmbH | | | 3 | | | | 0 | | | | 0 | | | | 0 | |
Constantia Flexibles America Co. | | | 0 | | | | (29 | ) | | | 3,453 | | | | (116 | ) |
Constantia Flexibles Bucuresti S.R.L. | | | 0 | | | | 0 | | | | 0 | | | | (3 | ) |
Constantia Flexibles DMCC | | | 0 | | | | 0 | | | | 10 | | | | 0 | |
Constantia Flexibles Germany GmbH | | | 123 | | | | 0 | | | | 760 | | | | 1,650 | |
Constantia Flexibles GmbH | | | 0 | | | | 0 | | | | 0 | | | | (5 | ) |
Constantia Flexibles Group GmbH | | | 0 | | | | (7,547 | ) | | | 25,408 | | | | (308,969 | ) |
Constantia Flexibles Holding GmbH | | | 0 | | | | 0 | | | | 9 | | | | (118 | ) |
Constantia Flexibles International GmbH | | | 788 | | | | (3,108 | ) | | | 59 | | | | (3,280 | ) |
Constantia Flexibles Sales LLC | | | 0 | | | | 0 | | | | 433 | | | | (452 | ) |
Constantia Shared Services Austria Gmb | | | 0 | | | | (459 | ) | | | 22,317 | | | | (202 | ) |
Constantia Sittingbourne Ltd. | | | 0 | | | | 0 | | | | 3 | | | | 0 | |
Constantia St. Petersburg OOO | | | 0 | | | | (36 | ) | | | 2,317 | | | | (2,432 | ) |
Constantia Teich GmbH | | | 1 | | | | (220 | ) | | | 2 | | | | (75 | ) |
Constantia Tobepal S.L. | | | 0 | | | | (5,427 | ) | | | 0 | | | | (2,291 | ) |
Afripack Consumer Flexibles | | | 0 | | | | (47 | ) | | | 867 | | | | (13 | ) |
Corona Packaging ApS | | | 0 | | | | 0 | | | | 0 | | | | (56 | ) |
Supply and service relationships with the Group holding companies during the first half year 2016:
| | | | | | | | | | | | | | | | |
| (in€ thousand) | | received | | | completed | | | Receivables | | | Payables | |
Constantia Shared Services Austria Gmb | | | 0 | | | | (211 | ) | | | 25,802 | | | | (10 | ) |
Afripack Consumer Flexibles | | | 19 | | | | (10 | ) | | | 21 | | | | (42 | ) |
Afripack Holdings Pty. Ltd. | | | 0 | | | | (40 | ) | | | 0 | | | | 0 | |
Aluprint S. de R.L. de C.V. | | | 1 | | | | (283 | ) | | | 2 | | | | (5,965 | ) |
Constantia Flexibles Germany GmbH | | | 159 | | | | 0 | | | | 584 | | | | (10 | ) |
Constantia Flexibles International GmbH | | | 297 | | | | (1,837 | ) | | | 18 | | | | (3,567 | ) |
Aluprint Plegadizos S. de R.L. de C.V. | | | 0 | | | | (10 | ) | | | 0 | | | | 0 | |
Constantia Shared Services Germany Gr | | | 0 | | | | (63 | ) | | | 0 | | | | (75 | ) |
Constantia Ebert GmbH | | | 3 | | | | 0 | | | | 0 | | | | 0 | |
Constantia St. Petersburg OOO | | | 1,409 | | | | (34 | ) | | | 1,035 | | | | (17 | ) |
Constantia Flexibles Group GmbH | | | 1 | | | | (5,953 | ) | | | 23,300 | | | | (267,836 | ) |
Constantia Flexibles Bucuresti S.R.L. | | | 0 | | | | (3 | ) | | | 0 | | | | 0 | |
Constantia Flexibles DMCC | | | 0 | | | | 0 | | | | 10 | | | | 0 | |
Constantia Flexibles Sales LLC | | | 729 | | | | 0 | | | | 311 | | | | 0 | |
Constantia Hueck Folien GmbH & Co KG | | | 0 | | | | (80 | ) | | | 0 | | | | (29 | ) |
Constantia Flexibles America Co. | | | 0 | | | | (0 | ) | | | 1,263 | | | | (174 | ) |
Constantia Sittingbourne Ltd. | | | 2 | | | | 0 | | | | 5 | | | | 0 | |
Constantia Teich GmbH | | | 1 | | | | (266 | ) | | | 4 | | | | (90 | ) |
Constantia Tobepal S.L. | | | 0 | | | | (5,406 | ) | | | 0 | | | | (1,238 | ) |
The transactions mainly include financing (interest & loans), dividends, management fees and product delivery.
For additional information regarding business dealings with related parties, please see the combined financial statements as of December 31, 2016.
Maturity terms at the reporting date for intercompany loans issued by Constantia Flexibles Group GmbH are up to 5 years (June 30, 2016: 6 years).
F-96
All outstanding balances with related parties are settled in cash. There is no collateral.
All hedging instruments at the Division Labels are contracted with Constantia Flexibles Group GmbH which serves as the group trader with hedging derivatives. Further description is included in the Chapter I. Financial instruments.
At the reporting date following entities of the Division Labels participated in cash pooling agreements:
| | - | Haendler & Natermann GmbH |
Each day the balance of the respective master accounts are cleared to zero. Positive balances are transferred to the cash pool master account and negative balances are funded with monies transferred from the cash pool master account. Interests are charged at arm’s length and calculated according to the external interests charged plus a margin which depends on the participants’ internal rating calculated once a year. The Cash Pool Agreement is concluded for an indefinite term. However, the Pool Master may exclude a Participant with immediate effect at any time for good cause.
F-97
| L. | GROUP ENTITIES (DIVISION LABELS ENTITIES)ASOF JUNE 30, 2017AND DECEMBER 31, 2016 |
| | | | | | | | | | | | |
| | | | | | Percentage interest held | |
| Name | | Registered office | | | Directly* | | | Indirectly** | |
Fully combined | | | | | | | | | | | | |
| | | |
Afripack Consumer Flexibles (Labels) Pty. Ltd. | | | Mobeni, ZA | | | | 74.00 | | | | 70.30 | |
CF Australia Holding Pty. Ltd. | | | Sydney, AU | | | | 100.00 | | | | 100.00 | |
CF Australia Pty. Ltd. | | | Sydney, AU | | | | 100.00 | | | | 100.00 | |
Cunamara Investments Pty. Ltd. | | | Victoria, AU | | | | 100.00 | | | | 100.00 | |
GPC III BV | | | Amsterdam, NL | | | | 100.00 | | | | 100.00 | |
GPC III Packaging Holdings Mexico S de R.L. de C.V. | | | Monterrey, MX | | | | 100.00 | | | | 100.00 | |
Grafo Regia S. de R. L. de C.V. | | | Monterrey, MX | | | | 100.00 | | | | 100.00 | |
Pemara Asia Holding Pte Ltd. | | | Singapore, SG | | | | 100.00 | | | | 100.00 | |
Pemara Pty. Ltd. | | | Victoria, AU | | | | 100.00 | | | | 100.00 | |
PT. Pemara Labels Indonesia | | | Jababeka Cikarang-Bekasi, ID | | | | 100.00 | | | | 100.00 | |
Pemara Labels (Malaysia) SDN. BHD. | | | Selangor, MAL | | | | 100.00 | | | | 100.00 | |
Pemara Labels (Philippines) Inc. | | | Laguna, PH | | | | 100.00 | | | | 100.00 | |
Pemara Labels (Vietnam) Ltd. | | | Binh Duong Province, VN | | | | 100.00 | | | | 100.00 | |
Spearsystem Packaging (Africa) (Pty) Ltd. | | | Boksburg, SA | | | | 74.90 | | | | 74.90 | |
Spearsystem Packaging (Asia) PTE Ltd. | | | Singapur, SG | | | | 100.00 | | | | 100.00 | |
Spear Europe Ltd. | | | Cwmbran, GB | | | | 100.00 | | | | 100.00 | |
SGH (No. 2) Ltd. | | | Cwmbran, GB | | | | 100.00 | | | | 100.00 | |
Spear Group Holdings Ltd. | | | Cwmbran, GB | | | | 100.00 | | | | 100.00 | |
Spear Ltd. | | | Cwmbran, GB | | | | 100.00 | | | | 100.00 | |
Spear USA Inc. | | | Mason, USA | | | | 100.00 | | | | 100.00 | |
Gardoc Inc. | | | Milford, USA | | | | 100.00 | | | | 100.00 | |
Precision, Printing and Packaging Inc. | | | Clarksville, USA | | | | 100.00 | | | | 100.00 | |
Haendler et Natermann Benelux SPRL/BVBA | | | Waterloo, B | | | | 100.00 | | | | 100.00 | |
H & N (Suzhou) Packaging Materials Co. Ltd. | | | Taicang, RC | | | | 100.00 | | | | 100.00 | |
Constantia CM Labels SDN BHD | | | Kuala Lumpur, MAL | | | | 100.00 | | | | 100.00 | |
Etipack SARL | | | Vittel, F | | | | 100.00 | | | | 100.00 | |
Exprim SARL | | | Ablis, F | | | | 100.00 | | | | 100.00 | |
Haendler & Natermann GmbH | | | Hann. Münden, D | | | | 100.00 | | | | 100.00 | |
Haendler & Natermann Iberica S.L.U. | | | Sevilla, E | | | | 100.00 | | | | 100.00 | |
SIM’EDIT Imprimeurs SAS | | | Couëron, F | | | | 99.99 | | | | 99.99 | |
Constantia Labels GmbH | | | Heiligenstadt, D | | | | 100.00 | | | | 100.00 | |
Novis Casa de Editura si Tipografia S.R.L. | | | Cluj- Napoca, RO | | | | 100.00 | | | | 100.00 | |
Printer Labels Inc. | | | Ontario, USA | | | | 100.00 | �� | | | 100.00 | |
Sim’EDIT SAS | | | Ablis, F | | | | 100.00 | | | | 100.00 | |
SIM’Label Inc. | | | Cowansville, CAN | | | | 100.00 | | | | 100.00 | |
Verstraete in mould labels NV | | | Maldegem, B | | | | 51.00 | | | | 51.00 | |
Significant events after the end of the reporting period
Constantia Flexibles signed an agreement to sell its Labels business to Multi-Color Corporation, for an enterprise value of approximately€1.15 billion (1.3 billion USD). Subject to customary regulatory approvals, the sale
F-98
transaction is expected to be finalized in the fourth quarter of 2017. The majority of the transaction is payable in cash, while Constantia Flexibles will hold a 16.6% equity holding in Multi-Color, thereby becoming its largest shareholder.
Vienna, September 7, 2017
| | |
Chief Executive Officer | | Chief Financial Officer |
Alexander Baumgartner | | Stephan Kühne |
F-99