UNITED STATES
SECURITIES AND EXCHANGE COMMISSION
Washington, D.C. 20549
FORM N-CSR
CERTIFIED SHAREHOLDER REPORT OF
REGISTERED MANAGEMENT INVESTMENT COMPANIES
Investment Company Act file number 811-05262
MFS SERIES TRUST VIII
(Exact name of registrant as specified in charter)
111 Huntington Avenue, Boston, Massachusetts 02199
(Address of principal executive offices) (Zip code)
Susan S. Newton
Massachusetts Financial Services Company
111 Huntington Avenue
Boston, Massachusetts 02199
(Name and address of agents for service)
Registrant’s telephone number, including area code: (617) 954-5000
Date of fiscal year end: October 31
Date of reporting period: April 30, 2014
| ITEM 1. | REPORTS TO STOCKHOLDERS. |
SEMIANNUAL REPORT
April 30, 2014

MFS® GLOBAL GROWTH FUND

WGF-SEM
MFS® GLOBAL GROWTH FUND
CONTENTS
The report is prepared for the general information of shareholders. It is authorized for distribution to prospective investors only when preceded or accompanied by a current prospectus.
NOT FDIC INSURED Ÿ MAY LOSE VALUE Ÿ NO BANK GUARANTEE

LETTER FROM THE CHAIRMAN AND CEO
Dear Shareholders:
After gaining momentum late last year, the U.S. economy slipped this winter, as severe weather curtailed activity. More recently, however, labor market data, consumer
confidence, retail sales and industrial output have indicated that the U.S. economy could be regaining traction.
Europe emerged from its recession midway through 2013. However, its pace of growth has been slow, high unemployment persists and the risk of deflation exists. Asia remains vulnerable. China’s economic growth has slowed, and Japan’s early progress toward an economic turnaround continues to face obstacles. Emerging markets have also displayed much higher volatility, affected by the early transition from aggressive central bank monetary easing.
With so much uncertainty, global financial markets began 2014 with much greater volatility than last year’s broad-based rally. For equity investors, attention to company fundamentals has taken on more importance. Bond investors have been attuned to heightened risks from possible interest rate increases.
As always at MFS®, active risk management is an integral part of how we manage your investments. We use a collaborative process, sharing insights across asset classes, regions and economic sectors. Our global team of investment professionals uses a multidisciplined, long-term, diversified investment approach.
We understand that these are challenging economic times. We believe that we can serve you best by applying proven principles, such as asset allocation and diversification, over the long term. We are confident that this approach can serve you well as you work with your financial advisors to reach your goals in the years ahead.
Respectfully,

Robert J. Manning
Chairman and Chief Executive Officer
MFS Investment Management
June 13, 2014
The opinions expressed in this letter are subject to change, may not be relied upon for investment advice, and no forecasts can be guaranteed.
1
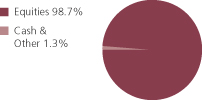
PORTFOLIO COMPOSITION
Portfolio structure
| | | | |
| Top ten holdings | | | | |
| LVMH Moet Hennessy Louis Vuitton S.A. | | | 2.6% | |
| Accenture PLC, “A” | | | 2.4% | |
| Schlumberger Ltd. | | | 2.3% | |
| Groupe Danone | | | 2.3% | |
| Compass Group PLC | | | 2.2% | |
| Pernod Ricard S.A. | | | 2.2% | |
| Taiwan Semiconductor Manufacturing Co. Ltd., ADR | | | 2.0% | |
| Nestle S.A. | | | 2.0% | |
| Colgate-Palmolive Co. | | | 1.9% | |
| Danaher Corp. | | | 1.7% | |
| |
| Equity sectors | | | | |
| Consumer Staples | | | 17.2% | |
| Retailing | | | 11.5% | |
| Industrial Goods & Services | | | 11.4% | |
| Technology | | | 10.9% | |
| Financial Services | | | 10.4% | |
| Health Care | | | 9.7% | |
| Special Products & Services | | | 8.2% | |
| Leisure | | | 7.5% | |
| Basic Materials | | | 5.3% | |
| Energy | | | 4.3% | |
| Autos & Housing | | | 1.2% | |
| Transportation | | | 1.1% | |
| | | | |
| Issuer country weightings (x) | | | | |
| United States | | | 52.2% | |
| United Kingdom | | | 12.7% | |
| France | | | 9.6% | |
| Switzerland | | | 6.0% | |
| Germany | | | 3.9% | |
| Brazil | | | 3.4% | |
| Taiwan | | | 2.1% | |
| Denmark | | | 1.6% | |
| Canada | | | 1.3% | |
| Other Countries | | | 7.2% | |
|
| Currency exposure weightings (y) | |
| United States Dollar | | | 53.3% | |
| Euro | | | 15.7% | |
| British Pound Sterling | | | 12.7% | |
| Swiss Franc | | | 6.0% | |
| Brazilian Real | | | 3.4% | |
| Taiwan Dollar | | | 2.1% | |
| Danish Krone | | | 1.6% | |
| Canadian Dollar | | | 1.3% | |
| South Korean Won | | | 1.2% | |
| Other Currencies | | | 2.7% | |
2
Portfolio Composition – continued
| (x) | Represents the portfolio’s exposure to issuer countries as a percentage of a portfolio’s net assets. For purposes of this presentation, United States includes Cash & Other. |
| (y) | Represents the portfolio’s exposure to a particular currency as a percentage of a portfolio’s net assets. For purposes of this presentation, United States Dollar includes Cash & Other. |
Percentages are based on net assets as of 4/30/14.
The portfolio is actively managed and current holdings may be different.
3
EXPENSE TABLE
Fund expenses borne by the shareholders during the period, November 1, 2013 through April 30, 2014
As a shareholder of the fund, you incur two types of costs: (1) transaction costs, including sales charges (loads) on certain purchase or redemption payments, and (2) ongoing costs, including management fees; distribution and service (12b-1) fees; and other fund expenses. This example is intended to help you understand your ongoing costs (in dollars) of investing in the fund and to compare these costs with the ongoing costs of investing in other mutual funds.
The example is based on an investment of $1,000 invested at the beginning of the period and held for the entire period November 1, 2013 through April 30, 2014.
Actual Expenses
The first line for each share class in the following table provides information about actual account values and actual expenses. You may use the information in this line, together with the amount you invested, to estimate the expenses that you paid over the period. Simply divide your account value by $1,000 (for example, an $8,600 account value divided by $1,000 = 8.6), then multiply the result by the number in the first line under the heading entitled “Expenses Paid During Period” to estimate the expenses you paid on your account during this period.
Hypothetical Example for Comparison Purposes
The second line for each share class in the following table provides information about hypothetical account values and hypothetical expenses based on the fund’s actual expense ratio and an assumed rate of return of 5% per year before expenses, which is not the fund’s actual return. The hypothetical account values and expenses may not be used to estimate the actual ending account balance or expenses you paid for the period. You may use this information to compare the ongoing costs of investing in the fund and other funds. To do so, compare this 5% hypothetical example with the 5% hypothetical examples that appear in the shareholder reports of the other funds.
Please note that the expenses shown in the table are meant to highlight your ongoing costs only and do not reflect any transactional costs, such as sales charges (loads). Therefore, the second line for each share class in the table is useful in comparing ongoing costs only, and will not help you determine the relative total costs of owning different funds. In addition, if these transactional costs were included, your costs would have been higher.
4
Expense Table – continued
| | | | | | | | | | | | | | | | | | |
Share
Class | | | | Annualized Expense Ratio | | | Beginning Account Value 11/01/13 | | | Ending Account Value 4/30/14 | | | Expenses Paid During Period (p) 11/01/13-4/30/14 | |
| A | | Actual | | | 1.45% | | | | $1,000.00 | | | | $1,047.54 | | | | $7.36 | |
| | Hypothetical (h) | | | 1.45% | | | | $1,000.00 | | | | $1,017.60 | | | | $7.25 | |
| B | | Actual | | | 2.20% | | | | $1,000.00 | | | | $1,043.73 | | | | $11.15 | |
| | Hypothetical (h) | | | 2.20% | | | | $1,000.00 | | | | $1,013.88 | | | | $10.99 | |
| C | | Actual | | | 2.20% | | | | $1,000.00 | | | | $1,043.51 | | | | $11.15 | |
| | Hypothetical (h) | | | 2.20% | | | | $1,000.00 | | | | $1,013.88 | | | | $10.99 | |
| I | | Actual | | | 1.20% | | | | $1,000.00 | | | | $1,048.70 | | | | $6.10 | |
| | Hypothetical (h) | | | 1.20% | | | | $1,000.00 | | | | $1,018.84 | | | | $6.01 | |
| R1 | | Actual | | | 2.20% | | | | $1,000.00 | | | | $1,043.58 | | | | $11.15 | |
| | Hypothetical (h) | | | 2.20% | | | | $1,000.00 | | | | $1,013.88 | | | | $10.99 | |
| R2 | | Actual | | | 1.70% | | | | $1,000.00 | | | | $1,046.28 | | | | $8.63 | |
| | Hypothetical (h) | | | 1.70% | | | | $1,000.00 | | | | $1,016.36 | | | | $8.50 | |
| R3 | | Actual | | | 1.45% | | | | $1,000.00 | | | | $1,047.46 | | | | $7.36 | |
| | Hypothetical (h) | | | 1.45% | | | | $1,000.00 | | | | $1,017.60 | | | | $7.25 | |
| R4 | | Actual | | | 1.20% | | | | $1,000.00 | | | | $1,048.86 | | | | $6.10 | |
| | Hypothetical (h) | | | 1.20% | | | | $1,000.00 | | | | $1,018.84 | | | | $6.01 | |
| R5 | | Actual | | | 1.14% | | | | $1,000.00 | | | | $1,048.95 | | | | $5.79 | |
| | Hypothetical (h) | | | 1.14% | | | | $1,000.00 | | | | $1,019.14 | | | | $5.71 | |
| (h) | 5% class return per year before expenses. |
| (p) | “Expenses Paid During Period” are equal to each class’s annualized expense ratio, as shown above, multiplied by the average account value over the period, multiplied by 181/365 (to reflect the one-half year period). Expenses paid do not include any applicable sales charges (loads). If these transaction costs had been included, your costs would have been higher. |
Notes to Expense Table
Each class with a Rule 12b-1 service fee is subject to a rebate of a portion of such fee. Such rebates are included in the expense ratios above. For Class A shares, this rebate reduced the expense ratio above by 0.01%. See Note 3 in the Notes to Financial Statements for additional information.
5
PORTFOLIO OF INVESTMENTS
4/30/14 (unaudited)
The Portfolio of Investments is a complete list of all securities owned by your fund. It is categorized by broad-based asset classes.
| | | | | | | | |
| Common Stocks - 98.7% | | | | | | | | |
| Issuer | | Shares/Par | | | Value ($) | |
| | | | | | | | |
| Aerospace - 3.3% | | | | | | | | |
| Precision Castparts Corp. | | | 5,524 | | | $ | 1,398,065 | |
| Rolls-Royce Holdings PLC | | | 142,570 | | | | 2,527,509 | |
| Rolls-Royce Holdings PLC, IPS | | | 19,104,380 | | | | 32,256 | |
| United Technologies Corp. | | | 32,600 | | | | 3,857,558 | |
| | | | | | | | |
| | | | | | | $ | 7,815,388 | |
| Alcoholic Beverages - 4.7% | | | | | | | | |
| Carlsberg Group | | | 19,182 | | | $ | 1,916,417 | |
| Diageo PLC | | | 90,538 | | | | 2,778,310 | |
| Heineken N.V. (l) | | | 17,154 | | | | 1,189,930 | |
| Pernod Ricard S.A. | �� | | 41,936 | | | | 5,033,144 | |
| | | | | | | | |
| | | | | | | $ | 10,917,801 | |
| Apparel Manufacturers - 6.4% | | | | | | | | |
| Burberry Group PLC | | | 60,744 | | | $ | 1,523,019 | |
| Cia. Hering S.A. | | | 33,600 | | | | 355,025 | |
| Compagnie Financiere Richemont S.A. | | | 14,836 | | | | 1,505,346 | |
| Li & Fung Ltd. | | | 1,466,400 | | | | 2,137,432 | |
| LVMH Moet Hennessy Louis Vuitton S.A. | | | 31,439 | | | | 6,182,695 | |
| NIKE, Inc., “B” | | | 19,370 | | | | 1,413,042 | |
| VF Corp. | | | 28,969 | | | | 1,769,716 | |
| | | | | | | | |
| | | | | | | $ | 14,886,275 | |
| Automotive - 0.5% | | | | | | | | |
| Johnson Controls, Inc. | | | 26,690 | | | $ | 1,204,787 | |
| | |
| Broadcasting - 5.5% | | | | | | | | |
| Discovery Communications, Inc., “A” (a) | | | 20,760 | | | $ | 1,575,684 | |
| Publicis Groupe | | | 16,865 | | | | 1,436,616 | |
| Time Warner, Inc. | | | 52,590 | | | | 3,495,131 | |
| Twenty-First Century Fox, Inc. | | | 48,750 | | | | 1,560,975 | |
| Viacom, Inc., “B” | | | 14,200 | | | | 1,206,716 | |
| Walt Disney Co. | | | 44,060 | | | | 3,495,720 | |
| | | | | | | | |
| | | | | | | $ | 12,770,842 | |
| Brokerage & Asset Managers - 3.0% | | | | | | | | |
| BM&F Bovespa S.A. | | | 574,800 | | | $ | 2,938,769 | |
| CME Group, Inc. | | | 15,160 | | | | 1,067,112 | |
| Franklin Resources, Inc. | | | 59,656 | | | | 3,122,992 | |
| | | | | | | | |
| | | | | | | $ | 7,128,873 | |
6
Portfolio of Investments (unaudited) – continued
| | | | | | | | |
| Issuer | | Shares/Par | | | Value ($) | |
| | | | | | | | |
| Common Stocks - continued | | | | | | | | |
| Business Services - 8.2% | | | | | | | | |
| Accenture PLC, “A” | | | 70,890 | | | $ | 5,686,796 | |
| Brenntag AG | | | 11,963 | | | | 2,163,402 | |
| Cognizant Technology Solutions Corp., “A” (a) | | | 37,460 | | | | 1,794,521 | |
| Compass Group PLC | | | 323,630 | | | | 5,147,247 | |
| Experian Group Ltd. | | | 123,397 | | | | 2,366,782 | |
| Intertek Group PLC | | | 42,349 | | | | 2,077,850 | |
| | | | | | | | |
| | | | | | | $ | 19,236,598 | |
| Chemicals - 0.9% | | | | | | | | |
| Monsanto Co. | | | 18,652 | | | $ | 2,064,776 | |
| | |
| Computer Software - 2.1% | | | | | | | | |
| Dassault Systemes S.A. | | | 14,767 | | | $ | 1,815,763 | |
| Oracle Corp. | | | 77,020 | | | | 3,148,578 | |
| | | | | | | | |
| | | | | | | $ | 4,964,341 | |
| Computer Software - Systems - 2.4% | | | | | | | | |
| Apple, Inc. | | | 1,830 | | | $ | 1,079,865 | |
| EMC Corp. | | | 116,860 | | | | 3,014,988 | |
| International Business Machines Corp. | | | 7,724 | | | | 1,517,534 | |
| | | | | | | | |
| | | | | | | $ | 5,612,387 | |
| Construction - 0.7% | | | | | | | | |
| Sherwin-Williams Co. | | | 7,843 | | | $ | 1,567,345 | |
| | |
| Consumer Products - 4.7% | | | | | | | | |
| Colgate-Palmolive Co. | | | 65,089 | | | $ | 4,380,490 | |
| Procter & Gamble Co. | | | 38,440 | | | | 3,173,222 | |
| Reckitt Benckiser Group PLC | | | 43,114 | | | | 3,475,898 | |
| | | | | | | | |
| | | | | | | $ | 11,029,610 | |
| Electrical Equipment - 7.1% | | | | | | | | |
| Amphenol Corp., “A” | | | 15,300 | | | $ | 1,458,855 | |
| Danaher Corp. | | | 52,880 | | | | 3,880,334 | |
| Legrand S.A. | | | 20,494 | | | | 1,322,104 | |
| Mettler-Toledo International, Inc. (a) | | | 10,275 | | | | 2,395,308 | |
| Schneider Electric S.A. | | | 13,549 | | | | 1,269,751 | |
| Sensata Technologies Holding B.V. (a) | | | 83,580 | | | | 3,549,643 | |
| W.W. Grainger, Inc. | | | 10,548 | | | | 2,683,411 | |
| | | | | | | | |
| | | | | | | $ | 16,559,406 | |
| Electronics - 3.6% | | | | | | | | |
| Microchip Technology, Inc. | | | 47,200 | | | $ | 2,243,888 | |
| Samsung Electronics Co. Ltd. | | | 1,140 | | | | 1,485,839 | |
7
Portfolio of Investments (unaudited) – continued
| | | | | | | | |
| Issuer | | Shares/Par | | | Value ($) | |
| | | | | | | | |
| Common Stocks - continued | | | | | | | | |
| Electronics - continued | | | | | | | | |
| Taiwan Semiconductor Manufacturing Co. Ltd., ADR | | | 237,228 | | | $ | 4,768,283 | |
| | | | | | | | |
| | | | | | | $ | 8,498,010 | |
| Energy - Independent - 1.0% | | | | | | | | |
| Occidental Petroleum Corp. | | | 23,990 | | | $ | 2,297,043 | |
| | |
| Energy - Integrated - 0.6% | | | | | | | | |
| BG Group PLC | | | 67,217 | | | $ | 1,359,600 | |
| | |
| Food & Beverages - 7.8% | | | | | | | | |
| Chr. Hansen Holding A.S. | | | 41,719 | | | $ | 1,880,457 | |
| Groupe Danone (l) | | | 71,285 | | | | 5,257,377 | |
| M. Dias Branco S.A. Industria e Comercio de Alimentos | | | 39,200 | | | | 1,694,403 | |
| Mead Johnson Nutrition Co., “A” | | | 39,760 | | | | 3,509,218 | |
| Nestle S.A. | | | 60,617 | | | | 4,680,065 | |
| PepsiCo, Inc. | | | 14,480 | | | | 1,243,687 | |
| | | | | | | | |
| | | | | | | $ | 18,265,207 | |
| Food & Drug Stores - 2.3% | | | | | | | | |
| CVS Caremark Corp. | | | 47,170 | | | $ | 3,430,202 | |
| Jeronimo Martins SGPS S.A. | | | 60,301 | | | | 1,054,517 | |
| Sundrug Co. Ltd. | | | 24,100 | | | | 985,357 | |
| | | | | | | | |
| | | | | | | $ | 5,470,076 | |
| General Merchandise - 1.9% | | | | | | | | |
| Dollarama, Inc. | | | 37,130 | | | $ | 3,088,154 | |
| Lojas Renner S.A. | | | 43,100 | | | | 1,268,017 | |
| | | | | | | | |
| | | | | | | $ | 4,356,171 | |
| Internet - 2.8% | | | | | | | | |
| Google, Inc., “A” (a) | | | 4,821 | | | $ | 2,578,656 | |
| Google, Inc., “C” (a) | | | 4,821 | | | | 2,539,028 | |
| Naver Corp. | | | 1,909 | | | | 1,374,646 | |
| | | | | | | | |
| | | | | | | $ | 6,492,330 | |
| Machinery & Tools - 1.0% | | | | | | | | |
| Schindler Holding AG | | | 14,476 | | | $ | 2,240,235 | |
| | |
| Major Banks - 1.0% | | | | | | | | |
| Standard Chartered PLC | | | 105,470 | | | $ | 2,282,038 | |
| | |
| Medical & Health Technology & Services - 1.2% | | | | | | | | |
| Express Scripts Holding Co. (a) | | | 42,220 | | | $ | 2,811,008 | |
8
Portfolio of Investments (unaudited) – continued
| | | | | | | | |
| Issuer | | Shares/Par | | | Value ($) | |
| | | | | | | | |
| Common Stocks - continued | | | | | | | | |
| Medical Equipment - 4.2% | | | | | | | | |
| Abbott Laboratories | | | 48,980 | | | $ | 1,897,485 | |
| DENTSPLY International, Inc. | | | 46,120 | | | | 2,058,336 | |
| Sonova Holding AG | | | 13,831 | | | | 1,995,838 | |
| Thermo Fisher Scientific, Inc. | | | 22,870 | | | | 2,607,180 | |
| Waters Corp. (a) | | | 12,300 | | | | 1,212,042 | |
| | | | | | | | |
| | | | | | | $ | 9,770,881 | |
| Metals & Mining - 1.1% | | | | | | | | |
| Rio Tinto PLC | | | 49,420 | | | $ | 2,690,546 | |
| | |
| Oil Services - 2.7% | | | | | | | | |
| Saipem S.p.A. | | | 34,590 | | | $ | 926,177 | |
| Schlumberger Ltd. | | | 53,290 | | | | 5,411,600 | |
| | | | | | | | |
| | | | | | | $ | 6,337,777 | |
| Other Banks & Diversified Financials - 6.4% | | | | | | | | |
| Credicorp Ltd. | | | 17,130 | | | $ | 2,556,653 | |
| HDFC Bank Ltd. | | | 185,891 | | | | 2,228,684 | |
| Itau Unibanco Holding S.A., ADR | | | 104,052 | | | | 1,702,291 | |
| Julius Baer Group Ltd. | | | 54,013 | | | | 2,525,435 | |
| MasterCard, Inc., “A” | | | 20,071 | | | | 1,476,222 | |
| Sberbank of Russia, ADR (a) | | | 106,712 | | | | 894,460 | |
| Visa, Inc., “A” | | | 17,190 | | | | 3,482,866 | |
| | | | | | | | |
| | | | | | | $ | 14,866,611 | |
| Pharmaceuticals - 4.3% | | | | | | | | |
| Allergan, Inc. | | | 8,267 | | | $ | 1,370,999 | |
| Bayer AG (l) | | | 21,506 | | | | 2,983,635 | |
| Johnson & Johnson | | | 23,010 | | | | 2,330,683 | |
| Zoetis, Inc. | | | 110,380 | | | | 3,340,099 | |
| | | | | | | | |
| | | | | | | $ | 10,025,416 | |
| Printing & Publishing - 0.1% | | | | | | | | |
| Equifax, Inc. | | | 3,490 | | | $ | 247,127 | |
| | |
| Railroad & Shipping - 0.5% | | | | | | | | |
| Kuehne & Nagel International AG | | | 8,060 | | | $ | 1,100,798 | |
| | |
| Restaurants - 1.9% | | | | | | | | |
| McDonald’s Corp. | | | 24,922 | | | $ | 2,526,592 | |
| Whitbread PLC | | | 28,567 | | | | 1,967,887 | |
| | | | | | | | |
| | | | | | | $ | 4,494,479 | |
9
Portfolio of Investments (unaudited) – continued
| | | | | | | | |
| Issuer | | Shares/Par | | | Value ($) | |
| | | | | | | | |
| Common Stocks - continued | | | | | | | | |
| Specialty Chemicals - 3.3% | | | | | | | | |
| Croda International PLC | | | 32,688 | | | $ | 1,421,705 | |
| Linde AG | | | 13,383 | | | | 2,774,824 | |
| Praxair, Inc. | | | 17,429 | | | | 2,275,356 | |
| Symrise AG | | | 23,364 | | | | 1,179,061 | |
| | | | | | | | |
| | | | | | | $ | 7,650,946 | |
| Specialty Stores - 0.9% | | | | | | | | |
| Industria de Diseno Textil S.A. | | | 13,547 | | | $ | 2,032,618 | |
| | |
| Trucking - 0.6% | | | | | | | | |
| Expeditors International of Washington, Inc. | | | 35,000 | | | $ | 1,443,400 | |
| Total Common Stocks (Identified Cost, $174,337,091) | | | | | | $ | 230,490,746 | |
| | |
| Money Market Funds - 0.7% | | | | | | | | |
MFS Institutional Money Market Portfolio, 0.09%,
at Cost and Net Asset Value (v) | | | 1,645,366 | | | $ | 1,645,366 | |
| | |
| Collateral for Securities Loaned - 3.0% | | | | | | | | |
JPMorgan Prime Money Market Fund, 0.06%,
at Cost and Net Asset Value (j) | | | 7,107,147 | | | $ | 7,107,147 | |
| Total Investments (Identified Cost, $183,089,604) | | | | | | $ | 239,243,259 | |
| | |
| Other Assets, Less Liabilities - (2.4)% | | | | | | | (5,708,997 | ) |
| Net Assets - 100.0% | | | | | | $ | 233,534,262 | |
| (a) | Non-income producing security. |
| (j) | The rate quoted is the annualized seven-day yield of the fund at period end. |
| (l) | A portion of this security is on loan. |
| (v) | Underlying affiliated fund that is available only to investment companies managed by MFS. The rate quoted for the MFS Institutional Money Market Portfolio is the annualized seven-day yield of the fund at period end. |
The following abbreviations are used in this report and are defined:
| ADR | | American Depositary Receipt |
| PLC | | Public Limited Company |
See Notes to Financial Statements
10
Financial Statements
STATEMENT OF ASSETS AND LIABILITIES
At 4/30/14 (unaudited)
This statement represents your fund’s balance sheet, which details the assets and liabilities comprising the total value of the fund.
| | | | |
| Assets | | | | |
Investments- | | | | |
Non-affiliated issuers, at value (identified cost, $181,444,238) | | | $237,597,893 | |
Underlying affiliated funds, at cost and value | | | 1,645,366 | |
Total investments, at value, including $6,807,955 of securities on loan (identified cost, $183,089,604) | | | $239,243,259 | |
Cash | | | 60,764 | |
Receivables for | | | | |
Investments sold | | | 1,268,284 | |
Fund shares sold | | | 145,115 | |
Interest and dividends | | | 469,449 | |
Other assets | | | 1,162 | |
Total assets | | | $241,188,033 | |
| Liabilities | | | | |
Payables for | | | | |
Investments purchased | | | $241,697 | |
Fund shares reacquired | | | 83,465 | |
Collateral for securities loaned, at value | | | 7,107,147 | |
Payable to affiliates | | | | |
Investment adviser | | | 10,706 | |
Shareholder servicing costs | | | 165,327 | |
Distribution and service fees | | | 3,951 | |
Payable for independent Trustees’ compensation | | | 8,034 | |
Accrued expenses and other liabilities | | | 33,444 | |
Total liabilities | | | $7,653,771 | |
Net assets | | | $233,534,262 | |
| Net assets consist of | | | | |
Paid-in capital | | | $173,144,669 | |
Unrealized appreciation (depreciation) on investments and translation of assets and liabilities in foreign currencies | | | 56,158,115 | |
Accumulated net realized gain (loss) on investments and foreign currency | | | 4,147,537 | |
Undistributed net investment income | | | 83,941 | |
Net assets | | | $233,534,262 | |
Shares of beneficial interest outstanding | | | 6,876,163 | |
11
Statement of Assets and Liabilities (unaudited) – continued
| | | | | | | | | | | | |
| | | Net assets | | | Shares
outstanding | | | Net asset value
per share (a) | |
Class A | | | $190,359,460 | | | | 5,551,620 | | | | $34.29 | |
Class B | | | 7,729,257 | | | | 248,066 | | | | 31.16 | |
Class C | | | 13,759,645 | | | | 446,178 | | | | 30.84 | |
Class I | | | 12,513,486 | | | | 357,719 | | | | 34.98 | |
Class R1 | | | 656,747 | | | | 21,333 | | | | 30.79 | |
Class R2 | | | 3,369,782 | | | | 100,752 | | | | 33.45 | |
Class R3 | | | 4,107,507 | | | | 120,311 | | | | 34.14 | |
Class R4 | | | 920,467 | | | | 26,814 | | | | 34.33 | |
Class R5 | | | 117,911 | | | | 3,370 | | | | 34.99 | |
| (a) | Maximum offering price per share was equal to the net asset value per share for all share classes, except for Class A, for which the maximum offering price per share was $36.38 [100 / 94.25 x $34.29]. On sales of $50,000 or more, the maximum offering price of Class A shares is reduced. A contingent deferred sales charge may be imposed on redemptions of Class A, Class B, and Class C shares. Redemption price per share was equal to the net asset value per share for Classes I, R1, R2, R3, R4, and R5. |
See Notes to Financial Statements
12
Financial Statements
STATEMENT OF OPERATIONS
Six months ended 4/30/14 (unaudited)
This statement describes how much your fund earned in investment income and accrued in expenses. It also describes any gains and/or losses generated by fund operations.
| | | | |
| Net investment income | |
Income | | | | |
Dividends | | | $1,900,612 | |
Interest | | | 13,484 | |
Dividends from underlying affiliated funds | | | 609 | |
Foreign taxes withheld | | | (88,845 | ) |
Total investment income | | | $1,825,860 | |
Expenses | | | | |
Management fee | | | $1,021,935 | |
Distribution and service fees | | | 355,607 | |
Shareholder servicing costs | | | 172,391 | |
Administrative services fee | | | 18,888 | |
Independent Trustees’ compensation | | | 5,837 | |
Custodian fee | | | 35,360 | |
Shareholder communications | | | 11,604 | |
Audit and tax fees | | | 36,820 | |
Legal fees | | | 1,047 | |
Miscellaneous | | | 65,950 | |
Total expenses | | | $1,725,439 | |
Fees paid indirectly | | | (2 | ) |
Reduction of expenses by investment adviser and distributor | | | (10,993 | ) |
Net expenses | | | $1,714,444 | |
Net investment income | | | $111,416 | |
| Realized and unrealized gain (loss) on investments and foreign currency | |
Realized gain (loss) (identified cost basis) | | | | |
Investments | | | $4,288,492 | |
Foreign currency | | | (5,956 | ) |
Net realized gain (loss) on investments and foreign currency | | | $4,282,536 | |
Change in unrealized appreciation (depreciation) | | | | |
Investments | | | $6,176,347 | |
Translation of assets and liabilities in foreign currencies | | | 2,219 | |
Net unrealized gain (loss) on investments and foreign currency translation | | | $6,178,566 | |
Net realized and unrealized gain (loss) on investments and foreign currency | | | $10,461,102 | |
Change in net assets from operations | | | $10,572,518 | |
See Notes to Financial Statements
13
Financial Statements
STATEMENTS OF CHANGES IN NET ASSETS
These statements describe the increases and/or decreases in net assets resulting from operations, any distributions, and any shareholder transactions.
| | | | | | | | |
| | | Six months ended
4/30/14 | | | Year ended
10/31/13 | |
| Change in net assets | | (unaudited) | | | | |
| From operations | | | | | | | | |
Net investment income | | | $111,416 | | | | $542,778 | |
Net realized gain (loss) on investments and foreign currency | | | 4,282,536 | | | | 10,891,700 | |
Net unrealized gain (loss) on investments and foreign currency translation | | | 6,178,566 | | | | 33,159,662 | |
Change in net assets from operations | | | $10,572,518 | | | | $44,594,140 | |
| Distributions declared to shareholders | | | | | | | | |
From net investment income | | | $(562,037 | ) | | | $(460,035 | ) |
From net realized gain on investments | | | (7,102,037 | ) | | | — | |
Total distributions declared to shareholders | | | $(7,664,074 | ) | | | $(460,035 | ) |
Change in net assets from fund share transactions | | | $1,984,787 | | | | $(9,426,579 | ) |
Total change in net assets | | | $4,893,231 | | | | $34,707,526 | |
| Net assets | | | | | | | | |
At beginning of period | | | 228,641,031 | | | | 193,933,505 | |
At end of period (including undistributed net investment income of $83,941 and $534,562, respectively) | | | $233,534,262 | | | | $228,641,031 | |
See Notes to Financial Statements
14
Financial Statements
FINANCIAL HIGHLIGHTS
The financial highlights table is intended to help you understand the fund’s financial performance for the semiannual period and the past 5 fiscal years (or life of a particular share class, if shorter). Certain information reflects financial results for a single fund share. The total returns in the table represent the rate by which an investor would have earned (or lost) on an investment in the fund share class (assuming reinvestment of all distributions) held for the entire period.
| | | | | | | | | | | | | | | | | | | | | | | | |
| | | Six months
ended
4/30/14 (unaudited) | | | Years ended 10/31 | |
| Class A | | | 2013 | | | 2012 | | | 2011 | | | 2010 | | | 2009 | |
| | | | | | | | | | | | | | | | | |
Net asset value, beginning of
period | | | $33.89 | | | | $27.45 | | | | $25.50 | | | | $24.88 | | | | $21.93 | | | | $17.35 | |
| Income (loss) from investment operations | | | | | | | | | | | | | |
Net investment income (d) | | | $0.03 | | | | $0.10 | | | | $0.09 | | | | $0.11 | | | | $0.08 | | | | $0.11 | |
Net realized and unrealized gain
(loss) on investments and
foreign currency | | | 1.51 | | | | 6.41 | | | | 1.93 | | | | 0.57 | | | | 2.96 | | | | 4.47 | |
Total from investment operations | | | $1.54 | | | | $6.51 | | | | $2.02 | | | | $0.68 | | | | $3.04 | | | | $4.58 | |
| Less distributions declared to shareholders | | | | | | | | | | | | | |
From net investment income | | | $(0.09 | ) | | | $(0.07 | ) | | | $(0.07 | ) | | | $(0.06 | ) | | | $(0.09 | ) | | | $(0.00 | )(w) |
From net realized gain on
investments | | | (1.05 | ) | | | — | | | | — | | | | — | | | | — | | | | — | |
Total distributions declared to
shareholders | | | $(1.14 | ) | | | $(0.07 | ) | | | $(0.07 | ) | | | $(0.06 | ) | | | $(0.09 | ) | | | $(0.00 | )(w) |
Net asset value, end of period (x) | | | $34.29 | | | | $33.89 | | | | $27.45 | | | | $25.50 | | | | $24.88 | | | | $21.93 | |
Total return (%) (r)(s)(t)(x) | | | 4.75 | (n) | | | 23.77 | | | | 7.98 | | | | 2.73 | | | | 13.92 | | | | 26.40 | |
Ratios (%) (to average net assets)
and Supplemental data: | | | | | | | | | | | | | | | | | | | | | |
Expenses before expense
reductions (f) | | | 1.46 | (a) | | | 1.49 | | | | 1.53 | | | | 1.53 | | | | 1.55 | | | | 1.70 | |
Expenses after expense
reductions (f) | | | 1.45 | (a) | | | 1.49 | | | | 1.53 | | | | 1.53 | | | | 1.55 | | | | 1.67 | |
Net investment income | | | 0.16 | (a)(l) | | | 0.33 | | | | 0.33 | | | | 0.42 | | | | 0.34 | | | | 0.59 | |
Portfolio turnover | | | 13 | (n) | | | 31 | | | | 37 | | | | 39 | | | | 63 | | | | 83 | |
Net assets at end of period
(000 omitted) | | | $190,359 | | | | $186,818 | | | | $159,905 | | | | $164,474 | | | | $183,544 | | | | $180,278 | |
See Notes to Financial Statements
15
Financial Highlights – continued
| | | | | | | | | | | | | | | | | | | | | | | | |
| | | Six months
ended
4/30/14 (unaudited) | | | Years ended 10/31 | |
| Class B | | | | 2013 | | | | 2012 | | | | 2011 | | | | 2010 | | | | 2009 | |
| | | | | | | | | | | | | | | | | |
Net asset value, beginning of
period | | | $30.92 | | | | $25.18 | | | | $23.49 | | | | $23.03 | | | | $20.37 | | | | $16.24 | |
| Income (loss) from investment operations | | | | | | | | | | | | | | | | | |
Net investment loss (d) | | | $(0.09 | ) | | | $(0.12 | ) | | | $(0.10 | ) | | | $(0.08 | ) | | | $(0.09 | ) | | | $(0.03 | ) |
Net realized and unrealized gain
(loss) on investments and
foreign currency | | | 1.38 | | | | 5.86 | | | | 1.79 | | | | 0.54 | | | | 2.75 | | | | 4.16 | |
Total from investment operations | | | $1.29 | | | | $5.74 | | | | $1.69 | | | | $0.46 | | | | $2.66 | | | | $4.13 | |
| Less distributions declared to shareholders | | | | | | | | | | | | | | | | | |
From net realized gain on
investments | | | $(1.05 | ) | | | $— | | | | $— | | | | $— | | | | $— | | | | $— | |
Net asset value, end of period (x) | | | $31.16 | | | | $30.92 | | | | $25.18 | | | | $23.49 | | | | $23.03 | | | | $20.37 | |
Total return (%) (r)(s)(t)(x) | | | 4.37 | (n) | | | 22.80 | | | | 7.19 | | | | 2.00 | | | | 13.06 | | | | 25.43 | |
Ratios (%) (to average net assets)
and Supplemental data: | | | | | | | | | | | | | | | | | | | | | |
Expenses before expense
reductions (f) | | | 2.21 | (a) | | | 2.24 | | | | 2.28 | | | | 2.28 | | | | 2.30 | | | | 2.43 | |
Expenses after expense
reductions (f) | | | 2.20 | (a) | | | 2.24 | | | | 2.28 | | | | 2.28 | | | | 2.30 | | | | 2.43 | |
Net investment loss | | | (0.60 | )(a)(l) | | | (0.42 | ) | | | (0.43 | ) | | | (0.35 | ) | | | (0.43 | ) | | | (0.19 | ) |
Portfolio turnover | | | 13 | (n) | | | 31 | | | | 37 | | | | 39 | | | | 63 | | | | 83 | |
Net assets at end of period
(000 omitted) | | | $7,729 | | | | $8,165 | | | | $7,966 | | | | $9,854 | | | | $13,563 | | | | $17,219 | |
See Notes to Financial Statements
16
Financial Highlights – continued
| | | | | | | | | | | | | | | | | | | | | | | | |
| | | Six months
ended
4/30/14 (unaudited) | | | Years ended 10/31 | |
| Class C | | | 2013 | | | 2012 | | | 2011 | | | 2010 | | | 2009 | |
| | | | | | | | | | | | | | | | | |
Net asset value, beginning of
period | | | $30.62 | | | | $24.93 | | | | $23.25 | | | | $22.81 | | | | $20.17 | | | | $16.08 | |
| Income (loss) from investment operations | | | | | | | | | | | | | | | | | |
Net investment loss (d) | | | $(0.09 | ) | | | $(0.12 | ) | | | $(0.10 | ) | | | $(0.07 | ) | | | $(0.09 | ) | | | $(0.03 | ) |
Net realized and unrealized gain
(loss) on investments and
foreign currency | | | 1.36 | | | | 5.81 | | | | 1.78 | | | | 0.51 | | | | 2.73 | | | | 4.12 | |
Total from investment operations | | | $1.27 | | | | $5.69 | | | | $1.68 | | | | $0.44 | | | | $2.64 | | | | $4.09 | |
| Less distributions declared to shareholders | | | | | | | | | | | | | | | | | |
From net realized gain on
investments | | | $(1.05 | ) | | | $— | | | | $— | | | | $— | | | | $— | | | | $— | |
Net asset value, end of period (x) | | | $30.84 | | | | $30.62 | | | | $24.93 | | | | $23.25 | | | | $22.81 | | | | $20.17 | |
Total return (%) (r)(s)(t)(x) | | | 4.35 | (n) | | | 22.82 | | | | 7.23 | | | | 1.93 | | | | 13.09 | | | | 25.44 | |
Ratios (%) (to average net assets)
and Supplemental data: | | | | | | | | | | | | | | | | | | | | | |
Expenses before expense
reductions (f) | | | 2.21 | (a) | | | 2.24 | | | | 2.28 | | | | 2.28 | | | | 2.30 | | | | 2.42 | |
Expenses after expense
reductions (f) | | | 2.20 | (a) | | | 2.24 | | | | 2.28 | | | | 2.28 | | | | 2.30 | | | | 2.41 | |
Net investment loss | | | (0.59 | )(a)(l) | | | (0.43 | ) | | | (0.42 | ) | | | (0.31 | ) | | | (0.41 | ) | | | (0.19 | ) |
Portfolio turnover | | | 13 | (n) | | | 31 | | | | 37 | | | | 39 | | | | 63 | | | | 83 | |
Net assets at end of period
(000 omitted) | | | $13,760 | | | | $13,433 | | | | $11,304 | | | | $11,327 | | | | $14,485 | | | | $13,598 | |
See Notes to Financial Statements
17
Financial Highlights – continued
| | | | | | | | | | | | | | | | | | | | | | | | |
| | | Six months
ended
4/30/14 (unaudited) | | | Years ended 10/31 | |
| Class I | | | 2013 | | | 2012 | | | 2011 | | | 2010 | | | 2009 | |
| | | | | | | | | | | | | | | | | |
Net asset value, beginning of
period | | | $34.59 | | | | $28.02 | | | | $26.03 | | | | $25.39 | | | | $22.37 | | | | $17.73 | |
| Income (loss) from investment operations | | | | | | | | | | | | | |
Net investment income (d) | | | $0.07 | | | | $0.18 | | | | $0.16 | | | | $0.18 | | | | $0.14 | | | | $0.16 | |
Net realized and unrealized gain
(loss) on investments and
foreign currency | | | 1.54 | | | | 6.53 | | | | 1.97 | | | | 0.58 | | | | 3.02 | | | | 4.55 | |
Total from investment operations | | | $1.61 | | | | $6.71 | | | | $2.13 | | | | $0.76 | | | | $3.16 | | | | $4.71 | |
| Less distributions declared to shareholders | | | | | | | | | | | | | |
From net investment income | | | $(0.17 | ) | | | $(0.14 | ) | | | $(0.14 | ) | | | $(0.12 | ) | | | $(0.14 | ) | | | $(0.07 | ) |
From net realized gain on
investments | | | (1.05 | ) | | | — | | | | — | | | | — | | | | — | | | | — | |
Total distributions declared to
shareholders | | | $(1.22 | ) | | | $(0.14 | ) | | | $(0.14 | ) | | | $(0.12 | ) | | | $(0.14 | ) | | | $(0.07 | ) |
Net asset value, end of period (x) | | | $34.98 | | | | $34.59 | | | | $28.02 | | | | $26.03 | | | | $25.39 | | | | $22.37 | |
Total return (%) (r)(s)(x) | | | 4.87 | (n) | | | 24.05 | | | | 8.29 | | | | 2.99 | | | | 14.18 | | | | 26.68 | |
Ratios (%) (to average net assets)
and Supplemental data: | | | | | | | | | | | | | | | | | | | | | |
Expenses before expense
reductions (f) | | | 1.21 | (a) | | | 1.24 | | | | 1.28 | | | | 1.28 | | | | 1.30 | | | | 1.42 | |
Expenses after expense
reductions (f) | | | 1.20 | (a) | | | 1.24 | | | | 1.28 | | | | 1.28 | | | | 1.30 | | | | 1.41 | |
Net investment income | | | 0.42 | (a)(l) | | | 0.56 | | | | 0.58 | | | | 0.67 | | | | 0.60 | | | | 0.84 | |
Portfolio turnover | | | 13 | (n) | | | 31 | | | | 37 | | | | 39 | | | | 63 | | | | 83 | |
Net assets at end of period
(000 omitted) | | | $12,513 | | | | $11,511 | | | | $7,513 | | | | $6,731 | | | | $6,788 | | | | $5,875 | |
See Notes to Financial Statements
18
Financial Highlights – continued
| | | | | | | | | | | | | | | | | | | | | | | | |
| | | Six months
ended
4/30/14 (unaudited) | | | Years ended 10/31 | |
| Class R1 | | | 2013 | | | 2012 | | | 2011 | | | 2010 | | | 2009 | |
| | | | | | | | | | | | | | | | | |
Net asset value, beginning of
period | | | $30.57 | | | | $24.88 | | | | $23.22 | | | | $22.77 | | | | $20.14 | | | | $16.05 | |
| Income (loss) from investment operations | | | | | | | | | | | | | | | | | |
Net investment loss (d) | | | $(0.09 | ) | | | $(0.12 | ) | | | $(0.09 | ) | | | $(0.08 | ) | | | $(0.08 | ) | | | $(0.02 | ) |
Net realized and unrealized gain
(loss) on investments and
foreign currency | | | 1.36 | | | | 5.81 | | | | 1.75 | | | | 0.53 | | | | 2.71 | | | | 4.11 | |
Total from investment operations | | | $1.27 | | | | $5.69 | | | | $1.66 | | | | $0.45 | | | | $2.63 | | | | $4.09 | |
| Less distributions declared to shareholders | | | | | | | | | | | | | | | | | |
From net realized gain on
investments | | | $(1.05 | ) | | | $— | | | | $— | | | | $— | | | | $— | | | | $— | |
Net asset value, end of period (x) | | | $30.79 | | | | $30.57 | | | | $24.88 | | | | $23.22 | | | | $22.77 | | | | $20.14 | |
Total return (%) (r)(s)(x) | | | 4.36 | (n) | | | 22.87 | | | | 7.15 | | | | 1.98 | | | | 13.06 | | | | 25.48 | |
Ratios (%) (to average net assets)
and Supplemental data: | | | | | | | | | | | | | | | | | | | | | |
Expenses before expense
reductions (f) | | | 2.21 | (a) | | | 2.24 | | | | 2.28 | | | | 2.28 | | | | 2.30 | | | | 2.41 | |
Expenses after expense
reductions (f) | | | 2.20 | (a) | | | 2.24 | | | | 2.28 | | | | 2.28 | | | | 2.30 | | | | 2.41 | |
Net investment loss | | | (0.62 | )(a)(l) | | | (0.42 | ) | | | (0.39 | ) | | | (0.33 | ) | | | (0.38 | ) | | | (0.11 | ) |
Portfolio turnover | | | 13 | (n) | | | 31 | | | | 37 | | | | 39 | | | | 63 | | | | 83 | |
Net assets at end of period
(000 omitted) | | | $657 | | | | $867 | | | | $763 | | | | $775 | | | | $791 | | | | $886 | |
See Notes to Financial Statements
19
Financial Highlights – continued
| | | | | | | | | | | | | | | | | | | | | | | | |
| | | Six months
ended
4/30/14 (unaudited) | | | Years ended 10/31 | |
| Class R2 | | | 2013 | | | 2012 | | | 2011 | | | 2010 | | | 2009 | |
| | | | | | | | | | | | | | | | | |
Net asset value, beginning of
period | | | $33.04 | | | | $26.76 | | | | $24.84 | | | | $24.25 | | | | $21.37 | | | | $16.95 | |
| Income (loss) from investment operations | | | | | | | | | | | | | | | | | |
Net investment income (loss) (d) | | | $(0.02 | ) | | | $0.03 | | | | $0.02 | | | | $0.04 | | | | $0.02 | | | | $0.06 | |
Net realized and unrealized gain
(loss) on investments and
foreign currency | | | 1.48 | | | | 6.25 | | | | 1.90 | | | | 0.55 | | | | 2.90 | | | | 4.36 | |
Total from investment operations | | | $1.46 | | | | $6.28 | | | | $1.92 | | | | $0.59 | | | | $2.92 | | | | $4.42 | |
| Less distributions declared to shareholders | | | | | | | | | | | | | | | | | |
From net investment income | | | $(0.00 | )(w) | | | $— | | | | $— | | | | $(0.00 | )(w) | | | $(0.04 | ) | | | $— | |
From net realized gain on
investments | | | (1.05 | ) | | | — | | | | — | | | | — | | | | — | | | | — | |
Total distributions declared to shareholders | | | $(1.05 | ) | | | $— | | | | $— | | | | $(0.00 | )(w) | | | $(0.04 | ) | | | $— | |
Net asset value, end of period (x) | | | $33.45 | | | | $33.04 | | | | $26.76 | | | | $24.84 | | | | $24.25 | | | | $21.37 | |
Total return (%) (r)(s)(x) | | | 4.63 | (n) | | | 23.47 | | | | 7.73 | | | | 2.45 | | | | 13.66 | | | | 26.08 | |
Ratios (%) (to average net assets)
and Supplemental data: | | | | | | | | | | | | | | | | | | | | | |
Expenses before expense
reductions (f) | | | 1.71 | (a) | | | 1.74 | | | | 1.78 | | | | 1.78 | | | | 1.80 | | | | 1.93 | |
Expenses after expense
reductions (f) | | | 1.70 | (a) | | | 1.74 | | | | 1.78 | | | | 1.78 | | | | 1.80 | | | | 1.93 | |
Net investment income (loss) | | | (0.11 | )(a)(l) | | | 0.08 | | | | 0.09 | | | | 0.14 | | | | 0.10 | | | | 0.36 | |
Portfolio turnover | | | 13 | (n) | | | 31 | | | | 37 | | | | 39 | | | | 63 | | | | 83 | |
Net assets at end of period
(000 omitted) | | | $3,370 | | | | $3,372 | | | | $3,250 | | | | $4,586 | | | | $5,250 | | | | $5,128 | |
See Notes to Financial Statements
20
Financial Highlights – continued
| | | | | | | | | | | | | | | | | | | | | | | | |
| | | Six months
ended
4/30/14 (unaudited) | | | Years ended 10/31 | |
| Class R3 | | | 2013 | | | 2012 | | | 2011 | | | 2010 | | | 2009 | |
| | | | | | | | | | | | | | | | | |
Net asset value, beginning of
period | | | $33.75 | | | | $27.35 | | | | $25.41 | | | | $24.80 | | | | $21.86 | | | | $17.29 | |
| Income (loss) from investment operations | | | | | | | | | | | | | |
Net investment income (d) | | | $0.03 | | | | $0.10 | | | | $0.09 | | | | $0.11 | | | | $0.08 | | | | $0.11 | |
Net realized and unrealized gain
(loss) on investments and
foreign currency | | | 1.50 | | | | 6.38 | | | | 1.93 | | | | 0.56 | | | | 2.96 | | | | 4.46 | |
Total from investment operations | | | $1.53 | | | | $6.48 | | | | $2.02 | | | | $0.67 | | | | $3.04 | | | | $4.57 | |
| Less distributions declared to shareholders | | | | | | | | | | | | | |
From net investment income | | | $(0.09 | ) | | | $(0.08 | ) | | | $(0.08 | ) | | | $(0.06 | ) | | | $(0.10 | ) | | | $— | |
From net realized gain on
investments | | | (1.05 | ) | | | — | | | | — | | | | — | | | | — | | | | — | |
Total distributions declared to
shareholders | | | $(1.14 | ) | | | $(0.08 | ) | | | $(0.08 | ) | | | $(0.06 | ) | | | $(0.10 | ) | | | $— | |
Net asset value, end of period (x) | | | $34.14 | | | | $33.75 | | | | $27.35 | | | | $25.41 | | | | $24.80 | | | | $21.86 | |
Total return (%) (r)(s)(x) | | | 4.75 | (n) | | | 23.74 | | | | 8.00 | | | | 2.72 | | | | 13.93 | | | | 26.43 | |
Ratios (%) (to average net assets)
and Supplemental data: | | | | | | | | | | | | | | | | | | | | | |
Expenses before expense
reductions (f) | | | 1.46 | (a) | | | 1.49 | | | | 1.53 | | | | 1.53 | | | | 1.55 | | | | 1.67 | |
Expenses after expense
reductions (f) | | | 1.45 | (a) | | | 1.49 | | | | 1.53 | | | | 1.53 | | | | 1.55 | | | | 1.67 | |
Net investment income | | | 0.16 | (a)(l) | | | 0.32 | | | | 0.32 | | | | 0.42 | | | | 0.34 | | | | 0.60 | |
Portfolio turnover | | | 13 | (n) | | | 31 | | | | 37 | | | | 39 | | | | 63 | | | | 83 | |
Net assets at end of period
(000 omitted) | | | $4,108 | | | | $3,419 | | | | $2,942 | | | | $2,693 | | | | $2,528 | | | | $2,168 | |
See Notes to Financial Statements
21
Financial Highlights – continued
| | | | | | | | | | | | | | | | | | | | | | | | |
| | | Six months
ended
4/30/14 (unaudited) | | | Years ended 10/31 | |
| Class R4 | | | 2013 | | | 2012 | | | 2011 | | | 2010 | | | 2009 | |
| | | | | | | | | | | | | | | | | |
Net asset value, beginning of
period | | | $33.97 | | | | $27.52 | | | | $25.57 | | | | $24.95 | | | | $21.98 | | | | $17.41 | |
| Income (loss) from investment operations | | | | | | | | | | | | | |
Net investment income (d) | | | $0.07 | | | | $0.12 | | | | $0.14 | | | | $0.17 | | | | $0.14 | | | | $0.19 | |
Net realized and unrealized gain
(loss) on investments and
foreign currency | | | 1.51 | | | | 6.47 | | | | 1.95 | | | | 0.57 | | | | 2.97 | | | | 4.44 | |
Total from investment operations | | | $1.58 | | | | $6.59 | | | | $2.09 | | | | $0.74 | | | | $3.11 | | | | $4.63 | |
| Less distributions declared to shareholders | | | | | | | | | | | | | |
From net investment income | | | $(0.17 | ) | | | $(0.14 | ) | | | $(0.14 | ) | | | $(0.12 | ) | | | $(0.14 | ) | | | $(0.06 | ) |
From net realized gain on
investments | | | (1.05 | ) | | | — | | | | — | | | | — | | | | — | | | | — | |
Total distributions declared to
shareholders | | | $(1.22 | ) | | | $(0.14 | ) | | | $(0.14 | ) | | | $(0.12 | ) | | | $(0.14 | ) | | | $(0.06 | ) |
Net asset value, end of period (x) | | | $34.33 | | | | $33.97 | | | | $27.52 | | | | $25.57 | | | | $24.95 | | | | $21.98 | |
Total return (%) (r)(s)(x) | | | 4.89 | (n) | | | 24.05 | | | | 8.28 | | | | 2.96 | | | | 14.21 | | | | 26.73 | |
Ratios (%) (to average net assets)
and Supplemental data: | | | | | | | | | | | | | | | | | | | | | |
Expenses before expense
reductions (f) | | | 1.21 | (a) | | | 1.25 | | | | 1.28 | | | | 1.28 | | | | 1.30 | | | | 1.38 | |
Expenses after expense
reductions (f) | | | 1.20 | (a) | | | 1.25 | | | | 1.28 | | | | 1.28 | | | | 1.30 | | | | 1.38 | |
Net investment income | | | 0.44 | (a)(l) | | | 0.39 | | | | 0.51 | | | | 0.67 | | | | 0.60 | | | | 1.03 | |
Portfolio turnover | | | 13 | (n) | | | 31 | | | | 37 | | | | 39 | | | | 63 | | | | 83 | |
Net assets at end of period
(000 omitted) | | | $920 | | | | $942 | | | | $292 | | | | $175 | | | | $171 | | | | $146 | |
See Notes to Financial Statements
22
Financial Highlights – continued
| | | | | | | | |
| Class R5 | | Six months
ended
4/30/14
(unaudited) | | | Period ended
10/31/13 (i) | |
| | | | | |
Net asset value, beginning of period | | | $34.61 | | | | $30.79 | |
| Income (loss) from investment operations | | | | | | | | |
Net investment income (d) | | | $0.08 | | | | $0.15 | |
Net realized and unrealized gain (loss) on investments and
foreign currency | | | 1.54 | | | | 3.67 | (g) |
Total from investment operations | | | $1.62 | | | | $3.82 | |
| Less distributions declared to shareholders | | | | | | | | |
From net investment income | | | $(0.19 | ) | | | $— | |
From net realized gain on investments | | | (1.05 | ) | | | — | |
Total distributions declared to shareholders | | | $(1.24 | ) | | | $— | |
Net asset value, end of period (x) | | | $34.99 | | | | $34.61 | |
Total return (%) (r)(s)(x) | | | 4.89 | (n) | | | 12.41 | (n) |
Ratios (%) (to average net assets)
and Supplemental data: | | | | | | | | |
Expenses before expense reductions (f) | | | 1.14 | (a) | | | 1.15 | (a) |
Expenses after expense reductions (f) | | | 1.14 | (a) | | | 1.15 | (a) |
Net investment income | | | 0.47 | (a)(l) | | | 0.68 | (a) |
Portfolio turnover | | | 13 | (n) | | | 33 | (n) |
Net assets at end of period (000 omitted) | | | $118 | | | | $112 | |
| (d) | Per share data is based on average shares outstanding. |
| (f) | Ratios do not reflect reductions from fees paid indirectly, if applicable. |
| (g) | The per share amount is not in accordance with the net realized and unrealized gain/loss for the period because of the timing of sales of fund shares and the per share amount of realized and unrealized gains and losses at such time. |
| (i) | For the period from the class inception, March 1, 2013, through the stated period end. |
| (l) | Recognition of net investment income by the fund may be affected by the timing of the declaration of dividends by companies in which the fund invests and the actual annual net investment income ratio may differ. |
| (r) | Certain expenses have been reduced without which performance would have been lower. |
| (s) | From time to time the fund may receive proceeds from litigation settlements, without which performance would be lower. |
| (t) | Total returns do not include any applicable sales charges. |
| (w) | Per share amount was less than $0.01. |
| (x) | The net asset values per share and total returns have been calculated on net assets which include adjustments made in accordance with U.S. generally accepted accounting principles required at period end for financial reporting purposes. |
See Notes to Financial Statements
23
NOTES TO FINANCIAL STATEMENTS
(unaudited)
(1) Business and Organization
MFS Global Growth Fund (the fund) is a diversified series of MFS Series Trust VIII (the trust). The trust is organized as a Massachusetts business trust and is registered under the Investment Company Act of 1940, as amended, as an open-end management investment company.
The fund is an investment company and accordingly follows the investment company accounting and reporting guidance of the Financial Accounting Standards Board (FASB) Accounting Standard Codification Topic 946 Financial Services – Investment Companies.
(2) Significant Accounting Policies
General – The preparation of financial statements in conformity with U.S. generally accepted accounting principles requires management to make estimates and assumptions that affect the reported amounts of assets and liabilities, and disclosure of contingent assets and liabilities at the date of the financial statements and the reported amounts of increases and decreases in net assets from operations during the reporting period. Actual results could differ from those estimates. In the preparation of these financial statements, management has evaluated subsequent events occurring after the date of the fund’s Statement of Assets and Liabilities through the date that the financial statements were issued. The fund invests in foreign securities. Investments in foreign securities are vulnerable to the effects of changes in the relative values of the local currency and the U.S. dollar and to the effects of changes in each country’s legal, political, and economic environment.
In this reporting period, the fund adopted the disclosure provisions of FASB Accounting Standards Update 2011-11 (“ASU 2011-11”), Balance Sheet (Topic 210) – Disclosures about Offsetting Assets and Liabilities along with the related scope clarification provisions of FASB Accounting Standards Update 2013-01 (“ASU 2013-01”) entitled Balance Sheet (Topic 210) – Clarifying the Scope of Disclosures about Offsetting Assets and Liabilities. ASU 2011-11 is intended to enhance disclosures on the offsetting of financial assets and liabilities by requiring entities to disclose both gross and net information about financial instruments and transactions that are either offset in the statement of financial position or subject to an enforceable Master Netting Agreement or similar arrangement. ASU 2013-01 limits the scope of ASU 2011-11’s disclosure requirements on offsetting to financial assets and financial liabilities related to derivatives, repurchase and reverse repurchase agreements, and securities lending and securities borrowing transactions. The disclosures required by ASU 2011-11, to the extent applicable to the fund, have been included in the fund’s Significant Accounting Policies note under the captions for each of the fund’s in-scope financial instruments and transactions.
The fund’s accounting policy with respect to balance sheet offsetting is that, absent an event of default by the counterparty or a termination of the agreement, the ISDA Master Agreement does not result in an offset of reported amounts of financial assets and financial liabilities in the Statement of Assets and Liabilities across transactions between the fund and the applicable counterparty. The fund’s right to setoff may be restricted or prohibited by the bankruptcy or insolvency laws of the particular
24
Notes to Financial Statements (unaudited) – continued
jurisdiction to which a specific master netting agreement counterparty is subject. Balance sheet offsetting disclosures, to the extent applicable to the fund, have been included in the fund’s Significant Accounting Policies note under the captions for each of the fund’s in-scope financial instruments and transactions.
Investment Valuations – Equity securities, including restricted equity securities, are generally valued at the last sale or official closing price as provided by a third-party pricing service on the market or exchange on which they are primarily traded. Equity securities, for which there were no sales reported that day, are generally valued at the last quoted daily bid quotation as provided by a third-party pricing service on the market or exchange on which such securities are primarily traded. Short-term instruments with a maturity at issuance of 60 days or less generally are valued at amortized cost, which approximates market value. Open-end investment companies are generally valued at net asset value per share. Securities and other assets generally valued on the basis of information from a third-party pricing service may also be valued at a broker/dealer bid quotation. Values obtained from third-party pricing services can utilize both transaction data and market information such as yield, quality, coupon rate, maturity, type of issue, trading characteristics, and other market data. The values of foreign securities and other assets and liabilities expressed in foreign currencies are converted to U.S. dollars using the mean of bid and asked prices for rates provided by a third-party pricing service.
The Board of Trustees has delegated primary responsibility for determining or causing to be determined the value of the fund’s investments (including any fair valuation) to the adviser pursuant to valuation policies and procedures approved by the Board. If the adviser determines that reliable market quotations are not readily available, investments are valued at fair value as determined in good faith by the adviser in accordance with such procedures under the oversight of the Board of Trustees. Under the fund’s valuation policies and procedures, market quotations are not considered to be readily available for most types of debt instruments and floating rate loans and many types of derivatives. These investments are generally valued at fair value based on information from third-party pricing services. In addition, investments may be valued at fair value if the adviser determines that an investment’s value has been materially affected by events occurring after the close of the exchange or market on which the investment is principally traded (such as foreign exchange or market) and prior to the determination of the fund’s net asset value, or after the halting of trading of a specific security where trading does not resume prior to the close of the exchange or market on which the security is principally traded. Events that occur on a frequent basis after foreign markets close (such as developments in foreign markets and significant movements in the U.S. markets) and prior to the determination of the fund’s net asset value may be deemed to have a material effect on the value of securities traded in foreign markets. Accordingly, the fund’s foreign equity securities may often be valued at fair value. The adviser generally relies on third-party pricing services or other information (such as the correlation with price movements of similar securities in the same or other markets; the type, cost and investment characteristics of the security; the business and financial condition of the issuer; and trading and other market data) to assist in determining whether to fair value and at what value to fair value an investment. The value of an investment for purposes of calculating the fund’s net asset value can differ depending
25
Notes to Financial Statements (unaudited) – continued
on the source and method used to determine value. When fair valuation is used, the value of an investment used to determine the fund’s net asset value may differ from quoted or published prices for the same investment. There can be no assurance that the fund could obtain the fair value assigned to an investment if it were to sell the investment at the same time at which the fund determines its net asset value per share.
Various inputs are used in determining the value of the fund’s assets or liabilities. These inputs are categorized into three broad levels. In certain cases, the inputs used to measure fair value may fall into different levels of the fair value hierarchy. In such cases, an investment’s level within the fair value hierarchy is based on the lowest level of input that is significant to the fair value measurement. The fund’s assessment of the significance of a particular input to the fair value measurement in its entirety requires judgment, and considers factors specific to the investment. Level 1 includes unadjusted quoted prices in active markets for identical assets or liabilities. Level 2 includes other significant observable market-based inputs (including quoted prices for similar securities, interest rates, prepayment speed, and credit risk). Level 3 includes unobservable inputs, which may include the adviser’s own assumptions in determining the fair value of investments. The following is a summary of the levels used as of April 30, 2014 in valuing the fund’s assets or liabilities:
| | | | | | | | | | | | | | | | |
| Investments at Value | | Level 1 | | | Level 2 | | | Level 3 | | | Total | |
| Equity Securities: | | | | | | | | | | | | | | | | |
United States | | | $118,895,881 | | | | $— | | | | $— | | | | $118,895,881 | |
United Kingdom | | | 29,618,391 | | | | 32,256 | | | | — | | | | 29,650,647 | |
France | | | 22,317,450 | | | | — | | | | — | | | | 22,317,450 | |
Switzerland | | | 14,047,717 | | | | — | | | | — | | | | 14,047,717 | |
Germany | | | 9,100,922 | | | | — | | | | — | | | | 9,100,922 | |
Brazil | | | 7,958,505 | | | | — | | | | — | | | | 7,958,505 | |
Taiwan | | | 4,768,283 | | | | — | | | | — | | | | 4,768,283 | |
Denmark | | | 3,796,874 | | | | — | | | | — | | | | 3,796,874 | |
Canada | | | 3,088,154 | | | | — | | | | — | | | | 3,088,154 | |
Other Countries | | | 9,639,712 | | | | 7,226,601 | | | | — | | | | 16,866,313 | |
| Mutual Funds | | | 8,752,513 | | | | — | | | | — | | | | 8,752,513 | |
| Total Investments | | | $231,984,402 | | | | $7,258,857 | | | | $— | | | | $239,243,259 | |
For further information regarding security characteristics, see the Portfolio of Investments.
Of the level 2 investments presented above, equity investments amounting to $7,226,601 would have been considered level 1 investments at the beginning of the period. The primary reason for changes in the classifications between levels 1 and 2 occurs when foreign equity securities are fair valued using other observable market-based inputs in place of the closing exchange price due to events occurring after the close of the exchange or market on which the investment is principally traded. The fund’s foreign equity securities may often be valued at fair value. The fund’s policy is to recognize transfers between the levels as of the end of the period.
Foreign Currency Translation – Purchases and sales of foreign investments, income, and expenses are converted into U.S. dollars based upon currency exchange rates prevailing on the respective dates of such transactions or on the reporting date for
26
Notes to Financial Statements (unaudited) – continued
foreign denominated receivables and payables. Gains and losses attributable to foreign currency exchange rates on sales of securities are recorded for financial statement purposes as net realized gains and losses on investments. Gains and losses attributable to foreign exchange rate movements on receivables, payables, income and expenses are recorded for financial statement purposes as foreign currency transaction gains and losses. That portion of both realized and unrealized gains and losses on investments that results from fluctuations in foreign currency exchange rates is not separately disclosed.
Security Loans – Under its Securities Lending Agency Agreement with the fund, JPMorgan Chase and Co. (“Chase”), as lending agent, loans the securities of the fund to certain qualified institutions (the “Borrowers”) approved by the fund. The loans are collateralized by cash and/or U.S. Treasury and federal agency obligations in an amount typically at least equal to the market value of the securities loaned. The market value of the loaned securities is determined at the close of business of the fund and any additional required collateral is delivered to the fund on the next business day. Chase provides the fund with indemnification against Borrower default. In the event of Borrower default, Chase will for the benefit of the fund either purchase securities identical to those loaned or, when such purchase is commercially impracticable, pay the fund the market value of the loaned securities. In return, Chase assumes the fund’s rights to the related collateral. If the collateral value is less than the cost to purchase identical securities, Chase is responsible for the shortfall, but only to the extent that such shortfall is not due to a decline in collateral value resulting from collateral reinvestment for which the fund bears the risk of loss. On loans collateralized by cash, the cash collateral is invested in a money market fund or short-term securities. At period end, the fund had investment securities on loan with a fair value of $6,807,955 and a related liability of $7,107,147 for collateral received on securities loaned, both of which are presented gross on the Statement of Assets and Liabilities. The liability for collateral for securities loaned is carried at fair value, which is categorized as level 2 within the fair value hierarchy. The collateral received on securities loaned exceeded the value of securities on loan at period end. A portion of the income generated upon investment of the collateral is remitted to the Borrowers, and the remainder is allocated between the fund and the lending agent. On loans collateralized by U.S. Treasury and/or federal agency obligations, a fee is received from the Borrower, and is allocated between the fund and the lending agent. Income from securities lending is included in “Interest” income, in the Statement of Operations. The dividend and interest income earned on the securities loaned is accounted for in the same manner as other dividend and interest income.
Indemnifications – Under the fund’s organizational documents, its officers and Trustees may be indemnified against certain liabilities and expenses arising out of the performance of their duties to the fund. Additionally, in the normal course of business, the fund enters into agreements with service providers that may contain indemnification clauses. The fund’s maximum exposure under these agreements is unknown as this would involve future claims that may be made against the fund that have not yet occurred.
Investment Transactions and Income – Investment transactions are recorded on the trade date. Interest income is recorded on the accrual basis. Dividends received in cash
27
Notes to Financial Statements (unaudited) – continued
are recorded on the ex-dividend date. Certain dividends from foreign securities will be recorded when the fund is informed of the dividend if such information is obtained subsequent to the ex-dividend date. Dividend and interest payments received in additional securities are recorded on the ex-dividend or ex-interest date in an amount equal to the value of the security on such date.
The fund may receive proceeds from litigation settlements. Any proceeds received from litigation involving portfolio holdings are reflected in the Statement of Operations in realized gain/loss if the security has been disposed of by the fund or in unrealized gain/loss if the security is still held by the fund. Any other proceeds from litigation not related to portfolio holdings are reflected as other income in the Statement of Operations.
Fees Paid Indirectly – The fund’s custody fee may be reduced according to an arrangement that measures the value of cash deposited with the custodian by the fund. This amount, for the six months ended April 30, 2014, is shown as a reduction of total expenses in the Statement of Operations.
Tax Matters and Distributions – The fund intends to qualify as a regulated investment company, as defined under Subchapter M of the Internal Revenue Code, and to distribute all of its taxable income, including realized capital gains. As a result, no provision for federal income tax is required. The fund’s federal tax returns, when filed, will remain subject to examination by the Internal Revenue Service for a three year period. Management has analyzed the fund’s tax positions taken on federal and state tax returns for all open tax years and does not believe that there are any uncertain tax positions that require recognition of a tax liability. Foreign taxes, if any, have been accrued by the fund in the accompanying financial statements in accordance with the applicable foreign tax law. Foreign income taxes may be withheld by certain countries in which the fund invests. Additionally, capital gains realized by the fund on securities issued in or by certain foreign countries may be subject to capital gains tax imposed by those countries.
Distributions to shareholders are recorded on the ex-dividend date. Income and capital gain distributions are determined in accordance with income tax regulations, which may differ from U.S. generally accepted accounting principles. Certain capital accounts in the financial statements are periodically adjusted for permanent differences in order to reflect their tax character. These adjustments have no impact on net assets or net asset value per share. Temporary differences which arise from recognizing certain items of income, expense, gain or loss in different periods for financial statement and tax purposes will reverse at some time in the future. Distributions in excess of net investment income or net realized gains are temporary overdistributions for financial statement purposes resulting from differences in the recognition or classification of income or distributions for financial statement and tax purposes.
Book/tax differences primarily relate to wash sale loss deferrals and treating a portion of the proceeds from redemptions as a distribution for tax purposes.
28
Notes to Financial Statements (unaudited) – continued
The tax character of distributions made during the current period will be determined at fiscal year end. The tax character of distributions declared to shareholders for the last fiscal year is as follows:
| | | | |
| | | 10/31/13 | |
Ordinary income (including any
short-term capital gains) | | | $460,035 | |
The federal tax cost and the tax basis components of distributable earnings were as follows:
| | | | |
| As of 4/30/14 | | | |
| Cost of investments | | | $183,224,215 | |
| Gross appreciation | | | 59,196,282 | |
| Gross depreciation | | | (3,177,238 | ) |
| Net unrealized appreciation (depreciation) | | | $56,019,044 | |
| |
| As of 10/31/13 | | | |
| Undistributed ordinary income | | | 561,638 | |
| Undistributed long-term capital gain | | | 7,101,649 | |
| Other temporary differences | | | (24,835 | ) |
| Net unrealized appreciation (depreciation) | | | 49,842,697 | |
The aggregate cost above includes prior fiscal year end tax adjustments, if applicable.
Multiple Classes of Shares of Beneficial Interest – The fund offers multiple classes of shares, which differ in their respective distribution and service fees. The fund’s income, realized and unrealized gain (loss), and common expenses are allocated to shareholders based on the daily net assets of each class. Dividends are declared separately for each class. Differences in per share dividend rates are generally due to differences in separate class expenses. Class B shares will convert to Class A shares, approximately eight years after purchase. The fund’s distributions declared to shareholders as reported in the Statements of Changes in Net Assets are presented by class as follows:
| | | | | | | | | | | | | | | | |
| | | From net investment
income | | | From net realized gain on
investments | |
| | | Six months
ended
4/30/14 | | | Year
ended
10/31/13 | | | Six months
ended
4/30/14 | | | Year
ended
10/31/13 | |
| Class A | | | $492,259 | | | | $410,782 | | | | $5,737,527 | | | | $— | |
| Class B | | | — | | | | — | | | | 277,896 | | | | — | |
| Class C | | | — | | | | — | | | | 468,777 | | | | — | |
| Class I | | | 55,502 | | | | 39,439 | | | | 347,503 | | | | — | |
| Class R1 | | | — | | | | — | | | | 26,494 | | | | — | |
| Class R2 | | | 467 | | | | — | | | | 108,477 | | | | — | |
| Class R3 | | | 9,435 | | | | 8,165 | | | | 109,007 | | | | — | |
| Class R4 | | | 3,770 | | | | 1,649 | | | | 22,941 | | | | — | |
| Class R5 | | | 604 | | | | — | | | | 3,415 | | | | — | |
| Total | | | $562,037 | | | | $460,035 | | | | $7,102,037 | | | | $— | |
29
Notes to Financial Statements (unaudited) – continued
(3) Transactions with Affiliates
Investment Adviser – The fund has an investment advisory agreement with MFS to provide overall investment management and related administrative services and facilities to the fund. The management fee is computed daily and paid monthly at the following annual rates:
| | | | |
| First $1 billion of average daily net assets | | | 0.90 | % |
| Next $1 billion of average daily net assets | | | 0.75 | % |
| Average daily net assets in excess of $2 billion | | | 0.65 | % |
MFS has agreed in writing to reduce its management fee by a specified amount if certain MFS mutual fund assets exceed thresholds agreed to by MFS and the fund’s Board of Trustees. For the six months ended April 30, 2014, this management fee reduction amounted to $3,347 which is included in the reduction of total expenses in the Statement of Operations. The management fee incurred for the six months ended April 30, 2014 was equivalent to an annual effective rate of 0.90% of the fund’s average daily net assets.
Distributor – MFS Fund Distributors, Inc. (MFD), a wholly-owned subsidiary of MFS, as distributor, received $19,460 for the six months ended April 30, 2014, as its portion of the initial sales charge on sales of Class A shares of the fund.
The Board of Trustees has adopted a distribution plan for certain share classes pursuant to Rule 12b-1 of the Investment Company Act of 1940.
The fund’s distribution plan provides that the fund will pay MFD for services provided by MFD and financial intermediaries in connection with the distribution and servicing of certain share classes. One component of the plan is a distribution fee paid to MFD and another component of the plan is a service fee paid to MFD. MFD may subsequently pay all, or a portion, of the distribution and/or service fees to financial intermediaries.
Distribution Plan Fee Table:
| | | | | | | | | | | | | | | | | | | | |
| | | Distribution Fee Rate (d) | | | Service Fee Rate (d) | | | Total Distribution Plan (d) | | | Annual Effective Rate (e) | | | Distribution and Service Fee | |
| Class A | | | — | | | | 0.25% | | | | 0.25% | | | | 0.24% | | | | $231,452 | |
| Class B | | | 0.75% | | | | 0.25% | | | | 1.00% | | | | 1.00% | | | | 39,844 | |
| Class C | | | 0.75% | | | | 0.25% | | | | 1.00% | | | | 1.00% | | | | 67,501 | |
| Class R1 | | | 0.75% | | | | 0.25% | | | | 1.00% | | | | 1.00% | | | | 3,637 | |
| Class R2 | | | 0.25% | | | | 0.25% | | | | 0.50% | | | | 0.50% | | | | 8,354 | |
| Class R3 | | | — | | | | 0.25% | | | | 0.25% | | | | 0.25% | | | | 4,819 | |
| Total Distribution and Service Fees | | | | $355,607 | |
| (d) | In accordance with the distribution plan for certain classes, the fund pays distribution and/or service fees equal to these annual percentage rates of each class’s average daily net assets. The distribution and service fee rates disclosed by class represent the current rates in effect at the end of the reporting period. Any rate changes, if applicable, are detailed below. |
| (e) | The annual effective rates represent actual fees incurred under the distribution plan for the six months ended April 30, 2014 based on each class’s average daily net assets. MFD has voluntarily agreed to rebate a portion of each class’s 0.25% service fee attributable to accounts for which MFD retains the 0.25% service fee except for accounts attributable to MFS or its affiliates’ seed money. For the six months ended April 30, 2014, this rebate amounted to $7,094, $119, $223, and $45 for Class A, Class B, Class C and Class R3, respectively, and is included in the reduction of total expenses in the Statement of Operations. |
30
Notes to Financial Statements (unaudited) – continued
Certain Class A shares are subject to a contingent deferred sales charge (CDSC) in the event of a shareholder redemption within 18 months of purchase for shares purchased on or after August 1, 2012, and within 24 months of purchase for shares purchased prior to August 1, 2012. Class C shares are subject to a CDSC in the event of a shareholder redemption within 12 months of purchase. Class B shares are subject to a CDSC in the event of a shareholder redemption within six years of purchase. All contingent deferred sales charges are paid to MFD and during the six months ended April 30, 2014, were as follows:
| | | | |
| | | Amount | |
| Class A | | | $114 | |
| Class B | | | 4,068 | |
| Class C | | | 529 | |
Shareholder Servicing Agent – MFS Service Center, Inc. (MFSC), a wholly-owned subsidiary of MFS, receives a fee from the fund for its services as shareholder servicing agent calculated as a percentage of the average daily net assets of the fund as determined periodically under the supervision of the fund’s Board of Trustees. For the six months ended April 30, 2014, the fee was $56,361, which equated to 0.0496% annually of the fund’s average daily net assets. MFSC also receives payment from the fund for out-of-pocket expenses, sub-accounting and other shareholder servicing costs which may be paid to affiliated and unaffiliated service providers. Class R5 shares do not incur sub-accounting fees. For the six months ended April 30, 2014, these out-of-pocket expenses, sub-accounting and other shareholder servicing costs amounted to $116,030.
Administrator – MFS provides certain financial, legal, shareholder communications, compliance, and other administrative services to the fund. Under an administrative services agreement, the fund partially reimburses MFS the costs incurred to provide these services. The fund is charged an annual fixed amount of $17,500 plus a fee based on average daily net assets. The administrative services fee incurred for the six months ended April 30, 2014 was equivalent to an annual effective rate of 0.0166% of the fund’s average daily net assets.
Trustees’ and Officers’ Compensation – The fund pays compensation to independent Trustees in the form of a retainer, attendance fees, and additional compensation to Board and Committee chairpersons. The fund does not pay compensation directly to Trustees or officers of the fund who are also officers of the investment adviser, all of whom receive remuneration for their services to the fund from MFS. Certain officers and Trustees of the fund are officers or directors of MFS, MFD, and MFSC.
Prior to December 31, 2001, the fund had an unfunded defined benefit plan (“DB plan”) for independent Trustees. As of December 31, 2001, the Board took action to terminate the DB plan with respect to then-current and any future independent Trustees, such that the DB plan covers only certain of those former independent Trustees who retired on or before December 31, 2001. Effective January 1, 2002, accrued benefits under the DB plan for then-current independent Trustees who continued were credited to an unfunded retirement deferral plan (the “Retirement Deferral plan”), which was established for and exists solely with respect to these
31
Notes to Financial Statements (unaudited) – continued
credited amounts, and is not available for other deferrals by these or other independent Trustees. Although the Retirement Deferral plan is unfunded, amounts deferred under the plan are periodically adjusted for investment experience as if they had been invested in shares of the fund. The DB plan resulted in a pension expense of $176 and the Retirement Deferral plan resulted in an expense of $1,216. Both amounts are included in independent Trustees’ compensation for the six months ended April 30, 2014. The liability for deferred retirement benefits payable to certain independent Trustees under both plans amounted to $6,878 at April 30, 2014, and is included in “Payable for independent Trustees’ compensation” in the Statement of Assets and Liabilities.
Other – This fund and certain other funds managed by MFS (the funds) have entered into services agreements (the Agreements) which provide for payment of fees by the funds to Tarantino LLC and Griffin Compliance LLC in return for the provision of services of an Independent Chief Compliance Officer (ICCO) and Assistant ICCO, respectively, for the funds. The ICCO and Assistant ICCO are officers of the funds and the sole members of Tarantino LLC and Griffin Compliance LLC, respectively. The funds can terminate the Agreements with Tarantino LLC and Griffin Compliance LLC at any time under the terms of the Agreements. For the six months ended April 30, 2014, the aggregate fees paid by the fund to Tarantino LLC and Griffin Compliance LLC were $730 and are included in “Miscellaneous” expense in the Statement of Operations. MFS has agreed to reimburse the fund for a portion of the payments made by the fund in the amount of $165, which is included in the reduction of total expenses in the Statement of Operations. Additionally, MFS has agreed to bear all expenses associated with office space, other administrative support, and supplies provided to the ICCO and Assistant ICCO.
The fund invests in the MFS Institutional Money Market Portfolio which is managed by MFS and seeks current income consistent with preservation of capital and liquidity. Income earned on this investment is included in “Dividends from underlying affiliated funds” in the Statement of Operations. This money market fund does not pay a management fee to MFS.
At April 30, 2014, MFS held 100% of the outstanding shares of Class R5.
(4) Portfolio Securities
Purchases and sales of investments, other than short-term obligations, aggregated $29,415,206 and $36,061,299, respectively.
32
Notes to Financial Statements (unaudited) – continued
(5) Shares of Beneficial Interest
The fund’s Declaration of Trust permits the Trustees to issue an unlimited number of full and fractional shares of beneficial interest. Transactions in fund shares were as follows:
| | | | | | | | | | | | | | | | |
| | | Six months ended
4/30/14 | | | Year ended
10/31/13 (i) | |
| | | Shares | | | Amount | | | Shares | | | Amount | |
| Shares sold | | | | | | | | | | | | | | | | |
Class A | | | 203,821 | | | | $6,820,414 | | | | 437,447 | | | | $13,501,702 | |
Class B | | | 19,633 | | | | 601,282 | | | | 30,888 | | | | 862,407 | |
Class C | | | 33,692 | | | | 1,016,394 | | | | 53,381 | | | | 1,495,626 | |
Class I | | | 32,024 | | | | 1,095,024 | | | | 92,808 | | | | 2,894,986 | |
Class R1 | | | 943 | | | | 28,453 | | | | 9,672 | | | | 259,839 | |
Class R2 | | | 9,982 | | | | 327,874 | | | | 10,462 | | | | 310,656 | |
Class R3 | | | 24,267 | | | | 792,782 | | | | 16,228 | | | | 501,787 | |
Class R4 | | | 6,070 | | | | 205,888 | | | | 18,015 | | | | 583,883 | |
Class R5 | | | — | | | | — | | | | 3,248 | | | | 100,001 | |
| | | 330,432 | | | | $10,888,111 | | | | 672,149 | | | | $20,510,887 | |
| | | | |
Shares issued to shareholders in
reinvestment of distributions | | | | | | | | | | | | | | | | |
Class A | | | 178,622 | | | | $5,774,870 | | | | 13,195 | | | | $376,720 | |
Class B | | | 9,139 | | | | 269,222 | | | | — | | | | — | |
Class C | | | 12,727 | | | | 371,104 | | | | — | | | | — | |
Class I | | | 10,934 | | | | 360,292 | | | | 1,213 | | | | 35,254 | |
Class R1 | | | 910 | | | | 26,494 | | | | — | | | | — | |
Class R2 | | | 3,451 | | | | 108,944 | | | | — | | | | — | |
Class R3 | | | 3,679 | | | | 118,442 | | | | 287 | | | | 8,165 | |
Class R4 | | | 826 | | | | 26,710 | | | | 57 | | | | 1,649 | |
Class R5 | | | 122 | | | | 4,019 | | | | — | | | | — | |
| | | 220,410 | | | | $7,060,097 | | | | 14,752 | | | | $421,788 | |
| | | | |
| Shares reacquired | | | | | | | | | | | | | | | | |
Class A | | | (342,823 | ) | | | $(11,498,017 | ) | | | (763,418 | ) | | | $(23,241,161 | ) |
Class B | | | (44,737 | ) | | | (1,371,265 | ) | | | (83,260 | ) | | | (2,338,583 | ) |
Class C | | | (38,954 | ) | | | (1,165,989 | ) | | | (68,159 | ) | | | (1,892,731 | ) |
Class I | | | (18,009 | ) | | | (614,037 | ) | | | (29,400 | ) | | | (918,370 | ) |
Class R1 | | | (8,889 | ) | | | (270,685 | ) | | | (11,970 | ) | | | (337,847 | ) |
Class R2 | | | (14,734 | ) | | | (483,680 | ) | | | (29,842 | ) | | | (899,240 | ) |
Class R3 | | | (8,933 | ) | | | (294,182 | ) | | | (22,800 | ) | | | (701,804 | ) |
Class R4 | | | (7,814 | ) | | | (265,566 | ) | | | (937 | ) | | | (29,518 | ) |
| | | (484,893 | ) | | | $(15,963,421 | ) | | | (1,009,786 | ) | | | $(30,359,254 | ) |
33
Notes to Financial Statements (unaudited) – continued
| | | | | | | | | | | | | | | | |
| | | Six months ended
4/30/14 | | | Year ended
10/31/13 (i) | |
| | | Shares | | | Amount | | | Shares | | | Amount | |
| Net change | | | | | | | | | | | | | | | | |
Class A | | | 39,620 | | | | $1,097,267 | | | | (312,776 | ) | | | $(9,362,739 | ) |
Class B | | | (15,965 | ) | | | (500,761 | ) | | | (52,372 | ) | | | (1,476,176 | ) |
Class C | | | 7,465 | | | | 221,509 | | | | (14,778 | ) | | | (397,105 | ) |
Class I | | | 24,949 | | | | 841,279 | | | | 64,621 | | | | 2,011,870 | |
Class R1 | | | (7,036 | ) | | | (215,738 | ) | | | (2,298 | ) | | | (78,008 | ) |
Class R2 | | | (1,301 | ) | | | (46,862 | ) | | | (19,380 | ) | | | (588,584 | ) |
Class R3 | | | 19,013 | | | | 617,042 | | | | (6,285 | ) | | | (191,852 | ) |
Class R4 | | | (918 | ) | | | (32,968 | ) | | | 17,135 | | | | 556,014 | |
Class R5 | | | 122 | | | | 4,019 | | | | 3,248 | | | | 100,001 | |
| | | 65,949 | | | | $1,984,787 | | | | (322,885 | ) | | | $(9,426,579 | ) |
| (i) | For Class R5, the period is from inception, March 1, 2013, through the stated period end. |
(6) Line of Credit
The fund and certain other funds managed by MFS participate in a $1.1 billion unsecured committed line of credit, subject to a $1 billion sublimit, provided by a syndication of banks under a credit agreement. Borrowings may be made for temporary financing needs. Interest is charged to each fund, based on its borrowings, generally at a rate equal to the higher of the Federal Reserve funds rate or one month LIBOR plus an agreed upon spread. A commitment fee, based on the average daily, unused portion of the committed line of credit, is allocated among the participating funds at the end of each calendar quarter. In addition, the fund and other funds managed by MFS have established unsecured uncommitted borrowing arrangements with certain banks. Interest is charged to each fund, based on its borrowings, at a rate equal to the Federal Reserve funds rate plus an agreed upon spread. For the six months ended April 30, 2014, the fund’s commitment fee and interest expense were $481 and $0, respectively, and are included in “Miscellaneous” expense in the Statement of Operations.
(7) Transactions in Underlying Affiliated Funds-Affiliated Issuers
An affiliated issuer may be considered one in which the fund owns 5% or more of the outstanding voting securities, or a company which is under common control. For the purposes of this report, the fund assumes the following to be an affiliated issuer:
| | | | | | | | | | | | | | | | |
| Underlying Affiliated Fund | | Beginning Shares/Par Amount | | | Acquisitions Shares/Par Amount | | | Dispositions Shares/Par Amount | | | Ending Shares/Par Amount | |
MFS Institutional Money
Market Portfolio | | | 2,047,635 | | | | 14,990,423 | | | | (15,392,692 | ) | | | 1,645,366 | |
| | | | |
| Underlying Affiliated Fund | | Realized Gain (Loss) | | | Capital Gain Distributions | | | Dividend Income | | | Ending Value | |
MFS Institutional Money
Market Portfolio | | | $— | | | | $— | | | | $609 | | | | $1,645,366 | |
34
BOARD REVIEW OF INVESTMENT ADVISORY AGREEMENT
A discussion regarding the Board’s most recent review and renewal of the fund’s Investment Advisory Agreement with MFS is available by clicking on the fund’s name under “Mutual Funds” in the “Products” section of the MFS Web site (mfs.com).
PROXY VOTING POLICIES AND INFORMATION
MFS votes proxies on behalf of the fund pursuant to proxy voting policies and procedures that are available without charge, upon request, by calling 1-800-225-2606, by visiting the Proxy Voting section of mfs.com or by visiting the SEC’s Web site at http://www.sec.gov.
Information regarding how the fund voted proxies relating to portfolio securities during the twelve-month period ended June 30, 2013 is available without charge by visiting the Proxy Voting section of mfs.com or by visiting the SEC’s Web site at http://www.sec.gov.
QUARTERLY PORTFOLIO DISCLOSURE
The fund will file a complete schedule of portfolio holdings with the Securities and Exchange Commission (the Commission) for the first and third quarters of each fiscal year on Form N-Q. A shareholder can obtain the quarterly portfolio holdings report at mfs.com. The fund’s Form N-Q is also available on the EDGAR database on the Commission’s Internet Web site at http://www.sec.gov, and may be reviewed and copied at the:
Public Reference Room
Securities and Exchange Commission
100 F Street, NE, Room 1580
Washington, D.C. 20549
Information on the operation of the Public Reference Room may be obtained by calling the Commission at 1-800-SEC-0330. Copies of the fund’s Form N-Q also may be obtained, upon payment of a duplicating fee, by electronic request at the following e-mail address: publicinfo@sec.gov, or by writing the Public Reference Section at the above address.
FURTHER INFORMATION
From time to time, MFS may post important information about the fund or the MFS funds on the MFS web site (mfs.com). This information is available by visiting the “Commentary & Announcements” and “Market Outlooks” sections of mfs.com or by clicking on the fund’s name under “Mutual Funds” in the “Products” section of mfs.com.
PROVISION OF FINANCIAL REPORTS AND SUMMARY PROSPECTUSES
The fund produces financial reports every six months and updates its summary prospectus and prospectus annually. To avoid sending duplicate copies of materials to households, only one copy of the fund’s annual and semiannual report and summary prospectus may be mailed to shareholders having the same last name and residential address on the fund’s records. However, any shareholder may contact MFSC (please see back cover for address and telephone number) to request that copies of these reports and summary prospectuses be sent personally to that shareholder.
35
Save paper with eDelivery.

| MFS® will send you prospectuses, |
reports, and proxies directly via e-mail so you will get information faster with less mailbox clutter.
To sign up:
1. Go to mfs.com.
2. Log in via MFS® Access.
3. Select eDelivery.
If you own your MFS fund shares through a financial institution or a retirement plan, MFS® TALK, MFS® Access, or eDelivery may not be available to you.
CONTACT
WEB SITE
mfs.com
MFS TALK
1-800-637-8255
24 hours a day
ACCOUNT SERVICE AND LITERATURE
Shareholders
1-800-225-2606
Financial advisors
1-800-343-2829
Retirement plan services
1-800-637-1255
MAILING ADDRESS
MFS Service Center, Inc.
P.O. Box 55824
Boston, MA 02205-5824
OVERNIGHT MAIL
MFS Service Center, Inc.
c/o Boston Financial Data Services
30 Dan Road
Canton, MA 02021-2809
SEMIANNUAL REPORT
April 30, 2014

MFS® STRATEGIC INCOME FUND

MFO-SEM
MFS® STRATEGIC INCOME FUND
CONTENTS
The report is prepared for the general information of shareholders. It is authorized for distribution to prospective investors only when preceded or accompanied by a current prospectus.
NOT FDIC INSURED Ÿ MAY LOSE VALUE Ÿ NO BANK GUARANTEE

LETTER FROM THE CHAIRMAN AND CEO
Dear Shareholders:
After gaining momentum late last year, the U.S. economy slipped this winter, as severe weather curtailed activity. More recently, however, labor market data, consumer
confidence, retail sales and industrial output have indicated that the U.S. economy could be regaining traction.
Europe emerged from its recession midway through 2013. However, its pace of growth has been slow, high unemployment persists and the risk of deflation exists. Asia remains vulnerable. China’s economic growth has slowed, and Japan’s early progress toward an economic turnaround continues to face obstacles. Emerging markets have also displayed much higher volatility, affected by the early transition from aggressive central bank monetary easing.
With so much uncertainty, global financial markets began 2014 with much greater volatility than last year’s broad-based rally. For equity investors, attention to company fundamentals has taken on more importance. Bond investors have been attuned to heightened risks from possible interest rate increases.
As always at MFS®, active risk management is an integral part of how we manage your investments. We use a collaborative process, sharing insights across asset classes, regions and economic sectors. Our global team of investment professionals uses a multidisciplined, long-term, diversified investment approach.
We understand that these are challenging economic times. We believe that we can serve you best by applying proven principles, such as asset allocation and diversification, over the long term. We are confident that this approach can serve you well as you work with your financial advisors to reach your goals in the years ahead.
Respectfully,

Robert J. Manning
Chairman and Chief Executive Officer
MFS Investment Management
June 13, 2014
The opinions expressed in this letter are subject to change, may not be relied upon for investment advice, and no forecasts can be guaranteed.
1
PORTFOLIO COMPOSITION
Portfolio structure (i)
| | | | |
| Fixed income sectors (i) | | | | |
| High Grade Corporates | | | 45.1% | |
| High Yield Corporates | | | 32.8% | |
| Non-U.S. Government Bonds | | | 10.4% | |
| Emerging Markets Bonds | | | 6.6% | |
| Floating Rate Loans | | | 0.8% | |
| Commercial Mortgage-Backed Securities | | | 0.7% | |
| Mortgage-Backed Securities | | | 0.7% | |
| Asset-Backed Securities | | | 0.4% | |
| Municipal Bonds | | | 0.3% | |
| Collateralized Debt Obligations | | | 0.2% | |
| U.S. Government Agencies | | | 0.1% | |
| U.S. Treasury Securities | | | (8.7)% | |
| | | | |
| Composition including fixed income credit quality (a)(i) | |
| AAA | | | 2.6% | |
| AA | | | 3.7% | |
| A | | | 18.0% | |
| BBB | | | 36.3% | |
| BB | | | 15.1% | |
| B | | | 16.3% | |
| CCC | | | 4.7% | |
| CC (o) | | | 0.0% | |
| C | | | 0.1% | |
| Federal Agencies | | | 0.8% | |
| Not Rated | | | (8.2)% | |
| Non-Fixed Income | | | 0.3% | |
| Cash & Other | | | 10.3% | |
|
| Issuer country weightings (i)(x) | |
| United States | | | 65.1% | |
| United Kingdom | | | 3.5% | |
| France | | | 3.1% | |
| Italy | | | 2.9% | |
| Canada | | | 2.8% | |
| Netherlands | | | 2.7% | |
| Japan | | | 2.0% | |
| Australia | | | 1.6% | |
| Germany | | | 1.3% | |
| Other Countries | | | 15.0% | |
| |
| Portfolio facts (i) | | | | |
| Average Duration (d) | | | 4.5 | |
| Average Effective Maturity (m) | | | 7.2 yrs. | |
2
Portfolio Composition – continued
| (a) | For all securities other than those specifically described below, ratings are assigned to underlying securities utilizing ratings from Moody’s, Fitch, and Standard & Poor’s rating agencies and applying the following hierarchy: If all three agencies provide a rating, the middle rating (after dropping the highest and lowest ratings) is assigned; if two of the three agencies rate a security, the lower of the two is assigned. Ratings are shown in the S&P and Fitch scale (e.g., AAA). Securities rated BBB or higher are considered investment grade. All ratings are subject to change. Federal Agencies includes rated and unrated U.S. Agency fixed-income securities, U.S. Agency mortgage-backed securities, and collateralized mortgage obligations of U.S. Agency mortgage-backed securities. Not Rated includes fixed income securities, including fixed income futures contracts, which have not been rated by any rating agency. Non-Fixed Income includes equity securities (including convertible bonds and equity derivatives) and commodities. The fund may not hold all of these instruments. The fund is not rated by these agencies. |
| (d) | Duration is a measure of how much a bond’s price is likely to fluctuate with general changes in interest rates, e.g., if rates rise 1.00%, a bond with a 5-year duration is likely to lose about 5.00% of its value due to the interest rate move. |
| (i) | For purposes of this presentation, the components include the market value of securities, and reflect the impact of the equivalent exposure of derivative positions, if any. These amounts may be negative from time to time. Equivalent exposure is a calculated amount that translates the derivative position into a reasonable approximation of the amount of the underlying asset that the portfolio would have to hold at a given point in time to have the same price sensitivity that results from the portfolio’s ownership of the derivative contract. When dealing with derivatives, equivalent exposure is a more representative measure of the potential impact of a position on portfolio performance than market value. The bond component will include any accrued interest amounts. |
| (m) | In determining an instrument’s effective maturity for purposes of calculating the fund’s dollar-weighted average effective maturity, MFS uses the instrument’s stated maturity or, if applicable, an earlier date on which MFS believes it is probable that a maturity-shortening device (such as a put, pre-refunding or prepayment) will cause the instrument to be repaid. Such an earlier date can be substantially shorter than the instrument’s stated maturity. |
| (x) | Represents the portfolio’s exposure to issuer countries as a percentage of a portfolio’s net assets. For purposes of this presentation, United States includes Cash & Other. |
Where the fund holds convertible bonds, these are treated as part of the equity portion of the portfolio.
The fund invests a portion of its assets in the MFS High Yield Pooled Portfolio. Percentages reflect exposure to the underlying holdings of the MFS High Yield Pooled Portfolio and not to the exposure from investing directly in the MFS High Yield Pooled Portfolio itself.
Cash & Other includes cash, other assets less liabilities, offsets to derivative positions, and short-term securities.
Percentages are based on net assets as of 4/30/14.
The portfolio is actively managed and current holdings may be different.
3
EXPENSE TABLE
Fund expenses borne by the shareholders during the period,
November 1, 2013 through April 30, 2014
As a shareholder of the fund, you incur two types of costs: (1) transaction costs, including sales charges (loads) on certain purchase or redemption payments, and (2) ongoing costs, including management fees; distribution and service (12b-1) fees; and other fund expenses. This example is intended to help you understand your ongoing costs (in dollars) of investing in the fund and to compare these costs with the ongoing costs of investing in other mutual funds.
In addition to the fees and expenses which the fund bears directly, the fund indirectly bears a pro rata share of the fees and expenses of the underlying MFS Pooled Portfolio in which the fund invests. MFS Pooled Portfolios are mutual funds advised by MFS that do not pay management fees to MFS but do incur investment and operating costs. If these transactional and indirect costs were included, your costs would have been higher.
The example is based on an investment of $1,000 invested at the beginning of the period and held for the entire period November 1, 2013 through April 30, 2014.
Actual Expenses
The first line for each share class in the following table provides information about actual account values and actual expenses. You may use the information in this line, together with the amount you invested, to estimate the expenses that you paid over the period. Simply divide your account value by $1,000 (for example, an $8,600 account value divided by $1,000 = 8.6), then multiply the result by the number in the first line under the heading entitled “Expenses Paid During Period” to estimate the expenses you paid on your account during this period.
Hypothetical Example for Comparison Purposes
The second line for each share class in the following table provides information about hypothetical account values and hypothetical expenses based on the fund’s actual expense ratio and an assumed rate of return of 5% per year before expenses, which is not the fund’s actual return. The hypothetical account values and expenses may not be used to estimate the actual ending account balance or expenses you paid for the period. You may use this information to compare the ongoing costs of investing in the fund and other funds. To do so, compare this 5% hypothetical example with the 5% hypothetical examples that appear in the shareholder reports of the other funds.
Please note that the expenses shown in the table are meant to highlight your ongoing costs only and do not reflect any transactional costs, such as sales charges (loads). Therefore, the second line for each share class in the table is useful in comparing ongoing costs only, and will not help you determine the relative total costs of owning different funds. In addition, if these transactional costs were included, your costs would have been higher.
4
Expense Table – continued
| | | | | | | | | | | | | | | | | | |
Share
Class | | | | Annualized
Expense Ratio | | | Beginning
Account Value
11/01/13 | | | Ending Account Value
4/30/14 | | | Expenses Paid During Period (p) 11/01/13-4/30/14 | |
| A | | Actual | | | 1.05% | | | | $1,000.00 | | | | $1,031.55 | | | | $5.29 | |
| | Hypothetical (h) | | | 1.05% | | | | $1,000.00 | | | | $1,019.59 | | | | $5.26 | |
| B | | Actual | | | 1.80% | | | | $1,000.00 | | | | $1,027.77 | | | | $9.05 | |
| | Hypothetical (h) | | | 1.80% | | | | $1,000.00 | | | | $1,015.87 | | | | $9.00 | |
| C | | Actual | | | 1.80% | | | | $1,000.00 | | | | $1,027.80 | | | | $9.05 | |
| | Hypothetical (h) | | | 1.80% | | | | $1,000.00 | | | | $1,015.87 | | | | $9.00 | |
| I | | Actual | | | 0.80% | | | | $1,000.00 | | | | $1,032.82 | | | | $4.03 | |
| | Hypothetical (h) | | | 0.80% | | | | $1,000.00 | | | | $1,020.83 | | | | $4.01 | |
| (h) | 5% class return per year before expenses. |
| (p) | “Expenses Paid During Period” are equal to each class’s annualized expense ratio, as shown above, multiplied by the average account value over the period, multiplied by 181/365 (to reflect the one-half year period). Expenses paid do not include any applicable sales charges (loads). If these transaction costs had been included, your costs would have been higher. In addition to the fees and expenses which the fund bears directly, the fund indirectly bears a pro rata share of the fees and expenses of the underlying funds in which the fund invests. If these indirect costs were included, your costs would have been higher. |
5
PORTFOLIO OF INVESTMENTS
4/30/14 (unaudited)
The Portfolio of Investments is a complete list of all securities owned by your fund. It is categorized by broad-based asset classes.
| | | | | | | | |
| Bonds - 63.7% | | | | | | | | |
| Issuer | | Shares/Par | | | Value ($) | |
| | | | | | | | |
| Asset-Backed & Securitized - 1.2% | | | | | | | | |
| Bayview Financial Revolving Mortgage Loan Trust, FRN, 1.752%, 12/28/40 (z) | | $ | 405,329 | | | $ | 268,221 | |
| Capital Trust Realty Ltd., CDO, 5.16%, 6/25/35 (n) | | | 20,047 | | | | 20,583 | |
| Credit Suisse Commercial Mortgage Trust, “A4”, FRN, 6.053%, 9/15/39 | | | 638,126 | | | | 697,860 | |
| Crest Ltd., CDO, 7%, 1/28/40 (a)(p) | | | 527,972 | | | | 26,399 | |
| Falcon Franchise Loan LLC, FRN, 11.062%, 1/05/23 (i)(z) | | | 517,665 | | | | 43,587 | |
| Falcon Franchise Loan LLC, FRN, 14.914%, 1/05/25 (i)(z) | | | 228,660 | | | | 73,171 | |
| First Union-Lehman Brothers Bank of America, FRN, 0.706%, 11/18/35 (i) | | | 4,269,014 | | | | 80,134 | |
| HLSS Servicer Advance Receivables Trust, 2013-T1, “A2”, 1.495%, 1/16/46 (n) | | | 970,000 | | | | 969,224 | |
| JPMorgan Chase Commercial Mortgage Trust, 2007-LD11, “AM”, FRN, 5.989%, 6/15/49 | | | 1,280,263 | | | | 1,343,806 | |
| KKR Financial CLO Ltd., “C”, FRN, 1.685%, 5/15/21 (n) | | | 523,730 | | | | 507,515 | |
| Morgan Stanley Capital I, Inc., FRN, 1.412%, 4/28/39 (i)(z) | | | 2,484,327 | | | | 15,552 | |
| | | | | | | | |
| | | | | | | $ | 4,046,052 | |
| Automotive - 0.7% | | | | | | | | |
| Daimler Finance North America LLC, 1.875%, 1/11/18 (n) | | $ | 1,257,000 | | | $ | 1,262,093 | |
| Delphi Corp., 5%, 2/15/23 | | | 152,000 | | | | 161,120 | |
| TRW Automotive, Inc., 4.45%, 12/01/23 (n) | | | 797,000 | | | | 812,940 | |
| | | | | | | | |
| | | | | | | $ | 2,236,153 | |
| Biotechnology - 0.3% | | | | | | | | |
| Life Technologies Corp., 6%, 3/01/20 | | $ | 960,000 | | | $ | 1,113,834 | |
| | |
| Broadcasting - 0.6% | | | | | | | | |
| CBS Corp., 5.75%, 4/15/20 | | $ | 260,000 | | | $ | 299,250 | |
| Globo Comunicacoes e Participacoes S.A., 6.25% to 7/20/15, 9.375% to 12/31/49 (n) | | | 100,000 | | | | 104,625 | |
| Myriad International Holdings B.V., 6%, 7/18/20 (n) | | | 524,000 | | | | 572,470 | |
| News America, Inc., 8.5%, 2/23/25 | | | 415,000 | | | | 546,588 | |
| SES Global Americas Holdings GP, 2.5%, 3/25/19 (n) | | | 410,000 | | | | 410,358 | |
| | | | | | | | |
| | | | | | | $ | 1,933,291 | |
| Brokerage & Asset Managers - 0.9% | | | | | | | | |
| Affiliated Managers Group, Inc., 4.25%, 2/15/24 | | $ | 742,000 | | | $ | 755,179 | |
| Blackstone Holdings Finance Co. LLC, 4.75%, 2/15/23 (n) | | | 940,000 | | | | 1,009,870 | |
6
Portfolio of Investments (unaudited) – continued
| | | | | | | | |
| Issuer | | Shares/Par | | | Value ($) | |
| | | | | | | | |
| Bonds - continued | | | | | | | | |
| Brokerage & Asset Managers - continued | | | | | | | | |
| TD Ameritrade Holding Corp., 5.6%, 12/01/19 | | $ | 1,045,000 | | | $ | 1,213,649 | |
| | | | | | | | |
| | | | | | | $ | 2,978,698 | |
| Building - 0.3% | | | | | | | | |
| CRH PLC, 8.125%, 7/15/18 | | $ | 590,000 | | | $ | 725,027 | |
| Owens Corning, Inc., 4.2%, 12/15/22 | | | 385,000 | | | | 383,947 | |
| | | | | | | | |
| | | | | | | $ | 1,108,974 | |
| Business Services - 0.2% | | | | | | | | |
| Tencent Holdings Ltd., 3.375%, 3/05/18 (n) | | $ | 290,000 | | | $ | 295,795 | |
| Tencent Holdings Ltd., 3.375%, 5/02/19 (z) | | | 200,000 | | | | 201,044 | |
| | | | | | | | |
| | | | | | | $ | 496,839 | |
| Cable TV - 1.0% | | | | | | | | |
| Cox Communications, Inc., 3.25%, 12/15/22 (n) | | $ | 1,138,000 | | | $ | 1,103,142 | |
| DIRECTV Holdings LLC, 5.875%, 10/01/19 | | | 370,000 | | | | 425,481 | |
| NBCUniversal Enterprise, Inc., 1.974%, 4/15/19 (n) | | | 618,000 | | | | 607,759 | |
| Time Warner Cable, Inc., 8.25%, 4/01/19 | | | 920,000 | | | | 1,165,165 | |
| | | | | | | | |
| | | | | | | $ | 3,301,547 | |
| Chemicals - 0.7% | | | | | | | | |
| Dow Chemical Co., 8.55%, 5/15/19 | | $ | 1,410,000 | | | $ | 1,807,545 | |
| Sociedad Quimica y Minera de Chile S.A., 5.5%, 4/21/20 (n) | | | 347,000 | | | | 375,684 | |
| | | | | | | | |
| | | | | | | $ | 2,183,229 | |
| Computer Software - 0.2% | | | | | | | | |
| Oracle Corp., 5.375%, 7/15/40 | | $ | 607,000 | | | $ | 698,378 | |
| | |
| Computer Software - Systems - 0.1% | | | | | | | | |
| Seagate HDD Cayman, 3.75%, 11/15/18 (n) | | $ | 416,000 | | | $ | 430,560 | |
| | |
| Conglomerates - 0.1% | | | | | | | | |
| Metalloinvest Finance Ltd., 5.625%, 4/17/20 (n) | | $ | 207,000 | | | $ | 184,748 | |
| | |
| Consumer Products - 0.4% | | | | | | | | |
| Mattel, Inc., 5.45%, 11/01/41 | | $ | 436,000 | | | $ | 464,843 | |
| Newell Rubbermaid, Inc., 4.7%, 8/15/20 | | | 796,000 | | | | 850,274 | |
| | | | | | | | |
| | | | | | | $ | 1,315,117 | |
| Consumer Services - 0.1% | | | | | | | | |
| Experian Finance PLC, 2.375%, 6/15/17 (n) | | $ | 353,000 | | | $ | 358,323 | |
7
Portfolio of Investments (unaudited) – continued
| | | | | | | | |
| Issuer | | Shares/Par | | | Value ($) | |
| | | | | | | | |
| Bonds - continued | | | | | | | | |
| Defense Electronics - 0.6% | | | | | | | | |
| BAE Systems Holdings, Inc., 5.2%, 8/15/15 (n) | | $ | 1,297,000 | | | $ | 1,364,807 | |
| BAE Systems Holdings, Inc., 6.375%, 6/01/19 (n) | | | 380,000 | | | | 438,359 | |
| | | | | | | | |
| | | | | | | $ | 1,803,166 | |
| Electrical Equipment - 0.3% | | | | | | | | |
| Arrow Electronics, Inc., 3%, 3/01/18 | | $ | 344,000 | | | $ | 352,748 | |
| Ericsson, Inc., 4.125%, 5/15/22 | | | 670,000 | | | | 690,661 | |
| | | | | | | | |
| | | | | | | $ | 1,043,409 | |
| Electronics - 0.3% | | | | | | | | |
| Tyco Electronics Group S.A., 3.5%, 2/03/22 | | $ | 275,000 | | | $ | 276,704 | |
| Xilinx, Inc., 3%, 3/15/21 | | | 830,000 | | | | 833,684 | |
| | | | | | | | |
| | | | | | | $ | 1,110,388 | |
| Emerging Market Quasi-Sovereign - 1.9% | | | | | | | | |
| Banco de Reservas de la Republica Dominicana, 7%, 2/01/23 (n) | | $ | 218,000 | | | $ | 209,553 | |
| CNOOC Finance (2012) Ltd., 3.875%, 5/02/22 (n) | | | 204,000 | | | | 201,614 | |
| CNPC (HK) Overseas Capital Ltd., 4.5%, 4/28/21 (n) | | | 494,000 | | | | 518,184 | |
| Comision Federal de Electricidad, 5.75%, 2/14/42 (n) | | | 639,000 | | | | 635,006 | |
| Gaz Capital S.A., 4.95%, 2/06/28 (n) | | | 615,000 | | | | 502,763 | |
| Instituto Costarricense, 6.375%, 5/15/43 (n) | | | 208,000 | | | | 172,900 | |
| Korea Gas Corp., 2.25%, 7/25/17 (n) | | | 700,000 | | | | 709,188 | |
| Pertamina PT, 6%, 5/03/42 (n) | | | 201,000 | | | | 179,393 | |
| Petroleos Mexicanos, 5.5%, 1/21/21 | | | 542,000 | | | | 593,490 | |
| Petroleos Mexicanos, 4.875%, 1/24/22 | | | 344,000 | | | | 361,114 | |
| Petroleos Mexicanos, 4.875%, 1/18/24 (n) | | | 53,000 | | | | 54,842 | |
| Petroleos Mexicanos, 6.5%, 6/02/41 | | | 292,000 | | | | 324,120 | |
| PT Perusahaan Listrik Negara, 5.5%, 11/22/21 (n) | | | 200,000 | | | | 203,250 | |
| Ras Laffan Liquefied Natural Gas Co. Ltd., 5.832%, 9/30/16 (n) | | | 398,720 | | | | 423,640 | |
| Sinopec Capital (2013) Ltd., 3.125%, 4/24/23 (n) | | | 518,000 | | | | 479,755 | |
| Sinopec Capital (2013) Ltd., 4.25%, 4/24/43 (n) | | | 426,000 | | | | 380,323 | |
| Sinopec Group Overseas Development (2012) Ltd., 3.9%, 5/17/22 (n) | | | 200,000 | | | | 198,395 | |
| | | | | | | | |
| | | | | | | $ | 6,147,530 | |
| Emerging Market Sovereign - 0.7% | | | | | | | | |
| Oriental Republic of Uruguay, 4.5%, 8/14/24 | | $ | 86,000 | | | $ | 88,688 | |
| Republic of Colombia, 6.125%, 1/18/41 | | | 210,000 | | | | 239,400 | |
| Republic of Hungary, 5.375%, 2/21/23 | | | 82,000 | | | | 85,588 | |
| Republic of Indonesia, 4.875%, 5/05/21 (n) | | | 200,000 | | | | 206,250 | |
| Republic of Philippines, 5.5%, 3/30/26 | | | 200,000 | | | | 227,000 | |
| Republic of Philippines, 6.375%, 10/23/34 | | | 300,000 | | | | 375,750 | |
| Republic of Romania, 4.375%, 8/22/23 (n) | | | 60,000 | | | | 60,750 | |
| Republic of Romania, 4.875%, 1/22/24 (n) | | | 58,000 | | | | 60,900 | |
| Republic of Slovakia, 4.375%, 5/21/22 (n) | | | 600,000 | | | | 632,682 | |
8
Portfolio of Investments (unaudited) – continued
| | | | | | | | |
| Issuer | | Shares/Par | | | Value ($) | |
| | | | | | | | |
| Bonds - continued | | | | | | | | |
| Emerging Market Sovereign - continued | | | | | | | | |
| Russian Federation, 4.875%, 9/16/23 (n) | | $ | 200,000 | | | $ | 189,750 | |
| Russian Federation, 5.625%, 4/04/42 (n) | | | 200,000 | | | | 184,000 | |
| | | | | | | | |
| | | | | | | $ | 2,350,758 | |
| Energy - Independent - 0.2% | | | | | | | | |
| EQT Corp., 4.875%, 11/15/21 | | $ | 431,000 | | | $ | 461,439 | |
| Hess Corp., 8.125%, 2/15/19 | | | 270,000 | | | | 340,054 | |
| | | | | | | | |
| | | | | | | $ | 801,493 | |
| Energy - Integrated - 1.2% | | | | | | | | |
| BP Capital Markets PLC, 4.5%, 10/01/20 | | $ | 272,000 | | | $ | 299,933 | |
| BP Capital Markets PLC, 4.742%, 3/11/21 | | | 760,000 | | | | 845,992 | |
| LUKOIL International Finance B.V., 3.416%, 4/24/18 (n) | | | 571,000 | | | | 536,883 | |
| LUKOIL International Finance B.V., 4.563%, 4/24/23 (n) | | | 784,000 | | | | 686,000 | |
| Pacific Rubiales Energy Corp., 7.25%, 12/12/21 (n) | | | 401,000 | | | | 438,093 | |
| Pacific Rubiales Energy Corp., 5.125%, 3/28/23 (n) | | | 100,000 | | | | 96,625 | |
| Petro-Canada Financial Partnership, 5%, 11/15/14 | | | 860,000 | | | | 880,004 | |
| | | | | | | | |
| | | | | | | $ | 3,783,530 | |
| Financial Institutions - 1.7% | | | | | | | | |
| CIT Group, Inc., 3.875%, 2/19/19 | | $ | 1,940,000 | | | $ | 1,961,825 | |
| General Electric Capital Corp., 6%, 8/07/19 | | | 300,000 | | | | 353,979 | |
| General Electric Capital Corp., 5.5%, 1/08/20 | | | 710,000 | | | | 819,147 | |
| General Electric Capital Corp., 3.15%, 9/07/22 | | | 813,000 | | | | 813,113 | |
| General Electric Capital Corp., 3.1%, 1/09/23 | | | 508,000 | | | | 502,730 | |
| LeasePlan Corp. N.V., 3%, 10/23/17 (n) | | | 870,000 | | | | 888,105 | |
| LeasePlan Corp. N.V., 2.5%, 5/16/18 (n) | | | 286,000 | | | | 285,499 | |
| | | | | | | | |
| | | | | | | $ | 5,624,398 | |
| Food & Beverages - 2.9% | | | | | | | | |
| Anadolu Efes Biracilik ve Malt Sanayii A.S., 3.375%, 11/01/22 | | $ | 956,000 | | | $ | 822,160 | |
| BRF S.A., 3.95%, 5/22/23 (n) | | | 994,000 | | | | 911,995 | |
| Conagra Foods, Inc., 3.2%, 1/25/23 | | | 743,000 | | | | 716,693 | |
| Embotelladora Andina S.A., 5%, 10/01/23 (n) | | | 200,000 | | | | 212,355 | |
| Grupo Bimbo S.A.B. de C.V., 4.5%, 1/25/22 (n) | | | 101,000 | | | | 104,676 | |
| Kerry Group Financial Services, 3.2%, 4/09/23 (n) | | | 1,400,000 | | | | 1,312,790 | |
| Kraft Foods Group, Inc., 6.125%, 8/23/18 | | | 720,000 | | | | 842,391 | |
| Mead Johnson Nutrition Co., “A”, 4.9%, 11/01/19 | | | 263,000 | | | | 290,487 | |
| Pernod Ricard S.A., 5.75%, 4/07/21 (n) | | | 594,000 | | | | 677,954 | |
| SABMiller Holdings, Inc., 3.75%, 1/15/22 (n) | | | 904,000 | | | | 933,418 | |
| Tyson Foods, Inc., 6.6%, 4/01/16 | | | 560,000 | | | | 616,030 | |
| Tyson Foods, Inc., 4.5%, 6/15/22 | | | 448,000 | | | | 474,208 | |
| Wm. Wrigley Jr. Co., 2.4%, 10/21/18 (n) | | | 343,000 | | | | 347,562 | |
| Wm. Wrigley Jr. Co., 3.375%, 10/21/20 (n) | | | 1,051,000 | | | | 1,080,798 | |
| | | | | | | | |
| | | | | | | $ | 9,343,517 | |
9
Portfolio of Investments (unaudited) – continued
| | | | | | | | |
| Issuer | | Shares/Par | | | Value ($) | |
| | | | | | | | |
| Bonds - continued | | | | | | | | |
| Forest & Paper Products - 0.3% | | | | | | | | |
| Georgia-Pacific LLC, 3.734%, 7/15/23 (n) | | $ | 1,092,000 | | | $ | 1,097,562 | |
| | |
| Gaming & Lodging - 0.5% | | | | | | | | |
| Wyndham Worldwide Corp., 5.625%, 3/01/21 | | $ | 1,360,000 | | | $ | 1,490,923 | |
| | |
| Industrial - 0.2% | | | | | | | | |
| Johns Hopkins University, 5.25%, 7/01/19 | | $ | 587,000 | | | $ | 666,719 | |
| | |
| Insurance - 2.3% | | | | | | | | |
| American International Group, Inc., 3%, 3/20/15 | | $ | 20,000 | | | $ | 20,439 | |
| American International Group, Inc., 5.85%, 1/16/18 | | | 881,000 | | | | 1,005,647 | |
| American International Group, Inc., 3.375%, 8/15/20 | | | 810,000 | | | | 838,480 | |
| MetLife, Inc., 1.756%, 12/15/17 | | | 223,000 | | | | 224,896 | |
| Metropolitan Life Global Funding I, 5.125%, 6/10/14 (n) | | | 430,000 | | | | 432,027 | |
| Principal Financial Group, Inc., 8.875%, 5/15/19 | | | 650,000 | | | | 829,752 | |
| Prudential Financial, Inc., 6.2%, 1/15/15 | | | 660,000 | | | | 686,116 | |
| Unum Group, 7.125%, 9/30/16 | | | 945,000 | | | | 1,075,797 | |
| Unum Group, 4%, 3/15/24 | | | 1,384,000 | | | | 1,405,654 | |
| Voya Financial, Inc., 2.9%, 2/15/18 | | | 403,000 | | | | 415,820 | |
| Voya Financial, Inc., 5.7%, 7/15/43 | | | 506,000 | | | | 585,824 | |
| | | | | | | | |
| | | | $ | 7,520,452 | |
| Insurance - Property & Casualty - 2.2% | | | | | | | | |
| Aon Corp., 3.5%, 9/30/15 | | $ | 760,000 | | | $ | 788,473 | |
| AXIS Capital Holdings Ltd., 5.75%, 12/01/14 | | | 1,035,000 | | | | 1,066,069 | |
| AXIS Capital Holdings Ltd., 5.875%, 6/01/20 | | | 370,000 | | | | 422,013 | |
| AXIS Specialty Finance LLC, 2.65%, 4/01/19 | | | 141,000 | | | | 141,638 | |
| CNA Financial Corp., 5.875%, 8/15/20 | | | 990,000 | | | | 1,151,056 | |
| Liberty Mutual Group, Inc., 4.95%, 5/01/22 (n) | | | 757,000 | | | | 816,620 | |
| PartnerRe Ltd., 5.5%, 6/01/20 | | | 583,000 | | | | 647,934 | |
| QBE Capital Funding III Ltd., FRN, 7.25%, 5/24/41 (n) | | | 920,000 | | | | 986,700 | |
| ZFS Finance USA Trust V, 6.5% to 5/09/17, FRN to 5/09/67 (n) | | | 1,095,000 | | | | 1,174,388 | |
| | | | | | | | |
| | | | | | | $ | 7,194,891 | |
| International Market Quasi-Sovereign - 1.3% | | | | | | | | |
| EDF Energies Nouvelles S.A., 6.5%, 1/26/19 (n) | | $ | 1,090,000 | | | $ | 1,297,547 | |
| Eksportfinans A.S.A., 5.5%, 5/25/16 | | | 965,000 | | | | 1,022,900 | |
| Israel Electric Corp. Ltd., 6.7%, 2/10/17 (n) | | | 553,000 | | | | 602,079 | |
| Israel Electric Corp. Ltd., 5.625%, 6/21/18 (n) | | | 1,159,000 | | | | 1,225,643 | |
| | | | | | | | |
| | | | | | | $ | 4,148,169 | |
| International Market Sovereign - 8.9% | | | | | | | | |
| Federal Republic of Germany, 4.25%, 7/04/18 | | EUR | 756,000 | | | $ | 1,216,178 | |
| Federal Republic of Germany, 6.25%, 1/04/30 | | EUR | 485,000 | | | | 1,048,054 | |
| Government of Australia, 5.75%, 5/15/21 | | AUD | 693,000 | | | | 727,761 | |
10
Portfolio of Investments (unaudited) – continued
| | | | | | | | |
| Issuer | | Shares/Par | | | Value ($) | |
| | | | | | | | |
| Bonds - continued | | | | | | | | |
| International Market Sovereign - continued | | | | | | | | |
| Government of Canada, 4.5%, 6/01/15 | | CAD | 658,000 | | | $ | 622,934 | |
| Government of Canada, 4.25%, 6/01/18 | | CAD | 533,000 | | | | 539,852 | |
| Government of Canada, 3.25%, 6/01/21 | | CAD | 302,000 | | | | 298,184 | |
| Government of Canada, 5.75%, 6/01/33 | | CAD | 119,000 | | | | 155,124 | |
| Government of Japan, 1.8%, 3/20/43 | | JPY | 52,000,000 | | | | 520,499 | |
| Government of Japan, 1.1%, 6/20/20 | | JPY | 191,000,000 | | | | 1,961,649 | |
| Government of Japan, 2.1%, 9/20/24 | | JPY | 62,000,000 | | | | 693,747 | |
| Government of Japan, 2.2%, 9/20/27 | | JPY | 148,300,000 | | | | 1,686,432 | |
| Government of Japan, 2.4%, 3/20/37 | | JPY | 153,200,000 | | | | 1,723,724 | |
| Kingdom of Belgium, 5.5%, 9/28/17 | | EUR | 977,000 | | | | 1,583,385 | |
| Kingdom of Belgium, 4.25%, 9/28/21 | | EUR | 230,000 | | | | 381,061 | |
| Kingdom of Denmark, 3%, 11/15/21 | | DKK | 1,532,000 | | | | 322,130 | |
| Kingdom of Spain, 5.4%, 1/31/23 | | EUR | 242,000 | | | | 402,453 | |
| Kingdom of Spain, 4.6%, 7/30/19 | | EUR | 1,417,000 | | | | 2,246,932 | |
| Kingdom of Sweden, 5%, 12/01/20 | | SEK | 1,100,000 | | | | 205,128 | |
| Kingdom of the Netherlands, 5.5%, 1/15/28 | | EUR | 354,000 | | | | 690,004 | |
| Republic of Austria, 4.65%, 1/15/18 | | EUR | 608,000 | | | | 971,216 | |
| Republic of Finland, 3.875%, 9/15/17 | | EUR | 281,000 | | | | 434,563 | |
| Republic of France, 6%, 10/25/25 | | EUR | 282,000 | | | | 545,756 | |
| Republic of France, 4.75%, 4/25/35 | | EUR | 591,000 | | | | 1,081,914 | |
| Republic of Iceland, 4.875%, 6/16/16 (n) | | $ | 593,000 | | | | 622,650 | |
| Republic of Iceland, 5.875%, 5/11/22 (n) | | | 113,000 | | | | 123,029 | |
| Republic of Ireland, 4.5%, 4/18/20 | | EUR | 279,000 | | | | 447,539 | |
| Republic of Ireland, 5.4%, 3/13/25 | | EUR | 170,000 | | | | 287,602 | |
| Republic of Italy, 5.25%, 8/01/17 | | EUR | 2,230,000 | | | | 3,484,530 | |
| Republic of Italy, 3.75%, 3/01/21 | | EUR | 1,482,000 | | | | 2,235,933 | |
| Republic of Portugal, 4.45%, 6/15/18 | | EUR | 218,000 | | | | 328,712 | |
| Republic of Portugal, 4.8%, 6/15/20 | | EUR | 110,000 | | | | 169,268 | |
| United Kingdom Treasury, 8%, 6/07/21 | | GBP | 209,000 | | | | 485,938 | |
| United Kingdom Treasury, 4.25%, 3/07/36 | | GBP | 435,000 | | | | 834,495 | |
| | | | | | | | |
| | | | | | | $ | 29,078,376 | |
| Internet - 0.3% | | | | | | | | |
| Baidu, Inc., 3.25%, 8/06/18 | | $ | 588,000 | | | $ | 600,642 | |
| Baidu, Inc., 3.5%, 11/28/22 | | | 367,000 | | | | 350,004 | |
| | | | | | | | |
| | | | | | | $ | 950,646 | |
| Local Authorities - 0.4% | | | | | | | | |
| State of Illinois (Build America Bonds), 6.725%, 4/01/35 | | $ | 1,130,000 | | | $ | 1,294,539 | |
| | |
| Machinery & Tools - 0.4% | | | | | | | | |
| Atlas Copco AB, 5.6%, 5/22/17 (n) | | $ | 1,073,000 | | | $ | 1,202,408 | |
| Ferreycorp S.A.A., 4.875%, 4/26/20 (n) | | | 221,000 | | | | 214,370 | |
| | | | | | | | |
| | | | | | | $ | 1,416,778 | |
11
Portfolio of Investments (unaudited) – continued
| | | | | | | | |
| Issuer | | Shares/Par | | | Value ($) | |
| | | | | | | | |
| Bonds - continued | | | | | | | | |
| Major Banks - 7.9% | | | | | | | | |
| ABN AMRO Bank N.V., 4.25%, 2/02/17 (n) | | $ | 913,000 | | | $ | 980,516 | |
| Bank of America Corp., 7.375%, 5/15/14 | | | 460,000 | | | | 460,900 | |
| Bank of America Corp., 6.5%, 8/01/16 | | | 1,305,000 | | | | 1,455,821 | |
| Bank of America Corp., 3.3%, 1/11/23 | | | 1,554,000 | | | | 1,508,396 | |
| Bank of America Corp., 4.125%, 1/22/24 | | | 1,371,000 | | | | 1,390,385 | |
| Barclays Bank PLC, 5.125%, 1/08/20 | | | 770,000 | | | | 865,425 | |
| BNP Paribas, 2.7%, 8/20/18 | | | 950,000 | | | | 972,841 | |
| BNP Paribas, 7.195% to 6/29/37, FRN to 12/31/49 (n) | | | 600,000 | | | | 672,000 | |
| BNP Paribas, FRN, 2.985%, 12/20/14 | | | 164,000 | | | | 166,697 | |
| Commonwealth Bank of Australia, 5%, 10/15/19 (n) | | | 760,000 | | | | 852,825 | |
| Credit Suisse Group AG, 6.5%, 8/08/23 (n) | | | 1,160,000 | | | | 1,294,896 | |
| DBS Bank Ltd., 2.35%, 2/28/17 (n) | | | 980,000 | | | | 1,007,886 | |
| Goldman Sachs Group, Inc., 5.125%, 1/15/15 | | | 450,000 | | | | 464,027 | |
| Goldman Sachs Group, Inc., 5.75%, 1/24/22 | | | 1,213,000 | | | | 1,384,022 | |
| HSBC USA, Inc., 4.875%, 8/24/20 | | | 930,000 | | | | 1,022,099 | |
| ING Bank N.V., 3.75%, 3/07/17 (n) | | | 1,233,000 | | | | 1,311,806 | |
| ING Bank N.V., 5.8%, 9/25/23 (n) | | | 1,344,000 | | | | 1,473,535 | |
| JPMorgan Chase & Co., 2%, 8/15/17 | | | 330,000 | | | | 334,900 | |
| JPMorgan Chase & Co., 4.625%, 5/10/21 | | | 870,000 | | | | 953,187 | |
| Merrill Lynch & Co., Inc., 6.4%, 8/28/17 | | | 400,000 | | | | 458,178 | |
| Morgan Stanley, 6%, 5/13/14 | | | 620,000 | | | | 620,768 | |
| Morgan Stanley, 7.3%, 5/13/19 | | | 250,000 | | | | 303,093 | |
| Morgan Stanley, 5.625%, 9/23/19 | | | 420,000 | | | | 478,882 | |
| Morgan Stanley, FRN, 1.485%, 2/25/16 | | | 1,400,000 | | | | 1,420,132 | |
| Royal Bank of Scotland PLC, 2.55%, 9/18/15 | | | 471,000 | | | | 481,043 | |
| Royal Bank of Scotland PLC, 6%, 12/19/23 | | | 1,611,000 | | | | 1,682,963 | |
| Santander U.S. Debt S.A.U., 3.724%, 1/20/15 (n) | | | 400,000 | | | | 407,426 | |
| Standard Chartered PLC, 3.85%, 4/27/15 (n) | | | 850,000 | | | | 875,424 | |
| Wells Fargo & Co., 7.98% to 2018, FRN to 12/31/49 | | | 405,000 | | | | 459,675 | |
| | | | | | | | |
| | | | | | | $ | 25,759,748 | |
| Medical & Health Technology & Services - 0.4% | | | | | | | | |
| McKesson Corp., 5.7%, 3/01/17 | | $ | 370,000 | | | $ | 410,566 | |
| Owens & Minor, Inc., 6.35%, 4/15/16 | | | 710,000 | | | | 769,764 | |
| | | | | | | | |
| | | | | | | $ | 1,180,330 | |
| Metals & Mining - 1.5% | | | | | | | | |
| Barrick Gold Corp., 4.1%, 5/01/23 | | $ | 1,360,000 | | | $ | 1,324,285 | |
| Freeport-McMoRan Copper & Gold, Inc., 2.375%, 3/15/18 | | | 500,000 | | | | 502,834 | |
| Freeport-McMoRan Copper & Gold, Inc., 3.1%, 3/15/20 | | | 810,000 | | | | 802,235 | |
| Glencore Funding LLC, FRN, 1.394%, 5/27/16 (n) | | | 1,170,000 | | | | 1,176,214 | |
| Kinross Gold Corp., 5.95%, 3/15/24 (n) | | | 924,000 | | | | 935,565 | |
| | | | | | | | |
| | | | | | | $ | 4,741,133 | |
12
Portfolio of Investments (unaudited) – continued
| | | | | | | | |
| Issuer | | Shares/Par | | | Value ($) | |
| | | | | | | | |
| Bonds - continued | | | | | | | | |
| Mortgage-Backed - 0.7% | | | | | | | | |
| Fannie Mae, 5.5%, 7/01/19 - 11/01/36 | | $ | 596,392 | | | $ | 646,361 | |
| Fannie Mae, 6.5%, 5/01/31 | | | 55,850 | | | | 64,105 | |
| Fannie Mae, 6%, 11/01/34 (f) | | | 550,261 | | | | 614,098 | |
| Freddie Mac, 4.224%, 3/25/20 | | | 818,658 | | | | 896,213 | |
| | | | | | | | |
| | | | | | | $ | 2,220,777 | |
| Municipals - 0.3% | | | | | | | | |
| Florida Hurricane Catastrophe Fund Finance Corp. Rev, “A”, 2.107%, 7/01/18 | | $ | 1,015,000 | | | $ | 1,016,228 | |
| | |
| Natural Gas - Distribution - 0.4% | | | | | | | | |
| GDF Suez, 1.625%, 10/10/17 (n) | | $ | 1,400,000 | | | $ | 1,406,128 | |
| | |
| Natural Gas - Pipeline - 2.6% | | | | | | | | |
| DCP Midstream LLC, 3.875%, 3/15/23 | | $ | 630,000 | | | $ | 627,978 | |
| Energy Transfer Partners LP, 3.6%, 2/01/23 | | | 825,000 | | | | 802,150 | |
| Energy Transfer Partners LP, 6.5%, 2/01/42 | | | 779,000 | | | | 904,051 | |
| EnLink Midstream Partners LP, 4.4%, 4/01/24 | | | 705,000 | | | | 725,810 | |
| Enterprise Products Partners LP, 6.3%, 9/15/17 | | | 870,000 | | | | 1,006,874 | |
| Kinder Morgan Energy Partners LP, 6.375%, 3/01/41 | | | 1,070,000 | | | | 1,220,030 | |
| ONEOK Partners LP, 3.2%, 9/15/18 | | | 510,000 | | | | 529,781 | |
| Spectra Energy Capital LLC, 8%, 10/01/19 | | | 679,000 | | | | 840,312 | |
| Sunoco Logistics Partners LP, 4.25%, 4/01/24 | | | 437,000 | | | | 446,115 | |
| Williams Cos., Inc., 3.7%, 1/15/23 | | | 279,000 | | | | 257,609 | |
| Williams Partners LP, 4.3%, 3/04/24 | | | 1,231,000 | | | | 1,256,925 | |
| | | | | | | | |
| | | | | | | $ | 8,617,635 | |
| Network & Telecom - 1.3% | | | | | | | | |
| AT&T, Inc., 5.5%, 2/01/18 | | $ | 660,000 | | | $ | 748,392 | |
| Centurylink, Inc., 7.65%, 3/15/42 | | | 810,000 | | | | 787,725 | |
| Verizon Communications, Inc., 8.75%, 11/01/18 | | | 448,000 | | | | 572,317 | |
| Verizon Communications, Inc., 5.15%, 9/15/23 | | | 1,439,000 | | | | 1,586,262 | |
| Verizon Communications, Inc., FRN, 1.003%, 6/17/19 | | | 610,000 | | | | 617,344 | |
| | | | | | | | |
| | | | | | | $ | 4,312,040 | |
| Oil Services - 0.5% | | | | | | | | |
| Odebrecht Offshore Drilling Finance Ltd., 6.75%, 10/01/22 (n) | | $ | 512,718 | | | $ | 536,432 | |
| Transocean, Inc., 2.5%, 10/15/17 | | | 314,000 | | | | 319,372 | |
| Transocean, Inc., 6%, 3/15/18 | | | 670,000 | | | | 748,164 | |
| | | | | | | | |
| | | | | | | $ | 1,603,968 | |
| Other Banks & Diversified Financials - 4.0% | | | | | | | | |
| Abbey National Treasury Services PLC, 3.05%, 8/23/18 | | $ | 345,000 | | | $ | 359,326 | |
| Banco GNB Sudameris S.A., 3.875%, 5/02/18 (n) | | | 102,000 | | | | 100,215 | |
13
Portfolio of Investments (unaudited) – continued
| | | | | | | | |
| Issuer | | Shares/Par | | | Value ($) | |
| | | | | | | | |
| Bonds - continued | | | | | | | | |
| Other Banks & Diversified Financials - continued | | | | | | | | |
| Bancolombia S.A., 5.95%, 6/03/21 | | $ | 398,000 | | | $ | 430,835 | |
| Bancolombia S.A., 5.125%, 9/11/22 | | | 43,000 | | | | 42,624 | |
| BBVA Banco Continental S.A., 5%, 8/26/22 (n) | | | 40,000 | | | | 41,200 | |
| Citigroup, Inc., 6.375%, 8/12/14 | | | 630,000 | | | | 640,003 | |
| Citigroup, Inc., 6.01%, 1/15/15 | | | 530,000 | | | | 549,743 | |
| Citigroup, Inc., 8.5%, 5/22/19 | | | 919,000 | | | | 1,170,869 | |
| Groupe BPCE S.A., 5.7%, 10/22/23 (n) | | | 1,081,000 | | | | 1,144,660 | |
| Groupe BPCE S.A., 12.5% to 9/30/19, FRN to 12/31/49 (n) | | | 645,000 | | | | 857,850 | |
| Intesa Sanpaolo S.p.A., 2.375%, 1/13/17 | | | 420,000 | | | | 424,279 | |
| Intesa Sanpaolo S.p.A., 3.875%, 1/16/18 | | | 996,000 | | | | 1,046,547 | |
| Lloyds TSB Bank PLC, 5.8%, 1/13/20 (n) | | | 645,000 | | | | 745,691 | |
| Macquarie Bank Ltd., 5%, 2/22/17 (n) | | | 769,000 | | | | 839,909 | |
| Macquarie Group Ltd., 6%, 1/14/20 (n) | | | 428,000 | | | | 479,274 | |
| Rabobank Nederland N.V., 3.375%, 1/19/17 | | | 525,000 | | | | 556,985 | |
| Rabobank Nederland N.V., 3.95%, 11/09/22 | | | 1,174,000 | | | | 1,180,944 | |
| Santander Holdings USA, Inc., 4.625%, 4/19/16 | | | 130,000 | | | | 139,055 | |
| Santander Holdings USA, Inc., 3.45%, 8/27/18 | | | 490,000 | | | | 511,747 | |
| SunTrust Banks, Inc., 3.5%, 1/20/17 | | | 622,000 | | | | 658,232 | |
| Swedbank AB, 2.125%, 9/29/17 (n) | | | 615,000 | | | | 624,953 | |
| U.S. Bancorp, 2.95%, 7/15/22 | | | 416,000 | | | | 402,763 | |
| | | | | | | | |
| | | | | | | $ | 12,947,704 | |
| Personal Computers & Peripherals - 0.2% | | | | | | | | |
| Equifax, Inc., 3.3%, 12/15/22 | | $ | 671,000 | | | $ | 650,490 | |
| | |
| Pharmaceuticals - 0.5% | | | | | | | | |
| Celgene Corp., 3.95%, 10/15/20 | | $ | 890,000 | | | $ | 937,562 | |
| Hospira, Inc., 6.05%, 3/30/17 | | | 490,000 | | | | 541,248 | |
| | | | | | | | |
| | | | | | | $ | 1,478,810 | |
| Pollution Control - 0.2% | | | | | | | | |
| Republic Services, Inc., 5.25%, 11/15/21 | | $ | 730,000 | | | $ | 821,722 | |
| | |
| Railroad & Shipping - 0.3% | | | | | | | | |
| CSX Corp., 4.1%, 3/15/44 | | $ | 915,000 | | | $ | 856,490 | |
| | |
| Real Estate - 2.1% | | | | | | | | |
| AvalonBay Communities, Inc., REIT, 3.625%, 10/01/20 | | $ | 999,000 | | | $ | 1,037,247 | |
| Boston Properties LP, REIT, 3.7%, 11/15/18 | | | 420,000 | | | | 447,352 | |
| DDR Corp., REIT, 3.375%, 5/15/23 | | | 1,263,000 | | | | 1,210,358 | |
| HCP, Inc., REIT, 5.375%, 2/01/21 | | | 806,000 | | | | 912,129 | |
| Health Care REIT, Inc., 2.25%, 3/15/18 | | | 312,000 | | | | 315,687 | |
| Kimco Realty Corp., REIT, 6.875%, 10/01/19 | | | 191,000 | | | | 229,037 | |
14
Portfolio of Investments (unaudited) – continued
| | | | | | | | |
| Issuer | | Shares/Par | | | Value ($) | |
| | | | | | | | |
| Bonds - continued | | | | | | | | |
| Real Estate - continued | | | | | | | | |
| Simon Property Group, Inc., REIT, 6.1%, 5/01/16 | | $ | 1,790,000 | | | $ | 1,953,910 | |
| WEA Finance LLC, 6.75%, 9/02/19 (n) | | | 590,000 | | | | 714,245 | |
| | | | | | | | |
| | | | | | | $ | 6,819,965 | |
| Retailers - 1.3% | | | | | | | | |
| Dollar General Corp., 4.125%, 7/15/17 | | $ | 706,000 | | | $ | 754,368 | |
| Gap, Inc., 5.95%, 4/12/21 | | | 1,118,000 | | | | 1,272,252 | |
| Kohl’s Corp., 3.25%, 2/01/23 | | | 997,000 | | | | 945,968 | |
| Limited Brands, Inc., 5.25%, 11/01/14 | | | 242,000 | | | | 246,840 | |
| Macy’s, Inc., 7.875%, 7/15/15 | | | 860,000 | | | | 931,432 | |
| | | | | | | | |
| | | | | | | $ | 4,150,860 | |
| Supermarkets - 0.3% | | | | | | | | |
| Kroger Co., 3.85%, 8/01/23 | | $ | 1,090,000 | | | $ | 1,106,755 | |
| | |
| Supranational - 0.4% | | | | | | | | |
| Corporacion Andina de Fomento, 4.375%, 6/15/22 | | $ | 1,290,000 | | | $ | 1,364,607 | |
| | |
| Telecommunications - Wireless - 0.9% | | | | | | | | |
| American Tower Corp., REIT, 4.625%, 4/01/15 | | $ | 440,000 | | | $ | 455,526 | |
| American Tower Corp., REIT, 4.7%, 3/15/22 | | | 732,000 | | | | 768,368 | |
| Crown Castle Towers LLC, 6.113%, 1/15/20 (n) | | | 838,000 | | | | 969,915 | |
| Digicel Group Ltd., 6%, 4/15/21 (n) | | | 316,000 | | | | 319,950 | |
| Millicom International Cellular S.A., 4.75%, 5/22/20 (n) | | | 205,000 | | | | 197,825 | |
| MTS International Funding Ltd., 5%, 5/30/23 (n) | | | 201,000 | | | | 178,890 | |
| | | | | | | | |
| | | | | | | $ | 2,890,474 | |
| Telephone Services - 0.0% | | | | | | | | |
| B Communications Ltd., 7.375%, 2/15/21 (n) | | $ | 22,000 | | | $ | 23,265 | |
| | |
| Tobacco - 1.4% | | | | | | | | |
| Altria Group, Inc., 9.25%, 8/06/19 | | $ | 231,000 | | | $ | 306,350 | |
| Altria Group, Inc., 4%, 1/31/24 | | | 401,000 | | | | 408,479 | |
| Lorillard Tobacco Co., 8.125%, 6/23/19 | | | 640,000 | | | | 795,606 | |
| Lorillard Tobacco Co., 6.875%, 5/01/20 | | | 480,000 | | | | 566,824 | |
| Reynolds American, Inc., 6.75%, 6/15/17 | | | 1,040,000 | | | | 1,199,034 | |
| Reynolds American, Inc., 4.75%, 11/01/42 | | | 1,270,000 | | | | 1,192,596 | |
| | | | | | | | |
| | | | | | | $ | 4,468,889 | |
| Transportation - 0.1% | | | | | | | | |
| Far Eastern Shipping Co., 8%, 5/02/18 (n) | | $ | 310,000 | | | $ | 218,550 | |
| | |
| Transportation - Services - 0.3% | | | | | | | | |
| ERAC USA Finance Co., 6.375%, 10/15/17 (n) | | $ | 930,000 | | | $ | 1,067,993 | |
15
Portfolio of Investments (unaudited) – continued
| | | | | | | | |
| Issuer | | Shares/Par | | | Value ($) | |
| | | | | | | | |
| Bonds - continued | | | | | | | | |
| U.S. Government Agencies and Equivalents - 0.1% | | | | | | | | |
| National Credit Union Administration Guaranteed Note, 2.9%, 10/29/20 | | $ | 240,000 | | | $ | 249,126 | |
| | |
| Utilities - Electric Power - 2.6% | | | | | | | | |
| CMS Energy Corp., 4.25%, 9/30/15 | | $ | 760,000 | | | $ | 795,752 | |
| CMS Energy Corp., 5.05%, 3/15/22 | | | 608,000 | | | | 684,361 | |
| Empresa Nacional de Electricidad S.A., 4.25%, 4/15/24 | | | 52,000 | | | | 52,092 | |
| Enel Finance International S.A., 6.25%, 9/15/17 (n) | | | 920,000 | | | | 1,045,313 | |
| Exelon Generation Co. LLC, 5.2%, 10/01/19 | | | 360,000 | | | | 403,424 | |
| Exelon Generation Co. LLC, 4.25%, 6/15/22 | | | 391,000 | | | | 400,486 | |
| Oncor Electric Delivery Co., 4.1%, 6/01/22 | | | 922,000 | | | | 977,387 | |
| PPL Capital Funding, Inc., 3.95%, 3/15/24 | | | 1,380,000 | | | | 1,413,081 | |
| PPL WEM Holdings PLC, 3.9%, 5/01/16 (n) | | | 1,210,000 | | | | 1,269,659 | |
| Progress Energy, Inc., 3.15%, 4/01/22 | | | 1,148,000 | | | | 1,141,796 | |
| Waterford 3 Funding Corp., 8.09%, 1/02/17 | | | 232,299 | | | | 232,081 | |
| | | | | | | | |
| | | | | | | $ | 8,415,432 | |
| Total Bonds (Identified Cost, $197,223,780) | | | | | | $ | 207,642,106 | |
| | |
| Common Stocks - 0.0% | | | | | | | | |
| Printing & Publishing - 0.0% | | | | | | | | |
| American Media Operations, Inc. (a) (Identified Cost, $104,328) | | | 7,311 | | | $ | 41,088 | |
| | |
| Underlying Affiliated Funds - 33.7% | | | | | | | | |
MFS High Yield Pooled Portfolio (v)
(Identified Cost, $106,721,215) | | | 11,027,117 | | | $ | 109,940,353 | |
| | |
| Money Market Funds - 1.8% | | | | | | | | |
MFS Institutional Money Market Portfolio, 0.09%,
at Cost and Net Asset Value (v) | | | 5,970,483 | | | $ | 5,970,483 | |
| Total Investments (Identified Cost, $310,019,806) | | | | | | $ | 323,594,030 | |
| | |
| Other Assets, Less Liabilities - 0.8% | | | | | | | 2,503,269 | |
| Net Assets - 100.0% | | | | | | $ | 326,097,299 | |
| (a) | Non-income producing security. |
| (f) | All or a portion of the security has been segregated as collateral for open futures contracts. |
| (i) | Interest only security for which the fund receives interest on notional principal (Par amount). Par amount shown is the notional principal and does not reflect the cost of the security. |
| (n) | Securities exempt from registration under Rule 144A of the Securities Act of 1933. These securities may be sold in the ordinary course of business in transactions exempt from registration, normally to qualified institutional buyers. At period end, the aggregate value of these securities was $59,109,779, representing 18.1% of net assets. |
16
Portfolio of Investments (unaudited) – continued
| (p) | Payment-in-kind security for which interest income may be received in additional securities and/or cash. During the period, the following amount of interest income was received in additional securities and/or cash: |
| | | | | | | | |
| Payment-in-kind Securities | | Cash | | | Additional
Securities | |
| Crest Ltd., CDO, 7%, 1/28/40 | | | $— | | | | $8,942 | |
| (v) | Underlying affiliated fund that is available only to investment companies managed by MFS. The rate quoted for the MFS Institutional Money Market Portfolio is the annualized seven-day yield of the fund at period end. |
| (z) | Restricted securities are not registered under the Securities Act of 1933 and are subject to legal restrictions on resale. These securities generally may be resold in transactions exempt from registration or to the public if the securities are subsequently registered. Disposal of these securities may involve time-consuming negotiations and prompt sale at an acceptable price may be difficult. The fund holds the following restricted securities: |
| | | | | | | | | | |
| Restricted Securities | | Acquisition
Date | | Cost | | | Value | |
| Bayview Financial Revolving Mortgage Loan Trust, FRN, 1.752%, 12/28/40 | | 3/01/06 | | | $405,329 | | | | $268,221 | |
| Falcon Franchise Loan LLC, FRN, 11.062%, 1/05/23 | | 1/18/02 | | | 13,253 | | | | 43,587 | |
| Falcon Franchise Loan LLC, FRN, 14.914%, 1/05/25 | | 1/29/03 | | | 16,955 | | | | 73,171 | |
| Morgan Stanley Capital I, Inc., FRN, 1.412%, 4/28/39 | | 7/20/04 | | | 26,676 | | | | 15,552 | |
| Tencent Holdings Ltd., 3.375%, 5/02/19 | | 4/22/14 | | | 199,790 | | | | 201,044 | |
| Total Restricted Securities | | | | $601,575 | |
| % of Net assets | | | | 0.2% | |
The following abbreviations are used in this report and are defined:
| CDO | | Collateralized Debt Obligation |
| CLO | | Collateralized Loan Obligation |
| FRN | | Floating Rate Note. Interest rate resets periodically and may not be the rate reported at period end. |
| PLC | | Public Limited Company |
| REIT | | Real Estate Investment Trust |
Abbreviations indicate amounts shown in currencies other than the U.S. dollar. All amounts are stated in U.S. dollars unless otherwise indicated. A list of abbreviations is shown below:
17
Portfolio of Investments (unaudited) – continued
Derivative Contracts at 4/30/14
Forward Foreign Currency Exchange Contracts at 4/30/14
| | | | | | | | | | | | | | | | | | | | | | | | |
| Type | | Currency | | Counter-
party | | Contracts
to
Deliver/
Receive | | | Settlement
Date Range | | | In
Exchange
for | | | Contracts
at Value | | | Net
Unrealized
Appreciation
(Depreciation) | |
| Liability Derivatives | | | | | | | | | | | | | |
| SELL | | AUD | | Westpac Banking Corp. | | | 792,198 | | | | 7/11/14 | | | | $729,179 | | | | $732,315 | | | | $(3,136 | ) |
| SELL | | CAD | | Merrill Lynch International Bank | | | 1,872,628 | | | | 7/11/14 | | | | 1,700,009 | | | | 1,705,625 | | | | (5,616 | ) |
| SELL | | DKK | | Barclays Bank PLC | | | 850,521 | | | | 7/11/14 | | | | 157,281 | | | | 158,140 | | | | (859 | ) |
| SELL | | DKK | | UBS AG | | | 850,521 | | | | 7/11/14 | | | | 157,297 | | | | 158,140 | | | | (843 | ) |
| SELL | | EUR | | Credit Suisse Group | | | 2,344,997 | | | | 7/11/14 | | | | 3,237,000 | | | | 3,252,797 | | | | (15,797 | ) |
| SELL | | GBP | | Credit Suisse Group | | | 419,100 | | | | 7/11/14 | | | | 701,042 | | | | 707,215 | | | | (6,173 | ) |
| SELL | | GBP | | Merrill Lynch International Bank | | | 419,100 | | | | 7/11/14 | | | | 701,096 | | | | 707,215 | | | | (6,119 | ) |
| BUY | | JPY | | Deutsche Bank AG | | | 149,509,206 | | | | 7/11/14 | | | | 1,467,512 | | | | 1,463,027 | | | | (4,485 | ) |
| BUY | | JPY | | Goldman Sachs International | | | 149,509,206 | | | | 7/11/14 | | | | 1,467,661 | | | | 1,463,027 | | | | (4,634 | ) |
| SELL | | SEK | | Goldman Sachs International | | | 1,114,421 | | | | 7/11/14 | | | | 170,198 | | | | 171,183 | | | | (985 | ) |
| | | | | | | | | | | | | | | | | | | | | | | | |
| | | | | | | | | | | | | | | | | | | | | | | $(48,647 | ) |
| | | | | | | | | | | | | | | | | | | | | | | | |
Futures Contracts at 4/30/14
| | | | | | | | | | | | | | | | | | |
| Description | | Currency | | | Contracts | | | Value | | Expiration
Date | | | Unrealized
Appreciation
(Depreciation) | |
| Liability Derivatives | | | | | | | | | | | | | | | | | | |
| Interest Rate Futures | | | | | | | | | | | | | | | |
| U.S. Treasury Note 10 yr (Short) | | | USD | | | | 206 | | | $25,630,906 | | | June - 2014 | | | | $(4,230 | ) |
| U.S. Treasury Bond 30 yr (Short) | | | USD | | | | 13 | | | 1,754,188 | | | June - 2014 | | | | (33,868 | ) |
| | | | | | | | | | | | | | | | | | |
| | | | | | | | | | | | | | | | | $(38,098 | ) |
| | | | | | | | | | | | | | | | | | |
At April 30, 2014, the fund had liquid securities with an aggregate value of $377,074 to cover any commitments for certain derivative contracts.
See Notes to Financial Statements
18
Financial Statements
STATEMENT OF ASSETS AND LIABILITIES
At 4/30/14 (unaudited)
This statement represents your fund’s balance sheet, which details the assets and liabilities comprising the total value of the fund.
| | | | |
| Assets | | | | |
Investments- | | | | |
Non-affiliated issuers, at value (identified cost, $197,328,108) | | | $207,683,194 | |
Underlying affiliated funds, at value (identified cost, $112,691,698) | | | 115,910,836 | |
Total investments, at value (identified cost, $310,019,806) | | | $323,594,030 | |
Cash | | | 310,617 | |
Receivables for | | | | |
Investments sold | | | 1,002,259 | |
Fund shares sold | | | 515,729 | |
Interest | | | 2,415,287 | |
Other assets | | | 1,515 | |
Total assets | | | $327,839,437 | |
| Liabilities | | | | |
Payables for | | | | |
Distributions | | | $108,689 | |
Forward foreign currency exchange contracts | | | 48,647 | |
Daily variation margin on open futures contracts | | | 94,219 | |
Investments purchased | | | 388,233 | |
Fund shares reacquired | | | 818,914 | |
Payable to affiliates | | | | |
Investment adviser | | | 969 | |
Shareholder servicing costs | | | 212,941 | |
Distribution and service fees | | | 7,860 | |
Payable for independent Trustees’ compensation | | | 10,934 | |
Accrued expenses and other liabilities | | | 50,732 | |
Total liabilities | | | $1,742,138 | |
Net assets | | | $326,097,299 | |
| Net assets consist of | | | | |
Paid-in capital | | | $324,150,775 | |
Unrealized appreciation (depreciation) on investments and translation of assets and liabilities in foreign currencies | | | 13,492,511 | |
Accumulated net realized gain (loss) on investments and foreign currency | | | (11,158,288 | ) |
Accumulated distributions in excess of net investment income | | | (387,699 | ) |
Net assets | | | $326,097,299 | |
Shares of beneficial interest outstanding | | | 48,081,731 | |
| | | | | | | | | | | | |
| | | Net assets | | | Shares
outstanding | | | Net asset value
per share (a) | |
Class A | | | $225,641,370 | | | | 33,188,021 | | | | $6.80 | |
Class B | | | 36,986,025 | | | | 5,479,740 | | | | 6.75 | |
Class C | | | 50,392,793 | | | | 7,489,708 | | | | 6.73 | |
Class I | | | 13,077,111 | | | | 1,924,262 | | | | 6.80 | |
| (a) | Maximum offering price per share was equal to the net asset value per share for all share classes, except for Class A, for which the maximum offering price per share was $7.14 [100 / 95.25 x $6.80]. On sales of $50,000 or more, the maximum offering price of Class A shares is reduced. A contingent deferred sales charge may be imposed on redemptions of Class A, Class B, and Class C shares. Redemption price per share was equal to the net asset value per share for Class I. |
See Notes to Financial Statements
19
Financial Statements
STATEMENT OF OPERATIONS
Six months ended 4/30/14 (unaudited)
This statement describes how much your fund earned in investment income and accrued in expenses. It also describes any gains and/or losses generated by fund operations.
| | | | |
| Net investment income | |
Income | | | | |
Interest | | | $4,300,817 | |
Dividends from underlying affiliated funds | | | 3,724,031 | |
Total investment income | | | $8,024,848 | |
Expenses | | | | |
Management fee | | | $1,028,588 | |
Distribution and service fees | | | 704,370 | |
Shareholder servicing costs | | | 208,913 | |
Administrative services fee | | | 24,043 | |
Independent Trustees’ compensation | | | 5,082 | |
Custodian fee | | | 34,010 | |
Shareholder communications | | | 19,593 | |
Audit and tax fees | | | 32,274 | |
Legal fees | | | 1,661 | |
Miscellaneous | | | 49,221 | |
Total expenses | | | $2,107,755 | |
Fees paid indirectly | | | (42 | ) |
Reduction of expenses by investment adviser and distributor | | | (141,952 | ) |
Net expenses | | | $1,965,761 | |
Net investment income | | | $6,059,087 | |
| Realized and unrealized gain (loss) on investments and foreign currency | |
Realized gain (loss) (identified cost basis) | | | | |
Investments: | | | | |
Non-affiliated issuers | | | $672,517 | |
Underlying affiliated funds | | | 819,441 | |
Capital gain distributions from underlying affiliated funds | | | 784,528 | |
Futures contracts | | | (637,487 | ) |
Foreign currency | | | (193,583 | ) |
Net realized gain (loss) on investments and foreign currency | | | $1,445,416 | |
Change in unrealized appreciation (depreciation) | | | | |
Investments | | | $1,372,125 | |
Futures contracts | | | 616,885 | |
Translation of assets and liabilities in foreign currencies | | | 537 | |
Net unrealized gain (loss) on investments and foreign currency translation | | | $1,989,547 | |
Net realized and unrealized gain (loss) on investments and foreign currency | | | $3,434,963 | |
Change in net assets from operations | | | $9,494,050 | |
See Notes to Financial Statements
20
Financial Statements
STATEMENTS OF CHANGES IN NET ASSETS
These statements describe the increases and/or decreases in net assets resulting from operations, any distributions, and any shareholder transactions.
| | | | | | | | |
| | | Six months ended
4/30/14 | | | Year ended
10/31/13 | |
| Change in net assets | | (unaudited) | | | | |
| From operations | | | | | | | | |
Net investment income | | | $6,059,087 | | | | $12,360,453 | |
Net realized gain (loss) on investments and foreign currency | | | 1,445,416 | | | | 4,904,667 | |
Net unrealized gain (loss) on investments and foreign currency translation | | | 1,989,547 | | | | (11,922,538 | ) |
Change in net assets from operations | | | $9,494,050 | | | | $5,342,582 | |
| Distributions declared to shareholders | | | | | | | | |
From net investment income | | | $(6,791,200 | ) | | | $(14,021,721 | ) |
Change in net assets from fund share transactions | | | $5,501,570 | | | | $(889,377 | ) |
Total change in net assets | | | $8,204,420 | | | | $(9,568,516 | ) |
| Net assets | | | | | | | | |
At beginning of period | | | 317,892,879 | | | | 327,461,395 | |
At end of period (including accumulated distributions in excess of net investment income of $387,699 and undistributed net investment income of $344,414, respectively) | | | $326,097,299 | | | | $317,892,879 | |
See Notes to Financial Statements
21
Financial Statements
FINANCIAL HIGHLIGHTS
The financial highlights table is intended to help you understand the fund’s financial performance for the semiannual period and the past 5 fiscal years. Certain information reflects financial results for a single fund share. The total returns in the table represent the rate by which an investor would have earned (or lost) on an investment in the fund share class (assuming reinvestment of all distributions) held for the entire period.
| | | | | | | | | | | | | | | | | | | | | | | | |
| | | Six months
ended
4/30/14 (unaudited) | | | Years ended 10/31 | |
| Class A | | | 2013 | | | 2012 | | | 2011 | | | 2010 | | | 2009 | |
| | | | | | | | | | | | | | | | | |
Net asset value, beginning of
period | | | $6.74 | | | | $6.92 | | | | $6.60 | | | | $6.72 | | | | $6.30 | | | | $5.43 | |
| Income (loss) from investment operations | | | | | | | | | | | | | |
Net investment income (d) | | | $0.13 | | | | $0.27 | | | | $0.29 | | | | $0.31 | | | | $0.33 | | | | $0.33 | |
Net realized and unrealized gain
(loss) on investments and
foreign currency | | | 0.08 | | | | (0.15 | ) | | | 0.35 | | | | (0.10 | ) | | | 0.44 | | | | 0.98 | |
Total from investment operations | | | $0.21 | | | | $0.12 | | | | $0.64 | | | | $0.21 | | | | $0.77 | | | | $1.31 | |
| Less distributions declared to shareholders | | | | | | | | | | | | | |
From net investment income | | | $(0.15 | ) | | | $(0.30 | ) | | | $(0.32 | ) | | | $(0.33 | ) | | | $(0.35 | ) | | | $(0.44 | ) |
Net asset value, end of period (x) | | | $6.80 | | | | $6.74 | | | | $6.92 | | | | $6.60 | | | | $6.72 | | | | $6.30 | |
Total return (%) (r)(s)(t)(x) | | | 3.15 | (n) | | | 1.85 | | | | 9.98 | | | | 3.24 | | | | 12.56 | | | | 25.36 | |
Ratios (%) (to average net assets)
and Supplemental data: | | | | | | | | | | | | | | | | | |
Expenses before expense
reductions (f) | | | 1.13 | (a)(h) | | | 1.15 | (h) | | | 1.18 | | | | 1.16 | | | | 1.18 | | | | 1.28 | |
Expenses after expense
reductions (f) | | | 1.05 | (a)(h) | | | 1.05 | (h) | | | 1.05 | | | | 1.05 | | | | 1.02 | | | | 0.92 | |
Net investment income | | | 4.01 | (a) | | | 3.95 | | | | 4.38 | | | | 4.62 | | | | 5.14 | | | | 5.86 | |
Portfolio turnover | | | 9 | (n) | | | 34 | | | | 42 | | | | 38 | | | | 49 | | | | 53 | |
Net assets at end of period
(000 omitted) | | | $225,641 | | | | $218,674 | | | | $222,166 | | | | $203,155 | | | | $216,200 | | | | $188,786 | |
See Notes to Financial Statements
22
Financial Highlights – continued
| | | | | | | | | | | | | | | | | | | | | | | | |
| | | Six months
ended
4/30/14 (unaudited) | | | Years ended 10/31 | |
| Class B | | | 2013 | | | 2012 | | | 2011 | | | 2010 | | | 2009 | |
| | | | | | | | | | | | | | | | | |
Net asset value, beginning of
period | | | $6.69 | | | | $6.86 | | | | $6.54 | | | | $6.66 | | | | $6.24 | | | | $5.38 | |
| Income (loss) from investment operations | | | | | | | | | | | | | |
Net investment income (d) | | | $0.11 | | | | $0.22 | | | | $0.24 | | | | $0.26 | | | | $0.28 | | | | $0.29 | |
Net realized and unrealized gain
(loss) on investments and
foreign currency | | | 0.07 | | | | (0.14 | ) | | | 0.35 | | | | (0.10 | ) | | | 0.44 | | | | 0.96 | |
Total from investment operations | | | $0.18 | | | | $0.08 | | | | $0.59 | | | | $0.16 | | | | $0.72 | | | | $1.25 | |
| Less distributions declared to shareholders | | | | | | | | | | | | | |
From net investment income | | | $(0.12 | ) | | | $(0.25 | ) | | | $(0.27 | ) | | | $(0.28 | ) | | | $(0.30 | ) | | | $(0.39 | ) |
Net asset value, end of period (x) | | | $6.75 | | | | $6.69 | | | | $6.86 | | | | $6.54 | | | | $6.66 | | | | $6.24 | |
Total return (%) (r)(s)(t)(x) | | | 2.78 | (n) | | | 1.22 | | | | 9.22 | | | | 2.45 | | | | 11.80 | | | | 24.45 | |
Ratios (%) (to average net assets)
and Supplemental data: | | | | | | | | | | | | | | | | | |
Expenses before expense
reductions (f) | | | 1.89 | (a)(h) | | | 1.91 | (h) | | | 1.94 | | | | 1.92 | | | | 1.94 | | | | 2.01 | |
Expenses after expense
reductions (f) | | | 1.80 | (a)(h) | | | 1.80 | (h) | | | 1.80 | | | | 1.80 | | | | 1.77 | | | | 1.63 | |
Net investment income | | | 3.30 | (a) | | | 3.24 | | | | 3.66 | | | | 3.92 | | | | 4.46 | | | | 5.22 | |
Portfolio turnover | | | 9 | (n) | | | 34 | | | | 42 | | | | 38 | | | | 49 | | | | 53 | |
Net assets at end of period
(000 omitted) | | | $36,986 | | | | $37,673 | | | | $39,238 | | | | $34,112 | | | | $39,468 | | | | $39,976 | |
See Notes to Financial Statements
23
Financial Highlights – continued
| | | | | | | | | | | | | | | | | | | | | | | | |
| | | Six months
ended
4/30/14 (unaudited) | | | Years ended 10/31 | |
| Class C | | | 2013 | | | 2012 | | | 2011 | | | 2010 | | | 2009 | |
| | | | | | | | | | | | | | | | | |
Net asset value, beginning of
period | | | $6.67 | | | | $6.84 | | | | $6.52 | | | | $6.64 | | | | $6.22 | | | | $5.35 | |
| Income (loss) from investment operations | | | | | | | | | | | | | |
Net investment income (d) | | | $0.11 | | | | $0.22 | | | | $0.24 | | | | $0.26 | | | | $0.28 | | | | $0.29 | |
Net realized and unrealized gain
(loss) on investments and
foreign currency | | | 0.07 | | | | (0.14 | ) | | | 0.35 | | | | (0.10 | ) | | | 0.44 | | | | 0.97 | |
Total from investment operations | | | $0.18 | | | | $0.08 | | | | $0.59 | | | | $0.16 | | | | $0.72 | | | | $1.26 | |
| Less distributions declared to shareholders | | | | | | | | | | | | | |
From net investment income | | | $(0.12 | ) | | | $(0.25 | ) | | | $(0.27 | ) | | | $(0.28 | ) | | | $(0.30 | ) | | | $(0.39 | ) |
Net asset value, end of period (x) | | | $6.73 | | | | $6.67 | | | | $6.84 | | | | $6.52 | | | | $6.64 | | | | $6.22 | |
Total return (%) (r)(s)(t)(x) | | | 2.78 | (n) | | | 1.21 | | | | 9.23 | | | | 2.45 | | | | 11.82 | | | | 24.74 | |
Ratios (%) (to average net assets)
and Supplemental data: | | | | | | | | | | | | | | | | | |
Expenses before expense
reductions (f) | | | 1.89 | (a)(h) | | | 1.91 | (h) | | | 1.94 | | | | 1.92 | | | | 1.94 | | | | 2.01 | |
Expenses after expense
reductions (f) | | | 1.80 | (a)(h) | | | 1.80 | (h) | | | 1.80 | | | | 1.80 | | | | 1.77 | | | | 1.64 | |
Net investment income | | | 3.32 | (a) | | | 3.26 | | | | 3.68 | | | | 3.94 | | | | 4.47 | | | | 5.19 | |
Portfolio turnover | | | 9 | (n) | | | 34 | | | | 42 | | | | 38 | | | | 49 | | | | 53 | |
Net assets at end of period
(000 omitted) | | | $50,393 | | | | $49,910 | | | | $54,671 | | | | $46,531 | | | | $46,789 | | | | $37,931 | |
See Notes to Financial Statements
24
Financial Highlights – continued
| | | | | | | | | | | | | | | | | | | | | | | | |
| | | Six months
ended
4/30/14 (unaudited) | | | Years ended 10/31 | |
| Class I | | | 2013 | | | 2012 | | | 2011 | | | 2010 | | | 2009 | |
| | | | | | | | | | | | | | | | | |
Net asset value, beginning of
period | | | $6.74 | | | | $6.91 | | | | $6.59 | | | | $6.72 | | | | $6.30 | | | | $5.43 | |
| Income (loss) from investment operations | | | | | | | | | | | | | |
Net investment income (d) | | | $0.14 | | | | $0.29 | | | | $0.31 | | | | $0.32 | | | | $0.35 | | | | $0.35 | |
Net realized and unrealized gain
(loss) on investments and
foreign currency | | | 0.08 | | | | (0.14 | ) | | | 0.35 | | | | (0.10 | ) | | | 0.43 | | | | 0.97 | |
Total from investment operations | | | $0.22 | | | | $0.15 | | | | $0.66 | | | | $0.22 | | | | $0.78 | | | | $1.32 | |
| Less distributions declared to shareholders | | | | | | | | | | | | | |
From net investment income | | | $(0.16 | ) | | | $(0.32 | ) | | | $(0.34 | ) | | | $(0.35 | ) | | | $(0.36 | ) | | | $(0.45 | ) |
Net asset value, end of period (x) | | | $6.80 | | | | $6.74 | | | | $6.91 | | | | $6.59 | | | | $6.72 | | | | $6.30 | |
Total return (%) (r)(s)(x) | | | 3.28 | (n) | | | 2.25 | | | | 10.27 | | | | 3.34 | | | | 12.84 | | | | 25.71 | |
Ratios (%) (to average net assets)
and Supplemental data: | | | | | | | | | | | | | | | | | |
Expenses before expense
reductions (f) | | | 0.89 | (a)(h) | | | 0.90 | (h) | | | 0.93 | | | | 0.91 | | | | 0.93 | | | | 1.00 | |
Expenses after expense
reductions (f) | | | 0.80 | (a)(h) | | | 0.80 | (h) | | | 0.80 | | | | 0.80 | | | | 0.77 | | | | 0.64 | |
Net investment income | | | 4.26 | (a) | | | 4.21 | | | | 4.61 | | | | 4.83 | | | | 5.36 | | | | 6.10 | |
Portfolio turnover | | | 9 | (n) | | | 34 | | | | 42 | | | | 38 | | | | 49 | | | | 53 | |
Net assets at end of period
(000 omitted) | | | $13,077 | | | | $11,636 | | | | $11,387 | | | | $8,309 | | | | $4,823 | | | | $2,939 | |
| (d) | Per share data is based on average shares outstanding. |
| (f) | Ratios do not reflect reductions from fees paid indirectly, if applicable. |
| (h) | In addition to the fees and expenses which the fund bears directly, the fund indirectly bears a pro rata share of the fees and expenses of the underlying affiliated funds in which the fund invests. Accordingly, the expense ratio for the fund reflects only those fees and expenses borne directly by the fund. Because the underlying affiliated funds have varied expense and fee levels and the fund may own different proportions of the underlying affiliated funds at different times, the amount of fees and expenses incurred indirectly by the fund will vary. |
| (r) | Certain expenses have been reduced without which performance would have been lower. |
| (s) | From time to time the fund may receive proceeds from litigation settlements, without which performance would be lower. |
| (t) | Total returns do not include any applicable sales charges. |
| (x) | The net asset values per share and total returns have been calculated on net assets which include adjustments made in accordance with U.S. generally accepted accounting principles required at period end for financial reporting purposes. |
See Notes to Financial Statements
25
NOTES TO FINANCIAL STATEMENTS
(unaudited)
(1) Business and Organization
MFS Strategic Income Fund (the fund) is a diversified series of MFS Series Trust VIII (the trust). The trust is organized as a Massachusetts business trust and is registered under the Investment Company Act of 1940, as amended, as an open-end management investment company.
The fund is an investment company and accordingly follows the investment company accounting and reporting guidance of the Financial Accounting Standards Board (FASB) Accounting Standard Codification Topic 946 Financial Services – Investment Companies.
(2) Significant Accounting Policies
General – The preparation of financial statements in conformity with U.S. generally accepted accounting principles requires management to make estimates and assumptions that affect the reported amounts of assets and liabilities, and disclosure of contingent assets and liabilities at the date of the financial statements and the reported amounts of increases and decreases in net assets from operations during the reporting period. Actual results could differ from those estimates. In the preparation of these financial statements, management has evaluated subsequent events occurring after the date of the fund’s Statement of Assets and Liabilities through the date that the financial statements were issued. The fund invests in the MFS High Yield Pooled Portfolio (“High Yield Pooled Portfolio”). The accounting policies of the High Yield Pooled Portfolio are outlined in its shareholder report, which is available without charge by calling 1-800-225-2606 and on the Securities and Exchange Commission (SEC) web site at http://www.sec.gov or at the SEC’s public reference room in Washington, D.C. The accounting policies detailed in the Significant Accounting Policies note cover both the fund and the High Yield Pooled Portfolio. For purposes of this policy disclosure, “fund” refers to both the fund and the High Yield Pooled Portfolio in which the fund invests. The High Yield Pooled Portfolio’s shareholder report is not covered by this report. The fund and the High Yield Pooled Portfolio invest in high-yield securities rated below investment grade. Investments in high-yield securities involve greater degrees of credit and market risk than investments in higher-rated securities and tend to be more sensitive to economic conditions. The fund invests in foreign securities. Investments in foreign securities are vulnerable to the effects of changes in the relative values of the local currency and the U.S. dollar and to the effects of changes in each country’s legal, political, and economic environment.
In this reporting period, the fund adopted the disclosure provisions of FASB Accounting Standards Update 2011-11 (“ASU 2011-11”), Balance Sheet (Topic 210) – Disclosures about Offsetting Assets and Liabilities along with the related scope clarification provisions of FASB Accounting Standards Update 2013-01 (“ASU 2013-01”) entitled Balance Sheet (Topic 210) – Clarifying the Scope of Disclosures about Offsetting Assets and Liabilities. ASU 2011-11 is intended to enhance disclosures on the offsetting of financial assets and liabilities by requiring entities to disclose both gross and net information about financial instruments and transactions that are either offset in the statement of financial position or subject to an enforceable Master Netting Agreement or similar arrangement. ASU 2013-01 limits the scope of ASU 2011-11’s disclosure requirements on offsetting to financial assets and financial liabilities related to
26
Notes to Financial Statements (unaudited) – continued
derivatives, repurchase and reverse repurchase agreements, and securities lending and securities borrowing transactions. The disclosures required by ASU 2011-11, to the extent applicable to the fund, have been included in the fund’s Significant Accounting Policies note under the captions for each of the fund’s in-scope financial instruments and transactions.
The fund’s accounting policy with respect to balance sheet offsetting is that, absent an event of default by the counterparty or a termination of the agreement, the ISDA Master Agreement does not result in an offset of reported amounts of financial assets and financial liabilities in the Statement of Assets and Liabilities across transactions between the fund and the applicable counterparty. The fund’s right to setoff may be restricted or prohibited by the bankruptcy or insolvency laws of the particular jurisdiction to which a specific master netting agreement counterparty is subject. Balance sheet offsetting disclosures, to the extent applicable to the fund, have been included in the fund’s Significant Accounting Policies note under the captions for each of the fund’s in-scope financial instruments and transactions.
Investment Valuations – The investments of the fund and the High Yield Pooled Portfolio are valued as described below.
Debt instruments and floating rate loans (other than short-term instruments), including restricted debt instruments, are generally valued at an evaluated or composite bid as provided by a third-party pricing service. Equity securities, including restricted equity securities, are generally valued at the last sale or official closing price as provided by a third-party pricing service on the market or exchange on which they are primarily traded. Equity securities, for which there were no sales reported that day, are generally valued at the last quoted daily bid quotation as provided by a third-party pricing service on the market or exchange on which such securities are primarily traded. Short-term instruments with a maturity at issuance of 60 days or less generally are valued at amortized cost, which approximates market value. Exchange-traded options are generally valued at the last sale or official closing price as provided by a third-party pricing service on the exchange on which such options are primarily traded. Exchange-traded options for which there were no sales reported that day are generally valued at the last daily bid quotation as provided by a third-party pricing service on the exchange on which such options are primarily traded. Options not traded on an exchange are generally valued at a broker/dealer bid quotation. Foreign currency options are generally valued at valuations provided by a third-party pricing service. Futures contracts are generally valued at last posted settlement price as provided by a third-party pricing service on the market on which they are primarily traded. Futures contracts for which there were no trades that day for a particular position are generally valued at the closing bid quotation as provided by a third-party pricing service on the market on which such futures contracts are primarily traded. Forward foreign currency exchange contracts are generally valued at the mean of bid and asked prices for the time period interpolated from rates provided by a third-party pricing service for proximate time periods. Swap agreements are generally valued at valuations provided by a third-party pricing service, which for cleared swaps includes an evaluation of any trading activity at the clearinghouses. Open-end investment companies are generally valued at net asset value per share. Securities and other assets generally valued on the basis of information from a third-party pricing service may also be valued at a
27
Notes to Financial Statements (unaudited) – continued
broker/dealer bid quotation. Values obtained from third-party pricing services can utilize both transaction data and market information such as yield, quality, coupon rate, maturity, type of issue, trading characteristics, and other market data. The values of foreign securities and other assets and liabilities expressed in foreign currencies are converted to U.S. dollars using the mean of bid and asked prices for rates provided by a third-party pricing service.
The Board of Trustees has delegated primary responsibility for determining or causing to be determined the value of the fund’s investments (including any fair valuation) to the adviser pursuant to valuation policies and procedures approved by the Board. If the adviser determines that reliable market quotations are not readily available, investments are valued at fair value as determined in good faith by the adviser in accordance with such procedures under the oversight of the Board of Trustees. Under the fund’s valuation policies and procedures, market quotations are not considered to be readily available for most types of debt instruments and floating rate loans and many types of derivatives. These investments are generally valued at fair value based on information from third-party pricing services. In addition, investments may be valued at fair value if the adviser determines that an investment’s value has been materially affected by events occurring after the close of the exchange or market on which the investment is principally traded (such as foreign exchange or market) and prior to the determination of the fund’s net asset value, or after the halting of trading of a specific security where trading does not resume prior to the close of the exchange or market on which the security is principally traded. The adviser generally relies on third-party pricing services or other information (such as the correlation with price movements of similar securities in the same or other markets; the type, cost and investment characteristics of the security; the business and financial condition of the issuer; and trading and other market data) to assist in determining whether to fair value and at what value to fair value an investment. The value of an investment for purposes of calculating the fund’s net asset value can differ depending on the source and method used to determine value. When fair valuation is used, the value of an investment used to determine the fund’s net asset value may differ from quoted or published prices for the same investment. There can be no assurance that the fund could obtain the fair value assigned to an investment if it were to sell the investment at the same time at which the fund determines its net asset value per share.
Various inputs are used in determining the value of the fund’s assets or liabilities. These inputs are categorized into three broad levels. In certain cases, the inputs used to measure fair value may fall into different levels of the fair value hierarchy. In such cases, an investment’s level within the fair value hierarchy is based on the lowest level of input that is significant to the fair value measurement. The fund’s assessment of the significance of a particular input to the fair value measurement in its entirety requires judgment, and considers factors specific to the investment. Level 1 includes unadjusted quoted prices in active markets for identical assets or liabilities. Level 2 includes other significant observable market-based inputs (including quoted prices for similar securities, interest rates, prepayment speed, and credit risk). Level 3 includes unobservable inputs, which may include the adviser’s own assumptions in determining the fair value of investments. Other financial instruments are derivative instruments not reflected in total investments, such as futures contracts and forward foreign currency exchange contracts.
28
Notes to Financial Statements (unaudited) – continued
The following is a summary of the levels used as of April 30, 2014 in valuing the fund’s assets or liabilities:
| | | | | | | | | | | | | | | | |
| Investments at Value | | Level 1 | | | Level 2 | | | Level 3 | | | Total | |
| Equity Securities | | | $— | | | | $— | | | | $41,088 | | | | $41,088 | |
| U.S. Treasury Bonds & U.S. Government Agency & Equivalents | | | — | | | | 249,126 | | | | — | | | | 249,126 | |
| Non-U.S. Sovereign Debt | | | — | | | | 43,089,437 | | | | — | | | | 43,089,437 | |
| Municipal Bonds | | | — | | | | 1,016,228 | | | | — | | | | 1,016,228 | |
| U.S. Corporate Bonds | | | — | | | | 108,054,364 | | | | — | | | | 108,054,364 | |
| Residential Mortgage-Backed Securities | | | — | | | | 2,220,776 | | | | — | | | | 2,220,776 | |
| Commercial Mortgage-Backed Securities | | | — | | | | 2,254,160 | | | | — | | | | 2,254,160 | |
| Asset-Backed Securities (including CDOs) | | | — | | | | 1,791,891 | | | | — | | | | 1,791,891 | |
| Foreign Bonds | | | — | | | | 48,966,124 | | | | — | | | | 48,966,124 | |
| Mutual Funds | | | 115,910,836 | | | | — | | | | — | | | | 115,910,836 | |
| Total Investments | | | $115,910,836 | | | | $207,642,106 | | | | $41,088 | | | | $323,594,030 | |
| | | | |
| Other Financial Instruments | | | | | | | | | | | | |
| Futures Contracts | | | $(38,098 | ) | | | $— | | | | $— | | | | $(38,098 | ) |
| Forward Foreign Currency Exchange Contracts | | | — | | | | (48,647 | ) | | | — | | | | (48,647 | ) |
For further information regarding security characteristics, see the Portfolio of Investments.
The following is a reconciliation of level 3 assets for which significant unobservable inputs were used to determine fair value. The fund’s policy is to recognize transfers between the levels as of the end of the period. The table presents the activity of level 3 securities held at the beginning and the end of the period.
| | | | |
| | | Equity Securities | |
| Balance as of 10/31/13 | | | $36,409 | |
Change in unrealized appreciation (depreciation) | | | 4,679 | |
| Balance as of 4/30/14 | | | $41,088 | |
The net change in unrealized appreciation (depreciation) from investments still held as level 3 at April 30, 2014 is $4,679.
Foreign Currency Translation – Purchases and sales of foreign investments, income, and expenses are converted into U.S. dollars based upon currency exchange rates prevailing on the respective dates of such transactions or on the reporting date for foreign denominated receivables and payables. Gains and losses attributable to foreign currency exchange rates on sales of securities are recorded for financial statement purposes as net realized gains and losses on investments. Gains and losses attributable to foreign exchange rate movements on receivables, payables, income and expenses are recorded for financial statement purposes as foreign currency transaction gains and losses. That portion of both realized and unrealized gains and losses on investments that results from fluctuations in foreign currency exchange rates is not separately disclosed.
29
Notes to Financial Statements (unaudited) – continued
Derivatives – The fund uses derivatives for different purposes, primarily to increase or decrease exposure to a particular market or segment of the market, or security, to increase or decrease interest rate or currency exposure, or as alternatives to direct investments. Derivatives are used for hedging or non-hedging purposes. While hedging can reduce or eliminate losses, it can also reduce or eliminate gains. When the fund uses derivatives as an investment to increase market exposure, or for hedging purposes, gains and losses from derivative instruments may be substantially greater than the derivative’s original cost.
The derivative instruments used by the fund were futures contracts and forward foreign currency exchange contracts. The fund’s period end derivatives, as presented in the Portfolio of Investments and the associated Derivative Contract tables, generally are indicative of the volume of its derivative activity during the period.
The following table presents, by major type of derivative contract, the fair value, on a gross basis, of the asset and liability components of derivatives held by the fund at April 30, 2014 as reported in the Statement of Assets and Liabilities:
| | | | | | | | | | |
| | | | | Fair Value (a) | |
| Risk | | Derivative Contracts | | Asset Derivatives | | | Liability Derivatives | |
| Interest Rate | | Interest Rate Futures | | | $— | | | $ | (38,098 | ) |
| Foreign Exchange | | Forward Foreign Currency Exchange | | | — | | | | (48,647 | ) |
| Total | | | | | $— | | | $ | (86,745 | ) |
| (a) | The value of futures contracts outstanding includes cumulative appreciation (depreciation) as reported in the fund’s Portfolio of Investments. Only the current day variation margin for futures contracts is separately reported within the fund’s Statement of Assets and Liabilities. |
The following table presents, by major type of derivative contract, the realized gain (loss) on derivatives held by the fund for the six months ended April 30, 2014 as reported in the Statement of Operations:
| | | | | | | | |
| Risk | | Futures
Contracts | | | Foreign
Currency | |
| Interest Rate | | | $(637,487 | ) | | | $— | |
| Foreign Exchange | | | — | | | | (191,692 | ) |
| Total | | | $(637,487 | ) | | | $(191,692 | ) |
The following table presents, by major type of derivative contract, the change in unrealized appreciation (depreciation) on derivatives held by the fund for the six months ended April 30, 2014 as reported in the Statement of Operations:
| | | | | | | | |
| Risk | | Futures
Contracts | | | Translation
of Assets
and
Liabilities in
Foreign
Currencies | |
| Interest Rate | | | $616,885 | | | | $— | |
| Foreign Exchange | | | — | | | | 1,767 | |
| Total | | | $616,885 | | | | $1,767 | |
30
Notes to Financial Statements (unaudited) – continued
Derivative counterparty credit risk is managed through formal evaluation of the creditworthiness of all potential counterparties. On certain, but not all, over-the-counter derivatives, the fund attempts to reduce its exposure to counterparty credit risk whenever possible by entering into an International Swaps and Derivatives Association (ISDA) Master Agreement on a bilateral basis with each of the counterparties with whom it undertakes a significant volume of transactions. The ISDA Master Agreement gives each party to the agreement the right to terminate all transactions traded under such agreement if there is a certain deterioration in the credit quality of the other party. Upon an event of default or a termination of the ISDA Master Agreement, the non-defaulting party has the right to close out all transactions traded under such agreement and to net amounts owed under each transaction to one net amount payable by one party to the other. This right to close out and net payments across all transactions traded under the ISDA Master Agreement could result in a reduction of the fund’s credit risk to such counterparty equal to any amounts payable by the fund under the applicable transactions, if any. The fund’s right to setoff may be restricted or prohibited by the bankruptcy or insolvency laws of the particular jurisdiction to which a specific ISDA counterparty is subject.
Collateral and margin requirements differ by type of derivative. Margin requirements are set by the broker or clearing house for cleared derivatives (i.e., futures contracts, cleared swaps, and exchange-traded options) while collateral terms are contract specific for over-the-counter traded derivatives (i.e., forward foreign currency exchange contracts, uncleared swap agreements, and over-the-counter options). For derivatives traded under an ISDA Master Agreement, the collateral requirements are netted across all transactions traded under such agreement and one amount is posted from one party to the other to collateralize such obligations. Cash that has been segregated to cover the fund’s collateral or margin obligations under derivative contracts, if any, will be reported separately in the Statement of Assets and Liabilities as “Restricted cash” or “Deposits with brokers.” Securities pledged as collateral or margin for the same purpose, if any, are noted in the Portfolio of Investments.
Purchased Options – The fund purchased call options for a premium. Purchased call options entitle the holder to buy a specified number of shares or units of a particular security, currency or index at a specified price at a specified date or within a specified period of time. Purchasing call options may hedge against an anticipated increase in the dollar cost of securities or currency to be acquired or increase the fund’s exposure to an underlying instrument. Purchasing put options may hedge against an anticipated decline in the value of portfolio securities or currency or decrease the fund’s exposure to an underlying instrument.
The premium paid is initially recorded as an investment in the Statement of Assets and Liabilities. That investment is subsequently marked-to-market daily with the difference between the premium paid and the market value of the purchased option being recorded as unrealized appreciation or depreciation. Premiums paid for purchased call options which have expired are treated as realized losses on investments in the Statement of Operations. Upon the exercise or closing of a purchased call option, the premium paid is added to the cost of the security or financial instrument purchased.
Whether or not the option is exercised, the fund’s maximum risk of loss from purchasing an option is the amount of premium paid. All option contracts involve
31
Notes to Financial Statements (unaudited) – continued
credit risk if the counterparty to the option contract fails to perform. For over-the-counter options, this risk is mitigated in cases where there is an ISDA Master Agreement between the fund and the counterparty providing for netting as described above and for posting of collateral by the counterparty to the fund to cover the fund’s exposure to the counterparty under such ISDA Master Agreement.
Futures Contracts – The fund entered into futures contracts which may be used to hedge against or obtain broad market exposure, interest rate exposure, currency exposure, or to manage duration. A futures contract represents a commitment for the future purchase or sale of an asset at a specified price on a specified date.
Upon entering into a futures contract, the fund is required to deposit with the broker, either in cash or securities, an initial margin in an amount equal to a certain percentage of the notional amount of the contract. Subsequent payments (variation margin) are made or received by the fund each day, depending on the daily fluctuations in the value of the contract, and are recorded for financial statement purposes as unrealized gain or loss by the fund until the contract is closed or expires at which point the gain or loss on futures contracts is realized.
The fund bears the risk of interest rates, exchange rates or securities prices moving unexpectedly, in which case, the fund may not achieve the anticipated benefits of the futures contracts and may realize a loss. While futures contracts may present less counterparty risk to the fund since the contracts are exchange traded and the exchange’s clearinghouse guarantees payments to the broker, there is still counterparty credit risk due to the insolvency of the broker. The fund’s maximum risk of loss due to counterparty credit risk is equal to the margin posted by the fund to the broker plus any gains or minus any losses on the outstanding futures contracts.
Forward Foreign Currency Exchange Contracts – The fund entered into forward foreign currency exchange contracts for the purchase or sale of a specific foreign currency at a fixed price on a future date. These contracts may be used to hedge the fund’s currency risk or for non-hedging purposes. For hedging purposes, the fund may enter into contracts to deliver or receive foreign currency that the fund will receive from or use in its normal investment activities. The fund may also use contracts to hedge against declines in the value of foreign currency denominated securities due to unfavorable exchange rate movements. For non-hedging purposes, the fund may enter into contracts with the intent of changing the relative exposure of the fund’s portfolio of securities to different currencies to take advantage of anticipated exchange rate changes.
Forward foreign currency exchange contracts are adjusted by the daily exchange rate of the underlying currency and any unrealized gains or losses are recorded as a receivable or payable for forward foreign currency exchange contracts until the contract settlement date. On contract settlement date, any gain or loss on the contract is recorded as realized gains or losses on foreign currency.
Risks may arise upon entering into these contracts from unanticipated movements in the value of the contract and from the potential inability of counterparties to meet the terms of their contracts. Generally, the fund’s maximum risk due to counterparty credit risk is the unrealized gain on the contract due to the use of Continuous Linked Settlement, an industry accepted settlement system. This risk is mitigated in cases
32
Notes to Financial Statements (unaudited) – continued
where there is an ISDA Master Agreement between the fund and the counterparty providing for netting as described above and for posting of collateral by the counterparty to the fund to cover the fund’s exposure to the counterparty under such ISDA Master Agreement.
Swap Agreements – During the period the fund entered into swap agreements. Effective June 10, 2013, certain types of swaps (“cleared swaps”) are required to be centrally cleared under provisions of the Dodd-Frank Regulatory Reform Bill. In a cleared swap transaction, the swap agreement is novated to a central counterparty (the “clearinghouse”) immediately following execution of the swap contract with an executing broker. Thereafter, throughout the term of the cleared swap, the fund interfaces indirectly with the clearinghouse through a clearing broker.
A swap agreement is generally an exchange of cash payments, at specified intervals or upon the occurrence of specified events, between the fund and a counterparty. The net cash payments exchanged are recorded as a realized gain or loss on swap agreements in the Statement of Operations. The value of the swap agreement, which is adjusted daily and includes any related interest accruals to be paid or received by the fund, is recorded in the Statement of Assets and Liabilities, as “Swaps, at value” for uncleared swaps and is included in “Due from brokers” or “Due to brokers” for cleared swaps. The daily change in value, including any related interest accruals to be paid or received, is recorded as unrealized appreciation or depreciation on swap agreements in the Statement of Operations. The daily change in valuation of cleared swaps is recorded as a receivable or payable for variation margin in the Statement of Assets and Liabilities. Amounts paid or received at the inception of the swap agreement are reflected as premiums paid or received in the Statement of Assets and Liabilities and are amortized using the effective interest method over the term of the agreement. A liquidation payment received or made upon early termination is recorded as a realized gain or loss on swap agreements in the Statement of Operations.
Risks related to swap agreements include the possible lack of a liquid market, unfavorable market and interest rate movements of the underlying instrument and the failure of the counterparty to perform under the terms of the agreements. To address counterparty risk, swap agreements are limited to only highly-rated counterparties. For uncleared swaps, that risk is further reduced by having an ISDA Master Agreement between the fund and the counterparty providing for netting as described above and by the posting of collateral by the counterparty to the fund to cover the fund’s exposure to the counterparty under such ISDA Master Agreement. Although not covered by an ISDA Master Agreement, the fund’s counterparty risk due to cleared swaps is mitigated by the clearinghouses’ margining requirements and financial safeguards in the event of a clearing broker default.
The fund entered into credit default swap agreements in order to manage its exposure to the market or certain sectors of the market, to reduce its credit risk exposure to defaults of corporate and sovereign issuers or to create exposure to corporate or sovereign issuers to which it is not otherwise exposed. In a credit default swap agreement, the protection buyer can make an upfront payment and will make a stream of payments to the protection seller based on a fixed percentage applied to the agreement notional amount in exchange for the right to receive a specified return upon the occurrence of a defined credit event on the reference obligation (which may
33
Notes to Financial Statements (unaudited) – continued
be either a single security or a basket of securities issued by corporate or sovereign issuers) and, with respect to the rare cases where physical settlement applies, the delivery by the buyer to the seller of a defined deliverable obligation. Although agreement-specific, credit events generally consist of a combination of the following: bankruptcy, failure to pay, restructuring, obligation acceleration, obligation default, or repudiation/moratorium, each as defined in the 2003 ISDA Credit Derivatives Definitions as amended by the relevant agreement. Restructuring is generally not applicable when the reference obligation is issued by a North American corporation and obligation acceleration, obligation default, or repudiation/moratorium are generally only applicable when the reference obligation is issued by a sovereign entity or an entity in an emerging country. Upon determination of the final price for the deliverable obligation (or upon delivery of the deliverable obligation in the case of physical settlement), the difference between the value of the deliverable obligation and the swap agreement’s notional amount is recorded as realized gain or loss on swap agreements in the Statement of Operations.
The fund’s maximum risk of loss from counterparty risk, either as the protection seller or as the protection buyer, is the fair value of the agreement. For uncleared swaps, counterparty risk is reduced by having an ISDA Master Agreement between the fund and the counterparty providing for netting as described above and by the posting of collateral by the counterparty to the fund to cover the fund’s exposure to the counterparty under such ISDA Master Agreement. For cleared swaps, the fund’s counterparty risk is mitigated by the clearinghouses’ margining requirements and financial safeguards in the event of a clearing broker default.
Loans and Other Direct Debt Instruments – The fund invests in loans and loan participations or other receivables. These investments may include standby financing commitments, including revolving credit facilities, which obligate the fund to supply additional cash to the borrower on demand. Loan participations involve a risk of insolvency of the lending bank or other financial intermediary.
Indemnifications – Under the fund’s organizational documents, its officers and Trustees may be indemnified against certain liabilities and expenses arising out of the performance of their duties to the fund. Additionally, in the normal course of business, the fund enters into agreements with service providers that may contain indemnification clauses. The fund’s maximum exposure under these agreements is unknown as this would involve future claims that may be made against the fund that have not yet occurred.
Investment Transactions and Income – Investment transactions are recorded on the trade date. Interest income is recorded on the accrual basis. All premium and discount is amortized or accreted for financial statement purposes in accordance with U.S. generally accepted accounting principles. Dividends received in cash are recorded on the ex-dividend date. Certain dividends from foreign securities will be recorded when the fund is informed of the dividend if such information is obtained subsequent to the ex-dividend date. Dividend and interest payments received in additional securities are recorded on the ex-dividend or ex-interest date in an amount equal to the value of the security on such date.
34
Notes to Financial Statements (unaudited) – continued
The fund may receive proceeds from litigation settlements. Any proceeds received from litigation involving portfolio holdings are reflected in the Statement of Operations in realized gain/loss if the security has been disposed of by the fund or in unrealized gain/loss if the security is still held by the fund. Any other proceeds from litigation not related to portfolio holdings are reflected as other income in the Statement of Operations.
Fees Paid Indirectly – The fund’s custody fee may be reduced according to an arrangement that measures the value of cash deposited with the custodian by the fund. This amount, for the six months ended April 30, 2014, is shown as a reduction of total expenses in the Statement of Operations.
Tax Matters and Distributions – The fund intends to qualify as a regulated investment company, as defined under Subchapter M of the Internal Revenue Code, and to distribute all of its taxable income, including realized capital gains. As a result, no provision for federal income tax is required. The fund’s federal tax returns, when filed, will remain subject to examination by the Internal Revenue Service for a three year period. Management has analyzed the fund’s tax positions taken on federal and state tax returns for all open tax years and does not believe that there are any uncertain tax positions that require recognition of a tax liability. Foreign taxes, if any, have been accrued by the fund in the accompanying financial statements in accordance with the applicable foreign tax law. Foreign income taxes may be withheld by certain countries in which the fund invests. Additionally, capital gains realized by the fund on securities issued in or by certain foreign countries may be subject to capital gains tax imposed by those countries.
Distributions to shareholders are recorded on the ex-dividend date. Income and capital gain distributions are determined in accordance with income tax regulations, which may differ from U.S. generally accepted accounting principles. Certain capital accounts in the financial statements are periodically adjusted for permanent differences in order to reflect their tax character. These adjustments have no impact on net assets or net asset value per share. Temporary differences which arise from recognizing certain items of income, expense, gain or loss in different periods for financial statement and tax purposes will reverse at some time in the future. Distributions in excess of net investment income or net realized gains are temporary overdistributions for financial statement purposes resulting from differences in the recognition or classification of income or distributions for financial statement and tax purposes.
Book/tax differences primarily relate to amortization and accretion of debt securities, straddle loss deferrals and derivative transactions.
The tax character of distributions made during the current period will be determined at fiscal year end. The tax character of distributions declared to shareholders for the last fiscal year is as follows:
| | | | |
| | | 10/31/13 | |
Ordinary income (including any
short-term capital gains) | | | $14,021,721 | |
35
Notes to Financial Statements (unaudited) – continued
The federal tax cost and the tax basis components of distributable earnings were as follows:
| | | | |
| As of 4/30/14 | | | |
| Cost of investments | | | $312,046,458 | |
| Gross appreciation | | | 14,773,717 | |
| Gross depreciation | | | (3,226,145 | ) |
| Net unrealized appreciation (depreciation) | | | $11,547,572 | |
| |
| As of 10/31/13 | | | |
| Undistributed ordinary income | | | 2,632,641 | |
| Capital loss carryforwards | | | (10,429,548 | ) |
| Other temporary differences | | | (3,244,545 | ) |
| Net unrealized appreciation (depreciation) | | | 10,285,126 | |
The aggregate cost above includes prior fiscal year end tax adjustments, if applicable.
Under the Regulated Investment Company Modernization Act of 2010 (the “Act”), net capital losses recognized for fund fiscal years beginning after October 31, 2011 may be carried forward indefinitely, and their character is retained as short-term and/or long-term losses (“post-enactment losses”). Previously, net capital losses were carried forward for eight years and treated as short-term losses (“pre-enactment losses”). As a transition rule, the Act requires that all post-enactment net capital losses be used before pre-enactment net capital losses.
As of October 31, 2013, the fund had capital loss carryforwards available to offset future realized gains. Such pre-enactment losses expire as follows:
| | | | |
| 10/31/16 | | | $(3,691,429 | ) |
| 10/31/17 | | | (6,738,119 | ) |
| Total | | | $(10,429,548 | ) |
Multiple Classes of Shares of Beneficial Interest – The fund offers multiple classes of shares, which differ in their respective distribution and service fees. The fund’s income and common expenses are allocated to shareholders based on the value of settled shares outstanding of each class. The fund’s realized and unrealized gain (loss) are allocated to shareholders based on the daily net assets of each class. Dividends are declared separately for each class. Differences in per share dividend rates are generally due to differences in separate class expenses. Class B shares will convert to Class A
36
Notes to Financial Statements (unaudited) – continued
shares approximately eight years after purchase. The fund’s distributions declared to shareholders as reported in the Statements of Changes in Net Assets are presented by class as follows:
| | | | | | | | |
| | | From net investment
income | |
| | | Six months
ended
4/30/14 | | | Year
ended
10/31/13 | |
| Class A | | | $4,899,628 | | | | $10,003,064 | |
| Class B | | | 686,794 | | | | 1,432,711 | |
| Class C | | | 924,311 | | | | 1,979,024 | |
| Class I | | | 280,467 | | | | 606,922 | |
| Total | | | $6,791,200 | | | | $14,021,721 | |
(3) Transactions with Affiliates
Investment Adviser – The fund has an investment advisory agreement with MFS to provide overall investment management and related administrative services and facilities to the fund. The management fee is computed daily and paid monthly at an annual rate of 0.65% of the fund’s average daily net assets. The investment adviser has agreed in writing to reduce its management fee to 0.60% of average daily net assets. This written agreement will continue until modified by the fund’s Board of Trustees, but such agreement will continue at least until February 28, 2015. For the six months ended April 30, 2014, this management fee reduction amounted to $79,124, which is included in the reduction of total expenses in the Statement of Operations. MFS has also agreed in writing to reduce its management fee by a specified amount if certain MFS mutual fund assets exceed thresholds agreed to by MFS and the fund’s Board of Trustees. For the six months ended April 30, 2014, this management fee reduction amounted to $4,669, which is included in the reduction of total expenses in the Statement of Operations. The management fee incurred for the six months ended April 30, 2014, was equivalent to an annual effective rate of 0.60% of the fund’s average daily net assets.
The investment adviser has agreed in writing to pay a portion of the fund’s total annual operating expenses, exclusive of interest, taxes, extraordinary expenses, brokerage and transaction costs and investment-related expenses (such as fees and expenses associated with investments in investment companies and other similar investment vehicles), such that total annual fund operating expenses do not exceed the following rates annually of each class’s average daily net assets:
| | | | | | | | | | | | | | |
| Class A | | | Class B | | | Class C | | | Class I | |
| | 1.05% | | | | 1.80 | % | | | 1.80 | % | | | 0.80 | % |
This written agreement will continue until modified by the fund’s Board of Trustees, but such agreement will continue at least until February 28, 2015. For the six months ended April 30, 2014, this reduction amounted to $52,602 and is included in the reduction of total expenses in the Statement of Operations.
Distributor – MFS Fund Distributors, Inc. (MFD), a wholly-owned subsidiary of MFS, as distributor, received $52,154 for the six months ended April 30, 2014, as its portion of the initial sales charge on sales of Class A shares of the fund.
37
Notes to Financial Statements (unaudited) – continued
The Board of Trustees has adopted a distribution plan for certain share classes pursuant to Rule 12b-1 of the Investment Company Act of 1940.
The fund’s distribution plan provides that the fund will pay MFD for services provided by MFD and financial intermediaries in connection with the distribution and servicing of certain share classes. One component of the plan is a distribution fee paid to MFD and another component of the plan is a service fee paid to MFD. MFD may subsequently pay all, or a portion, of the distribution and/or service fees to financial intermediaries.
Distribution Plan Fee Table:
| | | | | | | | | | | | | | | | | | | | |
| | | Distribution
Fee Rate (d) | | | Service
Fee Rate (d) | | | Total
Distribution
Plan (d) | | | Annual
Effective
Rate (e) | | | Distribution
and Service
Fee | |
| Class A | | | — | | | | 0.25% | | | | 0.25% | | | | 0.25% | | | | $272,969 | |
| Class B | | | 0.75% | | | | 0.25% | | | | 1.00% | | | | 1.00% | | | | 183,898 | |
| Class C | | | 0.75% | | | | 0.25% | | | | 1.00% | | | | 1.00% | | | | 247,503 | |
| Total Distribution and Service Fees | | | | | | | | $704,370 | |
| (d) | In accordance with the distribution plan for certain classes, the fund pays distribution and/or service fees equal to these annual percentage rates of each class’s average daily net assets. The distribution and service fee rates disclosed by class represent the current rates in effect at the end of the reporting period. Any rate changes, if applicable, are detailed below. |
| (e) | The annual effective rates represent actual fees incurred under the distribution plan for the six months ended April 30, 2014 based on each class’s average daily net assets. MFD has voluntarily agreed to rebate a portion of each class’s 0.25% service fee attributable to accounts for which MFD retains the 0.25% service fee except for accounts attributable to MFS or its affiliates’ seed money. For the six months ended April 30, 2014, this rebate amounted to $5,270, $29, and $29 for Class A, Class B, and Class C, respectively, and is included in the reduction of total expenses in the Statement of Operations. |
Certain Class A shares are subject to a contingent deferred sales charge (CDSC) in the event of a shareholder redemption within 18 months of purchase for shares purchased on or after August 1, 2012, and within 24 months of purchase for shares purchased prior to August 1, 2012. Class C shares are subject to a CDSC in the event of a shareholder redemption within 12 months of purchase. Class B shares are subject to a CDSC in the event of a shareholder redemption within six years of purchase. All contingent deferred sales charges are paid to MFD and during the six months ended April 30, 2014, were as follows:
| | | | |
| | | Amount | |
| Class A | | | $3,369 | |
| Class B | | | 23,711 | |
| Class C | | | 2,950 | |
Shareholder Servicing Agent – MFS Service Center, Inc. (MFSC), a wholly-owned subsidiary of MFS, receives a fee from the fund for its services as shareholder servicing agent calculated as a percentage of the average daily net assets of the fund as determined periodically under the supervision of the fund’s Board of Trustees. For the six months ended April 30, 2014, the fee was $64,748, which equated to 0.0409% annually of the fund’s average daily net assets. MFSC also receives payment from the fund for out-of-pocket expenses, sub-accounting and other shareholder servicing costs
38
Notes to Financial Statements (unaudited) – continued
which may be paid to affiliated and unaffiliated service providers. For the six months ended April 30, 2014, these out-of-pocket expenses, sub-accounting and other shareholder servicing costs amounted to $144,165.
Administrator – MFS provides certain financial, legal, shareholder communications, compliance, and other administrative services to the fund. Under an administrative services agreement, the fund partially reimburses MFS the costs incurred to provide these services. The fund is charged an annual fixed amount of $17,500 plus a fee based on average daily net assets. The administrative services fee incurred for the six months ended April 30, 2014 was equivalent to an annual effective rate of 0.0152% of the fund’s average daily net assets.
Trustees’ and Officers’ Compensation – The fund pays compensation to independent Trustees in the form of a retainer, attendance fees, and additional compensation to Board and Committee chairpersons. The fund does not pay compensation directly to Trustees or officers of the fund who are also officers of the investment adviser, all of whom receive remuneration for their services to the fund from MFS. Certain officers and Trustees of the fund are officers or directors of MFS, MFD, and MFSC.
Prior to December 31, 2001, the fund had an unfunded defined benefit plan (“DB plan”) for independent Trustees. As of December 31, 2001, the Board took action to terminate the DB plan with respect to then-current and any future independent Trustees, such that the DB plan covers only certain of those former independent Trustees who retired on or before December 31, 2001. Effective January 1, 2002, accrued benefits under the DB plan for then-current independent Trustees who continued were credited to an unfunded retirement deferral plan (the “Retirement Deferral plan”), which was established for and exists solely with respect to these credited amounts, and is not available for other deferrals by these or other independent Trustees. Although the Retirement Deferral plan is unfunded, amounts deferred under the plan are periodically adjusted for investment experience as if they had been invested in shares of the fund. The DB plan resulted in a pension expense of $131 and the Retirement Deferral plan resulted in an expense of $261. Both amounts are included in independent Trustees’ compensation for the six months ended April 30, 2014. The liability for deferred retirement benefits payable to certain independent Trustees under both plans amounted to $9,688 at April 30, 2014, and is included in “Payable for independent Trustees’ compensation” in the Statement of Assets and Liabilities.
Other – This fund and certain other funds managed by MFS (the funds) have entered into services agreements (the Agreements) which provide for payment of fees by the funds to Tarantino LLC and Griffin Compliance LLC in return for the provision of services of an Independent Chief Compliance Officer (ICCO) and Assistant ICCO, respectively, for the funds. The ICCO and Assistant ICCO are officers of the funds and the sole members of Tarantino LLC and Griffin Compliance LLC, respectively. The funds can terminate the Agreements with Tarantino LLC and Griffin Compliance LLC at any time under the terms of the Agreements. For the six months ended April 30, 2014, the aggregate fees paid by the fund to Tarantino LLC and Griffin Compliance LLC were $1,005 and are included in “Miscellaneous” expense in the Statement of Operations. MFS has agreed to reimburse the fund for a portion of the payments made by the fund
39
Notes to Financial Statements (unaudited) – continued
in the amount of $229, which is included in the reduction of total expenses in the Statement of Operations. Additionally, MFS has agreed to bear all expenses associated with office space, other administrative support, and supplies provided to the ICCO and Assistant ICCO.
The fund invests in the MFS Institutional Money Market Portfolio which is managed by MFS and seeks current income consistent with preservation of capital and liquidity. Income earned on this investment is included in “Dividends from underlying affiliated funds” in the Statement of Operations. This money market fund does not pay a management fee to MFS.
The fund invests in the High Yield Pooled Portfolio. The High Yield Pooled Portfolio is a mutual fund advised by MFS that does not pay management fees to MFS but does incur investment and operating costs. The High Yield Pooled Portfolio is designed to be used by MFS funds to invest in a particular security type rather than invest in the security type directly. The fund invests in the High Yield Pooled Portfolio to gain exposure to high income debt instruments, rather than investing in high income debt instruments directly.
At close of business on March 22, 2013, the fund and certain other MFS funds transferred high income debt instruments, accrued interest and cash to the High Yield Pooled Portfolio, a series of MFS Series Trust III, in exchange for shares of the High Yield Pooled Portfolio. The purpose of the transaction was to pool the portion of the assets of the fund and certain other MFS funds invested in high income debt instruments in the High Yield Pooled Portfolio. The transfer was accomplished by a tax-free exchange by the fund of investments valued at approximately $107,444,790 with a cost basis of approximately $101,892,713 accrued interest of approximately $2,053,165 and cash of approximately $529,112 for approximately 11,002,707 shares of the High Yield Pooled Portfolio (valued at approximately $110,027,067). For financial reporting purposes, investments transferred and shares received by the fund were recorded at fair value; however, the cost basis of the investments delivered to the High Yield Pooled Portfolio was carried forward to the shares received. Income earned on this investment is included in “Dividends from underlying affiliated funds” in the Statement of Operations. The High Yield Pooled Portfolio does not pay a management fee, distribution and/or service fee, or sales charge.
(4) Portfolio Securities
Purchases and sales of investments, other than short-term obligations, were as follows:
| | | | | | | | |
| | | Purchases | | | Sales | |
| U.S. Government securities | | | $2,922,872 | | | | $1,727,941 | |
| Investments (non-U.S. Government securities) | | | $29,056,830 | | | | $27,085,751 | |
40
Notes to Financial Statements (unaudited) – continued
(5) Shares of Beneficial Interest
The fund’s Declaration of Trust permits the Trustees to issue an unlimited number of full and fractional shares of beneficial interest. Transactions in fund shares were as follows:
| | | | | | | | | | | | | | | | |
| | | Six months ended
4/30/14 | | | Year ended
10/31/13 | |
| | | Shares | | | Amount | | | Shares | | | Amount | |
| Shares sold | | | | | | | | | | | | | | | | |
Class A | | | 3,560,801 | | | | $24,000,956 | | | | 7,850,264 | | | | $53,441,803 | |
Class B | | | 476,772 | | | | 3,191,955 | | | | 1,244,269 | | | | 8,400,049 | |
Class C | | | 889,385 | | | | 5,922,192 | | | | 1,669,429 | | | | 11,218,637 | |
Class I | | | 523,258 | | | | 3,525,172 | | | | 1,421,745 | | | | 9,659,042 | |
| | | 5,450,216 | | | | $36,640,275 | | | | 12,185,707 | | | | $82,719,531 | |
| | | |
Shares issued to shareholders in
reinvestment of distributions | | | | | | | | | | | | | |
Class A | | | 665,816 | | | | $4,491,411 | | | | 1,279,254 | | | | $8,683,893 | |
Class B | | | 88,170 | | | | 590,438 | | | | 155,169 | | | | 1,045,000 | |
Class C | | | 116,668 | | | | 778,770 | | | | 235,912 | | | | 1,584,323 | |
Class I | | | 35,692 | | | | 240,839 | | | | 75,265 | | | | 510,092 | |
| | | 906,346 | | | | $6,101,458 | | | | 1,745,600 | | | | $11,823,308 | |
| | | |
| Shares reacquired | | | | | | | | | | | | | |
Class A | | | (3,469,243 | ) | | | $(23,376,925 | ) | | | (8,814,020 | ) | | | $(59,734,159 | ) |
Class B | | | (714,419 | ) | | | (4,780,569 | ) | | | (1,486,947 | ) | | | (10,012,123 | ) |
Class C | | | (998,077 | ) | | | (6,653,496 | ) | | | (2,416,054 | ) | | | (16,164,686 | ) |
Class I | | | (361,050 | ) | | | (2,429,173 | ) | | | (1,417,507 | ) | | | (9,521,248 | ) |
| | | (5,542,789 | ) | | | $(37,240,163 | ) | | | (14,134,528 | ) | | | $(95,432,216 | ) |
| | | | |
| Net change | | | | | | | | | | | | | | | | |
Class A | | | 757,374 | | | | $5,115,442 | | | | 315,498 | | | | $2,391,537 | |
Class B | | | (149,477 | ) | | | (998,176 | ) | | | (87,509 | ) | | | (567,074 | ) |
Class C | | | 7,976 | | | | 47,466 | | | | (510,713 | ) | | | (3,361,726 | ) |
Class I | | | 197,900 | | | | 1,336,838 | | | | 79,503 | | | | 647,886 | |
| | | 813,773 | | | | $5,501,570 | | | | (203,221 | ) | | | $(889,377 | ) |
(6) Line of Credit
The fund and certain other funds managed by MFS participate in a $1.1 billion unsecured committed line of credit, subject to a $1 billion sublimit, provided by a syndication of banks under a credit agreement. Borrowings may be made for temporary financing needs. Interest is charged to each fund, based on its borrowings, generally at a rate equal to the higher of the Federal Reserve funds rate or one month LIBOR plus an agreed upon spread. A commitment fee, based on the average daily, unused portion of the committed line of credit, is allocated among the participating funds at the end of each calendar quarter. In addition, the fund and other funds managed by MFS have established unsecured uncommitted borrowing arrangements with certain banks for temporary financing needs. Interest is charged to each fund, based on its borrowings, at a rate equal to the Federal Reserve funds rate plus an
41
Notes to Financial Statements (unaudited) – continued
agreed upon spread. For the six months ended April 30, 2014, the fund’s commitment fee and interest expense were $698 and $0, respectively, and are included in “Miscellaneous” expense in the Statement of Operations.
(7) Transactions in Underlying Affiliated Funds-Affiliated Issuers
An affiliated issuer may be considered one in which the fund owns 5% or more of the outstanding voting securities, or a company which is under common control. For the purposes of this report, the fund assumes the following to be affiliated issuers:
| | | | | | | | | | | | | | | | |
| Underlying Affiliated Funds | | Beginning
Shares/Par
Amount | | | Acquisitions
Shares/Par
Amount | | | Dispositions
Shares/Par
Amount | | | Ending
Shares/Par
Amount | |
| MFS High Yield Pooled Portfolio | | | 10,984,557 | | | | 802,444 | | | | (759,884 | ) | | | 11,027,117 | |
MFS Institutional Money
Market Portfolio | | | 4,120,342 | | | | 29,094,468 | | | | (27,244,327 | ) | | | 5,970,483 | |
| | | | |
| Underlying Affiliated Funds | | Realized
Gain (Loss) | | | Capital Gain
Distributions | | | Dividend
Income | | | Ending
Value | |
| MFS High Yield Pooled Portfolio | | | $819,441 | | | | $784,528 | | | | $3,722,395 | | | | $109,940,353 | |
MFS Institutional Money
Market Portfolio | | | — | | | | — | | | | 1,636 | | | | 5,970,483 | |
| Total | | | $819,441 | | | | $784,528 | | | | $3,724,031 | | | | $115,910,836 | |
42
BOARD REVIEW OF INVESTMENT ADVISORY AGREEMENT
A discussion regarding the Board’s most recent review and renewal of the fund’s Investment Advisory Agreement with MFS is available by clicking on the fund’s name under “Mutual Funds” in the “Products” section of the MFS Web site (mfs.com).
PROXY VOTING POLICIES AND INFORMATION
MFS votes proxies on behalf of the fund pursuant to proxy voting policies and procedures that are available without charge, upon request, by calling 1-800-225-2606, by visiting the Proxy Voting section of mfs.com or by visiting the SEC’s Web site at http://www.sec.gov.
Information regarding how the fund voted proxies relating to portfolio securities during the twelve-month period ended June 30, 2013 is available without charge by visiting the Proxy Voting section of mfs.com or by visiting the SEC’s Web site at http://www.sec.gov.
QUARTERLY PORTFOLIO DISCLOSURE
The fund will file a complete schedule of portfolio holdings with the Securities and Exchange Commission (the Commission) for the first and third quarters of each fiscal year on Form N-Q. A shareholder can obtain the quarterly portfolio holdings report at mfs.com. The fund’s Form N-Q is also available on the EDGAR database on the Commission’s Internet Web site at http://www.sec.gov, and may be reviewed and copied at the:
Public Reference Room
Securities and Exchange Commission
100 F Street, NE, Room 1580
Washington, D.C. 20549
Information on the operation of the Public Reference Room may be obtained by calling the Commission at 1-800-SEC-0330. Copies of the fund’s Form N-Q also may be obtained, upon payment of a duplicating fee, by electronic request at the following e-mail address: publicinfo@sec.gov, or by writing the Public Reference Section at the above address.
FURTHER INFORMATION
From time to time, MFS may post important information about the fund or the MFS funds on the MFS web site (mfs.com). This information is available by visiting the “Commentary & Announcements” and “Market Outlooks” sections of mfs.com or by clicking on the fund’s name under “Mutual Funds” in the “Products” section of mfs.com.
PROVISION OF FINANCIAL REPORTS AND SUMMARY PROSPECTUSES
The fund produces financial reports every six months and updates its summary prospectus and prospectus annually. To avoid sending duplicate copies of materials to households, only one copy of the fund’s annual and semiannual report and summary prospectus may be mailed to shareholders having the same last name and residential address on the fund’s records. However, any shareholder may contact MFSC (please see back cover for address and telephone number) to request that copies of these reports and summary prospectuses be sent personally to that shareholder.
43
Save paper with eDelivery.

| MFS® will send you prospectuses, |
reports, and proxies directly via e-mail so you will get information faster with less mailbox clutter.
To sign up:
1. Go to mfs.com.
2. Log in via MFS® Access.
3. Select eDelivery.
If you own your MFS fund shares through a financial institution or a retirement plan, MFS® TALK, MFS® Access, or eDelivery may not be available to you.
CONTACT
WEB SITE
mfs.com
MFS TALK
1-800-637-8255
24 hours a day
ACCOUNT SERVICE AND LITERATURE
Shareholders
1-800-225-2606
Financial advisors
1-800-343-2829
Retirement plan services
1-800-637-1255
MAILING ADDRESS
MFS Service Center, Inc.
P.O. Box 55824
Boston, MA 02205-5824
OVERNIGHT MAIL
MFS Service Center, Inc.
c/o Boston Financial Data Services
30 Dan Road
Canton, MA 02021-2809
During the period covered by this report, the Registrant has not amended any provision in its Code of Ethics (the “Code”) that relates to an element of the Code’s definitions enumerated in paragraph (b) of Item 2 of this Form N-CSR. During the period covered by this report, the Registrant did not grant a waiver, including an implicit waiver, from any provision of the Code.
| ITEM 3. | AUDIT COMMITTEE FINANCIAL EXPERT. |
Not applicable for semi-annual reports.
| ITEM 4. | PRINCIPAL ACCOUNTANT FEES AND SERVICES. |
Not applicable for semi-annual reports.
| ITEM 5. | AUDIT COMMITTEE OF LISTED REGISTRANTS. |
Not applicable to the Registrant.
A schedule of investments for each series of the Registrant is included as part of the report to shareholders of such series under Item 1 of this Form N-CSR.
| ITEM 7. | DISCLOSURE OF PROXY VOTING POLICIES AND PROCEDURES FOR CLOSED-END MANAGEMENT INVESTMENT COMPANIES. |
Not applicable to the Registrant.
| ITEM 8. | PORTFOLIO MANAGERS OF CLOSED-END MANAGEMENT INVESTMENT COMPANIES. |
Not applicable to the Registrant.
| ITEM 9. | PURCHASES OF EQUITY SECURITIES BY CLOSED-END MANAGEMENT INVESTMENT COMPANY AND AFFILIATED PURCHASERS. |
Not applicable to the Registrant.
| ITEM 10. | SUBMISSION OF MATTERS TO A VOTE OF SECURITY HOLDERS. |
There were no material changes to the procedures by which shareholders may send recommendations to the Board for nominees to the Registrant’s Board since the Registrant last provided disclosure as to such procedures in response to the requirements of Item 407 (c)(2)(iv) of Regulation S-K or this Item.
| ITEM 11. | CONTROLS AND PROCEDURES. |
| (a) | Based upon their evaluation of the effectiveness of the registrant’s disclosure controls and procedures (as defined in Rule 30a-3(c) under the Investment Company Act of 1940 (the “Act”)) as conducted within 90 days of the filing date of this report on Form N-CSR, the registrant’s principal financial officer and principal executive officer have concluded that those disclosure controls and procedures provide reasonable assurance that the material information required to be disclosed by the registrant on this report is recorded, processed, summarized and reported within the time periods specified in the Securities and Exchange Commission’s rules and forms. |
| (b) | There were no changes in the registrant’s internal controls over financial reporting (as defined in Rule 30a-3(d) under the Act) that occurred during the second fiscal quarter of the period covered by the report that have materially affected, or are reasonably likely to materially affect, the registrant’s internal control over financial reporting. |
| (a) | File the exhibits listed below as part of this form. Letter or number the exhibits in the sequence indicated. |
| | (1) | Any code of ethics, or amendment thereto, that is the subject of the disclosure required by Item 2, to the extent that the registrant intends to satisfy the Item 2 requirements through filing of an exhibit. |
| | (2) | A separate certification for each principal executive officer and principal financial officer of the registrant as required by Rule 30a-2(a) under the Act (17 CFR 270.30a-2): Attached hereto. |
| (b) | If the report is filed under Section 13(a) or 15(d) of the Exchange Act, provide the certifications required by Rule 30a-2(b) under the Act (17 CFR 270.30a-2(b)), Rule 13a-14(b) or Rule 15d-14(b) under the Exchange Act (17 CFR 240.13a-14(b) or 240.15d-14(b)) and Section 1350 of Chapter 63 of Title 18 of the United States Code (18 U.S.C. 1350) as an exhibit. A certification furnished pursuant to this paragraph will not be deemed “filed” for the purposes of Section 18 of the Exchange Act (15 U.S.C. 78r), or otherwise subject to the liability of that section. Such certification will not be deemed to be incorporated by reference into any filing under the Securities Act of 1933 or the Exchange Act, except to the extent that the registrant specifically incorporates it by reference: Attached hereto. |
Notice
A copy of the Amended and Restated Declaration of Trust, as amended, of the Registrant is on file with the Secretary of State of The Commonwealth of Massachusetts and notice is hereby given that this instrument is executed on behalf of the Registrant by an officer of the Registrant as an officer and not individually and the obligations of or arising out of this instrument are not binding upon any of the Trustees or shareholders individually, but are binding only upon the assets and property of the respective constituent series of the Registrant.
SIGNATURES
Pursuant to the requirements of the Securities Exchange Act of 1934 and the Investment Company Act of 1940, the registrant has duly caused this report to be signed on its behalf by the undersigned, thereunto duly authorized.
(Registrant) MFS SERIES TRUST VIII
| | |
| By (Signature and Title)* | | JOHN M. CORCORAN |
| | John M. Corcoran, President |
Date: June 17, 2014
Pursuant to the requirements of the Securities Exchange Act of 1934 and the Investment Company Act of 1940, this report has been signed below by the following persons on behalf of the registrant and in the capacities and on the dates indicated.
| | |
| By (Signature and Title)* | | JOHN M. CORCORAN |
| | John M. Corcoran, President (Principal Executive Officer) |
Date: June 17, 2014
| | |
| By (Signature and Title)* | | DAVID L. DILORENZO |
| | David L. DiLorenzo, Treasurer (Principal Financial Officer and Accounting Officer) |
Date: June 17, 2014
| * | Print name and title of each signing officer under his or her signature. |