UNITED STATES
SECURITIES AND EXCHANGE COMMISSION
Washington, D.C. 20549
FORM N-CSR
CERTIFIED SHAREHOLDER REPORT OF
REGISTERED MANAGEMENT INVESTMENT COMPANIES
Investment Company Act file number 811-05262
MFS SERIES TRUST VIII
(Exact name of registrant as specified in charter)
111 Huntington Avenue, Boston, Massachusetts 02199
(Address of principal executive offices) (Zip code)
Christopher R. Bohane
Massachusetts Financial Services Company
111 Huntington Avenue
Boston, Massachusetts 02199
(Name and address of agents for service)
Registrant’s telephone number, including area code: (617) 954-5000
Date of fiscal year end: October 31
Date of reporting period: April 30, 2018
| ITEM 1. | REPORTS TO STOCKHOLDERS. |
Semiannual Report
April 30, 2018

MFS® Global Growth Fund

WGF-SEM
MFS® Global Growth Fund
CONTENTS
The report is prepared for the general information of shareholders.
It is authorized for distribution to prospective investors only when preceded or accompanied by a current prospectus.
NOT FDIC INSURED • MAY LOSE VALUE • NO BANK GUARANTEE

LETTER FROM THE EXECUTIVE CHAIRMAN
Dear Shareholders:
Rising bond yields have led to a measurable uptick in market volatility — a departure from the low-volatility environment that prevailed for much of 2017. In recent months,
against this backdrop, global markets have given back some of the strong gains recorded during 2017 and early 2018. Global economic growth remains robust, notwithstanding signs of a modest slowdown over the past few months, particularly in Europe.
Although the U.S. Federal Reserve continues to gradually raise interest rates and shrink its balance sheet, monetary policy remains accommodative around the world, with many central banks taking only tentative steps toward tighter policies. Newly enacted U.S. tax reforms have been welcomed by equity markets, while emerging market economies have benefited from a weaker U.S. dollar.
Around the world, inflation remains largely subdued, but tight labor markets and solid global demand have investors on the lookout for its potential resurgence. Increased U.S. protectionism is also a growing concern, as investors fear that trade friction could disrupt the synchronized rise in global growth.
As a global investment manager, MFS® strives to create long-term value and protect capital for clients through an active approach and an investment platform built on nearly a century of expertise. To make that long-term value meaningful for clients, we work to align with you on our beliefs, your needs and the time it takes to deliver on your desired outcomes.
Respectfully,

Robert J. Manning
Executive Chairman
MFS Investment Management
June 18, 2018
The opinions expressed in this letter are subject to change and may not be relied upon for investment advice. No forecasts can be guaranteed.
1
PORTFOLIO COMPOSITION
Portfolio structure

| | | | |
| Top ten holdings | | | | |
| Alphabet, Inc., “A” | | | 3.5% | |
| Microsoft Corp. | | | 2.5% | |
| Accenture PLC, “A” | | | 2.2% | |
| Starbucks Corp. | | | 2.0% | |
| NIKE, Inc., “B” | | | 2.0% | |
| Reckitt Benckiser Group PLC | | | 2.0% | |
| LVMH Moet Hennessy Louis Vuitton S.A. | | | 1.9% | |
| Taiwan Semiconductor Manufacturing Co. Ltd., ADR | | | 1.9% | |
| Nestle S.A. | | | 1.8% | |
| Aon PLC | | | 1.8% | |
| |
| Equity sectors | | | | |
| Technology | | | 15.6% | |
| Consumer Staples | | | 14.7% | |
| Special Products & Services | | | 12.6% | |
| Retailing | | | 10.3% | |
| Health Care | | | 10.0% | |
| Financial Services | | | 9.6% | |
| Leisure | | | 9.3% | |
| Industrial Goods & Services | | | 6.7% | |
| Basic Materials | | | 5.0% | |
| Transportation | | | 3.0% | |
| Autos & Housing | | | 1.0% | |
| Energy | | | 0.7% | |
| | | | |
| Issuer country weightings (x) | |
| United States | | | 57.8% | |
| United Kingdom | | | 10.8% | |
| Switzerland | | | 6.2% | |
| France | | | 6.2% | |
| Japan | | | 3.3% | |
| Germany | | | 2.4% | |
| China | | | 2.3% | |
| Taiwan | | | 1.9% | |
| India | | | 1.9% | |
| Other Countries | | | 7.2% | |
|
| Currency exposure weightings (y) | |
| United States Dollar | | | 58.7% | |
| British Pound Sterling | | | 12.3% | |
| Euro | | | 9.5% | |
| Swiss Franc | | | 6.2% | |
| Japanese Yen | | | 3.3% | |
| Chinese Renminbi | | | 2.3% | |
| Taiwan Dollar | | | 1.9% | |
| Indian Rupee | | | 1.9% | |
| South Korean Won | | | 1.5% | |
| Other Currencies | | | 2.4% | |
2
Portfolio Composition – continued
| (x) | Represents the portfolio’s exposure to issuer countries as a percentage of a portfolio’s net assets. For purposes of this presentation, United States includes Cash & Cash Equivalents. |
| (y) | Represents the portfolio’s exposure to a particular currency as a percentage of a portfolio’s net assets. For purposes of this presentation, United States Dollar includes Cash & Cash Equivalents. |
Cash & Cash Equivalents includes any cash, investments in money market funds, short-term securities, and other assets less liabilities. Please see the Statement of Assets and Liabilities for additional information related to the fund’s cash position and other assets and liabilities.
Percentages are based on net assets as of April 30, 2018.
The portfolio is actively managed and current holdings may be different.
3
EXPENSE TABLE
Fund expenses borne by the shareholders during the period, November 1, 2017 through April 30, 2018
As a shareholder of the fund, you incur two types of costs: (1) transaction costs, including sales charges (loads) on certain purchase or redemption payments, and (2) ongoing costs, including management fees; distribution and service (12b-1) fees; and other fund expenses. This example is intended to help you understand your ongoing costs (in dollars) of investing in the fund and to compare these costs with the ongoing costs of investing in other mutual funds.
The example is based on an investment of $1,000 invested at the beginning of the period and held for the entire period November 1, 2017 through April 30, 2018.
Actual Expenses
The first line for each share class in the following table provides information about actual account values and actual expenses. You may use the information in this line, together with the amount you invested, to estimate the expenses that you paid over the period. Simply divide your account value by $1,000 (for example, an $8,600 account value divided by $1,000 = 8.6), then multiply the result by the number in the first line under the heading entitled “Expenses Paid During Period” to estimate the expenses you paid on your account during this period.
Hypothetical Example for Comparison Purposes
The second line for each share class in the following table provides information about hypothetical account values and hypothetical expenses based on the fund’s actual expense ratio and an assumed rate of return of 5% per year before expenses, which is not the fund’s actual return. The hypothetical account values and expenses may not be used to estimate the actual ending account balance or expenses you paid for the period. You may use this information to compare the ongoing costs of investing in the fund and other funds. To do so, compare this 5% hypothetical example with the 5% hypothetical examples that appear in the shareholder reports of the other funds.
Please note that the expenses shown in the table are meant to highlight your ongoing costs only and do not reflect any transactional costs, such as sales charges (loads). Therefore, the second line for each share class in the table is useful in comparing ongoing costs only, and will not help you determine the relative total costs of owning different funds. In addition, if these transactional costs were included, your costs would have been higher.
4
Expense Table – continued
| | | | | | | | | | | | | | | | | | |
Share
Class | | | | Annualized
Expense Ratio | | | Beginning
Account Value
11/01/17 | | | Ending
Account Value
4/30/18 | | | Expenses
Paid During
Period (p)
11/01/17-4/30/18 | |
| A | | Actual | | | 1.37% | | | | $1,000.00 | | | | $1,049.33 | | | | $6.96 | |
| | Hypothetical (h) | | | 1.37% | | | | $1,000.00 | | | | $1,018.00 | | | | $6.85 | |
| B | | Actual | | | 2.13% | | | | $1,000.00 | | | | $1,045.57 | | | | $10.80 | |
| | Hypothetical (h) | | | 2.13% | | | | $1,000.00 | | | | $1,014.23 | | | | $10.64 | |
| C | | Actual | | | 2.13% | | | | $1,000.00 | | | | $1,045.53 | | | | $10.80 | |
| | Hypothetical (h) | | | 2.13% | | | | $1,000.00 | | | | $1,014.23 | | | | $10.64 | |
| I | | Actual | | | 1.13% | | | | $1,000.00 | | | | $1,050.41 | | | | $5.74 | |
| | Hypothetical (h) | | | 1.13% | | | | $1,000.00 | | | | $1,019.19 | | | | $5.66 | |
| R1 | | Actual | | | 2.13% | | | | $1,000.00 | | | | $1,045.34 | | | | $10.80 | |
| | Hypothetical (h) | | | 2.13% | | | | $1,000.00 | | | | $1,014.23 | | | | $10.64 | |
| R2 | | Actual | | | 1.63% | | | | $1,000.00 | | | | $1,048.25 | | | | $8.28 | |
| | Hypothetical (h) | | | 1.63% | | | | $1,000.00 | | | | $1,016.71 | | | | $8.15 | |
| R3 | | Actual | | | 1.38% | | | | $1,000.00 | | | | $1,049.35 | | | | $7.01 | |
| | Hypothetical (h) | | | 1.38% | | | | $1,000.00 | | | | $1,017.95 | | | | $6.90 | |
| R4 | | Actual | | | 1.13% | | | | $1,000.00 | | | | $1,050.73 | | | | $5.75 | |
| | Hypothetical (h) | | | 1.13% | | | | $1,000.00 | | | | $1,019.19 | | | | $5.66 | |
| R6 | | Actual | | | 1.06% | | | | $1,000.00 | | | | $1,051.06 | | | | $5.39 | |
| | Hypothetical (h) | | | 1.06% | | | | $1,000.00 | | | | $1,019.54 | | | | $5.31 | |
| (h) | 5% class return per year before expenses. |
| (p) | “Expenses Paid During Period” are equal to each class’s annualized expense ratio, as shown above, multiplied by the average account value over the period, multiplied by 181/365 (to reflect the one-half year period). Expenses paid do not include any applicable sales charges (loads). If these transaction costs had been included, your costs would have been higher. |
Notes to Expense Table
Each class with a Rule 12b-1 service fee is subject to a rebate of a portion of such fee. Such rebates are included in the expense ratios above and are outside of the expense limitation arrangement. For Class A shares, this rebate reduced the expense ratio above by 0.01%. See Note 3 in the Notes to Financial Statements for additional information.
5
PORTFOLIO OF INVESTMENTS
4/30/18 (unaudited)
The Portfolio of Investments is a complete list of all securities owned by your fund. It is categorized by broad-based asset classes.
| | | | | | | | |
| Common Stocks - 98.5% | | | | | | | | |
| Issuer | | Shares/Par | | | Value ($) | |
| Aerospace - 1.8% | | | | | | | | |
| Rolls-Royce Holdings PLC | | | 202,997 | | | $ | 2,335,716 | |
| United Technologies Corp. | | | 29,060 | | | | 3,491,559 | |
| | | | | | | | |
| | | | | | | $ | 5,827,275 | |
| Airlines - 0.9% | | | | | | | | |
| Aena S.A. | | | 14,661 | | | $ | 3,021,812 | |
| | |
| Alcoholic Beverages - 3.8% | | | | | | | | |
| AmBev S.A., ADR | | | 465,743 | | | $ | 3,083,219 | |
| Diageo PLC | | | 91,790 | | | | 3,264,952 | |
| Pernod Ricard S.A. | | | 34,284 | | | | 5,686,437 | |
| | | | | | | | |
| | | | | | | $ | 12,034,608 | |
| Apparel Manufacturers - 6.2% | | | | | | | | |
| Burberry Group PLC | | | 95,956 | | | $ | 2,405,839 | |
| Compagnie Financiere Richemont S.A. | | | 13,546 | | | | 1,286,427 | |
| LVMH Moet Hennessy Louis Vuitton S.A. (l) | | | 17,735 | | | | 6,173,162 | |
| NIKE, Inc., “B” | | | 93,480 | | | | 6,393,097 | |
| VF Corp. | | | 42,575 | | | | 3,443,040 | |
| | | | | | | | |
| | | | | | | $ | 19,701,565 | |
| Broadcasting - 0.3% | | | | | | | | |
| Walt Disney Co. | | | 9,555 | | | $ | 958,653 | |
| | |
| Brokerage & Asset Managers - 1.8% | | | | | | | | |
| Blackstone Group LP | | | 134,542 | | | $ | 4,164,075 | |
| Charles Schwab Corp. | | | 31,067 | | | | 1,729,810 | |
| | | | | | | | |
| | | | | | | $ | 5,893,885 | |
| Business Services - 12.6% | | | | | | | | |
| Accenture PLC, “A” | | | 47,121 | | | $ | 7,124,695 | |
| Brenntag AG | | | 14,394 | | | | 823,696 | |
| Cognizant Technology Solutions Corp., “A” | | | 59,656 | | | | 4,881,054 | |
| Compass Group PLC | | | 118,022 | | | | 2,534,702 | |
| Experian Group Ltd. | | | 237,095 | | | | 5,412,786 | |
| Fidelity National Information Services, Inc. | | | 46,395 | | | | 4,406,133 | |
| Fiserv, Inc. (a) | | | 76,323 | | | | 5,408,248 | |
| Intertek Group PLC | | | 56,325 | | | | 3,780,705 | |
| Verisk Analytics, Inc., “A” (a) | | | 54,548 | | | | 5,806,635 | |
| | | | | | | | |
| | | | | | | $ | 40,178,654 | |
6
Portfolio of Investments (unaudited) – continued
| | | | | | | | |
| Issuer | | Shares/Par | | | Value ($) | |
| Common Stocks - continued | | | | | | | | |
| Cable TV - 1.4% | | | | | | | | |
| Comcast Corp., “A” | | | 139,767 | | | $ | 4,387,286 | |
| | |
| Chemicals - 0.9% | | | | | | | | |
| PPG Industries, Inc. | | | 25,646 | | | $ | 2,715,398 | |
| | |
| Computer Software - 2.9% | | | | | | | | |
| Dassault Systemes S.A. | | | 8,908 | | | $ | 1,150,398 | |
| Microsoft Corp. | | | 86,189 | | | | 8,060,395 | |
| | | | | | | | |
| | | | | | | $ | 9,210,793 | |
| Computer Software - Systems - 1.2% | | | | | | | | |
| Apple, Inc. | | | 23,204 | | | $ | 3,834,693 | |
| | |
| Construction - 1.0% | | | | | | | | |
| Sherwin-Williams Co. | | | 8,490 | | | $ | 3,121,433 | |
| | |
| Consumer Products - 7.4% | | | | | | | | |
| Colgate-Palmolive Co. | | | 57,936 | | | $ | 3,779,165 | |
| Coty, Inc., “A” | | | 191,880 | | | | 3,329,118 | |
| Estee Lauder Cos., Inc., “A” | | | 28,489 | | | | 4,218,936 | |
| Kose Corp. | | | 11,800 | | | | 2,180,998 | |
| L’Oréal S.A. (l) | | | 16,906 | | | | 4,048,897 | |
| Reckitt Benckiser Group PLC | | | 79,630 | | | | 6,250,910 | |
| | | | | | | | |
| | | | | | | $ | 23,808,024 | |
| Electrical Equipment - 2.1% | | | | | | | | |
| Amphenol Corp., “A” | | | 40,063 | | | $ | 3,353,674 | |
| Fortive Corp. | | | 13,741 | | | | 966,130 | |
| Mettler-Toledo International, Inc. (a) | | | 3,983 | | | | 2,230,201 | |
| | | | | | | | |
| | | | | | | $ | 6,550,005 | |
| Electronics - 5.0% | | | | | | | | |
| Analog Devices, Inc. | | | 26,065 | | | $ | 2,276,778 | |
| Samsung Electronics Co. Ltd. | | | 988 | | | | 2,448,263 | |
| Taiwan Semiconductor Manufacturing Co. Ltd., ADR | | | 156,922 | | | | 6,033,651 | |
| Texas Instruments, Inc. | | | 51,421 | | | | 5,215,632 | |
| | | | | | | | |
| | | | | | | $ | 15,974,324 | |
| Food & Beverages - 3.5% | | | | | | | | |
| Chr. Hansen Holding A.S. | | | 10,619 | | | $ | 962,674 | |
| Danone S.A. | | | 34,201 | | | | 2,757,263 | |
| Nestle S.A. | | | 75,714 | | | | 5,853,377 | |
| PepsiCo, Inc. | | | 16,766 | | | | 1,692,360 | |
| | | | | | | | |
| | | | | | | $ | 11,265,674 | |
7
Portfolio of Investments (unaudited) – continued
| | | | | | | | |
| Issuer | | Shares/Par | | | Value ($) | |
| Common Stocks - continued | | | | | | | | |
| Food & Drug Stores - 1.4% | | | | | | | | |
| Sundrug Co. Ltd. | | | 87,200 | | | $ | 4,480,119 | |
| | |
| Gaming & Lodging - 1.5% | | | | | | | | |
| Paddy Power Betfair PLC | | | 49,401 | | | $ | 4,866,468 | |
| | |
| General Merchandise - 1.1% | | | | | | | | |
| Dollarama, Inc. | | | 17,881 | | | $ | 2,058,345 | |
| Lojas Renner S.A. | | | 152,964 | | | | 1,423,885 | |
| | | | | | | | |
| | | | | | | $ | 3,482,230 | |
| Insurance - 1.8% | | | | | | | | |
| Aon PLC | | | 40,967 | | | $ | 5,836,568 | |
| | |
| Internet - 6.5% | | | | | | | | |
| Alibaba Group Holding Ltd., ADR (a) | | | 21,769 | | | $ | 3,886,637 | |
| Alphabet, Inc., “A” (a) | | | 10,896 | | | | 11,098,448 | |
| Baidu, Inc., ADR (a) | | | 14,373 | | | | 3,606,186 | |
| Naver Corp. | | | 3,497 | | | | 2,332,808 | |
| | | | | | | | |
| | | | | | | $ | 20,924,079 | |
| Leisure & Toys - 1.0% | | | | | | | | |
| Electronic Arts, Inc. (a) | | | 27,651 | | | $ | 3,262,265 | |
| | |
| Machinery & Tools - 2.8% | | | | | | | | |
| Colfax Corp. (a) | | | 40,791 | | | $ | 1,264,929 | |
| Daikin Industries Ltd. | | | 34,500 | | | | 4,036,019 | |
| Nordson Corp. | | | 18,084 | | | | 2,325,602 | |
| Schindler Holding AG | | | 7,037 | | | | 1,451,440 | |
| | | | | | | | |
| | | | | | | $ | 9,077,990 | |
| Medical & Health Technology & Services - 0.9% | | | | | | | | |
| CVS Health Corp. | | | 28,580 | | | $ | 1,995,741 | |
| Express Scripts Holding Co. (a) | | | 10,015 | | | | 758,136 | |
| | | | | | | | |
| | | | | | | $ | 2,753,877 | |
| Medical Equipment - 5.4% | | | | | | | | |
| Abbott Laboratories | | | 67,078 | | | $ | 3,899,244 | |
| Cooper Cos., Inc. | | | 6,509 | | | | 1,488,674 | |
| Danaher Corp. | | | 25,149 | | | | 2,522,948 | |
| Sonova Holding AG | | | 13,487 | | | | 2,228,999 | |
| Thermo Fisher Scientific, Inc. | | | 25,280 | | | | 5,317,648 | |
| Waters Corp. (a) | | | 10,047 | | | | 1,892,955 | |
| | | | | | | | |
| | | | | | | $ | 17,350,468 | |
8
Portfolio of Investments (unaudited) – continued
| | | | | | | | |
| Issuer | | Shares/Par | | | Value ($) | |
| Common Stocks - continued | | | | | | | | |
| Oil Services - 0.7% | | | | | | | | |
| Schlumberger Ltd. | | | 33,778 | | | $ | 2,315,820 | |
| | |
| Other Banks & Diversified Financials - 5.9% | | | | | | | | |
| Credicorp Ltd. | | | 12,653 | | | $ | 2,941,696 | |
| HDFC Bank Ltd. | | | 156,143 | | | | 4,703,766 | |
| Julius Baer Group Ltd. | | | 46,892 | | | | 2,783,816 | |
| Mastercard, Inc., “A” | | | 20,469 | | | | 3,649,009 | |
| Visa, Inc., “A” | | | 39,090 | | | | 4,959,739 | |
| | | | | | | | |
| | | | | | | $ | 19,038,026 | |
| Pharmaceuticals - 3.7% | | | | | | | | |
| Bayer AG | | | 41,442 | | | $ | 4,961,006 | |
| Roche Holding AG | | | 18,268 | | | | 4,052,971 | |
| Zoetis, Inc. | | | 35,234 | | | | 2,941,334 | |
| | | | | | | | |
| | | | | | | $ | 11,955,311 | |
| Printing & Publishing - 1.6% | | | | | | | | |
| Moody’s Corp. | | | 31,867 | | | $ | 5,168,827 | |
| | |
| Railroad & Shipping - 2.0% | | | | | | | | |
| Adani Ports and Special Economic Zone Ltd. (a) | | | 196,826 | | | $ | 1,195,226 | |
| Union Pacific Corp. | | | 39,550 | | | | 5,285,066 | |
| | | | | | | | |
| | | | | | | $ | 6,480,292 | |
| Restaurants - 3.5% | | | | | | | | |
| Starbucks Corp. | | | 113,655 | | | $ | 6,543,118 | |
| Whitbread PLC | | | 76,992 | | | | 4,537,641 | |
| | | | | | | | |
| | | | | | | $ | 11,080,759 | |
| Specialty Chemicals - 4.2% | | | | | | | | |
| Croda International PLC | | | 66,141 | | | $ | 4,040,924 | |
| Ecolab, Inc. | | | 36,207 | | | | 5,241,687 | |
| Sika AG | | | 307 | | | | 2,224,932 | |
| Symrise AG | | | 23,687 | | | | 1,913,161 | |
| | | | | | | | |
| | | | | | | $ | 13,420,704 | |
| Specialty Stores - 1.7% | | | | | | | | |
| AutoZone, Inc. (a) | | | 1,698 | | | $ | 1,060,435 | |
| TJX Cos., Inc. | | | 51,896 | | | | 4,403,376 | |
| | | | | | | | |
| | | | | | | $ | 5,463,811 | |
| Total Common Stocks (Identified Cost, $214,447,642) | | | | | | $ | 315,441,696 | |
9
Portfolio of Investments (unaudited) – continued
| | | | | | | | |
| Preferred Stocks - 0.0% | | | | | | | | |
| Issuer | | Shares/Par | | | Value ($) | |
| Aerospace - 0.0% | | | | | | | | |
| Rolls Royce Group PLC (a) (Identified Cost, $20,060) | | | 14,412,787 | | | $ | 19,842 | |
| | |
| Investment Companies (h) - 1.2% | | | | | | | | |
| Money Market Funds - 1.2% | | | | | | | | |
MFS Institutional Money Market Portfolio, 1.78% (v)
(Identified Cost, $3,778,455) | | | 3,778,921 | | | $ | 3,778,544 | |
| | |
| Collateral for Securities Loaned - 2.8% | | | | | | | | |
JPMorgan U.S. Government Money Market Fund, 1.62% (j)
(Identified Cost, $8,942,259) | | | 8,942,259 | | | $ | 8,942,259 | |
| | |
| Other Assets, Less Liabilities - (2.5)% | | | | | | | (7,955,340 | ) |
| Net Assets - 100.0% | | | | | | $ | 320,227,001 | |
| (a) | Non-income producing security. |
| (h) | An affiliated issuer may be considered one in which the fund owns 5% or more of the outstanding voting securities, or a company which is under common control. At period end, the aggregate values of the fund’s investments in affiliated issuers and in unaffiliated issuers were $3,778,544 and $324,403,797, respectively. |
| (j) | The rate quoted is the annualized seven-day yield of the fund at period end. |
| (l) | A portion of this security is on loan. |
| (v) | Affiliated issuer that is available only to investment companies managed by MFS. The rate quoted for the MFS Institutional Money Market Portfolio is the annualized seven-day yield of the fund at period end. |
The following abbreviations are used in this report and are defined:
| ADR | | American Depositary Receipt |
| PLC | | Public Limited Company |
See Notes to Financial Statements
10
Financial Statements
STATEMENT OF ASSETS AND LIABILITIES
At 4/30/18 (unaudited)
This statement represents your fund’s balance sheet, which details the assets and liabilities comprising the total value of the fund.
| | | | |
| Assets | | | | |
Investments in unaffiliated issuers, at value, including $8,622,414 of securities on loan (identified cost, $223,409,961) | | | $324,403,797 | |
Investments in affiliated issuers, at value (identified cost, $3,778,455) | | | 3,778,544 | |
Cash | | | 16,114 | |
Receivables for | | | | |
Fund shares sold | | | 613,121 | |
Interest and dividends | | | 799,234 | |
Other assets | | | 1,150 | |
Total assets | | | $329,611,960 | |
| Liabilities | | | | |
Payable to custodian | | | $17,177 | |
Payables for | | | | |
Investments purchased | | | 66,814 | |
Fund shares reacquired | | | 191,938 | |
Collateral for securities loaned, at value | | | 8,942,259 | |
Payable to affiliates | | | | |
Investment adviser | | | 32,015 | |
Shareholder servicing costs | | | 86,642 | |
Distribution and service fees | | | 6,175 | |
Payable for independent Trustees’ compensation | | | 3,826 | |
Deferred country tax expense payable | | | 9,523 | |
Accrued expenses and other liabilities | | | 28,590 | |
Total liabilities | | | $9,384,959 | |
Net assets | | | $320,227,001 | |
| Net assets consist of | | | | |
Paid-in capital | | | $212,841,750 | |
Unrealized appreciation (depreciation) (net of $9,523 deferred country tax) | | | 100,974,269 | |
Accumulated net realized gain (loss) | | | 6,002,964 | |
Undistributed net investment income | | | 408,018 | |
Net assets | | | $320,227,001 | |
Shares of beneficial interest outstanding | | | 7,792,509 | |
11
Statement of Assets and Liabilities (unaudited) – continued
| | | | | | | | | | | | |
| | | Net assets | | | Shares
outstanding | | | Net asset value
per share (a) | |
Class A | | | $217,354,981 | | | | 5,280,322 | | | | $41.16 | |
Class B | | | 5,314,575 | | | | 147,832 | | | | 35.95 | |
Class C | | | 8,638,901 | | | | 243,232 | | | | 35.52 | |
Class I | | | 19,903,641 | | | | 472,043 | | | | 42.16 | |
Class R1 | | | 944,124 | | | | 26,641 | | | | 35.44 | |
Class R2 | | | 2,930,288 | | | | 73,466 | | | | 39.89 | |
Class R3 | | | 4,763,590 | | | | 116,334 | | | | 40.95 | |
Class R4 | | | 503,367 | | | | 12,209 | | | | 41.23 | |
Class R6 | | | 59,873,534 | | | | 1,420,430 | | | | 42.15 | |
| (a) | Maximum offering price per share was equal to the net asset value per share for all share classes, except for Class A, for which the maximum offering price per share was $43.67 [100 / 94.25 x $41.16]. On sales of $50,000 or more, the maximum offering price of Class A shares is reduced. A contingent deferred sales charge may be imposed on redemptions of Class A, Class B, and Class C shares. Redemption price per share was equal to the net asset value per share for Classes I, R1, R2, R3, R4, and R6. Net asset value per share is calculated using actual net assets and shares outstanding rather than amounts that have been rounded for presentation purposes. |
See Notes to Financial Statements
12
Financial Statements
STATEMENT OF OPERATIONS
Six months ended 4/30/18 (unaudited)
This statement describes how much your fund earned in investment income and accrued in expenses. It also describes any gains and/or losses generated by fund operations.
| | | | |
| Net investment income (loss) | | | | |
Income | | | | |
Dividends | | | $2,621,809 | |
Dividends from affiliated issuers | | | 26,552 | |
Interest | | | 5,073 | |
Income on securities loaned | | | 2,841 | |
Foreign taxes withheld | | | (120,485 | ) |
Total investment income | | | $2,535,790 | |
Expenses | | | | |
Management fee | | | $1,409,167 | |
Distribution and service fees | | | 379,176 | |
Shareholder servicing costs | | | 166,286 | |
Administrative services fee | | | 28,285 | |
Independent Trustees’ compensation | | | 4,654 | |
Custodian fee | | | 31,890 | |
Shareholder communications | | | 14,712 | |
Audit and tax fees | | | 36,112 | |
Legal fees | | | 1,515 | |
Miscellaneous | | | 77,502 | |
Total expenses | | | $2,149,299 | |
Fees paid indirectly | | | (165 | ) |
Reduction of expenses by investment adviser and distributor | | | (25,258 | ) |
Net expenses | | | $2,123,876 | |
Net investment income (loss) | | | $411,914 | |
| Realized and unrealized gain (loss) | | | | |
Realized gain (loss) (identified cost basis) | | | | |
Unaffiliated issuers (net of $23,072 country tax) | | | $6,467,498 | |
Affiliated issuers | | | (161 | ) |
Foreign currency | | | (3,050 | ) |
Net realized gain (loss) | | | $6,464,287 | |
Change in unrealized appreciation (depreciation) | | | | |
Unaffiliated issuers (net of $95,195 decrease in deferred country tax) | | | $7,741,367 | |
Affiliated issuers | | | (62 | ) |
Translation of assets and liabilities in foreign currencies | | | (6,786 | ) |
Net unrealized gain (loss) | | | $7,734,519 | |
Net realized and unrealized gain (loss) | | | $14,198,806 | |
Change in net assets from operations | | | $14,610,720 | |
See Notes to Financial Statements
13
Financial Statements
STATEMENTS OF CHANGES IN NET ASSETS
These statements describe the increases and/or decreases in net assets resulting from operations, any distributions, and any shareholder transactions.
| | | | | | | | |
| Change in net assets | | Six months ended
4/30/18
(unaudited) | | | Year ended
10/31/17 | |
| From operations | | | | | | | | |
Net investment income (loss) | | | $411,914 | | | | $705,183 | |
Net realized gain (loss) | | | 6,464,287 | | | | 10,841,985 | |
Net unrealized gain (loss) | | | 7,734,519 | | | | 47,345,112 | |
Change in net assets from operations | | | $14,610,720 | | | | $58,892,280 | |
| Distributions declared to shareholders | | | | | | | | |
From net investment income | | | $(652,041 | ) | | | $(218,102 | ) |
From net realized gain | | | (10,334,023 | ) | | | (3,609,099 | ) |
Total distributions declared to shareholders | | | $(10,986,064 | ) | | | $(3,827,201 | ) |
Change in net assets from fund share transactions | | | $19,745,763 | | | | $16,256,145 | |
Total change in net assets | | | $23,370,419 | | | | $71,321,224 | |
| Net assets | | | | | | | | |
At beginning of period | | | 296,856,582 | | | | 225,535,358 | |
At end of period (including undistributed net investment income of $408,018 and $648,145, respectively) | | | $320,227,001 | | | | $296,856,582 | |
See Notes to Financial Statements
14
Financial Statements
FINANCIAL HIGHLIGHTS
The financial highlights table is intended to help you understand the fund’s financial performance for the semiannual period and the past 5 fiscal years (or life of a particular share class, if shorter). Certain information reflects financial results for a single fund share. The total returns in the table represent the rate that an investor would have earned (or lost) on an investment in the fund share class (assuming reinvestment of all distributions) held for the entire period.
| | | | | | | | | | | | | | | | | | | | | | | | |
| | | Six months
ended 4/30/18 | | | Year ended | |
| Class A | | | 10/31/17 | | | 10/31/16 | | | 10/31/15 | | | 10/31/14 | | | 10/31/13 | |
| | | (unaudited) | | | | | | | | | | | | | | | | |
Net asset value, beginning of
period | | | $40.66 | | | | $32.89 | | | | $34.24 | | | | $34.44 | | | | $33.89 | | | | $27.45 | |
| Income (loss) from investment operations | | | | | | | | | | | | | |
Net investment income
(loss) (d) | | | $0.05 | | | | $0.10 | (c) | | | $0.05 | | | | $0.11 | | | | $0.12 | | | | $0.10 | |
Net realized and unrealized
gain (loss) | | | 1.92 | | | | 8.21 | | | | 0.49 | | | | 1.16 | | | | 1.57 | | | | 6.41 | |
Total from investment operations | | | $1.97 | | | | $8.31 | | | | $0.54 | | | | $1.27 | | | | $1.69 | | | | $6.51 | |
| Less distributions declared to shareholders | | | | | | | | | | | | | |
From net investment income | | | $(0.07 | ) | | | $(0.02 | ) | | | $(0.10 | ) | | | $(0.10 | ) | | | $(0.09 | ) | | | $(0.07 | ) |
From net realized gain | | | (1.40 | ) | | | (0.52 | ) | | | (1.79 | ) | | | (1.37 | ) | | | (1.05 | ) | | | — | |
Total distributions declared to
shareholders | | | $(1.47 | ) | | | $(0.54 | ) | | | $(1.89 | ) | | | $(1.47 | ) | | | $(1.14 | ) | | | $(0.07 | ) |
Net asset value, end of
period (x) | | | $41.16 | | | | $40.66 | | | | $32.89 | | | | $34.24 | | | | $34.44 | | | | $33.89 | |
Total return (%) (r)(s)(t)(x) | | | 4.93 | (n) | | | 25.70 | (c) | | | 1.91 | | | | 3.92 | | | | 5.21 | | | | 23.77 | |
Ratios (%) (to average net assets)
and Supplemental data: | | | | | | | | | | | | | |
Expenses before expense
reductions (f) | | | 1.39 | (a) | | | 1.38 | (c) | | | 1.46 | | | | 1.45 | | | | 1.45 | | | | 1.49 | |
Expenses after expense
reductions (f) | | | 1.37 | (a) | | | 1.33 | (c) | | | 1.43 | | | | 1.44 | | | | 1.44 | | | | 1.49 | |
Net investment income (loss) | | | 0.24 | (a)(l) | | | 0.29 | (c) | | | 0.16 | | | | 0.32 | | | | 0.35 | | | | 0.33 | |
Portfolio turnover | | | 9 | (n) | | | 27 | | | | 28 | | | | 26 | | | | 27 | | | | 31 | |
Net assets at end of period
(000 omitted) | | | $217,355 | | | | $203,117 | | | | $173,456 | | | | $181,489 | | | | $185,254 | | | | $186,818 | |
See Notes to Financial Statements
15
Financial Highlights – continued
| | | | | | | | | | | | | | | | | | | | | | | | |
| | | Six months
ended 4/30/18 | | | Year ended | |
| Class B | | | 10/31/17 | | | 10/31/16 | | | 10/31/15 | | | 10/31/14 | | | 10/31/13 | |
| | | (unaudited) | | | | | | | | | | | | | | | | |
Net asset value, beginning of
period | | | $35.76 | | | | $29.18 | | | | $30.72 | | | | $31.18 | | | | $30.92 | | | | $25.18 | |
| Income (loss) from investment operations | | | | | | | | | | | | | |
Net investment income
(loss) (d) | | | $(0.09 | ) | | | $(0.15 | )(c) | | | $(0.17 | ) | | | $(0.13 | ) | | | $(0.13 | ) | | | $(0.12 | ) |
Net realized and unrealized
gain (loss) | | | 1.68 | | | | 7.25 | | | | 0.42 | | | | 1.04 | | | | 1.44 | | | | 5.86 | |
Total from investment operations | | | $1.59 | | | | $7.10 | | | | $0.25 | | | | $0.91 | | | | $1.31 | | | | $5.74 | |
| Less distributions declared to shareholders | | | | | | | | | | | | | |
From net realized gain | | | $(1.40 | ) | | | $(0.52 | ) | | | $(1.79 | ) | | | $(1.37 | ) | | | $(1.05 | ) | | | $— | |
Net asset value, end of
period (x) | | | $35.95 | | | | $35.76 | | | | $29.18 | | | | $30.72 | | | | $31.18 | | | | $30.92 | |
Total return (%) (r)(s)(t)(x) | | | 4.53 | (n) | | | 24.78 | (c) | | | 1.13 | | | | 3.12 | | | | 4.44 | | | | 22.80 | |
Ratios (%) (to average net assets)
and Supplemental data: | | | | | | | | | | | | | |
Expenses before expense
reductions (f) | | | 2.14 | (a) | | | 2.13 | (c) | | | 2.21 | | | | 2.20 | | | | 2.20 | | | | 2.24 | |
Expenses after expense
reductions (f) | | | 2.13 | (a) | | | 2.08 | (c) | | | 2.19 | | | | 2.19 | | | | 2.19 | | | | 2.24 | |
Net investment income (loss) | | | (0.52 | )(a)(l) | | | (0.46 | )(c) | | | (0.60 | ) | | | (0.43 | ) | | | (0.41 | ) | | | (0.42 | ) |
Portfolio turnover | | | 9 | (n) | | | 27 | | | | 28 | | | | 26 | | | | 27 | | | | 31 | |
Net assets at end of period
(000 omitted) | | | $5,315 | | | | $5,097 | | | | $4,823 | | | | $6,036 | | | | $6,903 | | | | $8,165 | |
See Notes to Financial Statements
16
Financial Highlights – continued
| | | | | | | | | | | | | | | | | | | | | | | | |
| | | Six months
ended 4/30/18 | | | Year ended | |
| Class C | | | 10/31/17 | | | 10/31/16 | | | 10/31/15 | | | 10/31/14 | | | 10/31/13 | |
| | | (unaudited) | | | | | | | | | | | | | | | | |
Net asset value, beginning of
period | | | $35.34 | | | | $28.85 | | | | $30.39 | | | | $30.86 | | | | $30.62 | | | | $24.93 | |
| Income (loss) from investment operations | | | | | | | | | | | | | |
Net investment income
(loss) (d) | | | $(0.09 | ) | | | $(0.14 | )(c) | | | $(0.17 | ) | | | $(0.13 | ) | | | $(0.13 | ) | | | $(0.12 | ) |
Net realized and unrealized
gain (loss) | | | 1.67 | | | | 7.15 | | | | 0.42 | | | | 1.03 | | | | 1.42 | | | | 5.81 | |
Total from investment operations | | | $1.58 | | | | $7.01 | | | | $0.25 | | | | $0.90 | | | | $1.29 | | | | $5.69 | |
| Less distributions declared to shareholders | | | | | | | | | | | | | |
From net realized gain | | | $(1.40 | ) | | | $(0.52 | ) | | | $(1.79 | ) | | | $(1.37 | ) | | | $(1.05 | ) | | | $— | |
Net asset value, end of
period (x) | | | $35.52 | | | | $35.34 | | | | $28.85 | | | | $30.39 | | | | $30.86 | | | | $30.62 | |
Total return (%) (r)(s)(t)(x) | | | 4.55 | (n) | | | 24.75 | (c) | | | 1.15 | | | | 3.12 | | | | 4.42 | | | | 22.82 | |
Ratios (%) (to average net assets)
and Supplemental data: | | | | | | | | | | | | | |
Expenses before expense
reductions (f) | | | 2.14 | (a) | | | 2.13 | (c) | | | 2.21 | | | | 2.20 | | | | 2.20 | | | | 2.24 | |
Expenses after expense
reductions (f) | | | 2.13 | (a) | | | 2.08 | (c) | | | 2.19 | | | | 2.19 | | | | 2.19 | | | | 2.24 | |
Net investment income (loss) | | | (0.53 | )(a)(l) | | | (0.45 | )(c) | | | (0.59 | ) | | | (0.43 | ) | | | (0.41 | ) | | | (0.43 | ) |
Portfolio turnover | | | 9 | (n) | | | 27 | | | | 28 | | | | 26 | | | | 27 | | | | 31 | |
Net assets at end of period
(000 omitted) | | | $8,639 | | | | $13,743 | | | | $13,109 | | | | $13,988 | | | | $13,431 | | | | $13,433 | |
See Notes to Financial Statements
17
Financial Highlights – continued
| | | | | | | | | | | | | | | | | | | | | | | | |
| | | Six months
ended 4/30/18 | | | Year ended | |
| Class I | | | 10/31/17 | | | 10/31/16 | | | 10/31/15 | | | 10/31/14 | | | 10/31/13 | |
| | | (unaudited) | | | | | | | | | | | | | | | | |
Net asset value, beginning of
period | | | $41.64 | | | | $33.68 | | | | $34.99 | | | | $35.18 | | | | $34.59 | | | | $28.02 | |
| Income (loss) from investment operations | | | | | | | | | | | | | |
Net investment income
(loss) (d) | | | $0.10 | | | | $0.26 | (c) | | | $0.10 | | | | $0.22 | | | | $0.20 | | | | $0.18 | |
Net realized and unrealized
gain (loss) | | | 1.96 | | | | 8.34 | | | | 0.53 | | | | 1.15 | | | | 1.61 | | | | 6.53 | |
Total from investment operations | | | $2.06 | | | | $8.60 | | | | $0.63 | | | | $1.37 | | | | $1.81 | | | | $6.71 | |
| Less distributions declared to shareholders | | | | | | | | | | | | | |
From net investment income | | | $(0.14 | ) | | | $(0.12 | ) | | | $(0.15 | ) | | | $(0.19 | ) | | | $(0.17 | ) | | | $(0.14 | ) |
From net realized gain | | | (1.40 | ) | | | (0.52 | ) | | | (1.79 | ) | | | (1.37 | ) | | | (1.05 | ) | | | — | |
Total distributions declared to
shareholders | | | $(1.54 | ) | | | $(0.64 | ) | | | $(1.94 | ) | | | $(1.56 | ) | | | $(1.22 | ) | | | $(0.14 | ) |
Net asset value, end of
period (x) | | | $42.16 | | | | $41.64 | | | | $33.68 | | | | $34.99 | | | | $35.18 | | | | $34.59 | |
Total return (%) (r)(s)(t)(x) | | | 5.04 | (n) | | | 26.03 | (c) | | | 2.17 | | | | 4.13 | | | | 5.47 | | | | 24.05 | |
Ratios (%) (to average net assets)
and Supplemental data: | | | | | | | | | | | | | |
Expenses before expense
reductions (f) | | | 1.14 | (a) | | | 1.14 | (c) | | | 1.21 | | | | 1.20 | | | | 1.20 | | | | 1.24 | |
Expenses after expense
reductions (f) | | | 1.13 | (a) | | | 1.10 | (c) | | | 1.18 | | | | 1.20 | | | | 1.20 | | | | 1.24 | |
Net investment income (loss) | | | 0.48 | (a)(l) | | | 0.70 | (c) | | | 0.30 | | | | 0.61 | | | | 0.59 | | | | 0.56 | |
Portfolio turnover | | | 9 | (n) | | | 27 | | | | 28 | | | | 26 | | | | 27 | | | | 31 | |
Net assets at end of period
(000 omitted) | | | $19,904 | | | | $17,272 | | | | $18,070 | | | | $5,920 | | | | $13,174 | | | | $11,511 | |
See Notes to Financial Statements
18
Financial Highlights – continued
| | | | | | | | | | | | | | | | | | | | | | | | |
| | | Six months
ended 4/30/18 | | | Year ended | |
| Class R1 | | | 10/31/17 | | | 10/31/16 | | | 10/31/15 | | | 10/31/14 | | | 10/31/13 | |
| | | (unaudited) | | | | | | | | | | | | | | | | |
Net asset value, beginning of
period | | | $35.27 | | | | $28.79 | | | | $30.33 | | | | $30.80 | | | | $30.57 | | | | $24.88 | |
| Income (loss) from investment operations | | | | | | | | | | | | | |
Net investment income
(loss) (d) | | | $(0.10 | ) | | | $(0.15 | )(c) | | | $(0.17 | ) | | | $(0.14 | ) | | | $(0.14 | ) | | | $(0.12 | ) |
Net realized and unrealized
gain (loss) | | | 1.67 | | | | 7.15 | | | | 0.42 | | | | 1.04 | | | | 1.42 | | | | 5.81 | |
Total from investment operations | | | $1.57 | | | | $7.00 | | | | $0.25 | | | | $0.90 | | | | $1.28 | | | | $5.69 | |
| Less distributions declared to shareholders | | | | | | | | | | | | | |
From net realized gain | | | $(1.40 | ) | | | $(0.52 | ) | | | $(1.79 | ) | | | $(1.37 | ) | | | $(1.05 | ) | | | $— | |
Net asset value, end of
period (x) | | | $35.44 | | | | $35.27 | | | | $28.79 | | | | $30.33 | | | | $30.80 | | | | $30.57 | |
Total return (%) (r)(s)(t)(x) | | | 4.53 | (n) | | | 24.77 | (c) | | | 1.15 | | | | 3.13 | | | | 4.39 | | | | 22.87 | |
Ratios (%) (to average net assets)
and Supplemental data: | | | | | | | | | | | | | |
Expenses before expense
reductions (f) | | | 2.14 | (a) | | | 2.13 | (c) | | | 2.21 | | | | 2.20 | | | | 2.20 | | | | 2.24 | |
Expenses after expense
reductions (f) | | | 2.13 | (a) | | | 2.09 | (c) | | | 2.19 | | | | 2.20 | | | | 2.20 | | | | 2.24 | |
Net investment income (loss) | | | (0.54 | )(a)(l) | | | (0.47 | )(c) | | | (0.59 | ) | | | (0.45 | ) | | | (0.44 | ) | | | (0.42 | ) |
Portfolio turnover | | | 9 | (n) | | | 27 | | | | 28 | | | | 26 | | | | 27 | | | | 31 | |
Net assets at end of period
(000 omitted) | | | $944 | | | | $961 | | | | $801 | | | | $784 | | | | $687 | | | | $867 | |
See Notes to Financial Statements
19
Financial Highlights – continued
| | | | | | | | | | | | | | | | | | | | | | | | |
| | | Six months
ended 4/30/18 | | | Year ended | |
| Class R2 | | | 10/31/17 | | | 10/31/16 | | | 10/31/15 | | | 10/31/14 | | | 10/31/13 | |
| | | (unaudited) | | | | | | | | | | | | | | | | |
Net asset value, beginning of
period | | | $39.42 | | | | $31.97 | | | | $33.33 | | | | $33.55 | | | | $33.04 | | | | $26.76 | |
| Income (loss) from investment operations | | | | | | | | | | | | | |
Net investment income
(loss) (d) | | | $(0.01 | ) | | | $0.02 | (c) | | | $(0.03 | ) | | | $0.02 | | | | $0.03 | | | | $0.03 | |
Net realized and unrealized
gain (loss) | | | 1.88 | | | | 7.95 | | | | 0.48 | | | | 1.13 | | | | 1.53 | | | | 6.25 | |
Total from investment operations | | | $1.87 | | | | $7.97 | | | | $0.45 | | | | $1.15 | | | | $1.56 | | | | $6.28 | |
| Less distributions declared to shareholders | | | | | | | | | | | | | |
From net investment income | | | $— | | | | $— | | | | $(0.02 | ) | | | $(0.00 | )(w) | | | $(0.00 | )(w) | | | $— | |
From net realized gain | | | (1.40 | ) | | | (0.52 | ) | | | (1.79 | ) | | | (1.37 | ) | | | (1.05 | ) | | | — | |
Total distributions declared to
shareholders | | | $(1.40 | ) | | | $(0.52 | ) | | | $(1.81 | ) | | | $(1.37 | ) | | | $(1.05 | ) | | | $— | |
Net asset value, end of
period (x) | | | $39.89 | | | | $39.42 | | | | $31.97 | | | | $33.33 | | | | $33.55 | | | | $33.04 | |
Total return (%) (r)(s)(t)(x) | | | 4.82 | (n) | | | 25.35 | (c) | | | 1.66 | | | | 3.65 | | | | 4.94 | | | | 23.47 | |
Ratios (%) (to average net assets)
and Supplemental data: | | | | | | | | | | | | | |
Expenses before expense
reductions (f) | | | 1.64 | (a) | | | 1.63 | (c) | | | 1.71 | | | | 1.70 | | | | 1.70 | | | | 1.74 | |
Expenses after expense
reductions (f) | | | 1.63 | (a) | | | 1.58 | (c) | | | 1.69 | | | | 1.70 | | | | 1.70 | | | | 1.74 | |
Net investment income (loss) | | | (0.03 | )(a)(l) | | | 0.05 | (c) | | | (0.10 | ) | | | 0.06 | | | | 0.10 | | | | 0.08 | |
Portfolio turnover | | | 9 | (n) | | | 27 | | | | 28 | | | | 26 | | | | 27 | | | | 31 | |
Net assets at end of period
(000 omitted) | | | $2,930 | | | | $2,887 | | | | $2,797 | | | | $3,083 | | | | $3,050 | | | | $3,372 | |
See Notes to Financial Statements
20
Financial Highlights – continued
| | | | | | | | | | | | | | | | | | | | | | | | |
| | | Six months
ended 4/30/18 | | | Year ended | |
| Class R3 | | | 10/31/17 | | | 10/31/16 | | | 10/31/15 | | | 10/31/14 | | | 10/31/13 | |
| | | (unaudited) | | | | | | | | | | | | | | | | |
Net asset value, beginning of
period | | | $40.46 | | | | $32.73 | | | | $34.08 | | | | $34.29 | | | | $33.75 | | | | $27.35 | |
| Income (loss) from investment operations | | | | | | | | | | | | | |
Net investment income
(loss) (d) | | | $0.04 | | | | $0.10 | (c) | | | $0.05 | | | | $0.11 | | | | $0.12 | | | | $0.10 | |
Net realized and unrealized
gain (loss) | | | 1.92 | | | | 8.17 | | | | 0.49 | | | | 1.15 | | | | 1.56 | | | | 6.38 | |
Total from investment operations | | | $1.96 | | | | $8.27 | | | | $0.54 | | | | $1.26 | | | | $1.68 | | | | $6.48 | |
| Less distributions declared to shareholders | | | | | | | | | | | | | |
From net investment income | | | $(0.07 | ) | | | $(0.02 | ) | | | $(0.10 | ) | | | $(0.10 | ) | | | $(0.09 | ) | | | $(0.08 | ) |
From net realized gain | | | (1.40 | ) | | | (0.52 | ) | | | (1.79 | ) | | | (1.37 | ) | | | (1.05 | ) | | | — | |
Total distributions declared to
shareholders | | | $(1.47 | ) | | | $(0.54 | ) | | | $(1.89 | ) | | | $(1.47 | ) | | | $(1.14 | ) | | | $(0.08 | ) |
Net asset value, end of
period (x) | | | $40.95 | | | | $40.46 | | | | $32.73 | | | | $34.08 | | | | $34.29 | | | | $33.75 | |
Total return (%) (r)(s)(t)(x) | | | 4.93 | (n) | | | 25.70 | (c) | | | 1.91 | | | | 3.90 | | | | 5.21 | | | | 23.74 | |
Ratios (%) (to average net assets)
and Supplemental data: | | | | | | | | | | | | | |
Expenses before expense
reductions (f) | | | 1.39 | (a) | | | 1.38 | (c) | | | 1.46 | | | | 1.45 | | | | 1.45 | | | | 1.49 | |
Expenses after expense
reductions (f) | | | 1.38 | (a) | | | 1.34 | (c) | | | 1.44 | | | | 1.45 | | | | 1.44 | | | | 1.49 | |
Net investment income (loss) | | | 0.21 | (a)(l) | | | 0.28 | (c) | | | 0.16 | | | | 0.31 | | | | 0.34 | | | | 0.32 | |
Portfolio turnover | | | 9 | (n) | | | 27 | | | | 28 | | | | 26 | | | | 27 | | | | 31 | |
Net assets at end of period
(000 omitted) | | | $4,764 | | | | $4,791 | | | | $4,070 | | | | $3,664 | | | | $4,002 | | | | $3,419 | |
See Notes to Financial Statements
21
Financial Highlights – continued
| | | | | | | | | | | | | | | | | | | | | | | | |
| | | Six months
ended 4/30/18 | | | Year ended | |
| Class R4 | | | 10/31/17 | | | 10/31/16 | | | 10/31/15 | | | 10/31/14 | | | 10/31/13 | |
| | | (unaudited) | | | | | | | | | | | | | | | | |
Net asset value, beginning of
period | | | $40.75 | | | | $32.96 | | | | $34.32 | | | | $34.52 | | | | $33.97 | | | | $27.52 | |
| Income (loss) from investment operations | | | | | | | | | | | | | |
Net investment income
(loss) (d) | | | $0.10 | | | | $0.20 | (c) | | | $0.13 | | | | $0.20 | | | | $0.21 | | | | $0.12 | |
Net realized and unrealized
gain (loss) | | | 1.93 | | | | 8.21 | | | | 0.48 | | | | 1.16 | | | | 1.56 | | | | 6.47 | |
Total from investment operations | | | $2.03 | | | | $8.41 | | | | $0.61 | | | | $1.36 | | | | $1.77 | | | | $6.59 | |
| Less distributions declared to shareholders | | | | | | | | | | | | | |
From net investment income | | | $(0.15 | ) | | | $(0.10 | ) | | | $(0.18 | ) | | | $(0.19 | ) | | | $(0.17 | ) | | | $(0.14 | ) |
From net realized gain | | | (1.40 | ) | | | (0.52 | ) | | | (1.79 | ) | | | (1.37 | ) | | | (1.05 | ) | | | — | |
Total distributions declared to
shareholders | | | $(1.55 | ) | | | $(0.62 | ) | | | $(1.97 | ) | | | $(1.56 | ) | | | $(1.22 | ) | | | $(0.14 | ) |
Net asset value, end of
period (x) | | | $41.23 | | | | $40.75 | | | | $32.96 | | | | $34.32 | | | | $34.52 | | | | $33.97 | |
Total return (%) (r)(s)(t)(x) | | | 5.07 | (n) | | | 26.00 | (c) | | | 2.13 | | | | 4.18 | | | | 5.47 | | | | 24.05 | |
Ratios (%) (to average net assets)
and Supplemental data: | | | | | | | | | | | | | |
Expenses before expense
reductions (f) | | | 1.14 | (a) | | | 1.13 | (c) | | | 1.21 | | | | 1.20 | | | | 1.20 | | | | 1.25 | |
Expenses after expense
reductions (f) | | | 1.13 | (a) | | | 1.09 | (c) | | | 1.20 | | | | 1.20 | | | | 1.19 | | | | 1.25 | |
Net investment income (loss) | | | 0.51 | (a)(l) | | | 0.55 | (c) | | | 0.41 | | | | 0.58 | | | | 0.62 | | | | 0.39 | |
Portfolio turnover | | | 9 | (n) | | | 27 | | | | 28 | | | | 26 | | | | 27 | | | | 31 | |
Net assets at end of period
(000 omitted) | | | $503 | | | | $559 | | | | $506 | | | | $703 | | | | $881 | | | | $942 | |
See Notes to Financial Statements
22
Financial Highlights – continued
| | | | | | | | | | | | | | | | | | | | | | | | |
| | | Six months
ended 4/30/18 | | | Year ended | |
| Class R6 | | | 10/31/17 | | | 10/31/16 | | | 10/31/15 | | | 10/31/14 | | | 10/31/13 (i) | |
| | | (unaudited) | | | | | | | | | | | | | | | | |
Net asset value, beginning of
period | | | $41.65 | | | | $33.68 | | | | $35.03 | | | | $35.20 | | | | $34.61 | | | | $30.79 | |
| Income (loss) from investment operations | | | | | | | | | | | | | |
Net investment income
(loss) (d) | | | $0.12 | | | | $0.11 | (c) | | | $0.16 | | | | $0.05 | | | | $0.23 | | | | $0.15 | |
Net realized and unrealized
gain (loss) | | | 1.97 | | | | 8.51 | | | | 0.49 | | | | 1.36 | | | | 1.60 | | | | 3.67 | |
Total from investment operations | | | $2.09 | | | | $8.62 | | | | $0.65 | | | | $1.41 | | | | $1.83 | | | | $3.82 | |
| Less distributions declared to shareholders | | | | | | | | | | | | | |
From net investment income | | | $(0.19 | ) | | | $(0.13 | ) | | | $(0.21 | ) | | | $(0.21 | ) | | | $(0.19 | ) | | | $— | |
From net realized gain | | | (1.40 | ) | | | (0.52 | ) | | | (1.79 | ) | | | (1.37 | ) | | | (1.05 | ) | | | — | |
Total distributions declared to
shareholders | | | $(1.59 | ) | | | $(0.65 | ) | | | $(2.00 | ) | | | $(1.58 | ) | | | $(1.24 | ) | | | $— | |
Net asset value, end of
period (x) | | | $42.15 | | | | $41.65 | | | | $33.68 | | | | $35.03 | | | | $35.20 | | | | $34.61 | |
Total return (%) (r)(s)(t)(x) | | | 5.11 | (n) | | | 26.09 | (c) | | | 2.22 | | | | 4.27 | | | | 5.52 | | | | 12.41 | (n) |
Ratios (%) (to average net assets)
and Supplemental data: | | | | | | | | | | | | | |
Expenses before expense
reductions (f) | | | 1.07 | (a) | | | 1.09 | (c) | | | 1.14 | | | | 1.11 | | | | 1.13 | | | | 1.15 | (a) |
Expenses after expense
reductions (f) | | | 1.06 | (a) | | | 1.05 | (c) | | | 1.12 | | | | 1.11 | | | | 1.12 | | | | 1.15 | (a) |
Net investment income (loss) | | | 0.58 | (a)(l) | | | 0.28 | (c) | | | 0.48 | | | | 0.14 | | | | 0.66 | | | | 0.68 | (a) |
Portfolio turnover | | | 9 | (n) | | | 27 | | | | 28 | | | | 26 | | | | 27 | | | | 31 | |
Net assets at end of period
(000 omitted) | | | $59,874 | | | | $48,429 | | | | $7,904 | | | | $7,864 | | | | $119 | | | | $112 | |
See Notes to Financial Statements
23
Financial Highlights – continued
| (c) | Amount reflects a one-time reimbursement of expenses by the custodian (or former custodian) without which net investment income and performance would be lower and expenses would be higher. |
| (d) | Per share data is based on average shares outstanding. |
| (f) | Ratios do not reflect reductions from fees paid indirectly, if applicable. |
| (i) | For the period from the inception of Class R6, March 1, 2013, through the stated period end. |
| (l) | Recognition of net investment income by the fund may be affected by the timing of the declaration of dividends by companies in which the fund invests and the actual annual net investment income ratio may differ. |
| (r) | Certain expenses have been reduced without which performance would have been lower. |
| (s) | From time to time the fund may receive proceeds from litigation settlements, without which performance would be lower. |
| (t) | Total returns do not include any applicable sales charges. |
| (w) | Per share amount was less than $0.01. |
| (x) | The net asset values and total returns have been calculated on net assets which include adjustments made in accordance with U.S. generally accepted accounting principles required at period end for financial reporting purposes. |
See Notes to Financial Statements
24
NOTES TO FINANCIAL STATEMENTS
(unaudited)
(1) Business and Organization
MFS Global Growth Fund (the fund) is a diversified series of MFS Series Trust VIII (the trust). The trust is organized as a Massachusetts business trust and is registered under the Investment Company Act of 1940, as amended, as an open-end management investment company.
The fund is an investment company and accordingly follows the investment company accounting and reporting guidance of the Financial Accounting Standards Board (FASB) Accounting Standards Codification Topic 946 Financial Services – Investment Companies.
(2) Significant Accounting Policies
General – The preparation of financial statements in conformity with U.S. generally accepted accounting principles requires management to make estimates and assumptions that affect the reported amounts of assets and liabilities, and disclosure of contingent assets and liabilities at the date of the financial statements and the reported amounts of increases and decreases in net assets from operations during the reporting period. Actual results could differ from those estimates. In the preparation of these financial statements, management has evaluated subsequent events occurring after the date of the fund’s Statement of Assets and Liabilities through the date that the financial statements were issued. The fund invests in foreign securities, including securities of emerging market issuers. Investments in foreign securities are vulnerable to the effects of changes in the relative values of the local currency and the U.S. dollar and to the effects of changes in each country’s market, economic, industry, political, regulatory, geopolitical, and other conditions. Investments in emerging markets can involve additional and greater risks than the risks associated with investments in developed foreign markets. Emerging markets can have less developed markets, greater custody and operational risk, less developed legal, regulatory, and accounting systems, and greater political, social, and economic instability than developed markets.
Balance Sheet Offsetting – The fund’s accounting policy with respect to balance sheet offsetting is that, absent an event of default by the counterparty or a termination of the agreement, the International Swaps and Derivatives Association (ISDA) Master Agreement, or similar agreement, does not result in an offset of reported amounts of financial assets and financial liabilities in the Statement of Assets and Liabilities across transactions between the fund and the applicable counterparty. The fund’s right to setoff may be restricted or prohibited by the bankruptcy or insolvency laws of the particular jurisdiction to which a specific master netting agreement counterparty is subject. Balance sheet offsetting disclosures, to the extent applicable to the fund, have been included in the fund’s Significant Accounting Policies note under the captions for each of the fund’s in-scope financial instruments and transactions.
Investment Valuations – Equity securities, including restricted equity securities, are generally valued at the last sale or official closing price on their primary market or exchange as provided by a third-party pricing service. Equity securities, for which there were no sales reported that day, are generally valued at the last quoted daily bid quotation on their primary market or exchange as provided by a third-party pricing service. Short-term instruments with a maturity at issuance of 60 days or less may be
25
Notes to Financial Statements (unaudited) – continued
valued at amortized cost, which approximates market value. Open-end investment companies are generally valued at net asset value per share. Securities and other assets generally valued on the basis of information from a third-party pricing service may also be valued at a broker/dealer bid quotation. Values obtained from third-party pricing services can utilize both transaction data and market information such as yield, quality, coupon rate, maturity, type of issue, trading characteristics, and other market data. The values of foreign securities and other assets and liabilities expressed in foreign currencies are converted to U.S. dollars using the mean of bid and asked prices for rates provided by a third-party pricing service.
The Board of Trustees has delegated primary responsibility for determining or causing to be determined the value of the fund’s investments (including any fair valuation) to the adviser pursuant to valuation policies and procedures approved by the Board. If the adviser determines that reliable market quotations are not readily available, investments are valued at fair value as determined in good faith by the adviser in accordance with such procedures under the oversight of the Board of Trustees. Under the fund’s valuation policies and procedures, market quotations are not considered to be readily available for most types of debt instruments and floating rate loans and many types of derivatives. These investments are generally valued at fair value based on information from third-party pricing services. In addition, investments may be valued at fair value if the adviser determines that an investment’s value has been materially affected by events occurring after the close of the exchange or market on which the investment is principally traded (such as foreign exchange or market) and prior to the determination of the fund’s net asset value, or after the halting of trading of a specific security where trading does not resume prior to the close of the exchange or market on which the security is principally traded. Events that occur on a frequent basis after foreign markets close (such as developments in foreign markets and significant movements in the U.S. markets) and prior to the determination of the fund’s net asset value may be deemed to have a material effect on the value of securities traded in foreign markets. Accordingly, the fund’s foreign equity securities may often be valued at fair value. The adviser generally relies on third-party pricing services or other information (such as the correlation with price movements of similar securities in the same or other markets; the type, cost and investment characteristics of the security; the business and financial condition of the issuer; and trading and other market data) to assist in determining whether to fair value and at what value to fair value an investment. The value of an investment for purposes of calculating the fund’s net asset value can differ depending on the source and method used to determine value. When fair valuation is used, the value of an investment used to determine the fund’s net asset value may differ from quoted or published prices for the same investment. There can be no assurance that the fund could obtain the fair value assigned to an investment if it were to sell the investment at the same time at which the fund determines its net asset value per share.
Various inputs are used in determining the value of the fund’s assets or liabilities. These inputs are categorized into three broad levels. In certain cases, the inputs used to measure fair value may fall into different levels of the fair value hierarchy. In such cases, an investment’s level within the fair value hierarchy is based on the lowest level of input that is significant to the fair value measurement. The fund’s assessment of the significance of a particular input to the fair value measurement in its entirety requires
26
Notes to Financial Statements (unaudited) – continued
judgment, and considers factors specific to the investment. Level 1 includes unadjusted quoted prices in active markets for identical assets or liabilities. Level 2 includes other significant observable market-based inputs (including quoted prices for similar securities, interest rates, prepayment speed, and credit risk). Level 3 includes unobservable inputs, which may include the adviser’s own assumptions in determining the fair value of investments. The following is a summary of the levels used as of April 30, 2018 in valuing the fund’s assets or liabilities:
| | | | | | | | | | | | | | | | |
| Financial Instruments | | Level 1 | | | Level 2 | | | Level 3 | | | Total | |
| Equity Securities: | | | | | | | | | | | | | | | | |
United States | | | $180,219,770 | | | | $— | | | | $— | | | | $180,219,770 | |
United Kingdom | | | 13,323,253 | | | | 21,260,764 | | | | — | | | | 34,584,017 | |
Switzerland | | | — | | | | 19,881,961 | | | | — | | | | 19,881,961 | |
France | | | — | | | | 19,816,156 | | | | — | | | | 19,816,156 | |
Japan | | | — | | | | 10,697,136 | | | | — | | | | 10,697,136 | |
Germany | | | — | | | | 7,697,863 | | | | — | | | | 7,697,863 | |
China | | | 7,492,823 | | | | — | | | | — | | | | 7,492,823 | |
Taiwan | | | 6,033,651 | | | | — | | | | — | | | | 6,033,651 | |
India | | | — | | | | 5,898,992 | | | | — | | | | 5,898,992 | |
Other Countries | | | 9,507,144 | | | | 13,632,025 | | | | — | | | | 23,139,169 | |
| Mutual Funds | | | 12,720,803 | | | | — | | | | — | | | | 12,720,803 | |
| Total | | | $229,297,444 | | | | $98,884,897 | | | | $— | | | | $328,182,341 | |
For further information regarding security characteristics, see the Portfolio of Investments.
Of the level 2 investments presented above, equity investments amounting to $80,864,079 would have been considered level 1 investments at the beginning of the period. The primary reason for changes in the classifications between levels 1 and 2 occurs when foreign equity securities are fair valued using other observable market-based inputs in place of the closing exchange price due to events occurring after the close of the exchange or market on which the investment is principally traded. The fund’s foreign equity securities may often be valued using other observable market-based inputs. The fund’s policy is to recognize transfers between the levels as of the end of the period.
Foreign Currency Translation – Purchases and sales of foreign investments, income, and expenses are converted into U.S. dollars based upon currency exchange rates prevailing on the respective dates of such transactions or on the reporting date for foreign denominated receivables and payables. Gains and losses attributable to foreign currency exchange rates on sales of securities are recorded for financial statement purposes as net realized gains and losses on investments. Gains and losses attributable to foreign exchange rate movements on receivables, payables, income and expenses are recorded for financial statement purposes as foreign currency transaction gains and losses. That portion of both realized and unrealized gains and losses on investments that results from fluctuations in foreign currency exchange rates is not separately disclosed.
Security Loans – Under its Securities Lending Agency Agreement with the fund, JPMorgan Chase and Co. (“Chase”), as lending agent, loans the securities of the fund
27
Notes to Financial Statements (unaudited) – continued
to certain qualified institutions (the “Borrowers”) approved by the fund. Security loans can be terminated at the discretion of either the lending agent or the fund and the related securities must be returned within the earlier of the standard trade settlement period for such securities or within three business days. The loans are collateralized by cash and/or U.S. Treasury and federal agency obligations in an amount typically at least equal to the market value of the securities loaned. On loans collateralized by cash, the cash collateral is invested in a money market fund. The market value of the loaned securities is determined at the close of business of the fund and any additional required collateral is delivered to the fund on the next business day. Chase provides the fund with indemnification against Borrower default. In the event of Borrower default, Chase will, for the benefit of the fund, either purchase securities identical to those loaned or, when such purchase is commercially impracticable, pay the fund the market value of the loaned securities. In return, Chase assumes the fund’s rights to the related collateral. If the collateral value is less than the cost to purchase identical securities, Chase is responsible for the shortfall, but only to the extent that such shortfall is not due to a decline in collateral value resulting from collateral reinvestment for which the fund bears the risk of loss. At period end, the fund had investment securities on loan, all of which were classified as equity securities in the fund’s Portfolio of Investments, with a fair value of $8,622,414. The fair value of the fund’s investment securities on loan and a related liability of $8,942,259 for cash collateral received on securities loaned are both presented gross in the Statement of Assets and Liabilities. The collateral on securities loaned exceeded the value of securities on loan at period end. The liability for cash collateral for securities loaned is carried at fair value, which is categorized as level 2 within the fair value hierarchy. A portion of the income generated upon investment of the collateral is remitted to the Borrowers, and the remainder is allocated between the fund and the lending agent. On loans collateralized by U.S. Treasury and/or federal agency obligations, a fee is received from the Borrower, and is allocated between the fund and the lending agent. Income from securities lending is separately reported in the Statement of Operations. The dividend and interest income earned on the securities loaned is accounted for in the same manner as other dividend and interest income.
Indemnifications – Under the fund’s organizational documents, its officers and Trustees may be indemnified against certain liabilities and expenses arising out of the performance of their duties to the fund. Additionally, in the normal course of business, the fund enters into agreements with service providers that may contain indemnification clauses. The fund’s maximum exposure under these agreements is unknown as this would involve future claims that may be made against the fund that have not yet occurred.
Investment Transactions and Income – Investment transactions are recorded on the trade date. Interest income is recorded on the accrual basis. Dividends received in cash are recorded on the ex-dividend date. Certain dividends from foreign securities will be recorded when the fund is informed of the dividend if such information is obtained subsequent to the ex-dividend date. Dividend and interest payments received in additional securities are recorded on the ex-dividend or ex-interest date in an amount equal to the value of the security on such date.
28
Notes to Financial Statements (unaudited) – continued
The fund may receive proceeds from litigation settlements. Any proceeds received from litigation involving portfolio holdings are reflected in the Statement of Operations in realized gain/loss if the security has been disposed of by the fund or in unrealized gain/loss if the security is still held by the fund. Any other proceeds from litigation not related to portfolio holdings are reflected as other income in the Statement of Operations.
Fees Paid Indirectly – The fund’s custody fee may be reduced by a credit earned under an arrangement that measures the value of U.S. dollars deposited with the custodian by the fund. The amount of the credit, for the six months ended April 30, 2018, is shown as a reduction of total expenses in the Statement of Operations.
Tax Matters and Distributions – The fund intends to qualify as a regulated investment company, as defined under Subchapter M of the Internal Revenue Code, and to distribute all of its taxable income, including realized capital gains. As a result, no provision for federal income tax is required. The fund’s federal tax returns, when filed, will remain subject to examination by the Internal Revenue Service for a three year period. Management has analyzed the fund’s tax positions taken on federal and state tax returns for all open tax years and does not believe that there are any uncertain tax positions that require recognition of a tax liability. Foreign taxes, if any, have been accrued by the fund in the accompanying financial statements in accordance with the applicable foreign tax law. Foreign income taxes may be withheld by certain countries in which the fund invests. Additionally, capital gains realized by the fund on securities issued in or by certain foreign countries may be subject to capital gains tax imposed by those countries.
Distributions to shareholders are recorded on the ex-dividend date. Income and capital gain distributions are determined in accordance with income tax regulations, which may differ from U.S. generally accepted accounting principles. Certain capital accounts in the financial statements are periodically adjusted for permanent differences in order to reflect their tax character. These adjustments have no impact on net assets or net asset value per share. Temporary differences which arise from recognizing certain items of income, expense, gain or loss in different periods for financial statement and tax purposes will reverse at some time in the future. Distributions in excess of net investment income or net realized gains are temporary overdistributions for financial statement purposes resulting from differences in the recognition or classification of income or distributions for financial statement and tax purposes.
Book/tax differences primarily relate to wash sale loss deferrals and treating a portion of the proceeds from redemptions as a distribution for tax purposes.
The tax character of distributions made during the current period will be determined at fiscal year end. The tax character of distributions declared to shareholders for the last fiscal year is as follows:
| | | | |
| | | Year ended
10/31/17 | |
Ordinary income (including any
short-term capital gains) | | | $247,169 | |
| Long-term capital gains | | | 3,580,032 | |
| Total distributions | | | $3,827,201 | |
29
Notes to Financial Statements (unaudited) – continued
The federal tax cost and the tax basis components of distributable earnings were as follows:
| | | | |
| As of 4/30/18 | | | |
| Cost of investments | | | $227,188,416 | |
| Gross appreciation | | | 104,988,292 | |
| Gross depreciation | | | (3,994,367 | ) |
| Net unrealized appreciation (depreciation) | | | $100,993,925 | |
| |
| As of 10/31/17 | | | |
| Undistributed ordinary income | | | 1,714,043 | |
| Undistributed long-term capital gain | | | 9,270,317 | |
| Other temporary differences | | | (6,632 | ) |
| Net unrealized appreciation (depreciation) | | | 92,782,867 | |
The aggregate cost above includes prior fiscal year end tax adjustments, if applicable.
Multiple Classes of Shares of Beneficial Interest – The fund offers multiple classes of shares, which differ in their respective distribution and service fees. The fund’s income, realized and unrealized gain (loss), and common expenses are allocated to shareholders based on the daily net assets of each class. Dividends are declared separately for each class. Differences in per share dividend rates are generally due to differences in separate class expenses. Class B shares will convert to Class A shares approximately eight years after purchase. Effective April 23, 2018, Class C shares will convert to Class A shares approximately ten years after purchase. The fund’s distributions declared to shareholders as reported in the Statements of Changes in Net Assets are presented by class as follows:
| | | | | | | | | | | | | | | | |
| | | From net investment
income | | | From net realized
gain | |
| | | Six months
ended
4/30/18 | | | Year
ended
10/31/17 | | | Six months
ended
4/30/18 | | | Year
ended
10/31/17 | |
| Class A | | | $354,192 | | | | $107,405 | | | | $6,961,021 | | | | $2,699,409 | |
| Class B | | | — | | | | — | | | | 203,135 | | | | 83,063 | |
| Class C | | | — | | | | — | | | | 547,616 | | | | 232,989 | |
| Class I | | | 60,952 | | | | 77,089 | | | | 602,595 | | | | 341,239 | |
| Class R1 | | | — | | | | — | | | | 38,118 | | | | 14,350 | |
| Class R2 | | | — | | | | — | | | | 102,538 | | | | 45,401 | |
| Class R3 | | | 8,672 | | | | 2,327 | | | | 168,847 | | | | 62,208 | |
| Class R4 | | | 1,561 | | | | 1,519 | | | | 14,674 | | | | 8,108 | |
| Class R6 | | | 226,664 | | | | 29,762 | | | | 1,695,479 | | | | 122,332 | |
| Total | | | $652,041 | | | | $218,102 | | | | $10,334,023 | | | | $3,609,099 | |
30
Notes to Financial Statements (unaudited) – continued
(3) Transactions with Affiliates
Investment Adviser – The fund has an investment advisory agreement with MFS to provide overall investment management and related administrative services and facilities to the fund. The management fee is computed daily and paid monthly at the following annual rates based on the fund’s average daily net assets:
| | | | |
| Up to $1 billion | | | 0.90 | % |
| In excess of $1 billion and up to $2 billion | | | 0.75 | % |
| In excess of $2 billion | | | 0.65 | % |
MFS has agreed in writing to reduce its management fee by a specified amount if certain MFS mutual fund assets exceed thresholds agreed to by MFS and the fund’s Board of Trustees. For the six months ended April 30, 2018, this management fee reduction amounted to $13,928, which is included in the reduction of total expenses in the Statement of Operations. The management fee incurred for the six months ended April 30, 2018 was equivalent to an annual effective rate of 0.89% of the fund’s average daily net assets.
The investment adviser has agreed in writing to pay a portion of the fund’s total annual operating expenses, excluding interest, taxes, extraordinary expenses, brokerage and transaction costs, and investment-related expenses, such that total fund operating expenses do not exceed the following rates annually of each class’s average daily net assets:
| | | | | | | | | | | | | | | | | | | | | | | | | | | | | | | | |
| Classes | |
| A | | B | | | C | | | I | | | R1 | | | R2 | | | R3 | | | R4 | | | R6 | |
| 1.40% | | | 2.15% | | | | 2.15% | | | | 1.15% | | | | 2.15% | | | | 1.65% | | | | 1.40% | | | | 1.15% | | | | 1.08% | |
This written agreement will continue until modified by the fund’s Board of Trustees, but such agreement will continue at least until February 28, 2019. For the six months ended April 30, 2018, the fund’s actual operating expenses did not exceed the limit and therefore, the investment adviser did not pay any portion of the fund’s expenses related to this agreement.
Distributor – MFS Fund Distributors, Inc. (MFD), a wholly-owned subsidiary of MFS, as distributor, received $28,791 for the six months ended April 30, 2018, as its portion of the initial sales charge on sales of Class A shares of the fund.
The Board of Trustees has adopted a distribution plan for certain share classes pursuant to Rule 12b-1 of the Investment Company Act of 1940.
The fund’s distribution plan provides that the fund will pay MFD for services provided by MFD and financial intermediaries in connection with the distribution and servicing of certain share classes. One component of the plan is a distribution fee paid to MFD and another component of the plan is a service fee paid to MFD. MFD may subsequently pay all, or a portion, of the distribution and/or service fees to financial intermediaries.
31
Notes to Financial Statements (unaudited) – continued
Distribution Plan Fee Table:
| | | | | | | | | | | | | | | | | | | | |
| | | Distribution
Fee Rate (d) | | | Service
Fee Rate (d) | | | Total
Distribution
Plan (d) | | | Annual
Effective
Rate (e) | | | Distribution
and Service
Fee | |
| Class A | | | — | | | | 0.25% | | | | 0.25% | | | | 0.24% | | | | $262,335 | |
| Class B | | | 0.75% | | | | 0.25% | | | | 1.00% | | | | 1.00% | | | | 26,817 | |
| Class C | | | 0.75% | | | | 0.25% | | | | 1.00% | | | | 1.00% | | | | 71,611 | |
| Class R1 | | | 0.75% | | | | 0.25% | | | | 1.00% | | | | 1.00% | | | | 4,852 | |
| Class R2 | | | 0.25% | | | | 0.25% | | | | 0.50% | | | | 0.50% | | | | 7,324 | |
| Class R3 | | | — | | | | 0.25% | | | | 0.25% | | | | 0.25% | | | | 6,237 | |
| Total Distribution and Service Fees | | | | | | | | | | | | $379,176 | |
| (d) | In accordance with the distribution plan for certain classes, the fund pays distribution and/or service fees equal to these annual percentage rates of each class’s average daily net assets. The distribution and service fee rates disclosed by class represent the current rates in effect at the end of the reporting period. Any rate changes, if applicable, are detailed below. |
| (e) | The annual effective rates represent actual fees incurred under the distribution plan for the six months ended April 30, 2018 based on each class’s average daily net assets. MFD has voluntarily agreed to rebate a portion of each class’s 0.25% service fee attributable to accounts for which MFD retains the 0.25% service fee except for accounts attributable to MFS or its affiliates’ seed money. For the six months ended April 30, 2018, this rebate amounted to $10,921, $79, and $330 for Class A, Class B, and Class C, respectively, and is included in the reduction of total expenses in the Statement of Operations. |
Certain Class A shares are subject to a contingent deferred sales charge (CDSC) in the event of a shareholder redemption within 18 months of purchase. Class B shares are subject to a CDSC in the event of a shareholder redemption within six years of purchase. Class C shares are subject to a CDSC in the event of a shareholder redemption within 12 months of purchase. All contingent deferred sales charges are paid to MFD and during the six months ended April 30, 2018, were as follows:
| | | | |
| | | Amount | |
| Class A | | | $1,580 | |
| Class B | | | 1,225 | |
| Class C | | | 594 | |
Shareholder Servicing Agent – MFS Service Center, Inc. (MFSC), a wholly-owned subsidiary of MFS, receives a fee from the fund for its services as shareholder servicing agent calculated as a percentage of the average daily net assets of the fund as determined periodically under the supervision of the fund’s Board of Trustees. For the six months ended April 30, 2018, the fee was $49,270, which equated to 0.0315% annually of the fund’s average daily net assets. MFSC also receives payment from the fund for out-of-pocket expenses, sub-accounting and other shareholder servicing costs which may be paid to affiliated and unaffiliated service providers. Class R6 shares do not incur sub-accounting fees. For the six months ended April 30, 2018, these out-of-pocket expenses, sub-accounting and other shareholder servicing costs amounted to $117,016.
Administrator – MFS provides certain financial, legal, shareholder communications, compliance, and other administrative services to the fund. Under an administrative services agreement, the fund reimburses MFS the costs incurred to provide these
32
Notes to Financial Statements (unaudited) – continued
services. The fund is charged an annual fixed amount of $17,500 plus a fee based on average daily net assets. The administrative services fee incurred for the six months ended April 30, 2018 was equivalent to an annual effective rate of 0.0181% of the fund’s average daily net assets.
Trustees’ and Officers’ Compensation – The fund pays compensation to independent Trustees in the form of a retainer, attendance fees, and additional compensation to Board and Committee chairpersons. The fund does not pay compensation directly to Trustees or officers of the fund who are also officers of the investment adviser, all of whom receive remuneration for their services to the fund from MFS. Certain officers and Trustees of the fund are officers or directors of MFS, MFD, and MFSC.
Prior to December 31, 2001, the fund had an unfunded defined benefit plan (“DB plan”) for independent Trustees. As of December 31, 2001, the Board took action to terminate the DB plan with respect to then-current and any future independent Trustees, such that the DB plan covers only certain of those former independent Trustees who retired on or before December 31, 2001. The DB plan resulted in a pension expense of $526 and is included in “Independent Trustees’ compensation” in the Statement of Operations for the six months ended April 30, 2018. The liability for deferred retirement benefits payable to certain independent Trustees under the DB plan amounted to $2,937 at April 30, 2018, and is included in “Payable for independent Trustees’ compensation” in the Statement of Assets and Liabilities.
Other – This fund and certain other funds managed by MFS (the funds) have entered into a service agreement (the ISO Agreement) which provides for payment of fees solely by the funds to Tarantino LLC in return for the provision of services of an Independent Senior Officer (ISO) for the funds. Frank L. Tarantino serves as the ISO and is an officer of the funds and the sole member of Tarantino LLC. The funds can terminate the ISO Agreement with Tarantino LLC at any time under the terms of the ISO Agreement. For the six months ended April 30, 2018, the fee paid by the fund under this agreement was $248 and is included in “Miscellaneous” expense in the Statement of Operations. MFS has agreed to bear all expenses associated with office space, other administrative support, and supplies provided to the ISO.
The fund invests in the MFS Institutional Money Market Portfolio which is managed by MFS and seeks current income consistent with preservation of capital and liquidity. This money market fund does not pay a management fee to MFS.
On March 16, 2017, MFS redeemed 1,649 shares of Class I for an aggregate amount of $59,501. On August 15, 2017, MFS purchased 390, 370, and 1,640 shares of Class R1, Class R4, and Class R6 for an aggregate amount of $92,115. On September 20, 2017, MFS purchased 33 shares of Class I for an aggregate amount of $1,334. On March 19, 2018, MFS redeemed 5,985 shares of Class I for an aggregate amount of $256,087.
The fund is permitted to engage in purchase and sale transactions with funds and accounts for which MFS serves as investment adviser or sub-adviser (“cross-trades”) pursuant to a policy adopted by the Board of Trustees. This policy has been designed to ensure that cross-trades conducted by the fund comply with Rule 17a-7 under the Investment Company Act of 1940. During the six months ended April 30, 2018, the
33
Notes to Financial Statements (unaudited) – continued
fund engaged in purchase and sale transactions pursuant to this policy, which amounted to $50,123 and $593,851, respectively. The sales transactions resulted in net realized gains (losses) of $68,732.
Effective January 3, 2018, the adviser has voluntarily undertaken to reimburse the fund from its own resources on a quarterly basis for the cost of investment research embedded in the cost of the fund’s securities trades. This agreement may be rescinded at any time. This reimbursement, if any, will be determined in arrears on a quarterly basis beginning with the quarter ending March 31, 2018.
(4) Portfolio Securities
For the six months ended April 30, 2018, purchases and sales of investments, other than short-term obligations, aggregated $35,774,455 and $27,400,440, respectively.
(5) Shares of Beneficial Interest
The fund’s Declaration of Trust permits the Trustees to issue an unlimited number of full and fractional shares of beneficial interest. Transactions in fund shares were as follows:
| | | | | | | | | | | | | | | | |
| | | Six months ended
4/30/18 | | | Year ended
10/31/17 | |
| | | Shares | | | Amount | | | Shares | | | Amount | |
| Shares sold | | | | | | | | | | | | | | | | |
Class A | | | 448,282 | | | | $18,566,826 | | | | 529,057 | | | | $19,179,749 | |
Class B | | | 17,187 | | | | 623,587 | | | | 24,397 | | | | 772,441 | |
Class C | | | 50,690 | | | | 1,820,713 | | | | 70,743 | | | | 2,257,388 | |
Class I | | | 196,551 | | | | 8,399,894 | | | | 782,969 | | | | 28,071,377 | |
Class R1 | | | 851 | | | | 30,201 | | | | 1,951 | | | | 61,202 | |
Class R2 | | | 2,979 | | | | 118,402 | | | | 7,850 | | | | 273,297 | |
Class R3 | | | 11,003 | | | | 453,482 | | | | 16,451 | | | | 607,710 | |
Class R4 | | | 3,729 | | | | 157,132 | | | | 4,609 | | | | 169,858 | |
Class R6 | | | 342,547 | | | | 14,539,224 | | | | 1,002,448 | | | | 39,260,558 | |
| | | 1,073,819 | | | | $44,709,461 | | | | 2,440,475 | | | | $90,653,580 | |
| | | | |
| Shares issued to shareholders in reinvestment of distributions | | | | | | | | | | | | | | | | |
Class A | | | 170,362 | | | | $6,840,045 | | | | 82,205 | | | | $2,651,935 | |
Class B | | | 5,710 | | | | 200,771 | | | | 2,867 | | | | 81,890 | |
Class C | | | 15,296 | | | | 531,387 | | | | 6,713 | | | | 189,510 | |
Class I | | | 14,921 | | | | 613,141 | | | | 11,982 | | | | 395,031 | |
Class R1 | | | 1,100 | | | | 38,118 | | | | 509 | | | | 14,350 | |
Class R2 | | | 2,445 | | | | 95,212 | | | | 1,348 | | | | 42,269 | |
Class R3 | | | 4,445 | | | | 177,519 | | | | 2,010 | | | | 64,535 | |
Class R4 | | | 404 | | | | 16,235 | | | | 298 | | | | 9,627 | |
Class R6 | | | 37,486 | | | | 1,539,184 | | | | 32 | | | | 1,042 | |
| | | 252,169 | | | | $10,051,612 | | | | 107,964 | | | | $3,450,189 | |
34
Notes to Financial Statements (unaudited) – continued
| | | | | | | | | | | | | | | | |
| | | Six months ended
4/30/18 | | | Year ended
10/31/17 | |
| | | Shares | | | Amount | | | Shares | | | Amount | |
| Shares reacquired | | | | | | | | | | | | | | | | |
Class A | | | (333,756 | ) | | | $(13,864,928 | ) | | | (889,331 | ) | | | $(31,400,810 | ) |
Class B | | | (17,627 | ) | | | (643,522 | ) | | | (49,944 | ) | | | (1,570,986 | ) |
Class C | | | (211,654 | ) | | | (7,565,891 | ) | | | (142,930 | ) | | | (4,558,389 | ) |
Class I | | | (154,264 | ) | | | (6,492,604 | ) | | | (916,563 | ) | | | (35,345,409 | ) |
Class R1 | | | (2,549 | ) | | | (90,945 | ) | | | (3,028 | ) | | | (90,556 | ) |
Class R2 | | | (5,193 | ) | | | (214,453 | ) | | | (23,451 | ) | | | (830,349 | ) |
Class R3 | | | (17,539 | ) | | | (722,668 | ) | | | (24,379 | ) | | | (869,128 | ) |
Class R4 | | | (5,633 | ) | | | (234,910 | ) | | | (6,556 | ) | | | (248,397 | ) |
Class R6 | | | (122,246 | ) | | | (5,185,389 | ) | | | (74,477 | ) | | | (2,933,600 | ) |
| | | (870,461 | ) | | | $(35,015,310 | ) | | | (2,130,659 | ) | | | $(77,847,624 | ) |
| | | | |
| Net change | | | | | | | | | | | | | | | | |
Class A | | | 284,888 | | | | $11,541,943 | | | | (278,069 | ) | | | $(9,569,126 | ) |
Class B | | | 5,270 | | | | 180,836 | | | | (22,680 | ) | | | (716,655 | ) |
Class C | | | (145,668 | ) | | | (5,213,791 | ) | | | (65,474 | ) | | | (2,111,491 | ) |
Class I | | | 57,208 | | | | 2,520,431 | | �� | | (121,612 | ) | | | (6,879,001 | ) |
Class R1 | | | (598 | ) | | | (22,626 | ) | | | (568 | ) | | | (15,004 | ) |
Class R2 | | | 231 | | | | (839 | ) | | | (14,253 | ) | | | (514,783 | ) |
Class R3 | | | (2,091 | ) | | | (91,667 | ) | | | (5,918 | ) | | | (196,883 | ) |
Class R4 | | | (1,500 | ) | | | (61,543 | ) | | | (1,649 | ) | | | (68,912 | ) |
Class R6 | | | 257,787 | | | | 10,893,019 | | | | 928,003 | | | | 36,328,000 | |
| | | 455,527 | | | | $19,745,763 | | | | 417,780 | | | | $16,256,145 | |
Class T shares were not publicly available for sale during the period. Please see the fund’s prospectus for details.
(6) Line of Credit
The fund and certain other funds managed by MFS participate in a $1.25 billion unsecured committed line of credit, subject to a $1 billion sublimit, provided by a syndication of banks under a credit agreement. Borrowings may be made for temporary financing needs. Interest is charged to each fund, based on its borrowings, generally at a rate equal to the higher of the Overnight Federal Reserve funds rate or daily one month LIBOR plus an agreed upon spread. A commitment fee, based on the average daily, unused portion of the committed line of credit, is allocated among the participating funds at the end of each calendar quarter. In addition, the fund and other funds managed by MFS have established unsecured uncommitted borrowing arrangements with certain banks for temporary financing needs. Interest is charged to each fund, based on its borrowings, at a rate equal to the Overnight Federal Reserve funds rate plus an agreed upon spread. For the six months ended April 30, 2018, the fund’s commitment fee and interest expense were $952 and $0, respectively, and are included in “Miscellaneous” expense in the Statement of Operations.
35
Notes to Financial Statements (unaudited) – continued
(7) Investments in Affiliated Issuers
An affiliated issuer may be considered one in which the fund owns 5% or more of the outstanding voting securities, or a company which is under common control. For the purposes of this report, the fund assumes the following to be affiliated issuers:
| | | | | | | | | | | | | | | | | | | | |
| Affiliated Issuers | | | | | Beginning
Shares/Par
Amount | | | Acquisitions
Shares/Par
Amount | | | Dispositions
Shares/Par
Amount | | | Ending
Shares/Par
Amount | |
| MFS Institutional Money Market Portfolio | | | | | | | 3,515,847 | | | | 26,915,649 | | | | (26,652,575 | ) | | | 3,778,921 | |
| | | | | |
| Affiliated Issuers | | Realized
Gain (Loss) | | | Change in
Unrealized
Appreciation
(Depreciation) | | | Capital Gain
Distributions | | | Dividend
Income | | | Ending
Value | |
| MFS Institutional Money Market Portfolio | | | $(161 | ) | | | $(62 | ) | | | $— | | | | $26,552 | | | | $3,778,544 | |
36
PROXY VOTING POLICIES AND INFORMATION
MFS votes proxies on behalf of the fund pursuant to proxy voting policies and procedures that are available without charge, upon request, by calling 1-800-225-2606, by visiting mfs.com/proxyvoting, or by visiting the SEC’s Web site at http://www.sec.gov.
Information regarding how the fund voted proxies relating to portfolio securities during the most recent twelve-month period ended June 30 is available by August 31 of each year without charge by visiting mfs.com/proxyvoting, or by visiting the SEC’s Web site at http://www.sec.gov.
QUARTERLY PORTFOLIO DISCLOSURE
The fund will file a complete schedule of portfolio holdings with the Securities and Exchange Commission (the Commission) for the first and third quarters of each fiscal year on Form N-Q. A shareholder can obtain the quarterly portfolio holdings report at mfs.com. The fund’s Form N-Q is also available on the EDGAR database on the Commission’s Internet Web site at http://www.sec.gov, and may be reviewed and copied at the:
Public Reference Room
Securities and Exchange Commission
100 F Street, NE, Room 1580
Washington, D.C. 20549
Information on the operation of the Public Reference Room may be obtained by calling the Commission at 1-800-SEC-0330. Copies of the fund’s Form N-Q also may be obtained, upon payment of a duplicating fee, by electronic request at the following e-mail address: publicinfo@sec.gov or by writing the Public Reference Section at the above address.
FURTHER INFORMATION
From time to time, MFS may post important information about the fund or the MFS funds on the MFS web site (mfs.com). This information is available at https://www.mfs.com/en-us/what-we-do/announcements.html or at mfs.com/openendfunds by choosing the fund’s name.
37
INFORMATION ABOUT FUND CONTRACTS AND LEGAL CLAIMS
The fund has entered into contractual arrangements with an investment adviser, administrator, distributor, shareholder servicing agent, 529 program manager (if applicable), and custodian who each provide services to the fund. Unless expressly stated otherwise, shareholders are not parties to, or intended beneficiaries of these contractual arrangements, and these contractual arrangements are not intended to create any shareholder right to enforce them against the service providers or to seek any remedy under them against the service providers, either directly or on behalf of the fund.
Under the Trust’s By-Laws and Declaration of Trust, any claims asserted against or on behalf of the MFS Funds, including claims against Trustees and Officers, must be brought in state and federal courts located within the Commonwealth of Massachusetts.
PROVISION OF FINANCIAL REPORTS AND SUMMARY PROSPECTUSES
The fund produces financial reports every six months and updates its summary prospectus and prospectus annually. To avoid sending duplicate copies of materials to households, only one copy of the fund’s annual and semiannual report and summary prospectus may be mailed to shareholders having the same last name and residential address on the fund’s records. However, any shareholder may contact MFSC (please see back cover for address and telephone number) to request that copies of these reports and summary prospectuses be sent personally to that shareholder.
38
Save paper with eDelivery.

| MFS® will send you prospectuses, |
reports, and proxies directly via e-mail so you will get information faster with less mailbox clutter.
To sign up:
1. Go to mfs.com.
2. Log in via MFS® Access.
3. Select eDelivery.
If you own your MFS fund shares through a financial institution or a retirement plan, MFS® TALK, MFS® Access, or eDelivery may not be available to you.
CONTACT
WEB SITE
mfs.com
MFS TALK
1-800-637-8255
24 hours a day
ACCOUNT SERVICE AND LITERATURE
Shareholders
1-800-225-2606
Financial advisors
1-800-343-2829
Retirement plan services
1-800-637-1255
MAILING ADDRESS
MFS Service Center, Inc.
P.O. Box 55824
Boston, MA 02205-5824
OVERNIGHT MAIL
MFS Service Center, Inc.
c/o DST Asset Manager Solutions, Inc.
30 Dan Road
Canton, MA 02021-2809
Semiannual Report
April 30, 2018

MFS® Strategic Income Fund

MFO-SEM
MFS® Strategic Income Fund
CONTENTS
The report is prepared for the general information of shareholders.
It is authorized for distribution to prospective investors only when preceded or accompanied by a current prospectus.
NOT FDIC INSURED • MAY LOSE VALUE • NO BANK GUARANTEE

LETTER FROM THE EXECUTIVE CHAIRMAN
Dear Shareholders:
Rising bond yields have led to a measurable uptick in market volatility — a departure from the low-volatility environment that prevailed for much of 2017. In recent months,
against this backdrop, global markets have given back some of the strong gains recorded during 2017 and early 2018. Global economic growth remains robust, notwithstanding signs of a modest slowdown over the past few months, particularly in Europe.
Although the U.S. Federal Reserve continues to gradually raise interest rates and shrink its balance sheet, monetary policy remains accommodative around the world, with many central banks taking only tentative steps toward tighter policies. Newly enacted U.S. tax reforms have been welcomed by equity markets, while emerging market economies have benefited from a weaker U.S. dollar.
Around the world, inflation remains largely subdued, but tight labor markets and solid global demand have investors on the lookout for its potential resurgence. Increased U.S. protectionism is also a growing concern, as investors fear that trade friction could disrupt the synchronized rise in global growth.
As a global investment manager, MFS® strives to create long-term value and protect capital for clients through an active approach and an investment platform built on nearly a century of expertise. To make that long-term value meaningful for clients, we work to align with you on our beliefs, your needs and the time it takes to deliver on your desired outcomes.
Respectfully,

Robert J. Manning
Executive Chairman
MFS Investment Management
June 18, 2018
The opinions expressed in this letter are subject to change and may not be relied upon for investment advice. No forecasts can be guaranteed.
1
PORTFOLIO COMPOSITION
Portfolio structure (i)
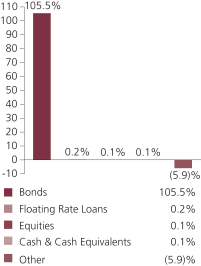
| | | | |
| Fixed income sectors (i) | | | | |
| Investment Grade Corporates | | | 31.3% | |
| U.S. Treasury Securities | | | 20.4% | |
| High Yield Corporates | | | 19.2% | |
| Collateralized Debt Obligations | | | 10.7% | |
| Commercial Mortgage-Backed Securities | | | 9.6% | |
| Emerging Markets Bonds | | | 9.1% | |
| Asset-Backed Securities | | | 3.4% | |
| Municipal Bonds | | | 0.7% | |
| Non-U.S. Government Bonds | | | 0.4% | |
| Mortgage-Backed Securities | | | 0.4% | |
| Residential Mortgage-Backed Securities | | | 0.3% | |
| Floating Rate Loans | | | 0.2% | |
| | | | |
| Composition including fixed income credit quality (a)(i) | |
| AAA | | | 10.9% | |
| AA | | | 4.2% | |
| A | | | 21.0% | |
| BBB | | | 21.6% | |
| BB | | | 11.3% | |
| B | | | 13.2% | |
| CCC | | | 1.6% | |
| CC | | | 0.1% | |
| C (o) | | | 0.0% | |
| D (o) | | | 0.0% | |
| U.S. Government | | | 14.6% | |
| Federal Agencies | | | 0.4% | |
| Not Rated | | | 6.8% | |
| Non-Fixed Income | | | 0.1% | |
| Cash & Cash Equivalents | | | 0.1% | |
| Other | | | (5.9)% | |
| |
| Portfolio facts (i) | | | | |
| Average Duration (d) | | | 6.0 | |
| Average Effective Maturity (m) | | | 9.1 yrs. | |
2
Portfolio Composition – continued
| (a) | For all securities other than those specifically described below, ratings are assigned to underlying securities utilizing ratings from Moody’s, Fitch, and Standard & Poor’s rating agencies and applying the following hierarchy: If all three agencies provide a rating, the middle rating (after dropping the highest and lowest ratings) is assigned; if two of the three agencies rate a security, the lower of the two is assigned. Ratings are shown in the S&P and Fitch scale (e.g., AAA). Securities rated BBB or higher are considered investment grade. All ratings are subject to change. U.S. Government includes securities issued by the U.S. Department of the Treasury. Federal Agencies includes rated and unrated U.S. Agency fixed-income securities, U.S. Agency mortgage-backed securities, and collateralized mortgage obligations of U.S. Agency mortgage-backed securities. Not Rated includes fixed income securities, including fixed income futures contracts, which have not been rated by any rating agency. Non-Fixed Income includes equity securities (including convertible bonds and equity derivatives) and/or commodity-linked derivatives. The fund may or may not have held all of these instruments on this date. The fund is not rated by these agencies. |
| (d) | Duration is a measure of how much a bond’s price is likely to fluctuate with general changes in interest rates, e.g., if rates rise 1.00%, a bond with a 5-year duration is likely to lose about 5.00% of its value due to the interest rate move. |
| (i) | For purposes of this presentation, the components include the value of securities, and reflect the impact of the equivalent exposure of derivative positions, if any. These amounts may be negative from time to time. Equivalent exposure is a calculated amount that translates the derivative position into a reasonable approximation of the amount of the underlying asset that the portfolio would have to hold at a given point in time to have the same price sensitivity that results from the portfolio’s ownership of the derivative contract. When dealing with derivatives, equivalent exposure is a more representative measure of the potential impact of a position on portfolio performance than value. The bond component will include any accrued interest amounts. |
| (m) | In determining an instrument’s effective maturity for purposes of calculating the fund’s dollar-weighted average effective maturity, MFS uses the instrument’s stated maturity or, if applicable, an earlier date on which MFS believes it is probable that a maturity-shortening device (such as a put, pre-refunding or prepayment) will cause the instrument to be repaid. Such an earlier date can be substantially shorter than the instrument’s stated maturity. |
Where the fund holds convertible bonds, they are treated as part of the equity portion of the portfolio.
The fund invests a portion of its assets in the MFS High Yield Pooled Portfolio. Percentages reflect exposure to the underlying holdings, including Cash & Cash Equivalents and Other, of the MFS High Yield Pooled Portfolio and not to the exposure from investing directly in the MFS High Yield Pooled Portfolio itself.
Cash & Cash Equivalents includes any cash, investments in money market funds, short-term securities, and other assets less liabilities. Please see the Statement of Assets and Liabilities for additional information related to the fund’s cash position and other assets and liabilities.
Other includes equivalent exposure from currency derivatives and/or any offsets to derivative positions and may be negative.
Percentages are based on net assets as of April 30, 2018.
The portfolio is actively managed and current holdings may be different.
3
EXPENSE TABLE
Fund expenses borne by the shareholders during the period, November 1, 2017 through April 30, 2018
As a shareholder of the fund, you incur two types of costs: (1) transaction costs, including sales charges (loads) on certain purchase or redemption payments, and (2) ongoing costs, including management fees; distribution and service (12b-1) fees; and other fund expenses. This example is intended to help you understand your ongoing costs (in dollars) of investing in the fund and to compare these costs with the ongoing costs of investing in other mutual funds.
In addition to the fees and expenses which the fund bears directly, the fund indirectly bears a pro rata share of the fees and expenses of the underlying MFS Pooled Portfolio in which the fund invests. MFS Pooled Portfolios are mutual funds advised by MFS that do not pay management fees to MFS but do incur investment and operating costs. If these transactional and indirect costs were included, your costs would have been higher.
The example is based on an investment of $1,000 invested at the beginning of the period and held for the entire period November 1, 2017 through April 30, 2018.
Actual Expenses
The first line for each share class in the following table provides information about actual account values and actual expenses. You may use the information in this line, together with the amount you invested, to estimate the expenses that you paid over the period. Simply divide your account value by $1,000 (for example, an $8,600 account value divided by $1,000 = 8.6), then multiply the result by the number in the first line under the heading entitled “Expenses Paid During Period” to estimate the expenses you paid on your account during this period.
Hypothetical Example for Comparison Purposes
The second line for each share class in the following table provides information about hypothetical account values and hypothetical expenses based on the fund’s actual expense ratio and an assumed rate of return of 5% per year before expenses, which is not the fund’s actual return. The hypothetical account values and expenses may not be used to estimate the actual ending account balance or expenses you paid for the period. You may use this information to compare the ongoing costs of investing in the fund and other funds. To do so, compare this 5% hypothetical example with the 5% hypothetical examples that appear in the shareholder reports of the other funds.
Please note that the expenses shown in the table are meant to highlight your ongoing costs only and do not reflect any transactional costs, such as sales charges (loads). Therefore, the second line for each share class in the table is useful in comparing ongoing costs only, and will not help you determine the relative total costs of owning different funds. In addition, if these transactional costs were included, your costs would have been higher.
4
Expense Table – continued
| | | | | | | | | | | | | | | | | | |
Share
Class | | | | Annualized
Expense
Ratio | | | Beginning
Account Value
11/01/17 | | | Ending Account Value 4/30/18 | | | Expenses Paid During
Period (p)
11/01/17-4/30/18 | |
| A | | Actual | | | 1.04% | | | | $1,000.00 | | | | $980.05 | | | | $5.11 | |
| | Hypothetical (h) | | | 1.04% | | | | $1,000.00 | | | | $1,019.64 | | | | $5.21 | |
| B | | Actual | | | 1.80% | | | | $1,000.00 | | | | $974.92 | | | | $8.81 | |
| | Hypothetical (h) | | | 1.80% | | | | $1,000.00 | | | | $1,015.87 | | | | $9.00 | |
| C | | Actual | | | 1.80% | | | | $1,000.00 | | | | $976.07 | | | | $8.82 | |
| | Hypothetical (h) | | | 1.80% | | | | $1,000.00 | | | | $1,015.87 | | | | $9.00 | |
| I | | Actual | | | 0.80% | | | | $1,000.00 | | | | $981.23 | | | | $3.93 | |
| | Hypothetical (h) | | | 0.80% | | | | $1,000.00 | | | | $1,020.83 | | | | $4.01 | |
| R6 | | Actual (i) | | | 0.71% | | | | $1,000.00 | | | | $994.36 | | | | $1.16 | |
| | Hypothetical (h) | | | 0.71% | | | | $1,000.00 | | | | $1,021.27 | | | | $3.56 | |
| (h) | 5% class return per year before expenses. |
| (i) | For the period from the class inception, March 2, 2018, through the stated period end. |
| (p) | “Expenses Paid During Period” are equal to each class’s annualized expense ratio, as shown above, multiplied by the average account value over the period, multiplied by 181/365 (to reflect the one-half year period), except for Actual Expenses of Class R6, which is multiplied by 60/365 (to reflect the period from the commencement of the class’s investment operations, March 2, 2018, through April 30, 2018). For Hypothetical Expenses paid, it is assumed that Class R6 was in existence for the entire six month period ended April 30, 2018. Expenses paid do not include any applicable sales charges (loads). If these transaction costs had been included, your costs would have been higher. In addition to the fees and expenses which the fund bears directly, the fund indirectly bears a pro rata share of the fees and expenses of the underlying funds in which the fund invests. If these indirect costs were included, your costs would have been higher. |
Notes to Expense Table
Each class with a Rule 12b-1 service fee is subject to a rebate of a portion of such fee. Such rebates are included in the expense ratios above and are outside of the expense limitation arrangement. For Class A shares, this rebate reduced the expense ratio above by 0.01%. See Note 3 in the Notes to Financial Statements for additional information.
5
PORTFOLIO OF INVESTMENTS
4/30/18 (unaudited)
The Portfolio of Investments is a complete list of all securities owned by your fund. It is categorized by broad-based asset classes.
| | | | | | | | |
| Bonds - 79.8% | |
| Issuer | | Shares/Par | | | Value ($) | |
| Asset-Backed & Securitized - 23.9% | | | | | | | | |
| A Voce CLO Ltd., 2014-1A, “BR”, FLR, 4.498% (LIBOR-3mo. + 2.15%), 7/15/2026 (n) | | $ | 1,710,000 | | | $ | 1,712,562 | |
| Allegro CLO Ltd., 2014-1A, “BR”, FLR, 4.762% (LIBOR-3mo. + 2.4%), 1/21/2027 (n) | | | 869,893 | | | | 870,799 | |
| ARI Fleet Lease Trust, 2016-A, “A2”, 1.82%, 7/15/2024 (n) | | | 73,766 | | | | 73,625 | |
| Babson CLO Ltd., 2013-IIA, “BR”, FLR, 3.612% (LIBOR-3mo. + 1.25%), 1/20/2028 (n) | | | 1,750,000 | | | | 1,748,649 | |
| Babson CLO Ltd., 2014-IIA, “CR”, FLR, 4.553% (LIBOR-3mo. + 2.2%), 10/17/2026 (n) | | | 1,710,000 | | | | 1,709,600 | |
| Bancorp Commercial Mortgage Trust, 2018-CR3, “D”, FLR, 4.597% (LIBOR-1mo. + 2.7%), 1/15/2033 (z) | | | 1,751,843 | | | | 1,756,455 | |
| Bayview Financial Revolving Mortgage Loan Trust, FLR, 3.501% (LIBOR-1mo. + 1.6%), 12/28/2040 (z) | | | 245,625 | | | | 222,849 | |
| Benchmark Mortgage Trust, “2018-B1”, 3.666%, 1/15/2051 | | | 1,748,616 | | | | 1,741,081 | |
| Business Jet Securities LLC, 2018-1, “C”, 7.748%, 2/15/2033 (z) | | | 787,651 | | | | 800,522 | |
| Cavalry CLO IV Ltd./Cavalry CLO IV LLC, FLR, 4.248% (LIBOR-3mo. + 1.9%), 10/15/2026 (z) | | | 2,000,000 | | | | 1,998,890 | |
| Cent CLO LP, 2012-16AR, “A1AR”, FLR, 5.558% (LIBOR-3mo. + 3.2%), 8/01/2024 (z) | | | 1,685,000 | | | | 1,681,682 | |
| Cent CLO LP, 2014-21A, “A2AR”, FLR, 4.066% (LIBOR-3mo. + 1.7%), 7/27/2026 (n) | | | 944,440 | | | | 941,811 | |
| Cent CLO LP, 2014-21A, “BR”, FLR, 4.766% (LIBOR-3mo. + 2.4%), 7/27/2026 (n) | | | 1,633,430 | | | | 1,632,084 | |
| Chesapeake Funding II LLC, 2017-2A, “C”, 3.01%, 5/15/2029 (n) | | | 1,285,000 | | | | 1,271,532 | |
| Citigroup Commercial Mortgage Trust, 2017-C4, 3.471%, 10/12/2050 | | | 1,272,123 | | | | 1,246,858 | |
| Commercial Mortgage Pass-Through Certificates, “2017-BNK8”, “A3”, 3.229%, 11/15/2050 | | | 1,750,000 | | | | 1,682,637 | |
| Commercial Mortgage Pass-Through Certificates, “2018-BNK10”, “A5”, 3.688%, 2/15/2061 | | | 1,750,000 | | | | 1,743,923 | |
| Commercial Mortgage Trust, 2015-CR22, “A5”, 3.309%, 3/10/2048 | | | 943,747 | | | | 925,477 | |
| Commercial Mortgage Trust, 2015-PC1, “A5”, 3.902%, 7/10/2050 | | | 1,805,893 | | | | 1,835,247 | |
| Commercial Mortgage Trust, 2017-CD4, “A4”, 3.514%, 5/10/2050 | | | 664,113 | | | | 654,580 | |
| Commercial Mortgage Trust, 2017-COR2, “A3”, 3.51%, 9/10/2050 | | | 1,750,000 | | | | 1,717,887 | |
| CPS Auto Trust, 2016-D, “B”, 2.11%, 3/15/2021 (n) | | | 1,285,000 | | | | 1,274,694 | |
6
Portfolio of Investments (unaudited) – continued
| | | | | | | | |
| Issuer | | Shares/Par | | | Value ($) | |
| Bonds - continued | |
| Asset-Backed & Securitized - continued | | | | | | | | |
| Crest Ltd., CDO, 7%,(0.001% cash or 7% PIK) 1/28/2040 (a)(p) | | $ | 684,900 | | | $ | 71,914 | |
| Drive Auto Receivables Trust, 2017-1, “C”, 2.84%, 4/15/2022 | | | 555,000 | | | | 553,816 | |
| Dryden Senior Loan Fund, 2014-34A, “CR”, CLO, FLR, 4.498% (LIBOR-3mo. + 2.15%), 10/15/2026 (n) | | | 462,896 | | | | 465,252 | |
| DT Auto Owner Trust, 2017-2A, “C”, 3.03%, 1/17/2023 (n) | | | 1,285,000 | | | | 1,281,470 | |
| Eaton Vance CLO Ltd., 2014-1A, “CR”, FLR, 4.598% (LIBOR-3mo. + 2.25%), 7/15/2026 (n) | | | 1,700,000 | | | | 1,698,502 | |
| Falcon Franchise Loan LLC, 7.966%, 1/05/2023 (i)(z) | | | 68,038 | | | | 2,676 | |
| First Union-Lehman Brothers Bank of America, 1.187%, 11/18/2035 (i) | | | 602,796 | | | | 12,759 | |
| Flatiron CLO Ltd., 2015-1A, “CR”, FLR, 4.248% (LIBOR-3mo. + 1.9%), 4/15/2027 (n) | | | 1,740,000 | | | | 1,739,574 | |
| GMF Floorplan Owner Revolving Trust, 2017-2, “C”, 2.63%, 7/15/2022 (z) | | | 1,740,000 | | | | 1,703,327 | |
| GS Mortgage Securities Trust, 2017-GS6, “A3”, 3.433%, 5/10/2050 | | | 993,042 | | | | 971,774 | |
| GS Mortgage Securities Trust, 2017-GS7, “A4”, 3.43%, 8/10/2050 | | | 1,748,753 | | | | 1,696,833 | |
| HarbourView CLO VII Ltd., 7A, “CR”, FLR, 4.252% (LIBOR-3mo. + 2.38%), 11/18/2026 (n) | | | 1,700,000 | | | | 1,696,938 | |
| Invitation Homes Trust, 2018-SFR1, “C”, FLR, 3.146%, 3/17/2037 (z) | | | 870,000 | | | | 869,999 | |
| JPMorgan Chase Commercial Mortgage Securities Corp., 3.454%, 9/15/2050 | | | 769,436 | | | | 754,470 | |
| JPMorgan Chase Commercial Mortgage Trust, 2007-LD11, “AM”, 6.181%, 6/15/2049 | | | 393,705 | | | | 400,003 | |
| Magnetite CLO Ltd., 2015-16A, “DR”, FLR, 4.505% (LIBOR-3mo. + 2.15%), 1/18/2028 (z) | | | 500,000 | | | | 492,028 | |
| Morgan Stanley Bank of America Merrill Lynch Trust, 2017-C34, “A4”, 3.536%, 11/15/2052 | | | 1,611,527 | | | | 1,581,045 | |
| Morgan Stanley Capital I Trust, 2017-H1, “A5”, 3.53%, 6/15/2050 | | | 1,050,279 | | | | 1,033,232 | |
| Morgan Stanley Capital I, Inc., 1.493%, 4/28/2039 (i)(z) | | | 661,823 | | | | 993 | |
| Neuberger Berman CLO Ltd., 2016-21A, “CR”, FLR, 3.959% (LIBOR-3mo. + 1.6%), 4/20/2027 (n) | | | 1,750,000 | | | | 1,749,135 | |
| NextGear Floorplan Master Owner Trust, 2017-2A, “B”, 3.02%, 10/17/2022 (n) | | | 1,475,000 | | | | 1,459,066 | |
| NextGear Floorplan Master Owner Trust, 2018-1A, “B”, 3.57%, 2/15/2023 (z) | | | 800,000 | | | | 796,336 | |
| Oaktree CLO Ltd., 2014-2A, “BR”, FLR, 4.909% (LIBOR-3mo. + 2.55%), 10/20/2026 (n) | | | 1,700,000 | | | | 1,707,618 | |
| OCP CLO Ltd., 2015-9A, “A2R”, FLR, 3.698% (LIBOR-3mo. + 1.35%), 7/15/2027 (z) | | | 1,500,000 | | | | 1,498,636 | |
7
Portfolio of Investments (unaudited) – continued
| | | | | | | | |
| Issuer | | Shares/Par | | | Value ($) | |
| Bonds - continued | |
| Asset-Backed & Securitized - continued | | | | | | | | |
| Parallel Ltd., 2015-1A, “DR”, FLR, 4.909% (LIBOR-3mo. + 2.55%, 7/20/2027 (n) | | $ | 1,750,000 | | | $ | 1,733,517 | |
| Race Point CLO Ltd., 2013-8A, “CR”, FLR, 4.385% (LIBOR-3mo. + 2.5%), 2/20/2030 (n) | | | 1,700,000 | | | | 1,711,516 | |
| Santander Drive Auto Receivables Trust, 2017-2, “C”, 2.79%, 8/15/2022 | | | 1,286,000 | | | | 1,278,342 | |
| Shackleton CLO Ltd., 2014-6A, “CR”, FLR, 4.603% (LIBOR-3mo. + 2.25%), 7/17/2026 (n) | | | 1,710,000 | | | | 1,718,748 | |
| Sierra Receivables Funding Co. LLC, 2015-1A, “A”, 2.4%, 3/22/2032 (n) | | | 211,949 | | | | 210,143 | |
| Silver Spring CLO Ltd., FLR, 5.098% (LIBOR-3mo. + 2.75%), 10/15/2026 (n) | | | 1,720,000 | | | | 1,717,178 | |
| UBS Commercial Mortgage Trust 2017-C1, “A4”, 3.544%, 11/15/2050 | | | 1,748,753 | | | | 1,714,723 | |
| UBS Commercial Mortgage Trust 2017-C6, “A5”, 3.58%, 12/15/2050 | | | 1,750,000 | | | | 1,722,219 | |
| UBS Commercial Mortgage Trust 2017-C7, “A4”, 3.679%, 12/15/2050 | | | 1,750,000 | | | | 1,733,114 | |
| UBS Commercial Mortgage Trust 2017-C8, “A4”, 3.983%, 2/15/2051 | | | 1,750,000 | | | | 1,775,787 | |
| Voya CLO Ltd., 2013-3A, “BR”, FLR, 4.505% (LIBOR-3mo. + 2.15%), 1/18/2026 (n) | | | 1,710,000 | | | | 1,718,786 | |
| Wells Fargo Commercial Mortgage Trust, 2017-C42, “A5”, 3.589%, 12/15/2050 | | | 1,750,000 | | | | 1,728,839 | |
| Wells Fargo Commercial Mortgage Trust, 2017-RB1, “A4”, 3.374%, 3/15/2050 | | | 1,970,000 | | | | 1,920,887 | |
| West CLO Ltd., 2014-1A, “CR”, FLR, 5.355% (LIBOR-3mo. + 3%), 7/18/2026 (n) | | | 1,740,000 | | | | 1,739,211 | |
| | | | | | | | |
| | | | | | | $ | 75,903,850 | |
| Automotive - 0.9% | | | | | | | | |
| General Motors Co., 4.2%, 10/01/2027 | | $ | 866,000 | | | $ | 828,641 | |
| General Motors Financial Co., Inc., 3.45%, 4/10/2022 | | | 1,984,000 | | | | 1,957,052 | |
| | | | | | | | |
| | | | | | | $ | 2,785,693 | |
| Broadcasting - 0.2% | | | | | | | | |
| Time Warner, Inc., 3.8%, 2/15/2027 | | $ | 701,000 | | | $ | 678,336 | |
| | |
| Brokerage & Asset Managers - 0.2% | | | | | | | | |
| Raymond James Financial, Inc., 4.95%, 7/15/2046 | | $ | 658,000 | | | $ | 688,420 | |
| | |
| Building - 0.8% | | | | | | | | |
| CRH America Finance, Inc., 4.5%, 4/04/2048 (n) | | $ | 400,000 | | | $ | 384,263 | |
| Martin Marietta Materials, Inc., 4.25%, 7/02/2024 | | | 1,054,000 | | | | 1,073,921 | |
8
Portfolio of Investments (unaudited) – continued
| | | | | | | | |
| Issuer | | Shares/Par | | | Value ($) | |
| Bonds - continued | |
| Building - continued | | | | | | | | |
| Martin Marietta Materials, Inc., 3.5%, 12/15/2027 | | $ | 1,057,000 | | | $ | 991,483 | |
| | | | | | | | |
| | | | | | | $ | 2,449,667 | |
| Cable TV - 1.0% | | | | | | | | |
| Cox Communications, Inc., 3.25%, 12/15/2022 (n) | | $ | 1,138,000 | | | $ | 1,109,812 | |
| Time Warner Cable, Inc., 8.25%, 4/01/2019 | | | 920,000 | | | | 963,965 | |
| Time Warner Cable, Inc., 4.5%, 9/15/2042 | | | 1,279,000 | | | | 1,084,032 | |
| | | | | | | | |
| | | | | | | $ | 3,157,809 | |
| Computer Software - 2.0% | | | | | | | | |
| Microsoft Corp., 3.125%, 11/03/2025 | | $ | 1,576,000 | | | $ | 1,533,995 | |
| Microsoft Corp., 4.25%, 2/06/2047 | | | 2,498,000 | | | | 2,621,340 | |
| Oracle Corp., 3.25%, 11/15/2027 | | | 2,185,000 | | | | 2,100,731 | |
| | | | | | | | |
| | | | | | | $ | 6,256,066 | |
| Computer Software - Systems - 0.5% | | | | | | | | |
| Apple, Inc., 4.25%, 2/09/2047 | | $ | 1,705,000 | | | $ | 1,733,012 | |
| | |
| Conglomerates - 0.2% | | | | | | | | |
| United Technologies Corp., 4.05%, 5/04/2047 | | $ | 646,000 | | | $ | 595,672 | |
| | |
| Construction - 0.0% | | | | | | | | |
| Empresas ICA S.A.B. de C.V., 8.875%, 5/29/2024 (a)(d)(n) | | $ | 433,000 | | | $ | 64,950 | |
| | |
| Consumer Products - 1.3% | | | | | | | | |
| Reckitt Benckiser Treasury Services PLC, 3.625%, 9/21/2023 (n) | | $ | 921,000 | | | $ | 917,200 | |
| Reckitt Benckiser Treasury Services PLC, 2.75%, 6/26/2024 (n) | | | 3,256,000 | | | | 3,077,501 | |
| | | | | | | | |
| | | | | | | $ | 3,994,701 | |
| Consumer Services - 0.5% | | | | | | | | |
| Priceline Group, Inc., 3.55%, 3/15/2028 | | $ | 1,679,000 | | | $ | 1,597,404 | |
| | |
| Containers - 0.1% | | | | | | | | |
| San Miguel Industrias PET S.A., 4.5%, 9/18/2022 (n) | | $ | 200,000 | | | $ | 198,000 | |
| | |
| Emerging Market Quasi-Sovereign - 1.0% | | | | | | | | |
| Export-Import Bank of India, 3.875%, 2/01/2028 (n) | | $ | 300,000 | | | $ | 284,549 | |
| KazMunayGas National Co., 5.375%, 4/24/2030 (z) | | | 248,000 | | | | 247,926 | |
| Petrobras Global Finance B.V., 5.999%, 1/27/2028 (n) | | | 846,000 | | | | 824,723 | |
| Petroleos del Peru S.A., 5.625%, 6/19/2047 | | | 987,000 | | | | 960,104 | |
| Southern Gas Corridor CJSC, 6.875%, 3/24/2026 (n) | | | 689,000 | | | | 752,732 | |
| | | | | | | | |
| | | | | | | $ | 3,070,034 | |
9
Portfolio of Investments (unaudited) – continued
| | | | | | | | |
| Issuer | | Shares/Par | | | Value ($) | |
| Bonds - continued | |
| Emerging Market Sovereign - 4.6% | | | | | | | | |
| Arab Republic of Egypt, 6.588%, 2/21/2028 (n) | | $ | 1,492,000 | | | $ | 1,471,440 | |
| Government of Malaysia, 3.58%, 9/28/2018 | | MYR | 3,645,000 | | | | 929,538 | |
| Government of Ukraine, 7.75%, 9/01/2021 | | $ | 780,000 | | | | 805,506 | |
| Government of Ukraine, 7.375%, 9/25/2032 (n) | | | 872,000 | | | | 804,594 | |
| Kingdom of Thailand, 3.875%, 6/13/2019 | | THB | 50,411,000 | | | | 1,639,758 | |
| Oriental Republic of Uruguay, 4.975%, 4/20/2055 | | $ | 154,000 | | | | 148,225 | |
| Republic of Argentina, 5.875%, 1/11/2028 | | | 664,000 | | | | 608,224 | |
| Republic of Argentina, 7.125%, 7/06/2036 | | | 945,000 | | | | 898,695 | |
| Republic of Cote d’Ivoire, 5.25%, 3/22/2030 (n) | | EUR | 679,000 | | | | 830,423 | |
| Republic of Kenya, 7.25%, 2/28/2028 (n) | | $ | 200,000 | | | | 206,435 | |
| Republic of Kenya, 8.25%, 2/28/2048 (n) | | | 1,466,000 | | | | 1,511,373 | |
| Republic of Paraguay, 6.1%, 8/11/2044 | | | 303,000 | | | | 329,513 | |
| Republic of Paraguay, 5.6%, 3/13/2048 (n) | | | 234,000 | | | | 234,000 | |
| Republic of South Africa, 4.875%, 4/14/2026 | | | 1,493,000 | | | | 1,466,371 | |
| Republic of South Africa, 10.5%, 12/21/2026 | | ZAR | 7,714,000 | | | | 705,925 | |
| Republic of South Africa, 7%, 2/28/2031 | | | 6,675,000 | | | | 466,956 | |
| Republic of Sri Lanka, 5.75%, 4/18/2023 (n) | | $ | 1,430,000 | | | | 1,420,957 | |
| | | | | | | | |
| | | | | | | $ | 14,477,933 | |
| Energy - Independent - 0.5% | | | | | | | | |
| Canadian Oil Sands Co., 7.75%, 5/15/2019 (z) | | $ | 874,000 | | | $ | 910,233 | |
| Canadian Oil Sands Co., 4.5%, 4/01/2022 (z) | | | 822,000 | | | | 827,855 | |
| | | | | | | | |
| | | | | | | $ | 1,738,088 | |
| Energy - Integrated - 0.5% | | | | | | | | |
| Shell International Finance B.V., 2.875%, 5/10/2026 | | $ | 1,513,000 | | | $ | 1,439,139 | |
| | |
| Food & Beverages - 3.0% | | | | | | | | |
| Anheuser Busch InBev Worldwide, Inc., 3.75%, 1/15/2022 | | $ | 904,000 | | | $ | 919,114 | |
| Anheuser Busch InBev Worldwide, Inc., 4.439%, 10/06/2048 | | | 874,509 | | | | 842,309 | |
| Anheuser-Busch InBev Worldwide, Inc., 3.3%, 2/01/2023 | | | 1,780,000 | | | | 1,765,657 | |
| General Mills, Inc., 4.55%, 4/17/2038 | | | 2,189,000 | | | | 2,122,439 | |
| Kraft Foods Group, Inc., 5%, 6/04/2042 | | | 1,731,000 | | | | 1,693,549 | |
| Marb Bondco PLC, 6.875%, 1/19/2025 (n) | | | 569,000 | | | | 534,860 | |
| MHP Lux S.A., 6.95%, 4/03/2026 (n) | | | 600,000 | | | | 585,000 | |
| Wm. Wrigley Jr. Co., 3.375%, 10/21/2020 (n) | | | 1,051,000 | | | | 1,056,835 | |
| | | | | | | | |
| | | | | | | $ | 9,519,763 | |
| Insurance - 1.2% | | | | | | | | |
| American International Group, Inc., 3.75%, 7/10/2025 | | $ | 1,461,000 | | | $ | 1,430,816 | |
| American International Group, Inc., 3.9%, 4/01/2026 | | | 1,706,000 | | | | 1,668,035 | |
| American International Group, Inc., 4.7%, 7/10/2035 | | | 355,000 | | | | 356,309 | |
| American International Group, Inc., 4.5%, 7/16/2044 | | | 315,000 | | | | 302,658 | |
| | | | | | | | |
| | | | | | | $ | 3,757,818 | |
10
Portfolio of Investments (unaudited) – continued
| | | | | | | | |
| Issuer | | Shares/Par | | | Value ($) | |
| Bonds - continued | |
| Insurance - Health - 0.4% | | | | | | | | |
| UnitedHealth Group, Inc., 3.75%, 10/15/2047 | | $ | 1,530,000 | | | $ | 1,415,026 | |
| | |
| Insurance - Property & Casualty - 0.5% | | | | | | | | |
| Allied World Assurance Co. Holdings Ltd., 4.35%, 10/29/2025 | | $ | 1,580,000 | | | $ | 1,545,459 | |
| | |
| International Market Quasi-Sovereign - 0.5% | | | | | | | | |
| Dexia Credit Local S.A., 2.25%, 2/18/2020 (n) | | $ | 1,530,000 | | | $ | 1,513,896 | |
| | |
| Machinery & Tools - 0.6% | | | | | | | | |
| CNH Industrial Capital LLC, 3.85%, 11/15/2027 | | $ | 1,897,000 | | | $ | 1,814,662 | |
| | |
| Major Banks - 6.7% | | | | | | | | |
| Bank of America Corp., 2.151%, 11/09/2020 | | $ | 790,000 | | | $ | 771,265 | |
| Bank of America Corp., 4.125%, 1/22/2024 | | | 568,000 | | | | 581,421 | |
| Bank of America Corp., 3.248%, 10/21/2027 | | | 4,264,000 | | | | 3,971,036 | |
| Bank of New York Mellon Corp., 3.5%, 4/28/2023 | | | 2,225,000 | | | | 2,227,761 | |
| Barclays PLC, 3.25%, 1/12/2021 | | | 2,086,000 | | | | 2,067,149 | |
| Credit Suisse Group AG, 3.574%, 1/09/2023 (n) | | | 950,000 | | | | 936,977 | |
| Credit Suisse Group AG, 6.5%, 8/08/2023 (n) | | | 299,000 | | | | 323,668 | |
| Credit Suisse Group AG, 3.869%, 1/12/2029 (n) | | | 1,361,000 | | | | 1,292,812 | |
| ING Bank N.V., 5.8%, 9/25/2023 (n) | | | 1,344,000 | | | | 1,444,785 | |
| JPMorgan Chase & Co., 3.882% to 7/24/2037, FLR to 7/24/2038 | | | 1,731,000 | | | | 1,611,636 | |
| Morgan Stanley, 3.7%, 10/23/2024 | | | 1,993,000 | | | | 1,967,404 | |
| Morgan Stanley, 3.625%, 1/20/2027 | | | 2,043,000 | | | | 1,970,405 | |
| UBS Group Funding (Switzerland) AG, 4.253%, 3/23/2028 (n) | | | 2,105,000 | | | | 2,092,335 | |
| | | | | | | | |
| | | | | | | $ | 21,258,654 | |
| Medical & Health Technology & Services - 1.1% | | | | | | | | |
| Becton, Dickinson and Co., 3.734%, 12/15/2024 | | $ | 2,216,000 | | | $ | 2,161,008 | |
| CVS Health Corp., 5.05%, 3/25/2048 | | | 1,266,000 | | | | 1,286,125 | |
| | | | | | | | |
| | | | | | | $ | 3,447,133 | |
| Medical Equipment - 0.4% | | | | | | | | |
| Abbott Laboratories, 4.75%, 11/30/2036 | | $ | 1,279,000 | | | $ | 1,354,228 | |
| | |
| Metals & Mining - 1.1% | | | | | | | | |
| First Quantum Minerals Ltd., 6.5%, 3/01/2024 (n) | | $ | 726,000 | | | $ | 690,571 | |
| First Quantum Minerals Ltd., 7.5%, 4/01/2025 (n) | | | 336,000 | | | | 332,237 | |
| Glencore Funding LLC, 4.125%, 5/30/2023 (n) | | | 953,000 | | | | 949,474 | |
| Glencore Funding LLC, 4%, 4/16/2025 (n) | | | 479,000 | | | | 466,210 | |
| Glencore Funding LLC, 3.875%, 10/27/2027 (n) | | | 1,170,000 | | | | 1,099,660 | |
| | | | | | | | |
| | | | | | | $ | 3,538,152 | |
11
Portfolio of Investments (unaudited) – continued
| | | | | | | | |
| Issuer | | Shares/Par | | | Value ($) | |
| Bonds - continued | |
| Midstream - 1.4% | | | | | | | | |
| Kinder Morgan Energy Partners LP, 6.375%, 3/01/2041 | | $ | 2,220,000 | | | $ | 2,473,129 | |
| MPLX LP, 4%, 3/15/2028 | | | 2,200,000 | | | | 2,116,696 | |
| | | | | | | | |
| | | | | | | $ | 4,589,825 | |
| Mortgage-Backed - 0.4% | | | | | | | | |
| Fannie Mae, 5.5%, 7/01/2019 - 11/01/2036 | | $ | 110,129 | | | $ | 117,109 | |
| Fannie Mae, 6.5%, 5/01/2031 | | | 23,957 | | | | 26,827 | |
| Fannie Mae, 6%, 11/01/2034 | | | 215,130 | | | | 240,045 | |
| Freddie Mac, 4.224%, 3/25/2020 | | | 814,986 | | | | 833,414 | |
| Freddie Mac, 1.018%, 4/25/2024 | | | 99,870 | | | | 4,323 | |
| | | | | | | | |
| | | | | | | $ | 1,221,718 | |
| Municipals - 0.7% | | | | | | | | |
| New Jersey Economic Development Authority State Pension | | | | | | | | |
| Funding Rev., Capital Appreciation, “B”, 0%, 2/15/2023 | | $ | 2,500,000 | | | $ | 2,073,975 | |
| | |
| Natural Gas - Pipeline - 0.4% | | | | | | | | |
| Peru LNG, 5.375%, 3/22/2030 (n) | | $ | 1,332,000 | | | $ | 1,323,675 | |
| | |
| Network & Telecom - 0.9% | | | | | | | | |
| AT&T, Inc., 5.45%, 3/01/2047 | | $ | 1,961,000 | | | $ | 1,990,209 | |
| AT&T, Inc., 5.15%, 2/14/2050 | | | 817,000 | | | | 827,765 | |
| | | | | | | | |
| | | | | | | $ | 2,817,974 | |
| Oil Services - 0.2% | | | | | | | | |
| Shelf Drill Holdings Ltd., 8.25%, 2/15/2025 (n) | | $ | 660,000 | | | $ | 669,900 | |
| | |
| Oils - 1.3% | | | | | | | | |
| Andeavor, 3.8%, 4/01/2028 | | $ | 469,000 | | | $ | 451,464 | |
| Marathon Petroleum Corp., 4.75%, 9/15/2044 | | | 1,706,000 | | | | 1,683,785 | |
| Phillips 66, 4.875%, 11/15/2044 | | | 1,923,000 | | | | 2,008,414 | |
| | | | | | | | |
| | | | | | | $ | 4,143,663 | |
| Other Banks & Diversified Financials - 0.8% | | | | | | | | |
| Compass Bank, 2.875%, 6/29/2022 | | $ | 1,931,000 | | | $ | 1,858,911 | |
| Kazkommertsbank JSC, 5.5%, 12/21/2022 | | | 691,000 | | | | 688,706 | |
| | | | | | | | |
| | | | | | | $ | 2,547,617 | |
| Pharmaceuticals - 1.9% | | | | | | | | |
| Actavis Funding SCS, 3.8%, 3/15/2025 | | $ | 1,406,000 | | | $ | 1,351,219 | |
| Celgene Corp., 3.25%, 2/20/2023 | | | 1,748,000 | | | | 1,705,165 | |
| Gilead Sciences, Inc., 3.65%, 3/01/2026 | | | 1,051,000 | | | | 1,039,453 | |
| Johnson & Johnson, 2.9%, 1/15/2028 | | | 2,186,000 | | | | 2,070,787 | |
| | | | | | | | |
| | | | | | | $ | 6,166,624 | |
12
Portfolio of Investments (unaudited) – continued
| | | | | | | | |
| Issuer | | Shares/Par | | | Value ($) | |
| Bonds - continued | |
| Supermarkets - 0.3% | | | | | | | | |
| Eurotorg LLC via Bonitron D.A.C., 8.75%, 10/30/2022 | | $ | 795,000 | | | $ | 803,809 | |
| | |
| Supranational - 0.4% | | | | | | | | |
| Corporacion Andina de Fomento, 4.375%, 6/15/2022 | | $ | 1,290,000 | | | $ | 1,339,975 | |
| | |
| Telecommunications - Wireless - 1.4% | | | | | | | | |
| American Tower Corp., REIT, 3.55%, 7/15/2027 | | $ | 2,165,000 | | | $ | 2,019,342 | |
| American Tower Corp., REIT, 3.6%, 1/15/2028 | | | 875,000 | | | | 817,239 | |
| Digicel Group Ltd., 6%, 4/15/2021 (n) | | | 316,000 | | | | 300,595 | |
| Digicel Ltd., 6%, 4/15/2021 | | | 391,000 | | | | 371,939 | |
| SBA Tower Trust, 2.898%, 10/08/2019 (n) | | | 1,061,000 | | | | 1,061,176 | |
| | | | | | | | |
| | | | | | | $ | 4,570,291 | |
| Tobacco - 0.6% | | | | | | | | |
| B.A.T. Capital Corp., 3.557%, 8/15/2027 (n) | | $ | 2,091,000 | | | $ | 1,956,330 | |
| | |
| Transportation - Services - 0.1% | | | | | | | | |
| Delhi International Airport, 6.125%, 10/31/2026 (n) | | $ | 288,000 | | | $ | 288,288 | |
| | |
| U.S. Treasury Obligations - 14.5% | | | | | | | | |
| U.S. Treasury Bonds, 3.5%, 2/15/2039 (f) | | $ | 8,152,000 | | | $ | 8,763,718 | |
| U.S. Treasury Bonds, 2.5%, 2/15/2045 | | | 3,043,000 | | | | 2,714,689 | |
| U.S. Treasury Notes, 1.375%, 12/15/2019 | | | 6,482,000 | | | | 6,372,110 | |
| U.S. Treasury Notes, 1.5%, 4/15/2020 | | | 17,500,000 | | | | 17,167,090 | |
| U.S. Treasury Notes, 1.75%, 2/28/2022 | | | 11,420,000 | | | | 11,021,192 | |
| | | | | | | | |
| | | | | | | $ | 46,038,799 | |
| Utilities - Electric Power - 0.8% | | | | | | | | |
| Enel Finance International N.V., 3.625%, 5/25/2027 (n) | | $ | 1,858,000 | | | $ | 1,754,690 | |
| Star Energy Geothermal (Wayang Windu) Ltd., 6.75%, 4/24/2033 (z) | | | 800,000 | | | | 799,981 | |
| | | | | | | | |
| | | | | | | $ | 2,554,671 | |
| Total Bonds (Identified Cost, $258,590,370) | | | | | | $ | 253,100,699 | |
| | |
| Common Stocks - 0.0% | | | | | | | | |
| Energy - Independent - 0.0% | | | | | | | | |
| Frontera Energy Corp. (a) (Identified Cost, $96,603) | | | 2,760 | | | $ | 85,049 | |
| | |
| Investment Companies (h) - 20.0% | | | | | | | | |
| Bond Funds - 19.9% | | | | | | | | |
| MFS High Yield Pooled Portfolio (v) | | | 6,932,003 | | | $ | 62,942,593 | |
13
Portfolio of Investments (unaudited) – continued
| | | | | | | | |
| Issuer | | Shares/Par | | | Value ($) | |
| Investment Companies (h) - continued | | | | | | | | |
| Money Market Funds - 0.1% | | | | | | | | |
| MFS Institutional Money Market Portfolio, 1.78% (v) | | | 450,716 | | | $ | 450,671 | |
Total Investment Companies
(Identified Cost, $ 67,033,150) | | | $ | 63,393,264 | |
| | |
| Other Assets, Less Liabilities - 0.2% | | | | | | | 637,490 | |
| Net Assets - 100.0% | | | | | | $ | 317,216,502 | |
| (a) | Non-income producing security. |
| (f) | All or a portion of the security has been segregated as collateral for open futures contracts. |
| (h) | An affiliated issuer may be considered one in which the fund owns 5% or more of the outstanding voting securities, or a company which is under common control. At period end, the aggregate values of the fund’s investments in affiliated issuers and in unaffiliated issuers were $63,393,264 and $253,185,748, respectively. |
| (i) | Interest only security for which the fund receives interest on notional principal (Par amount). Par amount shown is the notional principal and does not reflect the cost of the security. |
| (n) | Securities exempt from registration under Rule 144A of the Securities Act of 1933. These securities may be sold in the ordinary course of business in transactions exempt from registration, normally to qualified institutional buyers. At period end, the aggregate value of these securities was $68,348,936, representing 21.5% of net assets. |
| (p) | Payment-in-kind security for which interest income may be received in additional securities and/or cash. |
| (v) | Affiliated issuer that is available only to investment companies managed by MFS. The rate quoted for the MFS Institutional Money Market Portfolio is the annualized seven-day yield of the fund at period end. |
| (z) | Restricted securities are not registered under the Securities Act of 1933 and are subject to legal restrictions on resale. These securities generally may be resold in transactions exempt from registration or to the public if the securities are subsequently registered. Disposal of these securities may involve time-consuming negotiations and prompt sale at an acceptable price may be difficult. The fund holds the following restricted securities: |
| | | | | | | | | | |
| Restricted Securities | | Acquisition
Date | | Cost | | | Value | |
| Bancorp Commercial Mortgage Trust, 2018-CR3, “D”, FLR, 4.597% (LIBOR-1mo. + 2.7%), 1/15/2033 | | 3/13/18 | | | $1,751,843 | | | | $1,756,455 | |
| Bayview Financial Revolving Mortgage Loan Trust, FLR, 3.501% (LIBOR-1mo. + 1.6%), 12/28/2040 | | 3/01/06 | | | 245,625 | | | | 222,849 | |
| Business Jet Securities LLC, 2018-1, “C”, 7.748%, 2/15/2033 | | 2/21/18 | | | 787,642 | | | | 800,522 | |
| Canadian Oil Sands Co., 7.75%, 5/15/2019 | | 9/29/17 | | | 919,583 | | | | 910,233 | |
| Canadian Oil Sands Co., 4.5%, 4/01/2022 | | 10/26/17 | | | 855,066 | | | | 827,855 | |
| Cavalry CLO IV Ltd./Cavalry CLO IV LLC, FLR, 4.248% (LIBOR-3mo. + 1.9%), 10/15/2026 | | 10/04/17 | | | 2,000,000 | | | | 1,998,890 | |
| Cent CLO LP, 2012-16AR, “A1AR”, FLR, 4.973% | | | | | | | | | | |
| (LIBOR-3mo. + 3.2%), 8/01/2024 | | 5/04/16 | | | 1,685,000 | | | | 1,681,682 | |
14
Portfolio of Investments (unaudited) – continued
| | | | | | | | | | |
| Restricted Securities - continued | | Acquisition
Date | | Cost | | | Value | |
| Falcon Franchise Loan LLC, 7.966%, 1/05/2023 | | 1/18/02 | | | $2 | | | | $2,676 | |
| GMF Floorplan Owner Revolving Trust, 2017-2, “C”, 2.63%, 7/15/2022 | | 8/15/17 | | | 1,739,646 | | | | 1,703,327 | |
| Invitation Homes Trust, 2018-SFR1, “C”, FLR, 3.146%, 3/17/2037 | | 1/26/18 | | | 870,000 | | | | 869,999 | |
| KazMunayGas National Co., 5.375%, 4/24/2030 | | 4/17/18 | | | 248,000 | | | | 247,926 | |
| Magnetite CLO Ltd., 2015-16A, “DR”, FLR, 4.505% (LIBOR-3mo. + 2.15%), 1/18/2028 | | 1/18/18 | | | 500,000 | | | | 492,028 | |
| Morgan Stanley Capital I, Inc., 1.493%, 4/28/2039 | | 7/20/04 | | | 4 | | | | 993 | |
| NextGear Floorplan Master Owner Trust, 2018-1A, | | | | | | | | | | |
| “B”, 3.57%, 2/15/2023 | | 3/06/18 | | | 799,929 | | | | 796,336 | |
| OCP CLO Ltd., 2015-9A, “A2R”, FLR, 3.698% (LIBOR-3mo. + 1.35%), 7/15/2027 | | 10/27/17 | | | 1,500,000 | | | | 1,498,636 | |
| Star Energy Geothermal (Wayang Windu) Ltd., 6.75%, 4/24/2033 | | 4/17/18 | | | 800,000 | | | | 799,981 | |
| Total Restricted Securities | | | | | | | | | $14,610,388 | |
| % of Net assets | | | | | | | | | 4.6% | |
The following abbreviations are used in this report and are defined:
| CDO | | Collateralized Debt Obligation |
| CJSC | | Closed Joint Stock Company |
| CLO | | Collateralized Loan Obligation |
| FLR | | Floating Rate. Interest rate resets periodically based on the parenthetically disclosed reference rate plus a spread (if any). The period-end rate reported may not be the current rate. |
| PLC | | Public Limited Company |
| REIT | | Real Estate Investment Trust |
Abbreviations indicate amounts shown in currencies other than the U.S. dollar. All amounts are stated in U.S. dollars unless otherwise indicated. A list of abbreviations is shown below:
Derivative Contracts at 4/30/18
Forward Foreign Currency Exchange Contracts
| | | | | | | | | | | | | | | | | | |
Currency
Purchased | | | Currency
Sold | | Counterparty | | Settlement
Date | | | Unrealized
Appreciation
(Depreciation) | |
| Asset Derivatives | | | | | | | | | | | | |
| USD | | | 719,090 | | | EUR | | 583,549 | | Brown Brothers Harriman | | | 5/25/2018 | | | | $13,173 | |
| USD | | | 380,031 | | | EUR | | 306,000 | | JPMorgan Chase Bank N.A. | | | 5/25/2018 | | | | 9,864 | |
| USD | | | 1,251,614 | | | ZAR | | 14,874,428 | | JPMorgan Chase Bank N.A. | | | 6/08/2018 | | | | 64,480 | |
| | | | | | | | | | | | | | | | | | |
| | | | | | | | | | | | | | | | | $87,517 | |
| | | | | | | | | | | | | | | | | | |
15
Portfolio of Investments (unaudited) – continued
Forward Foreign Currency Exchange Contracts - continued
| | | | | | | | | | | | | | | | | | |
Currency
Purchased | | | Currency
Sold | | Counterparty | | Settlement
Date | | | Unrealized
Appreciation
(Depreciation) | |
| Liability Derivatives | | | | | | | | | | |
| EUR | | | 209,262 | | | USD | | 259,650 | | Deutsche Bank AG | | | 5/25/2018 | | | | $(6,506 | ) |
| MXN | | | 716 | | | USD | | 38 | | JPMorgan Chase Bank N.A. | | | 5/25/2018 | | | | (1 | ) |
| ZAR | | | 15,647,000 | | | USD | | 1,316,622 | | JPMorgan Chase Bank N.A. | | | 6/08/2018 | | | | (67,829 | ) |
| | | | | | | | | | | | | | | | | | |
| | | | | | | | | | | | | | | | | $(74,336 | ) |
| | | | | | | | | | | | | | | | | | |
Futures Contracts
| | | | | | | | | | | | | | | | | | | | | | |
| Description | | Long/
Short | | | Currency | | | Contracts | | Notional
Amount | | | Expiration
Date | | | Value/
Unrealized
Appreciation
(Depreciation) | |
| Asset Derivatives | | | | | | | | | | | | | | | | | | | | | | |
| Interest Rate Futures | | | | | | | | | | | | | | | | | | | | | | |
| U.S. Treasury Bond 30 yr | | | Long | | | | USD | | | 29 | | | $4,171,469 | | | | June - 2018 | | | | $15,530 | |
| U.S. Treasury Ultra Bond 30 yr | | | Long | | | | USD | | | 52 | | | 8,170,500 | | | | June - 2018 | | | | 18,462 | |
| U.S. Treasury Ultra Note 10 yr | | | Short | | | | USD | | | 145 | | | 18,544,140 | | | | June - 2018 | | | | 40,255 | |
| | | | | | | | | | | | | | | | | | | | | | |
| | | | | | | | | | | | | | | | | | | | | $74,247 | |
| | | | | | | | | | | | | | | | | | | | | | |
| Liability Derivatives | | | | | | | | | | | | | | | | | | | | | | |
| Interest Rate Futures | | | | | | | | | | | | | | | | | | | | | | |
| U.S. Treasury Note 2 yr | | | Long | | | | USD | | | 70 | | | $14,843,281 | | | | June - 2018 | | | | $(41,810 | ) |
| U.S. Treasury Note 5 yr | | | Long | | | | USD | | | 105 | | | 11,918,320 | | | | June - 2018 | | | | (66,049 | ) |
| | | | | | | | | | | | | | | | | | | | | | |
| | | | | | | | | | | | | | | | | | | | | $(107,859 | ) |
| | | | | | | | | | | | | | | | | | | | | | |
At April 30, 2018, the fund had liquid securities with an aggregate value of $204,258 to cover any collateral or margin obligations for certain derivative contracts.
See Notes to Financial Statements
16
Financial Statements
STATEMENT OF ASSETS AND LIABILITIES
At 4/30/18 (unaudited)
This statement represents your fund’s balance sheet, which details the assets and liabilities comprising the total value of the fund.
| | | | |
| Assets | | | | |
Investments in unaffiliated issuers, at value (identified cost, $258,686,973) | | | $253,185,748 | |
Investments in affiliated issuers, at value (identified cost, $67,033,150) | | | 63,393,264 | |
Cash | | | 36,957 | |
Foreign currency, at value (identified cost, $16,885) | | | 16,629 | |
Receivables for | | | | |
Forward foreign currency exchange contracts | | | 87,517 | |
Daily variation margin on open futures contracts | | | 27,067 | |
Investments sold | | | 121,363 | |
Fund shares sold | | | 390,005 | |
Interest | | | 1,571,327 | |
Other assets | | | 1,234 | |
Total assets | | | $318,831,111 | |
| Liabilities | | | | |
Payables for | | | | |
Distributions | | | $45,847 | |
Forward foreign currency exchange contracts | | | 74,336 | |
Investments purchased | | | 607,364 | |
Fund shares reacquired | | | 661,747 | |
Payable to affiliates | | | | |
Investment adviser | | | 7,544 | |
Shareholder servicing costs | | | 139,734 | |
Distribution and service fees | | | 9,802 | |
Payable for independent Trustees’ compensation | | | 5,022 | |
Accrued expenses and other liabilities | | | 63,213 | |
Total liabilities | | | $1,614,609 | |
Net assets | | | $317,216,502 | |
| Net assets consist of | | | | |
Paid-in capital | | | $330,922,457 | |
Unrealized appreciation (depreciation) | | | (9,163,347 | ) |
Accumulated net realized gain (loss) | | | (3,986,000 | ) |
Accumulated net investment loss | | | (556,608 | ) |
Net assets | | | $317,216,502 | |
Shares of beneficial interest outstanding | | | 49,499,355 | |
| | | | | | | | | | | | |
| | | Net assets | | | Shares
outstanding | | | Net asset value
per share (a) | |
Class A | | | $203,818,766 | | | | 31,765,550 | | | | $6.42 | |
Class B | | | 15,806,316 | | | | 2,479,566 | | | | 6.37 | |
Class C | | | 22,758,744 | | | | 3,579,204 | | | | 6.36 | |
Class I | | | 74,782,941 | | | | 11,667,279 | | | | 6.41 | |
Class R6 | | | 49,735 | | | | 7,756 | | | | 6.41 | |
| (a) | Maximum offering price per share was equal to the net asset value per share for all share classes, except for Class A, for which the maximum offering price per share was $6.70 [100 / 95.75 x $6.42]. On sales of $100,000 or more, the maximum offering price of Class A shares is reduced. A contingent deferred sales charge may be imposed on redemptions of Class A, Class B, and Class C shares. Redemption price per share was equal to the net asset value per share for Classes I and R6. Net asset value per share is calculated using actual net assets and shares outstanding rather than amounts that have been rounded for presentation purposes. |
See Notes to Financial Statements
17
Financial Statements
STATEMENT OF OPERATIONS
Six months ended 4/30/18 (unaudited)
This statement describes how much your fund earned in investment income and accrued in expenses. It also describes any gains and/or losses generated by fund operations.
| | | | |
| Net investment income (loss) | | | | |
Income | | | | |
Interest | | | $4,522,973 | |
Dividends from affiliated issuers | | | 2,101,618 | |
Total investment income | | | $6,624,591 | |
Expenses | | | | |
Management fee | | | $1,008,960 | |
Distribution and service fees | | | 490,623 | |
Shareholder servicing costs | | | 221,316 | |
Administrative services fee | | | 29,994 | |
Independent Trustees’ compensation | | | 4,752 | |
Custodian fee | | | 23,430 | |
Shareholder communications | | | 41,078 | |
Audit and tax fees | | | 33,660 | |
Legal fees | | | 2,842 | |
Miscellaneous | | | 63,089 | |
Total expenses | | | $1,919,744 | |
Fees paid indirectly | | | (137 | ) |
Reduction of expenses by investment adviser and distributor | | | (89,102 | ) |
Net expenses | | | $1,830,505 | |
Net investment income (loss) | | | $4,794,086 | |
| Realized and unrealized gain (loss) | | | | |
Realized gain (loss) (identified cost basis) | | | | |
Unaffiliated issuers | | | $477,568 | |
Affiliated issuers | | | (2,793,207 | ) |
Futures contracts | | | 33,856 | |
Forward foreign currency exchange contracts | | | (37,971 | ) |
Foreign currency | | | 3,026 | |
Net realized gain (loss) | | | $(2,316,728 | ) |
Change in unrealized appreciation (depreciation) | | | | |
Unaffiliated issuers | | | $(9,073,970 | ) |
Affiliated issuers | | | (382,159 | ) |
Futures contracts | | | (16,039 | ) |
Forward foreign currency exchange contracts | | | 25,104 | |
Translation of assets and liabilities in foreign currencies | | | (1,794 | ) |
Net unrealized gain (loss) | | | $(9,448,858 | ) |
Net realized and unrealized gain (loss) | | | $(11,765,586 | ) |
Change in net assets from operations | | | $(6,971,500 | ) |
See Notes to Financial Statements
18
Financial Statements
STATEMENTS OF CHANGES IN NET ASSETS
These statements describe the increases and/or decreases in net assets resulting from operations, any distributions, and any shareholder transactions.
| | | | | | | | |
| Change in net assets | | Six months ended
4/30/18
(unaudited) | | | Year ended
10/31/17 | |
| From operations | | | | | | | | |
Net investment income (loss) | | | $4,794,086 | | | | $9,840,728 | |
Net realized gain (loss) | | | (2,316,728 | ) | | | 1,779,689 | |
Net unrealized gain (loss) | | | (9,448,858 | ) | | | 1,870,053 | |
Change in net assets from operations | | | $(6,971,500 | ) | | | $13,490,470 | |
| Distributions declared to shareholders | | | | | | | | |
From net investment income | | | $(4,515,868 | ) | | | $(10,675,426 | ) |
Change in net assets from fund share transactions | | | $(19,233,550 | ) | | | $35,983,345 | |
Total change in net assets | | | $(30,720,918 | ) | | | $38,798,389 | |
| Net assets | | | | | | | | |
At beginning of period | | | 347,937,420 | | | | 309,139,031 | |
At end of period (including accumulated net investment loss of $556,608 and accumulated distributions in excess of net investment income of $834,826, respectively) | | | $317,216,502 | | | | $347,937,420 | |
See Notes to Financial Statements
19
Financial Statements
FINANCIAL HIGHLIGHTS
The financial highlights table is intended to help you understand the fund’s financial performance for the semiannual period and the past 5 fiscal years (or life of a particular share class, if shorter). Certain information reflects financial results for a single fund share. The total returns in the table represent the rate that an investor would have earned (or lost) on an investment in the fund share class (assuming reinvestment of all distributions) held for the entire period.
| | | | | | | | | | | | | | | | | | | | | | | | |
| | | Six months
ended
4/30/18 | | | Year ended | |
| Class A | | | 10/31/17 | | | 10/31/16 | | | 10/31/15 | | | 10/31/14 | | | 10/31/13 | |
| | | (unaudited) | | | | | | | | | | | | | | | | |
Net asset value, beginning of
period | | | $6.64 | | | | $6.58 | | | | $6.41 | | | | $6.71 | | | | $6.74 | | | | $6.92 | |
| Income (loss) from investment operations | | | | | | | | | | | | | |
Net investment income
(loss) (d) | | | $0.09 | | | | $0.21 | (c) | | | $0.24 | | | | $0.23 | | | | $0.26 | | | | $0.27 | |
Net realized and unrealized
gain (loss) | | | (0.22 | ) | | | 0.08 | | | | 0.16 | | | | (0.28 | ) | | | (0.00 | )(w) | | | (0.15 | ) |
Total from investment
operations | | | $(0.13 | ) | | | $0.29 | | | | $0.40 | | | | $(0.05 | ) | | | $0.26 | | | | $0.12 | |
| Less distributions declared to shareholders | | | | | | | | | | | | | |
From net investment income | | | $(0.09 | ) | | | $(0.23 | ) | | | $(0.23 | ) | | | $(0.24 | ) | | | $(0.29 | ) | | | $(0.30 | ) |
From tax return of capital | | | — | | | | — | | | | — | | | | (0.01 | ) | | | — | | | | — | |
Total distributions declared to
shareholders | | | $(0.09 | ) | | | $(0.23 | ) | | | $(0.23 | ) | | | $(0.25 | ) | | | $(0.29 | ) | | | $(0.30 | ) |
Net asset value, end of
period (x) | | | $6.42 | | | | $6.64 | | | | $6.58 | | | | $6.41 | | | | $6.71 | | | | $6.74 | |
Total return (%) (r)(s)(t)(x) | | | (2.00 | )(n) | | | 4.44 | (c) | | | 6.45 | | | | (0.72 | ) | | | 3.88 | | | | 1.85 | |
Ratios (%) (to average net assets)
and Supplemental data: | | | | | | | | | | | | | |
Expenses before expense
reductions (f)(h) | | | 1.10 | (a) | | | 1.12 | (c) | | | 1.12 | | | | 1.15 | | | | 1.14 | | | | 1.15 | |
Expenses after expense
reductions (f)(h) | | | 1.04 | (a) | | | 1.04 | (c) | | | 1.05 | | | | 1.05 | | | | 1.05 | | | | 1.05 | |
Net investment income (loss) | | | 2.90 | (a) | | | 3.18 | (c) | | | 3.68 | | | | 3.44 | | | | 3.84 | | | | 3.95 | |
Portfolio turnover | | | 27 | (n) | | | 69 | | | | 21 | | | | 29 | | | | 22 | | | | 34 | |
Net assets at end of period
(000 omitted) | | | $203,819 | | | | $207,268 | | | | $212,431 | | | | $215,070 | | | | $229,895 | | | | $218,674 | |
See Notes to Financial Statements
20
Financial Highlights – continued
| | | | | | | | | | | | | | | | | | | | | | | | |
| | | Six months
ended
4/30/18 | | | Year ended | |
| Class B | | | 10/31/17 | | | 10/31/16 | | | 10/31/15 | | | 10/31/14 | | | 10/31/13 | |
| | | (unaudited) | | | | | | | | | | | | | | | | |
Net asset value, beginning of period | | | $6.60 | | | | $6.54 | | | | $6.36 | | | | $6.66 | | | | $6.69 | | | | $6.86 | |
| Income (loss) from investment operations | | | | | | | | | | | | | |
Net investment income
(loss) (d) | | | $0.07 | | | | $0.16 | (c) | | | $0.19 | | | | $0.18 | | | | $0.21 | | | | $0.22 | |
Net realized and unrealized
gain (loss) | | | (0.23 | ) | | | 0.08 | | | | 0.17 | | | | (0.28 | ) | | | (0.00 | )(w) | | | (0.14 | ) |
Total from investment
operations | | | $(0.16 | ) | | | $0.24 | | | | $0.36 | | | | $(0.10 | ) | | | $0.21 | | | | $0.08 | |
| Less distributions declared to shareholders | | | | | | | | | | | | | |
From net investment income | | | $(0.07 | ) | | | $(0.18 | ) | | | $(0.18 | ) | | | $(0.19 | ) | | | $(0.24 | ) | | | $(0.25 | ) |
From tax return of capital | | | — | | | | — | | | | — | | | | (0.01 | ) | | | — | | | | — | |
Total distributions declared to
shareholders | | | $(0.07 | ) | | | $(0.18 | ) | | | $(0.18 | ) | | | $(0.20 | ) | | | $(0.24 | ) | | | $(0.25 | ) |
Net asset value, end of
period (x) | | | $6.37 | | | | $6.60 | | | | $6.54 | | | | $6.36 | | | | $6.66 | | | | $6.69 | |
Total return (%) (r)(s)(t)(x) | | | (2.51 | )(n) | | | 3.67 | (c) | | | 5.84 | | | | (1.50 | ) | | | 3.10 | | | | 1.22 | |
Ratios (%) (to average net assets)
and Supplemental data: | | | | | | | | | | | | | |
Expenses before expense
reductions (f)(h) | | | 1.85 | (a) | | | 1.87 | (c) | | | 1.87 | | | | 1.91 | | | | 1.89 | | | | 1.91 | |
Expenses after expense
reductions (f)(h) | | | 1.80 | (a) | | | 1.80 | (c) | | | 1.80 | | | | 1.80 | | | | 1.80 | | | | 1.80 | |
Net investment income (loss) | | | 2.14 | (a) | | | 2.48 | (c) | | | 2.96 | | | | 2.73 | | | | 3.13 | | | | 3.24 | |
Portfolio turnover | | | 27 | (n) | | | 69 | | | | 21 | | | | 29 | | | | 22 | | | | 34 | |
Net assets at end of period
(000 omitted) | | | $15,806 | | | | $18,387 | | | | $24,052 | | | | $28,420 | | | | $35,650 | | | | $37,673 | |
See Notes to Financial Statements
21
Financial Highlights – continued
| | | | | | | | | | | | | | | | | | | | | | | | |
| | | Six months
ended
4/30/18 | | | Year ended | |
| Class C | | | 10/31/17 | | | 10/31/16 | | | 10/31/15 | | | 10/31/14 | | | 10/31/13 | |
| | | (unaudited) | | | | | | | | | | | | | | | | |
Net asset value, beginning of
period | | | $6.58 | | | | $6.52 | | | | $6.35 | | | | $6.64 | | | | $6.67 | | | | $6.84 | |
| Income (loss) from investment operations | | | | | | | | | | | | | |
Net investment income
(loss) (d) | | | $0.07 | | | | $0.16 | (c) | | | $0.19 | | | | $0.18 | | | | $0.21 | | | | $0.22 | |
Net realized and unrealized
gain (loss) | | | (0.23 | ) | | | 0.08 | | | | 0.16 | | | | (0.27 | ) | | | (0.01 | ) | | | (0.14 | ) |
Total from investment
operations | | | $(0.16 | ) | | | $0.24 | | | | $0.35 | | | | $(0.09 | ) | | | $0.20 | | | | $0.08 | |
| Less distributions declared to shareholders | | | | | | | | | | | | | |
From net investment income | | | $(0.06 | ) | | | $(0.18 | ) | | | $(0.18 | ) | | | $(0.19 | ) | | | $(0.23 | ) | | | $(0.25 | ) |
From tax return of capital | | | — | | | | — | | | | — | | | | (0.01 | ) | | | — | | | | — | |
Total distributions declared to
shareholders | | | $(0.06 | ) | | | $(0.18 | ) | | | $(0.18 | ) | | | $(0.20 | ) | | | $(0.23 | ) | | | $(0.25 | ) |
Net asset value, end of
period (x) | | | $6.36 | | | | $6.58 | | | | $6.52 | | | | $6.35 | | | | $6.64 | | | | $6.67 | |
Total return (%) (r)(s)(t)(x) | | | (2.39 | )(n) | | | 3.67 | (c) | | | 5.68 | | | | (1.36 | ) | | | 3.10 | | | | 1.21 | |
Ratios (%) (to average net assets)
and Supplemental data: | | | | | | | | | | | | | |
Expenses before expense
reductions (f)(h) | | | 1.85 | (a) | | | 1.87 | (c) | | | 1.87 | | | | 1.91 | | | | 1.89 | | | | 1.91 | |
Expenses after expense
reductions (f)(h) | | | 1.80 | (a) | | | 1.80 | (c) | | | 1.80 | | | | 1.80 | | | | 1.80 | | | | 1.80 | |
Net investment income (loss) | | | 2.14 | (a) | | | 2.48 | (c) | | | 2.97 | | | | 2.74 | | | | 3.14 | | | | 3.26 | |
Portfolio turnover | | | 27( | n) | | | 69 | | | | 21 | | | | 29 | | | | 22 | | | | 34 | |
Net assets at end of period
(000 omitted) | | | $22,759 | | | | $32,196 | | | | $38,836 | | | | $43,826 | | | | $51,719 | | | | $49,910 | |
See Notes to Financial Statements
22
Financial Highlights – continued
| | | | | | | | | | | | | | | | | | | | | | | | |
| | | Six months
ended
4/30/18 | | | Year ended | |
| Class I | | | 10/31/17 | | | 10/31/16 | | | 10/31/15 | | | 10/31/14 | | | 10/31/13 | |
| | | (unaudited) | | | | | | | | | | | | | | | | |
Net asset value, beginning of
period | | | $6.63 | | | | $6.58 | | | | $6.40 | | | | $6.71 | | | | $6.74 | | | | $6.91 | |
| Income (loss) from investment operations | | | | | | | | | | | | | |
Net investment income
(loss) (d) | | | $0.10 | | | | $0.22 | (c) | | | $0.25 | | | | $0.24 | | | | $0.28 | | | | $0.29 | |
Net realized and unrealized
gain (loss) | | | (0.22 | ) | | | 0.07 | | | | 0.18 | | | | (0.28 | ) | | | (0.01 | ) | | | (0.14 | ) |
Total from investment
operations | | | $(0.12 | ) | | | $0.29 | | | | $0.43 | | | | $(0.04 | ) | | | $0.27 | | | | $0.15 | |
| Less distributions declared to shareholders | | | | | | | | | | | | | |
From net investment income | | | $(0.10 | ) | | | $(0.24 | ) | | | $(0.25 | ) | | | $(0.26 | ) | | | $(0.30 | ) | | | $(0.32 | ) |
From tax return of capital | | | — | | | | — | | | | — | | | | (0.01 | ) | | | — | | | | — | |
Total distributions declared to
shareholders | | | $(0.10 | ) | | | $(0.24 | ) | | | $(0.25 | ) | | | $(0.27 | ) | | | $(0.30 | ) | | | $(0.32 | ) |
Net asset value, end of
period (x) | | | $6.41 | | | | $6.63 | | | | $6.58 | | | | $6.40 | | | | $6.71 | | | | $6.74 | |
Total return (%) (r)(s)(t)(x) | | | (1.88 | )(n) | | | 4.54 | (c) | | | 6.88 | | | | (0.63 | ) | | | 4.14 | | | | 2.25 | |
Ratios (%) (to average net assets)
and Supplemental data: | | | | | | | | | | | | | |
Expenses before expense
reductions (f)(h) | | | 0.85 | (a) | | | 0.87 | (c) | | | 0.85 | | | | 0.90 | | | | 0.89 | | | | 0.90 | |
Expenses after expense
reductions (f)(h) | | | 0.80 | (a) | | | 0.80 | (c) | | | 0.80 | | | | 0.80 | | | | 0.80 | | | | 0.80 | |
Net investment income (loss) | | | 3.13 | (a) | | | 3.30 | (c) | | | 3.86 | | | | 3.68 | | | | 4.07 | | | | 4.21 | |
Portfolio turnover | | | 27 | (n) | | | 69 | | | | 21 | | | | 29 | | | | 22 | | | | 34 | |
Net assets at end of period
(000 omitted) | | | $74,783 | | | | $90,086 | | | | $33,820 | | | | $14,826 | | | | $16,072 | | | | $11,636 | |
See Notes to Financial Statements
23
Financial Highlights – continued
| | | | |
| Class R6 | | Six months ended 4/30/18 (i) | |
| | |
Net asset value, beginning of period | | | $6.48 | |
| Income (loss) from investment operations | |
Net investment income (loss) (d) | | | $0.03 | |
Net realized and unrealized gain (loss) | | | (0.07 | ) |
Total from investment operations | | | $(0.04 | ) |
| Less distributions declared to shareholders | |
From net investment income | | | $(0.03 | ) |
Net asset value, end of period (x) | | | $6.41 | |
Total return (%) (r)(s)(t)(x) | | | (0.56 | )(n) |
Ratios (%) (to average net assets)
and Supplemental data: | |
Expenses before expense reductions (f)(h) | | | 0.76 | (a) |
Expenses after expense reductions (f)(h) | | | 0.71 | (a) |
Net investment income (loss) | | | 3.22 | (a) |
Portfolio turnover | | | 27 | (n) |
Net assets at end of period (000 omitted) | | | $50 | |
| (c) | Amount reflects a one-time reimbursement of expenses by the custodian (or former custodian) without which net investment income and performance would be lower and expenses would be higher. |
| (d) | Per share data is based on average shares outstanding. |
| (f) | Ratios do not reflect reductions from fees paid indirectly, if applicable. |
| (h) | In addition to the fees and expenses which the fund bears directly, the fund indirectly bears a pro rata share of the fees and expenses of the underlying affiliated funds in which the fund invests. Accordingly, the expense ratio for the fund reflects only those fees and expenses borne directly by the fund. Because the underlying affiliated funds have varied expense and fee levels and the fund may own different proportions of the underlying affiliated funds at different times, the amount of fees and expenses incurred indirectly by the fund will vary. |
| (i) | For the period from the inception of Class R6, March 2, 2018, through the stated period end. |
| (r) | Certain expenses have been reduced without which performance would have been lower. |
| (s) | From time to time the fund may receive proceeds from litigation settlements, without which performance would be lower. |
| (t) | Total returns do not include any applicable sales charges. |
| (w) | Per share amount was less than $0.01. |
| (x) | The net asset values and total returns have been calculated on net assets which include adjustments made in accordance with U.S. generally accepted accounting principles required at period end for financial reporting purposes. |
See Notes to Financial Statements
24
NOTES TO FINANCIAL STATEMENTS
(unaudited)
(1) Business and Organization
MFS Strategic Income Fund (the fund) is a diversified series of MFS Series Trust VIII (the trust). The trust is organized as a Massachusetts business trust and is registered under the Investment Company Act of 1940, as amended, as an open-end management investment company.
The fund is an investment company and accordingly follows the investment company accounting and reporting guidance of the Financial Accounting Standards Board (FASB) Accounting Standards Codification Topic 946 Financial Services – Investment Companies.
(2) Significant Accounting Policies
General – The preparation of financial statements in conformity with U.S. generally accepted accounting principles requires management to make estimates and assumptions that affect the reported amounts of assets and liabilities, and disclosure of contingent assets and liabilities at the date of the financial statements and the reported amounts of increases and decreases in net assets from operations during the reporting period. Actual results could differ from those estimates. In the preparation of these financial statements, management has evaluated subsequent events occurring after the date of the fund’s Statement of Assets and Liabilities through the date that the financial statements were issued. The fund invests in the MFS High Yield Pooled Portfolio (“High Yield Pooled Portfolio”). MFS does not receive a management fee from the High Yield Pooled Portfolio. The High Yield Pooled Portfolio’s investment objective is to seek total return with an emphasis on high current income, but also considering capital appreciation. The accounting policies of the High Yield Pooled Portfolio are outlined in its shareholder report, which is available without charge by calling
1-800-225-2606 and on the Securities and Exchange Commission (SEC) web site at http://www.sec.gov or at the SEC’s public reference room in Washington, D.C. The accounting policies detailed in the Significant Accounting Policies note cover both the fund and the High Yield Pooled Portfolio. For purposes of this policy disclosure, “fund” refers to both the fund and the High Yield Pooled Portfolio in which the fund invests. The High Yield Pooled Portfolio’s shareholder report is not covered by this report. The fund and the High Yield Pooled Portfolio invest in high-yield securities rated below investment grade. Investments in below investment grade quality securities can involve a substantially greater risk of default or can already be in default, and their values can decline significantly. Below investment grade quality securities tend to be more sensitive to adverse news about the issuer, or the market or economy in general, than higher quality debt instruments. The fund and the High Yield Pooled Portfolio invest in foreign securities. Investments in foreign securities are vulnerable to the effects of changes in the relative values of the local currency and the U.S. dollar and to the effects of changes in each country’s market, economic, industry, political, regulatory, geopolitical, and other conditions. The fund invests in foreign securities. Investments in foreign securities are vulnerable to the effects of changes in the relative values of the local currency and the U.S. dollar and to the effects of changes in each country’s market, economic, industry, political, regulatory, geopolitical, and other conditions.
25
Notes to Financial Statements (unaudited) – continued
In March 2017, the FASB issued Accounting Standards Update 2017-08, Receivables –Nonrefundable Fees and Other Costs (Subtopic 310-20) – Premium Amortization on Purchased Callable Debt Securities (“ASU 2017-08”). For entities that hold callable debt securities at a premium, ASU 2017-08 requires that the premium be amortized to the earliest call date. ASU 2017-08 will be effective for fiscal years beginning after December 15, 2018, and interim periods within those fiscal years. Management has evaluated the potential impacts of ASU 2017-08 and believes that adoption of ASU 2017-08 will not have a material effect on the fund’s overall financial position or its overall results of operations.
Balance Sheet Offsetting – The fund’s accounting policy with respect to balance sheet offsetting is that, absent an event of default by the counterparty or a termination of the agreement, the International Swaps and Derivatives Association (ISDA) Master Agreement, or similar agreement, does not result in an offset of reported amounts of financial assets and financial liabilities in the Statement of Assets and Liabilities across transactions between the fund and the applicable counterparty. The fund’s right to setoff may be restricted or prohibited by the bankruptcy or insolvency laws of the particular jurisdiction to which a specific master netting agreement counterparty is subject. Balance sheet offsetting disclosures, to the extent applicable to the fund, have been included in the fund’s Significant Accounting Policies note under the captions for each of the fund’s in-scope financial instruments and transactions.
Investment Valuations – The investments of the fund and the High Yield Pooled Portfolio are valued as described below.
Equity securities, including restricted equity securities, are generally valued at the last sale or official closing price on their primary market or exchange as provided by a third-party pricing service. Equity securities, for which there were no sales reported that day, are generally valued at the last quoted daily bid quotation on their primary market or exchange as provided by a third-party pricing service. Debt instruments and floating rate loans, including restricted debt instruments, are generally valued at an evaluated or composite bid as provided by a third-party pricing service. Short-term instruments with a maturity at issuance of 60 days or less may be valued at amortized cost, which approximates market value. Exchange-traded options are generally valued at the last sale or official closing price on their primary exchange as provided by a third-party pricing service. Exchange-traded options for which there were no sales reported that day are generally valued at the last daily bid quotation on their primary exchange as provided by a third-party pricing service. Options not traded on an exchange are generally valued at a broker/dealer bid quotation. Foreign currency options are generally valued at valuations provided by a third-party pricing service. Futures contracts are generally valued at last posted settlement price on their primary exchange as provided by a third-party pricing service. Futures contracts for which there were no trades that day for a particular position are generally valued at the closing bid quotation on their primary exchange as provided by a third-party pricing service. Forward foreign currency exchange contracts are generally valued at the mean of bid and asked prices for the time period interpolated from rates provided by a third-party pricing service for proximate time periods. Open-end investment companies are generally valued at net asset value per share. Securities and other assets generally valued on the basis of information from a third-party pricing service may also be valued
26
Notes to Financial Statements (unaudited) – continued
at a broker/dealer bid quotation. Values obtained from third-party pricing services can utilize both transaction data and market information such as yield, quality, coupon rate, maturity, type of issue, trading characteristics, and other market data. The values of foreign securities and other assets and liabilities expressed in foreign currencies are converted to U.S. dollars using the mean of bid and asked prices for rates provided by a third-party pricing service.
The Board of Trustees has delegated primary responsibility for determining or causing to be determined the value of the fund’s investments (including any fair valuation) to the adviser pursuant to valuation policies and procedures approved by the Board. If the adviser determines that reliable market quotations are not readily available, investments are valued at fair value as determined in good faith by the adviser in accordance with such procedures under the oversight of the Board of Trustees. Under the fund’s valuation policies and procedures, market quotations are not considered to be readily available for most types of debt instruments and floating rate loans and many types of derivatives. These investments are generally valued at fair value based on information from third-party pricing services. In addition, investments may be valued at fair value if the adviser determines that an investment’s value has been materially affected by events occurring after the close of the exchange or market on which the investment is principally traded (such as foreign exchange or market) and prior to the determination of the fund’s net asset value, or after the halting of trading of a specific security where trading does not resume prior to the close of the exchange or market on which the security is principally traded. The adviser generally relies on third-party pricing services or other information (such as the correlation with price movements of similar securities in the same or other markets; the type, cost and investment characteristics of the security; the business and financial condition of the issuer; and trading and other market data) to assist in determining whether to fair value and at what value to fair value an investment. The value of an investment for purposes of calculating the fund’s net asset value can differ depending on the source and method used to determine value. When fair valuation is used, the value of an investment used to determine the fund’s net asset value may differ from quoted or published prices for the same investment. There can be no assurance that the fund could obtain the fair value assigned to an investment if it were to sell the investment at the same time at which the fund determines its net asset value per share.
Various inputs are used in determining the value of the fund’s assets or liabilities. These inputs are categorized into three broad levels. In certain cases, the inputs used to measure fair value may fall into different levels of the fair value hierarchy. In such cases, an investment’s level within the fair value hierarchy is based on the lowest level of input that is significant to the fair value measurement. The fund’s assessment of the significance of a particular input to the fair value measurement in its entirety requires judgment, and considers factors specific to the investment. Level 1 includes unadjusted quoted prices in active markets for identical assets or liabilities. Level 2 includes other significant observable market-based inputs (including quoted prices for similar securities, interest rates, prepayment speed, and credit risk). Level 3 includes unobservable inputs, which may include the adviser’s own assumptions in determining the fair value of investments. Other financial instruments are derivative instruments,
27
Notes to Financial Statements (unaudited) – continued
such as futures contracts and forward foreign currency exchange contracts. The following is a summary of the levels used as of April 30, 2018 in valuing the fund’s assets or liabilities:
| | | | | | | | | | | | | | | | |
| Financial Instruments | | Level 1 | | | Level 2 | | | Level 3 | | | Total | |
| Equity Securities | | | $85,049 | | | | $ — | | | | $ — | | | | $85,049 | |
| U.S. Treasury Bonds & U.S. Government Agency & Equivalents | | | — | | | | 46,038,799 | | | | — | | | | 46,038,799 | |
| Non-U.S. Sovereign Debt | | | — | | | | 20,401,838 | | | | — | | | | 20,401,838 | |
| Municipal Bonds | | | — | | | | 2,073,975 | | | | — | | | | 2,073,975 | |
| U.S. Corporate Bonds | | | — | | | | 74,507,607 | | | | — | | | | 74,507,607 | |
| Residential Mortgage-Backed Securities | | | — | | | | 2,091,716 | | | | — | | | | 2,091,716 | |
| Commercial Mortgage-Backed Securities | | | — | | | | 30,353,497 | | | | — | | | | 30,353,497 | |
| Asset-Backed Securities (including CDOs) | | | — | | | | 44,680,355 | | | | — | | | | 44,680,355 | |
| Foreign Bonds | | | — | | | | 32,952,912 | | | | — | | | | 32,952,912 | |
| Mutual Funds | | | 63,393,264 | | | | — | | | | — | | | | 63,393,264 | |
| Total | | | $63,487,313 | | | | $253,100,699 | | | | $ — | | | | $316,579,012 | |
| | |
| Other Financial Instruments | | | | | | | |
| Futures Contracts – Assets | | | $74,247 | | | | $ — | | | | $ — | | | | $74,247 | |
| Futures Contracts – Liabilities | | | (107,859 | ) | | | — | | | | — | | | | (107,859 | ) |
| Forward Foreign Currency Exchange Contracts – Assets | | | — | | | | 87,517 | | | | — | | | | 87,517 | |
| Forward Foreign Currency Exchange Contracts – Liabilities | | | — | | | | (74,336 | ) | | | — | | | | (74,336 | ) |
For further information regarding security characteristics, see the Portfolio of Investments. Please refer to the High Yield Pooled Portfolio’s shareholder report for further information regarding the levels used in valuing its assets or liabilities.
Foreign Currency Translation – Purchases and sales of foreign investments, income, and expenses are converted into U.S. dollars based upon currency exchange rates prevailing on the respective dates of such transactions or on the reporting date for foreign denominated receivables and payables. Gains and losses attributable to foreign currency exchange rates on sales of securities are recorded for financial statement purposes as net realized gains and losses on investments. Gains and losses attributable to foreign exchange rate movements on receivables, payables, income and expenses are recorded for financial statement purposes as foreign currency transaction gains and losses. That portion of both realized and unrealized gains and losses on investments that results from fluctuations in foreign currency exchange rates is not separately disclosed.
Derivatives – The fund uses derivatives for different purposes, primarily to increase or decrease exposure to a particular market or segment of the market, or security, to increase or decrease interest rate or currency exposure, or as alternatives to direct investments. Derivatives are used for hedging or non-hedging purposes. While hedging can reduce or eliminate losses, it can also reduce or eliminate gains. When the fund uses derivatives as an investment to increase market exposure, or for hedging purposes, gains and losses from derivative instruments may be substantially greater than the derivative’s original cost.
28
Notes to Financial Statements (unaudited) – continued
The derivative instruments used by the fund during the period were futures contracts and forward foreign currency exchange contracts. Depending on the type of derivative, the fund may exit a derivative position by entering into an offsetting transaction with a counterparty or exchange, negotiating an agreement with the derivative counterparty, or novating the position to a third party. The fund may be unable to promptly close out
a futures position in instances where the daily fluctuation in the price for that type of future exceeds the daily limit set by the exchange. The fund’s period end derivatives, as presented in the Portfolio of Investments and the associated Derivative Contract tables, generally are indicative of the volume of its derivative activity during the period.
The following table presents, by major type of derivative contract, the fair value, on a gross basis, of the asset and liability components of derivatives held by the fund at April 30, 2018 as reported in the Statement of Assets and Liabilities:
| | | | | | | | | | |
| | | | | Fair Value (a) | |
| Risk | | Derivative Contracts | | Asset Derivatives | | | Liability Derivatives | |
| Interest Rate | | Interest Rate Futures | | | $74,247 | | | $ | (107,859 | ) |
Foreign Exchange | | Forward Foreign Currency Exchange | | | 87,517 | | | | (74,336 | ) |
| Total | | | | | $161,764 | | | $ | (182,195 | ) |
| (a) | Values presented in this table for futures contracts correspond to the values reported in the fund’s Portfolio of Investments. Only the current day net variation margin for futures contracts is separately reported within the fund’s Statement of Assets and Liabilities. |
The following table presents, by major type of derivative contract, the realized gain (loss) on derivatives held by the fund for the six months ended April 30, 2018 as reported in the Statement of Operations:
| | | | | | | | | | | | |
| Risk | | Futures
Contracts | | | Forward Foreign
Currency
Exchange
Contracts | | | Unaffiliated
Issuers
(Purchased
Options) | |
| Interest Rate | | | $33,856 | | | | $— | | | | $— | |
| Foreign Exchange | | | — | | | | (37,971 | ) | | | — | |
| Credit | | | — | | | | — | | | | (72,036 | ) |
| Total | | | $33,856 | | | | $(37,971 | ) | | | $(72,036 | ) |
The following table presents, by major type of derivative contract, the change in unrealized appreciation (depreciation) on derivatives held by the fund for the six months ended April 30, 2018 as reported in the Statement of Operations:
| | | | | | | | | | | | |
| Risk | | Futures
Contracts | | | Forward Foreign
Currency
Exchange
Contracts | | | Unaffiliated Issuers
(Purchased
Options) | |
| Interest Rate | | | $(16,039 | ) | | | $— | | | | $— | |
| Foreign Exchange | | | — | | | | 25,104 | | | | — | |
| Credit | | | — | | | | — | | | | 71,939 | |
| Total | | | $(16,039 | ) | | | $25,104 | | | | $71,939 | |
29
Notes to Financial Statements (unaudited) – continued
Derivative counterparty credit risk is managed through formal evaluation of the creditworthiness of all potential counterparties. On certain, but not all, uncleared derivatives, the fund attempts to reduce its exposure to counterparty credit risk whenever possible by entering into an ISDA Master Agreement on a bilateral basis. The ISDA Master Agreement gives each party to the agreement the right to terminate all transactions traded under such agreement if there is a specified deterioration in the credit quality of the other party. Upon an event of default or a termination of the ISDA Master Agreement, the non-defaulting party has the right to close out all transactions traded under such agreement and to net amounts owed under each agreement to one net amount payable by one party to the other. This right to close out and net payments across all transactions traded under the ISDA Master Agreement could result in a reduction of the fund’s credit risk to such counterparty equal to any amounts payable by the fund under the applicable transactions, if any.
Collateral and margin requirements differ by type of derivative. For cleared derivatives
(e.g., futures contracts, cleared swaps, and exchange-traded options), margin requirements are set by the clearing broker and the clearing house and collateral, in the form of cash or securities, is posted by the fund directly with the clearing broker. Collateral terms are counterparty agreement specific for uncleared derivatives (e.g., forward foreign currency exchange contracts, uncleared swap agreements, and uncleared options) and collateral, in the form of cash and securities, is held in segregated accounts with the fund’s custodian in connection with these agreements. For derivatives traded under an ISDA Master Agreement, which contains a collateral support annex, the collateral requirements are netted across all transactions traded under such counterparty-specific agreement and one amount is posted from one party to the other to collateralize such obligations. Cash that has been segregated or delivered to cover the fund’s collateral or margin obligations under derivative contracts, if any, will be reported separately in the Statement of Assets and Liabilities as restricted cash for uncleared derivatives and/or deposits with brokers for cleared derivatives. Securities pledged as collateral or margin for the same purpose, if any, are noted in the Portfolio of Investments. The fund may be required to make payments of interest on uncovered collateral or margin obligations with the broker. Any such payments are included in “Miscellaneous” expense in the Statement of Operations.
Purchased Options – The fund purchased put options for a premium. Purchased put options entitle the holder sell a specified number of shares or units of a particular security, currency or index at a specified price at a specified date or within a specified period of time. Purchasing put options may hedge against an anticipated decline in the value of portfolio securities or currency or decrease the fund’s exposure to an underlying instrument.
The premium paid is initially recorded as an investment in the Statement of Assets and Liabilities. That investment is subsequently marked-to-market daily with the difference between the premium paid and the market value of the purchased option being recorded as unrealized appreciation or depreciation. Premiums paid for purchased put options which have expired are treated as realized losses on investments in the Statement of Operations. Upon the exercise or closing of a purchased put option, the premium paid is offset against the proceeds on the sale of the underlying security or financial instrument in order to determine the realized gain or loss on investments.
30
Notes to Financial Statements (unaudited) – continued
Whether or not the option is exercised, the fund’s maximum risk of loss from purchasing an option is the amount of premium paid. All option contracts involve credit risk if the counterparty to the option contract fails to perform. For uncleared options, this risk is mitigated in cases where there is an ISDA Master Agreement between the fund and the counterparty providing for netting as described above and, where applicable, by the posting of collateral by the counterparty to the fund to cover the fund’s exposure to the counterparty under such ISDA Master Agreement.
Futures Contracts – The fund entered into futures contracts which may be used to hedge against or obtain broad market exposure, interest rate exposure, currency exposure, or to manage duration. A futures contract represents a commitment for the future purchase or sale of an asset at a specified price on a specified date.
Upon entering into a futures contract, the fund is required to deposit with the broker, either in cash or securities, an initial margin in an amount equal to a certain percentage of the notional amount of the contract. Subsequent payments (variation margin) are made or received by the fund each day, depending on the daily fluctuations in the value of the contract, and are recorded for financial statement purposes as unrealized gain or loss by the fund until the contract is closed or expires at which point the gain or loss on futures contracts is realized.
The fund bears the risk of interest rates, exchange rates or securities prices moving unexpectedly, in which case, the fund may not achieve the anticipated benefits of the futures contracts and may realize a loss. While futures contracts may present less counterparty risk to the fund since the contracts are exchange traded and the exchange’s clearinghouse guarantees payments to the broker, there is still counterparty credit risk due to the insolvency of the broker. The fund’s maximum risk of loss due to counterparty credit risk is equal to the margin posted by the fund to the broker plus any gains or minus any losses on the outstanding futures contracts.
Forward Foreign Currency Exchange Contracts – The fund entered into forward foreign currency exchange contracts for the purchase or sale of a specific foreign currency at a fixed price on a future date. These contracts may be used to hedge the fund’s currency risk or for non-hedging purposes. For hedging purposes, the fund may enter into contracts to deliver or receive foreign currency that the fund will receive from or use in its normal investment activities. The fund may also use contracts to hedge against declines in the value of foreign currency denominated securities due to unfavorable exchange rate movements. For non-hedging purposes, the fund may enter into contracts with the intent of changing the relative exposure of the fund’s portfolio of securities to different currencies to take advantage of anticipated exchange rate changes.
Forward foreign currency exchange contracts are adjusted by the daily exchange rate of the underlying currency and any unrealized gains or losses are recorded as a receivable or payable for forward foreign currency exchange contracts until the contract settlement date. On contract settlement date, any gain or loss on the contract is recorded as realized gains or losses on forward foreign currency exchange contracts.
Risks may arise upon entering into these contracts from unanticipated movements in the value of the contract and from the potential inability of counterparties to meet the terms of their contracts. Generally, the fund’s maximum risk due to counterparty credit
31
Notes to Financial Statements (unaudited) – continued
risk is the unrealized gain on the contract due to the use of Continuous Linked Settlement, a multicurrency cash settlement system for the centralized settlement of foreign transactions. This risk is mitigated in cases where there is an ISDA Master Agreement between the fund and the counterparty providing for netting as described above and, where applicable, by the posting of collateral by the counterparty to the fund to cover the fund’s exposure to the counterparty under such ISDA Master Agreement.
Loans and Other Direct Debt Instruments –The fund invests in loans and loan participations or other receivables. These investments may include standby financing commitments, including revolving credit facilities, which contractually obligate the fund to supply additional cash to the borrower on demand. The fund generally provides this financial support in order to preserve its existing investment or to obtain a more senior secured interest in the assets of the borrower. Loan participations involve a risk of insolvency of the lending bank or other financial intermediary.
Indemnifications – Under the fund’s organizational documents, its officers and Trustees may be indemnified against certain liabilities and expenses arising out of the performance of their duties to the fund. Additionally, in the normal course of business, the fund enters into agreements with service providers that may contain indemnification clauses. The fund’s maximum exposure under these agreements is unknown as this would involve future claims that may be made against the fund that have not yet occurred.
Investment Transactions and Income – Investment transactions are recorded on the trade date. Interest income is recorded on the accrual basis. All premium and discount is amortized or accreted for financial statement purposes in accordance with U.S. generally accepted accounting principles. Dividends received in cash are recorded on the ex-dividend date. Certain dividends from foreign securities will be recorded when the fund is informed of the dividend if such information is obtained subsequent to the ex-dividend date. Interest payments received in additional securities are recorded on the ex-interest date in an amount equal to the value of the security on such date. Debt obligations may be placed on non-accrual status or set to accrue at a rate of interest less than the contractual coupon when the collection of all or a portion of interest has become doubtful. Interest income for those debt obligations may be further reduced by the write-off of the related interest receivables when deemed uncollectible.
The fund may receive proceeds from litigation settlements. Any proceeds received from litigation involving portfolio holdings are reflected in the Statement of Operations in realized gain/loss if the security has been disposed of by the fund or in unrealized gain/loss if the security is still held by the fund. Any other proceeds from litigation not related to portfolio holdings are reflected as other income in the Statement of Operations.
The fund invests a significant portion of its assets in asset-backed and/or mortgage-backed securities. For these securities, the value of the debt instrument also depends on the credit quality and adequacy of the underlying assets or collateral as well as whether there is a security interest in the underlying assets or collateral. Enforcing rights, if any, against the underlying assets or collateral may be difficult. U.S. Government securities not supported as to the payment of principal or interest by the
32
Notes to Financial Statements (unaudited) – continued
U.S. Treasury, such as those issued by Fannie Mae, Freddie Mac, and the Federal Home Loan Banks, are subject to greater credit risk than are U.S. Government securities supported by the U.S. Treasury, such as those issued by Ginnie Mae.
The fund purchased or sold debt securities on a when-issued or delayed delivery basis, or in a “To Be Announced” (TBA) or “forward commitment” transaction with delivery or payment to occur at a later date beyond the normal settlement period. At the time a fund enters into a commitment to purchase or sell a security, the transaction is recorded and the value of the security acquired is reflected in the fund’s net asset value. The price of such security and the date that the security will be delivered and paid for are fixed at the time the transaction is negotiated. The value of the security may vary with market fluctuations. No interest accrues to the fund until payment takes place. At the time that a fund enters into this type of transaction, the fund is required to have sufficient cash and/or liquid securities to cover its commitments. Losses may arise due to changes in the value of the underlying securities or if the counterparty does not perform under the contract’s terms, or if the issuer does not issue the securities due to political, economic or other factors. Additionally, losses may arise due to declines in the value of the securities prior to settlement date.
To mitigate this risk of loss on TBA securities and other types of forward settling mortgage-backed securities, the fund whenever possible enters into a Master Securities Forward Transaction Agreement (“MSFTA”) on a bilateral basis with each of the counterparties with whom it undertakes a significant volume of transactions. The MSFTA gives each party to the agreement the right to terminate all transactions traded under such agreement if there is a certain deterioration in the credit quality of the other party. Upon an event of default or a termination of the MSFTA, the non-defaulting party has the right to close out all transactions traded under such agreement and to net amounts owed under each transaction to one net amount payable by one party to the other. This right to close out and net payments across all transactions traded under the MSFTA could result in a reduction of the fund’s credit risk to such counterparty equal to any amounts payable by the fund under the applicable transactions, if any.
For mortgage-backed securities traded under a MSFTA, the collateral and margining requirements are contract specific. Collateral amounts across all transactions traded under such agreement are netted and one amount is posted from one party to the other to collateralize such obligations. Cash that has been pledged to cover the fund’s collateral or margin obligations under a MSFTA, if any, will be reported separately on the Statement of Assets and Liabilities as restricted cash. Securities pledged as collateral or margin for the same purpose, if any, are noted in the Portfolio of Investments.
Fees Paid Indirectly – The fund’s custody fee may be reduced by a credit earned under an arrangement that measures the value of U.S. dollars deposited with the custodian by the fund. The amount of the credit, for the six months ended April 30, 2018, is shown as a reduction of total expenses in the Statement of Operations.
Tax Matters and Distributions – The fund intends to qualify as a regulated investment company, as defined under Subchapter M of the Internal Revenue Code, and to distribute all of its taxable income, including realized capital gains. As a result, no provision for federal income tax is required. The fund’s federal tax returns, when
33
Notes to Financial Statements (unaudited) – continued
filed, will remain subject to examination by the Internal Revenue Service for a three year period. Management has analyzed the fund’s tax positions taken on federal and state tax returns for all open tax years and does not believe that there are any uncertain tax positions that require recognition of a tax liability. Foreign taxes, if any, have been accrued by the fund in the accompanying financial statements in accordance with the applicable foreign tax law. Foreign income taxes may be withheld by certain countries in which the fund invests. Additionally, capital gains realized by the fund on securities issued in or by certain foreign countries may be subject to capital gains tax imposed by those countries.
Distributions to shareholders are recorded on the ex-dividend date. Income and capital gain distributions are determined in accordance with income tax regulations, which may differ from U.S. generally accepted accounting principles. Certain capital accounts in the financial statements are periodically adjusted for permanent differences in order to reflect their tax character. These adjustments have no impact on net assets or net asset value per share. Temporary differences which arise from recognizing certain items of income, expense, gain or loss in different periods for financial statement and tax purposes will reverse at some time in the future. Distributions in excess of net investment income or net realized gains are temporary overdistributions for financial statement purposes resulting from differences in the recognition or classification of income or distributions for financial statement and tax purposes.
Book/tax differences primarily relate to expiration of capital loss carryforwards, amortization and accretion of debt securities, and wash sale loss deferrals.
The tax character of distributions made during the current period will be determined at fiscal year end. The tax character of distributions declared to shareholders for the last fiscal year is as follows:
| | | | |
| | | Year ended | |
| | | 10/31/17 | |
Ordinary income (including any short-term capital gains) (a) | | | $10,675,426 | |
| (a) | Included in the fund’s distributions from ordinary income for the year ended October 31, 2017 is $222,562 in excess of investment company taxable income which, in accordance with applicable U.S. tax law, is taxable to shareholders as ordinary income distributions. |
The federal tax cost and the tax basis components of distributable earnings were as follows:
| | | | |
| As of 4/30/18 | | | |
| Cost of investments | | | $326,922,488 | |
| Gross appreciation | | | 551,479 | |
| Gross depreciation | | | (10,894,955 | ) |
| Net unrealized appreciation (depreciation) | | | $(10,343,476 | ) |
| |
| As of 10/31/17 | | | |
| Other temporary differences | | | (723,453 | ) |
| Net unrealized appreciation (depreciation) | | | (1,495,134 | ) |
The aggregate cost above includes prior fiscal year end tax adjustments, if applicable.
34
Notes to Financial Statements (unaudited) – continued
Multiple Classes of Shares of Beneficial Interest – The fund offers multiple classes of shares, which differ in their respective distribution and service fees. The fund’s income and common expenses are allocated to shareholders based on the value of settled shares outstanding of each class. The fund’s realized and unrealized gain (loss) are allocated to shareholders based on the daily net assets of each class. Dividends are declared separately for each class. Differences in per share dividend rates are generally due to differences in separate class expenses. Class B shares will convert to Class A shares approximately eight years after purchase. Effective April 23, 2018, Class C shares will convert to Class A shares approximately ten years after purchase. The fund’s distributions declared to shareholders as reported in the Statements of Changes in Net Assets are presented by class as follows:
| | | | | | | | |
| | | From net investment
income | |
| | | Six months
ended
4/30/18 | | | Year
ended
10/31/17 | |
| Class A | | | $2,758,494 | | | | $7,089,499 | |
| Class B | | | 173,034 | | | | 569,513 | |
| Class C | | | 298,986 | | | | 939,013 | |
| Class I | | | 1,285,095 | | | | 2,077,401 | |
| Class R6 | | | 259 | | | | — | |
| Total | | | $4,515,868 | | | | $10,675,426 | |
(3) Transactions with Affiliates
Investment Adviser – The fund has an investment advisory agreement with MFS to provide overall investment management and related administrative services and facilities to the fund. The management fee is computed daily and paid monthly at the following annual rates based on the fund’s average daily net assets:
| | | | |
| Up to $1 billion | | | 0.60 | % |
| In excess of $1 billion and up to $2.5 billion | | | 0.55 | % |
| In excess of $2.5 billion | | | 0.50 | % |
MFS has agreed in writing to reduce its management fee by a specified amount if certain MFS mutual fund assets exceed thresholds agreed to by MFS and the fund’s Board of Trustees. For the six months ended April 30, 2018, this management fee reduction amounted to $14,942, which is included in the reduction of total expenses in the Statement of Operations. The management fee incurred for the six months ended April 30, 2018 was equivalent to an annual effective rate of 0.59% of the fund’s average daily net assets.
The investment adviser has agreed in writing to pay a portion of the fund’s total annual operating expenses, excluding interest, taxes, extraordinary expenses, brokerage and transaction costs, and investment-related expenses (such as fees and expenses associated with investment companies and other similar investment vehicles), such that total fund operating expenses do not exceed the following rates annually of each class’s average daily net assets:
| | | | | | | | | | | | | | | | | | |
| Class A | | | Class B | | | Class C | | | Class I | | | Class R6 | |
| | 1.05% | | | | 1.80 | % | | | 1.80 | % | | | 0.80 | % | | | 0.72 | % |
35
Notes to Financial Statements (unaudited) – continued
This written agreement will continue until modified by the fund’s Board of Trustees, but such agreement will continue at least until February 28, 2019. For the six months ended April 30, 2018, this reduction amounted to $68,037, which is included in the reduction of total expenses in the Statement of Operations.
Distributor – MFS Fund Distributors, Inc. (MFD), a wholly-owned subsidiary of MFS, as distributor, received $4,785 for the six months ended April 30, 2018, as its portion of the initial sales charge on sales of Class A shares of the fund.
The Board of Trustees has adopted a distribution plan for certain share classes pursuant to Rule 12b-1 of the Investment Company Act of 1940.
The fund’s distribution plan provides that the fund will pay MFD for services provided by MFD and financial intermediaries in connection with the distribution and servicing of certain share classes. One component of the plan is a distribution fee paid to MFD and another component of the plan is a service fee paid to MFD. MFD may subsequently pay all, or a portion, of the distribution and/or service fees to financial intermediaries.
Distribution Plan Fee Table:
| | | | | | | | | | | | | | | | | | | | |
| | | Distribution
Fee Rate (d) | | | Service
Fee Rate (d) | | | Total
Distribution
Plan (d) | | | Annual
Effective
Rate (e) | | | Distribution
and Service
Fee | |
| Class A | | | — | | | | 0.25% | | | | 0.25% | | | | 0.24% | | | | $252,879 | |
| Class B | | | 0.75% | | | | 0.25% | | | | 1.00% | | | | 1.00% | | | | 85,577 | |
| Class C | | | 0.75% | | | | 0.25% | | | | 1.00% | | | | 1.00% | | | | 152,167 | |
| Total Distribution and Service Fees | | | | | | | | | | | | $490,623 | |
| (d) | In accordance with the distribution plan for certain classes, the fund pays distribution and/or service fees equal to these annual percentage rates of each class’s average daily net assets. The distribution and service fee rates disclosed by class represent the current rates in effect at the end of the reporting period. Any rate changes, if applicable, are detailed below. |
| (e) | The annual effective rates represent actual fees incurred under the distribution plan for the six months ended April 30, 2018 based on each class’s average daily net assets. MFD has voluntarily agreed to rebate a portion of each class’s 0.25% service fee attributable to accounts for which MFD retains the 0.25% service fee except for accounts attributable to MFS or its affiliates’ seed money. For the six months ended April 30, 2018, this rebate amounted to $6,069, $33, and $21 for Class A, Class B, and Class C, respectively, and is included in the reduction of total expenses in the Statement of Operations. |
Certain Class A shares are subject to a contingent deferred sales charge (CDSC) in the event of a shareholder redemption within 18 months of purchase. Class B shares are subject to a CDSC in the event of a shareholder redemption within six years of purchase. Class C shares are subject to a CDSC in the event of a shareholder redemption within 12 months of purchase. All contingent deferred sales charges are paid to MFD and during the six months ended April 30, 2018, were as follows:
| | | | |
| | | Amount | |
| Class A | | | $3,215 | |
| Class B | | | 10,969 | |
| Class C | | | 558 | |
Shareholder Servicing Agent – MFS Service Center, Inc. (MFSC), a wholly-owned subsidiary of MFS, receives a fee from the fund for its services as shareholder servicing agent calculated as a percentage of the average daily net assets of the fund as
36
Notes to Financial Statements (unaudited) – continued
determined periodically under the supervision of the fund’s Board of Trustees. For the six months ended April 30, 2018, the fee was $55,013, which equated to 0.0327% annually of the fund’s average daily net assets. MFSC also receives payment from the fund for out-of-pocket expenses, sub-accounting and other shareholder servicing costs which may be paid to affiliated and unaffiliated service providers. Class R6 shares do not incur sub-accounting fees. For the six months ended April 30, 2018, these out-of-pocket expenses, sub-accounting and other shareholder servicing costs amounted to $166,303.
Administrator – MFS provides certain financial, legal, shareholder communications, compliance, and other administrative services to the fund. Under an administrative services agreement, the fund reimburses MFS the costs incurred to provide these services. The fund is charged an annual fixed amount of $17,500 plus a fee based on average daily net assets. The administrative services fee incurred for the six months ended April 30, 2018 was equivalent to an annual effective rate of 0.0178% of the fund’s average daily net assets.
Trustees’ and Officers’ Compensation – The fund pays compensation to independent Trustees in the form of a retainer, attendance fees, and additional compensation to Board and Committee chairpersons. The fund does not pay compensation directly to Trustees or officers of the fund who are also officers of the investment adviser, all of whom receive remuneration for their services to the fund from MFS. Certain officers and Trustees of the fund are officers or directors of MFS, MFD, and MFSC.
Prior to December 31, 2001, the fund had an unfunded defined benefit plan (“DB plan”) for independent Trustees. As of December 31, 2001, the Board took action to terminate the DB plan with respect to then-current and any future independent Trustees, such that the DB plan covers only certain of those former independent Trustees who retired on or before December 31, 2001. The DB plan resulted in a pension expense of $566 and is included in “Independent Trustees’ compensation” in the Statement of Operations for the six months ended April 30, 2018. The liability for deferred retirement benefits payable to certain independent Trustees under the DB plan amounted to $4,052 at April 30, 2018, and is included in “Payable for independent Trustees’ compensation” in the Statement of Assets and Liabilities.
Other – This fund and certain other funds managed by MFS (the funds) have entered into a service agreement (the ISO Agreement) which provides for payment of fees solely by the funds to Tarantino LLC in return for the provision of services of an Independent Senior Officer (ISO) for the funds. Frank L. Tarantino serves as the ISO and is an officer of the funds and the sole member of Tarantino LLC. The funds can terminate the ISO Agreement with Tarantino LLC at any time under the terms of the ISO Agreement. For the six months ended April 30, 2018, the fee paid by the fund under this agreement was $280 and is included in “Miscellaneous” expense in the Statement of Operations. MFS has agreed to bear all expenses associated with office space, other administrative support, and supplies provided to the ISO.
The fund invests in the MFS Institutional Money Market Portfolio which is managed by MFS and seeks current income consistent with preservation of capital and liquidity. This money market fund does not pay a management fee to MFS.
37
Notes to Financial Statements (unaudited) – continued
The fund invests in the High Yield Pooled Portfolio, which is a mutual fund advised by MFS that does not pay management fees to MFS but does incur investment and operating costs. The fund invests in the High Yield Pooled Portfolio to gain exposure to high income debt instruments, rather than investing in high income debt instruments directly. The High Yield Pooled Portfolio does not pay a management fee to MFS or distribution and/or service fee to MFD.
On March 16, 2017, MFS purchased 38,284 shares of Class I for an aggregate amount of $248,078.
On September 20, 2017, MFS purchased 63 shares of Class I for an aggregate amount of $418.
At April 30, 2018, MFS held approximately 100% of the outstanding shares of Class R6.
(4) Portfolio Securities
For the six months ended April 30, 2018, purchases and sales of investments, other than short-term obligations, were as follows:
| | | | | | | | |
| | | Purchases | | | Sales | |
| U.S. Government securities | | | $6,837,212 | | | | $24,123,552 | |
| Non-U.S. Government securities | | | $83,189,132 | | | | $88,574,074 | |
(5) Shares of Beneficial Interest
The fund’s Declaration of Trust permits the Trustees to issue an unlimited number of full and fractional shares of beneficial interest. Transactions in fund shares were as follows:
| | | | | | | | | | | | | | | | |
| | | Six months ended
4/30/18 | | | Year ended
10/31/17 | |
| | | Shares | | | Amount | | | Shares | | | Amount | |
| Shares sold | | | | | | | | | | | | | | | | |
Class A | | | 3,890,819 | | | | $25,328,808 | | | | 6,831,232 | | | | $44,818,495 | |
Class B | | | 72,703 | | | | 472,621 | | | | 185,647 | | | | 1,212,023 | |
Class C | | | 315,451 | | | | 2,050,711 | | | | 927,100 | | | | 6,014,835 | |
Class I | | | 2,991,572 | | | | 19,554,780 | | | | 11,135,625 | | | | 73,240,379 | |
Class R6 | | | 7,717 | | | | 50,001 | | | | — | | | | — | |
| | | 7,278,262 | | | | $47,456,921 | | | | 19,079,604 | | | | $125,285,732 | |
| | | | |
| Shares issued to shareholders in reinvestment of distributions | | | | | | | | | | | | | | | | |
Class A | | | 400,073 | | | | $2,611,571 | | | | 1,018,085 | | | | $6,692,723 | |
Class B | | | 24,097 | | | | 156,298 | | | | 75,540 | | | | 493,223 | |
Class C | | | 42,721 | | | | 276,408 | | | | 129,244 | | | | 841,443 | |
Class I | | | 183,261 | | | | 1,195,425 | | | | 282,349 | | | | 1,860,538 | |
Class R6 | | | 39 | | | | 259 | | | | — | | | | — | |
| | | 650,191 | | | | $4,239,961 | | | | 1,505,218 | | | | $9,887,927 | |
| | | | |
| Shares reacquired | | | | | | | | | | | | | | | | |
Class A | | | (3,745,321 | ) | | | $(24,463,816 | ) | | | (8,902,802 | ) | | | $(58,366,348 | ) |
Class B | | | (404,268 | ) | | | (2,620,638 | ) | | | (1,152,028 | ) | | | (7,513,166 | ) |
Class C | | | (1,672,848 | ) | | | (10,714,976 | ) | | | (2,118,081 | ) | | | (13,760,884 | ) |
Class I | | | (5,090,102 | ) | | | (33,131,002 | ) | | | (2,978,616 | ) | | | (19,549,916 | ) |
| | | (10,912,539 | ) | | | $(70,930,432 | ) | | | (15,151,527 | ) | | | $(99,190,314 | ) |
38
Notes to Financial Statements (unaudited) – continued
| | | | | | | | | | | | | | | | |
| | | Six months ended
4/30/18 | | | Year ended
10/31/17 | |
| | | Shares | | | Amount | | | Shares | | | Amount | |
| Net change | | | | | | | | | | | | | | | | |
Class A | | | 545,571 | | | | $3,476,563 | | | | (1,053,485 | ) | | | $(6,855,130 | ) |
Class B | | | (307,468 | ) | | | (1,991,719 | ) | | | (890,841 | ) | | | (5,807,920 | ) |
Class C | | | (1,314,676 | ) | | | (8,387,857 | ) | | | (1,061,737 | ) | | | (6,904,606 | ) |
Class I | | | (1,915,269 | ) | | | (12,380,797 | ) | | | 8,439,358 | | | | 55,551,001 | |
Class R6 | | | 7,756 | | | | 50,260 | | | | — | | | | — | |
| | | (2,984,086 | ) | | | $(19,233,550 | ) | | | 5,433,295 | | | | $35,983,345 | |
Class T shares were not publicly available for sale during the period. Please see the fund’s prospectus for details.
(6) Line of Credit
The fund and certain other funds managed by MFS participate in a $1.25 billion unsecured committed line of credit, subject to a $1 billion sublimit, provided by a syndication of banks under a credit agreement. Borrowings may be made for temporary financing needs. Interest is charged to each fund, based on its borrowings, generally at a rate equal to the higher of the Overnight Federal Reserve funds rate or daily one month LIBOR plus an agreed upon spread. A commitment fee, based on the average daily, unused portion of the committed line of credit, is allocated among the participating funds at the end of each calendar quarter. In addition, the fund and other funds managed by MFS have established unsecured uncommitted borrowing arrangements with certain banks for temporary financing needs. Interest is charged to each fund, based on its borrowings, at a rate equal to the Overnight Federal Reserve funds rate plus an agreed upon spread. For the six months ended April 30, 2018, the fund’s commitment fee and interest expense were $1,159 and $0, respectively, and are included in “Miscellaneous” expense in the Statement of Operations.
(7) Investments in Affiliated Issuers
An affiliated issuer may be considered one in which the fund owns 5% or more of the outstanding voting securities, or a company which is under common control. For the purposes of this report, the fund assumes the following to be affiliated issuers:
| | | | | | | | | | | | | | | | | | | | |
| | | | | |
| Affiliated Issuers | | | | | Beginning
Shares/Par
Amount | | | Acquisitions
Shares/Par
Amount | | | Dispositions
Shares/Par
Amount | | | Ending
Shares/Par
Amount | |
| MFS High Yield Pooled Portfolio | | | | | | | 9,745,192 | | | | 471,229 | | | | (3,284,418 | ) | | | 6,932,003 | |
MFS Institutional Money
Market Portfolio | | | | | | | 647,019 | | | | 76,149,789 | | | | (76,346,092 | ) | | | 450,716 | |
| | | | | |
| Affiliated Issuers | | Realized
Gain (Loss) | | | Change in
Unrealized
Appreciation (Depreciation) | | | Capital Gain
Distributions | | | Dividend
Income | | | Ending
Value | |
| MFS High Yield Pooled Portfolio | | | $(2,791,330 | ) | | | $(382,159 | ) | | | $— | | | | $2,043,397 | | | | $62,942,593 | |
MFS Institutional Money
Market Portfolio | | | (1,877 | ) | | | — | | | | — | | | | 58,221 | | | | 450,671 | |
| | | $(2,793,207 | ) | | | $(382,159 | ) | | | $— | | | | $2,101,618 | | | | $63,393,264 | |
39
Notes to Financial Statements (unaudited) – continued
(8) Legal Proceedings
In May 2015, the Motors Liquidation Company Avoidance Action Trust (hereafter, “AAT”) served upon the fund a complaint in an adversary proceeding in the U.S. Bankruptcy Court for the Southern District of New York, captioned Motors Liquidation Company Avoidance Action Trust v. JPMorgan Chase Bank, N.A., et al. (No. 09-00504 (REG)). The complaint, which was originally filed in 2009 but not served on the fund until 2015, names as defendants over 500 entities (including the fund) that held an interest in a $1.5 billion General Motors (GM) term loan in 2009, when GM filed for bankruptcy. The AAT alleges that the fund and the other term loan lenders were improperly treated as secured lenders with respect to the term loan shortly before and immediately after GM’s bankruptcy, receiving full principal and interest payments under the loan. The AAT alleges that the fund and other term loan lenders should have been treated as unsecured (or partially unsecured) creditors because the main lien securing the collateral was allegedly not perfected at the time of GM’s bankruptcy due to an erroneous filing in October 2008 that terminated the financing statement perfecting the lien. The AAT seeks to claw back payments made to the fund and the other term loan lenders after, and during the 90 days before, GM’s June 2009 bankruptcy petition. During that time period, the fund received term loan payments of approximately $570,000. The fund cannot predict the outcome of this proceeding. Among other things, it is unclear whether the AAT’s claims will succeed; what the fund would be entitled to as an unsecured (or partially unsecured) creditor, given the existence of other collateral not impacted by the erroneous October 2008 filing; whether third parties responsible for the erroneous October 2008 filing would bear some or all of any liability; and the degree to which the fund may be entitled to indemnification from a third party for any amount required to be disgorged. The fund has and will continue to incur legal expenses associated with the defense of this action and in related claims against third parties.
40
PROXY VOTING POLICIES AND INFORMATION
MFS votes proxies on behalf of the fund pursuant to proxy voting policies and procedures that are available without charge, upon request, by calling 1-800-225-2606, by visiting mfs.com/proxyvoting, or by visiting the SEC’s Web site at http://www.sec.gov.
Information regarding how the fund voted proxies relating to portfolio securities during the most recent twelve-month period ended June 30 is available by August 31 of each year without charge by visiting mfs.com/proxyvoting, or by visiting the SEC’s Web site at http://www.sec.gov.
QUARTERLY PORTFOLIO DISCLOSURE
The fund will file a complete schedule of portfolio holdings with the Securities and Exchange Commission (the Commission) for the first and third quarters of each fiscal year on Form N-Q. A shareholder can obtain the quarterly portfolio holdings report at mfs.com. The fund’s Form N-Q is also available on the EDGAR database on the Commission’s Internet Web site at http://www.sec.gov, and may be reviewed and copied at the:
Public Reference Room
Securities and Exchange Commission
100 F Street, NE, Room 1580
Washington, D.C. 20549
Information on the operation of the Public Reference Room may be obtained by calling the Commission at 1-800-SEC-0330. Copies of the fund’s Form N-Q also may be obtained, upon payment of a duplicating fee, by electronic request at the following e-mail address: publicinfo@sec.gov or by writing the Public Reference Section at the above address.
FURTHER INFORMATION
From time to time, MFS may post important information about the fund or the MFS funds on the MFS web site (mfs.com). This information is available at https://www.mfs.com/en-us/what-we-do/announcements.html or at mfs.com/openendfunds by choosing the fund’s name.
41
INFORMATION ABOUT FUND CONTRACTS AND LEGAL CLAIMS
The fund has entered into contractual arrangements with an investment adviser, administrator, distributor, shareholder servicing agent, 529 program manager (if applicable), and custodian who each provide services to the fund. Unless expressly stated otherwise, shareholders are not parties to, or intended beneficiaries of these contractual arrangements, and these contractual arrangements are not intended to create any shareholder right to enforce them against the service providers or to seek any remedy under them against the service providers, either directly or on behalf of the fund.
Under the Trust’s By-Laws and Declaration of Trust, any claims asserted against or on behalf of the MFS Funds, including claims against Trustees and Officers, must be brought in state and federal courts located within the Commonwealth of Massachusetts.
PROVISION OF FINANCIAL REPORTS AND SUMMARY PROSPECTUSES
The fund produces financial reports every six months and updates its summary prospectus and prospectus annually. To avoid sending duplicate copies of materials to households, only one copy of the fund’s annual and semiannual report and summary prospectus may be mailed to shareholders having the same last name and residential address on the fund’s records. However, any shareholder may contact MFSC (please see back cover for address and telephone number) to request that copies of these reports and summary prospectuses be sent personally to that shareholder.
42
Save paper with eDelivery.

| MFS® will send you prospectuses, |
reports, and proxies directly via e-mail so you will get information faster with less mailbox clutter.
To sign up:
1. Go to mfs.com.
2. Log in via MFS® Access.
3. Select eDelivery.
If you own your MFS fund shares through a financial institution or a retirement plan, MFS® TALK, MFS® Access, or eDelivery may not be available to you.
CONTACT
WEB SITE
mfs.com
MFS TALK
1-800-637-8255
24 hours a day
ACCOUNT SERVICE AND LITERATURE
Shareholders
1-800-225-2606
Financial advisors
1-800-343-2829
Retirement plan services
1-800-637-1255
MAILING ADDRESS
MFS Service Center, Inc.
P.O. Box 55824
Boston, MA 02205-5824
OVERNIGHT MAIL
MFS Service Center, Inc.
c/o DST Asset Manager Solutions, Inc.
30 Dan Road
Canton, MA 02021-2809
During the period covered by this report, the Registrant has not amended any provision in its Code of Ethics (the “Code”) that relates to an element of the Code’s definitions enumerated in paragraph (b) of Item 2 of this Form N-CSR. During the period covered by this report, the Registrant did not grant a waiver, including an implicit waiver, from any provision of the Code.
| ITEM 3. | AUDIT COMMITTEE FINANCIAL EXPERT. |
Not applicable for semi-annual reports.
| ITEM 4. | PRINCIPAL ACCOUNTANT FEES AND SERVICES. |
Not applicable for semi-annual reports.
| ITEM 5. | AUDIT COMMITTEE OF LISTED REGISTRANTS. |
Not applicable to the Registrant.
A schedule of investments for each series of the Registrant is included as part of the report to shareholders of such series under Item 1 of this Form N-CSR.
| ITEM 7. | DISCLOSURE OF PROXY VOTING POLICIES AND PROCEDURES FOR CLOSED-END MANAGEMENT INVESTMENT COMPANIES. |
Not applicable to the Registrant.
| ITEM 8. | PORTFOLIO MANAGERS OF CLOSED-END MANAGEMENT INVESTMENT COMPANIES. |
Not applicable to the Registrant.
| ITEM 9. | PURCHASES OF EQUITY SECURITIES BY CLOSED-END MANAGEMENT INVESTMENT COMPANY AND AFFILIATED PURCHASERS. |
Not applicable to the Registrant.
| ITEM 10. | SUBMISSION OF MATTERS TO A VOTE OF SECURITY HOLDERS. |
There were no material changes to the procedures by which shareholders may send recommendations to the Board for nominees to the Registrant’s Board since the Registrant last provided disclosure as to such procedures in response to the requirements of Item 407 (c)(2)(iv) of Regulation S-K or this Item.
| ITEM 11. | CONTROLS AND PROCEDURES. |
| (a) | Based upon their evaluation of the effectiveness of the registrant’s disclosure controls and procedures (as defined in Rule 30a-3(c) under the Investment Company Act of 1940 (the “Act”)) as conducted within 90 days of the filing date of this report on Form N-CSR, the registrant’s principal financial officer and principal executive officer have concluded that those disclosure controls and procedures provide reasonable assurance that the material information required to be disclosed by the registrant on this report is recorded, processed, summarized and reported within the time periods specified in the Securities and Exchange Commission’s rules and forms. |
| (b) | There were no changes in the registrant’s internal controls over financial reporting (as defined in Rule 30a-3(d) under the Act) that occurred during the second fiscal quarter of the period covered by the report that have materially affected, or are reasonably likely to materially affect, the registrant’s internal control over financial reporting. |
| ITEM 12. | DISCLOSURE OF SECURITIES LENDING ACTIVITIES FOR CLOSED-END MANAGEMENT INVESTMENT COMPANIES. |
Not applicable to the Registrant.
| (a) | File the exhibits listed below as part of this form. Letter or number the exhibits in the sequence indicated. |
| | (1) | Any code of ethics, or amendment thereto, that is the subject of the disclosure required by Item 2, to the extent that the registrant intends to satisfy the Item 2 requirements through filing of an exhibit. |
| | (2) | A separate certification for each principal executive officer and principal financial officer of the registrant as required by Rule 30a-2(a) under the Act (17 CFR 270.30a-2): Attached hereto. |
| (b) | If the report is filed under Section 13(a) or 15(d) of the Exchange Act, provide the certifications required by Rule 30a-2(b) under the Act (17 CFR 270.30a-2(b)), Rule 13a-14(b) or Rule 15d-14(b) under the Exchange Act (17 CFR 240.13a-14(b) or 240.15d-14(b)) and Section 1350 of Chapter 63 of Title 18 of the United States Code (18 U.S.C. 1350) as an exhibit. A certification furnished pursuant to this paragraph will not be deemed “filed” for the purposes of Section 18 of the Exchange Act (15 U.S.C. 78r), or otherwise subject to the liability of that section. Such certification will not be deemed to be incorporated by reference into any filing under the Securities Act of 1933 or the Exchange Act, except to the extent that the registrant specifically incorporates it by reference: Attached hereto. |
Notice
A copy of the Amended and Restated Declaration of Trust, as amended, of the Registrant is on file with the Secretary of State of The Commonwealth of Massachusetts and notice is hereby given that this instrument is executed on behalf of the Registrant by an officer of the Registrant as an officer and not individually and the obligations of or arising out of this instrument are not binding upon any of the Trustees or shareholders individually, but are binding only upon the assets and property of the respective constituent series of the Registrant.
SIGNATURES
Pursuant to the requirements of the Securities Exchange Act of 1934 and the Investment Company Act of 1940, the registrant has duly caused this report to be signed on its behalf by the undersigned, thereunto duly authorized.
(Registrant) MFS SERIES TRUST VIII
| | |
| By (Signature and Title)* | | DAVID L. DILORENZO |
| | David L. DiLorenzo, President |
Date: June 18, 2018
Pursuant to the requirements of the Securities Exchange Act of 1934 and the Investment Company Act of 1940, this report has been signed below by the following persons on behalf of the registrant and in the capacities and on the dates indicated.
| | |
| By (Signature and Title)* | | DAVID L. DILORENZO |
| | David L. DiLorenzo, President (Principal Executive Officer) |
Date: June 18, 2018
| | |
| By (Signature and Title)* | | JAMES O. YOST |
| | James O. Yost, Treasurer (Principal Financial Officer and Accounting Officer) |
Date: June 18, 2018
| * | Print name and title of each signing officer under his or her signature. |