UNITED STATES
SECURITIES AND EXCHANGE COMMISSION Washington, D.C. 20549
FORM N-CSR
CERTIFIED SHAREHOLDER REPORT OF REGISTERED MANAGEMENT INVESTMENT COMPANIES
Investment Company Act file number 811-05262
MFS SERIES TRUST VIII
(Exact name of registrant as specified in charter)
111 Huntington Avenue, Boston, Massachusetts 02199 (Address of principal executive offices) (Zip code)
Christopher R. Bohane
Massachusetts Financial Services Company
111 Huntington Avenue
Boston, Massachusetts 02199
(Name and address of agents for service)
Registrant's telephone number, including area code: (617) 954-5000
Date of fiscal year end: October 31
Date of reporting period: October 31, 2022
ITEM 1. REPORTS TO STOCKHOLDERS.
Item 1(a):
Annual Report
October 31, 2022
| 1 |
| 2 |
| 5 |
| 7 |
| 10 |
| 12 |
| 27 |
| 29 |
| 31 |
| 32 |
| 36 |
| 51 |
| 53 |
| 57 |
| 61 |
| 61 |
| 61 |
| 61 |
| 61 |
| 62 |
The report is prepared for the general information of shareholders. It is authorized for distribution to prospective investors only when preceded or accompanied by a current prospectus.
NOT FDIC INSURED • MAY LOSE VALUE • NO BANK GUARANTEE
LETTER FROM THE CHAIR AND CEO
Dear Shareholders:
Global markets have recently been buffeted by a series of crosscurrents, including rising inflation, tighter financial conditions, and evolving geopolitical tensions. Consequently, at a time when global growth faces multiple headwinds, central banks have been presented with the challenge of reining in rising prices without tipping economies into recession. The U.S. Federal Reserve has made it clear that rates must move higher and tighter policy must be sustained to restore price stability and that this will likely bring some pain to households and businesses. Against that backdrop, richly valued, interest rate–sensitive growth equities have been hit particularly hard by rising interest rates. Volatility in fixed income and currency markets has picked up, with fiscal policy missteps in the United Kingdom leading to a crisis of market confidence that ultimately resulted in the ouster of Prime Minister Liz Truss. That episode could forewarn other governments to avoid policy overreach.
There are, however, encouraging signs for the markets. China has modestly relaxed its zero-COVID policy, and cases globally, while numerous, appear to be causing fewer serious illnesses. Meanwhile, unemployment is low and global supply chain bottlenecks are easing, though lingering coronavirus restrictions in China and disruptions stemming from Russia’s invasion of Ukraine could hamper these advances. Additionally, easier Chinese monetary and regulatory policies and the record pace of corporate stock buybacks are supportive elements, albeit in an otherwise turbulent investment environment.
It is important to have a deep understanding of company fundamentals during times of market transition, and we have built our unique global research platform to do just that.
At MFS®, we put our clients’ assets to work responsibly by carefully navigating increasingly complex global capital markets. Our investment team is guided by a commitment to long-term fundamental investing. Our global investment platform — combining collective expertise, long-term discipline, and thoughtful risk management — seeks to uncover what we believe are the best, most durable investment ideas in markets around the world, enabling us to potentially create value for investors.
Respectfully,
Michael W. Roberge
Chair and Chief Executive Officer
MFS Investment Management
December 15, 2022
The opinions expressed in this letter are subject to change and may not be relied upon for investment advice. No forecasts can be guaranteed.
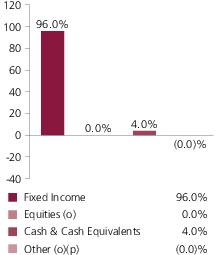
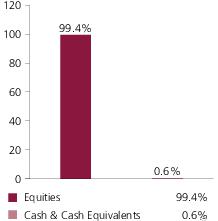
Portfolio structure at value (v)
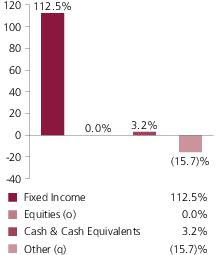
Portfolio structure reflecting equivalent exposure of derivative positions (i)
Fixed income sectors (i)
| U.S. Treasury Securities | 54.5% |
| Investment Grade Corporates | 26.8% |
| Collateralized Debt Obligations | 13.2% |
| High Yield Corporates | 7.8% |
| Emerging Markets Bonds | 4.9% |
| Commercial Mortgage-Backed Securities | 3.7% |
| Municipal Bonds | 1.2% |
| Asset-Backed Securities | 0.3% |
| Residential Mortgage-Backed Securities | 0.1% |
| Mortgage-Backed Securities (o) | 0.0% |
Composition including fixed income credit quality (a)(i)
| AAA | 1.9% |
| AA | 3.9% |
| A | 12.0% |
| BBB | 27.7% |
| BB | 8.3% |
| B | 3.1% |
| CCC | 0.8% |
| D (o) | 0.0% |
| U.S. Government | 38.8% |
| Federal Agencies (o) | 0.0% |
| Not Rated | 16.0% |
| Non-Fixed Income (o) | 0.0% |
| Cash & Cash Equivalents | 3.2% |
| Other (q) | (15.7)% |
Portfolio Composition - continued
Portfolio facts
| Average Duration (d) | 5.8 |
| Average Effective Maturity (m) | 7.7 yrs. |
| (a) | For all securities other than those specifically described below, ratings are assigned to underlying securities utilizing ratings from Moody’s, Fitch, and Standard & Poor’s rating agencies and applying the following hierarchy: If all three agencies provide a rating, the middle rating (after dropping the highest and lowest ratings) is assigned; if two of the three agencies rate a security, the lower of the two is assigned. If none of the 3 rating agencies above assign a rating, but the security is rated by DBRS Morningstar, then the DBRS Morningstar rating is assigned. If none of the 4 rating agencies listed above rate the security, but the security is rated by the Kroll Bond Rating Agency (KBRA), then the KBRA rating is assigned. Ratings are shown in the S&P and Fitch scale (e.g., AAA). Securities rated BBB or higher are considered investment grade. All ratings are subject to change. U.S. Government includes securities issued by the U.S. Department of the Treasury. Federal Agencies includes rated and unrated U.S. Agency fixed-income securities, U.S. Agency mortgage-backed securities, and collateralized mortgage obligations of U.S. Agency mortgage-backed securities. |
Not Rated includes fixed income securities and fixed income derivatives that have not been rated by any rating agency. Non-Fixed Income includes equity securities (including convertible bonds and equity derivatives), ETFs, and/or commodity-linked derivatives. The fund may or may not have held all of these instruments on this date. The fund is not rated by these agencies.
| (d) | Duration is a measure of how much a bond’s price is likely to fluctuate with general changes in interest rates, e.g., if rates rise 1.00%, a bond with a 5-year duration is likely to lose about 5.00% of its value due to the interest rate move. The Average Duration calculation reflects the impact of the equivalent exposure of derivative positions, if any. |
| (i) | For purposes of this presentation, the components include the value of securities, and reflect the impact of the equivalent exposure of derivative positions, if any. These amounts may be negative from time to time. Equivalent exposure is a calculated amount that translates the derivative position into a reasonable approximation of the amount of the underlying asset that the portfolio would have to hold at a given point in time to have the same price sensitivity that results from the portfolio’s ownership of the derivative contract. When dealing with derivatives, equivalent exposure is a more representative measure of the potential impact of a position on portfolio performance than value. The bond component will include any accrued interest amounts. |
| (m) | In determining each instrument’s effective maturity for purposes of calculating the fund’s dollar-weighted average effective maturity, MFS uses the instrument’s stated maturity or, if applicable, an earlier date on which MFS believes it is probable that a maturity-shortening device (such as a put, pre-refunding or prepayment) will cause the instrument to be repaid. Such an earlier date can be substantially shorter than the instrument’s stated maturity. |
| (p) | For purposes of the presentation of Portfolio structure at value, Other includes equivalent exposure from currency derivatives and may be negative. |
| (q) | For purposes of this presentation, Other includes equivalent exposure from currency derivatives and/or any offsets to derivative positions and may be negative. |
| (v) | For purposes of this presentation, market value of fixed income and/or equity derivatives, if any, is included in Cash & Cash Equivalents. |
Where the fund holds convertible bonds, they are treated as part of the equity portion of the portfolio.
Portfolio Composition - continued
Cash & Cash Equivalents includes any cash, investments in money market funds, short-term securities, and other assets less liabilities. Please see the Statement of Assets and Liabilities for additional information related to the fund’s cash position and other assets and liabilities.
Percentages are based on net assets as of October 31, 2022.
The portfolio is actively managed and current holdings may be different.
Management Review
Summary of Results
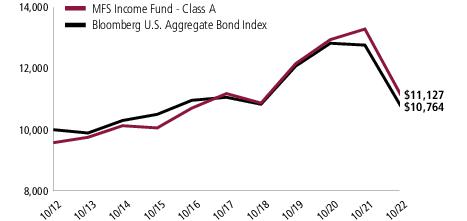
For the twelve months ended October 31, 2022, Class A shares of the MFS Income Fund (fund) provided a total return of -16.28%, at net asset value. This compares with a return of -15.68% for the fund’s benchmark, the Bloomberg U.S. Aggregate Bond Index.
Market Environment
During the reporting period, markets continued to grapple with the strongest global inflationary pressures in decades along with signs of slowing economic growth. Intermittent coronavirus flareups, particularly in China, where home-grown vaccines have proved less effective than elsewhere, kept supply chains stretched for a considerable period. At the same time, the reopening of the economy in the parts of the world where the virus has been better contained has led to a shift in consumption patterns in favor of services, straining already tight labor markets in most developed economies, while reducing demand for manufactured goods, primarily from Asia. As a result of Russia’s invasion of Ukraine, geopolitical considerations, such as sanctions and trade bans, have resulted in additional supply chain tumult and volatile global energy prices. Taken together, these factors have contributed to market volatility.
The ripple effects from the Russian invasion further complicated the mission central banks must undertake to rein in surging inflation. Energy shocks have historically resulted in global growth slowdowns, if not pullbacks, so policymakers will find themselves in the difficult position of trying to restrain inflation without tipping economies into recession. Despite the challenging macroeconomic and geopolitical environment, policymakers remained focused on corralling inflation, although investors appeared to have expected varying degrees of action from the central banks. The Fed was expected to be the most hawkish developed market central bank and the European Central Bank less so, given the growth-depleting effects on Europe's economy stemming from the invasion, while the Bank of Japan remained on the monetary sidelines, leading to a dramatic weakening of the yen.
Against an environment of still-tight labor markets, tighter global financial conditions and volatile materials prices, investor anxiety appeared to have increased over the potential that corporate profit margins may be past peak for this cycle. That said, tentative signs that supply chain bottlenecks (particularly semiconductors) may be easing, low levels of unemployment across developed markets and somewhat easier prices for non-energy raw materials were supportive factors for the macroeconomic backdrop.
Factors Affecting Performance
Relative to the Bloomberg U.S. Aggregate Bond Index, bond selection within both the industrials sector, particularly in“BBB”-rated(r) bonds, and in the financial institutions sector, detracted from the fund’s relative performance. The fund’s asset allocation decisions, most notably, its exposure to collateralized mortgage obligation (CMO) securities, for which the benchmark has no exposure, also held back relative returns. An overweight allocation to the industrials sector, and underweight allocation to the treasury sector, further weakened the fund’s relative performance.
Management Review - continued
Conversely, the fund's shorter duration(d) stance supported relative performance as interest rates rose over the reporting period. Additionally, the fund’s significant underweight allocation to agency fixed-rate mortgage-backed securities (MBS) strengthened relative results. The fund’s allocation to below investment grade corporate industrial bonds, for which the benchmark has no exposure, further supported relative returns.
Respectfully,
Portfolio Manager(s)
Neeraj Arora, Philipp Burgener, David Cole, Alexander Mackey, Joshua Marston, and Michael Skatrud
| (d) | Duration is a measure of how much a bond’s price is likely to fluctuate with general changes in interest rates, e.g., if rates rise 1.00%, a bond with a 5-year duration is likely to lose about 5.00% of its value. |
| (r) | Securities rated “BBB”, “Baa”, or higher are considered investment grade; securities rated “BB”, “Ba”, or below are considered non-investment grade. Ratings are assigned to underlying securities utilizing ratings from Moody's, Fitch, and Standard & Poor's and applying the following hierarchy: If all three agencies provide a rating, the middle rating (after dropping the highest and lowest ratings) is assigned; if two of the three agencies rate a security, the lower of the two is assigned. If none of the 3 rating agencies above assign a rating, but the security is rated by DBRS Morningstar, then the DBRS Morningstar rating is assigned. If none of the 4 rating agencies listed above rate the security, but the security is rated by the Kroll Bond Rating Agency (KBRA), then the KBRA rating is assigned. Ratings are shown in the S&P and Fitch scale (e.g., AAA). For securities that are not rated by any of the rating agencies, the security is considered Not Rated. |
The views expressed in this report are those of the portfolio manager(s) only through the end of the period of the report as stated on the cover and do not necessarily reflect the views of MFS or any other person in the MFS organization. These views are subject to change at any time based on market or other conditions, and MFS disclaims any responsibility to update such views. These views may not be relied upon as investment advice or an indication of trading intent on behalf of any MFS portfolio. References to specific securities are not recommendations of such securities, and may not be representative of any MFS portfolio’s current or future investments.
Performance Summary THROUGH 10/31/22
The following chart illustrates a representative class of the fund’s historical performance in comparison to its benchmark(s). Performance results include the deduction of the maximum applicable sales charge and reflect the percentage change in net asset value, including reinvestment of dividends and capital gains distributions. The performance of other share classes will be greater than or less than that of the class depicted below. Benchmarks are unmanaged and may not be invested in directly. Benchmark returns do not reflect sales charges, commissions or expenses. (See Notes to Performance Summary.)
Performance data shown represents past performance and is no guarantee of future results. Investment return and principal value fluctuate so your shares, when sold, may be worth more or less than the original cost; current performance may be lower or higher than quoted. The performance shown does not reflect the deduction of taxes, if any, that a shareholder would pay on fund distributions or the redemption of fund shares.
Growth of a Hypothetical $10,000 Investment
Performance Summary - continued
Total Returns through 10/31/22
Average annual without sales charge
| Share Class | Class Inception Date | 1-yr | 5-yr | 10-yr | Life (t) |
| A | 10/29/87 | (16.28)% | (0.10)% | 1.51% | N/A |
| B | 9/07/93 | (16.90)% | (0.85)% | 0.78% | N/A |
| C | 9/01/94 | (16.81)% | (0.83)% | 0.79% | N/A |
| I | 1/08/97 | (15.97)% | 0.15% | 1.76% | N/A |
| R6 | 3/02/18 | (15.87)% | N/A | N/A | 0.56% |
Comparative benchmark(s)
| | | | | |
| Bloomberg U.S. Aggregate Bond Index (f) | (15.68)% | (0.54)% | 0.74% | N/A |
Average annual with sales charge
| | | | | |
A
With Initial Sales Charge (4.25%) | (19.83)% | (0.96)% | 1.07% | N/A |
B
With CDSC (Declining over six years from 4% to 0%) (v) | (20.13)% | (1.20)% | 0.78% | N/A |
C
With CDSC (1% for 12 months) (v) | (17.62)% | (0.83)% | 0.79% | N/A |
CDSC – Contingent Deferred Sales Charge.
Class I and R6 shares do not have sales charge.
| (f) | Source: FactSet Research Systems Inc. |
| (t) | For the period from the class inception date through the stated period end (for those share classes with less than 10 years of performance history). No comparative benchmark performance information is provided for “life” periods. (See Notes to Performance Summary.) |
| (v) | Assuming redemption at the end of the applicable period. |
Benchmark Definition(s)
Bloomberg U.S. Aggregate Bond Index(a) – a market capitalization-weighted index that measures the performance of the U.S. investment-grade, fixed rate bond market, with index components for government and corporate securities, mortgage pass-through securities, and asset-backed securities with at least one year to final maturity.
It is not possible to invest directly in an index.
| (a) | Source: Bloomberg Index Services Limited. BLOOMBERG® is a trademark and service mark of Bloomberg Finance L.P. and its affiliates (collectively “Bloomberg”). Bloomberg or Bloomberg's licensors own all proprietary rights in the Bloomberg Indices. Bloomberg neither approves or endorses this material, or guarantees the accuracy or completeness of any information herein, or makes any warranty, express or implied, as to the results to be obtained therefrom and, to the maximum extent allowed by law, neither shall have any liability or responsibility for injury or damages arising in connection therewith. |
Notes to Performance Summary
Performance information prior to December 2, 2019 reflects time periods when the fund had (i) a policy permitting the fund to invest up to 100% of its assets in below investment grade quality debt instruments and (ii) a policy permitting the fund to invest
Performance Summary - continued
in equity securities as a principal investment strategy. The fund’s investment policies and strategies changed effective December 2, 2019.
Average annual total return represents the average annual change in value for each share class for the periods presented. Life returns are presented where the share class has less than 10 years of performance history and represent the average annual total return from the class inception date to the stated period end date. As the fund's share classes may have different inception dates, the life returns may represent different time periods and may not be comparable. As a result, no comparative benchmark performance information is provided for life periods.
Performance results reflect any applicable expense subsidies and waivers in effect during the periods shown. Without such subsidies and waivers the fund's performance results would be less favorable. Please see the prospectus and financial statements for complete details.
Performance results do not include adjustments made for financial reporting purposes in accordance with U.S. generally accepted accounting principles and may differ from amounts reported in the financial highlights.
From time to time the fund may receive proceeds from litigation settlements, without which performance would be lower.
Expense Table
Fund expenses borne by the shareholders during the period,
May 1, 2022 through October 31, 2022
As a shareholder of the fund, you incur two types of costs: (1) transaction costs, including sales charges (loads) on certain purchase or redemption payments, and (2) ongoing costs, including management fees; distribution and service (12b-1) fees; and other fund expenses. This example is intended to help you understand your ongoing costs (in dollars) of investing in the fund and to compare these costs with the ongoing costs of investing in other mutual funds.
The example is based on an investment of $1,000 invested at the beginning of the period and held for the entire period May 1, 2022 through October 31, 2022.
Actual Expenses
The first line for each share class in the following table provides information about actual account values and actual expenses. You may use the information in this line, together with the amount you invested, to estimate the expenses that you paid over the period. Simply divide your account value by $1,000 (for example, an $8,600 account value divided by $1,000 = 8.6), then multiply the result by the number in the first line under the heading entitled “Expenses Paid During Period” to estimate the expenses you paid on your account during this period.
Hypothetical Example for Comparison Purposes
The second line for each share class in the following table provides information about hypothetical account values and hypothetical expenses based on the fund’s actual expense ratio and an assumed rate of return of 5% per year before expenses, which is not the fund’s actual return. The hypothetical account values and expenses may not be used to estimate the actual ending account balance or expenses you paid for the period. You may use this information to compare the ongoing costs of investing in the fund and other funds. To do so, compare this 5% hypothetical example with the 5% hypothetical examples that appear in the shareholder reports of the other funds.
Please note that the expenses shown in the table are meant to highlight your ongoing costs only and do not reflect any transactional costs, such as sales charges (loads). Therefore, the second line for each share class in the table is useful in comparing ongoing costs only, and will not help you determine the relative total costs of owning different funds. In addition, if these transactional costs were included, your costs would have been higher.
Expense Table - continued
Share
Class | | Annualized
Expense
Ratio | Beginning
Account Value
5/01/22 | Ending
Account Value
10/31/22 | Expenses
Paid During
Period (p)
5/01/22-10/31/22 |
| A | Actual | 0.74% | $1,000.00 | $922.38 | $3.59 |
| Hypothetical (h) | 0.74% | $1,000.00 | $1,021.48 | $3.77 |
| B | Actual | 1.49% | $1,000.00 | $919.76 | $7.21 |
| Hypothetical (h) | 1.49% | $1,000.00 | $1,017.69 | $7.58 |
| C | Actual | 1.49% | $1,000.00 | $919.62 | $7.21 |
| Hypothetical (h) | 1.49% | $1,000.00 | $1,017.69 | $7.58 |
| I | Actual | 0.49% | $1,000.00 | $923.41 | $2.38 |
| Hypothetical (h) | 0.49% | $1,000.00 | $1,022.74 | $2.50 |
| R6 | Actual | 0.39% | $1,000.00 | $925.47 | $1.89 |
| Hypothetical (h) | 0.39% | $1,000.00 | $1,023.24 | $1.99 |
| (h) | 5% class return per year before expenses. |
| (p) | “Expenses Paid During Period” are equal to each class’s annualized expense ratio, as shown above, multiplied by the average account value over the period, multiplied by 184/365 (to reflect the one-half year period). Expenses paid do not include any applicable sales charges (loads). If these transaction costs had been included, your costs would have been higher. |
Portfolio of Investments
10/31/22
The Portfolio of Investments is a complete list of all securities owned by your fund. It is categorized by broad-based asset classes.
| Issuer | | | Shares/Par | Value ($) |
| Bonds – 96.0% |
| Aerospace & Defense – 0.9% |
| Boeing Co., 2.196%, 2/04/2026 | | $ | 2,018,000 | $1,783,296 |
| Boeing Co., 2.95%, 2/01/2030 | | | 453,000 | 362,889 |
| Boeing Co., 5.705%, 5/01/2040 | | | 1,359,000 | 1,178,972 |
| Boeing Co., 5.805%, 5/01/2050 | | | 349,000 | 300,160 |
| Moog, Inc., 4.25%, 12/15/2027 (n) | | | 2,965,000 | 2,653,260 |
| TransDigm, Inc., 6.375%, 6/15/2026 | | | 900,000 | 868,500 |
| TransDigm, Inc., 4.625%, 1/15/2029 | | | 3,000,000 | 2,554,590 |
| | | | | $9,701,667 |
| Asset-Backed & Securitized – 17.2% |
| ACREC 2021-FL1 Ltd., “D”, FLR, 6.093% (LIBOR - 1mo. + 2.65%), 10/16/2036 (n) | | $ | 2,591,000 | $2,379,235 |
| ACRES 2021-FL2 Issuer Ltd., “C”, FLR, 6.062% (LIBOR - 1mo. + 2.65%), 1/15/2037 (n) | | | 3,162,000 | 2,969,502 |
| Allegro CLO Ltd., 2014-1RA, “C”, FLR, 7.278% (LIBOR - 3mo. + 3%), 10/21/2028 (n) | | | 1,250,000 | 1,100,248 |
| Arbor Realty Trust, Inc., CLO, 2019-FL2, “D”, FLR, 5.94% (SOFR - 30 day + 2.565%), 9/15/2034 (n) | | | 4,000,000 | 3,709,552 |
| Arbor Realty Trust, Inc., CLO, 2020-FL1, “D”, FLR, 5.94% (LIBOR - 1mo. + 2.45%), 2/15/2035 (n) | | | 1,768,000 | 1,641,282 |
| Arbor Realty Trust, Inc., CLO, 2021-FL1, “C”, FLR, 5.412% (LIBOR - 1mo. + 2%), 12/15/2035 (n) | | | 4,000,000 | 3,750,260 |
| Arbor Realty Trust, Inc., CLO, 2021-FL1, “D”, FLR, 6.362% (LIBOR - 1mo. + 2.95%), 12/15/2035 (n) | | | 701,000 | 646,598 |
| Arbor Realty Trust, Inc., CLO, 2021-FL2, “B”, FLR, 5.012% (LIBOR - 1mo. + 1.6%), 5/15/2036 (n) | | | 2,596,000 | 2,420,978 |
| Arbor Realty Trust, Inc., CLO, 2021-FL2, “C”, FLR, 5.362% (LIBOR - 1mo. + 1.95%), 5/15/2036 (n) | | | 375,000 | 344,807 |
| Arbor Realty Trust, Inc., CLO, 2021-FL3, “C”, FLR, 5.262% (LIBOR - 1mo. + 1.85%), 8/15/2034 (n) | | | 3,500,000 | 3,246,429 |
| Arbor Realty Trust, Inc., CLO, 2021-FL3, “D”, FLR, 5.612% (LIBOR - 1mo. + 2.2%), 8/15/2034 (n) | | | 539,000 | 499,314 |
| Arbor Realty Trust, Inc., CLO, 2021-FL4, “D”, FLR, 6.312% (LIBOR - 1mo. + 2.9%), 11/15/2036 (n) | | | 5,743,500 | 5,299,388 |
| Arbor Realty Trust, Inc., CLO, 2022-FL1, “D”, FLR, 5.791% (SOFR - 30 day + 3%), 1/15/2037 (n) | | | 2,800,000 | 2,638,378 |
| Arbor Realty Trust, Inc., CLO, 2022-FL1, “E”, FLR, 6.541% (SOFR - 30 day + 3.75%), 1/15/2037 (n) | | | 4,500,000 | 4,275,761 |
| Arbor Realty Trust, Inc., CLO, 2022-FL2, FLR, 7.726% (SOFR - 1mo. + 4.35%), 5/15/2037 (n) | | | 8,038,000 | 7,725,846 |
Portfolio of Investments – continued
| Issuer | | | Shares/Par | Value ($) |
| Bonds – continued |
| Asset-Backed & Securitized – continued |
| AREIT 2019-CRE3 Trust, “D”, FLR, 6.14% (LIBOR - 1mo. + 2.65%), 9/14/2036 (n) | | $ | 1,729,000 | $1,602,812 |
| AREIT 2022-CRE6 Trust, “E”, FLR, 6.294% (SOFR - 30 day + 3.4%), 1/16/2037 (n) | | | 4,500,000 | 4,299,183 |
| AREIT 2022-CRE7 LLC, “B”, FLR, 6.659% (SOFR - 1mo. + 3.244%), 6/17/2039 (n) | | | 6,000,000 | 5,700,846 |
| Babson CLO Ltd., 2013-IIA, “BR”, FLR, 5.493% (LIBOR - 3mo. + 1.25%), 1/20/2028 (n) | | | 1,750,000 | 1,695,854 |
| Balboa Bay Loan Funding Ltd., 2020-1A, “CR”, FLR, 6.342% (LIBOR - 3mo. + 2.1%), 1/20/2032 (n) | | | 2,083,333 | 1,875,329 |
| Bayview Financial Revolving Mortgage Loan Trust, FLR, 5.232% (LIBOR - 1mo. + 1.6%), 12/28/2040 (n) | | | 77,842 | 93,437 |
| BBCMS Mortgage Trust, 2019-C5, “A4”, 3.063%, 11/15/2052 | | | 500,000 | 424,295 |
| BDS 2021-FL9 Ltd., “C”, FLR, 5.343% (LIBOR - 1mo. + 1.9%), 11/16/2038 (n) | | | 4,254,000 | 3,976,490 |
| BSPDF 2021-FL1 Issuer Ltd., “B”, FLR, 5.212% (LIBOR - 1mo. + 1.8%), 10/15/2036 (n) | | | 1,231,000 | 1,151,917 |
| BSPRT 2019-FL5 Issuer Ltd., “C”, FLR, 5.412% (LIBOR - 1mo. + 2%), 5/15/2029 (n) | | | 1,505,000 | 1,465,707 |
| BSPRT 2021-FL6 Issuer Ltd., “C”, FLR, 5.462% (LIBOR - 1mo. + 2.05%), 3/15/2036 (n) | | | 1,300,000 | 1,197,734 |
| BSPRT 2021-FL7 Issuer Ltd., “D”, FLR, 6.162% (LIBOR - 1mo. + 2.75%), 12/15/2038 (n) | | | 3,418,500 | 3,143,994 |
| BSPRT 2022-FL8 Issuer Ltd., “D”, FLR, 5.591% (SOFR - 30 day + 2.8%), 2/15/2037 (n) | | | 4,000,000 | 3,786,340 |
| Business Jet Securities LLC, 2020-1A, “A”, 2.981%, 11/15/2035 (n) | | | 336,882 | 307,292 |
| Business Jet Securities LLC, 2021-1A, “C”, 5.067%, 4/15/2036 (n) | | | 317,024 | 275,817 |
| BXMT 2021-FL4 Ltd., “B”, FLR, 4.962% (LIBOR - 1mo. + 1.55%), 5/15/2038 (n) | | | 2,123,000 | 1,985,233 |
| Capital Automotive, 2020-1A, “B1”, REIT, 4.17%, 2/15/2050 (n) | | | 764,773 | 698,546 |
| CHCP 2021-FL1 Ltd., “B”, FLR, 5.18% (LIBOR - 1mo. + 1.65%), 2/15/2038 (n) | | | 3,500,000 | 3,347,810 |
| CHCP 2021-FL1 Ltd., “C”, FLR, 5.63% (LIBOR - 1mo. + 2.1%), 2/15/2038 (n) | | | 549,500 | 521,786 |
| CLNC 2019-FL1 Ltd., “C”, FLR, 5.982% (LIBOR - 1mo. + 2.4%), 8/20/2035 (n) | | | 1,735,000 | 1,646,945 |
| Columbia Cent CLO 28 Ltd., “B-R”, 6.682%, 11/07/2030 (n) | | | 2,083,333 | 1,911,531 |
| Commercial Equipment Finance 2021-A, LLC, “A”, 2.05%, 2/16/2027 (n) | | | 1,478,106 | 1,420,185 |
| Commercial Mortgage Trust, 2015-PC1, “A5”, 3.902%, 7/10/2050 | | | 1,805,893 | 1,720,402 |
| Crest Ltd., CDO, 7%, (0.001% cash or 7% PIK) 1/28/2040 (a)(p) | | | 722,925 | 7 |
Portfolio of Investments – continued
| Issuer | | | Shares/Par | Value ($) |
| Bonds – continued |
| Asset-Backed & Securitized – continued |
| Cutwater 2015-1A Ltd., “BR”, FLR, 5.879% (LIBOR - 3mo. + 1.8%), 1/15/2029 (n) | | $ | 1,500,000 | $1,455,597 |
| Dryden Senior Loan Fund, 2017-49A, “CR”, CLO, FLR, 6.244% (LIBOR - 3mo. + 2.05%), 7/18/2030 (n) | | | 2,000,000 | 1,861,694 |
| DT Auto Owner Trust, 2020-1A, “C”, 2.29%, 11/17/2025 (n) | | | 438,841 | 436,217 |
| Exeter Automobile Receivables Trust, 2020-1A, 2.49%, 1/15/2025 (n) | | | 39,835 | 39,793 |
| HGI CRE CLO Ltd., 2021-FL3, “D”, FLR, 6.541% (SOFR - 30 day + 3.75%), 4/20/2037 (n) | | | 4,500,000 | 4,235,697 |
| Invitation Homes 2018-SFR1 Trust, “C”, FLR, 4.662% (LIBOR - 1mo. + 1.25%), 3/17/2037 (n) | | | 869,875 | 854,993 |
| KREF 2021-FL2 Ltd., “D”, FLR, 5.612% (LIBOR - 1mo. + 2.2%), 2/15/2039 (n) | | | 1,837,000 | 1,663,391 |
| LCCM 2021-FL2 Trust, “C”, FLR, 5.562% (LIBOR - 1mo. + 2.15%), 12/13/2038 (n) | | | 3,212,500 | 3,067,526 |
| LoanCore 2018-CRE1 Ltd., “C”, FLR, 5.962% (LIBOR - 1mo. + 2.55%), 5/15/2028 (n) | | | 1,740,000 | 1,728,460 |
| LoanCore 2018-CRE1 Ltd., “C”, FLR, 5.362% (LIBOR - 1mo. + 1.95%), 4/15/2034 (n) | | | 1,355,850 | 1,323,859 |
| LoanCore 2019-CRE2 Ltd., “D”, FLR, 5.862% (LIBOR - 1mo. + 2.45%), 5/15/2036 (n) | | | 1,291,000 | 1,269,547 |
| LoanCore 2021-CRE5 Ltd., “C”, FLR, 5.762% (LIBOR - 1mo. + 2.35%), 7/15/2036 (n) | | | 3,000,000 | 2,779,983 |
| Madison Park Funding Ltd., 2017- 23A, “CR”, FLR, 6.358% (LIBOR - 3mo. + 2%), 7/27/2031 (n) | | | 3,000,000 | 2,801,415 |
| Magnetite CLO Ltd., 2015-16A, “DR”, FLR, 6.344% (LIBOR - 3mo. + 2.15%), 1/18/2028 (n) | | | 500,000 | 461,898 |
| MF1 2020-FL4 Ltd., “B”, FLR, 6.24% (LIBOR - 1mo. + 2.75%), 11/15/2035 (n) | | | 2,250,000 | 2,158,291 |
| MF1 2021-FL5 Ltd., “C”, FLR, 5.19% (LIBOR - 1mo. + 1.7%), 7/15/2036 (n) | | | 2,250,000 | 2,087,260 |
| MF1 2021-FL5 Ltd., “D”, FLR, 5.99% (LIBOR - 1mo. + 2.5%), 7/15/2036 (n) | | | 3,000,000 | 2,791,023 |
| MF1 2021-FL6 Ltd., “C”, FLR, 5.293% (LIBOR - 1mo. + 1.85%), 7/16/2036 (n) | | | 3,357,603 | 3,109,023 |
| MF1 2022-FL10 Ltd., “B”, FLR, 7.202% (SOFR - 1mo. + 3.735%), 9/17/2037 (n) | | | 7,500,000 | 7,404,503 |
| MF1 2022-FL8 Ltd., “E”, FLR, 6.044% (SOFR - 30 day + 3.15%), 2/19/2037 (n) | | | 4,500,000 | 4,106,777 |
| MF1 2022-FL9 Ltd., “B”, FLR, 6.617% (SOFR - 1mo. + 3.15%), 6/19/2037 (n) | | | 7,000,000 | 6,883,345 |
| Neuberger Berman CLO Ltd., 2013-15A, “CR2”, FLR, 5.929% (LIBOR - 3mo. + 1.85%), 10/15/2029 (n) | | | 2,286,610 | 2,115,752 |
Portfolio of Investments – continued
| Issuer | | | Shares/Par | Value ($) |
| Bonds – continued |
| Asset-Backed & Securitized – continued |
| Neuberger Berman CLO Ltd., 2016-21A, “CR2”, 6.293%, 4/20/2034 (n) | | $ | 1,750,000 | $1,601,947 |
| Oaktree CLO 2019-1A Ltd., “CR”, FLR, 6.675% (LIBOR - 3mo. + 2.35%), 4/22/2030 (n) | | | 3,236,356 | 2,940,958 |
| Palmer Square Loan Funding 2020-1A Ltd., “B”, FLR, 4.884% (LIBOR - 3mo. + 1.9%), 2/20/2028 (n) | | | 879,778 | 849,427 |
| Palmer Square Loan Funding 2022-5A Ltd., “A1”, FLR, 4.084% (SOFR - 3mo. + 1.56%), 1/15/2031 (n) | | | 7,500,000 | 7,366,462 |
| Parallel 2015-1A Ltd., “DR”, FLR, 6.793% (LIBOR - 3mo. + 2.55%), 7/20/2027 (n) | | | 1,750,000 | 1,714,137 |
| PFP III 2021-7 Ltd., “C”, FLR, 5.062% (LIBOR - 1mo. + 1.65%), 4/14/2038 (n) | | | 431,479 | 398,548 |
| PFP III 2021-8 Ltd., “D”, FLR, 5.562% (LIBOR - 1mo. + 2.15%), 8/09/2037 (n) | | | 4,274,000 | 3,964,537 |
| Race Point CLO Ltd., 2013-8A, “CR2”, FLR, 5.034% (LIBOR - 3mo. + 2.05%), 2/20/2030 (n) | | | 1,500,000 | 1,400,204 |
| ReadyCap Commercial Mortgage Trust, 2021-FL7, “D”, FLR, 6.536% (LIBOR - 1mo. + 2.95%), 11/25/2036 (z) | | | 1,770,000 | 1,660,649 |
| Securitized Term Auto Receivable Trust, 2019-CRTA, “C”, 2.849%, 3/25/2026 (n) | | | 139,608 | 138,608 |
| Shackleton 2015-8A CLO Ltd., “CR”, FLR, 5.893% (LIBOR - 3mo. + 1.65%), 10/20/2027 (n) | | | 1,000,000 | 954,688 |
| Starwood Commercial Mortgage, 2021-FL2, “D”, 6.243%, 4/18/2038 (n) | | | 3,000,000 | 2,769,552 |
| Starwood Commercial Mortgage, 2022-FL3, “D”, FLR, 5.541% (SOFR - 30 day + 2.75%), 11/15/2038 (n) | | | 2,750,000 | 2,553,390 |
| TPG Real Estate Finance, 2021-FL4, “B”, FLR, 5.262% (LIBOR - 1mo. + 1.85%), 3/15/2038 (n) | | | 2,700,000 | 2,533,993 |
| UBS Commercial Mortgage Trust, 2017-C7, “A4”, 3.679%, 12/15/2050 | | | 1,052,000 | 956,526 |
| Voya CLO 2012-4A Ltd., “C1R3”, FLR, 7.379% (LIBOR - 3mo. + 3.3%), 10/15/2030 (n) | | | 1,737,638 | 1,518,254 |
| Wells Fargo Commercial Mortgage Trust, 2016-C34, “A4”, 3.096%, 6/15/2049 | | | 1,740,000 | 1,593,502 |
| Wells Fargo Commercial Mortgage Trust, 2017-C42, “A5”, 3.589%, 12/15/2050 | | | 3,490,000 | 3,136,409 |
| Wells Fargo Commercial Mortgage Trust, 2017-RB1, “A5”, 3.635%, 3/15/2050 | | | 1,500,000 | 1,376,574 |
| Wells Fargo Commercial Mortgage Trust, 2018-C44, 4.212%, 5/15/2051 | | | 1,500,000 | 1,386,018 |
| | | | | $182,347,497 |
Portfolio of Investments – continued
| Issuer | | | Shares/Par | Value ($) |
| Bonds – continued |
| Automotive – 0.7% |
| Hyundai Capital America, 2.1%, 9/15/2028 (n) | | $ | 2,000,000 | $1,541,684 |
| Hyundai Capital America, 6.375%, 4/08/2030 (n) | | | 2,250,000 | 2,192,563 |
| Stellantis N.V., 2.691%, 9/15/2031 (n) | | | 5,147,000 | 3,666,256 |
| | | | | $7,400,503 |
| Broadcasting – 0.9% |
| Discovery, Inc., 4.65%, 5/15/2050 | | $ | 857,000 | $562,051 |
| Magallanes, Inc., 5.141%, 3/15/2052 (n) | | | 7,295,000 | 5,093,503 |
| Prosus N.V., 3.257%, 1/19/2027 (n) | | | 1,975,000 | 1,626,198 |
| WMG Acquisition Corp., 3.875%, 7/15/2030 (n) | | | 2,700,000 | 2,307,380 |
| | | | | $9,589,132 |
| Brokerage & Asset Managers – 1.1% |
| Charles Schwab Corp., 5% to 6/01/2027, FLR (CMT - 5yr. + 3.256%) to 6/01/2170 | | $ | 3,272,000 | $2,903,900 |
| Intercontinental Exchange, Inc., 2.1%, 6/15/2030 | | | 592,000 | 473,979 |
| LPL Holdings, Inc., 4.625%, 11/15/2027 (n) | | | 5,000,000 | 4,604,855 |
| LPL Holdings, Inc., 4%, 3/15/2029 (n) | | | 1,300,000 | 1,134,627 |
| Morgan Stanley Domestic Holdings, Inc., 4.5%, 6/20/2028 | | | 1,958,000 | 1,827,894 |
| Raymond James Financial, 4.65%, 4/01/2030 | | | 1,069,000 | 994,120 |
| | | | | $11,939,375 |
| Building – 0.5% |
| ABC Supply Co., Inc., 4%, 1/15/2028 (n) | | $ | 2,700,000 | $2,382,453 |
| Standard Industries, Inc., 4.375%, 7/15/2030 (n) | | | 1,700,000 | 1,374,535 |
| Standard Industries, Inc., 3.375%, 1/15/2031 (n) | | | 2,600,000 | 1,945,320 |
| | | | | $5,702,308 |
| Business Services – 0.8% |
| Global Payments, Inc., 2.9%, 5/15/2030 | | $ | 1,080,000 | $859,437 |
| Global Payments, Inc., 2.9%, 11/15/2031 | | | 6,000,000 | 4,578,926 |
| Iron Mountain, Inc., 4.5%, 2/15/2031 (n) | | | 2,700,000 | 2,186,986 |
| RELX Capital, Inc., 3%, 5/22/2030 | | | 674,000 | 561,970 |
| | | | | $8,187,319 |
| Cable TV – 1.6% |
| CCO Holdings LLC/CCO Holdings Capital Corp., 4.5%, 8/15/2030 (n) | | $ | 3,300,000 | $2,678,148 |
| Charter Communications Operating LLC/Charter Communications Operating Capital Corp., 3.9%, 6/01/2052 | | | 1,824,000 | 1,129,497 |
| Charter Communications Operating LLC/Charter Communications Operating Capital Corp., 5.25%, 4/01/2053 | | | 5,342,000 | 4,016,642 |
| CSC Holdings LLC, 4.125%, 12/01/2030 (n) | | | 3,600,000 | 2,832,372 |
| Sirius XM Radio, Inc., 5.5%, 7/01/2029 (n) | | | 4,800,000 | 4,427,040 |
Portfolio of Investments – continued
| Issuer | | | Shares/Par | Value ($) |
| Bonds – continued |
| Cable TV – continued |
| Time Warner Cable, Inc., 4.5%, 9/15/2042 | | $ | 2,031,000 | $1,386,820 |
| | | | | $16,470,519 |
| Chemicals – 0.3% |
| Axalta Coating Systems Ltd., 3.375%, 2/15/2029 (n) | | $ | 3,600,000 | $2,958,750 |
| Computer Software – 0.4% |
| Clarivate Science Holdings Corp., 4.875%, 7/01/2029 (n) | | $ | 3,000,000 | $2,501,250 |
| Dell International LLC/EMC Corp., 5.3%, 10/01/2029 | | | 1,388,000 | 1,299,424 |
| | | | | $3,800,674 |
| Computer Software - Systems – 0.2% |
| SS&C Technologies Holdings, Inc., 5.5%, 9/30/2027 (n) | | $ | 1,965,000 | $1,827,040 |
| Conglomerates – 1.1% |
| BWX Technologies, Inc., 4.125%, 6/30/2028 (n) | | $ | 2,500,000 | $2,187,500 |
| Gates Global LLC, 6.25%, 1/15/2026 (n) | | | 3,000,000 | 2,880,000 |
| Westinghouse Air Brake Technologies Corp., 4.95%, 9/15/2028 | | | 7,534,000 | 7,008,006 |
| | | | | $12,075,506 |
| Construction – 0.2% |
| Mattamy Group Corp., 5.25%, 12/15/2027 (n) | | $ | 1,900,000 | $1,623,455 |
| Taylor Morrison Communities, Inc., 5.75%, 1/15/2028 (n) | | | 333,000 | 305,219 |
| | | | | $1,928,674 |
| Consumer Products – 0.2% |
| GSK Consumer Healthcare Capital US LLC, 3.625%, 3/24/2032 | | $ | 2,275,000 | $1,916,640 |
| Consumer Services – 0.7% |
| Expedia Group, Inc., 3.25%, 2/15/2030 | | $ | 3,950,000 | $3,183,373 |
| Match Group Holdings II LLC, 5%, 12/15/2027 (n) | | | 1,800,000 | 1,606,077 |
| Match Group Holdings II LLC, 3.625%, 10/01/2031 (n) | | | 1,700,000 | 1,295,842 |
| Meituan, 3.05%, 10/28/2030 (n) | | | 1,024,000 | 598,156 |
| Toll Road Investors Partnership II LP, Capital Appreciation, NPFG, 0%, 2/15/2026 (n) | | | 307,000 | 243,659 |
| Toll Road Investors Partnership II LP, Capital Appreciation, NPFG, 0%, 2/15/2029 (n) | | | 889,000 | 577,929 |
| Toll Road Investors Partnership II LP, Capital Appreciation, NPFG, 0%, 2/15/2031 (n) | | | 307,000 | 173,343 |
| | | | | $7,678,379 |
| Containers – 0.1% |
| Crown Americas LLC/Crown Americas Capital Corp. VI, 4.75%, 2/01/2026 | | $ | 1,500,000 | $1,435,665 |
Portfolio of Investments – continued
| Issuer | | | Shares/Par | Value ($) |
| Bonds – continued |
| Electronics – 0.7% |
| Broadcom, Inc., 4.3%, 11/15/2032 | | $ | 5,334,000 | $4,485,414 |
| Broadcom, Inc., 3.187%, 11/15/2036 (n) | | | 2,240,000 | 1,527,823 |
| NXP B.V./NXP Funding LLC/NXP USA, Inc., 3.4%, 5/01/2030 | | | 1,305,000 | 1,083,159 |
| | | | | $7,096,396 |
| Emerging Market Quasi-Sovereign – 0.9% |
| Greenko Wind Projects (Mauritius) Ltd., 5.5%, 4/06/2025 (n) | | $ | 1,977,000 | $1,683,112 |
| Huarong Finance Co. Ltd. (People’s Republic of China), 3.375%, 2/24/2030 | | | 4,145,000 | 2,507,725 |
| Ipoteka Bank (Republic of Uzbekistan), 5.5%, 11/19/2025 | | | 2,618,000 | 2,244,150 |
| Petroleos Mexicanos, 5.95%, 1/28/2031 | | | 1,810,000 | 1,304,430 |
| PT Bank Negara Indonesia (Persero) Tbk, 3.75%, 3/30/2026 | | | 2,499,000 | 2,055,740 |
| | | | | $9,795,157 |
| Emerging Market Sovereign – 0.9% |
| Dominican Republic, 4.875%, 9/23/2032 (n) | | $ | 2,295,000 | $1,768,310 |
| Hashemite Kingdom of Jordan, 7.75%, 1/15/2028 (n) | | | 2,153,000 | 2,079,152 |
| Republic of Angola, 8%, 11/26/2029 | | | 1,436,000 | 1,165,601 |
| Republic of Colombia, 5.2%, 5/15/2049 | | | 2,865,000 | 1,737,031 |
| Republic of Cote d'Ivoire, 4.875%, 1/30/2032 (n) | | EUR | 1,864,000 | 1,290,243 |
| Republic of South Africa, 5.875%, 4/20/2032 | | $ | 2,282,000 | 1,949,558 |
| | | | | $9,989,895 |
| Energy - Independent – 1.0% |
| Energean PLC, 6.5%, 4/30/2027 (n) | | $ | 1,781,000 | $1,573,478 |
| EQT Corp., 5%, 1/15/2029 | | | 5,317,000 | 4,939,284 |
| Leviathan Bond Ltd., 6.75%, 6/30/2030 (n) | | | 1,834,000 | 1,634,131 |
| Medco Laurel Tree Pte. Ltd., 6.95%, 11/12/2028 (n) | | | 3,625,000 | 2,780,471 |
| | | | | $10,927,364 |
| Energy - Integrated – 0.4% |
| Cenovus Energy, Inc., 3.75%, 2/15/2052 | | $ | 2,700,000 | $1,798,915 |
| Eni S.p.A., 4%, 9/12/2023 (n) | | | 1,342,000 | 1,317,507 |
| Eni S.p.A., 4.25%, 5/09/2029 (n) | | | 1,685,000 | 1,510,454 |
| | | | | $4,626,876 |
| Financial Institutions – 1.6% |
| AerCap Ireland Capital DAC/AerCap Global Aviation Trust, 6.5%, 7/15/2025 | | $ | 1,568,000 | $1,543,517 |
| AerCap Ireland Capital DAC/AerCap Global Aviation Trust, 3.65%, 7/21/2027 | | | 2,698,000 | 2,346,131 |
| Air Lease Corp., 2.875%, 1/15/2032 | | | 5,633,000 | 4,207,372 |
| Avolon Holdings Funding Ltd., 3.25%, 2/15/2027 (n) | | | 2,342,000 | 1,913,342 |
| Avolon Holdings Funding Ltd., 2.75%, 2/21/2028 (n) | | | 3,617,000 | 2,764,894 |
Portfolio of Investments – continued
| Issuer | | | Shares/Par | Value ($) |
| Bonds – continued |
| Financial Institutions – continued |
| Global Aircraft Leasing Co. Ltd., 6.5% (6.5% cash or 7.25% PIK), 9/15/2024 (n) | | $ | 2,624,681 | $2,082,561 |
| Shriram Transport Finance Co. Ltd., 4.4%, 3/13/2024 (n) | | | 1,692,000 | 1,575,201 |
| Sunac China Holdings Ltd., 7.5%, 2/01/2024 (a) | | | 1,057,000 | 60,861 |
| | | | | $16,493,879 |
| Food & Beverages – 1.0% |
| Anheuser-Busch InBev Worldwide, Inc., 4.439%, 10/06/2048 | | $ | 874,509 | $708,269 |
| Bacardi Ltd., 5.15%, 5/15/2038 (n) | | | 955,000 | 800,414 |
| Central America Bottling Co., 5.25%, 4/27/2029 (n) | | | 2,293,000 | 2,016,997 |
| JBS USA Lux S.A./JBS USA Finance, Inc., 5.5%, 1/15/2030 (n) | | | 1,800,000 | 1,640,805 |
| JBS USA Lux S.A./JBS USA Food Co./JBS USA Finance, Inc., 5.75%, 4/01/2033 (n) | | | 4,179,000 | 3,765,864 |
| PT Indofood CBP Sukses Makmur Tbk, 3.541%, 4/27/2032 | | | 2,536,000 | 1,842,443 |
| | | | | $10,774,792 |
| Gaming & Lodging – 0.8% |
| GLP Capital LP/GLP Financing II, Inc., 4%, 1/15/2030 | | $ | 2,062,000 | $1,700,470 |
| GLP Capital LP/GLP Financing II, Inc., 4%, 1/15/2031 | | | 400,000 | 320,743 |
| Marriott International, Inc., 4.625%, 6/15/2030 | | | 561,000 | 503,247 |
| Marriott International, Inc., 2.85%, 4/15/2031 | | | 654,000 | 508,853 |
| Marriott International, Inc., 2.75%, 10/15/2033 | | | 4,537,000 | 3,293,987 |
| Wyndham Hotels & Resorts, Inc., 4.375%, 8/15/2028 (n) | | | 2,700,000 | 2,376,864 |
| | | | | $8,704,164 |
| Insurance – 0.5% |
| Corebridge Financial, Inc., 4.35%, 4/05/2042 (n) | | $ | 473,000 | $354,570 |
| Corebridge Financial, Inc., 4.4%, 4/05/2052 (n) | | | 1,412,000 | 1,031,069 |
| Corebridge Financial, Inc., 6.875% to 12/15/2027, FLR (CMT - 5yr. + 3.846%) to 12/15/2052 (n) | | | 4,850,000 | 4,371,362 |
| | | | | $5,757,001 |
| Insurance - Property & Casualty – 1.9% |
| Alliant Holdings Intermediate LLC, 6.75%, 10/15/2027 (n) | | $ | 2,250,000 | $2,053,125 |
| Allied World Assurance Co. Holdings Ltd., 4.35%, 10/29/2025 | | | 2,170,000 | 2,056,618 |
| Aon Corp., 4.5%, 12/15/2028 | | | 2,909,000 | 2,715,879 |
| Aon Corp./Aon Global Holdings PLC, 2.6%, 12/02/2031 | | | 2,471,000 | 1,910,774 |
| Brown & Brown, Inc., 4.95%, 3/17/2052 | | | 4,125,000 | 3,134,591 |
| Fairfax Financial Holdings Ltd., 4.85%, 4/17/2028 | | | 2,201,000 | 2,024,196 |
| Fairfax Financial Holdings Ltd., 3.375%, 3/03/2031 | | | 452,000 | 354,217 |
| Fairfax Financial Holdings Ltd., 5.625%, 8/16/2032 (n) | | | 4,000,000 | 3,622,120 |
| Hub International Ltd., 5.625%, 12/01/2029 (n) | | | 2,350,000 | 2,015,102 |
| | | | | $19,886,622 |
Portfolio of Investments – continued
| Issuer | | | Shares/Par | Value ($) |
| Bonds – continued |
| Machinery & Tools – 0.6% |
| Ashtead Capital, Inc., 5.5%, 8/11/2032 (n) | | $ | 5,000,000 | $4,519,552 |
| CNH Industrial Capital LLC, 4.2%, 1/15/2024 | | | 1,076,000 | 1,057,576 |
| CNH Industrial Capital LLC, 3.85%, 11/15/2027 | | | 1,025,000 | 927,929 |
| | | | | $6,505,057 |
| Major Banks – 6.5% |
| Bank of America Corp., 4.271% to 7/23/2028, FLR (LIBOR - 3mo. + 1.31%) to 7/23/2029 | | $ | 579,000 | $525,490 |
| Bank of America Corp., 2.572% to 10/20/2031, FLR (SOFR + 1.21%) to 10/20/2032 | | | 8,268,000 | 6,237,720 |
| Bank of America Corp., 5.015% to 7/22/2032, FLR (SOFR - 1 day + 2.16%) to 7/22/2033 | | | 3,000,000 | 2,751,186 |
| Bank of America Corp., 3.846% to 3/08/2032, FLR (CMT - 1yr. + 2%) to 3/08/2037 | | | 4,785,000 | 3,833,710 |
| Bank of New York Mellon Corp., 4.7% to 9/20/2025, FLR (CMT - 5yr. + 4.358%) to 9/20/2070 | | | 1,800,000 | 1,723,500 |
| Barclays PLC, 4.375%, 1/12/2026 | | | 1,325,000 | 1,230,075 |
| Capital One Financial Corp., 3.273% to 3/01/2029, FLR (SOFR - 1 day + 1.79%) to 3/01/2030 | | | 5,000,000 | 4,103,446 |
| Deutsche Bank AG, 2.311% to 11/16/2026, FLR (SOFR - 1 day + 1.219%) to 11/16/2027 | | | 2,217,000 | 1,769,616 |
| Goldman Sachs Group, Inc., 2.65% to 10/21/2031, FLR (SOFR - 1 day + 1.264%) to 10/21/2032 | | | 6,695,000 | 5,068,617 |
| Goldman Sachs Group, Inc., 3.102% to 2/24/2032, FLR (SOFR - 1 day + 1.41%) to 2/24/2033 | | | 4,410,000 | 3,453,870 |
| HSBC Holdings PLC, 4.7% to 9/09/2031, FLR (CMT - 1yr. + 3.25%) to 9/09/2169 | | | 1,150,000 | 800,044 |
| HSBC Holdings PLC, 4% to 9/09/2026, FLR (CMT - 1yr. + 3.222%) to 9/09/2170 | | | 536,000 | 418,278 |
| JPMorgan Chase & Co., 4.851% to 7/25/2027, FLR (SOFR - 1 day + 1.99%) to 7/25/2028 | | | 4,000,000 | 3,802,679 |
| JPMorgan Chase & Co., 2.956% to 5/13/2030, FLR (SOFR - 1 day + 2.515%) to 5/13/2031 | | | 726,000 | 571,168 |
| JPMorgan Chase & Co., 2.963% to 1/25/2032, FLR (SOFR - 1 day + 1.26%) to 1/25/2033 | | | 4,000,000 | 3,124,956 |
| Morgan Stanley, 4.679% to 7/17/2025, FLR (SOFR - 1 day + 1.669%) to 7/17/2026 | | | 6,000,000 | 5,816,864 |
| Morgan Stanley, 2.511% to 10/20/2031, FLR (SOFR - 1 day + 1.2%) to 10/20/2032 | | | 7,539,000 | 5,676,030 |
| UBS Group AG, 4.703% to 8/05/2026, FLR (CMT - 1yr. + 2.05%) to 8/05/2027 (n) | | | 3,165,000 | 2,941,378 |
| UBS Group AG, 4.375% to 2/10/2031, FLR (CMT - 1yr. + 3.313%) to 8/10/2069 (n) | | | 2,746,000 | 1,907,509 |
Portfolio of Investments – continued
| Issuer | | | Shares/Par | Value ($) |
| Bonds – continued |
| Major Banks – continued |
| UBS Group Funding (Switzerland) AG, 4.253%, 3/23/2028 (n) | | $ | 1,618,000 | $1,438,992 |
| Wells Fargo & Co., 2.572% to 2/11/2030, FLR (LIBOR - 3mo. +1%) to 2/11/2031 | | | 5,515,000 | 4,394,927 |
| Wells Fargo & Co., 3.35% to 3/02/2032, FLR (SOFR - 1 day + 1.5%) to 3/02/2033 | | | 4,571,000 | 3,684,897 |
| Wells Fargo & Co., 3.9% to 3/15/2026, FLR (CMT - 1yr. + 3.453%) to 3/15/2071 | | | 4,785,000 | 4,062,465 |
| | | | | $69,337,417 |
| Medical & Health Technology & Services – 1.2% |
| DaVita, Inc., 4.625%, 6/01/2030 (n) | | $ | 2,600,000 | $2,027,025 |
| HCA Healthcare, Inc., 4.625%, 3/15/2052 (n) | | | 7,619,000 | 5,611,634 |
| ProMedica Toledo Hospital, “B”, 5.325%, 11/15/2028 | | | 1,437,000 | 949,541 |
| ProMedica Toledo Hospital, “B”, AGM, 5.75%, 11/15/2038 | | | 568,000 | 506,475 |
| Syneos Health, Inc., 3.625%, 1/15/2029 (n) | | | 3,300,000 | 2,733,014 |
| Tower Health, 4.451%, 2/01/2050 | | | 1,730,000 | 890,950 |
| | | | | $12,718,639 |
| Metals & Mining – 1.0% |
| Anglo American Capital PLC, 2.25%, 3/17/2028 (n) | | $ | 992,000 | $804,273 |
| Anglo American Capital PLC, 2.875%, 3/17/2031 (n) | | | 1,161,000 | 892,385 |
| Anglo American Capital PLC, 4.75%, 3/16/2052 (n) | | | 5,361,000 | 3,989,169 |
| Glencore Funding LLC, 2.85%, 4/27/2031 (n) | | | 2,907,000 | 2,250,326 |
| Novelis Corp., 3.25%, 11/15/2026 (n) | | | 250,000 | 218,809 |
| Novelis Corp., 3.875%, 8/15/2031 (n) | | | 2,600,000 | 2,014,246 |
| | | | | $10,169,208 |
| Midstream – 1.7% |
| Cheniere Corpus Christi Holdings LLC, 3.7%, 11/15/2029 | | $ | 2,125,000 | $1,850,756 |
| Cheniere Corpus Christi Holdings LLC, 2.742%, 12/31/2039 | | | 963,000 | 714,576 |
| Enbridge, Inc., 3.125%, 11/15/2029 | | | 1,344,000 | 1,144,335 |
| Enbridge, Inc., 2.5%, 8/01/2033 | | | 1,923,000 | 1,437,956 |
| MPLX LP, 4.5%, 4/15/2038 | | | 2,200,000 | 1,753,853 |
| MPLX LP, 4.95%, 3/14/2052 | | | 3,699,000 | 2,859,546 |
| Plains All American Pipeline LP, 3.8%, 9/15/2030 | | | 4,057,000 | 3,382,437 |
| Sabine Pass Liquefaction LLC, 4.5%, 5/15/2030 | | | 3,285,000 | 2,996,209 |
| Targa Resources Corp., 4.95%, 4/15/2052 | | | 1,864,000 | 1,398,629 |
| | | | | $17,538,297 |
| Mortgage-Backed – 0.0% | |
| Fannie Mae, 6.5%, 5/01/2031 | | $ | 8,457 | $8,720 |
| Fannie Mae, 3%, 2/25/2033 (i) | | | 231,911 | 21,678 |
| Fannie Mae, 5.5%, 9/01/2034 - 11/01/2036 | | | 26,393 | 27,033 |
| Fannie Mae, 6%, 11/01/2034 | | | 84,202 | 86,327 |
Portfolio of Investments – continued
| Issuer | | | Shares/Par | Value ($) |
| Bonds – continued |
| Mortgage-Backed – continued | |
| Fannie Mae, UMBS, 2.5%, 3/01/2050 | | $ | 51,562 | $42,725 |
| Freddie Mac, 0.901%, 4/25/2024 (i) | | | 65,582 | 695 |
| Ginnie Mae, 3%, 9/20/2047 | | | 93,488 | 82,431 |
| | | | | $269,609 |
| Municipals – 1.2% |
| Bridgeview, IL, Stadium and Redevelopment Projects, Taxable, AAC, 5.14%, 12/01/2036 | | $ | 1,205,000 | $1,038,348 |
| Escambia County, FL, Health Facilities Authority Rev., Taxable (Baptist Health Care Corp.), “B”, AGM, 3.607%, 8/15/2040 | | | 1,730,000 | 1,256,024 |
| New Jersey Economic Development Authority State Pension Funding Rev., Capital Appreciation, Taxable, “B”, AGM, 0%, 2/15/2023 | | | 2,500,000 | 2,465,740 |
| New Jersey Economic Development Authority State Pension Funding Rev., Taxable, “A”, NPFG, 7.425%, 2/15/2029 | | | 1,155,000 | 1,228,060 |
| Oklahoma Development Finance Authority, Health System Rev., Taxable (OU Medicine Project), “C”, 5.45%, 8/15/2028 | | | 3,750,000 | 3,224,779 |
| Port Beaumont, TX, Industrial Development Authority Facility Rev., Taxable (Jefferson Gulf Coast Energy Project), “B”, 4.1%, 1/01/2028 (n) | | | 2,755,000 | 2,204,625 |
| Puerto Rico Electric Power Authority Rev., “A”, 5%, 7/01/2042 (a)(d) | | | 30,000 | 22,500 |
| Puerto Rico Electric Power Authority Rev., “ZZ”, 5%, 7/01/2018 (a)(d) | | | 455,000 | 340,113 |
| Puerto Rico Sales Tax Financing Corp., Restructured Sales Tax Rev., Capital Appreciation, Taxable, “2019A-1”, 4.55%, 7/01/2040 | | | 1,326,000 | 1,033,226 |
| | | | | $12,813,415 |
| Natural Gas - Distribution – 0.4% |
| Boston Gas Co., 3.757%, 3/16/2032 (n) | | $ | 5,000,000 | $4,176,689 |
| Other Banks & Diversified Financials – 1.5% |
| Bank Hapoalim B.M., 3.255% to 1/21/2027, FLR (CMT - 5yr. + 2.155%) to 1/21/2032 (n) | | $ | 1,431,000 | $1,169,843 |
| Macquarie Group Ltd., 4.442% to 6/21/2032, FLR (SOFR - 1 day + 2.405%) to 6/21/2033 (n) | | | 8,358,000 | 6,945,919 |
| Northern Trust Corp., 6.125%, 11/02/2032 | | | 6,550,000 | 6,555,339 |
| Uzbek Industrial and Construction Bank, 5.75%, 12/02/2024 | | | 1,424,000 | 1,263,800 |
| | | | | $15,934,901 |
| Pharmaceuticals – 0.5% |
| Jazz Securities DAC, 4.375%, 1/15/2029 (n) | | $ | 3,000,000 | $2,662,500 |
| Organon Finance 1 LLC, 4.125%, 4/30/2028 (n) | | | 3,000,000 | 2,642,460 |
| | | | | $5,304,960 |
Portfolio of Investments – continued
| Issuer | | | Shares/Par | Value ($) |
| Bonds – continued |
| Printing & Publishing – 0.1% |
| Cimpress N.V., 7%, 6/15/2026 (n) | | $ | 1,000,000 | $597,500 |
| Real Estate - Office – 0.1% |
| Boston Properties Ltd. LP, REIT, 2.55%, 4/01/2032 | | $ | 1,504,000 | $1,081,501 |
| Retailers – 0.2% |
| Alimentation Couche-Tard, Inc., 2.95%, 1/25/2030 (n) | | $ | 2,180,000 | $1,779,746 |
| Specialty Stores – 0.4% |
| Genuine Parts Co., 2.75%, 2/01/2032 | | $ | 5,031,000 | $3,899,687 |
| Telecommunications - Wireless – 1.3% |
| American Tower Corp., REIT, 3.55%, 7/15/2027 | | $ | 1,237,000 | $1,105,419 |
| Cellnex Finance Co. S.A., 3.875%, 7/07/2041 (n) | | | 1,582,000 | 968,342 |
| Crown Castle, Inc., REIT, 4.15%, 7/01/2050 | | | 2,318,000 | 1,653,125 |
| CT Trust, 5.125%, 2/03/2032 (n) | | | 765,000 | 611,104 |
| Rogers Communications, Inc., 4.35%, 5/01/2049 | | | 7,277,000 | 5,342,894 |
| SBA Communications Corp., 3.875%, 2/15/2027 | | | 1,480,000 | 1,332,000 |
| SBA Communications Corp., 3.125%, 2/01/2029 | | | 1,400,000 | 1,131,522 |
| T-Mobile USA, Inc., 4.375%, 4/15/2040 | | | 1,899,000 | 1,546,412 |
| | | | | $13,690,818 |
| Tobacco – 1.5% |
| B.A.T. Capital Corp., 3.215%, 9/06/2026 | | $ | 1,869,000 | $1,661,010 |
| B.A.T. Capital Corp., 4.742%, 3/16/2032 | | | 6,749,000 | 5,658,993 |
| Imperial Brands Finance PLC, 6.125%, 7/27/2027 (n) | | | 8,569,000 | 8,269,931 |
| | | | | $15,589,934 |
| Transportation – 0.2% |
| Hidrovias International Finance S.à r.l., 4.95%, 2/08/2031 | | $ | 2,106,000 | $1,606,830 |
| Transportation - Services – 0.3% |
| Delhi International Airport Ltd., 6.45%, 6/04/2029 (n) | | $ | 2,461,000 | $2,018,020 |
| Element Fleet Management Corp., 1.6%, 4/06/2024 (n) | | | 823,000 | 774,280 |
| JSW Infrastructure Ltd., 4.95%, 1/21/2029 (n) | | | 1,249,000 | 929,023 |
| | | | | $3,721,323 |
| U.S. Treasury Obligations – 38.6% |
| U.S. Treasury Bonds, 1.375%, 11/15/2040 | | $ | 35,900,000 | $22,178,066 |
| U.S. Treasury Bonds, 1.75%, 8/15/2041 | | | 11,300,000 | 7,375,016 |
| U.S. Treasury Bonds, 2.375%, 2/15/2042 | | | 64,200,000 | 46,876,031 |
| U.S. Treasury Bonds, 2.5%, 2/15/2045 (f) | | | 7,646,000 | 5,502,432 |
| U.S. Treasury Bonds, 2.375%, 11/15/2049 | | | 9,526,900 | 6,658,038 |
| U.S. Treasury Bonds, 1.625%, 11/15/2050 | | | 8,400,000 | 4,803,750 |
| U.S. Treasury Bonds, 2.25%, 2/15/2052 | | | 29,200,000 | 19,582,250 |
| U.S. Treasury Notes, 0.375%, 10/31/2023 | | | 12,350,000 | 11,833,809 |
Portfolio of Investments – continued
| Issuer | | | Shares/Par | Value ($) |
| Bonds – continued |
| U.S. Treasury Obligations – continued |
| U.S. Treasury Notes, 2.25%, 3/31/2024 | | $ | 99,500,000 | $96,231,270 |
| U.S. Treasury Notes, 4.25%, 9/30/2024 | | | 51,800,000 | 51,536,953 |
| U.S. Treasury Notes, 0.25%, 9/30/2025 | | | 15,700,000 | 13,937,430 |
| U.S. Treasury Notes, 0.875%, 6/30/2026 | | | 88,000,000 | 77,608,437 |
| U.S. Treasury Notes, 2.5%, 3/31/2027 | | | 47,900,000 | 44,442,219 |
| | | | | $408,565,701 |
| Utilities - Electric Power – 1.9% |
| Adani Transmission Ltd., 4.25%, 5/21/2036 (n) | | $ | 2,469,250 | $1,801,728 |
| AES Gener S.A., 6.35% to 4/07/2025, FLR (CMT - 5yr. + 4.917%) to 4/07/2030, FLR (CMT - 5yr. + 5.167%) to 4/07/2045, FLR (CMT - 5yr. + 5.917%) to 10/07/2079 (n) | | | 760,000 | 617,464 |
| AES Panama Generation Holdings SRL, 4.375%, 5/31/2030 (n) | | | 1,200,000 | 944,419 |
| American Electric Power Co., Inc., 5.95%, 11/01/2032 (w) | | | 3,437,000 | 3,413,525 |
| Calpine Corp., 3.75%, 3/01/2031 (n) | | | 2,900,000 | 2,375,896 |
| FirstEnergy Corp., 5.35%, 7/15/2047 | | | 838,000 | 691,417 |
| Jersey Central Power & Light Co., 2.75%, 3/01/2032 (n) | | | 359,000 | 279,345 |
| Mercury Chile Holdco LLC, 6.5%, 1/24/2027 (n) | | | 1,793,000 | 1,479,225 |
| Pacific Gas & Electric Co., 5.45%, 6/15/2027 | | | 4,527,000 | 4,268,605 |
| Pacific Gas & Electric Co., 3%, 6/15/2028 | | | 614,000 | 505,209 |
| Pacific Gas & Electric Co., 3.5%, 8/01/2050 | | | 2,250,000 | 1,372,469 |
| ReNew Wind Energy AP2/ReNew Power Private Ltd., 4.5%, 7/14/2028 (n) | | | 2,580,000 | 1,908,745 |
| | | | | $19,658,047 |
| Utilities - Water – 0.2% |
| Aegea Finance S.à r.l., 6.75%, 5/20/2029 (n) | | $ | 2,626,000 | $2,417,233 |
| Total Bonds (Identified Cost, $1,157,560,173) | | $1,016,388,306 |
| Common Stocks – 0.0% |
| Construction – 0.0% | |
| ICA Tenedora S.A. de C.V. (u) (Identified Cost, $0) | | 36,995 | $31,743 |
| Investment Companies (h) – 3.7% |
| Money Market Funds – 3.7% | |
| MFS Institutional Money Market Portfolio, 3.02% (v) (Identified Cost, $38,543,194) | | | 38,543,970 | $38,543,970 |
|
|
| Other Assets, Less Liabilities – 0.3% | | 3,366,765 |
| Net Assets – 100.0% | $1,058,330,784 |
| (a) | Non-income producing security. |
| (d) | In default. |
| (f) | All or a portion of the security has been segregated as collateral for open futures contracts. |
Portfolio of Investments – continued
| (h) | An affiliated issuer, which may be considered one in which the fund owns 5% or more of the outstanding voting securities, or a company which is under common control. At period end, the aggregate values of the fund's investments in affiliated issuers and in unaffiliated issuers were $38,543,970 and $1,016,420,049, respectively. |
| (i) | Interest only security for which the fund receives interest on notional principal (Par amount). Par amount shown is the notional principal and does not reflect the cost of the security. |
| (n) | Securities exempt from registration under Rule 144A of the Securities Act of 1933. These securities may be sold in the ordinary course of business in transactions exempt from registration, normally to qualified institutional buyers. At period end, the aggregate value of these securities was $359,989,835, representing 34.0% of net assets. |
| (p) | Payment-in-kind (PIK) security for which interest income may be received in additional securities and/or cash. |
| (u) | The security was valued using significant unobservable inputs and is considered level 3 under the fair value hierarchy. For further information about the fund’s level 3 holdings, please see Note 2 in the Notes to Financial Statements. |
| (v) | Affiliated issuer that is available only to investment companies managed by MFS. The rate quoted for the MFS Institutional Money Market Portfolio is the annualized seven-day yield of the fund at period end. |
| (w) | When-issued security. |
| (z) | Restricted securities are not registered under the Securities Act of 1933 and are subject to legal restrictions on resale. These securities generally may be resold in transactions exempt from registration or to the public if the securities are subsequently registered. Disposal of these securities may involve time-consuming negotiations and prompt sale at an acceptable price may be difficult. The fund holds the following restricted securities: |
| Restricted Securities | Acquisition
Date | Cost | Value |
| ReadyCap Commercial Mortgage Trust, 2021-FL7, “D”, FLR, 6.536% (LIBOR - 1mo. + 2.95%), 11/25/2036 | 11/12/21 | $1,770,000 | $1,660,649 |
| % of Net assets | | | 0.2% |
| The following abbreviations are used in this report and are defined: |
| AAC | Ambac Assurance Corp. |
| AGM | Assured Guaranty Municipal |
| CDO | Collateralized Debt Obligation |
| CLO | Collateralized Loan Obligation |
| CMT | Constant Maturity Treasury |
| FLR | Floating Rate. Interest rate resets periodically based on the parenthetically disclosed reference rate plus a spread (if any). The period-end rate reported may not be the current rate. All reference rates are USD unless otherwise noted. |
| LIBOR | London Interbank Offered Rate |
| NPFG | National Public Finance Guarantee Corp. |
| REIT | Real Estate Investment Trust |
| SOFR | Secured Overnight Financing Rate |
| UMBS | Uniform Mortgage-Backed Security |
| Abbreviations indicate amounts shown in currencies other than the U.S. dollar. All amounts are stated in U.S. dollars unless otherwise indicated. A list of abbreviations is shown below: |
| EUR | Euro |
Portfolio of Investments – continued
Derivative Contracts at 10/31/22
| Forward Foreign Currency Exchange Contracts |
Currency
Purchased | Currency
Sold | Counterparty | Settlement
Date | Unrealized
Appreciation
(Depreciation) |
| Liability Derivatives |
| USD | 1,489,501 | EUR | 1,511,723 | Barclays Bank PLC | 1/20/2023 | $(14,656) |
| Futures Contracts |
| Description | Long/
Short | Currency | Contracts | Notional
Amount | Expiration
Date | Value/Unrealized
Appreciation
(Depreciation) |
| Liability Derivatives |
| Interest Rate Futures | | |
| U.S. Treasury Note 2 yr | Long | USD | 314 | $64,176,203 | December – 2022 | $(1,278,836) |
| U.S. Treasury Note 5 yr | Long | USD | 701 | 74,722,219 | December – 2022 | (3,261,130) |
| U.S. Treasury Ultra Bond | Long | USD | 149 | 19,020,781 | December – 2022 | (2,982,951) |
| U.S. Treasury Ultra Note 10 yr | Long | USD | 69 | 8,002,922 | December – 2022 | (654,110) |
| | | | | | | $(8,177,027) |
At October 31, 2022, the fund had liquid securities with an aggregate value of $2,752,661 to cover any collateral or margin obligations for certain derivative contracts.
See Notes to Financial Statements
Financial Statements
Statement of Assets and Liabilities
At 10/31/22
This statement represents your fund’s balance sheet, which details the assets and liabilities comprising the total value of the fund.
| Assets | |
| Investments in unaffiliated issuers, at value (identified cost, $1,157,560,173) | $1,016,420,049 |
| Investments in affiliated issuers, at value (identified cost, $38,543,194) | 38,543,970 |
| Cash | 11,990 |
| Receivables for | |
| Investments sold | 6,212,368 |
| Fund shares sold | 5,260,219 |
| Interest | 7,655,817 |
| Receivable from investment adviser | 115,213 |
| Total assets | $1,074,219,626 |
| Liabilities | |
| Payables for | |
| Distributions | $31,404 |
| Forward foreign currency exchange contracts | 14,656 |
| Net daily variation margin on open futures contracts | 586,004 |
| Investments purchased | 8,900,021 |
| Fund shares reacquired | 2,511,729 |
| When-issued investments purchased | 3,413,525 |
| Payable to affiliates | |
| Administrative services fee | 1,827 |
| Shareholder servicing costs | 228,147 |
| Distribution and service fees | 10,932 |
| Payable for independent Trustees' compensation | 12 |
| Accrued expenses and other liabilities | 190,585 |
| Total liabilities | $15,888,842 |
| Net assets | $1,058,330,784 |
| Net assets consist of | |
| Paid-in capital | $1,236,806,586 |
| Total distributable earnings (loss) | (178,475,802) |
| Net assets | $1,058,330,784 |
| Shares of beneficial interest outstanding | 185,928,151 |
Statement of Assets and Liabilities – continued
| | Net assets | Shares
outstanding | Net asset value
per share (a) |
| Class A | $349,678,801 | 61,371,314 | $5.70 |
| Class B | 2,004,562 | 354,220 | 5.66 |
| Class C | 10,200,521 | 1,806,845 | 5.65 |
| Class I | 439,493,836 | 77,277,973 | 5.69 |
| Class R6 | 256,953,064 | 45,117,799 | 5.70 |
| (a) | Maximum offering price per share was equal to the net asset value per share for all share classes, except for Class A, for which the maximum offering price per share was $5.95 [100 / 95.75 x $5.70]. On sales of $100,000 or more, the maximum offering price of Class A shares is reduced. A contingent deferred sales charge may be imposed on redemptions of Class A, Class B, and Class C shares. Redemption price per share was equal to the net asset value per share for Classes I and R6. |
See Notes to Financial Statements
Financial Statements
Statement of Operations
Year ended 10/31/22
This statement describes how much your fund earned in investment income and accrued in expenses. It also describes any gains and/or losses generated by fund operations.
| Net investment income (loss) | |
| Income | |
| Interest | $29,155,207 |
| Dividends from affiliated issuers | 243,223 |
| Other | 150,608 |
| Total investment income | $29,549,038 |
| Expenses | |
| Management fee | $4,412,789 |
| Distribution and service fees | 1,035,143 |
| Shareholder servicing costs | 769,594 |
| Administrative services fee | 146,388 |
| Independent Trustees' compensation | 15,502 |
| Custodian fee | 80,846 |
| Shareholder communications | 73,680 |
| Audit and tax fees | 78,959 |
| Legal fees | 3,942 |
| Miscellaneous | 279,857 |
| Total expenses | $6,896,700 |
| Fees paid indirectly | (763) |
| Reduction of expenses by investment adviser and distributor | (1,781,669) |
| Net expenses | $5,114,268 |
| Net investment income (loss) | $24,434,770 |
Statement of Operations – continued
| Realized and unrealized gain (loss) |
| Realized gain (loss) (identified cost basis) | |
| Unaffiliated issuers | $(18,383,678) |
| Affiliated issuers | 1,053 |
| Futures contracts | (10,348,577) |
| Forward foreign currency exchange contracts | 1,460,524 |
| Foreign currency | (848,256) |
| Net realized gain (loss) | $(28,118,934) |
| Change in unrealized appreciation or depreciation | |
| Unaffiliated issuers | $(148,490,579) |
| Affiliated issuers | 776 |
| Futures contracts | (8,332,020) |
| Forward foreign currency exchange contracts | (2,169) |
| Translation of assets and liabilities in foreign currencies | (2,228) |
| Net unrealized gain (loss) | $(156,826,220) |
| Net realized and unrealized gain (loss) | $(184,945,154) |
| Change in net assets from operations | $(160,510,384) |
See Notes to Financial Statements
Financial Statements
Statements of Changes in Net Assets
These statements describe the increases and/or decreases in net assets resulting from operations, any distributions, and any shareholder transactions.
| | Year ended |
| | 10/31/22 | 10/31/21 |
| Change in net assets | | |
| From operations | | |
| Net investment income (loss) | $24,434,770 | $9,874,446 |
| Net realized gain (loss) | (28,118,934) | 8,429,367 |
| Net unrealized gain (loss) | (156,826,220) | (7,197,318) |
| Change in net assets from operations | $(160,510,384) | $11,106,495 |
| Total distributions to shareholders | $(30,562,894) | $(11,984,817) |
| Change in net assets from fund share transactions | $655,076,090 | $178,788,635 |
| Total change in net assets | $464,002,812 | $177,910,313 |
| Net assets | | |
| At beginning of period | 594,327,972 | 416,417,659 |
| At end of period | $1,058,330,784 | $594,327,972 |
See Notes to Financial Statements
Financial Statements
Financial Highlights
The financial highlights table is intended to help you understand the fund's financial performance for the past 5 years (or life of a particular share class, if shorter). Certain information reflects financial results for a single fund share. The total returns in the table represent the rate that an investor would have earned (or lost) on an investment in the fund share class (assuming reinvestment of all distributions) held for the entire period.
| Class A | Year ended |
| | 10/31/22 | 10/31/21 | 10/31/20 | 10/31/19 | 10/31/18 |
| Net asset value, beginning of period | $7.05 | $7.04 | $6.80 | $6.27 | $6.64 |
| Income (loss) from investment operations |
| Net investment income (loss) (d) | $0.16 | $0.14 | $0.18 | $0.20 | $0.20 |
| Net realized and unrealized gain (loss) | (1.28) | 0.04 | 0.25 | 0.53 | (0.38) |
| Total from investment operations | $(1.12) | $0.18 | $0.43 | $0.73 | $(0.18) |
| Less distributions declared to shareholders |
| From net investment income | $(0.16) | $(0.16) | $(0.19) | $(0.20) | $(0.19) |
| From net realized gain | (0.07) | (0.01) | — | — | — |
| Total distributions declared to shareholders | $(0.23) | $(0.17) | $(0.19) | $(0.20) | $(0.19) |
| Net asset value, end of period (x) | $5.70 | $7.05 | $7.04 | $6.80 | $6.27 |
| Total return (%) (r)(s)(t)(x) | (16.28) | 2.67 | 6.46 | 11.86 | (2.77) |
Ratios (%) (to average net assets)
and Supplemental data: |
| Expenses before expense reductions (f)(h) | 0.93 | 0.95 | 0.99 | 1.09 | 1.09 |
| Expenses after expense reductions (f)(h) | 0.73 | 0.73 | 0.76 | 1.02 | 1.04 |
| Net investment income (loss) | 2.55 | 2.02 | 2.64 | 3.05 | 3.04 |
| Portfolio turnover | 55 | 64 | 95 | 103 | 66 |
| Net assets at end of period (000 omitted) | $349,679 | $329,668 | $250,293 | $210,404 | $191,061 |
See Notes to Financial Statements
Financial Highlights – continued
| Class B | Year ended |
| | 10/31/22 | 10/31/21 | 10/31/20 | 10/31/19 | 10/31/18 |
| Net asset value, beginning of period | $7.00 | $6.99 | $6.76 | $6.22 | $6.60 |
| Income (loss) from investment operations |
| Net investment income (loss) (d) | $0.11 | $0.09 | $0.13 | $0.15 | $0.15 |
| Net realized and unrealized gain (loss) | (1.27) | 0.04 | 0.24 | 0.54 | (0.39) |
| Total from investment operations | $(1.16) | $0.13 | $0.37 | $0.69 | $(0.24) |
| Less distributions declared to shareholders |
| From net investment income | $(0.11) | $(0.11) | $(0.14) | $(0.15) | $(0.14) |
| From net realized gain | (0.07) | (0.01) | — | — | — |
| Total distributions declared to shareholders | $(0.18) | $(0.12) | $(0.14) | $(0.15) | $(0.14) |
| Net asset value, end of period (x) | $5.66 | $7.00 | $6.99 | $6.76 | $6.22 |
| Total return (%) (r)(s)(t)(x) | (16.90) | 1.91 | 5.54 | 11.27 | (3.63) |
Ratios (%) (to average net assets)
and Supplemental data: |
| Expenses before expense reductions (f)(h) | 1.68 | 1.70 | 1.74 | 1.84 | 1.84 |
| Expenses after expense reductions (f)(h) | 1.48 | 1.48 | 1.51 | 1.78 | 1.80 |
| Net investment income (loss) | 1.68 | 1.30 | 1.92 | 2.31 | 2.28 |
| Portfolio turnover | 55 | 64 | 95 | 103 | 66 |
| Net assets at end of period (000 omitted) | $2,005 | $4,365 | $6,402 | $11,016 | $13,331 |
| Class C | Year ended |
| | 10/31/22 | 10/31/21 | 10/31/20 | 10/31/19 | 10/31/18 |
| Net asset value, beginning of period | $6.98 | $6.97 | $6.74 | $6.21 | $6.58 |
| Income (loss) from investment operations |
| Net investment income (loss) (d) | $0.11 | $0.09 | $0.13 | $0.15 | $0.15 |
| Net realized and unrealized gain (loss) | (1.26) | 0.04 | 0.24 | 0.53 | (0.38) |
| Total from investment operations | $(1.15) | $0.13 | $0.37 | $0.68 | $(0.23) |
| Less distributions declared to shareholders |
| From net investment income | $(0.11) | $(0.11) | $(0.14) | $(0.15) | $(0.14) |
| From net realized gain | (0.07) | (0.01) | — | — | — |
| Total distributions declared to shareholders | $(0.18) | $(0.12) | $(0.14) | $(0.15) | $(0.14) |
| Net asset value, end of period (x) | $5.65 | $6.98 | $6.97 | $6.74 | $6.21 |
| Total return (%) (r)(s)(t)(x) | (16.81) | 1.91 | 5.55 | 11.12 | (3.55) |
Ratios (%) (to average net assets)
and Supplemental data: |
| Expenses before expense reductions (f)(h) | 1.68 | 1.70 | 1.74 | 1.84 | 1.84 |
| Expenses after expense reductions (f)(h) | 1.48 | 1.48 | 1.51 | 1.78 | 1.80 |
| Net investment income (loss) | 1.74 | 1.30 | 1.90 | 2.31 | 2.26 |
| Portfolio turnover | 55 | 64 | 95 | 103 | 66 |
| Net assets at end of period (000 omitted) | $10,201 | $14,461 | $19,035 | $17,783 | $19,834 |
See Notes to Financial Statements
Financial Highlights – continued
| Class I | Year ended |
| | 10/31/22 | 10/31/21 | 10/31/20 | 10/31/19 | 10/31/18 |
| Net asset value, beginning of period | $7.03 | $7.03 | $6.79 | $6.26 | $6.63 |
| Income (loss) from investment operations |
| Net investment income (loss) (d) | $0.18 | $0.16 | $0.20 | $0.21 | $0.21 |
| Net realized and unrealized gain (loss) | (1.28) | 0.03 | 0.25 | 0.54 | (0.38) |
| Total from investment operations | $(1.10) | $0.19 | $0.45 | $0.75 | $(0.17) |
| Less distributions declared to shareholders |
| From net investment income | $(0.17) | $(0.18) | $(0.21) | $(0.22) | $(0.20) |
| From net realized gain | (0.07) | (0.01) | — | — | — |
| Total distributions declared to shareholders | $(0.24) | $(0.19) | $(0.21) | $(0.22) | $(0.20) |
| Net asset value, end of period (x) | $5.69 | $7.03 | $7.03 | $6.79 | $6.26 |
| Total return (%) (r)(s)(t)(x) | (15.97) | 2.78 | 6.73 | 12.15 | (2.54) |
Ratios (%) (to average net assets)
and Supplemental data: |
| Expenses before expense reductions (f)(h) | 0.68 | 0.70 | 0.74 | 0.84 | 0.84 |
| Expenses after expense reductions (f)(h) | 0.48 | 0.48 | 0.51 | 0.77 | 0.80 |
| Net investment income (loss) | 2.92 | 2.26 | 2.86 | 3.28 | 3.25 |
| Portfolio turnover | 55 | 64 | 95 | 103 | 66 |
| Net assets at end of period (000 omitted) | $439,494 | $159,393 | $114,592 | $50,067 | $46,277 |
| Class R6 | Year ended |
| | 10/31/22 | 10/31/21 | 10/31/20 | 10/31/19 | 10/31/18(i) |
| Net asset value, beginning of period | $7.04 | $7.04 | $6.80 | $6.27 | $6.48 |
| Income (loss) from investment operations |
| Net investment income (loss) (d) | $0.19 | $0.16 | $0.20 | $0.22 | $0.15 |
| Net realized and unrealized gain (loss) | (1.28) | 0.04 | 0.25 | 0.53 | (0.22) |
| Total from investment operations | $(1.09) | $0.20 | $0.45 | $0.75 | $(0.07) |
| Less distributions declared to shareholders |
| From net investment income | $(0.18) | $(0.19) | $(0.21) | $(0.22) | $(0.14) |
| From net realized gain | (0.07) | (0.01) | — | — | — |
| Total distributions declared to shareholders | $(0.25) | $(0.20) | $(0.21) | $(0.22) | $(0.14) |
| Net asset value, end of period (x) | $5.70 | $7.04 | $7.04 | $6.80 | $6.27 |
| Total return (%) (r)(s)(t)(x) | (15.87) | 2.87 | 6.81 | 12.22 | (1.03)(n) |
Ratios (%) (to average net assets)
and Supplemental data: |
| Expenses before expense reductions (f)(h) | 0.60 | 0.61 | 0.66 | 0.76 | 0.72(a) |
| Expenses after expense reductions (f)(h) | 0.40 | 0.40 | 0.43 | 0.70 | 0.71(a) |
| Net investment income (loss) | 2.99 | 2.28 | 2.95 | 3.37 | 3.53(a) |
| Portfolio turnover | 55 | 64 | 95 | 103 | 66 |
| Net assets at end of period (000 omitted) | $256,953 | $86,441 | $26,095 | $14,141 | $12,798 |
See Notes to Financial Statements
Financial Highlights – continued
| (a) | Annualized. |
| (d) | Per share data is based on average shares outstanding. |
| (f) | Ratios do not reflect reductions from fees paid indirectly, if applicable. See Note 2 in the Notes to Financial Statements for additional information. |
| (h) | For financial highlights through October 31, 2018, in addition to the fees and expenses which the fund bears directly, the fund indirectly bears a pro rata share of the fees and expenses of the underlying affiliated funds in which the fund invests. Accordingly, the expense ratio for the fund reflects only those fees and expenses borne directly by the fund. Because the underlying affiliated funds have varied expense and fee levels and the fund may own different proportions of the underlying affiliated funds at different times, the amount of fees and expenses incurred indirectly by the fund will vary. |
| (i) | For Class R6, the period is from the class inception, March 2, 2018, through the stated period end. |
| (n) | Not annualized. |
| (r) | Certain expenses have been reduced without which performance would have been lower. |
| (s) | From time to time the fund may receive proceeds from litigation settlements, without which performance would be lower. |
| (t) | Total returns do not include any applicable sales charges. |
| (x) | The net asset values and total returns have been calculated on net assets which include adjustments made in accordance with U.S. generally accepted accounting principles required at period end for financial reporting purposes. |
See Notes to Financial Statements
Notes to Financial Statements
(1) Business and Organization
MFS Income Fund (the fund) is a diversified series of MFS Series Trust VIII (the trust). The trust is organized as a Massachusetts business trust and is registered under the Investment Company Act of 1940, as amended, as an open-end management investment company.
The fund is an investment company and accordingly follows the investment company accounting and reporting guidance of the Financial Accounting Standards Board (FASB) Accounting Standards Codification Topic 946 Financial Services - Investment Companies.
(2) Significant Accounting Policies
General — The preparation of financial statements in conformity with U.S. generally accepted accounting principles requires management to make estimates and assumptions that affect the reported amounts of assets and liabilities, and disclosure of contingent assets and liabilities at the date of the financial statements and the reported amounts of increases and decreases in net assets from operations during the reporting period. Actual results could differ from those estimates. In the preparation of these financial statements, management has evaluated subsequent events occurring after the date of the fund’s Statement of Assets and Liabilities through the date that the financial statements were issued. The fund invests in high-yield securities rated below investment grade. Investments in below investment grade quality securities can involve a substantially greater risk of default or can already be in default, and their values can decline significantly. Below investment grade quality securities tend to be more sensitive to adverse news about the issuer, or the market or economy in general, than higher quality debt instruments. The fund invests in foreign securities. Investments in foreign securities are vulnerable to the effects of changes in the relative values of the local currency and the U.S. dollar and to the effects of changes in each country’s market, economic, industrial, political, regulatory, geopolitical, environmental, public health, and other conditions.
In June 2022, the FASB issued Accounting Standards Update 2022-03, Fair Value Measurement (Topic 820) – Fair Value Measurement of Equity Securities Subject to Contractual Sale Restrictions (“ASU 2022-03”), which affects all entities that have investments in equity securities measured at fair value that are subject to contractual sale restrictions. ASU 2022-03 clarifies that a contractual restriction on the sale of an equity security is a characteristic of the reporting entity holding the equity security rather than a characteristic of the asset and, therefore, is not considered in measuring the fair value of the equity security. The fund decided to early adopt ASU 2022-03 effective as of June 30, 2022 as the guidance in ASU 2022-03 was consistent with the fund’s existing practices for fair value measurement.
Balance Sheet Offsetting — The fund's accounting policy with respect to balance sheet offsetting is that, absent an event of default by the counterparty or a termination of the agreement, the International Swaps and Derivatives Association (ISDA) Master Agreement, or similar agreement, does not result in an offset of reported amounts of financial assets and financial liabilities in the Statement of Assets and Liabilities across transactions between the fund and the applicable counterparty. The fund's right to setoff may be restricted or prohibited by the bankruptcy or insolvency laws of the particular jurisdiction to which a specific master netting agreement counterparty is
Notes to Financial Statements - continued
subject. Balance sheet offsetting disclosures, to the extent applicable to the fund, have been included in the fund’s Significant Accounting Policies note under the captions for each of the fund’s in-scope financial instruments and transactions.
Investment Valuations — Subject to its oversight, the fund's Board of Trustees has delegated primary responsibility for determining or causing to be determined the value of the fund’s investments to MFS as the fund's adviser, pursuant to the fund’s valuation policy and procedures which have been adopted by the adviser and approved by the Board. Effective September 8, 2022, and in accordance with Rule 2a-5 under the Investment Company Act of 1940, the Board of Trustees designated the adviser as the “valuation designee” of the fund. If the adviser, as valuation designee, determines that reliable market quotations are not readily available for an investment, the investment is valued at fair value as determined in good faith by the adviser in accordance with the adviser’s fair valuation policy and procedures.
Under the fund's valuation policy and procedures, equity securities, including restricted equity securities, are generally valued at the last sale or official closing price on their primary market or exchange as provided by a third-party pricing service. Equity securities, for which there were no sales reported that day, are generally valued at the last quoted daily bid quotation on their primary market or exchange as provided by a third-party pricing service. Debt instruments and floating rate loans, including restricted debt instruments, are generally valued at an evaluated or composite bid as provided by a third-party pricing service. Short-term instruments with a maturity at issuance of 60 days or less may be valued at amortized cost, which approximates market value.
Futures contracts are generally valued at last posted settlement price on their primary exchange as provided by a third-party pricing service. Futures contracts for which there were no trades that day for a particular position are generally valued at the closing bid quotation on their primary exchange as provided by a third-party pricing service.
Forward foreign currency exchange contracts are generally valued at the mean of bid and asked prices for the time period interpolated from rates provided by a third-party pricing service for proximate time periods. Open-end investment companies are generally valued at net asset value per share. The values of foreign securities and other assets and liabilities expressed in foreign currencies are converted to U.S. dollars using the mean of bid and asked prices for rates provided by a third-party pricing service.
Under the fund’s valuation policy and procedures, market quotations are not considered to be readily available for debt instruments, floating rate loans, and many types of derivatives. These investments are generally valued at fair value based on information from third-party pricing services or otherwise determined by the adviser in accordance with the adviser’s fair valuation policy and procedures. Securities and other assets generally valued on the basis of information from a third-party pricing service may also be valued at a broker/dealer bid quotation. In determining values, third-party pricing services can utilize both transaction data and market information such as yield, quality, coupon rate, maturity, type of issue, trading characteristics, spreads and other market data. An investment may also be valued at fair value if the adviser determines that the investment’s value has been materially affected by events occurring after the close of the exchange or market on which the investment is principally traded (such as foreign exchange or market) and prior to the determination of the fund’s net asset value, or after the halt of trading of a specific security where trading does not resume prior to the close of the exchange or market on which the security is principally traded. The adviser generally relies on third-party pricing services or other information (such as the correlation with price movements of similar securities in the same or other markets;
Notes to Financial Statements - continued
the type, cost and investment characteristics of the security; the business and financial condition of the issuer; and trading and other market data) to assist in determining whether to fair value and at what value to fair value an investment. The value of an investment for purposes of calculating the fund’s net asset value can differ depending on the source and method used to determine value. When fair valuation is used, the value of an investment used to determine the fund’s net asset value may differ from quoted or published prices for the same investment. There can be no assurance that the fund could obtain the fair value assigned to an investment if it were to sell the investment at the same time at which the fund determines its net asset value per share.
Various inputs are used in determining the value of the fund's assets or liabilities. These inputs are categorized into three broad levels. In certain cases, the inputs used to measure fair value may fall into different levels of the fair value hierarchy. In such cases, an investment's level within the fair value hierarchy is based on the lowest level of input that is significant to the fair value measurement. The fund's assessment of the significance of a particular input to the fair value measurement in its entirety requires judgment, and considers factors specific to the investment. Level 1 includes unadjusted quoted prices in active markets for identical assets or liabilities. Level 2 includes other significant observable market-based inputs (including quoted prices for similar securities, interest rates, prepayment speed, and credit risk). Level 3 includes significant unobservable inputs, which may include the adviser's own assumptions in determining the fair value of investments. Other financial instruments are derivative instruments, such as futures contracts and forward foreign currency exchange contracts. The following is a summary of the levels used as of October 31, 2022 in valuing the fund's assets and liabilities:
| Financial Instruments | Level 1 | Level 2 | Level 3 | Total |
| Equity Securities: | | | | |
| Mexico | $— | $— | $31,743 | $31,743 |
| U.S. Treasury Bonds & U.S. Government Agencies & Equivalents | — | 408,565,701 | — | 408,565,701 |
| Non - U.S. Sovereign Debt | — | 19,785,052 | — | 19,785,052 |
| Municipal Bonds | — | 12,813,415 | — | 12,813,415 |
| U.S. Corporate Bonds | — | 277,606,109 | — | 277,606,109 |
| Residential Mortgage-Backed Securities | — | 1,124,602 | — | 1,124,602 |
| Commercial Mortgage-Backed Securities | — | 39,263,659 | — | 39,263,659 |
| Asset-Backed Securities (including CDOs) | — | 142,228,845 | — | 142,228,845 |
| Foreign Bonds | — | 115,000,923 | — | 115,000,923 |
| Mutual Funds | 38,543,970 | — | — | 38,543,970 |
| Total | $38,543,970 | $1,016,388,306 | $31,743 | $1,054,964,019 |
| Other Financial Instruments | | | | |
| Futures Contracts – Liabilities | $(8,177,027) | $— | $— | $(8,177,027) |
| Forward Foreign Currency Exchange Contracts – Liabilities | — | (14,656) | — | (14,656) |
Notes to Financial Statements - continued
For further information regarding security characteristics, see the Portfolio of Investments.
The following is a reconciliation of level 3 assets for which significant unobservable inputs were used to determine fair value. The table presents the activity of level 3 securities held at the beginning and the end of the period.
| | Equity
Securities |
| Balance as of 10/31/21 | $30,548 |
| Change in unrealized appreciation or depreciation | 1,195 |
| Balance as of 10/31/22 | $31,743 |
The net change in unrealized appreciation or depreciation from investments held as level 3 at October 31, 2022 is $1,195. At October 31, 2022, the fund held one level 3 security.
Foreign Currency Translation — Purchases and sales of foreign investments, income, and expenses are converted into U.S. dollars based upon currency exchange rates prevailing on the respective dates of such transactions or on the reporting date for foreign denominated receivables and payables. Gains and losses attributable to foreign currency exchange rates on sales of securities are recorded for financial statement purposes as net realized gains and losses on investments. Gains and losses attributable to foreign exchange rate movements on receivables, payables, income and expenses are recorded for financial statement purposes as foreign currency transaction gains and losses. That portion of both realized and unrealized gains and losses on investments that results from fluctuations in foreign currency exchange rates is not separately disclosed.
Derivatives — The fund uses derivatives primarily to increase or decrease exposure to a particular market or segment of the market, or security, to increase or decrease interest rate or currency exposure, or as alternatives to direct investments. Derivatives are used for hedging or non-hedging purposes. While hedging can reduce or eliminate losses, it can also reduce or eliminate gains. When the fund uses derivatives as an investment to increase market exposure, or for hedging purposes, gains and losses from derivative instruments may be substantially greater than the derivative’s original cost.
The derivative instruments used by the fund during the period were futures contracts and forward foreign currency exchange contracts. Depending on the type of derivative, a fund may exit a derivative position by entering into an offsetting transaction with a counterparty or exchange, negotiating an agreement with the derivative counterparty, or novating the position to a third party. The fund may be unable to promptly close out a futures position in instances where the daily fluctuation in the price for that type of future exceeds the daily limit set by the exchange. The fund's period end derivatives, as presented in the Portfolio of Investments and the associated Derivative Contract tables, generally are indicative of the volume of its derivative activity during the period.
Notes to Financial Statements - continued
The following table presents, by major type of derivative contract, the fair value, on a gross basis, of the asset and liability components of derivatives held by the fund at October 31, 2022 as reported in the Statement of Assets and Liabilities:
| | | Fair Value (a) | |
| Risk | Derivative Contracts | Liability Derivatives | |
| Interest Rate | Futures Contracts | $(8,177,027) | |
| Foreign Exchange | Forward Foreign Currency Exchange Contracts | (14,656) | |
| Total | | $(8,191,683) | |
| (a) | Values presented in this table for futures contracts correspond to the values reported in the Portfolio of Investments. Only the current day net variation margin for futures contracts is reported separately within the Statement of Assets and Liabilities. |
The following table presents, by major type of derivative contract, the realized gain (loss) on derivatives held by the fund for the year ended October 31, 2022 as reported in the Statement of Operations:
| Risk | Futures
Contracts | Forward Foreign
Currency
Exchange
Contracts |
| Interest Rate | $(10,348,577) | $— |
| Foreign Exchange | — | 1,460,524 |
| Total | $(10,348,577) | $1,460,524 |
The following table presents, by major type of derivative contract, the change in unrealized appreciation or depreciation on derivatives held by the fund for the year ended October 31, 2022 as reported in the Statement of Operations:
| Risk | Futures
Contracts | Forward Foreign
Currency
Exchange
Contracts |
| Interest Rate | $(8,332,020) | $— |
| Foreign Exchange | — | (2,169) |
| Total | $(8,332,020) | $(2,169) |
Derivative counterparty credit risk is managed through formal evaluation of the creditworthiness of all potential counterparties. On certain, but not all, uncleared derivatives, the fund attempts to reduce its exposure to counterparty credit risk whenever possible by entering into an ISDA Master Agreement on a bilateral basis. The ISDA Master Agreement gives each party to the agreement the right to terminate all transactions traded under such agreement if there is a specified deterioration in the credit quality of the other party. Upon an event of default or a termination of the ISDA Master Agreement, the non-defaulting party has the right to close out all transactions traded under such agreement and to net amounts owed under each agreement to one net amount payable by one party to the other. This right to close out and net payments
Notes to Financial Statements - continued
across all transactions traded under the ISDA Master Agreement could result in a reduction of the fund's credit risk to such counterparty equal to any amounts payable by the fund under the applicable transactions, if any.
Collateral and margin requirements differ by type of derivative. For cleared derivatives (e.g., futures contracts, cleared swaps, and exchange-traded options), margin requirements are set by the clearing broker and the clearing house and collateral, in the form of cash or securities, is posted by the fund directly with the clearing broker. Collateral terms are counterparty agreement specific for uncleared derivatives (e.g., forward foreign currency exchange contracts, uncleared swap agreements, and uncleared options) and collateral, in the form of cash and securities, is held in segregated accounts with the fund's custodian in connection with these agreements. For derivatives traded under an ISDA Master Agreement, which contains a credit support annex, the collateral requirements are netted across all transactions traded under such counterparty-specific agreement and an amount is posted from one party to the other to collateralize such obligations. Cash that has been segregated or delivered to cover the fund's collateral or margin obligations under derivative contracts, if any, will be reported separately in the Statement of Assets and Liabilities as restricted cash for uncleared derivatives and/or deposits with brokers for cleared derivatives. Securities pledged as collateral or margin for the same purpose, if any, are noted in the Portfolio of Investments. The fund may be required to make payments of interest on uncovered collateral or margin obligations with the broker. Any such payments are included in “Miscellaneous” expense in the Statement of Operations.
Futures Contracts — The fund entered into futures contracts which may be used to hedge against or obtain broad market exposure, interest rate exposure, currency exposure, or to manage duration. A futures contract represents a commitment for the future purchase or sale of an asset at a specified price on a specified date.
Upon entering into a futures contract, the fund is required to deposit with the broker, either in cash or securities, an initial margin in an amount equal to a specified percentage of the notional amount of the contract. Subsequent payments (variation margin) are made or received by the fund each day, depending on the daily fluctuations in the value of the contract, and are recorded for financial statement purposes as unrealized gain or loss by the fund until the contract is closed or expires at which point the gain or loss on futures contracts is realized.
The fund bears the risk of interest rates, exchange rates or securities prices moving unexpectedly, in which case, the fund may not achieve the anticipated benefits of the futures contracts and may realize a loss. While futures contracts may present less counterparty risk to the fund since the contracts are exchange traded and the exchange’s clearinghouse guarantees payments to the broker, there is still counterparty credit risk due to the insolvency of the broker. The fund’s maximum risk of loss due to counterparty credit risk is equal to the margin posted by the fund to the broker plus any gains or minus any losses on the outstanding futures contracts.
Forward Foreign Currency Exchange Contracts — The fund entered into forward foreign currency exchange contracts for the purchase or sale of a specific foreign currency at a fixed price on a future date. These contracts may be used to hedge the fund’s currency risk or for non-hedging purposes. For hedging purposes, the fund may enter into contracts to deliver or receive foreign currency that the fund will receive from or use in its normal investment activities. The fund may also use contracts to hedge against declines in the value of foreign currency denominated securities due to
Notes to Financial Statements - continued
unfavorable exchange rate movements. For non-hedging purposes, the fund may enter into contracts with the intent of changing the relative exposure of the fund’s portfolio of securities to different currencies to take advantage of anticipated exchange rate changes.
Forward foreign currency exchange contracts are adjusted by the daily exchange rate of the underlying currency and any unrealized gains or losses are recorded as a receivable or payable for forward foreign currency exchange contracts until the contract settlement date. On contract settlement date, any gain or loss on the contract is recorded as realized gains or losses on forward foreign currency exchange contracts.
Risks may arise upon entering into these contracts from unanticipated movements in the value of the contract and from the potential inability of counterparties to meet the terms of their contracts. Generally, the fund’s maximum risk due to counterparty credit risk is the unrealized gain on the contract due to the use of Continuous Linked Settlement, a multicurrency cash settlement system for the centralized settlement of foreign transactions. This risk is mitigated in cases where there is an ISDA Master Agreement between the fund and the counterparty providing for netting as described above and, where applicable, by the posting of collateral by the counterparty to the fund to cover the fund’s exposure to the counterparty under such ISDA Master Agreement.
Indemnifications — Under the fund's organizational documents, its officers and Trustees may be indemnified against certain liabilities and expenses arising out of the performance of their duties to the fund. Additionally, in the normal course of business, the fund enters into agreements with service providers that may contain indemnification clauses. The fund's maximum exposure under these agreements is unknown as this would involve future claims that may be made against the fund that have not yet occurred.
Investment Transactions and Income — Investment transactions are recorded on the trade date. Some securities may be purchased or sold on an extended settlement basis, which means that the receipt or delivery of the securities by the fund and related payments occur at a future date, usually beyond the customary settlement period.
Interest income is recorded on the accrual basis. All premium and discount is amortized or accreted for financial statement purposes in accordance with U.S. generally accepted accounting principles. Interest payments received in additional securities are recorded on the ex-interest date in an amount equal to the value of the security on such date. In determining the net gain or loss on securities sold, the cost of securities is determined on the identified cost basis. Debt obligations may be placed on non-accrual status or set to accrue at a rate of interest less than the contractual coupon when the collection of all or a portion of interest has become doubtful. Interest income for those debt obligations may be further reduced by the write-off of the related interest receivables when deemed uncollectible.
The fund may receive proceeds from litigation settlements. Any proceeds received from litigation involving portfolio holdings are reflected in the Statement of Operations in realized gain/loss if the security has been disposed of by the fund or in unrealized gain/loss if the security is still held by the fund. Any other proceeds from litigation not related to portfolio holdings are reflected as other income in the Statement of Operations.
Notes to Financial Statements - continued
The fund may purchase or sell securities on a when-issued or delayed delivery basis. In these extended settlement transactions, the receipt or delivery of the securities by the fund and related payments occur at a future date, usually beyond the normal settlement period. The price of such security and the date that the security will be settled are generally fixed at the time the transaction is negotiated. The value of the security varies with market fluctuations and for debt securities no interest accrues to the fund until settlement takes place. When the fund sells securities on a when-issued or delayed delivery basis, the fund typically owns or has the right to acquire securities equivalent in kind and amount to the securities sold. Purchase and sale commitments for when-issued or delayed delivery securities are held at carrying amount, which approximates fair value and are categorized as level 2 within the fair value hierarchy, and included in When-issued investments purchased in the Statement of Assets and Liabilities. Losses may arise due to changes in the value of the underlying securities prior to settlement date or if the counterparty does not perform under the contract’s terms, or if the issuer does not issue the securities due to political, economic or other factors. At the time that it enters into a when-issued or delayed delivery transaction, the fund is required to have sufficient cash and/or liquid securities to cover its commitments.
To mitigate the counterparty credit risk on TBA transactions, mortgage dollar rolls, and other types of forward settling mortgage-backed and asset-backed security transactions, the fund whenever possible enters into a Master Securities Forward Transaction Agreement (“MSFTA”) on a bilateral basis with each of the counterparties with whom it undertakes a significant volume of transactions. The MSFTA gives each party to the agreement the right to terminate all transactions traded under such agreement if there is a specified deterioration in the credit quality of the other party. Upon an event of default or a termination of the MSFTA, the non-defaulting party has the right to close out all transactions traded under such agreement and to net amounts owed under each transaction to one net amount payable by one party to the other. This right to close out and net payments across all transactions traded under the MSFTA could result in a reduction of the fund's credit risk to such counterparty equal to any amounts payable by the fund under the applicable transactions, if any.
For mortgage-backed and asset-backed securities traded under a MSFTA, the collateral and margining requirements are contract specific. Collateral amounts across all transactions traded under such agreement are netted and an amount is posted from one party to the other to collateralize such obligations. Cash that has been pledged to cover the fund's collateral or margin obligations under a MSFTA, if any, will be reported separately on the Statement of Assets and Liabilities as restricted cash. Securities pledged as collateral or margin for the same purpose, if any, are noted in the Portfolio of Investments.
Fees Paid Indirectly — The fund's custody fee may be reduced by a credit earned under an arrangement that measures the value of U.S. dollars deposited with the custodian by the fund. The amount of the credit, for the year ended October 31, 2022, is shown as a reduction of total expenses in the Statement of Operations.
Tax Matters and Distributions — The fund intends to qualify as a regulated investment company, as defined under Subchapter M of the Internal Revenue Code, and to distribute all of its taxable income, including realized capital gains. As a result, no provision for federal income tax is required. The fund’s federal tax returns, when filed, will remain subject to examination by the Internal Revenue Service for a three
Notes to Financial Statements - continued
year period. Management has analyzed the fund’s tax positions taken on federal and state tax returns for all open tax years and does not believe that there are any uncertain tax positions that require recognition of a tax liability. Foreign taxes, if any, have been accrued by the fund in the accompanying financial statements in accordance with the applicable foreign tax law. Foreign income taxes may be withheld by certain countries in which the fund invests. Additionally, capital gains realized by the fund on securities issued in or by certain foreign countries may be subject to capital gains tax imposed by those countries.
Distributions to shareholders are recorded on the ex-dividend date. Income and capital gain distributions are determined in accordance with income tax regulations, which may differ from U.S. generally accepted accounting principles. Certain capital accounts in the financial statements are periodically adjusted for permanent differences in order to reflect their tax character. These adjustments have no impact on net assets or net asset value per share. Temporary differences which arise from recognizing certain items of income, expense, gain or loss in different periods for financial statement and tax purposes will reverse at some time in the future.
Book/tax differences primarily relate to amortization and accretion of debt securities and derivative transactions.
The tax character of distributions declared to shareholders for the last two fiscal years is as follows:
| | Year ended
10/31/22 | Year ended
10/31/21 |
| Ordinary income (including any short-term capital gains) | $25,309,459 | $11,984,817 |
| Long-term capital gains | 5,253,435 | — |
| Total distributions | $30,562,894 | $11,984,817 |
The federal tax cost and the tax basis components of distributable earnings were as follows:
| As of 10/31/22 | |
| Cost of investments | $1,190,540,960 |
| Gross appreciation | 145,969 |
| Gross depreciation | (143,914,593) |
| Net unrealized appreciation (depreciation) | $(143,768,624) |
| Undistributed ordinary income | 4,560,144 |
| Capital loss carryforwards | (36,073,087) |
| Other temporary differences | (3,194,235) |
| Total distributable earnings (loss) | $(178,475,802) |
As of October 31, 2022, the fund had capital loss carryforwards available to offset future realized gains. These net capital losses may be carried forward indefinitely and their character is retained as short-term and/or long-term losses. Such losses are characterized as follows:
| Short-Term | $(20,548,333) |
| Long-Term | (15,524,754) |
| Total | $(36,073,087) |
Notes to Financial Statements - continued
Multiple Classes of Shares of Beneficial Interest — The fund offers multiple classes of shares, which differ in their respective distribution and service fees. The fund's income and common expenses are allocated to shareholders based on the value of settled shares outstanding of each class. The fund's realized and unrealized gain (loss) are allocated to shareholders based on the daily net assets of each class. Dividends are declared separately for each class. Differences in per share dividend rates are generally due to differences in separate class expenses. Class B and Class C shares will convert to Class A shares approximately eight years after purchase. The fund’s distributions declared to shareholders as reported in the Statements of Changes in Net Assets are presented by class as follows:
| | Year
ended
10/31/22 | | Year
ended
10/31/21 |
| Class A | $12,152,878 | | $7,019,416 |
| Class B | 89,235 | | 94,813 |
| Class C | 352,211 | | 287,765 |
| Class I | 11,025,908 | | 3,437,213 |
| Class R6 | 6,942,662 | | 1,145,610 |
| Total | $30,562,894 | | $11,984,817 |
(3) Transactions with Affiliates
Investment Adviser — The fund has an investment advisory agreement with MFS to provide overall investment management and related administrative services and facilities to the fund. The management fee is computed daily and paid monthly at the following annual rates based on the fund's average daily net assets:
| Up to $1 billion | 0.50% |
| In excess of $1 billion and up to $2.5 billion | 0.45% |
| In excess of $2.5 billion | 0.40% |
The investment adviser has agreed in writing to reduce its management fee to 0.40% of the fund’s average daily net asset annually up to $2.5 billion. This written agreement will continue until modified by the fund’s Board of Trustees, but such agreement will continue at least until February 29, 2024. For the year ended October 31, 2022, this management fee reduction amounted to $875,774, which is included in the reduction of total expenses in the Statement of Operations. MFS has also agreed in writing to reduce its management fee by a specified amount if certain MFS mutual fund assets exceed thresholds agreed to by MFS and the fund's Board of Trustees. Effective March 1, 2022, MFS has also agreed in writing to waive at least 0.01% of its management fee as part of this agreement. The agreement to waive at least 0.01% of the management fee will continue until modified by the fund's Board of Trustees, but such agreement will continue at least until February 29, 2024. For the year ended October 31, 2022, this management fee reduction amounted to $123,983, which is included in the reduction of total expenses in the Statement of Operations. The management fee incurred for the year ended October 31, 2022 was equivalent to an annual effective rate of 0.39% of the fund's average daily net assets.
The investment adviser has agreed in writing to pay a portion of the fund’s total annual operating expenses, excluding interest, taxes, extraordinary expenses, brokerage and transaction costs, certain tax reclaim recovery expenses (including contingency fees and
Notes to Financial Statements - continued
closing agreement expenses), and investment-related expenses, such that total fund operating expenses do not exceed the following rates annually of each class’s average daily net assets:
| Classes |
| A | B | C | I | R6 |
| 0.73% | 1.48% | 1.48% | 0.48% | 0.40% |
This written agreement will continue until modified by the fund’s Board of Trustees, but such agreement will continue at least until February 29, 2024. For the year ended October 31, 2022, this reduction amounted to $781,122, which is included in the reduction of total expenses in the Statement of Operations.
Distributor — MFS Fund Distributors, Inc. (MFD), a wholly-owned subsidiary of MFS, as distributor, received $21,846 for the year ended October 31, 2022, as its portion of the initial sales charge on sales of Class A shares of the fund.
The Board of Trustees has adopted a distribution plan for certain share classes pursuant to Rule 12b-1 of the Investment Company Act of 1940.
The fund's distribution plan provides that the fund will pay MFD for services provided by MFD and financial intermediaries in connection with the distribution and servicing of certain share classes. One component of the plan is a distribution fee paid to MFD and another component of the plan is a service fee paid to MFD. MFD may subsequently pay all, or a portion, of the distribution and/or service fees to financial intermediaries.
Distribution Plan Fee Table:
| | Distribution
Fee Rate (d) | Service
Fee Rate (d) | Total
Distribution
Plan (d) | Annual
Effective
Rate (e) | Distribution
and Service
Fee |
| Class A | — | 0.25% | 0.25% | 0.25% | $ 880,283 |
| Class B | 0.75% | 0.25% | 1.00% | 1.00% | 30,055 |
| Class C | 0.75% | 0.25% | 1.00% | 1.00% | 124,805 |
| Total Distribution and Service Fees | | | | | $1,035,143 |
| (d) | In accordance with the distribution plan for certain classes, the fund pays distribution and/or service fees equal to these annual percentage rates of each class’s average daily net assets. The distribution and service fee rates disclosed by class represent the current rates in effect at the end of the reporting period. Any rate changes, if applicable, are detailed below. |
| (e) | The annual effective rates represent actual fees incurred under the distribution plan for the year ended October 31, 2022 based on each class's average daily net assets. MFD has voluntarily agreed to rebate a portion of each class's 0.25% service fee attributable to accounts for which there is no financial intermediary specified on the account except for accounts attributable to MFS or its affiliates' seed money. For the year ended October 31, 2022, this rebate amounted to $790 for Class A shares and is included in the reduction of total expenses in the Statement of Operations. |
Certain Class A shares are subject to a contingent deferred sales charge (CDSC) in the event of a shareholder redemption within 18 months of purchase. Class B shares are subject to a CDSC in the event of a shareholder redemption within six years of
Notes to Financial Statements - continued
purchase. Class C shares are subject to a CDSC in the event of a shareholder redemption within 12 months of purchase. All contingent deferred sales charges are paid to MFD and during the year ended October 31, 2022, were as follows:
| | Amount |
| Class A | $29,781 |
| Class B | 4,448 |
| Class C | 3,810 |
Shareholder Servicing Agent — MFS Service Center, Inc. (MFSC), a wholly-owned subsidiary of MFS, receives a fee from the fund for its services as shareholder servicing agent calculated as a percentage of the average daily net assets of the fund as determined periodically under the supervision of the fund's Board of Trustees. For the year ended October 31, 2022, the fee was $144,244, which equated to 0.0163% annually of the fund's average daily net assets. MFSC also receives reimbursement from the fund for out-of-pocket expenses, sub-accounting and other shareholder servicing costs which may be paid to affiliated and unaffiliated service providers. Class R6 shares do not incur sub-accounting fees. For the year ended October 31, 2022, these out-of-pocket expenses, sub-accounting and other shareholder servicing costs amounted to $625,350.
Administrator — MFS provides certain financial, legal, shareholder communications, compliance, and other administrative services to the fund. Under an administrative services agreement, the fund reimburses MFS the costs incurred to provide these services. The fund is charged an annual fixed amount of $17,500 plus a fee based on average daily net assets. The administrative services fee incurred for the year ended October 31, 2022 was equivalent to an annual effective rate of 0.0166% of the fund's average daily net assets.
Trustees’ and Officers’ Compensation — The fund pays compensation to independent Trustees in the form of a retainer, attendance fees, and additional compensation to Board and Committee chairpersons. The fund does not pay compensation directly to Trustees or officers of the fund who are also officers of the investment adviser, all of whom receive remuneration from MFS for their services to the fund. Certain officers and Trustees of the fund are officers or directors of MFS, MFD, and MFSC.
Other — The fund invests in the MFS Institutional Money Market Portfolio which is managed by MFS and seeks current income consistent with preservation of capital and liquidity. This money market fund does not pay a management fee to MFS but does incur investment and operating costs.
On August 3, 2022, MFS redeemed 34 shares of Class R6 for an aggregate amount of $211.
(4) Portfolio Securities
For the year ended October 31, 2022, purchases and sales of investments, other than short-term obligations, were as follows:
| | Purchases | Sales |
| U.S. Government securities | $640,034,114 | $337,914,933 |
| Non-U.S. Government securities | 446,583,735 | 132,948,211 |
Notes to Financial Statements - continued
(5) Shares of Beneficial Interest
The fund's Declaration of Trust permits the Trustees to issue an unlimited number of full and fractional shares of beneficial interest. Transactions in fund shares were as follows:
| | Year ended
10/31/22 | | Year ended
10/31/21 |
| | Shares | Amount | | Shares | Amount |
| Shares sold | | | | | |
| Class A | 25,801,280 | $166,081,925 | | 16,931,075 | $120,018,762 |
| Class B | 28,547 | 181,009 | | 97,969 | 691,741 |
| Class C | 485,282 | 3,099,644 | | 507,042 | 3,565,791 |
| Class I | 88,037,884 | 560,940,244 | | 15,858,131 | 112,395,035 |
| Class R6 | 42,237,750 | 272,061,000 | | 9,639,930 | 68,241,651 |
| | 156,590,743 | $1,002,363,822 | | 43,034,147 | $304,912,980 |
Shares issued to shareholders
in reinvestment of distributions | | | | | |
| Class A | 1,840,707 | $11,848,014 | | 952,064 | $6,758,338 |
| Class B | 13,128 | 85,953 | | 12,815 | 90,461 |
| Class C | 54,363 | 351,725 | | 40,594 | 285,791 |
| Class I | 1,743,850 | 10,927,238 | | 466,802 | 3,306,346 |
| Class R6 | 1,102,754 | 6,923,945 | | 161,017 | 1,141,595 |
| | 4,754,802 | $30,136,875 | | 1,633,292 | $11,582,531 |
| Shares reacquired | | | | | |
| Class A | (13,060,725) | $(82,828,010) | | (6,654,552) | $(47,185,184) |
| Class B | (311,278) | (1,999,755) | | (403,026) | (2,841,010) |
| Class C | (804,219) | (5,087,016) | | (1,205,705) | (8,494,252) |
| Class I | (35,164,107) | (222,324,945) | | (9,971,490) | (70,431,599) |
| Class R6 | (10,494,765) | (65,184,881) | | (1,236,935) | (8,754,831) |
| | (59,835,094) | $(377,424,607) | | (19,471,708) | $(137,706,876) |
| Net change | | | | | |
| Class A | 14,581,262 | $95,101,929 | | 11,228,587 | $79,591,916 |
| Class B | (269,603) | (1,732,793) | | (292,242) | (2,058,808) |
| Class C | (264,574) | (1,635,647) | | (658,069) | (4,642,670) |
| Class I | 54,617,627 | 349,542,537 | | 6,353,443 | 45,269,782 |
| Class R6 | 32,845,739 | 213,800,064 | | 8,564,012 | 60,628,415 |
| | 101,510,451 | $655,076,090 | | 25,195,731 | $178,788,635 |
Effective June 1, 2019, purchases of the fund’s Class B shares were closed to new and existing investors subject to certain exceptions.
(6) Line of Credit
The fund and certain other funds managed by MFS participate in a $1.45 billion unsecured committed line of credit of which $1.2 billion is reserved for use by the fund and certain other MFS U.S. funds. The line of credit is provided by a syndicate of banks
Notes to Financial Statements - continued
under a credit agreement. Borrowings may be made for temporary financing needs. Interest is charged to each fund, based on its borrowings, generally at a rate equal to the highest of 1) Daily Simple SOFR (Secured Overnight Financing Rate) plus 0.10%, 2) the Federal Funds Effective Rate, or 3) the Overnight Bank Funding Rate, each plus an agreed upon spread. A commitment fee, based on the average daily unused portion of the committed line of credit, is allocated among the participating funds. The line of credit expires on March 16, 2023 unless extended or renewed. In addition, the fund and other funds managed by MFS have established unsecured uncommitted borrowing arrangements with certain banks for temporary financing needs. Interest is charged to each fund, based on its borrowings, at rates equal to customary reference rates plus an agreed upon spread. For the year ended October 31, 2022, the fund’s commitment fee and interest expense were $3,557 and $0, respectively, and are included in “Miscellaneous” expense in the Statement of Operations.
(7) Investments in Affiliated Issuers
An affiliated issuer may be considered one in which the fund owns 5% or more of the outstanding voting securities, or a company which is under common control. For the purposes of this report, the following were affiliated issuers:
| Affiliated Issuers | Beginning
Value | Purchases | Sales
Proceeds | Realized
Gain
(Loss) | Change in
Unrealized
Appreciation or
Depreciation | Ending
Value |
| MFS Institutional Money Market Portfolio | $20,877,994 | $853,824,237 | $836,160,090 | $1,053 | $776 | $38,543,970 |
| Affiliated Issuers | Dividend
Income | Capital Gain
Distributions |
| MFS Institutional Money Market Portfolio | $243,223 | $— |
(8) LIBOR Transition
Certain of the fund's investments, including investments in certain debt instruments and derivatives (if any), as well as borrowings by the fund and certain other contractual arrangements of the fund, may be based on the London Interbank Offered Rate (“LIBOR”). In 2017, the regulatory authority that oversees financial services firms in the United Kingdom announced plans to transition away from LIBOR by the end of 2021. In March 2021, the administrator of LIBOR announced the extension of the publication of the more commonly used U.S. dollar LIBOR settings to the end of June 2023. Although the full impacts of the transition away from LIBOR are not fully known, the transition may result in, among other things, an increase in volatility or illiquidity of the markets for instruments that currently rely on LIBOR to determine interest rates and this could have an adverse impact on the fund's performance. With respect to the fund's accounting for investments, including investments in certain debt instruments and derivatives, as well as borrowings by the fund and any other contractual arrangements of the fund that undergo reference rate-related modifications as a result of the transition, management will rely upon the relief provided by FASB Codification Topic 848 – Reference Rate Reform (Topic 848). The guidance in Topic 848 permits the fund
Notes to Financial Statements - continued
to account for those modified contracts as a continuation of the existing contracts. Management is still evaluating the impact to the fund of the June 30, 2023 planned discontinuation of the more commonly used U.S. dollar LIBOR settings.
(9) Russia and Ukraine Conflict
The market disruptions, which began in late February 2022, associated with geopolitical events related to the conflict between Russia and Ukraine may adversely affect the value of the fund’s assets and thus the fund’s performance. Management continues to monitor these events and to evaluate the related impacts, if any, to the fund.
Report of Independent Registered Public Accounting Firm
To the Shareholders of MFS Income Fund and the Board of Trustees of MFS Series Trust VIII
Opinion on the Financial Statements
We have audited the accompanying statement of assets and liabilities of MFS Income Fund (the “Fund”) (one of the funds constituting MFS Series Trust VIII (the “Trust”)), including the portfolio of investments, as of October 31, 2022, and the related statement of operations for the year then ended, the statements of changes in net assets for each of the two years in the period then ended, the financial highlights for each of the five years in the period then ended and the related notes (collectively referred to as the “financial statements”). In our opinion, the financial statements present fairly, in all material respects, the financial position of the Fund (one of the funds constituting MFS Series Trust VIII) at October 31, 2022, the results of its operations for the year then ended, the changes in its net assets for each of the two years in the period then ended and its financial highlights for each of the five years in the period then ended, in conformity with U.S. generally accepted accounting principles.
Basis for Opinion
These financial statements are the responsibility of the Trust’s management. Our responsibility is to express an opinion on the Fund’s financial statements based on our audits. We are a public accounting firm registered with the Public Company Accounting Oversight Board (United States) (“PCAOB”) and are required to be independent with respect to the Trust in accordance with the U.S. federal securities laws and the applicable rules and regulations of the Securities and Exchange Commission and the PCAOB.
We conducted our audits in accordance with the standards of the PCAOB. Those standards require that we plan and perform the audit to obtain reasonable assurance about whether the financial statements are free of material misstatement, whether due to error or fraud. The Trust is not required to have, nor were we engaged to perform, an audit of the Trust’s internal control over financial reporting. As part of our audits, we are required to obtain an understanding of internal control over financial reporting but not for the purpose of expressing an opinion on the effectiveness of the Trust’s internal control over financial reporting. Accordingly, we express no such opinion.
Report of Independent Registered Public Accounting Firm – continued
Our audits included performing procedures to assess the risks of material misstatement of the financial statements, whether due to error or fraud, and performing procedures that respond to those risks. Such procedures included examining, on a test basis, evidence regarding the amounts and disclosures in the financial statements. Our procedures included confirmation of securities owned as of October 31, 2022, by correspondence with the custodian, brokers and others; when replies were not received from brokers and others, we performed other auditing procedures. Our audits also included evaluating the accounting principles used and significant estimates made by management, as well as evaluating the overall presentation of the financial statements. We believe that our audits provide a reasonable basis for our opinion.
We have served as the auditor of one or more MFS investment companies since 1993.
Boston, Massachusetts
December 15, 2022
Trustees and Officers — Identification and Background
The Trustees and Officers of the Trust, as of December 1, 2022, are listed below, together with their principal occupations during the past five years. (Their titles may have varied during that period.) The address of each Trustee and Officer is 111 Huntington Avenue, Boston, Massachusetts 02199-7618.
| Name, Age | | Position(s) Held with Fund | | Trustee/Officer Since(h) | | Number of MFS Funds overseen by the Trustee | | Principal Occupations During
the Past Five Years | | Other Directorships During
the Past Five Years (j) |
| INTERESTED TRUSTEES | | | | | | | | | | |
Michael W. Roberge (k)
(age 56) | | Trustee | | January 2021 | | 136 | | Massachusetts Financial Services Company, Chairman (since January 2021); Chief Executive Officer (since January 2017); Director; Chairman of the Board (since January 2022); President (until December 2018); Chief Investment Officer (until December 2018) | | N/A |
| INDEPENDENT TRUSTEES | | | | | | | | | | |
John P. Kavanaugh
(age 68) | | Trustee and Chair of Trustees | | January 2009 | | 136 | | Private investor | | N/A |
Steven E. Buller
(age 71) | | Trustee | | February 2014 | | 136 | | Private investor | | N/A |
John A. Caroselli
(age 68) | | Trustee | | March 2017 | | 136 | | Private investor; JC Global Advisors, LLC (management consulting), President (since 2015) | | N/A |
Maureen R. Goldfarb
(age 67) | | Trustee | | January 2009 | | 136 | | Private investor | | N/A |
Peter D. Jones
(age 67) | | Trustee | | January 2019 | | 136 | | Private investor | | N/A |
James W. Kilman, Jr.
(age 61) | | Trustee | | January 2019 | | 136 | | Burford Capital Limited (finance and investment management), Senior Advisor (since May 3, 2021), Chief Financial Officer (2019 - May 2, 2021); KielStrand Capital LLC (family office), Chief Executive Officer (since 2016) | | Alpha-En Corporation, Director (2016-2019) |
Trustees and Officers - continued
| Name, Age | | Position(s) Held with Fund | | Trustee/Officer Since(h) | | Number of MFS Funds overseen by the Trustee | | Principal Occupations During
the Past Five Years | | Other Directorships During
the Past Five Years (j) |
Clarence Otis, Jr.
(age 66) | | Trustee | | March 2017 | | 136 | | Private investor | | VF Corporation, Director; Verizon Communications, Inc., Director; The Travelers Companies, Director |
Maryanne L. Roepke
(age 66) | | Trustee | | May 2014 | | 136 | | Private investor | | N/A |
Laurie J. Thomsen
(age 65) | | Trustee | | March 2005 | | 136 | | Private investor | | The Travelers Companies, Director; Dycom Industries, Inc., Director |
| Name, Age | | Position(s) Held with
Fund | | Trustee/Officer Since(h) | | Number of MFS Funds for which the Person is an Officer | | Principal Occupations During
the Past Five Years |
| OFFICERS | | | | | | | | |
Christopher R. Bohane (k)
(age 48) | | Assistant Secretary and Assistant Clerk | | July 2005 | | 136 | | Massachusetts Financial Services Company, Senior Vice President and Senior Managing Counsel |
Kino Clark (k)
(age 54) | | Assistant Treasurer | | January 2012 | | 136 | | Massachusetts Financial Services Company, Vice President |
John W. Clark, Jr. (k)
(age 55) | | Assistant Treasurer | | April 2017 | | 136 | | Massachusetts Financial Services Company, Vice President |
David L. DiLorenzo (k)
(age 54) | | President | | July 2005 | | 136 | | Massachusetts Financial Services Company, Senior Vice President |
Heidi W. Hardin (k)
(age 55) | | Secretary and Clerk | | April 2017 | | 136 | | Massachusetts Financial Services Company, Executive Vice President and General Counsel |
Brian E. Langenfeld (k)
(age 49) | | Assistant Secretary and Assistant Clerk | | June 2006 | | 136 | | Massachusetts Financial Services Company, Vice President and Managing Counsel |
Trustees and Officers - continued
| Name, Age | | Position(s) Held with
Fund | | Trustee/Officer Since(h) | | Number of MFS Funds for which the Person is an Officer | | Principal Occupations During
the Past Five Years |
Rosa E. Licea-Mailloux (k)
(age 46) | | Chief Compliance Officer | | March 2022 | | 136 | | Massachusetts Financial Services Company, Vice President (since 2018); Director of Corporate Compliance (2018-2021), Senior Director Compliance (2021-2022), Senior Managing Director of North American Compliance & Chief Compliance Officer (since March 2022); Natixis Investment Managers (investment management), Funds Chief Compliance Officer, Deputy General Counsel & Senior Vice President (until 2018) |
Amanda S. Mooradian (k)
(age 43) | | Assistant Secretary and Assistant Clerk | | September 2018 | | 136 | | Massachusetts Financial Services Company, Assistant Vice President and Senior Counsel |
Susan A. Pereira (k)
(age 52) | | Assistant Secretary and Assistant Clerk | | July 2005 | | 136 | | Massachusetts Financial Services Company, Vice President and Managing Counsel |
Kasey L. Phillips (k)
(age 51) | | Assistant Treasurer | | September 2012 | | 136 | | Massachusetts Financial Services Company, Vice President |
Matthew A. Stowe (k)
(age 48) | | Assistant Secretary and Assistant Clerk | | October 2014 | | 136 | | Massachusetts Financial Services Company, Vice President and Senior Managing Counsel |
William B. Wilson (k)
(age 40) | | Assistant Secretary and Assistant Clerk | | October 2022 | | 136 | | Massachusetts Financial Services Company, Assistant Vice President and Counsel |
James O. Yost (k)
(age 62) | | Treasurer | | September 1990 | | 136 | | Massachusetts Financial Services Company, Senior Vice President |
| (h) | Date first appointed to serve as Trustee/Officer of an MFS Fund. Each Trustee has served continuously since appointment unless indicated otherwise. From January 2012 through December 2016, Messrs. DiLorenzo and Yost served as Treasurer and Deputy Treasurer of the Funds, respectively. |
| (j) | Directorships or trusteeships of companies required to report to the Securities and Exchange Commission (i.e., “public companies”). |
| (k) | “Interested person” of the Trust within the meaning of the Investment Company Act of 1940 (referred to as the 1940 Act), which is the principal federal law governing investment companies like the fund, as a result of a position with MFS. The address of MFS is 111 Huntington Avenue, Boston, Massachusetts 02199-7618. |
Trustees and Officers - continued
Each Trustee (other than Messrs. Jones, Kilman and Roberge) has been elected by shareholders and each Trustee and Officer holds office until his or her successor is chosen and qualified or until his or her earlier death, resignation, retirement or removal. Mr. Roberge became a Trustee of the Funds on January 1, 2021 and Messrs. Jones and Kilman became Trustees of the Funds on January 1, 2019. The Trust does not hold annual meetings for the purpose of electing Trustees, and Trustees are not elected for fixed terms. Under the terms of the Board's retirement policy, an Independent Trustee shall retire at the end of the calendar year in which he or she reaches the earlier of 75 years of age or 15 years of service on the Board (or, in the case of any Independent Trustee who joined the Board prior to 2015, 20 years of service on the Board).
Messrs. Buller, Kilman and Otis and Ms. Roepke are members of the Trust’s Audit Committee.
Each of the Interested Trustees and certain Officers hold comparable officer positions with certain affiliates of MFS.
The Statement of Additional Information for a Fund includes further information about the Trustees and is available without charge upon request by calling 1-800-225-2606.
| Investment Adviser | Custodian |
Massachusetts Financial Services Company
111 Huntington Avenue
Boston, MA 02199-7618 | JPMorgan Chase Bank, NA
4 Metrotech Center
New York, NY 11245 |
| Distributor | Independent Registered Public Accounting Firm |
MFS Fund Distributors, Inc.
111 Huntington Avenue
Boston, MA 02199-7618 | Ernst & Young LLP
200 Clarendon Street
Boston, MA 02116 |
| Portfolio Manager(s) | |
Neeraj Arora
Philipp Burgener
David Cole
Alexander Mackey
Joshua Marston
Michael Skatrud | |
Board Review of Investment Advisory Agreement
MFS Income Fund
The Investment Company Act of 1940 requires that both the full Board of Trustees and a majority of the non-interested (“independent”) Trustees, voting separately, annually approve the continuation of the Fund’s investment advisory agreement with MFS. The Trustees consider matters bearing on the Fund and its advisory arrangements at their meetings throughout the year, including a review of performance data at each regular meeting. In addition, the independent Trustees met several times over the course of three months beginning in May and ending in July, 2022 (“contract review meetings”) for the specific purpose of considering whether to approve the continuation of the investment advisory agreement for the Fund and the other investment companies that the Board oversees (the “MFS Funds”). The independent Trustees were assisted in their evaluation of the Fund’s investment advisory agreement by independent legal counsel, from whom they received separate legal advice and with whom they met separately from MFS during various contract review meetings. The independent Trustees were also assisted in this process by an independent consultant who was retained by and reported to the independent Trustees.
In connection with their deliberations regarding the continuation of the investment advisory agreement, the Trustees, including the independent Trustees, considered such information and factors as they believed, in light of the legal advice furnished to them and their own business judgment, to be relevant. The investment advisory agreement for the Fund was considered separately, although the Trustees also took into account the common interests of all MFS Funds in their review. As described below, the Trustees considered the nature, quality, and extent of the various investment advisory, administrative, and shareholder services performed by MFS under the existing investment advisory agreement and other arrangements with the Fund.
In connection with their contract review meetings, the Trustees received and relied upon materials that included, among other items: (i) information provided by Broadridge Financial Solutions, Inc. (“Broadridge”), an independent third party, on the investment performance of the Fund for various time periods ended December 31, 2021 and the investment performance of a group of funds with substantially similar investment classifications/objectives (the “Broadridge performance universe”), (ii) information provided by Broadridge on the Fund’s advisory fees and other expenses and the advisory fees and other expenses of comparable funds identified by Broadridge as well as all other funds in the same investment classification/category (the “Broadridge expense group and universe”), (iii) information provided by MFS on the advisory fees of portfolios of other clients of MFS, including institutional separate accounts and other clients, (iv) information as to whether and to what extent applicable expense waivers, reimbursements or fee “breakpoints” are observed for the Fund, (v) information regarding MFS’ financial results and financial condition, including MFS’ and certain of its affiliates’ estimated profitability from services performed for the Fund and the MFS Funds as a whole, and compared to MFS’ institutional business, (vi) MFS’ views regarding the outlook for the mutual fund industry and the strategic business plans of MFS, (vii) descriptions of various functions performed by MFS for the Funds, such as compliance monitoring and portfolio trading practices, and (viii) information regarding the overall organization of MFS, including information about
Board Review of Investment Advisory Agreement - continued
MFS’ senior management and other personnel providing investment advisory, administrative and other services to the Fund and the other MFS Funds. The comparative performance, fee and expense information prepared and provided by Broadridge was not independently verified and the independent Trustees did not independently verify any information provided to them by MFS.
The Trustees’ conclusion as to the continuation of the investment advisory agreement was based on a comprehensive consideration of all information provided to the Trustees and not the result of any single factor. Some of the factors that figured particularly in the Trustees’ deliberations are described below, although individual Trustees may have evaluated the information presented differently from one another, giving different weights to various factors. It is also important to recognize that the fee arrangements for the Fund and other MFS Funds are the result of years of review and discussion between the independent Trustees and MFS, that certain aspects of such arrangements may receive greater scrutiny in some years than in others, and that the Trustees’ conclusions may be based, in part, on their consideration of these same arrangements during the course of the year and in prior years.
Based on information provided by Broadridge and MFS, the Trustees reviewed the Fund’s total return investment performance as well as the Broadridge performance universe over various time periods. The Trustees placed particular emphasis on the total return performance of the Fund’s Class I shares in comparison to the performance of funds in its Broadridge performance universe over the five-year period ended December 31, 2021, which the Trustees believed was a long enough period to reflect differing market conditions. The total return performance of the Fund’s Class I shares was in the 1st quintile relative to the other funds in the universe for this five-year period (the 1st quintile being the best performers and the 5th quintile being the worst performers). The total return performance of the Fund’s Class I shares was in the 2nd quintile for the one-year period and 1st quintile for the three-year period ended December 31, 2021 relative to the Broadridge performance universe. Because of the passage of time, these performance results may differ from the performance results for more recent periods, including those shown elsewhere in this report.
In the course of their deliberations, the Trustees took into account information provided by MFS in connection with the contract review meetings, as well as during investment review meetings conducted with portfolio management personnel during the course of the year regarding the Fund’s performance. After reviewing these and related factors, the Trustees concluded, within the context of their overall conclusions regarding the investment advisory agreement, that they were satisfied with MFS’ responses and efforts relating to investment performance.
In assessing the reasonableness of the Fund’s advisory fee, the Trustees considered, among other information, the Fund’s advisory fee and the total expense ratio of the Fund’s Class I shares as a percentage of average daily net assets and the advisory fee and total expense ratios of the Broadridge expense group based on information provided by Broadridge. The Trustees considered that MFS has agreed in writing to reduce its advisory fee and that MFS currently observes an expense limitation for the Fund, each of which may not be changed without the Trustees’ approval. The Trustees also considered that, according to the data provided by Broadridge (which takes into
Board Review of Investment Advisory Agreement - continued
account any fee reductions or expense limitations that were in effect during the Fund’s last fiscal year), the Fund’s effective advisory fee rate and total expense ratio were each lower than the Broadridge expense group median.
The Trustees also considered the advisory fees charged by MFS to any institutional separate accounts advised by MFS (“separate accounts”) and unaffiliated investment companies for which MFS serves as subadviser (“subadvised funds”) that have comparable investment strategies to the Fund, if any. In comparing these fees, the Trustees considered information provided by MFS as to the generally broader scope of services provided by MFS to the Fund, as well as the more extensive regulatory burdens imposed on MFS in managing the Fund, in comparison to separate accounts and subadvised funds. The Trustees also considered the higher demands placed on MFS’ investment personnel and trading infrastructure as a result of the daily cash in-flows and out-flows of the Fund in comparison to separate accounts.
The Trustees also considered whether the Fund may benefit from any economies of scale in the management of the Fund in the event of growth in assets of the Fund and/or growth in assets of the MFS Funds as a whole. They noted that the Fund’s advisory fee rate schedule is subject to contractual breakpoints that reduce the Fund’s advisory fee rate on average daily net assets over $1 billion and $2.5 billion. The Trustees also noted that MFS has agreed in writing to waive a portion of the management fees of certain MFS Funds, including the Fund, if the total combined assets of certain funds within the MFS Funds’ complex increase above agreed upon thresholds (the “group fee waiver”), enabling the Fund’s shareholders to share in the benefits from any economies of scale at the complex level. The group fee waiver is reviewed and renewed annually between the Board and MFS. The Trustees concluded that the breakpoints and the group fee waiver were sufficient to allow the Fund to benefit from economies of scale as its assets and overall complex assets grow.
The Trustees also considered information prepared by MFS relating to MFS’ costs and profits with respect to the Fund, the MFS Funds considered as a group, and other investment companies and accounts advised by MFS, as well as MFS’ methodologies used to determine and allocate its costs to the MFS Funds, the Fund and other accounts and products for purposes of estimating profitability.
After reviewing these and other factors described herein, the Trustees concluded, within the context of their overall conclusions regarding the investment advisory agreement, that the advisory fees charged to the Fund represent reasonable compensation in light of the services being provided by MFS to the Fund.
In addition, the Trustees considered MFS’ resources and related efforts to continue to retain, attract and motivate capable personnel to serve the Fund. The Trustees also considered current and developing conditions in the financial services industry, including the presence of large and well-capitalized companies which are spending, and appear to be prepared to continue to spend, substantial sums to engage personnel and to provide services to competing investment companies. In this regard, the Trustees also considered the financial resources of MFS and its ultimate parent, Sun Life Financial Inc. The Trustees also considered the advantages and possible disadvantages to the Fund of having an adviser that also serves other investment companies as well as other accounts.
Board Review of Investment Advisory Agreement - continued
The Trustees also considered the nature, quality, cost, and extent of administrative, transfer agency, and distribution services provided to the Fund by MFS and its affiliates under agreements and plans other than the investment advisory agreement, including any 12b-1 fees the Fund pays to MFS Fund Distributors, Inc., an affiliate of MFS. The Trustees also considered the nature, extent and quality of certain other services MFS performs or arranges for on the Fund’s behalf, which may include securities lending programs, directed expense payment programs, class action recovery programs, and MFS’ interaction with third-party service providers, principally custodians and sub-custodians. The Trustees concluded that the various non-advisory services provided by MFS and its affiliates on behalf of the Fund were satisfactory.
The Trustees considered so-called “fall-out benefits” to MFS such as reputational value derived from serving as investment manager to the MFS Funds. The Trustees also considered that MFS discontinued its historic practice of obtaining investment research from portfolio brokerage commissions paid by certain MFS Funds effective January 2018, and directly pays or voluntarily reimburses a Fund, if applicable, for the costs of external research acquired through the use of the Fund’s portfolio brokerage commissions.
Based on their evaluation of factors that they deemed to be material, including those factors described above, the Board of Trustees, including the independent Trustees, concluded that the Fund’s investment advisory agreement with MFS should be continued for an additional one-year period, commencing August 1, 2022.
Proxy Voting Policies and Information
MFS votes proxies on behalf of the fund pursuant to proxy voting policies and procedures that are available without charge, upon request, by calling 1-800-225-2606, by visiting mfs.com/proxyvoting, or by visiting the SEC’s Web site at http://www.sec.gov.
Information regarding how the fund voted proxies relating to portfolio securities during the most recent twelve-month period ended June 30 is available by August 31 of each year without charge by visiting mfs.com/proxyvoting, or by visiting the SEC’s Web site at http://www.sec.gov.
Quarterly Portfolio Disclosure
The fund files a complete schedule of portfolio holdings with the SEC for the first and third quarters of each fiscal year as an exhibit to its reports on Form N-PORT. The fund's Form N-PORT reports are available on the SEC's Web site at http://www.sec.gov. A shareholder can obtain the portfolio holdings report for the first and third quarters of the fund's fiscal year at mfs.com/openendfunds by choosing the fund's name and then scrolling to the “Resources” section and clicking on the “Prospectus and Reports” tab.
Further Information
From time to time, MFS may post important information about the fund or the MFS Funds on the MFS Web site (mfs.com). This information is available at https://www.mfs.com/announcements or at mfs.com/openendfunds by choosing the fund’s name and then scrolling to the “Resources” section and clicking on the “Announcements” tab, if any.
Information About Fund Contracts and Legal Claims
The fund has entered into contractual arrangements with an investment adviser, administrator, distributor, shareholder servicing agent, and custodian who each provide services to the fund. Unless expressly stated otherwise, shareholders are not parties to, or intended beneficiaries of these contractual arrangements, and these contractual arrangements are not intended to create any shareholder right to enforce them against the service providers or to seek any remedy under them against the service providers, either directly or on behalf of the fund.
Under the Trust’s By-Laws and Declaration of Trust, any claims asserted against or on behalf of the MFS Funds, including claims against Trustees and Officers, must be brought in state and federal courts located within the Commonwealth of Massachusetts.
Federal Tax Information (unaudited)
The fund will notify shareholders of amounts for use in preparing 2022 income tax forms in January 2023. The following information is provided pursuant to provisions of the Internal Revenue Code.
The fund designates $5,779,000 as capital gain dividends paid during the fiscal year.
The fund intends to pass through the maximum amount allowable as Section 163(j) Interest Dividends as defined in Treasury Regulation §1.163(j)-1(b).
| FACTS | WHAT DOES MFS DO WITH YOUR PERSONAL INFORMATION? |
| Why? | Financial companies choose how they share your personal information. Federal law gives consumers the right to limit some but not all sharing. Federal law also requires us to tell you how we collect, share, and protect your personal information. Please read this notice carefully to understand what we do. |
| What? | The types of personal information we collect and share depend on the product or service you have with us. This information can include: |
| • Social Security number and account balances |
| • Account transactions and transaction history |
| • Checking account information and wire transfer instructions |
| When you are no longer our customer, we continue to share your information as described in this notice. |
| How? | All financial companies need to share customers' personal information to run their everyday business. In the section below, we list the reasons financial companies can share their customers' personal information; the reasons MFS chooses to share; and whether you can limit this sharing. |
Reasons we can share your
personal information | Does MFS share? | Can you limit
this sharing? |
For our everyday business purposes –
such as to process your transactions, maintain your
account(s), respond to court orders and legal
investigations, or report to credit bureaus | Yes | No |
For our marketing purposes –
to offer our products and services to you | No | We don't share |
For joint marketing with other
financial companies | No | We don't share |
For our affiliates' everyday business purposes –
information about your transactions and experiences | No | We don't share |
For our affiliates' everyday business purposes –
information about your creditworthiness | No | We don't share |
| For nonaffiliates to market to you | No | We don't share |
| Questions? | Call 800-225-2606 or go to mfs.com. |
| Who we are |
| Who is providing this notice? | MFS Funds, MFS Investment Management, MFS Institutional Advisors, Inc., and MFS Heritage Trust Company. |
| What we do |
How does MFS
protect my personal
information? | To protect your personal information from unauthorized access and use, we use security measures that comply with federal law. These measures include procedural, electronic, and physical safeguards for the protection of the personal information we collect about you. |
How does MFS
collect my personal
information? | We collect your personal information, for example, when you |
| • open an account or provide account information |
| • direct us to buy securities or direct us to sell your securities |
| • make a wire transfer |
| We also collect your personal information from others, such as credit bureaus, affiliates, or other companies. |
| Why can't I limit all sharing? | Federal law gives you the right to limit only |
| • sharing for affiliates' everyday business purposes – information about your creditworthiness |
| • affiliates from using your information to market to you |
| • sharing for nonaffiliates to market to you |
| State laws and individual companies may give you additional rights to limit sharing. |
| Definitions |
| Affiliates | Companies related by common ownership or control. They can be financial and nonfinancial companies. |
| • MFS does not share personal information with affiliates, except for everyday business purposes as described on page one of this notice. |
| Nonaffiliates | Companies not related by common ownership or control. They can be financial and nonfinancial companies. |
| • MFS does not share with nonaffiliates so they can market to you. |
| Joint marketing | A formal agreement between nonaffiliated financial companies that together market financial products or services to you. |
| • MFS doesn't jointly market. |
| Other important information |
| If you own an MFS product or receive an MFS service in the name of a third party such as a bank or broker-dealer, their privacy policy may apply to you instead of ours. |
Save paper with eDelivery.
MFS® will send you prospectuses, reports, and proxies directly via e-mail so you will get information faster with less mailbox clutter.
To sign up:
1. Go to mfs.com.
2. Log in via MFS® Access.
3. Select eDelivery.
If you own your MFS fund shares through a financial institution or a retirement plan, MFS® TALK, MFS® Access, or eDelivery may not be available to you.
CONTACT
WEB SITE
mfs.com
MFS TALK
1-800-637-8255
24 hours a day
ACCOUNT SERVICE AND LITERATURE
Shareholders
1-800-225-2606
Financial advisors
1-800-343-2829
Retirement plan services
1-800-637-1255
MAILING ADDRESS
MFS Service Center, Inc.
P.O. Box 219341
Kansas City, MO 64121-9341
OVERNIGHT MAIL
MFS Service Center, Inc.
Suite 219341
430 W 7th Street
Kansas City, MO 64105-1407
Annual Report
October 31, 2022
| 1 |
| 2 |
| 4 |
| 7 |
| 10 |
| 12 |
| 17 |
| 19 |
| 20 |
| 21 |
| 27 |
| 38 |
| 40 |
| 44 |
| 48 |
| 48 |
| 48 |
| 48 |
| 48 |
| 50 |
The report is prepared for the general information of shareholders. It is authorized for distribution to prospective investors only when preceded or accompanied by a current prospectus.
NOT FDIC INSURED • MAY LOSE VALUE • NO BANK GUARANTEE
LETTER FROM THE CHAIR AND CEO
Dear Shareholders:
Global markets have recently been buffeted by a series of crosscurrents, including rising inflation, tighter financial conditions, and evolving geopolitical tensions. Consequently, at a time when global growth faces multiple headwinds, central banks have been presented with the challenge of reining in rising prices without tipping economies into recession. The U.S. Federal Reserve has made it clear that rates must move higher and tighter policy must be sustained to restore price stability and that this will likely bring some pain to households and businesses. Against that backdrop, richly valued, interest rate–sensitive growth equities have been hit particularly hard by rising interest rates. Volatility in fixed income and currency markets has picked up, with fiscal policy missteps in the United Kingdom leading to a crisis of market confidence that ultimately resulted in the ouster of Prime Minister Liz Truss. That episode could forewarn other governments to avoid policy overreach.
There are, however, encouraging signs for the markets. China has modestly relaxed its zero-COVID policy, and cases globally, while numerous, appear to be causing fewer serious illnesses. Meanwhile, unemployment is low and global supply chain bottlenecks are easing, though lingering coronavirus restrictions in China and disruptions stemming from Russia’s invasion of Ukraine could hamper these advances. Additionally, easier Chinese monetary and regulatory policies and the record pace of corporate stock buybacks are supportive elements, albeit in an otherwise turbulent investment environment.
It is important to have a deep understanding of company fundamentals during times of market transition, and we have built our unique global research platform to do just that.
At MFS®, we put our clients’ assets to work responsibly by carefully navigating increasingly complex global capital markets. Our investment team is guided by a commitment to long-term fundamental investing. Our global investment platform — combining collective expertise, long-term discipline, and thoughtful risk management — seeks to uncover what we believe are the best, most durable investment ideas in markets around the world, enabling us to potentially create value for investors.
Respectfully,
Michael W. Roberge
Chair and Chief Executive Officer
MFS Investment Management
December 15, 2022
The opinions expressed in this letter are subject to change and may not be relied upon for investment advice. No forecasts can be guaranteed.
Portfolio structure
Top ten holdings
| Alphabet, Inc., “A” | 5.1% |
| Microsoft Corp. | 4.8% |
| Canadian Pacific Railway Ltd. | 2.9% |
| Accenture PLC, “A” | 2.7% |
| Visa, Inc., “A” | 2.7% |
| Apple, Inc. | 2.6% |
| ICON PLC | 2.1% |
| Fiserv, Inc. | 2.1% |
| Amphenol Corp., “A” | 2.1% |
| Electronic Arts, Inc. | 2.0% |
GICS equity sectors (g)
| Information Technology | 28.6% |
| Health Care | 13.9% |
| Consumer Discretionary | 12.8% |
| Communication Services | 11.2% |
| Industrials | 10.2% |
| Consumer Staples | 9.7% |
| Financials | 9.3% |
| Materials | 1.7% |
| Real Estate | 1.2% |
| Utilities | 0.8% |
Issuer country weightings (x)
| United States | 70.2% |
| Canada | 4.8% |
| United Kingdom | 4.5% |
| Switzerland | 4.4% |
| China | 2.8% |
| Japan | 2.1% |
| India | 1.8% |
| South Korea | 1.7% |
| France | 1.7% |
| Other Countries | 6.0% |
Currency exposure weightings (y)
| United States Dollar | 74.1% |
| British Pound Sterling | 5.5% |
| Euro | 4.5% |
| Swiss Franc | 4.4% |
| Hong Kong Dollar | 2.2% |
| Japanese Yen | 2.1% |
| Canadian Dollar | 1.9% |
| Indian Rupee | 1.8% |
| South Korean Won | 1.7% |
| Other Currencies | 1.8% |
Portfolio Composition - continued
| (g) | The Global Industry Classification Standard (GICS®) was developed by and/or is the exclusive property of MSCI, Inc. and S&P Global Market Intelligence Inc. (“S&P Global Market Intelligence”). GICS is a service mark of MSCI and S&P Global Market Intelligence and has been licensed for use by MFS. MFS has applied its own internal sector/industry classification methodology for equity securities and non-equity securities that are unclassified by GICS. |
| (x) | Represents the portfolio’s exposure to issuer countries as a percentage of a portfolio’s net assets. For purposes of this presentation, United States includes Cash & Cash Equivalents. |
| (y) | Represents the portfolio’s exposure to a particular currency as a percentage of a portfolio's net assets. For purposes of this presentation, United States Dollar includes Cash & Cash Equivalents. |
Cash & Cash Equivalents includes any cash, investments in money market funds, short-term securities, and other assets less liabilities. Please see the Statement of Assets and Liabilities for additional information related to the fund’s cash position and other assets and liabilities.
Percentages are based on net assets as of October 31, 2022.
The portfolio is actively managed and current holdings may be different.
Management Review
Summary of Results
For the twelve months ended October 31, 2022, Class A shares of the MFS Global Growth Fund (fund) provided a total return of -21.59%, at net asset value. This compares with a return of -29.25% for the fund’s benchmark, the MSCI All Country World Growth Index (net div).
Market Environment
During the reporting period, markets continued to grapple with the strongest global inflationary pressures in decades along with signs of slowing economic growth. Intermittent coronavirus flareups, particularly in China, where home-grown vaccines have proved less effective than elsewhere, kept supply chains stretched for a considerable period. At the same time, the reopening of the economy in the parts of the world where the virus has been better contained has led to a shift in consumption patterns in favor of services, straining already tight labor markets in most developed economies, while reducing demand for manufactured goods, primarily from Asia. As a result of Russia’s invasion of Ukraine, geopolitical considerations, such as sanctions and trade bans, have resulted in additional supply chain tumult and volatile global energy prices. Taken together, these factors have contributed to market volatility.
The ripple effects from the Russian invasion further complicated the mission central banks must undertake to rein in surging inflation. Energy shocks have historically resulted in global growth slowdowns, if not pullbacks, so policymakers will find themselves in the difficult position of trying to restrain inflation without tipping economies into recession. Despite the challenging macroeconomic and geopolitical environment, policymakers remained focused on corralling inflation, although investors appeared to have expected varying degrees of action from the central banks. The Fed was expected to be the most hawkish developed market central bank and the European Central Bank less so, given the growth-depleting effects on Europe's economy stemming from the invasion, while the Bank of Japan remained on the monetary sidelines, leading to a dramatic weakening of the yen.
Against an environment of still-tight labor markets, tighter global financial conditions and volatile materials prices, investor anxiety appeared to have increased over the potential that corporate profit margins may be past peak for this cycle. That said, tentative signs that supply chain bottlenecks (particularly semiconductors) may be easing, low levels of unemployment across developed markets and somewhat easier prices for non-energy raw materials were supportive factors for the macroeconomic backdrop.
Contributors to Performance
Relative to the MSCI All Country World Growth Index, favorable stock selection within the information technology sector contributed to the fund’s performance. Within this sector, the timing of the fund's overweight positions in financial technology services provider Fiserv and broadband communication products and interconnect systems manufacturer Amphenol supported relative results. Not holding shares of weak-performing computer graphics processor maker NVIDIA further benefited relative performance.
Management Review - continued
Stock selection and an overweight position in the health care sector also strengthened relative returns. Here, the fund’s overweight position in medical device maker Boston Scientific, and holding shares of global health services provider Cigna(b), aided relative performance as both stocks outperformed the benchmark.
Stocks in other sectors that contributed to relative performance included the fund’s avoidance of weak-performing social networking service provider Meta Platforms and internet retailer Amazon.com. A softer-than-expected outlook for the remainder of the year from Meta Platforms appeared to have weighed on the stock price, reflecting uncertain macroeconomic conditions and further weakening of online advertising demand. Concerns about increased competition in social networking along with higher spending to build its metaverse business also held back the shares. The fund's overweight positions in dollar store operator Dollarama (Canada) and transcontinental railway operator Canadian Pacific Railway (Canada) further strengthened relative results. The stock price of Dollarama advanced as the company reported solid same-store sales growth and gross margin performance. The easing of COVID-19 restrictions, coupled with Dollarama’s low-cost customer value proposition during this inflationary environment, helped drive improved in-store traffic and sales. Additionally, holding shares of financial services provider Charles Schwab(b) helped relative results.
During the reporting period, the fund’s relative currency exposure, resulting primarily from differences between the fund's and the benchmark's exposures to holdings of securities denominated in foreign currencies, was another contributor to relative performance. All of MFS’ investment decisions are driven by the fundamentals of each individual opportunity and as such, it is common for our funds to have different currency exposure than the benchmark.
Detractors from Performance
Relative to the MSCI All Country World Growth Index, the fund’s lack of exposure to the strong-performing energy sector detracted from performance. There were no individual stocks within this sector, either in the fund or in the benchmark, that were among the fund's top relative detractors over the reporting period.
Elsewhere, the fund’s underweight position in computer and personal electronics maker Apple held back relative returns. The share price of Apple advanced due to better-than-expected revenue growth as Apple’s iPhone and Services Segment sales remained strong across all regions. The fund's overweight positions in internet search engine and online computer games provider NAVER (South Korea), sportswear and sports equipment manufacturer Adidas (Germany), online and mobile commerce company Alibaba Group Holding (China), internet services company Tencent (China) and athletic shoes and apparel manufacturer NIKE further hindered relative returns. The stock price of NAVER declined, partially driven by the impact of weakening macroeconomic conditions on demand for online advertising on its platform. In addition, weaker-than-expected user data with unique visitors and the decline in paying user numbers weighed on the shares. Not holding shares of pharmaceutical company Eli Lilly, wholesale retailer Costco Wholesale and pharmaceutical company Novo Nordisk (Denmark), and holding shares of discount retailer B&M European Value Retail(b) (Luxembourg), also weakened relative results.
Management Review - continued
Respectfully,
Portfolio Manager(s)
Jeffrey Constantino and Joseph Skorski
| (b) | Security is not a benchmark constituent. |
The views expressed in this report are those of the portfolio manager(s) only through the end of the period of the report as stated on the cover and do not necessarily reflect the views of MFS or any other person in the MFS organization. These views are subject to change at any time based on market or other conditions, and MFS disclaims any responsibility to update such views. These views may not be relied upon as investment advice or an indication of trading intent on behalf of any MFS portfolio. References to specific securities are not recommendations of such securities, and may not be representative of any MFS portfolio’s current or future investments.
Performance Summary THROUGH 10/31/22
The following chart illustrates a representative class of the fund’s historical performance in comparison to its benchmark(s). Performance results include the deduction of the maximum applicable sales charge and reflect the percentage change in net asset value, including reinvestment of dividends and capital gains distributions. The performance of other share classes will be greater than or less than that of the class depicted below. Benchmarks are unmanaged and may not be invested in directly. Benchmark returns do not reflect sales charges, commissions or expenses. (See Notes to Performance Summary.)
Performance data shown represents past performance and is no guarantee of future results. Investment return and principal value fluctuate so your shares, when sold, may be worth more or less than the original cost; current performance may be lower or higher than quoted. The performance shown does not reflect the deduction of taxes, if any, that a shareholder would pay on fund distributions or the redemption of fund shares.
Growth of a Hypothetical $10,000 Investment
Performance Summary - continued
Total Returns through 10/31/22
Average annual without sales charge
| Share Class | Class Inception Date | 1-yr | 5-yr | 10-yr | Life (t) |
| A | 11/18/93 | (21.59)% | 7.76% | 9.68% | N/A |
| B | 11/18/93 | (22.17)% | 6.95% | 8.85% | N/A |
| C | 1/03/94 | (22.17)% | 6.95% | 8.85% | N/A |
| I | 1/02/97 | (21.39)% | 8.02% | 9.94% | N/A |
| R1 | 4/01/05 | (22.17)% | 6.95% | 8.85% | N/A |
| R2 | 10/31/03 | (21.78)% | 7.49% | 9.40% | N/A |
| R3 | 4/01/05 | (21.59)% | 7.75% | 9.67% | N/A |
| R4 | 4/01/05 | (21.38)% | 8.03% | 9.94% | N/A |
| R6 | 3/01/13 | (21.31)% | 8.11% | N/A | 9.26% |
Comparative benchmark(s)
| | | | | |
| MSCI All Country World Growth Index (net div) (f) | (29.25)% | 6.77% | 9.40% | N/A |
Average annual with sales charge
| | | | | |
A
With Initial Sales Charge (5.75%) | (26.10)% | 6.49% | 9.03% | N/A |
B
With CDSC (Declining over six years from 4% to 0%) (v) | (25.06)% | 6.65% | 8.85% | N/A |
C
With CDSC (1% for 12 months) (v) | (22.90)% | 6.95% | 8.85% | N/A |
CDSC – Contingent Deferred Sales Charge.
Class I, R1, R2, R3, R4, and R6 shares do not have a sales charge.
| (f) | Source: FactSet Research Systems Inc. |
| (t) | For the period from the class inception date through the stated period end (for those share classes with less than 10 years of performance history). No comparative benchmark performance information is provided for “life” periods. (See Notes to Performance Summary.) |
| (v) | Assuming redemption at the end of the applicable period. |
Benchmark Definition(s)
MSCI All Country World Growth Index(e) (net div) – a market capitalization-weighted index that is designed to measure equity market performance for growth securities in the global developed and emerging markets.
It is not possible to invest directly in an index.
| (e) | Morgan Stanley Capital International (“MSCI”) makes no express or implied warranties or representations and shall have no liability whatsoever with respect to any MSCI data contained herein. The MSCI data may not be further redistributed or used as a basis for other indices or any securities or financial products. This report is not approved, reviewed, or produced by MSCI. |
Performance Summary - continued
Notes to Performance Summary
Average annual total return represents the average annual change in value for each share class for the periods presented. Life returns are presented where the share class has less than 10 years of performance history and represent the average annual total return from the class inception date to the stated period end date. As the fund's share classes may have different inception dates, the life returns may represent different time periods and may not be comparable. As a result, no comparative benchmark performance information is provided for life periods.
Performance results reflect any applicable expense subsidies and waivers in effect during the periods shown. Without such subsidies and waivers, the fund's performance results would be less favorable. Please see the prospectus and financial statements for complete details.
Performance results do not include adjustments made for financial reporting purposes in accordance with U.S. generally accepted accounting principles and may differ from amounts reported in the financial highlights.
From time to time the fund may receive proceeds from litigation settlements, without which performance would be lower.
Expense Table
Fund expenses borne by the shareholders during the period,
May 1, 2022 through October 31, 2022
As a shareholder of the fund, you incur two types of costs: (1) transaction costs, including sales charges (loads) on certain purchase or redemption payments, and (2) ongoing costs, including management fees; distribution and service (12b-1) fees; and other fund expenses. This example is intended to help you understand your ongoing costs (in dollars) of investing in the fund and to compare these costs with the ongoing costs of investing in other mutual funds.
The example is based on an investment of $1,000 invested at the beginning of the period and held for the entire period May 1, 2022 through October 31, 2022.
Actual Expenses
The first line for each share class in the following table provides information about actual account values and actual expenses. You may use the information in this line, together with the amount you invested, to estimate the expenses that you paid over the period. Simply divide your account value by $1,000 (for example, an $8,600 account value divided by $1,000 = 8.6), then multiply the result by the number in the first line under the heading entitled “Expenses Paid During Period” to estimate the expenses you paid on your account during this period.
Hypothetical Example for Comparison Purposes
The second line for each share class in the following table provides information about hypothetical account values and hypothetical expenses based on the fund’s actual expense ratio and an assumed rate of return of 5% per year before expenses, which is not the fund’s actual return. The hypothetical account values and expenses may not be used to estimate the actual ending account balance or expenses you paid for the period. You may use this information to compare the ongoing costs of investing in the fund and other funds. To do so, compare this 5% hypothetical example with the 5% hypothetical examples that appear in the shareholder reports of the other funds.
Please note that the expenses shown in the table are meant to highlight your ongoing costs only and do not reflect any transactional costs, such as sales charges (loads). Therefore, the second line for each share class in the table is useful in comparing ongoing costs only, and will not help you determine the relative total costs of owning different funds. In addition, if these transactional costs were included, your costs would have been higher.
Expense Table - continued
Share
Class | | Annualized
Expense
Ratio | Beginning
Account Value
5/01/22 | Ending
Account Value
10/31/22 | Expenses
Paid During
Period (p)
5/01/22-10/31/22 |
| A | Actual | 1.22% | $1,000.00 | $895.52 | $5.83 |
| Hypothetical(h) | 1.22% | $1,000.00 | $1,019.06 | $6.21 |
| B | Actual | 1.97% | $1,000.00 | $892.14 | $9.40 |
| Hypothetical(h) | 1.97% | $1,000.00 | $1,015.27 | $10.01 |
| C | Actual | 1.97% | $1,000.00 | $892.14 | $9.40 |
| Hypothetical(h) | 1.97% | $1,000.00 | $1,015.27 | $10.01 |
| I | Actual | 0.97% | $1,000.00 | $896.72 | $4.64 |
| Hypothetical(h) | 0.97% | $1,000.00 | $1,020.32 | $4.94 |
| R1 | Actual | 1.97% | $1,000.00 | $892.30 | $9.40 |
| Hypothetical(h) | 1.97% | $1,000.00 | $1,015.27 | $10.01 |
| R2 | Actual | 1.47% | $1,000.00 | $894.42 | $7.02 |
| Hypothetical(h) | 1.47% | $1,000.00 | $1,017.80 | $7.48 |
| R3 | Actual | 1.22% | $1,000.00 | $895.54 | $5.83 |
| Hypothetical(h) | 1.22% | $1,000.00 | $1,019.06 | $6.21 |
| R4 | Actual | 0.97% | $1,000.00 | $896.72 | $4.64 |
| Hypothetical(h) | 0.97% | $1,000.00 | $1,020.32 | $4.94 |
| R6 | Actual | 0.89% | $1,000.00 | $897.11 | $4.26 |
| Hypothetical(h) | 0.89% | $1,000.00 | $1,020.72 | $4.53 |
| (h) | 5% class return per year before expenses. |
| (p) | “Expenses Paid During Period” are equal to each class’s annualized expense ratio, as shown above, multiplied by the average account value over the period, multiplied by 184/365 (to reflect the one-half year period). Expenses paid do not include any applicable sales charges (loads). If these transaction costs had been included, your costs would have been higher. |
Portfolio of Investments
10/31/22
The Portfolio of Investments is a complete list of all securities owned by your fund. It is categorized by broad-based asset classes.
| Issuer | | | Shares/Par | Value ($) |
| Common Stocks – 99.4% |
| Alcoholic Beverages – 2.0% | |
| Diageo PLC | | 222,665 | $9,187,573 |
| Kweichow Moutai Co. Ltd. | | 20,667 | 3,822,713 |
| | | | | $13,010,286 |
| Apparel Manufacturers – 5.3% | |
| Adidas AG | | 51,241 | $5,012,240 |
| Burberry Group PLC | | 325,165 | 6,768,121 |
| LVMH Moet Hennessy Louis Vuitton SE | | 16,778 | 10,595,169 |
| NIKE, Inc., “B” | | 121,944 | 11,301,770 |
| | | | | $33,677,300 |
| Automotive – 1.4% | |
| Aptiv PLC (a) | | 100,537 | $9,155,905 |
| Brokerage & Asset Managers – 2.2% | |
| Blackstone, Inc. | | 22,170 | $2,020,574 |
| Charles Schwab Corp. | | 152,790 | 12,172,779 |
| | | | | $14,193,353 |
| Business Services – 10.3% | |
| Accenture PLC, “A” | | 60,646 | $17,217,399 |
| CGI, Inc. (a) | | 90,619 | 7,299,541 |
| Cognizant Technology Solutions Corp., “A” | | 79,291 | 4,935,865 |
| Equifax, Inc. | | 48,817 | 8,276,434 |
| Fidelity National Information Services, Inc. | | 88,700 | 7,361,213 |
| Fiserv, Inc. (a) | | 130,002 | 13,356,405 |
| Thomson Reuters Corp. | | 25,476 | 2,709,449 |
| Verisk Analytics, Inc., “A” | | 25,564 | 4,673,866 |
| | | | | $65,830,172 |
| Cable TV – 0.3% | |
| Charter Communications, Inc., “A” (a) | | 5,935 | $2,181,825 |
| Computer Software – 8.4% | |
| Adobe Systems, Inc. (a) | | 29,462 | $9,383,647 |
| Black Knight, Inc. (a) | | 106,017 | 6,410,848 |
| Microsoft Corp. | | 131,340 | 30,487,954 |
| Naver Corp. | | 63,542 | 7,532,696 |
| | | | | $53,815,145 |
Portfolio of Investments – continued
| Issuer | | | Shares/Par | Value ($) |
| Common Stocks – continued |
| Computer Software - Systems – 3.1% | |
| Apple, Inc. | | 107,826 | $16,534,039 |
| Samsung Electronics Co. Ltd. | | 84,535 | 3,515,261 |
| | | | | $20,049,300 |
| Construction – 2.0% | |
| Otis Worldwide Corp. | | 97,639 | $6,897,219 |
| Sherwin-Williams Co. | | 26,134 | 5,880,934 |
| | | | | $12,778,153 |
| Consumer Products – 4.8% | |
| Church & Dwight Co., Inc. | | 140,760 | $10,434,539 |
| Estee Lauder Cos., Inc., “A” | | 14,925 | 2,992,313 |
| Kose Corp. | | 92,300 | 9,195,900 |
| Reckitt Benckiser Group PLC | | 118,677 | 7,866,510 |
| | | | | $30,489,262 |
| Electrical Equipment – 4.8% | |
| Amphenol Corp., “A” | | 175,248 | $13,289,056 |
| Fortive Corp. | | 163,758 | 10,464,136 |
| TE Connectivity Ltd. | | 58,523 | 7,153,266 |
| | | | | $30,906,458 |
| Electronics – 3.1% | |
| Analog Devices, Inc. | | 43,003 | $6,133,088 |
| Taiwan Semiconductor Manufacturing Co. Ltd., ADR | | 123,916 | 7,627,030 |
| Texas Instruments, Inc. | | 38,311 | 6,153,896 |
| | | | | $19,914,014 |
| Food & Beverages – 2.9% | |
| McCormick & Co., Inc. | | 99,666 | $7,837,734 |
| Nestle S.A. | | 71,378 | 7,772,564 |
| PepsiCo, Inc. | | 15,756 | 2,860,975 |
| | | | | $18,471,273 |
| Gaming & Lodging – 1.1% | |
| Flutter Entertainment PLC (a) | | 50,253 | $6,673,570 |
| General Merchandise – 1.1% | |
| B&M European Value Retail S.A. | | 1,310,772 | $4,849,302 |
| Dollarama, Inc. | | 37,920 | 2,253,183 |
| | | | | $7,102,485 |
| Health Maintenance Organizations – 0.6% | |
| Cigna Corp. | | 10,908 | $3,523,939 |
Portfolio of Investments – continued
| Issuer | | | Shares/Par | Value ($) |
| Common Stocks – continued |
| Insurance – 2.7% | |
| Aon PLC | | 40,444 | $11,384,582 |
| Marsh & McLennan Cos., Inc. | | 36,546 | 5,901,813 |
| | | | | $17,286,395 |
| Internet – 7.2% | |
| Alphabet, Inc., “A” (a) | | 342,780 | $32,396,138 |
| Gartner, Inc. (a) | | 13,808 | 4,168,911 |
| Tencent Holdings Ltd. | | 353,800 | 9,266,818 |
| | | | | $45,831,867 |
| Leisure & Toys – 2.0% | |
| Electronic Arts, Inc. | | 103,033 | $12,978,037 |
| Machinery & Tools – 1.2% | |
| Daikin Industries Ltd. | | 27,000 | $4,064,662 |
| Schindler Holding AG | | 21,123 | 3,443,681 |
| | | | | $7,508,343 |
| Medical & Health Technology & Services – 2.2% | |
| ICON PLC (a) | | 69,412 | $13,732,470 |
| Medical Equipment – 9.8% | |
| Abbott Laboratories | | 35,949 | $3,556,794 |
| Agilent Technologies, Inc. | | 33,434 | 4,625,594 |
| Becton, Dickinson and Co. | | 28,845 | 6,806,554 |
| Boston Scientific Corp. (a) | | 300,939 | 12,973,480 |
| Danaher Corp. | | 38,961 | 9,805,315 |
| STERIS PLC | | 49,172 | 8,486,104 |
| Stryker Corp. | | 26,996 | 6,188,563 |
| Thermo Fisher Scientific, Inc. | | 20,273 | 10,419,714 |
| | | | | $62,862,118 |
| Other Banks & Diversified Financials – 7.7% | |
| Credicorp Ltd. | | 40,911 | $5,987,734 |
| HDFC Bank Ltd. | | 615,727 | 11,132,960 |
| Julius Baer Group Ltd. | | 67,864 | 3,251,047 |
| Mastercard, Inc., “A” | | 14,597 | 4,790,443 |
| Moody's Corp. | | 27,518 | 7,288,693 |
| Visa, Inc., “A” | | 81,926 | 16,971,790 |
| | | | | $49,422,667 |
| Pharmaceuticals – 1.4% | |
| Roche Holding AG | | 26,494 | $8,798,701 |
Portfolio of Investments – continued
| Issuer | | | Shares/Par | Value ($) |
| Common Stocks – continued |
| Printing & Publishing – 0.9% | |
| Wolters Kluwer N.V. | | 56,060 | $5,958,409 |
| Railroad & Shipping – 2.9% | |
| Canadian Pacific Railway Ltd. | | 248,382 | $18,501,975 |
| Restaurants – 0.7% | |
| Starbucks Corp. | | 50,675 | $4,387,948 |
| Specialty Chemicals – 0.8% | |
| Sika AG | | 22,031 | $4,967,893 |
| Specialty Stores – 3.3% | |
| Alibaba Group Holding Ltd. (a) | | 636,372 | $5,066,458 |
| Ross Stores, Inc. | | 90,652 | 8,674,490 |
| TJX Cos., Inc. | | 99,690 | 7,187,649 |
| | | | | $20,928,597 |
| Telecommunications - Wireless – 2.3% | |
| American Tower Corp., REIT | | 38,084 | $7,890,624 |
| Cellnex Telecom S.A. | | 213,787 | 6,993,203 |
| | | | | $14,883,827 |
| Utilities - Electric Power – 0.9% | |
| Xcel Energy, Inc. | | 82,579 | $5,376,719 |
| Total Common Stocks (Identified Cost, $490,282,669) | | $635,198,406 |
| Investment Companies (h) – 0.6% |
| Money Market Funds – 0.6% | |
| MFS Institutional Money Market Portfolio, 3.02% (v) (Identified Cost, $3,633,510) | | | 3,633,510 | $3,633,510 |
|
|
| Other Assets, Less Liabilities – 0.0% | | 77,944 |
| Net Assets – 100.0% | $638,909,860 |
| (a) | Non-income producing security. | | | |
| (h) | An affiliated issuer, which may be considered one in which the fund owns 5% or more of the outstanding voting securities, or a company which is under common control. At period end, the aggregate values of the fund's investments in affiliated issuers and in unaffiliated issuers were $3,633,510 and $635,198,406, respectively. | | | |
| (v) | Affiliated issuer that is available only to investment companies managed by MFS. The rate quoted for the MFS Institutional Money Market Portfolio is the annualized seven-day yield of the fund at period end. | | | |
Portfolio of Investments – continued
| The following abbreviations are used in this report and are defined: |
| ADR | American Depositary Receipt |
| REIT | Real Estate Investment Trust |
See Notes to Financial Statements
Financial Statements
Statement of Assets and Liabilities
At 10/31/22
This statement represents your fund’s balance sheet, which details the assets and liabilities comprising the total value of the fund.
| Assets | |
| Investments in unaffiliated issuers, at value (identified cost, $490,282,669) | $635,198,406 |
| Investments in affiliated issuers, at value (identified cost, $3,633,510) | 3,633,510 |
| Cash | 61,943 |
| Receivables for | |
| Fund shares sold | 794,494 |
| Dividends | 914,944 |
| Receivable from investment adviser | 1,913 |
| Other assets | 366 |
| Total assets | $640,605,576 |
| Liabilities | |
| Payable to custodian | $59,780 |
| Payables for | |
| Fund shares reacquired | 969,883 |
| Payable to affiliates | |
| Administrative services fee | 1,150 |
| Shareholder servicing costs | 128,779 |
| Distribution and service fees | 9,652 |
| Payable for independent Trustees' compensation | 39 |
| Deferred country tax expense payable | 377,083 |
| Accrued expenses and other liabilities | 149,350 |
| Total liabilities | $1,695,716 |
| Net assets | $638,909,860 |
| Net assets consist of | |
| Paid-in capital | $474,222,264 |
| Total distributable earnings (loss) | 164,687,596 |
| Net assets | $638,909,860 |
| Shares of beneficial interest outstanding | 12,985,622 |
Statement of Assets and Liabilities – continued
| | Net assets | Shares
outstanding | Net asset value
per share (a) |
| Class A | $287,674,914 | 5,919,142 | $48.60 |
| Class B | 2,645,537 | 66,220 | 39.95 |
| Class C | 10,690,469 | 271,535 | 39.37 |
| Class I | 91,871,208 | 1,827,382 | 50.27 |
| Class R1 | 617,170 | 15,716 | 39.27 |
| Class R2 | 2,218,637 | 47,876 | 46.34 |
| Class R3 | 3,240,034 | 67,011 | 48.35 |
| Class R4 | 1,815,589 | 37,078 | 48.97 |
| Class R6 | 238,136,302 | 4,733,662 | 50.31 |
| (a) | Maximum offering price per share was equal to the net asset value per share for all share classes, except for Class A, for which the maximum offering price per share was $51.56 [100 / 94.25 x $48.60]. On sales of $50,000 or more, the maximum offering price of Class A shares is reduced. A contingent deferred sales charge may be imposed on redemptions of Class A, Class B, and Class C shares. Redemption price per share was equal to the net asset value per share for Classes I, R1, R2, R3, R4, and R6. |
See Notes to Financial Statements
Financial Statements
Statement of Operations
Year ended 10/31/22
This statement describes how much your fund earned in investment income and accrued in expenses. It also describes any gains and/or losses generated by fund operations.
| Net investment income (loss) | |
| Income | |
| Dividends | $8,445,099 |
| Dividends from affiliated issuers | 46,943 |
| Interest | 16,943 |
| Other | 14,975 |
| Income on securities loaned | 2,640 |
| Foreign taxes withheld | (352,574) |
| Total investment income | $8,174,026 |
| Expenses | |
| Management fee | $6,745,610 |
| Distribution and service fees | 1,056,117 |
| Shareholder servicing costs | 544,219 |
| Administrative services fee | 123,087 |
| Independent Trustees' compensation | 12,586 |
| Custodian fee | 97,382 |
| Shareholder communications | 73,572 |
| Audit and tax fees | 93,070 |
| Legal fees | 3,217 |
| Miscellaneous | 204,003 |
| Total expenses | $8,952,863 |
| Fees paid indirectly | (111) |
| Reduction of expenses by investment adviser and distributor | (844,713) |
| Net expenses | $8,108,039 |
| Net investment income (loss) | $65,987 |
| Realized and unrealized gain (loss) |
| Realized gain (loss) (identified cost basis) | |
| Unaffiliated issuers (net of $31,797 country tax) | $26,202,093 |
| Affiliated issuers | 553 |
| Foreign currency | (36,799) |
| Net realized gain (loss) | $26,165,847 |
| Change in unrealized appreciation or depreciation | |
| Unaffiliated issuers (net of $202,829 decrease in deferred country tax) | $(203,421,255) |
| Translation of assets and liabilities in foreign currencies | (91,597) |
| Net unrealized gain (loss) | $(203,512,852) |
| Net realized and unrealized gain (loss) | $(177,347,005) |
| Change in net assets from operations | $(177,281,018) |
See Notes to Financial Statements
Financial Statements
Statements of Changes in Net Assets
These statements describe the increases and/or decreases in net assets resulting from operations, any distributions, and any shareholder transactions.
| | Year ended |
| | 10/31/22 | 10/31/21 |
| Change in net assets | | |
| From operations | | |
| Net investment income (loss) | $65,987 | $562,292 |
| Net realized gain (loss) | 26,165,847 | 55,990,598 |
| Net unrealized gain (loss) | (203,512,852) | 154,888,566 |
| Change in net assets from operations | $(177,281,018) | $211,441,456 |
| Total distributions to shareholders | $(51,218,126) | $(22,314,557) |
| Change in net assets from fund share transactions | $8,944,365 | $40,081,037 |
| Total change in net assets | $(219,554,779) | $229,207,936 |
| Net assets | | |
| At beginning of period | 858,464,639 | 629,256,703 |
| At end of period | $638,909,860 | $858,464,639 |
See Notes to Financial Statements
Financial Statements
Financial Highlights
The financial highlights table is intended to help you understand the fund's financial performance for the past 5 years. Certain information reflects financial results for a single fund share. The total returns in the table represent the rate that an investor would have earned (or lost) on an investment in the fund share class (assuming reinvestment of all distributions) held for the entire period.
| Class A | Year ended |
| | 10/31/22 | 10/31/21 | 10/31/20 | 10/31/19 | 10/31/18 |
| Net asset value, beginning of period | $65.93 | $51.22 | $46.53 | $40.55 | $40.66 |
| Income (loss) from investment operations |
| Net investment income (loss) (d) | $(0.07) | $(0.04) | $(0.01) | $0.10 | $0.09 |
| Net realized and unrealized gain (loss) | (13.29) | 16.54 | 5.62 | 7.73 | 1.27 |
| Total from investment operations | $(13.36) | $16.50 | $5.61 | $7.83 | $1.36 |
| Less distributions declared to shareholders |
| From net investment income | $— | $— | $(0.04) | $(0.04) | $(0.07) |
| From net realized gain | (3.97) | (1.79) | (0.88) | (1.81) | (1.40) |
| Total distributions declared to shareholders | $(3.97) | $(1.79) | $(0.92) | $(1.85) | $(1.47) |
| Net asset value, end of period (x) | $48.60 | $65.93 | $51.22 | $46.53 | $40.55 |
| Total return (%) (r)(s)(t)(x) | (21.58) | 32.86 | 12.17 | 20.28 | 3.38 |
Ratios (%) (to average net assets)
and Supplemental data: |
| Expenses before expense reductions (f) | 1.33 | 1.32 | 1.36 | 1.38 | 1.39 |
| Expenses after expense reductions (f) | 1.22 | 1.22 | 1.21 | 1.31 | 1.37 |
| Net investment income (loss) | (0.13) | (0.06) | (0.03) | 0.23 | 0.21 |
| Portfolio turnover | 20 | 22 | 39 | 21 | 22 |
| Net assets at end of period (000 omitted) | $287,675 | $391,787 | $290,411 | $283,181 | $214,801 |
See Notes to Financial Statements
Financial Highlights – continued
| Class B | Year ended |
| | 10/31/22 | 10/31/21 | 10/31/20 | 10/31/19 | 10/31/18 |
| Net asset value, beginning of period | $55.29 | $43.53 | $39.93 | $35.28 | $35.76 |
| Income (loss) from investment operations |
| Net investment income (loss) (d) | $(0.41) | $(0.42) | $(0.32) | $(0.20) | $(0.20) |
| Net realized and unrealized gain (loss) | (10.96) | 13.97 | 4.80 | 6.66 | 1.12 |
| Total from investment operations | $(11.37) | $13.55 | $4.48 | $6.46 | $0.92 |
| Less distributions declared to shareholders |
| From net investment income | $— | $— | $— | $— | $— |
| From net realized gain | (3.97) | (1.79) | (0.88) | (1.81) | (1.40) |
| Total distributions declared to shareholders | $(3.97) | $(1.79) | $(0.88) | $(1.81) | $(1.40) |
| Net asset value, end of period (x) | $39.95 | $55.29 | $43.53 | $39.93 | $35.28 |
| Total return (%) (r)(s)(t)(x) | (22.17) | 31.86 | 11.34 | 19.36 | 2.58 |
Ratios (%) (to average net assets)
and Supplemental data: |
| Expenses before expense reductions (f) | 2.08 | 2.07 | 2.11 | 2.13 | 2.14 |
| Expenses after expense reductions (f) | 1.97 | 1.97 | 1.97 | 2.08 | 2.13 |
| Net investment income (loss) | (0.88) | (0.82) | (0.78) | (0.54) | (0.55) |
| Portfolio turnover | 20 | 22 | 39 | 21 | 22 |
| Net assets at end of period (000 omitted) | $2,646 | $4,537 | $4,277 | $4,928 | $5,020 |
| Class C | Year ended |
| | 10/31/22 | 10/31/21 | 10/31/20 | 10/31/19 | 10/31/18 |
| Net asset value, beginning of period | $54.55 | $42.96 | $39.42 | $34.85 | $35.34 |
| Income (loss) from investment operations |
| Net investment income (loss) (d) | $(0.40) | $(0.41) | $(0.32) | $(0.20) | $(0.20) |
| Net realized and unrealized gain (loss) | (10.81) | 13.79 | 4.74 | 6.58 | 1.11 |
| Total from investment operations | $(11.21) | $13.38 | $4.42 | $6.38 | $0.91 |
| Less distributions declared to shareholders |
| From net investment income | $— | $— | $— | $— | $— |
| From net realized gain | (3.97) | (1.79) | (0.88) | (1.81) | (1.40) |
| Total distributions declared to shareholders | $(3.97) | $(1.79) | $(0.88) | $(1.81) | $(1.40) |
| Net asset value, end of period (x) | $39.37 | $54.55 | $42.96 | $39.42 | $34.85 |
| Total return (%) (r)(s)(t)(x) | (22.17) | 31.89 | 11.33 | 19.37 | 2.58 |
Ratios (%) (to average net assets)
and Supplemental data: |
| Expenses before expense reductions (f) | 2.08 | 2.07 | 2.11 | 2.13 | 2.14 |
| Expenses after expense reductions (f) | 1.97 | 1.97 | 1.97 | 2.07 | 2.13 |
| Net investment income (loss) | (0.88) | (0.81) | (0.78) | (0.55) | (0.55) |
| Portfolio turnover | 20 | 22 | 39 | 21 | 22 |
| Net assets at end of period (000 omitted) | $10,690 | $17,013 | $14,222 | $13,332 | $8,857 |
See Notes to Financial Statements
Financial Highlights – continued
| Class I | Year ended |
| | 10/31/22 | 10/31/21 | 10/31/20 | 10/31/19 | 10/31/18 |
| Net asset value, beginning of period | $67.95 | $52.63 | $47.77 | $41.58 | $41.64 |
| Income (loss) from investment operations |
| Net investment income (loss) (d) | $0.07 | $0.12 | $0.09 | $0.25 | $0.19 |
| Net realized and unrealized gain (loss) | (13.74) | 17.01 | 5.79 | 7.89 | 1.29 |
| Total from investment operations | $(13.67) | $17.13 | $5.88 | $8.14 | $1.48 |
| Less distributions declared to shareholders |
| From net investment income | $(0.04) | $(0.02) | $(0.14) | $(0.14) | $(0.14) |
| From net realized gain | (3.97) | (1.79) | (0.88) | (1.81) | (1.40) |
| Total distributions declared to shareholders | $(4.01) | $(1.81) | $(1.02) | $(1.95) | $(1.54) |
| Net asset value, end of period (x) | $50.27 | $67.95 | $52.63 | $47.77 | $41.58 |
| Total return (%) (r)(s)(t)(x) | (21.39) | 33.19 | 12.45 | 20.58 | 3.60 |
Ratios (%) (to average net assets)
and Supplemental data: |
| Expenses before expense reductions (f) | 1.08 | 1.07 | 1.10 | 1.13 | 1.14 |
| Expenses after expense reductions (f) | 0.97 | 0.97 | 0.97 | 1.06 | 1.13 |
| Net investment income (loss) | 0.12 | 0.19 | 0.17 | 0.56 | 0.44 |
| Portfolio turnover | 20 | 22 | 39 | 21 | 22 |
| Net assets at end of period (000 omitted) | $91,871 | $126,593 | $98,214 | $83,727 | $22,537 |
| Class R1 | Year ended |
| | 10/31/22 | 10/31/21 | 10/31/20 | 10/31/19 | 10/31/18 |
| Net asset value, beginning of period | $54.42 | $42.86 | $39.33 | $34.78 | $35.27 |
| Income (loss) from investment operations |
| Net investment income (loss) (d) | $(0.40) | $(0.40) | $(0.32) | $(0.18) | $(0.20) |
| Net realized and unrealized gain (loss) | (10.78) | 13.75 | 4.73 | 6.54 | 1.11 |
| Total from investment operations | $(11.18) | $13.35 | $4.41 | $6.36 | $0.91 |
| Less distributions declared to shareholders |
| From net investment income | $— | $— | $— | $— | $— |
| From net realized gain | (3.97) | (1.79) | (0.88) | (1.81) | (1.40) |
| Total distributions declared to shareholders | $(3.97) | $(1.79) | $(0.88) | $(1.81) | $(1.40) |
| Net asset value, end of period (x) | $39.27 | $54.42 | $42.86 | $39.33 | $34.78 |
| Total return (%) (r)(s)(t)(x) | (22.17) | 31.89 | 11.33 | 19.35 | 2.59 |
Ratios (%) (to average net assets)
and Supplemental data: |
| Expenses before expense reductions (f) | 2.08 | 2.07 | 2.11 | 2.13 | 2.14 |
| Expenses after expense reductions (f) | 1.97 | 1.97 | 1.97 | 2.10 | 2.13 |
| Net investment income (loss) | (0.88) | (0.79) | (0.80) | (0.52) | (0.56) |
| Portfolio turnover | 20 | 22 | 39 | 21 | 22 |
| Net assets at end of period (000 omitted) | $617 | $766 | $442 | $317 | $862 |
See Notes to Financial Statements
Financial Highlights – continued
| Class R2 | Year ended |
| | 10/31/22 | 10/31/21 | 10/31/20 | 10/31/19 | 10/31/18 |
| Net asset value, beginning of period | $63.20 | $49.29 | $44.88 | $39.24 | $39.42 |
| Income (loss) from investment operations |
| Net investment income (loss) (d) | $(0.20) | $(0.18) | $(0.13) | $(0.03) | $(0.02) |
| Net realized and unrealized gain (loss) | (12.69) | 15.88 | 5.42 | 7.48 | 1.24 |
| Total from investment operations | $(12.89) | $15.70 | $5.29 | $7.45 | $1.22 |
| Less distributions declared to shareholders |
| From net investment income | $— | $— | $— | $— | $— |
| From net realized gain | (3.97) | (1.79) | (0.88) | (1.81) | (1.40) |
| Total distributions declared to shareholders | $(3.97) | $(1.79) | $(0.88) | $(1.81) | $(1.40) |
| Net asset value, end of period (x) | $46.34 | $63.20 | $49.29 | $44.88 | $39.24 |
| Total return (%) (r)(s)(t)(x) | (21.78) | 32.52 | 11.90 | 19.95 | 3.12 |
Ratios (%) (to average net assets)
and Supplemental data: |
| Expenses before expense reductions (f) | 1.58 | 1.57 | 1.61 | 1.63 | 1.64 |
| Expenses after expense reductions (f) | 1.47 | 1.47 | 1.47 | 1.58 | 1.63 |
| Net investment income (loss) | (0.38) | (0.31) | (0.27) | (0.07) | (0.05) |
| Portfolio turnover | 20 | 22 | 39 | 21 | 22 |
| Net assets at end of period (000 omitted) | $2,219 | $4,491 | $3,207 | $2,202 | $2,581 |
| Class R3 | Year ended |
| | 10/31/22 | 10/31/21 | 10/31/20 | 10/31/19 | 10/31/18 |
| Net asset value, beginning of period | $65.62 | $50.99 | $46.29 | $40.33 | $40.46 |
| Income (loss) from investment operations |
| Net investment income (loss) (d) | $(0.07) | $(0.05) | $(0.01) | $0.08 | $0.08 |
| Net realized and unrealized gain (loss) | (13.23) | 16.47 | 5.59 | 7.71 | 1.26 |
| Total from investment operations | $(13.30) | $16.42 | $5.58 | $7.79 | $1.34 |
| Less distributions declared to shareholders |
| From net investment income | $— | $— | $(0.00)(w) | $(0.02) | $(0.07) |
| From net realized gain | (3.97) | (1.79) | (0.88) | (1.81) | (1.40) |
| Total distributions declared to shareholders | $(3.97) | $(1.79) | $(0.88) | $(1.83) | $(1.47) |
| Net asset value, end of period (x) | $48.35 | $65.62 | $50.99 | $46.29 | $40.33 |
| Total return (%) (r)(s)(t)(x) | (21.59) | 32.86 | 12.18 | 20.28 | 3.35 |
Ratios (%) (to average net assets)
and Supplemental data: |
| Expenses before expense reductions (f) | 1.33 | 1.32 | 1.36 | 1.38 | 1.39 |
| Expenses after expense reductions (f) | 1.22 | 1.22 | 1.22 | 1.33 | 1.38 |
| Net investment income (loss) | (0.13) | (0.07) | (0.02) | 0.19 | 0.19 |
| Portfolio turnover | 20 | 22 | 39 | 21 | 22 |
| Net assets at end of period (000 omitted) | $3,240 | $4,915 | $4,237 | $4,106 | $4,324 |
See Notes to Financial Statements
Financial Highlights – continued
| Class R4 | Year ended |
| | 10/31/22 | 10/31/21 | 10/31/20 | 10/31/19 | 10/31/18 |
| Net asset value, beginning of period | $66.29 | $51.38 | $46.65 | $40.66 | $40.75 |
| Income (loss) from investment operations |
| Net investment income (loss) (d) | $0.07 | $0.11 | $0.11 | $0.21 | $0.19 |
| Net realized and unrealized gain (loss) | (13.38) | 16.60 | 5.64 | 7.73 | 1.27 |
| Total from investment operations | $(13.31) | $16.71 | $5.75 | $7.94 | $1.46 |
| Less distributions declared to shareholders |
| From net investment income | $(0.04) | $(0.01) | $(0.14) | $(0.14) | $(0.15) |
| From net realized gain | (3.97) | (1.79) | (0.88) | (1.81) | (1.40) |
| Total distributions declared to shareholders | $(4.01) | $(1.80) | $(1.02) | $(1.95) | $(1.55) |
| Net asset value, end of period (x) | $48.97 | $66.29 | $51.38 | $46.65 | $40.66 |
| Total return (%) (r)(s)(t)(x) | (21.38) | 33.19 | 12.47 | 20.55 | 3.62 |
Ratios (%) (to average net assets)
and Supplemental data: |
| Expenses before expense reductions (f) | 1.08 | 1.07 | 1.11 | 1.13 | 1.14 |
| Expenses after expense reductions (f) | 0.97 | 0.97 | 0.97 | 1.06 | 1.13 |
| Net investment income (loss) | 0.13 | 0.18 | 0.22 | 0.49 | 0.46 |
| Portfolio turnover | 20 | 22 | 39 | 21 | 22 |
| Net assets at end of period (000 omitted) | $1,816 | $2,153 | $1,613 | $1,662 | $484 |
| Class R6 | Year ended |
| | 10/31/22 | 10/31/21 | 10/31/20 | 10/31/19 | 10/31/18 |
| Net asset value, beginning of period | $67.99 | $52.65 | $47.77 | $41.59 | $41.65 |
| Income (loss) from investment operations |
| Net investment income (loss) (d) | $0.12 | $0.17 | $0.14 | $0.23 | $0.23 |
| Net realized and unrealized gain (loss) | (13.74) | 17.01 | 5.78 | 7.93 | 1.30 |
| Total from investment operations | $(13.62) | $17.18 | $5.92 | $8.16 | $1.53 |
| Less distributions declared to shareholders |
| From net investment income | $(0.09) | $(0.05) | $(0.16) | $(0.17) | $(0.19) |
| From net realized gain | (3.97) | (1.79) | (0.88) | (1.81) | (1.40) |
| Total distributions declared to shareholders | $(4.06) | $(1.84) | $(1.04) | $(1.98) | $(1.59) |
| Net asset value, end of period (x) | $50.31 | $67.99 | $52.65 | $47.77 | $41.59 |
| Total return (%) (r)(s)(t)(x) | (21.31) | 33.30 | 12.54 | 20.64 | 3.71 |
Ratios (%) (to average net assets)
and Supplemental data: |
| Expenses before expense reductions (f) | 1.00 | 0.99 | 1.03 | 1.05 | 1.07 |
| Expenses after expense reductions (f) | 0.89 | 0.89 | 0.89 | 0.99 | 1.06 |
| Net investment income (loss) | 0.20 | 0.27 | 0.28 | 0.53 | 0.53 |
| Portfolio turnover | 20 | 22 | 39 | 21 | 22 |
| Net assets at end of period (000 omitted) | $238,136 | $306,209 | $212,634 | $126,958 | $68,931 |
See Notes to Financial Statements
Financial Highlights – continued
| (d) | Per share data is based on average shares outstanding. |
| (f) | Ratios do not reflect reductions from fees paid indirectly, if applicable. See Note 2 in the Notes to Financial Statements for additional information. |
| (r) | Certain expenses have been reduced without which performance would have been lower. |
| (s) | From time to time the fund may receive proceeds from litigation settlements, without which performance would be lower. |
| (t) | Total returns do not include any applicable sales charges. |
| (w) | Per share amount was less than $0.01. |
| (x) | The net asset values and total returns have been calculated on net assets which include adjustments made in accordance with U.S. generally accepted accounting principles required at period end for financial reporting purposes. |
See Notes to Financial Statements
Notes to Financial Statements
(1) Business and Organization
MFS Global Growth Fund (the fund) is a diversified series of MFS Series Trust VIII (the trust). The trust is organized as a Massachusetts business trust and is registered under the Investment Company Act of 1940, as amended, as an open-end management investment company.
The fund is an investment company and accordingly follows the investment company accounting and reporting guidance of the Financial Accounting Standards Board (FASB) Accounting Standards Codification Topic 946 Financial Services - Investment Companies.
(2) Significant Accounting Policies
General — The preparation of financial statements in conformity with U.S. generally accepted accounting principles requires management to make estimates and assumptions that affect the reported amounts of assets and liabilities, and disclosure of contingent assets and liabilities at the date of the financial statements and the reported amounts of increases and decreases in net assets from operations during the reporting period. Actual results could differ from those estimates. In the preparation of these financial statements, management has evaluated subsequent events occurring after the date of the fund’s Statement of Assets and Liabilities through the date that the financial statements were issued. The fund invests in foreign securities. Investments in foreign securities are vulnerable to the effects of changes in the relative values of the local currency and the U.S. dollar and to the effects of changes in each country’s market, economic, industrial, political, regulatory, geopolitical, environmental, public health, and other conditions.
In June 2022, the FASB issued Accounting Standards Update 2022-03, Fair Value Measurement (Topic 820) – Fair Value Measurement of Equity Securities Subject to Contractual Sale Restrictions (“ASU 2022-03”), which affects all entities that have investments in equity securities measured at fair value that are subject to contractual sale restrictions. ASU 2022-03 clarifies that a contractual restriction on the sale of an equity security is a characteristic of the reporting entity holding the equity security rather than a characteristic of the asset and, therefore, is not considered in measuring the fair value of the equity security. The fund decided to early adopt ASU 2022-03 effective as of June 30, 2022 as the guidance in ASU 2022-03 was consistent with the fund’s existing practices for fair value measurement.
Balance Sheet Offsetting — The fund's accounting policy with respect to balance sheet offsetting is that, absent an event of default by the counterparty or a termination of the agreement, the International Swaps and Derivatives Association (ISDA) Master Agreement, or similar agreement, does not result in an offset of reported amounts of financial assets and financial liabilities in the Statement of Assets and Liabilities across transactions between the fund and the applicable counterparty. The fund's right to setoff may be restricted or prohibited by the bankruptcy or insolvency laws of the particular jurisdiction to which a specific master netting agreement counterparty is subject. Balance sheet offsetting disclosures, to the extent applicable to the fund, have been included in the fund’s Significant Accounting Policies note under the captions for each of the fund’s in-scope financial instruments and transactions.
Notes to Financial Statements - continued
Investment Valuations — Subject to its oversight, the fund's Board of Trustees has delegated primary responsibility for determining or causing to be determined the value of the fund’s investments to MFS as the fund's adviser, pursuant to the fund’s valuation policy and procedures which have been adopted by the adviser and approved by the Board. Effective September 8, 2022, and in accordance with Rule 2a-5 under the Investment Company Act of 1940, the Board of Trustees designated the adviser as the “valuation designee” of the fund. If the adviser, as valuation designee, determines that reliable market quotations are not readily available for an investment, the investment is valued at fair value as determined in good faith by the adviser in accordance with the adviser’s fair valuation policy and procedures.
Under the fund's valuation policy and procedures, equity securities, including restricted equity securities, are generally valued at the last sale or official closing price on their primary market or exchange as provided by a third-party pricing service. Equity securities, for which there were no sales reported that day, are generally valued at the last quoted daily bid quotation on their primary market or exchange as provided by a third-party pricing service. Short-term instruments with a maturity at issuance of 60 days or less may be valued at amortized cost, which approximates market value.
Open-end investment companies are generally valued at net asset value per share. The values of foreign securities and other assets and liabilities expressed in foreign currencies are converted to U.S. dollars using the mean of bid and asked prices for rates provided by a third-party pricing service.
Under the fund’s valuation policy and procedures, market quotations are not considered to be readily available for debt instruments, floating rate loans, and many types of derivatives. These investments are generally valued at fair value based on information from third-party pricing services or otherwise determined by the adviser in accordance with the adviser’s fair valuation policy and procedures. Securities and other assets generally valued on the basis of information from a third-party pricing service may also be valued at a broker/dealer bid quotation. In determining values, third-party pricing services can utilize both transaction data and market information such as yield, quality, coupon rate, maturity, type of issue, trading characteristics, spreads and other market data. An investment may also be valued at fair value if the adviser determines that the investment’s value has been materially affected by events occurring after the close of the exchange or market on which the investment is principally traded (such as foreign exchange or market) and prior to the determination of the fund’s net asset value, or after the halt of trading of a specific security where trading does not resume prior to the close of the exchange or market on which the security is principally traded. Events that occur after foreign markets close (such as developments in foreign markets and significant movements in the U.S. markets) and prior to the determination of the fund’s net asset value may be deemed to have a material effect on the value of securities traded in foreign markets. Accordingly, the fund’s foreign equity securities may often be valued at fair value. The adviser generally relies on third-party pricing services or other information (such as the correlation with price movements of similar securities in the same or other markets; the type, cost and investment characteristics of the security; the business and financial condition of the issuer; and trading and other market data) to assist in determining whether to fair value and at what value to fair value an investment. The value of an investment for purposes of calculating the fund’s net asset value can differ depending on the source and method used to determine value. When fair valuation is used, the value of an investment used to determine the fund’s net asset value may differ from quoted or published prices for the same
Notes to Financial Statements - continued
investment. There can be no assurance that the fund could obtain the fair value assigned to an investment if it were to sell the investment at the same time at which the fund determines its net asset value per share.
Various inputs are used in determining the value of the fund's assets or liabilities. These inputs are categorized into three broad levels. In certain cases, the inputs used to measure fair value may fall into different levels of the fair value hierarchy. In such cases, an investment's level within the fair value hierarchy is based on the lowest level of input that is significant to the fair value measurement. The fund's assessment of the significance of a particular input to the fair value measurement in its entirety requires judgment, and considers factors specific to the investment. Level 1 includes unadjusted quoted prices in active markets for identical assets or liabilities. Level 2 includes other significant observable market-based inputs (including quoted prices for similar securities, interest rates, prepayment speed, and credit risk). Level 3 includes significant unobservable inputs, which may include the adviser's own assumptions in determining the fair value of investments. The following is a summary of the levels used as of October 31, 2022 in valuing the fund's assets and liabilities:
| Financial Instruments | Level 1 | Level 2 | Level 3 | Total |
| Equity Securities: | | | | |
| United States | $445,084,043 | $— | $— | $445,084,043 |
| Canada | 30,764,148 | — | — | 30,764,148 |
| United Kingdom | 28,671,506 | — | — | 28,671,506 |
| Switzerland | 28,233,886 | — | — | 28,233,886 |
| China | 13,089,531 | 5,066,458 | — | 18,155,989 |
| Japan | 4,064,662 | 9,195,900 | — | 13,260,562 |
| India | 11,132,960 | — | — | 11,132,960 |
| South Korea | — | 11,047,957 | — | 11,047,957 |
| France | 10,595,169 | — | — | 10,595,169 |
| Other Countries | 38,252,186 | — | — | 38,252,186 |
| Mutual Funds | 3,633,510 | — | — | 3,633,510 |
| Total | $613,521,601 | $25,310,315 | $— | $638,831,916 |
For further information regarding security characteristics, see the Portfolio of Investments.
Foreign Currency Translation — Purchases and sales of foreign investments, income, and expenses are converted into U.S. dollars based upon currency exchange rates prevailing on the respective dates of such transactions or on the reporting date for foreign denominated receivables and payables. Gains and losses attributable to foreign currency exchange rates on sales of securities are recorded for financial statement purposes as net realized gains and losses on investments. Gains and losses attributable to foreign exchange rate movements on receivables, payables, income and expenses are recorded for financial statement purposes as foreign currency transaction gains and losses. That portion of both realized and unrealized gains and losses on investments that results from fluctuations in foreign currency exchange rates is not separately disclosed.
Security Loans — Under its Securities Lending Agency Agreement with the fund, JPMorgan Chase and Co., as lending agent, loans the securities of the fund to certain qualified institutions (the “Borrowers”) approved by the fund. Security loans can be terminated at the discretion of either the lending agent or the fund and the related
Notes to Financial Statements - continued
securities must be returned within the earlier of the standard trade settlement period for such securities or within three business days. The loans are collateralized by cash and/or U.S. Treasury and federal agency obligations in an amount typically at least equal to the market value of the securities loaned. On loans collateralized by cash, the cash collateral is invested in a money market fund. The market value of the loaned securities is determined at the close of business of the fund and any additional required collateral is delivered to the fund on the next business day. The lending agent provides the fund with indemnification against Borrower default. In the event of Borrower default, the lending agent will, for the benefit of the fund, either purchase securities identical to those loaned or, when such purchase is commercially impracticable, pay the fund the market value of the loaned securities. In return, the lending agent assumes the fund's rights to the related collateral. If the collateral value is less than the cost to purchase identical securities, the lending agent is responsible for the shortfall, but only to the extent that such shortfall is not due to a decline in collateral value resulting from collateral reinvestment for which the fund bears the risk of loss. A portion of the income generated upon investment of the collateral is remitted to the Borrowers, and the remainder is allocated between the fund and the lending agent. On loans collateralized by U.S. Treasury and/or federal agency obligations, a fee is received from the Borrower, and is allocated between the fund and the lending agent. Income from securities lending is separately reported in the Statement of Operations. The dividend and interest income earned on the securities loaned is accounted for in the same manner as other dividend and interest income. At October 31, 2022, there were no securities on loan or collateral outstanding.
Indemnifications — Under the fund's organizational documents, its officers and Trustees may be indemnified against certain liabilities and expenses arising out of the performance of their duties to the fund. Additionally, in the normal course of business, the fund enters into agreements with service providers that may contain indemnification clauses. The fund's maximum exposure under these agreements is unknown as this would involve future claims that may be made against the fund that have not yet occurred.
Investment Transactions and Income — Investment transactions are recorded on the trade date. Interest income is recorded on the accrual basis. Dividends received in cash are recorded on the ex-dividend date. Certain dividends from foreign securities will be recorded when the fund is informed of the dividend if such information is obtained subsequent to the ex-dividend date. Dividend and interest payments received in additional securities are recorded on the ex-dividend or ex-interest date in an amount equal to the value of the security on such date. In determining the net gain or loss on securities sold, the cost of securities is determined on the identified cost basis.
The fund may receive proceeds from litigation settlements. Any proceeds received from litigation involving portfolio holdings are reflected in the Statement of Operations in realized gain/loss if the security has been disposed of by the fund or in unrealized gain/loss if the security is still held by the fund. Any other proceeds from litigation not related to portfolio holdings are reflected as other income in the Statement of Operations.
Fees Paid Indirectly — The fund's custody fee may be reduced by a credit earned under an arrangement that measures the value of U.S. dollars deposited with the custodian by the fund. The amount of the credit, for the year ended October 31, 2022, is shown as a reduction of total expenses in the Statement of Operations.
Notes to Financial Statements - continued
Tax Matters and Distributions — The fund intends to qualify as a regulated investment company, as defined under Subchapter M of the Internal Revenue Code, and to distribute all of its taxable income, including realized capital gains. As a result, no provision for federal income tax is required. The fund’s federal tax returns, when filed, will remain subject to examination by the Internal Revenue Service for a three year period. Management has analyzed the fund’s tax positions taken on federal and state tax returns for all open tax years and does not believe that there are any uncertain tax positions that require recognition of a tax liability. Foreign taxes, if any, have been accrued by the fund in the accompanying financial statements in accordance with the applicable foreign tax law. Foreign income taxes may be withheld by certain countries in which the fund invests. Additionally, capital gains realized by the fund on securities issued in or by certain foreign countries may be subject to capital gains tax imposed by those countries.
Distributions to shareholders are recorded on the ex-dividend date. Income and capital gain distributions are determined in accordance with income tax regulations, which may differ from U.S. generally accepted accounting principles. Certain capital accounts in the financial statements are periodically adjusted for permanent differences in order to reflect their tax character. These adjustments have no impact on net assets or net asset value per share. Temporary differences which arise from recognizing certain items of income, expense, gain or loss in different periods for financial statement and tax purposes will reverse at some time in the future.
Book/tax differences primarily relate to wash sale loss deferrals and treating a portion of the proceeds from redemptions as a distribution for tax purposes.
The tax character of distributions declared to shareholders for the last two fiscal years is as follows:
| | Year ended
10/31/22 | Year ended
10/31/21 |
| Ordinary income (including any short-term capital gains) | $5,593,687 | $256,496 |
| Long-term capital gains | 45,624,439 | 22,058,061 |
| Total distributions | $51,218,126 | $22,314,557 |
The federal tax cost and the tax basis components of distributable earnings were as follows:
| As of 10/31/22 | |
| Cost of investments | $496,695,967 |
| Gross appreciation | 198,885,797 |
| Gross depreciation | (56,749,848) |
| Net unrealized appreciation (depreciation) | $142,135,949 |
| Undistributed long-term capital gain | 22,607,057 |
| Other temporary differences | (55,410) |
| Total distributable earnings (loss) | $164,687,596 |
Multiple Classes of Shares of Beneficial Interest — The fund offers multiple classes of shares, which differ in their respective distribution and service fees. The fund's income, realized and unrealized gain (loss), and common expenses are allocated to shareholders based on the daily net assets of each class. Dividends are declared
Notes to Financial Statements - continued
separately for each class. Differences in per share dividend rates are generally due to differences in separate class expenses. Class B and Class C shares will convert to Class A shares approximately eight years after purchase. The fund’s distributions declared to shareholders as reported in the Statements of Changes in Net Assets are presented by class as follows:
| | Year
ended
10/31/22 | | Year
ended
10/31/21 |
| Class A | $23,491,411 | | $10,203,215 |
| Class B | 309,629 | | 173,880 |
| Class C | 1,215,564 | | 593,561 |
| Class I | 7,468,790 | | 3,425,408 |
| Class R1 | 56,495 | | 18,956 |
| Class R2 | 273,119 | | 118,556 |
| Class R3 | 298,884 | | 150,265 |
| Class R4 | 123,454 | | 56,587 |
| Class R6 | 17,980,780 | | 7,574,129 |
| Total | $51,218,126 | | $22,314,557 |
(3) Transactions with Affiliates
Investment Adviser — The fund has an investment advisory agreement with MFS to provide overall investment management and related administrative services and facilities to the fund. The management fee is computed daily and paid monthly at the following annual rates based on the fund's average daily net assets:
| Up to $1 billion | 0.90% |
| In excess of $1 billion and up to $2 billion | 0.75% |
| In excess of $2 billion | 0.65% |
MFS has agreed in writing to reduce its management fee by a specified amount if certain MFS mutual fund assets exceed thresholds agreed to by MFS and the fund's Board of Trustees. Effective March 1, 2022, MFS has also agreed in writing to waive at least 0.01% of its management fee as part of this agreement. The agreement to waive at least 0.01% of the management fee will continue until modified by the fund's Board of Trustees, but such agreement will continue at least until February 29, 2024. For the year ended October 31, 2022, this management fee reduction amounted to $105,056, which is included in the reduction of total expenses in the Statement of Operations.
The management fee incurred for the year ended October 31, 2022 was equivalent to an annual effective rate of 0.89% of the fund's average daily net assets.
The investment adviser has agreed in writing to pay a portion of the fund’s total annual operating expenses, excluding interest, taxes, extraordinary expenses, brokerage and transaction costs, certain tax reclaim recovery expenses (including contingency fees and closing agreement expenses), and investment-related expenses, such that total fund operating expenses do not exceed the following rates annually of each class’s average daily net assets:
| | | | | Classes | | | | |
| A | B | C | I | R1 | R2 | R3 | R4 | R6 |
| 1.22% | 1.97% | 1.97% | 0.97% | 1.97% | 1.47% | 1.22% | 0.97% | 0.90% |
Notes to Financial Statements - continued
This written agreement will continue until modified by the fund’s Board of Trustees, but such agreement will continue at least until February 29, 2024. For the year ended October 31, 2022, this reduction amounted to $739,365, which is included in the reduction of total expenses in the Statement of Operations.
Distributor — MFS Fund Distributors, Inc. (MFD), a wholly-owned subsidiary of MFS, as distributor, received $34,898 for the year ended October 31, 2022, as its portion of the initial sales charge on sales of Class A shares of the fund.
The Board of Trustees has adopted a distribution plan for certain share classes pursuant to Rule 12b-1 of the Investment Company Act of 1940.
The fund's distribution plan provides that the fund will pay MFD for services provided by MFD and financial intermediaries in connection with the distribution and servicing of certain share classes. One component of the plan is a distribution fee paid to MFD and another component of the plan is a service fee paid to MFD. MFD may subsequently pay all, or a portion, of the distribution and/or service fees to financial intermediaries.
Distribution Plan Fee Table:
| | Distribution
Fee Rate (d) | Service
Fee Rate (d) | Total
Distribution
Plan (d) | Annual
Effective
Rate (e) | Distribution
and Service
Fee |
| Class A | — | 0.25% | 0.25% | 0.25% | $ 849,823 |
| Class B | 0.75% | 0.25% | 1.00% | 1.00% | 34,643 |
| Class C | 0.75% | 0.25% | 1.00% | 1.00% | 137,930 |
| Class R1 | 0.75% | 0.25% | 1.00% | 1.00% | 6,915 |
| Class R2 | 0.25% | 0.25% | 0.50% | 0.50% | 16,763 |
| Class R3 | — | 0.25% | 0.25% | 0.25% | 10,043 |
| Total Distribution and Service Fees | | | | | $1,056,117 |
| (d) | In accordance with the distribution plan for certain classes, the fund pays distribution and/or service fees equal to these annual percentage rates of each class’s average daily net assets. The distribution and service fee rates disclosed by class represent the current rates in effect at the end of the reporting period. Any rate changes, if applicable, are detailed below. |
| (e) | The annual effective rates represent actual fees incurred under the distribution plan for the year ended October 31, 2022 based on each class's average daily net assets. MFD has voluntarily agreed to rebate a portion of each class's 0.25% service fee attributable to accounts for which there is no financial intermediary specified on the account except for accounts attributable to MFS or its affiliates' seed money. For the year ended October 31, 2022, this rebate amounted to $272, $1, and $19 for Class A, Class B, and Class C shares, respectively, and is included in the reduction of total expenses in the Statement of Operations. |
Certain Class A shares are subject to a contingent deferred sales charge (CDSC) in the event of a shareholder redemption within 18 months of purchase. Class B shares are subject to a CDSC in the event of a shareholder redemption within six years of
Notes to Financial Statements - continued
purchase. Class C shares are subject to a CDSC in the event of a shareholder redemption within 12 months of purchase. All contingent deferred sales charges are paid to MFD and during the year ended October 31, 2022, were as follows:
| | Amount |
| Class A | $3,735 |
| Class B | 462 |
| Class C | 903 |
Shareholder Servicing Agent — MFS Service Center, Inc. (MFSC), a wholly-owned subsidiary of MFS, receives a fee from the fund for its services as shareholder servicing agent calculated as a percentage of the average daily net assets of the fund as determined periodically under the supervision of the fund's Board of Trustees. For the year ended October 31, 2022, the fee was $103,009, which equated to 0.0138% annually of the fund's average daily net assets. MFSC also receives reimbursement from the fund for out-of-pocket expenses, sub-accounting and other shareholder servicing costs which may be paid to affiliated and unaffiliated service providers. Class R6 shares do not incur sub-accounting fees. For the year ended October 31, 2022, these out-of-pocket expenses, sub-accounting and other shareholder servicing costs amounted to $441,210.
Administrator — MFS provides certain financial, legal, shareholder communications, compliance, and other administrative services to the fund. Under an administrative services agreement, the fund reimburses MFS the costs incurred to provide these services. The fund is charged an annual fixed amount of $17,500 plus a fee based on average daily net assets. The administrative services fee incurred for the year ended October 31, 2022 was equivalent to an annual effective rate of 0.0164% of the fund's average daily net assets.
Trustees’ and Officers’ Compensation — The fund pays compensation to independent Trustees in the form of a retainer, attendance fees, and additional compensation to Board and Committee chairpersons. The fund does not pay compensation directly to Trustees or officers of the fund who are also officers of the investment adviser, all of whom receive remuneration from MFS for their services to the fund. Certain officers and Trustees of the fund are officers or directors of MFS, MFD, and MFSC.
Other — The fund invests in the MFS Institutional Money Market Portfolio which is managed by MFS and seeks current income consistent with preservation of capital and liquidity. This money market fund does not pay a management fee to MFS but does incur investment and operating costs.
The fund is permitted to engage in purchase and sale transactions with funds and accounts for which MFS serves as investment adviser or sub-adviser (“cross-trades”) pursuant to a policy adopted by the Board of Trustees. This policy has been designed to ensure that cross-trades conducted by the fund comply with Rule 17a-7 under the Investment Company Act of 1940. During the year ended October 31, 2022, the fund engaged in purchase and sale transactions pursuant to this policy, which amounted to $300,323 and $774,780, respectively. The sales transactions resulted in net realized gains (losses) of $(145,236).
Notes to Financial Statements - continued
(4) Portfolio Securities
For the year ended October 31, 2022, purchases and sales of investments, other than short-term obligations, aggregated $147,065,871 and $184,280,423, respectively.
(5) Shares of Beneficial Interest
The fund's Declaration of Trust permits the Trustees to issue an unlimited number of full and fractional shares of beneficial interest. Transactions in fund shares were as follows:
| | Year ended
10/31/22 | | Year ended
10/31/21 |
| | Shares | Amount | | Shares | Amount |
| Shares sold | | | | | |
| Class A | 483,754 | $27,408,011 | | 821,264 | $49,225,929 |
| Class B | 204 | 11,025 | | 2,848 | 141,892 |
| Class C | 19,153 | 859,818 | | 49,729 | 2,451,154 |
| Class I | 818,474 | 44,853,839 | | 480,043 | 29,475,683 |
| Class R1 | 2,318 | 104,219 | | 5,406 | 267,847 |
| Class R2 | 6,357 | 330,334 | | 20,441 | 1,229,491 |
| Class R3 | 10,773 | 549,985 | | 10,231 | 604,811 |
| Class R4 | 6,075 | 346,432 | | 6,867 | 409,139 |
| Class R6 | 1,149,066 | 64,935,458 | | 1,496,168 | 93,197,676 |
| | 2,496,174 | $139,399,121 | | 2,892,997 | $177,003,622 |
Shares issued to shareholders
in reinvestment of distributions | | | | | |
| Class A | 361,063 | $22,433,130 | | 174,579 | $9,697,846 |
| Class B | 5,950 | 305,932 | | 3,644 | 170,911 |
| Class C | 23,930 | 1,212,544 | | 12,673 | 586,230 |
| Class I | 115,424 | 7,402,140 | | 59,604 | 3,404,605 |
| Class R1 | 1,118 | 56,495 | | 411 | 18,956 |
| Class R2 | 4,599 | 273,076 | | 2,187 | 116,712 |
| Class R3 | 4,836 | 298,883 | | 2,718 | 150,265 |
| Class R4 | 1,976 | 123,453 | | 972 | 54,139 |
| Class R6 | 272,289 | 17,459,199 | | 125,531 | 7,170,353 |
| | 791,185 | $49,564,852 | | 382,319 | $21,370,017 |
Notes to Financial Statements - continued
| | Year ended
10/31/22 | | Year ended
10/31/21 |
| | Shares | Amount | | Shares | Amount |
| Shares reacquired | | | | | |
| Class A | (867,724) | $(48,815,737) | | (723,165) | $(43,994,460) |
| Class B | (21,988) | (1,045,537) | | (22,700) | (1,168,526) |
| Class C | (83,457) | (3,752,277) | | (81,516) | (4,090,913) |
| Class I | (969,502) | (53,919,443) | | (542,746) | (33,815,783) |
| Class R1 | (1,797) | (80,509) | | (2,062) | (101,675) |
| Class R2 | (34,145) | (1,791,567) | | (16,625) | (949,459) |
| Class R3 | (23,501) | (1,310,152) | | (21,154) | (1,271,586) |
| Class R4 | (3,452) | (215,116) | | (6,755) | (408,953) |
| Class R6 | (1,191,261) | (69,089,270) | | (1,156,517) | (72,491,247) |
| | (3,196,827) | $(180,019,608) | | (2,573,240) | $(158,292,602) |
| Net change | | | | | |
| Class A | (22,907) | $1,025,404 | | 272,678 | $14,929,315 |
| Class B | (15,834) | (728,580) | | (16,208) | (855,723) |
| Class C | (40,374) | (1,679,915) | | (19,114) | (1,053,529) |
| Class I | (35,604) | (1,663,464) | | (3,099) | (935,495) |
| Class R1 | 1,639 | 80,205 | | 3,755 | 185,128 |
| Class R2 | (23,189) | (1,188,157) | | 6,003 | 396,744 |
| Class R3 | (7,892) | (461,284) | | (8,205) | (516,510) |
| Class R4 | 4,599 | 254,769 | | 1,084 | 54,325 |
| Class R6 | 230,094 | 13,305,387 | | 465,182 | 27,876,782 |
| | 90,532 | $8,944,365 | | 702,076 | $40,081,037 |
Effective June 1, 2019, purchases of the fund’s Class B shares were closed to new and existing investors subject to certain exceptions.
(6) Line of Credit
The fund and certain other funds managed by MFS participate in a $1.45 billion unsecured committed line of credit of which $1.2 billion is reserved for use by the fund and certain other MFS U.S. funds. The line of credit is provided by a syndicate of banks under a credit agreement. Borrowings may be made for temporary financing needs. Interest is charged to each fund, based on its borrowings, generally at a rate equal to the highest of 1) Daily Simple SOFR (Secured Overnight Financing Rate) plus 0.10%, 2) the Federal Funds Effective Rate, or 3) the Overnight Bank Funding Rate, each plus an agreed upon spread. A commitment fee, based on the average daily unused portion of the committed line of credit, is allocated among the participating funds. The line of credit expires on March 16, 2023, unless extended or renewed. In addition, the fund and other funds managed by MFS have established unsecured uncommitted borrowing arrangements with certain banks for temporary financing needs. Interest is charged to each fund, based on its borrowings, at rates equal to customary reference rates plus an
Notes to Financial Statements - continued
agreed upon spread. For the year ended October 31, 2022, the fund’s commitment fee and interest expense were $3,230 and $0, respectively, and are included in “Miscellaneous” expense in the Statement of Operations.
(7) Investments in Affiliated Issuers
An affiliated issuer may be considered one in which the fund owns 5% or more of the outstanding voting securities, or a company which is under common control. For the purposes of this report, the following were affiliated issuers:
| Affiliated Issuers | Beginning
Value | Purchases | Sales
Proceeds | Realized
Gain
(Loss) | Change in
Unrealized
Appreciation or
Depreciation | Ending
Value |
| MFS Institutional Money Market Portfolio | $4,748,732 | $120,459,421 | $121,575,196 | $553 | $— | $3,633,510 |
| Affiliated Issuers | Dividend
Income | Capital Gain
Distributions |
| MFS Institutional Money Market Portfolio | $46,943 | $— |
(8) LIBOR Transition
Certain of the fund's investments, including investments in certain debt instruments and derivatives (if any), as well as borrowings by the fund and certain other contractual arrangements of the fund, may be based on the London Interbank Offered Rate (“LIBOR”). In 2017, the regulatory authority that oversees financial services firms in the United Kingdom announced plans to transition away from LIBOR by the end of 2021. In March 2021, the administrator of LIBOR announced the extension of the publication of the more commonly used U.S. dollar LIBOR settings to the end of June 2023. Although the full impacts of the transition away from LIBOR are not fully known, the transition may result in, among other things, an increase in volatility or illiquidity of the markets for instruments that currently rely on LIBOR to determine interest rates and this could have an adverse impact on the fund's performance. With respect to the fund's accounting for investments, including investments in certain debt instruments and derivatives, as well as borrowings by the fund and any other contractual arrangements of the fund that undergo reference rate-related modifications as a result of the transition, management will rely upon the relief provided by FASB Codification Topic 848 – Reference Rate Reform (Topic 848). The guidance in Topic 848 permits the fund to account for those modified contracts as a continuation of the existing contracts. Management is still evaluating the impact to the fund of the June 30, 2023 planned discontinuation of the more commonly used U.S. dollar LIBOR settings.
(9) Russia and Ukraine Conflict
The market disruptions, which began in late February 2022, associated with geopolitical events related to the conflict between Russia and Ukraine may adversely affect the value of the fund’s assets and thus the fund’s performance. Management continues to monitor these events and to evaluate the related impacts, if any, to the fund.
Report of Independent Registered Public Accounting Firm
To the Board of Trustees of MFS Series Trust VIII and the Shareholders of MFS Global Growth Fund:
Opinion on the Financial Statements and Financial Highlights
We have audited the accompanying statement of assets and liabilities of MFS Global Growth Fund (the “Fund”), including the portfolio of investments, as of October 31, 2022, the related statement of operations for the year then ended, the statements of changes in net assets for each of the two years in the period then ended, the financial highlights for each of the five years in the period then ended, and the related notes. In our opinion, the financial statements and financial highlights present fairly, in all material respects, the financial position of the Fund as of October 31, 2022, and the results of its operations for the year then ended, the changes in its net assets for each of the two years in the period then ended, and the financial highlights for each of the five years in the period then ended, in conformity with accounting principles generally accepted in the United States of America.
Basis for Opinion
These financial statements and financial highlights are the responsibility of the Fund's management. Our responsibility is to express an opinion on the Fund's financial statements and financial highlights based on our audits. We are a public accounting firm registered with the Public Company Accounting Oversight Board (United States) (PCAOB) and are required to be independent with respect to the Fund in accordance with the U.S. federal securities laws and the applicable rules and regulations of the Securities and Exchange Commission and the PCAOB.
We conducted our audits in accordance with the standards of the PCAOB. Those standards require that we plan and perform the audit to obtain reasonable assurance about whether the financial statements and financial highlights are free of material misstatement, whether due to error or fraud. The Fund is not required to have, nor were we engaged to perform, an audit of its internal control over financial reporting. As part of our audits, we are required to obtain an understanding of internal control over financial reporting but not for the purpose of expressing an opinion on the effectiveness of the Fund's internal control over financial reporting. Accordingly, we express no such opinion.
Our audits included performing procedures to assess the risks of material misstatement of the financial statements and financial highlights, whether due to error or fraud, and performing procedures that respond to those risks. Such procedures included examining, on a test basis, evidence regarding the amounts and disclosures in the financial statements and financial highlights. Our audits also included evaluating the accounting principles used and significant estimates made by management, as well as
Report of Independent Registered Public Accounting Firm – continued
evaluating the overall presentation of the financial statements and financial highlights. Our procedures included confirmation of securities owned as of October 31, 2022, by correspondence with the custodian. We believe that our audits provide a reasonable basis for our opinion.
DELOITTE & TOUCHE LLP
Boston, Massachusetts
December 15, 2022
We have served as the auditor of one or more of the MFS investment companies since 1924.
Trustees and Officers — Identification and Background
The Trustees and Officers of the Trust, as of December 1, 2022, are listed below, together with their principal occupations during the past five years. (Their titles may have varied during that period.) The address of each Trustee and Officer is 111 Huntington Avenue, Boston, Massachusetts 02199-7618.
| Name, Age | | Position(s) Held with Fund | | Trustee/Officer Since(h) | | Number of MFS Funds overseen by the Trustee | | Principal Occupations During
the Past Five Years | | Other Directorships During
the Past Five Years (j) |
| INTERESTED TRUSTEES | | | | | | | | | | |
Michael W. Roberge (k)
(age 56) | | Trustee | | January 2021 | | 136 | | Massachusetts Financial Services Company, Chairman (since January 2021); Chief Executive Officer (since January 2017); Director; Chairman of the Board (since January 2022); President (until December 2018); Chief Investment Officer (until December 2018) | | N/A |
| INDEPENDENT TRUSTEES | | | | | | | | | | |
John P. Kavanaugh
(age 68) | | Trustee and Chair of Trustees | | January 2009 | | 136 | | Private investor | | N/A |
Steven E. Buller
(age 71) | | Trustee | | February 2014 | | 136 | | Private investor | | N/A |
John A. Caroselli
(age 68) | | Trustee | | March 2017 | | 136 | | Private investor; JC Global Advisors, LLC (management consulting), President (since 2015) | | N/A |
Maureen R. Goldfarb
(age 67) | | Trustee | | January 2009 | | 136 | | Private investor | | N/A |
Peter D. Jones
(age 67) | | Trustee | | January 2019 | | 136 | | Private investor | | N/A |
James W. Kilman, Jr.
(age 61) | | Trustee | | January 2019 | | 136 | | Burford Capital Limited (finance and investment management), Senior Advisor (since May 3, 2021), Chief Financial Officer (2019 - May 2, 2021); KielStrand Capital LLC (family office), Chief Executive Officer (since 2016) | | Alpha-En Corporation, Director (2016-2019) |
Trustees and Officers - continued
| Name, Age | | Position(s) Held with Fund | | Trustee/Officer Since(h) | | Number of MFS Funds overseen by the Trustee | | Principal Occupations During
the Past Five Years | | Other Directorships During
the Past Five Years (j) |
Clarence Otis, Jr.
(age 66) | | Trustee | | March 2017 | | 136 | | Private investor | | VF Corporation, Director; Verizon Communications, Inc., Director; The Travelers Companies, Director |
Maryanne L. Roepke
(age 66) | | Trustee | | May 2014 | | 136 | | Private investor | | N/A |
Laurie J. Thomsen
(age 65) | | Trustee | | March 2005 | | 136 | | Private investor | | The Travelers Companies, Director; Dycom Industries, Inc., Director |
| Name, Age | | Position(s) Held with
Fund | | Trustee/Officer Since(h) | | Number of MFS Funds for which the Person is an Officer | | Principal Occupations During
the Past Five Years |
| OFFICERS | | | | | | | | |
Christopher R. Bohane (k)
(age 48) | | Assistant Secretary and Assistant Clerk | | July 2005 | | 136 | | Massachusetts Financial Services Company, Senior Vice President and Senior Managing Counsel |
Kino Clark (k)
(age 54) | | Assistant Treasurer | | January 2012 | | 136 | | Massachusetts Financial Services Company, Vice President |
John W. Clark, Jr. (k)
(age 55) | | Assistant Treasurer | | April 2017 | | 136 | | Massachusetts Financial Services Company, Vice President |
David L. DiLorenzo (k)
(age 54) | | President | | July 2005 | | 136 | | Massachusetts Financial Services Company, Senior Vice President |
Heidi W. Hardin (k)
(age 55) | | Secretary and Clerk | | April 2017 | | 136 | | Massachusetts Financial Services Company, Executive Vice President and General Counsel |
Brian E. Langenfeld (k)
(age 49) | | Assistant Secretary and Assistant Clerk | | June 2006 | | 136 | | Massachusetts Financial Services Company, Vice President and Managing Counsel |
Trustees and Officers - continued
| Name, Age | | Position(s) Held with
Fund | | Trustee/Officer Since(h) | | Number of MFS Funds for which the Person is an Officer | | Principal Occupations During
the Past Five Years |
Rosa E. Licea-Mailloux (k)
(age 46) | | Chief Compliance Officer | | March 2022 | | 136 | | Massachusetts Financial Services Company, Vice President (since 2018); Director of Corporate Compliance (2018-2021), Senior Director Compliance (2021-2022), Senior Managing Director of North American Compliance & Chief Compliance Officer (since March 2022); Natixis Investment Managers (investment management), Funds Chief Compliance Officer, Deputy General Counsel & Senior Vice President (until 2018) |
Amanda S. Mooradian (k)
(age 43) | | Assistant Secretary and Assistant Clerk | | September 2018 | | 136 | | Massachusetts Financial Services Company, Assistant Vice President and Senior Counsel |
Susan A. Pereira (k)
(age 52) | | Assistant Secretary and Assistant Clerk | | July 2005 | | 136 | | Massachusetts Financial Services Company, Vice President and Managing Counsel |
Kasey L. Phillips (k)
(age 51) | | Assistant Treasurer | | September 2012 | | 136 | | Massachusetts Financial Services Company, Vice President |
Matthew A. Stowe (k)
(age 48) | | Assistant Secretary and Assistant Clerk | | October 2014 | | 136 | | Massachusetts Financial Services Company, Vice President and Senior Managing Counsel |
William B. Wilson (k)
(age 40) | | Assistant Secretary and Assistant Clerk | | October 2022 | | 136 | | Massachusetts Financial Services Company, Assistant Vice President and Counsel |
James O. Yost (k)
(age 62) | | Treasurer | | September 1990 | | 136 | | Massachusetts Financial Services Company, Senior Vice President |
| (h) | Date first appointed to serve as Trustee/Officer of an MFS Fund. Each Trustee has served continuously since appointment unless indicated otherwise. From January 2012 through December 2016, Messrs. DiLorenzo and Yost served as Treasurer and Deputy Treasurer of the Funds, respectively. |
| (j) | Directorships or trusteeships of companies required to report to the Securities and Exchange Commission (i.e., “public companies”). |
| (k) | “Interested person” of the Trust within the meaning of the Investment Company Act of 1940 (referred to as the 1940 Act), which is the principal federal law governing investment companies like the fund, as a result of a position with MFS. The address of MFS is 111 Huntington Avenue, Boston, Massachusetts 02199-7618. |
Trustees and Officers - continued
Each Trustee (other than Messrs. Jones, Kilman and Roberge) has been elected by shareholders and each Trustee and Officer holds office until his or her successor is chosen and qualified or until his or her earlier death, resignation, retirement or removal. Mr. Roberge became a Trustee of the Funds on January 1, 2021 and Messrs. Jones and Kilman became Trustees of the Funds on January 1, 2019. The Trust does not hold annual meetings for the purpose of electing Trustees, and Trustees are not elected for fixed terms. Under the terms of the Board's retirement policy, an Independent Trustee shall retire at the end of the calendar year in which he or she reaches the earlier of 75 years of age or 15 years of service on the Board (or, in the case of any Independent Trustee who joined the Board prior to 2015, 20 years of service on the Board).
Messrs. Buller, Kilman and Otis and Ms. Roepke are members of the Trust’s Audit Committee.
Each of the Interested Trustees and certain Officers hold comparable officer positions with certain affiliates of MFS.
The Statement of Additional Information for a Fund includes further information about the Trustees and is available without charge upon request by calling 1-800-225-2606.
| Investment Adviser | Custodian |
Massachusetts Financial Services Company
111 Huntington Avenue
Boston, MA 02199-7618 | JPMorgan Chase Bank, NA
4 Metrotech Center
New York, NY 11245 |
| Distributor | Independent Registered Public Accounting Firm |
MFS Fund Distributors, Inc.
111 Huntington Avenue
Boston, MA 02199-7618 | Deloitte & Touche LLP
200 Berkeley Street
Boston, MA 02116 |
| Portfolio Manager(s) | |
Jeffrey Constantino
Joseph Skorski | |
Board Review of Investment Advisory Agreement
MFS Global Growth Fund
The Investment Company Act of 1940 requires that both the full Board of Trustees and a majority of the non-interested (“independent”) Trustees, voting separately, annually approve the continuation of the Fund’s investment advisory agreement with MFS. The Trustees consider matters bearing on the Fund and its advisory arrangements at their meetings throughout the year, including a review of performance data at each regular meeting. In addition, the independent Trustees met several times over the course of three months beginning in May and ending in July 2022 (“contract review meetings”) for the specific purpose of considering whether to approve the continuation of the investment advisory agreement for the Fund and the other investment companies that the Board oversees (the “MFS Funds”). The independent Trustees were assisted in their evaluation of the Fund’s investment advisory agreement by independent legal counsel, from whom they received separate legal advice and with whom they met separately from MFS during various contract review meetings. The independent Trustees were also assisted in this process by an independent consultant who was retained by and reported to the independent Trustees.
In connection with their deliberations regarding the continuation of the investment advisory agreement, the Trustees, including the independent Trustees, considered such information and factors as they believed, in light of the legal advice furnished to them and their own business judgment, to be relevant. The investment advisory agreement for the Fund was considered separately, although the Trustees also took into account the common interests of all MFS Funds in their review. As described below, the Trustees considered the nature, quality, and extent of the various investment advisory, administrative, and shareholder services performed by MFS under the existing investment advisory agreement and other arrangements with the Fund.
In connection with their contract review meetings, the Trustees received and relied upon materials that included, among other items: (i) information provided by Broadridge Financial Solutions, Inc. (“Broadridge”), an independent third party, on the investment performance of the Fund for various time periods ended December 31, 2021 and the investment performance of a group of funds with substantially similar investment classifications/objectives (the “Broadridge performance universe”), (ii) information provided by Broadridge on the Fund’s advisory fees and other expenses and the advisory fees and other expenses of comparable funds identified by Broadridge as well as all other funds in the same investment classification/category (the “Broadridge expense group and universe”), (iii) information provided by MFS on the advisory fees of portfolios of other clients of MFS, including institutional separate accounts and other clients, (iv) information as to whether and to what extent applicable expense waivers, reimbursements or fee “breakpoints” are observed for the Fund, (v) information regarding MFS’ financial results and financial condition, including MFS’ and certain of its affiliates’ estimated profitability from services performed for the Fund and the MFS Funds as a whole, and compared to MFS’ institutional business, (vi) MFS’ views regarding the outlook for the mutual fund industry and the strategic business plans of MFS, (vii) descriptions of various functions performed by MFS for the Funds, such as compliance monitoring and portfolio trading practices, and (viii) information regarding the overall organization of MFS, including information about
Board Review of Investment Advisory Agreement - continued
MFS’ senior management and other personnel providing investment advisory, administrative and other services to the Fund and the other MFS Funds. The comparative performance, fee and expense information prepared and provided by Broadridge was not independently verified and the independent Trustees did not independently verify any information provided to them by MFS.
The Trustees’ conclusion as to the continuation of the investment advisory agreement was based on a comprehensive consideration of all information provided to the Trustees and not the result of any single factor. Some of the factors that figured particularly in the Trustees’ deliberations are described below, although individual Trustees may have evaluated the information presented differently from one another, giving different weights to various factors. It is also important to recognize that the fee arrangements for the Fund and other MFS Funds are the result of years of review and discussion between the independent Trustees and MFS, that certain aspects of such arrangements may receive greater scrutiny in some years than in others, and that the Trustees’ conclusions may be based, in part, on their consideration of these same arrangements during the course of the year and in prior years.
Based on information provided by Broadridge and MFS, the Trustees reviewed the Fund’s total return investment performance as well as the Broadridge performance universe over various time periods. The Trustees placed particular emphasis on the total return performance of the Fund’s Class I shares in comparison to the performance of funds in its Broadridge performance universe over the five-year period ended December 31, 2021, which the Trustees believed was a long enough period to reflect differing market conditions. The total return performance of the Fund’s Class I shares was in the 2nd quintile relative to the other funds in the universe for this five-year period (the 1st quintile being the best performers and the 5th quintile being the worst performers). The total return performance of the Fund’s Class I shares was in the 2nd quintile for the one-year period and the 3rd quintile for the three-year period ended December 31, 2021 relative to the Broadridge performance universe. Because of the passage of time, these performance results may differ from the performance results for more recent periods, including those shown elsewhere in this report.
In the course of their deliberations, the Trustees took into account information provided by MFS in connection with the contract review meetings, as well as during investment review meetings conducted with portfolio management personnel during the course of the year regarding the Fund’s performance. After reviewing these and related factors, the Trustees concluded, within the context of their overall conclusions regarding the investment advisory agreement, that they were satisfied with MFS’ responses and efforts relating to investment performance.
In assessing the reasonableness of the Fund’s advisory fee, the Trustees considered, among other information, the Fund’s advisory fee and the total expense ratio of the Fund’s Class I shares as a percentage of average daily net assets and the advisory fee and total expense ratios of the Broadridge expense group based on information provided by Broadridge. The Trustees considered that MFS currently observes an expense limitation for the Fund, which may not be changed without the Trustees’ approval. The Trustees also considered that, according to the data provided by Broadridge (which takes into account any fee reductions or expense limitations that
Board Review of Investment Advisory Agreement - continued
were in effect during the Fund’s last fiscal year), the Fund’s effective advisory fee rate was approximately at the Broadridge expense group median and the Fund's total expense ratio was higher than the Broadridge expense group median.
The Trustees also considered the advisory fees charged by MFS to any institutional separate accounts advised by MFS (“separate accounts”) and unaffiliated investment companies for which MFS serves as subadviser (“subadvised funds”) that have comparable investment strategies to the Fund, if any. In comparing these fees, the Trustees considered information provided by MFS as to the generally broader scope of services provided by MFS to the Fund, as well as the more extensive regulatory burdens imposed on MFS in managing the Fund, in comparison to separate accounts and subadvised funds. The Trustees also considered the higher demands placed on MFS’ investment personnel and trading infrastructure as a result of the daily cash in-flows and out-flows of the Fund in comparison to separate accounts.
The Trustees also considered whether the Fund may benefit from any economies of scale in the management of the Fund in the event of growth in assets of the Fund and/or growth in assets of the MFS Funds as a whole. They noted that the Fund’s advisory fee rate schedule is subject to contractual breakpoints that reduce the Fund’s advisory fee rate on average daily net assets over $1 billion and $2 billion. The Trustees also noted that MFS has agreed in writing to waive a portion of the management fees of certain MFS Funds, including the Fund, if the total combined assets of certain funds within the MFS Funds’ complex increase above agreed upon thresholds (the “group fee waiver”), enabling the Fund’s shareholders to share in the benefits from any economies of scale at the complex level. The group fee waiver is reviewed and renewed annually between the Board and MFS. The Trustees concluded that the breakpoints and the group fee waiver were sufficient to allow the Fund to benefit from economies of scale as its assets and overall complex assets grow.
The Trustees also considered information prepared by MFS relating to MFS’ costs and profits with respect to the Fund, the MFS Funds considered as a group, and other investment companies and accounts advised by MFS, as well as MFS’ methodologies used to determine and allocate its costs to the MFS Funds, the Fund and other accounts and products for purposes of estimating profitability.
After reviewing these and other factors described herein, the Trustees concluded, within the context of their overall conclusions regarding the investment advisory agreement, that the advisory fees charged to the Fund represent reasonable compensation in light of the services being provided by MFS to the Fund.
In addition, the Trustees considered MFS’ resources and related efforts to continue to retain, attract and motivate capable personnel to serve the Fund. The Trustees also considered current and developing conditions in the financial services industry, including the presence of large and well-capitalized companies which are spending, and appear to be prepared to continue to spend, substantial sums to engage personnel and to provide services to competing investment companies. In this regard, the Trustees also considered the financial resources of MFS and its ultimate parent, Sun Life Financial Inc. The Trustees also considered the advantages and possible disadvantages to the Fund of having an adviser that also serves other investment companies as well as other accounts.
Board Review of Investment Advisory Agreement - continued
The Trustees also considered the nature, quality, cost, and extent of administrative, transfer agency, and distribution services provided to the Fund by MFS and its affiliates under agreements and plans other than the investment advisory agreement, including any 12b-1 fees the Fund pays to MFS Fund Distributors, Inc., an affiliate of MFS. The Trustees also considered the nature, extent and quality of certain other services MFS performs or arranges for on the Fund’s behalf, which may include securities lending programs, directed expense payment programs, class action recovery programs, and MFS’ interaction with third-party service providers, principally custodians and sub-custodians. The Trustees concluded that the various non-advisory services provided by MFS and its affiliates on behalf of the Fund were satisfactory.
The Trustees considered so-called “fall-out benefits” to MFS such as reputational value derived from serving as investment manager to the MFS Funds. The Trustees also considered that MFS discontinued its historic practice of obtaining investment research from portfolio brokerage commissions paid by certain MFS Funds effective January 2018, and directly pays or voluntarily reimburses a Fund, if applicable, for the costs of external research acquired through the use of the Fund’s portfolio brokerage commissions.
Based on their evaluation of factors that they deemed to be material, including those factors described above, the Board of Trustees, including the independent Trustees, concluded that the Fund’s investment advisory agreement with MFS should be continued for an additional one-year period, commencing August 1, 2022.
Proxy Voting Policies and Information
MFS votes proxies on behalf of the fund pursuant to proxy voting policies and procedures that are available without charge, upon request, by calling 1-800-225-2606, by visiting mfs.com/proxyvoting, or by visiting the SEC’s Web site at http://www.sec.gov.
Information regarding how the fund voted proxies relating to portfolio securities during the most recent twelve-month period ended June 30 is available by August 31 of each year without charge by visiting mfs.com/proxyvoting, or by visiting the SEC’s Web site at http://www.sec.gov.
Quarterly Portfolio Disclosure
The fund files a complete schedule of portfolio holdings with the SEC for the first and third quarters of each fiscal year as an exhibit to its reports on Form N-PORT. The fund's Form N-PORT reports are available on the SEC's Web site at http://www.sec.gov. A shareholder can obtain the portfolio holdings report for the first and third quarters of the fund's fiscal year at mfs.com/openendfunds by choosing the fund's name and then scrolling to the “Resources” section and clicking on the “Prospectus and Reports” tab.
Further Information
From time to time, MFS may post important information about the fund or the MFS Funds on the MFS Web site (mfs.com). This information is available at https://www.mfs.com/announcements or at mfs.com/openendfunds by choosing the fund’s name and then scrolling to the “Resources” section and clicking on the “Announcements” tab, if any.
Information About Fund Contracts and Legal Claims
The fund has entered into contractual arrangements with an investment adviser, administrator, distributor, shareholder servicing agent, and custodian who each provide services to the fund. Unless expressly stated otherwise, shareholders are not parties to, or intended beneficiaries of these contractual arrangements, and these contractual arrangements are not intended to create any shareholder right to enforce them against the service providers or to seek any remedy under them against the service providers, either directly or on behalf of the fund.
Under the Trust’s By-Laws and Declaration of Trust, any claims asserted against or on behalf of the MFS Funds, including claims against Trustees and Officers, must be brought in state and federal courts located within the Commonwealth of Massachusetts.
Federal Tax Information (unaudited)
The fund will notify shareholders of amounts for use in preparing 2022 income tax forms in January 2023. The following information is provided pursuant to provisions of the Internal Revenue Code.
The fund designates the maximum amount allowable as qualified dividend income eligible to be taxed at the same rate as long-term capital gain.
The fund designates $54,603,000 as capital gain dividends paid during the fiscal year.
For corporate shareholders, 85.49% of the ordinary income dividends paid during the fiscal year qualify for the corporate dividends received deduction.
Federal Tax Information (unaudited) - continued
The fund designates the maximum amount allowable as Section 199A dividends as defined in Proposed Treasury Regulation §1.199A-3(d).
| FACTS | WHAT DOES MFS DO WITH YOUR PERSONAL INFORMATION? |
| Why? | Financial companies choose how they share your personal information. Federal law gives consumers the right to limit some but not all sharing. Federal law also requires us to tell you how we collect, share, and protect your personal information. Please read this notice carefully to understand what we do. |
| What? | The types of personal information we collect and share depend on the product or service you have with us. This information can include: |
| • Social Security number and account balances |
| • Account transactions and transaction history |
| • Checking account information and wire transfer instructions |
| When you are no longer our customer, we continue to share your information as described in this notice. |
| How? | All financial companies need to share customers' personal information to run their everyday business. In the section below, we list the reasons financial companies can share their customers' personal information; the reasons MFS chooses to share; and whether you can limit this sharing. |
Reasons we can share your
personal information | Does MFS share? | Can you limit
this sharing? |
For our everyday business purposes –
such as to process your transactions, maintain your
account(s), respond to court orders and legal
investigations, or report to credit bureaus | Yes | No |
For our marketing purposes –
to offer our products and services to you | No | We don't share |
For joint marketing with other
financial companies | No | We don't share |
For our affiliates' everyday business purposes –
information about your transactions and experiences | No | We don't share |
For our affiliates' everyday business purposes –
information about your creditworthiness | No | We don't share |
| For nonaffiliates to market to you | No | We don't share |
| Questions? | Call 800-225-2606 or go to mfs.com. |
| Who we are |
| Who is providing this notice? | MFS Funds, MFS Investment Management, MFS Institutional Advisors, Inc., and MFS Heritage Trust Company. |
| What we do |
How does MFS
protect my personal
information? | To protect your personal information from unauthorized access and use, we use security measures that comply with federal law. These measures include procedural, electronic, and physical safeguards for the protection of the personal information we collect about you. |
How does MFS
collect my personal
information? | We collect your personal information, for example, when you |
| • open an account or provide account information |
| • direct us to buy securities or direct us to sell your securities |
| • make a wire transfer |
| We also collect your personal information from others, such as credit bureaus, affiliates, or other companies. |
| Why can't I limit all sharing? | Federal law gives you the right to limit only |
| • sharing for affiliates' everyday business purposes – information about your creditworthiness |
| • affiliates from using your information to market to you |
| • sharing for nonaffiliates to market to you |
| State laws and individual companies may give you additional rights to limit sharing. |
| Definitions |
| Affiliates | Companies related by common ownership or control. They can be financial and nonfinancial companies. |
| • MFS does not share personal information with affiliates, except for everyday business purposes as described on page one of this notice. |
| Nonaffiliates | Companies not related by common ownership or control. They can be financial and nonfinancial companies. |
| • MFS does not share with nonaffiliates so they can market to you. |
| Joint marketing | A formal agreement between nonaffiliated financial companies that together market financial products or services to you. |
| • MFS doesn't jointly market. |
| Other important information |
| If you own an MFS product or receive an MFS service in the name of a third party such as a bank or broker-dealer, their privacy policy may apply to you instead of ours. |
Save paper with eDelivery.
MFS® will send you prospectuses, reports, and proxies directly via e-mail so you will get information faster with less mailbox clutter.
To sign up:
1. Go to mfs.com.
2. Log in via MFS® Access.
3. Select eDelivery.
If you own your MFS fund shares through a financial institution or a retirement plan, MFS® TALK, MFS® Access, or eDelivery may not be available to you.
CONTACT
WEB SITE
mfs.com
MFS TALK
1-800-637-8255
24 hours a day
ACCOUNT SERVICE AND LITERATURE
Shareholders
1-800-225-2606
Financial advisors
1-800-343-2829
Retirement plan services
1-800-637-1255
MAILING ADDRESS
MFS Service Center, Inc.
P.O. Box 219341
Kansas City, MO 64121-9341
OVERNIGHT MAIL
MFS Service Center, Inc.
Suite 219341
430 W 7th Street
Kansas City, MO 64105-1407
Item 1(b):
Not applicable
ITEM 2. CODE OF ETHICS.
The Registrant has adopted a Code of Ethics (the "Code") pursuant to Section 406 of the Sarbanes-Oxley Act and as defined in Form N-CSR that applies to the Registrant's principal executive officer and principal financial and accounting officer. During the period covered by this report, the Registrant has not amended any provision in the Code that relates to an element of the Code's definition enumerated in paragraph (b) of Item 2 of this Form N-CSR. During the period covered by this report, the Registrant did not grant a waiver, including an implicit waiver, from any provision of the Code.
A copy of the Code is attached hereto as EX-99.COE.
ITEM 3. AUDIT COMMITTEE FINANCIAL EXPERT.
Messrs. Steven E. Buller, James Kilman, and Clarence Otis, Jr. and Ms. Maryanne L. Roepke, members of the Audit Committee, have been determined by the Board of Trustees in their reasonable business judgment to meet the definition of "audit committee financial expert" as such term is defined in Form N-CSR. In addition, Messrs. Buller, Kilman, and Otis and Ms. Roepke are "independent" members of the Audit Committee (as such term has been defined by the Securities and Exchange Commission in regulations implementing Section 407 of the Sarbanes-Oxley Act of 2002). The Securities and Exchange Commission has stated that the designation of a person as an audit committee financial expert pursuant to this Item 3 on the Form N-CSR does not impose on such a person any duties, obligations or liability that are greater than the duties, obligations or liability imposed on such person as a member of the Audit Committee and the Board of Trustees in the absence of such designation or identification.
ITEM 4. PRINCIPAL ACCOUNTANT FEES AND SERVICES.
Items 4(a) through 4(d) and 4(g):
The Board of Trustees has appointed Deloitte & Touche LLP ("Deloitte") to serve as independent accountants to certain series of the Registrant and Ernst & Young LLP ("E&Y") to serve in the same capacity to certain other series of the Registrant (each a "Fund" and collectively the "Funds"). The tables below set forth the audit fees billed to each Fund as well as fees for non-audit services provided to each Fund and/or to each Fund's investment adviser, Massachusetts Financial Services Company ("MFS"), and to various entities either controlling, controlled by, or under common control with MFS that provide ongoing services to the Fund ("MFS Related Entities").
For the fiscal years ended October 31, 2022 and 2021, audit fees billed to each Fund by Deloitte and E&Y were as follows:
Fees billed by Deloitte: | | Audit Fees |
| 2022 | 2021 |
MFS Global Growth Fund | 66,600 | 63,229 |
| | |
Fees billed by E&Y: | | Audit Fees |
| 2022 | 2021 |
MFS Income Fund | 63,046 | 59,857 |
For the fiscal years ended October 31, 2022 and 2021, fees billed by Deloitte and E&Y for audit-related, tax and other services provided to each Fund and for audit-related, tax and other services provided to MFS and MFS Related Entities were as follows:
Fees billed by Deloitte: | | Audit-Related | | Tax Fees2 | | All Other Fees3 |
| | Fees1 | | | | | | |
| 2022 | 2021 | | 2022 | 2021 | | 2022 | | 2021 |
To MFS Global Growth Fund | 0 | 0 | | 400 | 7,066 | | 0 | | 0 |
| | | | | | | | |
| | | | | | | |
Fees billed by Deloitte: | | Audit-Related | | Tax Fees2 | All Other Fees3 |
| | Fees1 | | | | | | |
| 2022 | 2021 | | 2022 | 2021 | | 2022 | | 2021 |
To MFS and MFS Related | | | | | | | | | |
Entities of MFS Global Growth | 0 | 0 | | 0 | 0 | | 3,790 | | 5,390 |
Fund * | | | | | | | | | |
| | | | | |
Fees Billed by Deloitte: | | | | Aggregate Fees for Non-audit Services |
| | | | 2022 | | | | 2021 |
To MFS Global Growth Fund, MFS and MFS Related Entities# | | 4,190 | | | | 12,456 |
| | | | | | |
Fees billed by E&Y: | | | Audit-Related | | Tax Fees2 | All Other Fees4 |
| | | Fees1 | | | | | | | |
| 2022 | | 2021 | | 2022 | 2021 | | 2022 | | | 2021 |
To MFS Income Fund | 0 | | 0 | | 255 | 10,943 | | 79 | | | 1,089 |
| | | | | | | | | |
Fees billed by E&Y: | | | Audit-Related | | Tax Fees2 | All Other Fees4 |
| | | Fees1 | | | | | | | |
| 2022 | | 2021 | | 2022 | 2021 | | 2022 | | | 2021 |
To MFS and MFS Related | | | | | | | | | | | |
Entities of MFS Income Fund* | 662,511 | | 1,663,649 | 0 | 0 | | 111,415 | | | 110,620 |
| | | | | | | | | | |
Fees Billed by E&Y: | | | | | Aggregate Fees for Non-audit Services | |
| | | | | 2022 | | | 2021 | | |
To MFS Income Fund, MFS and MFS Related Entities# | | | 904,690 | | | 2,003,001 | |
| | | | | | | |
*This amount reflects the fees billed to MFS and MFS Related Entities for non-audit services relating directly to the operations and financial reporting of the Funds (portions of which services also related to the operations and financial reporting of other funds within the MFS Funds complex).
#This amount reflects the aggregate fees billed by Deloitte or E&Y, as the case may be, for non-audit services rendered to the Funds and for non-audit services rendered to MFS and the MFS Related Entities.
1 The fees included under "Audit-Related Fees" are fees related to assurance and related services that are reasonably related to the performance of the audit or review of financial statements, but not reported under ''Audit Fees,'' including accounting consultations, agreed-upon procedure reports, attestation reports, comfort letters and internal control reviews.
2 The fees included under "Tax Fees" are fees associated with tax compliance, tax advice and tax planning, including services relating to the filing or amendment of federal, state or local income tax returns, regulated investment company qualification reviews and tax distribution and analysis.
3 The fees included under "All Other Fees" are fees for products and services provided by Deloitte other than those reported under "Audit Fees," "Audit-Related Fees" and "Tax Fees".
4 The fees included under "All Other Fees" are fees for products and services provided by E&Y other than those reported under "Audit Fees," "Audit-Related Fees" and "Tax Fees," including fees for services related to review of internal controls and review of Rule 38a-1 compliance program.
Item 4(e)(1):
Set forth below are the policies and procedures established by the Audit Committee of the Board of Trustees relating to the pre- approval of audit and non-audit related services:
To the extent required by applicable law, pre-approval by the Audit Committee of the Board is needed for all audit and permissible non- audit services rendered to the Funds and all permissible non-audit services rendered to MFS or MFS Related Entities if the services relate directly to the operations and financial reporting of the Registrant. Pre-approval is currently on an engagement-by-engagement basis. In the event pre-approval of such services is necessary between regular meetings of the Audit Committee and it is not practical to wait to seek pre-approval at the next regular meeting of the Audit Committee, pre-approval of such services may be referred to the Chair of the Audit Committee for approval; provided that the Chair may not pre-approve any individual engagement for such services exceeding $50,000 or multiple engagements for such services in the aggregate exceeding $100,000 in each period between regular meetings of the Audit Committee. Any engagement pre-approved by the Chair between regular meetings of the Audit Committee shall be presented for ratification by the entire Audit Committee at its next regularly scheduled meeting.
Item 4(e)(2):
None, or 0%, of the services relating to the Audit-Related Fees, Tax Fees and All Other Fees paid by the Fund and MFS and MFS Related Entities relating directly to the operations and financial reporting of the Registrant disclosed above were approved by the audit committee pursuant to paragraphs (c)(7)(i)(C) of Rule 2-01 of Regulation S-X (which permits audit committee approval after the start of the engagement with respect to services other than audit, review or attest services, if certain conditions are satisfied).
Item 4(f):
Not applicable.
Item 4(h):
The Registrant's Audit Committee has considered whether the provision by a Registrant's independent registered public accounting firm of non-audit services to MFS and MFS Related Entities that were not pre-approved by the Committee (because such services did not
relate directly to the operations and financial reporting of the Registrant) was compatible with maintaining the independence of the independent registered public accounting firm as the Registrant's principal auditors.
ITEM 5. AUDIT COMMITTEE OF LISTED REGISTRANTS.
Not applicable to the Registrant.
ITEM 6. INVESTMENTS
A schedule of investments for each series covered by this Form N-CSR is included as part of the report to shareholders of such series under Item 1(a) of this Form N-CSR.
ITEM 7. DISCLOSURE OF PROXY VOTING POLICIES AND PROCEDURES FOR CLOSED-END MANAGEMENT INVESTMENT COMPANIES.
Not applicable to the Registrant.
ITEM 8. PORTFOLIO MANAGERS OF CLOSED-END MANAGEMENT INVESTMENT COMPANIES.
Not applicable to the Registrant.
ITEM 9. PURCHASES OF EQUITY SECURITIES BY CLOSED-END MANAGEMENT INVESTMENT COMPANY AND AFFILIATED PURCHASERS.
Not applicable to the Registrant.
ITEM 10. SUBMISSION OF MATTERS TO A VOTE OF SECURITY HOLDERS.
There were no material changes to the procedures by which shareholders may send recommendations to the Board for nominees to the Registrant's Board since the Registrant last provided disclosure as to such procedures in response to the requirements of Item 407 (c)(2)(iv) of Regulation S-K or this Item.
ITEM 11. CONTROLS AND PROCEDURES.
(a)Based upon their evaluation of the effectiveness of the registrant's disclosure controls and procedures (as defined in Rule 30a-3(c) under the Investment Company Act of 1940 (the "Act")) as conducted within 90 days of the filing date of this report on Form N-CSR, the registrant's principal financial officer and principal executive officer have concluded that those disclosure controls and procedures provide reasonable assurance that the material information required to be disclosed by the registrant on this report is recorded, processed, summarized and reported within the time periods specified in the Securities and Exchange Commission's rules and forms.
(b)There were no changes in the registrant's internal controls over financial reporting (as defined in Rule 30a-3(d) under the Act) that occurred during the period covered by the report that have materially affected, or are reasonably likely to materially affect, the registrant's internal control over financial reporting.
ITEM 12. DISCLOSURE OF SECURITIES LENDING ACTIVITIES FOR CLOSED-END MANAGEMENT INVESTMENT COMPANIES.
Not applicable to the Registrant.
ITEM 13. EXHIBITS.
(a)(1) Any code of ethics, or amendment thereto, that is the subject of the disclosure required by Item 2, to the extent that the registrant intends to satisfy the Item 2 requirements through filing of an exhibit: Attached hereto as EX-99.COE.
(2)A separate certification for each principal executive officer and principal financial officer of the registrant as required by Rule 30a-2(a) under the Act (17 CFR 270.30a-2): Attached hereto as EX-99.302CERT.
(3)Any written solicitation to purchase securities under Rule 23c-1 under the Act (17 CFR 270.23c-1) sent or given during the period covered by the report by or on behalf of the registrant to 10 or more persons. Not applicable.
(4)Change in the registrant's independent public accountant. Not applicable.
(b)If the report is filed under Section 13(a) or 15(d) of the Exchange Act, provide the certifications required by Rule 30a-2(b) under the Act (17 CFR 270.30a-2(b)), Rule 13a-14(b) or Rule 15d-14(b) under the Exchange Act (17 CFR 240.13a-14(b) or
240.15d-14(b)) and Section 1350 of Chapter 63 of Title 18 of the United States Code (18 U.S.C. 1350) as an exhibit. A certification furnished pursuant to this paragraph will not be deemed "filed" for the purposes of Section 18 of the Exchange Act (15 U.S.C. 78r), or otherwise subject to the liability of that section. Such certification will not be deemed to be incorporated by reference into any filing under the Securities Act of 1933 or the Exchange Act, except to the extent that the registrant specifically incorporates it by reference. Attached hereto as EX-99.906CERT.
Notice
A copy of the Amended and Restated Declaration of Trust, as amended, of the Registrant is on file with the Secretary of State of The Commonwealth of Massachusetts and notice is hereby given that this instrument is executed on behalf of the Registrant by an officer of the Registrant as an officer and not individually and the obligations of or arising out of this instrument are not binding upon any of the Trustees or shareholders individually, but are binding only upon the assets and property of the respective constituent series of the Registrant.
SIGNATURES
Pursuant to the requirements of the Securities Exchange Act of 1934 and the Investment Company Act of 1940, the registrant has duly caused this report to be signed on its behalf by the undersigned, thereunto duly authorized.
(Registrant) MFS SERIES TRUST VIII
By (Signature and Title)*
/S/ DAVID L. DILORENZO
David L. DiLorenzo, President
Date: December 15, 2022
Pursuant to the requirements of the Securities Exchange Act of 1934 and the Investment Company Act of 1940, this report has been signed below by the following persons on behalf of the registrant and in the capacities and on the dates indicated.
By (Signature and Title)*
/S/ DAVID L. DILORENZO
David L. DiLorenzo, President (Principal Executive Officer)
Date: December 15, 2022
By (Signature and Title)*
/S/ JAMES O. YOST
James O. Yost, Treasurer (Principal Financial Officer and Accounting Officer)
Date: December 15, 2022
* Print name and title of each signing officer under his or her signature.