Exhibit 99.2

Q4 Financial Performance February 5, 2018
‘Non-GAAP’ Items and Forward-Looking Statements This presentation contains the following non-GAAP measures: Percentage changes in net sales, excluding currency rate effects (for each segment, and the Company as a whole); Adjusted EBITDA (for each segment, and the Company as a whole; absolute and as a percentage of sales);Net debt; and Net income per share attributable to the Company, excluding adjustments. We think such items provide useful information to investors regarding the Company’s core operational performance. See the Company’s earnings release (which accompanies this presentation) for additional information including reconciliations to GAAP measures. This presentation also may contain statements, estimates, or projections that constitute “forward-looking statements” as defined under U.S. federal securities laws. Forward-looking statements are subject to certain risks and uncertainties that could cause actual results to differ materially from the Company’s historical experience and our present expectations or projections. We disclaim any obligation to update any information in this presentation to reflect any changes or developments after the date on the cover page. Certain additional disclosures regarding our use of these ‘non-GAAP’ items and forward-looking statements are set forth in our fourth-quarter earnings press release dated February 5, 2018, and in our SEC filings, including our most recent quarterly reports and our annual reports for the years ended December 31, 2014, 2015, and 2016. Our use of such items in this presentation is subject to those additional disclosures, which we urge you to read. 2
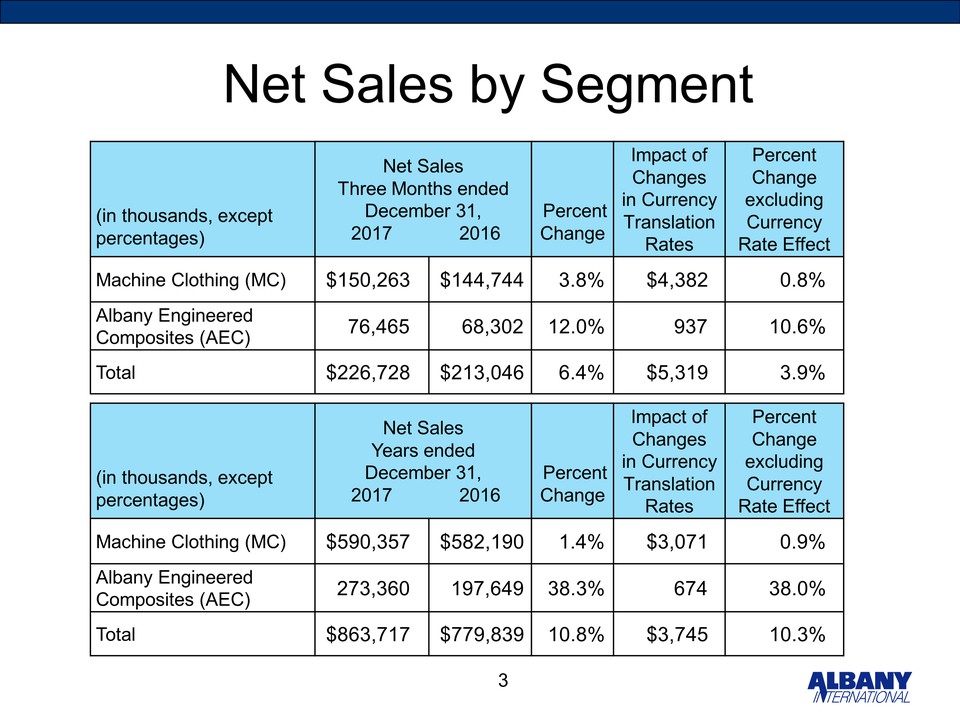
Net Sales by Segment 3 (in thousands, except percentages) Net Sales Three Months ended December 31, 2017 2016 Percent Change Impact of Changes in Currency Translation Rates Percent Change excluding Currency Rate Effect Machine Clothing (MC) $150,263 $144,744 3.8% $4,382 0.8% Albany Engineered Composites (AEC) 76,465 68,302 12.0% 937 10.6% Total $226,728 $213,046 6.4% $5,319 3.9% (in thousands, except percentages) Net Sales Years ended December 31, 2017 2016 Percent Change Impact of Changes in Currency Translation Rates Percent Change excluding Currency Rate Effect Machine Clothing (MC) $590,357 $582,190 1.4% $3,071 0.9% Albany Engineered Composites (AEC) 273,360 197,649 38.3% 674 38.0% Total $863,717 $779,839 10.8% $3,745 10.3%
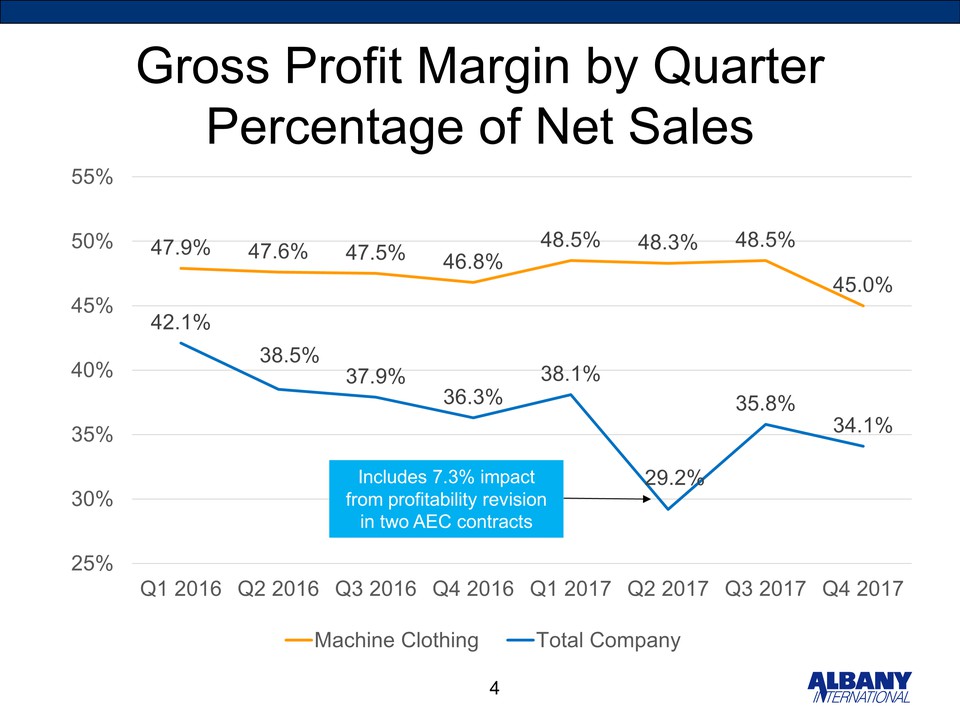
Gross Profit Margin by Quarter Percentage of Net Sales 4 Includes 7.3% impact from profitability revision in two AEC contracts 55% 50% 45% 40% 35% 30% 25% Q1 2016 Q2 2016 Q3 2016 Q4 2016 Q1 2017 Q2 2017 Q3 2017 Q4 2017 47.9% 47.6% 47.5% 46.8% 48.5% 48.3% 48.5% 45.0% 42.1% 38.5% 37.9% 36.3% 38.1% 29.2% 35.8% 34.1% Machine Clothing Total Company
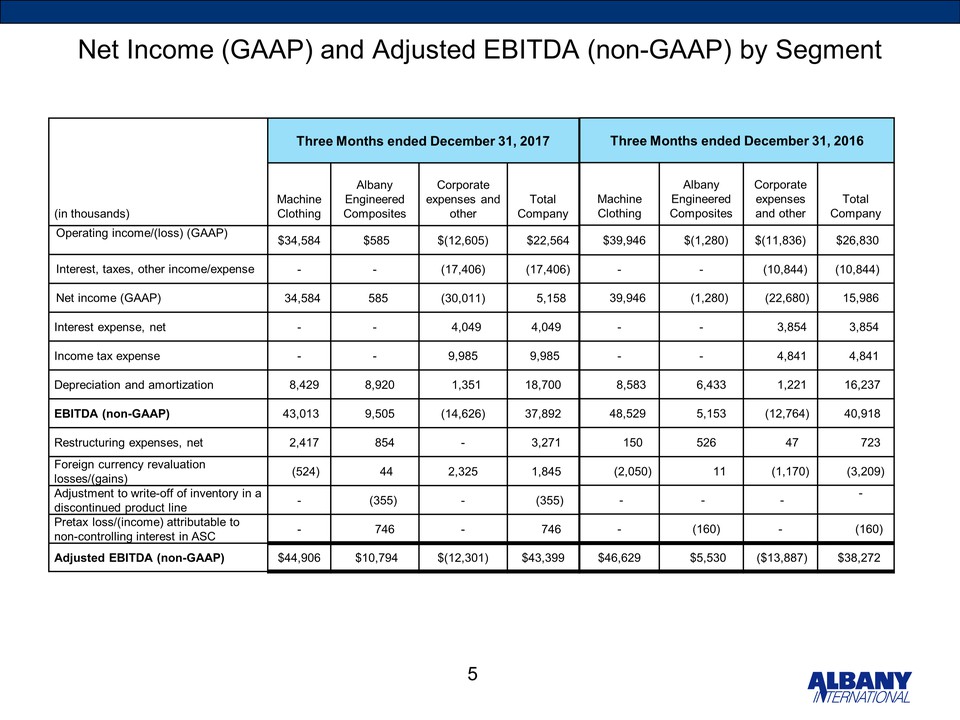
Net Income (GAAP) and Adjusted EBITDA (non-GAAP) by Segment 5 Three Months ended December 31, 2017 (in thousands) Machine Clothing Albany Engineered Composites Corporate expenses and other Total Company Operating income/(loss) (GAAP) $34,584 $585 $(12,605) $22,564 Interest, taxes, other income/expense - - (17,406) (17,406) Net income (GAAP) 34,584 585 (30,011) 5,158 Interest expense, net - - 4,049 4,049 Income tax expense - - 9,985 9,985 Depreciation and amortization 8,429 8,920 1,351 18,700 EBITDA (non GAAP) 43,013 9,505 (14,626) 37,892 Restructuring expenses, net 2,417 854 - 3,271 Foreign currency revaluation losses/(gains) (524) 44 2,325 1,845 Adjustment to write-off of inventory in a discontinued product line - (355) - (355) Pretax loss/(income) attributable to non-controlling interest in ASC -746 - 746 Adjusted EBITDA (non-GAAP) $44,906 $10,794 $(12,301) $43,399 Three Months ended December 31, 2016 Machine Clothing Albany Engineered Composites Corporate expenses and other Total Company $39,946 $(1,280) $(11,836) $26,830 - - (10,844) (10,844) 39,946 (1,280) (22,680) 15,986 - - 3,854 3,854 - - 4,841 4,841 8,583 6,433 1,221 16,237 48,529 5,153 (12,764) 40,918 150 526 47 723 (2,050) 11 (1,170) (3,209) - - - - - (160) - (160) $46,629 $5,530 ($13,887) $38,272
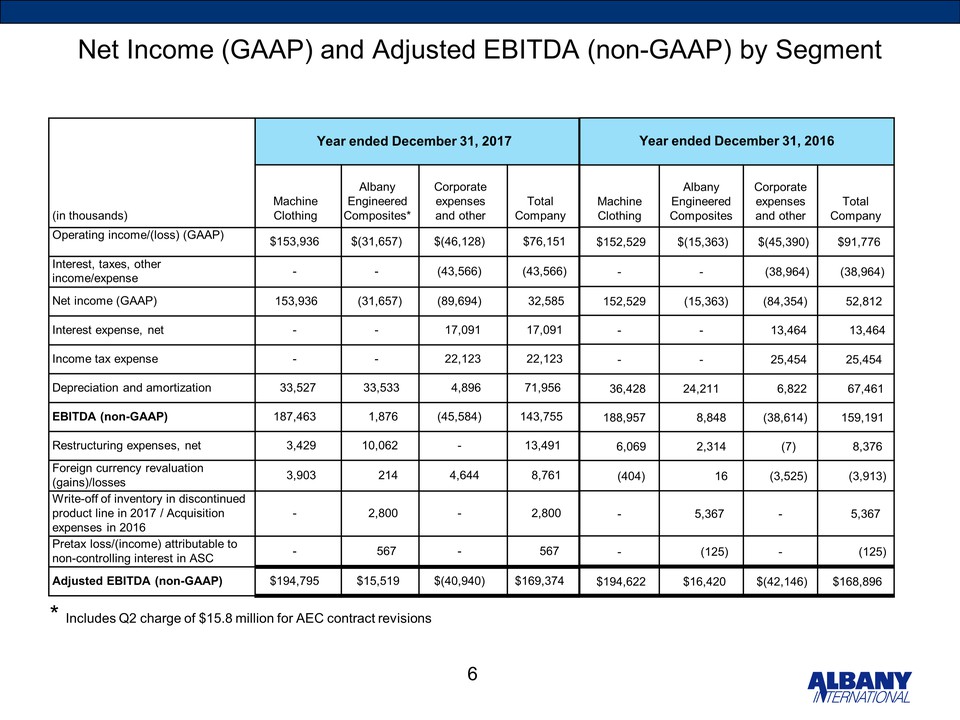
Net Income (GAAP) and Adjusted EBITDA (non-GAAP) by Segment 6 Year ended December 31, 2017 (in thousands) Machine Clothing Albany Engineered Composites* Corporate expenses and other Total Company Operating income/(loss) (GAAP) $153,936 $(31,657) $(46,128) $76,151 Interest, taxes, other income/expense - - (43,566) (43,566) Net income (GAAP) 153,936 (31,657) (89,694) 32,585 Interest expense, net - - 17,091 17,091 Income tax expense - - 22,123 22,123 Depreciation and amortization 33,527 33,533 4,896 71,956 EBITDA (non-GAAP) 187,463 1,876 (45,584) 143,755 Restructuring expenses, net 3,429 10,062 - 13,491 Foreign currency revaluation (gains)/losses 3,903 214 4,644 8,761 Write-off of inventory in discontinued product line in 2017 / Acquisition expenses in 2016- 2,800 - 2,800 Pretax loss/(income) attributable to non-controlling interest in ASC - 567- 567 Adjusted EBITDA (non-GAAP) $194,795 $15,519 $(40,940) $169,374 Year ended December 31, 2016 Machine Clothing Albany Engineered Composites Corporate expenses and other Total Company $152,529 $(15,363) $(45,390) $91,776 - - (38,964) (38,964) 152,529 (15,363) (84,354) 52,812 - - 13,464 13,464 - - 25,454 25,454 36,428 24,211 6,822 67,461 188,957 8,848 (38,614) 159,191 6,069 2,314 (7) 8,376 (404) 16 (3,525) (3,913) - 5,367 - 5,367 - (125) - (125) $194,622 $16,420 $(42,146) $168,896 * Includes Q2 charge of $15.8 million for AEC contract revisions
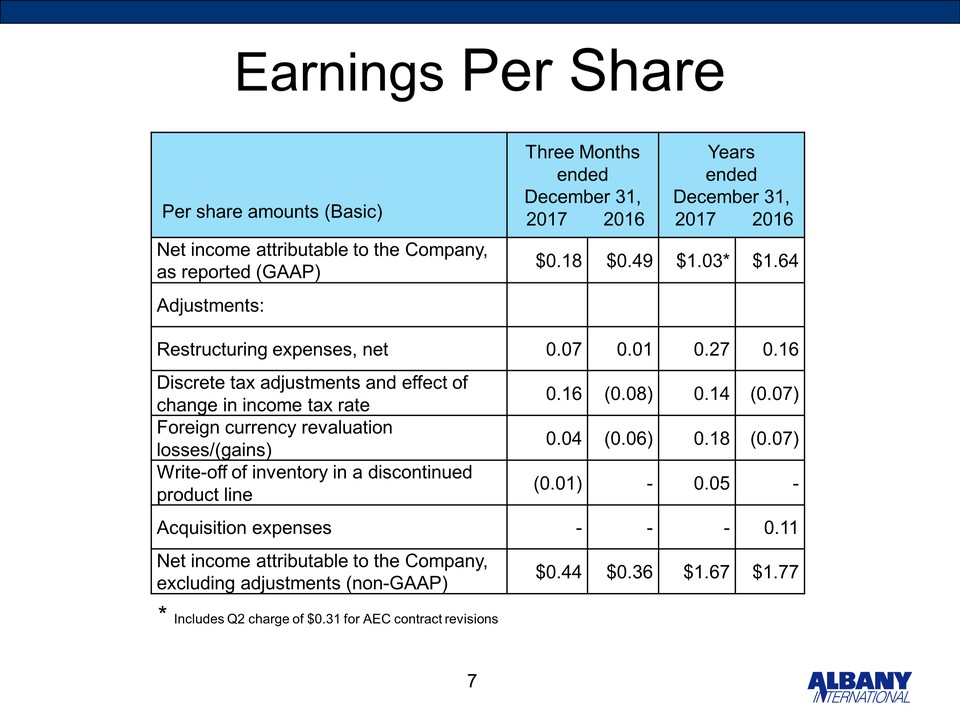
Earnings Per Share Per share amounts (Basic) Three Months ended December 31, 2017 2016 Years ended December 31, 2017 2016 Net income attributable to the Company, as reported (GAAP) $0.18 $0.49 $1.03* $1.64 Adjustments: Restructuring expenses, net 0.07 0.01 0.27 0.16 Discrete tax adjustments and effect of change in income tax rate 0.16 (0.08) 0.14 (0.07) Foreign currency revaluation losses/(gains) 0.04 (0.06) 0.18 (0.07) Write-off of inventory in a discontinued product line (0.01) - 0.05 - Acquisition expenses - - - 0.11 Net income attributable to the Company, excluding adjustments (non-GAAP) $0.44 $0.36 $1.67 $1.77 * Includes Q2 charge of $0.31 for AEC contract revisions 7
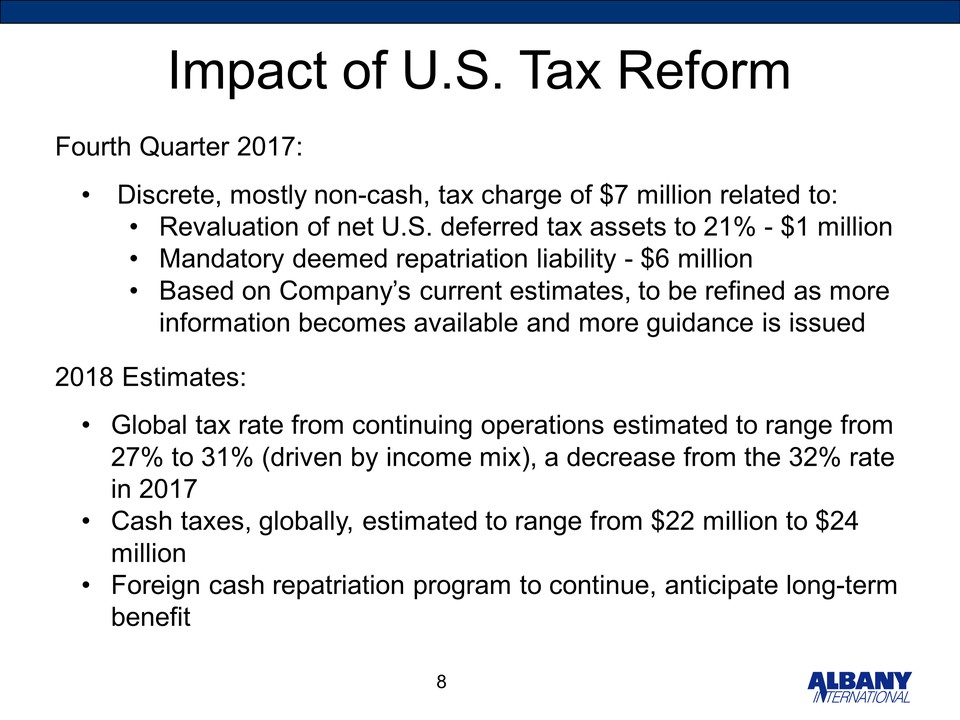
Impact of U.S. Tax Reform Fourth Quarter 2017:Discrete, mostly non-cash, tax charge of $7 million related to: Revaluation of net U.S. deferred tax assets to 21% - $1 million Mandatory deemed repatriation liability - $6 million Based on Company’s current estimates, to be refined as more information becomes available and more guidance is issued 2018 Estimates: Global tax rate from continuing operations estimated to range from 27% to 31% (driven by income mix), a decrease from the 32% rate in 2017Cash taxes, globally, estimated to range from $22 million to $24 million Foreign cash repatriation program to continue, anticipate long-term benefit 8
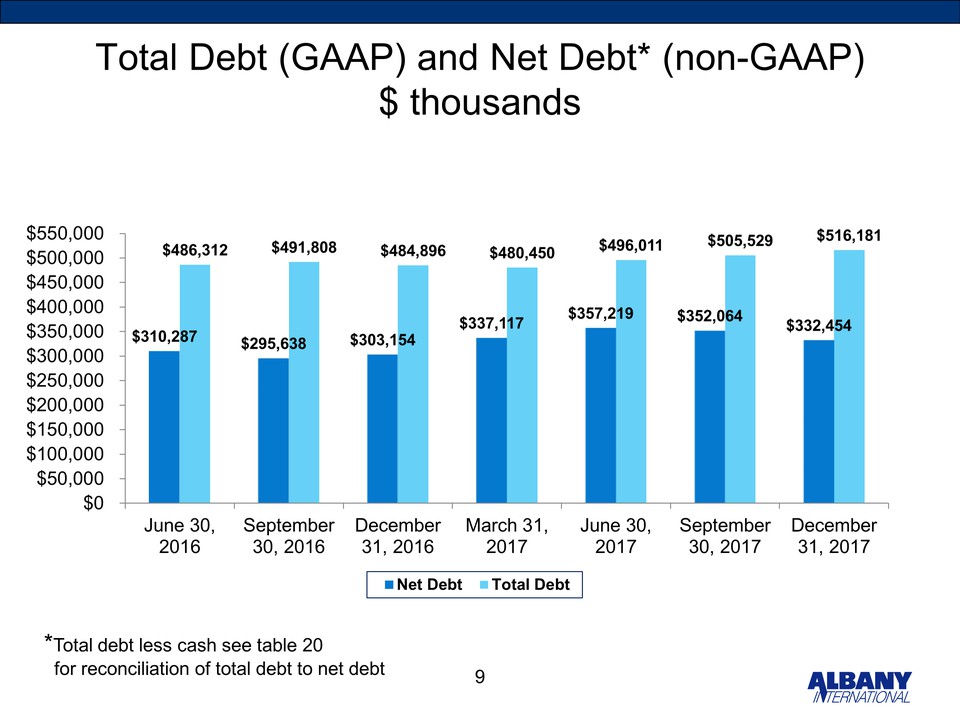
Total Debt (GAAP) and Net Debt* (non-GAAP)$ thousands 9 *Total debt less cash see table 20 for reconciliation of total debt to net debt $550,000 $500,000 $450,000 $400,000 $350,000 $300,000 $250,000 $200,000 $150,000 $100,000 $50,000 40 June 30, 2016 September 30, 2016 December 31, 2016 March 31, 2017 June 30, 2017 September 30, 2017 December 31, 2017 $486,312 $310,287 $491,808 $295,638 $484,896 $303,154 $480,450 $337,117 $496,011 $357,219 $505,529 $352,064 $516,181 $332,454