UNITED STATES
SECURITIES AND EXCHANGE COMMISSION
Washington, D.C. 20549
FORM N-CSR
CERTIFIED SHAREHOLDER REPORT OF REGISTERED
MANAGEMENT INVESTMENT COMPANIES
Investment Company Act File Number: 811-05299
| T. Rowe Price Science & Technology Fund, Inc. |
|
| (Exact name of registrant as specified in charter) |
| |
| 100 East Pratt Street, Baltimore, MD 21202 |
|
| (Address of principal executive offices) |
| |
| David Oestreicher |
| 100 East Pratt Street, Baltimore, MD 21202 |
|
| (Name and address of agent for service) |
Registrant’s telephone number, including area code: (410) 345-2000
Date of fiscal year end: December 31
Date of reporting period: December 31, 2020
Item 1. Reports to Shareholders
(a) Report pursuant to Rule 30e-1.
| Science & Technology Fund | December 31, 2020 |
| PRSCX | Investor Class |
| PASTX | Advisor Class |
| TSNIX | I Class |
| T. ROWE PRICE SCIENCE & TECHNOLOGY FUND |
|
HIGHLIGHTS
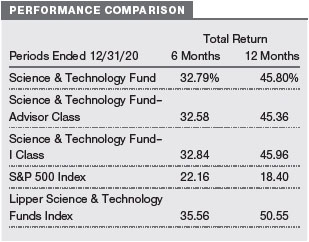
| ■ | The Science & Technology Fund rose 45.80% for the year, underperforming its peer group—as represented by the Lipper Science & Technology Funds Index—but outperforming the S&P 500 Index, a proxy for the broader market. |
| | |
| ■ | Many of our best and worst performers were driven by impacts of the coronavirus pandemic. |
| | |
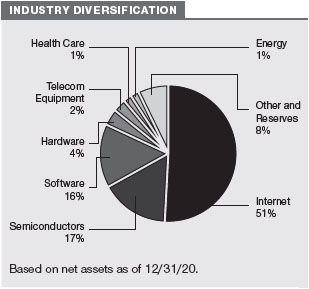
| ■ | We’re finding the most attractive stocks in the internet subsector, which remains the portfolio’s largest weighting. |
| | |
| ■ | Elevated valuations in some parts of the technology sector have resulted in fewer opportunities. |

Log in to your account at troweprice.com for more information.
*Certain mutual fund accounts that are assessed an annual account service fee can also save money by switching to e-delivery.
CIO Market Commentary
Dear Shareholder
Nearly all major stock and bond indexes produced positive results during 2020 as markets recovered from the steep sell-off that resulted from the spread of the coronavirus. Extraordinary fiscal and monetary support from global governments and central banks helped spur the rebound, although the pandemic continued to pose significant public health and economic challenges as the year came to an end.
In the U.S., the large-cap Dow Jones Industrial Average and S&P 500 Index reached record highs, as did the technology-heavy Nasdaq Composite Index—a result that few would have predicted in late March after the benchmarks tumbled more than 30% as governments instituted lockdowns to try to halt the spread of the virus. Large-cap information technology and internet-related firms helped lead the rebound as they benefited from the work-from-home environment and an acceleration in demand for online services.
Within the S&P 500, the technology and consumer discretionary sectors were the top performers, and communication services and materials stocks also outperformed. Despite a late rally, the energy sector trailed with significant losses due to a plunge in oil prices.
Most equity markets outside the U.S. also performed well. Emerging markets outpaced developed markets, and Asian shares delivered strong results as China and other countries in the region proved relatively successful in containing the coronavirus.
Growth stocks significantly outpaced their value counterparts for the full year; however, value shares rallied late in the period. Positive vaccine news in November raised hopes for a return to normalcy in 2021 and boosted sectors that had been beaten down in the initial phases of the pandemic.
Within the fixed income universe, corporate bonds delivered strong results as the market easily absorbed a torrent of new issuance. After falling to record lows in March, intermediate- and longer-term Treasury yields ticked higher later in the year but remained very low by historical standards, a factor that encouraged investors to seek out riskier securities with higher return potential.
While investors had reason to cheer the market’s recovery, the global economic outlook remained unclear as the year came to an end. Most notable on the positive side was the start of vaccine distributions, which provided hope that the pandemic was in its final phase. In addition, Congress passed a $900 billion coronavirus relief package, supplementing the $2.4 trillion allocated to address the crisis earlier in the year, and the Fed continued to pledge very accommodative monetary policies for the foreseeable future. Meanwhile, political uncertainty diminished with Joe Biden’s victory in the U.S. presidential election and the completion of a Brexit trade deal between the UK and the European Union.
On the negative side, concerns about a resurgence in virus hospitalizations led to new lockdowns and business restrictions in many countries, which in turn appeared to threaten economic recoveries. In the U.S., after a strong recovery in the summer and fall, the pace of hiring slowed late in the year, and household spending declined in November for the first time since April.
It was a remarkable 12-month period in many ways, but as far as markets are concerned, I can recall no calendar year that so starkly displayed evidence of both fear and greed. Fear emerged during the March sell-off and again in April as oil futures briefly traded in negative territory. Greed surfaced later as some assets seemed to continue to rally without fundamental support. Bitcoin rocketed to a record high of $29,000 by year-end, and the amount of money raised by initial public offerings also climbed to historic levels. While valuations are still attractive in some areas of the market, other sectors appear to have already priced in a strong rebound in earnings and are trading at elevated levels.
There are both risks and potential rewards in this environment, and we believe strong fundamental analysis and skilled active security selection will remain critical components of investment success.
Thank you for your continued confidence in T. Rowe Price.
Sincerely,

Robert Sharps
Group Chief Investment Officer
Management’s Discussion of Fund Performance
INVESTMENT OBJECTIVE
The fund seeks to provide long-term capital appreciation.
FUND COMMENTARY
How did the fund perform in the past year?
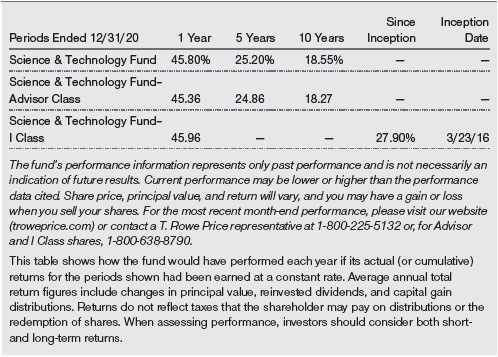
The Science & Technology Fund returned 45.80% for the 12-month period ended December 31, 2020, matching the large gain it enjoyed in 2019. The fund underperformed the Lipper Science & Technology Funds Index while topping the S&P 500 Index by a wide margin. (Returns for the fund’s Advisor and I Class shares varied slightly, reflecting their different fee structures. Past performance cannot guarantee future results. Investors should note that the short-term performance for the fund is highly unusual and unlikely to be sustained.)
What factors influenced the fund’s performance?
While the world grappled with the scourges of the coronavirus and racial inequity, technology stocks showed more resilience than ever, surging back from March’s sharp downdraft to post large gains for the year. The stay-at-home environment brought about by the pandemic and limitations on travel and restrictions to entertainment turned out to be ideal for many tech stocks, including those involved in cloud computing, which had already seen large appreciation in recent years. Providers of technologies necessary for remote work saw surging sales. Many of these stocks traded at very high multiples throughout most of the year and offered thin margins of safety for investors mindful of risk. We refrained from buying stocks where prices exceeded what we deemed to be reasonable based on fundamental analysis and our cash flow-focused valuation methodologies. While we failed to capture some of these gains, we found opportunities in many of our internet holdings, including those bought or added to in the March sell-off as these benefited from the marked increase in online commerce during and after the pandemic-driven closure of physical stores.
Our long-standing positions in online travel agencies Booking Holdings and Trip.Com lagged sharply as the coronavirus rapidly spread from initially a seemingly isolated virus to a global pandemic. With a jarring impact on travel, especially between countries, investors largely seemed unwilling to look ahead to brighter days even as vaccines progressed through trials and began to be administered around the world. We believe leisure travel will benefit from the release of pent-up demand in the next few years, even though business travel will likely remain muted for some time. Interestingly, Airbnb soared in a late-year IPO, suggestive of investors’ unusual enthusiasm for new issues as well as a latent opportunity for Booking Holdings and Trip.Com, companies also in the stressed online travel industry. (Please refer to the portfolio of investments for a complete list of holdings and the amount each represents in the portfolio.)
In times of turmoil, and the uncertainty created by it, we often find our best opportunities, whether in particular industries or in specific stocks. The volatility associated with this uncertainty typically offers us better pricing opportunities, and the fundamental, long-term insights of our research analysts provide us with the conviction to buy stocks on weakness. When the market downturn occurred in March, we regrettably missed out on a number of buying opportunities in cloud software. While we were holding out for lower prices, many investors embraced these stocks seemingly irrespective of valuation considerations, resulting in large gains. Our lesser weight in the most expensive software stocks represented a persistent headwind to our portfolio when compared with the benchmark through year-end. In semiconductors and internet, we more significantly captured the opportunities presented by the March sell-off.
Many internet retailers—most notably, Amazon.com—became arguably essential societal services at the height of the coronavirus lockdowns, sourcing and delivering scarce items such as household essentials, disinfecting supplies, and protective face masks. Food delivery services like DoorDash and Delivery Hero kept restaurants and grocery stores operating and helped them reach customers. Given that the coronavirus pandemic has caused more people to frequent internet commerce sites and experience their substantial benefits, such as selection and convenience, we believe many internet retail leaders will prove lasting beneficiaries.
Zalando—a leading European online apparel marketplace—leveraged its broad selection to meet the volatile demands of its customers, especially early in the pandemic. Zalando was one of our largest positions and we added to our holdings in March, after which the stock tripled as share gains offset broadly weak apparel trends. Etsy, heretofore a relatively small online destination for unique and handmade items, enjoyed a breakout year. The large breadth of sellers across Etsy’s marketplace enabled it to both rapidly supply massive numbers of face masks and meet the broader needs of customers, including many new ones, across a wide variety of goods for which it wasn’t previously typically considered. We initiated a position early in the pandemic, and the stock more than doubled.
Baidu, a new position, rose sharply at year-end as the market swung from deeply discounting its online search business, which is a leader in China, to richly rewarding it for its innovation and long-term opportunities in electric and autonomous vehicles.
In semiconductors, NVIDIA extended its late-2019 gains with the stock doubling on the strength of a sharp recovery in sales of chips for gaming and hyperscale data centers. With its broad combination of software and chip technologies, NVIDIA is at the heart of the building wave of artificial intelligence and machine learning with long duration opportunities in next-generation data centers and autonomous vehicles. Additionally, our opportunistic purchases of shares of Lam Research and Applied Materials, leading providers of advanced machines for making chips, saw strong gains. At a time investors had severely discounted these stocks due to cyclical and geopolitical risks, we focused more on strong long-term end demand and the benefits of increasing capital spending needs of large customers.
A software initiation for which we saw even greater value than reflected in its high valuation was collaboration provider Slack Technologies. The stock surged on its announced sale to Salesforce.com, a customer relationship management software company that, like us, was attracted to Slack Technologies’ differentiated technology. A new position in Wix.com, a leading provider of website-building software, doubled in value as entrepreneurs and small businesses rushed online during the pandemic.
How is the fund positioned?
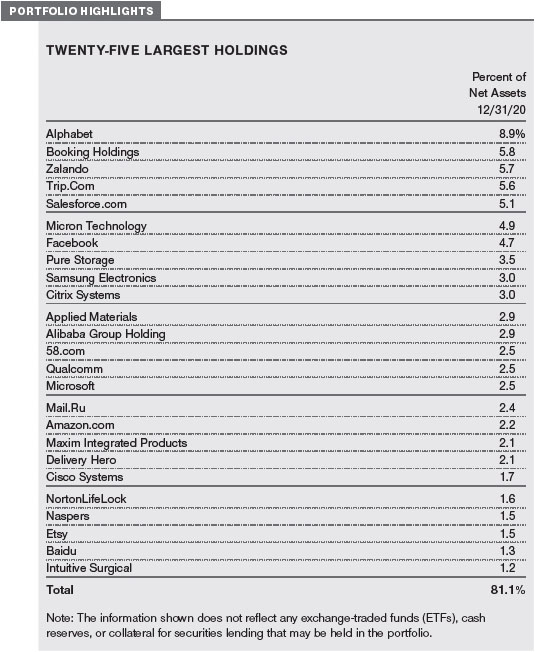
Your portfolio’s holdings remain focused on a relatively modest number of companies for which we believe upside potential is particularly attractive and downside risk is palatable. Our largest weight is in internet, where we see many businesses with attractive valuations relative to their durable growth prospects as economic activity continues its inexorable move online. The mega-cap technology stocks Alphabet, Amazon.com, Apple, Facebook, and Microsoft continue to be particularly important. In 2020, Amazon.com was a strong contributor due, in part, to the pandemic. On the other hand, Alphabet, Facebook, and Microsoft lagged Apple—a stock outside of the portfolio that benefited from a large increase in its earnings multiple as investors had increasingly high hopes for the iPhone 12, which went on sale in the fall. While we have a high regard for Apple’s dominance in high-end phones and its supporting ecosystem, we believe saturation in that market will preclude the level of cross-product cycle growth required by the stock’s currently high share price. In contrast, we see a long growth runway for Alphabet and Facebook in online advertising; for Microsoft in cloud computing; and for Amazon.com in a unique combination of online retail, online advertising, and cloud computing.
Much of our differentiation from technology-investing alternatives comes from many other holdings where we see company-specific merits. We’re particularly optimistic about the post-vaccination prospects for Booking Holdings and Trip.Com. We see Salesforce.com as a strong cloud software platform with an arguably low valuation due to its negative investor sentiment. Also, in software, we believe Citrix, a provider of remote application access, is greatly undervalued at a discount to the broader market, particularly given our view that the pandemic has sustainably increased the prevalence of remote work. We see continued opportunity in several internet businesses outside the U.S. These include Delivery Hero and Alibaba Group Holding, China’s leader in online retail and cloud computing. Despite large gains in recent months, we remain confident in Micron Technology and Samsung Electronics, leading providers of memory semiconductors that we expect to benefit from increasingly favorable pricing for their chips.
What is portfolio management’s outlook?
We don’t know what the new year will bring for the overall stock market or if technology stocks will continue their unprecedented outperformance, which has seen relatively few interruptions since I assumed management of your portfolio in 2009. I continue to think we’ll be in a golden age of technology for the foreseeable future, as the global near-ubiquity of high-speed internet access and innovations in software, artificial intelligence, cloud infrastructure, and advanced semiconductors make technology ever more useful for businesses and omnipresent for individuals. Extremely high valuations in many areas of technology, however, give me pause, and I believe it will be critical to remain vigilant in identifying good prices and monitoring risks. Similar to a year ago, I think we’re positioned well for most environments other than another year of massive gains in tech stocks, particularly the most expensive ones. Whatever the broader environment, we intend to remain highly focused on where we do our best work, namely the individual stocks and trends to which they’re levered.
There will be a lot of investor focus in the coming months on the implications for economic activity, corporate earnings, and stock prices of the coming widespread vaccinations against COVID-19, the disease caused by the coronavirus. This is something that we’ve sought to account for in our investment decisions since the beginning of the pandemic, and we will continue sharpening our views on its lasting impacts. As such, we’ll be on the lookout for opportunities in companies we view as long-term beneficiaries of the pandemic, including appealing businesses for which valuations are presently prohibitively high.
Throughout an unprecedented and tragic year, I’ve been impressed by the consistent rigorous work and effective collaboration of T. Rowe Price’s analysts, particularly the technology team with which I work every day. As I manage your fund, I’m incredibly fortunate to benefit from the insights of these colleagues. As ever, I’m grateful for your continued trust and support.
The views expressed reflect the opinions of T. Rowe Price as of the date of this report and are subject to change based on changes in market, economic, or other conditions. These views are not intended to be a forecast of future events and are no guarantee of future results.
RISKS OF INVESTING IN THE FUND
A fund that focuses its investments in specific industries or sectors is more susceptible to developments affecting those industries and sectors than a more broadly diversified fund. Because the fund invests significantly in science and technology companies, the fund may perform poorly during a downturn in those industries. Science and technology companies can be adversely affected by, among other things, intense competition, government regulation, earnings disappointments, dependency on patent protection, and rapid obsolescence of products and services due to technological innovations or changing consumer preferences.
BENCHMARK INFORMATION
Note: Lipper, a Thomson Reuters Company, is the source for all Lipper content reflected in these materials. Copyright 2021 © Refinitiv. All rights reserved. Any copying, republication or redistribution of Lipper content is expressly prohibited without the prior written consent of Lipper. Lipper shall not be liable for any errors or delays in the content, or for any actions taken in reliance thereon.
Note: ©2021, S&P Global Market Intelligence. Reproduction of any information, data or material, including ratings (Content) in any form is prohibited except with the prior written permission of the relevant party. Such party, its affiliates and suppliers (Content Providers) do not guarantee the accuracy, adequacy, completeness, timeliness or availability of any Content and are not responsible for any errors or omissions (negligent or otherwise), regardless of the cause, or for the results obtained from the use of such Content. In no event shall Content Providers be liable for any damages, costs, expenses, legal fees, or losses (including lost income or lost profit and opportunity costs) in connection with any use of the Content.
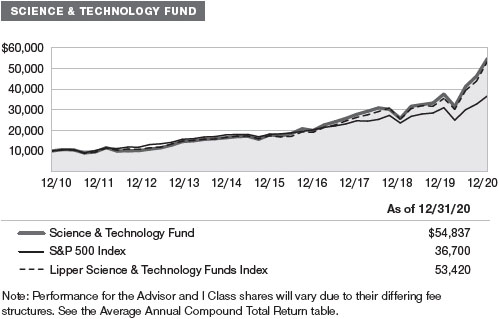
GROWTH OF $10,000
This chart shows the value of a hypothetical $10,000 investment in the fund over the past 10 fiscal year periods or since inception (for funds lacking 10-year records). The result is compared with benchmarks, which include a broad-based market index and may also include a peer group average or index. Market indexes do not include expenses, which are deducted from fund returns as well as mutual fund averages and indexes.
AVERAGE ANNUAL COMPOUND TOTAL RETURN
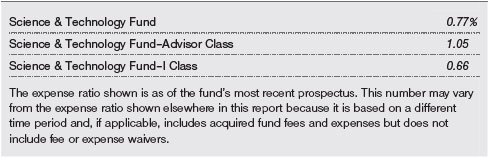
EXPENSE RATIO
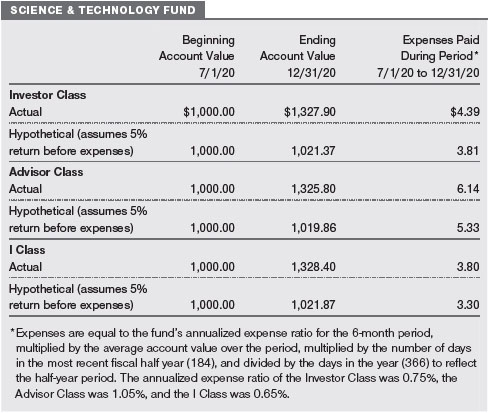
FUND EXPENSE EXAMPLE
As a mutual fund shareholder, you may incur two types of costs: (1) transaction costs, such as redemption fees or sales loads, and (2) ongoing costs, including management fees, distribution and service (12b-1) fees, and other fund expenses. The following example is intended to help you understand your ongoing costs (in dollars) of investing in the fund and to compare these costs with the ongoing costs of investing in other mutual funds. The example is based on an investment of $1,000 invested at the beginning of the most recent six-month period and held for the entire period.
Please note that the fund has three share classes: The original share class (Investor Class) charges no distribution and service (12b-1) fee, the Advisor Class shares are offered only through unaffiliated brokers and other financial intermediaries and charge a 0.25% 12b-1 fee, and I Class shares are available to institutionally oriented clients and impose no 12b-1 or administrative fee payment. Each share class is presented separately in the table.
Actual Expenses
The first line of the following table (Actual) provides information about actual account values and expenses based on the fund’s actual returns. You may use the information on this line, together with your account balance, to estimate the expenses that you paid over the period. Simply divide your account value by $1,000 (for example, an $8,600 account value divided by $1,000 = 8.6), then multiply the result by the number on the first line under the heading “Expenses Paid During Period” to estimate the expenses you paid on your account during this period.
Hypothetical Example for Comparison Purposes
The information on the second line of the table (Hypothetical) is based on hypothetical account values and expenses derived from the fund’s actual expense ratio and an assumed 5% per year rate of return before expenses (not the fund’s actual return). You may compare the ongoing costs of investing in the fund with other funds by contrasting this 5% hypothetical example and the 5% hypothetical examples that appear in the shareholder reports of the other funds. The hypothetical account values and expenses may not be used to estimate the actual ending account balance or expenses you paid for the period.
Note: T. Rowe Price charges an annual account service fee of $20, generally for accounts with less than $10,000. The fee is waived for any investor whose T. Rowe Price mutual fund accounts total $50,000 or more; accounts electing to receive electronic delivery of account statements, transaction confirmations, prospectuses, and shareholder reports; or accounts of an investor who is a T. Rowe Price Personal Services or Enhanced Personal Services client (enrollment in these programs generally requires T. Rowe Price assets of at least $250,000). This fee is not included in the accompanying table. If you are subject to the fee, keep it in mind when you are estimating the ongoing expenses of investing in the fund and when comparing the expenses of this fund with other funds.
You should also be aware that the expenses shown in the table highlight only your ongoing costs and do not reflect any transaction costs, such as redemption fees or sales loads. Therefore, the second line of the table is useful in comparing ongoing costs only and will not help you determine the relative total costs of owning different funds. To the extent a fund charges transaction costs, however, the total cost of owning that fund is higher.
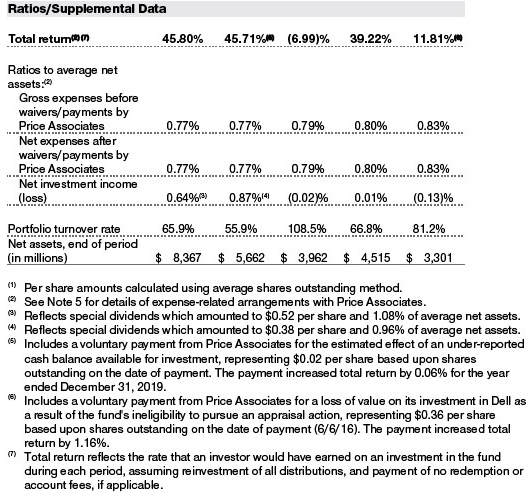
The accompanying notes are an integral part of these financial statements.
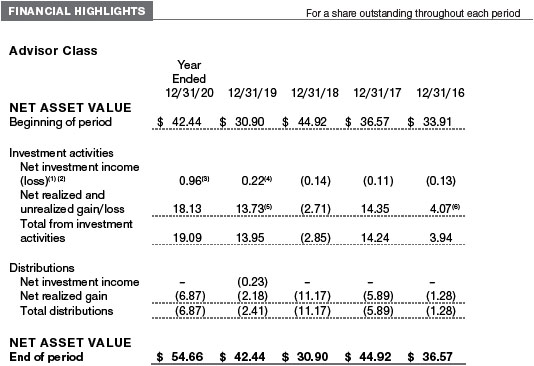
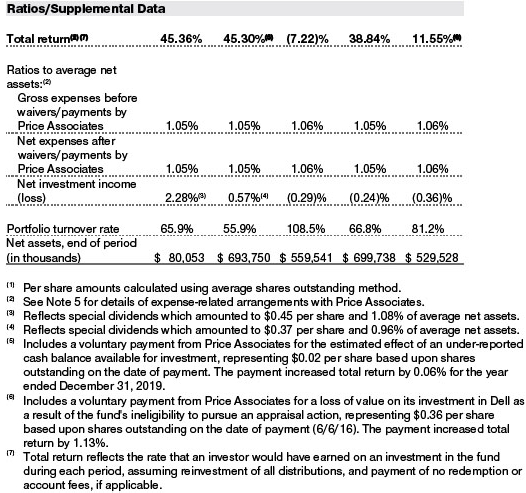
The accompanying notes are an integral part of these financial statements.
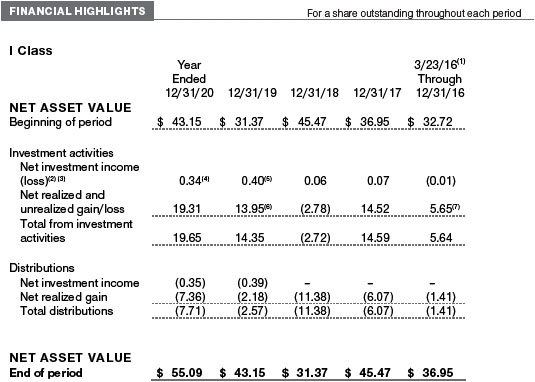
The accompanying notes are an integral part of these financial statements.
December 31, 2020
The accompanying notes are an integral part of these financial statements.
December 31, 2020
The accompanying notes are an integral part of these financial statements.
The accompanying notes are an integral part of these financial statements.
The accompanying notes are an integral part of these financial statements.
| NOTES TO FINANCIAL STATEMENTS |
T. Rowe Price Science & Technology Fund, Inc. (the fund) is registered under the Investment Company Act of 1940 (the 1940 Act) as a nondiversified, open-end management investment company. The fund seeks to provide long-term capital appreciation. The fund has three classes of shares: the Science & Technology Fund (Investor Class), the Science & Technology Fund–Advisor Class (Advisor Class), and the Science & Technology Fund–I Class (I Class). Advisor Class shares are sold only through various brokers and other financial intermediaries. I Class shares require a $1 million initial investment minimum, although the minimum generally is waived for retirement plans, financial intermediaries, and certain other accounts. The Advisor Class operates under a Board-approved Rule 12b-1 plan pursuant to which the class compensates financial intermediaries for distribution, shareholder servicing, and/or certain administrative services; the Investor and I Classes do not pay Rule 12b-1 fees. Each class has exclusive voting rights on matters related solely to that class; separate voting rights on matters that relate to all classes; and, in all other respects, the same rights and obligations as the other classes.
NOTE 1 - SIGNIFICANT ACCOUNTING POLICIES
Basis of Preparation The fund is an investment company and follows accounting and reporting guidance in the Financial Accounting Standards Board (FASB) Accounting Standards Codification Topic 946 (ASC 946). The accompanying financial statements were prepared in accordance with accounting principles generally accepted in the United States of America (GAAP), including, but not limited to, ASC 946. GAAP requires the use of estimates made by management. Management believes that estimates and valuations are appropriate; however, actual results may differ from those estimates, and the valuations reflected in the accompanying financial statements may differ from the value ultimately realized upon sale or maturity.
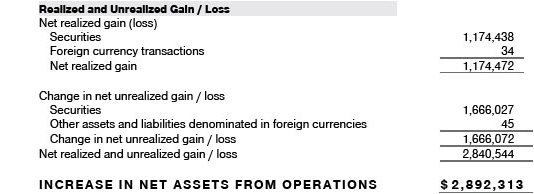
Investment Transactions, Investment Income, and Distributions Investment transactions are accounted for on the trade date basis. Income and expenses are recorded on the accrual basis. Realized gains and losses are reported on the identified cost basis. Premiums and discounts on debt securities are amortized for financial reporting purposes. Income tax-related interest and penalties, if incurred, are recorded as income tax expense. Dividends received from mutual fund investments are reflected as dividend income; capital gain distributions are reflected as realized gain/loss. Dividend income and capital gain distributions are recorded on the ex-dividend date. Non-cash dividends, if any, are recorded at the fair market value of the asset received. Distributions to shareholders are recorded on the ex-dividend date. Income distributions, if any, are declared and paid by each class annually. A capital gain distribution may also be declared and paid by the fund annually.
Currency Translation Assets, including investments, and liabilities denominated in foreign currencies are translated into U.S. dollar values each day at the prevailing exchange rate, using the mean of the bid and asked prices of such currencies against U.S. dollars as quoted by a major bank. Purchases and sales of securities, income, and expenses are translated into U.S. dollars at the prevailing exchange rate on the respective date of such transaction. The effect of changes in foreign currency exchange rates on realized and unrealized security gains and losses is not bifurcated from the portion attributable to changes in market prices.
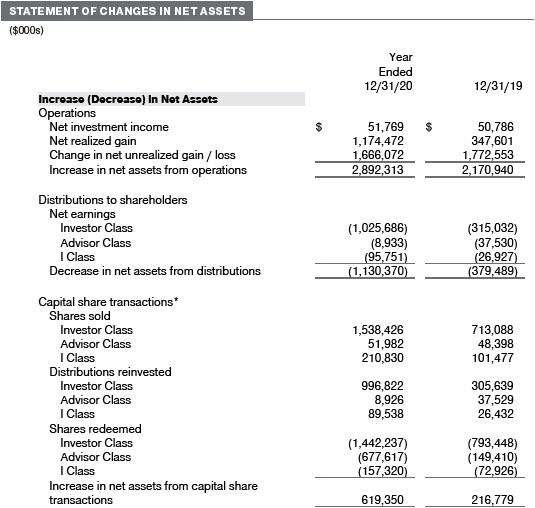
Class Accounting Shareholder servicing, prospectus, and shareholder report expenses incurred by each class are charged directly to the class to which they relate. Expenses common to all classes, investment income, and realized and unrealized gains and losses are allocated to the classes based upon the relative daily net assets of each class. The Advisor Class pays Rule 12b-1 fees, in an amount not exceeding 0.25% of the class’s average daily net assets.
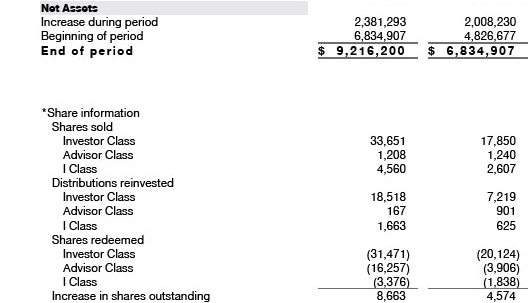
Capital Transactions Each investor’s interest in the net assets of the fund is represented by fund shares. The fund’s net asset value (NAV) per share is computed at the close of the New York Stock Exchange (NYSE), normally 4 p.m. ET, each day the NYSE is open for business. However, the NAV per share may be calculated at a time other than the normal close of the NYSE if trading on the NYSE is restricted, if the NYSE closes earlier, or as may be permitted by the SEC. Purchases and redemptions of fund shares are transacted at the next-computed NAV per share, after receipt of the transaction order by T. Rowe Price Associates, Inc., or its agents.
New Accounting Guidance In March 2020, the FASB issued Accounting Standards Update (ASU), ASU 2020-04, Reference Rate Reform (Topic 848) – Facilitation of the Effects of Reference Rate Reform on Financial Reporting, which provides optional, temporary relief with respect to the financial reporting of contracts subject to certain types of modifications due to the planned discontinuation of the London Interbank Offered Rate (LIBOR) and other interbank-offered based reference rates as of the end of 2021. The guidance is effective for certain reference rate-related contract modifications that occur during the period March 12, 2020 through December 31, 2022. Management expects that the adoption of the guidance will not have a material impact on the fund’s financial statements.
Indemnification In the normal course of business, the fund may provide indemnification in connection with its officers and directors, service providers, and/or private company investments. The fund’s maximum exposure under these arrangements is unknown; however, the risk of material loss is currently considered to be remote.
NOTE 2 - VALUATION
Fair Value The fund’s financial instruments are valued at the close of the NYSE and are reported at fair value, which GAAP defines as the price that would be received to sell an asset or paid to transfer a liability in an orderly transaction between market participants at the measurement date. The T. Rowe Price Valuation Committee (the Valuation Committee) is an internal committee that has been delegated certain responsibilities by the fund’s Board of Directors (the Board) to ensure that financial instruments are appropriately priced at fair value in accordance with GAAP and the 1940 Act. Subject to oversight by the Board, the Valuation Committee develops and oversees pricing-related policies and procedures and approves all fair value determinations. Specifically, the Valuation Committee establishes policies and procedures used in valuing financial instruments, including those which cannot be valued in accordance with normal procedures or using pricing vendors; determines pricing techniques, sources, and persons eligible to effect fair value pricing actions; evaluates the services and performance of the pricing vendors; oversees the pricing process to ensure policies and procedures are being followed; and provides guidance on internal controls and valuation-related matters. The Valuation Committee provides periodic reporting to the Board on valuation matters.
Various valuation techniques and inputs are used to determine the fair value of financial instruments. GAAP establishes the following fair value hierarchy that categorizes the inputs used to measure fair value:
Level 1 – quoted prices (unadjusted) in active markets for identical financial instruments that the fund can access at the reporting date
Level 2 – inputs other than Level 1 quoted prices that are observable, either directly or indirectly (including, but not limited to, quoted prices for similar financial instruments in active markets, quoted prices for identical or similar financial instruments in inactive markets, interest rates and yield curves, implied volatilities, and credit spreads)
Level 3 – unobservable inputs (including the fund’s own assumptions in determining fair value)
Observable inputs are developed using market data, such as publicly available information about actual events or transactions, and reflect the assumptions that market participants would use to price the financial instrument. Unobservable inputs are those for which market data are not available and are developed using the best information available about the assumptions that market participants would use to price the financial instrument. GAAP requires valuation techniques to maximize the use of relevant observable inputs and minimize the use of unobservable inputs. When multiple inputs are used to derive fair value, the financial instrument is assigned to the level within the fair value hierarchy based on the lowest-level input that is significant to the fair value of the financial instrument. Input levels are not necessarily an indication of the risk or liquidity associated with financial instruments at that level but rather the degree of judgment used in determining those values.
Valuation Techniques Equity securities, including exchange-traded funds, listed or regularly traded on a securities exchange or in the over-the-counter (OTC) market are valued at the last quoted sale price or, for certain markets, the official closing price at the time the valuations are made. OTC Bulletin Board securities are valued at the mean of the closing bid and asked prices. A security that is listed or traded on more than one exchange is valued at the quotation on the exchange determined to be the primary market for such security. Listed securities not traded on a particular day are valued at the mean of the closing bid and asked prices for domestic securities and the last quoted sale or closing price for international securities.
The last quoted prices of non-U.S. equity securities may be adjusted to reflect the fair value of such securities at the close of the NYSE, if the fund determines that developments between the close of a foreign market and the close of the NYSE will affect the value of some or all of its portfolio securities. Each business day, the fund uses information from outside pricing services to evaluate and, if appropriate, decide whether it is necessary to adjust quoted prices to reflect fair value by reviewing a variety of factors, including developments in foreign markets, the performance of U.S. securities markets, and the performance of instruments trading in U.S. markets that represent foreign securities and baskets of foreign securities. The fund uses outside pricing services to provide it with quoted prices and information to evaluate or adjust those prices. The fund cannot predict how often it will use quoted prices and how often it will determine it necessary to adjust those prices to reflect fair value.
Debt securities generally are traded in the OTC market and are valued at prices furnished by independent pricing services or by broker dealers who make markets in such securities. When valuing securities, the independent pricing services consider the yield or price of bonds of comparable quality, coupon, maturity, and type, as well as prices quoted by dealers who make markets in such securities.
Investments in mutual funds are valued at the mutual fund’s closing NAV per share on the day of valuation. Assets and liabilities other than financial instruments, including short-term receivables and payables, are carried at cost, or estimated realizable value, if less, which approximates fair value.
Investments for which market quotations or market-based valuations are not readily available or deemed unreliable are valued at fair value as determined in good faith by the Valuation Committee, in accordance with fair valuation policies and procedures. The objective of any fair value pricing determination is to arrive at a price that could reasonably be expected from a current sale. Financial instruments fair valued by the Valuation Committee are primarily private placements, restricted securities, warrants, rights, and other securities that are not publicly traded. Factors used in determining fair value vary by type of investment and may include market or investment specific considerations. The Valuation Committee typically will afford greatest weight to actual prices in arm’s length transactions, to the extent they represent orderly transactions between market participants, transaction information can be reliably obtained, and prices are deemed representative of fair value. However, the Valuation Committee may also consider other valuation methods such as market-based valuation multiples; a discount or premium from market value of a similar, freely traded security of the same issuer; discounted cash flows; yield to maturity; or some combination. Fair value determinations are reviewed on a regular basis and updated as information becomes available, including actual purchase and sale transactions of the investment. Because any fair value determination involves a significant amount of judgment, there is a degree of subjectivity inherent in such pricing decisions, and fair value prices determined by the Valuation Committee could differ from those of other market participants.
Valuation Inputs The following table summarizes the fund’s financial instruments, based on the inputs used to determine their fair values on December 31, 2020 (for further detail by category, please refer to the accompanying Portfolio of Investments):
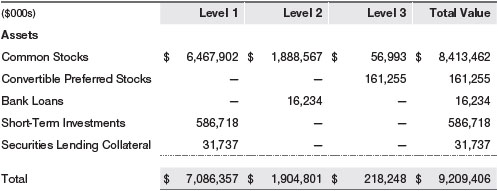
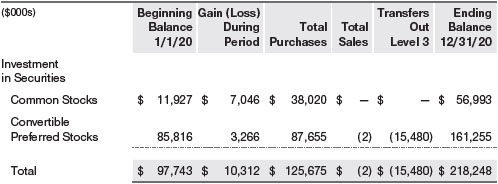
Following is a reconciliation of the fund’s Level 3 holdings for the year ended December 31, 2020. Gain (loss) reflects both realized and change in unrealized gain/ loss on Level 3 holdings during the period, if any, and is included on the accompanying Statement of Operations. The change in unrealized gain/loss on Level 3 instruments held at December 31, 2020, totaled $10,312,000 for the year ended December 31, 2020. During the year, transfers out of Level 3 were because observable market data became available for the security.
NOTE 3 - OTHER INVESTMENT TRANSACTIONS
Consistent with its investment objective, the fund engages in the following practices to manage exposure to certain risks and/or to enhance performance. The investment objective, policies, program, and risk factors of the fund are described more fully in the fund’s prospectus and Statement of Additional Information.
Emerging and Frontier Markets The fund invests, either directly or through investments in other T. Rowe Price funds, in securities of companies located in, issued by governments of, or denominated in or linked to the currencies of emerging and frontier market countries. Emerging markets, and to a greater extent frontier markets, generally have economic structures that are less diverse and mature, and political systems that are less stable, than developed countries. These markets may be subject to greater political, economic, and social uncertainty and differing regulatory environments that may potentially impact the fund’s ability to buy or sell certain securities or repatriate proceeds to U.S. dollars. Such securities are often subject to greater price volatility, less liquidity, and higher rates of inflation than U.S. securities. Investing in frontier markets is significantly riskier than investing in other countries, including emerging markets.
Restricted Securities The fund invests in securities that are subject to legal or contractual restrictions on resale. Prompt sale of such securities at an acceptable price may be difficult and may involve substantial delays and additional costs.
Bank Loans The fund invests in bank loans, which represent an interest in amounts owed by a borrower to a syndicate of lenders. Bank loans are generally noninvestment grade and often involve borrowers whose financial condition is highly leveraged. Bank loans may be in the form of either assignments or participations. A loan assignment transfers all legal, beneficial, and economic rights to the buyer, and transfer typically requires consent of both the borrower and agent. In contrast, a loan participation generally entitles the buyer to receive the cash flows from principal, interest, and any fee payments on a portion of a loan; however, the seller continues to hold legal title to that portion of the loan. As a result, the buyer of a loan participation generally has no direct recourse against the borrower and is exposed to credit risk of both the borrower and seller of the participation. Bank loans often have extended settlement periods, generally may be repaid at any time at the option of the borrower, and may require additional principal to be funded at the borrowers’ discretion at a later date (e.g., unfunded commitments and revolving debt instruments). Until settlement, the fund maintains liquid assets sufficient to settle its unfunded loan commitments. The fund reflects both the funded portion of a bank loan as well as its unfunded commitment in the Portfolio of Investments. However, if a credit agreement provides no initial funding of a tranche, and funding of the full commitment at a future date(s) is at the borrower’s discretion and considered uncertain, a loan is reflected in the Portfolio of Investments only if, and only to the extent that, the fund has actually settled a funding commitment.
Securities Lending The fund may lend its securities to approved borrowers to earn additional income. Its securities lending activities are administered by a lending agent in accordance with a securities lending agreement. Security loans generally do not have stated maturity dates, and the fund may recall a security at any time. The fund receives collateral in the form of cash or U.S. government securities. Collateral is maintained over the life of the loan in an amount not less than the value of loaned securities; any additional collateral required due to changes in security values is delivered to the fund the next business day. Cash collateral is invested in accordance with investment guidelines approved by fund management. Additionally, the lending agent indemnifies the fund against losses resulting from borrower default. Although risk is mitigated by the collateral and indemnification, the fund could experience a delay in recovering its securities and a possible loss of income or value if the borrower fails to return the securities, collateral investments decline in value, and the lending agent fails to perform. Securities lending revenue consists of earnings on invested collateral and borrowing fees, net of any rebates to the borrower, compensation to the lending agent, and other administrative costs. In accordance with GAAP, investments made with cash collateral are reflected in the accompanying financial statements, but collateral received in the form of securities is not. At December 31, 2020, the value of loaned securities was $30,433,000; the value of cash collateral and related investments was $31,737,000.
LIBOR The fund may invest in instruments that are tied to reference rates, including the LIBOR. On July 27, 2017, the United Kingdom’s Financial Conduct Authority announced a decision to transition away from LIBOR by the end of 2021. There remains uncertainty regarding the future utilization of LIBOR and the nature of any replacement rate. Any potential effects of the transition away from LIBOR on the fund, or on certain instruments in which the fund invests, are not known. The transition process may result in, among other things, an increase in volatility or illiquidity of markets for instruments that currently rely on LIBOR, a reduction in the value of certain instruments held by a the fund, or a reduction in the effectiveness of related fund transactions such as hedges. Any such effects could have an adverse impact on the fund’s performance.
Other Purchases and sales of portfolio securities other than short-term securities aggregated $4,458,119,000 and $4,687,921,000, respectively, for the year ended December 31, 2020.
NOTE 4 - FEDERAL INCOME TAXES
Generally, no provision for federal income taxes is required since the fund intends to continue to qualify as a regulated investment company under Subchapter M of the Internal Revenue Code and distribute to shareholders all of its taxable income and gains. Distributions determined in accordance with federal income tax regulations may differ in amount or character from net investment income and realized gains for financial reporting purposes.
The fund files U.S. federal, state, and local tax returns as required. The fund’s tax returns are subject to examination by the relevant tax authorities until expiration of the applicable statute of limitations, which is generally three years after the filing of the tax return but which can be extended to six years in certain circumstances. Tax returns for open years have incorporated no uncertain tax positions that require a provision for income taxes.
Financial reporting records are adjusted for permanent book/tax differences to reflect tax character but are not adjusted for temporary differences.
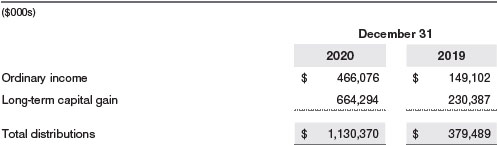
Distributions during the years ended December 31, 2020 and December 31, 2019, were characterized for tax purposes as follows:
At December 31, 2020, the tax-basis cost of investments and components of net assets were as follows:
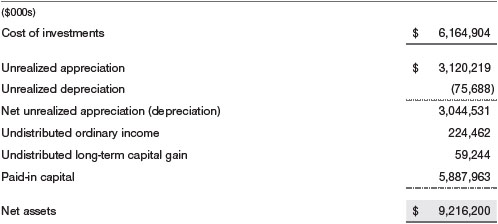
The difference between book-basis and tax-basis net unrealized appreciation (depreciation) is attributable to the deferral of losses from wash sales and the realization of gains/losses on passive foreign investment companies for tax purposes.
NOTE 5 - RELATED PARTY TRANSACTIONS
The fund is managed by T. Rowe Price Associates, Inc. (Price Associates), a wholly owned subsidiary of T. Rowe Price Group, Inc. (Price Group). The investment management agreement between the fund and Price Associates provides for an annual investment management fee, which is computed daily and paid monthly. The fee consists of an individual fund fee, equal to 0.35% of the fund’s average daily net assets, and a group fee. The group fee rate is calculated based on the combined net assets of certain mutual funds sponsored by Price Associates (the group) applied to a graduated fee schedule, with rates ranging from 0.48% for the first $1 billion of assets to 0.260% for assets in excess of $845 billion. The fund’s group fee is determined by applying the group fee rate to the fund’s average daily net assets. The fee is computed daily and paid monthly. At December 31, 2020, the effective annual group fee rate was 0.28%.
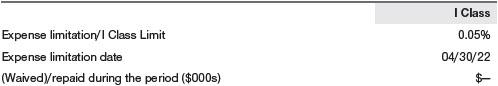
The I Class is subject to an operating expense limitation (I Class Limit) pursuant to which Price Associates is contractually required to pay all operating expenses of the I Class, excluding management fees; interest; expenses related to borrowings, taxes, and brokerage; and other non-recurring expenses permitted by the investment management agreement, to the extent such operating expenses, on an annualized basis, exceed the I Class Limit. This agreement will continue through the expense limitation date indicated in the table below, and may be renewed, revised, or revoked only with approval of the fund’s Board. The I Class is required to repay Price Associates for expenses previously paid to the extent the class’s net assets grow or expenses decline sufficiently to allow repayment without causing the class’s operating expenses (after the repayment is taken into account) to exceed the lesser of: (1) the I Class Limit in place at the time such amounts were paid; or (2) the current I Class Limit. However, no repayment will be made more than three years after the date of a payment or waiver.
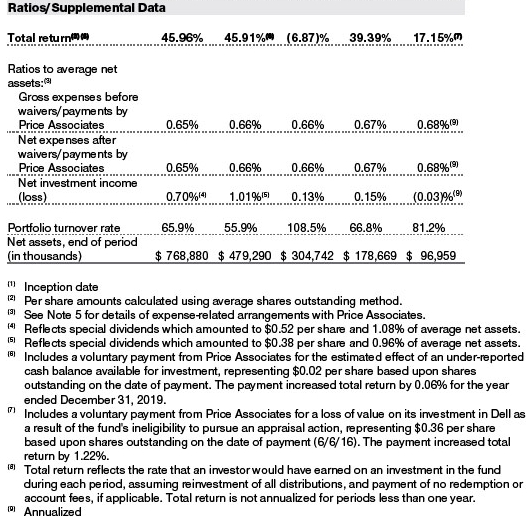
In addition, the fund has entered into service agreements with Price Associates and two wholly owned subsidiaries of Price Associates, each an affiliate of the fund (collectively, Price). Price Associates provides certain accounting and administrative services to the fund. T. Rowe Price Services, Inc. provides shareholder and administrative services in its capacity as the fund’s transfer and dividend-disbursing agent. T. Rowe Price Retirement Plan Services, Inc. provides subaccounting and recordkeeping services for certain retirement accounts invested in the Investor Class and Advisor Class. For the year ended December 31, 2020, expenses incurred pursuant to these service agreements were $68,000 for Price Associates; $3,092,000 for T. Rowe Price Services, Inc.; and $1,246,000 for T. Rowe Price Retirement Plan Services, Inc. All amounts due to and due from Price, exclusive of investment management fees payable, are presented net on the accompanying Statement of Assets and Liabilities.
Additionally, the fund is one of several mutual funds in which certain college savings plans managed by Price Associates may invest. As approved by the fund’s Board of Directors, shareholder servicing costs associated with each college savings plan are borne by the fund in proportion to the average daily value of its shares owned by the college savings plan. For the year ended December 31, 2020, the fund was charged $104,000 for shareholder servicing costs related to the college savings plans, of which $69,000 was for services provided by Price. All amounts due to and due from Price, exclusive of investment management fees payable, are presented net on the accompanying Statement of Assets and Liabilities. At December 31, 2020, approximately 1% of the outstanding shares of the Investor Class were held by college savings plans.
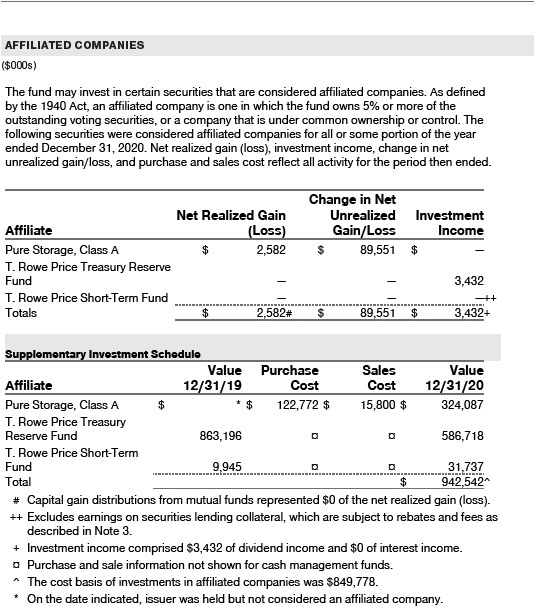
The fund may invest its cash reserves in certain open-end management investment companies managed by Price Associates and considered affiliates of the fund: the T. Rowe Price Government Reserve Fund or the T. Rowe Price Treasury Reserve Fund, organized as money market funds, or the T. Rowe Price Short-Term Fund, a short-term bond fund (collectively, the Price Reserve Funds). The Price Reserve Funds are offered as short-term investment options to mutual funds, trusts, and other accounts managed by Price Associates or its affiliates and are not available for direct purchase by members of the public. Cash collateral from securities lending is invested in the T. Rowe Price Short-Term Fund. The Price Reserve Funds pay no investment management fees.
The fund may participate in securities purchase and sale transactions with other funds or accounts advised by Price Associates (cross trades), in accordance with procedures adopted by the fund’s Board and Securities and Exchange Commission rules, which require, among other things, that such purchase and sale cross trades be effected at the independent current market price of the security. During the year ended December 31, 2020, the fund had no purchases or sales cross trades with other funds or accounts advised by Price Associates.
Effective January 1, 2020, Price Associates has voluntarily agreed to reimburse the fund from its own resources on a monthly basis for the cost of investment research embedded in the cost of the fund’s securities trades. This agreement may be rescinded at any time. For the year ended December 31, 2020, this reimbursement amounted to $245,000, which is included in Net realized gain (loss) on Securities in the Statement of Operations.
NOTE 6 - INTERFUND LENDING PROGRAM
Price Associates has developed and manages an interfund lending program that provides temporary liquidity to the T. Rowe Price-sponsored mutual funds. The program permits the borrowing and lending of cash between the fund and other T. Rowe Price-sponsored mutual funds at rates beneficial to both the borrowing and lending funds. Pursuant to program guidelines, the fund may lend up to 15% of its net assets, and no more than 5% of its net assets may be lent to any one borrower. Loans totaling 10% or more of a borrowing fund’s total assets require collateralization at 102% of the value of the loan; loans of less than 10% are unsecured. During the year ended December 31, 2020, the fund earned $5,000 in interest income related to loans made to other funds on one day in the average amount of $73,200,000 and at an average annual rate of 2.56%. At December 31, 2020, there were no loans outstanding.
NOTE 7 - OTHER MATTERS
Unpredictable events such as environmental or natural disasters, war, terrorism, pandemics, outbreaks of infectious diseases, and similar public health threats may significantly affect the economy and the markets and issuers in which a fund invests. Certain events may cause instability across global markets, including reduced liquidity and disruptions in trading markets, while some events may affect certain geographic regions, countries, sectors, and industries more significantly than others, and exacerbate other pre-existing political, social, and economic risks. During 2020, a novel strain of coronavirus (COVID-19) resulted in disruptions to global business activity and caused significant volatility and declines in global financial markets.
These types of events, such as the global pandemic caused by COVID-19, may also cause widespread fear and uncertainty, and result in, among other things: enhanced health screenings, quarantines, cancellations, and travel restrictions, including border closings; disruptions to business operations, supply chains and customer activity; exchange trading suspensions and closures, and overall reduced liquidity of securities, derivatives, and commodities trading markets; reductions in consumer demand and economic output; and significant challenges in healthcare service preparation and delivery. The fund could be negatively impacted if the value of a portfolio holding were harmed by such political or economic conditions or events. In addition, the operations of the fund, its investment advisers, and the fund’s service providers may be significantly impacted, or even temporarily halted, as a result of any impairment to their information technology and other operational systems, extensive employee illnesses or unavailability, government quarantine measures, and restrictions on travel or meetings and other factors related to public emergencies.
Governmental and quasi-governmental authorities and regulators have in the past responded to major economic disruptions with a variety of significant fiscal and monetary policy changes, including but not limited to, direct capital infusions into companies, new monetary programs, and dramatically lower interest rates. An unexpected or quick reversal of these policies, or the ineffectiveness of these policies, could negatively impact overall investor sentiment and further increase volatility in securities markets. The impact of this outbreak has adversely affected the economies of many nations and the entire global economy and may impact individual issuers and capital markets in ways that cannot be foreseen. Other infectious illness outbreaks that may arise in the future could have similar or other unforeseen effects. The duration of this outbreak or others and their effects cannot be determined with certainty.
REPORT OF INDEPENDENT REGISTERED PUBLIC ACCOUNTING FIRM
To the Board of Directors and Shareholders of
T. Rowe Price Science & Technology Fund, Inc.
Opinion on the Financial Statements
We have audited the accompanying statement of assets and liabilities, including the portfolio of investments, of T. Rowe Price Science & Technology Fund, Inc. (the “Fund”) as of December 31, 2020, the related statement of operations for the year ended December 31, 2020, the statement of changes in net assets for each of the two years in the period ended December 31, 2020, including the related notes, and the financial highlights for each of the periods indicated therein (collectively referred to as the “financial statements”). In our opinion, the financial statements present fairly, in all material respects, the financial position of the Fund as of December 31, 2020, the results of its operations for the year then ended, the changes in its net assets for each of the two years in the period ended December 31, 2020 and the financial highlights for each of the periods indicated therein, in conformity with accounting principles generally accepted in the United States of America.
Basis for Opinion
These financial statements are the responsibility of the Fund’s management. Our responsibility is to express an opinion on the Fund’s financial statements based on our audits. We are a public accounting firm registered with the Public Company Accounting Oversight Board (United States) (PCAOB) and are required to be independent with respect to the Fund in accordance with the U.S. federal securities laws and the applicable rules and regulations of the Securities and Exchange Commission and the PCAOB.
We conducted our audits of these financial statements in accordance with the standards of the PCAOB. Those standards require that we plan and perform the audit to obtain reasonable assurance about whether the financial statements are free of material misstatement, whether due to error or fraud.
Our audits included performing procedures to assess the risks of material misstatement of the financial statements, whether due to error or fraud, and performing procedures that respond to those risks. Such procedures included examining, on a test basis, evidence regarding the amounts and disclosures in the financial statements. Our audits also included evaluating the accounting principles used and significant estimates made by management, as well as evaluating the overall presentation of the financial statements. Our procedures included confirmation of securities owned as of December 31, 2020 by correspondence with the custodians, transfer agent and brokers; when replies were not received from brokers, we performed other auditing procedures. We believe that our audits provide a reasonable basis for our opinion.
PricewaterhouseCoopers LLP
Baltimore, Maryland
February 17, 2021
We have served as the auditor of one or more investment companies in the T. Rowe Price group of investment companies since 1973.
TAX INFORMATION (UNAUDITED) FOR THE TAX YEAR ENDED 12/31/20
We are providing this information as required by the Internal Revenue Code. The amounts shown may differ from those elsewhere in this report because of differences between tax and financial reporting requirements.
The fund’s distributions to shareholders included:
| ■ | $421,559,000 from short-term capital gains, |
| |
| ■ | $664,294,000 from long-term capital gains, subject to a long-term capital gains tax rate of not greater than 20% |
For taxable non-corporate shareholders, $104,736,000 of the fund’s income represents qualified dividend income subject to a long-term capital gains tax rate of not greater than 20%.
For corporate shareholders, $98,177,000 of the fund’s income qualifies for the dividends received deduction.
INFORMATION ON PROXY VOTING POLICIES, PROCEDURES, AND RECORDS
A description of the policies and procedures used by T. Rowe Price funds and portfolios to determine how to vote proxies relating to portfolio securities is available in each fund’s Statement of Additional Information. You may request this document by calling 1-800-225-5132 or by accessing the SEC’s website, sec.gov.
The description of our proxy voting policies and procedures is also available on our corporate website. To access it, please visit the following Web page:
https://www.troweprice.com/corporate/en/utility/policies.html
Scroll down to the section near the bottom of the page that says, “Proxy Voting Policies.” Click on the Proxy Voting Policies link in the shaded box.
Each fund’s most recent annual proxy voting record is available on our website and through the SEC’s website. To access it through T. Rowe Price, visit the website location shown above, and scroll down to the section near the bottom of the page that says, “Proxy Voting Records.” Click on the Proxy Voting Records link in the shaded box.
HOW TO OBTAIN QUARTERLY PORTFOLIO HOLDINGS
Effective for reporting periods on or after March 1, 2019, a fund, except a money market fund, files a complete schedule of portfolio holdings with the Securities and Exchange Commission (SEC) for the first and third quarters of each fiscal year as an exhibit to its reports on Form N-PORT. Prior to March 1, 2019, a fund, including a money market fund, filed a complete schedule of portfolio holdings with the SEC for the first and third quarters of each fiscal year on Form N-Q. A money market fund files detailed month-end portfolio holdings information on Form N-MFP with the SEC each month and posts a complete schedule of portfolio holdings on its website (troweprice.com) as of each month-end for the previous six months. A fund’s Forms N-PORT, N-MFP, and N-Q are available electronically on the SEC’s website (sec.gov).
ABOUT THE FUND’S DIRECTORS AND OFFICERS
Your fund is overseen by a Board of Directors (Board) that meets regularly to review a wide variety of matters affecting or potentially affecting the fund, including performance, investment programs, compliance matters, advisory fees and expenses, service providers, and business and regulatory affairs. The Board elects the fund’s officers, who are listed in the final table. At least 75% of the Board’s members are considered to be independent, i.e., not “interested persons” as defined in Section 2(a)(19) of the 1940 Act, of the Boards of T. Rowe Price Associates, Inc. (T. Rowe Price), and its affiliates; “interested” directors and officers are employees of T. Rowe Price. The business address of each director and officer is 100 East Pratt Street, Baltimore, Maryland 21202. The Statement of Additional Information includes additional information about the fund directors and is available without charge by calling a T. Rowe Price representative at 1-800-638-5660.
INDEPENDENT DIRECTORS(a)
Name
(Year of Birth)
Year Elected
[Number of T. Rowe Price
Portfolios Overseen] | | Principal Occupation(s) and Directorships of Public Companies and Other Investment Companies During the Past Five Years |
| | | |
Teresa Bryce Bazemore
(1959)
2018
[190] | | President, Radian Guaranty (2008 to 2017); Chief Executive Officer, Bazemore Consulting LLC (2018 to present); Director, Chimera Investment Corporation (2017 to present); Director, First Industrial Realty Trust (2020 to present); Director, Federal Home Loan Bank of Pittsburgh (2017 to 2019) |
| | | |
Ronald J. Daniels
(1959)
2018
[190] | | President, The Johns Hopkins University(b) and Professor, Political Science Department, The Johns Hopkins University (2009 to present); Director, Lyndhurst Holdings (2015 to present); Director, BridgeBio Pharma, Inc. (2020 to present) |
| | | |
Bruce W. Duncan
(1951)
2013
[190] | | President, Chief Executive Officer, and Director, CyrusOne, Inc. (2020 to present); Chief Executive Officer and Director (2009 to 2016), Chairman of the Board (2016 to 2020), and President (2009 to 2016), First Industrial Realty Trust, owner and operator of industrial properties; Chairman of the Board (2005 to 2016) and Director (1999 to 2016), Starwood Hotels & Resorts, a hotel and leisure company; Member, Investment Company Institute Board of Governors (2017 to 2019); Member, Independent Directors Council Governing Board (2017 to 2019); Senior Advisor, KKR (2018 to present); Director, Boston Properties (2016 to present); Director, Marriott International, Inc. (2016 to 2020) |
| | | |
Robert J. Gerrard, Jr.
(1952)
2012
[190] | | Advisory Board Member, Pipeline Crisis/Winning Strategies, a collaborative working to improve opportunities for young African Americans (1997 to 2016); Chairman of the Board, all funds (since July 2018) |
| | | |
Paul F. McBride
(1956)
2013
[190] | | Advisory Board Member, Vizzia Technologies (2015 to present); Board Member, Dunbar Armored (2012 to 2018) |
| | | |
Cecilia E. Rouse, Ph.D.
(1963)
2012
[190] | | Dean, Princeton School of Public and International Affairs (2012 to present); Professor and Researcher, Princeton University (1992 to present); Director of Education Studies Committee, MDRC, a nonprofit education and social policy research organization (2011 to 2020); Member, National Academy of Education (2010 to present); Board Member, National Bureau of Economic Research (2011 to present); Board Member of the Council on Foreign Relations (2018 to present); Board Member, The Pennington School (2017 to present); Board Member, the University of Rhode Island (2020 to present); Chair of Committee on the Status of Minority Groups in the Economic Profession of the American Economic Association (2012 to 2018); Vice President (2015 to 2016) and Board Member (2018 to present), American Economic Association |
| | | |
John G. Schreiber
(1946)
2001
[190] | | Owner/President, Centaur Capital Partners, Inc., a real estate investment company (1991 to present); Cofounder, Partner, and Cochairman of the Investment Committee, Blackstone Real Estate Advisors, L.P. (1992 to 2015); Director, Blackstone Mortgage Trust, a real estate finance company (2012 to 2016); Director and Chairman of the Board, Brixmor Property Group, Inc. (2013 to present); Director, Hilton Worldwide (2007 to present); Director, Hudson Pacific Properties (2014 to 2016); Director, Invitation Homes (2014 to 2017); Director, JMB Realty Corporation (1980 to present) |
| | | |
(a)All information about the independent directors was current as of December 31, 2019, unless otherwise indicated, except for the number of portfolios overseen, which is current as of the date of this report. |
(b)William J. Stromberg, president and chief executive officer of T. Rowe Price Group, Inc., the parent company of the Price Funds’ investment advisor, has served on the Board of Trustees of Johns Hopkins University since 2014. |
INTERESTED DIRECTORS(a)
Name
(Year of Birth)
Year Elected
[Number of T. Rowe Price
Portfolios Overseen] | | Principal Occupation(s) and Directorships of Public Companies and Other Investment Companies During the Past Five Years |
| | | |
David Oestreicher
(1967)
2018
[190] | | General Counsel, Vice President, and Secretary, T. Rowe Price Group, Inc.; Chairman of the Board, Chief Executive Officer, President, and Secretary, T. Rowe Price Trust Company; Director, Vice President, and Secretary, T. Rowe Price, T. Rowe Price Investment Services, Inc., T. Rowe Price Retirement Plan Services, Inc., and T. Rowe Price Services, Inc.; Vice President and Secretary, T. Rowe Price International; Vice President, T. Rowe Price Hong Kong (Price Hong Kong), T. Rowe Price Japan (Price Japan), and T. Rowe Price Singapore (Price Singapore); Principal Executive Officer and Executive Vice President, all funds |
| | | |
Robert W. Sharps, CFA, CPA
(1971)
2017
[190] | | Director and Vice President, T. Rowe Price; Vice President, T. Rowe Price Group, Inc., and T. Rowe Price Trust Company |
| | | |
(a)All information about the interested directors was current as of December 31, 2019, unless otherwise indicated, except for the number of portfolios overseen, which is current as of the date of this report. |
OFFICERS
Name (Year of Birth)
Position Held With Science &
Technology Fund | | Principal Occupation(s) |
| | | |
Kennard W. Allen (1977)
President | | Vice President, T. Rowe Price and T. Rowe Price Group, Inc. |
| | | |
Darrell N. Braman (1963)
Vice President | | Vice President, Price Hong Kong, Price Singapore, T. Rowe Price, T. Rowe Price Group, Inc., T. Rowe Price International, T. Rowe Price Investment Services, Inc., and T. Rowe Price Services, Inc. |
| | | |
Greg Dunham, CFA (1974)
Vice President | | Vice President, T. Rowe Price and T. Rowe Price Group, Inc. |
| | |
Alan S. Dupski, CPA (1982)
Principal Financial Officer, Vice President, and
Treasurer | | Vice President, T. Rowe Price, T. Rowe Price Group, Inc., and T. Rowe Price Trust Company |
| | | |
David J. Eiswert, CFA (1972)
Vice President | | Vice President, T. Rowe Price and T. Rowe Price Group, Inc. |
| | |
John R. Gilner (1961)
Chief Compliance Officer | | Chief Compliance Officer and Vice President, T. Rowe Price; Vice President, T. Rowe Price Group, Inc., and T. Rowe Price Investment Services, Inc. |
| | | |
Gary J. Greb (1961)
Vice President | | Vice President, T. Rowe Price, T. Rowe Price International, and T. Rowe Price Trust Company |
| | |
Paul D. Greene II (1978)
Vice President | | Vice President, T. Rowe Price and T. Rowe Price Group, Inc. |
| | |
Sam Johnson (1992)
Vice President | | Employee, T. Rowe Price |
| | |
Paul J. Krug, CPA (1964)
Vice President | | Vice President, T. Rowe Price, T. Rowe Price Group, Inc., and T. Rowe Price Trust Company |
| | |
Jacqueline L. Liu (1979)
Vice President | | Vice President, Price Hong Kong and T. Rowe Price Group, Inc. |
| | |
Ross MacMillan (1970)
Vice President | | Vice President, T. Rowe Price; formerly, Managing Director, RBC Capital Markets (to 2019) |
| | |
Fran M. Pollack-Matz (1961)
Vice President and Secretary | | Vice President, T. Rowe Price and T. Rowe Price Group, Inc. |
| | |
Shannon H. Rauser (1987)
Assistant Secretary | | Assistant Vice President, T. Rowe Price |
| | |
Dominic Rizzo (1993)
Vice President | | Vice President, T. Rowe Price International |
| | |
Emily C. Scudder, CFA, CPA (1985)
Vice President | | Vice President, T. Rowe Price and T. Rowe Price Group, Inc. |
| | |
Joshua K. Spencer, CFA (1973)
Vice President | | Vice President, T. Rowe Price, T. Rowe Price Group, Inc., and T. Rowe Price Trust Company |
| | |
James Stillwagon (1982)
Vice President | | Vice President, T. Rowe Price and T. Rowe Price Group, Inc.; formerly, Partner, Cat Rock Capital (to 2016) |
| | | |
Alan Tu (1985)
Vice President | | Vice President, T. Rowe Price and T. Rowe Price Group, Inc. |
| | |
Anthony B. Wang (1989)
Vice President | | Vice President, T. Rowe Price and T. Rowe Price Group, Inc.; formerly, student, Harvard Business School (to 2017) |
| | | |
Megan Warren (1968)
Vice President | | Vice President, T. Rowe Price, T. Rowe Price Group, Inc., T. Rowe Price Retirement Plan Services, Inc., T. Rowe Price Services, Inc., and T. Rowe Price Trust Company; formerly, Executive Director, JPMorgan Chase (to 2017) |
| | | |
Thomas H. Watson (1977)
Vice President | | Director and Vice President, T. Rowe Price Trust Company; Vice President, T. Rowe Price and T. Rowe Price Group, Inc. |
| | | |
Alison Mei Ling Yip (1966)
Vice President | | Vice President, Price Hong Kong and T. Rowe Price Group, Inc. |
| | |
Unless otherwise noted, officers have been employees of T. Rowe Price or T. Rowe Price International for at least 5 years. |
Item 1. (b) Notice pursuant to Rule 30e-3.
Not applicable.
Item 2. Code of Ethics.
The registrant has adopted a code of ethics, as defined in Item 2 of Form N-CSR, applicable to its principal executive officer, principal financial officer, principal accounting officer or controller, or persons performing similar functions. A copy of this code of ethics is filed as an exhibit to this Form N-CSR. No substantive amendments were approved or waivers were granted to this code of ethics during the period covered by this report.
Item 3. Audit Committee Financial Expert.
The registrant’s Board of Directors/Trustees has determined that Mr. Bruce W. Duncan qualifies as an audit committee financial expert, as defined in Item 3 of Form N-CSR. Mr. Duncan is considered independent for purposes of Item 3 of Form N-CSR.
Item 4. Principal Accountant Fees and Services.
(a) – (d) Aggregate fees billed for the last two fiscal years for professional services rendered to, or on behalf of, the registrant by the registrant’s principal accountant were as follows:
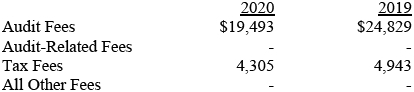
Audit fees include amounts related to the audit of the registrant’s annual financial statements and services normally provided by the accountant in connection with statutory and regulatory filings. Audit-related fees include amounts reasonably related to the performance of the audit of the registrant’s financial statements and specifically include the issuance of a report on internal controls and, if applicable, agreed-upon procedures related to fund acquisitions. Tax fees include amounts related to services for tax compliance, tax planning, and tax advice. The nature of these services specifically includes the review of distribution calculations and the preparation of Federal, state, and excise tax returns. All other fees include the registrant’s pro-rata share of amounts for agreed-upon procedures in conjunction with service contract approvals by the registrant’s Board of Directors/Trustees.
(e)(1) The registrant’s audit committee has adopted a policy whereby audit and non-audit services performed by the registrant’s principal accountant for the registrant, its investment adviser, and any entity controlling, controlled by, or under common control with the investment adviser that provides ongoing services to the registrant require pre-approval in advance at regularly scheduled audit committee meetings. If such a service is required between regularly scheduled audit committee meetings, pre-approval may be authorized by one audit committee member with ratification at the next scheduled audit committee meeting. Waiver of pre-approval for audit or non-audit services requiring fees of a de minimis amount is not permitted.
(2) No services included in (b) – (d) above were approved pursuant to paragraph (c)(7)(i)(C) of Rule 2-01 of Regulation S-X.
(f) Less than 50 percent of the hours expended on the principal accountant’s engagement to audit the registrant’s financial statements for the most recent fiscal year were attributed to work performed by persons other than the principal accountant’s full-time, permanent employees.
(g) The aggregate fees billed for the most recent fiscal year and the preceding fiscal year by the registrant’s principal accountant for non-audit services rendered to the registrant, its investment adviser, and any entity controlling, controlled by, or under common control with the investment adviser that provides ongoing services to the registrant were $3,781,000 and $3,227,000, respectively.
(h) All non-audit services rendered in (g) above were pre-approved by the registrant’s audit committee. Accordingly, these services were considered by the registrant’s audit committee in maintaining the principal accountant’s independence.
Item 5. Audit Committee of Listed Registrants.
Not applicable.
Item 6. Investments.
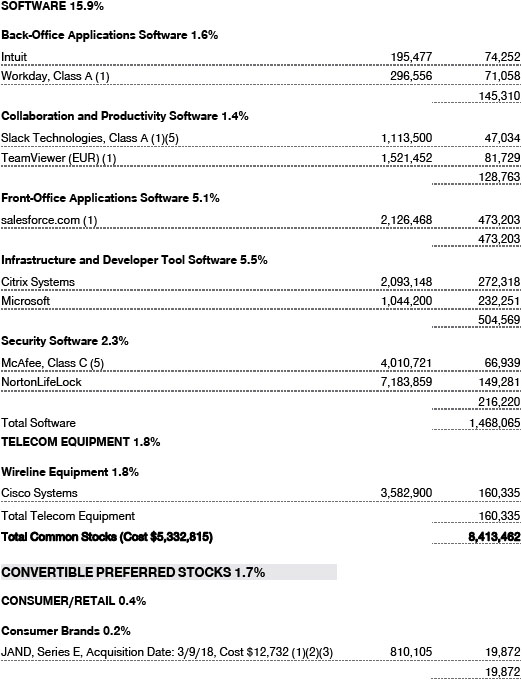
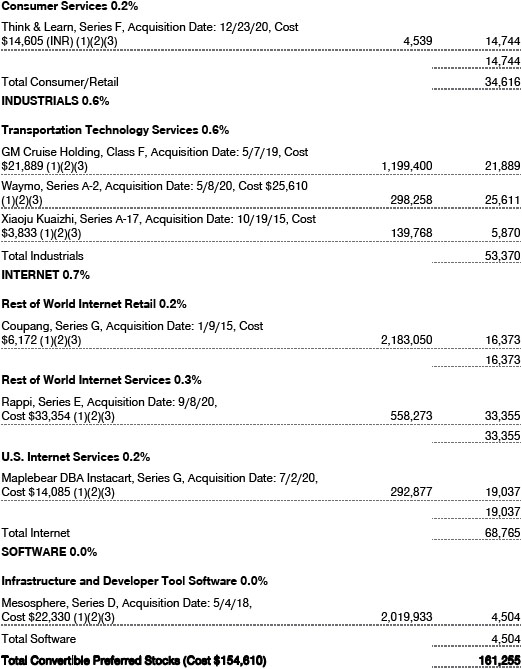
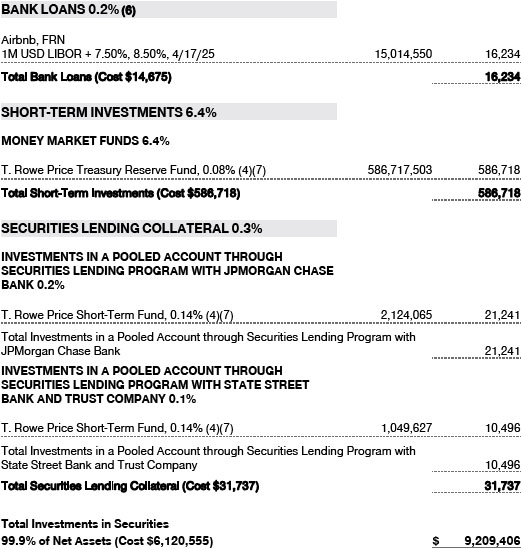
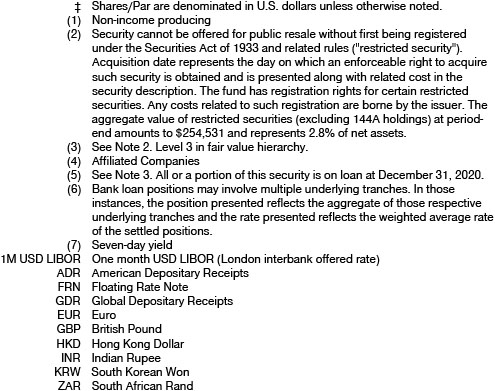
(a) Not applicable. The complete schedule of investments is included in Item 1 of this Form N-CSR.
(b) Not applicable.
Item 7. Disclosure of Proxy Voting Policies and Procedures for Closed-End Management Investment Companies.
Not applicable.
Item 8. Portfolio Managers of Closed-End Management Investment Companies.
Not applicable.
Item 9. Purchases of Equity Securities by Closed-End Management Investment Company and Affiliated Purchasers.
Not applicable.
Item 10. Submission of Matters to a Vote of Security Holders.
There has been no change to the procedures by which shareholders may recommend nominees to the registrant’s board of directors.
Item 11. Controls and Procedures.
(a) The registrant’s principal executive officer and principal financial officer have evaluated the registrant’s disclosure controls and procedures within 90 days of this filing and have concluded that the registrant’s disclosure controls and procedures were effective, as of that date, in ensuring that information required to be disclosed by the registrant in this Form N-CSR was recorded, processed, summarized, and reported timely.
(b) The registrant’s principal executive officer and principal financial officer are aware of no change in the registrant’s internal control over financial reporting that occurred during the period covered by this report that has materially affected, or is reasonably likely to materially affect, the registrant’s internal control over financial reporting.
Item 12. Disclosure of Securities Lending Activities for Closed-End Management Investment Companies.
Not applicable.
Item 13. Exhibits.
(a)(1) The registrant’s code of ethics pursuant to Item 2 of Form N-CSR is attached.
(2) Separate certifications by the registrant's principal executive officer and principal financial officer, pursuant to Section 302 of the Sarbanes-Oxley Act of 2002 and required by Rule 30a-2(a) under the Investment Company Act of 1940, are attached.
(3) Written solicitation to repurchase securities issued by closed-end companies: not applicable.
(b) A certification by the registrant's principal executive officer and principal financial officer, pursuant to Section 906 of the Sarbanes-Oxley Act of 2002 and required by Rule 30a-2(b) under the Investment Company Act of 1940, is attached.
SIGNATURES
Pursuant to the requirements of the Securities Exchange Act of 1934 and the Investment Company Act of 1940, the registrant has duly caused this report to be signed on its behalf by the undersigned, thereunto duly authorized.
T. Rowe Price Science & Technology Fund, Inc.
| By | | /s/ David Oestreicher |
| | | David Oestreicher |
| | | Principal Executive Officer |
| |
| Date | | February 17, 2021 | | | | |
Pursuant to the requirements of the Securities Exchange Act of 1934 and the Investment Company Act of 1940, this report has been signed below by the following persons on behalf of the registrant and in the capacities and on the dates indicated.
| By | | /s/ David Oestreicher |
| | | David Oestreicher |
| | | Principal Executive Officer |
| |
| Date | | February 17, 2021 | | | | |
| |
| |
| By | | /s/ Alan S. Dupski |
| | | Alan S. Dupski |
| | | Principal Financial Officer |
| |
| Date | | February 17, 2021 | | | | |