Filed by Barrick Gold Corporation This communication is filed pursuant to Rule 425 under The Securities Act of 1933, as amended. Subject Company: Placer Dome Inc. Commission File Number: 1-9059 Date: November 1, 2005 |
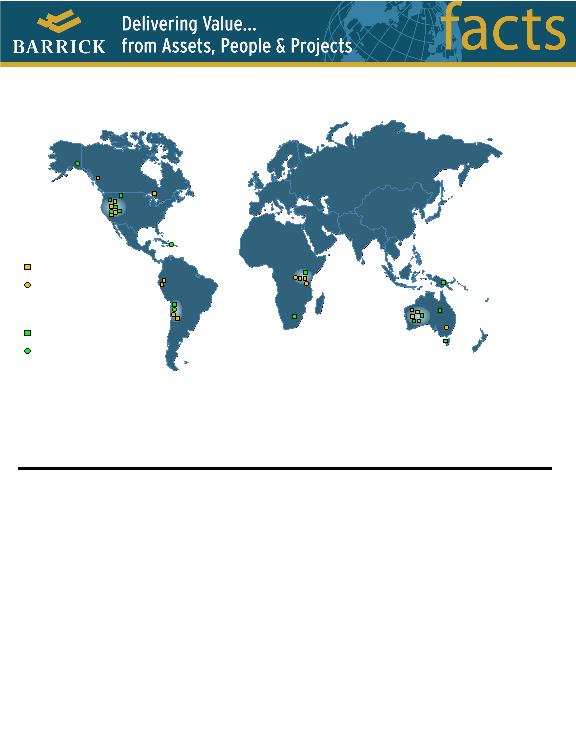
Many Barrick and Placer Dome operating mines, projects and exploration properties are in close proximity: for example, Nevada, Chile, Australia and Tanzania. Barrick anticipates to capture synergies of approximately $200 million a year. Barrick has the financial strength and expertise to realize the opportunities presented by this expanded asset base, and the established Regional Business structure to effectively integrate the assets, people and projects of both companies.
1
The Combined Company
Barrick
Placer Dome
Mines
Projects
Mines
Projects
Operations
North America
Barrick
Goldstrike – Nevada
Round Mountain (50%) – Nevada
Eskay Creek – B.C.
Hemlo (50%) – Ontario
Marigold (33%) – Nevada
Placer Dome
Cortez (60%) – Nevada
Turquoise Ridge (75%) – Nevada
Bald Mountain – Nevada
Golden Sunlight – Montana
South America
Barrick
Lagunas Norte – Peru
Pierina – Peru
Veladero – Argentina
Placer Dome
Zaldivar (copper) – Chile
Australia/Asia
Barrick
Kalgoorlie (50%) – W. Australia
Plutonic – W. Australia
Lawlers – W. Australia
Darlot – W. Australia
Placer Dome
Porgera (75%) – Papua New Guinea
Kalgoorlie – W. Australia
Granny Smith – W. Australia
Henty – Tasmania
Osborne (copper) - Queensland
Africa
Barrick
Bulyanhulu – Tanzania
Tulawaka (70%) – Tanzania
Placer Dome
North Mara – Tanzania
South Deep (50%) – S. Africa
Projects
Barrick
Cowal – Australia (2006)
East Archimedes – Nevada
(2007)
Buzwagi – Tanzania (2008)
Pascua-Lama – Chile/Argentina
(2009)
Kabanga (nickel) (50%) –
Tanzania (Beyond 2009)
Tanzania (Beyond 2009)
Placer Dome
Cortez Hills (60%) – Nevada
(2008)
(2008)
Pueblo Viejo (60%) – Dominican
Republic (Beyond 2009)
Republic (Beyond 2009)
Donlin Creek (70%) – Alaska
(Beyond 2009)
(Beyond 2009)
Cerro Casale (51%)1– Chile (Beyond 2009)
1 Placer Dome announced agreement in principle to sell their interest to Arizona Star and Bema Gold.
•
Founded in 1983
•
Gold production of 4.96 million ounces in 2004
•
Gold production of 3.81 million ounces for the 9-month period ended Sept. 30, 2005, and on track to meet original full-year guidance to produce between 5.4 to 5.5 million ounces
•
14 operations and 5 projects in 7 countries
Proven and probable gold reserves2: 89.1 million ounces (December 31, 2004)
Listed on Toronto, New York, London, Euronext Paris and the Swiss stock exchanges
•
•
Barrick Gold Corporation
2
Combined Company*
•
149.8 million in proven and probable gold reserves and 63.3 million ounces in resources based on 2004 year-end figures and Placer Dome’s publicly-announced adjustments in 2005
•
Proven and probable copper reserves of 6,542 million pounds as at December 31, 2004
•
Estimated production of between 8.3 and 8.4 million ounces of gold and about 370 million pounds of copper for 2005 from a portfolio of quality operations in key gold-producing districts
•
Estimated total cash costs per ounce of gold in the range of $245-250 for 2005
•
Proven cost-containment strategies to mitigate industry-wide cost pressures
•
Opportunities to grow, with an unrivalled pipeline of nine projects on four continents and extensive land positions for exploration in 16 countries – reflecting a balanced geopolitical risk profile
•
Cash position (assuming cash proceeds from the exercise of stock options) of $2.4 billion as at September 30, 2005, and EBITDA of approximately $1 billion for the twelve months ended September 30, 2005
•
The ability to finance a combined project pipeline without equity dilution
•
A performance-driven management team with demonstrated expertise in developing, financing and operating large scale mines worldwide.
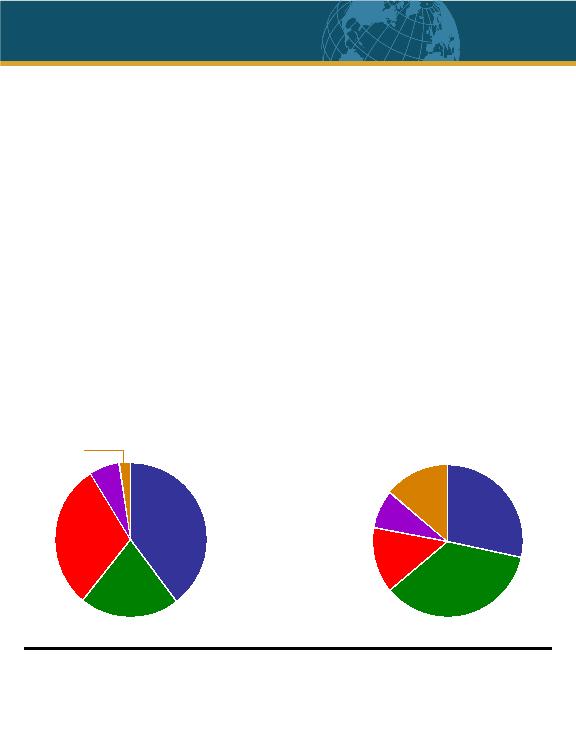
Gold Equivalent
Reserves & Resources
Reserves & Resources
2005E Production
North America
South America
Australasia
Tanzania
South Africa
2 Based on reserves calculated at December 31, 2004 using an assumed price of $375 per ounce for gold and $5.50 per ounce for silver and an exchange ratio rate of $1.45 C$/US$. Calculations were performed by employees of Barrick under the supervision of Rene L. Marion, P. Eng., Vice President, Technical Services of Barrick. Reserve calculations incorporate current and/or expected mine plans and cost levels. Barrick’s normal data verification procedures have been employed in connection with the calculations. For a breakdown of reserves by category and for additional information on Barrick’s reserve methodology, see Barrick’s most recent Annual Information Form / Form 40-F on file with Canadian provincial securities regulatory authorities and the US Securities and Exchange Commission.
* Adjusted for sale of Goldcorp assets.
35.6%
13.9%
13.8%
8.3%
28.4%
21.0%
30.0%
7.0%
39.6%
2.4%
| Important Notice |
| Barrick plans to file with the U.S. Securities and Exchange Commission a Registration Statement on Form F-8, which will include Barrick’s offer and take-over bid circular. Investors and security holders are urged to read the offer and take-over bid circular, regarding the proposed business combination transaction referred to in the foregoing information, when these documents become available, because they will contain important information. Investors may obtain a free copy of the offer and take-over bid circular when they become available and other documents filed by Barrick with the SEC at the SEC’s website at www.sec.gov. The prospectus and these other documents may also be obtained for free, once they have been mailed, on Barrick’s website or by directing a request to Barrick’s media or investor relations department. |