- COHR Dashboard
- Financials
- Filings
-
Holdings
- Transcripts
- ETFs
- Insider
- Institutional
- Shorts
-
8-K Filing
Coherent (COHR) 8-KCoherent Corp. Reports Second Quarter Fiscal 2025 Results
Filed: 5 Feb 25, 4:05pm
Second Quarter Fiscal 2025 February 2025 Investor Presentation Exhibit 99.2
Forward-Looking Statements This presentation contains forward-looking statements relating to future events and expectations, including our expectations regarding (i) the growth, megatrends, and value proposition in the markets we serve including industrial, communications, electronics, and instrumentation; and (ii) our estimates and projections for our business outlook for the third quarter of fiscal 2025, each of which is based on certain assumptions and contingencies. The forward-looking statements are made pursuant to the safe harbor provisions of the U.S. Private Securities Litigation Reform Act of 1995 and relate to the Company’s performance on a going-forward basis. The forward-looking statements in this investor presentation involve risks and uncertainties, which could cause actual results, performance, or trends to differ materially from those expressed in the forward-looking statements herein or in previous disclosures. The Company believes that all forward-looking statements made by it in this presentation have a reasonable basis, but there can be no assurance that management’s expectations, beliefs, or projections as expressed in the forward-looking statements will actually occur or prove to be correct. In addition to general industry and global economic conditions, factors that could cause actual results to differ materially from those discussed in the forward-looking statements in this presentation include but are not limited to: (i) the failure of any one or more of the assumptions stated herein to prove to be correct; (ii) the risks relating to forward-looking statements and other “Risk Factors” identified from time to time in our filings with the Securities and Exchange Commission (“SEC”), including our Annual Report on Form 10-K for the fiscal year ended June 30, 2024, and subsequently filed Quarterly Reports on Form 10-Q, which filings are available from the SEC; (iii) the substantial indebtedness the Company incurred in connection with its acquisition of Coherent, Inc. (the “Transaction”), the need to generate sufficient cash flows to service and repay such debt, and the Company’s ability to generate sufficient funds to meet its anticipated debt reduction goals; (iv) the possibility that the Company may not be able to continue its integration progress on and/or take other restructuring actions, or otherwise be able to achieve expected synergies, operating efficiencies, including greater scale, focus, resiliency, and lower operating costs, and other benefits within the expected time frames or at all and ultimately to successfully fully integrate the operations of Coherent, Inc. (“Coherent”), with those of the Company; (v) the possibility that such integration and/or the restructuring actions may be more difficult, time-consuming, or costly than expected or that operating costs and business disruption (including, without limitation, disruptions in relationships with employees, customers, or suppliers) may be greater than expected in connection with the Transaction and/or the restructuring actions; (vi) any unexpected costs, charges, or expenses resulting from the Transaction and/or the restructuring actions; (vii) the risk that disruption from the Transaction and/or the restructuring actions materially and adversely affects the respective businesses and operations of the Company and Coherent; (viii) potential adverse reactions or changes to business relationships resulting from the completion of the Transaction and/or the restructuring actions; (ix) the ability of the Company to retain and hire key employees; (x) the purchasing patterns of customers and end users; (xi) the timely release of new products and acceptance of such new products by the market; (xii) the introduction of new products by competitors and other competitive responses; (xiii) the Company’s ability to assimilate other recently acquired businesses and realize synergies, cost savings, and opportunities for growth in connection therewith, together with the risks, costs, and uncertainties associated with such acquisitions; (xiv) the Company’s ability to devise and execute strategies to respond to market conditions; (xv) the risks to realizing the benefits of investments in R&D and commercialization of innovations; (xvi) the risks that the Company’s stock price will not trade in line with industrial technology leaders; and/or (xvii) the risks of business and economic disruption related to worldwide health epidemics or outbreaks that may arise. The Company disclaims any obligation to update information contained in these forward-looking statements, whether as a result of new information, future events or developments, or otherwise. Unless otherwise indicated in this presentation, all information in this presentation is as of February 5, 2025. This presentation contains non-GAAP financial measures and key metrics relating to the Company’s past performance. We believe the presentation of these non-GAAP financial measures enhances investors' overall understanding of our historical financial performance and assists investors in comparing our performance across reporting periods. These non-GAAP financial measures are in addition to, and not as a substitute for or superior to, measures of financial performance prepared in accordance with U.S. GAAP. There are a number of limitations related to the use of these non-GAAP financial measures versus their nearest GAAP equivalents. For example, other companies may calculate non-GAAP financial measures differently or may use other measures to evaluate their performance, all of which could reduce the usefulness of our non-GAAP financial measures as tools for comparison. As required by Regulation G, we have provided reconciliations of those measures to the most directly comparable GAAP measures in the section captioned “GAAP to NON-GAAP RECONCILIATION.”
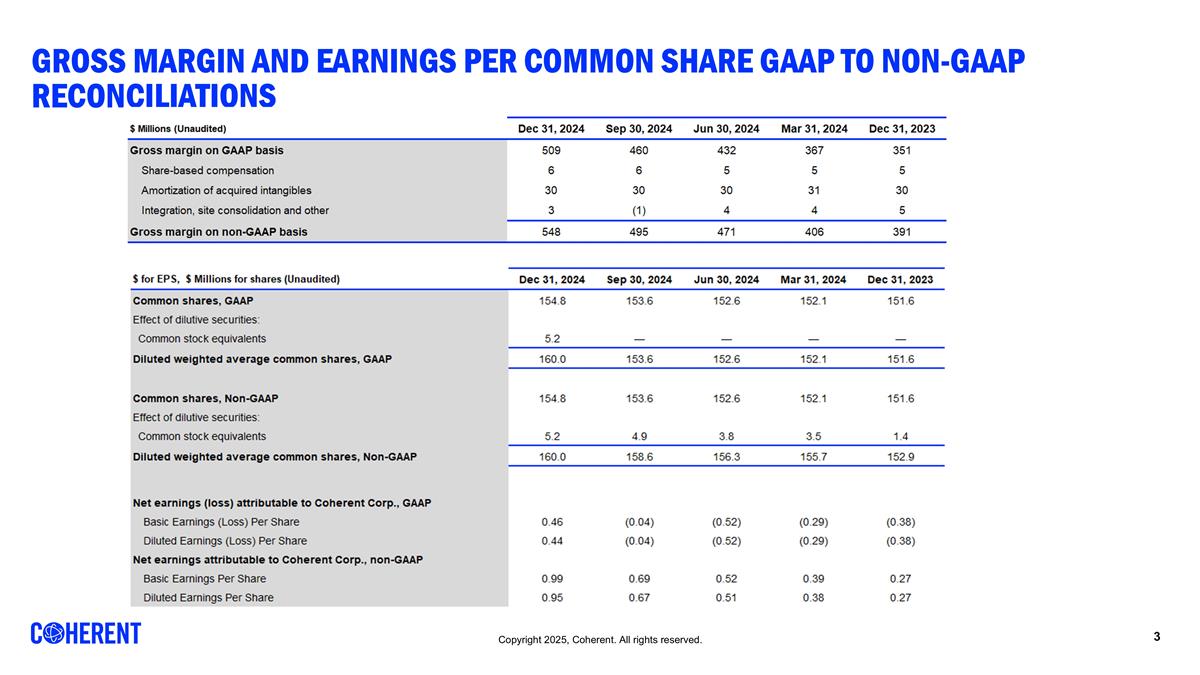
Gross MARGIN and earnings per common share GAAP to Non-GAAP Reconciliations
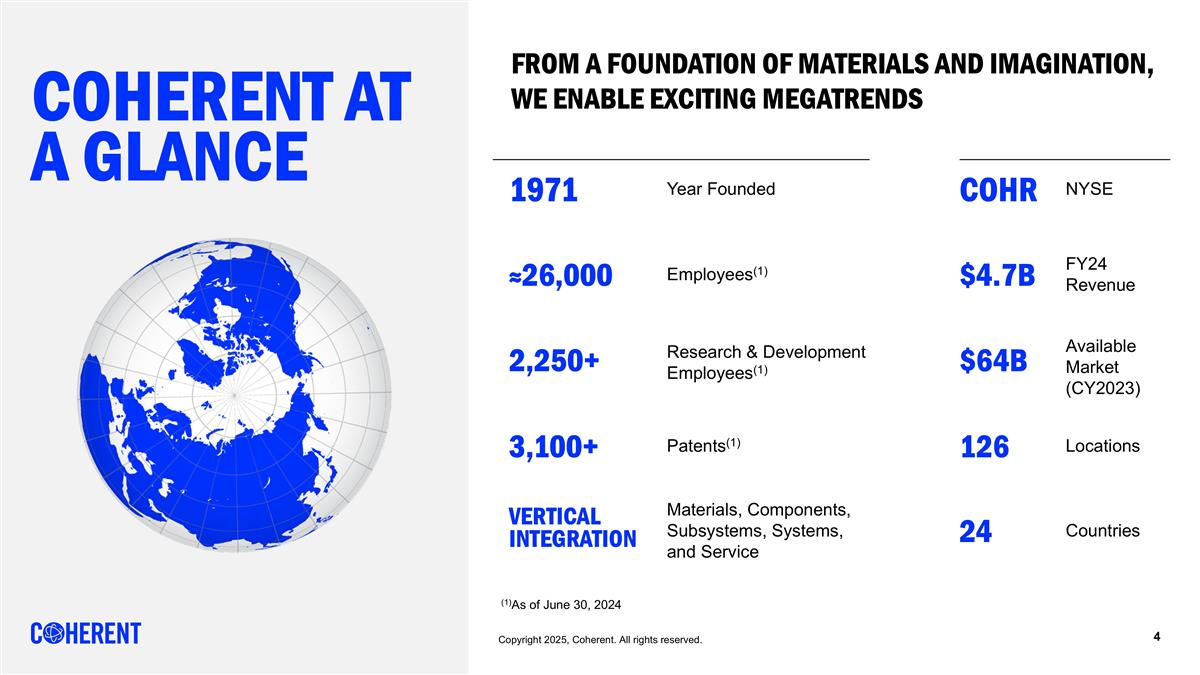
Patents(1) COHERENT at a Glance From a Foundation of Materials and Imagination, We Enable Exciting Megatrends 1971 Year Founded COHR NYSE 126 Locations 3,100+ ≈26,000 Employees(1) FY24 Revenue $4.7B 24 Countries VERTICAL INTEGRATION Materials, Components, Subsystems, Systems, and Service 2,250+ Research & Development Employees(1) Available Market (CY2023) $64B (1)As of June 30, 2024
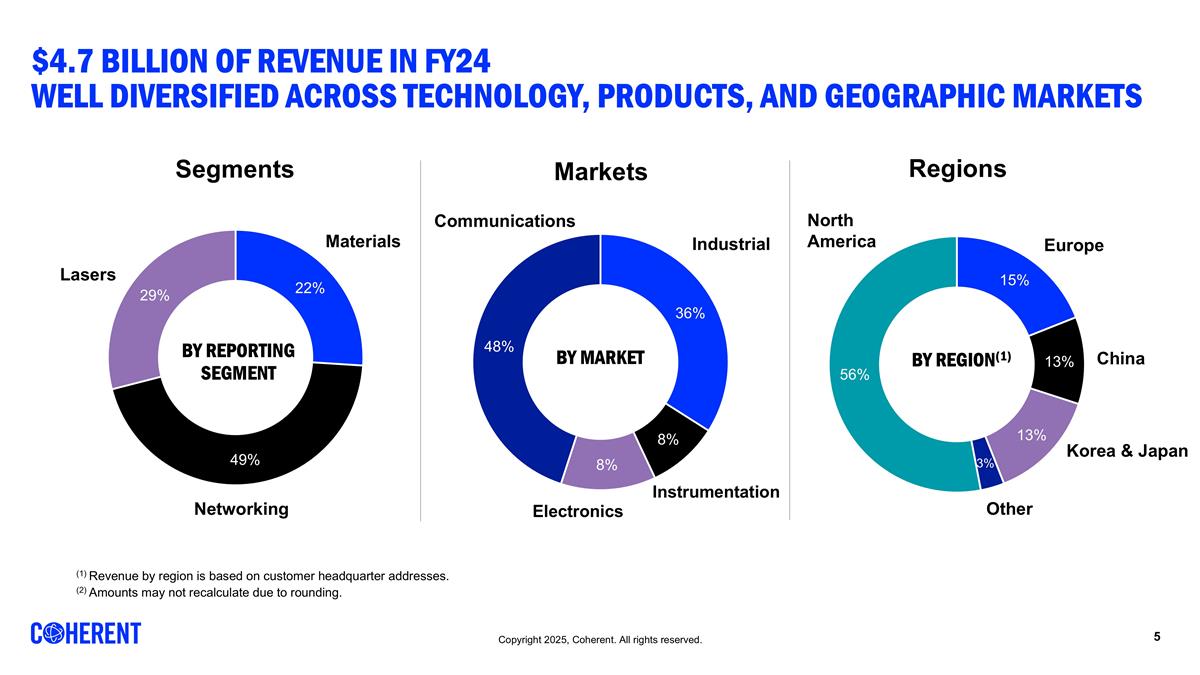
$4.7 Billion of Revenue in FY24 Well diversified across technology, Products, and Geographic Markets (1) Revenue by region is based on customer headquarter addresses. (2) Amounts may not recalculate due to rounding. Industrial Communications Electronics Instrumentation North America Europe China Other Materials Lasers Networking Korea & Japan Markets Regions Segments
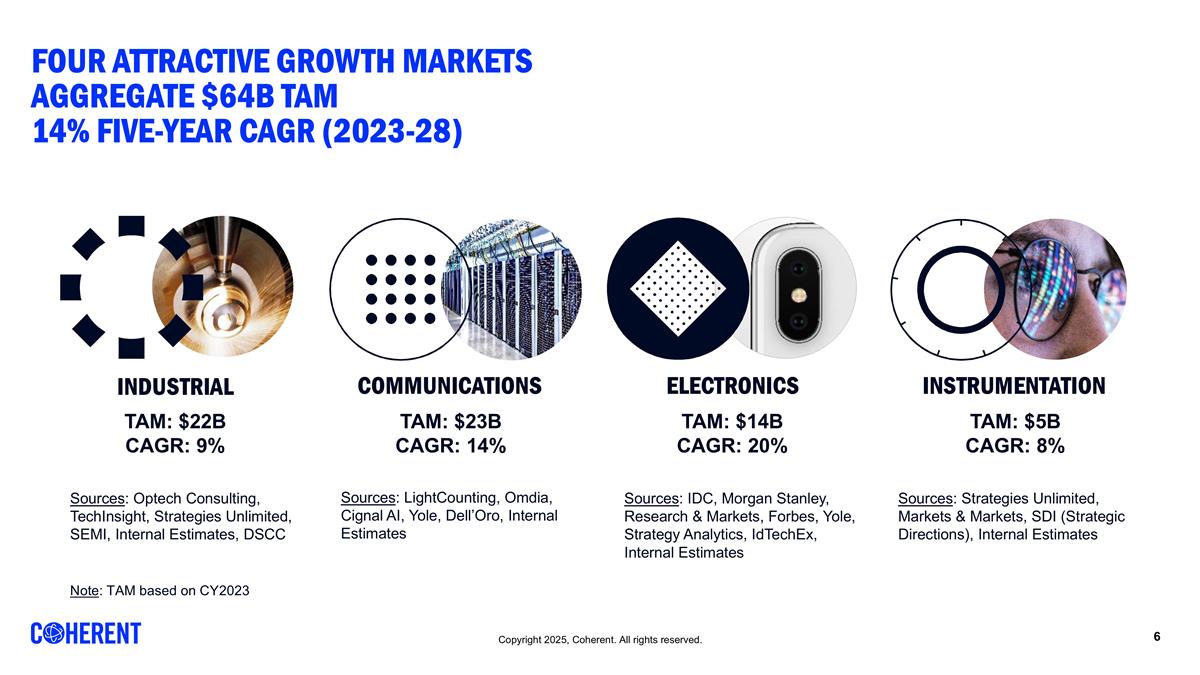
Four Attractive Growth MARKETS Aggregate $64B TAM 14% Five-Year CAGR (2023-28) INDUSTRIAL COMMUNICATIONS ELECTRONICS INSTRUMENTATION TAM: $22B CAGR: 9% TAM: $23B CAGR: 14% TAM: $14B CAGR: 20% TAM: $5B CAGR: 8% Note: TAM based on CY2023 Sources: LightCounting, Omdia, Cignal AI, Yole, Dell’Oro, Internal Estimates Sources: Optech Consulting, TechInsight, Strategies Unlimited, SEMI, Internal Estimates, DSCC Sources: Strategies Unlimited, Markets & Markets, SDI (Strategic Directions), Internal Estimates Sources: IDC, Morgan Stanley, Research & Markets, Forbes, Yole, Strategy Analytics, IdTechEx, Internal Estimates
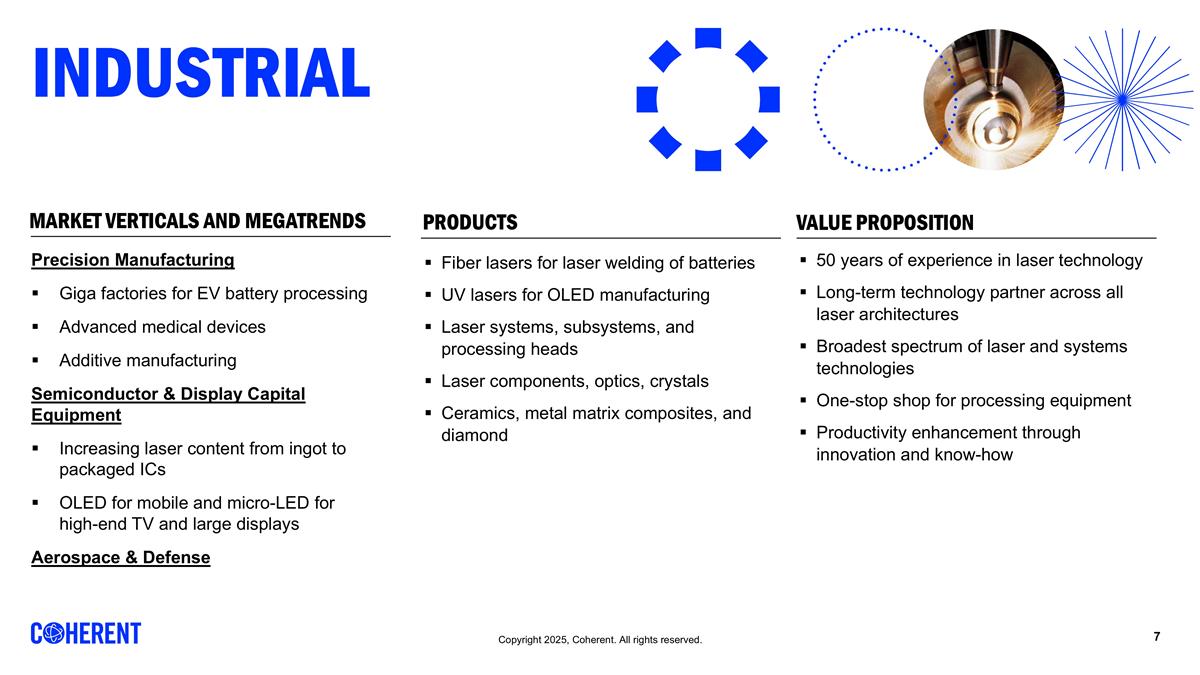
Industrial Precision Manufacturing Giga factories for EV battery processing Advanced medical devices Additive manufacturing Semiconductor & Display Capital Equipment Increasing laser content from ingot to packaged ICs OLED for mobile and micro-LED for high-end TV and large displays Aerospace & Defense PRODUCTS Fiber lasers for laser welding of batteries UV lasers for OLED manufacturing Laser systems, subsystems, and processing heads Laser components, optics, crystals Ceramics, metal matrix composites, and diamond VALUE PROPOSITION 50 years of experience in laser technology Long-term technology partner across all laser architectures Broadest spectrum of laser and systems technologies One-stop shop for processing equipment Productivity enhancement through innovation and know-how MARKET VERTICALS AND MEGATRENDS
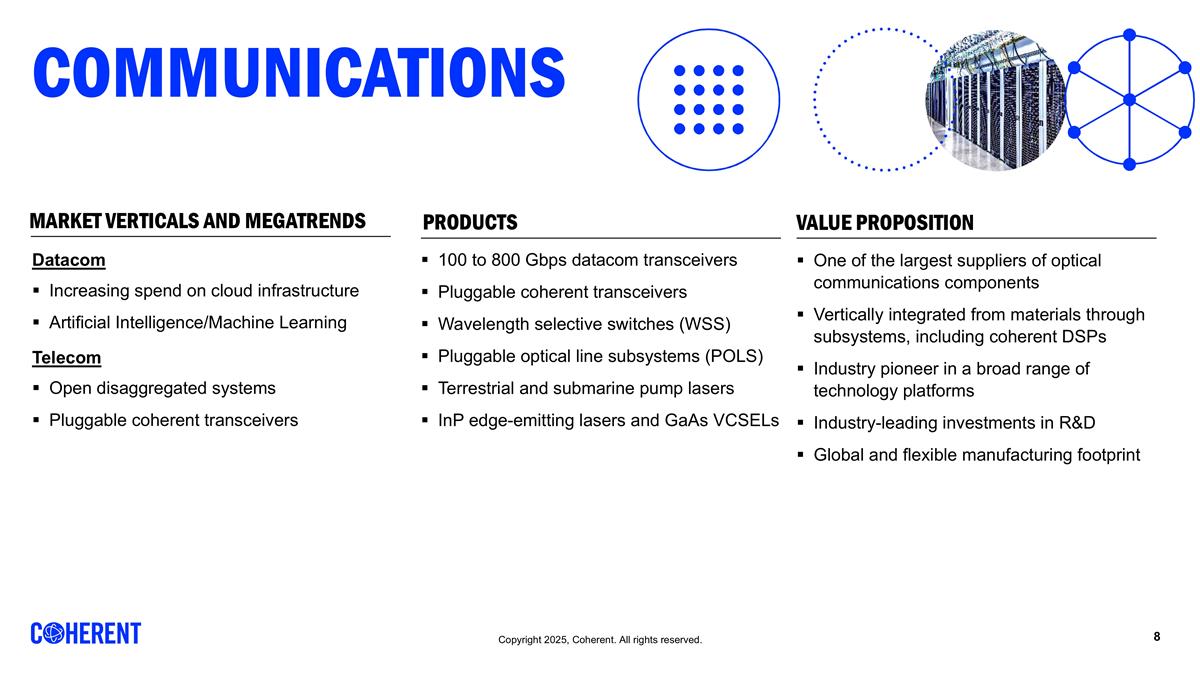
Communications Datacom Increasing spend on cloud infrastructure Artificial Intelligence/Machine Learning Telecom Open disaggregated systems Pluggable coherent transceivers 100 to 800 Gbps datacom transceivers Pluggable coherent transceivers Wavelength selective switches (WSS) Pluggable optical line subsystems (POLS) Terrestrial and submarine pump lasers InP edge-emitting lasers and GaAs VCSELs One of the largest suppliers of optical communications components Vertically integrated from materials through subsystems, including coherent DSPs Industry pioneer in a broad range of technology platforms Industry-leading investments in R&D Global and flexible manufacturing footprint PRODUCTS VALUE PROPOSITION MARKET VERTICALS AND MEGATRENDS
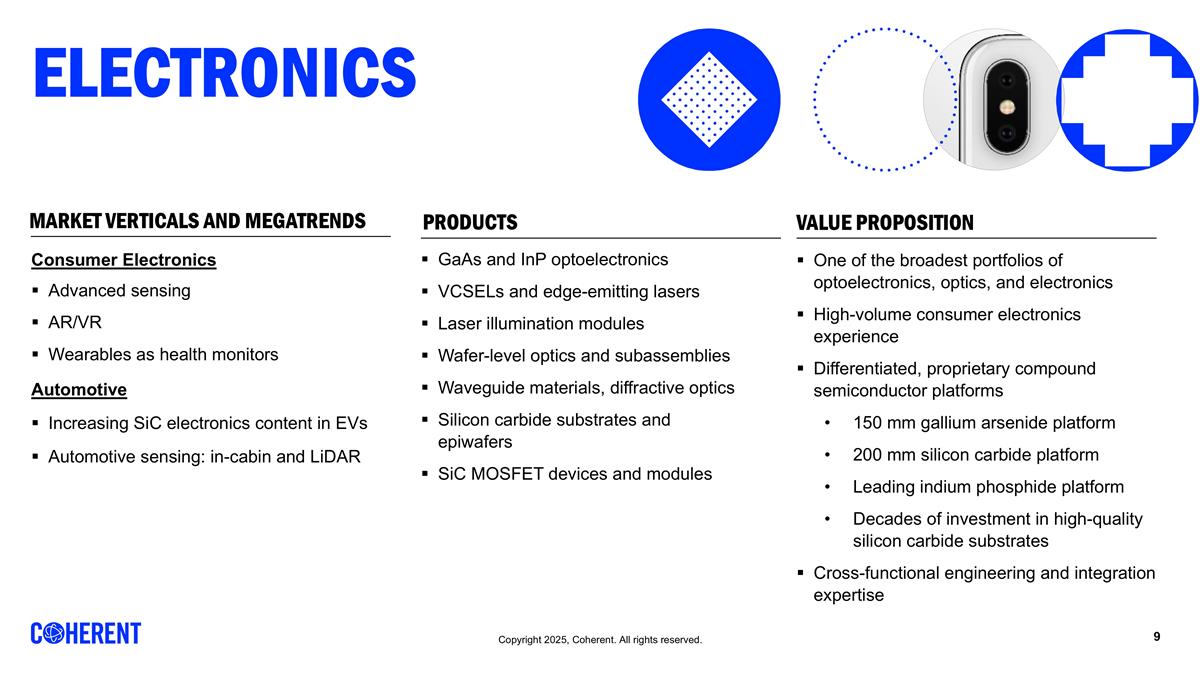
Electronics Consumer Electronics Advanced sensing AR/VR Wearables as health monitors Automotive Increasing SiC electronics content in EVs Automotive sensing: in-cabin and LiDAR GaAs and InP optoelectronics VCSELs and edge-emitting lasers Laser illumination modules Wafer-level optics and subassemblies Waveguide materials, diffractive optics Silicon carbide substrates and epiwafers SiC MOSFET devices and modules One of the broadest portfolios of optoelectronics, optics, and electronics High-volume consumer electronics experience Differentiated, proprietary compound semiconductor platforms 150 mm gallium arsenide platform 200 mm silicon carbide platform Leading indium phosphide platform Decades of investment in high-quality silicon carbide substrates Cross-functional engineering and integration expertise PRODUCTS VALUE PROPOSITION MARKET VERTICALS AND MEGATRENDS
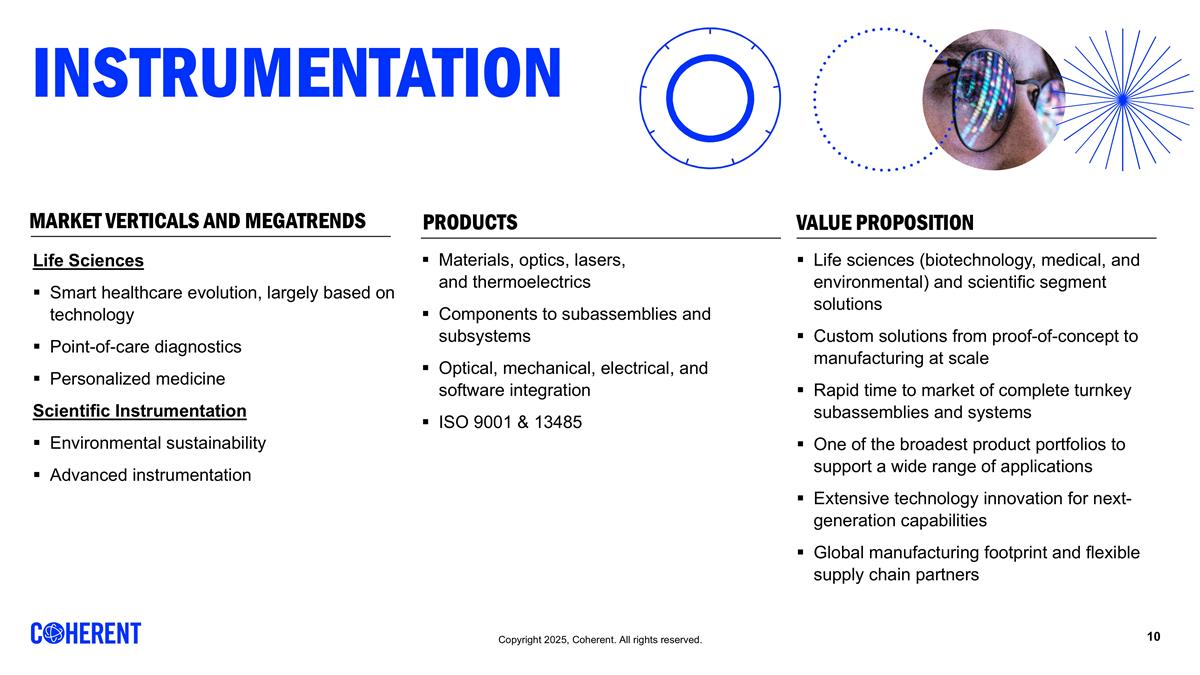
instrumentation Materials, optics, lasers, and thermoelectrics Components to subassemblies and subsystems Optical, mechanical, electrical, and software integration ISO 9001 & 13485 Life sciences (biotechnology, medical, and environmental) and scientific segment solutions Custom solutions from proof-of-concept to manufacturing at scale Rapid time to market of complete turnkey subassemblies and systems One of the broadest product portfolios to support a wide range of applications Extensive technology innovation for next-generation capabilities Global manufacturing footprint and flexible supply chain partners Life Sciences Smart healthcare evolution, largely based on technology Point-of-care diagnostics Personalized medicine Scientific Instrumentation Environmental sustainability Advanced instrumentation PRODUCTS VALUE PROPOSITION MARKET VERTICALS AND MEGATRENDS

Financial Highlights
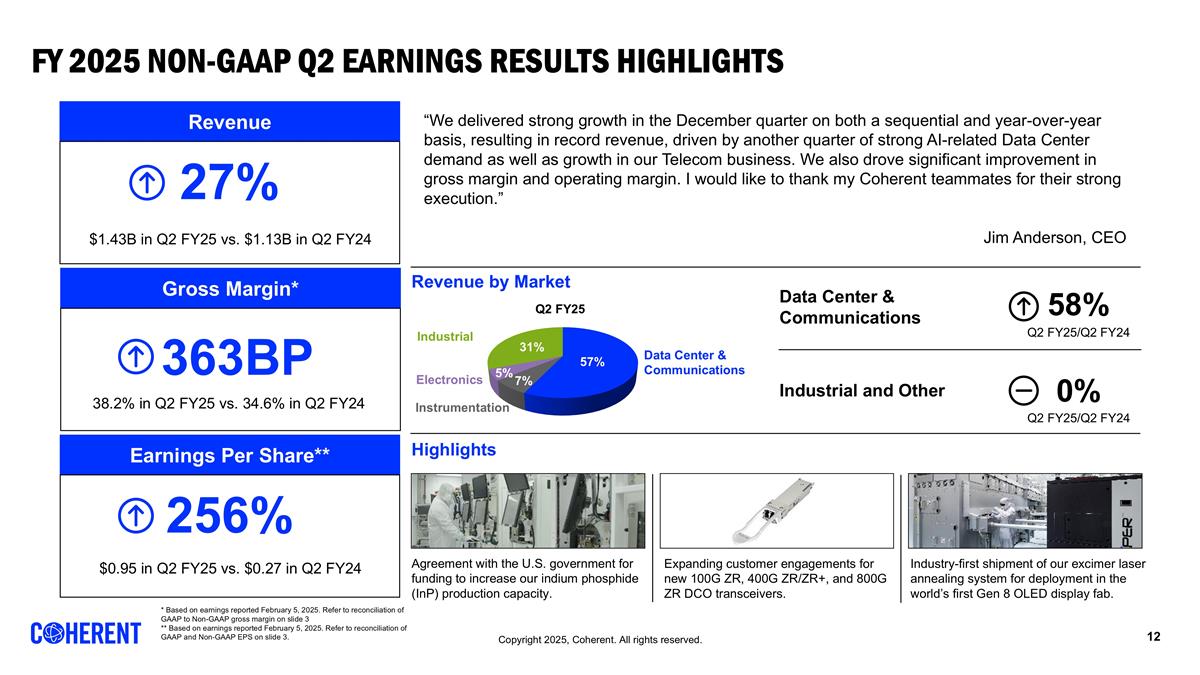
FY 2025 NON-GAAP Q2 Earnings Results Highlights 58% Data Center & Communications Q2 FY25/Q2 FY24 0% Q2 FY25/Q2 FY24 Industrial and Other Revenue 27% $1.43B in Q2 FY25 vs. $1.13B in Q2 FY24 Gross Margin* 363BP Earnings Per Share** 256% $0.95 in Q2 FY25 vs. $0.27 in Q2 FY24 Revenue by Market Highlights Agreement with the U.S. government for funding to increase our indium phosphide (InP) production capacity. Expanding customer engagements for new 100G ZR, 400G ZR/ZR+, and 800G ZR DCO transceivers. Industry-first shipment of our excimer laser annealing system for deployment in the world’s first Gen 8 OLED display fab. “We delivered strong growth in the December quarter on both a sequential and year-over-year basis, resulting in record revenue, driven by another quarter of strong AI-related Data Center demand as well as growth in our Telecom business. We also drove significant improvement in gross margin and operating margin. I would like to thank my Coherent teammates for their strong execution.” Jim Anderson, CEO 38.2% in Q2 FY25 vs. 34.6% in Q2 FY24 Q2 FY25 Data Center & Communications Industrial Instrumentation Electronics * Based on earnings reported February 5, 2025. Refer to reconciliation of GAAP to Non-GAAP gross margin on slide 3 ** Based on earnings reported February 5, 2025. Refer to reconciliation of GAAP and Non-GAAP EPS on slide 3.
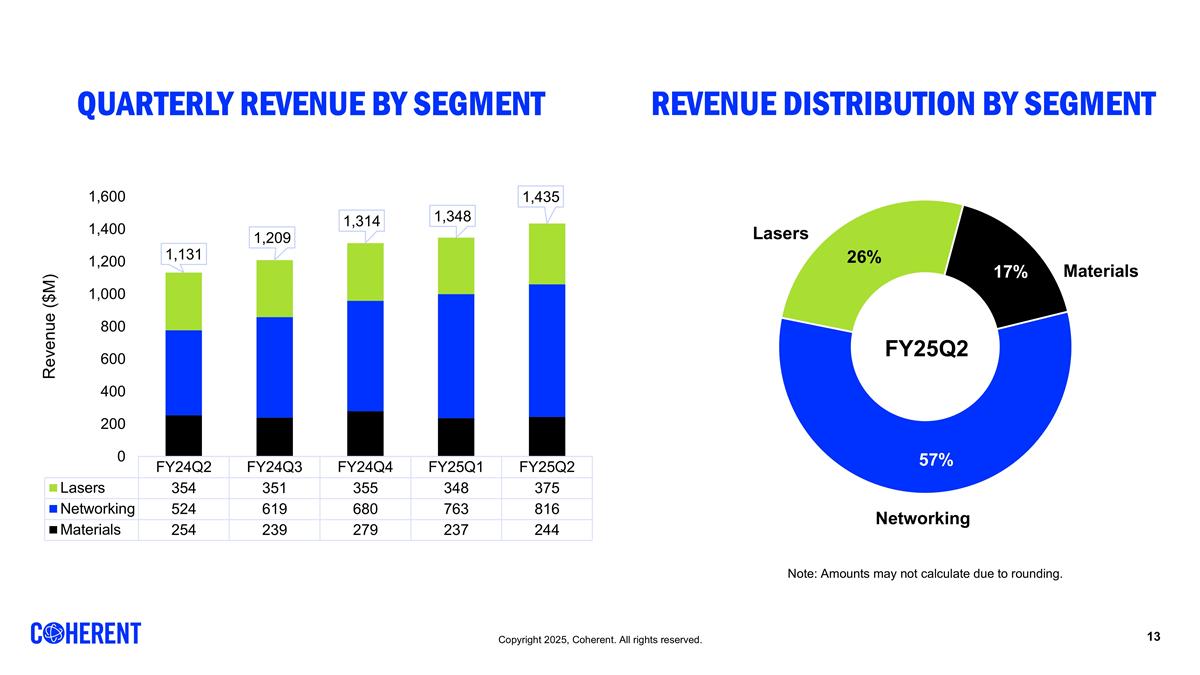
FY25Q2 Materials Networking Lasers Note: Amounts may not calculate due to rounding. QUARTERLY REVENUE BY SEGMENT REVENUE DISTRIBUTION BY SEGMENT
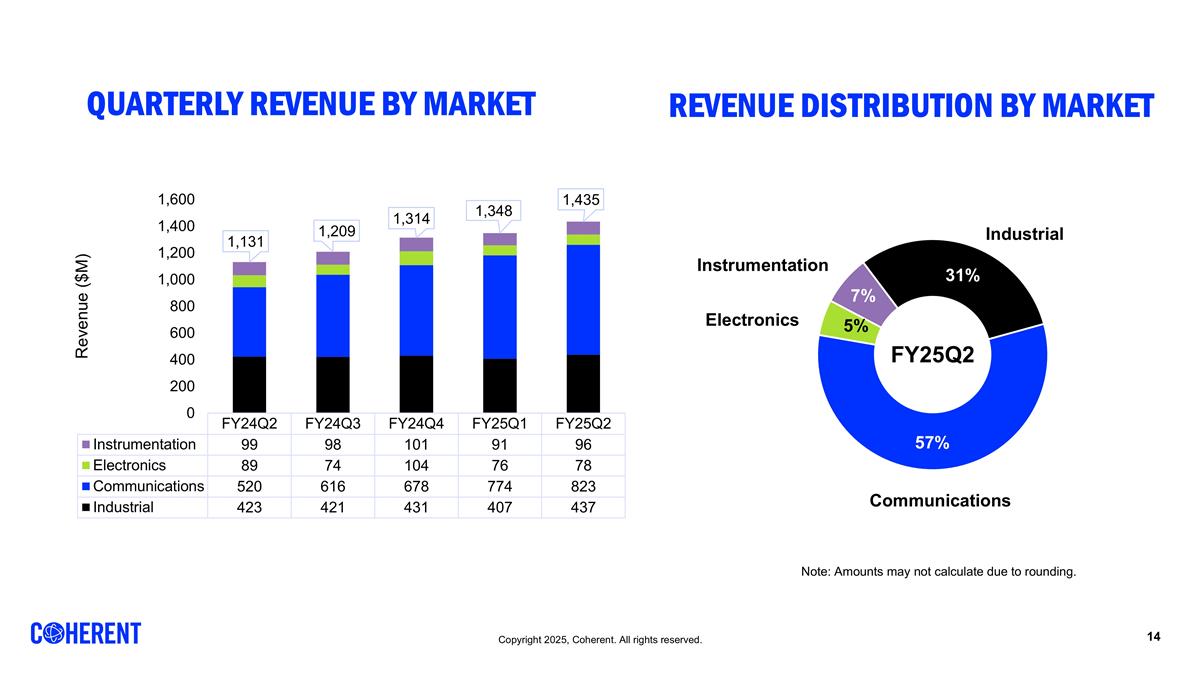
Communications Electronics Instrumentation Industrial FY25Q2 Note: Amounts may not calculate due to rounding. QUARTERLY REVENUE BY MARKET REVENUE DISTRIBUTION BY MARKET
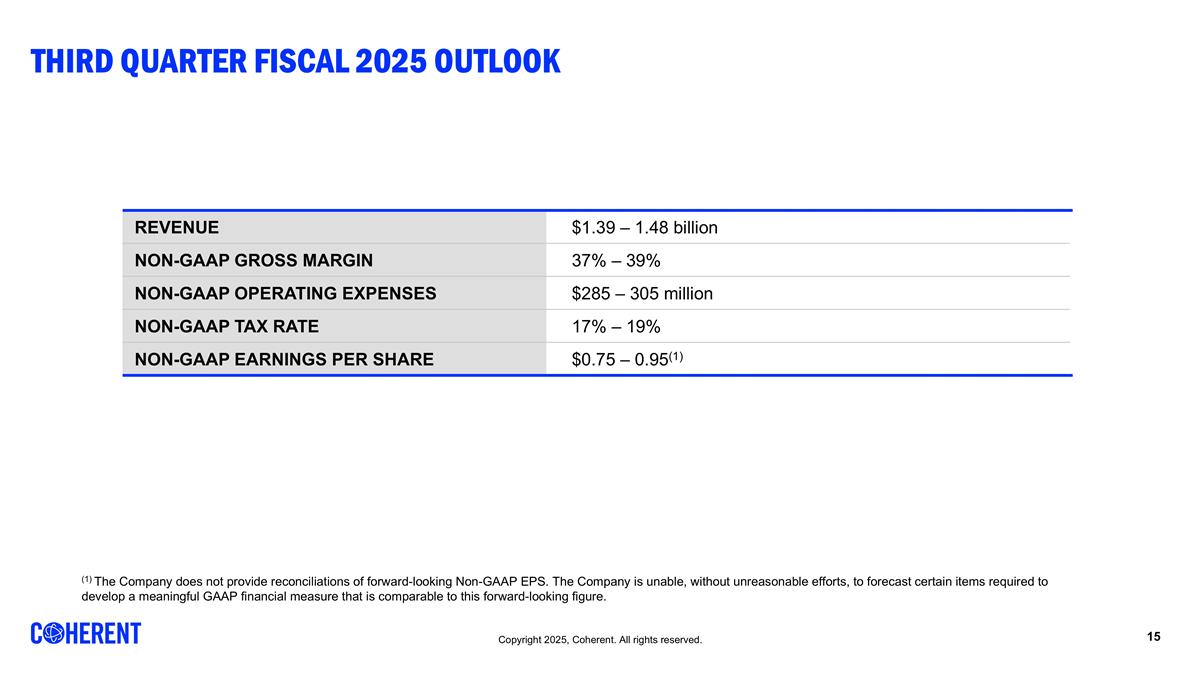
THIRD quarter fiscal 2025 Outlook REVENUE $1.39 – 1.48 billion NON-GAAP GROSS MARGIN 37% – 39% NON-GAAP OPERATING EXPENSES $285 – 305 million NON-GAAP TAX RATE 17% – 19% NON-GAAP EARNINGS PER SHARE $0.75 – 0.95(1) (1) The Company does not provide reconciliations of forward-looking Non-GAAP EPS. The Company is unable, without unreasonable efforts, to forecast certain items required to develop a meaningful GAAP financial measure that is comparable to this forward-looking figure.
Gaap to Non-Gaap Reconciliation
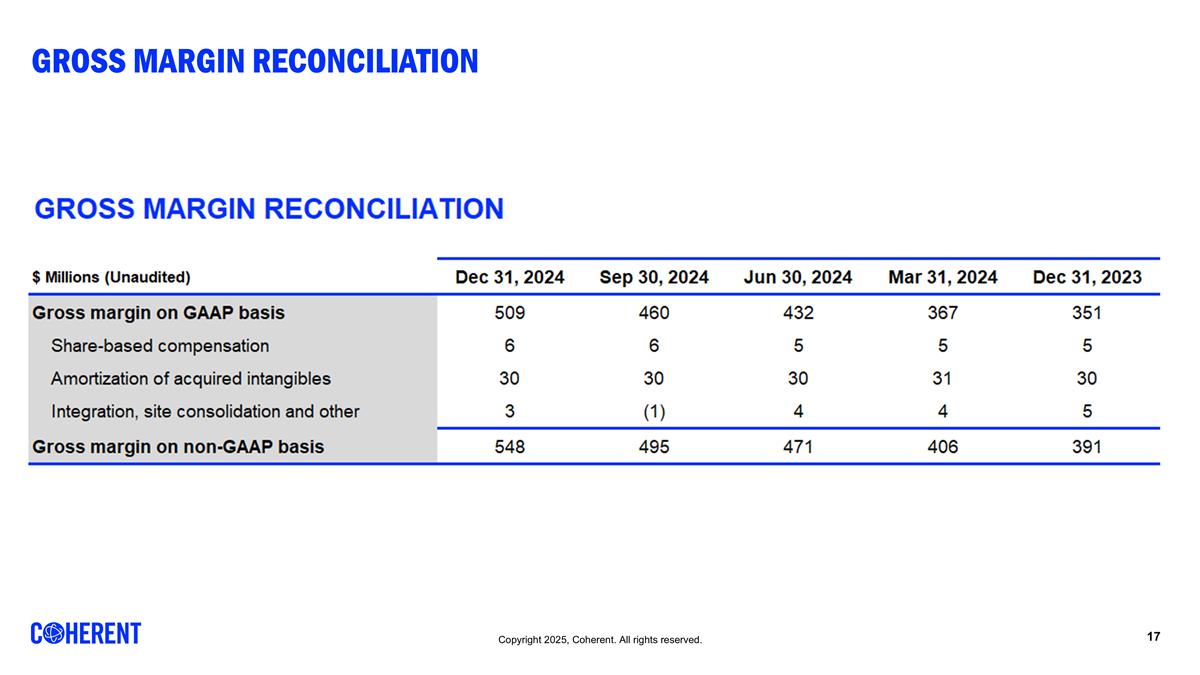
Gross MARGIN Reconciliation
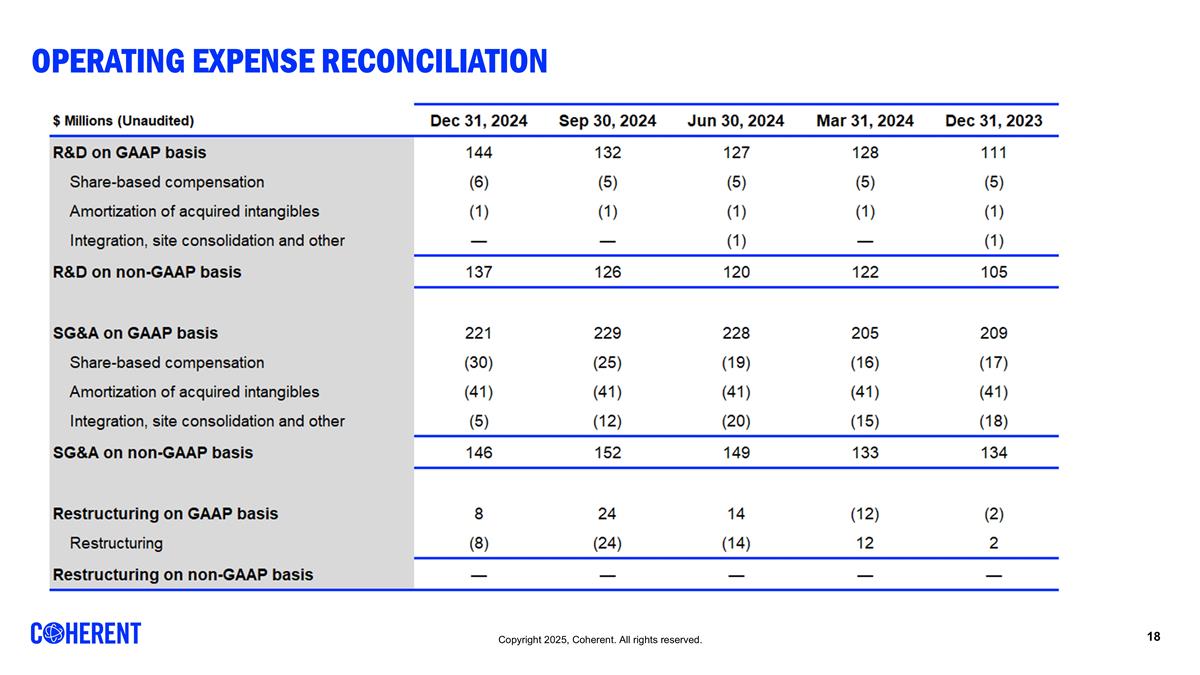
Operating Expense Reconciliation
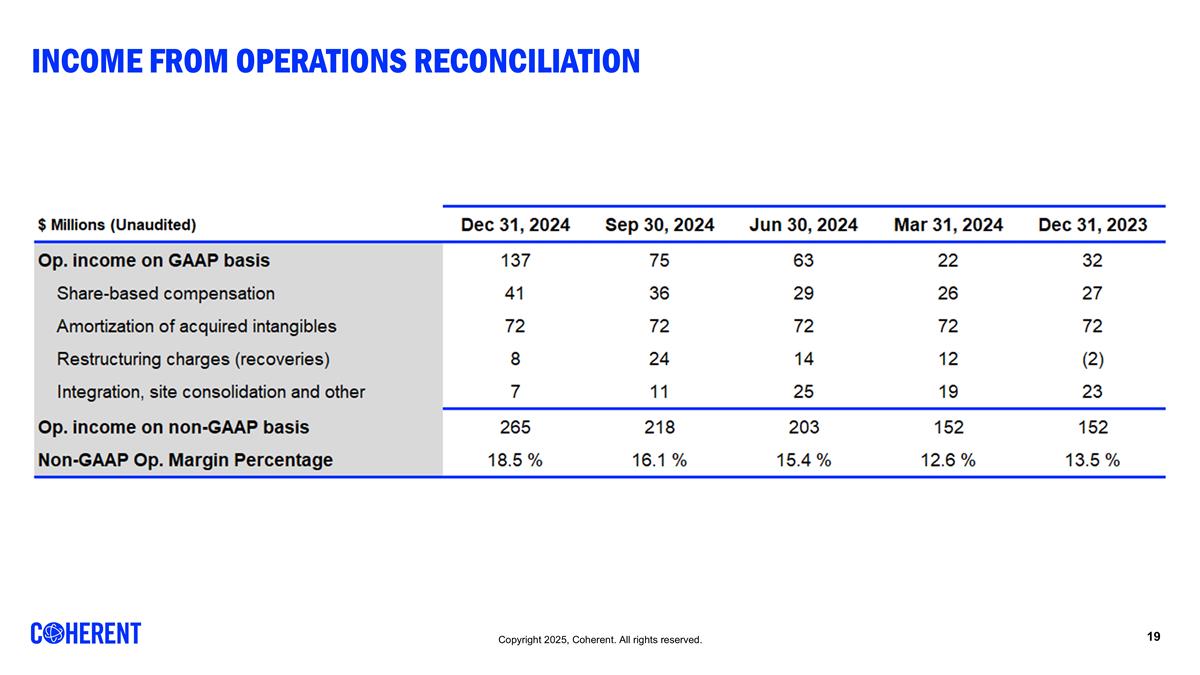
Income from Operations Reconciliation
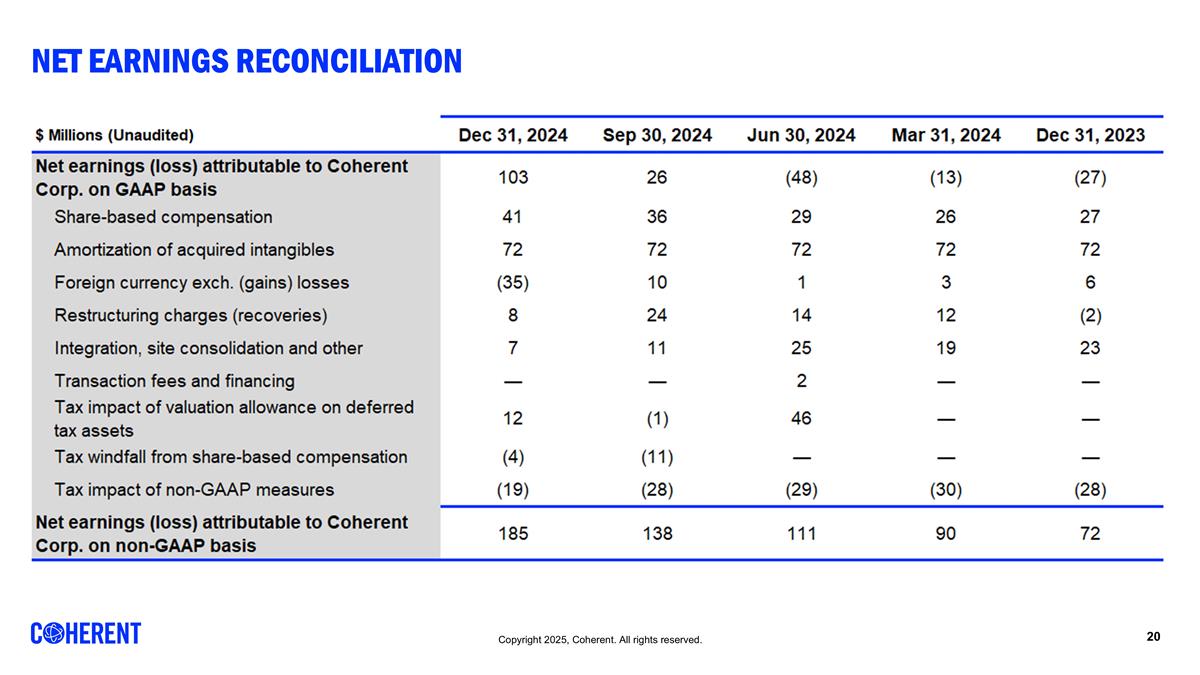
Net Earnings Reconciliation
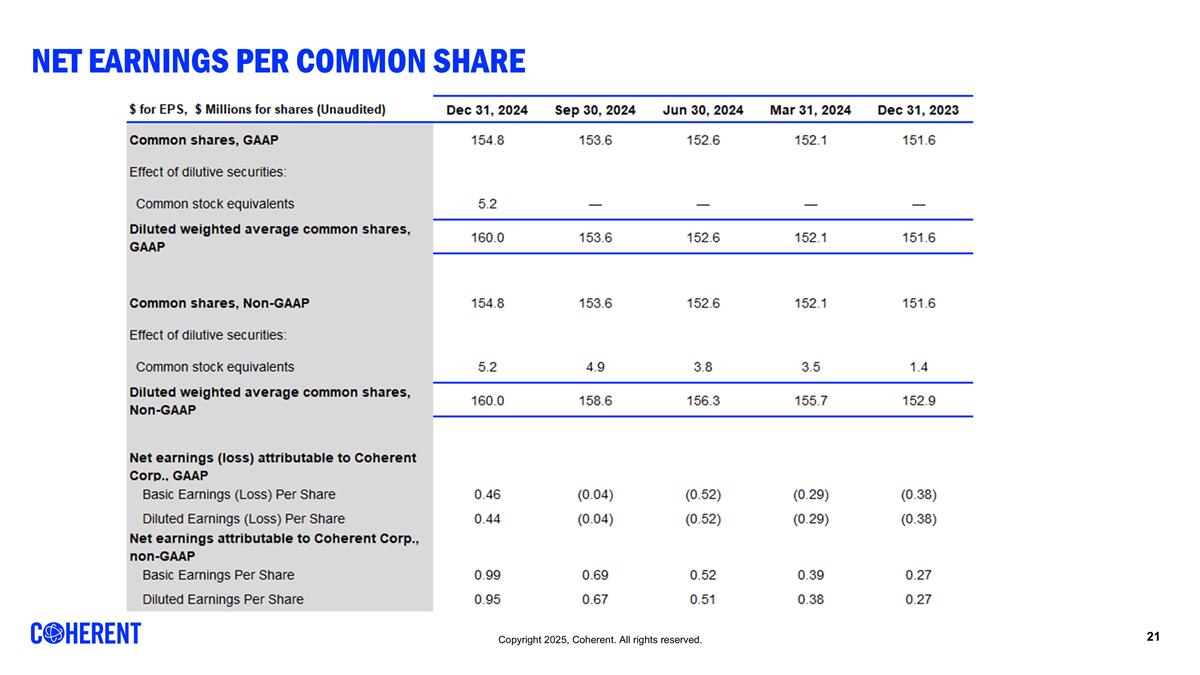
NET Earnings per Common Share
