
As a wholly-owned subsidiary of BT Group plc, British Telecommunications plc meets the conditions set forth in General Instruction (I)(1)(a) and (b) of Form 10-K as applied to reports on Form 20-F and is therefore filing this Form 20-F with the reduced disclosure format.
BT is one of the world’s leading communications services companies, serving the needs of customers in the UK and in more than 170 countries worldwide.
CONTENTS
This is the Annual Report for the year ended 31 March 2012. It complies with UK regulations and comprises part of the Annual Report on Form 20-F for the US Securities and Exchange Commission to meet US regulations.
In this Annual Report, references to “BT”, “BT plc”, “the group”, “the company”, “we” or “our” are to British Telecommunications plc and its subsidiaries and lines of business, internal service units or any of them as the context may require.
References to ‘2014’, ‘2013’, ‘2012’, ‘2011’ and ‘2010’ are to financial years ending 31 March 2014, 2013, 2012, 2011 and 2010, respectively. References to ‘the year’ and ‘current year’ are to the year ended 31 March 2012 except in relation to our fibre roll-out plans which are based on calendar years, not financial years. Please see cautionary statement regarding forward-looking statements on page 109.
A number of measures quoted in this Annual Report are ‘non-GAAP measures’ provided in addition to the disclosure requirements of IFRS. These include EBITDA, adjusted EBITDA and free cash flow. The rationale for using non-GAAP measures is explained on page 28. Reconciliations from non-GAAP measures to the most directly comparable IFRS measure are detailed in the Performance section on pages 28 and 29.
| | |
| | British Telecommunications plc Annual Report & Form 20-F 2012 1 |
REPORT OF THE DIRECTORS
BUSINESS
We are one of the world’s leading communications services companies. Our main activities are providing and managing data and voice networks and providing a range of services over these networks.
In the UK we are a leading communications services provider, selling products and services to consumers and small and medium-sized enterprises (SMEs). In the UK and globally we are a leading provider of managed networked IT services for many of the largest multinational corporations, domestic businesses and national and local government organisations. We also sell wholesale telecoms services to communications providers (CPs) in the UK and around the world.
HOW WE ARE ORGANISED
Our customers are at the heart of everything we do and this is reflected in the way we organise our business. We have four customer-facing Iines of business: BT Global Services; BT Retail; BT Wholesale, and Openreach. These are supported by two internal service units: BT Innovate & Design and BT Operate.
BT Global Services
BT Global Services is a global leader in managed networked IT services, serving the needs of customers in more than 170 countries worldwide. We provide services to around 7,000 large corporate and public sector customers. Our corporate customers operate in a wide range of sectors including banking and financial services, manufacturing, logistics, pharmaceuticals, and consumer packaged goods. We serve customers in the public sector in the UK, including central government and local councils as well as public sector organisations outside the UK. Globally we provide transit and other wholesale services to global carriers.
Our customers benefit from our global scale and operating model. Products are sold globally, and customers are served locally in their own countries and sectors by teams who understand their specific business challenges and create locally relevant solutions. We call this ‘operating globally and delivering locally’.
We have operations around the world so that we can serve the domestic and international needs of our customers. We operate domestic businesses in key markets in Continental Europe such as Italy, Germany, Benelux, France and Spain, and have local network infrastructure including high-speed fibre networks in 24 major European cities. We also operate in 45 countries across the Middle East and Africa. In Latin America we operate in 22 countries. In the US and Canada, we serve customers from offices in 35 key cities. We serve 18 countries in the Asia Pacific region including India, China, Malaysia, Singapore, South Korea, Japan and Australia. We are investing in high-growth regions such as Asia Pacific, Latin America and Middle East and Africa, recruiting more people and improving our portfolio, and our network infrastructure.
BT Retail
BT Retail serves its customers through four customer-facing divisions: BT Consumer; BT Business; BT Ireland, and BT Enterprises.
BT Consumer
We are the leading provider of voice and broadband services for retail consumers in Great Britain and we also have a growing pay-TV service, BT Vision.
We sell services under the BT brand as well as the Plusnet brand in order to reach a wider range of customers. Our BT-branded services have a range of extra features that set them apart from competitors while Plusnet provides simple voice and broadband services for more cost-conscious customers.
BT Business
BT Business supplies SMEs in Great Britain with fixed calls and lines, broadband, mobility and IT services as well as data and voice networks. Specialist businesses within BT Business include:
| — | | BT iNet: A Cisco centre of excellence specialising in infrastructure, security and unified communications |
| — | | BT Engage IT: A leading provider of business-to-business IT equipment and services |
| — | | BT Business Direct: An online store providing IT, computing and networking equipment plus associated installation and support services. |
BT Ireland
BT Ireland operates in Northern Ireland and in the Republic of Ireland. In Northern Ireland we operate the copper access network and are the leading provider of communications services to consumers, SMEs and the public sector. We are also rolling out fibre in partnership with the Northern Ireland government through the Department of Enterprise, Trade and Investment’s broadband project. In the Republic of Ireland we serve corporate and public sector customers and we are one of the largest providers of wholesale network services to CPs.
BT Enterprises
BT Enterprises consists of six separate businesses each of which operates as a standalone business:
| — | | BT Conferencing: Audio, video and web conferencing and collaboration services for large corporate customers in the UK and around the world |
| — | | BT Directories: Directory Enquiries (118500), operator and emergency services. Marketing solutions business, including ‘The Phone Book’, website design services and web-based marketing services that help customers advertise their businesses online |
| — | | BT Expedite & Fresca: Specialist services for the retail sector, including store point of sale systems, back-office applications such as merchandising and sales analytics, and software and platforms for website transactions |
| — | | BT Redcare: Fire and intruder alarm signalling services, CCTV and surveillance networks and control room services. Mobile-to-mobile solutions for vending machines, cash machines and payment terminals, taxis and fleet management |
| — | | BT Payphones: Public payphones and managed prison, card and private payphones |
| — | | BT Wi-fi: Premium BT Openzone wi-fi hotspots and BT Fon hotspots offering broadband on the move to retail customers and to wholesale customers such as mobile network operators. |
BT Wholesale
BT Wholesale provides a broad range of voice, broadband and data communications services for fixed and mobile network operators (MNOs), internet service providers (ISPs) and telecoms resellers in the UK and also provides services to other BT lines of business.
We provide managed network services (MNS) for fixed and mobile CPs with differing requirements – from fully managed network outsourcing for operators with significant network assets, to white label managed services designed to help operators with limited or no infrastructure. We have MNS contracts in place with all of the UK’s MNOs, helping them to manage the growth in mobile data and video content with high speed data connections that link mobile base stations to their and our core networks.
Openreach
In Great Britain Openreach provides services over the ‘local loop’ network (also referred to as the ‘local access network’ and the ‘last mile’), a critical national asset that comprises the copper and fibre connections between telephone exchanges and consumer and
| | |
| 2 British Telecommunications plc Annual Report & Form 20-F 2012 | | Report of the Directors – Business |
business premises. Openreach is also responsible for delivering the roll-out of our fibre broadband network. In addition to delivering local loop services, we provide backhaul services that connect exchanges to CPs’ networks.
Our business is subject to regulation that requires us to sell services to all CPs on an open and equal basis, meaning that external CPs can buy services from us on the same terms as BT’s lines of business. To make this work effectively Openreach’s operational, engineering and systems capabilities are separate from the rest of BT.
BT Innovate & Design and BT Operate
Our customer-facing lines of business are supported by two internal service units, BT Innovate & Design (BTID) and BT Operate (BTO).
BT Innovate & Design
BTID designs, develops, tests and deploys IT systems, processes, networks, products and services. These are either used by, or sold through, the customer-facing lines of business to end-customers in the UK and around the world. BTID aims to develop cost-efficient, flexible solutions.
In addition, BTID manages and delivers our long-term technology strategy and our global research and innovation activities, including our worldwide patent portfolio (see page 14).
BT Operate
BTO manages our core voice, data and TV networks, and IT applications which represent the core infrastructure over which we run our portfolio of products and services.
BTO is also responsible for managing our energy consumption and the strategy for reducing our future carbon footprint (see page 23). In addition, BTO manages the physical and cyber security of our operations.
CUSTOMERS, MARKETS AND PRODUCTS
We serve a number of different customer groups in the UK and around the world. In this section we explain who our customers are and the trends we see in the markets where we operate, as well as the products and services we offer customers in response to market trends.
UK Consumers
The UK consumer customer segment is served by the BT Consumer and BT Ireland divisions of BT Retail.
Customers
There are around 26m households in the UK and this is growing slowly, currently at a rate of around 1% every year, due to an increasing population and demographic changes. We can reach almost all of these households with our consumer products and services.
At 31 March 2012 we had a total of 10.9m consumer fixed lines in the UK with 10m active voice lines (lines on which the consumer also buys calls from us). We had around 6.3m retail broadband customers (including business customers), of which over 550,000 now take BT Infinity, our super-fast fibre-based broadband service. At 31 March 2012 our BT Vision customer base was over 700,000.
Markets
The UK consumer market for fixed calls and lines, broadband and TV services is highly competitive, with more than a hundred companies offering voice and/or broadband services. The market has concentrated over the last few years and there are now several strong players. The four highest market shares are held by BT, Virgin Media, Sky and TalkTalk.
Fixed calls and lines
About 84% of households in the UK have a fixed telephone line and this percentage has been steady for the last two years. There are currently 23.9m fixed lines to households in the UK, some of which take more than one line, up 0.5% compared with last year. Fixed lines have remained important to customers as they need them to receive broadband services. Around 15% of UK households have only a mobile phone and about 1% of UK households have no type of telephone at all. The number of call minutes from fixed lines has been in decline for some time, with our total call minutes down 11% in the year, as customers are increasingly using mobile phones, email, social networking and other kinds of communication as alternatives.
We have the largest share of fixed lines to households in the UK at 47%, although this has been on a declining trend due to the increasingly competitive nature of the market. The three main competitors to BT for fixed calls and lines are Virgin Media, Sky and TalkTalk.
Broadband
The UK has one of the highest levels of broadband availability in Europe, with 99% of premises being able to receive a type of broadband connection and around 67% currently having a fixed broadband connection. At 31 March 2012 there were around 21m fixed cable and digital subscriber line (DSL) broadband connections to homes and businesses in the UK, up by 6% over last year. BT, Virgin Media, Sky and TalkTalk are the largest broadband providers in the UK. We are the largest broadband provider with a 30% share of the total broadband market including cable and a 37% share of the DSL, Local Loop Unbundling (LLU) and fibre broadband market at 31 March 2012. Mobile operators O2 and Everything Everywhere also have a significant share of the fixed broadband market and a number of other players make up the remainder of the market.
Broadband speed has become increasingly important as consumers have more devices and use more data-intensive applications. Average downstream speeds have steadily increased as we have invested in upgrading networks and as customers have migrated to higher speed services. Higher upstream speeds are also becoming more important for customers for activities such as sharing large files, video communications and online gaming.
Wi-fi
Wi-fi networks allow customers to access the internet out of the home at hotspot locations as an alternative to using mobile networks. We are a leader in this field with the largest wi-fi network in the UK, with more than 4m hotspots. These are a mix of BT Openzone sites in premium locations such as hotels, transport hubs and shopping centres, and BT Fon sites in customers’ homes and premises. There is a trend for premium locations to offer access to wi-fi networks for free. We offer free wi-fi connectivity to our BT Broadband and BT Infinity customers across our entire network. Competition in wi-fi has increased with Sky (who bought The Cloud in January 2011), O2 and Virgin Media all investing in their networks.
Pay-TV services
There are four main platforms supporting pay-TV services in the UK: cable and satellite, which account for over 90% of subscriptions, and digital terrestrial and internet protocol TV (IPTV) services. BT Vision is our IP-enabled TV service.
Pay-TV subscriptions
There were 14.3m pay-TV subscriptions in the UK in December 2011 and penetration has now reached 53% of all households. Sky has the largest market share with 67% of subscriptions. BT was not allowed to offer TV services for many years and so started offering services much later. We now have around a 4% market share.
| | |
| Report of the Directors – Business | | British Telecommunications plc Annual Report & Form 20-F 2012 3 |
On-demand TV
Technological developments are bringing the TV and internet together. A number of companies have already launched TV services over the internet in the UK, including Sky, LoveFilm and Netflix. There is also considerable choice in free online catch-up TV services, such as BBC iPlayer, ITV Player and others. There are an estimated 4m TV sets in the UK that are connected to the internet, via games consoles, set top boxes and smart TVs. There is also a growing number of IP-connected devices such as tablets and smartphones that can be used to view TV content in or out of the home.
This trend will become increasingly important and will allow richer on-demand and interactive TV services, provided that there is suitable regulatory intervention to allow fair access to premium content.
Products and services
BT Retail sells calls, lines and broadband into the consumer market under two brands: BT and Plusnet. Under our BT Infinity brand we offer super-fast fibre-based broadband using fibre-to-the-cabinet (FTTC) and fibre-to-the-premises (FTTP) technology. We also offer a pay-TV service, BT Vision. In order to win and retain customers it is important for us to offer all three services and to package them together in flexible bundles to meet customer needs and respond to competition. We offer customers a wide choice of packages of calls, broadband and pay-TV services. They offer our best value to customers and encourage take-up of additional services. When choosing their lines and calls, broadband and pay-TV, more than half of UK consumers now buy two or more of those services from the same supplier.
Voice services
We provide fixed lines and a choice of calling plans, including a range of unlimited options to meet customer preferences for evening, weekend and peak-time calling. All options include free calling features such as call waiting and free inclusive 0800 and 0845 minutes. We also offer alternative payment options such as Line Rental Saver which reduces the line rental charge if customers pay for a whole year upfront. We are the only company to provide BT Basic, a simple, low-cost telephone service available to people who are on low incomes.
Broadband
We sell broadband services under the BT, Plusnet and BT Infinity brands with a wide range of speeds. BT Broadband and BT Infinity have a range of options for usage limits and bundled call plans, and include our free wireless Home Hub, free online storage and security services and unlimited access to our wi-fi hotspots.
BT Vision
Our BT Vision TV service offers customers standard Freeview channels, the ability to pause, record and rewind live TV and a catch-up service from the BBC, ITV, Channel 4 and Channel 5. Customers get a Vision+ box, which allows them to stream over 5,600 hours of on-demand programming, including BBC iPlayer, and to download high definition (HD) and 3D content. We currently offer a choice of two subscription packages, Essential and Unlimited, and the option to subscribe to Sky Sports 1 and 2, inclusive with the ESPN channel.
UK Small and medium-sized enterprises
One of our strategic priorities is to be the ‘Brand for Business’ for UK SMEs so this is an important customer segment for us. The UK SME market is mainly served by the BT Business division of BT Retail.
Customers
In the UK there are estimated to be 4.5m SMEs, ranging in size from sole traders to businesses with up to 1,000 employees. The communications and IT needs of these customers vary considerably, depending on factors such as size, number of sites in which they operate, their industry sector and their maturity.
We serve around 1m SME customers across the UK from small start-ups to medium-sized businesses with up to 1,000 employees. Small customers, with fewer than 50 employees, account for over 90% of our customers.
Markets
The SME market for fixed and mobile communications and IT services in the UK is very fragmented and highly competitive, with competitors varying by the customer segments they serve and the products and services they offer. Overall the market has been impacted by the current economic conditions.
Fixed telecoms services
The SME market for fixed voice is declining with call volumes falling due to substitution by mobile, wireless, email and voice over IP (VoIP) and the impact of the current economic conditions. BT has a 49% market share of lines in the total UK business market but there is a lot of competition with over 300 resellers as well as fixed network operators. Competition varies by market segment with key competitors including Daisy, TalkTalk, Virgin Media, XLN, Alternative Networks, Cable & Wireless Worldwide, Colt Group and KCOM Group.
IT services
The IT services market has experienced challenging conditions in recent years with low revenue growth. However, there is growing interest in new service and business models, including cloud-based services such as managed hosting of IT applications and data, and unified communication and collaboration (UCC) tools. These provide companies with greater control and flexibility to manage their costs. Key competitors in the SME IT services market include Computacenter, SCC, Phoenix IT, Kelway, Dimension Data, Logicalis and 2E2.
Mobile
The SME mobile market is growing, in particular in areas such as mobile data access and machine-to-machine services. There has been a significant growth in smartphones which is driving growth in data volumes. The leading operators in the mobile market are Vodafone, 02 and Everything Everywhere and we have a small but growing share.
Products and services
We have a broad portfolio of products and services covering fixed telephony, IT and mobility ranging from simple standalone services to managed services and complex customised solutions. We sell to smaller customers through four channels: call centres; 41 Local Businesses, which are not part of BT but are independently owned companies that exclusively sell our products and services; non-exclusive relationships with indirect partners, and online sales via bt.com. For larger customers we operate desk-based and field-based account management teams.
Voice services
We provide a full range of fixed voice services from standard calls and lines to fully managed office phone systems and contact centre solutions. As well as traditional voice, we increasingly sell VoIP services. We have a mobile virtual network operator (MVNO) agreement with Vodafone and sell mobile voice and data services.
| | |
| 4 British Telecommunications plc Annual Report & Form 20-F 2012 | | Report of the Directors – Business |
Broadband and internet
We provide a range of internet access options including: BT Business Broadband over copper; and BT Infinity for Business over FTTC and FTTP; BTNet dedicated internet access, and mobile broadband. Other internet services include email, hosted Microsoft collaboration services and web hosting.
Connectivity services
We offer networking services to support customers’ voice and data communications needs. This includes the design, installation and management of leased lines, Ethernet services, IP virtual private network (IPVPN) services, structured cabling, and local area networking solutions.
IT services
We offer IT services through our three IT services businesses: BT Engage IT; BT iNet, and BT Business Direct. Services include data centres, unified communications and security solutions. We also provide hardware, computing support services and consultancy. We work with most leading vendors including Cisco, Microsoft, Citrix, HP, NetApps and Symantec.
Large corporate and public sector customers
The large corporate and public sector customer segment is our largest segment in terms of external revenue. It is served by BT Global Services.
Customers
We provide large corporate and public sector customers with a range of network, IT and professional services. We provide services to some of the largest companies in the world.
We serve:
| — | | 87% of the FTSE100 companies |
| — | | 64% of the Fortune 500 companies |
| — | | 90% of Interbrands’ annual ranking of the world’s most valuable brands |
| — | | the world’s top stock exchanges, leading broker-dealers and biggest banks. |
We also supply services to national and local government organisations and other public sector bodies in the UK and in 16 countries around the world.
In the UK we are one of the largest suppliers of networked IT services for the UK government (Government). The Government, as a whole, is our largest customer. Except as described on page 8, we have a normal customer and supplier relationship with the Government.
Markets
The global information and communications technology (ICT) market serving large corporate and public sector customers is very fragmented in terms of products, suppliers, and standards.
Estimates of market size vary, but IDC value the total global ICT market serving corporate and public sector customers at £1,327bn. Within the total global ICT market our core products and services most closely align to a segment defined as managed networked IT services. This market has been impacted by economic conditions, as customers delay projects or reduce ICT budgets. The global managed networked IT services market is estimated to be worth £875bn and is predicted to grow over the next four calendar years.
There are regional differences in market growth rates. The UK is a highly competitive market and we continue to see pricing pressure as well as declines in more traditional telecoms services as customers switch to newer technologies. However, there is increasing potential in high-growth economies as domestic companies expand globally, and global companies enter new markets.
Market demand is driven by many factors, but our customers tell us that they need to:
| — | | reduce costs and improve efficiency – by rationalising networks, using cloud computing and improving workforce effectiveness by using flexible working and collaboration tools |
| — | | position themselves for growth – by improving the service they provide to their end-customers as well as accessing new high-growth markets around the world |
| — | | manage risk – by improving their ability to protect their networks and IT systems from cyber attacks. |
Products and services
We build and run global networks and provide services such as UCC, customer relationship management (CRM), data centre services and managed security solutions supported by professional services skills. We deliver value by combining our network, IT and professional services.
To make it easier for customers to buy from us we group our products and services into clear categories, which address different business needs. They are:
BT Connect
We supply a range of network services that connect our customers’ employees and sites to their customers and the world. We deliver access and connectivity through many industry standard technologies including Ethernet, DSL, multiprotocol label switching (MPLS), satellite broadband, IP networks, telephone systems, private telephone lines, analogue private circuits and managed local area networks (LANs). Super-fast fibre-based broadband is also available.
BT Compute
We offer customers a reliable IT platform for their business applications, data storage and security, hosted in a secure and controlled environment in our global BT data centres and connected over the internet or our global IP network. We provide a new generation of cloud-based services, giving our customers the flexibility and agility that comes from a cloud computing environment.
BT Assure
The security of companies’ networks and IT systems is becoming more important as the threat of cyber crime increases. We provide a range of security products and services (including firewalls, web access security, intrusion prevention and event monitoring) which form the basis of a global security management system, combined with a professional services capability.
BT Contact
With our range of CRM services we help customers to deal with their end-customers efficiently and to improve their customers’ experience. Our products allow our customers to be contacted by their end-customers using different methods including email, web chats and phone calls, using either automated systems or dedicated customer relationship employees working in physical or cloud-based contact centres.
BT One
Our UCC products let our customers communicate more efficiently with their employees, suppliers, customers and business partners and so reduce costs and build a more sustainable organisation. Our products let them take part in almost any kind of communication, through phone calls, email, instant messaging and web conferencing, by allowing their communications infrastructure, mobile phones, desktop computers and applications to work together.
| | |
| Report of the Directors – Business | | British Telecommunications plc Annual Report & Form 20-F 2012 5 |
BT Advise
As well as providing physical products, we provide consulting, systems integration and managed services. BT Advise experts help customers more effectively solve business problems and advise them on products and services developed specifically for our key industry sectors.
Wholesale customers
The wholesale telecoms customer segment in the UK and the Republic of Ireland is served through Openreach, BT Wholesale and BT Ireland. Internationally it is served mainly through Global Telecoms Markets, the wholesale arm of BT Global Services.
We provide our wholesale customers with access to our platforms, skills and technology, making our investments and economies of scale work for their benefit. This promotes competition, delivers end-customer choice, avoids infrastructure duplication and encourages innovation.
Customers
Openreach provides access products to around 490 CPs, including fixed and mobile operators and ISPs. Openreach’s largest customers include BT Retail, Sky and TalkTalk.
BT Wholesale provides services to over 1,400 CPs, including fixed and mobile operators, ISPs, broadcasters, resellers and infrastructure carriers. We manage and support the network and services requirements of a number of national UK operators including KCOM Group, Virgin Media, Orange UK, Vodafone, O2 and MBNL.
Outside of the UK we provide wholesale telecoms services to over 1,000 CPs across more than 170 countries.
Markets
Some of our markets are being impacted by the current difficult economic climate. However, the need to reduce costs will encourage more network sharing and outsourcing and our MNS solutions are well positioned to help our wholesale customers. In addition, demand for data and connectivity for all types of users is driving growth in demand for our wholesale products and services.
UK
In March 2011 Analysys Mason valued the UK addressable wholesale market at £14.9bn per year. The largest sector, worth an estimated £9.4bn per year, is wholesale telecoms, which includes data, broadband, voice and mobile services plus some value-added services like contact centres and content distribution. The IT services sector, worth an estimated £3.6bn, covers cloud services, enterprise solutions and managed network services.
Today we primarily address the wholesale telecoms sector but we are active, and expanding into, the IP-based service sector where future growth is expected.
In the UK our competitors include Cable & Wireless Worldwide, Virgin Media and Colt Group, as well as a range of equipment vendors.
Europe and overseas
We are Europe’s largest telecoms services wholesaler by revenue, accounting for around 18% of total European wholesale revenue.
Internationally, we compete with the wholesale divisions of local incumbents and alternative network operators as well as global wholesale telecoms companies.
Wholesale broadband
Our broadband footprint reaches 99% of UK homes and businesses, making us the UK’s largest wholesale provider of broadband in terms of reach. We sell to CP customers who have their own broadband infrastructure but choose our services outside their own network
footprints, as well as providing managed wholesale services to ISPs and other parts of BT.
For those CPs who wish to invest in building their own networks Openreach rents the copper access lines to the CPs who put their own equipment in the exchanges. This is called Local Loop Unbundling (LLU). The competitive market place for broadband has stimulated growth in LLU.
Openreach continues to see a steady rise in the number of unbundled exchange areas, which over the last three years has risen by around 11%.
Bandwidth demand
The wholesale market is adopting next generation communications services for data connectivity, such as Ethernet, IP voice and higher speed broadband over copper and fibre. Bandwidth growth is accelerating as customers move onto higher speed broadband services, something which has resulted in capacity on our network increasing by eight times over the past six years.
The UK’s spectrum auction expected in 2013 and the subsequent introduction of 4G Long Term Evolution (LTE) services are likely to significantly increase demand for mobile data services. We are working with all UK mobile operators to help them efficiently meet this challenge.
Products and services
We sell to wholesale customers through Openreach or BT Wholesale depending on the product or type of customer. Openreach offers its products on an equivalent basis to all CPs consistent with BT’s Undertakings (see page 8). BT Wholesale offers a range of managed products and services, many of which are based on the access products that Openreach provides to all CPs.
Wholesale Line Rental (WLR)
Openreach sells WLR which is used by CPs to offer telephony services using their own brand, pricing structure and billing, but using our network. CPs do not need to invest in additional equipment or infrastructure to use WLR.
Local Loop Unbundling (LLU)
As an alternative to buying WLR, CPs can rent the copper lines between BT’s exchanges and customer premises from Openreach to provide voice and broadband services using their own equipment, this is called Local Loop Unbundling (LLU).
Wholesale broadband
BT Wholesale offers a range of wholesale broadband services, delivered over copper and fibre. Our traditional broadband products, including IPstream, Datastream and IPStream Connect, offer speeds of up to 8Mbps (ADSL). Wholesale Broadband Connect (WBC), our next generation family of broadband products, offers speeds up to 20Mbps (ADSL2+) over copper. We also offer broadband services over fibre. WBC FTTC offers downstream speeds of up to 40Mbps and up to 80Mbps and WBC FTTP offers speeds of 100Mbps and 110Mbps.
Our WBC copper and fibre services are certified as meeting the mandatory Government security assurance levels required to support Public Services Network (PSN) opportunities in the UK.
Super-fast fibre-based broadband is provided by Openreach through our Generic Ethernet Access (GEA) product. There are two variants of GEA, FTTC and FTTP. FTTC uses fibre to provide high connection speeds from the exchange to a street cabinet near to customer premises, and a copper line for the final connection to the premises. FTTP uses fibre for the whole route from the exchange to the customer. We plan to launch a 330Mbps downstream product during 2013 and are testing a 1Gbps service.
| | |
| 6 British Telecommunications plc Annual Report & Form 20-F 2012 | | Report of the Directors – Business |
Fibre Voice Access (FVA)
Openreach is introducing a voice service over fibre, called FVA. This will allow CPs to provide voice services over fibre with similar levels of functionality to copper voice services. Our fibre broadband network can also deliver IPTV services as we have launched a multicast capability. This allows ‘triple play’ providers to prioritise broadcast TV traffic over other internet traffic and to transmit broadcast signals efficiently to their customers.
Passive Infrastructure Access (PIA)
Our PIA products allow CPs to rent space in our ducts or on our telegraph poles. CPs can use this space for their own fibres, as an alternative to buying fibre-based broadband from us.
Wholesale Ethernet
Ethernet is a widely-deployed network transmission technology that can transport large amounts of any type of data in a fast, assured and highly cost-effective manner. We offer a wide choice of high bandwidth Ethernet services designed to help CPs extend their networks and deliver a range of high quality services to their customers. Access connection speeds range from 2Mbps to 10Gbps.
Our Wholesale Ethernet is certified as meeting the mandatory Government security assurance levels required to support PSN opportunities in the UK.
Capacity, call-based products and IP Exchange
We sell a wide range of capacity and call-based products and services, both regulated and unregulated, using both traditional and IP technologies.
IP Exchange is our global IP interoperability service allowing IP network operators to interconnect with each other as well as with fixed telecoms operators and MNOs.
Private and partial private circuits
We are a major provider of traditional data circuits in the UK, which help our customers to extend the reach of their services and act as infill solutions for their own networks.
Transit
We provide transit voice services across the UK and internationally. This is a low-margin product where volumes are declining as CPs and MNOs interconnect directly with each other.
White label managed services
Our white label managed services business helps customers with limited or no infrastructure to offer telecoms services such as telephony and broadband without the need to make large investments. We provide a complete service, from accepting and processing new orders through to customer service and end-user billing.
Mobility and wi-fi
Our Mobile Ethernet Access Service (MEAS) is now available at more than 13,000 mobile base stations sites, an increase of around 3,800 in the year, reinforcing our market leading position. Mobile operators can also boost the capacity of their services using our more than 4m wi-fi UK hot spots.
Broadcasting services
Our Global Media Network provides access to all the key locations around the world where broadcast content is either created or distributed. We are strengthening our digital content capabilities by establishing a series of strategic alliances to expand our global media footprint. In the UK we provide TV outside broadcast services from our network of around 160 sports and news locations. Our UK media MPLS network also underpins all digital terrestrial TV delivery in the UK.
REGULATION
The efficient supply of telecoms services is so important in the modern world that the industry sometimes needs to be controlled and monitored. In the UK, and in the majority of countries around the world where we operate, these services are subject to regulation by governmental and independent non-governmental bodies. We explain below what this means for us.
European Union (EU) regulation
In EU countries electronic communications services are governed by a number of European directives and regulations. These provide a Europe-wide framework for the regulation of electronic communications services which includes both fixed and mobile voice services, broadband, cable TV and satellite TV. The way in which the existing directives have been implemented vary from country to country. They include rules about things like access and interconnection, universal service, and how often national regulators should review markets for significant market power (SMP). They also cover matters such as how SMP remedies like price controls should be set. They require regulators to consult with the European Commission on any price control decisions before they are finalised, to make sure they are consistent with the European regulations.
UK Regulation
The UK telecoms industry is regulated through various European directives, the Communications Act 2003 (the Communications Act), Ofcom (the UK’s independent regulator), and other regulations and recommendations.
The Communications Act
The Communications Act gives Ofcom legal powers and sets out the legal requirements for how electronic communications services should be regulated in the UK. It includes the conditions imposed by the European directives. The Government is currently reviewing our sector’s regulatory regime which will result in a new framework in 2015. The review is focusing on how growth and innovation can be encouraged and on removing unnecessary regulation and barriers to growth.
Ofcom
Ofcom is the independent regulator and competition authority for the whole UK communications market. Its main duties are:
| — | | to further the interests of citizens in relation to communications matters |
| — | | to further the interests of consumers in relevant markets, where appropriate by promoting competition. |
Ofcom sets out conditions under the Communications Act and directions under these conditions. Some conditions apply to all CPs. Others apply to certain individual providers Ofcom has decided are ‘universal service providers’ or have SMP in a particular market. Anyone can appeal against Ofcom’s regulatory decisions through a number of legal processes including the Competition Appeal Tribunal.
The general conditions that apply to all CPs are mainly about protecting consumer general access and interconnection, planning for emergencies, providing information to Ofcom, and telephone numbers.
We are the designated universal service provider for the UK (excluding the Hull area where KCOM Group is the designated provider) and so we have certain universal service obligations. This is an important responsibility that we take very seriously. Our primary obligation is to make sure that basic fixed-line services are available at an affordable price to all citizens and consumers in the UK. We are also required to provide public payphones.
| | |
| Report of the Directors – Business | | British Telecommunications plc Annual Report & Form 20-F 2012 7 |
The European directives require Ofcom to review relevant communications markets regularly, usually every three years, and to decide whether any CP has SMP in those markets. If Ofcom decides that a CP has SMP, it may impose appropriate controls, typically on the prices which the CP can charge. Where Ofcom decides a company has SMP it will also generally make sure that charges are reasonably based on costs plus an appropriate return on the capital invested.
Impact of Ofcom regulation
Around 90% of Openreach’s revenue comes from products that are regulated by Ofcom. The main exception is Ethernet services at speeds above 1Gbps. In addition, while fibre broadband is a regulated service, it is not subject to explicit price regulation by Ofcom, and is instead priced on a commercial basis in order to encourage investment.
There have been a number of regulatory decisions and outcomes of appeals in 2012 that will impact us in the future. In particular, the charge controls imposed on our WLR and LLU pricing, which we are appealing, have reduced the prices we can charge for these products with effect from April 2012. There are also ongoing disputes and appeals that could impact us.
During 2013 Ofcom is expected to carry out reviews of the business connectivity market (covering products such as Ethernet and leased lines) and the narrowband market (covering wholesale calls). Where we are found to have SMP Ofcom will carry out consultations on setting controls that could reduce or change the prices we charge for these products.
BT’s Undertakings
In response to Ofcom’s 2005 strategic review of telecommunications, we put forward some legally binding undertakings under the Enterprise Act 2002. These Undertakings (which included creating Openreach) came into force in September 2005. They set out to give clarity and certainty to the UK telecommunications industry about the way BT provides ‘upstream’ regulated products. This in turn supports effective and fair competition in related ‘downstream’ markets. Most of the commitments in the Undertakings have been delivered.
Our relationship with HM Government
We can be required by law to do certain things and provide certain services for the Government. For example, under the Communications Act, we (and others) can be required to make and implement plans to provide or restore services in connection with disasters. Under the Civil Contingencies Act 2004, the Government can also impose obligations on us (and others) at times of emergency and in connection with civil contingency planning. The Secretary of State can also require us to take certain actions in the interest of national security and international relations.
Overseas regulation
The degree of regulation in international markets varies widely and can hamper our ability to compete to a greater or lesser degree. We are pressing incumbent operators and their national regulatory authorities around the world for fairer, cost-related wholesale access to their networks. In particular, in the US we are trying to persuade the regulator to carry out a review of the US Business Access market to help us get fairer terms and lower prices from the incumbent operators for wholesale products in this important market.
| | |
| 8 British Telecommunications plc Annual Report & Form 20-F 2012 | | Report of the Directors – Business |
REPORT OF THE DIRECTORS
STRATEGY
Our aim is to drive shareholder value by making BT a better business with a better future. We have made good progress towards this goal in 2012, despite the challenging conditions.
OUR STRATEGY
Our ambition remains to drive profitable revenue growth but the economic and regulatory headwinds we are facing will make this more challenging.
Our strategy focuses on three key areas:
| — | | customer service delivery |
| — | | investing for the future. |
These three areas, which we explain below, are the foundations for making BT a better business. They build on one another: the better we serve our customers and improve our processes, the less time and money we have to spend on putting things right. This is a major driver of our cost transformation and frees up resources for us to invest in providing products and services for the future.
By investing in our six strategic priorities, outlined below, we expect to grow the value of the business.
Customer service delivery
Customer service is core to our strategy and we always try to improve the experience we provide to our customers. In practice this means trying to do things ‘right first time’ – keeping our promises, being easy to contact and straightforward to deal with. It means keeping our customers informed and taking prompt action to put things right when they have a fault. To improve our customer experience further we also focus on reducing faults and removing the need for customers to call us.
‘Right first time’ is our key measure for customer service. It measures how often we keep the promises we make to customers. As well as improving service, keeping more promises reduces work needed to put things right and so reduces our costs. In 2012 we achieved a 3.0% improvement in this measure, following a 3.0% improvement in 2011 and a 10.5% improvement in 2010. In addition we reduced faults handled and calls about problems by 6.2% in the year.
In the first half of the year the theft of copper and fibre cable grew significantly, increasing the number of faults suffered by customers. We have worked with the police, Government, media and other stakeholders to raise awareness of cable theft and to take action to reduce it. Cable theft declined in the later part of the year thanks to this collective effort, but more work is needed. We have invested in a number of innovations to help prevent cable theft and to catch the people who commit it.
This cable theft, together with increased repair work related to the demands for higher speed broadband and an increase in demand for new lines, led to a 19% increase in engineer visits. We recruited additional engineers and improved our efficiency resulting in a reduction in the level of repair work outstanding to, on average, only one and a half days’ activity. We have also improved our delivery performance for new copper lines. We worked with the industry to establish a target lead-time of 14 days, and were performing consistently better than this by the end of the year.
We made progress in other areas. For example, in BT Retail we aim to deal with customer queries in one call, without the need for customers to call us back. We saw the number of queries dealt with in one contact increase by 20% in BT Consumer. As a result of our ‘right first time’ programme we reduced customer faults by 5% in BT Global Services. A variety of initiatives to improve reliability led to a 15% reduction in faults being handled by BT Wholesale.
We believe the changes we have made, and will make in the next financial year, will deliver significantly improved service levels for our customers.
Cost transformation
We have been taking a phased approach to cost transformation. The first phase focuses on the efficiency of our expenditure in areas such as labour costs, consultancy spend and procurement from third parties. The second phase tackles ‘right first time’ process re-engineering and the reduction of overhead costs. The third phase looks at in-sourcing and output-based pricing. All these phases continue across the business with a particular focus on end-to-end process re-engineering to improve service and reduce costs still further.
Specific activities during the year have included reviewing the way that bundled orders flow through the organisation; the sales process for some of our more complex products; training and development of our people; and broadband faults. Cost transformation is as much about ‘cost avoidance’ as it is about reducing the unit cost of specific items or activities and the success that we have had in reducing broadband faults in the network has allowed us to offset some of the extra costs associated with the increase in copper line volumes.
Overall, we made good progress with our cost transformation activities during 2012. We reduced operating costs before depreciation and amortisation by £942m or 6%, with savings across all our main cost categories. This represents a cumulative reduction in operating costs of £2.9bn over the last three years.
All of our lines of business have contributed to the progress made on cost transformation. Our two internal service units, BTID and BTO, have delivered benefits to the customer-facing lines of business by targeting and driving lower delivery and operational costs. This has been achieved through vendor rationalisation and greater focus on automation of processes and operations. The emphasis has now moved to the rationalisation of our network and IT infrastructure and implementing a lean approach to our operations.
In order to identify further cost reduction opportunities we regularly benchmark the cost of running our infrastructure compared with other large telecoms operators around the world. The fact that we have cut costs and improved service helps us to be much more competitive in the market place but we recognise that there are further opportunities and also lessons to be learned from beyond the telecoms sector.
Investing for the future
Our industry has undergone radical change in recent years. Customers demand more from communications services and competition is increasing. By being more efficient in customer service delivery and transforming our cost base we can provide services on a more competitive basis and improve our cash generation, which in turn means we can invest in the future of the business and drive growth.
We are focusing our investments around three broad objectives across the business. These are to:
Defend and grow the value we add for our customers
As well as providing basic communications products, we have made investments so that we can provide higher value services. For example, super-fast fibre-based broadband for consumer and business customers in the UK, managed networked IT services for large corporate and public sector customers, and managed services for our wholesale customers. BT Global Services is adding further value by offering industry-specific solutions and expertise to customers. We have also made investments in customer service and billing and in our virtual data-centres.
Capture opportunities in converging markets
The way that customers buy our products and services is changing. Services which were once bought separately are increasingly bought together, in bundles. This convergence creates both threats and
| | |
| Report of the Directors – Strategy | | British Telecommunications plc Annual Report & Form 20-F 2012 9 |
opportunities. We have been investing to broaden the range of services we provide to customers as we expand into converging markets. Examples include broadband and pay-TV in consumer markets and fixed and mobile services in SME markets.
Capture opportunities in international markets
We have continued to invest in high-growth regions where customers want to expand. We have strengthened our position by investing in assets, people and technology to serve multinational and large domestic customers on a global basis. For example, as our customers have expanded into Asia Pacific and Latin America, so we have grown our capability in these regions. We have new technology showcases in New Delhi and Shanghai and a new secure operations centre in Sydney. Network and customer service improvements have been achieved and we have hired new people in key markets. In February 2012 we announced plans to expand operations across Turkey, the Middle East and Africa.
OUR BUSINESS MODEL
We believe that we have a sustainable business model. It is built on creating and delivering value for our customers. We are confident that the model supports our aim to grow the value of the business and our strategy for doing so by investing in and focusing on our six strategic priorities.
This confidence is based on the recognition that customers value our products and services, which are an integral part of modern life for both individuals and organisations. We can see an even greater role looking forward, driven by:
| — | | the fundamental need of individuals and organisations to communicate and interact |
| — | | the wider availability of higher performance fixed networks |
| — | | the wider availability of business-critical network-based IT services |
| — | | the wider adoption of network-based IT services including cloud-based services |
| — | | the superior cost and bandwidth performance of fixed networks over wireless networks |
| — | | the increased desire of individuals and organisations to act sustainably. |
Our business model is underpinned by strong market positions in combination with some market-leading assets and resources. This is a difficult combination for competitors to replicate, and we are confident that our business model is sustainable. That is why we continue to invest in the business, foster innovation, maintain a strong cost focus, drive to deliver superior customer service, and pursue paths to growth.
OUR STRATEGIC PRIORITIES
In 2012 we made progress against our six strategic priorities although the challenges we faced during the year meant we performed better in some areas than others.
Driving broadband-based consumer services
Broadband connectivity is now available to 99% of UK premises and it has become central to people’s lives, so the core of our consumer strategy is based on building and maintaining a competitive, differentiated broadband offer for our customers. There are several elements to this:
| — | | offer competitively priced bundles of broadband services with telephony and TV – Competitively priced bundles drive both the acquisition of new customers and the retention of existing ones, slowing the rate of line losses to competitors. This also increases the number of products that customers buy from us, driving up consumer average revenue per user (ARPU) |
| — | | maintain differentiation against competitors, and continue our dual-brand strategy with Plusnet – We include a range of features free with our BT Broadband services to differentiate us from other suppliers. The Plusnet brand addresses the cost-conscious consumer with a simple broadband offer |
| — | | launch higher broadband speeds and create new services that exploit these speeds – Our BT Infinity service meets customers’ growing demand for improved speed performance. Our higher speeds set us apart from ISPs only offering DSL services, and allow us to compete more effectively against Virgin Media’s fastest cable speeds. Where fibre is not yet deployed, we have been migrating our retail broadband customers onto our next generation copper-based product |
| — | | grow and enhance our TV services – Our TV service is differentiated from traditional pay-TV competitors as it is more oriented to video on-demand and catch-up TV, and is more interactive. We will improve our service adding a number of features over the coming years. In 2013 we plan to launch our YouView service, which combines free digital channels with free on-demand content from public service broadcasters delivered over broadband. We are also investing in multicast infrastructure to deliver additional channels over our IP network. |
Being the ‘Brand for Business’ for UK SMEs
Our aim is to become the first choice for SMEs in all their fixed and mobile communications and IT needs.
In fixed communications for SMEs we face significant competition in a fragmented market but we believe we have many advantages including national coverage, a broad portfolio of products and services, and strong sales channels in all segments of the market. We are looking to improve the products and services we sell and how we sell them to protect and grow our market position.
We are also looking to improve the way we offer mobile services and are developing capabilities to combine fixed and mobile services as part of an integrated offer.
During the year we withdrew from selling IT hardware to other resellers and have focused on selling a combination of services and hardware to our end-customers.
We will focus in the future on services to support our customers as they move to new models for delivery of their IT, such as cloud computing. These will increasingly involve managed hosting of data and applications and greater integration between IT and communications services.
BT Global Services – a global leader
We are already a leader in the market for managed networked IT services. We have been recognised by Gartner, Inc., a leading information technology research and advisory company, as being in the leaders quadrant in their recent analysis of global network service providersa.
We believe we have four key differentiators which make us stand out in the marketplace:
| — | | global assets, people and technology |
| — | | industry experience and solutions |
| — | | innovation and new solutions, based on our strength in the UK |
| — | | professional services people and capabilities in BT Advise. |
Our strategy is to make use of these differentiators to create competitive advantage. We are investing globally to make improvements in the areas our customers tell us are important to
| a | Gartner, Inc. “Magic Quadrant for Global Network Service Providers”, 24 April 2012. Authors Neil Rickard ID Number G00226786. Gartner does not endorse any vendor, product or service depicted in its research publications, and does not advise technology users to select only those vendors with the highest ratings. Gartner research publications consist of the opinions of Gartner’s research organisation and should not be construed as statements of fact. Gartner disclaims all warranties, expressed or implied, with respect to this research, including any warranties of merchantability or fitness for a particular purpose. |
| | |
| 10 British Telecommunications plc Annual Report & Form 20-F 2012 | | Report of the Directors – Strategy |
them. For example, we improved sales coverage in the UK, invested in our network in key cities, built out propositions across the four industry sectors we target, hired professional services people across the world in key portfolio areas and invested in key growth geographies.
We will build our global reputation in managed networked IT services by:
| — | | expanding our global business by investing in high-growth regions such as Asia Pacific, Latin America and Turkey, the Middle East and Africa, recruiting more people and improving our portfolio and our network infrastructure |
| — | | developing our relationships with our customers by building and enhancing industry-based solutions focusing on our four strategic industry sectors |
| — | | innovating around our core portfolio of product families by investing in growth areas including MPLS, Ethernet, UCC, CRM, security, mobility and cloud services, as well as professional services capabilities |
| — | | substantially improving customer experience by reducing the number of customer incidents, making our operations more efficient, and improving overall customer satisfaction with our service. |
The wholesaler of choice
We aim to be the wholesaler of choice in the UK and in the international telecoms services market.
There are two dimensions to what we mean by ‘wholesaler of choice’. The first refers to our ambition of being the obvious choice for customers based on the products we sell and the quality of the service we deliver. The second dimension is that customers can choose to engage with us as a wholesale supplier in a number of ways, for example, through Openreach for access products, or through BT Wholesale for value-added products.
During the year Openreach saw growth in its copper base and the first LLU operators buying its fibre-based broadband service. BT Wholesale saw growth in the Wholesale Ethernet and IP Exchange markets but a decline in revenues associated with transit and wholesale broadband due to the migration to LLU.
Looking ahead to 2013, we expect a variety of issues, such as regulatory charge controls and other regulatory pressures to continue to have an effect on our wholesale business. We are working to identify growth opportunities that will help mitigate the impact. Our future plans include:
| — | | creating opportunities for growth, by investing in fibre broadband, Ethernet and IP voice services and in our portfolio of managed service solutions |
| — | | improving customer experience through continuing investment in fault prevention, automation and self-service tools |
| — | | reducing our cost base significantly, while increasing the skills and productivity of our people. |
The best network provider
We aim to be the best network provider in the UK by providing the right products to suit customers’ needs. We try to improve network reliability and make it easier for customers to do business with us.
UK access network
Our copper access network is a critical national asset and we take our guardianship seriously. Through it we play a major part in people’s lives both at home and at work, managing and investing in the infrastructure that delivers telephony and broadband services throughout the UK. We continue to invest in our copper network by upgrading its capacity and improving its efficiency.
We also continue to roll-out WBC, our next generation copper broadband product, offering speeds of up to 20Mbps downstream,
and are on track to enable exchanges serving around 90% of UK premises during spring 2013.
UK fibre
One of the most important things we are doing is building a fibre broadband network throughout the UK. We are investing £2.5bn on a commercial basis to make fibre broadband available to around two-thirds of UK premises by the end of 2014. Looking beyond this, we believe that Broadband Delivery UK (BDUK) funds, together with funds from local government and other sources, as well as further private investment, could see around 90% of UK premises having access to fibre broadband in approximately the next five years. We have indicated that we would be willing to invest further funds of around £1bn should we win a sufficient share of the public funds being made available through competitive tenders to support fibre roll-out. We are competing for BDUK funds and have won the bid in Lancashire and are the preferred supplier for Rutland. We are also rolling out fibre in Cornwall and the Isles of Scilly and Northern Ireland, funded by public-private partnerships.
We believe fibre is our future, with customer demand for higher speeds being the driving force behind our fibre broadband deployment. Fibre broadband dramatically improves the online experience for customers, whether they are consumers or businesses. Consumers are able to watch HD movies on demand, download albums in seconds, enjoy online multiplayer gaming and catch up with friends and family with live video calls. The key factor, however, is the ability for everyone in the household to be able to participate in these activities online, all at the same time.
Fibre broadband also creates new ways of using the internet. For businesses, the additional bandwidth available – both upstream and downstream – enhances efficiency. For example, the faster upstream speeds allow businesses to increase flexible and remote working –saving money on office overheads and improving the work-life balance of employees. Businesses are also able to use high quality voice and video calls – helping them to reduce time and money spent on travel, while still gaining the benefit of direct customer contact. This also helps lower CO2 emissions.
In March 2012 we announced that we had upgraded the copper access network within our FTTC footprint by increasing the spectrum allocation at cabinets, so that the copper running from cabinets to the premises could support broadband speeds of up to 80Mbps downstream and up to 20Mbps upstream. Further advances are possible – for instance vectoring, which is an advanced technique to reduce the impact of noise on copper lines and increase available data speeds.
Our future plans include:
| — | | launching our commercial up to 330Mbps FTTP products |
| — | | commercially launching FVA, which provides voice service over FTTP connections |
| — | | making our FTTP service available in areas that are already served by FTTC, through the introduction of our ‘FTTP on demand’ service |
| — | | establishing a pilot for our fibre-only exchange programme in Deddington, Oxfordshire. The pilot will provide CPs with the opportunity to build and test a suite of new products that will run over fibre alone and help the industry better understand the opportunities arising from a fibre-only world |
| — | | delivering further improvements to network rationalisation, efficiency and reliability. |
A responsible and sustainable business leader
Our aim is to create a better future for our business, its stakeholders and the environment by being a responsible and sustainable business leader. In 2012 contracts worth more than £2.7bn with large corporate and public sector customers requested information on our sustainability credentials, making sustainability a basic requirement of doing business. We use a materiality process to determine the social and environmental issues that are important to our stakeholders and relevant to our business.
| | |
| Report of the Directors – Strategy | | British Telecommunications plc Annual Report & Form 20-F 2012 11 |
We have seven corporate responsibility (CR) related key performance indicators (KPIs) that we use to measure our progress. We provide information on how we have performed against these KPIs in thePerformancesection on page 23.
TheCommittee for Sustainable and Responsible Businessoversees our corporate responsibility, environment and community activities, including charitable expenditure and the Better Future strategy for maximising our contribution to society.
Creating a better future
Our Better Future strategy brings together everything we are doing to be a responsible and sustainable business leader. Examples of the ways we are creating a Better Future can be found throughout this annual report but everything we are doing supports our focus areas:
| — | | Better business practice. |
Better connected
We believe that the greatest impact we can have on society is by providing reliable and secure networks to allow the services needed for people and businesses to thrive. Getting this right is also essential for building trust in BT, which contributes to the value of our brand.
Access to fibre broadband
A recent independent report predicts that fibre broadband will result in significant economic benefits for the UK as a whole. Given our fibre roll-out, this makes us a key contributor to the economic health of the UK.
Increasing digital literacy
We also recognise our role in increasing digital literacy, which can help enrich the interactions between individuals, and give them access to essential services that are more frequently online. Some initiatives currently underway include Get IT Together, which aims to help people in the UK discover the digital world through the help of a friend or family member.
Better with less
We believe that we can be a force for ‘net good’ by helping individuals and businesses to live within the planet’s environmental constraints. We continually seek to minimise our own environmental footprint through efficient use of energy and natural resources. We can have a greater impact by helping customers reduce their environmental footprint through the use of our services.
Environmental management
Our Environmental Management System has been certified to the international standard ISO 14001 since 1999 in the UK. Our certification now covers our operations in Belgium, Ireland, Germany, Netherlands, Italy and Spain. ISO 14001 requires us to demonstrate compliance with environmental laws and regulations, effectively control environmental risks, and demonstrate continual improvement. We set improvement targets, and report annually on our progress.
Energy and carbon emissions
We are a large consumer of energy and in the UK we spent around £250m on energy in 2012. Electricity use, after purchase of low and zero carbon intensity electricity, makes up 70% of our direct carbon emissions.
Our strategy is to:
| — | | improve our energy efficiency |
| — | | generate our own renewable electricity |
| — | | purchase low and zero carbon intensity electricity. |
Our energy efficiency programme is decoupling energy use from business growth.
Despite increased volumes we reduced our energy consumption by 3.3%, against our target 2% reduction from 2011. In 2012 we delivered energy saving programmes which will save £21.9m per year.
Engaging with suppliers to reduce emissions
We work closely with our suppliers to reduce their environmental impact.
We are pleased to have become the first company in the world to have product carbon footprints independently certified by the Carbon Trust to the new Greenhouse Gas Protocol Product Standard. The independent verification covers three of our most popular consumer products: the BT Home Hub, our wireless router; the BT Vision+ digital set-top box; and the BT Graphite 2500 DECT phone.
Better lives
Our people and technology are helping to build skills and increase efficiency for our charity and community partners, allowing them to concentrate on providing help and support to their communities. Our community investment activities provide a source of pride in the company, helping motivate and engage our people.
Our supply chain
We source skills, products and services from many countries, contributing to economies around the world. However, environmental and labour regulations may be poorly enforced in some countries and local standards are sometimes lower than we consider acceptable. We use an in-house team to check the ethical standards in our supply chain in order to manage any risks.
Supporting our customers
We have been providing assistance and services for older and disabled customers in the UK since 1984. We are committed to helping them make the most out of our products and services, and overcome communication challenges wherever possible. We have brought together our most helpful products and services in one place, the Including You website, along with the latest news, advice and information to make it easier to get the most from our products, including broadband.
Better business practices
We have a long track record of investing in our people and running our business with high ethical and supply chain standards.
Running an ethical business
Operating ethically is not only the right thing to do, but is required by regulators and customers alike. To make sure that we are running our business to the high standards we expect of ourselves, we have a number of processes in place to make sure our people understand what is expected of them. We offer extensive training each year on our statement of business practice, which we revise regularly to make sure we meet the highest legally required standards in the countries in which we operate.
This is supported by a number of ethical policies, including Anti-Corruption and Bribery and Gifts and Hospitality. Our confidential hotline is now operational in 62 countries providing 96% coverage of our employee population.
| | |
| 12 British Telecommunications plc Annual Report & Form 20-F 2012 | | Report of the Directors – Strategy |
People and engagement
Our people are crucially important for the delivery of our services and therefore our reputation and success. They are our public face and are the talent behind our innovation.
We know that engaged employees deliver better performance for the business. Because of this we have a number of initiatives in place to enhance their well being, and to make sure that work-life balance is maintained through flexible working practices.
Health and safety
Looking after the health, safety and well being of all our people is a major priority for us. We have comprehensive management systems to help make our workplaces as safe as possible.
HOW WE MEASURE OUR PROGRESS
We measure our progress by two performance indicators: adjusted free cash flow, and customer service improvement.
Adjusted free cash flow
Free cash flow is an important measure of our financial performance and our progress against our strategic priorities. It represents the cash we generate from operations after capital expenditure and finance costs and reflects the cash available to invest in the business, repay debt, support the pension scheme and pay dividends. Our free cash flow measure changed from reported free cash flow to adjusted free cash flow in 2012 to align with management incentive arrangements. Adjusted free cash flow is before the cash impact of specific items.
For further details of adjusted free cash flow see page 24.
Customer service improvement
Our strategy starts with customer service and we always try to improve the experience we provide to our customers. ‘Right first time’ is our key measure for customer service. It measures how often we keep the promises we make to our customers. As well as improving service, keeping more promises reduces the work needed to put things right and so reduces our cost.
For further details of customer service improvement see page 9.
OUR RESOURCES
Our resources are the things we need to deliver our strategy. Many of them are things that make us different and that set us aside from our competitors and give us an advantage in our markets. We deal with our resources in a responsible and sustainable manner.
Brand and reputation
The BT brand is an important business asset and a key resource. We know that it is effective in making sure our products and services are considered by customers of all types, in communicating our strengths, and in acting as a guide to our behaviours. We are consistently assessed as one of the world’s most valuable brands. For example, we ranked 86 in Brand Finance’s Global 500 of the world’s top brands in 2012.
People who buy things from us do not just choose us for the obvious benefits of our products and services. They are buying into a set of values, and a rich heritage. Despite the diversity of our markets, the brand associations are remarkably consistent – we are seen as relevant to people, and they trust and like us as a brand. In 2011 we began a two-year programme of renewing our trademark licences around the world to provide confidence that the value of our brand is adequately protected.
People
Our people are a key resource; we rely on them to deliver our strategy and we are proud of what they achieve for our business. At 31 March 2012 our people resources were equivalent to 89,015 full time employees of which 73,845 were based in the UK.
Working environment
It is important to match the resources available to our customers’ needs. To help achieve this we have people on many different types of working arrangements. These include part-time, term-time and job share. They help to match the flexibility required for the business with people’s own aspirations for a work-life balance.
We continue to support an inclusive working environment where people can develop their careers and expect to be treated fairly, regardless of their race, sex, religion/beliefs, disability, marital or civil partnership status, age, sexual orientation, or caring responsibilities. We also work with specialist agencies to enable the recruitment of people with disabilities and we run a retention service to ensure that people can stay with us even if their capabilities change.
As our business develops and grows, the skills that we need may change. We provide opportunities to re-skill and look for alternative roles for individuals whose skills or jobs are no longer required. Since we started these arrangements six years ago, over 19,000 people have successfully found alternative employment within BT with 4,100 of these during the last year. Our ability to help find alternative roles has been enhanced by an ongoing review of work that has previously been resourced externally and bringing this back into BT where appropriate. Over the past two years around 4,000 jobs have been insourced from suppliers and overseas.
Employee representation
We have a record of stable industrial relations and constructive relationships with the recognised unions in the UK and with works councils elsewhere in Europe. In the UK we recognise two main trade unions – the Communication Workers Union (CWU), which represents people in engineering, administrative and clerical positions, and Prospect, which represents managerial and professional employees. We deal with unions around the world and also operate a pan-European works council, the BT European Consultation Committee.
Pay and benefits
We expect our people to work hard and in return we reward them fairly. In 2012 we implemented a 3% pay increase in the UK as well as paying all team members a £250 bonus. For our engineers and support people this is an across-the-board arrangement and for our managers there is performance-related differentiation. The same principles of fair pay for the work done are similarly applied in all other countries in which we operate.
Our managers also receive bonuses linked to the success of the business and their personal contribution to it. Our most senior managers are also eligible for long-term incentives, but again, payment is related to business success measured by our corporate performance over a three-year period. Different arrangements apply to the most senior managers in Openreach but these are also entirely related to business performance.
We also provide savings-related share option plans in over 25 countries. Under the BT employee share investment plan, we let employees in the UK participate in a tax and national insurance-efficient share purchase scheme. We are pleased that more than 60% of our people participate in one or more of these share plans.
We also provide pension and retirement benefits for employees as well as statutory retirement arrangements.
| | |
| Report of the Directors – Strategy | | British Telecommunications plc Annual Report & Form 20-F 2012 13 |
Networks and platforms
Our infrastructure is made up of networks and platforms which in combination connect our customers and support the services they use. As such they are a vital resource and their reliability and security are critical to our customers and to delivering our strategy.
Networks
Our UK fixed-line communications network is one of our most valuable resources. Our super-fast fibre-based broadband network is key to our future and our competitive position in the UK. Around the world, our networks consist of assets that we own and those that are leased from suppliers to give us global reach.
We have established a global MPLS network, which is designed to carry different types of network services over a common infrastructure. We offer two types of virtual private network (VPN) service: IPVPN and Ethernet VPN. These provide our customers with secure network capabilities in many countries across the world.
Our IPVPN service is available in 197 countries and territories and can be accessed through: global points of presence (GPoP) and direct leased lines in 118 countries; city fibre networks in 24 European cities and 2 Latin American cities; Ethernet access in 42 countries; DSL in 21 countries; network-to-network interfaces (NNI) in 31 countries; internet-based access in 178 countries, and satellite access in over 60 additional countries.
BT-owned physical GPoP are MPLS points of access which house an IP node. NNI are the interface between our network and the network of a third party. They allow us to use another provider’s network to extend our footprint in geographies where we have fewer of our own GPoP. Satellite links provides access to the BT network in remote locations, beyond the reach of traditional fixed-line solutions.
Our Ethernet VPN service is available in 28 countries using Ethernet access. This number is growing through the global expansion investments we have made over the past year.
Platforms
Our platforms are the processes and technology that deliver products and services over our networks. For example, the billing and payments platform comprises the systems and processes that calculate charges, produce bills and collect payments from our customers. The number of platforms we own has grown over time through a combination of acquisition, outsourcing contracts and technology upgrades. We continue to improve platforms by modernising and rationalising them, so reducing complexity while improving reliability, flexibility and cost.
We have reduced the number of IT applications by 11% over the year, which has helped BTID and BTO to underpin significant cost reduction.
Properties
At 31 March 2012 we occupied around 6,500 properties in the UK, and around 1,720 properties in the rest of the world. The majority of the UK properties are owned by – and leased from – Telereal Trillium, which is part of the William Pears Group. Of the UK portfolio, 90% of the properties are operational telephone exchanges which contain telecoms equipment and are required as part of our continuing activities. Our general purpose properties consist chiefly of offices, engineering depots and data centres. Outside the UK, 90% of the properties are operational sites housing data hosting and telecoms equipment. In 2012 we have continued our programme of property rationalisation, consolidating office space within the estate and disposing of redundant office and operational buildings through cost transformation programmes.
Innovation
Innovation has always been at the core of our business. Our global research and development activities are aligned with, and focused on, supporting our strategy.
Creating attractive and competitive propositions for customers is critical to our future. We access some of the best innovation from around the world through our open innovation model. Our teams work with customers, partners and universities in the US, Asia, Europe and the Middle East, exposing us to more than 500 new technologies, business propositions and market trends over the year. In 2012 we filed patent applications for 65 inventions. We routinely seek patent protection in different countries including the US and China, and we currently maintain a total worldwide portfolio of over 5,000 patents and applications.
In 2012 we invested £560m (2011: £684m) in global research and development to support our drive for innovation. The reduction in expenditure compared with 2011 has been delivered through better procurement, systems rationalisation, development efficiency improvements and platforms reaching maturity. Our global development centres, located in the UK, US and India, help us to draw together key and complementary skills and resources (both internal and third party) with the objective of increasing agility, efficiency and delivery of innovation into the market. We are actively looking to invest in establishing additional centres in new locations.
In 2012 we applied our research and development capability to a number of areas including:
| — | | increasing broadband coverage – we have been trialling innovative new technologies to test their suitability for providing service in hard to reach locations across the UK. For example, BT Wholesale trialled fixed-mobile 4G LTE in Cornwall and Openreach performed trials using TV white space radio technology to get better broadband to locations on the Isle of Bute |
| — | | improving broadband speed – we worked on the network frequency plan change (described on page 11) and have been trialling 1Gbps FTTP broadband |
| — | | improving customer service – we have been developing advanced network test capabilities to diagnose and solve the more complicated faults on our broadband network. We try to predict faults and fix them before they impact on customers |
| — | | enhancing cyber security – to complement our security capabilities we have developed advanced tools which provide additional insight and analysis. |
Suppliers
Suppliers play a key role in helping us deliver our products and services to customers and as such play an important role in helping us deliver our strategy. We work with around 18,200 suppliers, spending approximately £10.6bn per year with them, with the top 100 suppliers accounting for around 65% of this spend.
Our approach to procurement
Our supply chain is global. We source products and services from across the world and have a team of over 300 procurement professionals located across 27 countries.
We operate a strategic sourcing process for the vast majority of spend to derive maximum value and to meet our cost transformation goals, with vendor negotiations being a key driver of cost reductions. Against the backdrop of a difficult economic climate, our strategy has been to focus on the suppliers with the greatest spend together with innovative approaches to the market to achieve maximum business benefit. We are now planning to broaden this approach to include a larger proportion of our supply base, while at the same time exploring collaboration and consolidation options with our suppliers.
| | |
| 14 British Telecommunications plc Annual Report & Form 20-F 2012 | | Report of the Directors – Strategy |
Supplier selection
Suppliers are selected using an established set of procurement principles which makes sure that we act in an ethically and commercially responsible way in our business dealings with them. It is important to us that we understand who we are doing business with and who is acting on our behalf.
Another important part of our supplier strategy is to ensure that the goods and services we buy are made, delivered and disposed of in a socially and environmentally-responsible manner. Sustainability factors such as energy usage, environmental impact, and labour standards are embedded in our procurement process, and influence supplier and product selection. We are also actively restructuring our base of suppliers and partners to improve geographic reach, and increase resourcing resilience by reducing ‘dependency’ on geographically concentrated suppliers.
Payment of suppliers
In normal circumstances our payment terms for contracted suppliers will be to pay each due, valid and undisputed invoice between 60 and 73 days from date of receipt from the supplier. There are variations to this policy. For example, there could be shorter timescales for some interconnect payments to other telecoms operators, low value spend, or where there are specific customer requirements. In 2012 the average number of days between the invoice date and the date of the payment run for the invoice was 61 days (2011: 64 days).
In the UK we provide access to a financing scheme which offers contracted suppliers the opportunity to obtain early payments for valid and undisputed invoices – this can be a particularly attractive option for SMEs. In addition, we subscribe to the Better Payment Practice Code.
OUR RISKS
In common with all businesses, we are affected by a number of risks and uncertainties which are influenced by both internal and external factors, some of which are not within our control. Many of our risks are similar to those of comparable companies in terms of scale and operation.
Principal risks and uncertainties
This section highlights principal risks and uncertainties affecting our business but it is not intended to be an extensive analysis of all risk and uncertainty affecting us. These risks have the potential to impact our business, revenue, profits, assets, liquidity and capital resources adversely. Our processes are designed to give reasonable, but cannot give absolute, assurance that the risks significant to us are identified and addressed. There may be risks which are unknown or which are presently judged not to be significant but later prove to be significant.
Uncertainty in global economic and credit market conditions remains a major challenge to businesses globally. This is particularly true in Europe where there are concerns over government debt levels and possible currency re-denomination risks. In common with many other businesses we remain conscious of the adverse impact that unfavourable economic and credit conditions may have on our business. This economic uncertainty manifests itself in several of the risks we face, and we focus our efforts on the management of those principal risks.
The principal risks we reported last year have evolved in nature, as has our response to them, and we explain these changes in our principal risks section below.
We also include comment on mitigation – that is, what we can do to reduce the likelihood or impact of the risk – that we apply to help us manage the risks. However, it is possible that not all mitigation will be successful.
The principal risks and uncertainties should be considered in conjunction with the risk management process, the forward-looking statements for this document and the cautionary statement regarding forward-looking statements.
Risk management
It is our aim to manage risk so that we can successfully deliver our objectives, creating shareholder value while promoting the interests of our many stakeholders through the safeguarding of our assets and reputation.
We have in place group-wide risk management processes for the identification, evaluation, response and subsequent monitoring of risks which may significantly threaten the accomplishment of our objectives and long-term strategic aim.
During 2012 we introduced enhancements to our risk management process including:
| — | | improving the way we report risks to senior management, by providing a clearer focus on the key areas of concern. This makes it easier for our managers to take account of risks in their decision making |
| — | | enhancing our evaluation of risks, for example through consideration of when risks may materialise and when and how the impact may be felt. This helps us make informed decisions about how we will respond to the risks we face |
| — | | improving our risk training, such as through the development of new computer-based training modules. We see continued education and awareness as vital ingredients in developing and maintaining intelligent risk management in our business. |
The BT Group plc Board has overall responsibility for ensuring that our risks are managed appropriately and, either directly, or through the BT Group plc Audit & Risk Committee, undertakes regular reviews of the management of our risks at group-wide, line of business and internal service units levels.
The BT Group plc Operating Committee is responsible for identifying, evaluating, responding to and monitoring risks. Those risks that are significant to us are reported and monitored through the Group Risk Register. Each risk is assigned a management owner who is responsible for the ongoing monitoring and management of the risk. The Operating Committee review these risks through detailed monthly reviews as well as performing six-monthly reviews of the Group Risk Register.
The BT Group plc Board and the Operating Committee are supported in their oversight of risk management by the Group Risk Panel. The Group Risk Panel reviews the Group Risk Register in detail on a quarterly basis, considers new or emerging risks, makes recommendations on the strength of mitigations and monitors the work of the group risk management function. Our reporting is structured so that emerging key risks are escalated through management to the Board as appropriate.
Each line of business and service unit operates a risk management process as part of our Enterprise Risk Management framework. This includes identifying and responding to the key risks to their business, which are captured in a risk register and reviewed by their leadership teams. Audit and risk committees in each line of business and service unit provide assurance over the effectiveness of their risk management processes.
Our principal risks
Security and resilience
Our reputation for secure and resilient services relies on the quality, integrity and reliability of our global information systems, networks and infrastructure. The scale of our business and global nature of our operations means we are required to manage significant volumes of personal and commercially sensitive information which are stored and transmitted to meet our own business purposes and those of our customers. All of this needs to be safeguarded from potential exposure, loss or corruption.
| | |
| Report of the Directors – Strategy | | British Telecommunications plc Annual Report & Form 20-F 2012 15 |
Increasing dependence on voice and data transmission in a variety of forms is accompanied by high expectations about service continuity. In addition, concerns about interception, corruption and theft of information lead to requirements for stringent security measures, in an environment where attacks are becoming more frequent and sophisticated. Certain of our customers require specific, highly sophisticated security provisioning which we are contractually obliged to meet if we are to continue to be able to differentiate our offerings from those of our competitors.
Changes over the last year
Reports of and attention paid to computer hacking incidents have increased concerns about the likelihood of a cyber attack. Enhanced laptop encryption and significant improvements in the protection and segregation of credit card data are some measures which we have taken to manage this risk. We continue to evolve our strategy and capabilities to seek to protect our business against the threat of attacks. The increased threat we have faced in the UK from cable theft, together with actions we have taken in response, are set out in more detail on page 9.
Impact
Failure or interruption of data transfer could have a significant adverse effect on our business. A breach of our security and/or resilience affecting our own operations or those of our customers could lead to an extended interruption to network services and even affect national infrastructure. Such failure may lead to a loss of customer confidence, termination of contracts, loss of revenue, and reduced cash resources through penalties and unplanned costs of restoration and improvement. Additional reputational damage and financial loss may arise from a breach involving a legal failing such as breaching data protection requirements.
Risk mitigation
We operate well established policies addressing the security and resilience requirements of our operations, our own systems and systems operated by us for our customers. Compliance with these policies is routinely monitored. We apply stringent application and data encryption measures, deploy increasingly sophisticated anomaly and intrusion detection systems and utilise distributed and virtual data centre designs which provide much greater inherent resilience. We have a corporate resilience strategy that combines formal business continuity plans with well tested, rapid and flexible responses. These are designed to deal with catastrophic incidents including for example, major terrorist action, industrial action, cyber attacks or natural disasters.
Given our important role in the forthcoming London 2012 Olympic and Paralympic Games, safeguards and deterrent measures have been increased, and incident responses rehearsed, to increase the likelihood that any potential incidents can be contained and dealt with as quickly as possible.
Major contracts
We have a number of complex and high-value contracts with certain customers. The revenue arising from, and the profitability of, these contracts are subject to a number of factors including: variation in cost and achievement of cost reductions anticipated in the contract pricing, both in terms of scale and time; delays in delivery or achieving agreed milestones owing to factors either within or outside of our control; changes in customers’ requirements, budgets, strategies or businesses; the performance of our suppliers, and other factors. Any of these factors could make a contract less profitable or even loss making.
The degree of risk varies generally in proportion to the scope and life of the contract and is typically higher in the early transitional and transformational stages of the contract. Some customer contracts require investment in the early stages, which is expected to be recovered over the life of the contract. Major contracts often involve the implementation of new systems and communications networks, transformation of legacy networks and the development of new technologies. The recoverability of these upfront costs may be adversely impacted by delays or failure to meet milestones. Substantial performance risk exists in these contracts, and some or all elements of performance depend upon successful completion of the transition, development, transformation and deployment phases.
Changes over the last year
Global economic and credit market conditions, in Europe in particular, have put increased financial and operational pressures on our customers and have made the environment even more competitive. As we continue to expand into emerging markets, the landscape of our risks and opportunities naturally changes as we must deal with rapidly evolving geo-political risks and different trading environments and business practices. We are able to draw on our experience in managing these risks and will continue to apply the control framework and mitigation that is in place for our major contracts.
Impact
Failure to manage and meet our commitments under these contracts, as well as changes in customers’ requirements, budgets, strategies or businesses, may lead to a reduction in our expected future revenue, profitability and cash generation. We may lose revenue due to the merger or acquisition of customers, changes to customer strategy, business failure or contract termination. Failure to replace the revenue and earnings lost from such customers could lead to an overall reduction in revenue, profitability and cash flow.
Risk mitigation
We have in place business processes that support each stage of a major contract’s life cycle: bid; in-life; renewal, and termination. Our programme of in-life reviews has continued over the past year. It is designed to validate financial and non-financial controls over delivery of the contract. It incorporates tiered levels of defined review according to the scale and complexity of the contract. Controls are applied and regularly monitored across our major contracts. All our major contracts are subject to regular management review and many are subject to independent review (both internal and external) as part of that governance.
We have started rolling out new and revised risk training material with the objective of improving identification, evaluation and management of risk on our major contracts. Our independent review programme continues to help us identify lessons learned and to promote best practice through the business.
Pensions
We have a significant funding obligation in relation to our defined benefit pension schemes. Declining investment returns, longer life expectancy and regulatory changes may result in the cost of funding BT’s main defined benefit pension scheme, the BT Pension Scheme (BTPS), becoming a significant burden on our financial resources.
Changes over the last year
The triennial funding valuation of the BTPS at 30 June 2011 and associated recovery plan was agreed with the BTPS Trustee and certified by the Scheme Actuary in May 2012. Under this prudent funding valuation basis the deficit was £3.9bn and a recovery plan was agreed in order to return the BTPS to a fully funded position on an actuarial funding basis by 31 March 2021.
| | |
| 16 British Telecommunications plc Annual Report & Form 20-F 2012 | | Report of the Directors – Strategy |
The valuation documentation will now be submitted to the Pensions Regulator. The final Court decision in the Crown Guarantee case, after any appeals, will give greater clarity as to the extent to which the liabilities of the BTPS are covered by a Crown Guarantee. This will inform the Pension Regulator’s next steps with regards to the valuation of the Scheme. Accordingly, as matters stand, it is uncertain as to when they will conclude their review.
Impact
An increase in the pension deficit and associated funding requirements would have a direct adverse impact on our future cash resources. Indirectly it may also have an adverse impact on BT Group plc’s share price and our credit rating. Any deterioration in the credit rating would increase our cost of borrowing and may limit the availability or flexibility of future funding thereby affecting our ability to invest, pay dividends or repay debt as it matures.
Risk mitigation
The investment performance and liability experience, as well as the associated risks and mitigation strategy, is regularly reviewed and monitored by both us and the BTPS Trustee. The BTPS has a well-diversified investment strategy, which reduces the risk of adverse movements in the value of individual asset classes and helps ensure that an efficient balance of risk and return is maintained.
The funding deficit was reduced by a lump sum payment of £2.0bn into the BTPS in March 2012, following a provisional agreement with the BTPS Trustee on the funding valuation at 30 June 2011. Completing the valuation in a timely manner has provided additional certainty for us and members of the BTPS on future payments to the BTPS.
Our financial strength and cash generation provide a level of protection that enables variations in the funding position of the BTPS to be managed without having a material impact on the ongoing performance of our business.
Growth in a competitive market
We operate in markets which are characterised by high levels of competition including: declining prices; technology substitution; market and service convergence; customer churn; declining rates of growth; emerging competitors, and regulatory intervention to promote competition. A significant proportion of our revenue and profit is generated in the UK telecoms markets which are experiencing limited revenue growth despite strong volume demands in many markets. Revenue from our calls and lines services to consumers and businesses has historically been in decline but new broadband and connectivity markets are showing continuing growing demand. Our ability to deliver profitable revenue growth in a responsible and sustainable manner depends on delivering on our strategic priorities (see page 10).
Changes over the last year
The level of risk facing our business due to competition has increased with new competitors emerging and our customers in the UK and globally facing uncertainty in the economic outlook. Regulatory changes which now allow competitors to deploy access fibre using our duct and poles have also contributed to the increased level of risk. The competitive challenges across our different markets continue to evolve. In a number of our markets we remain disadvantaged by imbalances in the competitive playing field. Some of our competitors benefit from a combination of limited regulation applied to their core business and extensive sector specific regulation being applied to our UK fixed-line business. Competition remains strong in the UK consumer fixed communications retail and wholesale markets. In managed networked IT services for multinational companies, competition is increasingly centred on value-added network IT services rather than network connectivity.
Impact
Failure to achieve profitable revenue growth from our strategic priorities may lead to a continued decline in revenue, erosion of our competitive position and might also lead to a reduction in profitability and cash flow in the future.
Risk mitigation
Against this competitive backdrop we remain focused on successfully defending our existing business and offering new services in converging markets. We continue to press for changes in regulation to level the playing field so that we can compete efficiently for the benefit of customers. We have a clearly defined strategy aimed at increasing shareholder value, as set out on pages 10 to 13. The delivery of our strategic priorities will help improve our revenue trends. Our strategic priorities are underpinned by our view of the markets in which we operate. We have a well-developed cost transformation programme in place which has achieved significant savings and helped maintain a competitive cost base.
We have taken action to make the management of this risk more integral to our business. These steps have built on our existing processes which are primarily focused on monitoring performance against business plans and allowing timely interventions where appropriate. Management incentives have been changed to ensure better alignment and growth in underlying revenue excluding transit now carries a 20% weighting as a performance measure.
Communications industry regulation
Some of our activities continue to be subject to significant price and other regulatory controls which may affect our market share, competitive position, future profitability and cash. Many of our wholesale products in the UK are subject to significant regulatory controls. The controls regulate, among other things, the prices we can charge for many of our services and the extent to which we have to provide services to other CPs. In recent years the effect of these controls has required us to reduce our prices, although in some cases, prices have been allowed to increase in real terms.
Regulatory decisions in all jurisdictions in which we operate can directly impact our financial position. In the UK, Ofcom has powers to directly amend the prices we set and therefore the revenue we earn in certain markets. These can extend to requiring us to make retrospective repayments to other CPs for past overcharging and imposing fines for non-compliance with the regulatory rules (including competition law). Outside the UK, regulation defines where and how we are able to compete through general licensing requirements and defining the wholesale charges we pay for access.
Regulation usually operates within a clear legislative framework that is stable in the medium to long-term. Risks of negative regulatory decisions arise from within those frameworks. For instance, in the UK, risks can arise from periodic market reviews which may introduce tighter regulatory constraints, for example, from new charge controls, or from CPs raising disputes or complaints about our current or historical pricing. Risks also arise as legal challenges are brought by others against Ofcom decisions. Outside the UK, regulators can conduct investigations into our licensing requirements and whether the services we offer are compliant.
Changes over the last year
Over the last year, we have seen regulatory activity in a number of areas which are summarised in theRegulationsection on page 7. A number of these rulings have resulted in a negative impact either through retrospective price reductions or on our future pricing.
| | |
| Report of the Directors – Strategy | | British Telecommunications plc Annual Report & Form 20-F 2012 17 |
Impact
In recent years changes in price controls have required us to reduce our prices and in some instances to make payments in respect of retrospective price adjustments. Additional or more substantial regulatory price reductions could constrain our revenue performance.
We may be required to provide new services to wholesale customers on a non-discriminatory basis, increasing our costs and increasing retail competition. Disputes may result either in reduced revenue or increased costs going forward. We may also be required to make retrospective payments to CPs if it is ruled that we have overcharged them. Appeals may change Ofcom’s decisions, which had originally been concluded in our favour.
Risk mitigation
We continuously monitor and review potential regulatory changes and disputes, and maintain a dialogue with regulators and other key influencers on critical issues. We use external advisors to advise and support our positions and thoroughly assess the potential for a legal challenge to any regulatory decisions.
Compliance in a global environment
The global nature of our operations means that we have to comply with a wide range of local and international legislative requirements. Our legal compliance obligations include anti-trust and anti-corruption legislation, competition law, data privacy, trade sanctions, import and export controls, taxation and telecoms regulatory requirements.
Changes over the last year
Some of the countries where we operate have increased their enforcement of local laws and therefore the potential impact of failing to comply with local and international legislative requirements has increased significantly. The UK Bribery Act (which also has effect outside the UK) came into effect in July 2011, with penalties for non-compliant businesses through the introduction of a corporate offence of failing to have adequate procedures in place to prevent bribery.
Impact
Failure by our employees, suppliers or agents to comply with anti-bribery and corruption legislation (including the US Foreign Corrupt Practices Act and the UK Bribery Act), or any failure in our policies and procedures to monitor and prevent non-compliance, anywhere in the world, could result in substantial penalties, criminal prosecution and significant damage to our reputation.
More broadly, failure to comply with legal requirements can have a significant impact and lead to reputational and brand damage with investors, regulators and customers. This could in turn impact our future revenue streams, the extent of which would be dependent on the nature of the breach, the legislation concerned and any associated penalties.
Risk mitigation
We have in place a number of established controls to address risk in this area. These include a comprehensive ethics programme, The Way We Work (our statement of business practice), and anti-corruption and bribery policies. We also have policies covering gifts and hospitality, charitable donations and sponsorship, and agents.
We have a training programme for staff with a focus on roles such as procurement and sales.
We operate a governance structure with five regional governance committees focusing on the implementation of the programme. These regional committees cover the US and Canada, Asia Pacific, Latin America, EMEA, and the UK and Republic of Ireland.
A regular risk assessment is undertaken to ensure that the appropriate mitigation is in place and is regularly refreshed. We
operate a confidential hotline where messages can be left in person, via voicemail or by anonymous email. We run regular checks on our business using Internal Audit teams as well as external providers. We review our business operations to ensure that our policies have been complied with.
Supply chain
We are dependent on our supply chain for the delivery of goods and services on time, to cost and to specification. Failure of any of our critical suppliers to meet agreed requirements could adversely impact our customer service, product launches, updates to business critical systems, revenue or cost reduction plans.
We are committed to ensuring that all dealings with suppliers, from selection and consultation to contracting and payment are conducted in accordance with our trading and ethical policies. SeeSuppliersinOur resourcessection on page 14.
Our supply chain is global and we aim to harness the capability, diversity and innovation of our supply market to add value to our business and customers. Many suppliers are being impacted by the economic downturn and the challenges of globalisation. This is introducing further risk in our supply chain which includes, but is not limited to: increase in supplier insolvency; lack of supplier resilience following a natural disaster; lack of compliance with anti corruption and bribery legislation; corporate social responsibility risks in our extended supply chain, and security risks relating to data protection.
Changes over the last year
Over the last year we have seen the impact of a number of natural disasters including the Japanese earthquake and floods in Thailand. Both, to some extent, have had an impact on the supply of components used in the manufacture of our products although the impact on us was minimised through robust supplier business continuity plans. The current global economic and credit market conditions, particularly in Europe, mean an increased risk of suppliers failing.
Impact
Our suppliers could be adversely affected by continuing uncertain economic conditions which in turn could impact their ability to meet their obligations to us or, in the extreme, cause them to fail. If we are unable to contract with an alternative supplier our customer commitments could also be compromised leading to contractual breach, loss of revenue, penalties or increased costs. A failure in our supply chain to meet legal obligations or ethical expectations could adversely impact our reputation or possibly lead to censure, legal action and financial loss.
Risk mitigation
We continue to mitigate risks in this area through a number of measures including: globally coordinated vendor management programmes; rigorous bid controls; supplier risk assessments including focus on our most critical suppliers; our Procurement Academy Programme; anti-corruption and bribery awareness training, and corporate responsibility and compliance health checks. We work with our suppliers to ensure that the goods and services that we buy are made, delivered and disposed of in a socially and environmentally responsible manner.
Our sourcing strategies consider a wide range of potential risks. Our plans are aimed at mitigating against, for example, the impact of potential natural disasters or the current global economic conditions on our suppliers. We thereby seek to minimise the risk of not being able to meet our customer and legal commitments or comply with our ethical policies. This helps to minimise our exposure to loss of revenue, financial penalty and any adverse impact on our brand and reputation.
| | |
| 18 British Telecommunications plc Annual Report & Form 20-F 2012 | | Report of the Directors – Strategy |
REPORT OF THE DIRECTORS
PERFORMANCE
In this section we discuss the operating and financial performance of our customer-facing lines of business and the financial performance of the group.
We measure performance of our customer-facing lines of business on an ‘adjusted’ basis, being revenue, EBITDA, operating profit and operating cash flow; all of which are before specific items which are not allocated to the customer-facing lines of business.
A definition of specific items is set out on page 28. Specific items for 2012, 2011 and 2010 are disclosed in note 9 to the consolidated financial statements. A reconciliation of adjusted EBITDA to group operating profit by the customer-facing lines of business, and for the group, is provided in Segment information, note 4 to the consolidated financial statements.
We explain our financial performance using measures that are not defined under IFRS and are therefore termed non-GAAP measures. The non-GAAP measures we use are underlying revenue excluding transit, adjusted and reported EBITDA and normalised, adjusted and reported free cash flow. Each of these measures is discussed in more detail on pages 28 to 29.
LINE OF BUSINESS PERFORMANCE
We have made progress during the year, both on an operational basis with some improved measures, and financially. However, the economic climate has been challenging.
BT Global Services
Operating performance
Investing for the future
We continued to invest in high-growth regions where our customers want to expand. The investments we announced last year in Asia Pacific are progressing well with new technology showcases in New Delhi and Shanghai, a new secure operations centre in Sydney, a range of product refreshes and launches, and the hiring of around 200 professionals across the region in the key customer markets of Australia, China, Hong Kong, India, Japan and Singapore. As a result our Asia Pacific order pipeline has grown and we are converting it into orders.
In October 2011 we announced a series of investments in Latin America. Through recruiting around 200 new staff, increasing our professional services capabilities, opening new centres of excellence and implementing a wide range of network and customer service improvements, we aim to better support global customers investing in Latin America and help large Latin American companies expand globally. In February 2012 we also announced a series of investments in Turkey, the Middle East and Africa. Global companies investing in the region, as well as local companies expanding further afield, will gain access to a broader portfolio of services and will be supported by around 150 additional highly qualified staff, including professional services specialists. Across these three regions revenue increased by 16% in 2012. We expect to increase our revenue by around £500m in these regions over the medium term.
Cost transformation
We have continued to improve the efficiency of our operations helping to deliver a 4% reduction in net operating costs. We achieved this through:
| | — | | increasing our use of shared service centres for contract delivery |
| | — | | working with our external suppliers to improve contract terms |
| | — | | rationalising our network assets and our operations |
| | — | | removing redundant third party circuits from our inventory |
| | — | | improving our billing operations and promoting e-billing |
| | — | | rationalising our property portfolio and associated infrastructure. |
Products and services
In September 2011 we introduced new names for the categories of our products and services to improve the way we sell to our customers. These new names make it easier for customers to understand our portfolio and for our sales community to sell it. They also help to differentiate us from competitors by making our products more recognisable. See page 5 for more details on our new products and services categories.
In December 2011 we announced the formation of BT Advise, which brings together the BT Global Services experts who deliver consulting, systems integration and managed services around the world under one team. Customers will benefit from engaging with a team made up of 4,500 highly skilled professionals who apply industry-leading processes and methodologies.
We have also invested in growth areas including MPLS, Ethernet, UCC, CRM, security, mobility and cloud services. We also continue to invest in industry-specific products and services such as our BT Unified Trading voice service which we launched in 12 global financial centres.
Contracts
Our investment to support our customers and improve our services has resulted in contract wins around the world with an order intake of £6.7bn in 2012, a reduction of 8% which is more than accounted for by the lower level of contract renewals in the year. We are seeing the benefits from our investments in Asia Pacific, Latin America, Turkey the Middle East and Africa where the combined order intake was up over 60% on last year.
Contracts signed in 2012 included:
| | — | | European Parliament: two framework contracts covering a wide range of networked IT services, including the supply of network equipment and applications |
| | — | | NATO: a contract with NATO’s Consultation, Command and Control Agency (NC3A), to provide a communications network connecting more than 70 locations spread across the NATO nations and the Balkans |
| | — | | Lancashire County Council: a contract to deliver ICT for the County Council and schools as well as the back-office services for human resources, payroll, the customer service centre and procurement |
| | — | | Anglo American: a global managed networked IT services contract covering all Anglo American’s networking requirements at several hundred locations around the world |
| | — | | Bristol-Myers Squibb: a contract extension for global network services including wide area and local area networks, as well as remote access, voice, and telephony infrastructure |
| | — | | The Brazilian Post Office and Telegraph Company (Correios): a contract to connect more than 7,000 sites, including corporate, regional and local offices all over the country |
| | — | | CLSA Asia Pacific Markets: a contract for a managed voice, data and trading systems solution across 14 countries in the Asia Pacific region, the UK and the US |
| | — | | Serco Australia: a contract to install and manage communications infrastructure and run a range of IT services for the new Fiona Stanley hospital in Western Australia. |
During 2012 we continued to execute on our largest customer contracts.
London 2012 Olympic and Paralympic Games
BT is delivering a single communications network across 94 locations (including 34 competition venues). Every official photograph and sports report and millions of calls, emails, texts and tweets will be carried over BT’s communications network. We are carrying all the broadcast pictures for every sporting moment outside the Olympic Park. BT is providing 80,000 connections,
| | |
| Report of the Directors – Performance | | British Telecommunications plc Annual Report & Form 20-F 2012 19 |
16,500 fixed telephone lines, 14,000 mobile SIM cards, 10,000 cable TV outlets, 5,500km of internal cabling and 1,800 wireless access points. The London 2012 Delivery Programme team has hit key milestones by successfully completing the installation of FTTP in the athletes’ village on schedule. This will serve 2,818 flats, providing the athletes and coaches staying here with free BT Infinity super-fast broadband throughout the Olympic and Paralympic Games. The London 2012 Delivery team has also finalised the design for the Games-time website ahead of schedule. This is expected to be visited by over a billion people during Games-time, with over 200 million unique visitors.
NHS contracts
2012 was our busiest year ever in the delivery of our large NHS contracts and communications services. We rolled out four additional electronic patient record systems to major hospitals in London and the South of England. Around 220,000 NHS staff now use our clinical information systems in more than 80 NHS organisations. We also doubled the capacity of the internet gateway for N3, the secure national broadband network we have built and manage for the NHS, providing faster internet access for healthcare staff. On the Spine, the secure database and messaging service BT has also developed, more than 30m ‘Choose and Book’ appointments have been made since the service was launched, with 39,000 being made on average each working day.
Customer service delivery
We focused our efforts on improving customer satisfaction across a wide range of metrics and made improvements in many areas. Through our ‘right first time’ programme we reduced customer faults by 5% and improved the way we handle calls from customers. We take feedback from our customers in many ways: through customer surveys; through our global account management teams, and through customer events where we discuss our strategy and their experience of working with us. That feedback helps us identify opportunities to improve overall customer satisfaction with our services.
| | | | | | | | |
| Financial performance | | | | | | |
| | | 2012 | | | | 2011a | |
Year ended 31 March | | | £m | | | | £m | |
| |
Revenue | | | 7,809 | | | | 8,059 | |
Underlying revenue excluding transit | | | (1% | ) | | | (4% | ) |
Net operating costs | | | 7,182 | | | | 7,466 | |
| |
EBITDA | | | 627 | | | | 593 | |
Depreciation and amortisation | | | 712 | | | | 734 | |
| |
Operating loss | | | (85 | ) | | | (141 | ) |
| |
Capital expenditure | | | 560 | | | | 498 | |
Operating cash flow | | | 183 | | | | 119 | |
| |
In 2012 underlying revenue excluding transit decreased by 1% partly reflecting the challenging environment in certain markets. Revenue decreased by 3% including a £168m decline in transit revenue, a £55m impact from disposals and a £21m favourable impact from foreign exchange movements.
Revenue from networked IT services decreased by 1% mainly due to the impact of disposals. Calls and lines revenue decreased by 9% reflecting the continued trend of customers migrating to alternative IP-based services, however the rate of decline has slowed. Transit revenue decreased by 27% largely due to the impact of mobile termination rate reductions in Europe.
Net operating costs decreased by 4% or by 1% excluding transit costs, disposals and foreign exchange movements. This reflects the continued progress from our cost saving initiatives as set out above.
EBITDA increased by 6%. Excluding disposals and foreign exchange movements EBITDA increased by 7% reflecting the impact of cost saving initiatives and improved operational performance. Depreciation and amortisation decreased by 3% as a result of lower overall capital expenditure over the prior two financial years. This contributed to an operating loss of £85m, an improvement compared with the loss of £141m in 2011.
Capital expenditure increased by 12% due to customer contract commitments, additional expenditure to support the delivery of new contracts in EMEA and Latin America, as well as continued network investment.
Operating cash was an inflow of £183m (2011: £119m inflow). This was slightly below our target of around £200m for the year.
BT Retail
Operating performance
BT Consumer
In response to changing customer demand and strong competition over the past year we have focused our marketing and retention activities predominantly on ‘dual play’ bundled offers of calls and broadband, and ‘triple play’ bundles of calls, broadband and TV. We have improved the flexibility of our bundles by introducing a wider range of options for voice calling plans, broadband speed and usage limits and TV content.
More than 60% of our retail broadband customer base now has a bundle of services, and around 98% of new broadband orders are for bundled products. The increasing popularity of bundles has contributed to increased consumer ARPU which was £343 in the fourth quarter of 2012 compared with £326 in the fourth quarter of 2011 as consumers take more products from us.
Active consumer line loss was down 30% on last year. This has been achieved through a combination of competitive bundled offers and effective marketing and retention campaigns. Year-on-year line churn has reduced with customers on bundles having lower churn than those with calls only. Growth in call packages with inclusive unlimited calls has slowed the decline in call minutes per line.
In the broadband market, we added 589,000 retail broadband customers in the year, representing 54% of the broadband net additions of 1,083,000 and taking our retail customer base to around 6.3m, up 10%.
Take-up of our super-fast broadband product, BT Infinity, has accelerated and we now have over 550,000 customers. In November 2011 we launched our fastest ever broadband service, a FTTP BT Infinity service which supports downstream speeds of up to 100Mbps. In April 2012 we launched FTTC BT Infinity with up to 80Mbps downstream and up to 20Mbps upstream.
Plusnet, our brand for cost-conscious customers, performed well during 2012 and made a good contribution to our broadband performance, representing around 15% of total retail net additions. Take-up of the Plusnet fibre broadband service, which we launched at the start of 2012, was also encouraging.
Our pay-TV service, BT Vision, had over 700,000 customers at 31 March 2012, up 23% over the prior year. We are seeing the benefit of improvements we have made to our service during the year. In July we launched a new BT Vision Essential package giving customers unlimited access to BBC iPlayer and seven-day catch-up TV and the flexibility to pay for all other on-demand content only when they view it. In June we launched BBC iPlayer nationally after trialling it in 2011, and this has significantly increased subscription
| | |
| 20 British Telecommunications plc Annual Report & Form 20-F 2012 | | Report of the Directors – Performance |
views of on-demand content. In February we selectively launched our next generation BT Vision service (Vision 2.0), which offers improved browsing and navigation capabilities, and has a sophisticated recommendations engine to make viewing suggestions to customers. In March 2012 BT Vision won the IP&TV Industry Award in the Best Service Growth Achievement category. This is awarded for significant growth in the number of subscribers to an IP-enabled TV service.
BT Business
Our calls and lines business was impacted by the continuing decline in the fixed telephony market. However, we slowed the rate of line losses in 2012 through improved marketing and retention activities, with net losses down 14%, the lowest for four years. Call volumes continued to decline, but call usage per customer has stabilised.
Broadband performed well, and in particular we saw an acceleration in sales of our BT Infinity FTTC product. We improved our bundles of voice, broadband and mobile, which positively impacted our broadband performance. In November 2011 we won the award from IT Magazine V3 for best business broadband internet service provider.
BT Ireland
Despite a challenging economy in 2012 we achieved some important contract wins and extensions. In Northern Ireland these included the Police Service of Northern Ireland, the Department of Finance and Personnel, and Randox Laboratories. In the Republic of Ireland wins included the Department of Social Protection and FBD Insurance.
In Northern Ireland, more than 750,000 premises have now been passed by FTTC resulting in coverage of 89%, which makes it one of the most fibre-connected regions anywhere in Europe. We saw a significant uplift in BT Infinity sales in Northern Ireland, as well as line loss reductions and a fall in broadband churn. Our fibre-based ‘Total Transmission’ network went live in the Republic of Ireland in October 2011 and we are progressively extending it to further sites. This network upgrade increases the capacity of our network, lowers the cost of bandwidth, brings our network closer to businesses and enhances our Ethernet and IP capabilities to offer new services.
BT Enterprises
Our BT Enterprises portfolio of businesses delivered a good overall performance, despite challenging market conditions and migration to new technologies. We achieved significant customer wins and introduced product enhancements to improve our competitive position.
In BT Conferencing we increased the volume of external audio conferencing minutes by around 20% in the year and had some significant wins including DHL, Syngenta, and a contract extension with the NHS. We launched BT Engage Meeting Mobile, an application for iPhone, iPad, and Android devices and enhanced our cloud-based video conferencing solution.
In BT Directories we increased our share of directory enquiry calls to 118500 following successful TV advertising campaigns. We also launched our new BT Marketing Solutions website which combines all of our online and print portfolio in one place.
In BT Expedite & Fresca we launched a hosted EPOS solution and delivered the industry’s first iPad-enabled POS system, winning ‘Technology Initiative of the Year’ for our client, Oasis Fashions. We had some significant wins including the renewal of a five-year e-commerce contract with Aurora Fashions and a contract with WH Smith to provide a self-checkout solution.
In BT Redcare we saw a large increase in sales of mobile SIM-based fire and intruder products following significant enhancements to these products incorporating mobile roaming and secure remote upload and download of software.
In BT Payphones we removed around 330 payphones as part of our programme to remove unprofitable payphones while still meeting our universal service obligations.
In BT Wi-fi we increased the volume of wi-fi minutes by 43% in the year. We won a contract with Hilton Hotels to provide wi-fi in 17,000 rooms, and other significant wins included Heineken Pubs and John Lewis.
Customer service delivery
In our consumer customer service organisation we have focused on making it easier for our customers to contact and get help from us. The percentage of customers rating interactions with us as extremely easy or very easy has grown by eight percentage points during the year for our voice channels. In March 2012 our BT Care team won the UK Customer Satisfaction Award from the Institute of Customer Service for best use of social media and communication strategy. Over 60% of our service interactions are now self-serve via our website and automated telephone systems. Calls to our call centres have fallen by 13% and complaints have fallen 16%.
We continue to keep track of our performance in key areas that are important to customers, such as our success at resolving queries in one contact. In 2012 we improved our performance on this measure for consumers by a further eight percentage points.
In our business customer service organisation we focused on ‘One Contact Resolution’ (OCR) aiming to resolve customers’ issues in just one contact. We have reduced repeat service calls overall by 12%, with the best improvement in our broadband technical helpdesk organisation, for which repeat calls were down 17%. OCR for repair of lines also improved by 14 percentage points in the year. Complaints have significantly reduced, and were down by 20%.
| | | | | | | | |
| Financial performance | | | | | | |
| | | 2012 | | | | 2011a | |
Year ended 31 March | | | £m | | | | £m | |
| |
Revenue | | | 7,393 | | | | 7,700 | |
Net operating costs | | | 5,563 | | | | 5,916 | |
| |
EBITDA | | | 1,830 | | | | 1,784 | |
Depreciation and amortisation | | | 410 | | | | 443 | |
| |
Operating profit | | | 1,420 | | | | 1,341 | |
| |
Capital expenditure | | | 434 | | | | 434 | |
Operating cash flow | | | 1,362 | | | | 1,382 | |
| |
In 2012 revenue decreased by 4% as increased consumer ARPU was offset by lower calls and lines revenue and lower IT hardware sales in BT Business.
BT Consumer revenue declined by 5%. The reduced rate of decline was due to growth in our broadband base, particularly BT Infinity, and in BT Vision, which contributed to the increase in consumer ARPU.
BT Business revenue declined by 5%, impacted by lower IT hardware sales reflecting market conditions and our decision during 2012 to move away from low-margin IT hardware trade sales. Business line loss was at its lowest level for four years.
BT Ireland revenue was broadly flat excluding the impact of foreign exchange movements, benefiting from a number of significant contract wins despite the challenging economic environment.
| | |
| Report of the Directors – Performance | | British Telecommunications plc Annual Report & Form 20-F 2012 21 |
BT Enterprises revenue increased by 1% excluding the impact of foreign exchange movements. BT Conferencing revenue increased due to growth in conferencing minutes and BT Expedite & Fresca increased sales to retailers. These increases were partially offset by revenue declines in BT Payphones, BT Redcare and BT Directories.
Net operating costs decreased by 6% reflecting our cost transformation initiatives.
EBITDA increased by 3% and with depreciation and amortisation decreasing by 7% due to the lower level of capital expenditure in recent years, operating profit increased by 6%.
Capital expenditure was flat and operating cash flow decreased by 1%.
BT Wholesale
Operating performance
Investing for the future
We now have more than 60 CPs taking our WBC fibre broadband service. Our MEAS service is now available at more than 13,000 mobile base station sites, an increase of around 3,800 in the year, reinforcing our market-leading position.
Since its launch in 2011 our global IP Exchange platform, continues to grow rapidly and now has over 200 CP customers. IP voice minutes have increased by around 80% in the year.
Cost transformation
Net operating costs reduced by 6% but increased by 3% excluding transit costs. Reductions in total labour costs and discretionary expenditure were offset by the impact of changes in the product mix and network migration costs.
Contracts
During 2012 we signed contracts with a total order value of around £750m. This was lower than 2011 partly due to several significant wins in that year and the lengthening of sales lead times for new contracts as customers delay making long-term strategic decisions.
Customer service delivery
A variety of initiatives to improve reliability led to a 15% reduction in faults being handled by us. During 2012 we increased our e-chat service and we now handle 85% of customer enquiries on-line. This reduces waiting time and improves handling times for our customers.
Financial performance
| | | | | | | | |
Year ended 31 March | |
| 2012
£m |
| |
| 2011a
£m |
|
| |
Revenue | | | 3,923 | | | | 4,201 | |
Underlying revenue excluding transit | | | (2% | ) | | | (3% | ) |
Net operating costs | | | 2,715 | | | | 2,885 | |
| |
EBITDA | | | 1,208 | | | | 1,316 | |
Depreciation and amortisation | | | 604 | | | | 619 | |
| |
Operating profit | | | 604 | | | | 697 | |
| |
Capital expenditure | | | 336 | | | | 329 | |
Operating cash flow | | | 800 | | | | 911 | |
| |
In 2012 underlying revenue excluding transit declined by 2% primarily due to the ongoing migration of broadband lines to LLU and the transition to IP-based services such as Ethernet and IP Exchange. These new IP-based services grew significantly in 2012 but not enough to offset the decline in our traditional services. Revenue declined by 7% mainly due to a £224m reduction in transit revenue driven by mobile termination rate reductions of £213m. The majority of our largest customers by revenue have signed long-term contracts. Revenue from MNS contracts continued to grow
and accounted for 27% of external revenue in 2012, up from 24% in 2011.
Net operating costs reduced by 6% but increased by 3% excluding transit costs, as detailed above.
EBITDA decreased by 8%. Depreciation and amortisation reduced by 2% and operating profit declined by 13%.
Capital expenditure increased by 2% principally due to better utilisation of our assets being offset by increased investment in our WBC and Ethernet roll-out.
Operating cash flow decreased by 12% largely due to the decline in EBITDA.
Openreach
Operating performance
The continued growth in demand for bandwidth by consumers and businesses led to higher sales volumes across our portfolio. This growth helped us to deliver a good financial performance, but also led to higher levels of faults in our copper network.
Investing for the future
We have achieved our target of passing 10m UK premises with our fibre roll-out many months ahead of schedule and we are on track for passing two-thirds of premises by the end of 2014. Adoption of fibre broadband has been promising – at 31 March 2012 we had more than 60 different providers trialling or offering fibre broadband. Given our early experience of customer adoption, we have hired a new mobile workforce of over 800 engineers (including many former Armed Forces personnel) to manage the spikes in demand that occur when fibre broadband is first made available in an exchange area.
Products and services
Our overall copper line base increased by 136,000 in the year and has now grown for six consecutive quarters, as customers recognise the advantage of fixed-line broadband. At 31 March 2012 we were providing 15.5m WLR lines to other BT lines of business and 6.3m to other CPs.
At 31 March 2012 around 93% of UK premises were served by an unbundled exchange and there were 16.8m unbundled lines in the UK, up 6.9% on the previous year. Of these, 8.5m were for other BT lines of business to support broadband services and 8.3m were for other CPs. More than 30 CPs are providing services using LLU and we are fulfilling more than 50,000 LLU orders a week.
Demand for our Ethernet services further increased in 2012, with the number of Ethernet circuits rising by 25%. This growth was driven both by higher demand for connections to CPs’ business customers, and by demand from CPs for higher speed connections within their own networks.
Cost transformation
Net operating costs increased by 1% as efficiency improvements were offset by higher labour costs due to additional engineering activity and leaver costs.
Customer service delivery
We have improved our delivery performance for new copper lines. We worked with industry to establish a target lead-time of 14 days, and were performing consistently better than this by the end of the year. The main disappointment in the year was the higher than expected level of copper network faults which was largely driven by the higher adoption and usage of broadband.
| | |
| 22 British Telecommunications plc Annual Report & Form 20-F 2012 | | Report of the Directors – Performance |
Financial performance
| | | | | | | | |
Year ended 31 March | |
| 2012
£m |
| |
| 2011a
£m |
|
| |
External revenue | | | 1,623 | | | | 1,504 | |
Internal revenue | | | 3,513 | | | | 3,426 | |
| |
Revenue | | | 5,136 | | | | 4,930 | |
Net operating costs | | | 2,837 | | | | 2,798 | |
| |
EBITDA | | | 2,299 | | | | 2,132 | |
Depreciation and amortisation | | | 939 | | | | 877 | |
| |
Operating profit | | | 1,360 | | | | 1,255 | |
| |
Capital expenditure | | | 1,075 | | | | 1,087 | |
Operating cash flow | | | 1,195 | | | | 1,078 | |
| |
In 2012 revenue increased by 4% reflecting growth in Ethernet, LLU and fibre revenue.
External revenue increased by 8% largely due to growth in LLU and Ethernet revenue. Internal revenue increased by 3% driven by increased revenue from our Ethernet and fibre portfolio.
Net operating costs increased by 1% as detailed above.
EBITDA increased by 8% as revenue growth more than offset the higher operating costs. Depreciation and amortisation increased by 7% reflecting the investment in our fibre roll-out and Ethernet over the last year. Operating profit increased by 8%.
The accelerated investment in our fibre roll-out programme was offset by lower spend on DSL and improved efficiency in asset utilisation and phasing, resulting in capital expenditure reducing by 1%.
Operating cash flow increased by 11% primarily due to the higher EBITDA and lower capital expenditure.
OUR RESPONSIBLE AND SUSTAINABLE BUSINESS PERFORMANCE
We have made progress this year in our aim of being a responsible and sustainable business leader. We set out below our performance in the year against our seven CR KPIs.
Customer service delivery KPI
When customers do need to contact us with a query or to report a problem with their service, we aim to meet their needs through one call with our ‘right first time’ programme. We measure our success through our customer service improvement KPI.
For details of our customer service delivery see page 9.
Climate stabilising intensity KPI
We measure performance on climate change with our Climate Stabilising Intensity KPI. Our target is to reduce by December 2020 the CO2 equivalent emissions (CO2e) intensity of the BT Group by 80%, compared with 1997. In 2012 we achieved a 60% cumulative reduction in our carbon emissions intensity per unit of value added compared with 1997.
Community investment KPI
We are committed to investing in the communities that we live and work in and our people are encouraged to participate in their local communities. We run a formal volunteering programme to help them do this. In 2012 11% of our people volunteered some 50,000 volunteer days with an estimated value of £15.6m to our communities. Overall we invested £31.9m in 2012, which at 1.5% was well above our target of a minimum investment of 1% of the prior year’s adjusted profit before taxation. In 2012 the calculation methodology was changed in order to create a stronger link to current performance. In 2011 and 2010 the calculation was based on adjusted profit before taxation from two years previously.
Supply chain human rights KPI
We have achieved our ethical trading (Supply Chain Human Rights) KPI target to achieve 100% follow-up within three months for all suppliers identified as high or medium risk through our ethical standard questionnaires.
Ethical performance index KPI
We have met our target to maintain or improve on our 2011 ethical performance index score of 4.16 based on a five point scale of the success of BT’s employee awareness and training as measured through our employee surveys. We achieved 4.19 in 2012.
Employee engagement KPI
We measure our success in this area through our Employee Engagement Index KPI measured on a five point scale. In 2012 we improved our score to 3.68 (2011: 3.61).
Sickness absence rate KPI
We measure our success of health and safety through our sickness absence rate (SAR) KPI which is the percentage of calendar days lost to sickness absence expressed as a 12-month rolling average.
In 2012 we achieved 2.16% (2011: 2.46%), beating our target to reduce our SAR to 2.21%. This saw a corresponding reduction in our sick pay costs to £80.0m (2011: £90.1m).
GROUP FINANCIAL PERFORMANCE
Income statement
| | | | | | | | |
Year ended 31 March Before specific items | |
| 2012
£m |
| |
| 2011
£m |
|
Revenue | | | 19,307 | | | | 20,076 | |
Other operating income | | | 387 | | | | 373 | |
Operating costsa | | | (13,626 | ) | | | (14,568 | ) |
EBITDA | | | 6,068 | | | | 5,881 | |
Depreciation and amortisation | | | (2,972 | ) | | | (2,979 | ) |
Operating profit | | | 3,096 | | | | 2,902 | |
Net finance expense | | | (391 | ) | | | (598 | ) |
Associates and joint ventures | | | 10 | | | | 21 | |
Profit before taxation | | | 2,715 | | | | 2,325 | |
Taxation | | | (660 | ) | | | (520 | ) |
Profit for the year | | | 2,055 | | | | 1,805 | |
| a | Excluding depreciation and amortisation. |
Revenue
Underlying revenue excluding transit was down 1.9%, within our target range, reflecting lower revenue from calls and lines and the challenging environment in certain markets.
Adjusted revenue was 4% lower at £19,307m with transit revenue down by £392m (including mobile termination rate reductions of £286m), favourable foreign exchange movements of £22m and a £55m impact from our disposal of Accel Frontline Limited in August 2011. We expect a further decline in transit revenue of around £200m–£300m in 2013. In addition there were a number of regulatory rulings issued in 2012 that are expected to have a negative impact of around £100m–£200m on group revenue in 2013 and a similar year-on-year impact in 2014.
The decrease in adjusted revenue was principally due to a 9% reduction in calls and lines revenue and a 26% reduction in transit revenue. The continuing decline in calls and lines revenue reflects the challenging market conditions and the migration from fixed-line calls to broadband, data and IP services. The decrease in transit revenue was primarily due to the impact of regulatory mobile termination rate reductions and the continued decline in transit volumes. The declines in calls and lines and transit revenue were offset by broadband and convergence revenue which increased by 7%. This was driven by growth in our broadband base, particularly BT Infinity, and in BT Vision and from our Ethernet portfolio.
| | |
| Report of the Directors – Performance | | British Telecommunications plc Annual Report & Form 20-F 2012 23 |
An analysis of our revenue by major product and service category is provided in note 4 to the consolidated financial statements.
Operating costs
The progress we have made in our cost transformation programmes has contributed operating cost reductions of £942m, or 6%, in 2012 and £2.9bn over the last three years.
Underlying operating costs were down 6%. For further details of our cost transformation activities in 2012, see page 9.
Around a third of our cost base is labour costs, both direct and indirect. Net labour costs of £4,805m including leaver costs of £97m were broadly flat in 2012 or decreased by 2% excluding leaver costs and £87m of certain labour-related costs which were classified as other costs in 2011. The decline reflects lower indirect labour costs as we have sought to bring work resourced externally back into BT. In addition, efficiency improvements and re-engineering our end-to-end processes have resulted in direct labour cost reductions which have more than offset the impact of pay inflation. Leaver costs increased by £40m in 2012 mainly because of higher participation in Openreach leaver schemes.
Payments to telecommunications operators (POLOs) were down 16%, reflecting lower mobile termination rates and reduced transit and wholesale call volumes. Property and energy costs were down 7%. Network operating and IT costs were down 11% as we rationalise our networks and systems. Other operating costs decreased by 3%.
A detailed breakdown of our operating costs is provided in note 6 to the consolidated financial statements.
EBITDA
Adjusted EBITDA increased by 3% to £6.1bn in 2012. This reflects the benefits from our cost transformation activities. An analysis of EBITDA by line of business is provided in note 4 to the consolidated financial statements.
Depreciation and amortisation
Depreciation and amortisation was flat at £2,972m reflecting the lower levels of capital expenditure over the last three years offset by higher depreciation and amortisation on shorter lived assets.
Net finance expense
Net finance expense reduced by £207m in 2012 as we repaid higher coupon debt in the second half of 2011.
| | | | | | | | |
Year ended 31 March | |
| 2012
£m |
| |
| 2011
£m |
|
| |
Interest on borrowings | | | 672 | | | | 853 | |
Capitalised interest | | | (9 | ) | | | (6 | ) |
Fair value movements on derivatives | | | 29 | | | | 34 | |
| |
Total finance expense | | | 692 | | | | 881 | |
Total finance income | | | (301 | ) | | | (283 | ) |
| |
Net finance expense | | | 391 | | | | 598 | |
| |
In 2012 interest on borrowings decreased by 21% reflecting a reduction in average debt outstanding and the repayment of higher coupon debt in the second half of 2011. Fair value movements on derivatives included £16m (2011: £28m) of swap restructuring costs on certain derivatives and £13m (2011: £6m) of fair value movements on derivatives not in a designated hedge relationship. In 2012 finance income increased by £18m, this was mainly due to higher average balances due from ultimate parent and parent
companies. In 2011 finance income included £19m of interest in respect of a tax refund.
Net pension interest is classified as a specific item and discussed in note 19 to the consolidated financial statements.
Dividends
The directors have declared a final dividend of £1,400m.
Free cash flow
Adjusted free cash flow was £2.5bn. This reflects our improved profitability and is also after investing around £2.6bn in capital expenditure. Our strong financial performance has allowed us to make a £2.0bn lump sum payment into the pension scheme.
We monitor performance using adjusted free cash flow which is one of our two key performance indicators. Adjusted free cash flow is an important measure by which our financial performance is measured as it represents the cash we generate from operations after capital expenditure and financing costs. It also excludes the cash impact of specific items and pension deficit payments. This is consistent with the way financial performance is measured by management and assists in providing a meaningful analysis of the free cash flow generated by the group.
We are now also measuring our free cash flow on a normalised basis which removes the impact of the cash tax benefit relating to pension deficit payments and therefore gives a better view of the underlying cash generation and trends within the business.
A reconciliation from net cash inflow from operating activities, the most directly comparable IFRS measure, to adjusted free cash flow and normalised free cash flow is provided on page 29.
The major sources of our cash inflow for 2012 and 2011 were the cash generated from our operations and borrowings through short-term commercial paper issuance and long-term debt raised in the capital markets. These, as well as committed bank facilities of £1.5bn, are expected to remain the key sources of liquidity for the foreseeable future.
Summarised cash flow statement
| | | | | | | | |
Year ended 31 March | |
| 2012
£m |
| |
| 2011
£m |
|
| |
EBITDA | | | 6,068 | | | | 5,881 | |
Capital expenditure | | | (2,560 | ) | | | (2,630 | ) |
Interest | | | (566 | ) | | | (839 | ) |
Taxation | | | (400 | ) | | | (209 | ) |
Working capital | | | (5 | ) | | | (12 | ) |
Outflow on non-current amounts owed by parent company | | | (119 | ) | | | (105 | ) |
Other non-cash movements & non-current liabilities | | | 106 | | | | 141 | |
| |
Adjusted free cash flow | | | 2,524 | | | | 2,227 | |
Tax benefit of pension deficit payments | | | (215 | ) | | | (147 | ) |
| |
Normalised free cash flow | | | 2,309 | | | | 2,080 | |
Add back tax benefit of pension deficit payments | | | 215 | | | | 147 | |
Pension deficit payments | | | (2,000 | ) | | | (1,030 | ) |
Specific items | | | (204 | ) | | | (212 | ) |
Disposals and acquisitions | | | 15 | | | | 64 | |
Net (purchase) sale of current financial assets | | | (516 | ) | | | 365 | |
Net proceeds (repayment) of borrowings | | | 173 | | | | (2,516 | ) |
Foreign exchange | | | (2 | ) | | | (3 | ) |
| |
Net decrease in cash and cash equivalents | | | (10 | ) | | | (1,105 | ) |
Cash and cash equivalents at the start of the year | | | 328 | | | | 1,433 | |
| |
Cash and cash equivalents at the end of the year | | | 318 | | | | 328 | |
| |
| | |
| 24 British Telecommunications plc Annual Report & Form 20-F 2012 | | Report of the Directors – Performance |
In 2012 adjusted free cash flow increased by £297m. The main drivers were the higher EBITDA which increased by £187m; lower capital expenditure which decreased by £70m, partly reflecting the timing of supplier payments in the fourth quarter; and lower net interest payments which decreased by £273m as a result of lower average gross debt. This was offset by higher tax payments, which increased by £191m reflecting higher profits in the year. Working capital improved by £7m.
As described on page 24, as the tax credit in relation to the £2.0bn lump sum pension deficit payment will distort our cash flow in 2013, we are now measuring our free cash flow excluding the tax benefit of pension deficit payments. Excluding the £215m (2011: £147m) cash tax benefit associated with pension deficit payments, free cash flow on a normalised basis was £2,309m in 2012 (2011: £2,080m). The cash tax benefit of pension deficit payments is expected to be around £560m in 2013. Other non-cash movements and non-current liabilities reduced by £35m.
The net cash outflow from specific items of £204m in 2012 and £212m in 2011 principally comprised BT Global Services restructuring charges of £120m (2011: £165m) and property rationalisation costs of £68m (2011: £47m). In 2013, we expect a cash outflow of around £100m relating to the BT Global Services rationalisation and the cash payments associated with the property rationalisation programme. There are ongoing regulatory disputes and appeals in relation to prior periods. If any of these result in a significant cash payment or receipt, in accordance with our policy, they would be treated as a specific item.
Pension deficit payments are explained on page 27.
Disposal proceeds of £15m in 2012 principally comprised the sale of our 51% interest in Accel Frontline Limited. In 2011 the disposal proceeds of £64m principally related to the sale of a 6.5% interest in our associate Tech Mahindra.
Capital management and funding policy
The capital structure is managed by BT Group plc, the ultimate holding company of the group.
The objective of BT Group plc’s capital management policy is to reduce debt over time while investing in the business, supporting the pension scheme and paying progressive dividends.
In order to meet this objective BT Group plc may issue or repay debt, issue new shares, repurchase shares or adjust the amount of dividends paid to its shareholders. BT Group plc manages the capital structure and makes adjustments to it in the light of changes in economic conditions and the risk characteristics of the group. The BT Group plc Board regularly reviews the capital structure. No changes were made to the BT Group plc objectives and processes during 2012 and 2011. BT Group plc continues a policy of reducing its net debt and is targeting a BBB+ credit rating over the medium-term.
The general funding policy is to raise and invest funds centrally to meet anticipated requirements using a combination of capital market bond issuance, commercial paper borrowing, committed borrowing facilities and investments. These financial instruments vary in their maturity in order to meet short, medium and long-term requirements.
Credit exposures are continually reviewed and proactive steps are taken to ensure that the impact of adverse market conditions on these financial assets is minimised. In particular, line of business management actively reviews exposures arising from trading balances and, in managing investments and derivative financial instruments, the treasury operation monitors the credit quality across treasury counterparties and is actively managing exposures which arise.
Details of our treasury management policies are included in note 25 to the consolidated financial statements.
Loans and other borrowings
At 31 March 2012 loans and other borrowings were £10,486m compared with £9,888m at 31 March 2011, an increase of £598m. This increase principally reflects the increase in outstanding issued commercial paper of £517m, an increase of £81m relating to the fair value adjustment to our debt designated as the hedged item in a fair value hedge and an increase in the cash collateral received in respect of financial assets with certain derivative counterparties of £201m. This has been offset by a reduction in the carrying value of our Euro denominated debt of £190m due to the 6% weakening of Euro against Sterling in the year.
£1.7bn of our long-term debt falls due for repayment in 2013. In addition, debt due within one year totalling £2.9bn at 31 March 2012 comprises commercial paper of £0.6bn, other loans of £0.3bn and accrued interest of £0.3bn. We have a £1.5bn committed borrowing facility which is available until March 2016, none of which has been drawn down at 31 March 2012.
A detailed breakdown of our loans and borrowings is provided in note 23 to the consolidated financial statements.
Taxation
The effective tax rate was 24.3% in 2012 compared with 22.4% in 2011. This is slightly lower than the UK statutory rate of 26% (2011: 28%) reflecting the utilisation of tax losses.
We are a significant contributor to the UK Exchequer, collecting and paying taxes of around £3bn in a typical year.
Total tax contribution
In 2012 our total tax contribution to the UK Exchequer was £3.3bn (2011: £2.9bn). In 2012 we collected and paid £1,579m of VAT, £1,133 of PAYE and National Insurance, £353m of UK corporation tax and £189m of UK business and network rates. This ranked BT Group plc the fifth highest contributor as measured in the Hundred Group Total Tax Contribution Survey for 2011.
Tax strategy
Our strategy is to comply with relevant regulations whilst managing our tax burden and seeking to maintain a stable effective tax rate. We seek to achieve this through engagement with our stakeholders including HM Revenue & Customs (HMRC) and other tax authorities, partners and customers. We endeavour to structure our affairs in a tax efficient manner where there is strong commercial merit, with the aim of supporting our capital or operational expenditure programmes, supporting customer initiatives and reducing our overall cost of capital. The parameters which govern our approach are set by the BT Group plc Board, which regularly reviews the group’s tax strategy.
We operate in over 170 countries and this comes with additional complexities in the taxation arena. The majority of our tax liabilities arise in the UK. In terms of our UK corporation tax position, all years up to 2008 are agreed. We have an open, honest and positive working relationship with HMRC and are committed to prompt disclosure and transparency in all tax matters. We recognise that there will be areas of differing legal interpretations between ourselves and tax authorities and where this occurs we will engage in proactive discussion to bring matters to as rapid a conclusion as possible.
| | |
| Report of the Directors – Performance | | British Telecommunications plc Annual Report & Form 20-F 2012 25 |
Tax expense
Our effective tax rate on profit before taxation and specific items is lower than the UK statutory rate as the utilisation of overseas losses and the impact of prior period adjustments is in excess of normal disallowable costs and other tax adjustments as shown below.
| | | | | | | | |
Year ended 31 March | |
| 2012
£m |
| |
| 2011
£m |
|
Profit before taxation and specific items | | | 2,715 | | | | 2,325 | |
Tax at UK statutory rate of 26% (2011: 28%) | | | 706 | | | | 651 | |
Overseas losses utilised | | | (75) | | | | (53) | |
Prior period adjustments | | | (74) | | | | (36) | |
Non-deductible items | | | 37 | | | | 28 | |
Other tax adjustments | | | 66 | | | | (70) | |
Effective tax charge before specific items | | | 660 | | | | 520 | |
Effective tax rate | | | 24.3% | | | | 22.4% | |
A reconciliation of reported profit before taxation to effective rate is disclosed in note 10 to the consolidated financial statements.
The UK corporation tax rate changed from 28% to 26% on
1 April 2011 and from 26% to 24% on 1 April 2012. The Government has indicated that it intends to enact future reductions in the UK corporation tax rate to 22% by 1 April 2014. For 2013 we expect the effective tax rate to be around 23% reflecting the lower UK statutory rate and the utilisation of tax losses.
Tax cash payments
The total income tax paid of £400m in 2012 comprised £353m of UK taxes (2011: £175m) and £47m of overseas taxes (2011: £34m). The total tax expense in 2012 was £518m (2011: £281m expense).
The tax expense and the cash tax paid in each financial year are different, principally because UK cash tax payments are paid in quarterly instalments which straddle two consecutive financial years. For example, the UK cash tax paid in 2012 of £353m comprised the final two quarterly instalments in respect of 2011 amounting to £44m and the first two quarterly instalments in respect of 2012 amounting to £309m. The quarterly instalments are based on estimates of the expected tax liability for the full year and are therefore subject to estimation and may vary from the actual liability.
In addition there are differences in the basis of some items, such as pension deficit payments, which are deductible for the purpose of cash tax payments but are not a taxable deduction in the income statement and therefore do not impact the tax expense. The current tax benefit associated with pension deficit payments is recognised in retained earnings, within other comprehensive income. Following the £2.0bn pension deficit payment in March 2012, the tax liability relating to 2012 was recalculated. Tax instalments previously paid of around £250m are expected to be recovered in 2013.
Tax losses
We have unrecognised tax losses of £21.8bn (2011: £23.5bn) of which £17.2bn are capital losses arising in the UK, as set out in note 10 to the consolidated financial statements. The majority of the remaining losses of £4.0bn arose in our overseas entities in prior periods. Our ability, and the timeframe in which we can use these losses to offset against future taxable profits, is determined by the locations of the subsidiaries in which the losses arise.
Capital expenditure
Our capital expenditure totalled £2,594m in 2012 (2011: £2,590m), in line with our target, and after the accelerated investment in our fibre roll-out that we announced during the year.
Our capital expenditure in 2012 reflects our continuing strategy to improve customer service delivery and invest for the future of the business. In 2012 our capital expenditure comprised investment in:
| | — | | increasing the footprint of our fibre broadband network |
| | — | | extending our WBC coverage |
| | — | | providing additional Ethernet ports to support our fixed and mobile Ethernet portfolio |
| | — | | our UK and overseas network infrastructure, including Asia Pacific, Latin America and MEA expansion |
| | — | | new and existing customer contracts in BT Global Services and BT Wholesale |
| | — | | volume driven capital to support Openreach products and services. |
Of the capital expenditure, £235m (2011: £227m) arose outside of the UK. Capital expenditure contracted but not yet incurred totalled £433m (2011: £467m) at 31 March 2012.
We expect capital expenditure to remain at around £2.6bn in 2013.
Balance sheet
Summarised balance sheet
| | | | | | | | |
At 31 March | |
| 2012
£m |
| |
| 2011
£m |
|
| |
Property, plant & equipment and software | | | 16,023 | | | | 16,446 | |
Goodwill & other acquisition related intangible assets | | | 1,500 | | | | 1,574 | |
Other non-current & current assets | | | 20,987 | | | | 19,120 | |
Trade & other receivables | | | 3,479 | | | | 3,650 | |
Investments, cash & cash equivalents | | | 1,490 | | | | 1,592 | |
Loans & other borrowings | | | (10,486) | | | | (9,888) | |
Trade & other payables | | | (6,015) | | | | (6,188) | |
Other current & non-current liabilities | | | (1,787) | | | | (1,621) | |
Provisions | | | (857) | | | | (956) | |
Deferred tax liability | | | (1,100) | | | | (1,212) | |
Pensions, net of deferred tax | | | (1,873) | | | | (1,370) | |
| |
Total equity | | | 21,361 | | | | 21,147 | |
| |
Property, plant and equipment and software reduced by £423m in 2012 reflecting the higher depreciation expense of £2,972m compared with capital expenditure of £2,594m. Goodwill and other acquisition-related intangibles reduced by £74m, due to amortisation, exchange differences and disposals. There were no acquisitions in 2012.
Other non-current and current assets increased by £1,867m principally reflecting an increase in the amounts owed by the parent and ultimate parent companies. Trade and other receivables and trade and other payables reduced by £171m and £173m, respectively, principally reflecting lower revenue and costs.
Investments, cash and cash equivalents decreased by £102m and loans and other borrowings increased by £598m as detailed on page 25. Other non-current and current liabilities increased by £166m principally due to an increase in derivative financial instrument liabilities as detailed on page 84. Provisions reduced by £99m principally due to the utilisation of provisions in the year. Pensions, net of deferred tax increased by £503m as explained inPensionsbelow.
Pensions
Our strong financial performance over the last three years has allowed us to make a £2.0bn lump sum pension deficit payment, half the funding deficit at 30 June 2011.
| | |
| 26 British Telecommunications plc Annual Report & Form 20-F 2012 | | Report of the Directors – Performance |
Overview
We provide retirement plans for employees. The largest of these plans is the BT Pension Scheme (BTPS), a defined benefit plan in the UK. Although closed to new members, the BTPS still has around 46,500 contributing members, 194,500 pensioners and 84,000 deferred members.
The BT Retirement Saving Scheme (BTRSS) is the current arrangement for UK employees who joined the group after 1 April 2001 and has around 18,500 active members. The BTPS and BTRSS are not controlled by the Board. The BTPS is managed by a separate and independent corporate trustee. The BTRSS is a contract-based, defined contribution arrangement provided by Standard Life under which members choose their own investments and receive benefits at retirement that are linked to the performance of those investments.
We maintain similar arrangements in most other countries with a focus on these being appropriate within the local market and culture.
More information on our pension arrangements, funding and accounting valuations is provided in note 19 to the consolidated financial statements. The funding of the BTPS is also discussed further underOur riskson pages 16 and 17.
BTPS funding valuation and future funding obligations
The funding of our main defined benefit pension plan, the BTPS, is subject to legal agreement between BT and the Trustee of the BTPS which is determined at the conclusion of each triennial funding valuation. The triennial funding valuation at 30 June 2011 was agreed with the BTPS Trustee and certified by the Scheme Actuary in May 2012 together with the associated recovery plan. The final funding deficit at 30 June 2011 was £3.9bn.
The market value of the assets was £36.9bn and the prudent valuation of the liabilities on an actuarial funding basis was £40.8bn. If the valuation had used a ‘median estimate’ approach, BT estimates that the scheme had a surplus of £2.5bn at 30 June 2011. This approach reflects how investments might on average be expected to perform over time and use of other assumptions with no margins for prudence.
The 2011 valuation has been carried out at 30 June 2011 rather than 31 December 2011, the latest allowable date, to enable the valuation to be largely completed and a lump sum deficit payment of £2.0bn to be made before 31 March 2012. Future valuations will take place at 30 June enabling valuations and associated payment schedules to be completed within BT’s financial year.
Under the recovery plan, the £2.0bn lump sum paid in March 2012 will be followed by deficit payments of £325m in March 2013 and 2014 followed by seven annual payments of £295m through to March 2021. The £2.0bn lump sum deficit payment was funded by existing cash resources of £1.5bn, supplemented by commercial paper borrowings of £0.5bn.
Under the 2008 funding agreement, annual deficit payments were payable under a 17-year recovery plan. The first three deficit payments, totalling £1,555m were made in December 2009, December 2010 and March 2011. The payment due in December 2012 would have been £583m with future payments increasing at 3% per year until 2025.
IAS 19 accounting position
The IAS 19 accounting deficit has increased from £1.8bn to £2.4bn since 31 March 2011 and a summary of movements is set out below:
| | | | | | | | | | | | | | |
| | |
| Assets
£bn |
| |
| Liabilities
£bn |
| | | |
| Deficit
£bn |
|
At 1 April 2011 | | | 37.2 | | | | (39.0) | | | | | | (1.8) | |
Income statement: | | | | | | | | | | | | | | |
Current service cost | | | – | | | | (0.3) | | | | | | (0.3) | |
Specific items: | | | | | | | | | | | | | | |
Interest expense on plan liabilities | | | – | | | | (2.1) | | | | | | (2.1) | |
Expected return on plan assets | | | 2.3 | | | | – | | | | | | 2.3 | |
Comprehensive income: | | | | | | | | | | | | | | |
Actuarial losses on plan assets | | | (1.1) | | | | – | | | | | | (1.1) | |
Actuarial losses on plan liabilities | | | – | | | | (1.6) | | | | | | (1.6) | |
Cash: | | | | | | | | | | | | | | |
Regular contributions | | | 0.2 | | | | – | | | | | | 0.2 | |
Deficit payment | | | 2.0 | | | | – | | | | | | 2.0 | |
Benefit payments | | | (2.1) | | | | 2.1 | | | | | | – | |
At 31 March 2012 | | | 38.5 | | | | (40.9) | | | | | | (2.4) | |
Deferred tax asset | | | | | | | | | | | | | 0.5 | |
At 31 March 2012 net of deferred tax | | | | | | | | | | | | | (1.9) | |
Actuarial losses on plan assets reflect actual investment returns being lower than the assumed investment performance.
Actuarial losses on plan liabilities have arisen primarily as a result of a lower discount rate, driven by low real corporate bond yields partly reflecting the impact of quantitative easing, and actual inflation experience being higher than the long-term assumptions.
The International Accounting Standards Board has published amendments to IAS 19 which will be mandatory in 2014. Details of these amendments and the impact on 2012 are set out on page 46 of the consolidated financial statements.
Other information
Contractual obligations and commitments
A summary of our principal contractual financial obligations and commitments at 31 March 2012 is shown below. Further details on the items can be found in the notes to the consolidated financial statements. Details of our capital commitments and contingent liabilities are included in note 29 to the consolidated financial statements.
| | | | | | | | | | | | | | | | | | | | |
| | | | | | | Payments due by period | |
| | | | | | | | |
£m | | | Total | | |
| Less than
1 year |
| |
| Between
1 and
3 years |
| |
| Between
3 and
5 years |
| |
| More than
5 years |
|
| |
Loans and other borrowingsa | | | 10,123 | | | | 2,872 | b | | | 1,127 | | | | 1,520 | | | | 4,604 | |
Finance lease obligations | | | 285 | | | | 15 | | | | 15 | | | | 19 | | | | 236 | |
Operating lease obligations | | | 7,593 | | | | 429 | | | | 781 | | | | 723 | | | | 5,660 | |
Capital commitments | | | 433 | | | | 419 | | | | 14 | | | | – | | | | – | |
Pension deficit obligations | | | 2,715 | | | | 325 | | | | 620 | | | | 590 | | | | 1,180 | |
| |
Total | | | 21,149 | | | | 4,060 | | | | 2,557 | | | | 2,852 | | | | 11,680 | |
| |
| a | Excludes fair value adjustments for hedged risks. |
| b | Includes £262m of accrued interest within less than one year. |
At 31 March 2012 we had cash, cash equivalents and current asset investments of £1,490m. We also have an unused committed borrowing facility amounting to £1.5bn. These resources allow us to settle our obligations as they fall due.
Off-balance sheet arrangements
As disclosed in the consolidated financial statements, there are no off-balance sheet arrangements that have or are reasonably likely to have a current or future material effect on our financial condition, changes in financial condition, revenues or expenses, results of operations, liquidity, capital expenditure or capital resources, with the exception of financial commitments and contingent liabilities disclosed in note 29 to the consolidated financial statements.
| | |
| Report of the Directors – Performance | | British Telecommunications plc Annual Report & Form 20-F 2012 27 |
Legal proceedings
We do not believe that there is any single current court action that would have a material adverse effect on our financial position or operations. During 2012 the aggregate volume and value of legal actions to which we are party remained broadly the same as at the end of 2011.
Going concern
The sections onBusiness, StrategyandPerformanceon pages 2 to 29 include information on the group structure, the performance of each of the lines of business, the impact of regulation and competition and principal risks and uncertainties. The Performance section on pages 19 to 29 includes information on our financial results, financial outlook, cash flow, loans and borrowings and balance sheet position. Notes 21, 22, 23 and 25 of the consolidated financial statements include information on the group’s investments, cash and cash equivalents, borrowings, derivatives, financial risk management objectives, hedging policies and exposures to interest, foreign exchange, credit, liquidity and market risks.
Alongside the factors noted above, the directors have considered BT Group plc’s cash flow forecasts, in particular with reference to the period to the end of May 2013. The directors are satisfied that this cash flow forecast, taking into account reasonably possible risk sensitivities associated with this forecast and BT Group plc’s current funding and facilities, alongside BT Group plc’s funding strategy, shows that the group will continue to operate for the foreseeable future. The directors therefore continue to have a reasonable expectation that the group has adequate resources to continue in operational existence for the foreseeable future and continue to adopt a going concern basis (in accordance with the guidance ‘Going Concern and Liquidity Risk: Guidance for Directors of UK Companies 2009’ issued by the Financial Reporting Council) in preparing the consolidated financial statements.
There has been no significant change in the financial or trading position of the group since 31 March 2012.
OUTLOOK
Our objective remains to drive profitable revenue growth. While economic and regulatory headwinds will make revenue growth in 2013 more challenging than originally envisaged, we expect underlying revenue excluding transit to show an improving trend in 2013 and 2014. We expect a decline of around £200m–£300m in transit revenue in 2013.
We expect to make further progress in transforming our cost base which will drive growth in adjusted EBITDA in 2013 and 2014.
We expect BT Global Services to deliver solid EBITDA growth in 2013 as we intensify our efforts to improve the efficiency of its operations and reduce its cost base.
ALTERNATIVE PERFORMANCE MEASURES
Introduction
We assess the performance of the group using a variety of alternative performance measures. We principally discuss the group’s results on an ‘adjusted’ basis. The rationale for using adjusted measures is explained below. Results on an adjusted basis are presented before specific items.
We also explain financial performance using measures that are not defined under IFRS and are therefore termed ‘non-GAAP’ measures. The non-GAAP measures we use are underlying revenue, reported and adjusted EBITDA and reported, adjusted and normalised free cash flow. A reconciliation from these non-GAAP
measures to the nearest measure prepared in accordance with IFRS is presented below. The alternative performance measures we use may not be directly comparable to similarly titled measures used by other companies.
Specific items
The group’s income statement and segmental analysis separately identify trading results before specific items. Specific items are those that in management’s judgment need to be disclosed by virtue of their size, nature or incidence. In determining whether an event or transaction is specific, management considers quantitative as well as qualitative factors such as the frequency or predictability of occurrence. This is consistent with the way that financial performance is measured by management and reported to the BT Group plc Board and the Operating Committee and assists in providing a meaningful analysis of the trading results of the group. The directors believe that presentation of the group’s results in this way is relevant to an understanding of the group’s financial performance as specific items are identified by virtue of their size, nature or incidence. Items which have been considered to be specific items by virtue of their size, nature or incidence include disposals of businesses and investments, regulatory settlements, business restructuring programmes, asset impairment charges, property rationalisation programmes, net interest on pensions and the settlement of multiple tax years in a single payment. In 2009 BT Global Services contract and financial review charges were disclosed as a specific item by virtue of their size and nature. The impact of subsequent changes to the contract and financial review charges from revisions in estimates and assumptions are included within trading results before specific items, and are separately disclosed if considered significant.
Specific items are summarised below and disclosed in note 9 to the consolidated financial statements.
Revenue and other operating income
In 2012 following a retrospective regulatory ruling in Germany, a one-off charge of £410m was recognised against revenue with an equal reduction in operating costs. In 2012 a loss on disposal of £19m arose on the disposal of a subsidiary undertaking.
Operating costs
Specific operating costs comprised BT Global Services restructuring costs of £64m in 2012 (2011: £192m). In 2013 we expect to incur further BT Global restructuring costs of around £40m in relation to the rationalisation of the Infonet and Radianz networks. Property rationalisation charges of £90m were incurred in 2012 (2011: £88m). The property rationalisation programme has now been completed.
Net finance income
Net finance income on pensions was £197m in 2012 (2011: £79m expense).
Taxation
The specific tax items tax credit of £142m (2011: £239m credit) in 2012 principally comprised a tax credit of £164m (2011: £172m) for the re-measurement of deferred tax balances as a result of the change in the UK statutory tax rate from 26% to 24% effective in 2013 but enacted in 2012 and from 28% to 26% effective in 2012 but enacted in 2011.
Underlying revenue trends
Underlying revenue is a measure which seeks to reflect the underlying revenue performance of the group that will contribute to long-term profitable growth. As such it excludes any increases or
| | |
| 28 British Telecommunications plc Annual Report & Form 20-F 2012 | | Report of the Directors – Performance |
decreases in revenue as a result of acquisitions or disposals, any foreign exchange movements affecting revenue and any specific items. We are focusing on the trends in underlying revenue excluding transit revenue as transit traffic is low-margin and is significantly affected by reductions in mobile termination rates.
A reconciliation from the decrease in reported group revenue, the most directly comparable IFRS measure, to the decrease in adjusted group revenue and to the decrease in underlying revenue excluding transit, is set out below.
| | | | | | | | |
Year ended 31 March | |
| 2012
% |
| |
| 2011
% |
|
| |
Decrease in reported revenue | | | (5.9 | ) | | | (3.8 | ) |
Specific items | | | 2.1 | | | | (0.2 | ) |
| |
Decrease in adjusted revenue | | | (3.8 | ) | | | (4.0 | ) |
Acquisitions and disposals | | | 0.3 | | | | – | |
Foreign exchange movements and other | | | (0.2 | ) | | | 0.2 | |
Transit revenue | | | 1.8 | | | | 0.8 | |
| |
Decrease in underlying revenue excluding transit | | | (1.9 | ) | | | (3.0 | ) |
| |
EBITDA
In addition to measuring financial performance of the lines of business based on operating profit, we also measure performance based on EBITDA and adjusted EBITDA. EBITDA is defined as the group profit or loss before depreciation, amortisation, net finance expense and taxation. Adjusted EBITDA is defined as EBITDA before specific items. EBITDA is a common measure used by investors and analysts to evaluate the operating financial performance of companies, particularly in the telecom sector.
We consider EBITDA and adjusted EBITDA to be useful measures of our operating performance because they approximate the underlying operating cash flow by eliminating depreciation and amortisation. EBITDA and adjusted EBITDA are not direct measures of our liquidity, which is shown by our cash flow statement, and need to be considered in the context of our financial commitments.
A reconciliation from group operating profit, the most directly comparable IFRS measure, to reported and adjusted group EBITDA, is set out below. A reconciliation between operating profit and adjusted EBITDA for our lines of business is set out in Segment information, note 4 to the consolidated financial statements.
| | | | | | | | |
Year ended 31 March | |
| 2012
£m |
| |
| 2011
£m |
|
| |
Operating profit | | | 2,923 | | | | 2,573 | |
Depreciation and amortisation | | | 2,972 | | | | 2,979 | |
| |
Reported EBITDA | | | 5,895 | | | | 5,552 | |
Specific items | | | 173 | | | | 329 | |
| |
Adjusted EBITDA | | | 6,068 | | | | 5,881 | |
| |
Free cash flow
Adjusted free cash flow
Adjusted free cash flow is one of the group’s key performance indicators by which our financial performance is measured. Adjusted free cash flow is defined as the net increase in cash and cash equivalents less cash flows from financing activities (except net interest paid) and less the acquisition or disposal of group undertakings and less the net sale of short-term investments and excluding pension deficit payments. It is also before the cash impact of specific items including tax related specific items. For non-tax related items the adjustment is made on a pre-tax basis. Adjusted free cash flow is primarily a liquidity measure, however we also believe it is an important indicator of our overall operational performance as it reflects the cash we generate from operations after capital expenditure and financing costs, both of which are
significant ongoing cash outflows associated with investing in our infrastructure and financing our operations. In addition, adjusted free cash flow excludes cash flows that are determined at a corporate level independently of ongoing trading operations such as dividends, acquisitions and disposals and repayment of debt.
Normalised free cash flow
We now also measure cash flow on a normalised basis which removes the impact of the tax benefit relating to pension deficit payments.
A reconciliation from net cash inflow from operating activities, the most directly comparable IFRS measure, to reported, adjusted and normalised free cash flow is set out below.
| | | | | | | | |
Year ended 31 March | |
| 2012
£m |
| |
| 2011
£m |
|
| |
Net cash inflow from operations | | | 3,560 | | | | 4,570 | |
Add back pension deficit payment | | | 2,000 | | | | 1,030 | |
Included in cash flows from investing activities | | | | | | | | |
Net capital expenditure | | | (2,560 | ) | | | (2,630 | ) |
Interest received | | | 127 | | | | 134 | |
Dividends received from associates and joint ventures | | | 4 | | | | 7 | |
Sales (purchases) of non-current financial assets | | | 1 | | | | (18 | ) |
Outflow on non-current amounts owed by parent company | | | (119 | ) | | | (105 | ) |
Included in cash flows from financing activities | | | | | | | | |
Interest paid | | | (693 | ) | | | (973 | ) |
| |
Reported free cash flow | | | 2,320 | | | | 2,015 | |
Add back: Net cash outflow from specific items | | | 204 | | | | 212 | |
| |
Adjusted free cash flow | | | 2,524 | | | | 2,227 | |
Cash tax benefit of pension deficit payments | | | (215 | ) | | | (147 | ) |
| |
Normalised free cash flow | | | 2,309 | | | | 2,080 | |
| |
Net debt
This measure is applied in context of BT Group plc’s financial statements and is referred to in these financial statements.
Net debt consists of loans and other borrowings (both current and non current), less current asset investments and cash and cash equivalents. Loans and other borrowings are measured at the net proceeds raised, adjusted to amortise any discount over the term of the debt. For the purpose of this measure, current asset investments and cash and cash equivalents are measured at the lower of cost and net realisable value. Currency denominated balances within net debt are translated to Sterling at swap rates where hedged.
This definition of net debt measures balances at the expected value of future undiscounted cash flows due to arise on maturity of financial instruments and removes the balance sheet adjustments made from the re-measurement of hedged risks under fair value hedges and the use of the effective interest method. In addition, the gross balances are adjusted to take account of netting arrangements.
It is a measure of BT Group plc’s net indebtedness that provides an indicator of the overall balance sheet strength. It is also a single measure that can be used to assess both the BT Group plc’s cash position and indebtedness. There are material limitations in the use of alternative performance measures and the use of the term net debt does not necessarily mean that the cash included in the net debt calculation is available to settle the liabilities included in this measure.
BT Group plc’s management consider BT Group plc’s consolidated net debt to be an alternative performance measure as it is not defined in IFRS. The most directly comparable IFRS measure is the aggregate of loans and other borrowings (current and non-current), current asset investments and cash and cash equivalents.
| | |
| Report of the Directors – Performance | | British Telecommunications plc Annual Report & Form 20-F 2012 29 |
REPORT OF THE DIRECTORS
STATUTORY INFORMATION
The directors submit their report and the audited financial statements of the company, British Telecommunications plc, and the group, which includes its subsidiary undertakings, for 2012 year.
Introduction
TheBusiness, StrategyandPerformancesections on pages 2 to 29 form part of this report. The audited financial statements are presented on pages 35 to 90 and 108.
During the year no interim dividends have been paid (2011: nil). The directors have declared a final dividend of £1,400m (2011: nil).
Principal activity
The company is the principal trading company of the BT group. Our main activities are providing and managing data and voice networks and providing a range of services over these networks.
In the UK we are a leading communications services provider, selling products and services to consumers and small and medium-sized enterprises (SMEs). In the UK and globally we are a leading provider of managed networked IT services for many of the largest multinational corporations, domestic businesses and national and local government organisations. We also sell wholesale telecoms services to communications providers (CPs) in the UK and around the world.
Directors
The directors at 31 March 2012 were Tony Chanmugam and Glyn Parry who served throughout 2012 and Sean Williams who was appointed on 18 April 2011. Ian Livingston served as a director until 18 April 2011.
Financial statements
A statement by the directors of their responsibilities for preparing the financial statements is included in the Statement of directors’ responsibilities on page 32.
Our significant accounting policies are set out on pages 40 to 46 of the consolidated financial statements and conform with IFRS. These policies, and applicable estimation techniques have been reviewed by the directors who have confirmed them to be appropriate for the preparation of the 2012 consolidated financial statements.
So far as each of the directors is aware, there is no relevant information that has not been disclosed to the auditors and each of the directors believes that all steps have been taken that ought to have been taken to make them aware of any relevant audit information and to establish that the auditors have been made aware of that information.
Financial instruments
Details of the financial risk management objectives and policies of the group and exposure to interest risk, foreign exchange risk, credit risk, liquidity risk and price risk are given in note 25 on pages 77 to 87.
Auditors
PricewaterhouseCoopers have been the company’s auditors for many years and the BT Group plc Audit & Risk Committee carried out the annual review of their performance by gathering feedback from Committee members and senior management, and by considering reports on the audit firm’s own internal quality control procedure and assessment of independence. Having assessed the responses the BT Group plc Audit & Risk Committee did not consider it necessary to require them to tender for the audit. The external auditors are required to rotate the lead partner every five years and other partners that are responsible for the group and subsidiary audits every seven years. The partner currently responsible for BT’s audit is completing his third year.
A resolution to reappoint PricewaterhouseCoopers LLP as BT’s auditors and to authorise the directors to agree their remuneration will be proposed at the AGM.
Internal control and risk management
The Board of BT Group plc, the company’s ultimate parent, is responsible for the group’s systems of internal control and risk management and for reviewing each year the effectiveness of those systems. Such systems are designed to manage, rather than eliminate, the risk of failure to achieve business objectives; any system can provide only reasonable, and not absolute, assurance against material misstatement or loss. The process in place for reviewing BT’s systems of internal control includes procedures designed to identify and evaluate failings and weaknesses, and, in the case of any categorised as significant, procedures exist to ensure that necessary action is taken to remedy the failings.
BT Group plc has enterprise-wide risk management processes for identifying, evaluating and managing the significant risks faced by the group. These processes have been in place during 2012 and have continued up to the date on which this document was approved. The processes are in accordance with the Revised Guidance for Directors on the UK Governance Code published by the Financial Reporting Council (the “Turnbull Guidance”).
Risk assessment and evaluation takes place as an integral part of BT Group plc’s annual strategic planning cycle. We have a detailed risk management process, culminating in a BT Group plc Board review, which identifies the key risks facing the group and each business unit. This information is reviewed by senior management as part of the strategic review. Our current key risks are summarised in theStrategysection– Our riskson pages 15 to 18.
The key features of the enterprise-wide risk management and internal control process comprise the following procedures:
| — | | senior executives collectively review the group’s key risks and have created a Group Risk Register describing the risks, owners and mitigation strategies. This is reviewed by BT Group plc’s Group Risk Panel and Operating Committee before being reviewed and approved by the BT Group plc Board |
| — | | the lines of business and internal service units carry out risk assessments of their operations, create risk registers relating to those operations, and ensure that the key risks are addressed |
| — | | senior executives with responsibilities for major group operations report quarterly with their opinion on the effectiveness of the operation of internal controls in their area of responsibility |
| — | | BT Group plc’s internal auditors carry out continuing assessments of the quality of risk management and control, report to management and the BT Group plc Audit & Risk Committee on the status of specific areas identified for improvement and promote effective risk management in the lines of business and internal service units operations |
| — | | the BT Group plc Audit & Risk Committee, on behalf of the BT Group plc Board, considers the effectiveness of the operation of internal control procedures in the group during the financial year. It reviews reports from the internal and external auditors and reports its conclusions to the BT Group plc Board. The BT Group plc Audit & Risk Committee has carried out these actions for 2012. |
Joint ventures and associates, which BT does not control, have not been dealt with as part of the group risk management process and are responsible for their own internal control assessment.
| | |
| 30 British Telecommunications plc Annual Report & Form 20-F 2012 | | Report of the Directors – Statutory Information |
US Sarbanes-Oxley Act of 2002
BT has debt securities registered with the US Securities and Exchange Commission (SEC). As a result, we must comply with those provisions of the Sarbanes-Oxley Act applicable to foreign issuers. We comply with the legal and regulatory requirements introduced pursuant to this legislation, in so far as they are applicable.
Disclosure controls and procedures
The principal executive officer and the principal financial officer, after evaluating the effectiveness of BT’s disclosure controls and procedures as of the end of the period covered by this Annual Report & Form 20-F, have concluded that, as of such date, BT’s disclosure controls and procedures were effective to ensure that material information relating to BT was made known to them by others within the group. The principal executive officer and principal financial officer concluded that BT’s disclosure controls and procedures are also effective to ensure that the information required to be disclosed by the company in reports that it files under the Securities Exchange Act 1934 (Exchange Act) is recorded, processed, summarised and reported within the time periods specified in the rules and forms of the SEC. The principal executive officer and the principal financial officer have also provided the certifications required by the Sarbanes-Oxley Act.
Internal control over financial reporting
BT’s management is responsible for establishing and maintaining adequate internal control over financial reporting for the group including the consolidation process. Internal control over financial reporting is designed to provide reasonable assurance regarding the reliability of financial reporting and the preparation of financial statements for external reporting purposes in accordance with IFRS. Management conducted an assessment of the effectiveness of internal control over financial reporting based on the framework for internal control evaluation contained in the Turnbull Guidance.
Based on this assessment, management has concluded that at 31 March 2012, BT’s internal control over financial reporting was effective.
There were no changes in BT’s internal control over financial reporting that occurred during 2012 that have materially affected, or are reasonably likely to have materially affected, BT’s internal control over financial reporting. Any significant deficiency, as defined by the US Public Company Accounting Oversight Board (PCAOB), in internal control over financial reporting is reported to the Audit & Risk Committee of the ultimate parent company, BT Group plc.
PricewaterhouseCoopers LLP, which has audited the consolidated financial statements of the group for 2012, has also audited the effectiveness of the group’s internal control over financial reporting under Auditing Standard No. 5 of the PCAOB. Their report is on page 34.
By order of the Board
Heather Brierley
Secretary
16 May 2012
Registered Office: 81 Newgate Street, London EC1A 7AJ
Registered in England and Wales No. 1800000
| | |
| Report of the Directors – Statutory information | | British Telecommunications plc Annual Report & Form 20-F 2012 31 |
STATEMENT OF DIRECTORS’ RESPONSIBILITIES
for preparing the financial statements
The directors are responsible for preparing the Annual Report and the financial statements in accordance with applicable law and regulations. Company law requires the directors to prepare financial statements for each financial year. Under that law the directors have elected to prepare the consolidated financial statements in accordance with International Financial Reporting Standards (IFRS) as adopted by the European Union, and the parent company financial statements in accordance with United Kingdom Generally Accepted Accounting Practice (United Kingdom Accounting Standards and applicable law). In preparing the consolidated financial statements, the directors have also elected to comply with IFRS, issued by the International Accounting Standards Board (IASB). Under company law the directors must not approve the financial statements unless they are satisfied that they give a true and fair view of the state of affairs of the group and the company and of the profit or loss of the group for that period. In preparing these financial statements, the directors are required to:
| — | | select suitable accounting policies and then apply them consistently |
| — | | make judgments and accounting estimates that are reasonable and prudent |
| — | | state whether IFRS as adopted by the European Union and IFRS issued by IASB and applicable UK Accounting Standards have been followed, subject to any material departures disclosed and explained in the consolidated and parent company financial statements respectively |
| — | | prepare the financial statements on the going concern basis unless it is inappropriate to presume that the company will continue in business. |
The directors are responsible for keeping adequate accounting records that are sufficient to show and explain the company’s transactions and disclose with reasonable accuracy at any time the financial position of the company and the group and enable them to ensure that the financial statements comply with the Companies Act 2006 and, as regards the consolidated financial statements, Article 4 of the IAS Regulation. They are also responsible for safeguarding the assets of the company and the group and hence for taking reasonable steps for the prevention and detection of fraud and other irregularities.
Each of the directors, whose names are listed on page 30 confirm that, to the best of their knowledge:
| — | | theconsolidated financial statements, which have been prepared in accordance with IFRS as adopted by the European Union, give a true and fair view of the assets, liabilities, financial position and profit of the group |
| — | | theReport of the directorson pages 2 to 31 includes a fair review of the development and performance of the business and the position of the group, together with a description of the principal risks and uncertainties that it faces |
| — | | theparent company financial statements, which have been prepared in accordance with United Kingdom Generally Accepted Accounting Practice, give a true and fair view of the assets, liabilities and financial position of the parent company. |
| | |
| 32 British Telecommunications plc Annual Report & Form 20-F 2012 | | Statement of directors’ responsibilities |
REPORT OF THE INDEPENDENT AUDITORS – CONSOLIDATED FINANCIAL STATEMENTS
UNITED KINGDOM OPINION
Independent Auditors’ Report to the members of British Telecommunications plc (the ‘company’)
We have audited the consolidated financial statements of British Telecommunications plc for the year ended 31 March 2012 which comprise the Group income statement, the Group statement of comprehensive income, the Group balance sheet, the Group statement of changes in equity, the Group cash flow statement and the related notes. The financial reporting framework that has been applied in their preparation is applicable law and International Financial Reporting Standards (IFRS) as adopted by the European Union.
Respective responsibilities of directors and auditors
As explained more fully in the Statement of directors’ responsibilities set out on page 32, the directors are responsible for the preparation of the consolidated financial statements and for being satisfied that they give a true and fair view. Our responsibility is to audit and express an opinion on the consolidated financial statements in accordance with applicable law and International Standards on Auditing (UK and Ireland). Those standards require us to comply with the Auditing Practices Board’s Ethical Standards for Auditors.
This report, including the opinions, has been prepared for and only for the company’s members as a body in accordance with Chapter 3 of Part 16 of the Companies Act 2006 and for no other purpose. We do not, in giving these opinions, accept or assume responsibility for any other purpose or to any other person to whom this report is shown or into whose hands it may come save where expressly agreed by our prior consent in writing.
Scope of the audit of the financial statements
An audit involves obtaining evidence about the amounts and disclosures in the financial statements sufficient to give reasonable assurance that the financial statements are free from material misstatement, whether caused by fraud or error. This includes an assessment of: whether the accounting policies are appropriate to the group’s circumstances and have been consistently applied and adequately disclosed; the reasonableness of significant accounting estimates made by the directors and the overall presentation of the financial statements. In addition, we read all the financial and non-financial information in the British Telecommunications plc Annual Report & Form 20-F for the year ended 31 March 2012 to identify material inconsistencies with the audited consolidated financial statements. If we become aware of any apparent material misstatements or inconsistencies we consider the implication for our report.
Opinion on financial statements
In our opinion the consolidated financial statements:
| — | | give a true and fair view of the state of the group’s affairs as at 31 March 2012 and of its profit and cash flows for the year then ended; |
| — | | have been properly prepared in accordance with IFRS as adopted by the European Union; and |
| — | | have been prepared in accordance with the requirements of the Companies Act 2006 and Article 4 of the lAS Regulation. |
Separate opinion in relation to IFRS as issued by the IASB
As explained in note 1 to the consolidated financial statements the group, in addition to complying with its legal obligation to apply IFRS as adopted by the European Union, has also applied IFRS as issued by the International Accounting Standards Board (IASB).
In our opinion the consolidated financial statements comply with IFRS as issued by the IASB.
Opinion on other matters prescribed by the Companies Act 2006
In our opinion the information given in the Report of the directors for the financial year for which the consolidated financial statements are prepared is consistent with the consolidated financial statements.
Matters on which we are required to report by exception
We have nothing to report in respect of the following:
Under the Companies Act 2006 we are required to report to you if, in our opinion:
| — | | certain disclosures of directors’ remuneration specified by law are not made; or |
| — | | we have not received all the information and explanations we require for our audit. |
Other matter
We have reported separately on the parent company financial statements of British Telecommunications plc for the year ended 31 March 2012.
Philip Rivett (Senior Statutory Auditor)
for and on behalf of PricewaterhouseCoopers LLP
Chartered Accountants and Statutory Auditors
London, United Kingdom
16 May 2012
| | |
| Report of the independent auditors – Consolidated financial statements | | British Telecommunications plc Annual Report & Form 20-F 2012 33 |
UNITED STATES OPINION
Report of Independent Registered Public Accounting Firm to the Board of Directors and Shareholders of British Telecommunications plc (the ‘company’)
In our opinion, the accompanying Group income statements, Group statements of comprehensive income, Group balance sheets, Group statements of changes in equity and Group cash flow statements present fairly, in all material respects, the financial position of British Telecommunications plc and its subsidiaries at 31 March 2012 and 2011 and the results of their operations and cash flows for each of the three years in the period ended 31 March 2012, in conformity with International Financial Reporting Standards (IFRS) as issued by the International Accounting Standards Board. Also, in our opinion the company maintained, in all material respects, effective internal control over financial reporting as of 31 March 2012, based on criteria established in the Turnbull Guidance.
The company’s management is responsible for these financial statements, for maintaining effective internal control over financial reporting and for its assessment of the effectiveness of internal control over financial reporting, included in management’s evaluation of the effectiveness of internal control over financial reporting as set out in the first three paragraphs of Internal control over financial reporting in the Report of the directors of the British Telecommunications plc Annual Report & Form 20-F.
Our responsibility is to express opinions on these financial statements and on the company’s internal control over financial reporting based on our integrated audits. We conducted our audits in accordance with the standards of the Public Company Accounting Oversight Board (United States). Those standards require that we plan and perform the audits to obtain reasonable assurance about whether the financial statements are free of material misstatement and whether effective internal control over financial reporting was maintained in all material respects.
Our audits of the financial statements included examining, on a test basis, evidence supporting the amounts and disclosures in the financial statements, assessing the accounting principles used and significant estimates made by management, and evaluating the
overall financial statement presentation. Our audit of internal control over financial reporting included obtaining an understanding of internal control over financial reporting, assessing the risk that a material weakness exists, and testing and evaluating the design and operating effectiveness of internal control based on the assessed risk. Our audits also included performing such other procedures as we considered necessary in the circumstances. We believe that our audits provide a reasonable basis for our opinions.
A company’s internal control over financial reporting is a process designed to provide reasonable assurance regarding the reliability of financial reporting and the preparation of financial statements for external purposes in accordance with generally accepted accounting principles. A company’s internal control over financial reporting includes those policies and procedures that (i) pertain to the maintenance of records that, in reasonable detail, accurately and fairly reflect the transactions and dispositions of the assets of the company; (ii) provide reasonable assurance that transactions are recorded as necessary to permit preparation of financial statements in accordance with generally accepted accounting principles, and that receipts and expenditures of the company are being made only in accordance with authorisations of management and directors of the company; and (iii) provide reasonable assurance regarding prevention or timely detection of unauthorised acquisition, use, or disposition of the company’s assets that could have a material effect on the financial statements.
Because of its inherent limitations, internal control over financial reporting may not prevent or detect misstatements. Also, projections of any evaluation of effectiveness to future periods are subject to the risk that controls may become inadequate because of changes in conditions, or that the degree of compliance with the policies or procedures may deteriorate.
PricewaterhouseCoopers LLP
London, United Kingdom
16 May 2012
| | |
| 34 British Telecommunications plc Annual Report & Form 20-F 2012 | | Report of the independent auditors – Consolidated financial statements |
CONSOLIDATED FINANCIAL STATEMENTS
GROUP INCOME STATEMENT
| | | Before | | | Before | | | Before | | | Before | | | Before | | | Before | | | Before | |
Year ended 31 March 2012 | | | Notes | | | | |
| Before specific
items
£m |
| | | |
| Specific
itemsa £m |
| | | |
| Total
£m |
|
| |
Revenue | | | 4 | | | | | | 19,307 | | | | | | (410 | ) | | | | | 18,897 | |
Other operating income | | | 5 | | | | | | 387 | | | | | | (19 | ) | | | | | 368 | |
Operating costs | | | 6 | | | | | | (16,598 | ) | | | | | 256 | | | | | | (16,342 | ) |
| |
Operating profit | | | 4 | | | | | | 3,096 | | | | | | (173 | ) | | | | | 2,923 | |
| |
Finance expense | | | 24 | | | | | | (692 | ) | | | | | (2,092 | ) | | | | | (2,784 | ) |
Finance income | | | 24 | | | | | | 301 | | | | | | 2,289 | | | | | | 2,590 | |
| |
Net finance expense | | | | | | | | | (391 | ) | | | | | 197 | | | | | | (194 | ) |
Share of post tax profit of associates and joint ventures | | | 14 | | | | | | 10 | | | | | | – | | | | | | 10 | |
| |
Profit before taxation | | | | | | | | | 2,715 | | | | | | 24 | | | | | | 2,739 | |
Taxation | | | 10 | | | | | | (660 | ) | | | | | 142 | | | | | | (518 | ) |
| |
Profit for the year | | | | | | | | | 2,055 | | | | | | 166 | | | | | | 2,221 | |
| |
| | | | | | | |
Attributable to: | | | | | | | | | | | | | | | | | | | | | | |
Equity shareholders of the parent | | | | | | | | | 2,054 | | | | | | 166 | | | | | | 2,220 | |
Non-controlling interests | | | | | | | | | 1 | | | | | | – | | | | | | 1 | |
| |
a For a definition of specific items, see page 40. An analysis of specific items is provided in note 9. | |
Year ended 31 March 2011 | | | Notes | | | | |
| Before specific
items
£m |
| | | |
| Specific
itemsa £m |
| | | |
| Total
£m |
|
| |
Revenue | | | 4 | | | | | | 20,076 | | | | | | – | | | | | | 20,076 | |
Other operating income | | | 5 | | | | | | 373 | | | | | | – | | | | | | 373 | |
Operating costs | | | 6 | | | | | | (17,547 | ) | | | | | (329 | ) | | | | | (17,876 | ) |
| |
Operating profit | | | 4 | | | | | | 2,902 | | | | | | (329 | ) | | | | | 2,573 | |
| |
Finance expense | | | 24 | | | | | | (881 | ) | | | | | (2,323 | ) | | | | | (3,204 | ) |
Finance income | | | 24 | | | | | | 283 | | | | | | 2,244 | | | | | | 2,527 | |
| |
Net finance expense | | | | | | | | | (598 | ) | | | | | (79 | ) | | | | | (677 | ) |
Share of post tax profit of associates and joint ventures | | | 14 | | | | | | 21 | | | | | | – | | | | | | 21 | |
Profit on disposal of interest in associate | | | 9 | | | | | | – | | | | | | 42 | | | | | | 42 | |
| |
Profit before taxation | | | | | | | | | 2,325 | | | | | | (366 | ) | | | | | 1,959 | |
Taxation | | | 10 | | | | | | (520 | ) | | | | | 239 | | | | | | (281 | ) |
| |
Profit for the year | | | | | | | | | 1,805 | | | | | | (127 | ) | | | | | 1,678 | |
| |
| | | | | | | |
Attributable to: | | | | | | | | | | | | | | | | | | | | | | |
Equity shareholders of the parent | | | | | | | | | 1,803 | | | | | | (127 | ) | | | | | 1,676 | |
Non-controlling interests | | | | | | | | | 2 | | | | | | – | | | | | | 2 | |
| |
a For a definition of specific items, see page 40. An analysis of specific items is provided in note 9. | |
Year ended 31 March 2010 | | | Notes | | | | |
| Before specific
items
£m |
| | | |
| Specific
itemsa
£m |
| | | |
| Total
£m |
|
| |
Revenue | | | 4 | | | | | | 20,911 | | | | | | (52 | ) | | | | | 20,859 | |
Other operating income | | | 5 | | | | | | 378 | | | | | | 2 | | | | | | 380 | |
Operating costs | | | 6 | | | | | | (18,674 | ) | | | | | (427 | ) | | | | | (19,101 | ) |
| |
Operating profit | | | 4 | | | | | | 2,615 | | | | | | (477 | ) | | | | | 2,138 | |
| |
Finance expense | | | 24 | | | | | | (903 | ) | | | | | (2,211 | ) | | | | | (3,114 | ) |
Finance income | | | 24 | | | | | | 294 | | | | | | 1,943 | | | | | | 2,237 | |
| |
Net finance expense | | | | | | | | | (609 | ) | | | | | (268 | ) | | | | | (877 | ) |
Share of post tax profit of associates and joint ventures | | | | | | | | | 25 | | | | | | 29 | | | | | | 54 | |
Loss on disposal of interest in associate | | | 9 | | | | | | – | | | | | | (12 | ) | | | | | (12 | ) |
| |
Profit before taxation | | | | | | | | | 2,031 | | | | | | (728 | ) | | | | | 1,303 | |
Taxation | | | 10 | | | | | | (480 | ) | | | | | 420 | | | | | | (60 | ) |
| |
Profit for the year | | | | | | | | | 1,551 | | | | | | (308 | ) | | | | | 1,243 | |
| |
| | | | | | | |
Attributable to: | | | | | | | | | | | | | | | | | | | | | | |
Equity shareholders of the parent | | | | | | | | | 1,550 | | | | | | (308 | ) | | | | | 1,242 | |
Non-controlling interests | | | | | | | | | 1 | | | | | | – | | | | | | 1 | |
| |
| a | For a definition of specific items, see page 40. An analysis of specific items is provided in note 9. |
| | |
| Group income statement | | British Telecommunications plc Annual Report & Form 20-F 2012 35 |
GROUP STATEMENT OF COMPREHENSIVE INCOME
| | | Before | | | Before | | | Before | | | Before | | | Before | | | Before | | | Before | |
Year ended 31 March | | | Notes | | | | |
| 2012
£m |
| | | |
| 2011
£m |
| | | |
| 2010
£m |
|
| |
Profit for the year | | | | | | | | | 2,221 | | | | | | 1,678 | | | | | | 1,243 | |
| |
Other comprehensive income (loss) | | | | | | | | | | | | | | | | | | | | | | |
Actuarial (losses) gains relating to retirement benefit obligations | | | 19 | | | | | | (2,744 | ) | | | | | 5,109 | | | | | | (4,324 | ) |
Exchange differences on translation of foreign operations | | | 26 | | | | | | (38 | ) | | | | | (142 | ) | | | | | (112 | ) |
Fair value movements on available-for-sale assets: | | | | | | | | | | | | | | | | | | | | | | |
– net fair value gains | | | 26 | | | | | | – | | | | | | 20 | | | | | | 11 | |
– recognised in income and expense in the year | | | 26 | | | | | | – | | | | | | 1 | | | | | | – | |
Fair value movements on cash flow hedges: | | | | | | | | | | | | | | | | | | | | | | |
– net fair value losses | | | 26 | | | | | | (56 | ) | | | | | (347 | ) | | | | | (1,067 | ) |
– recognised in income and expense | | | 26 | | | | | | 179 | | | | | | 333 | | | | | | 496 | |
– reclassified and reported in non-current assets | | | 26 | | | | | | – | | | | | | – | | | | | | (4 | ) |
Tax on components of other comprehensive income | | | 10 | | | | | | 577 | | | | | | (1,497 | ) | | | | | 1,325 | |
| |
Other comprehensive (loss) income for the year, net of tax | | | | | | | | | (2,082 | ) | | | | | 3,477 | | | | | | (3,675 | ) |
| |
Total comprehensive income (loss) for the year | | | | | | | | | 139 | | | | | | 5,155 | | | | | | (2,432 | ) |
| |
| | | | | | | |
Attributable to: | | | | | | | | | | | | | | | | | | | | | | |
Equity shareholders of the parent | | | | | | | | | 137 | | | | | | 5,153 | | | | | | (2,433 | ) |
Non-controlling interests | | | | | | | | | 2 | | | | | | 2 | | | | | | 1 | |
| |
| | | | | | | | | 139 | | | | | | 5,155 | | | | | | (2,432 | ) |
| |
| | |
| 36 British Telecommunications plc Annual Report & Form 20-F 2012 | | Group statement of comprehensive income |
GROUP BALANCE SHEET
At 31 March
| | | Before | | | Before | | | Before | | | Before | | | Before | |
| | | Notes | | | | |
| 2012
£m |
| | | |
| 2011
£m |
|
| |
Non-current assets | | | | | | | | | | | | | | | | |
Intangible assets | | | 12 | | | | | | 3,135 | | | | | | 3,397 | |
Property, plant and equipment | | | 13 | | | | | | 14,388 | | | | | | 14,623 | |
Derivative financial instruments | | | 25 | | | | | | 886 | | | | | | 625 | |
Investments | | | 21 | | | | | | 19,517 | | | | | | 18,101 | |
Associates and joint ventures | | | 14 | | | | | | 153 | | | | | | 164 | |
Trade and other receivables | | | 16 | | | | | | 169 | | | | | | 286 | |
Deferred tax assets | | | 10 | | | | | | 626 | | | | | | 461 | |
| |
| | | | | | | | | 38,874 | | | | | | 37,657 | |
| |
Current assets | | | | | | | | | | | | | | | | |
Inventories | | | 15 | | | | | | 104 | | | | | | 121 | |
Trade and other receivables | | | 16 | | | | | | 3,310 | | | | | | 3,364 | |
Current tax receivable | | | | | | | | | 139 | | | | | | – | |
Derivative financial instruments | | | 25 | | | | | | 137 | | | | | | 108 | |
Investments | | | 21 | | | | | | 1,164 | | | | | | 1,238 | |
Cash and cash equivalents | | | 22 | | | | | | 326 | | | | | | 354 | |
| |
| | | | | | | | | 5,180 | | | | | | 5,185 | |
| |
Current liabilities | | | | | | | | | | | | | | | | |
Loans and other borrowings | | | 23 | | | | | | 2,887 | | | | | | 490 | |
Derivative financial instruments | | | 25 | | | | | | 89 | | | | | | 62 | |
Trade and other payables | | | 17 | | | | | | 6,015 | | | | | | 6,188 | |
Current tax liabilities | | | | | | | | | 66 | | | | | | 221 | |
Provisions | | | 18 | | | | | | 251 | | | | | | 149 | |
| |
| | | | | | | | | 9,308 | | | | | | 7,110 | |
| |
Total assets less current liabilities | | | | | | | | | 34,746 | | | | | | 35,732 | |
| |
| | | | | |
Non-current liabilities | | | | | | | | | | | | | | | | |
Loans and other borrowings | | | 23 | | | | | | 7,599 | | | | | | 9,398 | |
Derivative financial instruments | | | 25 | | | | | | 757 | | | | | | 507 | |
Retirement benefit obligations | | | 19 | | | | | | 2,448 | | | | | | 1,830 | |
Other payables | | | 17 | | | | | | 875 | | | | | | 831 | |
Deferred tax liabilities | | | 10 | | | | | | 1,100 | | | | | | 1,212 | |
Provisions | | | 18 | | | | | | 606 | | | | | | 807 | |
| |
| | | | | | | | | 13,385 | | | | | | 14,585 | |
| |
| | | | | |
Equity | | | | | | | | | | | | | | | | |
Ordinary shares | | | | | | | | | 2,172 | | | | | | 2,172 | |
Share premium | | | | | | | | | 8,000 | | | | | | 8,000 | |
Other reserves | | | 26 | | | | | | 1,477 | | | | | | 1,414 | |
Retained earnings | | | | | | | | | 9,701 | | | | | | 9,535 | |
| |
Total parent shareholders’ equity | | | | | | | | | 21,350 | | | | | | 21,121 | |
Non-controlling interests | | | | | | | | | 11 | | | | | | 26 | |
| |
Total equity | | | | | | | | | 21,361 | | | | | | 21,147 | |
| |
| | | | | | | | | 34,746 | | | | | | 35,732 | |
| |
The consolidated financial statements on pages 35 to 90 and 108 were approved by the Board of Directors on 16 May 2012 and were signed on its behalf by
Tony Chanmugam
Director
| | |
| Group balance sheet | | British Telecommunications plc Annual Report & Form 20-F 2012 37 |
GROUP STATEMENT OF CHANGES IN EQUITY
| | | | | | | | | | | | | | | | | | | | | | | | | | | | | | |
| | | Shareholders’ equity | | | | | | | |
| | | |
| Share
capitala
£m |
| |
| Share
premiumb
£m |
| |
| Other
reservesc
£m |
| |
| Retained
earnings
£m |
| |
| Total
£m |
| |
| Non-
controlling
interests
£m |
| |
| Total
Equity
£m |
|
| |
At 1 April 2009 | | | | | 2,172 | | | | 8,000 | | | | 2,074 | | | | 5,896 | | | | 18,142 | | | | 27 | | | | 18,169 | |
Profit for the year | | | | | – | | | | – | | | | – | | | | 1,242 | | | | 1,242 | | | | 1 | | | | 1,243 | |
Other comprehensive income – before tax | | | | | – | | | | – | | | | (1,168 | ) | | | (4,324 | ) | | | (5,492 | ) | | | – | | | | (5,492 | ) |
Other comprehensive income – tax | | | | | – | | | | – | | | | 114 | | | | 1,211 | | | | 1,325 | | | | – | | | | 1,325 | |
Transferred to the income statement | | | | | – | | | | – | | | | 496 | | | | – | | | | 496 | | | | – | | | | 496 | |
Transferred to non-current assets | | | | | – | | | | – | | | | (4 | ) | | | – | | | | (4 | ) | | | – | | | | (4 | ) |
Comprehensive (loss) income | | | | | – | | | | – | | | | (562 | ) | | | (1,871 | ) | | | (2,433 | ) | | | 1 | | | | (2,432 | ) |
Share-based payments | | | | | – | | | | – | | | | – | | | | 81 | | | | 81 | | | | – | | | | 81 | |
Tax on share-based payments | | | | | – | | | | – | | | | – | | | | 19 | | | | 19 | | | | – | | | | 19 | |
Other movements in non-controlling interests | | | | | – | | | | – | | | | – | | | | – | | | | – | | | | (4 | ) | | | (4 | ) |
| |
At 1 April 2010 | | | | | 2,172 | | | | 8,000 | | | | 1,512 | | | | 4,125 | | | | 15,809 | | | | 24 | | | | 15,833 | |
Profit for the year | | | | | – | | | | – | | | | – | | | | 1,676 | | | | 1,676 | | | | 2 | | | | 1,678 | |
Other comprehensive income – before tax | | | | | – | | | | – | | | | (469 | ) | | | 5,109 | | | | 4,640 | | | | – | | | | 4,640 | |
Other comprehensive income – tax | | | | | – | | | | – | | | | 37 | | | | (1,534 | ) | | | (1,497 | ) | | | – | | | | (1,497 | ) |
Transferred to the income statement | | | | | – | | | | – | | | | 334 | | | | – | | | | 334 | | | | – | | | | 334 | |
Comprehensive income (loss) | | | | | – | | | | – | | | | (98 | ) | | | 5,251 | | | | 5,153 | | | | 2 | | | | 5,155 | |
Share-based payments | | | | | – | | | | – | | | | – | | | | 68 | | | | 68 | | | | – | | | | 68 | |
Tax on share-based payments | | | | | – | | | | – | | | | – | | | | 91 | | | | 91 | | | | – | | | | 91 | |
| |
At 1 April 2011 | | | | | 2,172 | | | | 8,000 | | | | 1,414 | | | | 9,535 | | | | 21,121 | | | | 26 | | | | 21,147 | |
Profit for the year | | | | | – | | | | – | | | | – | | | | 2,220 | | | | 2,220 | | | | 1 | | | | 2,221 | |
Other comprehensive income – before tax | | | | | – | | | | – | | | | (93 | ) | | | (2,746 | ) | | | (2,839 | ) | | | 1 | | | | (2,838 | ) |
Other comprehensive income – tax | | | | | – | | | | – | | | | (23 | ) | | | 600 | | | | 577 | | | | – | | | | 577 | |
Transferred to the income statement | | | | | – | | | | – | | | | 179 | | | | – | | | | 179 | | | | – | | | | 179 | |
Comprehensive income | | | | | – | | | | – | | | | 63 | | | | 74 | | | | 137 | | | | 2 | | | | 139 | |
Share-based payments | | | | | – | | | | – | | | | – | | | | 75 | | | | 75 | | | | – | | | | 75 | |
Tax on share-based payments | | | | | – | | | | – | | | | – | | | | 17 | | | | 17 | | | | – | | | | 17 | |
Other movements in non-controlling interests | | | | | – | | | | – | | | | – | | | | – | | | | – | | | | (17 | ) | | | (17 | ) |
| |
At 31 March 2012 | | | | | 2,172 | | | | 8,000 | | | | 1,477 | | | | 9,701 | | | | 21,350 | | | | 11 | | | | 21,361 | |
| |
| a | The allotted, called up and fully paid ordinary share capital of the company at 31 March 2012 and 31 March 2011 was £2,172m comprising 8,689,755,905 ordinary shares. |
| b | The share premium account, representing the premium on allotment of shares is not available for distribution. |
| c | For further analysis of other reserves, see note 26. |
| | |
| 38 British Telecommunications plc Annual Report & Form 20-F 2012 | | Group statement of changes in equity |
GROUP CASH FLOW STATEMENT
Year ended 31 March
| | | | | | | | | | | | | | | | | | | | | | |
| | | Note | | | | | 2012 £m | | | | | 2011
£m | | | | | 2010
£m | |
| |
Cash flow from operating activities | | | | | | | | | | | | | | | | | | | | | | |
Profit before taxation | | | | | | | | | 2,739 | | | | | | 1,959 | | | | | | 1,303 | |
Loss (profit) on disposal of businesses and associates | | | | | | | | | 19 | | | | | | (42 | ) | | | | | 10 | |
Share of profits of associates and joint ventures | | | | | | | | | (10 | ) | | | | | (21 | ) | | | | | (54 | ) |
Net finance expense | | | | | | | | | 194 | | | | | | 677 | | | | | | 877 | |
Other non-cash charges | | | | | | | | | 106 | | | | | | 88 | | | | | | 70 | |
Depreciation and amortisation | | | | | | | | | 2,972 | | | | | | 2,979 | | | | | | 3,039 | |
Decrease (increase) in inventories | | | | | | | | | 12 | | | | | | (17 | ) | | | | | 14 | |
Decrease in trade and other receivables | | | | | | | | | 28 | | | | | | 411 | | | | | | 510 | |
Decrease in trade and other payables | | | | | | | | | (67 | ) | | | | | (382 | ) | | | | | (700 | ) |
Decrease in provisions and other liabilitiesa | | | | | | | | | (2,033 | ) | | | | | (873 | ) | | | | | (591 | ) |
| |
Cash generated from operations | | | | | | | | | 3,960 | | | | | | 4,779 | | | | | | 4,478 | |
Income taxes paid | | | | | | | | | (400 | ) | | | | | (209 | ) | | | | | (76 | ) |
Income tax repayment for prior years | | | | | | | | | – | | | | | | – | | | | | | 425 | |
| |
Net cash inflow from operating activities | | | | | | | | | 3,560 | | | | | | 4,570 | | | | | | 4,827 | |
| |
| | | | | | | |
Cash flow from investing activities | | | | | | | | | | | | | | | | | | | | | | |
Interest received | | | | | | | | | 127 | | | | | | 134 | | | | | | 207 | |
Dividends received from associates and joint ventures | | | | | | | | | 4 | | | | | | 7 | | | | | | 3 | |
Proceeds on disposal of interest in associates | | | | | | | | | 7 | | | | | | 72 | | | | | | – | |
Proceeds on disposal of businesses, net of bank overdrafts | | | | | | | | | 13 | | | | | | – | | | | | | 2 | |
Acquisition of subsidiaries, net of cash acquired | | | | | | | | | (5 | ) | | | | | (8 | ) | | | | | (70 | ) |
Outflow on non-current amounts owed by parent companyb | | | | | | | | | (119 | ) | | | | | (105 | ) | | | | | (191 | ) |
Proceeds on disposal of current financial assetsc | | | | | | | | | 8,329 | | | | | | 9,267 | | | | | | 8,739 | |
Purchases of current financial assetsc | | | | | | | | | (8,845 | ) | | | | | (8,902 | ) | | | | | (8,985 | ) |
Proceeds on disposal of non-current financial assets | | | | | | | | | 1 | | | | | | – | | | | | | – | |
Purchases of non-current financial assets | | | | | | | | | – | | | | | | (18 | ) | | | | | – | |
Proceeds on disposal of property, plant and equipment | | | | | | | | | 18 | | | | | | 15 | | | | | | 29 | |
Purchases of property, plant and equipment and software | | | | | �� | | | | (2,578 | ) | | | | | (2,645 | ) | | | | | (2,509 | ) |
| |
Net cash outflow from investing activities | | | | | | | | | (3,048 | ) | | | | | (2,183 | ) | | | | | (2,775 | ) |
| |
| | | | | | | |
Cash flow from financing activities | | | | | | | | | | | | | | | | | | | | | | |
Interest paid | | | | | | | | | (693 | ) | | | | | (973 | ) | | | | | (956 | ) |
Repayment of borrowingsd | | | | | | | | | (26 | ) | | | | | (2,509 | ) | | | | | (307 | ) |
Repayment of finance lease liabilities | | | | | | | | | (2 | ) | | | | | (11 | ) | | | | | (24 | ) |
Proceeds from finance leases | | | | | | | | | – | | | | | | – | | | | | | 9 | |
Net proceeds from (repayment of) commercial paper | | | | | | | | | 522 | | | | | | 69 | | | | | | (697 | ) |
Proceeds from bank loans | | | | | | | | | – | | | | | | 340 | | | | | | 522 | |
Intra-group fundinge | | | | | | | | | (579 | ) | | | | | (525 | ) | | | | | (261 | ) |
Cash flows from derivatives relating to net debt | | | | | | | | | 258 | | | | | | 120 | | | | | | – | |
| |
Net cash used in financing activities | | | | | | | | | (520 | ) | | | | | (3,489 | ) | | | | | (1,714 | ) |
| |
| | | | | | | |
Effect of exchange rate changes on cash and cash equivalents | | | | | | | | | (2 | ) | | | | | (3 | ) | | | | | (7 | ) |
| |
| | | | | | | |
Net (decrease) increase in cash and cash equivalents | | | | | | | | | (10 | ) | | | | | (1,105 | ) | | | | | 331 | |
Cash and cash equivalents at 1 April | | | | | | | | | 328 | | | | | | 1,433 | | | | | | 1,102 | |
| |
Cash and cash equivalents at 31 March | | | 22 | | | | | | 318 | | | | | | 328 | | | | | | 1,433 | |
| |
| a | Includes pension deficit payments of £2,000m (2011: £1,030m; 2010: £525m). |
| b | In addition, there are non-cash movements in these intra-group loan arrangements which principally relate to funding and investment transactions between British Telecommunications plc and its subsidiaries where one of the parties to the transaction has an intra-group loan arrangement with the parent company. For further details see note 28. |
| c | Primarily consists of investment in and redemption of amounts held in liquidity funds. |
| d | In 2011 the repayment of borrowings included the impact of hedging. |
| e | In addition, there are non-cash movements in this intra-group loan arrangement which principally relate to settlement of amounts the ultimate parent company was owed by the parent company which were settled through their loan accounts with British Telecommunications plc. For further details see note 28. |
| | |
| Group cash flow statement | | British Telecommunications plc Annual Report & Form 20-F 2012 39 |
NOTES TO THE CONSOLIDATED FINANCIAL STATEMENTS
For the year ended 31 March 2012
Preparation of the financial statements
These consolidated financial statements have been prepared in accordance with the Companies Act 2006, Article 4 of the IAS Regulation and International Accounting Standards (IAS) and International Financial Reporting Standards (IFRS) and related interpretations, as adopted by the European Union. The consolidated financial statements are also in compliance with IFRS as issued by the International Accounting Standards Board.
The consolidated financial statements are prepared on the historical cost basis, except for certain financial and equity instruments that have been measured at fair value. The consolidated financial statements are presented in Sterling, the presentation currency of the group.
Presentation of specific items
The group’s income statement and segmental analysis separately identify trading results before specific items. Specific items are those that in management’s judgment need to be disclosed by virtue of their size, nature or incidence. In determining whether an event or transaction is specific, management considers quantitative as well as qualitative factors such as the frequency or predictability of occurrence. This is consistent with the way that financial performance is measured by management and reported to the Board and the Operating Committee of BT Group plc and assists in providing a meaningful analysis of the trading results of the group. The directors believe that presentation of the group’s results in this way is relevant to an understanding of the group’s financial performance as specific items are identified by virtue of their size, nature or incidence. Furthermore, the group considers a columnar presentation to be appropriate, as it improves the clarity of the presentation and is consistent with the way that financial performance is measured by management and reported to the Board and the Operating Committee of BT Group plc. Specific items may not be comparable to similarly titled measures used by other companies.
Items which have been considered to be specific items by virtue of their size, nature or incidence include disposals of businesses and investments, regulatory settlements, business restructuring programmes, asset impairment charges, property rationalisation programmes, net interest on pensions and the settlement of multiple tax years in a single payment. In 2009 BT Global Services contract and financial review charges were disclosed as a specific item by virtue of their size and nature. The impact of subsequent changes to the contract and financial review charges from revisions in estimates and assumptions are included within trading results before specific items, and are separately disclosed if considered significant.
Specific items for the current and prior years are disclosed in note 9.
| 2. | Critical accounting estimates and key judgements |
The preparation of financial statements in conformity with IFRS requires the use of accounting estimates and assumptions. It also requires management to exercise its judgement in the process of applying the group’s accounting policies. We continually evaluate our estimates, assumptions and judgements based on available information and experience. As the use of estimates is inherent in financial reporting, actual results could differ from these estimates. Management has discussed its critical accounting estimates and associated disclosures with the Audit & Risk Committee. The areas involving a higher degree of judgement or complexity are described below.
Long-term customer contracts
Long-term customer contracts can extend over a number of financial years. During the contractual period recognition of costs and profits may be impacted by estimates of the ultimate profitability of each contract. If, at any time, these estimates indicate that any contract will be unprofitable, the entire estimated loss for the contract is recognised immediately. If these estimates indicate that any contract will be less profitable than previously forecast, contract assets may have to be written down to the extent they are no longer considered to be fully recoverable. The group performs ongoing profitability reviews of its contracts in order to determine whether the latest estimates are appropriate. Key factors reviewed include:
| — | | Transaction volumes or other inputs affecting future revenues which can vary depending on customer requirements, plans and market position and other factors such as general economic conditions; |
| — | | Our ability to achieve key contract milestones connected with the transition, development, transformation and deployment phases for customer contracts; |
| — | | The status of commercial relations with customers and the implication for future revenue and cost projections; and |
| — | | Our estimates of future staff and third party costs and the degree to which cost savings and efficiencies are deliverable. |
The carrying value of assets comprising the costs of the initial set up, transition or transformation phase of long-term networked IT services contracts are disclosed in note 16.
Pension obligations
BT has a commitment, mainly through the BTPS, to pay pension benefits to approximately 325,000 people over a period of more than 80 years. The cost of these benefits and the present value of our pension liabilities depend on such factors as the life expectancy of the members, the salary progression of our current employees, the return that the pension fund assets will generate in the time before they are used to fund the pension payments, price inflation and the discount rate used to calculate the net present value of the future pension payments. We use estimates for all of these factors in determining the pension costs and liabilities incorporated in our financial statements. The assumptions reflect historical experience and our judgement regarding future expectations.
The value of the net pension obligation at 31 March 2012 and the key financial assumptions used to measure the obligation are disclosed in note 19.
Useful lives for property, plant and equipment and software
The plant and equipment in BT’s networks is long lived with cables and switching equipment operating for over 10 years and underground ducts being used for decades. BT also develops software for use in IT systems and platforms that supports the products and services provided to our customers and that is also used within the group. The annual depreciation and amortisation charge is sensitive to the estimated service lives allocated to each type of asset. Asset lives are assessed annually and changed when necessary to reflect current thinking on their remaining lives in light of technological change, network investment plans (including the group’s fibre roll-out programme), prospective economic utilisation and physical condition of the assets concerned. Changes to the service lives of assets implemented from 1 April 2011 had no significant impact in aggregate on the results for the year ended 31 March 2012.
The carrying values of software, property, plant and equipment are disclosed in notes 12 and 13. The useful lives applied to the principal categories of assets are disclosed on pages 42 and 43.
| | |
| 40 British Telecommunications plc Annual Report & Form 20-F 2012 | | Notes to the consolidated financial statements |
| 2. | Critical accounting estimates and key judgementscontinued |
Provisions and contingent liabilities
As disclosed in note 18, the group’s provisions principally relate to obligations arising from property rationalisation programmes, restructuring programmes, claims and litigation and regulatory risks.
Under our property rationalisation programmes we have identified a number of surplus properties. Although efforts are being made to sub-let this space, this is not always possible. Estimates have been made of the cost of vacant possession and of any shortfall arising from any sub-lease income being lower than the lease costs. Any such shortfall is recognised as a provision.
In respect of claims, litigation and regulatory risks, the group provides for anticipated costs where an outflow of resources is considered probable and a reasonable estimate can be made of the likely outcome. The prices at which regulated services are charged are often regulated and may be subject to retrospective adjustment by regulators. Estimates are used in assessing the likely value of the regulatory risk. For all risks, the ultimate liability may vary from the amounts provided and will be dependent upon the eventual outcome of any settlement.
The group exercises judgement in measuring the exposures to contingent liabilities (see note 29) through assessing the likelihood that a potential claim or liability will arise and in quantifying the possible range of financial outcomes.
Current and deferred income tax
The actual tax we pay on our profits is determined according to complex tax laws and regulations. Where the effect of these laws and regulations is unclear, we use estimates in determining the liability for the tax to be paid on our past profits which we recognise in our financial statements. We believe the estimates, assumptions and judgements are reasonable but this can involve complex issues which may take a number of years to resolve. The final determination of prior year tax liabilities could be different from the estimates reflected in the financial statements and may result in the recognition of an additional tax expense or tax credit in the income statement.
Deferred tax assets and liabilities require management judgement in determining the amounts to be recognised. In particular, judgement is used when assessing the extent to which deferred tax assets should be recognised with consideration given to the timing and level of future taxable income.
The value of the group’s income tax assets and liabilities are disclosed on the balance sheet on page 37. The carrying value of the group’s deferred tax assets and liabilities are disclosed in note 10.
Goodwill
The recoverable amount of cash generating units has been determined based on value in use calculations. These calculations require the use of estimates, including management’s expectations of future revenue growth, operating costs, profit margins and operating cash flows for each cash generating unit.
The carrying value of goodwill and the key assumptions used in performing the annual impairment assessment are disclosed in note 12.
Providing for doubtful debts
BT provides services to consumer and business customers, mainly on credit terms. We know that certain debts due to us will not be paid through the default of a small number of our customers. Estimates, based on our historical experience, are used in determining the level of debts that we believe will not be collected. These estimates include such factors as the current state of the economy and particular industry issues.
The value of the provision for doubtful debts is disclosed in note 16.
| 3. | Significant accounting policies |
Revenue
Revenue represents the fair value of the consideration received or receivable for communication services and equipment sales, net of discounts and sales taxes. Revenue from the rendering of services and sale of equipment is recognised when it is probable that the economic benefits associated with a transaction will flow to the group and the amount of revenue and associated costs can be measured reliably. Where the group acts as an agent in a transaction, it recognises revenue net of directly attributable costs.
Services
Revenue arising from separable installation and connection services is recognised when it is earned, upon activation. Revenue from the rental of analogue and digital lines and private circuits is recognised evenly over the period to which the charges relate. Revenue from calls is recognised at the time the call is made over the group’s network. Subscription fees, consisting primarily of monthly charges for access to broadband and other internet access or voice services, are recognised as revenue as the service is provided. Revenue arising from the interconnection of voice and data traffic between other telecommunications operators is recognised at the time of transit across the group’s network.
Equipment sales
Revenue from the sale of peripheral and other equipment is recognised when all the significant risks and rewards of ownership are transferred to the buyer, which is normally the date the equipment is delivered and accepted by the customer.
Long-term contractual arrangements
Revenue from long-term contractual arrangements is recognised based on the percentage of completion method. The stage of completion is estimated using an appropriate measure according to the nature of the contract. If the performance pattern is other than straight line, revenue is recognised as services are provided, usually on an output or consumption basis. For fixed price contracts, including contracts to design and build software solutions, revenue is recognised by reference to the stage of completion, as determined by the proportion of costs incurred relative to the estimated total contract costs, or other measures of completion such as the achievement of contract milestones and customer acceptance. In the case of time and materials contracts, revenue is recognised as the service is rendered.
Costs related to delivering services under long-term contractual arrangements are expensed as incurred. An element of costs incurred in the initial set up, transition or transformation phase of the contract is deferred and recorded within non-current assets. These costs are then recognised in the income statement on a straight line basis over the remaining contractual term, unless the pattern of service delivery indicates a different profile is appropriate. These costs are directly attributable to specific contracts, relate to future activity, will generate future economic benefits and are assessed for recoverability on a regular basis.
The percentage of completion method relies on estimates of total expected contract revenues and costs, as well as reliable measurement of the progress made towards completion. Unless the financial outcome of a contract can be estimated with reasonable certainty, no attributable profit is recognised. In such circumstances, revenue is recognised equal to the costs incurred to date, to the extent that such revenue is expected to be recoverable. Recognised revenue and profits are subject to revisions during the
| | |
| Notes to the consolidated financial statements | | British Telecommunications plc Annual Report & Form 20-F 2012 41 |
| 3. | Significant accounting policiescontinued |
contract if the assumptions regarding the overall contract outcome are changed. The cumulative impact of a revision in estimates is recorded in the period in which such revisions become likely and can be estimated. Where the actual and estimated costs to completion exceed the estimated revenue for a contract, the full contract life loss is recognised immediately.
Multiple element arrangements
Where a contractual arrangement consists of two or more separate elements that have value to a customer on a standalone basis, revenue is recognised for each element as if it were an individual contract. The total contract consideration is allocated between the separate elements on the basis of relative fair value and the appropriate revenue recognition criteria are applied to each element as described above.
Retirement benefits
The group’s obligation in respect of defined benefit pension plans is calculated separately for each plan by estimating the amount of future benefit that employees have earned in return for their service to date.
That benefit is discounted to determine its present value using a rate which is the yield at the balance sheet date on AA credit rated corporate bonds that have maturity dates approximating the terms of the group’s obligations. The calculation of the obligation is performed by a qualified actuary using the projected unit credit method. The net obligation or asset recognised in the balance sheet is the present value of the defined benefit obligation less the fair value of the plan assets.
The income statement expense is allocated between an operating charge and net finance expense or income. The operating charge reflects the increase in the defined benefit obligation resulting from the pension benefit earned by active employees in the current period. The net finance expense reflects the unwinding of the discount applied to the liabilities of the plan, offset by the expected return on the assets of the plan, based on conditions prevailing at the start of the year.
Actuarial gains and losses are recognised in full in the period in which they occur and are presented in the group statement of comprehensive income.
The group also operates defined contribution pension plans and the income statement expense represents the contributions payable for the year.
Property, plant and equipment
Property, plant and equipment are included in the financial statements at historical cost, less accumulated depreciation and any impairment losses. On disposal of property, plant and equipment, the difference between the sale proceeds and the net book value at the date of disposal recognised in other operating income in the income statement.
Included within the cost for network infrastructure and equipment are direct and indirect labour, materials and directly attributable overheads. Depreciation is provided on property, plant and equipment on a straight line basis from the time the asset is available for use, so as to write off the asset’s cost over the estimated useful life taking into account any expected residual value. Freehold land is not depreciated. The lives assigned to principal categories of assets are as follows:
| | |
Land and buildings | | |
Freehold buildings | | 40 years |
Leasehold land and buildings | | Unexpired portion of |
| | lease or 40 years, |
| | whichever is the shorter |
Network infrastructure and other equipment |
Transmission equipment: | | |
Duct | | 40 years |
Cable | | 3 to 25 years |
Fibre | | 5 to 20 years |
Exchange equipment | | 2 to 13 years |
Payphones and other network equipment | | 2 to 20 years |
Other | | |
Motor vehicles | | 2 to 9 years |
Computers and office equipment | | 3 to 6 years |
Assets held under finance leases are depreciated over the shorter of the lease term or their useful economic life. Residual values and useful lives are reassessed annually and, if necessary, changes are recognised prospectively.
Intangible assets
Identifiable intangible assets are recognised when the group controls the asset, it is probable that future economic benefits attributable to the asset will flow to the group and the cost of the asset can be reliably measured. All intangible assets, other than goodwill and indefinite lived assets, are amortised over their useful economic life. The method of amortisation reflects the pattern in which the assets are expected to be consumed. If the pattern cannot be determined reliably, the straight line method is used.
Goodwill
Goodwill represents the excess of the cost of an acquisition over the fair value of the group’s share of the identifiable net assets (including intangible assets) of the acquired subsidiary.
Computer software
Computer software comprises computer software licences purchased from third parties, and also the cost of internally developed software. Computer software licences purchased from third parties initially recorded at cost. Costs directly associated with the production of internally developed software, where it is probable that the software will generate future economic benefits, are recognised as intangible assets.
Telecoms licences
Licence fees paid to governments, which permit telecoms activities to be operated for defined periods, are initially recorded at cost and amortised from the time the network is available for use to the end of the licence period.
Brands and customer relationships
Intangible assets acquired through business combinations are recorded at fair value at the date of acquisition. Assumptions are used in estimating the fair values of acquired intangible assets and include management’s estimates of revenue and profits to be generated by the acquired businesses.
| | |
| 42 British Telecommunications plc Annual Report & Form 20-F 2012 | | Notes to the consolidated financial statements |
| 3. | Significant accounting policiescontinued |
Estimated useful economic lives
The estimated useful economic lives assigned to the principal categories of intangible assets are as follows:
| | |
| Computer software | | 2 to 10 years |
| Telecommunication licences | | 2 to 5 years |
| Brands, customer relationships and technology | | 3 to 15 years |
Subscriber acquisition costs
Subscriber acquisition costs are expensed as incurred, unless they meet the criteria for capitalisation, in which case they are capitalised and amortised over the shorter of the expected customer life or contractual period.
Provisions
Provisions are recognised when the group has a present legal or constructive obligation as a result of past events, it is probable that an outflow of resources will be required to settle the obligation and the amount can be reliably estimated. Provisions are determined by discounting the expected future cash flows at a pre-tax rate that reflects current market assessments of the time value of money and the risks specific to the liability. Financial liabilities within provisions are initially recognised at fair value and subsequently carried at amortised cost using the effective interest method. Onerous lease provisions have been measured at the lower of the cost to fulfil the contract or the cost to exit it.
Current and deferred income tax
Current income tax is calculated on the basis of the tax laws enacted or substantively enacted at the balance sheet date in the countries where the company’s subsidiaries, associates and joint ventures operate and generate taxable income. The group periodically evaluates positions taken in tax returns with respect to situations in which applicable tax regulation is subject to interpretation, and the group establishes provisions where appropriate on the basis of the amounts expected to be paid to tax authorities.
Deferred tax is recognised, using the liability method, in respect of temporary differences between the carrying amount of the group’s assets and liabilities and their tax base. Deferred tax liabilities are, where permitted, offset against deferred tax assets within the same taxable entity or qualifying local tax group. Any remaining deferred tax asset is recognised only when, on the basis of all available evidence, it can be regarded as probable that there will be suitable taxable profits, within the same jurisdiction, in the foreseeable future against which the deductible temporary difference can be utilised.
Deferred tax is determined using tax rates that are expected to apply in the periods in which the asset is realised or liability settled, based on tax rates and laws that have been enacted or substantively enacted by the balance sheet date.
Basis of consolidation
The group financial statements consolidate the financial statements of British Telecommunications plc (‘the company’) and its subsidiaries, and they incorporate its share of the results of associates and joint ventures using the equity method of accounting.
Accounting for subsidiaries
A subsidiary is an entity that is controlled by another entity, known as the parent. Control is the power to govern the financial and operating policies of an entity so as to obtain benefits from its activities generally accompanied by a shareholding of more than one half of the voting rights. Non-controlling interests in the net assets of consolidated subsidiaries are identified separately from the group’s equity. Non-controlling interests consist of the amounts of those interests at the date of the original business combination and non-controlling share of changes in equity since the date of the combination.
The results of subsidiaries acquired or disposed of during the year are consolidated from and up to the date of change of control. All intra-group transactions including any gains or losses, balances, income or expenses are eliminated in full on consolidation.
When the group loses control of a subsidiary, the profit or loss on disposal is calculated as the difference between (i) the aggregate of the fair value of the consideration received and the fair value of any retained interest and (ii) the previous carrying amount of the assets (including goodwill), and liabilities of the subsidiary and any non-controlling interests.
Interests in associates and joint ventures
An associate is an entity over which another entity has significant influence and that is neither a subsidiary nor an interest in a joint venture. Significant influence is the power to participate in the financial and operating policy decisions of an entity but is not control or joint control over those policies. A joint venture is an entity that is jointly controlled by two or more entities. Joint control is the contractually agreed sharing of control over an economic activity, and exists only when the strategic financial and operating decisions relating to the activity require the unanimous consent of the parties sharing control.
Investments in associates and joint ventures are initially recognised at cost. Any excess of the cost of acquisition over the group’s share of the net fair value of the identifiable assets, liabilities and contingent liabilities of an associate or joint venture at the date of acquisition is recognised as goodwill, which is included within the carrying amount of the investment. Subsequent to acquisition, the carrying value of the group’s investment in associates and joint ventures includes the group’s share of post acquisition reserves. The income statement reflects the group’s share of the results of operations after tax of the associate or joint venture.
Business combinations
Acquisitions of businesses are accounted for using the acquisition method of accounting. The consideration transferred is measured at fair value, which is the aggregate of the fair values of the assets transferred, liabilities incurred or assumed and the equity instruments issued in exchange for control of the acquiree. Acquisition-related costs are generally expensed as incurred. The acquiree’s identifiable assets and liabilities are recognised at their fair value at the acquisition date.
Goodwill arising on acquisition is recognised as an asset and measured at cost representing the excess of the aggregate of the consideration, the amount of any non-controlling interests in the acquiree, and the fair value of the acquirer’s previously held equity interest in the acquiree (if any) over the net of the fair values of the identifiable assets and liabilities at the date of acquisition.
Impairment of non-financial assets
Intangible assets with finite useful lives and property, plant and equipment are tested for impairment if events or changes in circumstances (assessed at each reporting date) indicate that the
| | |
| Notes to the consolidated financial statements | | British Telecommunications plc Annual Report & Form 20-F 2012 43 |
| 3. | Significant accounting policiescontinued |
carrying amount may not be recoverable. When an impairment test is performed, the recoverable amount is assessed by reference to the higher of the net present value of the expected future cash flows (value in use) of the relevant cash generating unit and the fair value less cost to sell.
Goodwill and intangible assets with indefinite useful lives are reviewed for impairment at least annually. Impairment losses are recognised in the income statement. If a cash generating unit is impaired, provision is made to reduce the carrying amount of the related assets to their estimated recoverable amount, normally as a specific item. Impairment losses are allocated firstly against goodwill, and secondly on a pro rata basis against intangible and other assets.
Other operating income
Other operating income is income generated by the group that arises from activities outside of the provision of communication services and equipment sales. Items reported as other operating income include income from repayment works, proceeds from scrap and cable recovery, income generated by our fleet operations, income from government grants, profits and losses on the disposal of business operations and property, plant and equipment and income generated from the exploitation of our intellectual property.
Government grants
Government grants are recognised initially as deferred income at their fair value where there is a reasonable assurance that the grant will be received and the group will comply with the conditions associated with the grant. Grants that compensate the group for expenses incurred are recognised in the income statement within other operating income in the same periods in which the associated expenditure is recognised. Grants that compensate the group for the cost of an asset are recognised in the income statement in other operating income on a straight line basis over the useful life of the asset.
Foreign currencies
Foreign currency transactions are translated into the functional currency using the exchange rates prevailing at the date of the transaction. Foreign exchange gains and losses resulting from the settlement of such transactions and from the translation of monetary assets and liabilities denominated in foreign currencies at period end exchange rates are recognised in the income statement in the line which most appropriately reflects the nature of the item or transaction.
On consolidation, assets and liabilities of foreign undertakings are translated into Sterling at year end exchange rates. The results of foreign undertakings are translated into Sterling at average rates of exchange for the year (unless this average is not a reasonable approximation of the cumulative effects of the rates prevailing on the transaction dates, in which case income and expenses are translated at the dates of the transactions). Foreign exchange differences arising on retranslation are recognised directly in a separate component of equity, the translation reserve.
In the event of the disposal of an undertaking with assets and liabilities denominated in a foreign currency, the cumulative translation difference associated with the undertaking in the translation reserve is charged or credited to the gain or loss on disposal recognised in the income statement.
Research and development
Research expenditure is recognised in the income statement in the period in which it is incurred. Development expenditure, including the cost of internally developed software, is recognised in the income statement in the period in which it is incurred unless it is
probable that economic benefits will flow to the group from the asset being developed, the cost of the asset can be reliably measured and technical feasibility can be demonstrated. Capitalisation ceases when the asset being developed is ready for use. Research and development costs include direct and indirect labour, materials and directly attributable overheads.
Leases
The determination of whether an arrangement is, or contains, a lease is based on the substance of the arrangement and requires an assessment of whether the fulfilment of the arrangement is dependent on the use of a specific asset or assets and whether the arrangement conveys the right to use the asset.
Leases of property, plant and equipment where the group holds substantially all the risks and rewards of ownership are classified as finance leases. Finance lease assets are capitalised at the commencement of the lease term at the lower of the present value of the minimum lease payments or the fair value of the leased asset. The obligations relating to finance leases, net of finance charges in respect of future periods, are recognised as liabilities. Leases are subsequently measured at amortised cost using the effective interest method.
Leases where a significant portion of the risks and rewards are held by the lessor are classified as operating leases. Rentals are charged to the income statement on a straight line basis over the period of the lease.
Share-based payments
The ultimate parent of BT plc, BT Group plc, operates a number of equity settled share-based payment arrangements, under which the group receives services from employees as consideration for equity instruments (share options and shares) of BT Group plc. Equity settled share-based payments are measured at fair value (excluding the effect of non market-based vesting conditions) at the date of grant, but including any market-based performance criteria and the impact of non-vesting conditions (for example the requirement for employees to save). The fair value determined at the grant date is recognised on a straight-line basis over the vesting period, based on the group’s estimate of the options or shares that will eventually vest and adjusted for the effect of non market-based vesting conditions. Fair value is measured using either the Binomial options pricing model or Monte Carlo simulations, whichever is most appropriate to the award.
Service and performance conditions are vesting conditions. Any other conditions are non-vesting conditions which have to be taken into account to determine the fair value of equity instruments granted. In the case that an award or option does not vest as a result of a failure to meet a non-vesting condition that is within the control of either counterparty, this is accounted for as a cancellation. Cancellations must be treated as accelerated vesting and all remaining future charges are immediately recognised. As the requirement to save under an employee share save arrangement is a non-vesting condition, employee cancellations must be treated as an accelerated vesting.
Termination benefits
Termination benefits (leaver costs) are payable when employment is terminated before the normal retirement date, or when an employee accepts voluntary redundancy in exchange for these benefits. The group recognises termination benefits when it is demonstrably committed to the affected employees leaving the group.
| | |
| 44 British Telecommunications plc Annual Report & Form 20-F 2012 | | Notes to the consolidated financial statements |
| 3. | Significant accounting policiescontinued |
Financial instruments
Financial assets
Financial assets at fair value through profit and loss
A financial asset is classified in this category if it is either acquired principally for the purpose of selling in the short-term (held for trading) or if so designated by management. Financial assets held in this category are initially recognised and subsequently measured at fair value, with changes in value recognised in the income statement in the line which most appropriately reflects the nature of the item or transaction. Any direct transaction costs are recognised immediately in the income statement.
Loans and receivables
Loans and receivables are non-derivative financial assets with fixed or determinable payments that are not quoted in an active market other than those for which the group may not recover substantially all of its initial investment, other than because of credit deterioration, which are classified as available-for-sale. Loans and receivables are initially recognised at fair value plus transaction costs and subsequently carried at amortised cost using the effective interest method, with changes in carrying value recognised in the income statement in the line which most appropriately reflects the nature of the item or transaction.
Available-for-sale financial assets
Non-derivative financial assets classified as available-for-sale are either specifically designated in this category or not classified in any of the other categories. Available-for-sale financial assets are initially recognised at fair value plus direct transaction costs and then re-measured at subsequent reporting dates to fair value, with unrealised gains and losses (except for changes in exchange rates for monetary items, interest, dividends and impairment losses, which are recognised in the income statement) recognised in equity until the financial asset is derecognised, at which time the cumulative gain or loss previously recognised in equity is taken to the income statement, in the line that most appropriately reflects the nature of the item or transaction.
Trade and other receivables
Financial assets within trade and other receivables are initially recognised at fair value, which is usually the original invoiced amount, and are subsequently carried at amortised cost using the effective interest method less provisions made for doubtful receivables. Provisions are made specifically where there is evidence of a risk of non payment, taking into account ageing, previous losses experienced and general economic conditions.
Cash and cash equivalents
Cash and cash equivalents comprise cash in hand and current balances with banks and similar institutions, which are readily convertible to cash and which are subject to insignificant risk of changes in value and have an original maturity of three months or less. For the purpose of the consolidated cash flow statement, cash and cash equivalents are as defined above net of outstanding bank overdrafts. Bank overdrafts are included within loans and other borrowings, in current liabilities on the balance sheet.
Impairment of financial assets
The group assesses at each balance sheet date whether a financial asset or group of financial assets are impaired. Where there is objective evidence that an impairment loss has arisen on assets carried at amortised cost, the carrying amount is reduced with the loss being recognised in the income statement. The impairment loss is measured as the difference between that asset’s carrying amount
and the present value of estimated future cash flows discounted at the financial asset’s original effective interest rate.
Financial liabilities
Trade and other payables
Financial liabilities within trade and other payables are initially recognised at fair value, which is usually the original invoiced amount, and subsequently carried at amortised cost using the effective interest method.
Loans and other borrowings
Loans and other borrowings are initially recognised at fair value of amounts received net of transaction costs. Loans and other borrowings are subsequently measured at amortised cost using the effective interest method and, if included in a fair value hedge relationship, are revalued to reflect the fair value movements on the hedged risk associated with the loans and other borrowings. The resultant amortisation of fair value movements, on de-designation of the hedge, are recognised in the income statement.
Derivative financial instruments and hedge accounting
The group uses derivative financial instruments mainly to reduce exposure to foreign exchange and interest rate risks. The group does not hold or issue derivative financial instruments for financial trading purposes. However, derivatives that do not qualify for hedge accounting are classified as held for trading and are initially recognised and subsequently measured at fair value. The gain or loss on re-measurement to fair value is recognised immediately in the income statement in net finance expense. Derivative financial instruments are classified as current assets or current liabilities where they have a maturity period within 12 months. Where derivative financial instruments have a maturity period greater than 12 months, they are classified within either non-current assets or non-current liabilities.
Where derivatives qualify for hedge accounting, recognition of any resultant gain or loss depends on the nature of the hedge. To qualify for hedge accounting, hedge documentation must be prepared at inception and the hedge must be expected to be highly effective both prospectively and retrospectively. The hedge is tested for effectiveness at inception and in subsequent periods in which the hedge remains in operation. Hedge accounting is discontinued when the hedging instrument expires, or is sold, terminated or no longer qualifies for hedge accounting or the group chooses to end the hedge relationship. The group designates certain derivatives as either cash flow hedges or fair value hedges.
Cash flow hedges
When a derivative financial instrument is designated as a hedge of the variability in cash flows of a recognised asset or liability, or a highly probable transaction, the effective part of any gain or loss on the derivative financial instrument is recognised directly in equity, in the cash flow reserve. For cash flow hedges of recognised assets or liabilities, the associated cumulative gain or loss is removed from equity and recognised in the same line in the income statement in the same period or periods during which the hedged transaction affects the income statement. Any ineffectiveness arising on a cash flow hedge of a recognised asset or liability is recognised immediately in the same income statement line as the hedged item. Where ineffectiveness arises on highly probable transactions, it is recognised in the line which most appropriately reflects the nature of the item or transaction.
Fair value hedges
When a derivative financial instrument is designated as a hedge of the variability in fair value of a recognised asset or liability, or unrecognised firm commitment, at each reporting date the change
| | |
| Notes to the consolidated financial statements | | British Telecommunications plc Annual Report & Form 20-F 2012 45 |
| 3. | Significant accounting policiescontinued |
in fair value of the derivative that is designated as a fair value hedge is recorded in the income statement, together with any changes in fair value of the hedged asset or liability that is attributable to the hedged risk.
Accounting standards, interpretations and amendments in the year ended 31 March 2012
The following amended standards and interpretations were adopted in 2012. They have had no significant impact on the group’s results or financial position for the current or prior years but may impact the accounting for future transactions or arrangements.
| — | | Amendments to IAS 24 ‘Related Party Disclosures’ |
| — | | Amendments to IFRIC 14 ‘Prepayments of a Minimum Funding Requirement’ |
| — | | IFRIC 19 ‘Extinguishing Financial Liabilities with Equity Instruments’ and |
| — | | Improvements to IFRS 2010. |
Accounting standards, interpretations and amendments not yet effective
Certain new standards, interpretations and amendments to existing standards have been published that are mandatory for the group’s accounting periods beginning on 1 April 2013. Those which are considered to be relevant to the group’s operations are set out below.
Amendments to IAS 19 ‘Employee Benefits’
These amendments are intended to provide a clearer indication of an entity’s obligations resulting from the provision of defined benefit pension plans and how those obligations will affect its financial position, financial performance and cash flow. The amendments include:
| — | | The removal of the options to defer recognition of actuarial gains and losses and for alternative presentation of gains and losses by requiring immediate recognition of actuarial gains or losses in full in other comprehensive income and the inclusion of service and finance costs and plan administration costs in the income statement; |
| — | | The replacement of the expected return on pension plan assets and interest expense on pension plan liabilities with a single net interest component calculated on the net defined benefit liability or asset using the discount rate used to determine the defined benefit obligation; and |
| — | | Additional disclosures to explain the characteristics of a company’s defined benefit plans, the amounts recognised in the financial statements and the risks arising from defined benefit plans. |
IAS 19 requires retrospective adoption and therefore prior periods will be restated. The group estimates the impact on 2012 had the amendments applied would have been to increase operating costs by approximately £30m and reduce the net finance income on pensions, reported as a specific item, by approximately £295m, with compensating adjustments in other comprehensive income leaving equity unchanged. The group will also be required to make additional narrative disclosures.
Other new standards and amendments
The impact of the following new standards, amendments and interpretations which are effective from 1 April 2013 is under review, but the group does not currently expect any of these changes to have a significant impact on the group’s results or financial position.
| — | | Amendments to IFRS 7 ‘Financial Instruments: Disclosures’ |
| — | | IFRS 9 ‘Financial Instruments’ |
| — | | IFRS 10 ‘Consolidated Financial Statements’ |
| — | | IFRS 11 ‘Joint Arrangements’ |
| — | | IFRS 12 ‘Disclosure of Interests in Other Entities’ |
| — | | IFRS 13 ‘Fair Value Measurement’ |
| — | | Amendment to IAS 1 ‘Presentation of Items of Other Comprehensive Income’ |
| — | | Amendments to IAS 32 ‘Financial Instruments: Presentation’ and |
| — | | Improvements to IFRS 2011. |
| | |
| 46 British Telecommunications plc Annual Report & Form 20-F 2012 | | Notes to the consolidated financial statements |
The group’s operating segments are reported based on financial information provided to the BT Group plc Operating Committee, which is the key management committee and represents the ‘chief operating decision maker’. The BT Group plc Operating Committee is chaired by the BT Group plc Group Chief Executive and the other members are the BT Group plc Group Finance Director and the Chief Executives of BT Retail, BT Wholesale, BT Global Services, BT Innovate & Design and BT Operate. The Chief Executive of Openreach, the BT Group plc Company Secretary and the Group HR Director also normally attend all meetings.
The group’s organisational structure reflects the different customer groups to which it provides communications products and services via its customer-facing lines of business – BT Global Services, BT Retail, BT Wholesale and Openreach. The customer-facing lines of business are supported by two internal service units – BT Innovate & Design and BT Operate. The customer-facing lines of business are the group’s reportable segments and generate substantially all the group’s revenue.
The remaining operations of the group are aggregated and included within the ‘Other’ category to reconcile to the consolidated results of the group. The ‘Other’ category includes BT Innovate & Design and BT Operate and costs associated with the group’s centralised functions including procurement and supply chain, fleet and property management. Provisions for the settlement of significant legal, commercial and regulatory disputes, which are negotiated at a group level, are initially recorded in the ‘Other’ segment. On resolution of the dispute, the full impact is recognised in the relevant lines of business results offset in the group results by the utilisation of the provision previously charged to the ‘Other’ segment. Settlements which are particularly significant or cover more than one financial year may fall within the definition of specific items as detailed on page 40.
The costs incurred by BT Innovate & Design and BT Operate are allocated to the customer-facing lines of business in line with the services they provide. The depreciation and amortisation incurred by BT Operate in relation to the networks and systems it manages and operates on behalf of the customer-facing lines of business are allocated to the lines of business based on their respective utilisation. Capital expenditure incurred by BT Innovate & Design for specific projects undertaken on behalf of the customer-facing lines of business is allocated based on the value of the directly attributable expenditure incurred. Where projects are not directly attributable to a particular line of business, capital expenditure is allocated based on the proportion of estimated future economic benefits. Capital expenditure incurred by BT Operate is allocated to the customer-facing lines of business in proportion to operating cost recoveries. BT Innovate & Design and BT Operate and the group’s centralised functions are not reportable segments as they did not meet the quantitative thresholds as set out in IFRS 8 ‘Operating Segments’ for any of the years presented.
Information regarding the results of each reportable segment is provided below. Performance is measured based on adjusted EBITDA, defined as EBITDA before specific items, as included in the internal financial reports reviewed by the BT Group plc Operating Committee. EBITDA is defined as the operating profit or loss before depreciation, amortisation, net finance expense and taxation. Adjusted EBITDA is considered to be a useful measure of the operating performance of the lines of business because it approximates the underlying operating cash flow by eliminating depreciation and amortisation and also provides a meaningful analysis of trading performance by excluding specific items which are disclosed separately by virtue of their size, nature or incidence. Specific items are detailed in note 9 and are not allocated to the reportable segments as this reflects how they are reported to the Operating Committee of BT Group plc. Finance expense and income is not allocated to the reportable segments as this activity is managed by the central treasury function which manages the overall net debt position of the BT Group plc group.
| | |
| Notes to the consolidated financial statements | | British Telecommunications plc Annual Report & Form 20-F 2012 47 |
| 4. | Segment informationcontinued |
Segment revenue and profit
| | | | | | | | | | | | | | | | | | | | | | | | | | | | | | | | | | |
Year ended 31 March 2012 | |
| BT Global
Services
£m |
| | | |
| BT Retail
£m |
| | | |
| BT Wholesale
£m |
| | | |
| Openreach
£m |
| | | |
| Other
£m |
| | | |
| Total
£m |
|
| |
Segment revenue | | | 7,809 | | | | | | 7,393 | | | | | | 3,923 | | | | | | 5,136 | | | | | | 50 | | | | | | 24,311 | |
Internal revenue | | | – | | | | | | (511 | ) | | | | | (980 | ) | | | | | (3,513 | ) | | | | | – | | | | | | (5,004 | ) |
| |
Revenue from external customersa | | | 7,809 | | | | | | 6,882 | | | | | | 2,943 | | | | | | 1,623 | | | | | | 50 | | | | | | 19,307 | |
| |
EBITDAb | | | 627 | | | | | | 1,830 | | | | | | 1,208 | | | | | | 2,299 | | | | | | 104 | | | | | | 6,068 | |
Depreciation and amortisation | | | (712 | ) | | | | | (410 | ) | | | | | (604 | ) | | | | | (939 | ) | | | | | (307 | ) | | | | | (2,972 | ) |
| |
Operating profit (loss)a | | | (85 | ) | | | | | 1,420 | | | | | | 604 | | | | | | 1,360 | | | | | | (203 | ) | | | | | 3,096 | |
| | | | |
Specific items (note 9) | | | | | | | | | | | | | | | | | | | | | | | | | | | | | | | | | (173 | ) |
| | | | | | | | | | | | | | | | | | | | | | | | | | | | | | | | | | |
Operating profit | | | | | | | | | | | | | | | | | | | | | | | | | | | | | | | | | 2,923 | |
Net finance expensec | | | | | | | | | | | | | | | | | | | | | | | | | | | | | | | | | (194 | ) |
Share of post tax profit of associates and joint ventures | | | | | | | | | | | | | | | | | | | | | | | | | | | | | | | | | 10 | |
| |
Profit before tax | | | | | | | | | | | | | | | | | | | | | | | | | | | | | | | | | 2,739 | |
| |
| | | | | | | | | | | |
Year ended 31 March 2011 | |
| BT Global
Servicesd
£m |
�� | | | |
| BT Retaild
£m |
| | | |
| BT Wholesaled
£m |
| | | |
| Openreachd
£m |
| | | |
| Other
£m |
| | | |
| Total
£m |
|
| |
Segment revenue | | | 8,059 | | | | | | 7,700 | | | | | | 4,201 | | | | | | 4,930 | | | | | | 38 | | | | | | 24,928 | |
Internal revenue | | | – | | | | | | (447 | ) | | | | | (979 | ) | | | | | (3,426 | ) | | | | | – | | | | | | (4,852 | ) |
| |
Revenue from external customersa | | | 8,059 | | | | | | 7,253 | | | | | | 3,222 | | | | | | 1,504 | | | | | | 38 | | | | | | 20,076 | |
| |
EBITDAb | | | 593 | | | | | | 1,784 | | | | | | 1,316 | | | | | | 2,132 | | | | | | 56 | | | | | | 5,881 | |
Depreciation and amortisation | | | (734 | ) | | | | | (443 | ) | | | | | (619 | ) | | | | | (877 | ) | | | | | (306 | ) | | | | | (2,979 | ) |
| |
Operating profit (loss)a | | | (141 | ) | | | | | 1,341 | | | | | | 697 | | | | | | 1,255 | | | | | | (250 | ) | | | | | 2,902 | |
| | | | |
Specific items (note 9) | | | | | | | | | | | | | | | | | | | | | | | | | | | | | | | | | (329 | ) |
| | | | | | | | | | | | | | | | | | | | | | | | | | | | | | | | | | |
Operating profit | | | | | | | | | | | | | | | | | | | | | | | | | | | | | | | | | 2,573 | |
Net finance expensec | | | | | | | | | | | | | | | | | | | | | | | | | | | | | | | | | (677 | ) |
Share of post tax profit of associates and joint ventures | | | | | | | | | | | | | | | | | | | | | | | | | | | | | | | | | 21 | |
Profit on disposal of interest in associate | | | | | | | | | | | | | | | | | | | | | | | | | | | | | | | | | 42 | |
| |
Profit before tax | | | | | | | | | | | | | | | | | | | | | | | | | | | | | | | | | 1,959 | |
| |
| | | | | | | | | | | |
Year ended 31 March 2010 | |
| BT Global
Servicesd
£m |
| | | |
| BT Retaild
£m |
| | | |
| BT Wholesaled
£m |
| | | |
| Openreachd
£m |
| | | |
| Other
£m |
| | | |
| Total
£m |
|
| |
Segment revenue | | | 8,522 | | | | | | 8,078 | | | | | | 4,583 | | | | | | 5,164 | | | | | | 40 | | | | | | 26,387 | |
Internal revenue | | | – | | | | | | (373 | ) | | | | | (1,226 | ) | | | | | (3,877 | ) | | | | | – | | | | | | (5,476 | ) |
| |
Revenue from external customersa | | | 8,522 | | | | | | 7,705 | | | | | | 3,357 | | | | | | 1,287 | | | | | | 40 | | | | | | 20,911 | |
| |
EBITDAb | | | 457 | | | | | | 1,777 | | | | | | 1,353 | | | | | | 1,960 | | | | | | 107 | | | | | | 5,654 | |
Depreciation and amortisation | | | (815 | ) | | | | | (459 | ) | | | | | (680 | ) | | | | | (856 | ) | | | | | (229 | ) | | | | | (3,039 | ) |
| |
Operating profit (loss)a | | | (358 | ) | | | | | 1,318 | | | | | | 673 | | | | | | 1,104 | | | | | | (122 | ) | | | | | 2,615 | |
| | | | |
Specific items (note 9) | | | | | | | | | | | | | | | | | | | | | | | | | | | | | | | | | (477 | ) |
| | | | | | | | | | | | | | | | | | | | | | | | | | | | | | | | | | |
Operating profit | | | | | | | | | | | | | | | | | | | | | | | | | | | | | | | | | 2,138 | |
Net finance expensec | | | | | | | | | | | | | | | | | | | | | | | | | | | | | | | | | (877 | ) |
Share of post tax profit of associates and joint ventures | | | | | | | | | | | | | | | | | | | | | | | | | | | | | | | | | 54 | |
Loss on disposal of interest in associate | | | | | | | | | | | | | | | | | | | | | | | | | | | | | | | | | (12 | ) |
| |
Profit before tax | | | | | | | | | | | | | | | | | | | | | | | | | | | | | | | | | 1,303 | |
| |
| b | EBITDA is stated before specific items is a non-GAAP measure provided in addition to the disclosure requirements defined under IFRS. The rationale for using non-GAAP measures is explained on pages 28 and 29. |
| c | Net finance expense includes specific item income of £197m in 2012 (2011: £79m expense, 2010: £268m expense). See note 9. |
| d | In 2012 the group moved certain customer accounts between lines of business. Comparatives for 2011 and 2010 have been restated to be on a consistent basis. The impact on line of business results in 2011 was to increase revenue of BT Global Services and Openreach by £12m and £45m (2010: £9m and £46m) and to decrease revenue of BT Retail and BT Wholesale by £49m and £8m (2010: £46m and £9m). There is no impact on line of business EBITDA and there is no impact on total group results. |
| | |
| 48 British Telecommunications plc Annual Report & Form 20-F 2012 | | Notes to the consolidated financial statements |
| 4. | Segment informationcontinued |
Internal revenue and costs
Intra group revenue generated from the sale of regulated products and services is based on market price. Intra group revenue from the sale of other products and services is agreed between the relevant lines of business and therefore line of business profitability can be impacted by transfer pricing levels. The majority of the internal trading relates to Openreach and arises on rentals, and any associated connection or migration charges, of the UK access lines and other network products to the customer-facing lines of business both directly, and also indirectly, through BT Operate which is included within the ‘Other’ segment. Internal revenue arising in BT Retail relates primarily to BT Ireland and BT Enterprises. Internal revenue arising in BT Wholesale relates to the sale of line cards and access electronic services to Openreach.
| | | Global | | | Global | | | Global | | | Global | | | Global | | | Global | | | Global | | | Global | | | Global | | | Global | | | Global | |
| | | Internal cost recorded by | |
Year ended 31 March 2012 | |
| BT Global
Services £m |
| | | |
| BT Retail
£m |
| | | |
| BT Wholesale
£m |
| | | |
| Openreach
£m |
| | | |
| Other
£m |
| | | |
| Total
£m |
|
| |
Internal revenue recorded by | | | | | | | | | | | | | | | | | | | | | | | | | | | | | | | | | | |
BT Global Services | | | – | | | | | | – | | | | | | – | | | | | | – | | | | | | – | | | | | | – | |
BT Retail | | | 359 | | | | | | – | | | | | | 99 | | | | | | 5 | | | | | | 48 | | | | | | 511 | |
BT Wholesale | | | – | | | | | | – | | | | | | – | | | | | | 980 | | | | | | – | | | | | | 980 | |
Openreach | | | 226 | | | | | | 1,625 | | | | | | 245 | | | | | | – | | | | | | 1,417 | | | | | | 3,513 | |
| |
Total | | | 585 | | | | | | 1,625 | | | | | | 344 | | | | | | 985 | | | | | | 1,465 | | | | | | 5,004 | |
| |
| |
| | | Internal cost recorded by | |
Year ended 31 March 2011 | |
| BT Global
Services £m |
| | | |
| BT Retail
£m |
| | | |
| BT Wholesale
£m |
| | | |
| Openreach
£m |
| | | |
| Other
£m |
| | | |
| Total
£m |
|
| |
Internal revenue recorded by | | | | | | | | | | | | | | | | | | | | | | | | | | | | | | | | | | |
BT Global Services | | | – | | | | | | – | | | | | | – | | | | | | – | | | | | | – | | | | | | – | |
BT Retail | | | 309 | | | | | | – | | | | | | 64 | | | | | | 3 | | | | | | 71 | | | | | | 447 | |
BT Wholesale | | | – | | | | | | – | | | | | | – | | | | | | 979 | | | | | | – | | | | | | 979 | |
Openreach | | | 242 | | | | | | 1,779 | | | | | | 198 | | | | | | – | | | | | | 1,207 | | | | | | 3,426 | |
| |
Total | | | 551 | | | | | | 1,779 | | | | | | 262 | | | | | | 982 | | | | | | 1,278 | | | | | | 4,852 | |
| |
| |
| | | Internal cost recorded by | |
Year ended 31 March 2010 | |
| BT Global
Services £m |
| | | |
| BT Retail
£m |
| | | |
| BT Wholesale
£m |
| | | |
| Openreach
£m |
| | | |
| Other
£m |
| | | |
| Total
£m |
|
| |
Internal revenue recorded by | | | | | | | | | | | | | | | | | | | | | | | | | | | | | | | | | | |
BT Global Services | | | – | | | | | | – | | | | | | – | | | | | | – | | | | | | – | | | | | | – | |
BT Retail | | | 233 | | | | | | – | | | | | | 51 | | | | | | 2 | | | | | | 87 | | | | | | 373 | |
BT Wholesale | | | – | | | | | | – | | | | | | – | | | | | | 1,226 | | | | | | – | | | | | | 1,226 | |
Openreach | | | 263 | | | | | | 1,988 | | | | | | 131 | | | | | | – | | | | | | 1,495 | | | | | | 3,877 | |
| |
Total | | | 496 | | | | | | 1,988 | | | | | | 182 | | | | | | 1,228 | | | | | | 1,582 | | | | | | 5,476 | |
| |
| | | | | | | | | | | |
| Capital expenditure | | | | | | | | | | | | | | | | | | | | | | | | | | | | | | | | | | |
| | | | | | | | | | | |
Year ended 31 March 2012 | |
| BT Global
Services £m |
| | | |
| BT Retail
£m |
| | | |
| BT Wholesale
£m |
| | | |
| Openreach
£m |
| | | |
| Other
£m |
| | | |
| Total
£m |
|
| |
Property, plant and equipment | | | 414 | | | | | | 364 | | | | | | 260 | | | | | | 980 | | | | | | 117 | | | | | | 2,135 | |
Intangible assets | | | 146 | | | | | | 70 | | | | | | 76 | | | | | | 95 | | | | | | 72 | | | | | | 459 | |
| |
Capital expenditure | | | 560 | | | | | | 434 | | | | | | 336 | | | | | | 1,075 | | | | | | 189 | | | | | | 2,594 | |
| |
| | | | | | | | | | | |
Year ended 31 March 2011 | |
| BT Global
Services £m |
| | | |
| BT Retail
£m |
| | | |
| BT Wholesale
£m |
| | | |
| Openreach
£m |
| | | |
| Other
£m |
| | | |
| Total
£m |
|
| |
Property, plant and equipment | | | 338 | | | | | | 355 | | | | | | 246 | | | | | | 982 | | | | | | 169 | | | | | | 2,090 | |
Intangible assets | | | 160 | | | | | | 79 | | | | | | 83 | | | | | | 105 | | | | | | 73 | | | | | | 500 | |
| |
Capital expenditure | | | 498 | | | | | | 434 | | | | | | 329 | | | | | | 1,087 | | | | | | 242 | | | | | | 2,590 | |
| |
| | |
| Notes to the consolidated financial statements | | British Telecommunications plc Annual Report & Form 20-F 2012 49 |
| 4. | Segment informationcontinued |
Revenue by products and services
| | | 14,766 | | | 14,766 | | | 14,766 | | | 14,766 | | | 14,766 | |
Year ended 31 March | |
| 2012
£m |
| | | |
| 2011a
£m |
| | | |
| 2010
£m |
|
| |
ICT and managed networks | | | 6,584 | | | | | | 6,632 | | | | | | 6,574 | |
Broadband and convergence | | | 2,971 | | | | | | 2,767 | | | | | | 2,677 | |
Calls and lines | | | 5,094 | | | | | | 5,595 | | | | | | 6,225 | |
Transit | | | 1,128 | | | | | | 1,518 | | | | | | 1,758 | |
Conveyance, interconnect circuits, WLR, global carrier and other wholesale | | | 1,476 | | | | | | 1,512 | | | | | | 1,493 | |
Other products and services | | | 2,054 | | | | | | 2,052 | | | | | | 2,184 | |
| |
Revenuea | | | 19,307 | | | | | | 20,076 | | | | | | 20,911 | |
| |
Geographic information
The UK is the group’s country of domicile and the group generates the majority of its revenue from external customers in the UK. The geographic analysis of revenue is on the basis of the country of origin in which the customer is invoiced.
Revenue from external customers
| | | 14,766 | | | 14,766 | | | 14,766 | | | 14,766 | | | 14,766 | |
Year ended 31 March | |
| 2012
£m |
| | | |
| 2011
£m |
| | | |
| 2010
£m |
|
| |
UK | | | 14,766 | | | | | | 15,575 | | | | | | 16,116 | |
Europe, Middle East and Africa, excluding the UK | | | 2,973 | | | | | | 3,064 | | | | | | 3,250 | |
Americas | | | 1,070 | | | | | | 990 | | | | | | 1,235 | |
Asia Pacific | | | 498 | | | | | | 447 | | | | | | 310 | |
| |
Revenuea | | | 19,307 | | | | | | 20,076 | | | | | | 20,911 | |
| |
Non-current assets
| | | 14,766 | | | 14,766 | | | 14,766 | |
At 31 March | |
| 2012
£m |
| | | |
| 2011
£m |
|
| |
UK | | | 14,776 | | | | | | 15,135 | |
Europe, Middle East and Africa, excluding the UK | | | 2,444 | | | | | | 2,673 | |
Americas | | | 568 | | | | | | 601 | |
Asia Pacific | | | 57 | | | | | | 61 | |
| |
Non-current assets | | | 17,845 | | | | | | 18,470 | |
| |
Non-current assets, which exclude derivative financial instruments, investments and deferred tax assets, are based on the location of the assets.
| | | 14,766 | | | 14,766 | | | 14,766 | | | 14,766 | | | 14,766 | | | 14,766 | | | 14,766 | |
Year ended 31 March | | | Notes | | | | |
| 2012
£m |
| | | |
| 2011
£m |
| | | |
| 2010
£m |
|
| |
Profits on disposal of property, plant and equipment | | | | | | | | | 129 | | | | | | 103 | | | | | | 75 | |
Income from repayment works | | | | | | | | | 62 | | | | | | 62 | | | | | | 74 | |
Other operating income | | | | | | | | | 196 | | | | | | 208 | | | | | | 229 | |
| |
Other operating income before specific items | | | | | | | | | 387 | | | | | | 373 | | | | | | 378 | |
Specific items | | | 9 | | | | | | (19 | ) | | | | | – | | | | | | 2 | |
| |
Other operating income | | | | | | | | | 368 | | | | | | 373 | | | | | | 380 | |
| |
| | |
| 50 British Telecommunications plc Annual Report & Form 20-F 2012 | | Notes to the consolidated financial statements |
| | | 3,956 | | | 3,956 | | | 3,956 | | | 3,956 | | | 3,956 | | | 3,956 | | | 3,956 | |
Year ended 31 March | | | Notes | | | | |
| 2012
£m |
| | | |
| 2011
£m |
| | | |
| 2010
£m |
|
| |
Costs by nature | | | | | | | | | | | | | | | | | | | | | | |
Staff costs: | | | | | | | | | | | | | | | | | | | | | | |
Wages and salaries | | | | | | | | | 3,956 | | | | | | 3,940 | | | | | | 4,173 | |
Social security costs | | | | | | | | | 454 | | | | | | 456 | | | | | | 447 | |
Pension costs | | | 19 | | | | | | 393 | | | | | | 416 | | | | | | 304 | |
Share-based payment expense | | | 20 | | | | | | 75 | | | | | | 68 | | | | | | 71 | |
| |
Total staff costs | | | | | | | | | 4,878 | | | | | | 4,880 | | | | | | 4,995 | |
Own work capitalised | | | | | | | | | (652 | ) | | | | | (718 | ) | | | | | (575 | ) |
| |
Net staff costs | | | | | | | | | 4,226 | | | | | | 4,162 | | | | | | 4,420 | |
Net indirect labour costsa | | | | | | | | | 579 | | | | | | 629 | | | | | | 722 | |
| |
Net labour costs | | | | | | | | | 4,805 | | | | | | 4,791 | | | | | | 5,142 | |
Payments to telecommunications operators | | | | | | | | | 3,153 | | | | | | 3,740 | | | | | | 4,083 | |
Property and energy costs | | | | | | | | | 1,066 | | | | | | 1,149 | | | | | | 1,284 | |
Network operating and IT costs | | | | | | | | | 630 | | | | | | 706 | | | | | | 781 | |
Other operating costsb | | | | | | | | | 3,972 | | | | | | 4,182 | | | | | | 4,345 | |
Depreciation of property, plant and equipment | | | | | | | | | | | | | | | | | | | | | | |
Owned assets | | | 13 | | | | | | 2,248 | | | | | | 2,255 | | | | | | 2,260 | |
Held under finance leases | | | 13 | | | | | | 29 | | | | | | 33 | | | | | | 44 | |
Amortisation of intangible assets | | | 12 | | | | | | 695 | | | | | | 691 | | | | | | 735 | |
| |
Total operating costs before specific items | | | | | | | | | 16,598 | | | | | | 17,547 | | | | | | 18,674 | |
Specific items | | | 9 | | | | | | (256 | ) | | | | | 329 | | | | | | 427 | |
| |
Total operating costs | | | | | | | | | 16,342 | | | | | | 17,876 | | | | | | 19,101 | |
| |
Operating costs before specific items include the following: | | | | | | | | | | | | | | | | | | | | | | |
Leaver costsc | | | | | | | | | 97 | | | | | | 57 | | | | | | 142 | |
Research and development expenditured | | | | | | | | | 821 | | | | | | 833 | | | | | | 935 | |
Operating lease charges | | | | | | | | | 404 | | | | | | 395 | | | | | | 451 | |
Foreign currency losses (gains) | | | | | | | | | 7 | | | | | | (7 | ) | | | | | (2 | ) |
| |
| a | Net of capitalised indirect labour costs of £335m (2011: £329m, 2010: £440m). |
| b | Other operating costs also include a net charge of £nil (2011: £2m charge, 2010: £1m charge) relating to fair value movements on derivatives recycled from the cash flow reserve. |
| c | Leaver costs are included within wages and salaries and social security costs except for leaver costs associated with the restructuring of BT Global Services in 2011 and 2010 which were recorded as a specific item. |
| d | Research and development expenditure includes amortisation of £536m (2011: £444m, 2010: £491m) in respect of internally developed computer software. |
| | | 000 | | | 000 | | | 000 | | | | 000 | | | 000 | | | 000 | | | | 000 | | | 000 | | | 000 | |
| | | 2012 | | | | 2011 | | | | 2010 | |
| | | | | | | | | | | | |
Number of employees in the groupa | |
| Year end
000 |
| | | |
| Average
000 |
| |
| Year end
000 |
| | | |
| Average
000 |
| |
| Year end
000 |
| | | |
| Average
000 |
|
| |
UK | | | 73.9 | | | | | | 74.7 | | | | 75.7 | | | | | | 77.1 | | | | 78.2 | | | | | | 81.1 | |
Non-UK | | | 15.1 | | | | | | 16.0 | | | | 16.9 | | | | | | 17.5 | | | | 17.9 | | | | | | 18.6 | |
| |
Total employees | | | 89.0 | | | | | | 90.7 | | | | 92.6 | | | | | | 94.6 | | | | 96.1 | | | | | | 99.7 | |
| |
| | | |
| | | 2012 | | | | 2011 | | | | 2010 | |
| | | | | | | | | | | | |
Number of employees in the groupa | |
| Year end
000 |
| | | |
| Average
000 |
| |
| Year end
000 |
| | | |
| Average
000 |
| |
| Year end
000 |
| | | |
| Average
000 |
|
| |
BT Global Services | | | 20.0 | | | | | | 20.9 | | | | 21.8 | | | | | | 22.6 | | | | 24.1 | | | | | | 25.8 | |
BT Retail | | | 16.3 | | | | | | 16.4 | | | | 16.6 | | | | | | 17.4 | | | | 18.2 | | | | | | 19.0 | |
BT Wholesale | | | 1.4 | | | | | | 1.6 | | | | 1.9 | | | | | | 2.1 | | | | 2.4 | | | | | | 2.4 | |
Openreach | | | 30.9 | | | | | | 31.2 | | | | 31.3 | | | | | | 30.9 | | | | 30.7 | | | | | | 31.2 | |
Other | | | 20.4 | | | | | | 20.6 | | | | 21.0 | | | | | | 21.6 | | | | 20.7 | | | | | | 21.3 | |
| |
Total employees | | | 89.0 | | | | | | 90.7 | | | | 92.6 | | | | | | 94.6 | | | | 96.1 | | | | | | 99.7 | |
| |
| a | The numbers disclosed are the equivalent full-time employees including both full and part-time employees. |
| | |
| Notes to the consolidated financial statements | | British Telecommunications plc Annual Report & Form 20-F 2012 51 |
| 8. | Audit, audit related and other non-audit services |
The following fees were paid or are payable to the company’s auditors, PricewaterhouseCoopers LLP, for the three years ended 31 March 2012.
| | | 2,655 | | | 2,655 | | | 2,655 | | | 2,655 | | | 2,655 | |
Year ended 31 March | |
| 2012
£000 |
| | | |
| 2011a
£000 |
| | | |
| 2010a
£000 |
|
| |
Fees payable to the company’s auditors and its associates for: | | | | | | | | | | | | | | | | |
Audit services | | | | | | | | | | | | | | | | |
The audit of parent company and consolidated financial statements | | | 2,655 | | | | | | 2,691 | | | | | | 2,434 | |
The audit of the company’s subsidiaries | | | 5,416 | | | | | | 4,630 | | | | | | 4,732 | |
| |
| | | 8,071 | | | | | | 7,321 | | | | | | 7,166 | |
Audit related assurance services | | | 1,558 | | | | | | 1,556 | | | | | | 1,010 | |
| |
Other non-audit services | | | | | | | | | | | | | | | | |
Taxation compliance services | | | 455 | | | | | | 110 | | | | | | 123 | |
Taxation advisory services | | | 770 | | | | | | 1,046 | | | | | | 669 | |
All other assurance services | | | 74 | | | | | | 223 | | | | | | 451 | |
All other services | | | 641 | | | | | | 593 | | | | | | 457 | |
| |
| | | 1,940 | | | | | | 1,972 | | | | | | 1,700 | |
| |
Total services | | | 11,569 | | | | | | 10,849 | | | | | | 9,876 | |
| |
| a | In 2012 the group adopted the disclosure requirements of the Companies (Disclosure of Auditor Remuneration and Liability Limitation Agreements) (Amendment) Regulations 2011. Comparatives for 2011 and 2010 have been re-presented to be on a consistent basis. |
Audit services – represent fees payable for services in relation to the audit of the parent company and the consolidated financial statements, including fees for reports under section 404 of the US Public Company Accounting Reform and Investor Protection Act of 2002 (Sarbanes-Oxley). It also includes fees payable for the statutory audits of the financial statements of subsidiary companies.
Audit related assurance services – represent fees payable for services in relation to other statutory filings or engagements that are required by law or regulation to be carried out by the appointed auditor. This includes fees for the audit of the group’s regulatory financial statements and reporting associated with the group’s US debt shelf registration.
Taxation compliance services – represent services for tax returns, audits, monitoring and enquiries.
Taxation advisory services – represent fees payable for all taxation advisory services not falling within taxation compliance.
All other assurance services – comprise all assurance services not falling within the above categories.
All other services – represent fees payable for all non-audit services not covered above, principally comprising advice on accounting or financial matters.
In order to maintain the independence of the external auditors, the Board has determined policies as to what non-audit services can be provided by the company’s external auditors and the approval processes related to them. Under those policies work of a consultancy nature will not be offered to the external auditors unless there are clear efficiencies and value-added benefits to the company. In this context audit related assurance services are considered to pose a low threat to auditor independence and, therefore, the proportion of other non-audit services to total services is considered the most suitable measure to consider. This represented 17% of the total fees in 2012 (2011: 18%; 2010: 17%).
The BT Pension Scheme is an associated pension fund as defined in the Companies (Disclosure of Auditor Remuneration and Liability Limitation Agreements) (Amendment) Regulations 2011. In the year ended 31 March 2012 PricewaterhouseCoopers LLP received total fees from the BT Pension Scheme of £1,901,000 (2011: £897,000, 2010: £303,000) in respect of the following services: audit of financial statements of associates £131,000 (2011: £96,000, 2010: £46,000); taxation compliance services £92,000 (2011: £47,000, 2010: £31,000) and other non-audit services of £1,678,000 (2011: £754,000, 2010: £226,000).
| | |
| 52 British Telecommunications plc Annual Report & Form 20-F 2012 | | Notes to the consolidated financial statements |
The group separately identifies and discloses certain items by virtue of their size, nature or incidence (termed ‘specific items’). This is consistent with the way that financial performance is measured by management and reported to the BT Group plc Board and the Operating Committee and it assists in providing a meaningful analysis of the trading results of the group. A definition of specific items is provided on page 40.
| | | (410) | | | (410) | | | (410) | | | (410) | | | (410) | |
Year ended 31 March | |
| 2012
£m |
| | | |
| 2011
£m |
| | | |
| 2010
£m |
|
| |
Revenue | | | | | | | | | | | | | | | | |
German retrospective regulatory rulinga | | | 410 | | | | | | – | | | | | | – | |
Regulatory settlement | | | – | | | | | | – | | | | | | 52 | |
| |
Other operating income | | | | | | | | | | | | | | | | |
Loss (profit) on disposal of a subsidiaryb | | | 19 | | | | | | – | | | | | | (2 | ) |
| |
Operating costs | | | | | | | | | | | | | | | | |
BT Global Services restructuring chargesc | | | 64 | | | | | | 192 | | | | | | 301 | |
Property rationalisation costs | | | 90 | | | | | | 88 | | | | | | 121 | |
German retrospective regulatory rulinga | | | (410 | ) | | | | | – | | | | | | – | |
Intangible asset impairment chargesd | | | – | | | | | | 49 | | | | | | – | |
Costs associated with settlement of open tax years | | | – | | | | | | – | | | | | | 5 | |
| |
| | | (256 | ) | | | | | 329 | | | | | | 427 | |
| |
Net finance expense | | | | | | | | | | | | | | | | |
Interest expense on pension plan liabilitiese | | | 2,092 | | | | | | 2,323 | | | | | | 2,211 | |
Expected return on pension plan assetse | | | (2,289 | ) | | | | | (2,244 | ) | | | | | (1,932 | ) |
Interest income on settlement of open tax years | | | – | | | | | | – | | | | | | (11 | ) |
| |
| | | (197 | ) | | | | | 79 | | | | | | 268 | |
| |
Share of results of associates and joint ventures | | | | | | | | | | | | | | | | |
(Profit) loss on disposal of interest in associatef | | | – | | | | | | (42 | ) | | | | | 12 | |
Impact of renegotiated supply contracts on associate | | | – | | | | | | – | | | | | | (29 | ) |
| |
| | | – | | | | | | (42 | ) | | | | | (17 | ) |
| |
Net specific items (credit) charge before tax | | | (24 | ) | | | | | 366 | | | | | | 728 | |
| |
Taxation | | | | | | | | | | | | | | | | |
Tax charge (credit) on specific items above | | | 22 | | | | | | (72 | ) | | | | | (190 | ) |
Tax credit on re-measurement of deferred taxg | | | (164 | ) | | | | | (172 | ) | | | | | – | |
Tax charge (credit) in respect of settlement of open tax years | | | – | | | | | | 5 | | | | | | (230 | ) |
| |
| | | (142 | ) | | | | | (239 | ) | | | | | (420 | ) |
| |
Net specific items (credit) charge after tax | | | (166 | ) | | | | | 127 | | | | | | 308 | |
| |
| a | Following a retrospective regulatory ruling in Germany in relation to the period from September 2006 to November 2010, a one-off charge was recognised against revenue with an equal reduction in operating costs. |
| b | In 2012 a loss arose on the disposal of the group’s 51% shareholding in its subsidiary Accel Frontline Limited. |
| c | The components of the BT Global Services restructuring charges recognised in 2012, 2011 and 2010 were: networks, products and procurement channels rationalisation charges of £36m (2011: £41m, 2010: £142m), people and property charges of £28m (2011: £129m, 2010: £132m) principally comprising leaver costs and property exit costs; and intangible asset impairments and other charges of £nil (2011: £22m, 2010: £27m). |
| d | In 2011 the group recognised goodwill impairment charges of £39m mainly relating to an operational restructuring of a business acquired several years ago. In addition, intangible asset impairments of £10m were recognised relating to brands which are no longer in use. |
| e | See note 19 for more details. |
| f | In 2011 a profit arose on the disposal of a 6.5% interest in the group’s associate Tech Mahindra. In 2010 a loss arose on the disposal of an indirect interest in Tech Mahindra. |
| g | In 2012 and 2011, respectively, a tax credit was recognised for the re-measurement of deferred tax balances as a result of the change in the UK statutory corporation tax rate from 26% to 24% effective in 2013 but enacted in 2012 and from 28% to 26% effective in 2012 but enacted in 2011. |
| | |
| Notes to the consolidated financial statements | | British Telecommunications plc Annual Report & Form 20-F 2012 53 |
Analysis of taxation expense for the year
| | | (754) | | | (754) | | | (754) | | | (754) | | | (754) | |
Year ended 31 March | |
| 2012
£m |
| | | |
| 2011
£m |
| | | |
| 2010
£m |
|
| |
United Kingdom | | | | | | | | | | | | | | | | |
Corporation tax at 26% (2011: 28%, 2010: 28%) | | | (754 | ) | | | | | (265 | ) | | | | | (243 | ) |
Adjustments in respect of prior periods | | | 39 | | | | | | (7 | ) | | | | | 204 | |
Non-UK taxation | | | | | | | | | | | | | | | | |
Current | | | (60 | ) | | | | | (40 | ) | | | | | (31 | ) |
Adjustments in respect of prior periods | | | 8 | | | | | | 11 | | | | | | – | |
| |
Total current tax expense | | | (767 | ) | | | | | (301 | ) | | | | | (70 | ) |
| |
Deferred tax | | | | | | | | | | | | | | | | |
Origination and reversal of temporary differences | | | 58 | | | | | | (184 | ) | | | | | (53 | ) |
Adjustments in respect of prior periods | | | 27 | | | | | | 32 | | | | | | 63 | |
Impact of change in UK corporation tax rate to 24% (2011: 26%) | | | 164 | | | | | | 172 | | | | | | – | |
| |
Total deferred taxation credit | | | 249 | | | | | | 20 | | | | | | 10 | |
| |
Total taxation expense | | | (518 | ) | | | | | (281 | ) | | | | | (60 | ) |
| |
Factors affecting taxation expense for the year
The taxation expense on the profit for the year differs from the amount computed by applying the corporation tax rate to the profit before taxation as a result of the following factors:
| | | | | | | | | | | | | | | | | | | | | | | | | | | | | | | | | | |
Year ended 31 March | |
| 2012
£m |
| | | | | % | | | | |
| 2011
£m |
| | | | | % | | | | |
| 2010
£m |
| | | | | % | |
| |
Profit before taxation | | | 2,739 | | | | | | | | | | | | 1,959 | | | | | | | | | | | | 1,303 | | | | | | | |
| |
Expected taxation expense at UK rate of 26% (2011 and 2010: 28%) | | | (712 | ) | | | | | 26.0 | | | | | | (549 | ) | | | | | 28.0 | | | | | | (364 | ) | | | | | 28.0 | |
Effects of: | | | | | | | | | | | | | | | | | | | | | | | | | | | | | | | | | | |
Non-deductible depreciation and amortisation | | | (9 | ) | | | | | 0.3 | | | | | | (15 | ) | | | | | 0.8 | | | | | | (18 | ) | | | | | 1.4 | |
Non-taxable non-UK profits | | | (27 | ) | | | | | 0.9 | | | | | | (13 | ) | | | | | 0.7 | | | | | | (26 | ) | | | | | 2.0 | |
Overseas losses utilised | | | 75 | | | | | | (2.7 | ) | | | | | 53 | | | | | | (2.7 | ) | | | | | 35 | | | | | | (2.7 | ) |
Lower taxes on non-UK profits | | | (16 | ) | | | | | 0.6 | | | | | | (1 | ) | | | | | – | | | | | | (1 | ) | | | | | 0.1 | |
(Lower) higher taxes on gain on disposal of business | | | (5 | ) | | | | | 0.2 | | | | | | 12 | | | | | | (0.6 | ) | | | | | – | | | | | | – | |
Other deferred tax assets not recognised | | | (1 | ) | | | | | – | | | | | | (8 | ) | | | | | 0.4 | | | | | | (17 | ) | | | | | 1.3 | |
Associates and joint ventures | | | 3 | | | | | | 0.1 | | | | | | 6 | | | | | | (0.3 | ) | | | | | 11 | | | | | | (0.8 | ) |
Adjustments in respect of prior periods | | | 74 | | | | | | (2.7 | ) | | | | | 36 | | | | | | (1.9 | ) | | | | | 37 | | | | | | (2.9 | ) |
Tax credit in respect of settlement of open tax years | | | – | | | | | | – | | | | | | – | | | | | | – | | | | | | 230 | | | | | | (17.7 | ) |
Re-measurement of deferred tax balances | | | 164 | | | | | | (6.0 | ) | | | | | 172 | | | | | | (8.8 | ) | | | | | – | | | | | | – | |
Other | | | (64 | ) | | | | | 2.2 | | | | | | 26 | | | | | | (1.3 | ) | | | | | 53 | | | | | | (4.1 | ) |
| |
Total taxation expense and effective tax rate | | | (518 | ) | | | | | 18.9 | | | | | | (281 | ) | | | | | 14.3 | | | | | | (60 | ) | | | | | 4.6 | |
| |
Exclude specific items (note 9) | | | (142 | ) | | | | | | | | | | | (239 | ) | | | | | | | | | | | (420 | ) | | | | | | |
| |
Total taxation expense before specific items and effective
rate on profit before specific items | | | (660 | ) | | | | | 24.3 | | | | | | (520 | ) | | | | | 22.4 | | | | | | (480 | ) | | | | | 23.6 | |
| |
| | | (754) | | | (754) | | | (754) | | | (754) | | | (754) | |
| Tax credit recognised directly in equity | | | | | | | | | | | | | |
Year ended 31 March | |
| 2012
£m |
| | | |
| 2011
£m |
| | | |
| 2010
£m |
|
| |
Deferred tax credit relating to share-based payments | | | 17 | | | | | | 91 | | | | | | 19 | |
| |
| | |
| 54 British Telecommunications plc Annual Report & Form 20-F 2012 | | Notes to the consolidated financial statements |
Tax components of other comprehensive income
The tax credit (expense) relating to components of other comprehensive income is as follows:
| | | | | | | | | | | | | | | | | | | | | | | | | | | | | | | | | | | | | | | | | | | | | | | | | | | | |
| | | 2012 | | | | | 2011 | | | | | 2010 | |
| | | | | | | | | | | | | | | | |
Year ended 31 March | |
| Before
tax
£m |
| | | |
| Tax
(expense)
credit £m |
| | | |
| After
tax
£m |
| | | |
| Before
tax
£m |
| | | |
| Tax
(expense)
credit £m |
| | | |
| After
tax £m |
| | | |
| Before
tax
£m |
| | | |
| Tax
(expense)
credit £m |
| | | |
| After
tax £m |
|
| |
Actuarial (losses) gains relating to retirement benefit obligations | | | (2,744 | ) | | | | | 600 | | | | | | (2,144 | ) | | | | | 5,109 | | | | | | (1,534 | ) | | | | | 3,575 | | | | | | (4,324 | ) | | | | | 1,211 | | | | | | (3,113 | ) |
Exchange differences on translation of foreign operations | | | (38 | ) | | | | | (1 | ) | | | | | (39 | ) | | | | | (142 | ) | | | | | 42 | | | | | | (100 | ) | | | | | (112 | ) | | | | | (45 | ) | | | | | (157 | ) |
Fair value movements on available-for-sale assets | | | – | | | | | | – | | | | | | – | | | | | | 20 | | | | | | – | | | | | | 20 | | | | | | 11 | | | | | | – | | | | | | 11 | |
Fair value movements on cash flow hedges | | | | | | | | | | | | | | | | | | | | | | | | | | | | | | | | | | | | | | | | | | | | | | | | | | | | |
– fair value losses | | | (56 | ) | | | | | 10 | | | | | | (46 | ) | | | | | (347 | ) | | | | | (124 | ) | | | | | (471 | ) | | | | | (1,067 | ) | | | | | 297 | | | | | | (770 | ) |
– recognised in income and expense | | | 179 | | | | | | (32 | ) | | | | | 147 | | | | | | 334 | | | | | | 119 | | | | | | 453 | | | | | | 496 | | | | | | (139 | ) | | | | | 357 | |
– reclassified and reported in non-current assets | | | – | | | | | | – | | | | | | – | | | | | | – | | | | | | – | | | | | | – | | | | | | (4 | ) | | | | | 1 | | | | | | (3 | ) |
| |
| | | (2,659 | ) | | | | | 577 | | | | | | (2,082 | ) | | | | | 4,974 | | | | | | (1,497 | ) | | | | | 3,477 | | | | | | (5,000 | ) | | | | | 1,325 | | | | | | (3,675 | ) |
| |
Current tax credit (expense) | | | | | | | | | 566 | | | | | | | | | | | | | | | | | | 49 | | | | | | | | | | | | | | | | | | (6 | ) | | | | | | |
Deferred tax credit (expense) | | | | | | | | | 11 | | | | | | | | | | | | | | | | | | (1,546 | ) | | | | | | | | | | | | | | | | | 1,331 | | | | | | | |
| |
| | | | | | | | | 577 | | | | | | | | | | | | | | | | | | (1,497 | ) | | | | | | | | | | | | | | | | | 1,325 | | | | | | | |
| |
Deferred taxation
| | | | | | | | | | | | | | | | | | | | | | | | | | | | |
| |
| Excess capital
allowances
£m |
| | | |
| Retirement benefit
obligationsa
£m |
| | | |
| Share-based
payments
£m |
| | | |
| Other
£m |
| | | |
| Total
£m |
|
| |
At 1 April 2010 | | | 1,696 | | | | | | (2,196 | ) | | | | | (41 | ) | | | | | (199 | ) | | | | | (740 | ) |
(Credit) expense recognised in the income statement | | | (315 | ) | | | | | 201 | | | | | | (17 | ) | | | | | 111 | | | | | | (20 | ) |
Expense recognised in other comprehensive income | | | – | | | | | | 1,534 | | | | | | – | | | | | | 12 | | | | | | 1,546 | |
(Credit) recognised in equity | | | – | | | | | | – | | | | | | (91 | ) | | | | | – | | | | | | (91 | ) |
Transfer from current tax | | | 56 | | | | | | ��� | | | | | | – | | | | | | – | | | | | | 56 | |
| |
At 31 March 2011 | | | 1,437 | | | | | | (461 | ) | | | | | (149 | ) | | | | | (76 | ) | | | | | 751 | |
| |
| | | | | | | | | |
Deferred tax asset | | | | | | | | | | | | | | | | | | | | | | | | | | | (461 | ) |
Deferred tax liability | | | | | | | | | | | | | | | | | | | | | | | | | | | 1,212 | |
| |
At 1 April 2011 | | | 1,437 | | | | | | (461 | ) | | | | | (149 | ) | | | | | (76 | ) | | | | | 751 | |
(Credit) recognised in the income statement | | | (95 | ) | | | | | (79 | ) | | | | | (1 | ) | | | | | (74 | ) | | | | | (249 | ) |
(Credit) expense recognised in other comprehensive income | | | – | | | | | | (36 | ) | | | | | – | | | | | | 25 | | | | | | (11 | ) |
(Credit) recognised in equity | | | – | | | | | | – | | | | | | (17 | ) | | | | | – | | | | | | (17 | ) |
| |
At 31 March 2012 | | | 1,342 | | | | | | (576 | ) | | | | | (167 | ) | | | | | (125 | ) | | | | | 474 | |
| |
| | | | | | | | | |
Deferred tax asset | | | | | | | | | | | | | | | | | | | | | | | | | | | (626 | ) |
Deferred tax liability | | | | | | | | | | | | | | | | | | | | | | | | | | | 1,100 | |
| |
At 31 March 2012 | | | | | | | | | | | | | | | | | | | | | | | | | | | 474 | |
| |
| a | Includes a deferred tax asset of £1m (2011: £1m) arising on contributions payable to defined contribution pension plans. |
Jurisdictional netting has been applied except for BT’s pension schemes which are disclosed as deferred tax assets.
At 31 March 2012, all of the deferred tax asset of £626m (2011: £461m) is expected to be recovered after more than one year. At 31 March 2012, all of the deferred tax liability of £1,100m (2011: £1,212m) is expected to be settled after more than one year.
Factors affecting future tax charges
The rate of UK corporation tax changed from 26% to 24% on 1 April 2012. As deferred tax assets and liabilities are measured at the rates that are expected to apply in the periods of the reversal, deferred tax balances at 31 March 2012 have been calculated using a rate of 24%. The impact of the change of rate decreased deferred tax assets by £48m and deferred tax liabilities by £91m totalling a reduction in net liabilities of £43m. This reduction has been recognised as a deferred tax credit of £164m in the income statement (note 9) and a deferred tax expense of £121m in other comprehensive income.
The Government has also indicated that it intends to enact future reductions in the main rate of UK corporation tax to 22% by 1 April 2014. The future annual corporation tax reductions of 1% are expected to affect the group’s financial statements. The actual impact will depend on the group’s deferred tax position at that time.
| | |
| Notes to the consolidated financial statements | | British Telecommunications plc Annual Report & Form 20-F 2012 55 |
Unrecognised tax losses and other temporary differences
At 31 March 2012, the group had operating losses, capital losses and other temporary differences carried forward in respect of which no deferred tax assets were recognised amounting to £21.8bn (2011: £23.5bn). The group’s capital losses and other temporary differences have no expiry date restrictions. The expiry date of operating losses carried forward is dependent upon the tax law of the various territories in which the losses arose. A summary of expiry dates for losses in respect of which restrictions apply is set out below:
| | | | | | | | |
At 31 March | |
| 2012
£m |
| | | Expiry of losses | |
| |
Restricted losses | | | | | | | | |
Europe | | | 430 | | | | 2013-27 | |
Americas | | | 149 | | | | 2013-20 | |
Asia | | | 8 | | | | 2013-16 | |
| |
Total restricted losses | | | 587 | | | | | |
| |
Unrestricted losses | | | | | | | | |
Operating losses | | | 3,430 | | | | No expiry | |
Capital losses | | | 17,225 | | | | No expiry | |
| |
Total unrestricted losses | | | 20,655 | | | | | |
| |
Other temporary differences | | | 576 | | | | | |
| |
Total | | | 21,818 | | | | | |
| |
At 31 March 2012, the undistributed earnings of overseas subsidiaries was £5.2bn (2011: £5.3bn). No deferred tax liabilities have been recognised in respect of these unremitted earnings because the group is in a position to control the timing of the reversal of the temporary differences and it is probable that such differences will not reverse in the foreseeable future. Temporary differences arising in connection with interests in associates and joint ventures for which deferred tax liabilities have not been recognised are insignificant.
There were no dividends paid in 2012, 2011 or 2010. The directors have declared a final dividend of £1,400m.
| | |
| 56 British Telecommunications plc Annual Report & Form 20-F 2012 | | Notes to the consolidated financial statements |
| | | licences and other | | | | licences and other | | | | licences and other | | | | licences and other | | | | licences and other | | | licences and other |
| |
| Goodwill
£m |
| |
| Brands, customer
relationships
and technology
£m |
| |
| Telecoms
licences and other
£m |
| |
| Internally
developed
software
£m |
| |
| Computer
software
£m |
| | Total £m |
|
Cost | | | | | | | | | | | | | | | | | | | | | | |
At 1 April 2010 | | | 1,440 | | | | 357 | | | | 290 | | | | 2,568 | | | | 1,241 | | | 5,896 |
Additions | | | – | | | | – | | | | – | | | | 435 | | | | 65 | | | 500 |
Acquisitions through business combinations | | | 6 | | | | – | | | | – | | | | – | | | | – | | | 6 |
Interest on qualifying assetsa | | | – | | | | – | | | | – | | | | 4 | | | | – | | | 4 |
Disposals and adjustments | | | – | | | | – | | | | – | | | | (92 | ) | | | (5 | ) | | (97) |
Impairment chargesb | | | (39 | ) | | | (10 | ) | | | – | | | | – | | | | – | | | (49) |
Exchange differences | | | (42 | ) | | | (9 | ) | | | (2 | ) | | | (2 | ) | | | (3 | ) | | (58) |
|
At 1 April 2011 | | | 1,365 | | | | 338 | | | | 288 | | | | 2,913 | | | | 1,298 | | | 6,202 |
Additions | | | – | | | | – | | | | – | | | | 406 | | | | 53 | | | 459 |
Interest on qualifying assetsa | | | – | | | | – | | | | – | | | | 8 | | | | – | | | 8 |
Disposals and adjustments | | | (7 | ) | | | (13 | ) | | | 3 | | | | (236 | ) | | | (151 | ) | | (404) |
Exchange differences | | | (11 | ) | | | – | | | | (18 | ) | | | – | | | | (22 | ) | | (51) |
|
At 31 March 2012 | | | 1,347 | | | | 325 | | | | 273 | | | | 3,091 | | | | 1,178 | | | 6,214 |
|
| | | | | | |
Accumulated amortisation | | | | | | | | | | | | | | | | | | | | | | |
At 1 April 2010 | | | | | | | 197 | | | | 162 | | | | 927 | | | | 930 | | | 2,216 |
Charge for the year | | | | | | | 47 | | | | 14 | | | | 544 | | | | 86 | | | 691 |
Disposals and adjustments | | | | | | | – | | | | – | | | | (91 | ) | | | (4 | ) | | (95) |
Exchange differences | | | | | | | (2 | ) | | | (1 | ) | | | (1 | ) | | | (3 | ) | | (7) |
|
At 1 April 2011 | | | | | | | 242 | | | | 175 | | | | 1,379 | | | | 1,009 | | | 2,805 |
Charge for the year | | | | | | | 34 | | | | 11 | | | | 542 | | | | 108 | | | 695 |
Disposals and adjustments | | | | | | | (6 | ) | | | – | | | | (242 | ) | | | (143 | ) | | (391) |
Exchange differences | | | | | | | – | | | | (11 | ) | | | – | | | | (19 | ) | | (30) |
|
At 31 March 2012 | | | | | | | 270 | | | | 175 | | | | 1,679 | | | | 955 | | | 3,079 |
|
| | | | | | |
Carrying amount | | | | | | | | | | | | | | | | | | | | | | |
At 31 March 2012 | | | 1,347 | | | | 55 | | | | 98 | | | | 1,412 | | | | 223 | | | 3,135 |
|
At 31 March 2011 | | | 1,365 | | | | 96 | | | | 113 | | | | 1,534 | | | | 289 | | | 3,397 |
|
| a | Additions to internally generated software in 2012 include interest capitalised at a weighted average borrowing rate of 7.3% (2011: 7.8%). |
Goodwill impairment review
The group performs an annual goodwill impairment review, based on its cash generating units (CGUs). The CGUs that have associated goodwill are BT Global Services and BT Retail’s business units: BT Consumer, BT Business, BT Enterprises and BT Ireland. These are the smallest identifiable groups of assets that generate cash inflows that are largely independent of the cash inflows from other groups of assets, and to which goodwill is allocated. Goodwill is allocated to the group’s CGUs as follows:
| | | | | | | | | | | | | | | | | | | | | | | | |
| | | BT Global | | | | BT Retail | | | | | |
| | | | | | | | | | | | |
| |
| Services
£m |
| |
| BT Consumer
£m |
| |
| BT Business
£m |
| |
| BT Enterprises
£m |
| |
| BT Ireland
£m |
| |
| Total
£m |
|
| |
At 1 April 2010 | | | 1,180 | | | | 65 | | | | 61 | | | | 113 | | | | 21 | | | | 1,440 | |
Acquisitions through business combinations | | | 6 | | | | – | | | | – | | | | – | | | | – | | | | 6 | |
Reclassifications | | | – | | | | – | | | | (15 | ) | | | 15 | | | | – | | | | – | |
Impairment charges | | | (39) | | | | – | | | | – | | | | – | | | | – | | | | (39 | ) |
Exchange differences | | | (37) | | | | – | | | | – | | | | (5 | ) | | | – | | | | (42 | ) |
| |
At 1 April 2011 | | | 1,110 | | | | 65 | | | | 46 | | | | 123 | | | | 21 | | | | 1,365 | |
Disposals | | | (7) | | | | – | | | | – | | | | – | | | | – | | | | (7 | ) |
Exchange differences | | | (13) | | | | – | | | | – | | | | 2 | | | | – | | | | (11 | ) |
| |
At 31 March 2012 | | | 1,090 | | | | 65 | | | | 46 | | | | 125 | | | | 21 | | | | 1,347 | |
| |
| | |
| Notes to the consolidated financial statements | | British Telecommunications plc Annual Report & Form 20-F 2012 57 |
12. Intangible assetscontinued
The discount rate used in performing the value in use calculation in 2012 was 9.2% (2011: 10.0%) for all CGUs. The perpetuity growth rate for BT Global Services was 2.5% (2011: 2.5%) and 2.0% (2011: 2.0%) for all BT Retail CGUs. There were no new acquisitions in 2012.
Recoverable amount
The value in use of each CGU is determined using cash flow projections derived from financial plans approved by the BT Group plc Board covering a three-year period and a further two years approved by the line of business and group senior management team. They reflect management’s expectations of revenue, EBITDA growth, capital expenditure, working capital and operating cash flows, based on past experience and future expectations of business performance. Cash flows are also adjusted downwards to reflect the different risk attributes of each CGU. Cash flows beyond the five-year period have been extrapolated using perpetuity growth rates.
Discount rate
The pre-tax discount rates applied to the cash flow forecasts are derived from the group’s post-tax weighted average cost of capital. The assumptions used in the calculation of the group’s weighted average cost of capital are benchmarked to externally available data.
Growth rates
The perpetuity growth rates are determined based on the long-term historical growth rates of the regions in which the CGU operates, and they reflect an assessment of the long-term growth prospects of the sector in which the CGU operates. The growth rates have been benchmarked against external data for the relevant markets. None of the growth rates applied exceed the long-term historical average growth rates for those markets or sectors.
Sensitivities
For the BT Retail CGUs, significant headroom exists in each CGU and, based on the sensitivity analysis performed, no reasonably possible changes in the assumptions would cause the carrying amount of the CGUs to exceed their recoverable amount.
For BT Global Services, the value in use exceeds the carrying value of the CGU by approximately £762m. The following changes in assumptions would cause the recoverable amount to fall below the carrying value:
| — | | a reduction in the perpetuity growth rate from the 2.5% assumption applied to a revised assumption of a 0.3% decline or more |
| — | | an increase in the discount rate from the 9.2% assumption applied to a revised assumption of 11.2% or more |
| — | | a reduction in the projected operating cash flows across five years by 23.9% or more. |
| | |
| 58 British Telecommunications plc Annual Report & Form 20-F 2012 | | Notes to the consolidated financial statements |
| 13. | Property, plant and equipment |
| | | Network infrastructure | | | | Network infrastructure | | | | Network infrastructure | | | | Network infrastructure | | | | Network infrastructure | |
| |
| Land and buildingsa
£m |
| |
| Network infrastructure
and other equipmenta
£m |
| |
| Otherb
£m |
| |
| Assets in
course of construction £m |
| |
| Total
£m |
|
| |
Cost | | | | | | | | | | | | | | | | | | | | |
At 1 April 2010 | | | 1,379 | | | | 42,080 | | | | 2,151 | | | | 807 | | | | 46,417 | |
Additions | | | 11 | | | | 197 | | | | 180 | | | | 1,690 | | | | 2,078 | |
Interest on qualifying assetsc | | | – | | | | – | | | | – | | | | 2 | | | | 2 | |
Transfers | | | 17 | | | | 1,729 | | | | 1 | | | | (1,747 | ) | | | – | |
Disposals and adjustments | | | (2 | ) | | | (1,350 | ) | | | (77 | ) | | | (13 | ) | | | (1,442 | ) |
Exchange differences | | | (6 | ) | | | (39 | ) | | | (8 | ) | | | (3 | ) | | | (56 | ) |
| |
At 1 April 2011 | | | 1,399 | | | | 42,617 | | | | 2,247 | | | | 736 | | | | 46,999 | |
Additions | | | 21 | | | | 251 | | | | 137 | | | | 1,727 | | | | 2,136 | |
Interest on qualifying assetsc | | | – | | | | – | | | | – | | | | 1 | | | | 1 | |
Transfers | | | 7 | | | | 1,720 | | | | 1 | | | | (1,728 | ) | | | – | |
Disposals and adjustments | | | (104 | ) | | | (603 | ) | | | (166 | ) | | | (4 | ) | | | (877 | ) |
Exchange differences | | | (21 | ) | | | (208 | ) | | | (34 | ) | | | (4 | ) | | | (267 | ) |
| |
At 31 March 2012 | | | 1,302 | | | | 43,777 | | | | 2,185 | | | | 728 | | | | 47,992 | |
| |
| | | | | |
Accumulated depreciation | | | | | | | | | | | | | | | | | | | | |
At 1 April 2010 | | | 725 | | | | 29,201 | | | | 1,706 | | | | – | | | | 31,632 | |
Charge for the year | | | 63 | | | | 2,019 | | | | 206 | | | | – | | | | 2,288 | |
Disposals and adjustments | | | (13 | ) | | | (1,316 | ) | | | (98 | ) | | | – | | | | (1,427 | ) |
Exchange differences | | | (3 | ) | | | (24 | ) | | | (7 | ) | | | – | | | | (34 | ) |
| |
At 1 April 2011 | | | 772 | | | | 29,880 | | | | 1,807 | | | | – | | | | 32,459 | |
Charge for the year | | | 64 | | | | 2,011 | | | | 202 | | | | – | | | | 2,277 | |
Disposals and adjustments | | | (73 | ) | | | (605 | ) | | | (155 | ) | | | – | | | | (833 | ) |
Exchange differences | | | (16 | ) | | | (171 | ) | | | (30 | ) | | | – | | | | (217 | ) |
| |
At 31 March 2012 | | | 747 | | | | 31,115 | | | | 1,824 | | | | – | | | | 33,686 | |
| |
| | | | | |
Carrying amount | | | | | | | | | | | | | | | | | | | | |
At 31 March 2012 | | | 555 | | | | 12,662 | | | | 361 | | | | 728 | | | | 14,306 | |
Engineering stores | | | – | | | | – | | | | – | | | | 82 | | | | 82 | |
| |
Total at 31 March 2012 | | | 555 | | | | 12,662 | | | | 361 | | | | 810 | | | | 14,388 | |
| |
At 31 March 2011 | | | 627 | | | | 12,737 | | | | 440 | | | | 736 | | | | 14,540 | |
Engineering stores | | | – | | | | – | | | | – | | | | 83 | | | | 83 | |
| |
Total at 31 March 2011 | | | 627 | | | | 12,737 | | | | 440 | | | | 819 | | | | 14,623 | |
| |
| | | Network infrastructu | | | | Network infrastructu | |
| |
| 2012
£m |
| |
| 2011
£m |
|
| |
The carrying amount of land and buildings, including leasehold improvements, comprised: | | | | | | | | |
Freehold | | | 257 | | | | 276 | |
Leasehold | | | 298 | | | | 351 | |
| |
Total land and buildings | | | 555 | | | | 627 | |
| |
| a | The carrying amount of the group’s property, plant and equipment includes an amount of £113m (2011: £140m) in respect of assets held under finance leases, comprising land and buildings of £62m (2011: £71m) and network infrastructure and equipment of £51m (2011: £69m). The depreciation expense on those assets in 2012 was £29m (2011: £33m), comprising land and buildings of £3m (2011: £3m) and network infrastructure and equipment of £26m (2011: £30m). |
| b | Other mainly comprises motor vehicles and computers. |
| c | Additions to assets in the course of construction in 2012 include interest capitalised at a weighted average borrowing rate of 7.3% (2011: 7.8%). |
| | |
| Notes to the consolidated financial statements | | British Telecommunications plc Annual Report & Form 20-F 2012 59 |
| 14. | Associates and joint ventures |
| | | | | | | | | | | | | | | | | | | | | | | | |
| | | | | | | | | | | 2012 | | | | | | | | | | | | 2011 | |
| | | | | | | | |
| |
| Associates
£m |
| |
| Joint
ventures
£m |
| |
| Total
£m |
| |
| Associates
£m |
| |
| Joint
ventures £m |
| |
| Total
£m |
|
| |
Non-current assets | | | 31 | | | | 6 | | | | 37 | | | | 28 | | | | 6 | | | | 34 | |
Current assets | | | 194 | | | | 6 | | | | 200 | | | | 214 | | | | 5 | | | | 219 | |
Current liabilities | | | (44 | ) | | | (1 | ) | | | (45 | ) | | | (43 | ) | | | (1 | ) | | | (44 | ) |
Non-current liabilities | | | (39 | ) | | | – | | | | (39 | ) | | | (45 | ) | | | – | | | | (45 | ) |
| |
Share of net assets at 31 March | | | 142 | | | | 11 | | | | 153 | | | | 154 | | | | 10 | | | | 164 | |
| |
Revenue | | | 139 | | | | 13 | | | | 152 | | | | 263 | | | | 22 | | | | 285 | |
Expenses | | | (126 | ) | | | (13 | ) | | | (139 | ) | | | (233 | ) | | | (26 | ) | | | (259 | ) |
Taxation | | | (3 | ) | | | – | | | | (3 | ) | | | (5 | ) | | | – | | | | (5 | ) |
| |
Share of post tax results | | | 10 | | | | – | | | | 10 | | | | 25 | | | | (4 | ) | | | 21 | |
| |
| | | | | | |
| | | | | | | | | | | | | |
| Associates
£m |
| |
| Joint ventures
£m |
| |
| Total
£m |
|
| |
At 1 April 2010 | | | | | | | | | | | | | | | 186 | | | | 9 | | | | 195 | |
Share of post tax profit (loss) | | | | | | | | | | | | | | | 25 | | | | (4 | ) | | | 21 | |
Additions | | | | | | | | | | | | | | | – | | | | 4 | | | | 4 | |
Disposals | | | | | | | | | | | | | | | (42 | ) | | | – | | | | (42 | ) |
Dividends received | | | | | | | | | | | | | | | (7 | ) | | | – | | | | (7 | ) |
Exchange differences | | | | | | | | | | | | | | | (8 | ) | | | 1 | | | | (7 | ) |
| |
At 1 April 2011 | | | | | | | | | | | | | | | 154 | | | | 10 | | | | 164 | |
Share of post tax profit | | | | | | | | | | | | | | | 10 | | | | – | | | | 10 | |
Additions | | | | | | | | | | | | | | | 1 | | | | – | | | | 1 | |
Dividends received | | | | | | | | | | | | | | | (5 | ) | | | – | | | | (5 | ) |
Exchange differences | | | | | | | | | | | | | | | (18 | ) | | | 1 | | | | (17 | ) |
| |
At 31 March 2012 | | | | | | | | | | | | | | | 142 | | | | 11 | | | | 153 | |
| |
At 31 March 2012 the fair value of the group’s investments in associates and joint ventures for which published price quotations are available was £262m (2011: £279m). Details of the group’s principal associate at 31 March 2012 are set out on page 108. 15. Inventories | |
At 31 March | | | | | | | | | | | | | | | | | |
| 2012
£m |
| |
| 2011
£m |
|
| |
Consumables | | | | | | | | | | | | | | | | | | | 17 | | | | 28 | |
Work in progress | | | | | | | | | | | | | | | | | | | 40 | | | | 46 | |
Finished goods | | | | | | | | | | | | | | | | | | | 47 | | | | 47 | |
| |
| | | | | | | | | | | | | | | | | | | 104 | | | | 121 | |
| |
16. Trade and other receivables | | | | | | | | | | | | | | | | | | | | | | | | |
| | | | | | | | | | | | | | | | | |
| 2012
£m |
| |
| 2011
£m |
|
| |
Non-current | | | | | | | | | | | | | | | | | | | | | | | | |
Other assetsa | | | | | | | | | | | | | | | | | | | 169 | | | | 286 | |
| |
a Other assets includes costs relating to the initial set up, transition or transformation phase of long-term networked IT services contracts of £85m (2011: £215m) and prepayments and leasing debtors of £84m (2011: £71m). | |
At 31 March | | | | | | | | | | | | | | | | | |
| 2012
£m |
| |
| 2011
£m |
|
| |
Current | | | | | | | | | | | | | | | | | | | | | | | | |
Trade receivables | | | | | | | | | | | | | | | | | | | 1,747 | | | | 1,770 | |
Amounts owed by parent company | | | | | | | | | | | | | | | | | | | – | | | | 32 | |
Amounts owed by ultimate parent company | | | | | | | | | | | | | | | | | | | 3 | | | | – | |
Prepayments | | | | | | | | | | | | | | | | | | | 671 | | | | 570 | |
Accrued income | | | | | | | | | | | | | | | | | | | 730 | | | | 788 | |
Other receivables | | | | | | | | | | | | | | | | | | | 159 | | | | 204 | |
| |
| | | | | | | | | | | | | | | | | | | 3,310 | | | | 3,364 | |
| |
| | |
| 60 British Telecommunications plc Annual Report & Form 20-F 2012 | | Notes to the consolidated financial statements |
| 16. | Trade and other receivablescontinued |
Trade receivables are stated after deducting allowances for doubtful debts, as follows:
| | | | | | | | |
| |
| 2012
£m |
| |
| 2011
£m |
|
| |
At 1 April | | | 192 | | | | 219 | |
Expense | | | 104 | | | | 112 | |
Utilised | | | (104 | ) | | | (136 | ) |
Exchange differences | | | (5 | ) | | | (3 | ) |
| |
At 31 March | | | 187 | | | | 192 | |
| |
Trade receivables are continuously monitored and allowances applied against trade receivables consist of both specific impairments and collective impairments based on the group’s historical loss experiences for the relevant aged category and taking into account general economic conditions. Historical loss experience allowances are calculated by line of business in order to reflect the specific nature of the customers relevant to that line of business.
Trade receivables are due as follows:
| | | impaired net of | | | | impaired net of | | | | impaired net of | | | | impaired net of | | | | impaired net of | | | | impaired net of | | | | impaired net of | |
| | | | | | | | | | | Past due and not specifically impaired | | | | | |
| |
| Not past due
£m |
| |
| Trade
receivables
specifically
impaired net of
provision
£m |
| |
| Between 0 and
3 months
£m |
| |
| Between 3 and
6 months
£m |
| |
| Between 6 and
12 months
£m |
| |
| Over 12 months
£m |
| |
| Total
£m |
|
| |
2012 | | | 947 | | | | 111 | | | | 421 | | | | 28 | | | | 174 | | | | 66 | | | | 1,747 | |
2011 | | | 967 | | | | 127 | | | | 461 | | | | 93 | | | | 71 | | | | 51 | | | | 1,770 | |
| |
Gross trade receivables which have been specifically impaired amounted to £183m (2011: £193m).
Trade receivables not past due and accrued income are analysed below by line of business. The nature of customers associated with each line of business is disclosed in note 4.
| | | | | | | | | | | | | | | | |
| |
| Trade receivables
not past due |
| | | Accrued income | |
| | | | | | | | |
At 31 March | |
| 2012
£m |
| |
| 2011
£m |
| |
| 2012
£m |
| |
| 2011
£m |
|
| |
BT Global Services | | | 609 | | | | 674 | | | | 396 | | | | 422 | |
BT Retail | | | 212 | | | | 178 | | | | 93 | | | | 138 | |
BT Wholesale | | | 90 | | | | 82 | | | | 176 | | | | 176 | |
Openreach | | | 27 | | | | 25 | | | | 59 | | | | 47 | |
Other | | | 9 | | | | 8 | | | | 6 | | | | 5 | |
| |
Total | | | 947 | | | | 967 | | | | 730 | | | | 788 | |
| |
Given the broad and varied nature of the group’s customer base, the analysis of trade receivables not past due and accrued income by line of business is considered the most appropriate disclosure of credit concentrations. Cash collateral held against trade and other receivables amounted to £28m (2011: £29m).
| | |
| Notes to the consolidated financial statements | | British Telecommunications plc Annual Report & Form 20-F 2012 61 |
| 17. | Trade and other payables |
| | | | | | | | |
At 31 March | |
| 2012
£m |
| |
| 2011
£m |
|
| |
Current | | | | | | | | |
Trade payables | | | 3,261 | | | | 3,250 | |
Amounts owed to parent company | | | 68 | | | | 90 | |
Amounts owed to ultimate parent company | | | 9 | | | | 7 | |
Other taxation and social security | | | 487 | | | | 485 | |
Other payables | | | 463 | | | | 507 | |
Accrued expenses | | | 432 | | | | 505 | |
Deferred income | | | 1,295 | | | | 1,344 | |
| |
| | | 6,015 | | | | 6,188 | |
| |
| | |
At 31 March | |
| 2012
£m |
| |
| 2011
£m |
|
| |
Non-currenta | | | | | | | | |
Other payables | | | 821 | | | | 762 | |
Deferred income | | | 54 | | | | 69 | |
| |
| | | 875 | | | | 831 | |
| |
| a | Non-current payables mainly relate to operating lease liabilities and deferred gains on a prior period sale and finance leaseback transaction. |
| | | | | | | | | | | | | | | | |
| |
| BT Global Services
restructuringa
£m |
| |
| Propertyb
£m |
| |
| Otherc
£m |
| |
| Total
£m |
|
| |
At 1 April 2010 | | | 187 | | | | 272 | | | | 382 | | | | 841 | |
Income statement expensed | | | 76 | | | | 131 | | | | 190 | | | | 397 | |
Unwind of discount | | | – | | | | 3 | | | | – | | | | 3 | |
Utilised or released | | | (103 | ) | | | (88 | ) | | | (76 | ) | | | (267 | ) |
Transfers | | | – | | | | – | | | | (15 | ) | | | (15 | ) |
Exchange differences | | | (1 | ) | | | – | | | | (2 | ) | | | (3 | ) |
| |
At 1 April 2011 | | | 159 | | | | 318 | | | | 479 | | | | 956 | |
Income statement expensed | | | – | | | | 80 | | | | 90 | | | | 170 | |
Unwind of discount | | | – | | | | 5 | | | | – | | | | 5 | |
Utilised or released | | | (49 | ) | | | (107 | ) | | | (126 | ) | | | (282 | ) |
Transfers | | | (5 | ) | | | – | | | | 17 | | | | 12 | |
Exchange differences | | | – | | | | – | | | | (4 | ) | | | (4 | ) |
| |
At 31 March 2012 | | | 105 | | | | 296 | | | | 456 | | | | 857 | |
| |
| | | | |
At 31 March | | | | | | | | | |
| 2012
£m |
| |
| 2011
£m |
|
| |
Analysed as: | | | | | | | | | | | | | | | | |
Current | | | | | | | | | | | 251 | | | | 149 | |
Non-current | | | | | | | | | | | 606 | | | | 807 | |
| |
| | | | | | | | | | | 857 | | | | 956 | |
| |
| a | Amounts provided in relation to the BT Global Services restructuring programme and the contract and financial reviews in 2009. These are being utilised as the obligations are settled. |
| b | Property provisions mainly comprise onerous lease provisions arising from the rationalisation of the group’s property portfolio. The provisions will be utilised over the remaining lease periods, which range from one to 20 year. |
| c | Other provisions include amounts provided for legal or constructive obligations arising from insurance claims, litigation and regulatory risks, which will be utilised as the obligations are settled. |
| d | Includes specific items of £80m (2011: £88m) for property rationalisation costs and £nil (2011: £24m) relating to the BT Global Services restructuring programme. |
| | |
| 62 British Telecommunications plc Annual Report & Form 20-F 2012 | | Notes to the consolidated financial statements |
| 19. | Retirement benefit plans |
Background
The group has both defined benefit and defined contribution retirement benefit plans. The group’s main plans are in the UK and the largest by membership is the BT Pension Scheme (BTPS) which is a defined benefit plan that has been closed to new entrants since 31 March 2001. Subsequent to that date new entrants have been able to join a defined contribution plan, currently the BT Retirement Saving Scheme (BTRSS), a contract based defined contribution arrangement.
Defined contribution plans
A defined contribution plan is a pension arrangement under which both the company and participating members pay fixed contributions into an independently administered fund. Pension benefits for members of the plan are linked to contributions paid, the performance of each individual’s chosen investments and the annuity rates at retirement. The income statement charge in respect of defined contribution plans represents the contribution payable by the group based upon a fixed percentage of employees’ pay. The company has no exposure to investment and other experience risks.
Defined benefit plans
A defined benefit plan is a pension arrangement under which participating members receive a pension benefit at retirement dependent on factors such as age, years of service and pensionable pay. Benefits are determined by the scheme rules and are not dependent upon actual contributions made by the company or members. The plan is administered by an independent trustee who is responsible for ensuring that the scheme is sufficiently funded to meet current and future benefit payments and who must therefore agree with the sponsoring company a funding plan for additional company contributions where it is estimated that the benefits will not be met from regular contributions and expected investment returns. The income statement service cost in respect of defined benefit plans represents the increase in the defined benefit liability arising from pension benefits earned by active employees in the current period. The company is exposed to investment and other experience risks.
BTPS
At 31 March 2012 there were 325,000 members of the BTPS. Members belong to one of three sections depending upon the date they first joined the scheme. Section A is for members who joined before 1 December 1971, Section B is for members who joined the scheme between 1 December 1971 and 31 March 1986 and Section C is for members who joined the scheme on or after 1 April 1986 but before the scheme closed to new entrants on 31 March 2001. The membership is analysed below:
| | | | | | | | | | | | | | | | |
At 31 March 2012 | |
| Number of
active members |
| |
| Number of
deferred members |
| |
| Number of
pensioners |
| |
| Total
membership |
|
| |
Sections A and Ba | | | 20,500 | | | | 42,000 | | | | 177,500 | | | | 240,000 | |
Section C | | | 26,000 | | | | 42,000 | | | | 17,000 | | | | 85,000 | |
| |
Total at 31 March 2012 | | | 46,500 | | | | 84,000 | | | | 194,500 | | | | 325,000 | |
| |
| | | | |
At 31 March 2011 | | | | | | | | | | | | | | | | |
| |
Sections A and Ba | | | 23,500 | | | | 46,000 | | | | 173,000 | | | | 242,500 | |
Section C | | | 27,500 | | | | 42,500 | | | | 15,000 | | | | 85,000 | |
| |
Total at 31 March 2011 | | | 51,000 | | | | 88,500 | | | | 188,000 | | | | 327,500 | |
| |
| a | Section A and Section B memberships have been aggregated in this table as Section A members have typically elected to take Section B benefits at retirement. |
Since 1 April 2009, when changes to member benefits and contribution rates were introduced, BTPS members have accrued benefits based upon a career average re-valued earnings (CARE) basis and a normal pensionable age of 65. On a CARE basis benefits are built up based upon earnings in each year and the benefit accrued for each year is increased by the lower of inflation or the individual’s actual pay increase in each year to retirement. Benefits earned for pensionable service prior to that date are based upon a member’s final salary and a normal pensionable age of 60. Under the scheme rules the bases for determining the rate of inflation for statutory minimum rates of revaluation and indexation of benefits are based upon either the Retail Prices Index (RPI) or the Consumer Prices Index (CPI) which apply to each category of member as shown below:
| | | | | | |
| | | Active members | | Deferred members | | Pensioners |
Section B | | Benefits accrue on a CARE basis increasing at the lower of RPI or the individual’s actual pay increase | | Preserved benefits are revalued before retirement based upon CPI | | Increases in pensions in payment are based upon CPI |
Section C | | | | Increases in pensions in payment are based upon RPI up to a maximum of 5% |
| | |
| Notes to the consolidated financial statements | | British Telecommunications plc Annual Report & Form 20-F 2012 63 |
| 19. | Retirement benefit planscontinued |
Management of the scheme
BT Pension Scheme Trustees Limited (the Trustee) has been appointed by BT to administer and manage the scheme on behalf of the members in accordance with the terms of the Trust Deed of the scheme and relevant legislation. Under the terms of the BTPS Trust Deed there are nine Trustee directors all of whom are appointed by BT. The chairman of the Trustee is appointed after consultation with and with the agreement of the relevant trade unions who are also responsible for nominating four directors to act as representatives of the members. Of the remaining four directors, two will normally hold senior positions within the group, and two will normally hold (or have held) senior positions in commerce or industry. Subject to there being an appropriately qualified candidate at least one of the Trustee directors should be a current pensioner or deferred pensioner of the BTPS. Trustee directors are appointed for a three-year term, but are then eligible for re-appointment.
Further details of the governance of the BTPS, its financial position, performance of its investments and a summary of member benefits are available in the BTPS Annual Report typically published by the Trustee in May or June each year.
Accounting under IAS 19
Group income statement
The expense or income arising from all group pension arrangements recognised in the group income statement is shown below:
| | | 00000000000 | | | | 00000000000 | | | | 00000000000 | |
Year ended 31 March | |
| 2012
£m |
| |
| 2011
£m |
| |
| 2010
£m |
|
| |
Recognised in the income statement before specific items | | | | | | | | | | | | |
Current service cost: | | | | | | | | | | | | |
– defined benefit plans | | | 267 | | | | 297 | | | | 206 | |
– defined contribution plans | | | 126 | | | | 119 | | | | 98 | |
| |
Total operating expense | | | 393 | | | | 416 | | | | 304 | |
| |
Specific items(note 9) | | | | | | | | | | | | |
Interest expense on pension plan liabilities | | | 2,092 | | | | 2,323 | | | | 2,211 | |
Expected return on pension plan assets | | | (2,289 | ) | | | (2,244 | ) | | | (1,932 | ) |
| |
Net interest (income) expense included in specific items | | | (197 | ) | | | 79 | | | | 279 | |
| |
Total recognised in the income statement | | | 196 | | | | 495 | | | | 583 | |
| |
The service cost that will be recognised in the income statement in 2013 relating to defined benefit plans is estimated to be around £30m lower than in 2012. The net pension interest within specific items is expected to be a credit of around £30m for 2013, a decrease of around £165m, mainly due to lower expected returns on assets more than offsetting the higher asset values.
Group statement of comprehensive income
Actuarial gains and losses arise on both defined benefit liabilities and plan assets due to changes in assumptions compared with the start of the year and actual experience being different from those assumptions. These are recognised in full in the group statement of comprehensive income in the year in which they arise.
The history of actuarial gains and losses analysed between amounts arising from changes in assumptions and amounts arising from experience gains and losses and cumulative amounts incurred to date is shown below:
| | | 00000000000 | | | | 00000000000 | | | | 00000000000 | | | | 00000000000 | | | | 00000000000 | |
At 31 March | |
| 2012
£m |
| |
| 2011
£m |
| |
| 2010
£m |
| |
| 2009
£m |
| |
| 2008
£m |
|
| |
Present value of defined benefit liabilities | | | (40,989 | ) | | | (39,052 | ) | | | (43,293 | ) | | | (33,326 | ) | | | (34,669 | ) |
Fair value of plan assets | | | 38,541 | | | | 37,222 | | | | 35,429 | | | | 29,353 | | | | 37,448 | |
| |
Net pension (obligation) asset | | | (2,448 | ) | | | (1,830 | ) | | | (7,864 | ) | | | (3,973 | ) | | | 2,779 | |
| |
Actuarial (loss) gain arising from assumptions used to value defined benefit liabilitiesa | | | (1,006 | ) | | | 4,617 | | | | (11,113 | ) | | | 2,652 | | | | 5,215 | |
Actuarial (loss) gain arising from experience adjustments on defined benefit liabilitiesb | | | (668 | ) | | | 258 | | | | 1,632 | | | | (238 | ) | | | (22 | ) |
| |
Total actuarial (loss) gain arising on defined benefit liabilities | | | (1,674 | ) | | | 4,875 | | | | (9,481 | ) | | | 2,414 | | | | 5,193 | |
| |
Total actuarial gain or loss arising on defined benefit liabilities as a percentage of the present value of the defined benefit liabilities | | | 4.1% | | | | 12.5% | | | | 21.8% | | | | 7.2% | | | | 15.0% | |
| |
Actuarial (loss) gain arising from experience adjustment on plan assetsc | | | (1,070 | ) | | | 234 | | | | 5,157 | | | | (9,451 | ) | | | (2,572 | ) |
Actuarial gain or loss arising from experience adjustment on plan assets as a percentage of the plan assets | | | 2.8% | | | | 0.6% | | | | 14.6% | | | | 32.2% | | | | 6.9% | |
| |
Cumulative actuarial (losses) gains incurred to date | | | (2,550 | ) | | | 194 | | | | (4,915 | ) | | | (591 | ) | | | 6,446 | |
| |
| a | The actuarial loss or gain on defined benefit liabilities arises from changes in the assumptions used to value those liabilities at the end of the year compared with the assumptions used at the prior year end. This includes both financial assumptions, which are based on market conditions at the year end, and demographic assumptions such as life expectancy. |
| b | The actuarial loss or gain arising from experience adjustments on defined benefit liabilities represents the impact on the liabilities of differences between actual experience during the year compared with the assumptions made. Such differences might arise, for example, from members choosing different benefit options at retirement, actual salary increases being different from those assumed or actual pension increases being higher than the long-term inflation assumption. |
| c | The actuarial loss or gain arising from experience adjustments on plan assets represents the difference between actual investment performance in the year and the expected rate of return on assets assumed at the start of the year. |
| | |
| 64 British Telecommunications plc Annual Report & Form 20-F 2012 | | Notes to the consolidated financial statements |
| 19. | Retirement benefit planscontinued |
Group balance sheet
The net pension obligation in respect of defined benefit plans reported in the group balance sheet is set out below:
| | | of liabilities | | | | of liabilities | | | | of liabilities | | | | of liabilities | | | | of liabilities | | | | of liabilities | |
| | | 2012 | | | | 2011 | |
| | | | | | | | |
At 31 March | |
| Assets
£m |
| |
| Present
value of liabilities £m |
| |
| Deficit
£m |
| |
| Assets
£m |
| |
| Present
value of liabilities £m |
| |
| Deficit
£m |
|
| |
BTPS | | | 38,345 | | | | (40,628 | ) | | | (2,283 | ) | | | 37,034 | | | | (38,715 | ) | | | (1,681 | ) |
Other plansa | | | 196 | | | | (361 | ) | | | (165 | ) | | | 188 | | | | (337 | ) | | | (149 | ) |
| |
Retirement benefit obligation | | | 38,541 | | | | (40,989 | ) | | | (2,448 | ) | | | 37,222 | | | | (39,052 | ) | | | (1,830 | ) |
Deferred tax asset | | | | | | | | | | | 575 | | | | | | | | | | | | 460 | |
| |
Net pension obligation | | | | | | | | | | | (1,873 | ) | | | | | | | | | | | (1,370 | ) |
| |
| a | Included in the present value of liabilities of other plans is £68m (2011: £70m) related to unfunded pension arrangements. |
£6m (2011: £6m) of contributions to defined contribution plans were outstanding at 31 March 2012 and are reported under trade and other payables in the group balance sheet.
Movements in defined benefit plan assets and liabilities
The table below shows the movements on the plan assets and liabilities in the year and indicates where they are reflected in the financial statements.
| | | 0000000000 | | | | 0000000000 | | | | 0000000000 | |
| |
| Assets
£m |
| |
| Liabilities
£m |
| |
| Deficit
£m |
|
| |
At 1 April 2010 | | | 35,429 | | | | (43,293 | ) | | | (7,864 | ) |
Current service cost | | | – | | | | (297 | ) | | | (297 | ) |
Interest expense on pension plan liabilities | | | – | | | | (2,323 | ) | | | (2,323 | ) |
Expected return on pension plan assetsa | | | 2,244 | | | | – | | | | 2,244 | |
Included in the group income statement | | | 2,244 | | | | (2,620 | ) | | | (376 | ) |
Actuarial gain arising on plan assetsa | | | 234 | | | | – | | | | 234 | |
Actuarial gain arising on defined benefit liabilities | | | – | | | | 4,875 | | | | 4,875 | |
Included in the group statement of comprehensive income | | | 234 | | | | 4,875 | | | | 5,109 | |
Regular contributions by employer | | | 283 | | | | – | | | | 283 | |
Deficit contributions by employer | | | 1,030 | | | | – | | | | 1,030 | |
Included in the group cash flow statement | | | 1,313 | | | | – | | | | 1,313 | |
Contributions by employees | | | 15 | | | | (15 | ) | | | – | |
Benefits paid | | | (2,011 | ) | | | 2,014 | | | | 3 | |
Other movements | | | – | | | | (15 | ) | | | (15 | ) |
Exchange differences | | | (2 | ) | | | 2 | | | | – | |
Other movements | | | (1,998 | ) | | | 1,986 | | | | (12 | ) |
| |
At 1 April 2011 | | | 37,222 | | | | (39,052 | ) | | | (1,830 | ) |
Current service cost | | | – | | | | (267 | ) | | | (267 | ) |
Interest expense on pension plan liabilities | | | – | | | | (2,092 | ) | | | (2,092 | ) |
Expected return on pension plan assetsa | | | 2,289 | | | | – | | | | 2,289 | |
Included in the group income statement | | | 2,289 | | | | (2,359 | ) | | | (70 | ) |
Actuarial loss arising on plan assetsa | | | (1,070 | ) | | | – | | | | (1,070 | ) |
Actuarial loss arising on defined benefit liabilities | | | – | | | | (1,674 | ) | | | (1,674 | ) |
Included in the group statement of comprehensive income | | | (1,070 | ) | | | (1,674 | ) | | | (2,744 | ) |
Regular contributions by employer | | | 179 | | | | – | | | | 179 | |
Deficit contributions by employer | | | 2,000 | | | | – | | | | 2,000 | |
Included in the group cash flow statement | | | 2,179 | | | | – | | | | 2,179 | |
Contributions by employees | | | 14 | | | | (14 | ) | | | – | |
Benefits paid | | | (2,087 | ) | | | 2,091 | | | | 4 | |
Other movements | | | – | | | | 5 | | | | 5 | |
Exchange differences | | | (6 | ) | | | 14 | | | | 8 | |
Other movements | | | (2,079 | ) | | | 2,096 | | | | 17 | |
| |
At 31 March 2012 | | | 38,541 | | | | (40,989 | ) | | | (2,448 | ) |
| |
| a | The actual return on plan assets in 2012 was a gain of £1,219m (2011: £2,478m). |
| | |
| Notes to the consolidated financial statements | | British Telecommunications plc Annual Report & Form 20-F 2012 65 |
| 19. | Retirement benefit planscontinued |
BTPS assets
Asset allocation
The target allocation of assets between different classes of investment is reviewed regularly and is a key factor in the Trustee’s investment policy. The targets set reflect the Trustee’s views on the appropriate balance to be struck between seeking returns and incurring risk, and on the extent to which the assets should be distributed to match liabilities. Current market conditions and trends are continuously assessed and short-term tactical shifts in asset allocation may be made around the long-term target. The BTPS also uses financial instruments to balance the asset allocation and to manage interest rate risk, liquidity risk and foreign currency risk.
In the light of uncertainty in global economic conditions the Trustee has held a more defensive asset allocation during the year. This has included a short-term tactical decision to hold a lower equity allocation.
The lump sum deficit payment of £2.0bn made in late March 2012 is included in ‘cash and other’. In April 2012 the Scheme invested around £2.0bn of cash in a portfolio of global corporate bonds.
Under IAS 19 plan assets must be valued at the bid market value at the balance sheet date. For the main asset categories:
| — | | securities listed on recognised stock exchanges are valued at closing bid prices |
| — | | properties are valued on the basis of open market value |
| — | | unlisted equities are valued in accordance with International Private Equity and Venture Capital (IPEVC) guidelines. Unlisted fixed interest and index-linked instruments are valued using the latest market price or using discounted cash flow models that consider credit risk. |
The fair values of the assets of the BTPS analysed by asset category and the assumptions for the expected long-term rate of return on assets at 31 March were:
| | | rate of return00 | | | | rate of return00 | | | | rate of return00 | | | | rate of return00 | | | | rate of return00 | | | | rate of return00 | | | | rate of return00 | | | | rate of return00 | |
| | | 2012 | | | 2011 | |
| | | | | | | | |
| | | Expected
long-term rate of return (per year) | | | Asset fair valueb | | | Target | | | Expected
long-term
rate of return
(per year) | | | Asset fair valueb | | | Target | |
| | | | | | | | | | | | | | | | | | | | | | | | |
| At 31 March | | % | | | £bn | | | % | | | % | | | % | | | £bn | | | % | | | % | |
| |
UK equities | | | 7.10 | | | | 1.9 | | | | 5 | | | | 9 | | | | 7.90 | | | | 3.2 | | | | 8 | | | | 9 | |
Non-UK equities | | | 7.10 | | | | 5.9 | | | | 16 | | | | 22 | | | | 7.90 | | | | 8.2 | | | | 22 | | | | 22 | |
Fixed-interest securities | | | 3.70 | | | | 7.4 | | | | 19 | | | | 22 | | | | 5.00 | | | | 4.4 | | | | 12 | | | | 22 | |
Index-linked securities | | | 2.90 | | | | 7.4 | | | | 19 | | | | 15 | | | | 4.10 | | | | 5.9 | | | | 16 | | | | 15 | |
Property | | | 6.50 | | | | 4.1 | | | | 11 | | | | 11 | | | | 7.00 | | | | 3.9 | | | | 11 | | | | 11 | |
Alternative assetsa | | | 6.00 | | | | 8.1 | | | | 21 | | | | 21 | | | | 6.70 | | | | 7.3 | | | | 20 | | | | 21 | |
Cash and other | | | 2.20 | | | | 3.5 | | | | 9 | | | | – | | | | 3.60 | | | | 4.1 | | | | 11 | | | | – | |
| |
| | | 5.40 | | | | 38.3 | | | | 100 | | | | 100 | | | | 6.35 | | | | 37.0 | | | | 100 | | | | 100 | |
| |
| a | Alternative asset classes include commodities, hedge funds, private equity, infrastructure and credit opportunities. |
| b | At 31 March 2012 and 31 March 2011, the scheme’s assets did not include any ordinary shares of the company. However, the scheme held £8m (2011: £7m) of index-linked bonds and £nil (2011: £10m) of bonds issued by the group. |
The expected returns on fixed-interest and index-linked securities are based on the gross redemption yields at the start of the year which assume that the security is held to maturity. Expected returns on equities, property and alternative asset classes are based on a combination of an estimate of the risk premium above yields on government bonds, consensus economic forecasts of future returns and historical returns.
The overall expected long-term rate of return on assets at the end of the year is derived using the expected long-term rates of return for each category of asset weighted by the target asset allocation. The resulting percentage is used to calculate the expected return on plan assets reported in the income statement in the following year as a specific item.
The Trustee reports on investment performance against a target benchmark which is based on the target asset mix and the market returns for each asset class. BTPS performance against the benchmark for the periods to 31 December 2011 was as follows:
| | | benchmark | | | | benchmark | | | | benchmark | |
| Period ending 31 December 2011 | | Target benchmark % | | | Actual BTPS % | | | Over (under) performance % | |
| |
1 year | | | 3.7 | | | | 1.7 | | | | (2.0 | ) |
3 years | | | 8.6 | | | | 8.4 | | | | (0.2 | ) |
10 years | | | 5.4 | | | | 6.2 | | | | 0.8 | |
| |
Further commentary on investment performance is provided by the Trustee in the BTPS Annual Report.
| | |
| 66 British Telecommunications plc Annual Report & Form 20-F 2012 | | Notes to the consolidated financial statements |
| 19. | Retirement benefit planscontinued |
BTPS liabilities under IAS 19
Valuation methodology
The liabilities of the BTPS are measured as the present value of the best estimate of future cash flows to be paid out by the scheme using the projected unit credit method. The present value of scheme liabilities is calculated by estimating future benefit payments and discounting the resulting cash flows. These calculations are performed for the company by a professionally qualified independent actuary.
The expected future benefit payments are based on a number of assumptions including future inflation, retirement ages, benefit options chosen and life expectancy and are therefore inherently uncertain. Actual benefit payments in a given year may be higher or lower, for example if members retire sooner or later than assumed, or take more or less cash lump sum at retirement. The estimated duration of BTPS liabilities, which is an indicator of the weighted average term of the liabilities, is 15 years (2011: 15 years) although the benefits payable by the BTPS are expected to be paid over more than 80 years as shown in the following graph:
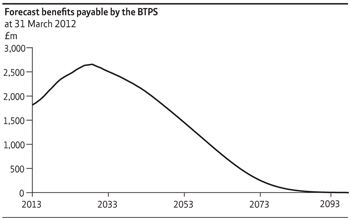
Key assumptions – IAS 19
The key financial assumptions used to measure the liabilities of the BTPS under IAS 19 are as follows:
| | | 000000000000 | | | | 000000000000 | | | | 000000000000 | | | | 000000000000 | | | | 000000000000 | | | | 000000000000 | |
| | | Nominal rates (per year)a | | | | Real rates (per year)b | |
| | | | | | | | |
At 31 March | |
| 2012
% |
| |
| 2011
% |
| |
| 2010
% |
| |
| 2012
% |
| |
| 2011
% |
| |
| 2010
% |
|
| |
Rate used to discount liabilities | | | 4.95 | | | | 5.50 | | | | 5.50 | | | | 1.84 | | | | 2.03 | | | | 1.83 | |
Inflation – increase in RPI | | | 3.05 | | | | 3.40 | | | | 3.60 | | | | – | | | | – | | | | – | |
Inflation – increase in CPI | | | 2.30 | c | | | 2.40 | d | | | n/a | | | | (0.75 | )c | | | (1.0 | )d | | | n/a | |
Average future increases in wages and salaries | | | 3.05 | | | | 3.40 | | | | 3.60 | | | | – | | | | – | | | | – | |
| |
| a | The nominal rate is used to discount the future expected benefit payments. |
| b | The real rate is calculated relative to RPI inflation and is shown as a comparator. |
| c | Assumed to reduce by 0.45% per year after the third year. |
| d | Assumed to be 0.50% per year lower for the first year. |
Rate used to discount liabilities
IAS 19 requires that the discount rate is determined by reference to market yields at the reporting date on high quality corporate bonds. The currency and term of these should be consistent with the currency and estimated term of the pension obligations. In line with developing best practice and reflecting a more sophisticated methodology, the discount rate at 31 March 2012 is based on a market-based AA corporate bond yield curve that matches the duration of the BTPS liabilities. This improved approach will be applied consistently going forward. At 31 March 2011 and 2010 the discount rate was based on a published index yield for a basket of corporate bonds and had this approach continued to be applied at 31 March 2012 the discount rate would have been around 30 basis points lower and the net pension deficit around £1.4bn higher net of tax.
Inflation – increases in RPI and CPI
Salary increases are assumed to be aligned with RPI inflation whilst benefits are assumed to increase by either RPI or CPI inflation as prescribed by the rules of the BTPS and summarised above. The assumption for RPI has been assessed by reference to yields on long-term fixed and index-linked Government bonds and Bank of England published inflationary expectations. CPI is assessed at a margin below RPI taking into account market forecasts and independent estimates of the long-run difference, such as the Office of Budgetary Responsibility’s projection of a long-term difference of between 1.3% to 1.5%.
| | |
| Notes to the consolidated financial statements | | British Telecommunications plc Annual Report & Form 20-F 2012 67 |
| 19. | Retirement benefit planscontinued |
Longevity
The average life expectancy assumptions, after retirement at 60 years of age, are as follows:
| | | 000000000000 | | | | 000000000000 | |
At 31 March | |
| 2012
Number of
years |
| |
| 2011
Number of
years |
|
| |
Male in lower pay bracket | | | 25.8 | | | | 25.3 | |
Male in higher pay bracket | | | 27.5 | | | | 27.6 | |
Female | | | 28.3 | | | | 28.2 | |
Average improvement for a member retiring at age 60 in 10 years’ time | | | 1.0 | | | | 1.1 | |
| |
The assumptions about life expectancy have regard to information published by the UK actuarial profession’s Continuous Mortality Investigation. However, due to the size of the membership of the BTPS it is considered appropriate for the adopted life expectancy assumptions to take into account the actual membership experience of the scheme. Allowance is also made for future improvements in mortality. The BTPS actuary undertakes formal reviews of the membership experience at every triennial valuation.
Sensitivity analysis of the principal assumptions used to measure BTPS liabilities
The assumptions on the discount rate, inflation, salary increases and life expectancy all have a significant effect on the measurement of scheme liabilities. The following table provides an indication of the sensitivity of the IAS 19 pension liability at 31 March 2012, and of the income statement charge for 2013, to changes in these assumptions:
| | | 00000000000000 | | | | 00000000000000 | | | | 00000000000000 | |
| |
| Decrease
(increase) in
liability
£bn |
| |
| Decrease
(increase) in
service cost
£m |
| |
| (Decrease)
increase in
net finance
income
£m |
|
| |
0.25 percentage point increase to: | | | | | | | | | | | | |
– discount rate | | | 1.4 | | | | 10 | | | | (5 | ) |
– inflation rate (assuming RPI, CPI and salary increases all move by 0.25 percentage points) | | | (1.2 | ) | | | (10 | ) | | | 15 | |
– salary increases (assuming RPI and CPI are unchanged) | | | (0.2 | ) | | | (5 | ) | | | (10 | ) |
Additional one year increase to life expectancy | | | (0.9 | ) | | | (5 | ) | | | (45 | ) |
0.1 percentage point increase in expected return on assets | | | – | | | | – | | | | 35 | |
| |
BTPS funding
Triennial funding valuation
The triennial valuation is carried out for the Trustee by a professionally qualified independent actuary, using the projected unit credit method. The purpose of the valuation is to design a funding plan to ensure that the scheme has sufficient funds available to meet future benefit payments. The latest funding valuation was performed as at 30 June 2011 rather than at 31 December 2011, the latest allowable date, which enabled the valuation to be largely completed and a lump sum deficit payment of £2.0bn to be made before 31 March 2012. The next funding valuation will have an effective date of no later than 30 June 2014.
The valuation basis for funding purposes, which is based on prudent assumptions, is broadly as follows:
| | — | | assets are valued at market value at the valuation date; and |
| | — | | liabilities are measured on an actuarial funding basis using a projected unit credit method and discounted to their present value. |
The results of the two most recent triennial valuations which have been performed using the same methodology were:
| | | 000000000000 | | | | 000000000000 | |
| |
| June
2011 Valuation £bn |
| |
| December
2008 Valuation £bn |
|
| |
BTPS liabilities | | | (40.8 | ) | | | (40.2 | ) |
Market value of BTPS assets | | | 36.9 | | | | 31.2 | |
| |
Funding deficit | | | (3.9 | ) | | | (9.0 | ) |
| |
Percentage of accrued benefits covered by BTPS assets at valuation date | | | 90.4% | | | | 77.6% | |
Percentage of accrued benefits on a solvency basis covered by the BTPS assets at the valuation date | | | 66.0% | | | | 57.0% | |
| |
The reduction of the funding deficit in the period from 31 December 2008 to 30 June 2011 reflects an increase in scheme assets due to deficit contribution payments totalling £1.6bn and strong investment performance of 10.1% per year. The liabilities have increased due to a lower discount rate which was partly offset by the impact of the announcement in July 2010 by the Government that CPI, rather than RPI, will be used as the basis for determining the rate of inflation for the statutory minimum rate of revaluation and indexation of occupational pension rights.
| | |
| 68 British Telecommunications plc Annual Report & Form 20-F 2012 | | Notes to the consolidated financial statements |
| 19. | Retirement benefit planscontinued |
Key assumptions – funding valuation
These valuations were determined using the following prudent long-term assumptions:
| | | | | | | | | | | | | | | | |
| | | Nominal rates (per year) | | | Real rates (per year)a | |
| | | | | | | | |
| | | June 2011
valuation % | | | December 2008
valuation % | | | June 2011
valuation % | | | December 2008
valuation % | |
| |
Discount rate | | | | | | | | | | | | | | | | |
– Pre-retirement liabilities | | | 6.35 | | | | 6.76 | | | | 3.05 | | | | 3.65 | |
– Post retirement liabilities | | | 4.90 | | | | 5.21 | | | | 1.65 | | | | 2.15 | |
Average long-term increase in RPI | | | 3.20 | | | | 3.00 | | | | – | | | | – | |
Average long-term increase in CPI | | | 2.20 | | | | n/a | | | | (1.0 | ) | | | n/a | |
Average future increases in wages and salaries | | | 3.20 | | | | 3.00 | | | | – | | | | – | |
Average increase in pensions linked to RPI | | | 3.20 | | | | 3.00 | | | | – | | | | – | |
Average increase in pensions linked to CPI | | | 2.20 | | | | n/a | | | | (1.0 | ) | | | n/a | |
| |
| a | The real rate is calculated relative to RPI inflation and is shown as a comparator. |
The average life expectancy assumptions, after retirement at 60 years of age, are as follows:
| | | December 2008 | | | | December 2008 | |
| At date of valuation | | June 2011
valuation
Number of
years | | | December
2008
valuation
Number of
years | |
| |
Male in lower pay bracket | | | 26.0 | | | | 25.5 | |
Male in higher pay bracket | | | 27.8 | | | | 27.7 | |
Female | | | 28.5 | | | | 28.3 | |
Average improvement for a member retiring at age 60 in 10 years’ time | | | 1.2 | | | | 1.1 | |
| |
| | |
| Payments made to the BTPS | | | | | | | | |
| | |
| Year ended 31 March | | 2012 £m | | | 2011 £m | |
| |
Ordinary contributions | | | 171 | | | | 266 | |
Deficit contributions | | | 2,000 | | | | 1,030 | |
| |
Total contributions in the year | | | 2,171 | | | | 1,296 | |
| |
The group expects to contribute approximately £550m to the BTPS in 2013, comprising ordinary contributions of £225m and deficit contributions of £325m. In 2012 ordinary contributions were lower compared with 2011 due to a deduction to recover overpayments made in an earlier year.
Future funding obligations and recovery plan
Under the terms of the Trust Deed, the group is required to have a funding plan, determined at the conclusion of the triennial funding valuation, which is a legal agreement between BT and the independent trustee and should address the deficit over a maximum period of 20 years.
In May 2012, the 2011 triennial funding valuation was finalised, agreed with the Trustee and certified by the Scheme Actuary. The funding deficit at 30 June 2011 was £3.9bn. Under the associated recovery plan BT made a payment of £2.0bn in March 2012 and will make deficit payments of £325m in March 2013 and 2014 followed by seven annual payments of £295m in each year from 2015 to 2021. The valuation in addition determined that the ordinary contributions rate required to meet the benefits of current employed members reduce to 13.5% of pensionable salaries (including employee contributions) from 13.6% with effect from 1 June 2012.
The valuation documentation will now be submitted to the Pensions Regulator for review. The final Court decision in the Crown Guarantee case, after any appeals, will give greater clarity as to the extent to which the liabilities of the BTPS are covered by the Crown Guarantee. This will inform the Pensions Regulator’s next steps with regard to the valuation of the scheme.
Under the 2008 recovery plan, the group made payments of £525m in December 2009 and 2010, and £505m in March 2011. The next payment would have been £583m in December 2012 and subsequent annual payments over the next 13 years would have increased by 3% per year to £856m in 2025.
| | |
| Notes to the consolidated financial statements | | British Telecommunications plc Annual Report & Form 20-F 2012 69 |
| 19. | Retirement benefit planscontinued |
Other protections
The 2011 funding agreement with the Trustee included additional features for BT to provide support to the scheme:
| — | | In the event that net cumulative shareholder distributions exceed cumulative pension deficit contributions over the period from 1 March 2012 to 30 June 2015 then BT will make additional matching contributions to the scheme. Shareholder distributions include dividends and the cost of share buybacks (excluding any possible buybacks associated with existing employee share plans) after deducting any proceeds from the issue of shares. BT will consult with the Trustee if it considers making a special dividend or embarking on a share buyback programme (excluding any possible buybacks associated with existing employee share plans). These provisions apply until the finalisation of the next valuation or 30 June 2015 at the latest. |
| — | | In the event that BT generates net cash proceeds greater than £1bn from disposals and acquisitions in any year to 30 June then BT will make additional contributions to the scheme equal to one third of those net cash proceeds. BT will consult with the Trustee if it considers making acquisitions with a total cost of more than £1bn in any 12-month period. These provisions apply until the finalisation of the next valuation or 30 September 2015 at the latest. |
| — | | A negative pledge that provides protection that future creditors will not be granted superior security to the scheme in excess of a £1.5bn threshold. This provision applies until the deficit reduces below £2.0bn at any subsequent funding valuation. |
| — | | In addition, in order to provide greater certainty, BT has committed to a schedule of future potential payments based upon a range of deficits at the next triennial valuations at 2014 and 2017. These payments would be in addition to the remaining deficit payments of £295m per year under the 2011 recovery plan and would have a maximum value of around £3.6bn in 2014 and £3.0bn in 2017 based on 2011 discount rates. |
At the 2014 valuation, the remaining 2011 recovery plan will be worth about £1.7bn (based on 2011 discount rates). If the deficit agreed at the 2014 valuation exceeds this level, BT will provide extra payments in addition to the remaining £295m annual deficit payments under the 2011 recovery plan. The amounts payable are dependent on the level of the deficit as shown in the table below:
| | | 202220220 | | | | 202220220 | | | | 202220220 | |
| | | Additional contributions payable | |
| | | | |
| |
| 2015
£m |
| |
| 2016
£m |
| |
| 2017
£m |
|
| |
Deficit above remaining 2011 recovery plan present value | | | | | | | | | | | | |
£nil | | | – | | | | – | | | | – | |
£1.0bn | | | 199 | | | | 205 | | | | 211 | |
£2.0bn | | | 273 | | | | 282 | | | | 289 | |
£2.9bn or above | | | 360 | | | | 371 | | | | 381 | |
| |
At deficit levels between these values the level of additional contributions is scaled accordingly. At a level of £2.9bn or above these are the maximum additional contributions under the terms of this agreement. A new agreement would cover additional contributions if these are required.
A similar mechanism applies based on the deficit agreed at the 2017 valuation. If this exceeds the outstanding recovery plan (with the remaining 2011 recovery plan worth about £1.1bn in 2017, based on 2011 discount rates), BT will provide extra payments dependent on the level of the deficit as shown in the table below:
| | | 20222022000 | | | | 20222022000 | | | | 20222022000 | | | | 20222022000 | | | | 20222022000 | | | | 20222022000 | | | | 20222022000 | |
| | | | | | | | | | | | | | | | | | | | | | | Additional contributions payable | |
| | | | |
| |
| 2018
£m |
| |
| 2019
£m |
| |
| 2020
£m |
| |
| 2021
£m |
| |
| 2022
£m |
| |
| 2023
£m |
| |
| 2024
£m |
|
| |
Deficit above remaining 2014 recovery plan present value | | | | | | | | | | | | | | | | | | | | | | | | | | | | |
£nil | | | – | | | | – | | | | – | | | | – | | | | – | | | | – | | | | – | |
£1.0bn | | | 197 | | | | 203 | | | | 209 | | | | 215 | | | | 207 | | | | 213 | | | | – | |
£2.0bn | | | 341 | | | | 351 | | | | 362 | | | | 373 | | | | 358 | | | | 369 | | | | 381 | |
£2.9bn or above | | | 393 | | | | 404 | | | | 416 | | | | 429 | | | | 670 | | | | 670 | | | | 670 | |
| |
A new agreement would cover additional contributions if these are required.
If the deficit at 2014 is below the value of the remaining 2011 recovery plan, no additional deficit contributions are necessary and the remaining recovery plan will be revised. Likewise, if the deficit at 2017 is below the remaining recovery plan at that time.
| | |
| 70 British Telecommunications plc Annual Report & Form 20-F 2012 | | Notes to the consolidated financial statements |
| 19. | Retirement benefit planscontinued |
Other protection of BTPS member benefits
In the unlikely event that the group were to become insolvent there are additional protections available to members:
| — | | the Crown Guarantee which was granted when the group was privatised in 1984 and which applies upon the winding up of BT. The scope and extent of the Crown Guarantee is being clarified by the Trustee through the courts. The decision of the High Court issued in October 2010 was that the Crown Guarantee can cover members who joined before and after privatisation. The Court confirmed that any payments to be made by the Government must be measured on an annuity basis. In a further High Court decision issued in December 2011, it was decided that the Crown Guarantee does not cover the benefits of members accrued while in service with companies that participate in the BTPS other than BT nor does it cover benefit augmentations granted by BT. The judgments may still be subject to appeal. |
| — | | the Pension Protection Fund (PPF) may take over the scheme and pay benefits to members not covered by the Crown Guarantee. There are limits on the amounts paid by the PPF and this would not give exactly the same benefits as those provided by the scheme. |
The ultimate parent company, BT Group plc, has savings-related share option plans for its employees and those of participating subsidiaries, further share option plans for selected employees and a stock purchase plan for employees in the US. It also has several share plans for executives. All share-based payment plans are equity settled in instruments of BT Group plc and details of these plans and an analysis of the total charge by type of award is set out below.
| | | | | | | | | | | | |
Year ended 31 March | |
| 2012
£m |
| |
| 2011
£m |
| |
| 2010
£m |
|
| |
Employee Sharesave Plans | | | 25 | | | | 23 | | | | 25 | |
Incentive Share Plan (ISP) | | | 43 | | | | 37 | | | | 29 | |
Deferred Bonus Plan (DBP) | | | 8 | | | | 5 | | | | 13 | |
Retention Share Plan (RSP) | | | – | | | | – | | | | 1 | |
Other plans | | | (1 | ) | | | 3 | | | | 3 | |
| |
| | | 75 | | | | 68 | | | | 71 | |
| |
Employee Sharesave Plans
Under an HMRC approved savings-related share option plan employees save on a monthly basis, over a three or five-year period, towards the purchase of shares at a fixed price determined when the option is granted. This price is usually set at a 20% discount to the market price for five-year plans and 10% for three-year plans. The options must be exercised within six months of maturity of the savings contract, otherwise they lapse. Similar plans operate for BT’s overseas employees.
Incentive Share Plan
Under the Incentive Share Plan, participants are only entitled to these shares in full at the end of a three-year period if the company has met the relevant pre-determined corporate performance measures and if the participants are still employed by the group. In 2012 the corporate performance measures for the ISP were amended: 40% of each share award is linked to a total shareholder return target (TSR) for a comparator group of companies from the beginning of the relevant performance period; 40% is linked to a three-year cumulative free cash flow measure, and 20% to growth in underlying revenue excluding transit. For ISP awards made in 2011 and 2010, 50% of each share award was linked to a TSR target for a comparator group of companies from the beginning of the relevant performance period and 50% was linked to a three-year cumulative free cash flow measure.
Deferred Bonus Plan
Under the Deferred Bonus Plan, awards are granted annually to selected employees of the group. Shares in the company are transferred to participants at the end of three years if they continue to be employed by the group throughout that period.
In accordance with the terms of the ISP and DBP, dividends or dividend equivalents earned on shares during the conditional periods are reinvested in company shares for the potential benefit of the participants.
| | |
| Notes to the consolidated financial statements | | British Telecommunications plc Annual Report & Form 20-F 2012 71 |
| 20. | Share-based paymentscontinued |
Share option plans
Movements in Employee Sharesave options during 2012, 2011 and 2010 are shown below.
| | | | | | | | | | | | | | | | | | | | | | | | |
| | | Movement in the number of share options | | | | Weighted average exercise price | |
| | | | | | | | |
| |
| 2012
millions |
| |
| 2011
millions |
| |
| 2010
millions |
| |
| 2012
pence |
| |
| 2011
pence |
| |
| 2010
pence |
|
| |
Outstanding at 1 April | | | 567 | | | | 534 | | | | 136 | | | | 77 | | | | 76 | | | | 160 | |
Granted | | | 33 | | | | 78 | | | | 490 | | | | 161 | | | | 107 | | | | 63 | |
Forfeited | | | (17 | ) | | | (28 | ) | | | (44 | ) | | | 97 | | | | 94 | | | | 107 | |
Exercised | | | (12 | ) | | | (3 | ) | | | (1 | ) | | | 132 | | | | 163 | | | | 125 | |
Expired | | | (10 | ) | | | (14 | ) | | | (47 | ) | | | 140 | | | | 175 | | | | 150 | |
| |
Outstanding at 31 March | | | 561 | | | | 567 | | | | 534 | | | | 79 | | | | 77 | | | | 76 | |
| |
Exercisable at 31 March | | | 1 | | | | 1 | | | | 1 | | | | 128 | | | | 111 | | | | 163 | |
| |
|
The weighted average share price for all options exercised during 2012 was 203p (2011: 181p, 2010: 136p). The following table summarises information relating to options outstanding and exercisable under Employee Sharesave plans at 31 March 2012. | |
Normal dates of vesting and exercise (based on calendar years) | | | | | | | | | | | | | |
| Exercise
price per share |
| |
| Number of
outstanding
options
millions |
| |
| Number of
exercisable
options
millions |
|
| |
BT Group Employee Sharesave Plans | | | | | | | | | | | | | | | | | | | | | | | | |
2012 | | | | | | | | | | | | | | | 68p – 262p | | | | 121 | | | | 1 | |
2013 | | | | | | | | | | | | | | | 104p – 185p | | | | 34 | | | | – | |
2014 | | | | | | | | | | | | | | | 61p – 175p | | | | 341 | | | | – | |
2015 | | | | | | | | | | | | | | | 104p –158p | | | | 44 | | | | – | |
2016 | | | | | | | | | | | | | | | 156p | | | | 21 | | | | – | |
| |
Total | | | | | | | | | | | | | | | | | | | 561 | | | | 1 | |
| |
The options outstanding under Employee Sharesave plans at 31 March 2012 have weighted average remaining contractual lives as follows: | |
| | | | | | | | | | | | | | | | | | | Employee Sharesave plans | |
| | | | | | | | | | | | | | | | |
Range of exercise prices | | | | | | | | | | | | | |
| Weighted
average
exercise
price |
| |
| Number of
outstanding
options
millions |
| |
| Weighted
average
remaining
contractual life |
|
| |
61p | | | | | | | | | | | | | | | 61p | | | | 316 | | | | 34 months | |
68p | | | | | | | | | | | | | | | 68p | | | | 115 | | | | 10 months | |
104p – 185p | | | | | | | | | | | | | | | 125p | | | | 125 | | | | 38 months | |
262p | | | | | | | | | | | | | | | 262p | | | | 5 | | | | 10 months | |
| |
Total | | | | | | | | | | | | | | | 79p | | | | 561 | | | | 30 months | |
| |
During 2012 1m (2011: 5m, 2010: 4m) options were forfeited, 2m (2011: nil, 2010: nil) options exercised and 2m (2011: 4m, 2010: nil) options expired under former executive share option plans (GSOP and GLOP). Under these plans 24m (2011: 29m, 2010: 38m) options were outstanding at the end of the year and are exercisable up to 2015. The weighted average exercise price of the outstanding options was 198p (2011: 207p, 2010: 255p). At 31 March 2012 outstanding options under GSOP and GLOP had a weighted average remaining contractual life of 17 months.
| | |
| 72 British Telecommunications plc Annual Report & Form 20-F 2012 | | Notes to the consolidated financial statements |
| 20. | Share-based paymentscontinued |
Executive share plans
Movements in executive share plans during 2012 are shown below:
| | | | | | | | | | | | | | | | | | | | | | | | |
| | | | | | | | | | | Number of shares (millions) | |
| | | | | | | | | | | ISP | | | | DBP | | | | RSP | | | | Total | |
| |
At 1 April 2011 | | | | | | | | | | | 114.5 | | | | 18.7 | | | | 0.3 | | | | 133.5 | |
Awards granted | | | | | | | | | | | 30.0 | | | | 6.7 | | | | 0.3 | | | | 37.0 | |
Awards vested | | | | | | | | | | | – | | | | (5.5 | ) | | | (0.2 | ) | | | (5.7 | ) |
Awards lapsed | | | | | | | | | | | (35.2 | ) | | | (0.9 | ) | | | – | | | | (36.1 | ) |
Dividend shares reinvested | | | | | | | | | | | 4.9 | | | | 0.9 | | | | – | | | | 5.8 | |
| |
At 31 March 2012 | | | | | | | | | | | 114.2 | | | | 19.9 | | | | 0.4 | | | | 134.5 | |
| |
At 31 March 2012, 0.1m shares (2011: 0.3m) were held in trust and 134.4m shares (2011: 133.2m) were held in treasury for executive share plans. Fair values The following table summarises the fair values and key assumptions used for valuing grants made under the Employee Sharesave plans and ISP in 2012, 2011 and 2010. | |
| | | | | | | 2012 | | | | | | | | 2011 | | | | | | | | 2010 | |
| | | | | | | | | | | | |
Year ended 31 March | |
| Employee
Sharesave |
| | | ISP | | |
| Employee
Sharesave |
| | | ISP | | |
| Employee
Sharesave |
| | | ISP | |
| |
Weighted average fair value | | | 44p | | | | 170p | | | | 34p | | | | 108p | | | | 14p | | | | 106p | |
Weighted average share price | | | 198p | | | | 198p | | | | 138p | | | | 134p | | | | 80p | | | | 131p | |
Weighted average exercise price | | | 161p | | | | – | | | | 107p | | | | – | | | | 63p | | | | – | |
Expected dividend yield | | | 5.3% – 5.5% | | | | 5.3% | | | | 5.4% – 5.8% | | | | 5.4% | | | | 5.7% – 6.4% | | | | 6.5% | |
Risk free rates | | | 1.1% – 2.0% | | | | 1.1% | | | | 1.2% – 2.2% | | | | 1.2% | | | | 2.2% – 2.8% | | | | 2.5% | |
Expected volatility | | | 31.0% – 35.6% | | | | 31.2% | | | | 34.4% – 41.4% | | | | 34.4% | | | | 26.9% – 30.7% | | | | 38.5% | |
| |
Employee Sharesave grants are valued using a Binomial options pricing model. Awards under the ISP are valued using Monte Carlo simulations. TSRs were generated for BT Group plc and the comparator group at the end of the three-year performance period, using each company’s volatility and dividend yield, as well as the cross correlation between pairs of stocks.
Volatility has been determined by reference to BT Group plc’s historical volatility which is expected to reflect the BT Group plc share price in the future. An expected life of three months after vesting date is assumed for Employee Sharesave options and for all other awards the expected life is equal to the vesting period. The risk-free interest rate is based on the UK gilt curve in effect at the time of the grant, for the expected life of the option or award.
The fair values for the DBP and RSP were determined using the market price of the shares at the date of grant. The weighted average share price for DBP awards granted in 2012 was 198p (2011: 131p, 2010: 131p).
| | | | | | | | | | | | | | | | |
At 31 March | | | | | | | | | |
| 2012
£m |
| |
| 2011
£m |
|
Non-current assets | | | | | | | | | | | | | | | | |
Available-for-sale | | | | | | | | | | | 81 | | | | 80 | |
Amounts owed by ultimate parent company | | | | | | | | | | | 1,286 | | | | 682 | |
Amounts owed by parent company | | | | | | | | | | | 18,140 | | | | 17,339 | |
Fair value through profit and loss | | | | | | | | | | | 10 | | | | – | |
| |
| | | | | | | | | | | 19,517 | | | | 18,101 | |
| |
Current assets | | | | | | | | | | | | | | | | |
Available-for-sale | | | | | | | | | | | 505 | | | | 1 | |
Amounts owed by ultimate parent company | | | | | | | | | | | 21 | | | | 13 | |
Amounts owed by parent company | | | | | | | | | | | 630 | | | | 1,206 | |
Loans and receivables | | | | | | | | | | | 8 | | | | 7 | |
Fair value through profit and loss | | | | | | | | | | | – | | | | 11 | |
| |
| | | | | | | | | | | 1,164 | | | | 1,238 | |
| |
The majority of current asset investments are held for periods ranging from one day to one year.
Current assets consist of investments in AAA rated liquidity funds denominated in Sterling of £505m (2011: £nil). Non-current assets include unlisted investments of £31m (2011: £31m), listed investments of £31m (2011: 34m) and an investment in the shares of the ultimate parent company, BT Group plc, of £19m (2011: £15m). These shares are held in trust for the BT Group Incentive Share Plan, the Retention Share Plan and the Deferred Bonus Plan.
Amounts owed by parent and ultimate parent company mainly consist of Sterling denominated loans which earn a floating rate of interest based upon LIBOR. Further details of these amounts are disclosed in note 28.
| | |
| Notes to the consolidated financial statements | | British Telecommunications plc Annual Report & Form 20-F 2012 73 |
| 22. | Cash and cash equivalents |
| | | 555555555 | | | | 555555555 | |
At 31 March | |
| 2012
£m |
| |
| 2011
£m |
|
| |
Cash at bank and in hand | | | 251 | | | | 144 | |
| |
Cash equivalents | | | | | | | | |
Loans and receivables | | | | | | | | |
US deposits | | | 66 | | | | 20 | |
UK deposits | | | 8 | | | | 182 | |
European deposits | | | 1 | | | | 8 | |
| |
Total cash equivalents | | | 75 | | | | 210 | |
| |
Total cash and cash equivalents | | | 326 | | | | 354 | |
Bank overdrafts | | | (8 | ) | | | (26 | ) |
| |
Cash and cash equivalents per the cash flow statement | | | 318 | | | | 328 | |
| |
The group has cross undertaking guarantee facilities across certain bank accounts which allow a legally enforceable right of set-off of the relevant cash and overdraft balances on bank accounts included within each scheme.
The group’s cash at bank included restricted cash of £76m (2011: £77m), of which £68m (2011: £59m) were held in countries in which prior approval is required to transfer funds abroad. Such liquid funds are at the group’s disposition within a reasonable period of time if it complies with these requirements. The remaining balance of £8m (2011: £18m) were held in escrow accounts.
| 23. | Loans and other borrowings |
| | | 555555555 | | | | 555555555 | |
At 31 March | |
| 2012
£m |
| |
| 2011
£m |
|
| |
US Dollar 5.15% bonds January 2013a | | | 538 | | | | 537 | |
Euro 5.25% bonds January 2013a | | | 842 | | | | 898 | |
Euro 5.25% bonds June 2014a | | | 650 | | | | 693 | |
Euro 6.125% bonds July 2014a,b | | | 522 | | | | 557 | |
Euro 6.5% bonds July 2015a | | | 874 | | | | 930 | |
Sterling 8.50% bonds December 2016 (2011: 8.75%; minimum 7.5%c) | | | 705 | | | | 715 | |
Sterling 6.625% bonds June 2017a | | | 525 | | | | 525 | |
US Dollar 5.95% bonds January 2018a | | | 697 | | | | 695 | |
Sterling 8.625% bonds March 2020 | | | 298 | | | | 298 | |
Sterling 3.5% index linked bonds April 2025 | | | 358 | | | | 340 | |
Sterling 5.75% bonds December 2028d | | | 686 | | | | 605 | |
US Dollar 9.625% bonds December 2030 (2011: 9.875%: minimum 8.625%c)a | | | 1,719 | | | | 1,714 | |
Sterling 6.375% bonds June 2037a | | | 522 | | | | 521 | |
| |
Total listed bonds | | | 8,936 | | | | 9,028 | |
| |
Finance leases | | | 285 | | | | 294 | |
| |
Sterling 6.375% bank loan due August 2012 | | | 312 | | | | 312 | |
Commercial papere | | | 588 | | | | 71 | |
Other loans | | | 357 | | | | 125 | |
Bank overdrafts | | | 8 | | | | 26 | |
Amounts due to parent companyf | | | – | | | | 32 | |
| |
Total other loans and borrowings | | | 1,265 | | | | 566 | |
| |
Total loans and borrowingsg | | | 10,486 | | | | 9,888 | |
| |
| a | Designated in a cash flow hedge relationship. |
| b | The interest rate payable on this bond attracts an additional 1.25% for a downgrade by one credit rating category by either or both Moody’s and S&P below Baa3/BBB-, respectively. |
| c | The interest rate payable on these bonds will be subject to adjustment from time to time if either Moody’s or S&P reduce the rating ascribed to the group’s senior unsecured debt below A3 in the case of Moody’s or below A- in the case of S&P. In this event, the interest payable on the bonds and the spread applicable to the floating bonds will be increased by 0.25% for each rating category adjustment by each rating agency. In addition, if Moody’s or S&P subsequently increase the ratings ascribed to the group’s senior unsecured debt, then the interest rate will be decreased by 0.25% for each rating category upgrade by each rating agency, but in no event will the interest rate be reduced below the minimum interest rate reflected in the above table. In July 2011 S&P upgraded BT’s credit rating by one category to BBB. At the next coupon date in 2012 the rate payable on these bonds decreased by 0.25 percentage points. |
| d | Designated in a fair value hedge relationship. |
| e | Commercial paper is denominated in Euros £208m (2011: £56m) and US Dollars £380m (2011: £15m). |
| f | Amounts due to parent company include loans denominated in Euros £nil (2011: £5m) and incur floating rates of interest. |
| g | Current liabilities of £2,887m (2011: £490m) consist of listed bonds of £1,366m (2011: £nil). Sterling bank loans of £300m (2011: £nil), bank overdrafts of £8m (2011: £26m), commercial paper of £588m (2011: £71m), finance leases of £15m (2011: £2m), amounts owed to parent company £nil (2011: £2m), other loans of £355m (2011: £125m) and accrued interest on listed bonds of £255m (2011: £264m). |
| | |
| 74 British Telecommunications plc Annual Report & Form 20-F 2012 | | Notes to the consolidated financial statements |
| 23. | Loans and other borrowingscontinued |
The interest rates payable on loans and borrowings disclosed above reflect the coupons on the underlying issued loans and borrowings and not the interest rates achieved through applying associated cross-currency and interest rate swaps in hedge arrangements.
The carrying values disclosed above reflect balances at amortised cost adjusted for accrued interest and current fair value adjustments to the relevant loans or borrowings. This does not reflect the final principal repayment that will arise after taking account of the relevant derivatives in hedging relationships which is reflected in the table below. Apart from finance leases, all borrowings as at 31 March 2012 and 2011 were unsecured.
| | | | | | | | | | | | | | | | | | | | | | | | | | |
| | | 2012 | | | | | 2011 | |
| | | | | | | | | | |
At 31 March | |
| Carrying
amount
£m |
| |
| Effect of hedging
and interesta
£m |
| |
| Principal repayment
at hedged rates
£m |
| | | |
| Carrying
amount
£m |
| |
| Effect of hedging
and interesta
£m |
| |
| Principal repayments
at hedged rates
£m |
|
Repayments fall due as follows: | | | | | | | | | | | | | | | | | | | | | | | | | | |
Within one year, or on demand | | | 2,887 | | | | (262 | ) | | | 2,625 | | | | | | 490 | | | | (267 | ) | | | 223 | |
| |
Between one and two years | | | 10 | | | | – | | | | 10 | | | | | | 1,747 | | | | (66 | ) | | | 1,681 | |
Between two and three years | | | 1,132 | | | | 26 | | | | 1,158 | | | | | | 10 | | | | – | | | | | |
Between three and four years | | | 845 | | | | (40 | ) | | | 805 | | | | | | 1,209 | | | | (48 | ) | | | 1,161 | |
Between four and five years | | | 695 | | | | – | | | | 695 | | | | | | 901 | | | | (94 | ) | | | 807 | |
After five years | | | 4,839 | | | | (207 | ) | | | 4,632 | | | | | | 5,534 | | | | (198 | ) | | | 5,336 | |
| |
Total due for repayment after more than one year | | | 7,521 | | | | (221 | ) | | | 7,300 | | | | | | 9,401 | | | | (406 | ) | | | 8,995 | |
| |
Total repayments | | | 10,408 | | | | (483 | ) | | | 9,925 | | | | | | 9,891 | | | | (673 | ) | | | 9,218 | |
Fair value adjustments for hedged risk | | | 78 | | | | | | | | | | | | | | (3 | ) | | | | | | | | |
| |
Total loans and other borrowings | | | 10,486 | | | | | | | | | | | | | | 9,888 | | | | | | | | | |
| |
| a | Adjustments for hedging and interest reflect the impact of the currency element of derivatives and adjust the repayments to exclude interest recognised in the carrying amount. |
As noted above, the principal repayments of loans and borrowings at hedged rates amounted to £9,925m (2011: £9,218m). The table below reflects the currency risk and interest cash flow and fair value risk associated with these loans and borrowings after the impact of hedging.
| | | | | | | | | | | | | | | | | | | | | | | | | | |
| | | 2012 | | | | | 2011 | |
| | | | | | | | | | |
At 31 March | |
| Fixed rate
interest
£m |
| |
| Floating rate
interest
£m |
| |
| Total
£m |
| | | |
| Fixed rate
interest £m |
| |
| Floating rate
interest £m |
| |
| Total
£m |
|
| |
Sterling | | | 7,948 | | | | 1,522 | | | | 9,470 | | | | | | 7,954 | | | | 939 | | | | 8,893 | |
Euro | | | – | | | | 447 | | | | 447 | | | | | | – | | | | 288 | | | | 288 | |
US Dollar | | | 6 | | | | 1 | | | | 7 | | | | | | 18 | | | | 2 | | | | 20 | |
Other | | | – | | | | 1 | | | | 1 | | | | | | – | | | | 17 | | | | 17 | |
| |
Total | | | 7,954 | | | | 1,971 | | | | 9,925 | | | | | | 7,972 | | | | 1,246 | | | | 9,218 | |
| |
Weighted average fixed interest rate | | | | | | | | | | | | | | | | | | | | | | | | | | |
Sterling | | | 7.3% | | | | | | | | | | | | | | 7.4% | | | | | | | | | |
| |
The floating rate loans and borrowings bear interest rates fixed in advance for periods ranging from one day to one year, primarily by reference to LIBOR and EURIBOR quoted rates.
Obligations under finance leases at the balance sheet date are analysed as follows:
| | | 0000000000000000 | | | | 0000000000000000 | | | | 0000000000000000 | | | | 0000000000000000 | |
| | | 2012 | | | | 2011 | | | | 2012 | | | | 2011 | |
| | | | | | | | | | | | | | | | |
| | | Minimum lease payments | | |
| Repayment of outstanding
lease obligations |
|
At 31 March | | | £m | | | | £m | | | | £m | | | | £m | |
| |
Amounts payable under finance leases: | | | | | | | | | | | | | | | | |
Within one year | | | 37 | | | | 19 | | | | 15 | | | | 2 | |
In the second to fifth years inclusive | | | 102 | | | | 128 | | | | 34 | | | | 57 | |
After five years | | | 484 | | | | 513 | | | | 236 | | | | 235 | |
| |
| | | 623 | | | | 660 | | | | 285 | | | | 294 | |
Less: future finance charges | | | (338 | ) | | | (366 | ) | | | – | | | | – | |
| |
Total finance lease obligations | | | 285 | | | | 294 | | | | 285 | | | | 294 | |
| |
Assets held under finance leases mainly consist of buildings and network assets. The group’s obligations under finance leases are secured by the lessors’ title to the leased assets.
| | |
| Notes to the consolidated financial statements | | British Telecommunications plc Annual Report & Form 20-F 2012 75 |
| 24. | Finance expense and income |
| | | | | | | | | | | | |
Year ended 31 March | |
| 2012
£m |
| |
| 2011
£m |
| |
| 2010
£m |
|
| |
Finance expense | | | | | | | | | | | | |
Interest on listed bondsa,b | | | 607 | | | | 775 | | | | 806 | |
Interest on finance leasesa | | | 18 | | | | 18 | | | | 18 | |
Interest on immediate and ultimate parent company borrowingsa | | | – | | | | – | | | | 1 | |
Interest on other borrowingsa | | | 42 | | | | 56 | | | | 58 | |
Unwinding of discount on provisionsa | | | 5 | | | | 3 | | | | 4 | |
Fair value movements on derivativesc | | | 29 | | | | 34 | | | | 19 | |
Net loss on disposal of available-for-sale financial assetsd | | | – | | | | 1 | | | | – | |
| |
Finance expensee,f | | | 701 | | | | 887 | | | | 906 | |
Less: amounts included in the cost of qualifying assetsg | | | (9 | ) | | | (6 | ) | | | (3 | ) |
| |
Total finance expense before specific items | | | 692 | | | | 881 | | | | 903 | |
| |
Specific items (note 9) | | | 2,092 | | | | 2,323 | | | | 2,211 | |
| |
Total finance expense | | | 2,784 | | | | 3,204 | | | | 3,114 | |
| |
| a | Calculated using the effective interest rate method unless otherwise stated below. |
| b | Includes a net charge of £5m (2011: £38m, 2010: £44m) relating to fair value movements on derivatives recycled from the cash flow reserve. |
| c | Includes a charge of £16m (2011: £28m, 2010: £9m) arising from restructuring certain derivatives and a charge of £13m (2011: £6m, 2010: £10m) due to fair value movements on derivatives not in a designated hedge relationship. |
| d | Includes a charge of £nil (2011: £1m, 2010: £nil) recycled from the available-for-sale reserve. |
| e | Includes a net charge of £81m (2011: net credit of £3m, 2010: net credit of £29m) relating to fair value movements arising on hedged items and a net credit of £81m (2011: net charge of £3m, 2010: net charge of £29m) relating to fair value movements arising on derivatives designated as fair value hedges. |
| f | Includes a net credit of £174m (2011: £293m, 2010: £451m) relating to foreign exchange movements on loans and borrowings and a net charge of £174m (2011: £293m, 2010: £451m) relating to fair value movements on derivatives recycled from the cash flow reserve. The items generating these foreign exchange movements are in designated hedge relationships. |
| g | The weighted average capitalisation rate on general borrowings was 7.3% in 2012 (2011: 7.8%, 2010: 7.9%). |
| | | | | | | | | | | | |
Year ended 31 March | |
| 2012
£m |
| |
| 2011
£m |
| |
| 2010
£m |
|
| |
Finance income | | | | | | | | | | | | |
Interest on available-for-sale investments | | | 6 | | | | 9 | | | | 5 | |
Interest on loans and receivables | | | 5 | | | | 7 | | | | 7 | |
Interest income on loans to immediate and ultimate parent company | | | 290 | | | | 248 | | | | 282 | |
Other interest and similar income | | | – | | | | 19 | | | | – | |
| |
Total finance income before specific items | | | 301 | | | | 283 | | | | 294 | |
| |
Specific items (note 9) | | | 2,289 | | | | 2,244 | | | | 1,943 | |
| |
Total finance income | | | 2,590 | | | | 2,527 | | | | 2,237 | |
| |
| | | |
Year ended 31 March | |
| 2012
£m |
| |
| 2011
£m |
| |
| 2010
£m |
|
| |
Net finance expense before specific items | | | 391 | | | | 598 | | | | 609 | |
| |
Specific items (note 9) | | | (197 | ) | | | 79 | | | | 268 | |
| |
Net finance expense | | | 194 | | | | 677 | | | | 877 | |
| |
| | |
| 76 British Telecommunications plc Annual Report & Form 20-F 2012 | | Notes to the consolidated financial statements |
| 25. | Financial instruments and risk management |
The group issues or holds financial instruments mainly to finance its operations; to finance corporate transactions such as dividends, share buy backs and acquisitions; for the temporary investment of short-term funds; and to manage the currency and interest rate risks arising from its operations and from its sources of finance. In addition, various financial instruments, for example trade receivables and trade payables, arise directly from the group’s operations.
Financial risk management
The group’s activities expose it to a variety of financial risks: market risk (including interest rate risk and foreign exchange risk); credit risk and liquidity risk.
Funding and exposure management
The group finances its operations primarily by a mixture of issued share capital, retained profits and long-term and short-term borrowing. The group borrows in the major long-term bond markets in major currencies and typically, but not exclusively, these markets provide the most cost effective means of long-term borrowing. The group uses derivative financial instruments primarily to manage its exposure to changes in interest and foreign exchange rates against these borrowings. The derivatives used for this purpose are principally interest rate swaps, cross currency swaps and forward currency contracts. The group also uses forward currency contracts to hedge some of its currency exposures arising from funding its overseas operations, acquisitions, overseas assets, liabilities and forward purchase commitments. The group does not hold or issue derivative financial instruments for trading purposes. All transactions in derivative financial instruments are undertaken to manage the risks arising from underlying business activities.
Treasury operations
The group has a centralised treasury operation whose primary role is to manage liquidity, funding, investments and counterparty credit risk arising from transactions with financial institutions. This treasury operation also manages the group’s market exposures, including risks from volatility in currency and interest rates. The treasury operation acts as a central bank to group entities providing central deposit taking, funding and foreign exchange management services. Funding and deposit taking is usually provided in the functional currency of the relevant entity. The treasury operation is not a profit centre and its objective is to manage financial risk at optimum cost.
Treasury policy
The BT Group plc Board sets the policy for the group’s treasury operation. Group treasury activities are subject to a set of controls commensurate with the magnitude of the borrowing, investments and group-wide exposures. The BT Group plc Board has delegated its authority to operate these polices to a series of panels that are responsible for the management of key treasury risks and operations. Appointment to and removal from the key panels requires approval from two of the Chairman, the Chief Executive or the Group Finance Director of the BT Group plc Board.
The management of exposures arising from trading related financial instruments, primarily trade receivables and trade payables, is through a series of policies and procedures set at a group and line of business level. Line of business management apply and review these policies and procedures to assess and manage the financial risks arising from these financial instruments.
There has been no change in the nature of the group’s risk profile between 31 March 2012 and the date of approval of these financial statements.
Interest rate risk management
Management policy
The group has interest bearing financial assets and liabilities which may expose the group to either cash flow or fair value volatility. The group’s policy, as prescribed by the BT Group plc Board, is to ensure that at least 70% of BT Group plc’s consolidated net debt is at fixed rates. Short-term interest rate management is delegated to the treasury operation while long-term interest rate management decisions require further approval from the BT Group plc Group Finance Director, Director Treasury, Tax and Risk Management or the Treasurer who have been delegated such authority by the BT Group plc Board.
| | |
| Notes to the consolidated financial statements | | British Telecommunications plc Annual Report & Form 20-F 2012 77 |
| 25. | Financial instruments and risk managementcontinued |
Hedging strategy
In order to manage the group’s interest rate mix profile, the group has entered into cross currency and interest rate swap agreements with commercial banks and other institutions to vary the amounts and periods for which interest rates on borrowings are fixed. The duration of the swap agreements matches the duration of the debt instruments. The majority of the group’s long-term borrowings have been, and are, subject to fixed Sterling interest rates after applying the impact of these hedging instruments. Outstanding cross currency and interest rate swaps at 31 March 2012 are detailed in the Hedging activities and Other derivatives section below.
The group’s fixed to floating interest rate profile, after hedging, on gross borrowings was:
| | | | | | | | | | | | | | | | | | | | | | | | |
| | | | | | | | | 2012 | | | | | | | | | 2011 | |
| | | | | | | | |
| At 31 March | | Fixed rate
interest
£m | | | Floating rate
interest £m | | | Total £m | | | Fixed rate
interest
£m | | | Floating rate
interest £m | | | Total £m | |
| |
Total borrowingsa | | | 7,954 | | | | 1,971 | | | | 9,925 | | | | 7,972 | | | | 1,246 | | | | 9,218 | |
| |
Ratio of fixed to floating | | | 80% | | | | 20% | | | | 100% | | | | 86% | | | | 14% | | | | 100% | |
| |
Sensitivities
Interest rates
The group is exposed to volatility in the income statement and shareholders’ equity arising from changes in interest rates. To demonstrate this volatility, management have concluded that a 1% increase in interest rates and parallel shift in yield curves across Sterling, US Dollar and Euro currencies is a reasonable benchmark for performing a sensitivity analysis.
After the impact of hedging, the group’s main exposure to interest rate volatility in the income statement arises from fair value movements on derivatives that are not in hedging relationships, investments and cash equivalents which are largely influenced by Sterling interest rates. With all other factors remaining constant at 31 March 2012, a 1% increase in Sterling interest rates would decrease the group’s annual net finance expense by approximately £194m (2011: £184m).
The group’s main exposure to interest rate volatility within shareholders’ equity arises from fair value movements on derivatives held in the cash flow reserve. The derivatives have an underlying interest exposure to Sterling, Euro and US Dollar rates. With all other factors remaining constant and based on the composition of derivatives included in the cash flow reserve at the balance sheet date, a 1% increase in interest rates in each of the currencies would impact equity, before tax, as detailed below:
| | | | | | | | |
| At 31 March | | 2012 £m
(Reduce)
Increase | | | 2011 £m
(Reduce)
Increase | |
| |
Sterling interest rates | | | 435 | | | | 426 | |
US Dollar interest rates | | | (406 | ) | | | (355 | ) |
Euro interest rates | | | (66 | ) | | | (94 | ) |
| |
A 1% decrease in interest rates would have broadly the same impact in the opposite direction.
Credit ratings
The group’s 2016 and 2030 bonds contain a covenant such that if the BT Group plc’s credit rating were downgraded below A3 in the case of Moody’s or below A– in the case of Standard & Poor’s (S&P), additional interest would accrue from the next coupon period at a rate of 0.25% for each ratings category adjustment by each agency. Based on the total notional value of debt outstanding of £2.4bn at 31 March 2012, the group’s finance expense would increase/decrease by approximately £12m a year if BT Group plc’s credit rating were to be downgraded/ upgraded respectively, by one credit rating category by both agencies from the current ratings.
The group’s€600m 2014 bond attracts an additional 1.25% for a downgrade by one credit rating by either or both Moody’s and S&P below Baa3/BBB–, respectively. This would result in an additional finance expense of approximately £6m a year.
The BT Group plc’s credit rating was upgraded by S&P to BBB in July 2011 Moody’s reaffirmed the group’s rating as Baa2 in March 2012. At 31 March BT Group plc’s credit ratings were as detailed below:
| | | | | | | | | | | | | | | | |
| | | 2012 | | | 2011 | |
| | | | | | | | |
| At 31 March | | Rating | | | Outlook | | | Rating | | | Outlook | |
| |
Rating Agency | | | | | | | | | | | | | | | | |
Standard & Poor’s | | | BBB | | | | Stable | | | | BBB– | | | | Positive | |
Moody’s | | | Baa2 | | | | Stable | | | | Baa2 | | | | Stable | |
| |
| | |
| 78 British Telecommunications plc Annual Report & Form 20-F 2012 | | Notes to the consolidated financial statements |
| 25. | Financial instruments and risk managementcontinued |
Foreign exchange risk management
Management policy
The purpose of the group’s foreign currency hedging activities is to protect the group from the risk that eventual future net inflows and net outflows will be adversely affected by changes in exchange rates. The BT Group plc Board’s policy for foreign exchange risk management defines the type of transactions which should normally be covered, including significant operational, funding and currency interest exposures, and the period over which cover should extend for the different types of transactions. Short-term foreign exchange management is delegated to the treasury operation whilst long-term foreign exchange management decisions require further approval from the BT Group plc Group Finance Director, Director Treasury, Tax and Risk Management or the Treasurer who have been delegated such authority by the BT Group plc Board. The policy delegates authority to the Director Treasury, Tax and Risk Management to take positions of up to £100m and for the Group Finance Director to take positions of up to £1bn.
Hedging strategy
A significant proportion of the group’s current revenue is invoiced in Sterling, and a significant element of its operations and costs arise within the UK. The group’s overseas operations generally trade and are funded in their functional currency which limits their exposure to foreign exchange volatility. The group’s foreign currency borrowing comprised:
| | | | | | | | |
| At 31 March | | 2012 £m | | | 2011 £m | |
| |
Euro | | | 3,341 | | | | 3,366 | |
US Dollar | | | 3,543 | | | | 2,966 | |
Other | | | 1 | | | | 17 | |
| |
| | | 6,885 | | | | 6,349 | |
| |
These borrowings are used to finance the group’s operations and have been predominantly swapped into Sterling using cross currency swaps. The currency profile of these borrowings after the impact of hedging is disclosed in note 23.
The group also enters into forward currency contracts to hedge foreign currency investments, interest expense, capital purchases and purchase and sale commitments on a selective basis. The commitments hedged are principally denominated in US Dollar, Euro and Asia Pacific region currencies. As a result, the group’s exposure to foreign currency arises mainly on its non UK subsidiary investments and on residual currency trading flows.
Sensitivities
After hedging, with all other factors remaining constant and based on the composition of assets and liabilities at the balance sheet date, the group’s exposure to foreign exchange volatility in the income statement from a 10% strengthening/weakening in Sterling against other currencies would result in a credit/charge respectively of approximately £14m (2011: approximately £5m).
The group’s main exposure to foreign exchange volatility within shareholders’ equity (excluding translation exposures) arises from fair value movements on derivatives held in the cash flow reserve. The majority of foreign exchange fluctuations in the cash flow reserve are recycled immediately to the income statement to match the hedged item and therefore the group’s exposure to foreign exchange fluctuations in equity were insignificant in both 2012 and 2011.
Outstanding cross currency swaps at 31 March 2012 are detailed in the Hedging activities and Other derivatives sections below.
Credit risk management
Treasury management policy
The group’s exposure to credit risk arises from financial assets transacted by the treasury operation (primarily derivatives, investments, cash and cash equivalents) and from its trading related receivables. For treasury related balances, the BT Group plc Board’s defined policy, restricts exposure to any one counterparty by setting credit limits based on the credit quality as defined by Moody’s and S&P and by defining the types of financial instruments which may be transacted. The minimum credit ratings permitted with counterparties are A3/A– for long-term and P1/A1 for short-term investments.
The treasury operation continuously reviews the limits applied to counterparties and will adjust the limit according to the nature and credit standing of the counterparty up to the maximum allowable limit set by the BT Group plc Board. Where multiple transactions are undertaken with a single counterparty, or group of related counterparties, the group may enter into netting arrangements to reduce the group’s exposure to credit risk by making use of standard International Swaps and Derivative Association (ISDA) documentation. The group also seeks collateral or other security where it is considered necessary. The treasury operation regularly reviews the credit limits applied when investing with counterparties in response to market conditions and continues to monitor their credit quality and actively manage any exposures which arise.
| | |
| Notes to the consolidated financial statements | | British Telecommunications plc Annual Report & Form 20-F 2012 79 |
| 25. | Financial instruments and risk managementcontinued |
Exposures
The maximum credit risk exposure of the group’s financial assets at the balance sheet date are as follows:
| | | | | | | | | | | | |
| At 31 March | | Notes | | | 2012 £m | | | 2011 £m | |
| |
Derivative financial assets | | | | | | | 1,023 | | | | 733 | |
Investments | | | 21 | | | | 20,681 | | | | 19,339 | |
Trade and other receivablesa | | | 16 | | | | 2,480 | | | | 2,590 | |
Cash and cash equivalents | | | 22 | | | | 326 | | | | 354 | |
| |
Total | | | | | | | 24,510 | | | | 23,016 | |
| |
| a | The carrying amount excludes £169m (2011: £286m) of non-current trade and other receivables which relate to non-financial assets, and £830m (2011: £774m) of prepayments and other receivables. |
The credit quality and credit concentration of cash equivalents, current asset investments (excluding amounts owed by parent and ultimate parent companies) and derivative financial assets are detailed in the tables below. Where the opinion of the Moody’s and S&P differ, the lower rating is used.
| | | | | | | | | | | | | | | | | | | | | | | | | | | | |
| | | Moody’s/S&P credit rating of counterparty | |
| | | | |
| At 31 March 2012 | | Aaa/AAA £m | | | Aa2/AA £m | | | Aa3/AA– £m | | | A1/A+ £m | | | A2/Ab
£m | | | Baa1/BBBb £m | | | Total £m | |
| |
Cash equivalents | | | – | | | | – | | | | – | | | | 23 | | | | 52 | | | | – | | | | 75 | |
Current asset investmentsa | | | 505 | | | | – | | | | – | | | | – | | | | 8 | | | | – | | | | 513 | |
Derivative financial assets | | | – | | | | – | | | | 121 | | | | 96 | | | | 462 | | | | 344 | | | | 1,023 | |
| |
| | | 505 | | | | – | | | | 121 | | | | 119 | | | | 522 | | | | 344 | | | | 1,611 | |
| |
| |
| | | Moody’s/S&P credit rating of counterparty | |
| | | | |
| At 31 March 2011 | | Aaa/AAA £m | | | Aa2/AA £m | | | Aa3/AA–
£m | | | A1/A+
£m | | | A2/Ab
£m | | | Baa1/BBBb £m | | | Total
£m | |
| |
Cash equivalents | | | – | | | | 18 | | | | 159 | | | | 32 | | | | 1 | | | | – | | | | 210 | |
Current asset investmentsa | | | – | | | | – | | | | – | | | | 7 | | | | 12 | | | | – | | | | 19 | |
Derivative financial assets | | | – | | | | 52 | | | | 115 | | | | 378 | | | | 188 | | | | – | | | | 733 | |
| |
| | | – | | | | 70 | | | | 274 | | | | 417 | | | | 201 | | | | – | | | | 962 | |
| |
| a | Current asset investments excluding amounts owed by parent and ultimate parent companies. |
| b | The group holds cash collateral of £350m (2011: £104m) in respect of derivative financial assets with certain counterparties. |
The concentration of credit risk for trading balances of the group is provided in note 16, which analyses outstanding balances by line of business and reflects the nature of customers in each line of business.
The derivative financial assets were held with nine counterparties at 31 March 2012 (2011: 14 counterparties). After applying the legal right of set-off under the group’s ISDA documentation, the group had a net exposure to derivative counterparties of £705m (2011: £549m) of which 98% (2011: 94%) was with six counterparties (2011: six).
The group has credit support agreements with certain swap counterparties whereby on a weekly basis the fair value position on nominal £945m of a long dated cross-currency swaps and interest rate swaps is collateralised. As at 31 March 2012, the group had paid cash collateral of £22m (2011: £14m) in respect of fair value losses and had received cash collateral of £350m (2011: £104m) in respect of fair value gains. The collateral paid and received is recognised within cash and cash equivalents, and loans and other borrowings, respectively.
The majority of the group’s derivatives are in designated cash flow hedges. With all other factors remaining constant and based on the composition of net derivative financial assets at 31 March 2012, a 1% change in interest rates across each of the ratings categories within which these derivative financial assets are classified would change their carrying values and impact equity, before tax, as follows:
| | | | | | | | |
| | | Change in interest rates | |
| | | | |
| At 31 March 2012 | | +1% £m
(Reduce)
Increase | | | –1% £m
(Reduce)
Increase | |
| |
Moody’s/S&P credit rating | | | | | | | | |
Aa3/AA | | | (21 | ) | | | 11 | |
A1/A+ | | | (56 | ) | | | 62 | |
A2/A | | | (169 | ) | | | 156 | |
Baa1/BBB | | | (131 | ) | | | 156 | |
| |
| | | (377 | ) | | | 385 | |
| |
The group also has credit exposure arising on amounts owed by its parent and ultimate parent companies, with the majority of this balance being owed by the parent company. The related party disclosures detailed in note 28 provide details of how this loan has arisen. The loan owed by the parent company is primarily supported by the parent company’s investment in British Telecommunications plc.
| | |
| 80 British Telecommunications plc Annual Report & Form 20-F 2012 | | Notes to the consolidated financial statements |
| 25. | Financial instruments and risk managementcontinued |
Operational management policy
The BT Group plc’s credit policy for trading related financial assets is applied and managed by each of the lines of business to ensure compliance. The policy requires that the creditworthiness and financial strength of customers is assessed at inception and on an ongoing basis. Payment terms are set in accordance with industry standards. The group will also enhance credit protection, when appropriate, taking into consideration the group’s exposure to the customer, by applying processes which include netting and offsetting, and requesting securities such as deposits, guarantees and letters of credit. The group takes proactive steps including constantly reviewing credit ratings of relationship banks to minimise the impact of adverse market conditions on trading related financial assets.
Capital risk management
The objective of BT Group plc’s capital management policy is to reduce debt over time whilst investing in the business, supporting the pension scheme and paying progressive dividends. In order to meet this objective, BT Group plc may issue or repay debt, issue new shares, repurchase shares, or adjust the amount of dividends paid to shareholders. BT Group plc manages the capital structure and makes adjustments to it in the light of changes in economic conditions and the risk characteristics of the group. The BT Group plc Board regularly reviews the capital structure. No changes were made to the BT Group plc’s objectives and processes during 2012 and 2011.
The BT Group plc group’s capital structure consists of net debt and shareholders’ equity. The following analysis summarises the components which are managed as capital by BT Group plc:
| | | | | | | | |
| At 31 March | | 2012 £m | | | 2011 £m | |
| |
BT Group plc consolidated net debt | | | 9,082 | | | | 8,816 | |
Ultimate parent shareholders’ equity | | | 1,297 | | | | 1,925 | |
| |
| | | 10,379 | | | | 10,741 | |
| |
Liquidity risk management
Management policy
The group ensures its liquidity is maintained by entering into short, medium and long-term financial instruments to support operational and other funding requirements. The group determines its liquidity requirements by the use of both short and long-term cash forecasts. These forecasts are supplemented by a financial headroom analysis which is used to assess funding adequacy for at least a 12-month period. On at least an annual basis the BT Group plc Board reviews and approves the maximum long-term funding of the group and on an ongoing basis considers any related matters. Short and medium-term requirements are regularly reviewed and managed by the treasury operation within the parameters of the policies set by the BT Group plc Board.
Refinancing risk is managed by limiting the amount of borrowing that matures within any specified period and having appropriate strategies in place to manage refinancing needs as they arise. The maturity profile of the group’s term debt at 31 March 2012 is disclosed in note 23. The group has term debt maturities of £1.7bn in 2013.
During 2012 and 2011 the group issued commercial paper and held cash, cash equivalents and current investments in order to manage short-term liquidity requirements. At 31 March 2012 the group has undrawn committed borrowing facilities of £1.5bn (2011: £1.5bn) maturing in March 2016.
| | |
| Notes to the consolidated financial statements | | British Telecommunications plc Annual Report & Form 20-F 2012 81 |
| 25. | Financial instruments and risk managementcontinued |
Maturity analysis
The group’s remaining contractually agreed cash flows, including interest, associated with non-derivative and derivative financial liabilities on an undiscounted basis, which therefore differs from both the carrying value and fair value, is as follows:
Non-derivative financial liabilities
| | | | | | | | | | | | | | | | | | | | |
| At 31 March 2012a | | Loans and other borrowings £m | | | Interest on loans and other borrowings £m | | | Trade and other payables £m | | | Provisions £m | | | Total £m | |
| |
Due within one year | | | 2,632 | | | | 630 | | | | 4,233 | | | | 48 | | | | 7,543 | |
Between one and two years | | | 10 | | | | 533 | | | | – | | | | 39 | | | | 582 | |
Between two and three years | | | 1,132 | | | | 534 | | | | – | | | | 24 | | | | 1,690 | |
Between three and four years | | | 845 | | | | 471 | | | | – | | | | 16 | | | | 1,332 | |
Between four and five years | | | 695 | | | | 416 | | | | – | | | | 11 | | | | 1,122 | |
After five years | | | 4,839 | | | | 3,875 | | | | – | | | | 259 | | | | 8,973 | |
| |
| | | 10,153 | | | | 6,459 | | | | 4,233 | | | | 397 | | | | 21,242 | |
| |
Effect of interest | | | 255 | | | | – | | | | – | | | | – | | | | 255 | |
Fair value adjustment for hedged risk | | | 78 | | | | – | | | | – | | | | – | | | | 78 | |
| |
Total | | | 10,486 | | | | 6,459 | | | | 4,233 | | | | 397 | | | | 21,575 | |
| |
| | | | | |
| At 31 March 2011a | | Loans and other borrowings £m | | | Interest on loans and other borrowings £m | | | Trade and other payables £m | | | Provisions £m | | | Total £m | |
| |
Due within one year | | | 226 | | | | 639 | | | | 4,359 | | | | 57 | | | | 5,291 | |
Between one and two years | | | 1,747 | | | | 639 | | | | – | | | | 38 | | | | 2,424 | |
Between two and three years | | | 10 | | | | 548 | | | | – | | | | 38 | | | | 596 | |
Between three and four years | | | 1,209 | | | | 548 | | | | – | | | | 18 | | | | 1,775 | |
Between four and five years | | | 901 | | | | 482 | | | | – | | | | 16 | | | | 1,399 | |
After five years | | | 5,534 | | | | 4,358 | | | | – | | | | 223 | | | | 10,115 | |
| |
| | | 9,627 | | | | 7,214 | | | | 4,359 | | | | 390 | | | | 21,600 | |
| |
Effect of interest | | | 264 | | | | – | | | | – | | | | – | | | | 264 | |
Fair value adjustment for hedged risk | | | (3 | ) | | | – | | | | – | | | | – | | | | (3 | ) |
| |
Total | | | 9,888 | | | | 7,214 | | | | 4,359 | | | | 390 | | | | 21,861 | |
| |
| | | | | | | | | | | | | | | | | | | | | | | | | | | | | | | | | | |
| Derivative financial liabilities | |
| | | Analysed by earliest payment dateb | | | | | | Analysed based on holding instrument to maturity | |
| | | | | | | | | | |
At 31 March 2012a | |
| Derivatives –
net settled £m |
| |
| Derivatives –
gross settled
outflows £m |
| |
| Derivatives –
gross settled
inflows £m |
| |
| Total
£m |
| | | |
| Derivatives –
net settled £m |
| |
| Derivatives –
gross settled
outflows £m |
| |
| Derivatives –
gross settled
inflows £m |
| |
| Total
£m |
|
| | | | | | | |
Due within one year | | | 228 | | | | 1,568 | | | | (1,530 | ) | | | 266 | | | | | | 57 | | | | 1,568 | | | | (1,530 | ) | | | 95 | |
Between one and two years | | | 238 | | | | 579 | | | | (546 | ) | | | 271 | | | | | | 57 | | | | 90 | | | | (83 | ) | | | 64 | |
Between two and three years | | | 473 | | | | 1,189 | | | | (1,192 | ) | | | 470 | | | | | | 44 | | | | 1,205 | | | | (1,209 | ) | | | 40 | |
Between three and four years | | | 253 | | | | 105 | | | | (101 | ) | | | 257 | | | | | | 72 | | | | 20 | | | | (20 | ) | | | 72 | |
Between four and five years | | | – | | | �� | – | | | | – | | | | – | | | | | | 72 | | | | 20 | | | | (20 | ) | | | 72 | |
After five years | | | – | | | | – | | | | – | | | | – | | | | | | 890 | | | | 538 | | | | (507 | ) | | | 921 | |
| | | | | | | |
Total | | | 1,192 | | | | 3,441 | | | | (3,369 | ) | | | 1,264 | | | | | | 1,192 | | | | 3,441 | | | | (3,369 | ) | | | 1,264 | |
| | | | | | | |
| | | |
| | | Analysed by earliest payment dateb | | | | | | Analysed based on holding instrument to maturity | |
| | | | | | | | | | |
At 31 March 2011a | |
| Derivatives –
net
settled £m |
| |
| Derivatives –
gross settled
outflows
£m |
| |
| Derivatives –
gross settled inflows £m |
| |
| Total
£m |
| | | |
| Derivatives –
net
settled £m |
| |
| Derivatives –
gross settled
outflows
£m |
| |
| Derivatives –
gross settled
inflows
£m |
| |
| Total
£m |
|
| | | | | | | |
Due within one year | | | 132 | | | | 919 | | | | (882 | ) | | | 169 | | | | | | 62 | | | | 397 | | | | (388 | ) | | | 71 | |
Between one and two years | | | 553 | | | | 411 | | | | (397 | ) | | | 567 | | | | | | 62 | | | | 427 | | | | (413 | ) | | | 76 | |
Between two and three years | | | 234 | | | | 4 | | | | (4 | ) | | | 234 | | | | | | 62 | | | | 20 | | | | (20 | ) | | | 62 | |
Between three and four years | | | 276 | | | | 4 | | | | (4 | ) | | | 276 | | | | | | 62 | | | | 20 | | | | (20 | ) | | | 62 | |
Between four and five years | | | 63 | | | | 103 | | | | (101 | ) | | | 65 | | | | | | 62 | | | | 20 | | | | (20 | ) | | | 62 | |
After five years | | | (120 | ) | | | – | | | | – | | | | (120) | | | | | | 828 | | | | 557 | | | | (527 | ) | | | 858 | |
| | | | | | | |
Total | | | 1,138 | | | | 1,441 | | | | (1,388 | ) | | | 1,191 | | | | | | 1,138 | | | | 1,441 | | | | (1,388 | ) | | | 1,191 | |
| | | | | | | |
| a | Foreign currency related cash flows were translated at closing rates as at the relevant reporting date. Future variable interest rate cash flows were calculated using the most recent rate applied at the relevant balance sheet date. |
| b | Certain derivative financial instruments contain break clauses, whereby either the group or bank counterparty can terminate the swap on certain dates and the mark to market position is settled in cash. |
| | |
| 82 British Telecommunications plc Annual Report & Form 20-F 2012 | | Notes to the consolidated financial statements |
| 25. | Financial instruments and risk managementcontinued |
Price risk
The group has limited exposure to price risk.
Fair value of financial instruments
The table below shows the accounting classification and the carrying amounts and fair values of all of the group’s financial assets and liabilities at 31 March 2012 and 2011. None of the financial instruments have been reclassified during the year.
Financial assets
| | | | | | | | | | | | | | | | | | | | | | | | | | | | | | | | | | | | |
At 31 March 2012 | | | Notes | | |
| Loans and
receivables
£m |
| |
| Fair value
through profit
and loss
£m |
| |
| Designated
in a cash flow hedge £m |
| |
| Designated
in a fair value hedge £m |
| |
| Available-
for-sale
£m |
| |
| Amounts
owed by parent
and ultimate parent company
£m |
| |
| Total
carrying
value
£m |
| |
| Fair value
£m |
|
| |
Non-derivative financial assets | | | | | | | | | | | | | | | | | | | | | | | | | | | | | | | | | | | | |
Investments | | | 21 | | | | 8 | | | | 10 | | | | – | | | | – | | | | 586 | | | | 20,077 | | | | 20,681 | | | | 20,681 | |
Cash and cash equivalents | | | 22 | | | | 326 | | | | – | | | | – | | | | – | | | | – | | | | – | | | | 326 | | | | 326 | |
Trade and other receivablesa | | | 16 | | | | 2,480 | | | | – | | | | – | | | | – | | | | – | | | | – | | | | 2,480 | | | | 2,480 | |
| |
Total non-derivative financial assets | | | | | | | 2,814 | | | | 10 | | | | – | | | | – | | | | 586 | | | | 20,077 | | | | 23,487 | | | | 23,487 | |
| |
Derivative financial assetsb | | | | | | | | | | | | | | | | | | | | | | | | | | | | | | | | | | | | |
Cross currency swaps | | | | | | | – | | | | – | | | | 769 | | | | – | | | | – | | | | – | | | | 769 | | | | 769 | |
Interest rate swaps | | | | | | | – | | | | 171 | | | | – | | | | 82 | | | | – | | | | – | | | | 253 | | | | 253 | |
Forward foreign exchange contracts | | | | | | | – | | | | 1 | | | | – | | | | – | | | | – | | | | – | | | | 1 | | | | 1 | |
| |
Total derivative financial assets | | | | | | | – | | | | 172 | | | | 769 | | | | 82 | | | | – | | | | – | | | | 1,023 | | | | 1,023 | |
| |
Total financial assets | | | | | | | 2,814 | | | | 182 | | | | 769 | | | | 82 | | | | 586 | | | | 20,077 | | | | 24,510 | | | | 24,510 | |
| |
| | | | | | | | | |
At 31 March 2011 | | | Notes | | |
| Loans and
receivables
£m |
| |
| Fair value
through profit
and loss
£m |
| |
| Designated
in a cash
flow hedge
£m |
| |
| Designated
in a fair
value hedge
£m |
| |
| Available-
for-sale
£m |
| |
| Amounts
owed by parent
and ultimate parent company
£m |
| |
| Total
carrying
value
£m |
| |
| Fair value
£m |
|
| |
Non-derivative financial assets | | | | | | | | | | | | | | | | | | | | | | | | | | | | | | | | | | | | |
Investments | | | 21 | | | | 7 | | | | 11 | | | | – | | | | – | | | | 81 | | | | 19,240 | | | | 19,339 | | | | 19,339 | |
Cash and cash equivalents | | | 22 | | | | 354 | | | | – | | | | – | | | | – | | | | – | | | | – | | | | 354 | | | | 354 | |
Trade and other receivablesa | | | 16 | | | | 2,558 | | | | – | | | | – | | | | – | | | | – | | | | 32 | | | | 2,590 | | | | 2,590 | |
| |
Total non-derivative financial assets | | | | | | | 2,919 | | | | 11 | | | | – | | | | – | | | | 81 | | | | 19,272 | | | | 22,283 | | | | 22,283 | |
| |
Derivative financial assetsb | | | | | | | | | | | | | | | | | | | | | | | | | | | | | | | | | | | | |
Cross currency swaps | | | | | | | – | | | | – | | | | 622 | | | | – | | | | – | | | | – | | | | 622 | | | | 622 | |
Interest rate swaps | | | | | | | – | | | | 99 | | | | – | | | | 4 | | | | – | | | | – | | | | 103 | | | | 103 | |
Forward foreign exchange contracts | | | | | | | – | | | | 5 | | | | 3 | | | | – | | | | – | | | | – | | | | 8 | | | | 8 | |
| |
Total derivative financial assets | | | | | | | – | | | | 104 | | | | 625 | | | | 4 | | | | – | | | | – | | | | 733 | | | | 733 | |
| |
Total financial assets | | | | | | | 2,919 | | | | 115 | | | | 625 | | | | 4 | | | | 81 | | | | 19,272 | | | | 23,016 | | | | 23,016 | |
| |
| a | Excludes prepayments of £671m (2011: £570m), other receivables of £159m (2011: £204m) and other non-current assets of £169m (2011: £286m). |
| b | Current derivative financial assets of £137m (2011: £108m) consists of cross-currency swaps of £100m (2011: £63m), interest rate swaps of £36m (2011: £37m) and forward foreign exchange contracts of £1m (2011: £8m). Non-current derivative financial assets of £886m (2011: £625m) consists of cross-currency swaps of £669m (2011: £559m) and interest rate swaps of £217m (2011: £66m). |
| | |
| Notes to the consolidated financial statements | | British Telecommunications plc Annual Report & Form 20-F 2012 83 |
| 25. | Financial instruments and risk managementcontinued |
Financial liabilities
| | | | | | | | | | | | | | | | | | | | | | | | | | | | | | | | |
At 31 March 2012 | | | Notes | | |
| Fair value
through profit
and loss
£m |
| |
| Designated
in a cash flow hedge £m |
| |
| Designated
in a fair value hedge £m |
| |
| At amortised
cost £m |
| |
| Amounts
owed to parent
and ultimate
parent company
£m |
| |
| Total
carrying value £m |
| |
| Fair value
£m |
|
| |
Non-derivative financial liabilities | | | | | | | | | | | | | | | | | | | | | | | | | | | | | | | | |
– Loans and other borrowings | | | 23 | | | | – | | | | – | | | | – | | | | 1,265 | | | | – | | | | 1,265 | | | | 1,265 | |
– Listed bonds | | | 23 | | | | – | | | | 6,889 | | | | 686 | | | | 1,361 | | | | – | | | | 8,936 | | | | 10,594 | |
– Finance leases | | | 23 | | | | – | | | | – | | | | – | | | | 285 | | | | – | | | | 285 | | | | 328 | |
– Trade and other payablesa | | | 17 | | | | – | | | | – | | | | – | | | | 4,233 | | | | – | | | | 4,233 | | | | 4,233 | |
– Provisionsb | | | 18 | | | | – | | | | – | | | | – | | | | 260 | | | | – | | | | 260 | | | | 260 | |
| |
Total non-derivative financial liabilities | | | | | | | – | | | | 6,889 | | | | 686 | | | | 7,404 | | | | – | | | | 14,979 | | | | 16,680 | |
| |
Derivative financial liabilitiesc | | | | | | | | | | | | | | | | | | | | | | | | | | | | | | | | |
– Cross currency swaps | | | | | | | – | | | | 59 | | | | – | | | | – | | | | – | | | | 59 | | | | 59 | |
– Interest rate swaps | | | | | | | 322 | | | | 451 | | | | – | | | | – | | | | – | | | | 773 | | | | 773 | |
– Forward foreign exchange contracts | | | | | | | 6 | | | | 8 | | | | – | | | | – | | | | – | | | | 14 | | | | 14 | |
| |
Total derivative financial liabilities | | | | | | | 328 | | | | 518 | | | | – | | | | – | | | | – | | | | 846 | | | | 846 | |
| |
Total financial liabilities | | | | | | | 328 | | | | 7,407 | | | | 686 | | | | 7,404 | | | | – | | | | 15,825 | | | | 17,526 | |
| |
| | | | | | | | |
At 31 March 2011 | | | Notes | | |
| Fair value
through profit
and loss
£m |
| |
| Designated
in a cash
flow hedge
£m |
| |
| Designated
in a fair
value hedge
£m |
| |
| At amortised
cost
£m |
| |
| Amounts
owed to parent
and ultimate
parent company
£m |
| |
| Total
carrying
value
£m |
| |
| Fair value
£m |
|
| |
Non-derivative financial liabilities | | | | | | | | | | | | | | | | | | | | | | | | | | | | | | | | |
– Loans and other borrowings | | | 23 | | | | – | | | | – | | | | – | | | | 534 | | | | 32 | | | | 566 | | | | 594 | |
– Listed bonds | | | 23 | | | | – | | | | 7,070 | | | | 605 | | | | 1,353 | | | | – | | | | 9,028 | | | | 10,274 | |
– Finance leases | | | 23 | | | | – | | | | – | | | | – | | | | 294 | | | | – | | | | 294 | | | | 339 | |
– Trade and other payablesa | | | 17 | | | | – | | | | – | | | | – | | | | 4,262 | | | | 97 | | | | 4,359 | | | | 4,359 | |
– Provisionsb | | | 18 | | | | – | | | | – | | | | – | | | | 280 | | | | – | | | | 280 | | | | 280 | |
| |
Total non-derivative financial liabilities | | | | | | | – | | | | 7,070 | | | | 605 | | | | 6,723 | | | | 129 | | | | 14,527 | | | | 15,846 | |
| |
Derivative financial liabilitiesc | | | | | | | | | | | | | | | | | | | | | | | | | | | | | | | | |
– Cross currency swaps | | | | | | | – | | | | 29 | | | | – | | | | – | | | | – | | | | 29 | | | | 29 | |
– Interest rate swaps | | | | | | | 267 | | | | 265 | | | | 2 | | | | – | | | | – | | | | 534 | | | | 534 | |
– Forward foreign exchange contracts | | | | | | | – | | | | 6 | | | | – | | | | – | | | | – | | | | 6 | | | | 6 | |
| |
Total derivative financial liabilities | | | | | | | 267 | | | | 300 | | | | 2 | | | | – | | | | – | | | | 569 | | | | 569 | |
| |
Total financial liabilities | | | | | | | 267 | | | | 7,370 | | | | 607 | | | | 6,723 | | | | 129 | | | | 15,096 | | | | 16,415 | |
| |
| a | Excludes other taxation and social security of £487m (2011: £485m), deferred income £1,295m (2011: £1,344m) and other non-current payables of £875m (2011: £831m). |
| b | Excludes provision of £597m (2011: £676m). |
| c | Current derivative financial liabilities of £89m (2011: £62m) consists of cross-currency swaps of £18m (2011: £nil), interest rate swaps of £57m (2011: £56m) and forward foreign exchange contracts of £14m (2011: £6m). Non-current derivative financial liabilities of £757m (2011: £507m) consists of cross-currency swaps of £41m (2011: £29m) and interest rate swaps of £716m (2011: £478m). |
The carrying amounts are included in the group balance sheet under the indicated headings. The methods and assumptions used to estimate the fair values of financial assets and liabilities are as follows:
| — | | The fair values of listed investments were estimated using quoted market prices for those investments at the balance sheet date. |
| — | | The carrying amount of short-term deposits and investments equates to fair value due to the short maturity of the investments held. |
| — | | The carrying amount of trade receivables and payables approximated to their fair values due to the short maturity of amounts payable and receivable. |
| — | | The fair value of the group’s bonds and other long-term borrowings has been estimated on the basis of quoted market prices for the same or similar issues with the same maturities where they existed, and on calculations of the value of future cash flows using the approximate discount rates in effect at the balance sheet date, where market prices of similar issues did not exist. |
| — | | The fair value of the group’s outstanding swaps and foreign exchange contracts were estimated using discounted cash flow models and market rates of interest and foreign exchange at the balance sheet date. |
| | |
| 84 British Telecommunications plc Annual Report & Form 20-F 2012 | | Notes to the consolidated financial statements |
| 25. | Financial instruments and risk managementcontinued |
The table below shows certain financial assets and financial liabilities that have been measured at fair value, analysed by the level of valuation method. The three levels of valuation methodology used are:
| — | | Level 1 – uses quoted prices in active markets for identical assets or liabilities |
| — | | Level 2 – uses inputs for the asset or liability other than quoted prices, that are observable either directly or indirectly |
| — | | Level 3 – uses inputs for the asset or liability that are not based on observable market data, such as internal models or other valuation methods. |
| | | | | | | | | | | | | | | | |
At 31 March 2012 | |
| Level 1
£m |
| |
| Level 2
£m |
| |
| Level 3
£m |
| |
| Total
£m |
|
| |
Financial assets at fair value | | | | | | | | | | | | | | | | |
Non-current and current derivative financial assets | | | | | | | | | | | | | | | | |
Derivatives designated as accounting hedges | | | – | | | | 851 | | | | – | | | | 851 | |
Other derivatives | | | – | | | | 172 | | | | – | | | | 172 | |
| |
Total non-current and current derivative financial assets | | | – | | | | 1,023 | | | | – | | | | 1,023 | |
| |
Non-current and current investments | | | | | | | | | | | | | | | | |
Available-for-sale financial assets | | | | | | | | | | | | | | | | |
Liquid investments | | | – | | | | 505 | | | | – | | | | 505 | |
Other investments | | | 50 | | | | – | | | | 31 | | | | 81 | |
Fair value through profit and loss | | | 10 | | | | – | | | | – | | | | 10 | |
| |
Total non-current and current investments | | | 60 | | | | 505 | | | | 31 | | | | 596 | |
| |
Total financial assets at fair value | | | 60 | | | | 1,528 | | | | 31 | | | | 1,619 | |
| |
Financial liabilities at fair value | | | | | | | | | | | | | | | | |
Current and non-current derivative financial liabilities | | | | | | | | | | | | | | | | |
Derivatives designated as accounting hedges | | | – | | | | 518 | | | | – | | | | 518 | |
Other derivatives | | | – | | | | 328 | | | | – | | | | 328 | |
| |
Total non-current and current financial liabilities | | | – | | | | 846 | | | | – | | | | 846 | |
| |
Total financial liabilities at fair value | | | – | | | | 846 | | | | – | | | | 846 | |
| |
| | | | |
At 31 March 2011 | |
| Level 1
£m |
| |
| Level 2
£m |
| |
| Level 3
£m |
| |
| Total
£m |
|
| |
Financial assets at fair value | | | | | | | | | | | | | | | | |
Non-current and current derivative financial assets | | | | | | | | | | | | | | | | |
Derivatives designated as accounting hedges | | | – | | | | 630 | | | | – | | | | 630 | |
Other derivatives | | | – | | | | 103 | | | | – | | | | 103 | |
| |
Total non-current and current derivative financial assets | | | – | | | | 733 | | | | – | | | | 733 | |
| |
Non-current and current investments | | | | | | | | | | | | | | | | |
Available-for-sale financial assets | | | | | | | | | | | | | | | | |
Liquid investments | | | – | | | | 1 | | | | – | | | | 1 | |
Other investments | | | 49 | | | | – | | | | 31 | | | | 80 | |
Fair value through profit and loss | | | 11 | | | | – | | | | – | | | | 11 | |
| |
Total non-current and current investments | | | 60 | | | | 1 | | | | 31 | | | | 92 | |
| |
Total financial assets at fair value | | | 60 | | | | 734 | | | | 31 | | | | 825 | |
| |
Financial liabilities at fair value | | | | | | | | | | | | | | | | |
Non-current and current derivative financial liabilities | | | | | | | | | | | | | | | | |
Derivatives designated as accounting hedges | | | – | | | | 302 | | | | – | | | | 302 | |
Other derivatives | | | – | | | | 267 | | | | – | | | | 267 | |
| |
Total non-current and current financial liabilities | | | – | | | | 569 | | | | – | | | | 569 | |
| |
Total financial liabilities at fair value | | | – | | | | 569 | | | | – | | | | 569 | |
| |
Movements in financial instruments measured using Level 3 valuation methods are presented below:
| | | | |
| |
| Other investments
£m |
|
| |
At 1 April 2010 | | | 34 | |
Additions | | | 1 | |
Disposals | | | (4 | ) |
| |
At 1 April 2011 | | | 31 | |
Additions | | | 4 | |
Disposals | | | (4 | ) |
| |
At 31 March 2012 | | | 31 | |
| |
There were no losses recognised in the income statement in respect of Level 3 assets held at 31 March 2012.
| | |
| Notes to the consolidated financial statements | | British Telecommunications plc Annual Report & Form 20-F 2012 85 |
| 25. | Financial instruments and risk managementcontinued |
Hedging activities
Our hedging policies use derivative financial instruments to manage financial risk. Derivatives that are held as hedging instruments are formally designated as hedges as defined in IAS 39. Derivatives may qualify as hedges for accounting purposes if they meet the criteria for designation as fair value hedges or cash flow hedges in accordance with IAS 39.
Fair value hedges
Fair value hedges principally consist of interest rate and cross-currency swaps that are used to protect against changes in the fair value of fixed-rate, long-term financial instruments due to movements in market interest rates. For qualifying fair value hedges, all changes in the fair value of the derivative and changes in the fair value of the hedged item in relation to the risk being hedged are recognised in the income statement. If the hedge relationship no longer meets the criteria for hedge accounting, the fair value adjustment to the hedged item continues to be reported as part of the basis of the item and is amortised to the income statement as a yield adjustment over the remainder of the life of the hedged item.
Gains and losses arising on fair value hedges at 31 March were as follows:
| | | | | | | | |
Gains (losses) | |
| 2012
£m |
| |
| 2011
£m |
|
| |
On hedging instruments | | | 81 | | | | (3 | ) |
On hedged items attributable to hedged risk | | | (81 | ) | | | 3 | |
| |
| | | – | | | | – | |
| |
Cash flow hedges
Exposure arises from the variability in future interest and currency cash flows on assets and liabilities which bear interest at variable rates and/or are in a foreign currency. Interest rate and cross-currency swaps are transacted, and where they qualify, designated as cash flow hedges to manage this exposure. Fair value changes on designated cash flow hedges are initially recognised directly in the cash flow hedge reserve, as gains or losses recognised in equity. Amounts are transferred from equity and recognised in the income statement as the income or expense is recognised on the hedged asset or liability.
Forward foreign currency contracts are used to hedge anticipated and committed future currency cash flows. Where these contracts qualify for hedge accounting they are designated as cash flow hedges. On recognition of the underlying transaction in the financial statements, the associated hedge gains and losses, deferred in equity, are transferred and included with the recognition of the underlying transaction.
The gains and losses on ineffective portions of such derivatives are recognised immediately in the income statement. See note 26 for details of movements in the cash flow hedge reserve.
When a hedging instrument expires or is sold, or when a hedge no longer meets the criteria for hedge accounting, any cumulative gain or loss existing in equity at that time remains in equity and is recognised when the forecast transaction is ultimately recognised in the income statement or on the balance sheet. When a forecast transaction is no longer expected to occur, the cumulative gain or loss that was reported in equity is immediately transferred to the income statement.
The group had outstanding hedging arrangements as at 31 March 2012 as follows:
| | | | | | | | | | | | | | | | | | | | | | | | |
Hedged item | | Hedging instruments | | Hedge type | | | Notional principal | | | | | | | | | | | Remaining term of hedging instruments | | Weighted average interest rate on hedging instruments | |
| Period over
which forecast transaction arises |
|
| | | | | | Derivative fair value | | | | |
| | | | | | | |
| | | | | | Asset | | | | Liability | | | | |
| | | | | | | £m | | | | £m | | | | £m | | | | | | | | | |
| |
| Euro and US Dollar denominated borrowingsa | | Interest rate swaps | | Cash flow | | | 1,014 | | | | – | | | | 451 | | | 19 years | | Sterling receivable at 1.4% Sterling payable at 6.0% | | | | |
| | Cross currrency swaps | | Cash flow | | | 5,451 | | | | 769 | | | | 59 | | | 1 to 19 years | | Euro receivable at 5.8% US dollar receivable at 7.3% Sterling payable at 6.2% | | | | |
| | | | | | | | |
| Sterling denominated borrowingsa | | Interest rate swaps | | Fair value | | | 500 | | | | 82 | | | | – | | | 17 years | | Sterling receivable at 5.8% Sterling payable at 2.9% | | | | |
| | | | | | | | |
| Euro and US Dollar step up interest on currency denominated borrowingsa | | Forward currency contracts | | Cash flow | | | 189 | | | | – | | | | 5 | | | 3 months | | | | | 19 years | |
| | | | | | | | |
| Currency exposures on overseas purchases principally US Dollar and Asia Pacific currencies | | Forward currency contracts | | Cash flow | | | 93 | | | | – | | | | 1 | | | 1 month rolling basis | | | | | 12 months | |
| | | | | | | | |
| Purchase of US Dollar denominated retail devices | | Forward currency contracts | | Cash flow | | | 176 | | | | – | | | | 2 | | | 1 to 6 months | | | | | | |
| |
Total | | | | | | | | | | | 851 | | | | 518 | | | | | | | | | |
| |
| | |
| 86 British Telecommunications plc Annual Report & Form 20-F 2012 | | Notes to the consolidated financial statements |
| 25. | Financial instruments and risk managementcontinued |
The group had outstanding hedging arrangements as at 31 March 2011 as follows:
| | | | | | | | | | | | | | | | | | | | |
Hedged item | | Hedging instruments | | Hedge type | | Notional principal £m | | Derivative fair value | |
| Remaining term of
hedging
instruments |
| | Weighted average interest rate on hedging instruments | |
| Period over
which forecast
transaction arises |
|
| | | | | | | |
| | | | | Asset | | Liability | | | |
| | | | | £m | | £m | | | |
| |
| Euro and US Dollar denominated borrowingsa | | Interest rate swaps | | Cash flow | | 1,014 | | – | | 265 | | | 20 years | | | Sterling receivable at 1.0% Sterling payable at 6.0% | | | | |
| | Cross currency swaps | | Cash flow | | 5,451 | | 622 | | 29 | | | 2 to 20 years | | | Euro receivable at 5.8% US Dollar receivable at 7.3% Sterling payable at 6.2% | | | | |
| | | | | | | | |
| Sterling denominated borrowingsa | | Interest rate swaps | | Fair value | | 500 | | 4 | | 2 | | | 18 years | | | Sterling receivable at 5.8% Sterling payable at 2.6% | | | | |
| | | | | | | | |
| Euro and US Dollar step up interest on currency denominated borrowingsa | | Forward currency contracts | | Cash flow | | 245 | | 1 | | 4 | | | 3 months | | | | | | 20 years | |
| | | | | | | | |
| Currency exposures on overseas purchases principally US Dollar and Asia Pacific currencies | | Forward currency contracts | | Cash flow | | 3 | | – | | – | |
| 1 month
rolling basis |
| | | | | 12 months | |
| Purchase of US Dollar denominated retail devices | | Forward currency contracts | | Cash flow | | 213 | | 2 | | 2 | | | 1 to 6 months | | | | | | | |
| |
| Total | | | | | | | | 629 | | 302 | | | | | | | | | | |
| |
Other derivatives
Our policy is not to use derivatives for trading purposes. However, due to the complex nature of hedge accounting under IAS 39 some derivatives may not qualify for hedge accounting, or are specifically not designated as a hedge where natural offset is more appropriate. Changes in the fair value of any derivative instruments that do not qualify for hedge accounting are recognised immediately in the income statement.
At 31 March 2012 the group held certain foreign currency forward and interest rate swap contracts which were not in hedging relationships in accordance with IAS 39. Foreign currency forward contracts were economically hedging operational purchases and sales. The interest rate swap contracts became ineffective on first time adoption of IFRS. The volatility arising from these swaps is recognised through the income statement but is limited due to a natural offset in their fair value movements.
The table below summarises these derivatives at 31 March 2012 and 2011.
| | | | | | | | | | | | | | | | | | |
At 31 March 2012 | |
| Notional
principal £m |
| |
| Derivative fair
value |
| |
| Remaining
term of derivatives |
| | Weighted average % |
| | | | |
| | | | Asset | | | | Liability | | | |
| | | | £m | | | | £m | | | |
|
Foreign currency forward contracts | | | 939 | | | | 1 | | | | 6 | | | | 7 months | | | |
Interest rate swaps | | | 1,887 | | | | 171 | | | | 322 | | | | 2 to 19 years | | | Sterling receivable at 4.5% Sterling payable at 6.1% |
|
Total | | | | | | | 172 | | | | 328 | | | | | | | |
|
| | | | | |
| | | Notional principal | | | | | | | | | | |
| Remaining
term of derivatives |
| | Weighted average |
| | | | Derivative fair value | | | |
| | | | | | | |
| | | | | | | Asset | | | | Liability | | | | | | | |
At 31 March 2011 | | | £m | | | | £m | | | | £m | | | | | | | % |
|
Foreign currency forward contracts | | | 534 | | | | 5 | | | | – | | | | 2 months | | | |
Interest rate swaps | | | 1,887 | | | | 99 | | | | 267 | | | | 3 to 20 years | | | Sterling receivable at 4.3% Sterling payable at 5.9% |
|
Total | | | | | | | 104 | | | | 267 | | | | | | | |
|
| | |
| Notes to the consolidated financial statements | | British Telecommunications plc Annual Report & Form 20-F 2012 87 |
| | | | | | | | | | | | | | | | | | | | |
| | | Other comprehensive income | | | | | | | | | |
| | | Cash flow | | | | Available-for- | | | | Translation | | | | Merger and | | | | Total other | |
| | | reservea | | | | sale reserveb | | | | reservec | | | | other reservesd | | | | reserves | |
| | | £m | | | | £m | | | | £m | | | | £m | | | | £m | |
| |
At 1 April 2009 | | | 563 | | | | (8 | ) | | | 661 | | | | 858 | | | | 2,074 | |
Exchange differences | | | – | | | | – | | | | (112 | ) | | | – | | | | (112 | ) |
Net fair value loss on cash flow hedges | | | (1,067 | ) | | | – | | | | – | | | | – | | | | (1,067 | ) |
Recognised in income and expense | | | 496 | | | | – | | | | – | | | | – | | | | 496 | |
Reclassified and reported in non-current assets | | | (4 | ) | | | – | | | | – | | | | – | | | | (4 | ) |
Fair value movements on available-for-sale assets | | | – | | | | 11 | | | | – | | | | – | | | | 11 | |
Tax recognised in other comprehensive income | | | 159 | | | | – | | | | (45 | ) | | | – | | | | 114 | |
| |
At 1 April 2010 | | | 147 | | | | 3 | | | | 504 | | | | 858 | | | | 1,512 | |
Exchange differences | | | – | | | | – | | | | (142 | ) | | | – | | | | (142 | ) |
Net fair value loss on cash flow hedges | | | (347 | ) | | | – | | | | – | | | | – | | | | (347 | ) |
Recognised in income and expense | | | 333 | | | | 1 | | | | – | | | | – | | | | 334 | |
Fair value movements on available-for-sale assets | | | – | | | | 20 | | | | – | | | | – | | | | 20 | |
Tax recognised in other comprehensive income | | | (5 | ) | | | – | | | | 42 | | | | – | | | | 37 | |
| |
At 1 April 2011 | | | 128 | | | | 24 | | | | 404 | | | | 858 | | | | 1,414 | |
Exchange differences | | | – | | | | – | | | | (39 | ) | | | – | | | | (39 | ) |
Recycled foreign exchange on disposal of subsidiary | | | – | | | | – | | | | 2 | | | | – | | | | 2 | |
Net fair value loss on cash flow hedges | | | (56 | ) | | | – | | | | – | | | | – | | | | (56 | ) |
Recognised in income and expense | | | 179 | | | | – | | | | – | | | | – | | | | 179 | |
Tax recognised in other comprehensive income | | | (22 | ) | | | – | | | | (1 | ) | | | – | | | | (23 | ) |
| |
At 31 March 2012 | | | 229 | | | | 24 | | | | 366 | | | | 858 | | | | 1,477 | |
| |
| a | The cash flow reserve is used to record the effective portion of the cumulative net change in the fair value of cash flow hedging instruments related to hedged transactions that have not yet occurred. |
| b | The available-for-sale reserve is used to record the cumulative fair value gains and losses on available-for-sale financial assets. The cumulative gains and losses are recycled to the income statement on disposal of the assets. |
| c | The translation reserve is used to record cumulative translation differences on the assets and liabilities of foreign operations. The cumulative translation differences are recycled to the income statement on disposal of the foreign operation. |
| d | The merger reserve arose on the group reorganisation that occurred in November 2001 and represented the difference between the nominal value of shares in the new ultimate parent company, BT Group plc, and the aggregate of the share capital, share premium account and capital redemption reserve of the prior ultimate parent company, British Telecommunications plc. |
| 27. | Directors’ emoluments and pensions |
For the year to 31 March 2012 the aggregate emoluments of the directors excluding deferred bonuses of £631,500 (2011: £1,919,000) was £2,092,000 (2011: £3,876,000). Deferred bonuses are payable in 5p ordinary shares of BT Group plc in three years’ time subject to continuous employment.
Retirement benefits were accruing to one director (2011: one) under a defined benefits pension scheme and one (2011: one) director under a money purchase scheme.
During the year no director exercised options (2011: none) under BT Group share option plans. Three directors who held office for the whole or part of the year (2011: three) received or are entitled to receive 5p ordinary shares of BT Group plc under BT long-term incentive plans. The aggregate value of BT Group plc shares which vested in directors during the year under BT long-term incentive plans was £136,742 (2011: £271,000).
The emoluments of the highest paid director excluding his deferred bonus of £453,614 (2011: £1,415,000) were £1,329,000 (2011: £2,359,000). He is entitled to receive 2,955,336 BT Group plc 5p ordinary shares under BT long-term incentive plans subject to continuous employment and in some cases to certain performance conditions being met. There are retirement benefits accruing to the highest paid director under a defined benefit scheme.
Included in the above aggregate emoluments are those of Tony Chanmugam who is also a director of the ultimate holding company, BT Group plc. The directors do not believe it is practicable for the purposes of this report to apportion the amounts of total emoluments received by him between his services as director of the company and his services as director of BT Group plc.
| | |
| 88 British Telecommunications plc Annual Report & Form 20-F 2012 | | Notes to the consolidated financial statements |
| 28. | Related party transactions |
Key management personnel are deemed to be the Chairman, non-executive directors and members of the Operating Committee of BT Group plc. Of the eight (2011: seven, 2010: seven) members of the BT Group plc Operating Committee, three (2011: three, 2010: three) were members of the Board of the ultimate parent company. It is the BT Group plc Operating Committee which has responsibility for planning, directing and controlling the activities of the group. Key management personnel compensation is shown in the table below:
| | | | | | | | | | | | |
| | | 2012
£m | | | 2011
£m | | | 2010
£m | |
| |
Salaries and short-term benefits | | | 11.6 | | | | 11.4 | | | | 10.3 | |
Termination benefits | | | – | | | | – | | | | 0.1 | |
Post employment benefits | | | 1.0 | | | | 1.4 | | | | 1.8 | |
Share-based payments | | | 7.8 | | | | 5.3 | | | | 2.6 | |
| |
| | | 20.4 | | | | 18.1 | | | | 14.8 | |
| |
During 2012 the group purchased services in the normal course of business and on an arm’s length basis from its principal associate, Tech Mahindra Limited. The net value of services purchased was £253m (2011: £258m, 2010: £301m) and the amount outstanding and payable for services at 31 March 2012 was £51m (2011: £61m, 2010: £65m). In 2010 a cash payment of £127m was made to Tech Mahindra Limited for the renegotiation of certain supply contracts as part of the rationalisation of procurement channels within BT Global Services.
Amounts paid to the group’s retirement benefit plans are set out in note 19. There were a number of transactions during the year between the company and its subsidiary undertakings, which are eliminated on consolidation and therefore not disclosed.
British Telecommunications plc acts as a funder and deposit taker for cash related transactions for both its parent and ultimate parent company. The loan arrangements described below with these companies reflect this. Cash transactions usually arise where the parent and ultimate parent company are required to meet their external payment obligations or receive amounts from third parties. These principally relate to the payment of dividends, the buyback of shares and the exercise of share options. Transactions between the ultimate parent company, parent company and the group are settled on both a cash and non-cash basis through these loan accounts depending on the nature of the transaction.
In the 2002 financial year, the group demerged its former mobile phone business and as a result BT Group plc became the listed ultimate parent company of the remaining group. The demerger steps resulted in the formation of an intermediary holding company, BT Group Investments Limited, between BT Group plc and British Telecommunications plc. This intermediary company held an investment of £18.5bn in British Telecommunications plc which was funded by an intercompany loan facility with British Telecommunications plc.
A summary of the balances with the parent and ultimate parent companies and the finance income or expense arising in respect of these balances is set out below:
| | | | | | | | | | | | | | | | | | | | |
| | | | | | | | | 2012 | | | | | | 2011 | |
| | | | | | | | | | | | |
| | | Notes | | | Asset (liability) at 31 March £m | | | Finance income (expense) £m | | | Asset (liability) at 31 March £m | | | Finance income (expense) £m | |
| |
Amounts owed by (to) parent company | | | | | | | | | | | | | | | | | | | | |
Loan facility – non-current assets investments | | | 21/24 | | | | 18,140 | | | | 258 | | | | 17,339 | | | | 248 | |
Loan facility – current asset investments | | | 21 | | | | 630 | | | | n/a | | | | 1,206 | | | | n/a | |
Trade and other receivables | | | 16 | | | | – | | | | n/a | | | | 32 | | | | n/a | |
Loans and other borrowings | | | 23 | | | | – | | | | – | | | | (32 | ) | | | – | |
Trade and other payables | | | 17 | | | | (68 | ) | | | n/a | | | | (90 | ) | | | n/a | |
| |
Amounts owed by (to) ultimate parent company | | | | | | | | | | | | | | | | | | | | |
Non-current assets investments | | | 21/24 | | | | 1,286 | | | | 32 | | | | 682 | | | | – | |
Trade and other receivables | | | 16 | | | | 3 | | | | n/a | | | | – | | | | n/a | |
Current asset investments | | | 21 | | | | 21 | | | | n/a | | | | 13 | | | | n/a | |
Trade and other payables | | | 17 | | | | (9 | ) | | | n/a | | | | (7 | ) | | | n/a | |
| |
The loan facility with the parent company accrued interest at a rate of LIBOR plus 50 basis points, is subject to an overall maximum of £25bn, and is either repayable on demand or from February 2015. In 2012 the overall loan investment balances were maintained at the same level as prior year with the mix increasing the level of short-term loans. The parent company currently finances its obligations on the loan as they fall due through dividends paid by the company.
The company holds ordinary shares in the ultimate parent company, disclosed in note 21. These shares are held in trust for the BT Group Incentive Share Plan, the Retention Share Plan and the Deferred Bonus Plan.
| | |
| Notes to the consolidated financial statements | | British Telecommunications plc Annual Report & Form 20-F 2012 89 |
| 29. | Financial commitments and contingent liabilities |
Capital expenditure contracted for at the balance sheet date but not yet incurred was as follows:
| | | | | | | | |
| | | 2012 £m | | | 2011 £m | |
| |
Property, plant and equipment | | | 431 | | | | 467 | |
Computer software | | | 2 | | | | – | |
| |
Total | | | 433 | | | | 467 | |
| |
| | |
| Future minimum operating lease payments for the group were as follows: | | | | | | | | |
| | |
| | | 2012 £m | | | 2011 £m | |
| |
Payable in the year ending 31 March: | | | | | | | | |
2012 | | | – | | | | 464 | |
2013 | | | 429 | | | | 440 | |
2014 | | | 403 | | | | 413 | |
2015 | | | 378 | | | | 383 | |
2016 | | | 366 | | | | 373 | |
2017 | | | 357 | | | | 359 | |
Thereafter | | | 5,660 | | | | 4,760 | |
| |
Total future minimum operating lease payments | | | 7,593 | | | | 7,192 | |
| |
Operating lease commitments were mainly in respect of land and buildings which arose from a sale and operating leaseback transaction in a prior period. Leases have an average term of 20 years (2011: 21 years) and rentals are fixed for an average of 20 years (2011: 21 years).
At 31 March 2012, other than as disclosed below, there were no contingent liabilities or guarantees other than those arising in the ordinary course of the group’s business and on these no material losses are anticipated. The group has insurance cover to certain limits for major risks on property and major claims in connection with legal liabilities arising in the course of its operations. Otherwise, the group generally carries its own risks.
The group has provided guarantees relating to certain leases entered into by Telefonica UK Limited prior to its demerger with O2 on 19 November 2001. mmO2 plc has given BT a counter indemnity for these guarantees. The maximum exposure was US$118m as at 31 March 2012 (2011: US$128m), approximately £74m (2011: £80m), although this could increase by a further US$228m (2011: US$268m), approximately £143m (2011: £167m), in the event of credit default in respect of amounts used to defease future lease obligations. The guarantee lasts until Telefonica UK Limited has discharged all its obligations, which is expected to be when the lease ends on 30 January 2017.
The group does not believe that there is any single current court action that would have a material adverse effect on the financial position or operations of the group. During 2012 the aggregate volume and value of legal actions to which the group is party remained broadly the same as at the end of 2011.
| | |
| 90 British Telecommunications plc Annual Report & Form 20-F 2012 | | Notes to the consolidated financial statements |
REPORT OF THE INDEPENDENT AUDITORS – PARENT COMPANY FINANCIAL STATEMENTS
Independent Auditors’ Report to the members of British Telecommunications plc (the ‘company’)
We have audited the parent company financial statements of British Telecommunications plc for the year ended 31 March 2012 which comprise the parent company balance sheet, the accounting policies and the related notes. The financial reporting framework that has been applied in their preparation is applicable law and United Kingdom Accounting Standards (United Kingdom Generally Accepted Accounting Practice).
Respective responsibilities of directors and auditors
As explained more fully in the Statement of directors’ responsibilities set out on page 32, the directors are responsible for the preparation of the parent company financial statements and for being satisfied that they give a true and fair view. Our responsibility is to audit the parent company financial statements in accordance with applicable law and International Standards on Auditing (UK and Ireland). Those standards require us to comply with the Auditing Practices Board’s Ethical Standards for Auditors.
This report, including the opinions, has been prepared for and only for the company’s members as a body in accordance with Chapter 3 of Part 16 of the Companies Act 2006 and for no other purpose. We do not, in giving these opinions, accept or assume responsibility for any other purpose or to any other person to whom this report is shown or into whose hands it may come save where expressly agreed by our prior consent in writing.
Scope of the audit of the financial statements
An audit involves obtaining evidence about the amounts and disclosures in the financial statements sufficient to give reasonable assurance that the financial statements are free from material misstatement, whether caused by fraud or error. This includes an assessment of: whether the accounting policies are appropriate to the parent company’s circumstances and have been consistently applied and adequately disclosed; the reasonableness of significant accounting estimates made by the directors; and the overall presentation of the financial statements. In addition, we read all the financial and non-financial information in the British Telecommunications plc Annual Report & Form 20-F for the year ended 31 March 2012 to identify material inconsistencies with the financial statements. If we become aware of any apparent misstatements or inconsistencies we consider the implications for our report.
Opinion on financial statements
In our opinion the parent company financial statements:
| — | | give a true and fair view of the state of the company’s affairs as at 31 March 2012; |
| — | | have been properly prepared in accordance with United Kingdom Generally Accepted Accounting Practice; and |
| — | | have been prepared in accordance with the requirements of the Companies Act 2006. |
Opinion on other matters prescribed by the Companies Act 2006
In our opinion the information given in the Report of the directors for the financial year for which the parent company financial statements are prepared is consistent with the parent company financial statements.
Matters on which we are required to report by exception
We have nothing to report in respect of the following matters where the Companies Act 2006 requires us to report to you if, in our opinion:
| — | | adequate accounting records have not been kept by the parent company, or returns adequate for our audit have not been received from branches not visited by us; or |
| — | | the parent company financial statements are not in agreement with the accounting records and returns; or |
| — | | certain disclosures of directors’ remuneration specified by law are not made; or |
| — | | we have not received all the information and explanations we require for our audit. |
Other matter
We have reported separately on the consolidated financial statements of British Telecommunications plc for the year ended 31 March 2012.
Philip Rivett (Senior Statutory Auditor)
for and on behalf of PricewaterhouseCoopers LLP
Chartered Accountants and Statutory Auditors
London, United Kingdom
16 May 2012
| | |
| Report of the independent auditors – Parent company financial statements | | British Telecommunications plc Annual Report & Form 20-F 2012 91 |
FINANCIAL STATEMENTS OF BRITISH TELECOMMUNICATIONS PLC
BRITISH TELECOMMUNICATIONS PLC PARENT COMPANY ACCOUNTING POLICIES
As used in these financial statements and associated notes, the term ‘company’ refers to British Telecommunications plc (BT plc). These separate financial statements of the company are presented as required by the Companies Act 2006. The separate financial statements have been prepared in accordance with UK Generally Accepted Accounting Principles (UK GAAP).
The financial statements are prepared on a going concern basis and under the historical cost convention as modified by the revaluation of certain financial instruments at fair value.
Balances with other companies in the BT Group plc group for 2011 have been disclosed separately between amounts due to and from parent and other group undertakings and have also been reclassified between debtors and other creditors: amounts falling due within one year on the balance sheet to reflect the cancellation of offsetting items. Within debtors, amounts owed by parent and group undertakings have reduced by £1,371m with an equivalent decrease in amounts owed to group and parent undertakings within other creditors.
The analysis of 2011 derivative financial instruments between current and non-current assets and liabilities has been amended to decrease current and increase non-current amounts by £66m and £222m respectively to reflect the maturity dates on a comparable basis with the current year.
Neither of these amendments had any impact on the results for the year, net assets or equity shareholders’ funds.
Exemptions
As permitted by Section 408(3) of the Companies Act 2006, the company’s profit and loss account has not been presented.
The BT plc consolidated financial statements for the year ended 31 March 2012 contain a consolidated cash flow statement. Consequently, the company has taken advantage of the exemption in FRS 1, ‘Cash Flow Statements’, not to present its own cash flow statement.
The BT plc consolidated financial statements for the year ended 31 March 2012 contain related party disclosures. Consequently, the company has taken advantage of the exemption in FRS 8, ‘Related Party Disclosures’, not to disclose transactions with other members of the BT Group.
The BT plc consolidated financial statements for the year ended 31 March 2012 contain financial instruments disclosures which comply with FRS 29, ‘Financial Instruments: Disclosures’. Consequently, the company is exempted from the disclosure requirements of FRS 29 in respect of its financial instruments.
Turnover represents the fair value of the consideration received or receivable for communication services and equipment sales, net of discounts and sales taxes. Turnover from the rendering of services and sale of equipment is recognised when it is probable that the economic benefits associated with a transaction will flow to the company, and the amount of turnover and associated costs can be measured reliably. Where the company acts as an agent in a transaction it recognises turnover net of directly attributable costs.
Services
Turnover arising from separable installation and connection services is recognised when it is earned, upon activation. Turnover from the rental of analogue and digital lines and private circuits is recognised
evenly over the period to which the charges relate. Turnover from calls is recognised at the time the call is made over the company’s network.
Subscription fees, consisting primarily of monthly charges for access to broadband and other internet access or voice services, are recognised as turnover as the service is provided. Turnover arising from the interconnection of voice and data traffic between other telecommunications operators is recognised at the time of transit across the company’s network.
Equipment sales
Turnover from the sale of peripheral and other equipment is recognised when all the significant risks and rewards of ownership are transferred to the buyer, which is normally the date the equipment is delivered and accepted by the customer.
Long-term contractual arrangements
Turnover from long-term contractual arrangements is recognised based on the percentage of completion method. The stage of completion is estimated using an appropriate measure according to the nature of the contract. If the performance pattern is other than straight line, turnover is recognised as services are provided, usually on an output or consumption basis. For fixed price contracts, including contracts to design and build software solutions, turnover is recognised by reference to the stage of completion, as determined by the proportion of costs incurred relative to the estimated total contract costs, or other measures of completion, such as the achievement of contract milestones and customer acceptance. In the case of time and materials contracts, turnover is recognised as the service is rendered.
Costs related to delivering services under long-term contractual arrangements are expensed as incurred. An element of costs incurred in the initial set up, transition or transformation phase of the contract is deferred and recorded within debtors due after more than one year. These costs are then recognised in the profit and loss account on a straight line basis over the remaining contractual term, unless the pattern of service delivery indicates a different profile is appropriate. These costs are directly attributable to specific contracts, relate to future activity, will generate future economic benefits and are assessed for recoverability on a regular basis.
The percentage of completion method relies on estimates of total expected contract turnover and costs, as well as reliable measurement of the progress made towards completion. Unless the financial outcome of a contract can be estimated with reasonable certainty, no attributable profit is recognised. In such circumstances, turnover is recognised equal to the costs incurred to date, to the extent that such turnover is expected to be recoverable. Recognised turnover and profits are subject to revisions during the contract if the assumptions regarding the overall contract outcome are changed. The cumulative impact of a revision in estimates is recorded in the period in which such revisions become likely and can be estimated. Where the actual and estimated costs to completion exceed the estimated turnover for a contract, the full contract life loss is recognised immediately.
Where a contractual arrangement consists of two or more separate elements that have value to a customer on a standalone basis, turnover is recognised for each element as if it were an individual contract. The total contract consideration is allocated between the separate elements on the basis of relative fair value and the appropriate turnover recognition criteria are applied to each element as described above.
| | |
| 92 British Telecommunications plc Annual Report & Form 20-F 2012 | | Parent company accounting policies |
| (iii) | Research and development |
Research expenditure is recognised in the profit and loss account in the period in which it is incurred. Development expenditure, including the cost of internally developed software, is recognised in the profit and loss account in the period in which it is incurred unless it is probable that economic benefits will flow to the company from the asset being developed, the cost of the asset can be reliably measured and technical feasibility can be demonstrated. Capitalisation ceases when the asset being developed is ready for use. Research and development costs include direct and indirect labour, materials and directly attributable overheads.
The determination of whether an arrangement is, or contains, a lease is based on the substance of the arrangement and requires an assessment of whether the fulfilment of the arrangement is dependent on the use of a specific asset or assets and whether the arrangement conveys the right to use the asset.
Leases of tangible fixed assets where the company holds substantially all the risks and rewards of ownership are classified as finance leases. Finance lease assets are capitalised at the commencement of the lease term at the lower of the present value of the minimum lease payments or the fair value of the leased asset. The obligations relating to finance leases, net of finance charges in respect of future periods, are recognised as liabilities. Leases are subsequently measured at amortised cost using the effective interest method.
Leases where a significant portion of the risks and rewards are held by the lessor are classified as operating leases. Rentals are charged to the profit and loss account on a straight line basis over the period of the lease.
Foreign currency transactions are translated into the functional currency using the exchange rate prevailing at the date of the transaction. Foreign exchange gains and losses resulting from the settlement of such transactions and from the translation of monetary assets and liabilities denominated in foreign currencies at period end exchange rates are recognised in the profit and loss account.
Goodwill arising from the purchase of businesses represents the excess of the fair value of the purchase consideration over the fair value of the identifiable net assets acquired.
Goodwill is amortised on a straight line basis from the time of acquisition over its useful economic life. The economic life is normally presumed to be a maximum of 20 years.
If a business is subsequently sold, the appropriate unamortised goodwill is included in the profit and loss account in the period of disposal as part of the gain or loss on disposal.
| (vii) | Tangible fixed assets |
Tangible fixed assets are stated at historical cost, less accumulated depreciation and any impairment losses. On disposal of tangible fixed assets, the difference between the sale proceeds and the net book value at the date of disposal is recorded in the profit and loss account.
Included within the cost of network infrastructure and equipment are direct and indirect labour costs, materials, and directly attributable overheads. Depreciation is provided on tangible fixed assets on a straight line basis from the time the asset is available for use, so as to write off the asset’s cost over the estimated useful life taking into account any expected residual value. Freehold land is not depreciated.
The lives assigned to principal categories of tangible fixed assets are:
| | |
Land and buildings | | |
Freehold buildings | | 40 years |
Leasehold land and buildings | | Unexpired portion of |
| | lease or 40 years, |
| | whichever is the shorter |
Network infrastructure and equipment | | |
Transmission equipment: | | |
Duct | | 40 years |
Cable | | 3 to 25 years |
Fibre | | 5 to 20 years |
Exchange equipment | | 2 to 13 years |
Payphones and other network equipment | | 2 to 20 years |
Other | | |
Motor vehicles | | 2 to 9 years |
Computers and office equipment | | 3 to 6 years |
Software | | 2 to 10 years |
Assets held under finance leases are depreciated over the shorter of the lease term or their useful economic life. Residual values and useful lives are reassessed annually, and if necessary, changes are recognised prospectively.
| (viii) | Impairment of fixed assets and goodwill |
Fixed assets and goodwill are tested for impairment if events or changes in circumstances (assessed at each reporting date) indicate that the carrying amount might not be recoverable. Goodwill is also reviewed for impairment at the end of the first financial year after its initial recognition.
When an impairment test is performed, the recoverable amount is assessed by reference to the higher of the net present value of the expected future cash flows (value in use) of the continued use of the asset, and the fair value less cost to sell. Impairment losses are recognised in the profit and loss account.
| (ix) | Investments in subsidiary undertakings |
Investments in subsidiary undertakings are stated at cost and reviewed for impairment if there are indicators that the carrying value may not be recoverable.
Stocks mainly comprise items of equipment held for sale or rental and consumable items.
Equipment and consumable items are stated at the lower of cost and estimated net realisable value, after provisions for obsolescence. Cost is calculated on a first-in-first-out basis.
| | |
| Parent company accounting policies | | British Telecommunications plc Annual Report & Form 20-F 2012 93 |
(xi) Redundancy costs
Redundancy or leaver costs are payable when employment is terminated before the normal retirement date, or when an employee accepts voluntary redundancy in exchange for these benefits. The company recognises redundancy or leaver costs when it is demonstrably committed to the affected employees leaving the company.
(xii) Post retirement benefits
The company’s obligation in respect of defined benefit pension plans is calculated separately for each plan by estimating the amount of future benefit that employees have earned in return for their service to date. That benefit is discounted to determine its present value using a rate which is the yield at the balance sheet date on AA credit rated bonds that have maturity dates approximating the terms of the company’s obligations, The calculation is performed by a qualified actuary using the projected unit credit method. The net obligation or asset recognised in the balance sheet is the present value of the defined benefit obligation less the fair value of the plan assets.
The profit and loss account charge is allocated between an operating charge and net finance expense or income. The operating charge reflects the increase in the defined benefit obligation resulting from pension earned by active employees in the current period. The net finance charge reflects the unwinding of the discount applied to the liabilities of the plan, offset by the expected return on the assets of the plan, based on conditions prevailing at the start of the year.
Actuarial gains and losses are recognised in full in the period in which they occur and are presented in the reconciliation of movement in equity shareholders’ funds.
The company also operates defined contribution pension schemes and the profit and loss account charge represents the contributions payable for the year.
(xiii) Share-based payments
The ultimate parent undertaking, BT Group plc, operates a number equity settled share-based arrangements, as detailed in note 20 to the BT plc consolidated financial statements, under which the company receives services from employees as consideration for equity instruments of BT Group plc. Equity settled share-based payments are measured at fair value (excluding the effect of non market-based vesting conditions) at the date of grant, but including any market-based performance criteria and the impact of non-vesting conditions (for example the requirement for employees to save). The fair value determined at the grant date is recognised on a straight line basis over the vesting period, based on the company’s estimate of the options or shares that will eventually vest and adjusted for the effect of non market-based vesting conditions. Fair value is measured using either the Binomial options pricing model or Monte Carlo simulations, whichever is most appropriate to the award.
Service and performance conditions are vesting conditions. Any other conditions are non-vesting conditions which have to be taken into account to determine the fair value of equity instruments granted. In the case that an award or option does not vest as a result of a failure to meet a non-vesting condition that is within the control of either counterparty, this is accounted for as a cancellation. Cancellations must be treated as accelerated vesting and all remaining future charges are immediately recognised. As the requirement to save under an employee sharesave arrangement is a non-vesting condition, employee cancellations must be treated as an accelerated vesting.
(xiv) Taxation including deferred tax
Current income tax is calculated based on tax laws enacted or substantively enacted at the balance sheet date. Full provision is made for deferred taxation on all timing differences which have arisen but not reversed at the balance sheet date. Deferred tax assets are recognised to the extent that it is regarded as more likely than not that there will be sufficient taxable profits from which the underlying timing differences can be deducted. The deferred tax balances are not discounted. Deferred tax is determined using tax rates that are expected to apply in the periods in which the asset is realised or liability settled, based upon tax rate and laws that have been enacted or substantively enacted at the balance sheet date.
(xv) Dividends
Dividend distributions are recognised as a liability in the year in which the dividends are approved by the company’s shareholders. Interim dividends are recognised when they are paid; final dividends when authorised in general meetings by shareholders.
(xvi) Provisions
Provisions are recognised when the company has a present legal or constructive obligation as a result of past events, it is probable that an outflow of resources will be required to settle the obligation and the amount can be reliably estimated. Provisions are determined by discounting the expected future cash flows at a pre-tax rate that reflects current market assessments of the time value of money and the risks specific to the liability. Financial liabilities within provisions are initially recognised at fair value and subsequently carried at amortised cost using the effective interest method. Onerous lease provisions have been measured at the lower of the cost to fulfil the contract or the cost to exit it.
(xvii) Financial instruments
Financial assets
Financial assets at fair value through profit or loss
A financial asset is classified in this category if acquired principally for the purpose of selling in the short-term (held for trading) or if so designated by management. Financial assets held in this category are initially recognised and subsequently measured at fair value, with changes in value recognised in the profit and loss account. Any direct transaction costs are recognised immediately in the profit and loss account.
Loans and receivables
Loans and receivables are non-derivative financial assets with fixed or determinable payments that are not quoted in an active market other than those for which the company may not recover substantially all of its initial investment, other than because of credit deterioration, which are classified as available-for-sale. Loans and receivables are initially recognised at fair value plus transaction costs and subsequently carried at amortised cost using the effective interest method, with changes in carrying value recognised in the profit and loss account in the line which most appropriately reflects the nature of the item or transaction.
Fixed asset investments
Fixed asset investments are stated at cost net of permanent diminution in value.
| | |
| 94 British Telecommunications plc Annual Report & Form 20-F 2012 | | Parent company accounting policies |
Available-for-sale financial assets
Non-derivative financial assets classified as available-for-sale are either specifically designated in this category or not classified in any of the other categories. Available-for-sale financial assets are initially recognised at fair value plus direct transaction costs and then re-measured at subsequent reporting dates to fair value, with unrealised gains and losses (except for changes in exchange rates for monetary items, interest, dividends and impairment losses, which are recognised in the profit and loss account) recognised in equity until the financial asset is derecognised, at which time the cumulative gain or loss previously recognised in equity is taken to the profit and loss account.
Debtors
Financial assets within debtors are initially recognised at fair value, which is usually the original invoiced amount, and are subsequently carried at amortised cost using the effective interest method less provisions made for doubtful debts. Provisions are made specifically where there is evidence of a risk of non payment, taking into account ageing, previous losses experienced and general economic conditions.
Cash
Cash includes cash in hand and bank deposits repayable on demand.
Impairment of financial assets
The company assesses at each balance sheet date whether a financial asset or group of financial assets are impaired. Where there is objective evidence that an impairment loss has arisen on assets carried at amortised cost, the carrying amount is reduced with the loss being recognised in the profit and loss account. The impairment loss is measured as the difference between that asset’s carrying amount and the present value of estimated future cash flows discounted at the financial asset’s original effective interest rate.
Financial liabilities
Creditors
Financial liabilities within creditors are initially recognised at fair value, which is usually the original invoiced amount, and subsequently carried at amortised cost using the effective interest method.
Loans and other borrowings
Loans and other borrowings are initially recognised at fair value plus directly attributable transaction costs. Loans and other borrowings are subsequently measured at amortised cost using the effective interest method and, if included in a fair value hedge relationship, are revalued to reflect the fair value movements on the hedged risk associated with the loans and other borrowings. The resultant amortisation of fair value movements, on de-designation of the hedge, are recognised in the profit and loss account.
Derivative financial instruments and hedge accounting
The company uses derivative financial instruments mainly to reduce exposure to foreign exchange and interest rate risks. The company does not hold or issue derivative financial instruments for financial trading purposes. However, derivatives that do not qualify for hedge accounting are accounted for as trading instruments. Derivative financial instruments are classified as held for trading and are initially recognised and subsequently measured at fair value. The gain or loss on re-measurement to fair value is recognised immediately in the
profit and loss account in net finance expense. Derivative financial instruments are classified as current assets or current liabilities where they have a maturity period within 12 months. Where derivative financial instruments have a maturity period greater than 12 months, they are classified within either fixed assets or creditors falling due after more than one year.
Where derivatives qualify for hedge accounting, recognition of any resultant gain or loss depends upon the nature of the hedge. To qualify for hedge accounting, hedge documentation must be prepared at inception and the hedge must be expected to be highly effective both prospectively and retrospectively. The hedge is tested for effectiveness at inception and in subsequent periods in which the hedge remains in operation. Hedge accounting is discontinued when the hedging instrument expires or is sold, terminated or no longer qualifies for hedge accounting or the company chooses to end the hedge relationship. The group designates certain derivatives as either cash flow hedges or fair value hedges.
Cash flow hedges
When a financial instrument is designated as a hedge of the variability in cash flows of a recognised asset or liability, or a highly probable transaction, the effective part of any gain or loss on the derivative financial instrument is recognised directly in equity. For cash flow hedges of recognised assets or liabilities, the associated cumulative gain or loss is removed from equity and recognised in the profit and loss account in the same period or periods during which the hedged transaction affects the profit and loss account. Any ineffectiveness arising on a cash flow hedge of a recognised asset or liability is recognised immediately in the profit and loss.
Fair value hedges
When a derivative financial instrument is designated as a hedge of the variability in fair value of a recognised asset or liability, or unrecognised firm commitments, the change in fair value of the derivatives that are designated as fair value hedges are recorded in the same line in the profit and loss account, together with any changes in fair value of the hedged asset or liability that is attributable to the hedged risk.
Hedge of net investment in a foreign operation
Exchange differences arising from the retranslation of currency instruments designated as hedges of net investments in a foreign operation are taken to shareholders’ equity on consolidation to the extent that the hedges are deemed effective.
Any ineffectiveness arising on a hedge of a net investment in a foreign operation is recognised in net finance expense.
Accounting standards, interpretations and amendments to published standards adopted in the year ended 31 March 2012
The following amended standards and interpretations were adopted in 2012. They have had no significant impact on the company’s results or financial position for the current or prior years but may impact the accounting for future transactions or arrangements.
| — | | UITF Abstract 47 ‘Extinguishing Financial Liabilities with Equity Instruments’ |
| — | | Amendments to FRS 2010. |
| | |
| Parent company accounting policies | | British Telecommunications plc Annual Report & Form 20-F 2012 95 |
PARENT COMPANY BALANCE SHEET
At 31 March
British Telecommunications plc parent company balance sheet
| | | | | | | | | | | | |
| | | | | | 2012 | | | 2011a | |
| | | Notes | | | £m | | | £m | |
| |
Fixed assets | | | | | | | | | | | | |
Intangible assets | | | 1 | | | | 314 | | | | 336 | |
Tangible assets | | | 2 | | | | 14,564 | | | | 14,797 | |
Derivative financial instruments | | | 3 | | | | 886 | | | | 625 | |
Investments in subsidiary undertakings, associates and joint ventures | | | 4 | | | | 44,773 | | | | 48,006 | |
Other investments | | | 5 | | | | 14,143 | | | | 12,200 | |
| |
Total fixed assets | | | | | | | 74,680 | | | | 75,964 | |
| |
Current assets | | | | | | | | | | | | |
Stocks | | | | | | | 71 | | | | 71 | |
Debtors | | | 6 | | | | 3,569 | | | | 3,159 | |
Derivative financial instruments | | | 3 | | | | 137 | | | | 108 | |
Other investments | | | 5 | | | | 5,626 | | | | 4,846 | |
Cash | | | | | | | 53 | | | | – | |
| |
Total current assets | | | | | | | 9,456 | | | | 8,184 | |
| |
Creditors: amounts falling due within one year | | | | | | | | | | | | |
Loans and other borrowings | | | 7 | | | | 8,876 | | | | 5,942 | |
Derivative financial instruments | | | 3 | | | | 89 | | | | 62 | |
Other creditors | | | 8 | | | | 4,440 | | | | 4,639 | |
| |
Total creditors: amounts falling due within one year | | | | | | | 13,405 | | | | 10,643 | |
| |
Net current liabilities | | | | | | | (3,949 | ) | | | (2,459 | ) |
| |
Total assets less current liabilities | | | | | | | 70,731 | | | | 73,505 | |
| |
Creditors: amounts falling due after more than one year | | | | | | | | | | | | |
Loans and other borrowings | | | 7 | | | | 46,213 | | | | 49,923 | |
Derivative financial instruments | | | 3 | | | | 757 | | | | 507 | |
Other creditors | | | 9 | | | | 853 | | | | 818 | |
| |
Total creditors: amounts falling due after more than one year | | | | | | | 47,823 | | | | 51,248 | |
| |
Provisions for liabilities and charges | | | | | | | | | | | | |
Deferred taxation | | | 10 | | | | 1,256 | | | | 1,465 | |
Other provisions | | | 10 | | | | 765 | | | | 824 | |
| |
Total provisions for liabilities and charges | | | | | | | 2,021 | | | | 2,289 | |
| |
Net assets excluding pension obligation | | | | | | | 20,887 | | | | 19,968 | |
| |
Pension obligation | | | 15 | | | | 1,765 | | | | 1,273 | |
| |
Net assets including pension obligation | | | | | | | 19,122 | | | | 18,695 | |
| |
Capital and reserves | | | | | | | | | | | | |
Called up share capital | | | 11 | | | | 2,172 | | | | 2,172 | |
Share premium account | | | 11 | | | | 8,000 | | | | 8,000 | |
Other reserves | | | 11 | | | | 951 | | | | 856 | |
Profit and loss account | | | 11 | | | | 7,999 | | | | 7,667 | |
| |
Equity shareholders’ funds | | | | | | | 19,122 | | | | 18,695 | |
| |
The financial statements of the company on pages 92 to 108 were approved by the board of directors on 16 May 2012 and were signed on its behalf by
Tony Chanmugam
Director
| | |
| 96 British Telecommunications plc Annual Report & Form 20-F 2012 | | Parent company balance sheet |
NOTES TO THE FINANCIAL STATEMENTS
| 1. | Intangible fixed assets |
| | | | |
| | | Goodwill
£m | |
| |
Cost | | | | |
At 1 April 2011 and 31 March 2012 | | | 473 | |
| |
Accumulated amortisation | | | | |
At 1 April 2011 | | | 137 | |
Charge for the year | | | 22 | |
| |
At 31 March 2012 | | | 159 | |
| |
Net book value | | | | |
At 31 March 2012 | | | 314 | |
| |
At 31 March 2011 | | | 336 | |
| |
| | | and equipmenta | | | | and equipmenta | | | | and equipmenta | | | | and equipmenta | | | | and equipmenta | |
| | | Land and buildings
£m | | | Network
infrastructure
and equipmenta
£m | | | Otherb
£m | | | Assets in course of
construction
£m | | | Total £m | |
| |
Cost | | | | | | | | | | | | | | | | | | | | |
At 1 April 2011 | | | 655 | | | | 38,501 | | | | 4,658 | | | | 938 | | | | 44,752 | |
Additions | | | 1 | | | | 47 | | | | 68 | | | | 2,180 | | | | 2,296 | |
Transfers | | | 7 | | | | 1,702 | | | | 431 | | | | (2,140 | ) | | | – | |
Disposals and adjustments | | | (99 | ) | | | (517 | ) | | | (409 | ) | | | – | | | | (1,025 | ) |
| |
At 31 March 2012 | | | 564 | | | | 39,733 | | | | 4,748 | | | | 978 | | | | 46,023 | |
| |
Accumulated depreciation | | | | | | | | | | | | | | | | | | | | |
At 1 April 2011 | | | 370 | | | | 26,640 | | | | 3,027 | | | | – | | | | 30,037 | |
Charge for the year | | | 27 | | | | 1,741 | | | | 733 | | | | – | | | | 2,501 | |
Disposals and adjustments | | | (74 | ) | | | (511 | ) | | | (412 | ) | | | – | | | | (997 | ) |
| |
At 31 March 2012 | | | 323 | | | | 27,870 | | | | 3,348 | | | | – | | | | 31,541 | |
| |
Net book value at 31 March 2012 | | | 241 | | | | 11,863 | | | | 1,400 | | | | 978 | | | | 14,482 | |
Engineering stores | | | – | | | | – | | | | – | | | | 82 | | | | 82 | |
| |
Total tangible fixed assets at 31 March 2012 | | | 241 | | | | 11,863 | | | | 1,400 | | | | 1,060 | | | | 14,564 | |
| |
Net book value at 31 March 2011 | | | 285 | | | | 11,861 | | | | 1,631 | | | | 938 | | | | 14,715 | |
Engineering stores | | | – | | | | – | | | | – | | | | 82 | | | | 82 | |
| |
Total tangible fixed assets at 31 March 2011 | | | 285 | | | | 11,861 | | | | 1,631 | | | | 1,020 | | | | 14,797 | |
| |
| | | | | |
| | | | | | | | | | | | 2012 £m | | | 2011 £m | |
| |
The net book value of land and buildings comprised: | | | | | | | | | | | | | | | | | | | | |
Freehold | | | | | | | | | | | | | | | 67 | | | | 72 | |
Long leases (over 50 years unexpired) | | | | | | | | | | | | | | | 13 | | | | 13 | |
Short leases | | | | | | | | | | | | | | | 161 | | | | 200 | |
| |
Total net book value of land and buildings | | | | | | | | | | | | | | | 241 | | | | 285 | |
| |
| a | The net book value of assets held under finance leases included within network infrastructure and equipment at 31 March 2012 was £503m (2011: £759m). The depreciation charge on those assets for the year ended 31 March 2012 was £292m (2011: £255m). |
| b | Other mainly comprises software, computers and motor vehicles. |
| | |
| Notes to the financial statements | | British Telecommunications plc Annual Report & Form 20-F 2012 97 |
| 3. | Derivative financial instruments |
| | | undertakings | | | | undertakings | | | | undertakings | | | | undertakings | |
| | | 2012 | | | 2011 | |
| | | | | | | | |
| At 31 March | | Assets
£m | | | Liabilities
£m | | | Assets
£m | | | Liabilities
£m | |
| |
Cash flow hedges | | | | | | | | | | | | | | | | |
Interest rate swaps | | | – | | | | 451 | | | | – | | | | 265 | |
Cross currency swaps | | | 769 | | | | 59 | | | | 622 | | | | 29 | |
Forward foreign exchange rate contracts | | | – | | | | 8 | | | | 3 | | | | 6 | |
| |
| | | 769 | | | | 518 | | | | 625 | | | | 300 | |
| |
Fair value hedges | | | | | | | | | | | | | | | | |
Interest rate swaps | | | 82 | | | | – | | | | 4 | | | | 2 | |
| |
| | | 82 | | | | – | | | | 4 | | | | 2 | |
| |
Derivatives not in a formal hedge relationship | | | | | | | | | | | | | | | | |
Interest rate swaps | | | 171 | | | | 322 | | | | 99 | | | | 267 | |
Forward foreign exchange rate contracts | | | 1 | | | | 6 | | | | 5 | | | | – | |
| |
| | | 172 | | | | 328 | | | | 104 | | | | 267 | |
| |
| | | 1,023 | | | | 846 | | | | 733 | | | | 569 | |
| |
Analysed as: | | | | | | | | | | | | | | | | |
Current assetsa | | | 137 | | | | 89 | | | | 108 | | | | 62 | |
Fixed assetsa | | | 886 | | | | 757 | | | | 625 | | | | 507 | |
| |
| | | 1,023 | | | | 846 | | | | 733 | | | | 569 | |
| |
| a | 2011 restated. See page 92. |
Details of hedges in which the derivatives are utilised are disclosed in note 18.
| 4. | Investments in subsidiary undertakings, associates and joint ventures |
| | undertakings | | | undertakings | | | | undertakings | | | | undertakings | |
| | | | | Subsidiary
undertakings
£m | | | Associates
and joint
ventures
£m | | | Total £m | |
| |
Cost | | | | | | | | | | | | | | |
At 1 April 2011 | | | | | 52,033 | | | | 8 | | | | 52,041 | |
Additionsa | | | | | 71 | | | | – | | | | 71 | |
Disposalsb | | | | | (3,630 | ) | | | (5 | ) | | | (3,635 | ) |
| |
At 31 March 2012 | | | | | 48,474 | | | | 3 | | | | 48,477 | |
| |
Provisions and amounts written off | | | | | | | | | | | | | | |
At 1 April 2011 | | | | | 4,029 | | | | 6 | | | | 4,035 | |
Additions | | | | | 113 | | | | – | | | | 113 | |
Disposals | | | | | (438 | ) | | | (6 | ) | | | (444 | ) |
| |
At 31 March 2012 | | | | | 3,704 | | | | – | | | | 3,704 | |
| |
Net book value at 31 March 2012 | | | | | 44,770 | | | | 3 | | | | 44,773 | |
| |
Net book value at 31 March 2011 | | | | | 48,004 | | | | 2 | | | | 48,006 | |
| |
| a | Additions in 2012 include a capital contribution to Communications Global Network Services Ltd of £39m and BT Centre Nominee Ltd of £10m. |
| b | Disposals in 2012 include a capital distribution from BT Newgate Investments Ltd of £2,899m, Shorwell Ltd of £256m and BT Subsea Cables Ltd of £187m. |
Details of the principal operating subsidiary undertakings and associate are set out on page 108.
| | | undertakings | | | | undertakings | |
| At 31 March | | 2012 £m | | | 2011 £m | |
| |
Fixed assets | | | | | | | | |
Available-for-sale assets | | | 37 | | | | 35 | |
Loans to group undertakings | | | 10,513 | | | | 9,811 | |
Loans to parent undertakings | | | 3,593 | | | | 2,354 | |
| |
| | | 14,143 | | | | 12,200 | |
| |
Current assets | | | | | | | | |
Available-for-sale assets | | | 505 | | | | – | |
Loans and receivables | | | 82 | | | | 203 | |
Loans to group undertakings | | | 4,515 | | | | 4,158 | |
Loans to parent undertakings | | | 524 | | | | 485 | |
| |
| | | 5,626 | | | | 4,846 | |
| |
Available-for-sale
Current assets consist of investments in AAA rated liquidity funds denominated in Sterling of £505m (2011: £nil).
Fixed asset available-for-sale assets include an investment in the shares of the ultimate parent company, BT Group plc of £19m (2011: £15m). These shares are held in trust for the BT Group Incentive Share Plan, the Retention Share Plan, and the Deferred Bonus Plan.
Loans to group undertakings and parent undertakings which total £19,145m (2011: £16,808m) are denominated in Sterling of £15,039m (2011: £13,325m), Euro of £1,071m (2011: £877m), US Dollars of £2,353m (2011: £2,015m) and other currencies of £682m (2011: £591m).
| | |
| 98 British Telecommunications plc Annual Report & Form 20-F 2012 | | Notes to the financial statements |
| | | 00000000000 | | | | 00000000000 | |
At 31 March | |
| 2012
£m |
| |
| 2011b
£m |
|
| |
Debtors due within one year | | | | | | | | |
Trade debtors | | | 960 | | | | 808 | |
Amount owed by group undertakings | | | 1,089 | | | | 1,101 | |
Amount owed by parent undertakings | | | 3 | | | | 32 | |
Other debtors | | | 262 | | | | 149 | |
Current tax receivable | | | 273 | | | | 6 | |
Accrued income | | | 469 | | | | 540 | |
Prepayments | | | 449 | | | | 347 | |
| |
| | | 3,505 | | | | 2,983 | |
| |
Debtors due after more than one year | | | | | | | | |
Other assetsa | | | 64 | | | | 176 | |
| |
Total debtors | | | 3,569 | | | | 3,159 | |
| |
| a | Mainly represents costs relating to the initial set up, transition or transformation phase of long-term networked IT services contracts. |
| 7. | Loans and other borrowings |
| | | 00000000000 | | | | 00000000000 | |
At 31 March | |
| 2012
£m |
| |
| 2011
£m |
|
| |
US Dollar 5.15% bonds January 2013a | | | 538 | | | | 537 | |
Euro 5.25% bonds January 2013a | | | 842 | | | | 898 | |
Euro 5.25% bonds June 2014a | | | 650 | | | | 693 | |
Euro 6.125% bonds July 2014a,b | | | 522 | | | | 557 | |
Euro 6.5% bonds July 2015a | | | 874 | | | | 930 | |
Sterling 8.50% bonds December 2016 (2011: 8.75%; minimum 7.5%c) | | | 705 | | | | 715 | |
Sterling 6.625% bonds June 2017a | | | 525 | | | | 525 | |
US Dollar 5.95% bonds January 2018a | | | 697 | | | | 695 | |
Sterling 8.625% bonds March 2020 | | | 298 | | | | 298 | |
Sterling 3.5% index linked bonds April 2025 | | | 358 | | | | 340 | |
Sterling 5.75% bonds December 2028d | | | 686 | | | | 605 | |
US Dollar 9.625% bonds December 2030 (2011: 9.875%; minimum 8.625%c)a | | | 1,719 | | | | 1,714 | |
Sterling 6.375% bonds June 2037a | | | 522 | | | | 521 | |
| |
Total listed bonds | | | 8,936 | | | | 9,028 | |
| |
Finance leases | | | 4 | | | | 7 | |
Finance leases with group undertakings | | | 199 | | | | 361 | |
| |
Total finance leases | | | 203 | | | | 368 | |
| |
Sterling 6.375% bank loan due August 2012 | | | 312 | | | | 312 | |
Commercial papere | | | 588 | | | | 71 | |
Loans from group undertakingsf,g | | | 44,697 | | | | 45,603 | |
Other loans | | | 351 | | | | 105 | |
Bank overdrafts | | | 2 | | | | 378 | |
| |
Total other loans and borrowings | | | 45,950 | | | | 46,469 | |
| |
Total loans and borrowingsh | | | 55,089 | | | | 55,865 | |
| |
| a | Designated in a cash flow hedge relationship. |
| b | The interest rate payable on this bond attracts an additional 1.25% for a downgrade by one credit rating category by either or both Moody’s and S&P below Baa3/BBB-, respectively. |
| c | The interest rate payable on these bonds will be subject to adjustment from time to time if either Moody’s or S&P reduce the rating ascribed to the group’s senior unsecured debt below A3 in the case of Moody’s or below A- in the case of S&P. In this event, the interest payable on the bonds and the spread applicable to the floating bonds will be increased by 0.25% for each rating category adjustment by each rating agency. In addition, if Moody’s or S&P subsequently increase the ratings ascribed to the group’s senior unsecured debt, then the interest rate will be decreased by 0.25% for each rating category upgrade by each rating agency, but in no event will the interest rate be reduced below the minimum interest rate reflected in the above table. In July 2011 S&P upgraded BT’s credit rating by one category to BBB. At at the next coupon date in 2012 the rate payable on these bonds decreased by 0.25 percentage points. |
| d | Designated in a fair value hedge relationship. |
| e | Commercial paper is denominated in Euros £208m (2011: £56m) and US Dollars £380m (2011: £15m). |
| f | Includes fixed interest bonds issued to group undertakings amounting to £1,594m (2011: £1,515m) denominated in Sterling and £14m (2011: £14m) denominated in Euros with maturities between 2012 and 2025). |
| g | Loans from group undertakings are mainly denominated in Sterling of £41,163m (2011: £43,848m), Euro of £1,502m (2011: £895m) and US Dollars of £1,903m (2011: £886m). |
| h | Current liabilities of £8,876m (2011: £5,942m) consist of listed bonds of £1,366m (2011: £nil). Sterling bank loans of £300m (2011: £nil), bank overdrafts of £2m (2011: £378m), commercial paper of £588m (2011: £71m), finance leases of £nil (2011: £2m), loans from group undertakings of £6,014m (2011: £5,122m), other loans of £351m (2011: £105m) and accrued interest on listed bonds of £255m (2011: £264m). |
The interest rates payable on loans and borrowings disclosed above reflect the coupons on the underlying issued loans and borrowings and not the interest rates achieved through applying associated currency and interest rate swaps in hedge arrangements.
| | |
| Notes to the financial statements | | British Telecommunications plc Annual Report & Form 20-F 2012 99 |
| 7. | Loans and other borrowingscontinued |
| | | | | | | | | | | | | | | | |
At 31 March | | | | | | | | | |
| 2012
£m |
| |
| 2011
£m |
|
| |
Repayments falling due as follows: | | | | | | | | | | | | | | | | |
Within one year, or on demand | | | | | | | | | | | 8,876 | | | | 5,942 | |
| |
Between one and two years | | | | | | | | | | | 50 | | | | 1,813 | |
Between two and three years | | | | | | | | | | | 1,154 | | | | 52 | |
Between three and four years | | | | | | | | | | | 834 | | | | 1,227 | |
Between four and five years | | | | | | | | | | | 689 | | | | 2,083 | |
After five years | | | | | | | | | | | 43,408 | | | | 44,751 | |
| |
Total due for repayment after more than one year | | | | | | | | | | | 46,135 | | | | 49,926 | |
| |
Total repayments | | | | | | | | | | | 55,011 | | | | 55,868 | |
Fair value adjustments for hedged risk | | | | | | | | | | | 78 | | | | (3 | ) |
| |
Total loans and other borrowings | | | | | | | | | | | 55,089 | | | | 55,865 | |
| |
| | |
| | | Minimum lease payments | | |
| Repayment of outstanding
lease obligations |
|
At 31 March | |
| 2012
£m |
| |
| 2011
£m |
| |
| 2012
£m |
| |
| 2011
£m |
|
| |
Amounts payable under finance leases: | | | | | | | | | | | | | | | | |
Within one year | | | 109 | | | | 174 | | | | 101 | | | | 167 | |
In the second to fifth years inclusive | | | 102 | | | | 204 | | | | 97 | | | | 191 | |
After five years | | | 5 | | | | 11 | | | | 5 | | | | 10 | |
| |
| | | 216 | | | | 389 | | | | 203 | | | | 368 | |
Less: future finance charges | | | (13 | ) | | | (21 | ) | | | – | | | | – | |
| |
Total finance lease obligations | | | 203 | | | | 368 | | | | 203 | | | | 368 | |
| |
The company’s obligations under finance leases are secured by the lessors’ title to the leased assets.
| 8. | Other creditors: amounts falling due within one year |
| | | | | | | | | | | | |
At 31 March | | | | | |
| 2012
£m |
| |
| 2011a
£m |
|
| |
Trade creditors | | | | | | | 2,090 | | | | 2,128 | |
Amounts owed to group undertakings | | | | | | | 196 | | | | 336 | |
Amounts owed to parent undertakings | | | | | | | 77 | | | | 97 | |
Other taxation and social security | | | | | | | 392 | | | | 396 | |
Other creditors | | | | | | | 299 | | | | 278 | |
Accrued expenses | | | | | | | 303 | | | | 271 | |
Deferred income | | | | | | | 1,083 | | | | 1,133 | |
| |
Total | | | | | | | 4,440 | | | | 4,639 | |
| |
| 9. | Other creditors: amounts falling due after more than one year |
| | | | | | | | | | | | |
At 31 March | | | | | |
| 2012
£m |
| |
| 2011
£m |
|
| |
Total | | | | | | | 853 | | | | 818 | |
| |
| 10. | Provisions for liabilities and charges |
| | | | | | | | | | | | | | |
Provisions for liabilities and charges excluding deferred taxation | | | |
| Property provisionsa
£m |
| |
| Other
provisionsb
£m |
| |
| Total
£m |
|
| |
At 1 April 2011 | | | | | 318 | | | | 506 | | | | 824 | |
Charged to the profit and loss accountc | | | | | 80 | | | | 72 | | | | 152 | |
Unwind of discount | | | | | 5 | | | | – | | | | 5 | |
Utilised or released | | | | | (107 | ) | | | (106 | ) | | | (213 | ) |
Transfers | | | | | – | | | | (3 | ) | | | (3 | ) |
| |
At 31 March 2012 | | | | | 296 | | | | 469 | | | | 765 | |
| |
| a | Property provisions mainly comprise onerous lease provisions arising from the rationalisation of the group’s property portfolio. The provisions will be utilised over the remaining lease periods, which range from one to 20 years. |
| b | Other provisions includes: |
| | – Amounts provided in relation to the BT Global Services contract and financial reviews in 2009. These will be utilised as the obligations are settled. |
| | – Amounts provided for legal or constructive obligations arising from insurance claims, litigation and regulatory risk, which will be utilised as the obligations are settled. |
| c | Includes £80m (2011: £88m) for property rationalisation costs. |
| | |
| 100 British Telecommunications plc Annual Report & Form 20-F 2012 | | Notes to the financial statements |
| 10. | Provisions for liabilities and chargescontinued |
Deferred taxation
Deferred tax is provided for in full on certain timing differences. BT does not discount the provision.
| | | | | | | | |
| | | | | | | £m | |
| |
At 1 April 2011 | | | | | | | 1,465 | |
Credit recognised in the profit and loss account | | | | | | | (222 | ) |
Charge recognised in reserves | | | | | | | 13 | |
| |
At 31 March 2012 | | | | | | | 1,256 | |
| |
| | |
At 31 March | |
| 2012
£m |
| |
| 2011
£m |
|
| |
Tax effect of timing differences due to: | | | | | | | | |
Excess capital allowances | | | 1,366 | | | | 1,524 | |
Share-based payments | | | (57 | ) | | | (14 | ) |
Other | | | (53 | ) | | | (45 | ) |
| |
Total provision for deferred taxation | | | 1,256 | | | | 1,465 | |
| |
The deferred taxation asset relating to the retirement benefit deficit is disclosed in note 15.
| 11. | Reconciliation of movement in equity shareholders’ funds |
| | | | | | | | | | | | | | | | | | | | |
| |
| Share
capitala
£m |
| |
| Share
premium
accountb
£m |
| |
| Other
Reservesb,d
£m |
| |
| Profit
and loss
account
£m |
| |
| Total
£m |
|
| |
At 1 April 2010 | | | 2,172 | | | | 8,000 | | | | 839 | | | | 450 | | | | 11,461 | |
Profit for the yearc | | | – | | | | – | | | | – | | | | 3,551 | | | | 3,551 | |
Actuarial gains | | | – | | | | – | | | | – | | | | 5,126 | | | | 5,126 | |
Deferred tax on actuarial gains | | | – | | | | – | | | | – | | | | (1,534 | ) | | | (1,534 | ) |
Share-based payment | | | – | | | | – | | | | – | | | | 57 | | | | 57 | |
Tax on items taken directly to equity | | | – | | | | – | | | | (5 | ) | | | 17 | | | | 12 | |
Gain on available-for-sale assets | | | – | | | | – | | | | 5 | | | | – | | | | 5 | |
Decrease in fair value of cash flow hedges | | | – | | | | – | | | | (327 | ) | | | – | | | | (327 | ) |
Recognised in profit and loss in the year | | | – | | | | – | | | | 344 | | | | – | | | | 344 | |
| |
At 1 April 2011 | | | 2,172 | | | | 8,000 | | | | 856 | | | | 7,667 | | | | 18,695 | |
Profit for the yearc | | | – | | | | – | | | | – | | | | 2,409 | | | | 2,409 | |
Actuarial losses | | | – | | | | – | | | | – | | | | (2,720 | ) | | | (2,720 | ) |
Deferred tax on actuarial losses | | | – | | | | – | | | | – | | | | 598 | | | | 598 | |
Share-based payment | | | – | | | | – | | | | – | | | | 64 | | | | 64 | |
Tax on items taken directly to equity | | | – | | | | – | | | | (11 | ) | | | (19 | ) | | | (30 | ) |
Gain on available-for-sale assets | | | – | | | | – | | | | 3 | | | | – | | | | 3 | |
Decrease in fair value of cash flow hedges | | | – | | | | – | | | | (78 | ) | | | – | | | | (78 | ) |
Recognised in profit and loss in the year | | | – | | | | – | | | | 181 | | | | – | | | | 181 | |
| |
At 31 March 2012 | | | 2,172 | | | | 8,000 | | | | 951 | | | | 7,999 | | | | 19,122 | |
| |
| a | The allotted, called up and fully paid share capital of the company at 31 March 2012 and 31 March 2011 was £2,172m representing 8,689,755,905 ordinary shares. |
| b | The share premium account, representing the premium on allotment of shares, and the capital redemption reserve are not available for distribution. |
| c | As permitted by Section 408(3) of the Companies Act 2006, no profit and loss account of the company is presented. The company’s profit for the financial year including dividends received from subsidiary undertakings was £2,409m (2011: £3,551m) before dividends paid of £nil (2011: £nil). |
| d | A breakdown of other reserves is provided in note 12. |
| | |
| Notes to the financial statements | | British Telecommunications plc Annual Report & Form 20-F 2012 101 |
| 12. | Reconciliation of movement in other reserves |
| | | | | | | | | | | | | | | | |
| | | Available-for-sale reserve £m | | | Cash flow reserve £m | | | Capital redemption reserve £m | | | Total other reserves £m | |
| |
At 1 April 2010 | | | (9 | ) | | | 96 | | | | 752 | | | | 839 | |
Gain on available-for-sale assets | | | 5 | | | | – | | | | – | | | | 5 | |
Net fair value losses | | | – | | | | (327 | ) | | | – | | | | (327 | ) |
Recognised in profit and loss in the year | | | 1 | | | | 343 | | | | – | | | | 344 | |
Tax on items taken directly to equity | | | – | | | | (5 | ) | | | – | | | | (5 | ) |
| |
At 1 April 2011 | | | (3 | ) | | | 107 | | | | 752 | | | | 856 | |
Gain on available-for-sale assets | | | 3 | | | | – | | | | – | | | | 3 | |
Net fair value losses | | | – | | | | (78 | ) | | | – | | | | (78 | ) |
Recognised in profit and loss in the year | | | – | | | | 181 | | | | – | | | | 181 | |
Tax on items taken directly to equity | | | – | | | | (11 | ) | | | – | | | | (11 | ) |
| |
At 31 March 2012 | | | – | | | | 199 | | | | 752 | | | | 951 | |
| |
| 13. | Related party transactions |
The company is a wholly owned subsidiary of BT Group Investments Limited, which is the immediate parent company. BT Group Investments Limited is a wholly owned subsidiary of the ultimate holding company and controlling entity, BT Group plc.
Copies of the ultimate holding company’s financial statements may be obtained from The Secretary, BT Group plc, 81 Newgate Street, London EC1A 7AJ.
The results of the company are included in the consolidated financial statements of BT Group plc. Consequently, the company is exempt under the terms of FRS 8, ‘Related Party Disclosures’, from disclosing details of transactions and balances with BT Group plc, fellow subsidiaries and associated undertakings, and other companies which are deemed to be under common control.
| 14. | Financial commitments and contingent liabilities |
| | | | | | | | |
| At 31 March | | 2012 £m | | | 2011 £m | |
| |
Contracts placed for capital expenditure not provided in the accounts | | | 422 | | | | 455 | |
| |
Operating lease payments payable within one year of the balance sheet date were in respect of leases expiring: | | | | | | | | |
Within one year | | | 21 | | | | 25 | |
Between one and five years | | | 78 | | | | 100 | |
After five years | | | 299 | | | | 337 | |
| |
Total payable within one year | | | 398 | | | | 462 | |
| |
Operating lease commitments were mainly in respect of land and buildings which arose from a sale and operating leaseback transaction in a prior period. Leases have an average term of 20 years (2011: 21 years) and rentals are fixed for an average of 20 years (2011: 21 years).
At 31 March 2012, other than as disclosed below, there were no contingent liabilities or guarantees other than those arising in the ordinary course of the group’s business and on these no material losses are anticipated. The group has insurance cover to certain limits for major risks on property and major claims in connection with legal liabilities arising in the course of its operations. Otherwise, the group generally carries its own risks.
The company has provided guarantees relating to certain leases entered into by Telefonica UK Limited prior to its demerger with O2 on 19 November 2001. mmO2 plc has given BT a counter indemnity for these guarantees. The maximum exposure was US$118m as at 31 March 2012 (2011: US$128m), approximately £74m (2011: £80m), although this could increase by a further US$228m (2011: US$268m), approximately £143m (2011: £167m), in the event of credit default in respect of amounts used to defease future lease obligations. The guarantee lasts until Telefonica UK Limited has discharged all its obligations, which is expected to be when the lease ends on 30 January 2017.
The company does not believe that there is any single current court action that would have a material adverse effect on the financial position or operations of the company. During 2012 the aggregate volume and value of legal actions to which the company is party remained broadly the same as at the end of 2011.
| | |
| 102 British Telecommunications plc Annual Report & Form 20-F 2012 | | Notes to the financial statements |
Background
The company has both defined benefit and defined contribution retirement benefit plans. The company’s main plans are in the UK and the largest by membership is the BT Pension Scheme (BTPS) which is a defined benefit plan that has been closed to new entrants since 31 March 2001. Subsequent to that date new entrants have been able to join a defined contribution plan, currently the BT Retirement Saving Scheme (BTRSS), a contract based defined contribution arrangement.
BTPS
Management of the scheme
BT Pension Scheme Trustees Limited (the Trustee) has been appointed by BT to administer and manage the scheme on behalf of the members in accordance with the terms of the Trust Deed of the scheme and relevant legislation. Under the terms of the BTPS Trust Deed there are nine Trustee directors all of whom are appointed by BT. The Chairman of the Trustee is appointed after consultation with and with the agreement of the relevant trade unions who are also responsible for nominating four directors to act as representatives of the members. Of the remaining four directors, two will normally hold senior positions within the group, and two will normally hold (or have held) senior positions in commerce or industry. Subject to there being an appropriately qualified candidate at least one of the Trustee directors should be a current pensioner or deferred pensioner of the BTPS. Trustee directors are appointed for a three-year term, but are then eligible for re-appointment.
Accounting under FRS 17
Profit and loss account
| | | | | | | | |
| Year ended 31 March | | 2012 £m | | | 2011 £m | |
| |
Current service cost – defined benefit plans | | | 256 | | | | 286 | |
– defined contribution plans | | | 85 | | | | 80 | |
| |
Total operating charge | | | 341 | | | | 366 | |
| |
Expected return on pension plan assets | | | (2,280 | ) | | | (2,239 | ) |
Interest expense on pension plan liabilities | | | 2,077 | | | | 2,315 | |
| |
Net finance (income) expense | | | (203 | ) | | | 76 | |
| |
Amount charged to profit before taxation | | | 138 | | | | 442 | |
| |
The total cost relating to defined benefit plans was £258m (2011: £289m) of which £2m (2011: £3m) has been recharged to subsidiary undertakings who are participating employers in the BTPS. The company retains the full liability for the BTPS.
The profit and loss account charge in respect of defined contribution schemes represents a fixed proportion of employees’ pay. The company has no exposure to investment and other experience risk.
Amounts recognised in equity shareholders’ funds
| | | | | | | | |
| Year ended 31 March | | 2012 £m | | | 2011 £m | |
| |
Actuarial gains (losses) at 1 April | | | 231 | | | | (4,895 | ) |
| |
Actuarial (losses) gains for the year: | | | | | | | | |
– arising on plan liabilities | | | (1,647 | ) | | | 4,914 | |
– arising on plan assets | | | (1,073 | ) | | | 212 | |
| |
Net actuarial (losses) gains recognised for the year in equity shareholders’ funds | | | (2,720 | ) | | | 5,126 | |
| |
Actuarial (losses) gains at 31 March | | | (2,489 | ) | | | 231 | |
| |
| | |
| Notes to the financial statements | | British Telecommunications plc Annual Report & Form 20-F 2012 103 |
| 15. | Retirement benefitscontinued |
The history of actuarial gains and losses analysed between amounts arising from changes in assumptions and experience gains and losses is set out below:
| | | | | | | | | | | | | | | | | | | | |
| At 31 March | | 2012 £m | | | 2011 £m | | | 2010 £m | | | 2009 £m | | | 2008 £m | |
| |
Present value of defined benefit obligation | | | (40,667 | ) | | | (38,754 | ) | | | (43,057 | ) | | | (33,108 | ) | | | (34,478) | |
Fair value of plan assets | | | 38,345 | | | | 37,034 | | | | 35,278 | | | | 29,227 | | | | 37,331 | |
| |
Net pension (obligation) asset | | | (2,322 | ) | | | (1,720 | ) | | | (7,779 | ) | | | (3,881 | ) | | | 2,853 | |
| |
Actuarial gain (loss) arising from assumptions used to value the defined benefit liabilitya | | | (1,007 | ) | | | 4,656 | | | | (11,102 | ) | | | 2,653 | | | | 5,214 | |
Actuarial gain (loss) arising from experience adjustments on defined benefit liabilityb | | | (640 | ) | | | 258 | | | | 1,632 | | | | (238 | ) | | | (22) | |
| |
Total actuarial gain (loss) arising on defined benefit liability | | | (1,647 | ) | | | 4,914 | | | | (9,470 | ) | | | 2,415 | | | | 5,192 | |
| |
Total actuarial gain or loss arising on defined benefit obligation as a percentage of the present value of the defined benefit obligation | | | 4.0% | | | | 12.7% | | | | 22.0% | | | | 7.3% | | | | 15.1% | |
Actuarial gain (loss) arising from experience adjustment on plan assetsc | | | (1,073 | ) | | | 212 | | | | 5,143 | | | | (9,440 | ) | | | (2,572) | |
Actuarial gain or loss arising from experience adjustment on plan assets as a percentage of the plan assets | | | 2.8% | | | | 0.6% | | | | 14.6% | | | | 32.3% | | | | 6.9% | |
| |
| a | The actuarial gain or loss on defined benefit liabilities arising from changes in the assumptions used to value those liabilities at the year end compared with the assumptions used at the prior year end. This includes both financial assumptions, which are based on market conditions at the year end, and demographic assumptions such as life expectancy. |
| b | The actuarial gain or loss arising from experience adjustments on the defined benefit liabilities represents the impact on the liabilities of differences between actual experience during the year compared with the assumptions made. Such differences might arise, for example, from members choosing different benefit options at retirement, actual salary increases being different from those assumed, or actual pension increases being higher than the long-term inflation assumption. |
| c | The actuarial gain or loss arising from experience adjustments on plan assets represents the difference between actual investment performance in the year and the expected rate of return on assets assumed at the start of the year. |
Balance sheet
The net pension obligation in respect of defined benefit plans reported in the balance sheet is set out below:
| | | | | | | | | | | | | | | | | | | | | | | | |
| | | | | | | | | 2012 | | | | | | | | | 2011 | |
| | | | | | | | |
| At 31 March | | Assets £m | | | Present value of liabilities £m | | | Deficit £m | | | Assets £m | | | Present value of liabilities £m | | | Deficit £m | |
| |
BTPS | | | 38,345 | | | | (40,628 | ) | | | (2,283 | ) | | | 37,034 | | | | (38,715 | ) | | | (1,681) | |
Other plansa | | | – | | | | (39 | ) | | | (39 | ) | | | – | | | | (39 | ) | | | (39) | |
| |
Total (deficit) asset | | | 38,345 | | | | (40,667 | ) | | | (2,322 | ) | | | 37,034 | | | | (38,754 | ) | | | (1,720) | |
Deferred tax asset | | | | | | | | | | | 557 | | | | | | | | | | | | 447 | |
| |
Net pension obligation | | | | | | | | | | | (1,765 | ) | | | | | | | | | | | (1,273) | |
| |
| a | Included in the present value of liabilities of other plans is £39m (2011: £39m) related to unfunded pension arrangements. |
£6m (2011: £6m) of contributions to defined contribution plans were outstanding at 31 March 2012 and are reported under other creditors on the balance sheet.
Movements in defined benefit plan assets and liabilities are shown below:
| | | | | | | | | | | | |
| | | Assets £m | | | Liabilities £m | | | Deficit £m | |
| |
At 1 April 2010 | | | 35,278 | | | | (43,057 | ) | | | (7,779) | |
Current service cost | | | – | | | | (289 | ) | | | (289) | |
Expected return on pension plan assetsa (interest expense on pension plan liabilities) | | | 2,239 | | | | (2,315 | ) | | | (76) | |
Actuarial gain (loss)a | | | 212 | | | | 4,914 | | | | 5,126 | |
Regular contributions by employer | | | 266 | | | | – | | | | 266 | |
Deficit contributions by employer | | | 1,030 | | | | – | | | | 1,030 | |
Contributions by employees | | | 14 | | | | (14 | ) | | | – | |
Benefits paid | | | (2,005 | ) | | | 2,007 | | | | 2 | |
| |
At 1 April 2011 | | | 37,034 | | | | (38,754 | ) | | | (1,720) | |
Current service cost | | | – | | | | (258 | ) | | | (258) | |
Expected return on pension plan assetsa (interest expense on pension plan liabilities) | | | 2,280 | | | | (2,077 | ) | | | 203 | |
Actuarial gain (loss)a | | | (1,073 | ) | | | (1,647 | ) | | | (2,720) | |
Regular contributions by employer | | | 171 | | | | – | | | | 171 | |
Deficit contributions by employer | | | 2,000 | | | | – | | | | 2,000 | |
Contributions by employees | | | 13 | | | | (13 | ) | | | – | |
Benefits paid | | | (2,080 | ) | | | 2,082 | | | | 2 | |
| |
At 31 March 2012 | | | 38,345 | | | | (40,667 | ) | | | (2,322) | |
| |
| a | Actual return on plan assets in the year was £1,207m (2011: £2,451m). |
| | |
| 104 British Telecommunications plc Annual Report & Form 20-F 2012 | | Notes to the financial statements |
| 15. | Retirement benefitscontinued |
BTPS assets
The expected long-term rate of return and fair values of the assets of the BTPS at 31 March 2012 are disclosed in note 19 of the consolidated financial statements.
The BTPS assets are invested in UK and non-UK equities, UK and overseas properties, fixed-interest and index-linked securities, alternative assets commodities, hedge funds, private equity, infrastructure and credit opportunities, deposits and short-term investments. At 31 March 2012 and 31 March 2011, the scheme’s assets did not include any ordinary shares of the ultimate parent company, BT Group plc. However, the scheme held £8m (2011: £7m) of index-linked bonds issued by the company and £nil (2011: £10m) of bonds.
BTPS liabilities
The present value of the obligation is derived from long-term cash flow projections and is thus inherently uncertain. The rate of inflation influences the assumptions for salary and pension increases.
Cash contributions to the BTPS
The company has made the following contributions to the BTPS:
| | | 0000000000 | | | | 0000000000 | |
Year ended 31 March | |
| 2012
£m |
| |
| 2011
£m |
|
| |
Ordinary contributions | | | 171 | | | | 266 | |
Deficit contributions | | | 2,000 | | | | 1,030 | |
| |
Total contributions in the year | | | 2,171 | | | | 1,296 | |
| |
The company expects to contribute approximately £550m to the BTPS in 2013, comprising ordinary contributions of £225m and deficit contributions of £325m. In 2012 ordinary contributions were lower due to a deduction to recover overpayments made in earlier years.
Details of the valuation methodology of scheme assets and liabilities, funding valuation and future funding obligations are disclosed in note 19 of the consolidated financial statements of British Telecommunications plc.
| 16. | Employees and directors |
The average number of persons employed by the company (including directors) during the year was:
| | | 0000000000 | | | | 0000000000 | |
Year ended 31 March | |
| 2012
000 |
| |
| 2011
000 |
|
| |
Average monthly number of employeesa | | | 71.7 | | | | 74.3 | |
| |
| | |
| The aggregate staff costs were as follows: | | | | | | | | |
Year ended 31 March | |
| 2012
£m |
| |
| 2011
£m |
|
| |
Wages and salaries | | | 2,876 | | | | 2,957 | |
Share-based payment | | | 64 | | | | 55 | |
Social security | | | 325 | | | | 325 | |
Other pension costs | | | 341 | | | | 366 | |
| |
| | | 3,606 | | | | 3,703 | |
| |
| a | Includes an average of 53 non-UK employees (2011: 51 employees). |
| 17. | Directors’ remuneration |
Information covering directors’ remuneration, interests in shares and share options of the ultimate parent, BT Group plc, and pension benefits is included in note 27 to the consolidated financial statements of BT plc.
| | |
| Notes to the financial statements | | British Telecommunications plc Annual Report & Form 20-F 2012 105 |
The majority of the company’s long-term listed bonds have been, and are, subject to fixed Sterling interest rates after applying the impact of hedging instruments. Outstanding currency and interest rate swaps at 31 March 2012 are detailed in the ‘Hedging activities’ and ‘Other derivatives’ sections below.
The company also uses financial instruments to hedge some of its currency exposures arising from its short-term investment funds, assets, liabilities and forward purchase commitments. The financial instruments used comprise forward currency contracts.
The company does not hold or issue derivative financial instruments for trading purposes. All transactions in derivative financial instruments are undertaken to manage the risks arising from underlying business activities.
Hedging activities
The company had outstanding hedging activities as at 31 March 2012 as follows:
| | | | | | | | | | | | | | | | | | | | | | | | | | |
| Hedged item | | Hedging instruments | | Hedge type | | Notional
principal
£m | | | Derivative fair value b | | | Remaining term of hedging instruments | | | Weighted average interest rate on hedging instruments | | Period over
which forecast transaction arises | |
| | | | | | | |
| | | | | | | |
| | | | |
| Asset
£m |
| |
| Liability
£m |
| | | |
| |
Euro and US Dollar | | Interest rate swaps | | Cash flow | | | 1,014 | | | | – | | | | 451 | | | | 19 years | | | Sterling receivable at 1.4% | | | | |
denominated borrowingsa | | | | | | | | | | | | | | | | | | | | | | Sterling payable at 6.0% | | | | |
| | Cross-currency swaps | | Cash flow | | | 5,451 | | | | 769 | | | | 59 | | | | 1 to 19 years | | | Euro receivable at 5.8% | | | | |
| | | | | | | | | | | | | | | | | | | | | | US Dollar receivable at 7.3% | | | | |
| | | | | | | | | | | | | | | | | | | | | | Sterling payable at 6.2% | | | | |
Sterling denominated borrowingsa | | Interest rate swaps | | Fair value | | | 500 | | | | 82 | | | | – | | | | 17 years | | | Sterling receivable at 5.8% Sterling payable at 2.9% | | | | |
Euro and US Dollar step up interest on currency denominated borrowingsa | | Forward currency contracts | | Cash flow | | | 189 | | | | – | | | | 5 | | | | 3 months | | | | |
| 19
years |
|
Currency exposures on overseas purchases principally | | Forward currency contracts | | Cash flow | | | 93 | | | | – | | | | 1 | | |
| 1 month
rolling basis |
| | | |
| 12
months |
|
US Dollar and Asia Pacific currencies | | | | | | | | | | | | | | | | | | | | | | | | | | |
Purchase of US Dollar denominated retail devices | | Forward currency contracts | | Cash flow | | | 176 | | | | – | | | | 2 | | |
| 1 to 6
months |
| | | | | | |
| |
Total | | | | | | | | | | | 851 | | | | 518 | | | | | | | | | | | |
| |
a See note 7. b See note 3. | | | | | | | | | | | | | | | | | | | | | | | | | | |
| |
| The company had outstanding hedging activities as at 31 March 2011 as follows: | | | | |
| Hedged item | | Hedging instruments | | Hedge type | | Notional
principal
£m | | | Derivative fair value b | | | Remaining term of hedging instruments | | | Weighted average interest rate on hedging instruments | | Period over
which forecast transaction
arises | |
| | | | | | | |
| | | | | | | |
| | | | |
| Asset
£m |
| |
| Liability
£m |
| | | |
| |
Euro and US Dollar | | Interest rate swaps | | Cash flow | | | 1,014 | | | | – | | | | 265 | | | | 20 years | | | Sterling receivable at 1.0% | | | | |
denominated borrowingsa | | | | | | | | | | | | | | | | | | | | | | Sterling payable at 6.0% | | | | |
| | Cross currency swaps | | Cash flow | | | 5,451 | | | | 622 | | | | 29 | | | | 2 to 20 years | | | Euro receivable at 5.8% | | | | |
| | | | | | | | | | | | | | | | | | | | | | US Dollar receivable at 7.3% | | | | |
| | | | | | | | | | | | | | | | | | | | | | Sterling payable at 6.2% | | | | |
Sterling denominated borrowingsa | | Interest rate swaps | | Fair value | | | 500 | | | | 4 | | | | 2 | | | | 18 years | | | Sterling receivable at 5.8% Sterling payable at 2.6% | | | | |
Euro and US Dollar step up interest on currency denominated borrowingsa | | Forward currency contracts | | Cash flow | | | 245 | | | | 1 | | | | 4 | | | | 3 months | | | | |
| 20
years |
|
Currency exposures on overseas purchases principally US Dollar and Asia Pacific currencies | | Forward currency contracts | | Cash flow | | | 3 | | | | – | | | | – | | |
| 1 month
rolling basis |
| | | |
| 12
months |
|
Purchase of US Dollar denominated retail devices | | Forward currency contracts | | Cash flow | | | 213 | | | | 2 | | | | 2 | | |
| 1 to 6
months |
| | | | | | |
| |
Total | | | | | | | | | | | 629 | | | | 302 | | | | | | | | | | | |
| |
a See note 7. b See note 3. | | | | | | | | | | | | | | | | | | | | | | | | | | |
| | |
| 106 British Telecommunications plc Annual Report & Form 20-F 2012 | | Notes to the financial statements |
Other derivatives
At 31 March 2012, the company held certain foreign currency forward and interest rate swap contracts which were not in hedging relationships in accordance with FRS 26. Foreign currency forward contracts were economically hedging operational purchases and sales. The interest rate swap contracts were hedging the group’s bond portfolio but became ineffective on first adoption of FRS 26. The volatility arising from these swaps is recognised through the profit and loss account but is limited due to a natural offset in their valuation movements.
The table below shows features of these derivatives at 31 March 2012 and 2011.
| | | | | | | | | | | | | | | | | | | | | | |
| | | | | 2012 | |
| | | |
| | | | | | | | | | | | | | Remaining | | | | |
| | | | | Notional | | | Derivative fair valuea | | | term of | | | Weighted | |
| | | | | principal | | | Asset | | | Liability | | | derivatives | | | average | |
| At 31 March | | | | £m | | | £m | | | £m | | | | | | % | |
| |
Foreign currency forward contracts | | | | | 939 | | | | 1 | | | | 6 | | | | 7 months | | | | | |
Interest rate swaps | | | | | 1,887 | | | | 171 | | | | 322 | | | | 2 to 19 years | | | | Sterling receivable at 4.5% | |
| | | | | | | | | | | | | | | | | | | | | Sterling payable at 6.1% | |
| |
Total | | | | | | | | | 172 | | | | 328 | | | | | | | | | |
| |
a See note 3. | | | | | | | | | | | | | | | | | | | | | | |
| | |
| | | | | 2011 | |
| | | |
| | | | | | | | | | | | | | Remaining | | | | |
| | | | | Notional | | | Derivative fair valuea | | | term of | | | Weighted | |
| | | | | principal | | | Asset | | | Liability | | | derivatives | | | average | |
| At 31 March | | | | £m | | | £m | | | £m | | | | | | % | |
| |
Foreign currency forward contracts | | | | | 534 | | | | 5 | | | | – | | | | 2 months | | | | | |
Interest rate swaps | | | | | 1,887 | | | | 99 | | | | 267 | | | | 3 to 20 years | | | | Sterling receivable at 4.3% | |
| | | | | | | | | | | | | | | | | | | | | Sterling payable at 5.9% | |
| |
Total | | | | | | | | | 104 | | | | 267 | | | | | | | | | |
| |
Fair value of financial instruments
The following table discloses the carrying amounts and fair values of all of the company’s financial instruments which are not carried at an amount which approximates to its fair value on the balance sheet at 31 March 2012 and 2011. The carrying amounts are included in the company balance sheet under the indicated headings. The fair values of listed investments were estimated based on quoted market prices for those investments. The carrying value of floating rate investments approximated to their fair values due to the frequent reset of interest rates to market rates. The carrying amount of the short-term deposits and investments approximated to their fair values due to the short maturity of the investments held. The carrying amount of trade receivables and payables approximated to their fair values due to the short maturity of the amounts receivable and payable. The fair value of the company’s bonds, finance leases and other long-term borrowings has been estimated on the basis of quoted market prices for the same or similar issues with the same maturities where they existed, and on calculations of the present value of future cash flows using the appropriate discount rates in effect at the balance sheet dates, where market prices of similar issues did not exist. The carrying value of floating rate borrowings approximated to their fair values due to the frequent reset of interest rates to market rates. The fair value of the company’s outstanding swaps and foreign exchange contracts were the estimated amounts, calculated using discounted cash flow models that the company would receive or pay in order to terminate such contracts in an arms length transaction taking into account market rates of interest and foreign exchange of the balance sheet date.
| | | Carrying amount | | | | Carrying amount | | | | Carrying amount | | | | Carrying amount | |
| | | Carrying amount | | | Fair value | |
| | | | | | | | |
| | | 2012 £m | | | 2011 £m | | | 2012 £m | | | 2011 £m | |
| |
Non-derivatives: | | | | | | | | | | | | | | | | |
Financial liabilities | | | | | | | | | | | | | | | | |
Listed bonds | | | 8,936 | | | | 9,028 | | | | 10,594 | | | | 10,274 | |
Finance leases | | | 285 | | | | 368 | | | | 328 | | | | 413 | |
Other loans and borrowings | | | 45,950 | | | | 46,469 | | | | 45,950 | | | | 46,592 | |
| |
Information relating to fees for audit services paid or payable to the company’s auditor, PricewaterhouseCoopers LLP, is included in note 8 to the consolidated financial statements of BT plc.
| | |
| Notes to the financial statements | | British Telecommunications plc Annual Report & Form 20-F 2012 107 |
SUBSIDIARY UNDERTAKINGS AND ASSOCIATE
The table below gives brief details of the group’s principala operating subsidiariesb and associate at 31 March 2012. All subsidiaries are unlisted, unless otherwise stated. No subsidiaries are excluded from the group consolidation.
| | | | | | |
| Subsidiary undertakings | | Activity | | Group interest in allotted capitalc | | Country of operationsd |
|
BT Americas Incd,e,g | | Communications related services, systems integration and products provider | | 100% common | | International |
|
BT Australasia Pty Limitede | | Communications related services and products provider | | 100% ordinary 100% preference | | Australia |
|
BT Business Direct Limitede | | Technology equipment retailer | | 100% ordinary | | UK |
|
BT Communications do Brasil Limitadab,e | | Communications related services, technology consulting and products provider | | 100% common | | Brazil |
|
BT Communications Ireland Limitede | | Telecommunications service provider | | 100% ordinary | | Republic of Ireland |
|
BT Conferencing Ince | | Audio, video and web collaboration service provider | | 100% common | | US |
|
BT Conferencing Video Ince | | Audio, video and web collaboration service provider | | 100% common | | US |
|
BT Convergent Solutions Limitede | | Communications related services and products provider | | 100% ordinary | | UK |
|
BT Engage IT Limitede | | IT solutions provider | | 100% ordinary | | UK |
|
BT ESPANA, Compania de Servicios Globales de Telecommunicaciones, SAe | | Communications related services and products provider | | 100% ordinary | | Spain |
|
BT Fleet Limited | | Fleet management company | | 100% ordinary | | UK |
|
BT France SAe | | Communications related services, systems integration and products provider | | 100% ordinary | | France |
|
BT (Germany) GmbH & Co. oHGe,f | | Communications related services and products provider | | 100% ordinary | | Germany |
|
BT Global Communications India Private Limitede | | Communications related services | | 100% ordinary | | India |
|
BT Global Services Limitede | | International telecommunications network systems provider | | 100% ordinary | | UK |
|
BT Holdings Limited | | Investment holding company | | 100% ordinary | | UK |
|
BT Hong Kong Limitede | | Communications related services and products provider | | 100% ordinary 100% preference | | Hong Kong |
|
BT LatAm Brasil Ltdab,e | | Data communication services | | 100% common | | Brazil |
|
BT Italia SpAe | | Communications related services and products provider | | 98.6% ordinary | | Italy |
|
BT Limitede | | International telecommunications network systems provider | | 100% ordinary | | International |
|
BT Managed Services Limited | | Communications related services and products provider | | 100% ordinary | | UK |
|
BT Nederland NV | | Communications related services and products provider | | 100% ordinary | | Netherlands |
|
BT Payment Services Limited | | Payment services provider | | 100% ordinary | | UK |
|
BT Services SAe | | Technology consulting and engineering services | | 100% ordinary | | France |
|
BT Singapore Pte Ltde | | Communications related services and products provider | | 100% ordinary | | Singapore |
|
BT Switzerland AGe | | Communications related services and products provider | | 100% ordinary | | Switzerland |
|
Communications Global Network Services Limitedd,e | | Communications related services and products provider | | 100% ordinary | | International |
|
Communications Networking Services (UK)e | | Communications related services and products provider | | 100% ordinary | | UK |
|
dabs.com plc | | Technology equipment retailer | | 100% ordinary | | UK |
|
Infonet Services Corporatione | | Global managed network service provider | | 100% common | | US |
|
Plusnet plc | | Broadband service provider | | 100% ordinary | | UK |
|
Radianz Americas Ince | | Global managed network service provider | | 100% common 100% preference | | US |
|
| a | The group comprises a large number of entities and it is not practical to include all of them in this list. The list therefore includes only those entities that have a significant impact on the revenue, profit or assets of the group. A full list of subsidiaries, joint ventures and associates will be annexed to the company’s next annual return filed with the Registrar of Companies. |
| b | The principal operating subsidiaries (listed above) have a reporting date of 31 March, except for entities domiciled in Brazil, due to regulatory requirements. |
| c | The proportion of voting rights held corresponds to the aggregate interest percentage held by the holding company and subsidiary undertakings. |
| d | All overseas undertakings are incorporated in their country of operations. Subsidiary undertakings operating internationally are all incorporated in England and Wales, except BT Americas Inc and Communications Global Network Services Limited which are incorporated in the US and Bermuda respectively. |
| e | Held through intermediate holding company. |
| f | BT (Germany) GmbH & Co. oHG is making use of disclosure exemptions under the German Commercial Code paragraph 264. |
| g | On 31 March 2012 BT INS Inc merged with BT Americas Inc. |
Note:
British Telecommunications plc is the General Partner of BT Investment Capital LP. BT Investment Capital LP is dealt with in the consolidated financial statements of British Telecommunications plc, which are prepared and audited in accordance with International Accounting Standards. Advantage has been taken of the exemption conferred by Regulation 7 of the Partnerships (Accounts) Regulations 2008 (SI 2008/569) in respect of appending a copy of the accounts of BT Investment Capital LP to these financial statements.
| | | | | | | | | | | | | | | | |
| | | | | | | Share capital | | | Country of incorporation and of operations | |
| | | | | | |
| | | | | | | | | | Percentage | | |
| Associate | | Activity | | | | Issuedh | | | ownedi | | |
| |
Tech Mahindra Limited | | Global systems integrator and business transformation consultancy provider | | | 127,486,541 | | | | 23.18% | | | | India | |
| |
| h | Issued share capital comprises ordinary or common shares, unless otherwise stated. |
| i | Held partly through an intermediate holding company. |
| | |
| 108 British Telecommunications plc Annual Report & Form 20-F 2012 | | Subsidiary undertakings and associate |
ADDITIONAL INFORMATION FOR SHAREHOLDERS
Cautionary statement regarding forward-looking statements
Certain statements in this annual report are forward-looking and are made in reliance on the safe harbour provisions of the US Private Securities Litigation Reform Act of 1995. These statements relate to analyses and other information which are based on forecasts of future results and estimates of amounts not yet determinable. These statements include, without limitation, those concerning: outlook; revenue growth and trends; EBITDA; free cash flow; net debt; credit ratings; operating cost reductions; BT Global Services’ EBITDA, restructuring costs, operating cash flow and revenue growth in higher growth economies; investment in and roll-out of our fibre network, and its reach, innovations, increased speeds and speed availability; our broadband service and strategy; the BT Pension Scheme recovery plan, operating charge, regular contributions and interest; capital expenditure; effective tax rate; growth opportunities in networked IT services, the pay-TV services market, broadband and mobility; enhancing our IP-enabled TV service; growth of, and opportunities available in, the communications industry and BT’s positioning to take advantage of those opportunities; expectations regarding competition, market shares, prices and growth; expectations regarding the convergence of technologies; plans for the launch of new products and services; network performance and quality; the impact of regulatory initiatives, decisions and outcomes on operations, including the regulation of the UK fixed wholesale and retail businesses and the impact of the Undertakings to Ofcom under the Enterprise Act; BT’s possible or assumed future results of operations and/or those of its associates and joint ventures; capital expenditure and investment plans; adequacy of capital; financing plans and refinancing requirements; demand for and access to broadband and the promotion of broadband by third-party service providers; and those preceded by, followed by, or that include the words ‘aims’, ‘believes’, ‘expects’, ‘anticipates’, ‘intends’, ‘will’, ‘should’ or similar expressions.
Although BT believes that the expectations reflected in these forward-looking statements are reasonable, it can give no assurance that these expectations will prove to have been correct. Because these statements involve risks and uncertainties, actual results may differ materially from those expressed or implied by these forward-looking statements. Factors that could cause differences between actual results and those implied by the forward-looking statements include, but are not limited to: material adverse changes in economic conditions in the markets served by BT; future regulatory actions and conditions in its operating areas, including competition from others; selection by BT of the appropriate trading and marketing models for its products and services; technological innovations, including the cost of developing new products, networks and solutions and the need to increase expenditures for improving the quality of service; the anticipated benefits and advantages of new technologies, products and services not being realised; developments in the convergence of technologies; prolonged adverse weather conditions resulting in a material increase in overtime, staff or other costs; the timing of entry and profitability of BT in certain communications markets; significant changes in market shares for BT and its principal products and services; fluctuations in foreign currency exchange rates and interest rates; the underlying assumptions and estimates made in respect of major contracts proving unreliable; the aims of the BT Global Services’ restructuring programme not being achieved; and general financial market conditions affecting BT’s performance and ability to raise finance. Certain of these factors are discussed in more detail elsewhere in this annual report including, without limitation, inOur riskson pages 15 to 18. BT undertakes no obligation to update any forward-looking statements whether as a result of new information, future events or otherwise.
Background
Telephone services in almost all of the UK were, until 1981, provided by the Post Office, which was a government department until 1969 when it was established as a state public corporation. In 1981, the postal and telecommunications services of the Post Office became the responsibility of two separate corporations, with British Telecommunications – under the trading name of British Telecom – taking over the telecommunications business.
British Telecommunications plc, the successor to the statutory corporation British Telecommunications, was incorporated in England and Wales on 1 April 1984 as a public limited company, wholly owned by the UK Government, as a result of the Telecommunications Act 1984. Between November 1984 and July 1993, the UK Government sold all of its shareholding in three public offerings.
BT Group was formed when the O2 business, comprising what had been BT’s mobile activities in the UK, the Netherlands, Germany and the Republic of Ireland, was demerged on 19 November 2001. British Telecommunications plc shares ceased trading on the London, New York and Tokyo stock exchanges on 16 November 2001. BT Group’s shares commenced trading on the London and New York stock exchanges on 19 November 2001. As a result of the transaction BT plc became a wholly-owned subsidiary of BT Group Investments Limited (BTGI), itself wholly owned by BT Group plc. Accordingly, the ordinary shares of BT plc were de-listed from the London Stock Exchange on 19 November 2001.
The registered office address of BT is 81 Newgate Street, London EC1A 7AJ. The company’s agent in the US is Richard Nohe, 620 Eighth Avenue, New York, NY 10018, US.
| | |
| Additional information for shareholders | | British Telecommunications plc Annual Report & Form 20-F 2012 109 |
Bonds prices
On 5 December 2000 BT issued four series of bonds comprising US$2.8bn 8.625% bonds due 2030 (the thirty-year 2000 Bonds), US$3.0bn 8.125% bonds due 2011 (the ten-year 2000 Bonds), US$3.1bn 7.625% bonds due 2005 (the five-year 2000 Bonds) and US$1.1bn floating rate bonds due 2003 (the three-year 2000 Bonds, and, together with the thirty-year 2000 Bonds, the ten-year 2000 Bonds and the five-year 2000 Bonds, the 2000 Bonds). The three-year 2000 Bonds were redeemed at par on 15 December 2003, the five-year 2000 Bonds were redeemed at par on 15 December 2005 and the ten-year 2000 Bonds were redeemed at par on 15 December 2011. On 5 December 2007, BT issued two series of bonds comprising US$600,000,000 5.15% senior bonds due 2013 (the five-year 2007 Bonds) and US$600,000,000 5.95% senior bonds due 2018 (the ten-year 2007 Bonds and, together with the five-year 2007 Bonds, the 2007 Bonds). On 19 March 2008, BT issued two series of bonds comprising US$250,000,000 5.15% senior bonds due 2013 (the five-year 2008 Bonds) and US$500,000,000 5.95% senior bonds due 2018 (the ten-year 2008 Bonds and, together with the five-year 2008 Bonds, the 2008 Bonds).
The high and low prices for the outstanding 2000 Bonds since 31 March 2005 as determined by indications or reports supplied by Bloomberg were as follows:
| | | | | | | | |
| | | Thirty-year 2000 Bonds | |
| | | High | | | Low | |
Year ended 31 March 2006 | | | 141.95 | | | | 127.65 | |
| | |
Year ended 31 March 2007 | | | 141.83 | | | | 120.97 | |
| | |
Year ended 31 March 2008 | | | 140.17 | | | | 121.62 | |
| | |
Year ended 31 March 2009 | | | 129.73 | | | | 83.15 | |
| | |
Year ended 31 March 2010 | | | 130.78 | | | | 91.54 | |
| | |
Year ended 31 March 2011 | | | | | | | | |
First quarter | | | 133.22 | | | | 119.55 | |
Second quarter | | | 140.53 | | | | 121.13 | |
Third quarter | | | 141.67 | | | | 131.49 | |
Fourth quarter | | | 141.01 | | | | 131.35 | |
Full period | | | 141.67 | | | | 119.55 | |
| | |
Year ended 31 March 2012 | | | | | | | | |
First quarter | | | 144.05 | | | | 137.70 | |
Second quarter | | | 151.11 | | | | 138.39 | |
Third quarter | | | 148.71 | | | | 140.19 | |
Fourth quarter | | | 153.24 | | | | 141.16 | |
Full period | | | 153.24 | | | | 137.70 | |
| | |
Last six months | | | | | | | | |
November 2011 | | | 148.71 | | | | 140.91 | |
December 2011 | | | 143.35 | | | | 140.19 | |
January 2012 | | | 149.51 | | | | 141.16 | |
February 2012 | | | 153.24 | | | | 147.70 | |
March 2012 | | | 152.26 | | | | 146.74 | |
April 2012 | | | 150.88 | | | | 147.29 | |
| | |
| 110 British Telecommunications plc Annual Report & Form 20-F 2012 | | Additional information for shareholders |
Bonds pricescontinued
The high and low prices for the outstanding 2007 Bonds and 2008 Bonds since issue as determined by indications or reports supplied by Bloomberg were as follows:
| | | 00000000000 | | | | 00000000000 | | | | 00000000000 | | | | 00000000000 | | | | 00000000000 | | | | 00000000000 | | | | 00000000000 | | | | 00000000000 | |
| | | Five-year 2007 Bonds | | | Ten-year 2007 Bonds | | | Five-year 2008 Bonds | | | Ten-year 2008 Bonds | |
| | | High | | | Low | | | High | | | Low | | | High | | | Low | | | High | | | Low | |
Year ended 31 March 2008 | | | 103.04 | | | | 97.72 | | | | 104.13 | | | | 95.49 | | | | 103.04 | | | | 97.72 | | | | 104.13 | | | | 95.49 | |
| | | | | | | | |
Year ended 31 March 2009 | | | 100.37 | | | | 86.40 | | | | 100.22 | | | | 78.68 | | | | 100.37 | | | | 86.40 | | | | 100.22 | | | | 78.68 | |
| | | | | | | | |
Year ended 31 March 2010 | | | 106.30 | | | | 92.33 | | | | 104.11 | | | | 80.52 | | | | 106.30 | | | | 92.33 | | | | 104.11 | | | | 80.52 | |
| | | | | | | | |
Year ended 31 March 2011 | | | | | | | | | | | | | | | | | | | | | | | | | | | | | | | | |
First quarter | | | 106.10 | | | | 104.20 | | | | 106.53 | | | | 101.72 | | | | 106.10 | | | | 104.20 | | | | 106.53 | | | | 101.72 | |
Second quarter | | | 106.76 | | | | 104.69 | | | | 111.28 | | | | 103.63 | | | | 106.76 | | | | 104.69 | | | | 111.28 | | | | 103.63 | |
Third quarter | | | 107.54 | | | | 105.83 | | | | 113.21 | | | | 108.04 | | | | 107.54 | | | | 105.83 | | | | 113.21 | | | | 108.04 | |
Fourth quarter | | | 106.78 | | | | 106.05 | | | | 111.93 | | | | 108.38 | | | | 106.78 | | | | 106.05 | | | | 111.93 | | | | 108.38 | |
Full period | | | 107.54 | | | | 104.20 | | | | 113.21 | | | | 101.72 | | | | 107.54 | | | | 104.20 | | | | 113.21 | | | | 101.72 | |
| | | | | | | | |
Year ended 31 March 2012 | | | | | | | | | | | | | | | | | | | | | | | | | | | | | | | | |
First quarter | | | 106.47 | | | | 105.97 | | | | 112.81 | | | | 109.68 | | | | 106.47 | | | | 105.97 | | | | 112.81 | | | | 109.68 | |
Second quarter | | | 105.99 | | | | 104.70 | | | | 115.85 | | | | 110.17 | | | | 105.99 | | | | 104.70 | | | | 115.85 | | | | 110.17 | |
Third quarter | | | 104.71 | | | | 103.46 | | | | 111.95 | | | | 108.53 | | | | 104.71 | | | | 103.46 | | | | 111.95 | | | | 108.53 | |
Fourth quarter | | | 103.75 | | | | 103.33 | | | | 116.78 | | | | 110.06 | | | | 103.75 | | | | 103.33 | | | | 116.78 | | | | 110.06 | |
Full period | | | 106.47 | | | | 103.33 | | | | 116.78 | | | | 108.53 | | | | 106.47 | | | | 103.33 | | | | 116.78 | | | | 108.53 | |
| | | | | | | | |
Last six months | | | | | | | | | | | | | | | | | | | | | | | | | | | | | | | | |
November 2011 | | | 104.58 | | | | 103.96 | | | | 111.95 | | | | 108.53 | | | | 104.58 | | | | 103.96 | | | | 111.95 | | | | 108.53 | |
December 2011 | | | 103.93 | | | | 103.46 | | | | 110.31 | | | | 108.60 | | | | 103.93 | | | | 103.46 | | | | 110.31 | | | | 108.60 | |
January 2012 | | | 103.72 | | | | 103.33 | | | | 114.66 | | | | 110.06 | | | | 103.72 | | | | 103.33 | | | | 114.66 | | | | 110.06 | |
February 2012 | | | 103.75 | | | | 103.53 | | | | 116.24 | | | | 114.59 | | | | 103.75 | | | | 103.53 | | | | 116.24 | | | | 114.59 | |
March 2012 | | | 103.73 | | | | 103.37 | | | | 116.78 | | | | 114.87 | | | | 103.73 | | | | 103.37 | | | | 116.78 | | | | 114.87 | |
April 2012 | | | 103.38 | | | | 103.00 | | | | 117.08 | | | | 115.86 | | | | 103.38 | | | | 103.00 | | | | 117.08 | | | | 115.86 | |
| | |
| Additional information for shareholders | | British Telecommunications plc Annual Report & Form 20-F 2012 111 |
Articles of Association (Articles)
The following is a summary of the principal provisions of BT’s Articles, a copy of which has been filed with the Registrar of Companies. New Articles of Association were adopted on 5 August 2010, largely to take account of changes in UK company law brought about by the Companies Act 2006 (2006 Act). Under the 2006 Act, the Memorandum of Association serves a more limited role as historical evidence of the formation of the company. Since August 2010, the provisions in relation to objects in BT’s Memorandum are deemed to form part of BT’s Articles, and have been deleted from those Articles because of shareholders passing a resolution to this effect. Under the 2006 Act, BT’s objects are unrestricted.
Articles
In the following description of the rights attaching to the shares in the company, a ‘holder of shares’ and a ‘member’ is, in either case, the person registered in the company’s register of members as the holder of the relevant shares.
Subject to certain restrictions, on a show of hands, every member present in person or by proxy at any general meeting has one vote and, on a poll, every member present in person or by proxy has one vote for each share which they hold.
Voting at any meeting of members is by a show of hands unless a poll is demanded by the chairman of the meeting or by any member at the meeting who is entitled to vote (or the member’s proxy).
The company may by ordinary resolution:
| | (i) | consolidate, or consolidate and then divide, all or any of its share capital into shares of a larger amount than its existing shares; |
| | (ii) | divide its shares, or any of them, into shares of a smaller amount and the resolution may decide that, as between the shares resulting from the division, any of them may have any preference or advantage as compared with the others. |
The company may also:
| | (i) | buy back its own shares; and |
| | (ii) | by special resolution reduce its share capital, any capital redemption reserve and any share premium account. |
The company’s members can declare dividends by passing an ordinary resolution, in addition to the powers of the Board, but no dividend can exceed the amount recommended by the Board. Dividends must be paid out of profits available for distribution. If the directors consider that the profits of the company justify such payments, they can pay interim and final dividends. Fixed dividends will be paid on any class of share on the dates stated for the payments of those dividends.
Any dividend which has not been claimed for 10 years after it was declared or became due for payment will be forfeited and belong to the company again unless the directors decide otherwise.
| (d) | Distribution of assets on winding up |
If the company is wound up (whether the liquidation is voluntary, under supervision of a court or by a court) the liquidator can, with the authority of a special resolution passed by the members, divide among the members all or any part of the assets of the company. This applies whether the assets consist of property of one kind or different kinds. For this purpose, the liquidator can place whatever value the liquidator considers fair on any property and decide how the division is carried out between members or different groups of members. The liquidator can also, with the same authority, transfer any assets to trustees upon trusts for the benefit of members which the liquidator decides. The liquidation of the company can then be finalised and the company dissolved. No past or present members can be compelled to accept any shares or other property under BT’s Articles which could give them a liability.
Shares of the company may only be transferred in writing and either in the usual form or another form approved by the Board. A transfer form must be signed or made effective in some other way, by or on behalf of the person making the transfer and, unless the share is fully paid, by or on behalf of the person to whom the shares are being transferred.
The Board can decide to call general meetings. If there are not enough directors in the UK to call a general meeting, any director or member may call a general meeting.
| (g) | Limitations on rights of non-resident or foreign shareholders |
There are no limitations on the rights of non-resident or foreign shareholders.
The directors are entitled to the remuneration set by the company by an ordinary resolution. The directors may be paid their expenses properly incurred in connection with the business of the company.
The directors can decide whether to provide pensions, annual payments or other allowances or benefits to any people including people who are or were directors of the company. The Board can decide to extend these arrangements to relations or dependants of, or people connected to these people. The Board can also decide to contribute to a scheme or fund or to pay premiums to a third party for these purposes. However, the company can only provide pension and other similar benefits to any director or former director who has not been employed by or held any other office or executive position, in BT Group plc or any of its subsidiary undertakings, including the company, or to relations or dependants of, or people connected to, those directors or former directors, if the members approve this by passing an ordinary resolution.
| | |
| 112 British Telecommunications plc Annual Report & Form 20-F 2012 | | Additional information for shareholders |
Articlescontinued
A director need not be a member, but a director who is not a member can still attend and speak at members’ meetings. Unless BT’s Articles say otherwise, a director cannot vote on a resolution about a contract in which the director has an interest (this will also apply to interests of a person connected with the director).
If the legislation allows, a director can vote and be counted in the quorum on a resolution concerning a contract:
| | (I) | in which the director has an interest of which the director is not aware; or which cannot reasonably be regarded as likely to give rise to a conflict of interest; |
| | (II) | in which the director has an interest only because the director is a holder of shares, debentures or other securities of BT, or by reason of any other interest in or through BT; |
| | (III) | which involves the giving of any security, guarantee or indemnity to the director or any other person for: money lent or obligations incurred by the director or by any other person at the request of or for the benefit of BT or the benefit of any of its subsidiary undertakings; or a debt or other obligation which is owed by BT or any of its subsidiary undertakings to that other person if the director has taken responsibility for all or any part of that debt or obligation by giving a guarantee, security or indemnity; |
| | (IV) | where BT or any of its subsidiary undertakings is offering any shares, debentures or other securities for subscription or purchase to which the director is or may be entitled to participate as a holder of BT or BT Group plc securities; or where the director will be involved in the underwriting or sub-underwriting; |
| | (V) | relating to any other company in which the director has an interest, directly or indirectly (including holding a position in that company) or is a shareholder, creditor, employee or otherwise involved in that company. These rights do not apply if the director owns 1% or more of that company or of the voting rights in that company; |
| | (VI) | relating to an arrangement for the benefit of BT employees or former employees of BT or any of BT’s subsidiary undertakings which only gives the directors the same benefits that are generally given to the employees or former employees to whom the arrangement relates; |
| | (VII) | relating to BT buying or renewing insurance for any liability for the benefit of directors or for the benefit of persons who include directors; (VIII) relating to the giving of indemnities in favour of directors; |
| | (IX) | relating to the funding of expenditure by any director or directors: on defending criminal, civil or regulatory proceedings or actions against the director or the directors; in connection with an application to the court for relief; or on defending the director or the directors in any regulatory investigations; or which enables any director or directors to avoid incurring expenditure as described in this paragraph; and |
| | (X) | in which the director’s interest, or the interest of directors generally, has been authorised by an ordinary resolution. |
Subject to the relevant legislation, the members can by passing an ordinary resolution ratify any particular contract or arrangement carried out in breach of those provisions.
| (j) | Retirement of directors |
No person will be prevented from being or becoming a director simply because that person has reached the age of 70.
| (k) | Directors’ borrowing powers |
To the extent that the legislation and BT’s Articles allow, the Board may exercise all the powers of the company to borrow money, to mortgage or charge its business, property and assets (present and future) and to issue debentures and other securities, and give security either outright or as collateral security for any debt, liability or obligation of the company or another person.
Further note on certain activities
During 2012, certain of the group’s non-US subsidiaries or other non-US entities conducted limited activities in, or with persons from, certain countries identified by the US Department of State as State Sponsors of Terrorism or otherwise subject to US sanctions. These activities, which generally relate to the provision of communications services to embassies and diplomatic missions of US-allied governments, other CPs, news organisations, multinational corporations and other customers that require global communications connectivity, are insignificant to the group’s financial condition and results of operations.
Limitations affecting security holders
There are no limitations under the laws of the United Kingdom restricting the right of non-residents to hold or to vote shares in the company.
Documents on display
All reports and other information that BT files with the US Securities and Exchange Commission (SEC) may be inspected at the SEC’s public reference facilities at Room 1580, 100 F Street, NE Washington, DC, 20549, US. These reports may be accessed via the SEC’s website at www.sec.gov.
| | |
| Additional information for shareholders | | British Telecommunications plc Annual Report & Form 20-F 2012 113 |
CROSS REFERENCE TO FORM 20-F
The information in this document that is referred to in the following table shall be deemed to be filed with the Securities and Exchange Commission for all purposes:
| | | | | | |
| Required Item in Form 20-F | | Where information can be found in this Annual Report | | |
| | | |
| Item | | | | Section | | Page |
| | | |
1 | | Identity of directors, senior management and advisors | | Not applicable | | |
2 | | Offer statistics and expected timetable | | Not applicable | | |
3 | | Key information | | | | |
3A | | Selected financial data | | Omitted due to reduced disclosure format | | |
3B | | Capitalisation and indebtedness | | Not applicable | | |
3C | | Reasons for the offer and use of proceeds | | Not applicable | | |
| | | |
4 | | Information on the company | | | | |
4A | | History and development of the company | | Business | | |
| | | | How we are organised | | 2 |
| | | | Additional information for shareholders | | |
| | | | Background | | 109 |
| | | | Performance | | |
| | | | Group financial performance | | |
| | | | Capital expenditure | | 26 |
4B | | Business overview | | Strategy | | |
| | | | Our strategy | | 9 |
| | | | Our business model | | 10 |
| | | | Our strategic priorities | | 10 |
| | | | How we measure our progress | | 13 |
| | | | Our resources | | 13 |
| | | | Additional information for shareholders | | |
| | | | Cautionary statement regarding forward-looking statements | | 109 |
| | | | Further note on certain activities | | 113 |
4C | | Organisational structure | | Business | | |
| | | | How we are organised | | 2 |
| | | | Subsidiary undertakings and associate | | 108 |
4D | | Property, plants and equipment | | Strategy | | |
| | | | Our resources | | |
| | | | Properties | | 14 |
| | | | Consolidated financial statements | | |
| | | | Notes to the consolidated financial statements | | |
| | | | Property, plant and equipment | | 59 |
5 | | Operating and financial review and prospects | | | | |
5A | | Operating results | | Performance | | 19 |
| | | | Consolidated financial statements | | |
| | | | Notes to the consolidated financial statements | | |
| | | | Significant accounting policies | | 41 |
| | | | Additional information for shareholders | | |
| | | | Cautionary statement regarding forward-looking statements | | 109 |
5B | | Liquidity and capital resources | | Performance | | 19 |
| | | | Additional information for shareholders | | |
| | | | Cautionary statement regarding forward-looking statements | | 109 |
| | | | Consolidated financial statements | | |
| | | | Notes to the consolidated financial statements | | |
| | | | Loans and other borrowings | | 74 |
| | | | Financial instruments and risk management | | 77 |
| | | | Financial commitments and contingent liabilities | | 90 |
5C | | Research and development, patents and licences | | Strategy | | |
| | | | Our resources | | |
| | | | Innovation | | 14 |
5D | | Trend information | | Performance | | 19 |
| | | | Additional information for shareholders | | |
| | | | Cautionary statement regarding forward-looking statements | | 109 |
5E | | Off-balance sheet arrangements | | Performance | | |
| | | | Other information | | |
| | | | Off-balance sheet arrangements | | 27 |
5F | | Tabular disclosure of contractual obligations | | Performance | | |
| | | | Other information | | |
| | | | Contractual obligations and commitments | | 27 |
6 | | Directors, senior management and employees | | | | |
6A | | Directors and senior management | | Omitted due to reduced disclosure format | | |
6B | | Compensation | | Omitted due to reduced disclosure format | | |
6C | | Board practices | | Omitted due to reduced disclosure format | | |
6D | | Employees | | Strategy | | |
| | | | Our resources | | |
| | | | People | | 13 |
| | | | Consolidated financial statements | | |
| | | | Notes to consolidated financial statements | | |
| | | | Employees | | 51 |
6E | | Share ownership | | Omitted due to reduced disclosure format | | |
| | |
| 114 British Telecommunications plc Annual Report & Form 20-F 2012 | | Cross reference to Form 20-F |
| | | | | | |
| Required Item in Form 20-F | | Where information can be found in this Annual Report | | |
| | | |
| Item | | | | Section | | Page |
| | | |
7 | | Major shareholders and related party transactions | | | | |
7A | | Major shareholders | | Omitted due to reduced disclosure format | | |
7B | | Related party transactions | | Consolidated financial statements | | |
| | | | Notes to the consolidated financial statements | | |
| | | | Related party transactions | | 89 |
7C | | Interests of experts and counsel | | Not applicable | | |
| | | |
8 | | Financial information | | | | |
8A | | Consolidated statements and other financial information | | See Item 18 below | | |
| | | | Performance | | |
| | | | Other information | | |
| | | | Legal proceedings | | 28 |
| | | | Performance | | |
| | | | Group financial performance | | |
| | | | Income statement | | |
| | | | Dividends | | 24 |
| | | | Consolidated financial statements | | |
| | | | Notes to the consolidated financial statements | | |
| | | | Financial commitments and contingent liabilities | | 90 |
| | | | Additional information for shareholders | | |
| | | | Articles of Association (Articles) | | |
| | | | Dividends | | 112 |
8B | | Significant changes | | Performance | | |
| | | | Other information | | |
| | | | Going concern | | 28 |
9 | | The offer and listing | | | | |
9A | | Offer and listing details | | Not applicable | | |
9B | | Plan of distribution | | Not applicable | | |
9C | | Markets | | Not applicable | | |
9D | | Selling shareholders | | Not applicable | | |
9E | | Dilution | | Not applicable | | |
9F | | Expenses of the issue | | Not applicable | | |
| | | |
10 | | Additional information | | | | |
10A | | Share capital | | Not applicable | | |
10B | | Articles of association | | Additional information for shareholders | | |
| | | | Articles of Association (Articles) | | 112 |
10C | | Material contracts | | Omitted due to reduced disclosure format | | |
10D | | Exchange controls | | Additional information for shareholders | | |
| | | | Limitations affecting security holders | | 113 |
10E | | Taxation | | Not applicable | | |
10F | | Dividends and paying agents | | Not applicable | | |
10G | | Statement by experts | | Not applicable | | |
10H | | Documents on display | | Additional information for shareholders | | |
| | | | Documents on display | | 113 |
10I | | Subsidiary information | | Not applicable | | |
11 | | Quantitative and qualitative | | Consolidated financial statements | | |
| | disclosures about market risk | | Notes to the consolidated financial statements | | |
| | | | Significant accounting policies | | |
| | | | Financial instruments | | 45 |
| | | | Financial instruments and risk management | | 77 |
12 | | Description of securities other than equity securities | | Not applicable | | |
13 | | Defaults, dividend arrearages and delinquencies | | Not applicable | | |
14 | | Material modifications to the rights of security holders | | | | |
| | and use of proceeds | | Not applicable | | |
15 | | Controls and Procedures | | Statutory information | | |
| | | | US Sarbanes-Oxley Act of 2002 | | 31 |
| | | | Disclosure controls and procedures | | 31 |
| | | | Internal control over financial reporting | | 31 |
| | | | Report of the independent auditors – Consolidated financial statements | | |
| | | | United States opinion | | 34 |
16A | | Audit Committee financial expert | | Omitted due to reduced disclosure format | | |
16B | | Code of Ethics | | Omitted due to reduced disclosure format | | |
| | | | Report of the Directors | | |
| | | | Statutory information | | |
| | | | Auditors | | 30 |
16C | | Principal accountants fees and services | | Consolidated financial statements | | |
| | | | Notes to the consolidated financial statements | | |
| | | | Audit, audit related and other non-audit services | | 52 |
16E | | Purchase of equity securities by the issuer and affiliated purchasers | | Not applicable | | |
16F | | Change in registrant’s certifying accountants | | Not applicable | | |
16G | | Corporate governance | | Omitted due to reduced disclosure format | | |
17 | | Financial statements | | Not applicable | | |
18 | | Financial statements | | Report of the independent auditors – Consolidated financial statements | | |
| | | | United States opinion | | 34 |
| | | | Consolidated financial statements | | 35 |
| | | | Notes to the consolidated financial statements | | 40 |
| | |
| Cross reference to Form 20-F | | British Telecommunications plc Annual Report & Form 20-F 2012 115 |
Notes
Notes

| | |
British Telecommunications plc Registered office: 81 Newgate Street, London EC1A 7AJ Registered in England No. 1800000 Produced by BT Group Designed by saslondon.com Typeset by RR Donnelley Printed in England by Leycol Printers Ltd Printed on elemental chlorine-free paper Sourced from sustainably managed forests 
www.bt.com PHME 64276 | |  |
| |