Table of Contents
SECURITIES AND EXCHANGE COMMISSION
Washington, D.C. 20549
Form6-K
Report of Foreign Private Issuer
Pursuant to Rule13a-16 or15d-16
of the Securities Exchange Act 1934
Report on Form6-K dated May 24, 2018
BRITISH TELECOMMUNICATIONS PLC
(Translation of registrant’s name into English)
BT Centre
81 Newgate Street
London EC1A 7AJ
England
(Address of principal executive offices)
Indicate by check mark whether the registrant files or will file annual reports under cover of Form20-F or Form40-F.
Form20-F ☒ Form40-F ☐
Indicate by check mark whether the registrant by furnishing the information contained in this Form is also thereby furnishing the information to the Commission pursuant to Rule12g3-2(b) under the Securities Exchange Act of 1934.
Yes ☐ No ☒
Enclosure: British Telecommunications plc — Annual Report & Form20-F 2018
Table of Contents
SIGNATURES
Pursuant to the requirements of the Securities Exchange Act of 1934, the registrant has duly caused this report to be signed on its behalf by the undersigned, thereunto duly authorized.
| British Telecommunications plc | ||||
| By: | /s/ Heather Brierley | |||
| Name: | Heather Brierley | |||
| Title: | Secretary | |||
Date: May 24, 2018
2
Table of Contents
BRITISH TELECOMMUNICATIONS plc
Annual
Report &
Form20-F
2018
As a wholly-owned subsidiary of BT Group plc, British Telecommunications plc meets the conditions set forth in General Instruction (I) (1)(a) and (b) of Form 10-K as applied to reports on Form 20-F and is therefore filing this Form 20-F with the reduced disclosure format.
Table of Contents
| THE STRATEGIC REPORT | GOVERNANCE | FINANCIAL STATEMENTS | ADDITIONAL INFORMATION | |||||||||
|
|
| ||||||||||
The Strategic Report | ||||
| 3 | ||||
| 4 | ||||
| 5 | ||||
| 6 | ||||
| 8 | ||||
| 10 | ||||
Our business model | ||||
| 12 | ||||
| 14 | ||||
| 16 | ||||
| 16 | ||||
| 17 | ||||
| 17 | ||||
| 19 | ||||
| 20 | ||||
| 21 | ||||
| 22 | ||||
| 25 | ||||
| 25 | ||||
| 26 | ||||
| 26 | ||||
| 27 | ||||
| 27 | ||||
| 28 | ||||
| 31 | ||||
Our risks | ||||
| 33 | ||||
| 34 | ||||
Operating review | ||||
| 48 | ||||
| 55 | ||||
| 59 | ||||
| 64 | ||||
| 69 | ||||
| 73 | ||||
| 79 | ||||
Group performance | ||||
| 82 | ||||
| 89 | ||||
| 95 | ||||
| 208 | ||||
| ||||
Table of Contents
Overview
British Telecommunications plc (‘the group’ or ‘the company’ ) is the principal operating subsidiary of BT Group plc. We’re a wholly-owned subsidiary of BT Group plc. The BT Group plc Board has ultimate responsibility for the management of the group while the Executive Committee of BT Group plc is our key management committee. It monitors the group’s financial, operational and customer service performance and has cross-business oversight of BT’s customer-facing units. It also reviews the group’s key risks and considers potential threats and opportunities facing the business.
British Telecommunications plc leverages the governance structure and processes of BT Group plc, including:
| – | BT Group plc Board | – | Governance Committee | |||
| – | Executive Committee | – | Investment Committee | |||
| – | Audit & Risk Committee | |||||
Key management personnel comprise executive andnon-executive directors of the BT Group plc Executive Committee, as well as members of the BT plc Board.
Our strategy in the year had three pillars: deliver great customer experience, invest for growth and transform our costs.
They work together: the better our customers’ experience, the more we sell and the less time and money we spend putting things right. And the better we manage our costs, the more we can invest in improving our customers’ experience and in products and services that will create growth.
Pages 3 to 7 describe our performance against the strategy.
Looking ahead, we’re evolving our strategy to build on our strengths and allow us to respond to market opportunities and challenges. You can find more detail on page 10
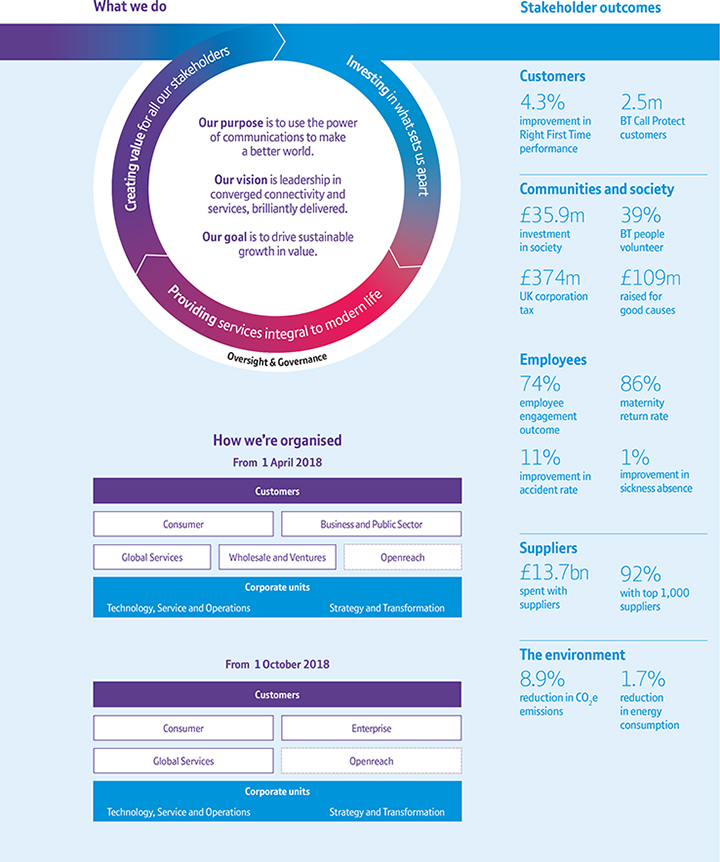
The graphic below shows the main elements of our strategy in the year. You’ll find more details on our purpose and goal, in the context of our business model, on page 12.
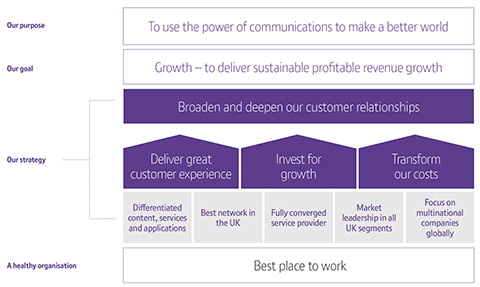
Table of Contents
| THE STRATEGIC REPORT | GOVERNANCE | FINANCIAL STATEMENTS | ADDITIONAL INFORMATION | |||||||||
|
|
| ||||||||||
Our strategy - how we performed
Delivering great customer experience
Customer experience remains central to our strategy and long-term growth – whether that’s improving our service levels, providing a more reliable network or introducing new products. We’re making good progress but we know there is still much more to do.
We believe that continuously improving customer experience drives growth. That’s why progress on customer experience is central to judging the group’s performance. We have two main measures of customer experience: customer perception (based on Net Promoter Score) and doing things Right First Time.
How we did in the year
We’ve built on earlier progress and have delivered seven quarters of continuous growth in customer perception. This year we saw an 8.3 point improvement on last year’s results.
Right First Time performance has improved by 4.3%, helped by better planning and resourcing. This means our network has had fewer faults and we’ve delivered high levels of service despite some terrible weather.
Everyone in BT has a role to play in delivering these results and every CFU has improved its customer perception and Right First Time scores.
We’ve also seen a drop in complaints made to Ofcom over the last year. EE saw complaints fall to their lowest level while complaints about BT Consumer broadband have fallen by 18%.
What difference did our customers see?
Our customers tell us they expect a reliable service, great networks and products that fit their digital, mobile and‘always-on’ lives. We‘ve made progress in all of these areas:
Deliver a consistent and reliable service
| – | On average we answered calls from BT Consumer customers in 41 seconds, a minute quicker than last year. |
| – | EE won the What Mobile award for Best Customer Support for the third year running. |
| – | We now have more than 600 EE shops including five new ‘showcase’ stores offeringface-to-face chats with advisers and highlighting the best of our network and technology partners. |
| – | Our customers are using our digital channels more, with online chat up 20% this year and more than 2m downloads of the ‘My BT’ app. |
| – | Openreach achieved all 60 of Ofcom’s copper Minimum Service Levels. |
| – | Ethernet performance keeps improving – with delivery times cut by a third since last year. |
| – | We’re continuing our transparent approach to performance by publishing quarterly updates on service levels via bt.com and ee.co.uk. |
Great customer experience from our network
| – | We’ve hired almost 2,400 more engineers into Openreach. We’ve also improved our resource planning so that we meet network repair targets more than 80% of the time. |
| – | We’ve continued to weatherproof our networks leading to 3.7% fewer network faults this year. |
| – | BT Consumer customers are now getting faster broadband speeds with average download speeds improving by 20% to 43Mbps. |
Products that fit our customers’ lives
| – | BT Consumer launched ultrafast products at 152Mbps and 314Mbps with minimum speed guarantees. |
| – | EE launched a new 4G antenna service that brings superfast broadband speeds to rural areas where fixed broadband is slow or not available. |
| – | A year after the launch of our BT Call Protect service we’ve protected 2.5m customers by diverting more than 90m nuisance calls. |
| – | And we’ve launched a new ‘BT Business’ app for business customers who want to interact with us digitally. |
| British Telecommunications plc Annual Report & Form 20-F 2018 | 3 | |||||
Table of Contents
Our strategy - How we performed continued
We’ve been putting money and resources into five strategic areas. Together, they underpin our strategy and our operational and financial performance, which in turn contribute to our KPIs (on page 6).
With good progress on the integration of EE within the group and with a fast-paced digitisation of the UK economy, we’ve placed a particular focus this year on enabling convergence and on infrastructure leadership as key drivers of future growth.
| 4 | British Telecommunications plc Annual Report & Form 20-F 2018 | |||||
Table of Contents
| THE STRATEGIC REPORT | GOVERNANCE | FINANCIAL STATEMENTS | ADDITIONAL INFORMATION | |||||||||
|
|
| ||||||||||
Our approach
Rigorous analysis, leadership and strong governance help us stay focused on both transforming costs and improving customer experience.
We benchmark the costs of doing business against other companies inside and outside our sector to see where we can do even better.
Most improvement initiatives are owned and run within individual business units. Our largest programmes span multiple business units or drive complex changes in a single business unit and often need centralco-ordination.
How we did in the year
This year we’ve increased the cumulative EE integration savings to £290m and we’re on track to deliver on our £400m commitment by the end of 2019/20.
The first phase of our restructuring activities has produced £180m of savings against our commitment to deliver £300m over two years.
Key achievements this year included:
| – | creating more synergies from integrating BT and EE. We’ve done this by combining functions, making good use of our increased purchasing power, and completing accommodation moves to bring teams together and save money from closing unneeded buildings |
| – | establishing a new unit, Customer and Enterprise Transformation, within the Strategy and Transformation team. The new unit helps us make investments and take decisions that better support our customer experience and productivity priorities |
| – | becoming even more efficient by creating a Central Business Services unit which brings together customer contact management services, contract delivery services, revenue assurance and billing. |
Looking ahead
We will continue to deliver against our EE integration and first phase restructuring commitments.
We’re also launching new cost transformation initiatives within each business unit, as well as some larger cross-business programmes.
The combination of new and existing initiatives will ensure we deliver against our new strategic target of £1.5bn gross cost reduction over the next three years.
| British Telecommunications plc Annual Report & Form 20-F 2018 | 5 | |||||
Table of Contents
Demanding market conditions and actions we have taken to exit lower margin business in our enterprise divisions have impacted our financial performance. We’ve achieved our customer experience goal for the year, but want to go further.
Progress against our KPIs
We use three key performance indicators (KPIs) to measure how we’re doing against our strategy. Our financial KPIs include the trend in underlying revenue excluding transit and adjusted EBITDA. Customer service improvement is the keynon-financial KPI for us.
Our KPIs are chosen because they reflect the key elements of our strategy.
We’ve outlined our performance against each KPI here, together with an explanation of how we define each measure.
You can find reconciliations of the financial measures to the closest IFRS measure in the Additional information section on pages 209 to 210.
Underlying revenue excluding transit
Underlying revenue reflects the overall performance of the group that will contribute to sustainable profitable revenue growth. We exclude the impact of specific items, foreign exchange movements, acquisitions and disposals. We focus on the trend in underlying revenue excluding transit because transit traffic is low margin and is affected by reductions in mobile termination rates, which are outside our control.
Our key measure of the group’s revenue trend, underlying revenue excluding transit, was down 1.0% (2016/17: down 0.2%).
-1.0%
2018 trend in underlying
revenue excluding transit
Performance
Our revenue performance has been impacted by challenges in our enterprise businesses, particularly in Global Services where revenue declined due to ongoing demanding market conditions and lower IP Exchange volumes and equipment sales in line with our strategy to reduce low margin business. We explain more about the performance of our customer-facing units from page 48.
Trend in underlying revenue excluding transit
Year ended 31 March
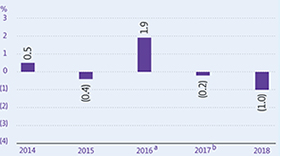
a Calculated as though EE was not part of the group until 1 April 2016.
b Calculated as though EE had been part of the group from 1 April 2015.
| 6 | British Telecommunications plc Annual Report & Form 20-F 2018 | |||||
Table of Contents
| THE STRATEGIC REPORT | GOVERNANCE | FINANCIAL STATEMENTS | ADDITIONAL INFORMATION | |||||||||
|
|
| ||||||||||
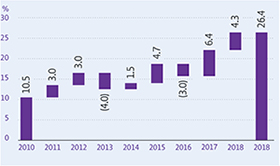
Customer service measure
Right First Time is our key measure of customer service. This tracks how often we keep the promises we make to our customers. This could be about keeping to appointment times, completing orders when we agreed or fixing faults within an agreed period. As well as improving service and the customer experience, keeping our promises should mean that there is less work to do to correct our mistakes, and so reduces our costs.
Adjusted EBITDA
Adjusted EBITDA is defined as group profit before depreciation, amortisation, net finance expense, taxation and is before specific items. We consider adjusted EBITDA to be a useful measure of our operating performance because it approximates the underlying operating cash flow by eliminating depreciation and amortisation.
Our customer service measure Right First Time was up 4.3% compared with up 6.4% last year.
+4.3% 2018 customer service measure
Performance Improving the service we deliver is key. Our Right First Time measure was up 4.3% (2016/17: up 6.4%). We’re making good progress in some areas and every customer-facing unit has improved its Right First Time scores. Despite these improvements, we’re looking ahead at improving customer experience further. You can read more about our customer service on page 3.
Customer service improvementa
At 31 March
a Cumulative improvement from 1 April 2009.
| Adjusted EBITDA was down 2% (2016/17: up 18%).
-2% 2018 adjusted EBITDA
Performance Adjusted EBITDA was down 2% reflecting the decline in volumes, investment in mobile devices and customer experience along with higher business rates and pension costs, partly offset by cost savings.
Adjusted EBITDA Year ended 31 March
|
| British Telecommunications plc Annual Report & Form 20-F 2018 | 7 | |||||
Table of Contents
Ournon-financial performance as a sustainable and responsible business
Our integrated approach to reporting means that the requirements of the newNon-Financial Reporting Directive are addressed throughout the Strategic Report.
For ease of reference, information pertaining to each of the matters addressed by the new regulation can be found on the following pages: Human rights (page 21); Employees (page 22); Social (page 25); Environmental (page 31); Anti-corruption and bribery (page 34).
Additionally,non-financial matters have long been embedded in our business model as stakeholder outcomes on page 13, and within our principal risks and uncertainties on pages 34 to 47.Non-financial performance indicators are linked to our ambitions and foundation measures as a sustainable and responsible business and can be seen in the table below.
 Target met
  Target failed
  Ongoing
| Our ambitions | 2016/17 performance | 2017/18 performance | Status | Page | ||||||
| ||||||||||
Creating a connected society |
By 2020, more than 9/10 people in the UK will have access to our fibre-based products and services |
8.8 out of 10 UK premises passed | Ambition superseded: 95% of premises now passed by superfast broadband
| n/ma | 25 | |||||
| ||||||||||
By 2020, to help 10m people overcome social disadvantage through the benefits our products and services can bring
|
3.9m people reached | 4.6m people reached |  | 25 | ||||||
| ||||||||||
Creating a culture of tech literacy |
By 2020, to help 5m children to receive better teaching in computer skills
|
1.1m children reached | 1.6m children reached | | 26 | |||||
| ||||||||||
Supporting charities and communities |
By 2020, to use our skills and technology to help generate more than £1bn for good causes |
£95m raised for good causes | £109m raised for good causes | | 26 | |||||
| Cumulative total: £422m since 2012 | Cumulative total: £531m since 2012 | |||||||||
| ||||||||||
By 2020, to inspire 66%(two-thirds) of our people to volunteer
|
31% of BT people volunteering | 39% of BT people volunteering | | 23 | ||||||
| ||||||||||
Delivering environmental benefits |
By 2020, to enable customers to reduce their carbon emissions by at least three times theend-to-end carbon impact of our business
|
1.8:1 achieved | 2.2:1 achieved | | 31 | |||||
| ||||||||||
By 2030, to cut our carbon emissions intensity by 87%, compared with 2016/17 levels
|
n/m (new ambition) | 6.8% reduction | | 31 | ||||||
| ||||||||||
aincluding other network operators. | ||||||||||
| Our foundation measures | 2016/17 performance | 2017/18 performance | Status | Page | ||||||
| ||||||||||
Investment in society |
Investment to accelerate our purposeful business approach; to be more than 1% of adjusted profit before tax (PBT)
|
1.03% of PBT invested
1.08% 5-year average | 1.02% of PBT invested
1.06%5-year average | | 25 | |||||
| ||||||||||
Customers |
Customer service:to consistently improve RFT across our entire customer base
|
6.4% improvement | 4.3% improvement | | 3 | |||||
| ||||||||||
Employees |
Employee engagement index:to maintain or improve our relationship with our employees
|
71% favourable | 74% favourable | | 23 | |||||
| ||||||||||
Sickness absence rate:to maintain or reduce % of calendar days lost to sickness
|
2.32% calendar days lost to sickness | 2.30% calendar days lost to sickness | | 24 | ||||||
| ||||||||||
Ethical performance:to maintain or improve our employees’ perception of our ethical performance
|
76% favourable | 83% favourable | | 34 | ||||||
| ||||||||||
Ethics training:all employeesbto complete annual training on our ethics code (including our zero tolerance approach to Anti-Corruption & Bribery)
|
99.3% trained | 99.5% trained | | 34 | ||||||
| ||||||||||
Supply chain |
Ethical trading:across our supply chain, with focus on human rights. Achieve 100%follow-up within three months, for all suppliers identified as high or medium risk, through our ethical standards questionnaire
|
100%follow-up within three months | 100%follow-up within three months | | 27 | |||||
| ||||||||||
Renewable electricity:by 2020 to buy 100% of our electricity world-wide from renewable sources, wherever markets allow
|
77%cbought from renewable sources | 81% bought from renewable sources | | 27 | ||||||
| ||||||||||
Carbon emissions:by 2030, to reduce our supply chain carbon emissions by 29%, compared with 2016/17 levels.
|
n/m (new target) | 6.3% reduction | | 27 | ||||||
| ||||||||||

To find out more about these measures, our methodologies and how our results are calculated, take a look atbt.com/deliveringourpurpose
an/m - not meaningful.
bAt least 99.5%, excluding those on maternity, paternity or long-term sick leave or with other extenuating circumstances.
c 2016/17 energy figures restated – see bt.com/deliveringourpurpose for details.
| 8 | British Telecommunications plc Annual Report & Form 20-F 2018 | |||||
Table of Contents
| THE STRATEGIC REPORT | GOVERNANCE | FINANCIAL STATEMENTS | ADDITIONAL INFORMATION | |||||||||
|
|
| ||||||||||
| British Telecommunications plc Annual Report & Form 20-F 2018 | 9 | |||||
Table of Contents

Table of Contents
| THE STRATEGIC REPORT | GOVERNANCE | FINANCIAL STATEMENTS | ADDITIONAL INFORMATION | |||||||||||
|
|
| ||||||||||||
Our purpose remains to use the power of communications to make a better world. This drives everything that we do.
Our vision is leadership in converged connectivity and services, delivered brilliantly in the UK and for multinational corporations. This highlights our commitment to convergence as a growing category of products and service.
Our goal is to drive sustainable growth in value. This reflects our commitment to balance top and bottom-line growth and to create value from our investment in our integrated network and differentiated products and services.
We will deliver these through three strategic priorities:
1. Deliver differentiated customer experiences
We will further differentiate our propositions, to retain and expand value. We’ll do this by creating innovative new propositions, improving value for money, offering better service, and making it easier to do business with us. We’ve made progress with customer experience in recent years, but there’s much more to do.
2. Invest in integrated network leadership
In UK fixed, we’ll drivetake-up of our superfast network and accelerate our investments in ultrafast through fibre to the premises to 3m homes by 2020 and through Gfast.
In UK mobile, we’ll expand our leadership in 4G coverage and capacity, and we intend to lead the market to 5G too.
Ultimately our aim is to build a single, integratedall-IP fibre network. Our investment will allow us to progressively close down legacy products such as the public switched telephone network, lead the market in advanced digital products, improve customer experience, and reduce our operating costs. | 3. Transform our operating model
We’re creating a more lean and agile organisation, with a simplified operating model, and more straightforward decision-making.
The steps we’re taking to achieve this include:
– simplifying our operating model by creating four customer-facing units focused on Consumer, Enterprise, multinational corporations through Global Services and fixed access networks through Openreach
– having fewer, bigger, more accountable leadership roles and simplifying and delayering our management structures
– accelerating the delivery of Digital GS, introducing new digital products with a greater focus on our top global customers
– reducing inefficiencies from being housed in numerous sites across the UK to focus on around 30 modern,fit-for-purpose sites to create a more collaborative, open and customer-focused working culture
– move from buying to strategic sourcing, consolidating our spend and standardising our products
– make better use of digitalisation to improve customer-experience and reduce costs to serve.
These strategic priorities will be tailored to the differentneeds of our key customers in each of our customer-facing units:
– forUK ConsumerandEnterprise, our focus will be on accelerating the development of converged services
– inGlobal Services, our focus will be on evolving towards a more digital proposition and operating model
– Openreach will focus on delivering unmatchedUK-wide fixed access to all CPs.
Outcomes from our transformation As a result of our transformation we’ll be more efficient, productive, focused, and better able to deliver excellent experiences to our customers. There should be a substantial positive impact on our financial performance, albeit offset in the short term by recent regulatory outcomes: Over three years we’re targeting improvements in our customer experience metrics, revenue generating units per customer, converged product penetration and digital interaction with our customers. We’ll deliver a three-year reduction of around 13,000 mainly back office and middle management roles, partially offset by new hires to support customer service and network deployment. We expect the programme to cost £800m and have atwo-year payback.
Ultimately, we will create afit-for-future organisation to drive sustainable growth in value for all our stakeholders as the leader in convergent connectivity and service in the UK and for multinational corporations. | |||||
| British Telecommunications plc Annual Report & Form 20-F 2018 | 11 | |||||||
Table of Contents
We create value for our stakeholders by developing and selling products and services that are an essential part of modern life.
Who we are
We’re one of the world’s leading communications services companies. We’re based in the UK and serve customers in 180 countries
(see page 64).
International Integrated Reporting
Council’s capitals
This key provides a mapping to the ‘capitals’ of the IIRC’s Integrated Reporting (IR) Framework.
You can find out more at: www.theiirc.org
 Financial
 Human
Human
 Manufactured
 Intellectual
 Social
 Natural
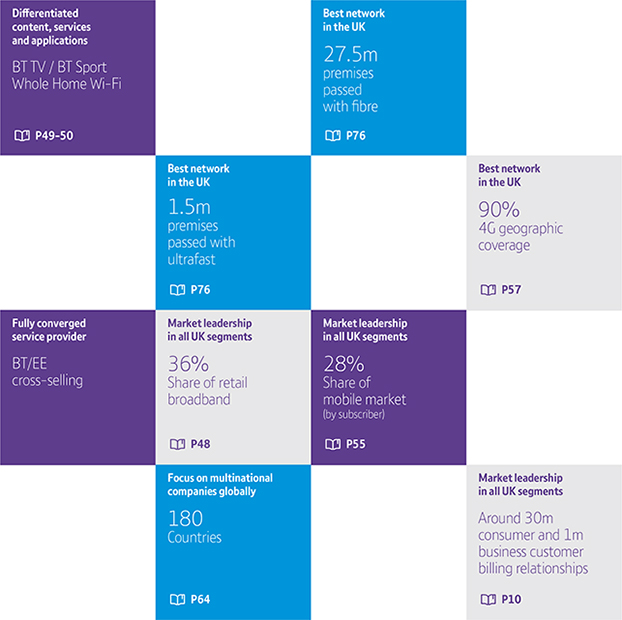
What sets us apart
| ||||||||||
 | ||||||||||
| Financial strength | £3.0bn | ||||||||
| We’re focused on growing our cash flow over the long term. | normalised free cash flow generated in 2017/18 | |||||||||
| ||||||||||
| Our people | 105,800 | ||||||||
| Their commitment, expertise | employees | |||||||||
| and diversity are key to our success. | 82,200 | |||||||||
| in the UK | ||||||||||
| ||||||||||
 | Networks and physical assets | 27.5m | ||||||||
| We continue to invest in these to improve the experience we offer our customers. | premises passed by our fibre footprint | |||||||||
| 90% | ||||||||||
| 4G geographic coverage | ||||||||||
| ||||||||||
 | Research and development | c£510m | ||||||||
| We’re one of the largest investors in research and development in the UK. | R&D spend | |||||||||
| 97 | ||||||||||
| patents filed | ||||||||||
| ||||||||||
| Our culture | Personal | ||||||||
| ‘The BT Way’ and our values express how we work together and what we expect from our people. | Simple Brilliant | |||||||||
| ||||||||||
| Our brand | |||||||||
| Our brands are a key asset. | ||||||||||
 | ||||||||||
| Natural resources | 81% | ||||||||
| We use some natural resources in doing business. | of the electricity we buy worldwide comes from renewable sources | |||||||||
| 12 | British Telecommunications plc Annual Report & Form 20-F 2018 | |||||
Table of Contents
| THE STRATEGIC REPORT | GOVERNANCE | FINANCIAL STATEMENTS | ADDITIONAL INFORMATION | |||||||||
|
|
| ||||||||||
| British Telecommunications plc Annual Report & Form 20-F 2018 | 13 | |||||
Table of Contents
This section details our purpose, goal and strategy in the context of our business model. It also explains how we create value for our stakeholders by providing services that are integral to modern life.
|
Our purpose, goal and strategy |

Our purpose
Our business model is built around our purpose, which is as simple as it is ambitious: to use the power of communications to make a better world.
Sustainability, ethics and human rights
To achieve our purpose, we must do business responsibly. That means behaving ethically, respecting people and the environment. We are a signatory to the UN Global Compact principles and we’re actively contributing to the UN Sustainable Development Goals.
We have a steering group that oversees human rights governance and policies and we’re committed to implementing the UN Guiding Principles on Business and Human Rights.
Every year we publish a statement which sets out our stance on modern slavery and human trafficking. And we don’t tolerate bribery or corruption.
Non-financial information reporting
New regulations onnon-financial information mean we must report on the following topics:
|  P31 Environmental matters P31 Environmental matters | |
|
bribery | |
| ||
There are references to our policies in these areas, along with how we’ve done against various measures, throughout the Strategic Report. Some of the outcomes feature in the business model graphic on page 13. We’ve listed others in the summary of ournon-financial performance on page 8.
Read more in our Delivering our Purpose report.
Our goal
Our goal is to drive sustainable growth in value. We’ll achieve this by giving our customers a great experience and products and services they value.
Our strategy
To follow our purpose and achieve our goal, our strategy is built around the three pillars outlined on page 11: delivering differentiated customer experiences, investing in integrated network leadership, and transforming our operating model.
They work together. The better our customers’ experience, the more we’ll sell and the less time and money we’ll spend putting things right.
And the leaner and more agile we are, and the better we manage our costs, the more we can invest in the business while maintaining a strong balance sheet (page 16). It’s a virtuous circle that balances short-term performance with long-term value creation.
|
Investing in what sets us apart |

We invest in building and maintaining communications networks in the UK and overseas. We also invest in differentiated products, services and applications to run over those networks.
Customer expectations are rising all the time. We believe that getting customer experience right is a competitive advantage. So we’re investing in our people (eg more contact centre roles, more multi-skilled advisors) and our processes (eg reducing missed appointments).
Some of our investments, like TV sports rights, last just a few years. Other investments, like our fibre broadband network, are much longer term, withpay-back periods of more than a decade.
We have a distinct combination of people, technology, content, networks and other physical assets that sets us apart from competitors. Importantly, we also have the financial strength to keep investing in these areas while balancing short, medium and long-term interests
|
Providing services integral to modern life |

We sell fixed-voice, broadband, mobile and TV products and services to individuals and households in the UK. For businesses we offer communications services ranging from phone and broadband through to complex managed networks and IT services and cybersecurity protection. Many public services rely on our technologies and in the UK and Ireland we help other communications providers to serve their own customers. And underpinning all this, we provide the connectivity that’s essential in a digital economy.
There’s growing demand for a lot of our products and services because they play such an integral role in modern life. And we’ll benefit as customers use more digital services and increasingly want value, reliability and consistent service.
Market context
Consumer broadband continues to switch to fibre, to meet customers’ demands for higher bandwidth. Meanwhile people are making fewer landline calls, replacing them with mobile phones, voice over IP or instant messaging. In mobile, there’s continuing growth in data use – and postpaid subscriptions are growing at the expense of prepaid.
At the same time,SIM-only tariffs are becoming more popular because people are keeping their phones for longer. In TV, there’s growth in subscriptionvideo-on-demand (SVoD), largely as a complement topay-TV services. And customers are increasingly using digital service channels, like apps and online chat, to interact with their service provider. Business customers are using landlines, leased lines and traditional voice services less as the market moves to data and IP voice. Other growing areas include cloud services, hosting, security and data protection. Business broadband is switching to fibre. And Ethernet and dedicated internet access services are also becoming more widespread as businesses rely more and more on connectivity.
| 14 | British Telecommunications plc Annual Report & Form 20-F 2018 | |||||
Table of Contents
| THE STRATEGIC REPORT | GOVERNANCE | FINANCIAL STATEMENTS | ADDITIONAL INFORMATION | |||||||||
|
|
| ||||||||||
‘Digitalisation’ or digital transformation is now a top priority for many businesses, particularly multinational corporations. It’s not an end in itself. But it does help companies achieve objectives like transforming costs, operating more efficiently or improving customer experience. Our ‘Cloud of clouds’ strategy (page 65) positions us well to be a trusted partner in our customers’ digital future.
We aim to be the UK’s leading converged operator – bringing together our fixed and mobile network assets to make sure our customers are always connected to the best possible network, and selling converged propositions that offer much more than simple ‘bundles’. We’re uniquely placed to do it – with the brands, scale and breadth of capabilities to benefit from convergence.
Our strategy puts us in a strong position to drive, and benefit from, these market trends. You can find out more in the customer-facing unit sections from page 48.
Channels to market
We sell our products and services through our customer-facing units.
We do it through a range of channels including online, contact centres and account managers. We also have around 600 EE stores in the UK.
Multibrand strategy
We have three retail brands (page 19). They let us serve different sectors of the market and lead to higher consideration by potential customers when they’re deciding whether to buy from us or one of our competitors. Add to that the cross-selling between our retail brands and we have an opportunity to sell more to more people.
Diverse revenue streams
Our revenue mostly comes from subscriptions or contracts. Individuals, households and SMEs pay for standalone or bundled services, typically on12- to24-month contracts.‘Pay-as-you-go’ mobile services are also available.
Large corporate and public sector customers usually buy managed networked IT services on contracts spanning several years. Wholesale customer contracts range from one month for regulated products, to five years or more for major managed services deals.
Other sources of revenue include our ventures (page 69), consultancy, device sales and advertising (online, BT Sport TV channels and InLinkUK kiosks).
|
Creating value for all our stakeholders |

What we do, matters – to millions of people. We help them communicate, enjoy entertainment, do business and generally live their lives. And we contribute directly to communities and the health of the UK by providing jobs, supporting suppliers, paying tax and encouraging our people to volunteer.
Sustainability is integral to our purpose and the value we create. We’re committed to using 100% renewable electricity (where markets allow) and we’re encouraging our suppliers, customers and people to do the same. At the same time, our products and services are helping to tackle climate change.
Our business generates emissions. From our operations, supply chain, and through the energy our customers use to power our products. But we’re contributing to a lower-carbon economy by cutting our own carbon footprint and helping customers cut theirs. The emission savings for our customers outweigh our own footprint. This means we’re a ‘net positive’ business (see page 31).
From a purely financial perspective, our carbon-saving products and services contribute £5.3bn revenue to our businessa.
|
Oversight and governance |

The markets we operate in are dynamic and very competitive, particularly the UK. There are many risks and opportunities, so it’s important that our strategy and business model are flexible and sustainable. To help us we:
| – | have a risk management framework to identify and mitigate the challenges we face (page 33) |
| – | use insight teams to keep us in tune with market drivers and customer expectations |
| – | talk and listen to our stakeholders to understand what’s important to them |
| – | use BT Group plc governance committees to ensure we’re making the right investments and investing with discipline. |
Together, these things help us anticipate and respond to changes in our markets including macro events like Brexit and the prospect of the UK leaving the single European market.
We know we can deliver value over the short, medium and long term. It’s this confidence that underpins our assessment of the future prospects and viability of the group.
The Design Council and BT Investment Board
TheDesign Council was asub-committee of BT Group plcOperating Committee. It was responsible for making sure capital investments in our networks, systems, platforms and products reflected our strategy, served the needs of our customers and were delivered cost-effectively. TheDesign Council was dissolved in October 2017 following the creation of theExecutiveCommittee.
From December 2017 the BT Group plc BT Investment Board has been responsible for providing input and recommendations to support the group chief executive on major capex and opex decisions.
| a | The list of our carbon-saving products and services is established and verified by Carbon Trust; the associated revenue is based on total external sales, independently verified by Lloyd’s Register. |
| British Telecommunications plc Annual Report & Form 20-F 2018 | 15 | |||||
Table of Contents
In this section we talk about the resources that set us apart
and underpin our business model. We also describe our
culture and approach, and commitment to respecting
human rights.
Our financial strength means we can make long-term investments while supporting other areas of the business.
Our financial strategy has been consistent for a number of years:
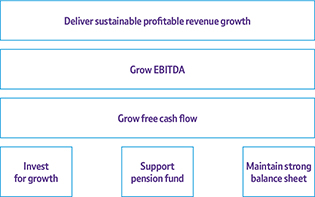
We have a prudent financial policy and adhere to a disciplined process for the allocation of capital between four main uses: investment in the business; supporting the pension fund; and maintaining a strong balance sheet. We also have strong governance and investment processes/controls. Together, they help us make the right decisions when it comes to planning investments, growing our business, and managing our level of debt and credit metrics.
Healthy finances also mean we can support the business in other ways. For example we continue to invest in R&D to stay at the forefront of a rapidly-changing industry, and in training, developing and supporting our people.
Our networks and physical assets
Our network, service and IT platforms support the products our customers rely on around the world.
Network platforms
Our UK fixed-line network is one of our most valuable assets and our investment in fibre broadband is key to providing services to UK consumers and businesses. Our fibre broadband network now passes more than 27.5m UK premises, and we providefibre-to-the-premises to more customers than any other UK service provider. To meet the demand from businesses, we’re continuing to expand Ethernet availability.
This year we’ve again had record levels of traffic across our UK network, with a peak demand of 9.75Tbps. The investments we’ve made in broadband technology mean that more customers get faster speeds and better reliability over our network.
We’ve also developed new technology that should more than double our previous records for data transmission speeds. Our latest breakthrough should deliver speeds of up to 13Tbps over a single fibre. This more than doubles the world record of 5.6Tbps we set last year.
Our global reach
Our global network is supported byin-country networks and infrastructure. The UK has our widest range of network services, access technologies and coverage. But we also have extensive networks in Brazil, Germany, Italy, the Netherlands, the Republic of Ireland and Spain.
The scale and reach of our global multi-protocol label switching (MPLS) network gives us a competitive advantage. Our virtual private network (VPN) services offer customers the convenience and security of a private network but over the public internet. We use our MPLS network, plus a combination of owned and leased fibre connections, to connect our points of presence (PoPs) around the world. For the final connection into the customers’ premises, we either use our own circuits, or lease connections from telecoms operators in that country. If customers need service in very remote places, we make use of our extensive satellite connections.
Security is an important part of our business. The expertise we’ve gained from protecting our own networks helps us secure our customers’ networks. We’ve seen that hacking tools, phishing scams and disruptive malware are becoming more sophisticated yet more accessible – so we’ve responded by continuing to develop our cyberdefence capability.
| 16 | British Telecommunications plc Annual Report & Form 20-F 2018 | |||||
Table of Contents
| THE STRATEGIC REPORT | GOVERNANCE | FINANCIAL STATEMENTS | ADDITIONAL INFORMATION | |||||||||
|
|
| ||||||||||
Mobile network
We are investing in 4G geographic coverage and capability, consolidating the EE network’s position as the biggest and fastest in the UK. We aim to expand 4G to reach 95% of the UK’s geography by the end of 2020.
Wi-fi
We run one of the world’s biggestwi-fi networks, with around 5.9m hotspots.
Progress this year
This year we’ve:
| – | achieved 99.999% availability in our core network for broadband customers |
| – | deployed Ethernet and optical nodes into 38 data centres belonging to other companies to help grow business connectivity services. |
| – | upgraded 935 exchanges and migrated more than 309,000 customers to faster broadband services that are cheaper and more energy efficient for us to run |
| – | launched the BT Agile Connect service |
| – | reached more than 90% of the UK’s geography with our 4G network, giving many rural and remote areas access to 4G |
| – | built 323 new sites on the Emergency Service Network (ESN) |
| – | installed 138 InLinkUK units, providing users with freewi-fi at up to 1Gbps, free UK phone calls, rapid mobile device charging and touchscreen access to local digital services. |
Service platforms
We run a number of service platforms that combine our network and IT resources. They underpin many of our products. Our five core service platforms are voice and mobile, broadband and internet access, TV, Ethernet and managed data, and emerging services.
Our TV platform supports a growing number of customers. Our voice and mobile platform supports EE, BT Mobile and Plusnet Mobile; it also underpins the Emergency Services Network (ESN).
Progress this year
This year we’ve:
| – | shown the Ashes live from Australia – with enhanced digital experience, so BT Sport customers watching online or via the app can skip straight to key moments |
| �� | carried over one billion minutes a month on our BT Conferencing platform. |
IT systems platforms
Our IT systems let us manage processes, handle customer information and deliver products and services. They’re critical to serving customers and running our business.
We’ve completed the first phase of our EE integration programme. This involved moving EE people to BT systems so all our people could benefit from a single, consistent set of applications.
Progress this year
We’re simplifying the different technologies we use. This year we’ve:
| – | brought together BT and EE datacentre and core IT applications management |
| – | deployed robotic process automation, using software robots to carry out automated tasks, including order entry and order management, to cut costs and improve our back-office processes. |
We have around 7,000 properties in the UK and 1,700 across the rest of the world.
We lease most of our UK properties from Telereal Trillium, part of the William Pears group. We signed a sale and leaseback arrangement with them in 2001. The majority (88%) of our UK properties are operational sites housing fixed and mobile telecoms and broadband kit. The rest are retail outlets, offices, contact centres, depots and data centres. We also have the BT Sport TV studios in London.
In the UK, we’ve rationalised and disposed of office, depot and data centre space in Croydon, Harrogate, Oxford and Wolverhampton.
Outside the UK, we’ve consolidated key office and operational locations in New York, Cincinnati, São Paulo, Frankfurt and Munich.
BT property portfolio (UK)a
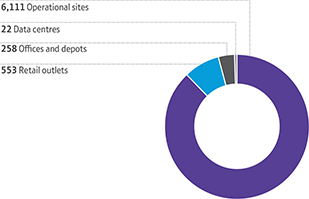
a excludes leased cell sites, concessions in other retailers’ stores and franchisee-owned leases.
Commercial success increasingly depends on innovation – that’s why we invest in R&D. The result is an enviable track record of scientific breakthroughs, engineering successes and commercial progress.
A proud history of innovation
In 1837, Sir William Fothergill Cooke and Sir Charles Wheatstone filed a patent for the world’s first practical electric telegraph. From this they founded The Electric Telegraph Company. This business eventually grew into BT.
Ingenuity transforms the world
Our innovation has continued to transform communications since
Cooke and Wheatstone’s electric telegraph. Often that impact has been wider than just communications. Colossus was the world’s first electronic programmable computer. It was created by GPO engineer Tommy Flowers in 1943, and heralded the start of the computer age. In 1984, we deployed the world’s first commercial 140Mbps single-mode optical fibre link. This technology is now the backbone of communications, carrying huge volumes of internet traffic around the globe. We made the world’s first live data call over GPRS (a mobile technology) in 1999. Less than 20 years later, mobile data has transformed the way people live.
You can read more about our innovation at
btplc.com/innovation/innovation
| British Telecommunications plc Annual Report & Form 20-F 2018 | 17 | |||||
Table of Contents
Our resources and culture continued
We showcased our innovation at two major events this year.
Innovation 2017 was held at Adastral Park, our global R&D headquarters in Suffolk, UK. It was attended by 625 customers and influencers, including government, investors, journalists and analysts. New Scientist Live hosted 30,000 visitors over four days. We sponsored its technology zone.
This year we invested around £510m (2016/17: around £520m) in R&D. Over the last decade we’ve been one of the largest investors in R&D both in the UK, and globally in the telecoms sector.a
Our research keeps producing new inventions. In 2017/18 we filed patent applications for 97 inventions (2016/17: 102), and as of 31 March 2018 had a worldwide portfolio of more than 5,000 patents and applications.
97
patent applications filed in 2017/18
5,000
patents and applications in our worldwide portfolio
Open innovation
No-one has a monopoly on good ideas. That’s why we work with partners, universities and customers from around the world.
There are eight BT global development centres. Our biggest is the innovation campus Adastral Park. Around 3,600 people work there and we share it with more than 90 other high-tech companies.
We have extensive, long-standing, joint-research programmes with Cambridge University (UK), Massachusetts Institute of Technology (USA), Tsinghua University (China), Khalifa University (UAE) and more than 30 other universities globally.
We’ve used ideas inspired by our collaboration with MIT or Artificial Intelligence (AI) and machine learning to create algorithms that give us a deeper understanding of our access network. This year we launched a five-year research collaboration with Huawei and the University of Cambridge. It will focus on photonics, digital and access network infrastructure and media technologies, alongside work aimed at boosting the impact of communications technologies in society.
We’ve opened the BT Ireland Innovation Centre with Ulster University in Belfast. It will work alongside the Belfast Global Development Centre and BT Labs at Adastral Park in Suffolk on projects including Internet of Things, artificial intelligence and data analytics for customer experience and cybersecurity.
Repurposed innovation
We like to repurpose innovations from other industries and apply them to our business. This year we flew a drone across a river in a Welsh valley to deliver a fibre. We’re looking into new ways to roll out fibre without so much digging. These include new directional drilling techniques and autonomous robots that propel themselves through the ground like worms.
Our researchers are investigating the application of artificial intelligence and machine learning techniques to the operation of 5G networks.
We’re also exploring how we can use a technique from the mobile world – called beamforming – to improve our copper lines’ performance. It exploits the interference or ‘crosstalk’ between copper cable pairs to boost the speed achievable on a line.
Awards for our research and development
We’re proud that our R&D is recognised outside BT. Here are some of the awards we’ve won this year.
| – | UK IT Awards: Best IoT (Internet of Things) Project |
| – | TM Forum 2017: Excellence Award for Smart City Innovator of the Year |
| – | TM Forum 2017: Outstanding Achievement Award |
| – | The Engineer magazine: Collaborate to Innovate Awards 2017 |
a Comparison based on total R&D spend 2007/8 to 2016/17. Source: EU Industrial R&D Investment Scoreboard, http://iri.jrc.ec.europa.eu/scoreboard.html
| 18 | British Telecommunications plc Annual Report & Form 20-F 2018 | |||||
Table of Contents
| THE STRATEGIC REPORT | GOVERNANCE | FINANCIAL STATEMENTS | ADDITIONAL INFORMATION | |||||||||
|
|
| ||||||||||
We own three strong retail brands: BT, EE and Plusnet. Between them, they cover UK and global markets for consumers, businesses and the public sector. We’ve positioned these three brands to maximise their customer reach and minimise overlap. This multi-brand approach makes us more agile in our markets and broadens our overall appeal. We also own the Openreach brand, with which we serve communication providers.
Lots of things affect our brands and reputation. But peoples’ direct interactions with us play a big part. That’s why we’re committed to optimising every aspect of customer experience: from our products to our service experience to our communication. For more on how we’re improving customer experience, see page 3 and our customer-facing units from page 48. |
|
| The BT brand stretches across consumer, business and public sector markets within the UK and across multinational business markets in 180 countries. | |||
This year, we unveiled Ultrafast Fibre, the first and only fibre broadband with a 100Mbps speed guarantee, and we were host broadcaster of the UEFA Champions League Final in Cardiff. | ||||||
In the UK business market, we have the highest awareness of any telecoms, networks and IT services brand. Strong business wins included network services for Severn Trent Water and mobility services for FirstGroup Plc. | ||||||
BT was recognised as a leader for the 14thconsecutive time in Gartner’s Magic Quadrant for Network Service Providers, Globala. (See page 66). | ||||||
And BT was named a ‘Leader’ in the IDC MarketScape for Worldwide Managed Security Services 2017 Vendor Assessmentb. | ||||||
|
EE is the UK’s biggest mobile network operator, positioned at the cutting edge of technology. | |||||
With around 600 retail stores across the UK, we are also first for spontaneous brand awareness, despite being the youngest major UK mobile brand by almost a decade. | ||||||
EE’s mobile network has been independently recognised as the best overall network by RootMetrics and in 2017, it was the only network in the UK able to offer mobile connectivity for the new Apple Watch. | ||||||
|
Plusnet offers UK customers a great value range of broadband and mobile services. | |||||
In 2018, Plusnet’s outstanding customer service continued to be acknowledged with industry awards, including uSwitch’s Best Customer Service for the fifth consecutive year. | ||||||
At the same awards, we also won Best Value for Money, Best Home Broadband and – despite only launching mobile in 2016 – BestValue Mobile(SIM-only). | ||||||
|
Openreach (page 73) builds and maintains Britain’s digital communications network. | |||||
More than 25,000 engineers take care of 165 million kilometres of network, working in every community, every day. | ||||||
This year, Openreach launched a new brand identity, reflecting commitments made as part of the DCR settlement (page 29). The programme to change all assets has already begun, including our buildings, vans and uniforms. |


a Gartner does not endorse any vendor, product or service depicted in its research publications, and does not advise technology users to select only those vendors with the highest ratings or other designation. Gartner research publications consist of the opinions of Gartner’s research organisation and should not be construed as statements of fact. Gartner disclaims all warranties, expressed or implied, with respect to this research, including any warranties of merchantability or fitness for a particular purpose.
b MarketScape for Global Managed Security Services Vendor Assessment 2017, Martha Vazquez, 1 December 2017.
| British Telecommunications plc Annual Report & Form 20-F 2018 | 19 | |||||
Table of Contents
Our resources and culture continued
We want our culture to reflect our values of personal, simple and brilliant, for our people and our customers.
Our values

We’re proudly personal, simple and brilliant in many ways already. That includes our history of pioneering innovation, a strong volunteering ethos, diverse career development for our people, and our ability to disrupt the market and reinvent ourselves when we need to – as through ventures like BT Sport, the 2012 Olympics and the acquisition of EE.
Embedding our values further
There’s more to do to be personal, simple and brilliant every day.
So we’ve launched a multi-year transformation programme to simplify our organisation, improve business performance, and reform our culture and capabilities.
This year we’ve begun simplifying how we do things – by helping our people take personal ownership to resolve their customers’ issues and introducing new ways to make better and faster decisions. That means making sure accountabilities are clear and decisions are made at the right level of the organisation, as close to customers as possible.
We’ve encouraged more diverse thinking in the business by attracting more diverse talent. This year we doubled our graduate intake and quadrupled our apprentice intake across the group. We’re offering more career development opportunities for our people, as well as inspiring fresh perspectives.
We’re also building new programmes and resources to help our people be brilliant, clarifying the key skills and behaviours they need now and in the future (including Management Essentials, Business Essentials and Connected Leaders (see page 23).
Finally, we’ve been helping our people do the right thing by:
| – | regularly reaffirming our expectation that everyone acts with integrity through our ethical code |
| – | creating a safe environment where everyone can speak up about risks and concerns |
| – | equipping our leaders to have more regular open and honest conversations so they make better-informed decisions. |
The BT Way
All of this will come together in ‘The BT Way’ – a three-part guide to reflect how we work together as a company, how we treat each other and how we expect everyone to behave. It will include:
| – | how we’reorganisedand how we deliver for our customers |
| – | what we expect from our people through our updatedethical code |
| – | what’s important to us and how we do things as expressed throughour values. |
Our efforts are having a positive impact
In January’sBT-wide ‘Your Say’ employee engagement survey, we did better than previous years on all our values scores:
+4% improvement in our Personal score (75%) |
+3% improvement in our Simple score (62%) |
+3% improvement in our Brilliant score (70%) |
| 20 | British Telecommunications plc Annual Report & Form 20-F 2018 | |||||
Table of Contents
| THE STRATEGIC REPORT | GOVERNANCE | FINANCIAL STATEMENTS | ADDITIONAL INFORMATION | |||||||||
|
|
| ||||||||||
We’re committed to respecting human rights in our own business and through our broader relationships.
We believe that everyone is entitled to basic rights and freedoms, whoever they are and wherever they live. These are established in The International Bill of Human Rights and the International Labour Organisation’s Declaration on Fundamental Principles and Rights at Work.
We’ve been a signatory to the UN Global Compact since it was established in 2000 – this is the world’s largest corporate sustainability initiative. We use the UN Guiding Principles on Business and Human Rights (UN Guiding Principles) to guide our approach.
How could we impact human rights?
As a global company we could impact human rights either directly, or indirectly through our business relationships. Our biggest impact could be on customers’ rights to privacy and free expression.
We must comply with lawful government requests for information about how people use our services and the content of their communications, but this could impact our customers’ rights to privacy.
Free expression includes the right to access information. As a communications company, we need to consider situations where we might need to limit people’s access to content. We could also affect: our people’s rights if our employment standards fall short; workers in our supply chain through our buying practices; and communities where we operate, if we don’t stick to environmental standards.
How do we manage human rights in BT?
Our ethical code sets out the standards we expect of our people and those who work on our behalf, including how they respect human rights.
We have a team dedicated to human rights integration and a Human Rights Steering Group chaired by a member of our Executive Committee. This year it considered a range of issues, including:
| – | contracts we’re monitoring for human rights issues |
| – | our second Modern Slavery Act statement and programme |
| – | our second privacy and free expression report |
| – | the impact on human rights when broadcasting large sporting events. |
What we’ve been doing this year
We’ve been pulling together our existing policies on human rights issues into one overarching policy. As part of that we’ve reviewed our operations in key countries outside the UK with the help of a leading law firm.
Due diligence
In April 2017 we launched our enhanced customer due diligence process. To embed the key principles with our sales teams we held calls andface-to-face training.
| a | wiltonpark.org.uk/wp-content/uploads/WP1546-Report.pdf |
| b | btplc.com/Thegroup/Ourcompany/Ourvalues/ModernSlaveryAct |
| c | gov.uk/government/news/leading-businesses-unite-to-tackle-slavery |
| d | ihrb.org/focus-areas/mega-sporting-events/2017-sporting-chance-forum-meeting-report |
In our due diligence checks we look for whether:
| – | our product/service could be used for defence, military, law enforcement, security or cybersecurity purposes |
| – | the customer or end user is a government, government agency or state-owned company |
| – | the service is being provided in an extreme or high-risk country (based on external measures). |
If these criteria are met we look into things in more detail – which might include contractual protections or internal monitoring arrangements.
Modern slavery
In June 2017 weco-sponsored a residential summit of international experts which explored the role of technology in tackling modern slavery. Building on the findingsa we’re establishing an industry collaboration to address the challenges and opportunities for technology to help end modern slavery.
We published our second Modern Slavery Act statementb in August 2017. It explained our progress and the steps we’ve taken to prevent modern slavery in our business and supply chain. We’re also reviewing our policies, processes and procedures with the help of external experts.
We’ve continued to support the UK Modern Slavery Helpline partnering with anti-slavery charity Unseen – for more details see our Delivering Our Purpose Report.
In October 2017 Gavin Patterson joined the first Business Against Slavery Forumc hosted by the Home Office. The forum is a way for companies to collaborate and drive change on identifying and tackling modern slavery.
Sport and human rights
Big sporting events have a hugely positive social impact. But they can also carry human rights risks like labour rights violations and community displacement.
Throughout the year we’ve continued working with the participants in the Mega-Sporting Events Platform for Human Rights. With input from other broadcasters, we’ve created a tool to help identify human rights risks when broadcasting. We presented it at the second Sporting Chance Forumd in November 2017. The team at BT Sport team are trialling the tool in their compliance processes.
Priorities for the year ahead
We’ll launch our overarching human rights policy and embed it in our business having reviewed our existing metrics to support the new policy.
We’ll be refreshing our privacy and free expression report with data on information requests in countries outside the UK. We’ll also cover what we do on cybersecurity.
| British Telecommunications plc Annual Report & Form 20-F 2018 | 21 | |||||
Table of Contents
As well as our people, our main stakeholders are customers, communities, lenders, pension schemes, suppliers, government and regulatory bodies.
People are the key to transforming our business. We want BT to be a place where people feel engaged and inspired to be the best they can be. We want them to use their skills and our technology to deliver great products and services for customers, communities and societies around the world.
Our people strategy is summed up by our ambition to be a great place to work. We want to deliver a great customer experience by getting our employee experience right. That means making BT a place where our people can do brilliant things. At the heart of this are our values.
Personal. Simple. Brilliant.
They guide our decisions and behaviours.
All of our people have a role to play in bringing our values to life – wherever they are and whatever job they do.
Our workforce
At 31 March 2018 we had 105,800 full-time equivalent (FTE) employees in 59 countries, with 82,200 based in the UK.
As our business evolves to meet our customers’ needs, we aim to reskill and redeploy our people to avoid redundancies where possible. Last year in the UK we redeployed almost 850 people, letting us keep experienced people with the skills we need for the future. More than a third of our redeployed people are in engineering or customer service. We’ve further developed their skills through training programmes.
Hiring talented people
We’ve increased awareness of BT as a brilliant employer by publishing engaging and informative careers content on social media. It’s making a difference. In 2017 we were recognised by Marketing Week as one of the ‘Best Places For Marketeers To Work’. Our content is continually liked and shared across social media and we’ve had over 1.3 million visits to our careers site.
This year, excluding acquisitions, we hired almost 14,100 people, of which almost 10,100 wereUK-based.
We’ve hired almost 2,400 engineers into Openreach as improving the quality of our customer relationships remains central to our people strategy.
Finally, we have converted almost 840 skilled agency workers to permanent employees because we recognise how important it is to keep experience inside our business.
Hiring more apprentices
We hired more than 2,100 new apprentices across the group in 2017/18. This is more than double the previous year’s intake, following the introduction of the apprenticeship levy in April 2017. We plan to take on a further 4,600 apprentices next year.
Hiring more graduates
This year, we recruited 460 graduates globally, and we plan to hire more than 480 next year.
Awards
Once again we’re in The Times Top 100 Graduate Employers. We’re one of only three companies in the IT and telecoms sector to feature in the top 100.
Recognition
We’ve been named ‘large employer of the year’ at the Scottish Training Federation and the BPP awards, and ‘creative and digital employer of the year’ at the Asian apprentice awards.
Reputation
We’re extremely proud our apprenticeship programmes have recently been graded ‘excellent’ in all areas in the latest Education Scotland audit.
Investing for growth
We never stop learning – whether that’s on the job or inface-to-face training. Our digital academy platform enables our people to solve problems and share knowledge and ideas with colleagues.
It’s how we adapt to a changing world and rise to tomorrow’s challenges. This year we’ve launched these new learning programmes:
Global new joiner programme | A refreshed induction for new hires, globally. We’ve rolled out corporate induction events and launched a new website for new joiners, which gets 14,000 visits a month.
| |
Business Essentials | A suite of foundation-level online learning resources for everyone in BT, covering 18 core skills.
| |
Management Essentials | These workshops help people managers to have better conversations with their team. The online platform helps them get to grips with the fundamentals of managing people at BT.
| |
Following 2016’s launch of the Fibre Academy and showcase, we’ve opened a new training centre called ‘Open Street’. It replicates the Openreach fibre and copper network from exchange to customer premises, with a working exchange, street cabinets, houses and business premises. It includes theend-to-end underground and over ground accessible network for our engineers to train and accredit on. It’s open for network demonstrations for BT as well as our external customers.
Investing for change
In such a fast moving industry we must invest in the skills, capabilities, methods and tools to define and deliver change in the
| 22 | British Telecommunications plc Annual Report & Form 20-F 2018 | |||||
Table of Contents
| THE STRATEGIC REPORT | GOVERNANCE | FINANCIAL STATEMENTS | ADDITIONAL INFORMATION | |||||||||
|
|
| ||||||||||
right way. We’ve developed a new change approach to improve our customer experience, growing our business and making BT an even better place to work.
Our change approach
We define change by understanding where we are today and what we and our customers need. We create a solution to deliver the change. And through this cycle, we take steps to engage our people.
Leadership
This year, we’ve invested heavily in leaders. We’ve appointed 42 senior leaders, with 19 of these coming from other organisations. We’ve launched the Connected Leaders development programme to identify the type of leaders we want to attract and develop internally. It’s been a huge success; with over 39,000 people accessing the online development platform, 8,000 leaders completing a personal development assessment and more than 700 attending our learning programmes.
We’ve also launched two new development programmes targeted at people with high potential.
Future Leaders | In 2017/18, we’ve taken on more than 300 people with high potential and developed them to become leaders for the first time. More than 40% of the 2016/17 cohort have gone on to become managers.
| |
Senior Talent Programmes | We’ve identified more than 80 senior leaders as having high potential for the future, and started accelerating their career development.
| |
Engaging our people
Around 93,000 (86%) of our people responded to our ‘Your Say’ engagement survey in January 2018. It’s our highest ever completion rate. The survey results show improved overall engagement at 74%. This is encouraging. There’s been a steady improvement in many categories since June 2017.
BT
|
| % Fav.
|
|
| Change
|
| ||
Engagement outcome
|
74%
|
+2%
| ||||||
Leading our people
|
59%
|
+5%
| ||||||
Managing our people
|
81%
|
+2%
| ||||||
Empowering and equipping our
|
61%
|
+2%
| ||||||
Enabling outstanding customer experience
|
64%
|
+3%
| ||||||
Working together
|
65%
|
+2%
| ||||||
Personal growth
|
73%
|
+3%
| ||||||
We tell our people about company results, major business decisions and other things that affect them through lots of different channels. Leaders regularly meet their teams through roundtables, town hall debates, site visits, webcasts and blogs.
We also listen to our people’s concerns through more formal engagement with our European Consultative Council, the
Communication Workers Union, Prospect and EE employee representatives in the UK.
Volunteering
Our 2020 ambition | ||
| 66% | Inspiretwo-thirds of | |
our people to volunteer
| ||
As part of our commitment to support charities and communities, (page 26), our people get up to three working days a year to volunteer. Volunteering means they can use their skills, energy and enthusiasm to tackle an issue or make a practical difference in their communities. Our volunteering website lists opportunities and lets everyone log activities centrally.
This year more than 2,000 of our people spent almost 5,000 days supporting our work to build a culture of tech literacy as Barefoot and Work Ready volunteers (see page 26).
Overall, 39% of our people registered their volunteering activity this year.
| British Telecommunications plc Annual Report & Form 20-F 2018 | 23 | |||||
Table of Contents
Our stakeholders continued
Diversity at work
We want a diverse workforce that matches our customers and delivers our business goals.
In March 2018 we reported our first Gender Pay Gap data under new government guidelines, relating to data from April 2017. Our gap is below the UK average. But we are still working hard to be more diverse and inclusive, and to have women better represented at all levels in our business.
Around 26% of our workforce and 28% of our management are women. Three out of eleven Board members are women (27%). And 42% of our new executive hires have been women.
By 2020 we want women in 40% of our most senior roles. To support this, we’re widening our Tech Women programme which develops talented BT women into senior roles where they’re underrepresented. This year we extended the programme to 172% more women than last year, including those outside the UK. In March, the programme won the BQF ‘Innovation in Diversity’ award.
We’ve also launched an extra employee network to connect mums who are returning to work. Our maternity return rate is 86%, measured one year after women returned to work.
We’ve been named in the Business in the Community’s 100 Top Employers for Best Employers for Race 2017.
Around 12% of our people have a Black, Asian or Minority Ethnic (BAME) background. Around 19% of our external appointments come from a BAME background.
Sponsorship helps build an environment where diversity is valued. So our senior leaders have had Inclusive Leadership workshops to help them overcome unintentional bias in decision making. We’ve also appointed executive sponsors for women, women in tech, race, disability and LGBT+.
Health, safety and wellbeing
Improving our people’s wellbeing is just the right thing to do. But it also drives better business performance.
The latest research is helping us determine what we need to do to foster good physical, psychological and emotional health in our workplace – beyond our commitment to ‘zero avoidable harm’. Our global health, safety and wellbeing policy sets out our approach and the Executive Committee and Board regularly monitor progress.
Our accident rate has dropped by a further 11% to its lowest-ever level and far fewer injuries are serious. Our risk profile is changing as we recruit more young people and we’ve responded by enhancing training and improving health and safety systems.
Fewer people took time off sick this year and our absence rate has dropped by 1% to 2.3% (against our 2.24% target).
Mental health is still our biggest focus. We endorse all the recommendations of the UK Government’s Stevenson/Farmer review. Prevention is key. Today work-related problems account for 16% of people seeking psychological support, compared with 36%
five years ago. We’ve strengthened our wellbeing support services through a peer-to-peer scheme and our success rate in getting people with mental illness back to their normal work has risen to 97%.
Pay and benefits
We regularly review our pay and benefits to make sure they’re competitive compared with similar companies.
Most of ourUK-based engineering and support people’s pay is negotiated through collective bargaining with our recognised trade unions. This means everyone gets treated fairly. Our managers’ pay ranges are also set at competitive levels. We work out bonuses through a mix of business performance and personal contribution.
Our executives may also get long-term share awards. These are discretionary and aligned to the long-term strategy of the company. What they get is determined by the group’s performance over a three-year period. Executive directors must keep hold of those shares for two more years.
In line with regulation, incentives for Openreach people are tied to a combination of personal contribution and Openreach’s performance, not the wider group. And these are paid in cash, not BT shares.
We support our people through retirement savings plans and country-specific benefits.
In the UK, after extensive consultation, we’ll be removing the eligibility for the majority of BT Pension Scheme members to accrue future benefits in that defined benefit scheme. Instead, these members and existing members will benefit from an enhanced contribution structure in our UK defined contribution plan – the BT Retirement Saving Scheme. This will provide more equal benefits across BT people in the UK and keep our pensions fair, flexible and affordable.
| You can read more about this on page 137. |
| 24 | British Telecommunications plc Annual Report & Form 20-F 2018 | |||||
Table of Contents
| THE STRATEGIC REPORT | GOVERNANCE | FINANCIAL STATEMENTS | ADDITIONAL INFORMATION | |||||||||
|
|
| ||||||||||
We listen to our customers, and have been investing to improve the experience they get from BT.
Our customers include UK individuals, households, businesses of all sizes and public sector organisations, plus companies around the globe.
You can read about our markets, customers and the services we offer them in our customer-facing units section, from page 48.
Some of our customers are also competitors. That’s because we sell wholesale products and services to other communications providers in the UK and overseas.
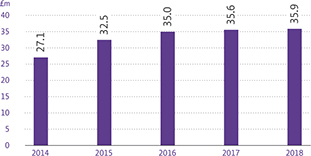
We’re at the heart of the UK’s digital strategya.
We use the power of communications to make a better world. The greatest impact we make to society and the economy is through our products and services, underpinned by our networks.
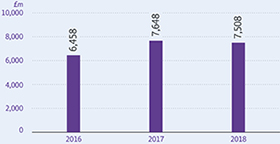
This year we invested nearly £36m in initiatives that further our societal and environmental ambitions and contribute to economic growth. That figure includes cash, time volunteered, and otherin-kind contributions. Over the last five years we’ve invested a total of £166m.
Total investment in society
Year ended 31 March
BT Group plc BoardCommittee for Sustainable and ResponsibleBusinessoversees these initiatives, in line with our shared value policy. We summarise progress on our societal ambitions below, with our environmental ambitions reported on page 31.
| And there are more details in our Delivering our Purpose report:bt.com/deliveringourpurpose | ||
| a | gov.uk/government/publications/uk-digital-strategy |
Providing access to fast broadband
| Our 2020 ambition | ||
| 9/10 | More than 9 out of 10 people | |
| in the UK will have access to | ||
| our fibre-based products and | ||
services
| ||
This year we supported the Government’s initiative to deliver superfast speeds (24Mbps or higher) to 95% of UK homes and businesses. Thanks in part to community fibre partnerships, our fibre broadband network now passes more than 27.5m premises. Our original 2020 ambition (above) has now been superseded by the new Openreach targets for fibre access (page 76). We are also extending our mobile network coverage across the country (page 57).
Promoting digital inclusion
| Our 2020 ambition | ||
| 10m | We will help 10m people | |
| overcome social disadvantage, | ||
| through the benefits our | ||
products and services can bring
| ||
Society is changing. ‘Digital’ is at the heart of this. Everybody should have both the access and skills to make the most of the digital world. Since setting this ambition in 2015, we’ve helped 4.6m people overcome social disadvantage:
| – | Our portfolio includes a lot of products and services for elderly, disabled and financially-disadvantaged people. And this year we established a partnership with the charity Action on Hearing Loss, to develop new propositions for their customers. |
| – | We’ve connected vulnerable communities in many parts of the world, bringing access to education, employment, financial support and healthcare. Our Connecting Africa initiative this year won the World Economic Forum’s ‘New Vision for Development’ award. |
We collaborate with our industry partners to develop new products to help the most vulnerable. This year saw two highlights through our partnership with TechHub:
| – | We launched Zone V (zonev.com) to make it easier for elderly or disabled people to use smartphones. |
| – | Tackling cybersecurity, we also ran a competition to ‘Secure the nation’. The winning SME – Chorus Intelligence – uses data analytics to support police in building intelligence cases to help solve crimes. |
Through our collaboration with Doteveryone, we continue to research public attitudes towards digital technologies. We use the results to help get more people online and develop the skills to make the most of technology – safely.
Our advisory role to the Government’s digital skills partnership means we can inform policy development and help shape the work of the public sector, NGOs and industry.
| British Telecommunications plc Annual Report & Form 20-F 2018 | 25 | |||||
Table of Contents
Our stakeholders continued
Building skills for the next generation
| Our 2020 ambition | ||
| 5m | We will help 5m children receive | |
| better teaching in computing | ||
and tech skills
| ||
Young people need techknow-how to thrive in the digital world. But there’s a risk that the next generation won’t have the skills to do the jobs of the future or shape a more inclusive society. As we build the UK’s future digital infrastructure, we can use our national footprint to help the next generation make the most of technology in life and work.
Starting in primary schools, the Barefoot Computing Project helps to equip teachers to teach children computational thinking like logic, sequencing, abstraction and programming – the building blocks of tech literacy. With our partners BCS, the chartered institute for IT, we’ve now helped train more than 57,000 teachers and, through them, more than 1.6 million children.
As children get older, we want to help them make more conscious choices in their online lives. So this year we’ve worked with 5Rights on an innovation hothouse to find new ways to help8-13 year olds navigate the commercial realities of the internet.
As they prepare to leave school, Work Ready gives16-24 year-olds – particularly from disadvantaged backgrounds – the skills development and work experience opportunities they’ll need to succeed in a tech-enabled workforce.
Supporting charities and communities
| Our 2020 ambition | ||
£1bn | We will use our skills and | |
| technology to help generate | ||
more than £1bn for good causes
| ||
This year we helped to raise around £109m for good causes. MyDonate, our commission-free online fundraising and donations platform, covered nearly £63m of this.
Our fundraising activities focused on three main charity partners, Cancer Research UK, Comic Relief and UNICEF UK. We provided ‘Text to donate’ for the charity appeals we supported. They included big regular appeals like the BBC’s Children in Need and raising money for the victims of the Grenfell Tower fire and Manchester Arena bombing.
Since setting this ambition in 2012, we’ve helped generate a total of £531m toward our £1bn target.
We pay close attention to our credit metrics.
Our lenders, mainly banking institutions and bondholders, play an important role in our treasury and balance sheet strategy.
These relationships are vital as we finance our business.
| You can read more about this on page 154. |
Our pension schemes need to be fair, flexible and affordable.
We must make sure our pension schemes are fair, flexible and affordable for all members. We operate defined contribution and defined benefit pension schemes. Most BT people working today are in the BTRSS defined contribution scheme. We also operate the BTPS defined benefit scheme which has around 300,000 members.
| You can read more about this on page 137. |
| 26 | British Telecommunications plc Annual Report & Form 20-F 2018 | |||||
Table of Contents
| THE STRATEGIC REPORT | GOVERNANCE | FINANCIAL STATEMENTS | ADDITIONAL INFORMATION | |||||||||
|
|
| ||||||||||
We use suppliers from across the world. We only choose ones that operate ethically and responsibly.
Our suppliers provide products and services that help us execute our strategy. We source from across the world and have suppliers in more than 150 countries. We spent around £13.7bn with suppliers this year (2016/17: £14.1bn). Around 92% of our spend is with our top 1,000 suppliers.
We have around 450 procurement people in 29 countries working with these suppliers.
This year we made a significant investment in our presence, capability and skill set within India, growing our team by 66. It now makes up 32% of our procurement organisation. Around 50 of our people took part in exchange visits to share best practice across cultures and enhance our capability. This is moving us towards our ambition of having a single global procurement team.
Procurement transformation
This year there was a major reshuffle of our procurement team, with a lot of changes:
| – | We created three buying teams – two focusing on our indirect (own use) and direct (customer) procurement needs and a third focusing on all ournon-UK spend. |
| – | We appointed newCFU-focused experts to manage conversations between procurement and CFUs. |
| – | We created a new scorecard which balances our performance between cost savings and things like risk, innovation and people. |
| – | We used external consultants and international benchmarks to understand the full range of commercial opportunities of our procurement categories and improve efficiency. |
| – | We carried out a detailed cost analysis of our complex networking equipment to identify further opportunities to reduce component costs. |
| – | With the University of Cambridge and a strategic supplier, we are collaborating on research to investigate how technology could be used to help vulnerable communities affected by climate change, and bridge digital divisions in society. |
Choosing our suppliers
We want to know who we’re doing business with and who’s acting on our behalf. So we:
| – | pick suppliers using principles that make sure we act ethically and responsibly |
| – | check that the goods and services we buy are made, delivered and disposed of in a socially and environmentally responsible way |
| – | measure things like suppliers’ energy use, environmental impact and labour standards as well as working with them to improve these. |
You can find out more atselling2bt.bt.com
Ethical standards in our supply chain
We want our suppliers’ people to work in safe and fair conditions. To help us assess the risks, we send an ethical standards questionnaire through an online portal or an industry standard self-assessment tool, Ecovadis. We follow up with anyone identified as high or medium risk, based on their responses.
We also visit supplier sites to make sure they meet our standards. This year we visited 52 sites (2016/17: 63 sites) around the world. To add to our resources, we trained four people in our India team to international audit standards. And they have since contributed to the assessments carried out this year.
We published our second Modern Slavery Act Statement in August. This year the focus was on due diligence practices in our supply chain.
We continued complying with the Dodd-Frank Act and the Security and Exchange Commission (SEC) requirements, by checking whether suppliers’ products contained minerals from conflict areas. In June 2017 we filed with the SEC our report for 2016 with the SEC, which described our conflict minerals approach and reflected the responses we received from suppliers.
Paying our suppliers
This year the average time between a supplier invoice and us paying them was 62 days (2016/17: 67 days).
Suppliers can also choose to use the BT Supplier Finance scheme which offers contracted suppliers the chance to be paid early. This cuts financing costs for whoever participates, large or small, and is particularly good for SMEs (who make up around 50% of our supply base). We remain a signatory of the UK Prompt Payment Code and support government initiatives to encourage small business growth.
We’re one of the largest suppliers of networked IT services to the UK public sector.
We work with almost 1,800 organisations across central, local and devolved government. And we support some of the UK’s most vital services – including critical infrastructure, welfare, tax, health and social care, police and defence.
Our public affairs team look after our UK political relationships. They’re responsible for Westminster (politicians and policy advisers) and Whitehall (the Government, including civil servants) on all issues of policy. They’re not responsible for operational issues like selling or maintaining contracts and services. That’s the job of Business and Public Sector (see page 59).
We have solutions designed for both central and local government. One of our most important contributions is helping organisations deliver better public services while keeping data secure. For example, this year we’ve supported the Metropolitan Police with the world’s largest rollout of body-worn video cameras. We’re also rolling outwi-fi which will allow front-line officers and more than 20,000 civilian staff to work more flexibly.
Supporting the armed forces community
The Government recognises us as one of the UK’s leading supporters of the armed forces community. This year:
| British Telecommunications plc Annual Report & Form 20-F 2018 | 27 | |||||
Table of Contents
Our stakeholders continued
| – | the MoD renewed the Employer Recognition Scheme (ERS) Gold Award it first gave us in 2014 |
| – | we helped make the MoD’s new Military Mental Health Helpline a reality. Launched in February 2018, it’s targeted at serving personnel and their families – allowing them to access the help, advice and support they need outside of work, anytime, anywhere in the UK. |
Civil resilience and other obligations
Another aspect of our relationship with government is that we can be required by law to do certain things and provide certain services. For example, under the Communications Act, we (and others) have to run or restore services during disasters. The Civil Contingencies Act 2004 also states that the Government can impose obligations on us (and others) at times of emergency or in connection with civil contingency planning.
The Secretary of State for the Home Department can also require us to take certain actions if they’re in the interests of national security.
We advocate clear, predictable and proportionate regulation.
Communications and TV services are regulated in the UK and around the world. This is to make sure that communication providers (CPs) and broadcasters stick to common standards and rules, and that nobody is disadvantaged by providers with strong positions in their market.
Overseas regulation
The degree of regulation in international markets varies widely.
This can hinder our ability to compete and provide the services our customers want. We continue to press incumbent operators around the world, and their regulators, for fairer, cost-related wholesale access to their networks.
European Union (EU) regulation
In EU countries, electronic communications networks and services are governed by Directives and Regulations set by the European Institutions. These create anEU-wide framework (the Common Regulatory Framework) for fixed and wireless telecoms, internet, broadcasting and transmission services.
The Directives are there to encourage competition, which in turn leads to better investment, lower prices and increased quality of service in fixed and mobile networks, and better protection for consumers. They require national regulators to review markets for significant market power (SMP) every three years and where relevant, to put in place appropriate and proportionate remedies.
They also include rules covering spectrum, consumer protection and universal service obligations.
Review of European rules for the communications sector | In September 2016 the European Commission (EC) proposed a review of the Common Regulatory Framework. As part of this review, the EC wants to encourage investment in very high-capacity networks and update consumer protection rules to reflect new types of services such as‘over-the-top’ providers. Negotiations are ongoing.
To protect audiences in anon-demand, internet environment, the EC is reviewing copyright and rules for audio-visual media services. Negotiations are ongoing.
| |
The UK’s exit from the EU | The UK is due to leave the EU in March 2019. Depending on any transition period or trade agreements, it may no longer have to follow the EU Regulatory Framework and other rules.
Existing regulations are recognised as having helped make the UK communications market one of the most competitive in the world. UK consumers get low prices and the best superfast broadband coverage in the major EU countries. So while existing regulations might be fine-tuned to suit specific UK market conditions, we don’t expect fundamental changes.
| |
| 28 | British Telecommunications plc Annual Report & Form 20-F 2018 | |||||
Table of Contents
| THE STRATEGIC REPORT | GOVERNANCE | FINANCIAL STATEMENTS | ADDITIONAL INFORMATION | |||||||||
|
|
| ||||||||||
UK regulation and Ofcom
The UK telecoms and broadcasting industries are regulated primarily by Ofcom (the UK’s independent regulator), within the framework set by European rules and UK regulations.
Ofcom operates under the Communications Act 2003, which gives it its powers and duties.
Ofcom’s main duties are to champion citizens’ interests on communications matters, and to further consumers’ interests by promoting competition.
Under the 2003 Act, Ofcom sets conditions that CPs must stick to. Some of these (the General Conditions) apply to all CPs. They deal mainly with things like protecting consumers, access and interconnection, and allocating and transferring phone numbers.
Other conditions apply only to certain companies who are universal service providers or who are found to have SMP in a particular market.
We’re the designated universal service provider in the UK (except for the Hull area where that role is taken by KCOM Group) and have to provide basic, affordable fixed-line services to all consumers. We also have to provide public payphones.
We have SMP in a number of markets including Business Connectivity (such as Ethernet and backhaul), Fixed Access
(including LLUa, GEAb and WLRc), Wholesale Broadband Access and Narrowband (such as Call Origination). That’s why Ofcom’s market reviews are so important to us.
Ofcom’s strategic review of digital communications | In July 2017 Ofcom confirmed it would release us from the Undertakings once the arrangements for our voluntary commitments were all in place. This included the employees working for Openreach being transferred to Openreach Limited and adopting the new model of functional separation for Openreach to secure greater strategic and operational independence.
Implementation of the new arrangements has gone well. Openreach Limited has been legally incorporated and the members of the Openreach Board were appointed as Directors of Openreach Limited in December 2017. The Openreach senior leadership team voluntarily transferred to Openreach Limited in January 2018.
| |
We have worked hard to implement all of the necessary changes that we can at this stage, and on 9 April 2018 BT formally adopted all the elements of the Commitments and Governance Protocol that can be adopted without triggering the TUPE transfer. We continue to work towards the TUPE of all employees working for Openreach to Openreach Limited as soon as practicable.
| ||
Price regulation of our main wholesale products
The following table shows which wholesale products provided to CPs are subject to price controls in markets where we have SMP.
Products | Annual charge control (2018/19) | Current charge control ends | ||||||
Fixed call termination
| 0.0323 ppm*
| 31 March 2021
| ||||||
| ||||||||
Mobile call termination | 0.495 ppm* (0.489 ppm from 1 June 2018)
| 31 March 2021
| ||||||
| ||||||||
ISDN2
|
CPI-CPI
| 31 March 2021
| ||||||
| ||||||||
ISDN30
|
CPI-CPI
| 31 March 2021
| ||||||
| ||||||||
Metallic Path Facility (MPF)
| £85.46
| 31 March 2021
| ||||||
| ||||||||
Ethernet (up to and including 1Gbps in geographies where BT has SMPd)
| CPI-13.5%
| 31 March 2019
| ||||||
| ||||||||
Generic Ethernet Access (GEA) 40/10
|
£69.59
| 31 March 2021
| ||||||
| ||||||||
Partial Private Circuit (PPC)e
| CPI-3.5%
| 31 March 2019
| ||||||
| ||||||||
Interconnect circuits
| CPI+0%
| 31 March 2021
| ||||||
| * | pence per minute. |
Other regulatory decisions and activities this year
Business connectivity market review (BCMR)
In April 2016 Ofcom published its Final Statement on its Business Connectivity Market Review. We disagreed with some aspects of this and appealed these to the Competition Appeal Tribunal (CAT). In July 2017 the Competition Appeal Tribunal (CAT) upheld our appeal on product market, geographic market and core network grounds. In November 2017, the CAT quashed Ofcom’s decisions on these aspects and told it to reconsider.
In response, Ofcom revoked the relevant parts of the 2016 BCMR. It then imposed temporary SMP findings and obligations on Ethernet services until March 2019 – using ‘exceptional’ and ‘emergency’ powers.
Ofcom consulted on adding dark fibre to the temporary obligations with effect from April 2018. On 12 April 2018 Ofcom confirmed that it would not be adding a dark fibre remedy to the temporary SMP remedies imposed in November 2017.
Wholesale local access market review (WLA)
Following the WLA market review in 2017, Ofcom made changes to Local Loop Unbundling (LLU ) and Virtual Unbundled Local Access
| a | Local Loop Unbundling. |
| b | Generic Ethernet Access. |
| c | Wholesale Line Rental. |
| d | The whole of the UK except the Central London Area, the central business districts of Birmingham, Glasgow and Leeds, and the Hull Area. |
| e | <8Mbps. |
| British Telecommunications plc Annual Report & Form 20-F 2018 | 29 | |||||
Table of Contents
Our stakeholders continued
(VULA ) product regulation. MPFa is still subject to aCPI-based charge control. SMPFb had its charge control removal and replaced with a fair and reasonable pricing obligation.
Ofcom has introduced a charge control for the GEA 40/10 lower speed product. The 55/10 and 80/20 products are subject to fair, reasonable andnon-discriminatory obligations, though not subject to a charge control – which means we still have some flexibility in how we price these other products.
Along with charge controls, Ofcom has implemented new minimum service level obligations (MSL) and a cap on duct and pole access prices.
Wholesale broadband access market review (WBA)
In June 2017 Ofcom consulted on the wholesale broadband access market. It proposed that the area with SMP (Market A) should be reduced from 10% to 2%. Ofcom have also proposed removing the charge control on our IP Stream Connect product. We’ve responded to the proposals and expect a final statement from Ofcom in summer 2018.
Narrowband market review (NBMR)
Ofcom completed a review of the narrowband market on 30 November 2017. This covered fixed call origination, call termination and WLR. It found that we held SMP in all these areas.
But it also recognised that alternative voice services were strengthening competition.
Ofcom decided to deregulate charge controls to ‘fair and reasonable’ charges, remove ‘undue discrimination obligations’ for Wholesale Call Origination (WCO) and bring in extra obligations on Wholesale Call Termination (including price controls and no undue discrimination).
Mobile regulation
On 24 September 2015 Ofcom published its final spectrum annual licence fees statement for 1800MHz and 900MHz spectrum. It trebled EE’s 1800MHz spectrum fees from c£25m to c£75m per year.
EE, supported by other mobile network operators, challenged that. The Court of Appeal quashed the Statement on 22 November 2017. It found that Ofcom should have considered its wider European law duties when setting the licence fees. EE will pay licence fees at the previous level until Ofcom issues a new determination. EE, along with other mobile network operators, is seeking repayment of the historical overpaid licence fees.
On 20 March 2018 the auction for both bands went ahead with results announced on 5 April 2018. BT/EE were awarded 40MHz of 3.4GHz spectrum. The location of the spectrum assignments within the 3.4GHz band were determined after further bidding in an assignment round on 10 April. BT/EE were allocated the 3540 – 3580 MHz spectrum frequencies. This result supports our 5G leadership ambitions.
Standalone landline telephone services
After a review of the Standalone Landline Telephone Services market, Ofcom has accepted our voluntary proposal to reduce line rental prices by £7 a month.
This price cut works with our further promise to only raise call and line rental prices in line with inflation (CPI) each year. It also sits alongside our commitment to engage with voice-only and ‘split purchase’ customers (who use us for landline and someone else for broadband) to make sure they are fully aware of potential savings available to them. Reduced line rental for voice-only customers came into effect from 1 April 2018.
Broadband Universal Service Obligation (USO)
In December 2017 the UK Government rejected our proposal to deliver universal broadband voluntarily.
Instead, the Government used secondary legislation to introduce a USO on broadband. It will give consumers the right to request at least a 10Mbps broadband connection from 2020. We’ll work closely with government, Ofcom and industry to make it happen.
Deemed consent
In March 2017 Ofcom found that Openreach had breached certain contractual and regulatory obligations by inadequately and retrospectively applying Deemed Consent to reduce compensation payments to CPs between January 2013 and December 2014.
Deemed Consent is an agreed contractual process between Openreach and its CP customers, which allows Openreach to reschedule the delivery date for providing dedicated business services (known as Ethernet) in a number of specific circumstances.
On 27 March 2018 Openreach reported to Ofcom that it had, in its view, complied with the requirements set out in Ofcom’s decision.
We estimate the total amount of compensation payments will amount to around £300m.
Automatic compensation
Following commencement of the Digital Economy Act 2017, Ofcom now has greater powers on automatic compensation. In March 2017, it consulted on proposals for introducing automatic compensation. It has accepted an updated industry scheme from leading communications providers, including us.
This voluntary scheme will automatically compensate fixed voice and broadband customers if they lose service, have a delayed order, or get a missed appointment. The scheme is due to start in February 2019, following extensive systems development.
| a | Metallic Path Facility (MPF). |
| b | Shared Metallic Path Facility (SMPF). |
| 30 | British Telecommunications plc Annual Report & Form 20-F 2018 | |||||
Table of Contents
| THE STRATEGIC REPORT | GOVERNANCE | FINANCIAL STATEMENTS | ADDITIONAL INFORMATION | |||||||||
|
|
| ||||||||||
For over 25 years we’ve been a leader in tackling climate change.
We set our first carbon reduction target in 1992. In 2008 we were one of the first companies in the world to set a science-based target to cut our carbon emissions intensity, by 80%. We achieved that four years early. Now we’ve gone a step further, setting an ambitious new target in line with the Paris Agreement on climate change.
Our leadership in sustainability and how to report it is widely recognised: we kept our place in the top 10 of Newsweek’s Green rankings, which track the environmental performance of the 500 largest publicly-traded global companies. Carbon Clear rated us as the second-best FTSE 100 company for carbon reporting. We achieved ‘A’ ratings from CDP on climate change and supply chain engagement.
On top of that, we continue to manage energy and water use; support the principles of a circular economy, and take seriously our responsibilities for the environment:
| – | Our Environmental Management Compliance Steering Board monitors performance against our environmental policy. It reports to the Audit & Risk committees of our business units, to regional governance committees outside the UK, and to ourExecutive Committee. |
| – | We assess climate-related and other environmental risks within our enterprise risk management framework (page 33). |
| – | This year our environmental management systems have been certified to ISO14001 standards in Belgium, Colombia, France, Germany, Ireland, Italy, the Netherlands, Spain and the UK. |
| – | We’re a signatory to the Climate Disclosure Standards Board’s fiduciary duty and climate change disclosure. |
Our Delivering our Purpose report atbt.com/deliveringourpurpose has more details.
Our net positive carbon impact
We’re already a net positive company. That means we help our customers cut their carbon footprints by more than double our own emissions (including our supply chain). We’re aiming for a 3:1 ratio by 2020.
Our 2020 ambition | ||
| 3:1 | Enable customers to reduce their carbon emissions by at least three times theend-to-end carbon impact of our business | |
3:1 ambition | 2016/17 | 2017/18 | ||||||||||||||
Customer savings (Mt CO2e)
|
10.0
|
11.3
| ||||||||||||||
| ||||||||||||||||
Our impact (Mt CO2e)
|
5.6
|
5.1
| ||||||||||||||
| ||||||||||||||||
Ratio
|
1.8:1
|
2.2:1
| ||||||||||||||
Cutting our customers’ carbon footprints
Many of our products and services help reduce our customers’ carbon footprints. This year we earned £5.3bn from these products, 22% of our total revenue.
Reducing our own emissions
This year we’ve set new ambition, which has been approved by the Science-Based Targets Initiative. It aligns our impact with the most ambitious aim of the Paris Agreement – to limit global warming to
1.5°C by the end of the century.
Our new 1.5°C ambition | ||
| 87% | By 2030, we aim to cut our carbon emissions intensitya by 87%, compared with 2016/17 levels
| |
ameasured by tonnes CO2e per £ value
| ||
To meet this target, we’re speeding up plans to cut our vehicle fleet emissions. This year we’ve added moreplug-in hybrid models to our company car list. We’re also exploring new ways to decarbonise our property estate and improve efficiency through technologies like IoT.
We report our greenhouse gas emission sources in line with UK regulations. In the last year we’ve reduced our total worldwide CO2
equivalent (CO2e) emissions by 8.9%. This year our scope 1 & 2 intensity totalled 26 tonnes CO2e per £m gross value added; a decrease of 6.8% from last year.
| British Telecommunications plc Annual Report & Form 20-F 2018 | 31 | |||||
Table of Contents
Our stakeholders continued
Our worldwide greenhouse gas emissionsa
Year ended 31 March
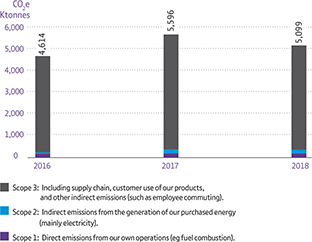
CO2e Ktonnes | 2016 | 2017 | 2018 | |||||||
Scope 3 | 4,391 | 5,233 | 4,758 | |||||||
Scope 2 | 51 | 184 | 160 | |||||||
Scope 1 | 172 | 179 | 180 | |||||||
Total | 4,614 | 5,596 | 5,099 | |||||||
Scope 1 + 2 intensity: | 21 | 28 | 26 | |||||||
(CO2e tonnes per £m value added) | ||||||||||
We now include all scope 3 emissions in our reporting. EE data is included from 2017 onwards. Figures exclude third-party consumption. Scope 2 data uses market-based calculation. For full methodology, and further data, see bt.com/deliveringourpurpose.
Abouttwo-thirds of our emissions come from our supply chain.
We’re working with our suppliers to reduce their impacts too. By 2030 we want to cut their emissions by 29% compared with 2016/17. This year, we’ve seen their emissions fall by 6.3%.
Cutting our energy use
This year our overall energy consumption dropped by 1.7%. We’ve cut our energy bill by nearly £29m, cumulatively saving £250m since our base year of 2009/10. In Great Britain, we spent around £370m on energy and fuel (2016/17: £341m).
Our worldwide energy use
Year ended 31 March
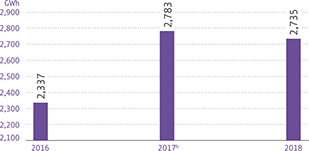
100% renewable electricity
We maintain our commitment that by 2020 we will buy all our electricity from renewable sources, wherever markets allow.
We’ve now renegotiated most of the electricity contracts we took on when we acquired EE, in line with that commitment, and we’re working on the rest. Overall this year 82% of our UK electricity, and 81% worldwide, came from renewable contracts (up from 78% and 77% respectively last yearb).
We also launched campaigns to encourage our suppliers, employees and home-mover customers to switch to buying renewable energy.
Other environmental impacts
Beyond our carbon footprint, we manage a range of other impacts, including the following:
Water use
We mainly use water in our offices and canteens, and in the cooling systems in our data centres and exchanges. We continue to monitor water use and target leaks. We’ve seen a 1% increase in our overall consumption this year, largely due to the adiabatic cooling systems we’re introducing to cut our reliance on refrigerant gases.
Waste and recycling
We work with our suppliers to minimise whatever materials we use, and we reuse or recycle equipment and materials whenever we can. We offer take-back schemes on many consumer products, including mobile phones. Complying with national regulations, we use specialist contractors to manage hazardous waste responsibly.
a We restate previous years’ data when we think subsequent information is materially significant (like replacing estimates with measured figures).
b 2016/17 energy figures restated – see bt.com/deliveringourpurpose for details.
| 32 | British Telecommunications plc Annual Report & Form 20-F 2018 | |||||
Table of Contents
| THE STRATEGIC REPORT | GOVERNANCE | FINANCIAL STATEMENTS | ADDITIONAL INFORMATION | |||||||||
|
|
| ||||||||||
Our approach to risk management
Like any business, we face a number of risks and uncertainties. Some come from outside our organisation, others from within. Some we can’t control, some we can. Many of our risks are similar to those felt by similar businesses.
Principal risks and uncertainties
The principal risks and uncertainties that affect us could have an impact on our business, brand, assets, revenue, profits, liquidity or capital resources. The principal risks we described last year have evolved, and so has our response to them.
Our Enterprise Risk Management framework gives reasonable (but cannot give absolute) assurance that we’ve identified and addressed our biggest risks. However, there may be some risks that are either currently unknown, or currently seen as less important but with the potential to become more so in the future.
Events outside BT present both risks and opportunities. We focus our efforts on predicting and reducing risks while aiming to take advantage of any opportunities that may emerge.
We recognise the uncertainty that political andgeo-political risks present, and have continued to operate a specific Brexit programme across BT that looks at how we might be affected and what our response should be. This programme is keeping a close watch on developments, and reports to a steering group chaired by our group CFO.
In the section below, we explain what we’re doing to prevent our main risks from materialising, or to limit their impact if they’re unavoidable. Our biggest risks and uncertainties should be considered alongside the risk management process, the forward- looking statements in this document and the associated cautionary statement (see page 211).
How we manage risk
To meet our objectives, build value and promote our stakeholders’ interests, it’s essential we manage risk. To help us, we’ve developed a group-wide risk management process with four stages:

Changes over the year
In 2016/17 we improved the way we manage risk through focussing on risks to our investment cases, developing an enhanced approach to root cause analysis, and identifying new ways to share good practice across the organisation. Specific further improvements this year included:
Three lines of defence
We’ve revisited our three lines of defence model (our approach to governing and assuring our business) and how we apply it to our key areas of risk. This has helped us identify areas where we can optimise our assurance. We’re also developing training around the three lines of defence to help our people better understand the model and how they support it.
External benchmarking/Internal review
We’ve been reviewing our risk management arrangements, using some external benchmarking and discussions with key internal stakeholders. This has helped highlight areas of strength and also areas where we can develop further. We’ll be addressing those findings next year.
Real-time war gaming
We’ve continued our cycle of war gaming during 2017/18, and this year also tested a crisis scenario in real time. This exercise involved numerous colleagues from across the business and the learnings will help us become more resilient to future events.
Enterprise risk framework
 |  | |||||
| Customer-facing unit | Group Risk Panel | Executive Committee | Board | |||
| and TSO leadership teams | The BT Group plc Risk Panel | The BT Group plc Executive | The BT Group plc Board has | |||
| Our customer-facing units and | supports the BT Group plc Board | Committeeidentifies, evaluates, | overall responsibility for | |||
| TSO follow our process for | and the BT Group plc Executive | responds to and monitors risks. | making sure we manage risks | |||
| managing risk as part of our | Committee. Every three months | Significant risks are reported | appropriately. It regularly | |||
| Enterprise Risk Management | it reviews the BT Group plc Risk | and monitored through the BT | reviews, either directly or | |||
| framework. That means | Register (which summarises | Group plc Risk Register. The BT | through the BT Group plc | |||
| identifying and responding to | those risks of greatest | Group plc Executive Committee | Audit & Risk Committee, how | |||
| the key risks affecting their | significance across our | assigns a management owner to | we’re doing across the group, | |||
| business. They record the risks | business), considers the | take charge of monitoring and | in our customer-facing units | |||
| for their leadership teams to | inclusion of new or emerging | managing each risk. It monitors | and in TSO. | |||
| review. Audit & risk committees | risks, and recommends ways to | risks through regular detailed | ||||
| in each customer-facing unit, | tackle them. It also oversees the | reviews as well assix-monthly | ||||
| TSO and our group functions, | work of the group risk | reviews of the BT Group plc | ||||
| make sure this process is | management function. | Risk Register. | ||||
| effective. |
| British Telecommunications plc Annual Report & Form 20-F 2018 | 33 | |||||
Table of Contents
Our principal risks and uncertainties Compliance risks | Trend indicates our perception of pre-mitigation risk | |||
| Significant control failure | ||||
Link to strategy in year
| Link to business model
| Trend
| ||
 – Deliver great customer experience – Deliver great customer experience | – Financial capital |
| ||
| – Human capital | |||
| ||||

It’s crucial that we maintain high ethical standards. We respect human rights and we don’t tolerate fraud, bribery, any form of corruption or any illegal or unethical activity.
We follow local and international law, including anti-corruption and bribery laws. The UK Bribery Act and US Foreign Corrupt Practices Act (FCPA) have extraterritorial reach, so cover our global operations. We also have to make sure we follow trade sanctions and import and export controls. We comply with the Modern Slavery Act and follow international standards on human rights, such as the International Labour Organisation’s Principles and the UN Guiding Principles on Business and Human Rights.
We also face the risks associated with inappropriate and unethical behaviour in local and other markets by our people or associates, such as suppliers or agents, which can be difficult to detect. There is also a risk that our controls, which are designed to prevent, detect and correct such behaviour may be circumvented. Controls and procedures, no matter how well designed and operated, can provide only reasonable assurance of achieving their objectives and there can be no assurance that any design will succeed in achieving its stated goals under all potential conditions, regardless of how remote.
Financial controls, and the assurance that exists over them, play an important part in our ability to prevent and detect inappropriate behaviour. Because of its inherent limitations, internal control over financial reporting may not prevent or detect misstatements. Therefore even those systems determined to be effective can provide only reasonable assurance with respect to financial statement preparation and presentation.
Potential impact
If our people, or associates like suppliers or agents, breach anti-corruption, bribery, sanctions or other legislation there could be significant penalties, criminal prosecution and damage to our brand. This could have an impact on future revenue and cash flow depending on the nature of the breach, the legislation concerned and any penalties. If we were accused of corruption, bribery, human rights abuses, violating sanctions regulations or other laws, it could lead to reputational damage with investors, regulators, civil society and customers. A breakdown in our financial control framework could result in financial misstatement.
What’s changed over the last year?
We’ve seen an increase in Speak Up (BT’s confidential hotline service) reports and conflict of interest registrations. In 2017/18 Speak Up reports increased by 63% on the previous year. This is indicative of a culture where people are more aware and confident to tell us about their concerns.
In terms of anti-corruption and bribery enforcement generally, we’ve continued to see a steady flow of significant cases from both the UK Bribery Act and the FCPA. In the US 11 companies paid a total of $1.92 billion to resolve FCPA cases in 2017.
There’s also been an increase in legislation (either enacted or proposed) to address and report on human rights abuses by companies.
How we’re mitigating the risks
This year we’ve implemented a major programme of work to strengthen our controls and compliance activities, and ensure awareness of the standards we expect. Following the identification of inappropriate behaviours in our Italian business in the summer of 2016, we have also implemented wider controls that monitor our overseas operations in our shared service centres, Global Services and at a group level, see page 92.
We’ve redefined and communicated our three lines of defence model, and strengthened our controls policies and procedures. This covered both financial andnon-financial controls, and we’vere-mapped our assurance coverage across the three lines of defence for our principal risks and uncertainties. This helped us identify opportunities to improve our controls policies and procedures, as well as to extend the assurance that operates over the controls. We’re also building awareness and understanding, and all finance employees have completed Financial Statement Fraud awareness training, including a module on how to escalate concerns.
We’ve also put a number of other controls in place to address risk in this area. These include an anti-corruption and bribery programme and ‘The Way We Work’, our ethical code, available in 14 languages. We ask all our people to complete training and sign up to The Way We Work which includes our zero tolerance to bribery and corruption. We’ve developed a new guide this year, ‘The BT Way’, which brings together for our people how we’re organised and deliver for our customers, our ethical code and our values.
We have policies covering conflicts of interest, gifts and hospitality, charitable donations and sponsorship. We also run tailored training for people in higher-risk roles like procurement and sales.
We regularly weigh up our business integrity risks to make sure we’ve got the right mitigation in place. We’ve introduced an Ethics & Compliance Integrity Risk Dashboard. It brings together various indicators to better identify possible emerging trends or particular hotspots. The approach draws together various themes to look for patterns and establish any outliers across our business.
All Speak Up reports are passed to the director of ethics and compliance for action. Our confidential hotline is operated by a third party and is available to employees and third-party contractors who can remain anonymous if they choose to. Any reports received direct by BT are also dealt with in accordance with our Speak Up procedures.
Our internal audit team regularly runs checks on our business. External providers also assess areas we think are higher risk (such as the use of agents), to make sure people understand our policies and that controls are working. We do due diligence checks on third parties like suppliers, agents, resellers and distributors. In 2017/18
| 34 | British Telecommunications plc Annual Report & Form 20-F 2018 | |||||
Table of Contents
| THE STRATEGIC REPORT | GOVERNANCE | FINANCIAL STATEMENTS | ADDITIONAL INFORMATION | |||||||||
|
|
| ||||||||||
we completed 32 reviews of our existing agents resellers and distributors. We take a risk-based approach to these reviews, which include external reviews, internalon-site reviews and desk-based reviews. Our procurement contracts include anti-corruption and bribery clauses. In addition all new suppliers, agents, resellers and distributors go through anon-boarding process which includes financial checks and the use of our due diligence screening tool. Existing suppliers, agents, resellers and distributors are additionally screened on a weekly basis.
Our sanctions policy helps us keep track of trade sanctions and export controls that apply to us. That means all bids involving a country which is subject to our sanctions policy requires approval. The policy also mandates everyone in BT to use our internal shipping system to arrange international exports, as it runs compliance checks and flags any orders which need an export licence.
We launched a customer due diligence tool which we use when
bidding for customer contracts. It identifies human rights risks and links them to the sanctions approval process. We’ve run training and calls to raise awareness of the tool. We’ve also carried out human rights impact assessments on our operations in India, Russia and China, and have developed an overarching human rights policy for imminent launch. We reported publicly on our most salient human rights risks in our Privacy and Free Expression Report in 2015, which we’re updating in 2018 to include parts of our international business. Our Human Rights Steering Group reviews our programme and discusses current issues. We’ve also been working closely with peers through organisations like the Business Against Slavery Forum and Global Network Initiative.
Despite our efforts, unfortunately not everyone gets it right every time. We disciplined 205 employees in the UK as a result of ethical misconduct this year, and 98 left the companya. The most common issues related to inappropriate use of company vehicles or falsified records such as timesheets.
| Processing our customers’ data | ||||
Link to strategy in year
| Link to business model
| Trend | ||
 – Deliver great customer experience – Deliver great customer experience | – Financial capital |
| ||
| ||||
We control and process huge quantities of customer data around the world, so observing data privacy laws is something we take extremely seriously. It’s essential that individuals and businesses can trust us to do the right thing with their data.
We make sure our customers’ data is secure, and protected against both internal and external threats (eg cyber attacks). Being trusted with our customers’ data goes further than that though. It means preserving the integrity of the personal data we process, and only keeping the things we need to provide customers with the services they’ve signed up for. It also means being transparent around how we use customer data, who we share it with, making sure the way we process personal data is legal, fair and in line with customers’ rights and wishes, and ensuring that we fulfil the legal obligations we have when customers want to exercise their rights under data legislation.
As a communications provider we currently operate under a stringent reporting regime to tell the UK Information Commissioner’s Office (ICO) if we become aware of a personal data security breach. We must also tell any affected individuals as quickly as possible if the incident is likely to have a significant impact on them. On 25 May 2018 EU General Data Protection Regulation (GDPR) will come into force. We are in the process of implementing more stringent procedures around data protection in order to comply with the GDPR requirements, which may lead to higher regulatory compliance costs.
An individual’s fundamental right to privacy is reflected in the fact that data privacy laws are in force in more than 100 countries. The nature of those laws vary across different parts of the world. Increasingly we (and other multinationals) have to show that we’re handling personal data in line with a complex web of national data laws and society’s ethical expectations.
Potential impact
Failing to stick to data protection and privacy laws could result in regulatory enforcement action, significant fines, class-action, prison sentences and the regulator telling us to stop processing data.
a UK only, excluding EE and Plusnet.
On top of that, we could see huge reputational damage and big financial losses. Those losses could come from fines and damages if we fail to meet our legal requirements, as well as costs resulting from having to terminate customer contracts and the subsequent customer churn. Companies who’ve had high profile data incidents have seen a significant impact to their share price and suffered ongoing costs from theirnon-compliance.
What’s changed over the last year?
The GDPR is deemed one of the biggest shake ups in data law for over a decade. It’s been created to update the existing law to ensure that individuals’ data is protected and secured and gives people a greater say as to how their data is used. It also increases their rights as to how their personal data is kept, used and retained by businesses. The sanctions for breaching the GDPR are significantly higher than under the previous regime, which could result in a substantial fine in the event of a breach.
Scrutiny from national regulators is increasing as companies are monitored to ensure they’re working towards compliance with the new law. In addition within the last 12 months several large companies have suffered further well-publicised data incidents and the general trend towards bigger financial penalties has increased.
How we’re mitigating the risks
We’ve created a compliance programme to review all activities that involve customer data across the business in light of the new regulatory requirements. Our focus will be on protecting our systems, enhancing our operational processes to protect customer data, and refreshing our training so that our people understand the importance of the data they handle.
We also want to give our people the tools they need to make everyday risk-based decisions around privacy and data protection without it being a burden or making their job more complicated. If we do that, there’s a much better chance of data compliance becoming ‘business as usual’. For example, using Privacy Impact Assessments when we develop new products and services makes
| British Telecommunications plc Annual Report & Form 20-F 2018 | 35 | |||||
Table of Contents
Our principal risks and uncertainties continued
Compliance risks
sure everyone understands privacy issues from the start and builds in the right controls, without any operational impact.
The Chief Privacy Officer and her team champion privacy awareness, and are responsible for undertaking monitoring and
assurance to make sure data compliance is embedded within the business.
Our mitigations against cyber attacks are described in our Security and resilience risk (page 43).
| Health, safety and wellbeing | ||||
Link to strategy in year
| Link to business model
| Trend | ||
| – Deliver great customer experience | – Financial capital |
| ||
| – Human capital | |||
| – Social capital | ||||
| ||||

Our people are crucial to our business and if they feel safe, healthy and happy they will perform better for our customers. Working to reduce the risk of harm to our people helps us comply with health and safety laws wherever we operate.
Many of our people, especially our UK engineers, work for much of the time in community settings where we have limited control over the working environment. Much of the network is carried above ground level and temporary work at height is a major risk for us – over the course of a year our people will undertake millions of climbing jobs. All of our people work in a fast-paced and highly competitive sector where change is constant and psychological pressures are significant. Managing physical and psychological hazards is therefore complex.
Potential impact
We work to make sure our people go home safely every day. Any health and safety failure could result in injury to our people or members of the public, financial penalties, and/or reputational damage.
The wellbeing of our colleagues is important if we’re to transform our business while continuing to recruit, retain and engage our workforce to deliver a great customer experience and grow the business. An adverse reaction to change could impact talent retention, resulting in a loss of critical skills and greater need for external recruitment, which would add cost to the business. Poor engagement also raises the risk of general industrial unrest and action.
What’s changed over the last year?
Changes in technology and working practices help to reduce the physical risks to our people. For example, the shift from copper to fibre in the network means our work involves less heavy manual labour, reducing the risk of musculo-skeletal disorders as a result. Conversely, people increasingly seek to attribute common health problems to past work activity with the aim of securing compensation, and the regulatory environment is getting harsher.
In parallel, a change in our workforce is increasing risks in areas such as driving. We’ve had a mature workforce with little labour turnover for many years. That cadre is reaching retirement age at the same time as demand for our products and services is increasing, and so we’re recruiting large numbers of younger people. The new intake has a different risk attitude, combined with less experience, so we need to make sure we put in additional safeguards with less reliance on expertise and individual judgement.
The pace of upgrading the network, fixed and mobile, has continued to accelerate. That increases our civil engineering workload and the hazards and risks associated with that type of work. The Grenfell Tower fire has raised awareness of fire issues –
we’ve reviewed cladding across the BT estate and we’re examining a range of other aspects of fire safety.
The pace and scale of change within the business has also continued to accelerate and we’re aware this has a psychological impact on our people. The risk of epidemic disease is constant; this year our main focus has been on pneumonic plague and influenza.
How we’re mitigating the risks
We’ve got a company wide and Board-endorsed health, safety and wellbeing strategy which has been refreshed this year. The Board receives abi-annual report which tracks key performance indicators and which forms the basis of a discussion of emerging issues. The strategy is cascaded through the chief executive to the operational businesses, each of which formulates its own plans and targets on an annual basis.
At an operational level, our managers take responsibility for making sure their teams know how to comply with health and safety standards. We monitor compliance using annual licensing, scheduled refresher training, competency assessments and accreditation processes for higher-risk groups. All our people undertake training in basic health and safety. Progress is monitored by a company wide health, safety and wellbeing forum chaired by the Group HR Director. Professional input is provided through a central centre of expertise which supplements advisers in the operational units.
This year we’ve completed a liability review and a material controls audit, both of which highlighted competency, accreditation and assurance as areas for attention. We’re undertaking a comprehensive revision of our health and safety training, with an emphasis on higher-risk activities. We make sure that training is externally accredited where possible and we’re extending the accreditation of our management systems where appropriate. We’ve adopted a three lines of defence approach and we’re enhancing our first and second lines of assurance as a result of audit recommendations. We’re procuring a new IT system which will help us better capture and share information.
We provide comprehensive support to our people to enhance their wellbeing. We provide extensive guidance on promoting good physical, psychological and emotional health. We launched this year a major programme on healthy change management. We train our managers to identify the early signs of distress and how to deal with them. This year we’ve supplemented that with a peer support scheme that uses our peoples’ experience of mental ill health to help their colleagues. We provide funded treatment services for mental health and musculo-skeletal disorders and have achieved a 95% rehabilitation rate.
| 36 | British Telecommunications plc Annual Report & Form 20-F 2018 | |||||
Table of Contents
| THE STRATEGIC REPORT | GOVERNANCE | FINANCIAL STATEMENTS | ADDITIONAL INFORMATION | |||||||||
|
|
| ||||||||||
Strategic and financial risks
| Competition and technology risks | ||||
Link to strategy in year
| Link to business model
| Trend | ||
 – Invest for growth – Invest for growth |  – Financial capital – Financial capital |
| ||
| ||||

Our markets are characterised by intensifying competition from established players and new entrants. This competition compounds some of the external challenges that we see in the market place, notably:
| – | fixed broadband and mobile connectivity nearing saturation, with most segments of the UK telecoms markets now growing below the rate of inflation |
| – | customers seeking fast migration from higher-margin legacy products to fully digitised, converged, secure, faultless solutions |
| – | efficient markets demanding clear differentiation for premium pricing, driving price deflation of basic connectivity and data |
| – | high exit barriers, prolonging and intensifying competition even when selected companies in the sector are struggling to generate economic returns. |
Technology change is also a key characteristic of our sector. We need to be able to identify emerging technologies, assess how customers will adopt these technologies, and invest accordingly, frequently a long-time before the demand materialises. We also need to respond to changes in the use of existing technology, such as the exponential growth the sector has seen in data consumption and network capacity requirements.
Potential impact
Intensified competition can result in lower volumes and/or prices than we currently forecast. If we do not respond effectively to competition then we can lose market share, revenue and/or profit.
In addition, new technology developments can lead to accelerated obsolescence of our current products, increased investment requirements, new sources of competition and/or the deterioration of our competitive position. This in turn can result in lower volumes and prices, stranded assets and higher costs. A failure to invest optimally in technology today can have implications for our market position and ability to generate future returns.
What’s changed over the last year?
Set against a challenging economic climate, in which the outlook for the UK economy has deteriorated, our leading competitors have been very active over the last 12 months. Important developments included:
| – | a move into fibre through a partnership with an existing provider |
| – | expansion of existing UK fibre networks |
| – | the launch of‘zero-rated’ mobile data propositions. |
Technological developments and changing customer preferences also continue to create risk to our business model. For example:
| – | While mobile data usage continues to grow, prices per gigabyte of network traffic have continued to fall. The ongoing profitability of our mobile operations hinges on our being able to successfully monetise mobile data growth in the face of strong competition. |
| – | Support for a large-scale deployment of FTTP infrastructure among key stakeholders has increased. However, there is still material uncertainty as to whether a viable economic case can be found for large-scale deployment. The economic case for FTTP remains challenging given superfast broadband coverage now exceeds 90% and the majority of end users are currently only willing to pay a low premium for additional speeds. |
How we’re mitigating the risks
We’ve evolved our strategy to reflect this environment, with renewed focus on:
– delivering differentiated customer experiences;
– investing in integrated network leadership;
– transforming our operating model.
We believe this is the best way for us to stay ahead of our competitors and to generate long-term, sustainable value growth. We’re also working with stakeholders to help develop an environment that both encourages and facilitates investment in a large-scale FTTP environment.
We also keep a close eye on technology developments that could impact us achieving our strategic goals, including through our Board Technology Committee. This Committee, chaired by the CEO, agrees our technology strategies, monitors emerging trends and oversees technology risk management across the group.
| British Telecommunications plc Annual Report & Form 20-F 2018 | 37 | |||||
Table of Contents
Our principal risks and uncertainties continued
Strategic and financial risks continued
| Communications industry regulation | ||||
Link to strategy in year
| Link to business model
| Trend
| ||
| – Financial capital |
| |||
| ||||
 – Manufactured capital
Regulation affects much of what we do.
In the UK, where Ofcom identifies competition concerns in communications markets, it can set rules requiring us to provide certain services on specified terms to our customers. Ofcom reviews markets regularly and can introduce, extend, relax or remove rules as a result of its findings. It has powers to conduct specific investigations about market behaviour, including price levels. In addition, Ofcom can set out rules for spectrum auctions and to ensure consumer protection in the sector.
Ofcom will investigate our compliance with regulatory requirements and can impose fines and restitution on us if we fail to comply.
Following the Government’s rejection of our voluntary commitment, a broadband universal service will now be delivered through a regulatory obligation. We acknowledge the impact that this will have on industry and the risks attached to a regulatory broadband USO. We will work hard with Ofcom to find a solution that works for our customers and society, and that minimises the distortions for industry.
Ofcom also has powers to regulate the terms on which we’re supplied with certain services by others – for instance, mobile call termination – and can sort out disputes between us and other communications providers about the terms on which services are supplied. Appeals of regulatory decisions also give rise to risks (and opportunities).
Outside the UK, regulation defines where and how we are able to compete through licensing rules and defining the terms on which we are able to access networks of incumbent operators.
Potential impact
Some of our revenue comes from supplying wholesale services to markets where Ofcom has found us to have significant market power. Most of this revenue relates to services where regulation requires us to cut average prices each year by a specific, real-term percentage for a three-year period.
Where other telecoms providers ask Ofcom to resolve disputes with us, there is a risk that Ofcom may set the prices at which we supply services, make us provide additional services and/or impact how we structure our business. In some circumstances, Ofcom can adjust past prices and make us pay back amounts to wholesale customers.
Regulation outside the UK can hit our revenue too. For example, overly-restrictive licensing requirements or ineffective regulation of access to other networks mean we might not be able to compete fairly. Regulation can also define and control the terms of access to necessary regulated inputs, which raises our costs.
What’s changed over the last year?
Ofcom has concluded market reviews in relation to wholesale narrowband access, wholesale local access and wholesale
broadband access. They have also decided not to impose a temporary remedy requiring BT to provide a restricted form of dark fibre (at and below 1Gbit/s) in the leased lines markets, but will consider this again in their upcoming business connectivity market review. We have summarised this on page 29.
We successfully appealed Ofcom’s Business Connectivity Market Review (BCMR) statement to the Competition Appeal Tribunal which found in our favour and remitted the decision back to Ofcom. It has also started its next market review on BCMR.
In the retail market, Ofcom also expressed concerns in relation to the prices charged to voice-only customers. We’ve responded to Ofcom’s concerns by agreeing to cut those prices. We’ve also introduced an automatic compensation scheme for slow repairs, missed appointments and delayed installations. Ofcom has also revised the General Conditions and the changes will come into force in October 2018.
Alongside the standard cycle of market reviews, we’ve been working hard to deliver on the Commitments made to Ofcom in March 2017 as part of its Digital Communications Review. We’ve made significant progress in this area, and have now introduced changes to our internal processes to ensure that we comply with both the letter and spirit of the commitments.
How we’re mitigating the risks
We have a strong team of regulatory and policy specialists. Together with legal experts, compliance and operational teams they guard against potential risks and look for opportunities to positively shape the regulatory regime at the right time and in the right way. They engage regularly with regulators, government, consumer organisations and other key stakeholders to build trust and to understand their outlook. They communicate our positions in a clear, consistent and straightforward way. Their insight also helps us to forecast future regulatory outcomes. We can then build sensible assumptions into our financial plans and investment decisions.
We push for clear, predictable and proportionate regulation that enables BT to succeed by delivering what customers and society want. Whenever there are market reviews, charge controls, disputes or investigations, we submit evidence and analysis. This helps us manage the risks around decisions in any particular year.
We can judicially review regulatory decisions and appeal to the Competition Appeal Tribunal. We can also raise disputes or complain (under the relevant regulatory framework or competition law) where we have problems getting access to wholesale services or to other access networks.
We’re also working hard to deliver a great customer experience, going beyond our minimum regulatory obligations.
| 38 | British Telecommunications plc Annual Report & Form 20-F 2018 | |||||
Table of Contents
| THE STRATEGIC REPORT | GOVERNANCE | FINANCIAL STATEMENTS | ADDITIONAL INFORMATION | |||||||||
|
|
| ||||||||||
| Political risk | ||||
Link to strategy in year
| Link to business model
| Trend
| ||
| – Deliver great customer experience | – Financial capital |
| ||
| – Human capital | |||
| ||||
Across our operations we are exposed to the effects of political and geopolitical risks, in particular:
| – | In the UK, internet access is increasingly seen as an essential part of people’s lives. As a result, political debate continues to focus on network coverage, quality and speed of service, as well as broader issues of online safety and security. As well as providing a critical element of the UK’s national infrastructure, both fixed and wireless, we’re also engaged in supporting high-profile programmes such as BDUK and the Emergency Services Network. |
| – | The result of the UK referendum to leave the European Union (‘Brexit’) significantly increased political uncertainty. This continues to impact political debates around the United Kingdom, such as the possibility of a second Scottish Independence referendum and the complex situation in Northern Ireland including border matters. |
| – | Outside the UK, political and geopolitical risk can impact our business through changes in the regulatory and competitive landscape – an example is the US Administration’s changed approach to trade policy - but also as a direct threat to our people and assets as a result of social unrest or a breakdown in the rule of law. |
Potential impact
Political uncertainty can have direct financial consequences across the economy, impacting for example foreign exchange rates, the availability and cost of capital, interest rates and also resulting in changes in the tax regime. For BT specifically, the most significant impact of political risk is its potential interaction with some of our other Principal Risks. In the UK, we’re seeing an increasing overlap between political debate and the regulatory environment, with the potential that our Communications Industry Regulation risk increases as a result.
The impacts of Brexit are still uncertain while the UK’s future trading and transition relationship with the EU is determined, albeit the agreement in principle on a number of withdrawal measures was welcome, notably the commitment to protect the rights of EU citizens living in the UK and vice versa. There is the potential for our costs to increase, for example through any changes required to our systems to reflect new taxes or customs duties or other processes. Our regulatory risk could increase if there were to be future divergence with the EU regime. Our suppliers may face disruption as a result of challenges in their own organisations and supply chains. Also, delivering a great customer experience and great network will become more challenging if it is harder for us to recruit and retain skilled talent and to source sufficient construction workforce. The UK economy may also suffer as a result of this uncertainty.
Geopolitical risk outside the UK can most clearly impact our Communications Industry Regulation risk, but also our Security and Resilience risks where it poses a threat to the continuity of our operations.
What’s changed over the last year?
This has been a complex year, given the 2017 General Election, EU Withdrawal Bill, Brexit negotiations and other policy measures. A second Scottish Independence Referendum became less imminent as the SNP has a significantly reduced number of Scottish seats (albeit a majority still). In December 2017, the Government reached agreement in principle with the EU on divorce measures around people, money and Irish border principles; negotiations early in 2018 focused on finalising withdrawal issues and also moved on to transition and trading arrangements. What trading relationship the UK/EU will end up with and by when is unclear.
In the UK, the conclusion of Ofcom’s Digital Communications Review (DCR) has resolved some of the uncertainties that affected BT 12 months ago. The agreement we reached with Ofcom at the conclusion of the review has led to the creation of a new, independent board for Openreach, which is working well. Openreach is doing its own independent work to plan its fibre rollout, in open consultation with the rest of the industry. The Government has now established a Future Telecoms Infrastructure Review, which we hope can provide additional certainty for companies and investors about how the policy and regulatory framework can promote long-term decision-making and, as a consequence, underpin future 5G and fibre deployment.
How we’re mitigating the risks
We maintain strong engagement with the UK Government, key departments, MPs, peers, the media and with business and consumer bodies. We also engage closely with governments and politicians in Brussels and in our key markets around the world. We seek to inform public debate around telecommunications through fact-based evidence concerning the market and our role within it.
We’ve progressed the programme across the business to help us understand and manage the risks associated with Brexit. This also considered other potential impacts such as those associated with a second Scottish Independence referendum, and the border questions on the island of Ireland, and is led by a steering group chaired by the group CFO. We’ve also offered our views to Government, Parliament and business groups on related policy areas, such as R&D, data flows, trade and people/skills matters.
Outside the UK, our Public Affairs and regulatory teams work to help support governments and regulators in ensuring that markets work in an open and fairly regulated way for the benefit of customers and competition. Geopolitical risks are closely monitored, with our security and business continuity teams particularly focused on protecting our people and our assets.
| British Telecommunications plc Annual Report & Form 20-F 2018 | 39 | |||||
Table of Contents
Our principal risks and uncertainties continued
Strategic and financial risks continued
| BREXIT | ||||||||
| There continues to be significant uncertainty following the UK’s vote to leave the European Union (EU). We are making sure that we’re prepared for the final outcome of negotiations between the UK and the EU. We also wish to help inform the debate where relevant to our sector and our company. | How we managed the risk We decided early on that we needed to understand what risks and opportunities Brexit might create for us, so ahead of the vote we set up a programme bringing together functions across the business.
We then ramped up the activity after the vote, forming a steering group chaired by the group CFO. Over the last two years or so, it has overseen work that is being done by varioussub-projects. These are looking at areas such as the tax, people, procurement, systems, regulatory and commercial impacts of Brexit. This year we’ve continued to offer our views to government on related policy areas, including responding to Parliamentary inquiries and consultation documents (on migration and on trade for instance), and working with business and sector associations to explain issues. We’ve also progressed our contingency planning, including identifying when we might need to put these plans into effect.
The result, and what we learnt The nature of the Brexit negotiations have created a period of prolonged uncertainty. The readiness work that we’ve undertaken across the business means we can provide confidence of our resilience to our people, our customers and our suppliers.
|
| ||||||
| 40 | British Telecommunications plc Annual Report & Form 20-F 2018 | |||||
Table of Contents
| THE STRATEGIC REPORT | GOVERNANCE | FINANCIAL STATEMENTS | ADDITIONAL INFORMATION | |||||||||
|
|
| ||||||||||
| Pensions | ||||
Link to strategy in year
| Link to business model
| Trend
| ||
 – Transform our costs – Transform our costs | – Financial capital |
| ||
| – Human capital | ||||
| ||||

We have a large funding obligation to our defined benefit (‘DB’) pension schemes. The largest of these, the BT Pension Scheme (BTPS or Scheme), represents over 97% of our pension obligations. The BTPS faces similar risks to other UK DB schemes: things like future low investment returns, high inflation, longer life expectancy and regulatory changes may all mean the BTPS becomes more of a financial burden.
Potential impact
The next valuation of the BTPS is scheduled to take place as at 30 June 2020 and an increase in the pension deficit may have an impact on the level of deficit payments we are required to make into the Scheme. Indirectly it may also have an adverse impact on our share price and credit rating.
Any deterioration in our credit rating would increase our cost of borrowing and may limit the availability or flexibility of future funding for the group, thereby affecting our ability to invest, pay dividends or repay debt as it matures.
What’s changed over the last year?
The actuarial valuation of the Scheme as at 30 June 2017 was announced in May 2018. This provides certainty over the level of cash contributions required until the next triennial valuation is concluded, taking place no later than as at 30 June 2020.
As part of the actuarial valuation, we discussed the Scheme’s approach to investing assets with the Trustee. The resulting changes which should help protect the BTPS from volatile investment returns and high inflation by investing in a way which provides greater certainty over the Scheme’s ability to meet benefit payments over the longer term.
When a valuation is calculated, the funding position is affected by the financial market conditions at the valuation date. When determining expected future returns on the Scheme assets,
different factors are taken into account, including yields (or returns) on government bonds. If assets returns are lower than expected over the period to the next valuation, or a lower future investment return assumption is adopted at the 30 June 2020 valuation, the deficit would likely increase, potentially leading to a higher level of future deficit payments.
In March 2018, we announced the closure of Sections B and C of the BTPS to future benefit accrual (which represents more than
99% of the BTPS active membership), having reached agreement with the relevant Unions. Although we will establish a new hybrid pension arrangement fornon-management employees in the BTPS at closure, the changes reduce the financial risks associated with providing future defined benefit pension accrual. We currently expect to close Sections B and C of the BTPS from 30 June 2018 when employees will join the BT Retirement Savings Scheme, our main defined contribution arrangement, for future pension accrual.
How we’re mitigating the risks
The investment performance and liability experience are regularly reviewed by both us and the Trustee of the BTPS. We also consider the associated risks and possible mitigations. The investment strategy aims to partly mitigate the impact of increases in the liabilities, for example by investing in assets that will increase in value if future inflation expectations rise. The assets held are also well diversified, softening the impact of sharp drops in the value of individual asset classes. This helps us maintain a reasonable balance of risk and return.
Our financial strength and cash generation provide a level of protection against the impact of changes in the funding position of the BTPS. The funding liabilities also include a buffer against future negative experience, as legislation requires that we calculate liabilities on a prudent basis.
| British Telecommunications plc Annual Report & Form 20-F 2018 | 41 | |||||
Table of Contents
Our principal risks and uncertainties continued
| Financial risk | ||||
Link to strategy in year
| Link to business model
| Trend | ||
|
|
| ||
In common with other major international businesses, we’re exposed to a variety of financial risks. These include treasury risks, which arise principally from market risk (including interest rate risk and foreign exchange risk), credit risk, and liquidity risk. They also include tax risk, principally that we need to understand fully the current and future tax consequences of business decisions to comply with tax rules and avoid financial and reputational damage.
Potential impact
If there is an adverse movement in foreign exchange and interest rates there could be a negative impact on the group’s profitability, cash flow, and balance sheet. Sensitivity in the income statement and shareholders’ equity arising from interest rate and foreign exchange volatility is shown in note 25 to the consolidated financial statements.
The failure of Treasury counterparties to honour financial obligations could have an adverse impact on the group’s liquidity (for example from the loss of cash deposits) and profitability (for example from increased finance expenses). A deterioration in liquidity could have an adverse impact on the Board’s assessment of going concern, particularly if combined with an inability to refinance maturing debt.
If we fail to comply with tax rules then we could face financial penalties and reputational damage. Beyond compliance, if we don’t adequately reflect the current and future tax consequences in our business decisions, we might make bad decisions resulting in financial loss and potentially financial misstatements, as well as reputational damage.
What’s changed over the last year?
We continue to face the same treasury risks as in financial year
2016/17.
From a taxation perspective, our business continues to evolve rapidly, creating different tax consequences, for example the bringing together of EE and the BT Consumer customer-facing units, the Openreach industry consultation on large-scale FTTP, and a review of our pension provision. During the year, new UK legislation was introduced, which restricts deductions for interest expense and which reduced the ability to offset profits with prior year losses. Accounting changes can also have tax consequences, for example, forthcoming changes to accounting for revenue from contracts with customers and accounting for leases. Global tax rules also continue to evolve, for example the OECD’s Base Erosion and Profit Shifting project, US tax reform, the European Commission’s challenge to tax practices under state aid provisions, and EC and UK proposals for the introduction of an interim digital services tax. All these change the current and future tax consequences of business decisions.
How we’re mitigating the risks
We have a centralised treasury function whose primary role is to manage liquidity and funding requirements as well as our exposure to associated financial and market risks, including credit risk, interest rate risk and foreign exchange risk,in-line with Board-approved policies. These risk management policies are described in detail in note 25 to the Consolidated Financial Statements. The Board reviews liquidity and funding requirements of the group on an ongoing basis.
A strong governance framework is also at the heart of our mitigation approach to tax risk. We’ve a framework for managing taxes that is set centrally and agreed by the Board. We employ suitably qualified professionals to manage and assure the operation of this framework. We seek to pay tax in accordance with the laws of the countries where we do business. However, in some areas these laws are unclear, and it can take many years to agree an outcome with a tax authority or through litigation. Nevertheless, we always seek open and constructive working relationships with tax authorities worldwide, engaging reputable independent advice where required.
| 42 | British Telecommunications plc Annual Report & Form 20-F 2018 | |||||
Table of Contents
| THE STRATEGIC REPORT | GOVERNANCE | FINANCIAL STATEMENTS | ADDITIONAL INFORMATION | |||||||||
|
|
| ||||||||||
Operational risks
| Security and resilience | ||||
Link to strategy in year
| Link to business model
| Trend | ||
| – Deliver great customer experience |  – Financial capital – Financial capital |
| ||
| – Intellectual capital | ||||
| ||||
 – Manufactured capital
Our commercial success is firmly rooted in our reputation for the security and resilience of our services. So we strive to maintain the highest standards of protection and incident management in order to confront the natural perils, network and system faults, and malicious acts that threaten our operations.
By monitoring cyber attacks on our networks and systems and our peers and customers, we see that hacking tools, phishing scams and disruptive malware are becoming more sophisticated and yet more accessible to attackers. In response, we continue to develop our cyber defence capability and invest more in automatic detection and prevention systems. We recognise that services can also be interrupted by events such as supply chain failure, software changes, equipment faults, fire, flood, infrastructure outages and sabotage.
Potential impact
The consequences of security and resilience risks can include major financial loss, long-term damage to reputation and loss of market share. Regulatory sanctions, fines and contract penalties might be applied, contracts might be terminated, and costly concessions might be needed, together with unplanned and rapid improvements to retain business and rebuild trust. We might also miss opportunities to grow revenue and launch new services ahead of the competition.
What’s changed over the last year?
Cyber attackers are learning how to defeat conventional defences such as Anti-Virus (AV), proxy servers, and basic authentication. They are changing malware signatures faster than AV vendors can deliver matching identity files, launching Denial of Service (DoS) attacks that are disguised as legitimate traffic at the application level, and using increasingly convincing phishing emails to trick users into giving access to restricted systems. The growth in ransomware attacks has made headline news and caused significant disruption to some of our corporate customers, but we have so far managed to avoid such consequences. Our incident management teams are gaining experience from these events and applying lessons learned to improve our responses. We’re also helping customers by sharing this expertise.
We’ve increased the use of Artificial Intelligence (AI) in our cybersecurity operations to process the vast amount of data available. We use our own Saturn system to visually filter the information and help our analysts perform investigations. We’re
trialling further AI innovations that will detect network anomalies in large volumes of data, and learn patterns of how malware propagates.
Looking at other drivers of service interruption, 2017/18 has been relatively benign for the UK in terms of extreme weather events. However, accepting that the risk is increasing, we’ve continued to enhance our overall flood/storm preparedness. We’ve also been working with the Government and other utilities in planning for a ‘Black Start’ (major shutdown of the national power transmission system) scenario.
How we’re mitigating the risks
We’re making risk improvements involving people, processes and technology - prioritising the work according to our assessments of security and resilience exposure. The proportion of our network and systems that is monitored and logged continuously is rising steadily, and the security awareness of our employees is being enhanced by advanced training modules and mock phishing exercises.
Segmentation of our IT estate at the data centre level is now complete, and we’re turning our attention to micro-segmentation at the applications level as we provision new cloud-based systems. The results of ‘Red Team’ exercises by our ethical hackers are driving improvements across BT, particularly where access controls are found to need upgrading. We’ve also been tightening our control of sensitive personal data in preparation for the EU GDPR. This has prompted significant improvements in our IT inventory, which in turn makes it easier to manage major cyber incidents.
Mobile, geographically dispersed, emergency response capabilities are now operating at full designed capability. We’ve built on our site-specific flood defence plans, and completed specialist flood surveys of our most critical at risk assets, with a view during 2018/19 to deploying permanent flood defences as appropriate.
Members of our Emergency Response Team were deployed to the Caribbean to utilise their skills in providing emergency communications in response to hurricanes Irma and Maria. They were also able to use our improved approach to supporting community isolation situations in assisting the emergency services following the Grenfell Tower tragedy.
| British Telecommunications plc Annual Report & Form 20-F 2018 | 43 | |||||
Table of Contents
Our principal risks and uncertainties continued
Operational risks continued
| Employee engagement | ||||
Link to strategy in year
| Link to business model
| Trend
| ||
| – Deliver great customer experience | – Human capital |  | ||
Our people are central to everything we do and a vital part of our ambition to deliver a great customer experience and sustainable, profitable revenue growth. Our people strategy supports this ambition by creating an inclusive and enjoyable workplace so that our people can thrive as part of a dynamic business. Great employee engagement is necessary to ensure we meet our strategic aims.
Potential impact
We need to transform our business while also continuing to recruit, retain and engage our workforce to deliver a great customer experience and grow the business. An adverse reaction to change could impact talent retention resulting in a loss of critical skills and greater need for external recruitment, which would add cost to the business. Poor engagement also raises the risk of general industrial unrest and action.
What’s changed over the last year?
We limited pensionable pay increases for some members of the BT pension scheme and subsequently initiated a review of our UK pension arrangements. Following the review, we decided to close the BTPS to ensure that our pension arrangements are fair, flexible and affordable for both employees and BT, which included enhancements to our defined contribution pension scheme.
We continue to work through the people implications of making Openreach a separate legal entity in response to the outcome of the Digital Communications Review. We also announced the creation of a new Consumer team that brings together the BT Consumer and EE businesses.
How we’re mitigating the risks
We’ve undertaken extensive consultation with unions, works councils and employee representatives as part of a comprehensive global engagement strategy designed to engender positive employee relations. We help employees understand the reasons for change and the impact it may have on them, while also working to protect service to customers.
The review of pension arrangements includes a proposal to enhance our defined contribution pension scheme to help provide an adequate income in retirement for all of our employees. We’ve continued to streamline our management structure to move decision making closer to the frontline customer teams and speed up the decision-making process to deliver better customer outcomes. We’ve also simplified our performance appraisal process, reducing the frequency of assessment and the number of performance categories to free up time for line managers to talk with their people and focus on developing their capabilities.
| Change management | ||||
Link to strategy in year
| Link to business model
| Trend
| ||
| – Human capital |
| ||
We are implementing a wide-ranging change programme across the entire organisation known as One BT. We need to continue to deliver differentiated customer experiences, whilst being able to have the financial capacity to invest in integrated network leadership. At the same time, we want BT to be a simple and agile business where our people can thrive.
In transforming our operating model, we need to manage this change carefully to ensure it delivers the desired outcomes. We recognise that such extensive change can also be a distraction and can cause uncertainty amongst our colleagues, so it’s important that we keep focused on delivering for our customers.
Potential impact
If we do not manage our change programmes carefully then they will not deliver the business outcomes that we are trying to achieve. That could result in poorer customer experiences, negative impacts on employee engagement, or potential overspend on the projects themselves, and at the end of the programmes we may not have achieved the efficient processes needed to deliver a great customer experience, the desired cost savings, or differentiated products and services we were trying to launch.
As we describe elsewhere in the Annual Report, we’ve been working hard on improving our customers’ experiences, and have seen
significant improvements over the last year. If our transformation programmes do not deliver their intended customer benefits, or divert colleagues’ attention away from serving our customers, then we may suffer a reduction in the quality of the service we provide, and as a result incur customer churn and even financial penalties in some cases.
What’s changed over the last year?
Over the past year, our key changes have included:
| – | the launch of apan-BT transformation programme, One BT, which is designed to help our businesses deliver to their full potential |
| – | bringing together BT Consumer, EE and Plusnet into a new Consumer business |
| – | ongoing work to deliver a new Digital Global Services |
| – | announcing the integration of our Wholesale and Ventures and Business and Public Sector businesses into a new Enterprise business |
| – | announcing our plans to introduce a new People Framework, which will include a particular focus on our middle and senior-management grades |
| – | as we describe elsewhere in the Annual Report, we’ve also been making changes to our Openreach business to implement Ofcom’s Digital Communications Review. |
| 44 | British Telecommunications plc Annual Report & Form 20-F 2018 | |||||
Table of Contents
| THE STRATEGIC REPORT | GOVERNANCE | FINANCIAL STATEMENTS | ADDITIONAL INFORMATION | |||||||||
|
|
| ||||||||||
How we’re mitigating the risks
We apply a formal structure and governance to our key change programmes – for example, One BT has a full-time Programme Office and a Transformation Committee. Change programmes are also supported by our Customer and Enterprise Transformation team. By bringing together several transformation teams into one, we are able to ensure that our internal change programmes are co-ordinated and remain focused on delivering for our customers. The Customer and Enterprise Transformation team tracks programme delivery against targets for the Transformation Committee,Executive Committeeand Board. The Transformation Committee meets weekly to make key decisions and to set the pace of change.
We recognise the importance of having the skills, capabilities, methods and tools to define and deliver change in the right way. So we’ve developed a new change approach, and have put in place an
expert team that is building capability and providing direct support to HR, communications, change teams and our leaders in the business.
We’ve also maintained a close focus on our people and our culture, launching a number of specific and focused leadership capability development programmes to help our leaders manage their people through a period of extensive change whilst also delivering the best possible customer experiences.
Organisational change can cause uncertainty amongst colleagues, and we communicate closely with our unions and works councils in designing, announcing and implementing changes. Our engagement strategy allows us to monitor employee engagement on a regular basis, informing any interventions that we feel necessary.
| Supply chain | ||||||
Link to strategy in year
|
Link to business model
| Trend
| ||||
| – Financial capital |
| ||||
| – Social capital | |||||
| – Human capital | |||||
| – Natural capital
| |||||
We operate in a global supply market. Our supply chains range from simple to very complex. It’s critical to our operations that we can guarantee their integrity and continuity.
Global markets expose us to global risks, including different standards in labour, environmental and climate change practices, increasing regulation and geopolitical events. We weigh up the impact and likelihood of external market forces on our suppliers’ ability to support us.
Globalisation means better sourcing opportunities, but brings challenges if suppliers become more geographically and culturally remote from our customers – or if governments put barriers in the way of doing business to protect national or regional economic interests.
Our dealings with suppliers follow our trading and ethical policies. From the way we choose them, to the contracts we sign and how we pay them. For more detail, see page 27.
Potential impact
If something goes wrong in our supply chain, the speed and scale of impact can vary. We need to determine the potential damage to customer experience, the likelihood of higher costs and the potential damage to our brand. If substituting a failing supplier meant that we had to disrupt our business, it could cost us a lot of time and money. If we couldn’t find an alternative supplier, it might compromise the commitments we make to our customers, which could in turn lead to breach of contract, lost revenue or penalties.
If any link in our supply chain falls foul of the law, or fails to meet our ethical expectations, that could damage our reputation – possibly leading to legal action and lost revenue.
If we don’t meet the expectations of regulators that govern us and the data we manage, it could result in significant penalties. In the case of EU General Data Protection Regulation 2018, this could amount to 4% of our global annual turnover.
What’s changed over the last year?
We dedicate time to assessing emerging geopolitical threats and the impact they could have on our supply chain. These include the impacts of the UK leaving the EU in March 2019; the threat of modern slavery and human trafficking; and the growing threat of cyber attacks on our systems and networks.
We continue to monitor the trend for mergers and acquisitions in some of the global markets we do business in. It highlights the risk of us becoming too dependent on single or monopolistic suppliers. We also try to make sure that suppliers do not become too dependent on us. Both scenarios are unhealthy for our business.
This year one of our more significant suppliers, Carillion, went into liquidation. However, by implementing our risk and governance arrangements we were able to manage and reduce the disruption to our business.
How we’re mitigating the risks
We have a few really critical suppliers. We keep a close watch on our relationships, their performance and their ability to meet their obligations. We tell the business when to prepare for the risk of a supplier failing, and our senior leaders continually review how ready we are for such events.
We make sure we exercise the right amount of due diligence when it comes to introducing new suppliers and continuing to do business with existing ones. That includes checks on company finances, business systems, accreditations, media reputation and ethical practices. The standards we apply to our suppliers are available on selling2bt.bt.com
We manage our top suppliers according to the contracts they’ve signed. We work with them to find better ways of working, reducing our exposure to risks around poor supplier practices in the process.
We’re also continually looking to improve our response to disruptive events.
| British Telecommunications plc Annual Report & Form 20-F 2018 | 45 | |||||
Table of Contents
Our principal risks and uncertainties continued
Operational risks continued
| Major contracts | ||||
Link to strategy in year
| Link to business model
| Trend | ||
|
|
| ||
We have a number of complex and high-value national and multinational customer contracts. The revenue and profitability of these contracts are affected by things like: variation in cost; achieving cost savings anticipated in contract pricing (both in terms of scale and time); delays in achieving agreed milestones owing to factors either in or out of our control; changes in customers’ needs, their budgets, strategies or businesses; and our suppliers’ performance. Any of these factors could make a contract less profitable or even loss-making.
The degree of risk varies with the scope and life of the contract and is typically higher in the early stages. Some customer contracts need investment in the early stages, which we then expect to recover over the life of the contract.
Major contracts often involve implementing new systems and communications networks, transforming legacy networks, managing customer networks and developing new technologies. Delays or missed milestones might have an impact on us recovering these upfront costs. There’s a substantial performance risk throughout the term of some of these highly-complex contracts.
Potential impact
If we don’t manage to meet our commitments under these contracts – or if customers’ needs, budgets, strategies or businesses change – then our expected future revenue, profitability and cash generation may go down. Unexpectedly high costs associated with fulfilling particular transformational contracts could also hit profitability. Earnings may drop. Contracts may even become loss-making through loss of revenue, changes to customers’ businesses (due to, for example, mergers or acquisitions), business failure or contract termination.
One of our highest profile contracts is providing a key element of the UK Emergency Services Network (ESN) on our EE mobile network. The complexities described above all apply to this programme. This service is delivered with several partners and managed by the Home Office. The Home Office has delayed the launch date and further delays will impact the expected income.
Furthermore, the criticality of this service increases our risk exposure once it’s live, and given the network provides emergency services communications for the UK, performance in life of the network could have reputational consequences for BT.
We’re continuing to deliver contracts with local authorities through regional fibre deployment programmes, including the Broadband Delivery UK programme (BDUK). As with our other major contracts, if we fail to deliver these contracts successfully it might lead to reduced future revenue, profitability and cash generation. As well as carrying a higher reputational risk, these contracts present specific risks around deployment, delivery and our ability to recover public funding. We also have an obligation to potentially either reinvest or repay grant funding depending on lots of different factors – including how many customers take up a new service.
What’s changed over the last year?
We have extended our ‘Gold Standard’ quality programme to our Contract Accounting and financial management activities. Our major contracts are assessed against strict ‘gold standard’ criteria and those contract teams below the benchmark will be developed/ coached for improvement in order to attain the standard.
Tough market conditions continue and the impact of the UK voting to leave the EU has meant some customer programmes have been delayed, which has had an impact on the business. Customers are asking for more flexibility in their contracts.
The majority of our first phase of BDUK contracts have now completed their deployment commitments. We’re now nearing the contractual end dates of the second phase of contracts (SEP). In addition, we have further extended numerous existing contracts and begun deployment of the third phase of contracts. While these later phase contracts are smaller in scale and coverage, the deployment challenges are significantly greater in terms of the geography encountered as we reach further into the final 5% of households.
While our broadband contracts and ESN carry a different risk profile to other major corporate contracts, we apply our governance and reporting processes to make sure we identify risks and mitigation activities and report them to management.
How we’re mitigating the risks
At both group and corporate unit level we have governance, risk management and reporting processes in place. Independent audits and the checks and balances in individual contracts provide assurance through an independent review programme. To track progress, we monitor how we’re doing on these risks and mitigation actions, and report the result to senior management. A separate, dedicated team provides assurance for our BDUK and ESN projects.
The BT Academy supports skills development and learning initiatives. These help our Contract Management Profession to better identify and manage risk. We also update new training collateral whenever we learn something new. In 2017/18 we introduced a Gold Standard sustainability measure to ensure our contracts continue to operate at the highest possible standard.
We continue to invest in risk training, and assess the management of our contracts against a best practice framework we’ve developed based on our knowledge of running and managing major programmes. We’re also investing and growing our contract management expertise through the provision of accredited contract management training.
| 46 | British Telecommunications plc Annual Report & Form 20-F 2018 | |||||
Table of Contents
| THE STRATEGIC REPORT | GOVERNANCE | FINANCIAL STATEMENTS | ADDITIONAL INFORMATION | |||||||||
|
|
| ||||||||||
Use of Artificial Intelligence to help contract management
Developing anin-depth understanding of our obligations and performance across our entire major contracts portfolio is challenging. However, it is imperative if we are to manage risk and deliver a great customer experience.
How we managed the risk
We’ve introduced an Artificial Intelligence (AI) capability to improve the efficiency and accuracy when analysing Major Contracts contained in the ‘contract lifecycle management’ system.
The result, and what we learnt
Our AI capability promises many benefits which we expect to increasingly evolve in support of Major Contract management, benefiting both BT and our customers. Analysing ‘big data’ has improved our revenue assurance capability as well as identifying risk trends across obligations on our more bespoke contracts. Finally, it’s helped us to understand the consequences of changes to legislation, regulation or market impacts on our complex contracts.
Sharing malware data with ISPs
Cyber threats pose a risk to our entire industry. In our efforts to protect customers and businesses from global cyber-crime, we’ve taken industry collaboration to a new level.
How we managed the risk
In February 2018 we became the first telecommunications provider in the world to start sharing information about malicious software and websites on a large scale with other internet service providers (ISPs). We launched a free collaborative online platform to share our threat intelligence data across the ISP community in a secure and trusted way. We’re now urging other UK broadband providers to follow our lead.
The result, and what we learnt
We’re sharing data relating to malware because we believe the most effective way to bolster the UK’s defences against cybercrime is through greater collaboration and the exchange of information. If other ISPs join us in actively sharing threat intelligence data, this will help the entire industry to develop and strengthen a collective shield which will help to protect all customers.
| British Telecommunications plc Annual Report & Form 20-F 2018 | 47 | |||||
Table of Contents
Our customer-facing units
We’re the biggest UK provider of consumer fixed-line voice and broadband services. We’re also the second-largestpay-TV sports broadcaster in the UK, a leading innovator in broadcasting technology and one of the UK’s fastest growing mobile operators.
BT Consumer and Plusnet (our value brand) connect customers to information, entertainment, friends and family, at home and on the move.
We buy access to fixed-line and broadband infrastructure from Openreach, and we use EE’s mobile network to provide mobile phone services.
BT Consumer and Plusnet both provide home phone, broadband, TV and mobile services. EE do too (page 55).
BT Consumer brands
BT Consumer sells products and services from BT and Plusnet. Subscriber numbers and market share data for home phone, retail broadband andpay-TV are reported at group level and can be found later in this section. Figures for mobile (also reported at group level) are in the EE section on page 55.
We sell a wide range of devices – including phones,wi-fi extenders and baby monitors via high street retailers and our website.
Sustainability is important to us; we work closely with suppliers to make our products and business as sustainable as possible, from the first link in the supply chain through to our customers.
We also sell services to commercial premises like pubs and hotels, so they can get BT Sport or BTWi-fi.
We employ around 9,000 full-time equivalent people. Roughly 6,500 of these directly help customers in our contact centres.
Markets and customers
Our broadband (copper and fibre) products are available to more than 99% of UK premises; our home phone and mobile services are available to all. Anyone with fast enough BT broadband can get BT TV.
Wholesale: Fixed network services
The UK consumer communications market is highly competitive. In December 2017, Ofcom found that UK prices for communications and TV services compared well to international benchmarks. In 2017 the UK ranked third overall among six comparator countries (France, Germany, Italy, Spain, UK and the US) and second for prices for triple-play bundles.
Within the UK market, our three consumer brands mean we’re well placed to compete with the likes of Sky, Virgin Media, TalkTalk and Vodafone.
BT retail market share
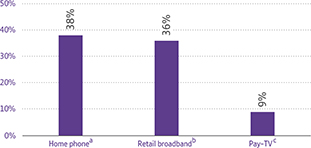
| a | Home phone includes BT Consumer and EE analogue and ISDN channels (WLR), including customers in Northern Ireland and Plusnet. |
| b | Retail broadband – Consumer (including Plusnet and Northern Ireland), EE, B&Ps, and broadband lines sold by Global Services. |
| c | TV refers to the total number of customers either with a BT Vision, YouView or EE TV box registered and enabled to receive video on demand including YouView from Plusnet. |
Home phone
According to Ofcom, the number of home phone lines in the UK was 26.7m in December 2017.
But people are increasingly using mobiles, voice over IP or instant messaging services instead of landlines. The number of minutes of home phone calls made in 2017 fell by 19% year on year to 35bn.
Broadband
There were 26m fixed broadband (home and SME) connections in December 2017, an increase of 2.1% from the previous year. Superfast speeds are available to 95% of the UK.
TV and content
There are roughly 18mpay-TV subscriptions in the UK. Subscription video on demand (SVoD) content providers like Netflix and Amazon Prime are becoming increasingly popular. They usually complement traditionalpay-TV rather than replace it – Ofcom found that 74% of SVoD users hadpay-TV too.
Mobile
We describe the UK mobile market, including BT’s overall position, in the EE section of this report which starts on page 55.
| 48 | British Telecommunications plc Annual Report & Form 20-F 2018 | |||||
Table of Contents
| THE STRATEGIC REPORT | GOVERNANCE | FINANCIAL STATEMENTS | ADDITIONAL INFORMATION | |||||||||
|
|
| ||||||||||
Products and services
One size rarely fits all. That’s why we sell home phone, broadband, TV and mobile to our customers in a variety of packages.
Home phone
Our range of home phone products and calling plans lets our customers pick the right service for them. We offer unlimited calls, andadd-ons like discounted international calls or calls to mobiles.
Here are a few examples of BT Consumer home phone services:
| – | BT Basic – discounted line rental and inclusive calls to people on certain state benefits. We’re the only company to offer this service in the UK. |
| – | BT Call Protect – a free service for customers which diverts nuisance calls to a junk voicemail box. We’ve now diverted more than 90m nuisance calls. |
| – | Discounts for standalone voice customers – this year we agreed with Ofcom to cut the price of line rental for BT home-phone-only customers who don’t have broadband with BT or anyone else. From 1 April 2018 this line rental is £11.99 a month. |
Plusnet and EE also offer a home phone service with a variety of different calling plans.
Broadband
We offer ADSL broadband, delivered over copper lines. Our BT Infinity superfast broadband uses fibre to deliver higher speeds and a more reliable service.
Two examples of our broadband services are BT Broadband Unlimited (speeds up to 17Mbps) and BT Unlimited Infinity 2 (speeds up to 76Mbps). In January 2018 we launched two new Ultrafast Fibre packages with speeds of up to 152Mbps and up to 314Mbps. Both come with a speed guarantee of 100Mbps, backed by £ 20 compensation.
To supercharge their homewi-fi, customers can buy Whole HomeWi-Fi. It uses an intelligent network of threewi-fi repeaters to extend connectivity to every corner of the home – automatically switching to the fastest, strongest and most reliable signal. We launched on the high street in December 2016 and by the second half of 2017/18, sales reached nearly 50% of the market by value, outperforming brands like Google and Netgear.
Our broadband packages also include:
| – | BTWi-fi – free, unlimitedwi-fi access at around 5.9m UK hotspots |
| – | BT Cloud – secure online andon-the-go access to data and photos |
| – | BT Web Protect – security tools to help keep customers and their families safe online. |
We offer special support to vulnerable customers and work with industry groups like Internet Matters to promote internet safety. Plusnet broadband is sold three ways with three different download speeds – unlimited with up to 17Mbps; fibre unlimited with up to 38Mbps; and unlimited fibre extra with up to 76Mbps.
EE broadband offers three similar products.
BT TV is available exclusively to our broadband customers. They can watch via a choice of three YouViewset-top boxes(non-recording, recording and 4K UHD).
TV content includes programmes for the whole family from all the big Hollywood Studios; AMC (a BT UK exclusive), Sky, BT Sport and Netflix. We aim to offer a selection of the best pay content at attractive prices.
BT TV comes in three different packages
Starter + BT Sport
Up to 80 Freeview channels, BT Sport channels, AMC and BoxNation – plus BT Store for renting or buying movies and shows. Includes anon-recordingset-top box and access to apps like BBC iPlayer, All 4, ITV Hub and My5.
Entertainment
Includes up to 99 channels, as well as aset-top box which can record up to 300 hours of programmes, pause and rewind live TV, and access seven days’ worth ofcatch-up TV. Includes BT TV app access.
Max
More than 140 channels, including 21 in HD. Also includes extra recording space on theset-top box, BT Kids TV and BT Sport in 4K Ultra HD.
This year we launched an award-winning TV user interface to make it even easier for customers to find their favourite programmes. There’s also a companion BT TV app so they can watch shows when they’re out and about.
Plusnet TV is available to Plusnet’s fibre customers. It includes over 70 Freeview channels, plus BT Sport and popularpay-TV channels.
EE TV provides more than 70 Freeview channels, as well aspay-TV channels and access to a number of apps.
BT Sport
The BT Sport channels are available on BT TV, the BT Sport App (to BT, Plusnet and EE customers), Sky and TalkTalk. Virgin Media TV customers can also access BT Sport. There’s a discount on BT Sport for current BT broadband customers, and an even bigger discount if they take BT TV too.
BT Sport 4K UHD was the UK’s first Ultra HD TV channel. It has four times the detail of HD and is available exclusively to BT TV Max customers with BT Infinity broadband.
BT Sport is the exclusive live broadcaster of the UEFA Champions League and UEFA Europa League in the UK. And it has the rights secured until the end of the 2020/21 season.
In January we won Premier League rights for a further three years until the end of 2021/22. We also broadcast FA Cup, FA Women’s
Super League and Scottish Premiership games. As well as football, BT Sport covers sports like Aviva Premiership Rugby, MotoGP, WTA tennis, Cricket Australia, UFC and boxing. This year, we broadcast over 13,000 hours of live sport.
Innovation is intrinsic to our strategy at BT Sport. Our coverage of the 2017 UEFA Champions League final was the UK’s first-ever live 4K broadcast on YouTube.
British Telecommunications plc Annual Report & Form 20-F 2018 | 49 | |||||
Table of Contents
Our customer-facing units continued
BT Consumer continued
We also achieved a world first by covering the live match using High Dynamic Range (HDR) technology in ultra-high definition with Dolby ‘Atmos’ sound.
And on YouTube and the BT Sport app we screened the match in360-degree virtual reality (VR) for the first time. Within the app viewers could choose between a360-degree produced programme or pick their own camera viewpoint.
In January we added HD streams to the BT Sport app for all our sport customers too. And the app and Ultra HD channel have both won awards for innovation.
BT Mobile
BT Mobile is availableSIM-only or with a service plan and choice of market-leading phones. Our broadband customers get a £5 a month discount on mobile service plans. There’s also BT Family SIM which lets customers buy two or more SIM cards at a discount.
We launchedWi-Fi Calling in March 2018 so customers can text or call overwi-fi when they can’t get a mobile signal (one of their biggest bugbears).
Plusnet offersSIM-only mobile plans at different prices. Plusnet broadband customers get ‘mates’ rates’ packages with extra mobile data.
Performance in the year – strategic
Customer experience is still our top priority
 | Delivering great customer experience | |
|
This year we’ve continued to make important investments in customer care. We are seeing progress.
Customer care is getting better. The Institute of Customer Service ranked BT within the top 15 most improved organisations this year.
This is because of the money we’re spending on improving our systems. They are now being used by 6,000 advisers and are improving the number of faults we fix and speeding up the time it takes to do it.
Customers’ opinion that BT is easy to deal with was four points higher in Q4 2017/18 than it was a year earlier. Right First Time improved by 1.1%, driven by a 7% reduction in Propensity to Contact.
Simpler organisation
We’ve reorganised our teams around the different moments in customers’ relationships with us – ‘joining’, ‘early life’ and‘in-life support’.
Thousands of agents now follow this new operating model. It’s widening and deepening their knowledge and letting them own and solve issues. For more complex stuff, we’ve introduced bespoke, dedicated support which is helping thousands of customers a week. This has been key to cutting Ofcom broadband complaints by 18%.
New diagnostics help detect and resolve faults
We’ve introducedpre-emptive broadband diagnostics. This now means we can often detect and fix faults automatically – before a customer finds there’s a problem and gets in touch.
Getting to customers quicker
Through extra investment in people and systems, we’ve cut the average wait to speak to us on the phone from 103 seconds in Q4 2016/17 to 41 seconds in Q4 2017/18.
Following our customers onto digital
The number of customers using online chat has grown. It now accounts for around a quarter of interactions.
| Investing for growth | |||
|
This year we kept our focus on sustainable long-term growth, making several investments for the future. The table below summarises our progress on the priorities we set out last year.
Review of last year’s priorities
What we said
| What we did
| |||||
Keeping the household connected
| ||||||
Move current customers from copper to fibre broadband and grow our base through acquiring new customers.
| 61% of our broadband customer base is now on fibre compared with 53% last year.
Our fibre customer base has grown by nearly 800,000 to 5.7m. | |||||
| ||||||
| Launch ultrafast broadband using Gfast and, where possible,fibre-to-the-premises. | We launched two new Ultrafast Fibre packages with speeds of up to 152Mbps and 314Mbps.
| |||||
Keep promoting BT Mobile to give existing customers more for their money.
|
We’ve significantly grown our mobile base.
We launchedwi-fi calling in March 2018.
| |||||
| 50 | British Telecommunications plc Annual Report & Form 20-F 2018 | |||||
Table of Contents
| THE STRATEGIC REPORT | GOVERNANCE | FINANCIAL STATEMENTS | ADDITIONAL INFORMATION | |||||||||
|
|
| ||||||||||
| What we said | What we did | |||
Enhance sport and content
| ||||
| Provide exclusive sport giving potential customers a brilliant reason to choose BT. | Our Ashes cricket coverage accounted for 8% of BT Sport viewing for the year.
We added UK and Irish international hockey and broadcast our first live boxing match with two World Championship fights. | |||
| We broadcast the UEFA Champions League Final in 4K UHD and with 360 degree VR experience. | ||||
On the BT Sport app we introduced
| ||||
| ||||
Improve our customers’ TV viewing experience. | We launched three new TV channels and expanded our boxset range with exclusive AMC productions. | |||
| We launched a BT TV App for customers to watch their favourite shows on the go and record programmes remotely. | ||||
We announced a deal to offer all of
| ||||
Transform customer experience
| ||||
Finish deploying our new frontline systems and operating structure to simplify the way we work. | We rolled out new systems and a simpler way of working to all our contact centre advisers.
We created a dedicated case management function for complex problems.
| |||
| ||||
Make further investments to cut the time it takes to get through to a contact centre agent.
| Wait times have dropped by more than a minute to 41 seconds in Q4 2017/18. | |||
| Transforming our costs | |||||
|
Costs went up 3% this year. This reflects our ongoing investment in improving overall customer experience, bringing fibre broadband to more customers and contractual sports rights increases.
To partly offset this, we cut costs by:
| – | finding economies of scale in our network infrastructure |
| – | negotiating improved contract terms with key broadband hub suppliers |
| – | improving customer care processes to cut the number of engineer visits. |
| British Telecommunications plc Annual Report & Form 20-F 2018 | 51 | |||||
Table of Contents
Our customer-facing units continued
BT Consumer continued
Performance in the year – operating
We won quite a few awards for our products and services this year.

| 52 | British Telecommunications plc Annual Report & Form 20-F 2018 | |||||
Table of Contents
| THE STRATEGIC REPORT | GOVERNANCE | FINANCIAL STATEMENTS | ADDITIONAL INFORMATION | |||||||||
|
|
| ||||||||||
Plusnet also won several awards:

The section below gives figures for home phone, broadband and TV across the group.
Mobile performance – also reported group-wide – is in the EE section on page 55.
Home phone
As of 31 March 2018, BT Group had a combined total of 10.1m home phone customers, at 31 December 2017 we had 38% market share.
Broadband
We held our position as the UK’s largest provider of home broadband services with 9.3m customers and 36% market share.
Around 61% of our home broadband customers have fibre broadband, getting faster speeds than ever before.
TV
We have 1.7m TV customers across BT, Plusnet and EE. Around 30,000 commercial premises have BT Sport.
BT Sport viewing figures across all platforms were up 19% in Q4 2017/18. We’ve seen a 31% increase in the proportion of our BT Sport base engaging with the app.
| British Telecommunications plc Annual Report & Form 20-F 2018 | 53 | |||||
Table of Contents
Our customer-facing units continued
BT Consumer continued
Performance in the year – financial
In 2017/18, our revenue went up by 3%, with particularly strong growth in mobile, broadband, TV and sport. EBITDA grew 1%, because of revenue growth being partly offset by extra investment in customer experience.
| Year ended 31 March | 2018 £m | 2017 £m | 2016 £m | |||||||||
Revenue
|
|
5,066
|
|
|
4,934
|
|
|
4,608
|
| |||
Operating costs
|
|
4,043
|
|
|
3,922
|
|
|
3,553
|
| |||
EBITDA
|
|
1,023
|
|
|
1,012
|
|
|
1,055
|
| |||
Depreciation and amortisation
|
|
216
|
|
|
209
|
|
|
207
|
| |||
Operating profit
|
|
807
|
|
|
803
|
|
|
848
|
| |||
Capital expenditure
|
|
291
|
|
|
237
|
|
|
207
|
| |||
Calls and lines revenue increased 2% (2016/17: up 4%) as mobile growth more than offset lower revenue from home phones.
Broadband and TV revenue increased 4% (2016/17: 13%) reflecting both revenue and product growth in the year. BT Consumer12-month ARPU increased by 5% to £41.7 driven by mobile and BT Sport, as well as an increase in revenue generating units per customer from 1.98 to 2.03.
Operating costs increased 3% as a result of extra investment in customer experience as we brought contact centre jobs back to the UK, a higher proportion of customers taking fibre broadband and sports rights costs – specifically the Ashes and Premier League.
EBITDA increased 1% as revenue growth in mobile, broadband, TV and sport more than offset our increased investment in customer service, fibre broadband and content.
Capital expenditure also increased by 23%, which reflects our ongoing investment in improving our network.
Our top priorities for 2018/19
Launch new products and establish convergence
| – | Launch BT Plus, bringing together the best of broadband and mobile for the whole family. |
| – | BT Plus will offer the best speeds with Ultrafast broadband and the best usage allowances. |
| – | Give our customers access to the best TV content through partnerships eg Now TV. |
Customer experience
| – | 100% of calls answered in the UK for our BT Plus customers. |
| – | Continue investing in our systems to offer personalised online interactions with us. |
| – | Increase our investment inpro-active repair. |
Improve the way we communicate with customers
| – | Refresh our advertising style to create a more personal connection with our customers. |
| – | Re-focus our priorities to sell more services to our existing customers, rather than focus on attracting new customers. |
| – | Offer BT products in EE stores so customers can experience and buy our products face to face. |
| 54 | British Telecommunications plc Annual Report & Form 20-F 2018 | |||||
Table of Contents
| THE STRATEGIC REPORT | GOVERNANCE | FINANCIAL STATEMENTS | ADDITIONAL INFORMATION | |||||||||
|
|
| ||||||||||
Our customer-facing units
We’re the UK’s largest mobile network operator. We also offer fixed broadband and TV.
At BT we report mobile customer numbers for the whole group, including those from other customer-facing units. We have more than 29m connections, 19.6m of which are 4G.
In EE, new mobile customers all join the EE brand, but we still have a number of customers on old Orange andT-Mobile tariffs. We acquire and retain customers through our chain of around 600 shops, website and contact centres – as well as through third parties like Dixons Carphone. To improve customer experience, since the end of 2016 we’ve handled all EE service calls in the UK and Ireland.
We have 9,600 people, with 66% directly helping customers in shops and contact centres. We were named best employer in the Sunday Times Best Big Companies to Work For 2018 awards, up from third in 2017.
Our mobile network has been independently recognised as the fastest network by OpenSignal, and best overall network by RootMetrics – for the ninth consecutive time – in its report for the second half of 2017. We’re getting our 4G Emergency Services Network (ESN) ready for use by emergency services workers.
On 1 April 2018 the BT Consumer and EE customer-facing businesses were brought together into a new combined unit.
Markets and customers
With four mobile network operators and plenty of mobile virtual network operators (MVNOs), the UK mobile market is competitive. Of the UK’s 84 m mobile connections,two-thirds are postpaid.
Our main competitors are O2, Vodafone, Three, Tesco Mobile, Virgin Media and Sky. Competition for customers is boosted by third-party distributors. These businesses sell mobile services on behalf of mobile operators, from high street shops and online.
Around 94% of adults in the UK use a mobile. Over 75% of UK adults use a smartphone. According to Ofcom, 66% of mobile connections are on postpaid tariffs. And 58% of homes also have a tablet.
Smartphones are now the most widely-used device by UK adults for getting online. Consequently, total mobile data use went up 44% in 2017.
By September 2017, total UK mobile call volumes were steady at around 38bn minutes a quarter. Texts and multimedia messages were down 16% to an average of 20bn a quarter. Mobile phone services generated £3.9bn in retail revenue in the quarter to September 2017, up 1% compared with last year.
The market is dealing with some existing and potential structural changes:
| – | increased customer expectations as we become more dependent on mobile services |
| – | huge growth in mobile data use |
| – | a continued slide in the prepaid market as customers move to postpaid tariffs |
| – | popularity ofSIM-only tariffs (smartphones are evolving more slowly so people are keeping their phones longer) |
| – | regulatory pressure on the prices charged to customers and other telecoms companies. |
BT has a 28% share of the UK mobile market, measured by subscribers.
There’s more detail on our consumer home phone and broadband markets on page 48.
| British Telecommunications plc Annual Report & Form 20-F 2018 | 55 | |||||
Table of Contents
Our customer-facing units continued
EE continued
Products and services
We provide mobile services in the UK, now bringing 4G to over 99% of the population, or 90% geographically. We also reach 99% of the population with 3G and 2G. We sell broadband, home phone and a TV service too.
Postpaid
We put new customers, and those renewing their contracts, on 4G tariffs. If that includes a phone, the contract is typically for 24 months. Our tariffs include a bundle of monthly voice, texts and data. Prices vary with the size of the data bundle, the device type and 4G speed. The tariffs are split into two main groups:
| – | Essential packsfor unlimited calls and texts plus tiered bundles of data over a30-day period, at speeds of up to 60Mbps. |
| – | 4GEE Max planswhich combine the largest data bundles, inclusive access to the BT Sport App and ‘roam like home’ calls, texts and data in more than 50 countries around the world. We also offer an annual upgrade option on selected flagship phones. |
Prepaid
Prepaid customers buy a phone and then add a‘pay-as-you-go’ pack of 4G. The packs are split into three groups:
| – | Everything packsfor unlimited texts and tiered bundles of calls and data over a30-day period. |
| – | Talk and text packsfor tiered bundles of calls and text use over 7 to30-day periods. |
| – | Data packsranging from 100MB to 5GB over 7 to30-day periods. Some automatically rollover unused data to the next month, so customers get a second chance to use it. |
We also have a loyalty programme where customers can get extra data, calls or texts added to their packs in return for staying with us and topping up.
Devices
We offer a wide range of 4G mobile phones, tablets, connected devices and mobile broadband devices from leading brands like Apple, Samsung and Google. Or customers can use their own phone with aSIM-only plan.
Broadband and TV
We sell home phone, broadband (including superfast fibre broadband) and TV services. To reward their loyalty, our postpaid customers get bigger data allowances if they also buy EE broadband.
EE TV comes with more than 70 free channels simultaneously on up to four devices, as well as access topay-TV channels. The EE TVset-top has one terabyte of storage. Customers can control it from their mobile phone or tablet via the EE TV app.
Emergency Services Network
In December 2015 we were awarded the network part of the Emergency Services Network (ESN).
Our 4G network may enable lots of applications. For instance:
| – | ambulance crews may be able to send vital data to a hospital to help staff prepare for a patient’s arrival |
| – | a police officer may be able to record an arrest on a body-worn camera and live-stream to nearby officers for support |
| – | fire and rescue crews may be able to assess a burning building based on live helicopter camera footage and digital blueprints viewed on a tablet. |
We’ve increased 4G coverage, including building more than 100 new mobile basestations in remote areas.
We’ve enabled and successfully tested specific services, like ‘push to talk’, ready for the contract.
Ahead of the launch of the ESN we’ve been working closely with the people who’ll actually use it every day. More than 500 have visited our Technology Operations Centre in Bristol. We expect the first emergency services workers to start using the network later in 2018.
| 56 | British Telecommunications plc Annual Report & Form 20-F 2018 | |||||
Table of Contents
| THE STRATEGIC REPORT | GOVERNANCE | FINANCIAL STATEMENTS | ADDITIONAL INFORMATION | |||||||||
|
|
| ||||||||||
Performance in the year – strategic
We’ve grown financially, improved customer experience and extended our mobile network while integrating with the group.
| | Delivering great customer experience |
We’re working hard to deliver the best customer experience in the UK. While we continue to make strong progress, we know there will always be more we can do.
This year we focused on four areas:
| – | call centres– we’ve made customer service more personal by coaching staff to be more empathetic |
| – | self-service– we’re always improving My EE functionality, with a new dedicatedtop-up tab and personalised recommendations |
| – | shops– we’ve launched our new Showcase stores, which give a more personal and immersive experience |
| – | network– we’ve increased 4G geographic coverage to give customers 4G in more places. |
We’re putting customers in the centre of our decisions. We want every interaction they have with us to feel personal – for example we’re now using video-calling in our stores and call centres.
Thanks to these steps, Ofcom has scored us second lowest for complaints on postpaid mobile and broadband, following 25% and 54% improvements.
Our call centres are now ranked top for postpaid mobile and broadband customer satisfaction, and our net promoter scores keep climbing, up 10 points for postpaid and 16 points for broadband.
 | Investing for growth |
We’ve built the UK’s best mobile network. And we’re still investing to stay number one.
Our 4G geographic coverage is now at 90% and we have an ambition to increase this to 95% by the end of December 2020. We’re also improving more than 1,000 sites in major cities, boosting their supported maximum speeds to over 400Mbps. We’re also preparing to lead the way on 5G, the next generation of mobile network technology.
 | Transforming our costs |
We’re now two years into the cost transformation programme we started after we joined the BT family.
We saved money this year by:
| – | improving interconnect, transit and roaming rates as part of larger group deals |
| – | further improving customer self-service to cut the volume of calls into our contact centres |
| – | continuing to reduce the number of people in our head office. |
Performance in the year – operating
We report mobile customer numbers for the whole of BT Group, including those from other customer-facing units.
In last year’s report, we set out our top priorities for this year. The table below explains what progress we’ve made.
Review of last year’s priorities
What we said
|
What we did
| |||
| Maintain network leadership. | We’ve now extended 4G geographic coverage to 90% of the UK.
EE is still ranked as the best UK mobile network by RootMetrics. | |||
| ||||
Carry on improving customer service. |
Our postpaid net promoter score is up by 10 points. We’ve cut complaints to Ofcom by 25% for postpaid mobile and 54% for broadband.
| |||
| ||||
Deliver the EE part of the ESN contract. |
We’ve been able to recognise revenues since September 2017. The first users are due to start using the network later in 2018.
| |||
At 31 March 2018 we had more than 29m connections. Here’s how they break down:
Customer base by type
000
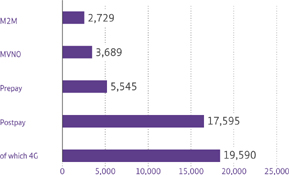
Our postpay customer base grew by 679,000 to 17.6m, supported by growth in all BT brands. The number of prepay customers continued to fall in line with industry trends (like people switching to postpay).
Ourmachine-to-machine customer base was up 290,000 to 2.7m, due to success in the automotive sector.
Our base of MVNO customers was steady at 3.7m.
| British Telecommunications plc Annual Report & Form 20-F 2018 | 57 | |||||
Table of Contents
Our customer-facing units continued
EE continued
Customer base movements
000
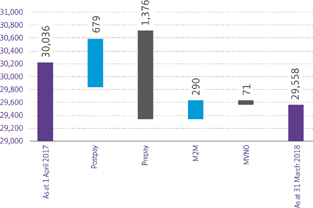
Performance in the year – financial
In 2017/18, our revenue went up by 4%, with particularly strong postpaid growth. EBITDA increased 17%.
| Year ended 31 March | 2018 £m | 2017 £m | 2016a £m | |||||||||
Revenue
|
|
5,294
|
|
|
5,090
|
|
|
841
|
| |||
Operating costs
|
|
3,941
|
|
|
3,934
|
|
|
668
|
| |||
EBITDA
|
|
1,353
|
|
|
1,156
|
|
|
173
|
| |||
Depreciation and amortisation
|
|
776
|
|
|
780
|
|
|
146
|
| |||
Operating profit
|
|
577
|
|
|
376
|
|
|
27
|
| |||
Capital expenditure
|
|
628
|
|
|
616
|
|
|
96
|
| |||
a Includes EE results from acquisition on 29 January 2016.
Postpaid revenue grew by 6%, as customers paid more for bigger bundles of data, ‘more for more’ pricing and we started to recognise ESN revenues.
Fixed broadband revenue was up 14%, reflecting our higher number of customers, and more customers wanting fibre broadband.
Our overall revenue growth was partially offset by an 11% drop in prepaid revenue as the number of customers fell by 20%. Monthly mobile ARPUs for the final quarter of the year were £26.0 for postpaid customers, down 1%, prepaid ARPUs were £4.8, up 9%.
Operating costs were flat because to win and keep customers in the face of increased smartphone costs we had to spend more, but this was offset by overheads savings.
Our EBITDA grew by 17%, with strong postpaid performance compensating for higher smartphone costs.
Capital expenditure increased by 2%. This was because of our work on extending 4G geographic coverage to 90%.
Our top priorities for 2018/19
Maintain network leadership
| – | Keep extending 4G geographic coverage. |
| – | Get the ESN ready for use by emergency service workers. |
| – | Keep working with suppliers and partners to run live customer trials to prepare for 5G’s commercial launch. |
Carry on improving customer experience
| – | Hold our top spot on call centre customer satisfaction. |
| – | Launch a new service toset-up customers’ new smartphones in their homes. |
| – | Add more shops as we work towards our ambition of providing 95% of the population with access to an EE store within a20-minute drive. |
Form partnerships with third parties
We’ll look to work with other companies to generate new revenue streams, by using our:
| – | shops, contact centres and billing platforms |
| – | relationships with millions of mobile customers. |
| 58 | British Telecommunications plc Annual Report & Form 20-F 2018 | |||||
Table of Contents
| THE STRATEGIC REPORT | GOVERNANCE | FINANCIAL STATEMENTS | ADDITIONAL INFORMATION | |||||||||
|
|
| ||||||||||
Our customer-facing units
We sell communications and IT services in the UK and the Republic of Ireland. We have around 1.2m customers and lead the field in fixed-voice, networking and broadband.
We’re passionate about helping all our customers succeed – whether they’re large Government departments, big household names, public sector organisations, small businesses orstart-ups. Our 10,000 people work locally, regionally and nationally, serving those customers wherever they are in the UK.
We have three trading units. They offer customers fixed, mobile, networking and IT services over the biggest UK fixed and mobile communications network.
Trading unit
|
Customers
| |||
Small and Medium Enterprises |
UK businesses typically with up to 100 people, ranging from sole traders to more complex organisations (like schools and colleges). | |||
| ||||
Corporate |
UK businesses typically with100-1,000 people. | |||
| ||||
Public Sector and Major Business |
UK businesses with more than 1,000 people. | |||
| Multinationals who do the majority of business with BT in the UK. | ||||
Public sector (central and local government, health, higher education, defence).
| ||||
| Corporates and public sector in Northern Ireland. | ||||
Corporates, public sector and wholesale customers in the Republic of Ireland.
| ||||
Markets and customers
We have around 1.2m customers and serve over half of the FTSE 350.
Major customers include:
| – | retailerslike Debenhams |
| – | utilitieslike Severn Trent |
| – | public sectororganisations like Surrey Police |
| – | healthcareproviders like Nuffield Health |
| – | sportscompanies like Williams Martini Racing |
| – | constructioncompanies like Anglian Home Improvements |
| – | financialorganisations likee-sure |
| – | educationalinstitutions like University Of Warwick. |
We cover both the communications and IT Services markets. Overall we’re focused on four main product markets: Fixed voice; Mobility; Fibre and connectivity; and Networked IT services.
We think these markets will converge over the next few years as technology and customer needs change. And as they do, we’ll be able to grow our market share.
Public sector is a big part of what we do. But it faces continuing challenges.
Larger systems integration contracts are still being disaggregated and replaced by smaller contracts. Devolution is increasingly shifting procurement decisions and spend to the regions. There is uncertainty over Brexit. The public sector is under increasing pressure – financial cutbacks, higher service expectations, demographic shifts, and economic dynamics.
Fixed voice
The overall number of fixed voice seats in the market will keep growing. For some time, there’s been a switch from traditional voice to IP Voice. Market analysts think that by 2019 IP Voice will dominate the UK business voice market in spending terms. That’s because it offers customers a combination of flexibility, cost efficiency and new features like integration with collaboration tools.
The fixed voice market is fragmented. We’re the market leader – competing with more than 950 resellers and fixed network operators, including companies such as Unicom, Azzurri, Colt Group, Daisy Group, Gamma, KCOM Group and O2.
Mobility
Mobility and mobile device use keeps growing. Customers use them to cut costs, increase productivity and flexibility, and get richer work experiences.
Our customers’ employees are using mobile phones and technologies to work together better, not just to connect. But this is against a backdrop of increasing risks around security, privacy and compliance.
Our main competitors are O2 and Vodafone. Both offer fixed products as well as mobile and are increasingly selling converged services.
Fibre and connectivity
We’re the largest business broadband provider in the UK. Broadband services continue to migrate to fibre to meet businesses’ growing bandwidth needs for higher downstream and upstream speeds. Third-party business applications are increasingly being offered alongside communications provider broadband services, typically via an app store.
Ethernet and dedicated internet access services are growing strongly, with businesses becoming increasingly reliant on connectivity. We’re the leading provider of fixed networking services in the UK.
Networked IT services
The IT services market is diverse. It stretches fromoff-the-shelf hardware sales to large outsourced solutions.
Some areas are growing fast – like cloud services, hosting, infrastructure and security. These all present attractive opportunities for us to grow our market share.
| British Telecommunications plc Annual Report & Form 20-F 2018 | 59 | |||||
Table of Contents
Our customer-facing units continued
Business and Public Sector continued
Networking is moving from physical provision to software-based, virtual provision. And it’s expanding into wide area networking through technologies like Software Defined Networking (SDN).
We think SDN will grow quickly. Customers see the benefits – faster service activation, simpler WAN management and more flexible bandwidth. This growth will boost demand for connectivity but also for hybrid networks especially (combined public and private networks).
As more businesses ‘go virtual’, networks will evolve. For example, WANs will need to become more flexible, manageable, scalable and cost effective.
Cybersecurity remains a key priority for companies; there were a lot of high profile cyber attacks in 2017.
In May 2018 the General Data Protection Regulation comes into force. Companies will have to stick to a strict set of data privacy and security measures. Another growing priority for our customers is the Internet of Things.
Competition is fragmented, with providers often focused on specific types of customer, industry or technology.
Products and services
We offer a wide choice of voice,
connectivity andIT-related services.
The things we sell range from standalone products and converged propositions to managed services and customised solutions. Together these meet the needs of our customers, from small start-ups to large enterprises and public sector organisations.
Fixed voice
Our fixed-voice services range from calls and lines to fully-managed office phone systems and contact centre solutions.
Our portfolio spans traditional and IP Voice. IP Voice services include Cloud Unified Communications, BT Cloud Phone and BT Cloud Voice – which we can offer to the full spectrum of customers we serve.
Mobility
We offer a range of mobile phones and tablets, a choice of voice and data tariffs and mobile office solutions, provided over the UK’s fastest 4G network.
BT One Phone is a converged proposition for businesses with a mobile workforce. It effectively creates an office switchboard in the cloud, then pushes those functions to a customer’s mobile phone.
Fibre and connectivity
Customers have lots of options for internet access. They include BT Business Broadband (over copper connections); BT Business Infinity overfibre-to-the-cabinet (FTTC) andfibre-to-the-premises (FTTP); and BTnet dedicated internet access.
Our networking solutions are perfect for customers connecting offices together or connecting to the internet over dedicated leased lines. They buy products like Ethernet, IP Virtual Private Network services, SIP trunking (which transports voice calls over IP networks), leased lines, cabling infrastructure and local area networking solutions.
We offer value-added services to complement our fibre and connectivity offerings. These include: computing apps to get customers online and running and marketing their websites effectively; security and backup; and cloud software access via our Business Apps Store to enable them to work effectively without needing to buy extra IT resource or hardware.
Networked IT services
Our IT services team designs and delivers solutions, manages services and providesin-life support. They specialise in four areas:
| – | end-user computing |
| – | Local Area Network (LAN) andwi-fi infrastructure |
| – | security |
| – | data centres and cloud. |
Partnerships with brands like Cisco, Apple, HP and Microsoft help to support these services.
We resell computing, networking and software products on BT Business Direct, our IT product website. It offers 20,000 hardware and software products from the world’s leading IT vendors.
Performance in the year – strategic
We continually invest in our people, portfolio and digital capabilities. This helps improve customer experience and provides a platform for us to grow.
 | Delivering great customer experience |
We want our customer experience to lead the market. We’re making good progress.
This year our Net Promoter Score went up 12.1 points. That’s eight quarters of consistent improvement. Our Right First Time (RFT) measure improved by more than 5%. We are fixing faults an average of 16% quicker. And on our Ethernet portfolio, we’ve cut the time it takes for our customers to get their orders by 14%.
We’ve continued to bring our contact centres back to the UK with 86% of our people now here. The number of calls into our contact centres has fallen by 15% from last year. This is because customers need to get in touch less. When they do, we’re giving them more ways to do it. And our complaints team won ‘Team of The Year’ in the UK Complaint Handling Awards 2018.
This year, we’ve:
| – | launched a Business Service app, which more than 25,000 customers have downloaded |
| – | successfully completed more than 1,600 improvement actions for Major and Public Sector customers |
| – | invested in our people, completing 28,000 hours of training across sales and service on having great conversations with customers |
| – | launched the BT Smart Hub for broadband customers, with better diagnostics to help us fix faults proactively and more quickly |
| – | updated the BT OnePhone portal to make it easier for customers to self-serve |
| – | launched BTnet Express – a simplified, fixed-pricing approach for our market-leading dedicated internet access product. |
| 60 | British Telecommunications plc Annual Report & Form 20-F 2018 | |||||
Table of Contents
| THE STRATEGIC REPORT | GOVERNANCE | FINANCIAL STATEMENTS | ADDITIONAL INFORMATION | |||||||||
|
|
| ||||||||||
 | Investing for growth |
We continue to futureproof our cloud, connectivity, mobile and networked IT offerings. This is underpinned by our investments in digital capabilities.
This year we’ve launched:
| – | BT Business Ultrafast broadband with download speeds of up to 314Mbs, upload speeds of up to 48Mbs, and a minimum speed guarantee |
| – | BT GuestWi-Fi, to protect our customers’ broadband speeds and provide extra security |
| – | BT Sport as part of the Infinity Broadband bundle |
| – | Business-gradeend-point security in conjunction with Symantec |
| – | Cloud Voice SIP-Trunking within our IP Voice portfolio. This gives customers the cost benefits of IP telephony through existingon- premises equipment |
| – | SIP phones and SIP endpoints within the BT OnePhone portfolio to expand its capabilities |
| – | new Mobile Sharer plans with extended international roaming options and new mobile security management. |
We have continued to invest more in our digital and online capabilities. This has helped us do more business online, made it easier for customers to do business with us, and delivered a more personalised experience.
 | Transforming our costs |
Building on last year’s work integrating EE with Business and Public Sector, we’re still finding big cost savings through bringing customer service, sales and support closer together.
We’ve combined the business elements of BT and EE – finding overlaps in the structures and delivering the financial savings.
We’ve also shared and adopted the best working practices of each organisation – using this to improve customer service levels and overall NPS.
Performance in the year – operating
Our order intake of £3.4bn was up 1%. Although we signed a large wholesale contract in Republic of Ireland this was offset by declining fixed voice revenue and by us deciding to move away fromlow-margin equipment sales.
Business and Public Sector12-month rolling order intake
Year ended 31 March
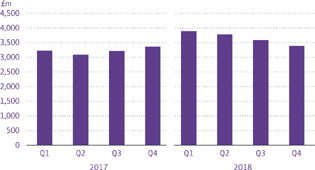
| British Telecommunications plc Annual Report & Form 20-F 2018 | 61 | |||||
Table of Contents
Our customer-facing units continued
Business and Public Sector continued
In last year’s report, we set out our top priorities for this year. There’s a summary of how we did in the table below.
Review of last year’s priorities
What we said
|
What we did
| |||
Drive growth from broader sales coverage, winning new customers and cross-selling to existing ones.
| We’re increasing the average number of products our customers buy from us. We’re doing that through multi-product combinations and by using the BT and EE brands to target existing customers who don’t have both fixed and mobile solutions with us.
We strengthened our leadership in our regional teams. | |||
| ||||
Stand out through integrating our portfolio and delivering it on the best network. |
We integrated BT OnePhone with our BTnet Internet Access product.
We launched Skype Integration with BT OnePhone for presence. | |||
| ||||
| Keep improving our customer experience. | Customer experience scores are all going in the right direction – NPS (+12.1), RFT (+5%), and call volumes(-15%).
We enhanced our portfolio to make our products more customer-friendly. Our broadband Smart Hub now comes with better diagnostics and we’ve simplified our pricing for BTnet.
| |||
We won orre-signed a lot of contracts this year, including:
| ||||
Customer
|
Contract
| |||
WSP UK |
We were picked as preferred network partner for extra internet connectivity. The solution will provide additional bandwidth to help its people work together better, and enhanceend-user experience as well as resilience to ensure business continuity. | |||
| ||||
Severn Trent Water
|
We’ll be providing core communications infrastructure, including Managed WAN, Voice, SIP and LAN services. | |||
| ||||
London Borough of Bromley
|
A multi-million pound contract. It covers all the council’s IT services. We’ll provide new voice and data networks, mobile phones, internet access and support for business software applications to be used by more than 2,000 council people. | |||
| ||||
First Group
|
We were chosen as its preferred Mobility Partner to provide a full range of mobility services.
| |||
The number of business lines we provide fell by 10% as customers continue to migrate to IP Voice. This has been partly balanced by our base of IP Voice lines going up 42% (against market growth of 21%).
There’s been a strongtake-up of BT Cloud Voice and BT Cloud Phone. User numbers are up 102% and 74% respectively.
We’re adapting to changes in the public sector market. We’ve bolstered our regional leadership and aligned our health team with local governments – reflecting the disaggregation of the centralised N3 contract.
We’ve reached agreement to end contracts with customers in areas we said last year weren’t core to our future. And we’ve also brought together our central government, defence and police organisations under new leadership.
Performance in the year – financial
Revenue was down 4% (2016/17: up 11%) with underlying revenue excluding transit also down 4% (2016/17: down 6%). Profits fell – mainly because of declining fixed voice revenues. But the rest of our business did well, especially mobile.
| Year ended 31 March | 2018 £m | 2017 £m | 2016 £m | |||||||||
Revenue
|
|
4,563
|
|
|
4,758
|
|
|
4,294
|
| |||
Change in underlying revenue excluding transit adjusted for the acquisition of EE
|
|
(4)%
|
|
|
(6)%
|
|
|
(2)%
|
| |||
Operating costs
|
|
3,145
|
|
|
3,230
|
|
|
2,880
|
| |||
EBITDA
|
|
1,418
|
|
|
1,528
|
|
|
1,414
|
| |||
Depreciation and amortisation
|
|
365
|
|
|
352
|
|
|
284
|
| |||
Operating profit
|
|
1,053
|
|
|
1,176
|
|
|
1,130
|
| |||
Capital expenditure
|
|
304
|
|
|
275
|
|
|
153
|
| |||
SME revenue was down 1%. Strong growth in mobile didn’t quite offset falling fixed voice revenues. As customers shift to IP Voice, they need fewer lines than with traditional voice, so overall line totals fall.
Corporate revenue was down 5%. Our growing mobile revenues were balanced by the decline in fixed voice revenue and falling equipment sales resulting from our decision to move away from lower-margin business.
Public Sector and Major Business revenue was down 7%. We sold less equipment and we are still feeling the impact of a few large public sector contracts coming to an end, as highlighted last year.
Foreign exchange movements had an £18m positive impact on Republic of Ireland revenue, where underlying revenue excluding transit was down 6%.
| 62 | British Telecommunications plc Annual Report & Form 20-F 2018 | |||||
Table of Contents
| THE STRATEGIC REPORT | GOVERNANCE | FINANCIAL STATEMENTS | ADDITIONAL INFORMATION | |||||||||
|
|
| ||||||||||
Operating costs were down 3% (2016/17: up 12%) and EBITDA was down 7% (2016/17: up 8%) because of lower revenues, operational efficiencies and cost savings. Depreciation and amortisation rose by 4% (2016/17: up 24%).
Capital expenditure went up by £29m (2016/17: £122m increase).
Our top priorities for 2018/19
Drive growth from broader sales coverage, winning new customers and cross-selling to existing ones
| – | Develop innovative tools to boost cross-selling. |
| – | Create new bundles that are simpler to upsell. |
| – | Increase our reach through indirect partners. |
Stand out through integrating our portfolio and delivering it on the best network
| – | Build new converged propositions. |
| – | Standardise our solutions across the portfolio. |
| – | Offer higher capacity data services. |
Keep improving our customer experience, especially digital
| – | Provide a more consistent, personalised digital experience for each customer. |
| – | Transform our service model. |
| – | Focus more on proactive care. |
| British Telecommunications plc Annual Report & Form 20-F 2018 | 63 | |||||
Table of Contents
Our customer-facing units
We’re a leading business communications provider with customers in 180 countries. Across the world we enable customers’ digital transformations so they can thrive. Our focus is simple: be the globalprovider-of-choice for managed network and IT infrastructure services.
Our business is all about transformation. Transformation affects our customers and their customers. It affects our competitors and the markets in which we operate. It affects our strategic partners and the race to roll out new technology and solutions. And it affects our people and how they serve our customers.
Ultimately transformation is what we do for our customers, so they can embrace the opportunities of digitisation. And embrace them trusting their networks, systems and applications to a reliable partner.
This year we’ve been carrying out our own transformation. We’re investing in scalable, repeatable platforms for a specific type of truly global company or organisation. We are also investing in differentiating our service, rolling out and managing software-defined network solutions, strengthening our security practice, and building on our Cloud of Clouds strategy.
We’re focusing on a smaller number of markets and a more select set of repeatable solutions. And we are making our service model work more efficiently. These things will deliver the long-term value our customers deserve.
Our strategic review
Last year we announced a strategic review of Global Services. Today we’ve already made the first moves to becoming a more profitable, predictable and customer-focused business, which we’re calling Digital GS.
Digital GS is our strategy to create a better future for Global Services, our people and our customers. Our business will focus on a set of named global customers and a portfolio of scalable repeatable solutions, supported by outstanding customer service and market-leading security.
Markets and customers
Customers
We have 5,500 customers around the world. Major accounts are our focus – they generated 81% of our revenue in 2017/18. Around 78% of our revenue came from serving customers operating in multiple geographies.
Regions
We have more than 17,000 people worldwide in 59 countries. Our 20 highest priority countries, including the UK and other key countries where our major customers are based, generate more than 95% of our revenue.
Continental Europe is our largest region by revenue. We have offices in 17 countries, and an extensive network serving customers across the continent.
In the UK, we focus on financial services organisations and multinationals, where we benefit from BT’s extensive UK network and mobile infrastructure.
Around 73% of our major customers have a presence in the Americas. So we operate in the USA, Canada and 28 countries across Latin America and the Caribbean. We do this from offices in 17 countries.
In Asia, Middle East and Africa we help multinationals expand their operations and we support local companies as they grow internationally. We have offices in 23 countries across the region.
Outside the UK, markets are liberalised to widely varying degrees. In many countries, this can constrain our ability to compete, to a greater or lesser degree.
We continue to press national incumbent operators and regulators around the world (including in the EU) for cost-relatednon-discriminatory wholesale access to their networks, where appropriate. We also ask for notice of any changes to network design or technology which would affect our ability to serve our customers.
Global Services revenue by region
Year ended 31 March 2018
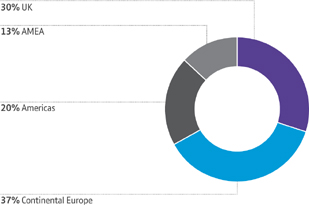
Key market trends
Our customers are facing new disruptions and challenges. They include:
| – | switching from old self-managed data centres to cloud-based infrastructure |
| – | responding to the explosion of data traffic, particularly to and from public clouds |
| – | the increased complexity of managing growing numbers of internet and network providers |
| – | increasing risk of cyberattacks and increased exposure as use of the internet grows. |
As our customers digitally transform themselves, they rely on us. We must keep them connected to increasingly vital IT infrastructure and applications, help them enrich their customer interactions and boost their people’s productivity.
Customers tell us they want a strategic partner. They want more commercial flexibility (eg usage-based billing) with reliable quoting and delivery. And they want faster innovation and time to market for new services.
| 64 | British Telecommunications plc Annual Report & Form 20-F 2018 | |||||
Table of Contents
| THE STRATEGIC REPORT | GOVERNANCE | FINANCIAL STATEMENTS | ADDITIONAL INFORMATION | |||||||||
|
|
| ||||||||||
So, we’re making our business more focused, straightforward and agile by investing and focusing on what our customers need:
| – | secure, flexible hybrid network solutions with faster deployment via our Dynamic Network Services portfolio |
| – | dedicated access to a rich digital ecosystem of the world’s leading cloud service providers through our Cloud Landing Zone |
| – | best-in-class customer service using the latest automation and information tools – flexible enough to cover self-service through to fully managed solutions. |
Our competitors include global telecoms companies like AT&T, NTT, Orange and Vodafone and regional operators like Singtel.
Products and services
We call our portfolio strategy Cloud of Clouds. It brings together our six core product families with our ecosystem of partners to deliver global network and IT services.
Dynamic Network Services are the heart of Cloud of Clouds. Our strategy brings together:
| – | strength in intelligent hybrid networks |
| – | a wide portfolio, especially in security |
| – | a focus on service |
| – | investments in the latest technology. |
We’re working with leading technology companies and cloud services providers like Amazon Web Services (AWS) and IBM. Together we’re helping customers get the most from cloud and transform their businesses more quickly.
Our six core product families
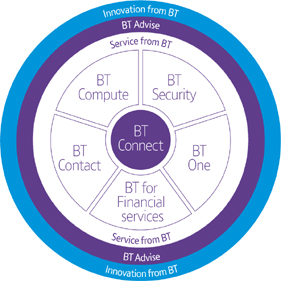
BT Connect
Our network services connect our customers to their people, to their own customers – and to the cloud. We offer flexible, intelligent hybrid and secure IP, Ethernet and internet virtual private network services, as well as connectivity to third-party cloud services providers.
Our Dynamic Network Services programme combines our global infrastructure with the latest technologies. They include network function virtualisation (NFV) and software-defined wide area networking(SD-WAN) solutions. These underpin the digital transformation of large organisations.
BT Security
Cyber attacks now happen every day, sparking cybersecurity conversations in the boardrooms of our customers.
We’ve learned a lot protecting our own organisation. And we use this knowledge to provide consultancy and managed security services, threat intelligence analysis and management to customers. This helps them protect themselves from ever-evolving threats and maximise the opportunities of digital transformation securely.
We work with more than 200 vendors. So our services are powered by leading technologies. We get intelligence from our global network and intelligence-sharing partnerships. So the services we offer are informed by real-time threat intelligence.
We’ve been at the forefront of cybersecurity for more than 70 years, working in close partnerships with government and law enforcement to make the internet safer for everyone.
BT One
People use technology to communicate in lots of different ways – phone, messaging, email, conferencing and data-sharing solutions, either at their desks or on the move.
Our collaboration services help businesses work together better and cut costs by transforming interactions with customers, colleagues, partners and suppliers.
BT Contact
Our contact centre services help our customers build richer relationships with their customers. We offer lots of ways to communicate – email, web chat, video, social media and phone – via automated systems or dedicated advisers.
Our cloud contact solutions give companies more control over costs, letting them change capacity depending on demand.
BT Compute
Businesses want reliable, flexible IT platforms and services for their applications, data storage and security.
We provide IT services from 48 data centres around the world, 22 of which deliver cloud services. We offer traditional telehousing and colocation through to the latest public, private and hybrid cloud solutions.
| British Telecommunications plc Annual Report & Form 20-F 2018 | 65 | |||||
Table of Contents
Our customer-facing units continued
Global Services continued
BT Advise
Our global team of consultants work with customers to understand their issues and current capabilities and make recommendations based on our portfolio.
The plans we develop and support for customers help them do things like cut costs or increase productivity.
BT for Financial Markets
To help the global financial community with its regulatory, technological, and infrastructure challenges, we’ve built industry-specific solutions.
| – | The BT Radianz Cloud is the world’s largest secure, financial services community. It helps customers cut costs and get to market faster. |
| – | Traders worldwide rely on our specialist Unified Trading voice devices. We’ve recently added IP Trade’s portfolio – giving customers more options to integrate new compliance and unified communications tools. |
| – | We provide secure financial messaging to more than 100 companies in the post-trade sector. |
| – | We combine our Radianz and Unified Trading platforms to offer flexible cloud-trading services to more than 50,000 users. |
Performance in the year
We remain a global leader for managed network and IT services.
In the last year we’ve been named as:
| – | a Leader for the 14th consecutive time in Gartner’s Magic Quadrant for Network Service Providers, Global (February 2018)a |
| – | a Leader for the fifth consecutive year in Gartner’s Magic Quadrant for Managed Hybrid Cloud Hosting (MHCH), in Europe (June 2017)a |
| – | a Leader for the third year in a row in Gartner’s 2017 Magic Quadrant for Contact Center as a Service, Western Europe (October 2017)a |
| – | a Leader for the second year in a row in Gartner’s 2017 Magic Quadrant for Unified Communications as a Service, Worldwide (September 2017)a |
| – | a Leader in the IDC MarketScape Global Managed Security Services 2017 Vendor Assessment (August 2017). |
We were also voted number one financial services network provider in the 2017 Waters Rankings. This is the 15th year running Waters have recognised us for innovation in the BT Radianz Cloud.
| a | Gartner does not endorse any vendor, product or service depicted in its research publications, and does not advise technology users to select only those vendors with the highest ratings or other designation. Gartner research publications consist of the opinions of Gartner’s research organisation and should not be construed as statements of fact. Gartner disclaims all warranties, expressed or implied, with respect to this research, including any warranties of merchantability or fitness for a particular purpose. |
| The Gartner Report(s) described herein, (the ‘Gartner Report(s)’) represent(s) research opinion or viewpoints published, as part of a syndicated subscription service, by Gartner, Inc. (‘Gartner’), and are not representations of fact. Each Gartner Report speaks as of its original publication date (and not as of the date of this Annual Report) and the opinions expressed in the Gartner Report(s) are subject to change without notice. |
Performance in the year – strategic
 | Delivering great customer experience |
The feedback and insight we get from customers helps us make the right decisions to enhance their experience with us.
| – | We measure loyalty and identify the things we need to improve through monthly net promoter score (NPS) surveys. |
| – | We use ‘Customer Thermometer’ to track how they feel about their interactions with us. |
| – | And we use Right First Time measures, like how quickly we deliver orders or fix faults, to monitor how we’re doing. |
During the year:
| – | Our NPS12-month rolling average rose 17 points (nine points ahead of ouryear-end target). More customers feel we understand them and proactively offer solutions. |
| – | Our RFT performance improved 8.2% (ahead of our 4.5% target), driven by strong performance in service delivery. |
 | Investing for growth |
Network and services
| – | We opened a new cybersecurity research and development hub in Sydney, Australia — our first outside the UK. We also opened a new Security Operations Centre near Frankfurt, Germany – part of a global network of 15. |
| – | As part of our Dynamic Network Services programme, we launched BT Agile Connect. It’s a newSD-WAN service giving customers control of infrastructure and traffic flows, faster and more secureset-up, and lower costs. |
We also launched: :
| – | BT Connect IntelligenceInfoVista-as-a-Service – we were first to market with Infovista’s latest application performance management solution. It gives customers a new, commercially-flexible approach. |
| – | BT Bandwidth on Demand – helps our customers be nimbler by letting them flex network bandwidth in real-time. |
| – | BT One Collaborate Spark – integrates the new Cisco Spark services platform into our voice network. This is designed to deliver market-leading audio quality and user experience. |
| – | Internet Connect Global DDoS – offers critical security protection for internet-based WAN networking. |
Service agility
| – | We’re investing in new systems for service assurance and delivery like our Service Intelligence platform. |
| – | Our 360° portfolio reviews streamline how we deliver our products. |
| 66 | British Telecommunications plc Annual Report & Form 20-F 2018 | |||||
Table of Contents
| THE STRATEGIC REPORT | GOVERNANCE | FINANCIAL STATEMENTS | ADDITIONAL INFORMATION | |||||||||
|
|
| ||||||||||
Partnerships
| – | We announced a strategic collaboration with Amazon Web Services to help customers adopt cloud services. |
| – | We extended our strategic partnership with Cisco, under the Dynamic Network Services programme. |
| – | We launched a new service, BT Cloud Connect Direct for IBM, to give global businesses direct access to IBM Cloud via our network. |
| – | We partnered with Symantec to provide our customers with best-in-class endpoint security. |
 | Transforming our costs |
We continue to focus on reducing costs. Operating costs were 8% lower this year.
Last year we said we’d transform Global Services. Since then we’ve streamlined and simplified our business to be more efficient and effective and to more tightly control our costs. For example:
| – | Restructuring our European operations.We’ve pressed ahead with a restructuring programme to help us compete more effectively, especially in Europe. By getting rid of duplication and working more efficiently we have been able to rationalise the number of management and back-office roles. |
| – | Rationalising our domestic portfolio.We’re switching from legacy and domestic portfolio platforms onto a set of globally scalable ones. This year we closed or migrated eleven domestic product platforms. |
| – | Re-designing our global network.We’re improving the performance and efficiency of our core European network. |
| – | Reducinglow-margin business.In line with our strategy, we’ve reduced IP Exchange volumes and equipment sales, leading to lower operating costs. |
Performance in the year – operating
We took £3.8bn worth of orders, down 16% from last year. This fall was due to our decision to stop pursuingnon-strategic opportunities and to changes in buying habits. Customers want more flexible commercial terms – like shorter contract lengths and more usage-based services.
The following table below shows the progress we’ve made on the priorities we set ourselves last year:
Review of last year’s priorities
| What we said | What we did | |||
Implement a leaner and more customer- focused operating model.
|
From April 2018 our top accounts have a new global account management model in place. | |||
| ||||
Grow our cloud-based services and security portfolio at double-digit rates. |
We grew our security and Cloud Compute services by double-digits. (One Cloud and Cloud Contact services didn’t grow as much – but we’re aiming for double-digit growth in future.)
| |||
| ||||
Launch a new digital customer experience, using automation and portfolio innovations like NFV and SDN. |
We launched Dynamic Network Services, including BT Agile Connect and Bandwidth on Demand.
We introduced the Service Intelligence platform. Now our people can view customers’ networks and applications in real-time.
And we brought in tools like MI Kitchen (a unified data source for better management insight) and Service Orchestration (to automate how we manage incidents).
| |||
This year we won:
| ||||
| Customer | Contract | |||
Anglo American BT Security |
Security operating centre capability and endpoint monitoring service. | |||
| ||||
AWE BT Security |
Cybersecurity. | |||
| ||||
Deloitte BT One |
Video streaming to 35,000 employees across North West Europe. | |||
| ||||
Deutsche Post DHL BT One |
Fixed voice services serving around 3,000 employees in 45 locations. | |||
| ||||
Fujitsu BT Connect |
WAN services providing connectivity between their own and customers’ premises. | |||
| ||||
Hella Group BT Connect |
Global WAN services connecting locations in 12 countries through Europe and Asia. | |||
| ||||
Mastercard BT Connect |
IP Connect managed network services in the UK, US and Europe. | |||
| ||||
Wallenius Wilhelmsen Logistics BT Connect
|
Network connecting more than 100 locations in 40 countries.
| |||
| British Telecommunications plc Annual Report & Form 20-F 2018 | 67 | |||||
Table of Contents
Our customer-facing units continued
Global Service continued
Performance in the year – financial
Revenue fell 9% (2016/17: up 8%). This decline principally reflects lower IP Exchange volumes and equipment sales from our strategic decision to reducelow-margin business, reduced revenue from our Italian business, lower general trading across all regions and some large contracts ending.
These factors were partly offset by a positive £68m impact from foreign exchange movements. Our key revenue measure, underlying revenue excluding transit, fell 8%.
Year ended 31 March
| 2018 £m
| 2017 £m
| 2016 £m
| |||||||||
Revenue
|
|
5,013
|
|
|
5,479
|
|
|
5,074
|
| |||
Change in underlying revenue excluding transit
|
|
(8)%
|
|
|
(2)%
|
|
|
0%
|
| |||
Operating costs
|
|
4,579
|
|
|
4,984
|
|
|
4,595
|
| |||
EBITDA
|
|
434
|
|
|
495
|
|
|
479
|
| |||
Depreciation and amortisation
|
|
424
|
|
|
439
|
|
|
422
|
| |||
Operating profit
|
|
10
|
|
|
56
|
|
|
57
|
| |||
Capital expenditure
|
|
278
|
|
|
361
|
|
|
355
|
| |||
Underlying revenuea in AMEAb fell by 5% (2016/17: down 4%). In the Americasc it fell by 11% (2016/17: fell 6%), reflecting the ongoing impact of a major customer insourcing services in the US and a large contract in Brazil completing in early 2017/18.
In Continental Europe underlying revenuea excluding transit dropped by 9% (2016/17: down 5%), reflecting lower IP Exchange volumes, lower equipment sales and lower revenue from our Italian business. In the UK revenue fell by 6% (2016/17: was up 5%) reflecting lower IP Exchange volumes.
Operating costs fell by 8% (2016/17: up 8%). This mainly reflected lower IP Exchange volumes and lower equipment sales.
EBITDA fell 12% (2016/17: up 3%) reflecting certainone-off items in the current year and the prior year benefit arising from a revision of the annual bonus. Excluding theseone-off items, EBITDA was broadly flat. Depreciation and amortisation was down 3% (2016/17: up 4%). Operating profit fell by £46m (2016/17: down
£1m).
Capital expenditure was down 23% (2016/17: up 2%). EBITDA less capital expenditure rose by £22m to £156m compared with last year’s rise of £10m.
| a | Excludes specific items and foreign exchange movements and acquisitions. |
| b | Asia Pacific, the Middle East and Africa (AMEA). |
| c | United States & Canada and Latin America. |
Our top priorities for 2018/19
Improve service agility and
customer experience
| – | Automate manually-intensive service processes. |
| – | Harmonise our systems so there’s betterend-to-end ownership of processes. |
| – | Introduce new tools to enrich our customer service interactions. |
Deliver our global transformation priorities
| – | Implement our global operating model faster. |
| – | Complete our organisationalre-design in line with our global strategy. |
| – | Help our people be more productive through investment in simplification, tools and process automation. |
Make our high-growth strategic portfolio more repeatable
| – | Embed BT Security features more deeply into the rest of our global portfolio. |
| – | Expand our portfolio of standardised Dynamic Network Services solutions. |
| – | Simplify commercial offers for cloud solutions. |
| 68 | British Telecommunications plc Annual Report & Form 20-F 2018 | |||||
Table of Contents
| THE STRATEGIC REPORT | GOVERNANCE | FINANCIAL STATEMENTS | ADDITIONAL INFORMATION | |||||||||
|
|
| ||||||||||
Our customer-facing units
We help communications companies provide fixed or mobile phone services. We also offer specialist enterprise services to our ventures and Internet of Things customers.
Our 4,700 people combine unique expertise in fixed and wholesale network solutions with operational knowledge in our venture businesses. This year we created a new unit dedicated to the Internet of Things, serving the wider BT Group.
Markets and customers
Our wholesale business helps communications providers (CPs) and other organisations provide fixed or mobile phone services. Our ventures provide mass-market services like directory enquiries and payphones, and enterprise services including BT Fleet and BT Redcare.
Wholesale: Fixed network services
We provide wholesale fixed network services to more than 1,400 customers. They include Sky, TalkTalk, Telefonica O2, Three and Virgin Media – and overseas CPs operating in the UK.
We also provide specialist media and broadcast services to companies like the BBC, Channel 4, ITV, Sky, Premier League
Productions and Viacom18.
Wholesale: Mobile network services
We help Mobile Virtual Network Operators (MVNOs) offer theirown-brand mobile plans. Today our MVNO business supports 3.7m customers. They access the EE mobile network under our partners’ brands.
Wholesale: Market trends
The key trends this year were:
| – | rising demand for bandwidth and superfast connectivity, especially fibre broadband |
| – | higher MVNO subscription volumes, coupled with slightly lower average prices |
| – | more price competition for wholesale data products like Ethernet and broadband |
| – | the UK market’s fastest ever growth in cloud communication business users in the last six months – with more than 3m business users for the first time. |
Ventures
Our ventures provide solutions to more than 1,000 enterprise customers. They include law firms, energy providers and mobile payment companies.
We also handle millions of directory enquiries and 999 calls and deliver the Phone Book to more than 21m homes and businesses.
Internet of Things
The Internet of Things (IoT) is a network of connected objects that exchange data to drive insight and action. Our IoT propositions,
coupled with solutions from our partners, serve high street retailers, large logistics groups and utilities.
We also offer IoT connectivity to our wholesale partners in the UK, using the EE mobile network.
Products and services
Broadband and Ethernet
We provide CPs with broadband and Ethernet connections between their core network and their customers.
Wholesale Broadband Connect can now serve 98% of premises with copper-based broadband (2016/17: 96%) and more than 29m premises with fibre. Combined with our older broadband network, we can reach 99% of premises.
Wholesale Ethernet lets customers connect at speeds of up to 10Gbps. Wholesale Optical boosts those speeds to 100Gbps. This year we extended our own fibre-based Ethernet to more third-party datacentres.
Our Managed Ethernet Access Service (MEAS) carries mobile voice and data traffic to and from mobile operators’ transmission masts.
Voice
Our IP Exchange platform helps CPs carry their customers’ voice calls beyond the reach of their own voice network. It’s used by more than 170 CPs, including most of the UK’s biggest operators.
CPs without their own voice network can use Wholesale Calls, which routes calls for them from start to finish. They keep their customer relationships through their own sales, service and billing.
Hosted communications
Traditionally, businesses made and received calls over phone lines via a switchboard.
Wholesale SIP-Trunking delivers calls over broadband or Ethernet, while Wholesale Hosted Centrex puts switchboard capabilities into our network.
Similarly, our Hosted Contact Centres replace the systems and services needed to handle large numbers of inbound or outbound customer calls.
Mobile Virtual Network Operator (MVNO)
We have kept our focus on supporting MVNOs, helping them give their customers access to the EE mobile network under their own brand. In 2017/18 we signed a new agreement with China Mobile. It launched a mobile proposition for Chinese communities, students and travellers in the UK.
Managed solutions
We’ve designed a range of fully-managed solutions, including access infrastructure, backhaul and core services. This means greater flexibility to meet CPs’ needs and includes the migration path to next generation technologies.
| British Telecommunications plc Annual Report & Form 20-F 2018 | 69 | |||||
Table of Contents
Our customer-facing units continued
Wholesale and Ventures continued
Our portfolio includes Managed Install (a quick and efficient Ethernet circuit installation) and Managed Wayleave – a solution that streamlines getting landowners’ rights of way.
Machine-to-machine and Internet of Things
We have four products in our Internet of Things portfolio. And we’re actively building new ones.
Machine-to-machine and IoT network solutions:these use our mobile and fixed networks to help companies communicate securely with their devices and improve their services’ features and reliability.
Intelligent Retail Solution: this helps high street retailers better understand customer footfall in their stores. It’s powered by the Acuitas Alliance of BT, Intel, RetailNext, SATO and other partners.
Asset Intelligence: these solutions let customers track, monitor and control assets via RFID, low power networks and cellular radio technology.
Smart Cities starter kit: this gives UK cities a bundle ofpre-configured use cases in things like transport management, lighting and operations. We’re involved in two big projects transforming Milton Keynes (MK Smart) and Manchester (City Verve).
Roaming
We help BT and EE mobile customers use their mobiles abroad through roaming agreements in more than 200 destinations.
Media services
Our media network connects major spots around the world where broadcast or film content is created or distributed.
In the UK it carries all the nation’s digital terrestrial TV, as well as TV broadcasts from more than 150 sports and news locations. Elsewhere, local partners help us link TV stations to major sports venues worldwide.
We also offer media services like cloud-based content playout and media file acceleration.
Ventures
Our ventures provide well-known services nationwide:
999: we handle 999 and 112 (the European equivalent) calls on BT and other CPs’ behalf. In 2017/18, we answered more than 32 million 999 and 112 calls. Despite the fires, terrorism incidents and bad weather that hit the UK, we answered these calls in an average time of 0.45 seconds – a big achievement.
Next Generation text calls:we deal with the next generation text calls that support deaf, hard of hearing or speech-impaired people. We answered 700,000 calls in 2017/18.
Directory Enquiries: we offer six services. They include 118 500 (for people to get listed phone numbers easily) and 195 (for directory access for people who can’t use a phone book due to disability).
Payphones: we provide most of the UK’s payphones, whether in public places or on private premises. In 2017, we launched InLink UK, our new digital kiosks, see page 71.
The Phone Book:we deliver this to 21.7m UK homes and businesses. Roughly 200,000 UK businesses advertise in the Phone Book’s print and digital editions.
Our other ventures are more enterprise-oriented:
BT Cables:we manufacture, source and supply cabling for telcos, railways and other industries.
BT Fleet:we source, manage and maintain BT’s fleet of 33,000 vehicles. And we manage a further 58,000 vehicles for brands like the AA and National Grid.
BT Redcare:we linkon-site alarm systems and central alarm receiving centres to secure more than 200,000 UK homes and businesses.
BT Supply Chain: we hold and dispatch products like mobile phones and smart meters. For customers with big field engineering teams, we manage vehicles, supply engineers, return any surplus supplies to base and provide real-time data for route management.
Tikit: we provide IT solutions to law and accountancy firms in the UK. We sell to more thantwo-thirds of the top 100 law firms, and across Europe, North America and Australia.
Messaging: we offer bulk text messaging to major UK and public sector customers. This year we sold 2.7 billion texts (25% more than last year). We also sent 0.5 billion text appointment reminders and alerts for NHS patients and staff.
Performance in the year – strategic
 | Delivering great customer experience |
We’re making progress in giving our customers a better and simpler experience.
Net satisfaction measures our customers’ views on how we’re doing. It’s the difference between those who score us very high (9+) and those who score us lower (six or less) on the net promoter scale of0-10.
During the year we improved our website and online service platforms. For example, we launched a new online capability for buying Ethernet services online – meaning faster and simpler ordering. We also improved our Fleet Solutions booking experience and the quality of our information updates for our customers. These initiatives boosted net satisfaction up 4.3 points from last year.
Our Right First Time measure continues to improve, increasing 3.4% on last year. This was helped by us achieving 100% of contractual milestone dates for Managed Ethernet commitments during Q4, and a 9% improvement in our Ethernet delivery to first customer promise date.
| 70 | British Telecommunications plc Annual Report & Form 20-F 2018 | |||||
Table of Contents
| THE STRATEGIC REPORT | GOVERNANCE | FINANCIAL STATEMENTS | ADDITIONAL INFORMATION | |||||||||
|
|
| ||||||||||
 | Investing for growth |
This year we’ve invested in both new connectivity options for wholesale networks and in the services to run those networks. Looking ahead, we’re implementing a new strategy for our ventures and for the Internet of Things for the wider BT Group.
Wholesale
We’re developing our sales channels, changing our sales organisation and investing more in people, processes and systems.
Ventures
In fleet, we bought SEV (a mobile vehicle maintenance business) and integrated it with our fleet operations. We grew our team of mobile technicians by 18%. And we launched a suite of mobile apps: driver daily defect checker, self-service booking, accident management and garage locator.
In supply chain this year, we finished integrating Pelipod (the smart locker company we bought in 2016). We installed 264 Pelipod-lockers and 2,518 Pelipod-boxes at 332 sites. And we established a nationwide network for field operations – supporting BT engineers and external customers like EDF Energy.
In payphones, we launched InLinkUK in June 2017. These kiosks replace old phone boxes and provide free digital services for the public and advertising for businesses. They feature the UK’s fastest free publicwi-fi and a pair of 55” HD digital displays. There are now 138 InLink kiosks installed in London and Leeds with hundreds more due in 2018/19.
Our new Internet of Things team is engaging with major customers and partners across BT Group. Building on our partnership with the Williams F1 team, we recently hosted a transport ecosystem event for 100+ customers.
The team also supports internal IoT initiatives to improve customer experience and cut costs and carbon emissions. There have been initiatives in EE datacentres, trials for smart building solutions and solutions to track BT’s fleet.
 | Transforming our costs |
Ongoing cost transformation projects continued to save us money. We’ve:
| – | audited, renegotiated and consolidated suppliers, especially in new areas of Wholesale and Ventures |
| – | consolidated old orend-of-life platforms |
| – | reviewed our structure to make sure we’re the right size and fit for what our customers need. |
Performance in the year – operating
Our product mix is changing. Customers used traditional products less, as expected. But that was balanced by a healthy order book and growing revenues in other areas.
This year we signed almost £1,418bn of orders. They included:
| – | extending our Managed Services Contract with Virgin Media to operate its UK voice network |
| – | rolling out a new managed service contract with InLinkUK |
| – | signing a multi-year product and professional services framework deal with KCOM |
| – | deploying IoT asset tracking solutions for logistics and utility customers |
| – | delivering a new MVNO partnership with China Mobile |
| – | signing a new multi-year deal with Daisy to manage itsend-to-end supply chain and logistics. |
Review of last year’s priorities
| ||||
What we said
|
What we did
| |||
| Start deploying our new digital street kiosks. | InLinkUK launched in June 2017. There are now 138 kiosks installed in London and Leeds – with hundreds more due across the UK in 2018/19.
| |||
| ||||
Expand our managed services capacity, to help customers run their networks and operations.
| We launched our new portfolio of Professional Services. | |||
| ||||
| Help mobile network operators prepare for the next generation of 5G networks. | We’re providing advanced mobile- focused products and managed services to our mobile network operator customers as they deploy 4G networks and plan for 5G. | |||
We’ve evolved our portfolio to include small cells and are deploying them at more than 50 UK sites. They’re used by mobile operators to improve 4G coverage and for future 5G capacity.
| ||||
| ||||
| Add 4G mobile access to our hosted communications portfolio. | We’re currently launching a new and improved mobile application called Office UC on our hosted Centrex products.
| |||
| British Telecommunications plc Annual Report & Form 20-F 2018 | 71 | |||||
Table of Contents
Our customer-facing units continued
Wholesale and Ventures continued
What we said
|
What we did
| |||
| Develop new solutions for the Internet of Things. | There are now IoT solutions in some datacentres. They’ve helped us anticipate and fix faults which might have affected broadband customers and optimise our energy consumption. | |||
| We’re rolling out components of our intelligent retail solution in our retail estate (around 600 EE stores) to improve customer experience and store operations. | ||||
We’re developing more IoT | ||||
| ||||
| Improve customer experience – especially RFT delivery for Wholesale Ethernet and Hosted Communications Services. | RFT has increased significantly with a 3.4% increase in one year.
We improved Ethernet delivery by the ‘customerrequired-by date’ by 9%.
We delivered Managed Ethernet Access Service (MEAS) 100% on time during Q4.
| |||
Performance in the year – financial
Revenue was down 5% compared with a 7% decline last year. This included £12m or 25% less transit revenue than the year before.
| Year ended 31 March | 2018 £m | 2017 £m | 2016 £m | |||||||||
Revenue
|
|
2,009
|
|
|
2,109
|
|
|
2,274
|
| |||
Change in underlying revenue excluding transit adjusted for the acquisition of EE
|
|
(4)%
|
|
|
(3)%
|
|
|
–
|
| |||
Operating costs
|
|
1,255
|
|
|
1,275
|
|
|
1,519
|
| |||
EBITDA
|
|
754
|
|
|
834
|
|
|
755
|
| |||
Depreciation and amortisation
|
|
311
|
|
|
306
|
|
|
253
|
| |||
Operating profit
|
|
443
|
|
|
528
|
|
|
502
|
| |||
Capital expenditure
|
|
229
|
|
|
226
|
|
|
209
|
| |||
Revenue was down 5%, this reflects the market decline in legacy products partially offset by growth in Ventures.
Managed Solutions revenue declined 9% as MEAS saw a 13% fall. Mobile network operators have now largely completed the 4G build phase, so they added capacity at fewer sites and connected fewer new sites. This was partially offset by growth in other contracts.
Data and Broadband revenue was down 8%, due to the continuing decline in legacy Partial Private Circuits and price pressure in an increasingly competitive wholesale broadband market. Ethernet saw a 2% increase. Voice revenue was down 6% due to the market decline in call volumes.
Wholesale Mobile revenue was up 2% at £229m supported by growing data usage and more customers moving to 4G.
Ventures revenue of £321m was up 3% compared with last year. This was driven by growth in BT Fleet, both organic and through acquisitions (for example the SEV acquisition that allows Fleet to have mobile repair capacity). Bulk messaging services also grew significantly. These were offset by reductions in BT Cables because of falling demand for copper cabling, and further reductions in our Phone Book, Payphones and BT Redcare businesses which continued to decline in line with their markets.
Operating costs were flat reflecting the change in product mix as higher margin legacy products continue to decline.
EBITDA was down 10% on last year reflecting the lower revenue on high-margin legacy services, continuing migration to lower-margin IP services in Wholesale, and the change in product mix.
Depreciation and amortisation was up 2% (2016/17: 21%), primarily due to the BT Fleet vehicle replacement programme. Operating profit went down by 16% (2016/17: up by 5%).
Capital expenditure was up 1%.
Our top priorities for 2018/19
Roll out new services in our wholesale and venture businesses
| – | Continue the rollout of our digital kiosks (InLinkUK). |
| – | Keep expanding managed services. |
Expand our growth portfolio
| – | Keep building Internet of Things solutions and strengthening our position in this area. |
| – | Carry on developing and rolling out our nationwide final mile network. |
Improve customer experience
| – | Roll out a new programme to improve customer experience on our website and digital platforms. |
| – | Improve the multi-product experience. |
| 72 | British Telecommunications plc Annual Report & Form 20-F 2018 | |||||
Table of Contents
| THE STRATEGIC REPORT | GOVERNANCE | FINANCIAL STATEMENTS | ADDITIONAL INFORMATION | |||||||||
|
|
| ||||||||||
Our customer-facing units
We’re Britain’s digital network business – connecting homes and businesses large and small. We want to build the best possible network with the highest quality service, and make sure everyone in Britain is connected.
We build the network that connects Britain’s homes and businesses to the future.
We’re responsible for providing services over the local access network (sometimes called ‘the last mile’), and installing and maintaining the fibre and copper communications networks that connect homes and businesses.
Communications Providers (CPs) access our network on equivalent terms. That means they all get the same products, prices and levels of service. They use our network to deliver services ranging from home phone, broadband and TV to high-speed data connections for businesses of all sizes.
Delivering a more independent Openreach
Openreach has now been incorporated (Openreach Ltd). This follows the long-term regulatory agreement between BT and Ofcom under the Digital Communications Review (DCR). When all DCR preconditions have been met, Openreach will operate as a distinct, legally separate company within BT plc group.
We now have more control of our strategy, investments and plans within a strategic and financial framework defined by BT, making it more autonomous, transparent, and accountable to customers and stakeholders alike.
Greater independence also strengthens our ability to work more closely with all our customers. These stronger partnerships will deliver a future communications infrastructure that will remain the foundation of the UK’s vibrant internet economy.
The DCR agreement with Ofcom is based on voluntary commitments from BT. Once they’re fully implemented, it means:
| – | Openreach becoming a distinct company |
| – | a new Openreach board with an independent chair and majority of independent directors setting the direction and overseeing the company |
| – | executives being accountable to the new Openreach board |
| – | Openreach having control over strategy and budget allocation within an overall framework set by BT |
| – | Openreach consulting widely with Communication Providers to inform its network investments, including through a new confidential consultation phase |
| – | distinct Openreach branding. |
Over the past 12 months, we’ve already taken big steps to meet the commitments quickly and work in a new way. They include establishing the Openreach board, consulting with customers on FTTP investment and launching a new, distinct brand. In fact we’ve delivered many of the commitments ahead of the original schedule agreed with the regulator.
Markets and customers
The UK has the highest share of GDP generated by the digital economy of any country in the G20. It also has higher superfast availability andtake-up than any major European peer. We’re playing our part in this success story by building and running the largest superfast network in the country.
At the end of December 2017 there were 26m connected broadband lines in the UK. 80% of these – excluding Hull – use Openreach’s network. (The rest are mainly on Virgin Media’s cable network.)
Total UK broadband market
As at 31 March
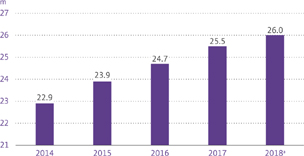
a As at December 2017.
| British Telecommunications plc Annual Report & Form 20-F 2018 | 73 | |||||
Table of Contents
Our customer-facing units continued
Openreach continued
Our customers are the communication providers (CPs) who provide communications services to homes and business across the UK. We also work closely with property developers building new properties to deliver our network to ‘new sites’.
There are 600 CPs using our network. They operate in three markets:
| – | Consumer– made up of households using fixed-line broadband and home phone services. Our largest customers include BT Consumer, Sky and TalkTalk. |
| – | Business– consisting of the 5.5m businesses in the UK. Most of our customers serve business clients. |
| – | Infrastructure– including firms building network infrastructure to data centres and mobile cell sites, and property developers building new developments. |
Recent market trends include:
| – | strong and growing demand for superfast fibre as consumers’ lives become more data-hungry |
| – | major investment in CPs’ backhaul capacity – spurred by more data usage and network reach to make sure everyone gets superfast speeds |
| – | more demand from consumers for high-capacity and reliable connectivity, and from businesses investing in cloud computing and IoT |
| – | a dynamic mobile connectivity market which is investing in greater capacity and coverage – driving innovative solutions |
| – | a fast-growing data centre market, creating a new need for high- capacity circuits (1Gbps or more). |
Competitors
Our main competitors also build networks. Virgin Media is the largest. Its cable network covers roughly half of UK homes, with plans to reach around 17m premises by 2019.
Other companies are building their own fibre access networks. CityFibre, Hyperoptic and Gigaclear are deployingfibre-to-the-premises across urban and rural areas, making our market more competitive.
In November 2017 CityFibre announced plans to bring FTTP to up to 5m premises by 2025 working in partnership with Vodafone.
In February 2018 TalkTalk announced it was investing in a joint venture with Infracapital to deploy FTTP to over 3m premises. Competitors in the business and infrastructure markets include Virgin Media, Colt Group and Vodafone.
Pricing, service delivery and product innovation remain competitive themes. ‘Price per Gigabit’ is falling because of intense competition – particularly in urban areas. New products like our OSA Filter Connect reflect the market’s competitive nature and the need to innovate to best meet customers’ needs.
Products and services
We provide network access and engineering services. They deliver phone, broadband and higher bandwidth data services through four main products: copper access, fibre access, Ethernet and optical, and infrastructure solutions.
Copper access
| – | Wholesale Line Rental (WLR)lets CPs offer phone services to their customers using our equipment and copper network. They pay for lines between our exchanges and their customers’ premises. |
| – | Local Loop Unbundling (LLU)provides CPs with a direct connection to the local network (or local loop). CPs can install their own equipment in, or near to, our exchanges, and use it to provide phone and broadband services to their customers. |
Fibre access
Our wholesale fibre product is called Generic Ethernet Access. We offer a few versions:
| – | Fibre-to-the-cabinet (FTTC)uses fibre from the exchange to the street cabinet, then the existing copper network for the final link to customers. |
| – | Gfastuses fibre from the exchange to the street cabinet, then uses high performance equipment to generate ultrafast speeds over the existing copper network for the final link to customers. |
| – | Fibre-to-the-premises (FTTP)uses fibre all the way from the exchange to the premises. We also offer speed tiers for smaller businesses needing ultrafast speeds at less cost than Ethernet. |
Fibre access allows us to offer superfast broadband (24Mbps+) via FTTC and FTTP and ultrafast broadband (100Mbps+) via Gfast and FTTP.
Ethernet and Optical high-bandwidth services
These are high-speed fibre connections. CPs use them to build and extend their networks, providing high-quality, high-bandwidth services to businesses and the public sector.
| – | Ethernet Access Direct (EAD)offers competitive services – from 10Mbps to 10Gbps – to all UK businesses and infrastructure markets. |
| – | Optical Spectrum Services (OSS)are scalable wavelength solutions offering up to 100Gbps at any distance. In 2018 we launched OSA Filter Connect to offer good value high-bandwidth pricing with lower incremental scaling costs. |
Infrastructure solutions
CPs use our infrastructure solutions to build their own networks. Third parties can ask us to rearrange our network or work on their networks.
| – | FlexibleCo-minglinglets CPs put their equipment in our exchanges. |
| – | Physical Infrastructure Access (PIA)lets CPs use our ducts and telephone poles to roll out their own fibre networks. PIA has been available since 2011. |
| – | Mobile Infill Infrastructure Solution (MiiS)lets CPs install their radio equipment in special cabinets linked to antennas |
| 74 | British Telecommunications plc Annual Report & Form 20-F 2018 | |||||
Table of Contents
| THE STRATEGIC REPORT | GOVERNANCE | FINANCIAL STATEMENTS | ADDITIONAL INFORMATION | |||||||||
|
|
| ||||||||||
on telephone poles and use their spectrum to improve mobile coverage. |
| – | Network rearrangementshelp third parties progress their projects by moving or removing our network. |
Performance in the year – strategic
| | Delivering great customer experience |
The table on page 78 shows how we’re doing on service. It includes a few key measures called Minimum Service Levels (MSLs).
MSLs are quality of service standards for installation and repair which are set by Ofcom and increase annually. Every quarter we publish our performance data with extra levels of detail.
We recognise the MSLs represent the minimum service standard and we are set to deliver performance ahead of these. This year we have again delivered ahead of Ofcom’s copper MSLs.
On-time customer provisions are now at just under 95% – meaning nearly all our customers get service when they want it, significantly ahead of Ofcom’s MSL of 89%. Our average first available appointment date is well below our12-day service level target.
Our investments in people and processes are working. They’re helping us keep up our performance during tough, high-demand patches like bad winter weather. We had fewer faults this year than last year. And we invested more than £30m to boost resilience and stop network faults rising like they have in the past.
We’re improving our customer service. There were 29.7% fewer missed appointments than last year (where we were responsible).
Customer satisfaction increased by 3.8% during the year, from a half-year baseline when our measures changed. And our Right First Time programme helped us to beat our targets to improve key service indicators by 3.7%.
Our service for large businesses keeps getting better. We’re providing more Ethernet circuits than ever before, and cutting the backlog of jobs. On average it takes us 40 days to install an Ethernet line, and we fix 95% of Ethernet faults in five hours.
In July 2017, the Competition Appeal Tribunal ruled there were errors in Ofcom’s Business Connectivity Market Review market assessment. So Ethernet MSLs were removed. Ofcom then used emergency powers to reimpose remedies on us – including MSLs – covering the period up to the end of March 2019.
We are currently outperforming four of the six temporary Ethernet MSLs. We remain concerned that the two remaining MSLs aren’t operationally achievable. We’re making further representations to Ofcom about this but that in no way weakens our resolve to further improve Ethernet service.
| | Investing for growth |
Our ambition is to deliver ultrafast speeds to homes and businesses – using FTTP and Gfast. We’re committed to bringing FTTP to 3m premises by 2020.
We’ll avoid building Gfast, only to rebuild later with FTTP – that would be a waste of money.
Our FTTP technology delivers ultrafast speeds of 1Gbps. It’s the technology of choice for all new homes and businesses. We’ve proposed to industry that 10m homes and businesses could have FTTP by themid-2020s – under the right conditions. That means cutting the cost of rolling it out, the right market demand, and Government support through regulation.
Gfast delivers ultrafast speeds of300-500Mbps on our existing copper network. It’s a really important part of our ultrafast strategy and we’ll deploy it to millions of UK premises.
For CP customers serving larger businesses, we launched a new managed fibre product – OSA Filter Connect – in April 2018.
Also in April 2018, Ofcom announced its decision not to impose a regulated Dark Fibre product for business connectivity during the period to March 2019.
Investing in our people
More than 30,000 people work for Openreach, including network engineers and planners who look after our access network.
To help us better meet customer demands, we’ve hired 2,392 new engineers this year. This boost in our people has helped us to both deliver beyond our MSLs and reduce missed appointments for a second successive year.
Nearly 300 of these new engineers are focused solely on cutting network faults – contributing this year to 104,400 fewer faults. We trained around 400 as fibre engineers – delivering ultrafast to newly-built properties and government funded BDUK contracts.
Our people are telling us they’re able to serve our customers better. Our latest people survey showed a 20% increase in pride in our service, and a 17% increase in confidence in the health of our network.
We want our best engineers to stay in the field, developing their skills, delivering for customers and supporting others to do the same.
That’s why this year, in response to engineer feedback, we’ve created and launched Engineering Career Pathways. Part of this is the introduction of a new Senior Engineer role – top engineers who can solve the most complex customer problems and pass on their skills and experience to their teams.
We’ve also modernised our training centres to include more varied and realistic training environments. This helps engineers learn the skills they need to serve customers in lots of different scenarios, in one location. We’re building 12 new fibre training centres – the first of which opened in Bradford in March 2018.
These things, and other interventions to positively influence our culture, have boosted our people’s engagement levels by 17% compared with last year.
| British Telecommunications plc Annual Report & Form 20-F 2018 | 75 | |||||
Table of Contents
Our customer-facing units continued
Openreach continued
| Transforming our costs | |||||
|
We’ve continued to review the way we work, simplifying our business to cut the cost of delivery while improving customer experience.
This year we:
| – | introduced new ‘connectorised’ technology to make the job of connecting up FTTP simpler. This moreplug-and-play approach means we can deploy more engineers to build networks and connect customers cheaper and quicker |
| – | used innovative technologies to speed up network build. Our new mechanised diggers dig trench, lay fibre, then fill the trench back in automatically. And we’re using drones to connect up fibre cable inhard-to-reach locations |
| – | invested in new technology to go inside customer homes. This includes ‘invisible’ cable and extendableplug-ins, which cut the time spent connecting customers to fibre |
| – | trialled the use of mobile planners who can survey and plan jobs out and about on a tablet – meaning customers wait less time for service |
| – | launched an engineer accreditation scheme for fibre to help share learning on how to cut the cost of building networks and time to install. |
Performance in the year – operating
Our superfast fibre network is now available to more than 27.5m premises. And 9.8m are now fibre customers. We also grew our Ethernet customer base by 11.6%.
Investing in fibre
We’ve helped the government achieve its ambition of making superfast speeds available to 95% of the UK. We’ve done it by over-delivering. We committed to bring superfast speeds to more than 730,000 premises between January and December 2017 (where it wasn’t already available). In fact, we brought speeds of 24Mbps or more to 774,000 premises.
We’re investing heavily in our fibre network. Superfast broadband (of over 24Mbps) is today available to more than 27.5m homes and businesses nationwide.
Our FTTP network is the UK’s biggest. We delivered more FTTP this year than ever before. Our footprint of 567,000 premises, combined with over 1m on Gfast, means that more than 1.5m premises can get ultrafast.
We’re extending our FTTP rollout to reach 3m premises by the end of 2020. If conditions are right we’ll go well beyond that – bringing the benefits of FTTP to nearly all UK homes and businesses.
To stimulate adoption, we provide free FTTP to all developments of 30+ properties. Since April 2017, 99% of plots on these sites are contracted to be built with FTTP.
Extending our reach
We’ve completed the build of superfast fibre in the BDUK programme to more than 4.8m homes and businesses. To reach more remote communities, we’ve partnered with local bodies and the BDUK programme.
We’ve made available £129m of reinvestment funding, earlier than planned. And we’ve worked with UK Government and local body partnerships to secure further funding to bring fibre to even more homes and businesses.
Our Community Fibre Partnerships programme usesco-funding to deliver high speed fibre broadband. To date we’ve signed deals with more than 500 communities. And 250 now have superfast and ultrafast access for over 65,000 premises.
We work with communities to secure funding from lots of different sources. They include the Government’s ‘Local Full Fibre Network’ and ‘Better Broadband’ voucher schemes and property developers. We’ve helped more than 60 school communities through our grant scheme to get access to a faster network.
The table below shows how we’re doing against the priorities we set for ourselves last year.
Review of last year’s priorities
| What we said | What we did | |||
| Connecting Britain to the future | ||||
Expand our ultrafast broadband network with Gfast and FTTP, reaching 2m homes and businesses with FTTP by the end of 2020.
| We’ve passed 1m premises with Gfast and 567,000 with FTTP. By 2020 our ‘Fibre First’ programme will give FTTP access to 3m premises. And we’re continuing to deliver our Gfast platform at scale.
| |||
Work to deploy FTTP using microfibre technology.
| We’ve made the most of our existing underground ducts by blowing through microfibre. This means we can build the fibre network more quickly and cheaply.
| |||
Delivering a great customer experience
| ||||
Achieve our RFT goal of 95%on-time installations by the end of 2017, ahead of Ofcom’s Minimum Service Level.
| We achieved 95%on-time installations for new lines, significantly ahead of Ofcom’s Minimum Service Level.
| |||
Hire 1,500 frontline engineers to further improve service.
| This year we hired 2,392 extra frontline engineers.
| |||
Drive higher investment in fibre skills and grow our Fibre Academy.
| We trained around 400 new recruits as fibre engineers this year. And we modernised our training centres so engineers could learn the right skills.
| |||
| 76 | British Telecommunications plc Annual Report & Form 20-F 2018 | |||||
Table of Contents
| THE STRATEGIC REPORT | GOVERNANCE | FINANCIAL STATEMENTS | ADDITIONAL INFORMATION | |||||||||
|
|
| ||||||||||
| What we said | What we did | |
Working with government and industry
| ||
Work with the Government to support its objective for universal broadband coverage.
| In December 2017 the Government opted for a broadband Universal Service Obligation (USO) rather than the voluntary offer we’d proposed. We’ll now work closely with them, Ofcom and industry to develop the USO.
| |
Launch a consultation with industry to shape future FTTP plans.
| We consulted with customers and announced our ‘Fibre First’ programme. It will bring FTTP to 3m homes and businesses by 2020. We’ll begin building FTTP in eight major cities during 2018.
| |
Performance in the year – financial
Revenue stayed flat. Strong demand for our fibre products was offset by regulatory price cuts and lower copper line rental. EBITDA fell 4% due to higher business rates and pension charges.
| Year ended 31 March | 2018 £m | 2017 £m | 2016 £m | |||||||||
Revenue
|
|
5,123
|
|
|
5,098
|
|
|
5,100
|
| |||
Operating costs
|
|
2,603
|
|
|
2,465
|
|
|
2,441
|
| |||
EBITDA
|
|
2,520
|
|
|
2,633
|
|
|
2,659
|
| |||
Depreciation and amortisation
|
|
1,360
|
|
|
1,369
|
|
|
1,301
|
| |||
Operating profit
|
|
1,160
|
|
|
1,264
|
|
|
1,358
|
| |||
Capital expenditure
|
|
1,658
|
|
|
1,573
|
|
|
1,447
|
| |||
Revenue was flat (2016/17: flat). The 22% growth in fibre broadband was offset by a reduction in our copper line base and regulatory price cuts.
Operating costs went up 6% (2016/17: up 1%) driven mainly by a rise in business rates charged on network assets and higher pension charges.
EBITDA fell 4% (2016/17: 1% fall). Depreciation and amortisation was down 1% (2016/17: up 5%) and operating profit down 8% (2016/17: down 7%).
Capital expenditure was £1,658m, up £85m or 5% (2016/17: up £126m or 9%). This reflects our ongoing investment in fibre broadband speed and coverage which helped us contribute to the Government’s ambition to get superfast to 95% of the UK by December 2017.
This was after gross grant income of £179m (2016/17: £159m) directly related to building the BDUK programme. It was offset by an increase in our grant funding deferral of £110m (2016/17: £185m) because of good fibre broadbandtake-up.
Our top priorities for 2018/19
Investment in fibre technology
| – | We’ll invest further in FTTP, starting in eight UK cities and building to 10m premises by themid-2020s (as long as conditions are right). |
| – | We’ll launch Gfast at scale in the UK to millions of premises, as a critical component of our ultrafast strategy. |
Decent broadband for all
| – | We’ll support government aims to bring at least 10Mbps broadband speeds to everyone in the UK, and the Scottish Parliament’s aim to deliver 30Mbps speeds in Scotland. |
| – | Where we can, we’ll deliver superfast or ultrafast speeds higher than the minimum speed. |
Improving customer experience
| – | We’ll aim to speed up our fibre repair by 3% – ahead of Ofcom’s MSLs. |
| – | We’ll hire 3,000 extra engineers to support our ‘Fibre First’ initiative to deliver FTTP across the UK. |
| British Telecommunications plc Annual Report & Form 20-F 2018 | 77 | |||||
Table of Contents
Our customer-facing units continued
Openreach continued
Openreach performance against service responsibilities
 Improvement Steady performance – staying focused
  Improvement needed – with plans in place to get back on track
| Ofcom minimum standard | Movement | 2017/18 | 2016/17a | |||||||||||||
| Home and smaller businesses | ||||||||||||||||
| Average time to install with an engineer (working days) |  | 13.29 | 13.65 | |||||||||||||
| Average time to install without an engineer (working days) | | 8.72 | 9.54 | |||||||||||||
| Installations needing an engineer waiting 22 days or longer for an appointment | | 0.2% | 0.24% | |||||||||||||
Average time for first available appointment date for a new installation (working days) | | 7.87 | 7.65 | |||||||||||||
New lines needing an engineer visit not installed 31 days past target date | | 1.00% | 1.32% | |||||||||||||
Average time to fix faults Maintenance level 1 (working days) | | 2.14 | 1.23 | |||||||||||||
Average time to fix faults Maintenance level 2 (working days) | | 1.66 | 1.80 | |||||||||||||
Faults not fixed after 31 days or more Maintenance level 1 | | 0.05% | 0.55% | |||||||||||||
Faults not fixed after 31 days or more Maintenance level 2 | | 0.07% | 0.64% | |||||||||||||
| Home and smaller business MSLs | ||||||||||||||||
New lines installed on time (WLR3) | 89% | | 95.44% | 93.50% | ||||||||||||
New lines installed on time (MPF) | 89% | | 94.41% | 93.76% | ||||||||||||
First available appointment date for a new installation (working days) 12 days or less (WLR3) | 79% | | 92.10% | 90.00% | ||||||||||||
First available appointment date for a new installation (working days) 12 days or less (MPF) | 79% | | 91.90% | 92.40% | ||||||||||||
Faults fixed within agreed time Maintenance level 1 | 77% | | 84.88% | 83.39% | ||||||||||||
Faults fixed within agreed time Maintenance level 2 | 77% | | 80.37% | 78.12% | ||||||||||||
| Larger business MSLs | ||||||||||||||||
Average time to install (working days) | n/m | 40 | n/m | |||||||||||||
Delivery date certainty | n/m | 78.4% | n/m | |||||||||||||
Circuits provided in 30 working days | n/m | 61.1% | n/m | |||||||||||||
Circuits provided in more than 118 working days | n/m | 6.6% | n/m | |||||||||||||
Faults fixed within agreed time | n/m | 95.2% | n/m | |||||||||||||
n/m – The products and areas that Openreach is regulated in for Business Connectivity services changed in 2017/18, making the comparison not meaningful.
| a | The figures in last year’s Annual Report were for the fourth quarter, these figures are full-year figures for 2016/17. |
| 78 | British Telecommunications plc Annual Report & Form 20-F 2018 | |||||
Table of Contents
| THE STRATEGIC REPORT | GOVERNANCE | FINANCIAL STATEMENTS | ADDITIONAL INFORMATION | |||||||||
|
|
| ||||||||||
Our corporate units
Technology, Service and Operations
TSO is our internal technology unit. It’s responsible for creating and operating our networks, platforms and IT systems.
We work with each of our customer-facing units. We create new products for them and make sure services evolve to meet their customers’ changing needs. And we make sure BT’s networks and systems stay reliable, resilient and secure.
There are more than 11,700 people in TSO. Most of them work in the UK, but we also have 3,300 people in 24 other countries. This year we hired more than 240 graduates and apprentices.
In the UK, most of our teams are based at Global Development Centres in Belfast, Bristol, Cardiff, Glasgow, London and Adastral Park in Suffolk; as well as Hatfield, Sheffield, Walsall and Oswestry.
Our teams give vital support to the rest of BT.
On page 17 we’ve set out that we’ve extended both our 4G and ESN coverage and brought together BT and EE IT systems to reduce costs. We’ve also filed 97 applications for new inventions as set out on page 18.
Products and services
We manage the critical infrastructure for BT’s products, services and internal systems. That means our IT systems, voice, data and TV networks. We also invent, design and develop new services for customers.
Our responsibilities
| Responsibilities | What we do | |
We’re responsible for BT’s technical strategy.
| Covering our technology estate, IT systems, processes and networks. Everything we use to deliver our technology capabilities to the rest of BT.
| |
We manage BT’send-to-end technical delivery processes.
| Working with the customer-facing units and BT Group.
| |
We design, test, build and run BT’s main global physical asset – our network and its critical supporting infrastructure.
| That includes the group’s broadband, Ethernet, VPN, internet,wi-fi and mobile platforms in the UK. It also includes allnon-UK IP, data, voice, multimedia, cloud and transmission platforms.
| |
We also deliver and manage the Emergency Services Network (ESN) contract. You can read more about our networks on page 16.
| ||
We design, build, test and run BT’s service and IT platforms.
| Supporting services like TV and broadband, interactions with customers, and the services our people use to do their jobs. You can find out more on page 17.
| |
We’re responsible for BT’s R&D and worldwide patent portfolio.
| You can read more about our R&D on page 17.
| |
We manage networks for many of the world’s top companies.
| These companies depend on us for their communications.
| |
We manage BT’s relationships with standards bodies.
| Our job is to make sure national, regional and international standards support our commercial strategy.
| |
| British Telecommunications plc Annual Report & Form 20-F 2018 | 79 | |||||
Table of Contents
Our corporate units continued
Technology, Service and Operations continued
Our responsibilitiescontinued
| Responsibilities | What we do | |
We combine the latest innovations from around the world, with work from our own world-leading researchers.
| Running programmes to find new and exciting ways to use technology to generate revenues or cut costs.
| |
We monitor cyber attacks on our networks and systems.
| Enhancing our cyber defence capabilities and investing more in automatic detection and prevention systems.
| |
Performance in the year – strategic
TSO helps deliver BT strategy.
We’re responsible for the technology that the rest of the group relies on. We are constantly on the lookout for ways to improve our networks, platforms and IT systems.
| | Delivering great customer experience
|
By developing technologies to enable new services (and make existing ones better) we’re transforming our customers’ experience.
We use two sets of measures to monitor how our network and platforms are doing.
This year we’ve improved our broadband performance score. That means broadband customers are getting better service despite higher traffic levels.
We’ve also improved our IT and network service availability score, making it easier for customers to do business with us.
We’ve diverted more than 90m unwanted or nuisance calls for the 2.5m customers using BT Call Protect.
Working with EE, we’ve driven the adoption of eSIM (electronic SIM) technology. Instead of being a removable card, eSIM sits on a chip inside a device – which lets smaller gadgets like watches connect to a mobile network. This technology was instrumental in the launch of the Apple Watch Series 3 on EE’s 4G network. The watch lets wearers leave their phone at home and still be connected.
| | Investing for growth
|
We’re investing in our network to provide greater speeds and capacity for our customers.
Thanks to our investments, we were able to satisfy peak demand in our core network of 9.75Tbps this year. And at Glastonbury festival we served EE customers with over 54TB of mobile data, twice as much as the year before.
| | Transforming our costs
|
By removing old technologies and consolidating IT equipment we are trimming back our operating costs.
We’ve removed 100System-X switches from our network – saving 60,000 tonnes of C0 and £6m on energy every year.
In our exchanges we’re continuing to install water-based adiabatic cooling. It’s more energy-efficient than theair-based systems of the past and costs less to run.
Performance in the year – operating
We never stop looking for new ways to maintain and improve our networks and service platforms.
We’ve reduced the group’s energy consumption. There are more details on page 32.
Our customers’ demand for data keeps rising. This year consumer data traffic jumped 45%. We’ve seen sustained, record levels over the last 12 months. So we’ve focused our investments on keeping performance and coverage levels high.
This year we completed one of the largest ever Global Services migration programmes. We worked with vendors, other service providers and some of our biggest multinational customers – updating network equipment to the latest versions, protecting and securing services for the future.
You can read more on page 16 about the improvements we’ve been making to our network, service and IT platforms.
The table below shows how we’ve done against the priorities we set out in last year’s report.
| 80 | British Telecommunications plc Annual Report & Form 20-F 2018 | |||||
Table of Contents
| THE STRATEGIC REPORT | GOVERNANCE | FINANCIAL STATEMENTS | ADDITIONAL INFORMATION | |||||||||
|
|
| ||||||||||
Review of last year’s priorities
| What we said | What we did | |
Enhance the UK broadband experience. | We’ve upgraded around 935 exchanges and switched more than 309,000 customers to faster broadband services overnight with no impact on their service. These customers now have a better service on more energy-efficient technology that’s cheaper to run.
| |
Extend 4G coverage to support the ESN contract.
| We’ve expanded our geographic coverage to over 90%, with 323 new sites deployed for the ESN.
| |
Make our systems more reliable. | We’ve improved our IT and network service availability. | |
And we’ve achieved 99.999% availability in our core network for broadband customers.
| ||
BT at the forefront of 5G
5G is the next generation of mobile. And we’re working with industry and academic partners to specify and standardise it. 5G will give our customers higher speeds and lower latency (shorter delays), making it suitable for things like driverless cars.
Our top priorities for 2018/19
Improving customer experience
| – | We’ll continue to drive Right First Time as our quality methodology. |
| – | We’ll enhance the ways customers can talk to us. We want them to be able to use the internet, mobile apps and Alexa-like voice- based interfaces for service queries. |
| – | To get deeper customer insights we’ll combine new tools with Big Data techniques. |
Innovating for new products and services
| – | We will create new converged products that seamlessly blend fixed, mobile and TV. |
| – | For business customers we’ll offer flexible software-based network solutions with powerful analytical capabilities. |
| – | We’ll work with industry partners to bring innovative products, services, devices and capabilities to our customers. |
Investing in our network
| – | We’ll use the latest FTTP innovations to improve how our ultrafast products perform and extend the reach of our NGA network platform. |
| – | While continuing to lead the way in 4G, we’ll begin deployment of 5G at pace across the country, enabling exciting new opportunities like Smart Cities and Industrial Automation. |
| – | We will increase network automation using telemetry and model- based technologies. This will improve network provisioning and capacity planning. We’ll also use more artificial intelligence technologies to manage the network. |
| British Telecommunications plc Annual Report & Form 20-F 2018 | 81 | |||||
Table of Contents
Summary financial performance for the year
We’ve already explained how we performed against our key performance indicators as set out on pages 6 to 7. In this section we’ve discussed further our performance.
We assess the performance of the group using a variety of performance measures. These measures are not defined under
IFRS are therefore termed‘non-GAAP’ measures. A reconciliation from thesenon-GAAP measures to the nearest prepared measure in accordance with IFRS is presented on pages 209 to 210. The alternative performance measures we use may not be directly comparable with similarly titled measures used by other companies.
Transforming our costs
The first phase of our restructuring programme, which we announced in May 2017 and which focused principally in Global Services, TSO and Corporate Functions, is firmly on track. We have incurred costs of £241m, removing over 2,800 roles mainly from managerial and back office areas. This restructuring programme delivered savings of £180m in 2017/18.
We also remain firmly on track to deliver our EE integration targets, having delivered arun-rate of £290m of annual cost synergies by the end of 2017/18.
Our strategy will drive sustainable growth in value by focusing on delivering differentiated customer experiences, investing in integrated network leadership, and transforming our operating model. The next phase of our restructuring programme will deliver the transformation of our operating model. It will include driving productivity improvements in core UK operations, focusing on around 30 modern, strategic sites in the UK, and repositioning Global Services as a more focused, lower cost, digital business. This restructuring programme will deliver a reduction of c13,000 mainly back office and middle management roles over three years, and a gross cash cost reduction of £1.5bn in the third year, with costs to achieve of £800m andtwo-year payback. The cost reductions will help offset near term cost and revenue pressures, drive longer term profit growth, and provide the capacity to invest in value enhancing projects, including the recruitment of c6,000 new employees to support network deployment and customer service.
Summarised income statement
Year ended 31 March Before specific items | 2018 £m | 2017 £m | 2016 £m | |||||||||
Revenue |
|
23,746 |
|
|
24,082 |
|
|
18,879 |
| |||
Operating costsa | (16,238 | ) | (16,434 | ) | (12,421 | ) | ||||||
EBITDA |
|
7,508 |
|
|
7,648 |
|
|
6,458 |
| |||
Depreciation and amortisation | (3,514 | ) | (3,510 | ) | (2,631 | ) | ||||||
Operating profit |
|
3,994 |
|
|
4,138 |
|
|
3,827 |
| |||
Net finance expense | (361 | ) | (400 | ) | (151 | ) | ||||||
Associates and joint ventures | (1 | ) | (9 | ) | 6 | |||||||
Profit before taxation
|
|
3,632
|
|
|
3,729
|
|
|
3,682
|
| |||
Taxation
|
|
(707
|
)
|
|
(702
|
)
|
|
(674
|
)
| |||
Profit for the year
|
|
2,925
|
|
|
3,027
|
|
|
3,008
|
| |||
a Excluding depreciation and amortisation.
Revenue
Reported revenue, which includes specific items, was down 1%. Adjusted revenue was also down 1% at £23,746m. Both of these decreases were driven by challenges in our enterprise businesses, particularly in Global Services where ongoing challenging market conditions and lower IP Exchange volumes and equipment sales, weighed on our results.
We had an £87m favourable impact from foreign exchange movements and a £157m reduction in transit revenue. Excluding these, underlying revenue excluding transit was down 1.0% (2016/17: down 0.2%).
BT Consumer revenue was up 3% due to strong growth in mobile, broadband, TV and sport. EE revenue was up 4% due to strong postpaid and fixed broadband revenue growth. Openreach revenue was flat with growth in fibre broadband offset by a reduction in copper line base and regulatory price cuts. Revenue was down 5% in Wholesale and Ventures as a result of market decline in legacy products partially offset by growth in Ventures. Business and Public Sector underlying revenue excluding transit was down 4% due to the decline in the fixed voice market and lower equipment sales, partially offset by continued growth in mobile and networking. Global Services’ underlying revenue excluding transit was down 8% reflecting ongoing challenging market conditions, lower IP exchange volumes and equipment sales in line with our strategy to reduce low margin business.
You can see a full breakdown of reported revenue by major product and service category in note 4 to the consolidated financial statements.
Operating costs
Reported operating costs were down 3% while adjusted operating costs before depreciation and amortisation decreased 1%.
Our adjusted operating costs before depreciation and amortisation were £16,238m, down £196m (2016/17: up £4,013m) driven by decline in volumes and cost savings partially offset by increased investment in mobile devices, customer experience, higher business rates and pension costs. The increase in 2016/17 reflects the impact of the acquisition of EE.
Operating costs before depreciation,
amortisation and specific items
Year ended 31 March
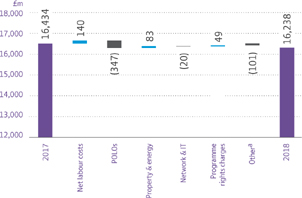
a Includes all other movements in costs.
| 82 | British Telecommunications plc Annual Report & Form 20-F 2018 | |||||
Table of Contents
| THE STRATEGIC REPORT | GOVERNANCE | FINANCIAL STATEMENTS | ADDITIONAL INFORMATION | |||||||||
|
|
| ||||||||||
Net labour costs increased by 3% due to pay inflation, a higher pension operating charge and investment in right-shoring, partially offset by efficiencies and lower leavers’ costs. Payments to telecommunications operators (POLOs) were down 13% due to lower IP exchange volumes. Property and energy costs were up 7% due to higher business rates. Network, operating and IT costs were down 2% and programme rights charges increased by £49m to £763m, primarily reflecting our investment in BT Sport. For the group, other operating costs were down £101m or 2%, primarily reflecting lower revenue in our business and wholesale activities.
2017/18 operating costsa
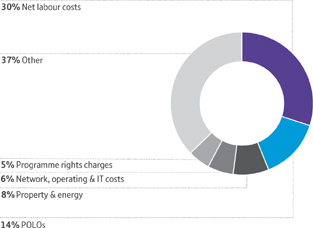
a Excluding depreciation, amortisation and specific items.
You can see a detailed breakdown of our operating costs in note 5 to the consolidated financial statements.
EBITDA
Adjusted EBITDA, which is before specific items, was down 2% at £7.5bn. This reflects the decline in volumes in our business and wholesale activities, higher business rates and pension costs, partly offset by cost savings.
You can see further details for EBITDA for the customer-facing units on pages 48 to 78.
Specific items
In this performance review we primarily explain our results before specific items reflecting the way we measure the sustainable performance of our business.
The table below outlines items we’ve treated as specific items:
| Year to 31 March | 2018 £m | 2017 £m | 2016 £m | |||||||||
Specific revenue | ||||||||||||
Italian business investigation | – | 22 | – | |||||||||
Regulatory matters | 23 | (2 | ) | (203 | ) | |||||||
EE fair value adjustment | – | – | 70 | |||||||||
Specific revenue | 23 | 20 | (133 | ) | ||||||||
Specific operating costs | ||||||||||||
EE acquisition warranty claims | 225 | – | – | |||||||||
Restructuring charges | 241 | – | – | |||||||||
Regulatory matters | 26 | 481 | 203 | |||||||||
Italian business investigation | 22 | 238 | – | |||||||||
EE acquisition and integration costsa | 46 | 215 | 113 | |||||||||
Out of period irrecoverable VAT | – | 30 | – | |||||||||
Profit on disposal of businesses | (1 | ) | (16 | ) | – | |||||||
Property rationalisation costs | 28 | – | 29 | |||||||||
Profit on disposal of property | – | – | – | |||||||||
Specific operating costs | 587 | 948 | 345 | |||||||||
Specific net finance expense | 218 | 210 | 229 | |||||||||
Tax credit | (87 | ) | (217 | ) | (166 | ) | ||||||
Net specific items charged after tax | 741 | 961 | 275 | |||||||||
a 2017/18 and 2016/17 costs wholly relate to integration.
This year, specific items resulted in a net charge after tax of £741m (2016/17: £961m).
During the year, we reached full and final settlements with Deutsche Telekom and Orange in respect of any warranty claims arising under the 2015 EE acquisition agreement, arising from the issues previously announced regarding our operations in Italy. We recognised a £225m (2016/17: £nil) specific item charge for these full and final settlements. We also recognised £22m for investigation costs into our Italian business.
We’ve incurred restructuring charges of £241m (2016/17: £nil) in relation to our cost transformation programme.
We’ve reassessed our regulatory risk provision in light of recent regulatory decisions by Ofcom. Accordingly we have recognised £49m (2016/17: £479m) of net costs in relation to regulatory matters.
| British Telecommunications plc Annual Report & Form 20-F 2018 | 83 | |||||
Table of Contents
Group performance continued
Summary financial performance for the year continued
We incurred £46m of EE integration costs (2016/17: £215m). The costs include EE integration related restructuring and leaver costs in the year.
In addition to the above, we also treated a number of other items as specific, such as the net interest expense on pensions of £218m (2016/17: £209m). The increase from 2016/17 mainly reflects an increase in the BT Pension Scheme deficit over the year to 31 March 2017 partly offset by a lower discount rate as at 31 March 2017.
The tax credit on specific items was £87m (2016/17: £154m).
You can see details of all revenue and costs that we have treated as specific items in the income statement in the last three years in note 8 to the consolidated financial statements.
Profit before tax
Reported profit before tax (which includes specific items) was up 10% to £2,804m while adjusted profit before tax was down 3% at £3,632m.
We discuss depreciation, net finance expense and tax in later sections of this performance review.
Dividends
No dividend was paid to the parent company, BT Group Investments Limited, during 2017/18 (2016/17: £2,350m, 2015/16: £1,450m). Subsequent to 31 March 2018 the directors have declared a final dividend of £2,500m for 2017/18.
Cash flow
We generated a net cash inflow from operating activities of £4,908m.
Summarised cash flow statement
| Year ended 31 March | 2018 £m | 2017 £m | 2016 £m | |||||||||
Cash generated from operating activities | 5,381 | 6,730 | 5,408 | |||||||||
Income taxes paid | (473 | ) | (551 | ) | (256 | ) | ||||||
Net cash inflow from operating activities | 4,908 | 6,179 | 5,152 | |||||||||
Cash flow from investing activities | ||||||||||||
Interest received | 7 | 7 | 10 | |||||||||
Dividends received from associates and joint ventures | – | 2 | 17 | |||||||||
Disposals and acquisitions | (23 | ) | 51 | 85 | ||||||||
Movement onnon-current amounts owed by ultimate parent company | (1,677 | ) | (1,571 | ) | (4,767 | ) | ||||||
Net movement on current financial assets | (1,495 | ) | 1,423 | 666 | ||||||||
Capital expenditure | (3,341 | ) | (3,119 | ) | (2,431 | ) | ||||||
Other | 19 | (22 | ) | – | ||||||||
Cash flow from financing activities | ||||||||||||
Interest paid | (555 | ) | (629 | ) | (558 | ) | ||||||
Proceeds from loan from ultimate parent company | – | – | – | |||||||||
Loans and borrowings | 2,171 | (2,302 | ) | 1,900 | ||||||||
Net increase in cash and cash equivalents | 14 | 19 | 74 | |||||||||
We’ve made investments for the future of our business, while supporting our pension, funding BT Group plc’s share buyback programme and paying dividends to our parent company.
The outflow fromnon-current amounts owed by the ultimate parent company mainly comprised the funding of the ultimate parent company’s payments of equity dividends of £1,523m (2016/17: £1,435m) and share buyback programme of £199m (2016/17: £206m), offset by the proceeds of the ultimate parent company’s issue of treasury shares of £45m (2016/17: £70m). In 2015/16, this outflow also comprised the funding of the ultimate parent company’s acquisition of EE of £3,464m.
The explanations for the interest paid and loans and borrowings cash flows are outlined in subsequent pages in this performance review.
The net cash outflow of £1,495m (2016/17: £1,423m inflow) on current financial assets comprises both the investment and redemption of amounts held in liquidity funds and term deposits.
Capital expenditure is discussed further below.
The net cash cost of specific items was £828m (2016/17: £205m).
This included payments related to the settlement of warranty claims arising from the 2015 EE acquisition agreement of £225m (2016/17: £nil), regulatory payments of £267m (2016/17: £3m) primarily reflecting payments in respect of Deemed Consent, restructuring payments of £193m (2016/17: £51m) and EE integration cost payments of £54m (2016/17: £72m).
Capital expenditure
We continue to invest in our strategy of network leadership, across both fixed and mobile networks, to deliver differentiated customer experience and transform our cost base.
For the year, our capital expenditure, inclusive of net grant deferral was £3,522m (2016/17: £3,454m, 2015/16: £2,622m). The table below shows the split of our investments by major category.
| 84 | British Telecommunications plc Annual Report & Form 20-F 2018 | |||||
Table of Contents
| THE STRATEGIC REPORT | GOVERNANCE | FINANCIAL STATEMENTS | ADDITIONAL INFORMATION | |||||||||
|
|
| ||||||||||
Capital expenditurea
Year ended 31 March
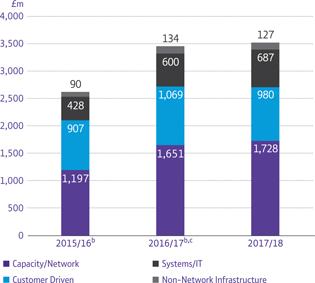
| a | Capacity/network includes BDUK grant funding deferral of £112m (2016/17: £188m; 2015/16: £229m). |
| b | The comparative information has been revised to reflect the latest internal categorisation. |
| c | 2016/17 is the first full year including EE Limited. |
In recent years we’ve prioritised our capital expenditure to underpin our strategy, and to expand coverage and capacity whilst enhancing the speed and resilience of both our fixed access network and our mobile network. Key investments in 2017/18 include:
Capacity/network investment, proactive investment in our integrated network to:
| – | improve the coverage and reliability of our superfast broadband network, including extending the reach of superfast broadband to rural areas under the BDUK programme. We’ve now passed more than 27.6m homes and businesses representing over three-quarters of UK premises |
| – | increase the deployment of ultrafast broadband, across both FTTP and Gfast technologies, with over 1.5m of ultrafast homes to date |
| – | enhance and expand our mobile network coverage, speed and capacity, including the delivery of the ESN contract |
| – | deliver a truly integrated network that supports converged products and services. |
Customer driven investment that directly generates revenue from:
| – | continued development of customer contract-specific infrastructure for our UK and global clients |
| – | deployment of Ethernet and broadband connections for homes and businesses, including reduction in the existing workstacks. |
Systems/IT investments that develop:
| – | differentiated customer experience |
| – | new products and services |
| – | transformation initiatives to drive cost savings. |
Non-network infrastructure that covers, for example:
| – | investment in our property estate |
| – | power and cooling investments to drive energy savings |
| – | specialist vehicle replacement. |
Capital expenditure was £3,522m (2016/17: £3,454m). This consists of gross expenditure of £3,596m (2016/17: £3,426m) which has been reduced by net grant funding of £74m (2016/17: £28m increase in net grant deferral). We have recognised gross grant funding of £168m (2016/17: £160m) in line with network build,re-invested grant funding of £18m (2016/17: £nil) and also deferred £112m (2016/17: £188m) of the total grant funding to reflect an increase in the base casetake-up assumption to 41% following our review of the level of customertake-up. The increase intake-up assumption shows the high demand on our fibre network driven by customers taking advantage of faster speeds to consume more data. Grant funding deferral repaid throughout the year was £4m, giving a balance at 31 March 2018 of £536m (Q4 2016/17: £446m).
Of the total group capital expenditure, £90m (2016/17: £69m) is related to the integration of EE. Additionally, £154m (2016/17: £272m, 2015/16: £248m) was invested outside of the UK. Capital expenditure contracted but not yet incurred was £993m at 31 March 2018 (2016/17: £889m, 2015/16: £922m).
Depreciation and amortisation
Depreciation and amortisation is flat at £3,514m (2016/17: £3,510m, 2015/16: £2,631m).
Net finance expense
Reported net finance expense has decreased £31m to £579m. Net finance expense before specific items of £361m (2016/17: £400m) decreased by £39m.
Year ended 31 March Before specific items | 2018 £m | 2017 £m | 2016 £m | |||||||||
Interest on borrowings | 561 | 620 | 529 | |||||||||
Interest relating to derivatives | 15 | 12 | 11 | |||||||||
Total finance expense | 576 | 632 | 540 | |||||||||
Total finance income | (215 | ) | (232 | ) | (389 | ) | ||||||
Net finance expense | 361 | 400 | 151 | |||||||||
Finance expense of £576m (2016/17: £632m) decreased by £56m as average weighted interest rates on gross debt are lower than last year.
Finance income of £215m (2016/17: £232m) decreased by £17m mainly due to lower average interest rates on investments.
Taxation
Our effective tax rate before specific items was 19.5% (2016/17: 18.8%). We paid income taxes of £473m (2016/17: £551m).
| British Telecommunications plc Annual Report & Form 20-F 2018 | 85 | |||||
Table of Contents
Group performance continued
Summary financial performance for the year continued
Our tax contribution
Our tax strategy sits at the heart of our business responsibility agenda. It ensures that we pay our fair share of taxes back into the societies in which we operate, and that we conduct our tax affairs ethically and with integrity. It is published at btplc.com/Purposefulbusiness/ Ourapproach/Ourpolicies/BTTaxReport2018.pdf.
We are proud to be a major contributor of taxes to the UK economy. In 2017 we bore UK taxes of £1,065m and collected £2,956m of taxes. The One Hundred Group 2017 Total Tax Contribution Survey ranked us as the 5th highest contributor in the UK.
We paid UK corporation tax of £374m. We benefited from £111m of EE’s historical tax losses (2016/17: £117m) and £217m from tax deductions associated with employee pension and share schemes (2016/17: £110m).
Tax expense
Our tax expense recognised in the income statement before specific items was £707m (2016/17: £702m). In addition we recognised a £345m tax expense (2016/17: £445m credit) in the statement of comprehensive income, principally in relation to our pension scheme.
We expect our income statement effective tax rate before specific items to be around the UK rate of corporation tax, as the majority of our business occurs in the UK. In the current year, our rate has been increased by the impact of US tax reform.
The UK tax rate will fall from 19% to 17% on 1 April 2020, which should reduce our expected effective tax rate. Recognition of further deferred tax assets on historical overseas tax losses would also reduce our future rate. Changes to our estimates of uncertain tax positions may increase or reduce our future rate.
Year ended 31 March Before specific items
| 2018 %
| 2017 %
| 2016 %
| |||||||||
Tax at UK statutory rate |
|
19.0 |
|
|
20.0 |
|
|
20.0 |
| |||
Non-UK results taxed at different rates | 0.2 | 0.3 | (0.2 | ) | ||||||||
Net permanent differences
|
| 0.6
|
|
| 0.7
|
|
| 0.3
|
| |||
| 19.8 | 21.0 | 20.1 | ||||||||||
Changes to prior year estimates | (0.1 | ) | (1.1 | ) | (2.5 | ) | ||||||
Deferred tax accounting fornon-UK losses
|
| (0.2
| )
|
| (1.1
| )
|
| 0.7
|
| |||
Effective tax rate
|
|
19.5
|
|
|
18.8
|
|
|
18.3
|
| |||
We have booked a tax benefit of £37m in respect of UK patent incentives (2016/17: £39m).
Key tax risks
Our key uncertainties are whether EE’s tax losses will be available to us, whether our intra-group trading model will be accepted by a particular tax authority and whether intra-group payments are subject to withholding taxes.
Additionally we have extensive and long standing UK operations that necessarily require the use of estimates in calculating our tax liabilities. We routinely work with HMRC to validate these estimates.
Tax losses
We have an asset on our balance sheet of £183m relating to tax losses. This relates mainly to historical tax losses acquired with EE. We expect to be able to use this against future profits of EE.
In addition we have £4.0bn of income tax losses that we’ve not given any value to on our balance sheet. We might be able to use these losses to offset future profits, however we currently do not consider this probable. We also have £16.9bn of UK capital losses, which we have no expectation of being able to use.
We’ve given more details in note 9 to the consolidated financial statements.
Summarised balance sheet
Our balance sheet reflects our significant investment in the network infrastructure assets that are the foundation of our business, as well as the working capital with which we manage our business day by day. It also reflects the longer-term strategy with which we finance our investment, and our obligation to the pension funds.
At 31 March
| 2018 £m
| 2017 £m
| Movement
| |||||||||
Property, plant & equipment, software and telecommunications licences | 21,283 | 20,884 | 399 | |||||||||
Goodwill and other intangible assets | 10,172 | 10,651 | (479 | ) | ||||||||
Othernon-current and current assets | 15,651 | 14,629 | 1,022 | |||||||||
Trade and other receivables | 4,346 | 4,220 | 126 | |||||||||
Investments, cash and cash equivalents
|
| 3,745
|
|
| 2,266
|
|
| 1,479
|
| |||
Total assetsa
|
|
55,197
|
|
|
52,650
|
|
|
2,547
|
| |||
Loans and other borrowings |
|
(15,336 |
) |
|
(13,896 |
) |
|
(1,440 |
) | |||
Trade and other payables | (7,190 | ) | (7,476 | ) | 286 | |||||||
Other current andnon-current liabilities | (2,246 | ) | (2,398 | ) | 152 | |||||||
Provisions | (1,055 | ) | (1,161 | ) | 106 | |||||||
Deferred tax liability | (1,340 | ) | (1,240 | ) | (100 | ) | ||||||
Pensions, net of DT
|
| (5,290
| )
|
| (7,553
| )
|
| 2,263
|
| |||
Total liabilities
|
|
(32,457
|
)
|
|
(33,724
|
)
|
|
1,267
|
| |||
Total equity
|
|
22,740
|
|
|
18,926
|
|
|
3,814
|
| |||
| a | Excluding deferred tax asset relating to BT’s defined benefit pension schemes. |
Our core fixed and mobile network infrastructure is included within property, plant and equipment, software and telecommunications licences. These assets were held at a net book value of £21.3bn at 31 March 2018. The net increase of £399m in the year primarily reflects capital expenditure of £3,522m exceeding the related depreciation and amortisation charge of £3,134m.
Goodwill and other acquisition-related intangible assets decreased by £479m, primarily reflecting the amortisation of customer relationships.
We review the recoverable amounts of goodwill annually across our cash generating units which hold goodwill, which are BT Consumer, EE, Business and Public Sector, Global Services, and Wholesale and Ventures, and are satisfied that these support the carrying value of goodwill (see note 11 to the consolidated financial statements).
| 86 | British Telecommunications plc Annual Report & Form 20-F 2018 | |||||
Table of Contents
| THE STRATEGIC REPORT | GOVERNANCE | FINANCIAL STATEMENTS | ADDITIONAL INFORMATION | |||||||||
|
|
| ||||||||||
Othernon-current and current assets and liabilities relate primarily to our financial instruments, which we’ve described in note 25 to the consolidated financial statements.
Trade and other receivables increased by £126m to £4,346m while trade and other payables of £7,190m were £286m lower.
Loans and other borrowings were £15,336m compared with £13,896m at 31 March 2017, an increase of £1,440m.
At 31 March 2018 £1,061m was due to the ultimate parent company in respect of the proceeds from the equity placing in February 2015 for the acquisition of EE. BT Group plc issued 222m ordinary shares for £1.0bn and transferred these proceeds to BT plc.
Bond maturities in June 2017, December 2017 and January 2018 resulted in a cash outflow of £1,399m.
We issued bonds of £2,025m in June 2017 and £1,728m in November 2017 to generate funding for general corporate purpose.
Short term borrowings of £2.0bn include term debt of £1.4bn repayable in 2018/19 and £0.6bn for the outstanding portion of our overdraft and collateral for openmark-to-market positions.
Provisions decreased by £106m to £1,055m mainly due to a decrease in regulatory provisions due to Deemed Consent payments made during the year. We have a significant property portfolio which includes both office buildings and former telephone exchanges (see page 17). Property provisions, which mainly comprise onerous lease provisions, amounted to £294m. There are also asset retirement obligations of £71m relating to leased mobile sites forming part of the EE network. You can find more information about these provisions in note 18 to the consolidated financial statements.
We’ve shown deferred tax movements in note 9 to the consolidated financial statements. Pensions, net of deferred tax, decreased by £2.3bn to £5.3bn and are discussed below.
Pensions
Overview
We provide a number of retirement plans for our employees:
| – | The BT Pension Scheme (BTPS), a defined benefit plan in the UK, is the largest of these plans. Although closed to new members since 2001, at 31 March 2018 the BTPS still had around 30,000 active members, 202,500 pensioners and 60,500 deferred members. In March 2018, BT announced the closure of Sections B and C of the BTPS to future benefit accrual (which represents over 99% of the BTPS active membership), having reached an agreement with the relevant Unions. BT currently expects to close the BTPS to future accrual from 30 June 2018 when employees will join the BT Retirement Savings Scheme (BTRSS) for future pension accrual. |
| – | The BTRSS is a contract-based, defined contribution arrangement operated by Standard Life. This is the current arrangement for UK employees who joined BT after 1 April 2001. It has around 35,000 active members. As part of the recent review of pension benefits, BT will increase its standard maximum contribution rate to 10% for employees building up benefits in the BTRSS, taking effect from 1 June 2018. |
| – | EE operates the EE Pension Scheme (EEPS), which has a defined benefit section that is closed to future accrual and a defined contribution section which has around 11,500 active members. |
| – | We also maintain retirement arrangements around the world with a focus on these being appropriate for the local market and culture. |
The BTPS, BTRSS and EEPS are not controlled by the Board. The BTPS and EEPS are managed by separate and independent Trustee bodies while savings in the BTRSS are managed directly by members.
Details of the governance of the BTPS, its financial position and the performance of its investments are available in the BTPS Annual Report published by the Trustee in October 2017, on the BTPS Trustee website (btpensions.net).
We’ve given more information on our pension arrangements, on the funding and accounting valuations and the recent review of pensions benefits in note 19 to the consolidated financial statements.
BTPS funding valuation and future funding obligations
The funding of the BTPS is subject to legal agreement between BT and the Trustee of the BTPS and is determined at the conclusion of each triennial valuation. The most recent triennial funding valuation at 30 June 2017 and the associated deficit contribution plan was agreed with the Trustee in May 2018.
At 30 June 2017, the market value of assets was £49.1bn and the funding deficit was £11.3bn. There are a wide range of assumptions that could be adopted for measuring pension liabilities. Legislation requires that this deficit is based on a prudent view – for example, assuming a lower future investment return than might be expected in practice.
The deficit will be met over a 13 year period, maintaining the remaining period of the previous recovery plan. The deficit contributions have three components:
| – | Payments within the three years to 31 March 2020 totalling £2.1bn, in line with the amount due under the previous recovery plan. £850m of this was paid in March 2018 and the remaining £1,250m is to be paid by 30 June 2019. |
| – | A further £2.0bn contribution, due to be funded from the proceeds of the issuance of bonds which will be held by the BTPS. The bonds will be issued as soon as practicable. |
| – | For the 10 years from 1 April 2020 to 31 March 2030, annual payments of around £900m. |
Accounting position under IAS 19
The accounting deficit, net of tax, decreased over the year from £7.6bn to £5.3bn. The movements in the deficit for the group’s defined benefit plans are shown below.
| British Telecommunications plc Annual Report & Form 20-F 2018 | 87 | |||||
Table of Contents
Group performance continued
Summary financial performance for the year continued
Key movements in IAS 19 deficit
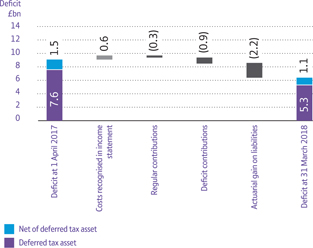
The actual investment return in the year to 31 March 2018 of around 2.4% was broadly in line with the discount rate assumption at 31 March 2017.
The actuarial gain on liabilities in 2017/18 was largely driven by an update to the discount rate model to better reflect yields on corporate bonds, reducing the liabilities by £2.1bn. Further detail is set out on page 144.
Contractual obligations and commitments
We’ve shown in the table below our principal undiscounted contractual financial obligations and commitments at 31 March
2018. You can see further details on these items in notes 20, 25 and 30 to the consolidated financial statements.
At 31 March 2018
| Total £m
| Less than 1 year £m
| Between 1 and 3 years £m
| Between 3 and 5 years £m
| More than 5 years £m
| |||||||||||||||
Loans and other borrowingsa |
|
15,044 |
|
|
2,271 |
|
|
2,492 |
|
|
1,469 |
|
|
8,812 |
| |||||
Finance lease obligations | 219 | 18 | 32 | 38 | 131 | |||||||||||||||
Operating lease obligations | 6,597 | 600 | 1,063 | 949 | 3,985 | |||||||||||||||
Capital commitments | 993 | 977 | 15 | 1 | – | |||||||||||||||
Other commitments | 362 | 213 | 141 | 8 | – | |||||||||||||||
Device purchase commitments | 262 | 260 | 2 | – | – | |||||||||||||||
Programme rights commitments | 2,823 | – | 663 | 1,703 | 457 | |||||||||||||||
Pension deficit obligations
|
| 12,374
|
|
| 2,025
|
|
| 2,191
|
|
| 1,808
|
|
| 6,350
|
| |||||
Total
|
|
38,674
|
|
|
6,364
|
|
|
6,599
|
|
|
5,976
|
|
|
19,735
|
| |||||
a Excludes fair value adjustments.
We have unused committed borrowing facilities totaling £2.1bn. We expect that these resources and our future cash generation will allow us to settle our obligations as they fall due.
Adoption of new accounting standards
IFRS 15 ‘Revenue from Contracts with Customers’
We adopted this standard on a modified retrospective basis. This means that on adoption we will recognise the cumulative effect of initially applying the standard as an adjustment to the opening balance of retained earnings at 1 April 2018, ie the date of initial application. We are in the process of finalising the impact on transition at 1 April 2018 but we have estimated this will produce a cumulative increase in retained earnings of between £1.1bn and £1.5bn before tax. The corresponding impact will primarily be recorded as a contract asset and will lead to additionalone-off cash tax payments equally split between 2018/19 and 2019/20.
IFRS 16 ‘Leases’
IFRS 16 ‘Leases’ will be effective for BT from 1 April 2019. We are planning to adopt IFRS 16 on a modified retrospective basis and the group will recognise the cumulative effect of initially applying the standard as an adjustment to the opening balance of retained earnings at 1 April 2019. We are still in the process of quantifying the implications of this standard. However, our operating lease obligations set out in the table opposite, which are currently off balance sheet, will be valued in accordance with the requirements of IFRS 16 and recorded on balance sheet after adoption along with a corresponding right of use asset.
IFRS 9 ‘Financial Instruments’
IFRS 9 ‘Financial Instruments’ will be adopted concurrently with
IFRS 15 and on the same basis. With the exception of the impact of recording expected lifetime losses on recognised IFRS 15 contract assets we do not expect the standard to have a material impact on our results. The effect of expected lifetime losses after IFRS 15 adoption has been included in the cumulative impact on retained earnings in the IFRS 15 section above.
More detail over our approach to these new standards is outlined in note 1 to the consolidated financial statements.
| 88 | British Telecommunications plc Annual Report & Form 20-F 2018 | |||||
Table of Contents
| THE STRATEGIC REPORT | GOVERNANCE | FINANCIAL STATEMENTS | ADDITIONAL INFORMATION | |||||||||
|
|
|
| |||||||||
Directors’ information
Statement of directors’ responsibilities
Our directors are responsible for preparing theAnnual Report and thefinancial statements in accordance with applicable law and regulation. Company law requires the directors to prepare financial statements for each financial year. Under that law the directors have prepared the group financial statements in accordance with International Financial Reporting Standards (IFRS) as adopted by the European Union and company financial statements in accordance with United Kingdom Generally Accepted Accounting Practice (United Kingdom Accounting Standards Comprising FRS 101 “Reduced Disclosure Framework”) and applicable law. In preparing the group financial statements, the directors have also elected to comply with IFRS issued by the International Accounting Standards Board (IASB). Under company law, the directors must not approve the financial statements unless they are satisfied that they give a true and fair view of the state of affairs of the group and company, and of the profit or loss of the group and company for that period.
In preparing the financial statements, the directors are required to:
| – | select suitable accounting policies and apply them consistently |
| – | state whether applicable IFRSs, as adopted by the European Union and IFRSs issued by IASB, have been followed for the group financial statements and United Kingdom Accounting Standards comprising FRS 101 have been followed for the company financial statements, subject to any material departures disclosed and explained in the financial statements |
| – | make judgements and accounting estimates that are reasonable and prudent |
| – | prepare financial statements on a ‘going concern’ basis unless it’s inappropriate to presume that the group and the company will continue in business. |
The directors are responsible for keeping adequate accounting
records that are sufficient to show and explain the group and company’s transactions and disclose with reasonable accuracy at any time the financial position of the group and company as well as ensuring that the financial statements comply with the Companies Act 2006 and, as regards the group financial statements, Article 4 of the IAS Regulation.
The directors are also responsible for safeguarding the assets of the group and company, and for taking reasonable steps to prevent and detect fraud and other irregularities.
The directors are responsible for the maintenance and integrity of the company’s website. Legislation in the United Kingdom governing the preparation and dissemination of financial statements may differ from legislation in other jurisdictions.
Each of the directors, whose names and functions are listed on page 90, confirms that, to the best of their knowledge:
| – | the company financial statements, which have been prepared in accordance with United Kingdom Generally Accepted Accounting Practice (United Kingdom Accounting Standards, comprising FRS 101 “Reduced Disclosure Framework”, and applicable law), give a true and fair view of the assets, liabilities, financial position and profit of the company |
| – | the group financial statements, which have been prepared in accordance with IFRSs as adopted by the European Union - Dual IFRS (European Union and IASB) - give a true and fair view of the assets, liabilities, financial position and profit of the group |
| – | the Strategic Report on pages 2 to 88 includes a fair review of the development and performance of the business and the position of the group and company, together with a description of the principal risks and uncertainties that it faces. |
| British Telecommunications plc Annual Report & Form 20-F 2018 | 89 | |||||
Table of Contents
Report of the directors statutory information
Introduction
The directors submit their report and the audited financial statements of the company, British Telecommunications plc, and the group, which includes its subsidiary undertakings, for the 2017/18 financial year.
The audited consolidated financial statements are presented on pages 106 to 191.
Dividend
No dividend was paid to the parent company, BT Group Investments Limited, during 2017/18 (2016/17: £2,350m; 2015/16: £1,450m).
Subsequent to 31 March 2018, the directors have declared a final dividend of £2,500m payable in 2018/19 (2016/17: £nil; 2015/16: £2,350m).
Principal activity
The company is the principal trading subsidiary of BT Group plc, which is the ultimate parent company.
BT is one of the world’s leading communications services companies. We serve the needs of customers in the UK and in 180 countries worldwide. Our main activities are the provision of fixed-line services, broadband, mobile and TV products and services as well as networked IT services.
In the UK we are a leading communications services provider, selling products and services to consumers, small and medium sized enterprises and the public sector.
We also sell wholesale products and services to communications providers in the UK and around the world. Globally, we supply managed networked IT services to multinational corporations, domestic businesses and national and local government organisations.
Directors
The directors at 31 March 2018 were Glyn Parry who served throughout 2017/18 and Patrick Bradley, Neil Harris and Simon Lowth who were appointed on 17 October 2017. Sean Williams served as a director until 29 September 2017 and Linda Bruce-Watt served as a director from 29 September 2017 until 17 October 2017.
Directors’ and officers’ liability insurance and indemnity
BT Group plc purchases insurance to cover the directors, officers and employees in positions of managerial supervision of BT Group plc and its subsidiaries. This is intended to protect against defence costs, civil damages and, in some circumstances, civil fines and penalties following an action brought against them in their personal capacity. The policy also covers individuals serving as directors of other companies or of joint ventures or on boards of trade associations or charitable organisation’s at BT’s request. The insurance protects the directors and officers directly in circumstances where, by law, BT cannot provide an indemnity. It also provides BT, subject to a retention, with cover against the cost of indemnifying a director or officer. One layer of insurance is ring-fenced for the directors of BT Group plc.
As at 22 May 2018, and throughout 2017/18, British Telecommunications plc has provided an indemnity in respect of a similar group of people who would be covered by the above insurance. Neither the insurance nor the indemnity provides cover where the person has acted fraudulently or dishonestly.
Financial statements
A statement by the directors of their responsibilities for preparing the financial statements is included in theStatement of directors’ responsibilities on page 89.
Our critical accounting estimates and key judgements, and significant accounting policies conform with IFRSs, as adopted by the European Union and IFRSs issued by IASB, and are set out on page 113 of the consolidated financial statements.The directors have reviewed these policies and applicable estimation techniques, and have confirmed they’re appropriate for the preparation of the 2017/18 consolidated financial statements.
So far as each of the directors is aware, there is no relevant information that has not been disclosed to the auditors and each of the directors believes that all steps have been taken that ought to have been taken to make them aware of any relevant audit information and to establish that the auditors have been made aware of that information.
Capital management and funding policy
The capital structure of the company is managed by BT Group plc. The policies described here apply equally to both BT Group plc and BT plc group companies.
The objective of BT Group plc’s capital management and funding policy is to reduce BT Group’s net debta while investing in the business, supporting the pension fund and paying progressive dividends.
| a | Net debt is a measure of BT Group plc’s consolidated net indebtedness that provides an indicator of the overall balance sheet strength of the group. Net debt consists of loans and other borrowings (both current andnon-current), less current asset investments and cash and cash equivalents. At 31 March 2018 BT Group plc’s net debt was £9,627m (2016/17: £8,932m). |
| 90 | British Telecommunications plc Annual Report & Form 20-F 2018 | |||||
Table of Contents
| THE STRATEGIC REPORT | GOVERNANCE | FINANCIAL STATEMENTS | ADDITIONAL INFORMATION | |||||||||
|
|
| ||||||||||
The BT Group plc Board reviews the group’s capital structure regularly. Management proposes actions which reflect the group’s investment plans and risk characteristics, as well as the macro-economic conditions in which we operate.
BT Group plc’s funding policy is to raise and invest funds centrally to meet the group’s anticipated requirements. A combination of capital market bond issuance, commercial paper borrowing and committed borrowing facilities is used. When issuing debt, group treasury will take into consideration the maturity profile of the debt portfolio as well as forecast cash flows to avoid refinancing risk.
Details of our treasury policy are included in note 25 to the consolidated financial statements.
Financial instruments
Details of the group’s financial risk management objectives and policies of the group and exposure to interest risk, credit risk, liquidity risk and foreign exchange are given in note 25 to the consolidated financial statements.
Credit risk management policy
Proactive steps are taken to minimise the impact of adverse market conditions on our financial instruments. In managing investments and derivative financial instruments, BT Group plc’s central treasury function monitors the credit quality across treasury counterparties and actively manages any exposures which arise within BT plc. Management within the business units also actively monitors any exposures arising from trading balances.
Off-balance sheet arrangements
Other than the financial commitments and contingent liabilities disclosed in note 29 to the consolidated financial statements, there are nooff-balance sheet arrangements that have, or are reasonably likely to have, a current or future material effect on: our financial condition; changes in financial condition; revenues or expenses; results of operations; liquidity; capital expenditure; or capital resources.
Legal proceedings
The group is involved in various legal proceedings, including actual or threatened litigation and, government or regulatory investigations. For further details of legal and regulatory proceedings to which the group is party please see note 29 to the consolidated financial statements on pages 166 to 168.
Apart from the information disclosed in note 29 to the consolidated financial statements, the group does not currently believe that there are any legal proceedings, government or regulatory investigations that may have a material adverse impact on the operations or financial condition of the group. In respect of each of the claims described in note 29 the nature and progression of such proceedings and investigations can make it difficult to predict the impact they will have on the group. Many factors prevent us from making these assessments with certainty, including, that the proceedings of investigations are in early stages, no damages or remedies have been specified, and/or the often slow pace of litigation.
Going concern
The assessment described below applies equally to both BT Group plc and BT plc group companies.
TheStrategic Reporton pages 2 to 88 includes information on the group structure, the performance of each of the customer facing units, the impact of regulation and competition and principal risks and uncertainties. TheGroup performancesection on pages 82 to 88 includes information on our group financial results, cash flow, loans and borrowings and balance sheet position. Notes 21, 22, 23 and 25 of the consolidated financial statements include information on the group’s investments, cash and cash equivalents, loans and borrowings, derivatives, financial risk management objectives, hedging policies and exposure to interest, foreign exchange, credit and liquidity.
Alongside the factors noted above, the directors have considered the group’s cash flow forecasts, in particular with reference to the period to the end of May 2019. The directors are satisfied that these cash flow forecasts, taking into account reasonably possible risk sensitivities associated with these forecasts and BT Group plc’s current funding and facilities, alongside BT Group plc’s funding strategy, show that the group will continue to operate for the foreseeable future. The directors therefore continue to have a reasonable expectation that the group has adequate resources to continue in operational existence for the foreseeable future and continue to adopt a going concern basis (in accordance with the guidance ‘Going Concern and Liquidity Risk: Guidance for Directors of UK Companies 2009’ issued by the Financial Reporting Council) in preparing the consolidated financial statements.
Auditors
PwC and its predecessor firms have been BT’s auditors since BT listed on the London Stock Exchange in 1984. We reported to you last year that the BT Group plc Audit & Risk Committee recommended to the BT Group plc Board that the audit tender process commence with a view to appointing new auditors for the financial year 2018/19.
Two firms, EY and KPMG, were invited to submit tenders. PwC would not be able to act as auditors beyond 2020/21 and did not participate. Deloitte are embedded in our IFRS 15 implementation project and replacing them would have presented an unacceptable business risk to the company.
The audit tender process was led by the BT Group plc Audit & Risk Committee chairman and the proposals presented by EY and KPMG were subject to detailed evaluation and discussion. The BT Group plc Audit & Risk Committee recommended to the Board, who endorsed the appointment of KPMG as the preferred new auditor.
In February 2018, KPMG became independent and planning activities commenced for the 2018/19 audit.
The company confirms that it complied with the provisions of the Competition and Markets Authority’s Order for the financial year under review.
| British Telecommunications plc Annual Report & Form 20-F 2018 | 91 | |||||
Table of Contents
Report of the directors statutory information continued
UK internal control and risk management
The Board of BT Group plc is responsible for the group’s systems of internal control and risk management and for reviewing the effectiveness of those systems each year. These systems are designed to manage, rather than eliminate, the risk of failure to achieve business objectives; any system can provide only reasonable, and not absolute, assurance against material misstatement or loss.
BT has enterprise-wide risk management processes for identifying, evaluating and managing the principal risks faced by the group. These processes have been in place throughout the year and have continued up to the date on which this document was approved. The processes are in accordance with the FRC Guidance on risk management, internal control and related financial and business reporting.
Risk assessment and evaluation take place as an integral part of BT Group plc’s annual strategic planning cycle. There is a detailed risk management process which identifies the key risks facing the group, our customer facing units and TSO.
The key features of our enterprise-wide risk management and internal control process (covering financial, operational and compliance controls) are:
| – | senior executives collectively review the group’s key risks and have created a Group Risk Register describing the risks, their owners and mitigation strategies. BT Group plc’s Group Risk Panel and Executive Committee review this before it is reviewed and approved by the BT Group plc Board; |
| – | the customer facing units and TSO carry out risk assessments of their operations, create risk registers relating to those operations and ensure that the key risks are addressed; |
| – | senior executives with responsibility for major group operations report quarterly their opinion on the effectiveness of the operation of internal controls in their areas of responsibility; |
| – | the internal auditors carry out continuing assessments of the quality of risk management and control, report to management and the BT Group plc Audit & Risk Committee on the status of specific areas identified for improvement and promote effective risk management in the customer facing units and TSO; |
| – | the BT Group plc Audit & Risk Committee, on behalf of the of BT Group plc Board, considers the effectiveness of the group’s internal control procedures during the financial year. It reviews reports from the internal and external auditors and reports its conclusions to the of BT Group plc Board. The BT Group plc Audit & Risk Committee has carried out these actions for 2017/18; and |
| – | the BT Group plc Audit & Risk Committee, on behalf of the BT Group plc Board, reviews the effectiveness of risk management arrangements across the group. In support of this, an annual review meeting is held with the group chief executive and the CEOs of each customer facing unit. |
We haven’t included joint ventures and associates, which BT doesn’t control, as part of the group risk management process. Third parties we enter into joint ventures with are responsible for their own internal control assessment.
Our significant accounting policies are set out on pages 113 to 118. The consistent application of those policies is subject to ongoing verification through management review and independent review by internal and external auditors.
The processes supporting the preparation and consolidation of the financial statements have been documented and are subject to annual verification through the programme of testing done by our internal auditors. This serves to confirm the operation of the internal controls over financial reporting, and compliance with the Sarbanes-Oxley Act.
US SARBANES-OXLEY ACT OF 2002
The company has debt securities registered with the US Securities and Exchange Commission (SEC). As a result, we must comply with those provisions of the Sarbanes-Oxley Act applicable to foreign issuers. We comply with the legal and regulatory requirements introduced under the Sarbanes-Oxley Act, in so far as they apply.
Controls and Procedures
Background and status of remediation of material weakness reported in 2017
In October 2016 we reported that following an initial investigation we had identified improper accounting practices in our Italian business. We had appointed KPMG, with support and oversight from our Legal, Governance and Compliance function and Freshfields Bruckhaus Deringer, reporting directly to both the chair of the BT Group plc Audit & Risk Committee and BT Group chairman, to perform an independent investigation, alongside our own investigation and detailed balance sheet review. In January 2017 BT Group plc reported that the investigations had revealed that the extent and complexity of the improper practices were greater than previously identified and that these had resulted in an overstatement of profits over a number of years.
The investigations uncovered that individuals in our Italian business colluded to override the period end financial close controls and overstate the results, and the monitoring controls which include the review of reconciliations, journals, results and financial position, did not operate effectively to identify the overstatement in a timely manner. Management concluded that the group did not maintain effective controls to prevent or detect the collusive circumvention or override of controls related to our Italian business. Specifically management identified the following internal control deficiencies related to our Italian business and the failure to detect the circumvention or override of controls: (i) failure in the review of reconciliations, (ii) failure in the review of journals and (iii) failure in our monitoring controls over the results and financial position of our Italian business. Together, these deficiencies constituted a material weakness in the control environment, and management concluded that, as of 31 March 2017, our internal control over financial reporting was not effective.
| 92 | British Telecommunications plc Annual Report & Form 20-F 2018 | |||||
Table of Contents
| THE STRATEGIC REPORT | GOVERNANCE | FINANCIAL STATEMENTS | ADDITIONAL INFORMATION | |||||||||
|
|
| ||||||||||
Remediation
Beginning in October 2016, and later informed by the results of the KPMG investigation and management’s own review, management implemented a series of remedial and compensating actions, including suspending key members of the management team in Italy (who have now left the business) and appointing a new senior management team in Italy, strengthening the monitoring controls and escalation mechanisms in our finance shared service centres, transferring Italyin-country managed customer billing activities to the group customer billing team and performing detailed substantive reviews of the balance sheet of our Italian business and other large country operations outside the UK. The active engagement in the design and implementation of remediation efforts intended to address the material weakness in the control environment as of 31 March 2017 has continued during 2017/18 as described below. The design and implementation of these and other remedial efforts are the responsibility of management.
We have implemented a number of changes across the group including steps to improve processes and controls, not only in Italy, but also in our shared service centres, in Global Services and across the wider group.
In relation to the matters that gave rise to the material weakness in the control environment, that existed as of 31 March 2017, we have strengthened our review of reconciliations, journals, results and the financial position for Italy. Specifically:
| – | we introduced enhanced and detailed policies and procedures including a detailed checklist that must be followed when reviewing any journals in Italy and in our Budapest shared service centre |
| – | we enhanced the review of reconciliations including the review of significant and aged reconciling items within balance sheet account reconciliations |
| – | we introduced new detailed oversight controls to holistically review the results and financial position of Italy and other material overseas territories. |
We also introduced similar enhancements to journals, reconciliation and oversight controls (assessing the results and financial position) in relation to other material overseas territories and provided additional control guidance and procedures to local finance teams, including a clear policy as to when and whom concerns should be escalated.
Each of these enhanced and new controls is operating effectively.
We have also sought to improve the capabilities of our functions outside the UK. We have reviewed the talent mix on international leadership teams, including establishing anex-pat programme. Within Italy, we have made further senior finance appointments, including a new deputy CFO and financial controller. We have established monitoring to detect early warning signs and assessed target setting and remuneration to ensure it reflects balanced risks and opportunities.
We have continued our programme of detailed balance sheet reviews in our operations in Global Services outside of the UK. Combined with the reviews performed in 2016/17, these have now covered around 80% by asset value of the operations outside the UK. These reviews have not identified any similar issues or areas of concern elsewhere, giving us comfort that the inappropriate behaviours were isolated to Italy.
Across the group, we have enhanced our controls and compliance programmes to strengthen awareness of the standards we expect, and reinforced the importance of doing business in an ethical and disciplined way. We have also sought to enhance the capabilities of our people. All finance employees have completed Financial Statement Fraud awareness training which includes a module on how to escalate concerns. We have redefined and communicated our three lines of defence model and developed and communicated these enhanced controls, policies and procedures.
At the group level, we have introduced enhanced integrated financial risk and assurance reviews which combine a review of controls and compliance issues, external and internal audit findings, risk registers and legal matters, alongside the reviews of performance, financial position, business and accounting issues and quality of earnings analysis of each of our customer-facing units and corporate units.
As a result of these remediation efforts, including allowing for a sufficient period of time to confirm that the new processes and controls put in place as part of the remediation are operating effectively, management has concluded that we have remediated the material weakness identified as of 31 March 2017. While we are satisfied with the improvements to processes and controls we have implemented in the year, we recognise that further system and process improvement opportunities exist which will continue to be a focus in 2018/19.
| British Telecommunications plc Annual Report & Form 20-F 2018 | 93 | |||||
Table of Contents
Report of the directors statutory information continued
Disclosure controls and procedures
The principal executive officer and principal financial officer, after evaluating the effectiveness of the company’s disclosure controls and procedures as of the end of the period covered by this Annual Report & Form20-F, concluded that, as of such date, the company’s disclosure controls and procedures were effective to ensure that the material information relating to the company was made known to them by others within the group.
The principal executive officer and principal financial officer concluded that the company’s disclosure controls and procedures are also effective to ensure that the information required to be disclosed by the company in reports that it has under the Securities Exchange Act 1934 (Exchange Act) is recorded, processed, summoned and reported within the time periods specified in the rules and forms of the SEC.
The principal executive officer and the principal financial officer also provided the certifications required by the Sarbanes-Oxley Act.
Management’s Report on Internal Control over Financial Reporting
Management is responsible for establishing and maintaining adequate internal control over financial reporting for the group. Internal control over financial reporting is designed to provide reasonable assurance regarding the reliability of financial reporting and the preparation of consolidated financial statements for external reporting purposes in accordance with IFRS as issued by the IASB and IFRS as adopted by the EU.
Because of its inherent limitations, internal control over financial reporting may not prevent or detect misstatements. Therefore even those systems determined to be effective can provide only reasonable assurance with respect to financial statement preparation and presentation. Also, projections of any evaluation of effectiveness to future periods are subject to the risk that controls may become inadequate because of changes in conditions, or that the degree of compliance with the policies or procedures may deteriorate.
Management conducted an assessment of the effectiveness of our internal control over financial reporting as of 31 March 2018 based on the criteria established in “Internal Control – Integrated Framework” (2013) issued by the Committee of Sponsoring Organizations of the Treadway Commission (COSO).
Following this assessment, management has concluded that our internal control over financial reporting was effective as of 31 March 2018.
Audit of the Effectiveness of Internal Control over Financial Reporting
Our independent registered public accounting firm, PricewaterhouseCoopers LLP, has audited the effectiveness of our internal control over financial reporting, as stated in their report as of 31 March 2018, which is included herein.
CROSS REFERENCE TO THE STRATEGIC REPORT
In line with the Companies Act, we’ve chosen to include the following information in theStrategic Reportthe following information (required by law to be included in theReport of the Directors):
| – | an indication of likely future developments in the business of the company (see theStrategic Reporton pages 2 to 88); |
| – | an indication of our R&D activities (page 17); |
| – | information about our people (page 22); and |
| – | information about greenhouse gas emissions (page 32). |
By order of the Board
Heather Brierley
Secretary
23 May 2018
Registered Office: 81 Newgate Street, London EC1A 7AJ
Registered in England and Wales No. 1800000
| 94 | British Telecommunications plc Annual Report & Form 20-F 2018 | |||||
Table of Contents
| THE STRATEGIC REPORT | GOVERNANCE | FINANCIAL STATEMENTS | ADDITIONAL INFORMATION | |||||||||
|
|
| ||||||||||

| Financial statements | ||||||||||
| Auditors’ reports | ||||||||||
| – | consolidated financial statements | |||||||||
| – | United Kingdom opinion | 96 | ||||||||
| – | United States opinion | 105 | ||||||||
| Group income statement | 106 | |||||||||
| 107 | ||||||||||
| Group balance sheet | 108 | |||||||||
| 109 | ||||||||||
| Group cash flow statement | 110 | |||||||||
| – | Basis of preparation | 111 | ||||||||
| – | 113 | |||||||||
| – | Significant accounting policies | 113 | ||||||||
| – | Segment information | 119 | ||||||||
| – | Operating costs | 122 | ||||||||
| – | Employees | 123 | ||||||||
| – | 124 | |||||||||
| – | Specific items | 125 | ||||||||
| – | Taxation | 127 | ||||||||
| – | Dividends | 129 | ||||||||
| – | Intangible assets | 130 | ||||||||
| – | Property, plant and equipment | 132 | ||||||||
| – | Business combinations | 133 | ||||||||
| – | Programme rights | 133 | ||||||||
| – | Inventories | 133 | ||||||||
| – | Trade and other receivables | 133 | ||||||||
| – | Trade and other payables | 136 | ||||||||
| – | Provisions | 136 | ||||||||
| – | Retirement benefit plans | 137 | ||||||||
| – | Share-based payments | 150 | ||||||||
| – | Investments | 152 | ||||||||
| – | Cash and cash equivalents | 153 | ||||||||
| – | Loans and other borrowings | 154 | ||||||||
| – | Finance expense | 156 | ||||||||
| – | 157 | |||||||||
| – | Other reserves | 164 | ||||||||
| – | 165 | |||||||||
| – | Related party transactions | 165 | ||||||||
| – | 166 | |||||||||
| – | Post balance sheet events | 168 | ||||||||
| Financial statements of BT plc | 171 | |||||||||
| Related undertakings | 192 | |||||||||
| Additional information | 208 | |||||||||
British Telecommunications plc Annual Report & Form 20-F 2018 | 95 | |||||
Table of Contents
Independent auditors’ report to the members of British Telecommunications plc
Report on the audit of the financial statements
Opinion
In our opinion:
| – | British Telecommunications plc’s group financial statements and parent company financial statements (the “financial statements”) give a true and fair view of the state of the group’s and of the parent company’s affairs as at 31 March 2018 and of the group’s profit and cash flows for the year then ended; |
| – | the group financial statements have been properly prepared in accordance with IFRSs as adopted by the European Union; |
| – | the parent company financial statements have been properly prepared in accordance with United Kingdom Generally Accepted Accounting Practice (United Kingdom Accounting Standards, comprising FRS 101 “Reduced Disclosure Framework”, and applicable law); and |
| – | the financial statements have been prepared in accordance with the requirements of the Companies Act 2006 and, as regards the group financial statements, Article 4 of the IAS Regulation. |
We have audited the financial statements, included within the Annual Report & Form20-F 2018 (the “Annual Report”), which comprise: the group and British Telecommunications plc parent company balance sheets as at 31 March 2018; the group income statement, the group statement of comprehensive income, the group cash flow statement, and the group and parent company statements of changes in equity for the year then ended; and the notes to the financial statements, which include a description of the significant accounting policies.
Our opinion is consistent with our reporting to the BT Group plcAudit & Risk Committee.
Separate opinion in relation to IFRSs as issued by the IASB
As explained in note 1 to the financial statements, the group, in addition to applying IFRSs as adopted by the European Union, has also applied IFRSs as issued by the International Accounting Standards Board (IASB).
In our opinion, the group financial statements have been properly prepared in accordance with IFRSs as issued by the IASB.
Basis for opinion
We conducted our audit in accordance with International Standards on Auditing (UK) (“ISAs (UK)”) and applicable law. Our responsibilities under ISAs (UK) are further described in the Auditors’ responsibilities for the audit of the financial statements section of our report. We believe that the audit evidence we have obtained is sufficient and appropriate to provide a basis for our opinion.
Independence
We remained independent of the group in accordance with the ethical requirements that are relevant to our audit of the financial statements in the UK, which includes the FRC’s Ethical Standard, as applicable to listed public interest entities, and we have fulfilled our other ethical responsibilities in accordance with these requirements.
To the best of our knowledge and belief, we declare thatnon-audit services prohibited by the FRC’s Ethical Standard were not provided to the group or the parent company.
Other than those disclosed in note 7 to the financial statements, we have provided nonon-audit services to the group or the parent company in the period from 1 April 2017 to 31 March 2018.
Our audit approach
Overview
| Materiality | – Overall group materiality: £130m (2016/17: £130m), based on 5% of profit before tax. | |
– Overall parent company materiality: £110m (2016/17: £110m), based on 5% of profit before tax. | ||
| Audit scope | – The locations included and work performed were: | |
– Full scope audits of British Telecommunications plc and EE in the UK, and the principal reporting unit in Italy. | ||
– Audit of certain financial statement line items in Germany, Ireland, Spain, the US and an additional reporting unit in the UK. | ||
– Specified procedures on certain financial statement line items in Switzerland. | ||
| Key audit matters | – Assessment of the carrying value of goodwill in Global Services (Group only); | |
– Major contracts in Global Services, Business and Public Sector and EE (Group and parent company); | ||
– Accuracy of revenue due to complex billing systems (Group and parent company); | ||
– Valuation of pension scheme obligations and unquoted investments in the BT Pension Scheme (Group and parent company); | ||
– Adequacy of regulatory and other provisions (Group and parent company); | ||
– Recognition and measurement of potential tax exposures and deferred tax assets (Group and parent company); | ||
– BT Italy – changes to the control environment and review of estimates made in 2016/17 (Group only); and | ||
– Cost capitalisation and asset lives for property, plant and equipment and software intangible assets (Group and parent company). |
The scope of our audit
As part of designing our audit, we determined materiality and assessed the risks of material misstatement in the financial statements. In particular, we looked at where the directors made subjective judgements, for example in respect of significant accounting estimates that involved making assumptions and considering future events that are inherently uncertain.
We gained an understanding of the legal and regulatory framework applicable to the group and the industry in which it operates, and considered the risk of acts by the group which were
| 96 | British Telecommunications plc Annual Report & Form 20-F 2018 | |||||
Table of Contents
| THE STRATEGIC REPORT | GOVERNANCE | FINANCIAL STATEMENTS | ADDITIONAL INFORMATION | |||||||||
|
|
| ||||||||||
contrary to applicable laws and regulations, including fraud. We designed audit procedures at group and significant component level to respond to the risk, recognising that the risk of not detecting a material misstatement due to fraud is higher than the risk of not detecting one resulting from error, as fraud may involve deliberate concealment by, for example, forgery or intentional misrepresentations, or through collusion. We focused on laws and regulations that could give rise to a material misstatement in the group and parent company financial statements, including, but not limited to, the Companies Act 2006, the UK Listing Rules and certain requirements from the Communications Act 2003. Our tests included, but were not limited to, agreement of the financial statement disclosures to underlying supporting documentation, review of correspondence with regulators, review of correspondence with legal advisors, enquiries of management, review of significant component auditors’ working papers and review of internal audit reports in so far as they related to the financial statements. There are inherent limitations in the audit procedures described above and the further removednon-compliance with laws and regulations is from the events and
transactions reflected in the financial statements, the less likely we would become aware of it.
As in all of our audits we also addressed the risk of management override of internal controls, including testing journals and evaluating whether there was evidence of bias by the directors that represented a risk of material misstatement due to fraud.
Key audit matters
Key audit matters are those matters that, in the auditors’ professional judgement, were of most significance in the audit of the financial statements of the current period and include the most significant assessed risks of material misstatement (whether or not due to fraud) identified by the auditors, including those which had the greatest effect on: the overall audit strategy; the allocation of resources in the audit; and directing the efforts of the engagement team. These matters, and any comments we make on the results of our procedures thereon, were addressed in the context of our audit of the financial statements as a whole, and in forming our opinion thereon, and we do not provide a separate opinion on these matters. This is not a complete list of all risks identified by our audit.
| British Telecommunications plc Annual Report & Form 20-F 2018 | 97 | |||||
Table of Contents
Independent auditors’ report to the members of British Telecommunications plc continued
Report on the audit of the financial statements continued
Key audit matter
|
How our audit addressed the key audit matter
| |
Assessment of the carrying value of goodwill in Global Services (relevant to the group financial statements) As at 31 March 2018, goodwill relating to the Global Services CGU amounted to £498m out of a total goodwill balance of £7,953m. Management prepared an impairment assessment for the Global Services cash generating unit (“CGU”), as required under accounting standards, which was based on a value in use calculation. Similar assessments were performed by the directors for the other goodwill balances. Management concluded that there was no impairment of goodwill in any CGU, including Global Services.
We focused on the impairment assessment for Global Services as the headroom (of value in use over carrying value) was limited and, as disclosed by management in note 11 to the financial statements, the calculation of recoverable amount is sensitive to changes in assumptions (in particular the long term growth rate, the discount rate and the assumptions underlying future operating cash flows). | We evaluated the design and tested the operating effectiveness of management’s controls in assessing the carrying value of goodwill. We determined that we could rely on these controls for the purposes of our audit.
We then focused on the key assumptions included in the impairment assessment, being the cash flows for each year of management’s detailed forecast, the long-term growth rate and the discount rate.
To determine the appropriateness of the future operating cash flows, we: – Agreed the cash flow forecasts used in the impairment model to Board approved forecasts; – Considered management’s expectations in respect of developments in the business and corroborated certain information with third party sources. We considered planned operational improvements and the reasonableness of these in generating future cash flows and whether these were appropriately reflected in the cash flow forecasts; and – Compared actual historical cash flow results for the Global Services CGU with previous forecasts to assess forecasting accuracy.
We used internal specialists to independently corroborate the long term growth rate and the discount rate used by management by reference to market data.
We recalculated the sensitivity analysis performed by management and performed our own sensitivity analyses, focusing on what we considered to be reasonably possible changes in the key assumptions. We also considered the appropriateness of the disclosures in note 11.
Overall, we considered the assumptions made to be within a supportable range and the disclosures appropriate. | |
Major contracts in Global Services, Business and Public Sector and EE (relevant to the group and (aside from major contracts in EE) parent company financial statements) We focused on these contracts as they involve significant estimates in respect of: – the completeness and valuation of provisions against contracts projected to be loss making; and – the recoverability of contract-specific assets, including deferred costs and property, plant and equipment.
Consideration of the completeness and valuation of provisions against contracts and the recoverability of contract-specific assets is dependent on the assumptions underpinning the lifetime profitability forecasts for the contracts. | We stratified the population and tested a sample of major contracts, focusing our work on those which we regarded as higher risk because of the nature of the contract, its stage of delivery or the quantum of the related assets on the balance sheet, and then by those which were material by size. In performing this testing, we assessed the appropriateness of the assumptions and estimates underpinning the accounting for these major contracts as follows: – We evaluated the design and tested the operating effectiveness of controls that operate across the contract life cycle for major contracts. – We obtained and read the relevant sections of certain contracts agreed between the group and the customer, to identify the contracted revenues, key provisions in the event of contract termination (such as penalties or the ability for the group to recover costs) and other significant obligations. We ensured the future forecasts reflected the contract terms, testing any significant changes (such as new services) to changes notices or other supporting documentation. – We tested a sample of recorded revenue and cost transactions by tracing them to supporting evidence, which for revenue included evidence of delivery and/or customer acceptance.
|
| 98 | British Telecommunications plc Annual Report & Form 20-F 2018 | |||||
Table of Contents
| THE STRATEGIC REPORT | GOVERNANCE | FINANCIAL STATEMENTS | ADDITIONAL INFORMATION | |||||||||
|
|
| ||||||||||
Key audit matter
|
How our audit addressed the key audit matter
| |
– We compared the historical forecast results of certain contracts with the actual results to assess the performance of the contract and the historical accuracy of forecasting. – We performed sensitivity analysis to reflect reasonable downside risks that may impact the contract. – We also assessed the contract terms to identify any financial compensation the group is entitled to if the contract is terminated early by the customer for convenience to support our assessment of the recoverability of any associated contract assets.
We considered the future forecast profitability, including sensitivity analysis, and the contractual terms to assess the recoverability of the contract-specific assets and to determine if any contracts required loss provisions.
Based on our work we considered management’s estimates in respect of contract loss provisions and the recoverability of contract specific assets to be supportable and recorded in line with the group’s accounting policies as set out in note 3.
| ||
Accuracy of revenue due to complex billing systems (relevant to the group and parent company financial statements) The accuracy of revenue amounts recorded is an inherent risk. This is because the group’s billing systems are complex and process large volumes of data with a combination of different products sold and price changes in the year, through a number of different systems. |
We evaluated the relevant IT systems and the design of controls, and tested the operating effectiveness of controls over the: – Capture and recording of revenue transactions; – Authorisation of rate changes and the input of this information into the billing systems; and – Calculation of amounts billed to customers.
We determined that we could rely on these controls for the purposes of our audit. We also tested a sample of customer bills and checked these to supporting evidence (e.g. customer orders, contracts or subsequent communications from the group to customers confirming changes to prices, and call detail records where applicable) and cash received. Our testing included agreeing amounts to customer bills for consumers, corporate customers and wholesale customers.
Based on our work, we noted no material issues in the accuracy of revenue recorded in the year.
| |
Valuation of pension scheme obligations and unquoted investments in the BT Pension Scheme (relevant to the group and parent company financial statements) We focused on the BT Pension Scheme (BTPS) because the valuation of the BTPS obligations (£55.8bn at 31 March 2018) and unquoted assets (which comprised unquoted equity investments, property assets and other assets totalling £20.2bn at 31 March 2018) require the use of estimates and significant judgement, and a small change in the key assumptions can have a material impact on the financial statements. | We evaluated the design and tested the operating effectiveness of controls in respect of the determination of the BTPS net deficit. We determined that we could rely on these controls for the purposes of our audit.
We used our actuarial experts to assess the appropriateness of the actuarial assumptions used in valuing the BTPS obligations. This included comparing the assumptions used with our internally developed benchmarks. We also focused on the update to the discount rate model made at 31 March 2018 to assess its compliance with IAS 19 and considered the adequacy of the disclosure of the impact.
All the assumptions used by management fell within acceptable ranges.
We tested the valuation of the unquoted assets on a sample basis. Specifically: – For property assets, we: – Obtained and read valuation reports prepared by third party expert valuers for management. We assessed the methods and assumptions used by the valuers and the competence and objectivity of those third party experts; and
|
| British Telecommunications plc Annual Report & Form 20-F 2018 | 99 | |||||
Table of Contents
Independent auditors’ report to the members of British Telecommunications plc continued
Report on the audit of the financial statements continued
Key audit matter
|
How our audit addressed the key audit matter
| |
– Tested the carrying amount of other property assets by validating these to audited financial statements. – For direct investments held by the BTPS, the valuations of the investments are derived from discounted cash flow models. These models use assumptions including discount rates and cash flow forecasts. We assessed the assumptions used in a sample of the valuations by checking that the assumptions used were consistent with our internally developed range of discount rates (with the support of internal specialists), by comparing the cash flows with historical results and by considering the impact of other external information. We tested the accuracy of the calculations and assessed whether the assumptions used were in line with other market participants and reflected the particular status of the investment shareholding; and – For other unquoted investments, in addition to testing internal controls related to their valuation, we obtained confirmations of the valuation from the custodians and the investment managers, and tested the carrying amount by validating these to audited financial statements.
Based on the audit work we performed as described above, we considered the estimates and judgements used by management for the obligations and the unquoted investments to be within an acceptable range. We also satisfied ourselves as to the appropriateness of the disclosures in note 19.
| ||
Adequacy of regulatory and other provisions (relevant to the group and parent company financial statements)
The group and parent company have regulatory provisions of £320m relating to regulatory risks. There has been an increased frequency, and magnitude, of matters considered by Ofcom and the Competition Appeal Tribunal (CAT) in the UK.
The group and parent company have litigation provisions of £64m and £48m respectively. The group and parent company are involved in various legal proceedings, including actual or threatened litigation and regulatory investigations.
The magnitude of litigation and regulatory exposures means that a change in management’s judgement as to the likely outcome could have a material impact on the financial statements. |
We evaluated the design and tested the operating effectiveness of controls in respect of the determination of the provisions. We determined that we could rely on these controls for the purposes of our audit.
For regulatory provisions, we read correspondence and pronouncements from the regulator Ofcom and the CAT and correspondence from other communication providers (CPs).
We evaluated the regulatory risk exposures identified by management, and where relevant the provisions recorded, against observable data. We also considered management’s assessment of the likelihood of regulatory risks crystallising, and therefore the completeness of the provisions recorded, by comparing its assessment against historical disputes, open claims from CPs, current pronouncements issued by Ofcom and the CAT, and by considering the nature of the identified regulatory risk exposure.
For litigation provisions, we read the summary of major litigation matters provided by management and held discussions with the group’s general counsel and head of litigation. For a sample of matters, we held discussions with the group’s external legal advisors with respect to the matters included in the summary. Where appropriate we examined correspondence between the group’s external legal advisors and the relevant court or other regulatory body. We also tested a sample of legal expenses to identify any other potential litigation matters.
For regulatory provisions, we tested the calculation of a sample of the provisions, assessed the key assumptions against third party data where available, and assessed the estimates against historical trends, including an overall assessment of the provision against the aggregate risk exposures.
|
| 100 | British Telecommunications plc Annual Report & Form 20-F 2018 | |||||
Table of Contents
| THE STRATEGIC REPORT | GOVERNANCE | FINANCIAL STATEMENTS | ADDITIONAL INFORMATION | |||||||||
|
|
| ||||||||||
Key audit matter
|
How our audit addressed the key audit matter
| |
We considered management’s estimates of the level of provisioning to be appropriately supported based on the work we have performed. We also satisfied ourselves as to the appropriateness of the disclosures in note 18.
| ||
Recognition and measurement of potential tax exposures (relevant to the group and parent company financial statements) and deferred tax assets (relevant to the group financial statements) The group operates in a complex multinational tax environment and is subject to a range of tax risks. There is inherent judgement involved in determining provisions for uncertain tax positions (£240m as at 31 March 2018).
The parent company is subject to a range of tax risks and there is inherent judgement involved in determining provisions for uncertain tax positions (£215m as at 31 March 2018).
The group has material unrecognised deferred tax assets in respect of brought forward trading losses and other temporary differences, as set out in note 9. The recognition of deferred tax assets involves estimation regarding the likelihood of the realisation of these assets, in particular whether there will be taxable profits in future periods that support recognition of these assets. |
We evaluated the design and tested the operating effectiveness of controls in place for the determination and recognition of deferred tax balances and uncertain tax positions balances. We determined that we could rely on these controls for the purposes of our audit.
We tested the underlying data in support of the key deferred tax and uncertain tax provision calculations.
In conjunction with our tax specialists, we evaluated management’s conclusions in relation to uncertain tax positions and the related level of tax provisions. We considered the status of recent and current tax audits and enquiries as well as the results of previous claims, and changes to the tax environments in the markets in which the group operates. We utilised our specialist tax knowledge and experience of similar situations elsewhere to examine tax planning arrangements and the global transfer pricing model and assess management’s judgements. We found that the level of provisioning overall was supportable.
In assessing management’s conclusions with respect to the recognition of deferred tax assets, we evaluated the amount of tax losses recognised in light of the future projected profitability of the relevant subsidiary companies, by assessing the forecasts against past results and expectations of future trading performance.
We determined that the tax balances were supportable. We also satisfied ourselves as to the appropriateness of the disclosure in note 9 of the group financial statements and note 13 of the parent company financial statements.
| |
BT Italy – changes to the control environment and review of estimates made in 2016/17 (relevant to the group financial statements) In 2016/17, the group disclosed the results of its investigations into irregular accounting practices in Italy and reported control deficiencies related to the Italian business as at 31 March 2017.
In 2017/18, the group made a number of changes to the control environment as it relates to its Italian business, including enhancing the controls that had not operated effectively in the prior year and implementing new controls.
Following the prior year investigations, and as previously reported, the group recorded an aggregate adjustment of £513m in respect of the Italian business in 2016/17, of which £245m was recognised as a specific item charge in the 2016/17 income statement and £268m related to years prior to 2016/17.
The nature of the irregular accounting practices and control weaknesses required management to make a number of estimates and judgements in determining the adjustments recorded in 2016/17. During 2017/18 management has undertaken additional work to reassess the estimates previously made and determined no further material adjustments were necessary.
|
We evaluated the design and tested the operating effectiveness of the enhanced controls and the new controls related to the Italian business.
Our Italian component team performed a full scope audit for the purposes of the group audit for the year ended 31 March 2018 and reported to us thereon. With the assistance of the Italian component team we also assessed whether there was any evidence of events or circumstances arising in the year ended 31 March 2018 that provided new information which necessitated further adjustments to be made to the financial information of the Italian business, either in the current year or in respect of prior years.
We satisfied ourselves that the critical estimates recorded in respect of the Italian business in the group balance sheet at 31 March 2018, including any reassessments of the amounts previously recognised, were appropriately supported. |
| British Telecommunications plc Annual Report & Form 20-F 2018 | 101 | |||||
Table of Contents
Independent auditors’ report to the members of British Telecommunications plc continued
Report on the audit of the financial statements continued
Key audit matter
|
How our audit addressed the key audit matter
| |
Cost capitalisation and asset lives for property, plant and equipment and software intangible assets (relevant to the group and parent company financial statements) Capitalisation of costs involves management judgement and the useful lives assigned to assets are a key management estimate. These manifest themselves in the following two audit risks: – that amounts being capitalised do not meet capitalisation criteria, including the recognition and deferral of related grants; and – that the useful economic lives assigned to assets are inappropriate.
We also focused on the recognition of capital grants associated with the Broadband Delivery UK (BDUK) and Superfast Extension (SEP) programmes, as the grants may be subject tore-investment or repayment depending on the level oftake-up requiring calculation of grant income to be deferred. | We evaluated the design and tested the operating effectiveness of controls around the property, plant and equipment cycle and software intangible assets cycle, including the controls over whether engineering (labour) activity is capital or operating in nature. We determined that we could rely on these controls for the purposes of our audit.
We tested costs capitalised in the year and considered the ageing of assets in the course of construction. We assessed the nature of costs incurred in capital projects through testing of amounts recorded and considering whether the expenditure met the criteria for capitalisation under accounting standards.
We tested the controls over the annual review of asset lives. In addition, we considered whether management’s views on asset lives are supportable by considering our knowledge of the business and of the wider telecoms industry. We also tested whether the prior year asset life review has been appropriately applied and assessed the judgements made by management in the current year review. We found that the asset lives were consistent with those commonly used in the industry and appropriately reflected technological developments.
We tested the controls in place over the recording and reconciliation of grant income deferral. We assessed the key assumption of the forecast level of end usertake-up applied by management to calculate the deferral. In addition, we tested other key inputs to supporting evidence as well as the accuracy of the calculation. We determined that management’s conclusions were supportable.
| |
How we tailored the audit scope We tailored the scope of our audit to ensure that we performed enough work to be able to give an opinion on the financial statements as a whole, taking into account the structure of the group and the parent company, the accounting processes and controls, and the industry in which they operate.
The group’s accounting process is structured around a finance function in each of the reporting units who are supported by one of the group’s shared service centres. The reporting units are responsible for their own accounting records and controls and report to the head office finance team in London through an integrated consolidation system.
In establishing the overall approach to the group audit, we determined the type of work that needed to be performed at reporting units by us, as the group engagement team, or component auditors from other PwC network firms operating under our instruction (including PwC UK for EE). Where the work was performed by component auditors, we determined the level of involvement we needed to have in the audit work at those reporting units to be able to conclude whether sufficient appropriate audit evidence had been obtained as a basis for our opinion on the financial statements as a whole. |
For three reporting units (the main BT UK trading company (British Telecommunications plc), EE and the principal reporting unit in Italy) an audit of the complete financial information was performed.
These accounted for over 80% of the group’s revenue and the group’s profit before tax.
In five reporting units (Germany, Ireland, Spain, the US and an additional UK reporting unit) audits of the revenue financial statement line item and related balance sheet accounts were performed. The work performed on these five reporting units accounted for 7% of the group’s revenue. For the additional UK reporting unit, audit procedures on certain operating costs and related balance sheet accounts were also performed. In addition, specified procedures were performed on revenue and certain balance sheet accounts in Switzerland.
This, together with additional procedures performed on centralised functions and at the group level (on the consolidation and other areas of significant judgement including tax and goodwill), gave us the evidence we needed for our opinion on the financial statements as a whole.
The group engagement team performed the audit of British Telecommunications plc. The group engagement team also performed the work on the US reporting unit and the other UK reporting unit. |
| 102 | British Telecommunications plc Annual Report & Form 20-F 2018 | |||||
Table of Contents
| THE STRATEGIC REPORT | GOVERNANCE | FINANCIAL STATEMENTS | ADDITIONAL INFORMATION | |||||||||
|
|
| ||||||||||
For EE, the group engagement team met regularly with the component audit team, who are UK based, and attended meetings with management, including the year end clearance meeting.
Senior members of the group engagement team also visited Italy, Germany, Ireland and Spain and communicated with our component audit teams on a regular basis. We also reviewed certain component auditor working papers and participated in the audit clearance meetings for Italy, Germany, Ireland and Spain either in person or by conference call. In addition, the group engagement team visited the shared service centres relevant to those reporting units in scope for the group audit.
Materiality
The scope of our audit was influenced by our application of materiality. We set certain quantitative thresholds for materiality. These, together with qualitative considerations, helped us to determine the scope of our audit and the nature, timing and extent of our audit procedures on the individual financial statement line items and disclosures and in evaluating the effect of misstatements, both individually and in aggregate on the financial statements as a whole.
Based on our professional judgement, we determined materiality for the financial statements as a whole as follows:
| Group financial statements | Parent company financial statements | |||
Overall materiality | £130m (2016/17: £130m). | £110m (2016/17: £110m). | ||
How we determined it | 5% of profit before tax. | 5% of profit before tax. | ||
Rationale for benchmark applied | The Group is profit orientated and we consider profit before tax to be an appropriate benchmark as it represents a key statutory measure used by the shareholders to assess the financial performance of the group. | We consider profit before tax to be an appropriate benchmark as it represents a key statutory measure used by the shareholders to assess the financial performance of the parent company. As the parent company is a component materiality has been capped at an amount appropriate for the group financial statements. |
For each component in the scope of our group audit, we allocated a materiality that is less than our overall group materiality. As noted above, British Telecommunications plc is a component of the group and materiality was set at £110m. For EE, materiality allocated to this unit was £100m. For all other reporting units the materiality allocated was between £10m and £20m.
We agreed with the BT Group plc Audit & Risk Committee that we would report to them misstatements identified during our audit above £10m (for both the group and parent company audits) (2016/17: £10m) as well as misstatements below those amounts that, in our view, warranted reporting for qualitative reasons.
Conclusions relating to going concern
We have nothing to report in respect of the following matters in relation to which ISAs (UK) require us to report to you when:
| – | the directors’ use of the going concern basis of accounting in the preparation of the financial statements is not appropriate; or |
| – | the directors have not disclosed in the financial statements any identified material uncertainties that may cast significant doubt about the group’s and parent company’s ability to continue to adopt the going concern basis of accounting for a period of at least twelve months from the date when the financial statements are authorised for issue. |
However, because not all future events or conditions can be predicted, this statement is not a guarantee as to the group’s and parent company’s ability to continue as a going concern.
Reporting on other information
The other information comprises all of the information in the Annual Report other than the financial statements and our auditors’ report thereon. The directors are responsible for the other information. Our opinion on the financial statements does not cover the other information and, accordingly, we do not express an audit opinion or, except to the extent otherwise explicitly stated in this report, any form of assurance thereon.
In connection with our audit of the financial statements, our responsibility is to read the other information and, in doing so, consider whether the other information is materially inconsistent with the financial statements or our knowledge obtained in the audit, or otherwise appears to be materially misstated. If we identify an apparent material inconsistency or material misstatement, we are required to perform procedures to conclude whether there is a material misstatement of the financial statements or a material misstatement of the other information. If, based on the work we have performed, we conclude that there is a material misstatement of this other information, we are required to report that fact. We have nothing to report based on these responsibilities.
With respect to the Strategic Report, Report of the Directors and Corporate Governance Statement, we also considered whether the disclosures required by the UK Companies Act 2006 have been included.
Based on the responsibilities described above and our work undertaken in the course of the audit, ISAs (UK) require us also to report certain opinions and matters as described below.
| British Telecommunications plc Annual Report & Form 20-F 2018 | 103 | |||||
Table of Contents
Independent auditors’ report to the members of British Telecommunications plc continued
Report on the audit of the financial statements continued
Strategic Report and Report of the Directors
In our opinion, based on the work undertaken in the course of the audit, the information given in the Strategic Report and Report of the Directors for the year ended 31 March 2018 is consistent with the financial statements and has been prepared in accordance with applicable legal requirements.
In light of the knowledge and understanding of the group and parent company and their environment obtained in the course of the audit, we did not identify any material misstatements in the Strategic Report and Report of the Directors.
Responsibilities for the financial statements and the audit
Responsibilities of the directors for the financial statements
As explained more fully in the Statement of directors’ responsibilities set out on page 89, the directors are responsible for the preparation of the financial statements in accordance with the applicable framework and for being satisfied that they give a true and fair view. The directors are also responsible for such internal control as they determine is necessary to enable the preparation of financial statements that are free from material misstatement, whether due to fraud or error.
In preparing the financial statements, the directors are responsible for assessing the group’s and the parent company’s ability to continue as a going concern, disclosing as applicable, matters related to going concern and using the going concern basis of accounting unless the directors either intend to liquidate the group or the parent company or to cease operations, or have no realistic alternative but to do so.
Auditors’ responsibilities for the audit of the financial statements
Our objectives are to obtain reasonable assurance about whether the financial statements as a whole are free from material misstatement, whether due to fraud or error, and to issue an auditors’ report that includes our opinion. Reasonable assurance is a high level of assurance, but is not a guarantee that an audit conducted in accordance with ISAs (UK) will always detect a material misstatement when it exists. Misstatements can arise from fraud or error and are considered material if, individually or in the aggregate, they could reasonably be expected to influence the economic decisions of users taken on the basis of these financial statements.
A further description of our responsibilities for the audit of the financial statements is located on the FRC’s website at: www.frc.org.uk/auditorsresponsibilities. This description forms part of our auditors’ report.
Use of this report
This report, including the opinions, has been prepared for and only for the parent company’s members as a body in accordance with Chapter 3 of Part 16 of the Companies Act 2006 and for no other purpose. We do not, in giving these opinions, accept or assume responsibility for any other purpose or to any other person to whom this report is shown or into whose hands it may come save where expressly agreed by our prior consent in writing.
Other required reporting
Companies Act 2006 exception reporting
Under the Companies Act 2006 we are required to report to you if, in our opinion:
| – | we have not received all the information and explanations we require for our audit; or |
| – | adequate accounting records have not been kept by the parent company, or returns adequate for our audit have not been received from branches not visited by us; or |
| – | certain disclosures of directors’ remuneration specified by law are not made; or |
| – | the parent company financial statements are not in agreement with the accounting records and returns. |
We have no exceptions to report arising from this responsibility.
Appointment
We were appointed by the members in 1984 to audit the financial statements for the year ended 31 March 1985 and subsequent financial periods. The period of total uninterrupted engagement is 34 years, covering the years ended 31 March 1985 to 31 March 2018.
Richard Hughes (Senior Statutory Auditor)
for and on behalf of PricewaterhouseCoopers LLP
Chartered Accountants and Statutory Auditors
London
23 May 2018
| 104 | British Telecommunications plc Annual Report & Form 20-F 2018 | |||||
Table of Contents
| THE STRATEGIC REPORT | GOVERNANCE | FINANCIAL STATEMENTS | ADDITIONAL INFORMATION | |||||||||
|
|
| ||||||||||
Report of Independent Registered Public Accounting Firm
To the Board of Directors and the Shareholders of British Telecommunications plc
Opinions on the Financial Statements and Internal Control over Financial Reporting
We have audited the accompanying group balance sheets of British Telecommunications plc and its subsidiaries (the “Company”) as of 31 March 2018 and 31 March 2017, and the related group income statements, group statements of comprehensive income, group statements of changes in equity and group cash flow statements for each of the three years in the period ended 31 March 2018, including the related notes (collectively referred to as the “financial statements”). We also have audited the Company’s internal control over financial reporting as of 31 March 2018, based on criteria established inInternal Control - Integrated Framework (2013) issued by the Committee of Sponsoring Organizations of the Treadway Commission (“COSO”).
In our opinion, the financial statements referred to above present fairly, in all material respects, the financial position of the Company as of 31 March 2018 and 31 March 2017, and the results of their operations and their cash flows for each of the three years in the period ended 31 March 2018 in conformity with International Financial Reporting Standards as issued by the International Accounting Standards Board and International Financial Reporting Standards as adopted by the European Union. Also in our opinion, the Company maintained, in all material respects, effective internal control over financial reporting as of 31 March 2018, based on criteria established inInternal Control - Integrated Framework (2013) issued by the COSO.
Basis for Opinions
The Company’s management is responsible for these financial statements, for maintaining effective internal control over financial reporting, and for its assessment of the effectiveness of internal control over financial reporting included in Management’s Report on Internal Control over Financial Reporting on page 94 of the Report of the Directors’ Statutory Information of the British Telecommunications plc Annual Report & Form20-F 2018. Our responsibility is to express opinions on the Company’s financial statements and on the Company’s internal control over financial reporting based on our audits. We are a public accounting firm registered with the Public Company Accounting Oversight Board (United States) (“PCAOB”) and are required to be independent with respect to the Company in accordance with the U.S. federal securities laws and the applicable rules and regulations of the Securities and Exchange Commission and the PCAOB.
We conducted our audits in accordance with the standards of the PCAOB. Those standards require that we plan and perform the audits to obtain reasonable assurance about whether the financial statements are free of material misstatement, whether due to error or fraud, and whether effective internal control over financial reporting was maintained in all material respects.
Our audits of the financial statements included performing procedures to assess the risks of material misstatement of the financial statements, whether due to error or fraud, and performing procedures that respond to those risks. Such procedures included examining, on a test basis, evidence regarding the amounts and disclosures in the financial statements. Our audits also included evaluating the accounting principles used and significant estimates made by management, as well as evaluating the overall presentation of the financial statements. Our audit of internal control over financial reporting included obtaining an understanding of internal control over financial reporting, assessing the risk that a material weakness exists, and testing and evaluating the design and operating effectiveness of internal control based on the assessed risk. Our audits also included performing such other procedures as we considered necessary in the circumstances. We believe that our audits provide a reasonable basis for our opinions.
Definition and Limitations of Internal Control over Financial Reporting
A company’s internal control over financial reporting is a process designed to provide reasonable assurance regarding the reliability of financial reporting and the preparation of financial statements for external purposes in accordance with generally accepted accounting principles. A company’s internal control over financial reporting includes those policies and procedures that (i) pertain to the maintenance of records that, in reasonable detail, accurately and fairly reflect the transactions and dispositions of the assets of the company; (ii) provide reasonable assurance that transactions are recorded as necessary to permit preparation of financial statements in accordance with generally accepted accounting principles, and that receipts and expenditures of the company are being made only in accordance with authorisations of management and directors of the company; and (iii) provide reasonable assurance regarding prevention or timely detection of unauthorised acquisition, use, or disposition of the company’s assets that could have a material effect on the financial statements.
Because of its inherent limitations, internal control over financial reporting may not prevent or detect misstatements. Also, projections of any evaluation of effectiveness to future periods are subject to the risk that controls may become inadequate because of changes in conditions, or that the degree of compliance with the policies or procedures may deteriorate.
PricewaterhouseCoopers LLP
London, United Kingdom
23 May 2018
We have served as the Company’s auditor since 1984.
| British Telecommunications plc Annual Report & Form 20-F 2018 | 105 | |||||
Table of Contents
Year ended 31 March 2018
Notes | | Before specific items £m |
| | Specific items £m | a
|
| Total £m |
| |||||||
Revenue | 4 | 23,746 | (23 | ) | 23,723 | |||||||||||
Operating costs | 5 | (19,752 | ) | (587 | ) | (20,339 | ) | |||||||||
Operating profit (loss) | 4 | 3,994 | (610 | ) | 3,384 | |||||||||||
Finance expense | 24 | (576 | ) | (218 | ) | (794 | ) | |||||||||
Finance income | 24 | 215 | – | 215 | ||||||||||||
Net finance expense | (361 | ) | (218 | ) | (579 | ) | ||||||||||
Share of post tax profit (loss) of associates and joint ventures | (1 | ) | – | (1 | ) | |||||||||||
Profit (loss) before taxation | 3,632 | (828 | ) | 2,804 | ||||||||||||
Taxation | 9 | (707 | ) | 87 | (620 | ) | ||||||||||
Profit (loss) for the year | 2,925 | (741 | ) | 2,184 | ||||||||||||
| Year ended 31 March 2017 | ||||||||||||||||
Notes | | Before specific items £m |
| | Specific itemsa £m |
|
| Total £m |
| |||||||
Revenue | 4 | 24,082 | (20 | ) | 24,062 | |||||||||||
Operating costs | 5 | (19,944 | ) | (948 | ) | (20,892 | ) | |||||||||
Operating profit (loss) | 4 | 4,138 | (968 | ) | 3,170 | |||||||||||
Finance expense | 24 | (632 | ) | (210 | ) | (842 | ) | |||||||||
Finance income | 24 | 232 | – | 232 | ||||||||||||
Net finance expense | (400 | ) | (210 | ) | (610 | ) | ||||||||||
Share of post tax profit (loss) of associates and joint ventures | (9 | ) | – | (9 | ) | |||||||||||
Profit (loss) before taxation | 3,729 | (1,178 | ) | 2,551 | ||||||||||||
Taxation | 9 | (702 | ) | 217 | (485 | ) | ||||||||||
Profit (loss) for the year | 3,027 | (961 | ) | 2,066 | ||||||||||||
| Year ended 31 March 2016 | ||||||||||||||||
| Notes | | Before specific items £m | | | Specific itemsa £m | | | Total £m | | |||||||
Revenue | 4 | 18,879 | 133 | 19,012 | ||||||||||||
Operating costs | 5 | (15,052 | ) | (345 | ) | (15,397 | ) | |||||||||
Operating profit (loss) | 4 | 3,827 | (212 | ) | 3,615 | |||||||||||
Finance expense | 24 | (540 | ) | (229 | ) | (769 | ) | |||||||||
Finance income | 24 | 389 | – | 389 | ||||||||||||
Net finance expense | (151 | ) | (229 | ) | (380 | ) | ||||||||||
Share of post tax profit (loss) of associates and joint ventures | 6 | – | 6 | |||||||||||||
Profit (loss) before taxation | 3,682 | (441 | ) | 3,241 | ||||||||||||
Taxation | 9 | (674 | ) | 166 | (508 | ) | ||||||||||
Profit (loss) for the year | 3,008 | (275 | ) | 2,733 | ||||||||||||
| a | For a definition of specific items, see page 209. An analysis of specific items is provided in note 8. |
| 106 | British Telecommunications plc Annual Report & Form 20-F 2018 | |||||
Table of Contents
| THE STRATEGIC REPORT | GOVERNANCE | FINANCIAL STATEMENTS | ADDITIONAL INFORMATION | |||||||||
|
|
| ||||||||||
Group statement of comprehensive income
Year ended 31 March
| Notes | 2018 £m | 2017 £m | 2016 £m | |||||||||||||
Profit for the year | 2,184 | 2,066 | 2,733 | |||||||||||||
Other comprehensive income (loss) | ||||||||||||||||
Items that will not be reclassified to the income statement | ||||||||||||||||
Remeasurements of the net pension obligation | 19 | 2,160 | (2,789 | ) | 755 | |||||||||||
Tax on pension remeasurements | 9 | (346 | ) | 416 | (240 | ) | ||||||||||
Items that have been or may be reclassified to the income statement | ||||||||||||||||
Exchange differences on translation of foreign operations | 26 | (188 | ) | 237 | 29 | |||||||||||
Fair value movement onavailable-for-sale assets | 26 | 11 | (3 | ) | (2 | ) | ||||||||||
Fair value movement on cash flow hedges: | ||||||||||||||||
– net fair value (losses) gains | 26 | (368 | ) | 884 | 381 | |||||||||||
– recognised in income and expense | 26 | 277 | (938 | ) | (230 | ) | ||||||||||
Tax on components of other comprehensive income that have been or may be reclassified | 9, 26 | 1 | 29 | 5 | ||||||||||||
Other comprehensive income (loss) for the year, net of tax | 1,547 | (2,164 | ) | 698 | ||||||||||||
Total comprehensive income (loss) for the year | 3,731 | (98 | ) | 3,431 | ||||||||||||
| British Telecommunications plc Annual Report & Form 20-F 2018 | 107 | |||||
Table of Contents
At 31 March
| Notes | 2018 £m | 2017 £m | 2016 £m | |||||||||||||||||||||||||
Non-current assets | ||||||||||||||||||||||||||||
Intangible assets | 11 | 14,455 | 15,037 | 15,458 | ||||||||||||||||||||||||
Property, plant and equipment | 12 | 17,000 | 16,498 | 15,971 | ||||||||||||||||||||||||
Derivative financial instruments | 25 | 1,312 | 1,818 | 1,462 | ||||||||||||||||||||||||
Investments | 21 | 13,354 | 11,606 | 11,965 | ||||||||||||||||||||||||
Associates and joint ventures | 38 | 31 | 24 | |||||||||||||||||||||||||
Trade and other receivables | 16 | 317 | 360 | 218 | ||||||||||||||||||||||||
Deferred tax assets | 9 | 1,243 | 1,717 | 1,247 | ||||||||||||||||||||||||
| 47,719 | 47,067 | 46,345 | ||||||||||||||||||||||||||
Current assets | ||||||||||||||||||||||||||||
Programme rights | 14 | 272 | 264 | 225 | ||||||||||||||||||||||||
Inventories | 15 | 239 | 227 | 189 | ||||||||||||||||||||||||
Trade and other receivables | 16 | 4,029 | 3,860 | 3,987 | ||||||||||||||||||||||||
Current tax receivable | 77 | 73 | 65 | |||||||||||||||||||||||||
Derivative financial instruments | 25 | 197 | 428 | 177 | ||||||||||||||||||||||||
Investments | 21 | 3,224 | 1,740 | 3,271 | ||||||||||||||||||||||||
Cash and cash equivalents | 22 | 521 | 526 | 989 | ||||||||||||||||||||||||
| 8,559 | 7,118 | 8,903 | ||||||||||||||||||||||||||
Current liabilities | ||||||||||||||||||||||||||||
Loans and other borrowings | 23 | 2,298 | 2,791 | 3,756 | ||||||||||||||||||||||||
Derivative financial instruments | 25 | 50 | 34 | 48 | ||||||||||||||||||||||||
Trade and other payables | 17 | 7,190 | 7,476 | 7,463 | ||||||||||||||||||||||||
Current tax liabilities | 83 | 197 | 271 | |||||||||||||||||||||||||
Provisions | 18 | 603 | 625 | 178 | ||||||||||||||||||||||||
| 10,224 | 11,123 | 11,716 | ||||||||||||||||||||||||||
Total assets less current liabilities | 46,054 | 43,062 | 43,532 | |||||||||||||||||||||||||
Non-current liabilities | ||||||||||||||||||||||||||||
Loans and other borrowings | 23 | 13,038 | 11,105 | 12,029 | ||||||||||||||||||||||||
Derivative financial instruments | 25 | 787 | 869 | 863 | ||||||||||||||||||||||||
Retirement benefit obligations | 19 | 6,371 | 9,088 | 6,382 | ||||||||||||||||||||||||
Other payables | 17 | 1,326 | 1,298 | 1,106 | ||||||||||||||||||||||||
Deferred tax liabilities | 9 | 1,340 | 1,240 | 1,262 | ||||||||||||||||||||||||
Provisions | 18 | 452 | 536 | 565 | ||||||||||||||||||||||||
| 23,314 | 24,136 | 22,207 | ||||||||||||||||||||||||||
Equity | ||||||||||||||||||||||||||||
Ordinary shares | 2,172 | 2,172 | 2,172 | |||||||||||||||||||||||||
Share premium | 8,000 | 8,000 | 8,000 | |||||||||||||||||||||||||
Other reserves | 26 | 1,241 | 1,591 | 1,392 | ||||||||||||||||||||||||
Retained earnings | 11,327 | 7,163 | 9,761 | |||||||||||||||||||||||||
Total shareholder’s equity | 22,740 | 18,926 | 21,325 | |||||||||||||||||||||||||
| 46,054 | 43,062 | 43,532 | ||||||||||||||||||||||||||
The consolidated financial statements on pages 106 to 191 were approved by the Board of Directors on 23 May 2018 and were signed on its behalf by:
Simon Lowth
Director
| 108 | British Telecommunications plc Annual Report & Form 20-F 2018 | |||||
Table of Contents
| THE STRATEGIC REPORT | GOVERNANCE | FINANCIAL STATEMENTS | ADDITIONAL INFORMATION | |||||||||
|
|
| ||||||||||
Group statement of changes in equity
| Notes | | Share capital £m | a
| | Share premium £m | b
| | Other reserves £m | c
| | Retained earnings (loss) £m |
| | Total equity (deficit) £m |
| |||||||||||||
At 1 April 2015 | 2,172 | 8,000 | 1,209 | 7,896 | 19,277 | |||||||||||||||||||||||
Profit for the year | – | – | – | 2,733 | 2,733 | |||||||||||||||||||||||
Other comprehensive income (loss) – before tax | – | – | 408 | 755 | 1,163 | |||||||||||||||||||||||
Tax on other comprehensive income (loss) | 9 | – | – | 5 | (240 | ) | (235 | ) | ||||||||||||||||||||
Transferred to the income statement | – | – | (230 | ) | – | (230 | ) | |||||||||||||||||||||
Total comprehensive income (loss) for the year | – | – | 183 | 3,248 | 3,431 | |||||||||||||||||||||||
Share-based payments | 20 | – | – | – | 58 | 58 | ||||||||||||||||||||||
Tax on share-based payments | 9 | – | – | – | 12 | 12 | ||||||||||||||||||||||
Dividends to parent company | 10 | – | – | – | (1,450 | ) | (1,450 | ) | ||||||||||||||||||||
Other movements | – | – | – | (3 | ) | (3 | ) | |||||||||||||||||||||
At 1 April 2016 | 2,172 | 8,000 | 1,392 | 9,761 | 21,325 | |||||||||||||||||||||||
Profit for the year | – | – | – | 2,066 | 2,066 | |||||||||||||||||||||||
Other comprehensive income (loss) – before tax | – | – | 1,108 | (2,779 | ) | (1,671 | ) | |||||||||||||||||||||
Tax on other comprehensive income (loss) | 9 | – | – | 29 | 416 | 445 | ||||||||||||||||||||||
Transferred to the income statement | – | – | (938 | ) | – | (938 | ) | |||||||||||||||||||||
Total comprehensive income (loss) for the year | – | – | 199 | (297 | ) | (98 | ) | |||||||||||||||||||||
Share-based payments | 20 | – | – | – | 57 | 57 | ||||||||||||||||||||||
Tax on share-based payments | 9 | – | – | – | (6 | ) | (6 | ) | ||||||||||||||||||||
Dividends to parent company | 10 | – | – | – | (2,350 | ) | (2,350 | ) | ||||||||||||||||||||
Other movements | – | – | – | (2 | ) | (2 | ) | |||||||||||||||||||||
At 1 April 2017 | 2,172 | 8,000 | 1,591 | 7,163 | 18,926 | |||||||||||||||||||||||
Profit for the year | – | – | – | 2,184 | 2,184 | |||||||||||||||||||||||
Other comprehensive income (loss) – before tax | – | – | (545 | ) | 2,160 | 1,615 | ||||||||||||||||||||||
Tax on other comprehensive income (loss) | 9 | – | – | 1 | (346 | ) | (345 | ) | ||||||||||||||||||||
Transferred to the income statement | – | – | 277 | – | 277 | |||||||||||||||||||||||
Total comprehensive income (loss) for the year | – | – | (267 | ) | 3,998 | 3,731 | ||||||||||||||||||||||
Share-based payments | 20 | – | – | – | 84 | 84 | ||||||||||||||||||||||
Tax on share-based payments | 9 | – | – | – | (2 | ) | (2 | ) | ||||||||||||||||||||
Transfer to realised profit | – | – | (83 | ) | 83 | – | ||||||||||||||||||||||
Other movements | – | – | – | 1 | 1 | |||||||||||||||||||||||
At 31 March 2018 | 2,172 | 8,000 | 1,241 | 11,327 | 22,740 |
| a | The allotted, called up, and fully paid ordinary share capital of the company at 31 March 2018 was £2,172m comprising 8,689,755,905 ordinary shares of 25p each. |
| b | The share premium account, comprising the premium on allotment of shares, is not available for distribution. |
| c | For further analysis of other reserves, see note 26. |
| British Telecommunications plc Annual Report & Form 20-F 2018 | 109 | |||||
Table of Contents
Year ended 31 March
Notes | 2018 £m | 2017 £m | 2016 £m | |||||||||||||||||||||||||
Cash flow from operating activities | ||||||||||||||||||||||||||||
Profit before taxation | 2,804 | 2,551 | 3,241 | |||||||||||||||||||||||||
Share of post tax loss (profit) of associates and joint ventures | 1 | 9 | (6 | ) | ||||||||||||||||||||||||
Net finance expense | 579 | 610 | 380 | |||||||||||||||||||||||||
Operating profit | 3,384 | 3,170 | 3,615 | |||||||||||||||||||||||||
Othernon-cash charges | 33 | 20 | 39 | |||||||||||||||||||||||||
Profit on disposal of businesses | (1 | ) | (16 | ) | – | |||||||||||||||||||||||
Depreciation and amortisation | 3,514 | 3,572 | 2,631 | |||||||||||||||||||||||||
Increase in inventories | (14 | ) | (33 | ) | – | |||||||||||||||||||||||
Increase in programme rights | (34 | ) | (95 | ) | (44 | ) | ||||||||||||||||||||||
(Increase) decrease in trade and other receivablesa | (156 | ) | 168 | (83 | ) | |||||||||||||||||||||||
(Decrease) increase in trade and other payables | (367 | ) | (150 | ) | 123 | |||||||||||||||||||||||
Decrease in other liabilitiesb | (775 | ) | (307 | ) | (810 | ) | ||||||||||||||||||||||
(Decrease) increase in provisionsc | 18 | (203 | ) | 401 | (63 | ) | ||||||||||||||||||||||
Cash generated from operations | 5,381 | 6,730 | 5,408 | |||||||||||||||||||||||||
Income taxes paid | (473 | ) | (551 | ) | (256 | ) | ||||||||||||||||||||||
Net cash inflow from operating activities | 4,908 | 6,179 | 5,152 | |||||||||||||||||||||||||
Cash flow from investing activities | ||||||||||||||||||||||||||||
Interest received | 7 | 7 | 10 | |||||||||||||||||||||||||
Dividends received from associates and joint ventures | – | 2 | 17 | |||||||||||||||||||||||||
Acquisition of subsidiariesd | 13 | (16 | ) | 18 | 93 | |||||||||||||||||||||||
Proceeds on disposal of subsidiariesd, associates and joint ventures | 2 | 46 | – | |||||||||||||||||||||||||
Acquisition of joint ventures | (9 | ) | (13 | ) | (8 | ) | ||||||||||||||||||||||
Outflow onnon-current amounts owed by ultimate parent companye | (1,677 | ) | (1,571 | ) | (4,767 | ) | ||||||||||||||||||||||
Proceeds on disposal of current financial assetsf | 11,134 | 10,834 | 8,918 | |||||||||||||||||||||||||
Purchases of current financial assetsf | (12,629 | ) | (9,411 | ) | (8,252 | ) | ||||||||||||||||||||||
Proceeds on disposal ofnon-current asset investmentsg | 19 | – | – | |||||||||||||||||||||||||
Purchases ofnon-current asset investmentsg | – | (22 | ) | – | ||||||||||||||||||||||||
Proceeds on disposal of property, plant and equipment | 21 | 26 | 7 | |||||||||||||||||||||||||
Purchases of property, plant and equipment and software | (3,362 | ) | (3,145 | ) | (2,438 | ) | ||||||||||||||||||||||
Net cash outflow from investing activities | (6,510 | ) | (3,229 | ) | (6,420 | ) | ||||||||||||||||||||||
Cash flow from financing activities | ||||||||||||||||||||||||||||
Interest paid | (555 | ) | (629 | ) | (558 | ) | ||||||||||||||||||||||
Repayment of borrowingsh | (1,401 | ) | (1,805 | ) | (1,283 | ) | ||||||||||||||||||||||
Proceeds from bank loans and bonds | 3,760 | 3 | 3,023 | |||||||||||||||||||||||||
Cash flows from derivatives related to net debt | (188 | ) | 119 | 79 | ||||||||||||||||||||||||
Drawdown on acquisition facility | – | – | 3,200 | |||||||||||||||||||||||||
Repayment of acquisition facility | – | (181 | ) | (3,019 | ) | |||||||||||||||||||||||
Repayment of EE revolving credit facility | – | (438 | ) | (100 | ) | |||||||||||||||||||||||
Net cash inflow (outflow) from financing activities | 1,616 | (2,931 | ) | 1,342 | ||||||||||||||||||||||||
Net increase in cash and cash equivalents | 14 | 19 | 74 | |||||||||||||||||||||||||
Opening cash and cash equivalentsi | 509 | 452 | 402 | |||||||||||||||||||||||||
Net increase in cash and cash equivalents | 14 | 19 | 74 | |||||||||||||||||||||||||
Effect of exchange rate changes | (31 | ) | 38 | (24 | ) | |||||||||||||||||||||||
Closing cash and cash equivalentsi | 22 | 492 | 509 | 452 | ||||||||||||||||||||||||
| a | Includes a prepayment of £325m (2016/17: £nil, 2015/16: £nil) in respect of the acquisition of Spectrum. |
| b | Includes pension deficit payments of £872m (2016/17: £274m, 2015/16: £880m). |
| c | Included within the change in provisions is the settlement of Deemed Consent, part of which isnon-cash and is offset by movements in working capital. |
| d | Acquisitions and disposals of subsidiaries are shown net of cash acquired or disposed of and in 2017 included £20mtrue-up of consideration following the audit of the completion balance sheet relating to the acquisition of EE. |
| e | Refer to note 28 for further information. |
| f | Primarily consists of investment in and redemption of amounts held in liquidity funds. |
| g | Relates to assets held for sale classified within trade and other receivables. |
| h | Repayment of borrowings includes the impact of hedging and repayment of lease liabilities. |
| I | Net of bank overdrafts of £29m (2016/17: £17m, 2015/16: £537m). |
| 110 | British Telecommunications plc Annual Report & Form 20-F 2018 | |||||
Table of Contents
| THE STRATEGIC REPORT | GOVERNANCE | FINANCIAL STATEMENTS | ADDITIONAL INFORMATION | |||||||||
|
|
| ||||||||||
Notes to the consolidated financial statements
Preparation of the financial statements
These consolidated financial statements have been prepared in accordance with the Companies Act 2006 as applicable to companies using International Financial Reporting Standards (IFRS), Article 4 of the IAS Regulation and International Accounting Standards (IAS) and IFRS and related interpretations, as adopted by the European Union. The consolidated financial statements are also in compliance with IFRS as issued by the International Accounting Standards Board (the IASB) and interpretations as issued by the IFRS Interpretations Committee. The consolidated financial statements are prepared on a going concern basis.
These financial statements consolidate British Telecommunications plc, the parent company, and its subsidiaries (together the ‘group’). The consolidated financial statements are prepared on the historical cost basis, except for certain financial and equity instruments that have been measured at fair value. The consolidated financial statements are presented in Sterling, the functional currency of British Telecommunications plc, the parent company.
New and amended accounting standards
effective during the year
Note 23 of these consolidated financial statements reflect the amendments of IAS 7 ‘Statement of Cash Flows’ requiring the disclosure of changes in liabilities arising from financing activities.
There have been no other new or amended standards or interpretations adopted during the year that have a significant impact on the financial statements.
New and amended accounting standards that
have been issued but are not yet effective
The following standards have been issued and are effective for accounting periods ending on or after 1 April 2018 and are expected to have an impact on the group financial statements.
IFRS 15 ‘Revenue from Contracts with Customers’
Background
In May 2014, IFRS 15 ‘Revenue from Contracts with Customers’ was issued. It was subsequently amended in September 2015 and April 2016. It is effective for periods beginning on or after 1 January 2018. Transition to IFRS 15 for the group will take place on 1 April 2018. Results in the 2018/19 financial year will comply with IFRS 15, with the first Annual Report and Form20-F published in accordance with IFRS 15 being that for the year ended 31 March 2019.
IFRS 15 sets out the requirements for recognising revenue and costs from contracts with customers and includes extensive disclosure requirements. The standard requires entities to apportion revenue earned from contracts to individual promises, or performance obligations, on a relative stand-alone selling price basis, based on a five-step model.
Transition
We previously disclosed in our Annual Report & Form20-F 2017 that we were planning to adopt IFRS 15 retrospectively. This meant applying the new standard to each prior reporting period presented, ie 2016/17 and 2017/18, in accordance with IAS 8 ‘Accounting Policies, Changes in Accounting Estimates and Errors’. Having considered further the factors that would influence our approach (including the time, effort and cost of adopting IFRS 15 retrospectively), as disclosed in the prior year Annual Report, we have decided to adopt the new standard on a modified retrospective basis and the group will recognise the cumulative effect of initially applying the standard as an adjustment to the opening balance of retained earnings at 1 April 2018, ie the date of initial application. Under this transition method:
| – | the standard will be applied only to contracts in progress but not completed at the date of initial application |
| – | for contracts that were modified before 1 April 2018, the group shall reflect the aggregate effect of all of the modifications that occur before this date at 1 April 2018 |
| – | we will not restate prior year comparatives for the effect of IFRS 15 but will instead restate our 1 April 2018 opening retained earnings for the full cumulative impact of adopting this standard |
| – | for the year ended 31 March 2019 we will provide a reconciliation of our primary financial statements under IFRS 15 to those in accordance with IAS 18. |
IFRS 15 Project
The group has deployed a cross-functional project team dedicated to the implementation of IFRS 15. This team has been engaged in determining accounting policies under the new standard, quantifying the transitional adjustments and selecting and implementing suitable systems solutions. The team is also reviewing the impact on tax, intragroup trading, forecasting, the bid and tender process and HR and remuneration plans. There is a significant impact on the group’s billing data and accounting platforms.
Performance obligations
IFRS 15 requires that at contract inception, we assess the goods or services promised in a contract with a customer and identify as a performance obligation each promise to transfer to the customer the good or service. Promises in a contract can be explicit, or implicit if the promises create a valid expectation to provide a good or service based on the customary business practices, published policies, or specific statements.
The stand-alone selling prices of the group’s products and services have been determined. These may be regulated prices, list prices, a cost-plus derived price, the price of similar products when sold on a stand-alone basis by BT or a competitor or in some cases the contract price where the price contracted represents a bespoke price that would be the same for a similar customer in a similar circumstance.
| British Telecommunications plc Annual Report & Form 20-F 2018 | 111 | |||||
Table of Contents
Notes to the consolidated financial statements continued
Financial Impact
The group is in the process of finalising the impact of the standard including the final transition adjustment to retained earnings. We have estimated that the likely impact on transition at 1 April 2018 will produce a cumulative increase in retained earnings of between £1.1bn and £1.5bn before tax. The corresponding impact will primarily be recorded as contract asset and will lead to an additionalone-off cash tax payment split equally between 2018/19 and 2019/20. The cumulative increase in retained earnings is mainly due to the acceleration of handset revenues and, to a lesser extent, deferral of costs (notably third party contract acquisition costs primarily associated with post pay contracts).
The financial impact of each business area is as follows:
| – | Under our current accounting policy, mobile handset revenue is recognised based on the amount the customer pays for the handset when it is delivered to the customer. Generally mobile handsets are either provided for free or for a small upfront charge. |
Under IFRS 15, additional revenue will be allocated to the mobile handset at the start of the contract. This is calculated with reference to its relative standalone value within the contract, regardless of the contract pricing. For each mobile handset contract the revenue recognition profile will change with greater day one recognition of revenue for the handset and a corresponding reduction in ongoing mobile service revenue over the contract period. The difference between the mobile handset revenue recognised and the amounts charged to the customer will be recognised as a contract asset. On adoption of IFRS 15, we will recognise a contract asset for all open contracts at 1 April 2018.
Over time, we expect the contract asset generated to remain at similar levels as old contracts expire and new ones are signed. However, we will see short-term volatility, for example around key handset launches.
This will be the most significant impact of the IFRS 15 adoption on the group and will primarily impact EE. To a lesser extent this will also impact mobile handset revenues in Business and Public Sector, in respect of the legacy EE business division, and BT Consumer. The impact in these customer-facing units is less significant due to the lower handset base.
We expect to see a similar trend in respect of subsidised equipment although we expect this to have a less significant impact due to the lower relative standalone value for this equipment.
| – | Currently, sales commissions and other third party acquisition costs resulting directly from securing contracts with customers are expensed when incurred. |
Under IFRS 15 sales commissions and other third party contract acquisition costs will be recognised as an asset, and amortised over the period in which the corresponding benefit is received, resulting in earlier profit recognition.
The impact is greatest in EE in respect of third-party acquisition costs partially associated with post pay contracts.
| – | The above two impacts will be partly offset by amended accounting for connections revenue. Currently, the group recognises connections revenue upon performance of the connection activity. Under IFRS 15 connections revenue will be deferred and recognised on a straight-line basis over the associated line/circuit contractual period. This will mean that revenue and profits will be recognised later and on transition leads to the recognition of a contract liability as revenue and profits are deferred to future periods. Wholesale and Ventures and Openreach deliver the majority of this service and therefore will experience the majority of the impact. Over time, this liability is expected to remain at similar levels as old contracts expire and new ones are signed. |
On the adoption date we expect the impact of this deferral to be significantly less than the impact of handset revenue and third party acquisition costs noted above.
| – | We will provide for expected lifetime losses on recognised contract assets as required by IFRS 9 as set out below. |
IFRS 15 will impact other areas but we do not expect the impact to be material. These include certain contract fulfilment costs which will be recognised as an asset and amortised over the period in which benefit is received and certain expenses will be recognised as a deduction from revenue.
IFRS 15 also provides more detailed guidance on how to account for contract modifications than the current revenue standards IAS 18 and IAS 11. Changes must be accounted for either as a retrospective change (creating either a catch up or deferral of previously recorded revenues), prospectively with a reallocation of revenues amongst identified performance obligations, or prospectively as separate contracts which will not require any reallocation. We expect contract modifications would primarily relate to changes in the agreed products and services to be provided to customers for long-term IT and networking solution contracts.
Disclosures
The adoption of IFRS 15 would also result in changes to our Annual Report disclosures. They key changes expected are as follows:
| – | we will amend our existing revenue disclosures to comply with the requirements to disaggregate revenue recognised from contracts with customers into categories that depict how the nature, amount, timing and uncertainty of revenue and associated cash flows are affected by economic factors |
| – | we will provide further detail around contract balances and their movements |
| – | we will provide an aggregate amount of the transaction price allocated to the performance obligation that are unsatisfied as of the end of the reporting period and an explanation of when the entity expects the amounts to be recognised as revenue. |
IFRS 9 ‘Financial instruments’
IFRS 9 is effective for BT from 1 April 2018. It is applicable to financial assets and financial liabilities and covers the classification, measurement, impairment andde-recognition of financial assets and liabilities together with a new hedge accounting model.
With the exception of the impact on IFRS 15 contract assets we do not expect the standard to have a material impact on our results, with the key issues for BT being around documentation of policies, hedging strategy and new hedge documentation.
| 112 | British Telecommunications plc Annual Report & Form 20-F 2018 | |||||
Table of Contents
| THE STRATEGIC REPORT | GOVERNANCE | FINANCIAL STATEMENTS | ADDITIONAL INFORMATION | |||||||||
|
|
| ||||||||||
IFRS 9 operates an expected credit loss model rather than an incurred credit loss model. Providing for loss allowances on our existing financial assets is not expected to have a material impact. We have included the impact of providing for losses on our contract assets within the estimated impact of the adoption of IFRS 15 as set out above.
IFRS 16 ‘Leases’
IFRS 16 was published in January 2016 and will be effective for BT from 1 April 2019, replacing IAS 17 ‘Leases’. We are planning to adopt IFRS 16 on a modified retrospective basis and the group will recognise the cumulative effect of initially applying the standard as an adjustment to the opening balance of retained earnings at 1 April 2019, ie the date of initial application. Results in the 2019/20 financial year will be IFRS 16 compliant and the Annual Report and20-F 2020 will be the first to include the results on this basis.
The standard requires lessees to recognise assets and liabilities for all leases unless the lease term is 12 months or less, or the underlying asset is of low value.
The group is still in the process of quantifying the implications of this standard. However, we expect the following indicative impacts:
| – | there is expected to be an increase in total assets, as leased assets which are currently accounted for off balance sheet (ie classified as operating leases under IAS 17) will be recognised on balance sheet valued in accordance with the principles of IFRS 16. The biggest asset category impacted for the group is expected to be land and buildings |
| – | there is expected to be an increase in debt, as liabilities relating to existing operating leases are recognised. The increase in total debt will have an impact on gearing ratios |
| – | operating lease expenditure will be reclassified and split between depreciation and finance costs. Therefore EBITDA will increase. Future depreciation and finance costs are also expected to increase as a result of increased assets and liabilities |
| – | there is an expected temporary reduction in profit after tax as result of the above changes. This is expected to be driven by an increase in finance costs as a result of the new leases. These finance costs will have an accelerated profile which will reduce once the leases are settled |
| – | there may be a corresponding effect on tax balances in relation to all of the above impacts. |
This standard will require us to make key accounting judgements in particular around the likelihood of lease renewals.
Details of our existing operating lease commitments are set out in note 29.
Presentation of specific items
Our income statement and segmental analysis separately identify trading results before specific items. The directors believe that presentation of our results in this way is relevant to an understanding of our financial performance, as specific items are identified by virtue of their size, nature or incidence. This presentation is consistent with the way that financial performance is measured by management and reported to the Board and theExecutive Committeeof BT Group plc and assists in providing a meaningful analysis of our trading results. In determining whether an event or transaction is specific, management considers quantitative as well as qualitative factors such as the frequency or predictability of occurrence.
Furthermore, we consider a columnar presentation to be appropriate, as it improves the clarity of the presentation and is consistent with the way that financial performance is measured by
management and reported to the Board and theExecutive Committee of BT Group plc.
Specific items may not be comparable to similarly titled measures used by other companies. Examples of charges or credits meeting the above definition and which have been presented as specific items in the current and/or prior years include acquisitions/disposals of businesses and investments, regulatory settlements, historical insurance or litigation claims, business restructuring programmes, asset impairment charges, property rationalisation programmes, net interest on pensions and the settlement of multiple tax years. In the event that other items meet the criteria, which are applied consistently from year to year, they are also treated as specific items.
Specific items for the current and prior years are disclosed in note 8.
2. Critical accounting estimates and key judgements
The preparation of financial statements in conformity with IFRS requires the use of accounting estimates and assumptions. It also requires management to exercise its judgement in the process of applying our accounting policies. We continually evaluate our estimates, assumptions and judgements based on available information and experience. As the use of estimates is inherent in financial reporting, actual results could differ from these estimates. Management has discussed its critical accounting estimates and associated disclosures with theAudit and Risk Committeeof BT Group plc.The areas involving a higher degree of judgement or complexity are described in the applicable notes to the financial statements. Critical accounting estimates and key judgements can be identified throughout the notes by the following symbol.
We have the following critical accounting estimates (E) and key judgements (J):
| – | Revenue from multiple element arrangements, see note 4 (J). |
| – | Subscriber acquisition and retention costs, see note 5 (J). |
| – | Current and deferred income tax, see note 9 (E, J). |
| – | Goodwill, see note 11 (E). |
| – | Government grants relating to Broadband Delivery UK (BDUK) contracts, see note 12 (E, J). |
| – | Long-term customer contracts, see note 16 (E). |
| – | Provisions and contingent liabilities, see note 18 (E, J). |
| – | Pension obligations, see note 19 (E, J). |
3. Significant accounting policies
The significant accounting policies applied in the preparation of our consolidated financial statements are set out below. These policies have been consistently applied to all the years presented, unless otherwise stated.
Basis of consolidation
The group financial statements consolidate the financial statements of British Telecommunications plc and its subsidiaries, and include its share of the results of associates and joint ventures using the equity method of accounting. The group recognises its direct rights to (and its share of) jointly held assets, liabilities, revenues and expenses of joint operations under the appropriate headings in the consolidated financial statements.
A subsidiary is an entity that is controlled by another entity, known as the parent or investor. An investor controls an investee when the investor is exposed, or has rights, to variable returns from its involvement with the investee and has the ability to affect those returns through its power over the investee.
| British Telecommunications plc Annual Report & Form 20-F 2018 | 113 | |||||
Table of Contents
Notes to the consolidated financial statements continued
Non-controlling interests in the net assets of consolidated subsidiaries, which consist of the amounts of those interests at the date of the original business combination andnon-controlling share of changes in equity since the date of the combination, are not material to the group’s financial statements.
The results of subsidiaries acquired or disposed of during the year are consolidated from and up to the date of change of control. Where necessary, accounting policies of subsidiaries have been aligned with the policies adopted by the group. All intra-group transactions including any gains or losses, balances, income or expenses are eliminated in full on consolidation.
When the group loses control of a subsidiary, the profit or loss on disposal is calculated as the difference between (i) the aggregate of the fair value of the consideration received and the fair value of any retained interest and (ii) the previous carrying amount of the assets (including goodwill), and liabilities of the subsidiary and anynon-controlling interests. The profit or loss on disposal is recognised as a specific item.
Revenue
Revenue represents the fair value of the consideration received or receivable for communications services and equipment sales, net of discounts and sales taxes. Revenue is recognised when it is probable that the economic benefits associated with a transaction will flow to the group and the amount of revenue and associated costs can be measured reliably. The accounting for revenue sharing arrangements depends on the analysis of the facts and circumstances surrounding these transactions.
Where we act as an agent in a transaction, we recognise revenue net of directly attributable costs.
Services
Revenue arising from separable installation and connection services is recognised when it is earned, upon activation. Revenue from the rental of analogue and digital lines and private circuits as well as wholesale access revenue is recognised on a straight line basis over the period to which it relates. Revenue from calls is recognised at the time the call is made over our network. Subscription fees, consisting primarily of monthly charges for access to broadband and other internet access or voice services, are recognised as revenue as the service is provided. Revenue from the interconnection of voice and data traffic between other telecommunications operators is recognised at the time of transit across our network.
Equipment sales
Revenue from the sale of equipment is recognised when all the significant risks and rewards of ownership are transferred to the customer, which is normally the date the equipment is delivered and accepted by the customer.
Long-term contractual arrangements
Revenue from long-term contractual arrangements, including fixed price contracts to design and build software solutions, is recognised based on the percentage of completion method. The stage of completion is estimated using an appropriate measure according to the nature of the contract such as the proportion of costs incurred relative to the estimated total contract costs, or other measures of completion such as the achievement of contract milestones and customer acceptance. In the case of time and materials contracts, revenue is recognised as the service is rendered.
Costs related to delivering services under long-term contractual arrangements are expensed as incurred except for an element of costs incurred in the initial contractset-up, transition or transformation phase, which is deferred and recorded withinnon-current assets. These costs are then recognised in the income statement on a straight line basis over the remaining contract term, unless the pattern of service delivery indicates a different profile is more appropriate. These costs are directly attributable to specific contracts, relate to future activity, will generate future economic benefits and are assessed for recoverability on a regular basis.
The percentage of completion method relies on estimates of total expected contract revenues and costs, as well as reliable measurement of the progress made towards completion. Unless the financial outcome of a contract can be estimated with reasonable certainty, no attributable profit is recognised. In such circumstances, revenue is recognised equal to the costs incurred to date, to the extent that such revenue is expected to be recoverable, or costs are accrued to bring the margin to nil. Recognised revenue and profits are subject to revisions during the contract if the assumptions regarding the overall contract outcome are changed. The cumulative impact of a revision in estimates is recorded in the period in which such revisions become likely and can be estimated. Where the actual and estimated costs to completion exceed the estimated revenue for a contract, the full contract life loss is recognised immediately.
Multiple element arrangements and bundles
Revenue from multiple element arrangements and bundles is described in note 4.
Operating and reportable segments
Our operating segments are reported based on financial information provided to theExecutive Committeeof BT Group plc which is the key management committee and represents the ‘chief operating decision maker’.
Our organisational structure reflects the different customer groups to which we provide communications products and services via our customer-facing units: BT Consumer, EE, Business and Public Sector, Global Services, Wholesale and Ventures and Openreach. The customer-facing units are supported by an internal service unit: Technology, Service & Operations (TSO).
The customer-facing units are our reportable segments and generate substantially all of our revenue. We aggregate the remaining operations and include within the ‘Other’ category to reconcile to the consolidated results of the group. The ‘Other’ category includes TSO and our corporate units including procurement and property management.
Provisions for the settlement of significant legal, commercial and regulatory disputes, which are negotiated at a group level, are initially recorded in the ‘Other’ segment. On resolution of the dispute, the full impact is recognised in the results of the relevant customer-facing unit and offset in the group results through the utilisation of the provision previously charged to the ‘Other’ segment. Settlements which are particularly significant or cover more than one financial year may fall within the definition of specific items as detailed on page 209.
| 114 | British Telecommunications plc Annual Report & Form 20-F 2018 | |||||
Table of Contents
| THE STRATEGIC REPORT | GOVERNANCE | FINANCIAL STATEMENTS | ADDITIONAL INFORMATION | |||||||||
|
|
| ||||||||||
The costs incurred by TSO are recharged to the customer-facing units to reflect the services it provides to them. Depreciation and amortisation incurred by TSO in relation to the networks and systems it manages and operates on behalf of the customer-facing units is allocated to the customer-facing units based on their respective utilisation. Capital expenditure incurred by TSO for specific projects undertaken on behalf of the customer-facing units is allocated based on the value of the directly attributable expenditure incurred. Where projects are not directly attributable to a particular customer-facing unit, capital expenditure is allocated between them based on the proportion of estimated future economic benefits. TSO and the group’s corporate functions are not reportable segments as they did not meet the quantitative thresholds as set out in IFRS 8 ‘Operating Segments’ for any of the years presented.
Performance of each reportable segment is measured based on adjusted EBITDA, defined as EBITDA before specific items, as included in the internal financial reports reviewed by theExecutive Committeeof BT Group plc.EBITDA is defined as the operating profit or loss before depreciation, amortisation, net finance expense and taxation. Adjusted EBITDA is considered to be a useful measure of the operating performance of the customer-facing units because it approximates the underlying operating cash flow by eliminating depreciation and amortisation and also provides a meaningful analysis of trading performance by excluding specific items, which are disclosed separately by virtue of their size, nature or incidence. Specific items are detailed in note 8 and are not allocated to the reportable segments as this reflects how they are reported to theExecutive Committeeof BT Group plc.Finance expense and income are not allocated to the reportable segments, as the central treasury function manages this activity, together with the overall net debt position of the group.
On 1 April 2018, our BT Consumer and EE customer-facing units were brought together to drive converged products and accelerate transformation. Additionally, Business and Public Sector and Wholesale and Ventures will be brought together from 1 October 2018. Each of these businesses operated separately throughout 2017/18 and therefore have been presented as four separate operating segments throughout these financial statements, unless explicitly stated otherwise. For further information see note 30.
Retirement benefits
The group’s net obligation in respect of defined benefit pension plans is the present value of the defined benefit obligation less the fair value of the plan assets.
The calculation of the obligation is performed by a qualified actuary using the projected unit credit method and key actuarial assumptions at the balance sheet date.
The income statement expense is allocated between an operating charge and net finance income or expense. The operating charge reflects the increase in the defined benefit obligation resulting from the pension benefit earned by active employees in the current period, the costs of administering the plans and any past service costs/credits such as those arising from curtailments or settlements. The net finance income or expense reflects the interest on the net retirement benefit obligations recognised in the group balance sheet, based on the discount rate at the start of the year. Actuarial gains and losses are recognised in full in the period in which they occur and are presented in the group statement of comprehensive income.
The group also operates defined contribution pension plans and the income statement expense represents the contributions payable for the year.
Property, plant and equipment
Property, plant and equipment are included at historical cost, net of accumulated depreciation, government grants and any impairment charges. Property, plant and equipment acquired through business combinations are initially recorded at fair value and subsequently accounted for on the same basis as the group’s existing assets. An item of property, plant and equipment is derecognised on disposal or when no future economic benefits are expected to arise from the continued use of the asset. The difference between the sale proceeds and the net book value at the date of disposal is recognised in operating costs in the income statement.
Included within the cost of network infrastructure and equipment are direct and indirect labour costs, materials and directly attributable overheads.
Depreciation is provided on property, plant and equipment on a straight line basis from the time the asset is available for use, to write off the asset’s cost over the estimated useful life taking into account any expected residual value. Freehold land is not depreciated.
The estimated useful lives assigned to principal categories of assets are as follows:
Land and buildings | ||||
| – Freehold buildings | 14 to 50 years | |||
| – Short-term leasehold improvements | | Shorter of 10 years or lease term |
|
| – Leasehold land and buildings | | Unexpired portion of lease or 40 years, whichever is the shorter |
|
Network infrastructure | ||||
Transmission equipment | ||||
| – Duct | 40 years | |||
| – Cable | 3 to 25 years | |||
| – Fibre | 5 to 20 years | |||
| Exchange equipment | 2 to 13 years | |||
Other network equipment
| 2 to 20 years | |||
Other assets | ||||
| – Motor vehicles | 2 to 9 years | |||
– Computers and office equipment
| 3 to 7 years | |||
Assets held under finance leases are depreciated over the shorter of the lease term or their useful economic life. Residual values and useful lives are reassessed annually and, if necessary, changes are recognised prospectively.
Network share assets
Certain assets have been contributed to a network share arrangement by both EE and Hutchison 3G UK Limited, with legal title remaining with the contributor. This is considered to be a reciprocal arrangement. The group’s share of the assets on acquisition of EE was recognised at fair value within tangible assets, and depreciated in line with the group’s policy. Subsequent additions are recorded at cost. For further information see note 12.
| British Telecommunications plc Annual Report & Form 20-F 2018 | 115 | |||||
Table of Contents
Notes to the consolidated financial statements continued
Intangible assets
Identifiable intangible assets are recognised when the group controls the asset, it is probable that future economic benefits attributable to the asset will flow to the group and the cost of the asset can be reliably measured. All intangible assets, other than goodwill, are amortised over their useful economic life. The method of amortisation reflects the pattern in which the assets are expected to be consumed. If the pattern cannot be determined reliably, the straight line method is used.
Goodwill
Goodwill represents the excess of the cost of an acquisition over the fair value of the group’s share of the identifiable net assets (including intangible assets) of the acquired business.
For the purpose of impairment testing, goodwill acquired in a business combination is allocated to each of the Cash Generating Units (CGUs) that is expected to benefit from the business combination. Each CGU to which goodwill is allocated represents the lowest level within the group at which the goodwill is monitored for internal management purposes.
Acquired intangible assets – customer relationships and brands
Intangible assets such as customer relationships or brands acquired through business combinations are recorded at fair value at the date of acquisition and subsequently carried at amortised cost. Assumptions are used in estimating the fair values of these relationships or brands and include management’s estimates of revenue and profits to be generated by them.
Telecommunications licences
Licence fees paid to governments, which permit telecommunications activities to be operated for defined periods, are initially recorded at cost and amortised from the time the network is available for use to the end of the licence period or where our usage can extend beyond the initial licence period, over the period we expect to benefit from the use of the licences, which is typically 20 years. Licences acquired through business combinations are recorded at fair value at the date of acquisition and subsequently carried at amortised cost. The fair value is based on management’s assumption of future cash flows using market expectations at acquisition date.
Computer software
Computer software comprises computer software licences purchased from third parties, and also the cost of internally developed software. Computer software licences purchased from third parties are initially recorded at cost.
Costs directly associated with the production of internally developed software, including direct and indirect labour costs of development, are capitalised only where it is probable that the software will generate future economic benefits, the cost of the asset can be reliably measured and technical feasibility can be demonstrated, in which case it is capitalised as an intangible asset on the balance sheet. Costs which do not meet these criteria and research costs are expensed as incurred.
The group’s development costs which give rise to internally developed software include upgrading the network architecture or functionality and developing service platforms aimed at offering new services to the group’s customers. See research and development on page 17.
Other
Other intangible assets include website development costs and other licences. Items are capitalised at cost and amortised on a straight line basis over their useful economic life or the term of the contract.
Estimated useful economic lives
The estimated useful economic lives assigned to the principal categories of intangible assets are as follows:
– Computer software | 2 to 10 years | |||
– Telecommunications licences | 2 to 20 years | |||
– Customer relationships and brands
|
| 1 to 15 years
|
| |
Programme rights
Programme rights are recognised on the balance sheet from the point at which the legally enforceable licence period begins. Rights for which the licence period has not started are disclosed as contractual commitments in note 29. Payments made to receive commissioned or acquired programming in advance of the legal right to broadcast the programmes are classified as prepayments.
Programmes produced internally are charged to the income statement over the period of the related broadcast.
Programme rights are tested for impairment in accordance with the group’s policy for impairment of non-financial assets set out below. Related cash outflows are classified as operating cash flows in the cash flow statement.
Inventories
Network maintenance equipment and equipment to be sold to customers are stated at the lower of cost or net realisable value, taking into account expected revenues from the sale of packages comprising a mobile handset and a subscription. Cost corresponds to purchase or production cost determined by either the first in first out (FIFO) or average cost method.
Provisions
Provisions are recognised when the group has a present legal or constructive obligation as a result of past events, it is probable that an outflow of resources will be required to settle the obligation and the amount can be reliably estimated. Provisions are determined by discounting the expected future cash flows at a pre-tax rate that reflects current market assessments of the time value of money and the risks specific to the liability. Financial liabilities within provisions are initially recognised at fair value and subsequently carried at amortised cost using the effective interest method. Onerous lease provisions are measured at the lower of the cost to fulfil or to exit the contract.
Current and deferred income tax
Current income tax is calculated on the basis of the tax laws enacted or substantively enacted at the balance sheet date in the countries where the group’s subsidiaries, associates and joint ventures operate and generate taxable income. The group periodically evaluates positions taken in tax returns with respect to situations in which applicable tax regulation is subject to interpretation, and the group establishes provisions where appropriate on the basis of the amounts expected to be paid to tax authorities.
Deferred tax is recognised, using the liability method, in respect of temporary differences between the carrying amount of the group’s assets and liabilities and their tax base. Deferred income tax assets and liabilities are offset when there is a legally enforceable right to offset current tax assets against current tax liabilities and when the deferred income tax assets and liabilities relate to income taxes levied by the same taxation authority on either the taxable entity or different taxable entities where there is an intention to settle the balances on a net basis. Any remaining deferred tax asset is recognised only when, on the basis of all
| 116 | British Telecommunications plc Annual Report & Form 20-F 2018 | |||||
Table of Contents
| THE STRATEGIC REPORT | GOVERNANCE | FINANCIAL STATEMENTS | ADDITIONAL INFORMATION | |||||||||
|
|
| ||||||||||
available evidence, it can be regarded as probable that there will be suitable taxable profits, within the same jurisdiction, in the foreseeable future against which the deductible temporary difference can be utilised.
Deferred tax is determined using tax rates that are expected to apply in the periods in which the asset is realised or liability settled, based on tax rates and laws that have been enacted or substantively enacted by the balance sheet date.
Impairment of non-financial assets
Intangible assets with finite useful lives and property, plant and equipment are tested for impairment if events or changes in circumstances (assessed at each reporting date) indicate that the carrying amount may not be recoverable. When an impairment test is performed, the recoverable amount is assessed by reference to the higher of the net present value of the expected future cash flows (value in use) of the relevant cash generating unit and the fair value less costs to dispose.
Goodwill is reviewed for impairment at least annually. Impairment losses are recognised in the income statement, as a specific item. If a cash generating unit is impaired, impairment losses are allocated firstly against goodwill, and secondly on a pro-rata basis against intangible and other assets.
Government grants
Government grants are recognised when there is reasonable assurance that the conditions associated with the grants have been complied with and the grants will be received.
Grants for the purchase or production of property, plant and equipment are deducted from the cost of the related assets and reduce future depreciation expense accordingly. Grants for the reimbursement of operating expenditure are deducted from the related category of costs in the income statement. Government grants received relating to the BDUK programme and other rural superfast broadband contracts are accounted for as described under ‘Critical accounting estimates and key judgements’.
Once a government grant is recognised, any related deferred income is treated in accordance with IAS 20 ‘Accounting for Government Grants and Disclosure of Government Assistance’.
Foreign currencies
Foreign currency transactions are translated into the functional currency using the exchange rates prevailing at the date of the transaction. Foreign exchange gains and losses resulting from the settlement of transactions and the translation of monetary assets and liabilities denominated in foreign currencies at period end exchange rates are recognised in the income statement line which most appropriately reflects the nature of the item or transaction.
On consolidation, assets and liabilities of foreign undertakings are translated into Sterling at year end exchange rates. The results of foreign undertakings are translated into Sterling at average rates of exchange for the year (unless this average is not a reasonable approximation of the cumulative effects of the rates prevailing on the transaction dates, in which case income and expenses are translated at the dates of the transactions). Foreign exchange differences arising on the retranslation of foreign undertakings are recognised directly in a separate component of equity, the translation reserve.
In the event of the disposal of an undertaking with assets and liabilities denominated in a foreign currency, the cumulative translation difference associated with the undertaking in the
translation reserve is charged or credited to the gain or loss on disposal recognised in the income statement.
Research and development
Research expenditure is recognised in the income statement in the period in which it is incurred. Development expenditure, including the cost of internally developed software, is recognised in the income statement in the period in which it is incurred unless it is probable that economic benefits will flow to the group from the asset being developed, the cost of the asset can be reliably measured and technical feasibility can be demonstrated, in which case it is capitalised as an intangible asset on the balance sheet. Capitalisation ceases when the asset being developed is ready for use. Research and development costs include direct and indirect labour, materials and directly attributable overheads.
Leases
The determination of whether an arrangement is, or contains, a lease is based on the substance of the arrangement and requires an assessment of whether the fulfilment of the arrangement is dependent on the use of a specific asset or assets and whether the arrangement conveys the right to use the asset.
Leases of property, plant and equipment where the group holds substantially all the risks and rewards of ownership are classified as finance leases. Finance lease assets are capitalised at the commencement of the lease term at the lower of the present value of the minimum lease payments or the fair value of the leased asset. The obligations relating to finance leases, net of finance charges in respect of future periods, are recognised as liabilities. Leases are subsequently measured at amortised cost using the effective interest method.
Leases where a significant portion of the risks and rewards are held by the lessor are classified as operating leases. Rentals are charged to the income statement on a straight line basis over the period of the lease.
Share-based payments
BT Group plc operates a number of equity settled share-based payment arrangements, under which the group receives services from employees in consideration for equity instruments (share options and shares) of BT Group plc. Equity settled share-based payments are measured at fair value at the date of grant. Market-based performance criteria and non-vesting conditions (for example, the requirement for employees to make contributions to the share purchase programme) are reflected in this measurement of fair value. The fair value determined at the grant date is recognised as an expense on a straight line basis over the vesting period, based on the group’s estimate of the options or shares that will eventually vest and adjusted for the effect of non market-based vesting conditions. Fair value is measured using either the Binomial options pricing model or Monte Carlo simulations, whichever is more appropriate to the share-based payment arrangement.
Service and performance conditions are vesting conditions. Any other conditions are non-vesting conditions which have to be taken into account to determine the fair value of equity instruments granted. In the case that an award or option does not vest as a result of a failure to meet a non-vesting condition that is within the control of either counterparty, this is accounted for as a cancellation. Cancellations are treated as accelerated vesting and all remaining future charges are immediately recognised in the income statement. As the requirement to save under an employee saveshare arrangement is a non-vesting condition, employee cancellations, other than through a termination of service, are treated as an accelerated vesting.
| British Telecommunications plc Annual Report & Form 20-F 2018 | 117 | |||||
Table of Contents
Notes to the consolidated financial statements continued
No adjustment is made to total equity for awards that lapse or are forfeited after the vesting date.
Termination benefits
Termination benefits (leaver costs) are payable when employment is terminated before the normal retirement date, or when an employee accepts voluntary redundancy in exchange for these benefits. The group recognises termination benefits when it is demonstrably committed to the affected employees leaving the group.
Financial instruments
Financial liabilities at amortised cost
Trade and other payables
Financial liabilities within trade and other payables are initially recognised at fair value, which is usually the original invoiced amount, and subsequently carried at amortised cost using the effective interest method.
Loans and other borrowings
Loans and other borrowings are initially recognised at the fair value of amounts received net of transaction costs. Loans and other borrowings are subsequently measured at amortised cost using the effective interest method and, if included in a fair value hedge relationship, are re-valued to reflect the fair value movements on the hedged risk associated with the loans and other borrowings. The resulting amortisation of fair value movements, on de-designation of the hedge, is recognised in the income statement.
Available-for-sale investments
Liquid and other investments are classified as available-for-sale investments and are initially recognised at fair value plus direct transaction costs. These are re-measured at subsequent reporting dates to fair value, with unrealised gains and losses (except for changes in exchange rates for monetary items, interest, dividends and impairment losses, which are recognised in the income statement) recognised in equity. When the financial asset is derecognised, at which time the cumulative gain or loss previously recognised in equity is taken to the income statement, in the line that most appropriately reflects the nature of the item or transaction. On disposal or impairment of the investments, any gains and losses that have been deferred in other comprehensive income are re-classified to the income statement. Dividends on equity investments are recognised in the income statement when the group’s right to receive payment is established. Equity investments are recorded in non-current assets unless they are expected to be sold within one year.
Loans and receivables
Trade and other receivables
Trade and other receivables are initially recognised at fair value, which is usually the original invoiced amount, and are subsequently carried at amortised cost, using the effective interest method, less provisions made for doubtful receivables. Provisions are made specifically where there is evidence of a risk of non-payment, taking into account ageing, previous losses experienced and general economic conditions.
Cash and cash equivalents
Cash and cash equivalents comprise cash in hand and current balances with banks and similar institutions, which are readily convertible to cash and are subject to insignificant risk of changes in value and have an original maturity of three months or less. For the purpose of the consolidated cash flow statement, cash and cash equivalents are as defined above net of outstanding bank overdrafts. Bank overdrafts are included within loans and other borrowings, in current liabilities on the balance sheet.
Financial assets and liabilities at fair value through profit or loss
All of the group’s derivative financial instruments are held for trading and classified as fair value through profit or loss.
Derivative financial instruments
The group uses derivative financial instruments mainly to reduce exposure to foreign exchange and interest rate risks. The group’s policy is not to use derivatives for trading purposes. However, derivatives that do not qualify for hedge accounting or are specifically not designated as a hedge where natural offset is more appropriate are initially recognised and subsequently measured at fair value through profit and loss. Any direct transaction costs are recognised immediately in the income statement. Gains and losses on re-measurement are recognised in the income statement in the line that most appropriately reflects the nature of the item or transaction to which they relate. Derivative financial instruments are classified as current assets or current liabilities where they have a maturity period within 12 months. Where derivative financial instruments have a maturity period greater than 12 months, they are classified within either non-current assets or non-current liabilities.
Where the fair value of a derivative contract at initial recognition is not supported by observable market data and differs from the transaction price, a day one gain or loss will arise which is not recognised in the income statement. Such gains and losses are deferred and amortised to the income statement based on the remaining contractual term and as observable market data becomes available.
Hedge accounting
Where derivatives qualify for hedge accounting, recognition of any resultant gain or loss depends on the nature of the hedge. To qualify for hedge accounting, hedge documentation must be prepared at inception and the hedge must be expected to be highly effective both prospectively and retrospectively. The hedge is tested for effectiveness at inception and in subsequent periods in which the hedge remains in operation. Hedge accounting is discontinued when the hedging instrument expires, or is sold, terminated or no longer qualifies for hedge accounting or the group chooses to end the hedge relationship. The group designates certain derivatives as either cash flow hedges or fair value hedges.
Cash flow hedges
When a derivative financial instrument is designated as a hedge of the variability in cash flows of a recognised asset or liability, or a highly probable transaction, the effective part of any gain or loss on the derivative financial instrument is recognised directly in equity, in the cash flow reserve. For cash flow hedges of recognised assets or liabilities, the associated cumulative gain or loss is removed from equity and recognised in the same line of the income statement and in the same period or periods that the hedged transaction affects the income statement. Any ineffectiveness arising on a cash flow hedge of a recognised asset or liability is recognised immediately in the same income statement line as the hedged item. Where ineffectiveness arises on highly probable transactions, it is recognised in the income statement line which most appropriately reflects the nature of the item or transaction.
Fair value hedges
When a derivative financial instrument is designated as a hedge of the variability in fair value of a recognised asset or liability, or unrecognised firm commitment, the change in fair value of the derivative that is designated as a fair value hedge is recorded in the income statement at each reporting date, together with any changes in fair value of the hedged asset or liability that is attributable to the hedged risk.
| 118 | British Telecommunications plc Annual Report & Form 20-F 2018 | |||||
Table of Contents
| THE STRATEGIC REPORT | GOVERNANCE | FINANCIAL STATEMENTS | ADDITIONAL INFORMATION | |||||||||
|
|
| ||||||||||
The definition of our operating and reportable segments is provided on pages 114 and 115. We have set out below information regarding the results of each reportable segment.
Segment revenue and profit
| Year ended 31 March 2018 | BT Consumer £m | EE £m | Business £m | Global Services £m | Wholesale and Ventures £m | Openreach £m | Other £m | Total £m | ||||||||||||||||||||||||
Segment revenue | 5,066 | 5,294 | 4,563 | 5,013 | 2,009 | 5,123 | 8 | 27,076 | ||||||||||||||||||||||||
Internal revenue | (66 | ) | (37 | ) | (115 | ) | – | (134 | ) | (2,978 | ) | – | (3,330 | ) | ||||||||||||||||||
Revenue from external customersa | 5,000 | 5,257 | 4,448 | 5,013 | 1,875 | 2,145 | 8 | 23,746 | ||||||||||||||||||||||||
EBITDAb | 1,023 | 1,353 | 1,418 | 434 | 754 | 2,520 | 6 | 7,508 | ||||||||||||||||||||||||
Depreciation and amortisation | (216 | ) | (776 | ) | (365 | ) | (424 | ) | (311 | ) | (1,360 | ) | (62 | ) | (3,514 | ) | ||||||||||||||||
Operating profit (loss)a | 807 | 577 | 1,053 | 10 | 443 | 1,160 | (56 | ) | 3,994 | |||||||||||||||||||||||
Specific items (note 8) | (610 | ) | ||||||||||||||||||||||||||||||
Operating profit | 3,384 | |||||||||||||||||||||||||||||||
Net finance expensec | (579 | ) | ||||||||||||||||||||||||||||||
Share of post tax profit (loss) of associates and joint ventures | (1 | ) | ||||||||||||||||||||||||||||||
Profit before tax | 2,804 | |||||||||||||||||||||||||||||||
| Year ended 31 March 2017 | BT Consumer £m | EE £m | Business £m | Global Services £m | Wholesale and Ventures £m | Openreach £m | Other £m | Total £m | ||||||||||||||||||||||||
Segment revenue | 4,934 | 5,090 | 4,758 | 5,479 | 2,109 | 5,098 | 10 | 27,478 | ||||||||||||||||||||||||
Internal revenue | (63 | ) | (37 | ) | (122 | ) | – | (138 | ) | (3,036 | ) | – | (3,396 | ) | ||||||||||||||||||
Revenue from external customersa | 4,871 | 5,053 | 4,636 | 5,479 | 1,971 | 2,062 | 10 | 24,082 | ||||||||||||||||||||||||
EBITDAb | 1,012 | 1,156 | 1,528 | 495 | 834 | 2,633 | (10 | ) | 7,648 | |||||||||||||||||||||||
Depreciation and amortisation | (209 | ) | (780 | ) | (352 | ) | (439 | ) | (306 | ) | (1,369 | ) | (55 | ) | (3,510 | ) | ||||||||||||||||
Operating profit (loss)a | 803 | 376 | 1,176 | 56 | 528 | 1,264 | (65 | ) | 4,138 | |||||||||||||||||||||||
Specific items (note 8) | (968 | ) | ||||||||||||||||||||||||||||||
Operating profit | 3,170 | |||||||||||||||||||||||||||||||
Net finance expensec | (610 | ) | ||||||||||||||||||||||||||||||
Share of post tax profit (loss) of associates and joint ventures | (9 | ) | ||||||||||||||||||||||||||||||
Profit before tax | 2,551 | |||||||||||||||||||||||||||||||
| Year ended 31 March 2016 | | BT Consumer £m | | | EEd £m | | | Business and Public Sector £m |
| | Global Services £m | | | Wholesale and Ventures £m | | | Openreach £m | | | Other £m | | | Total £m | | ||||||||
Segment revenue | 4,608 | 841 | 4,294 | 5,074 | 2,274 | 5,100 | 11 | 22,202 | ||||||||||||||||||||||||
Internal revenue | (65 | ) | (7 | ) | (99 | ) | – | (94 | ) | (3,058 | ) | – | (3,323 | ) | ||||||||||||||||||
Revenue from external customersa | 4,543 | 834 | 4,195 | 5,074 | 2,180 | 2,042 | 11 | 18,879 | ||||||||||||||||||||||||
EBITDAb | 1,055 | 173 | 1,414 | 479 | 755 | 2,659 | (77 | ) | 6,458 | |||||||||||||||||||||||
Depreciation and amortisation | (207 | ) | (146 | ) | (284 | ) | (422 | ) | (253 | ) | (1,301 | ) | (18 | ) | (2,631 | ) | ||||||||||||||||
Operating profit (loss)a | 848 | 27 | 1,130 | 57 | 502 | 1,358 | (95 | ) | 3,827 | |||||||||||||||||||||||
Specific items (note 8) | (212 | ) | ||||||||||||||||||||||||||||||
Operating profit | 3,615 | |||||||||||||||||||||||||||||||
Net finance expensec | (380 | ) | ||||||||||||||||||||||||||||||
Share of post tax profit (loss) of associates and joint ventures | 6 | |||||||||||||||||||||||||||||||
Profit before tax | 3,241 | |||||||||||||||||||||||||||||||
| a | Before specific items. |
| b | EBITDA is stated before specific items and is the group’s profitability measure for segments. |
| c | Net finance expense includes specific item expense of £218m (2016/17: £210m, 2015/16: £229m). See note 8. |
| d | EE reflects results for the period from acquisition on 29 January 2016 to 31 March 2016. |
| British Telecommunications plc Annual Report & Form 20-F 2018 | 119 | |||||
Table of Contents
Notes to the consolidated financial statements continued
What are our internal revenue and costs?
Most of our internal trading relates to Openreach and arises on rentals, and any associated connection or migration charges, of the UK access lines and other network products to the customer-facing units. This occurs both directly, and also indirectly, through TSO which is included within the ‘Other’ segment. Wholesale and Ventures internal revenue arises from EE for mobile ethernet access and TSO for transmission planning services. Internal revenue in Business and Public Sector relates primarily to the use of BT Ireland’s network by other customer-facing units. Internal revenue arising in BT Consumer relates primarily to employee broadband and wi-fi services.
Intra-group revenue generated from the sale of regulated products and services is based on market price. Intra-group revenue from the sale of other products and services is agreed between the relevant customer-facing units and therefore customer-facing units profitability may be impacted by transfer pricing levels.
The tables below show internal revenue and costs recorded by each reportable segment.
| Internal cost recorded by | ||||||||||||||||||||||||||||||||
| Year ended 31 March 2018 | BT Consumer £m | EE £m | Business and Public Sector £m | Global Services £m | Wholesale and Ventures £m | Openreach £m | Other £m | Total £m | ||||||||||||||||||||||||
Internal revenue recorded by | ||||||||||||||||||||||||||||||||
BT Consumer | – | – | 24 | 20 | 4 | – | 18 | 66 | ||||||||||||||||||||||||
EE | – | – | – | – | 37 | – | – | 37 | ||||||||||||||||||||||||
Business and Public Sector | 62 | 2 | – | 32 | 19 | – | – | 115 | ||||||||||||||||||||||||
Global Services | – | – | – | – | – | – | – | – | ||||||||||||||||||||||||
Wholesale and Ventures | 1 | 2 | 13 | 10 | – | 42 | 66 | 134 | ||||||||||||||||||||||||
Openreach | 896 | – | 210 | 125 | 232 | – | 1,515 | 2,978 | ||||||||||||||||||||||||
Total | 959 | 4 | 247 | 187 | 292 | 42 | 1,599 | 3,330 | ||||||||||||||||||||||||
| Internal cost recorded by | ||||||||||||||||||||||||||||||||
| Year ended 31 March 2017 | BT Consumer £m | EE £m | Business £m | Global Services £m | Wholesale and Ventures £m | Openreach £m | Other £m | Total £m | ||||||||||||||||||||||||
Internal revenue recorded by | ||||||||||||||||||||||||||||||||
BT Consumer | – | – | 21 | 20 | 4 | – | 18 | 63 | ||||||||||||||||||||||||
EE | – | – | – | – | 37 | – | – | 37 | ||||||||||||||||||||||||
Business and Public Sector | 60 | 3 | – | 39 | 20 | – | – | 122 | ||||||||||||||||||||||||
Global Services | – | – | – | – | – | – | – | – | ||||||||||||||||||||||||
Wholesale and Ventures | – | – | 2 | 23 | – | 39 | 74 | 138 | ||||||||||||||||||||||||
Openreach | 910 | – | 236 | 158 | 260 | – | 1,472 | 3,036 | ||||||||||||||||||||||||
Total | 970 | 3 | 259 | 240 | 321 | 39 | 1,564 | 3,396 | ||||||||||||||||||||||||
| Internal cost recorded by | ||||||||||||||||||||||||||||||||
| Year ended 31 March 2016 | | BT Consumer £m | | | EEa £m | | | Business and Public Sector £m |
| | Global Services £m | | | Wholesale and Ventures £m | | | Openreach £m | | | Other £m | | | Total £m | | ||||||||
Internal revenue recorded by | ||||||||||||||||||||||||||||||||
BT Consumer | – | – | 20 | 23 | 4 | – | 18 | 65 | ||||||||||||||||||||||||
EEa | – | – | – | – | 7 | – | – | 7 | ||||||||||||||||||||||||
Business and Public Sector | 60 | 1 | – | 18 | 19 | 1 | – | 99 | ||||||||||||||||||||||||
Global Services | – | – | – | – | – | – | – | – | ||||||||||||||||||||||||
Wholesale and Ventures | – | 12 | 5 | 22 | – | 55 | – | 94 | ||||||||||||||||||||||||
Openreach | 905 | – | 262 | 173 | 264 | – | 1,454 | 3,058 | ||||||||||||||||||||||||
Total | 965 | 13 | 287 | 236 | 294 | 56 | 1,472 | 3,323 | ||||||||||||||||||||||||
| a | EE reflects results for the period from acquisition on 29 January 2016 to 31 March 2016. |
Revenue by products and services
What critical accounting judgements do we make when we have revenue from multiple element arrangements?
Where a contractual arrangement consists of two or more separate elements that have value to a customer on a standalone basis, revenue is recognised for each element as if it were an individual contract. Total contract consideration is allocated between the separate elements based on their fair value. We apply judgement in both identifying separate elements and allocating consideration between them.
Sales of bundled offers in our mobile businesses frequently include a handset and a telecommunications service contract. There is objective and reliable evidence of fair value for the telecommunications service to be delivered and this represents the revenue
| 120 | British Telecommunications plc Annual Report & Form 20-F 2018 | |||||
Table of Contents
| THE STRATEGIC REPORT | GOVERNANCE | FINANCIAL STATEMENTS | ADDITIONAL INFORMATION | |||||||||
|
|
| ||||||||||
recognised in respect of the services delivered. The residual value of the bundled offer therefore represents the revenue in respect of the handset. Revenue allocated to the deliverables is restricted to the amount that is receivable without the delivery of additional goods or services.
For offers that cannot be separated into identifiable elements, revenues are recognised in full over the life of the contract. The main example is connection to a service where this does not represent a separately identifiable transaction from the subscription.
| Year ended 31 March | 2018 £m | 2017 £m | 2016 £m | |||||||||
ICT and managed networks | 5,530 | 5,927 | 6,193 | |||||||||
Broadband and TV | 4,655 | 4,477 | 3,535 | |||||||||
Mobile | 6,451 | 6,358 | 1,326 | |||||||||
Calls, lines and connections | 5,126 | 5,069 | 5,920 | |||||||||
Transit | 265 | 404 | 419 | |||||||||
Other products and services | 1,719 | 1,847 | 1,486 | |||||||||
Revenuea | 23,746 | 24,082 | 18,879 | |||||||||
| a | Before specific items. |
Capital expenditure
| Year ended 31 March 2018 | BT Consumer £m | EE £m | Business £m | Global Services £m | Wholesale and Ventures £m | Openreach £m | Other £m | Total £m | ||||||||||||||||||||||||
Intangible assets | 106 | 130 | 93 | 92 | 87 | 70 | 64 | 642 | ||||||||||||||||||||||||
Property, plant and equipment | 185 | 498 | 211 | 186 | 142 | 1,588 | 70 | 2,880 | ||||||||||||||||||||||||
Capital expenditurea | 291 | 628 | 304 | 278 | 229 | 1,658 | 134 | 3,522 | ||||||||||||||||||||||||
| Year ended 31 March 2017 | BT Consumer £m | EE £m | Business £m | Global Services £m | Wholesale and Ventures | Openreach £m | Other £m | Total £m | ||||||||||||||||||||||||
Intangible assets | 92 | 133 | 64 | 126 | 77 | 74 | 55 | 621 | ||||||||||||||||||||||||
Property, plant and equipment | 145 | 483 | 211 | 235 | 149 | 1,499 | 111 | 2,833 | ||||||||||||||||||||||||
Capital expenditurea | 237 | 616 | 275 | 361 | 226 | 1,573 | 166 | 3,454 | ||||||||||||||||||||||||
| Year ended 31 March 2016 | | BT Consumer £m | | | EE b £m | | | Business and Public Sector £m |
| | Global Services £m | | | Wholesale and Ventures | | | Openreach £m | | | Other £m | | | Total £m | | ||||||||
Intangible assets | 88 | 29 | 36 | 62 | 70 | 62 | 65 | 412 | ||||||||||||||||||||||||
Property, plant and equipment | 119 | 67 | 117 | 293 | 139 | 1,385 | 90 | 2,210 | ||||||||||||||||||||||||
Capital expenditurea | 207 | 96 | 153 | 355 | 209 | 1,447 | 155 | 2,622 | ||||||||||||||||||||||||
| a | Net of government grants. |
| b | EE reflects results for the period from acquisition on 29 January 2016 to 31 March 2016. |
How do we determine our geographic information?
The UK is our country of domicile and we generate the majority of our revenue from external customers in the UK. The geographic analysis of revenue is based on the country of origin in which the customer is invoiced. The geographic analysis of non-current assets, which exclude derivative financial instruments, investments and deferred tax assets, is based on the location of the assets.
| British Telecommunications plc Annual Report & Form 20-F 2018 | 121 | |||||
Table of Contents
Notes to the consolidated financial statements continued
Revenue from external customers
| Year ended 31 March | 2018 £m | 2017 £m | 2016 £m | |||||||||
UK | 19,687 | 19,421 | 14,814 | |||||||||
Europe, Middle East and Africa, excluding the UK | 2,489 | 2,841 | 2,442 | |||||||||
Americas | 996 | 1,148 | 1,011 | |||||||||
Asia Pacific | 574 | 672 | 612 | |||||||||
Revenuea | 23,746 | 24,082 | 18,879 | |||||||||
| a | Before specific items. |
Non-current assets
| At 31 March | 2018 £m | 2017 £m | 2016 £m | |||||||||
UK | 28,843 | 28,818 | 28,583 | |||||||||
Europe, Middle East and Africa, excluding the UK | 2,527 | 2,535 | 2,349 | |||||||||
Americas | 331 | 424 | 548 | |||||||||
Asia Pacific | 109 | 149 | 191 | |||||||||
Non-current assets | 31,810 | 31,926 | 31,671 | |||||||||
| Year ended 31 March | Notes | 2018 £m | 2017 £m | 2016 £m | ||||||||||||||||||||
Operating costs by nature | ||||||||||||||||||||||||
Staff costs: | ||||||||||||||||||||||||
Wages and salaries | 4,223 | 4,128 | 3,684 | |||||||||||||||||||||
Social security costs | 461 | 477 | 398 | |||||||||||||||||||||
Other pension costs | 19 | 624 | 521 | 494 | ||||||||||||||||||||
Share-based payment expense | 20 | 84 | 57 | 58 | ||||||||||||||||||||
Total staff costs | 5,392 | 5,183 | 4,634 | |||||||||||||||||||||
Own work capitalised | (798 | ) | (813 | ) | (720 | ) | ||||||||||||||||||
Net staff costs | 4,594 | 4,370 | 3,914 | |||||||||||||||||||||
Net indirect labour costsa | 315 | 399 | 304 | |||||||||||||||||||||
Net labour costs | 4,909 | 4,769 | 4,218 | |||||||||||||||||||||
Payments to telecommunications operators | 2,306 | 2,653 | 2,183 | |||||||||||||||||||||
Property and energy costs | 1,285 | 1,202 | 1,024 | |||||||||||||||||||||
Network operating and IT costs | 963 | 983 | 644 | |||||||||||||||||||||
TV programme rights charges | 763 | 714 | 544 | |||||||||||||||||||||
Other operating costs | 6,234 | 6,298 | 4,023 | |||||||||||||||||||||
Other operating income | (222 | ) | (185 | ) | (215 | ) | ||||||||||||||||||
Depreciation of property, plant and equipment | ||||||||||||||||||||||||
Owned assets | 12 | 2,381 | 2,382 | 2,000 | ||||||||||||||||||||
Held under finance leases | 12 | 10 | 10 | 10 | ||||||||||||||||||||
Amortisation of intangible assetsb | 11 | 1,123 | 1,118 | 621 | ||||||||||||||||||||
Total operating costs before specific items | 19,752 | 19,944 | 15,052 | |||||||||||||||||||||
Specific items | 8 | 587 | 948 | 345 | ||||||||||||||||||||
Total operating costs | 20,339 | 20,892 | 15,397 | |||||||||||||||||||||
Operating costs before specific items include the following: | ||||||||||||||||||||||||
Leaver costsc | 50 | 86 | 109 | |||||||||||||||||||||
Research and development expenditured | 632 | 638 | 574 | |||||||||||||||||||||
Operating lease charges | 732 | 692 | 441 | |||||||||||||||||||||
Foreign currency gains | – | (12 | ) | (1 | ) | |||||||||||||||||||
Government grants | (3 | ) | (5 | ) | (6 | ) | ||||||||||||||||||
| a | Net of capitalised indirect labour costs of £612m (2016/17: £463m, 2015/16: £430m). |
| b | Excludes £nil (2016/17: £62m, 2015/16: £nil) of amortisation presented as specific items which relate to a write off of software costs as a result of the integration of EE. Refer to note 8. |
| c | Leaver costs are included within wages and salaries, except for leaver costs of £168m (2016/17: £37m, 2015/16: £nil) associated with restructuring and EE integration costs, which have been recorded as specific items. |
| d | Research and development expenditure reported in the income statement, includes amortisation of £573m (2016/17: £577m, 2015/16: £501m) in respect of internally developed computer software and operating expenses of £59m (2016/17: £61m, 2015/16: £73m). In addition, the group capitalised software development costs of £450m (2016/17: £457m, 2015/16: £399m). |
| 122 | British Telecommunications plc Annual Report & Form 20-F 2018 | |||||
Table of Contents
| THE STRATEGIC REPORT | GOVERNANCE | FINANCIAL STATEMENTS | ADDITIONAL INFORMATION | |||||||||
|
|
| ||||||||||
Why is the treatment of our subscriber acquisition and retention costs a critical judgement?
Subscriber acquisition and retention costs are recognised as an expense within other operating costs for the period in which they are incurred. If subscriber acquisition and retention costs are paid in advance they are recognised as prepayments provided the amounts are able to be measured reliably and are expected to be recoverable. In some cases, contractual clauses with retailers provide for profit-sharing based on the recognised and paid revenue. In these cases we recognise an expense when the revenue is earned from the customer and a corresponding liability to pay that retailer. In some cases we need to exercise judgement in assessing whether we have an upfront obligation based on the contractual terms.
Who are our key management personnel and how are they compensated?
Key management personnel comprise executive and non-executive directors and members of the BT Group plc Executive Committeeas well as the directors of the company. It is the BT Group plc Executive Committee which has responsibility for planning, directing and controlling the activities of the group.
Compensation of key management personnel is shown in the table below:
| Year ended 31 March | 2018 £m | 2017 £m | 2016 £m | |||||||||
Short-term employee benefits | 12.4 | 10.9 | 10.3 | |||||||||
Post employment benefits | 1.4 | 1.4 | 1.2 | |||||||||
Share-based payments | 6.6 | 5.8 | 5.9 | |||||||||
Termination benefits | 2.2 | – | 0.6 | |||||||||
| 22.6 | 18.1 | 18.0 | ||||||||||
Information concerning directors’ remuneration, pension entitlements and long-term incentive plans is shown in note 27.
| 2018 | 2017 | 2016 | ||||||||||||||||||||||||||||||
| Number of employees in the groupa | Year end 000 | Average 000 | Year end 000 | Average 000 | Year end 000 | Average 000 | ||||||||||||||||||||||||||
UK | 82.2 | 82.5 | 82.8 | 82.2 | 81.4 | 71.8 | ||||||||||||||||||||||||||
Non-UK | 23.6 | 23.7 | 23.6 | 22.8 | 21.1 | 19.2 | ||||||||||||||||||||||||||
Total employees | 105.8 | 106.2 | 106.4 | 105.0 | 102.5 | 91.0 | ||||||||||||||||||||||||||
| 2018 | 2017 | 2016 | ||||||||||||||||||||||||||||||
| Number of employees in the groupa | Year end 000 | Average 000 | Year end 000 | Average 000 | Year end 000 | Average 000 | ||||||||||||||||||||||||||
BT Consumer | 8.8 | 8.8 | 8.7 | 7.7 | 6.7 | 6.3 | ||||||||||||||||||||||||||
EE | 9.4 | 9.2 | 9.2 | 9.1 | 9.0 | 1.3 | ||||||||||||||||||||||||||
Business and Public Sector | 10.1 | 10.3 | 10.3 | 10.2 | 10.3 | 9.3 | ||||||||||||||||||||||||||
Global Services | 16.9 | 17.3 | 17.5 | 17.4 | 16.8 | 16.5 | ||||||||||||||||||||||||||
Wholesale and Ventures | 3.8 | 3.9 | 3.8 | 3.7 | 3.7 | 3.8 | ||||||||||||||||||||||||||
Openreach | 30.5 | 30.4 | 30.2 | 30.9 | 31.5 | 32.1 | ||||||||||||||||||||||||||
Other | 26.3 | 26.3 | 26.7 | 26.0 | 24.5 | 21.7 | ||||||||||||||||||||||||||
Total employees | 105.8 | 106.2 | 106.4 | 105.0 | 102.5 | 91.0 | ||||||||||||||||||||||||||
| a | These reflect the full-time equivalent of full and part-time employees. |
| British Telecommunications plc Annual Report & Form 20-F 2018 | 123 | |||||
Table of Contents
Notes to the consolidated financial statements continued
7. Audit, audit related and other non-audit services
The following fees were paid or are payable to the company’s auditors, PricewaterhouseCoopers LLP and other firms in the PricewaterhouseCoopers network.
| Year ended 31 March | 2018 £000 | 2017 £000 | 2016 £000 | |||||||||
Fees payable to the company’s auditors and its associates for: | ||||||||||||
Audit servicesa | ||||||||||||
The audit of the parent company and the consolidated financial statements | 5,372 | 4,271 | 3,871 | |||||||||
The audit of the company’s subsidiaries | 5,866 | 5,664 | 5,073 | |||||||||
| 11,238 | 9,935 | 8,944 | ||||||||||
Audit related assurance servicesb | 1,631 | 1,865 | 2,210 | |||||||||
Other non-audit services | ||||||||||||
Taxation compliance servicesc | – | 366 | 412 | |||||||||
Taxation advisory servicesd | – | 111 | 156 | |||||||||
All other assurance servicese | 211 | 200 | 1,611 | |||||||||
All other servicesf | 592 | 2,332 | 1,665 | |||||||||
| 803 | 3,009 | 3,844 | ||||||||||
Total services | 13,672 | 14,809 | 14,998 | |||||||||
| a | Services in relation to the audit of the parent company and the consolidated financial statements, including fees for reports under section 404 of the Sarbanes-Oxley Act. This also includes fees payable for the statutory audits of the financial statements of subsidiary companies. |
| b | Services in relation to other statutory filings or engagements that are required by law or regulation to be carried out by an appointed auditor. This includes fees for the review of interim results, the audit of the group’s regulatory financial statements and reporting associated with the group’s US debt shelf registration. |
| c | Services relating to tax returns, tax audits, monitoring and enquiries. |
| d | Fees payable for all taxation advisory services not falling within taxation compliance. |
| e | All other assurance services include fees payable to PricewaterhouseCoopers LLP as Reporting Accountants in 2015/16 in relation to the Listing Prospectus, which was issued on 26 January 2016 for the issue of new shares. |
| f | Fees payable for all non-audit services not covered above, principally comprising other advisory services. |
The BT Pension Scheme is an associated pension fund as defined in the Companies (Disclosure of Auditor Remuneration and Liability Limitation Agreements) (Amendment) Regulations 2011. In the year ended 31 March 2018 PricewaterhouseCoopers LLP received total fees from the BT Pension Scheme of £2.1m (2016/17: £2.1m, 2015/16: £1.7m) in respect of the following services:
| Year ended 31 March | 2018 £000 | 2017 £000 | 2016 £000 | |||||||||
Audit of financial statements of associates | 345 | 251 | 213 | |||||||||
Audit-related assurance services | – | – | 10 | |||||||||
Taxation compliance services | 153 | 210 | 198 | |||||||||
Taxation advisory services | 1,074 | 493 | 681 | |||||||||
Other non-audit services | 565 | 1,168 | 603 | |||||||||
Total services | 2,137 | 2,122 | 1,705 | |||||||||
| 124 | British Telecommunications plc Annual Report & Form 20-F 2018 | |||||
Table of Contents
| THE STRATEGIC REPORT | GOVERNANCE | FINANCIAL STATEMENTS | ADDITIONAL INFORMATION | |||||||||
|
|
| ||||||||||
| Year ended 31 March | 2018 £m | 2017 £m | 2016 £m | |||||||||
Revenue | ||||||||||||
Italian business investigation | – | 22 | – | |||||||||
Regulatory matters | 23 | (2 | ) | (203 | ) | |||||||
EE fair value adjustment | – | – | 70 | |||||||||
| 23 | 20 | (133 | ) | |||||||||
Operating costs | ||||||||||||
EE acquisition warranty claims | 225 | – | – | |||||||||
Restructuring charges | 241 | – | – | |||||||||
EE acquisition and integration costs | 46 | 215 | 113 | |||||||||
Property rationalisation costs | 28 | – | 29 | |||||||||
Regulatory matters | 26 | 481 | 203 | |||||||||
Italian business investigation | 22 | 238 | – | |||||||||
Out of period irrecoverable VAT | – | 30 | – | |||||||||
Profit on disposal of businesses | (1 | ) | (16 | ) | – | |||||||
| 587 | 948 | 345 | ||||||||||
Operating loss | 610 | 968 | 212 | |||||||||
Net finance expense | ||||||||||||
Interest expense on retirement benefit obligation | 218 | 209 | 221 | |||||||||
EE related finance cost | – | – | 8 | |||||||||
Interest on out of period irrecoverable VAT | – | 1 | – | |||||||||
| 218 | 210 | 229 | ||||||||||
Net specific items charge before tax | 828 | 1,178 | 441 | |||||||||
Taxation | ||||||||||||
Tax credit on specific items above | (87 | ) | (154 | ) | (70 | ) | ||||||
Tax credit on re-measurement of deferred tax | – | (63 | ) | (96 | ) | |||||||
| (87 | ) | (217 | ) | (166 | ) | |||||||
Net specific items charge after tax | 741 | 961 | 275 | |||||||||
EE acquisition warranty claims
In the year we reached settlements with Deutsche Telekom and Orange in respect of any warranty claims under the 2015 EE acquisition agreement, arising from the issues previously announced regarding our operations in Italy. This represents a full and final settlement of these issues and resulted in a specific item charge of £225m (2016/17: £nil, 2015/16: £nil).
Restructuring charges
During the year we’ve incurred restructuring charges of £241m (2016/17: £nil, 2015/16: £nil), primarily relating to leaver costs. These costs reflect projects within the first phase of our group-wide cost transformation programme (which was announced in May 2017 and is expected to total £300m). Further associated charges relating to the first phase will be recognised in 2018/19 as part of our wider restructuring activity. See note 30 for further details.
EE acquisition and integration costs
We incurred £46m (2016/17: £215m, 2015/16: £113m) of acquisition and integration related costs for EE. Integration costs include EE related restructuring and leaver costs in the year. In 2016/17, this included a £62m (2015/16: £nil) amortisation charge relating to the write-off of IT assets as we integrated the EE and BT IT infrastructure.
Property rationalisation costs
We have recognised a charge of £28m (2016/17: £nil, 2015/16: £29m) relating to the rationalisation of the group’s property portfolio.
| British Telecommunications plc Annual Report & Form 20-F 2018 | 125 | |||||
Table of Contents
Notes to the consolidated financial statements continued
Regulatory matters
We’ve recognised a net charge of £49m (2016/17: £479m, 2015/16: £nil) in relation to regulatory matters in the year. Of this, £23m is recognised in revenue and £26m in operating costs, these are made up of the following:
Deemed Consent
In 2016/17 a charge of £342m was recognised (2015/16: £nil) in relation to Ofcom’s March 2017 findings of its investigation into our historical practices on Deemed Consent by Openreach. This included a fine of £42m. We have agreed the majority of compensation payments to other Communications Providers in the year and continue to estimate the total compensation payments will amount to £300m.
Ladder pricing agreements
In 2016/17 we recognised revenue and costs of £8m (2015/16: £203m) being the prior year impacts of ladder pricing agreements with the other UK mobile operators following a Supreme Court judgment in July 2014.
Other regulatory matters
We re-assessed our regulatory risk provision in light of recent regulatory decisions by Ofcom. As a result we have increased our net charge by £49m (2016/17: £137m) for the year. £51m is recognised in provisions offset by a release of £2m in trade and other payables.
Italian business investigation
In 2017/18, we have incurred professional costs relating to the investigation of our Italian business of £22m (2016/17: £15m).
As part of the investigation into our Italian business in 2016/17, we reviewed the carrying value of the assets and liabilities on the balance sheet of our Italian business including reassessing the recoverability of trade and other receivables and reconsidering other exposures, principally tax penalties. We took into account any changes in facts or circumstances since 31 March 2016 in determining whether there was a need to change an estimate and whether additional exposures had arisen. In the prior year we recognised a charge of £245m in relation to this as well as fees in relation to the investigation of £15m.
During 2017/18 we have reassessed the prior year judgements and estimates we made as a result of the investigation into our Italian business. We concluded that the total adjustments recorded in 2016/17, either as part of the prior year revision or as a specific item, remain appropriate and thus no further adjustment is required. We identified offsetting movements in individual balance sheet line items which were not material either individually or in aggregate. These movements have been adjusted in the 2017/18 balance sheet.
Profit on disposal of businesses
During the year we disposed of non-core businesses with a gain on disposal of £1m (2016/17: £16m, 2015/16: £nil).
EE fair value adjustment
In 2015/16 we recognised a fair value adjustment on the acquisition of EE which reduced the amount of deferred income in relation to its prepaid subscriber base by £70m with no cash impact. The step down reflects the difference between the amount recorded by EE on acquisition and the fair value calculated based on the incremental cost that a market participant would incur to take on the liability plus a reasonable profit margin. This amount was released as a reduction to revenue in the period between acquisition and 31 March 2016, reflecting the period over which EE provided the related service.
Out of period irrecoverable VAT
In 2016/17, we recorded a charge of £30m for out of period irrecoverable VAT. We also recorded a further £1m related interest charge.
Interest expense on retirement benefit obligation
See note 19 for more details.
Tax credit on re-measurement of deferred tax
See note 9 for more details.
| 126 | British Telecommunications plc Annual Report & Form 20-F 2018 | |||||
Table of Contents
| THE STRATEGIC REPORT | GOVERNANCE | FINANCIAL STATEMENTS | ADDITIONAL INFORMATION | |||||||||
|
|
| ||||||||||
Current and deferred income tax
What critical judgements and estimates do we make in accounting for taxation?
We seek to pay tax in accordance with the laws of the countries where we do business. However, in some areas these laws are unclear, and it can take many years to agree an outcome with a tax authority or through litigation. We estimate our tax on country-by-country and issue-by-issue bases. Our key uncertainties are whether EE’s tax losses will be available to us, whether our intra-group trading model will be accepted by a particular tax authority and whether intra-group payments are subject to withholding taxes. We provide for the most likely outcome where an outflow is probable, but the agreed amount can differ materially from our estimates. Approximately 80% by value of the provisions are under active tax authority examination and are therefore likely to be re-estimated or resolved in the coming 12 months. £240m (2016/17: £281m) is included in current tax liabilities in relation to these uncertainties.
Under a downside case an additional amount of £471m could be required, of which £382m would relate to EE losses. This amount is not provided as we don’t consider this outcome to be probable.
Deciding whether to recognise deferred tax assets is judgemental. We only recognise them when we consider it is probable that they can be recovered. In making this judgement we consider evidence such as historical financial performance, future financial plans and trends, the duration of existing customer contracts and whether our intra-group pricing model has been agreed by the relevant tax authority.
The value of the group’s income tax assets and liabilities is disclosed on theGroup balance sheeton page 108. The value of the group’s deferred tax assets and liabilities, including the deferred tax asset recognised in respect of EE Limited’s historical tax losses, is disclosed below.
Analysis of our taxation expense for the year
| Year ended 31 March | 2018 £m | 2017 £m | 2016 £m | |||||||||
United Kingdom | ||||||||||||
Corporation tax at 19% (2016/17: 20%, 2015/16: 20%) | (614 | ) | (594 | ) | (684 | ) | ||||||
Adjustments in respect of earlier years | 37 | 33 | 59 | |||||||||
Non-UK taxation | ||||||||||||
Current | (66 | ) | (109 | ) | (80 | ) | ||||||
Adjustments in respect of earlier years | 23 | – | 29 | |||||||||
Total current tax expense | (620 | ) | (670 | ) | (676 | ) | ||||||
Deferred taxation | ||||||||||||
Origination and reversal of temporary differences | 46 | 96 | 70 | |||||||||
Adjustments in respect of earlier years | (57 | ) | 26 | 2 | ||||||||
Impact of change in UK corporation tax rate to 17% (2016/17: 17%, 2015/16: 19%) | – | 63 | 96 | |||||||||
Remeasurement of temporary differences | 11 | – | – | |||||||||
Total deferred taxation credit | – | 185 | 168 | |||||||||
Total taxation expense | (620 | ) | (485 | ) | (508 | ) | ||||||
Factors affecting our taxation expense for the year
The taxation expense on the profit for the year differs from the amount computed by applying the UK corporation tax rate to the profit before taxation as a result of the following factors:
| Year ended 31 March | 2018 £m | 2017 £m | 2016 £m | |||||||||
Profit before taxation | 2,804 | 2,551 | 3,241 | |||||||||
Expected taxation expense at UK rate of 19% (2016/17: 20%, 2015/16: 20%) | (533 | ) | (510 | ) | (648 | ) | ||||||
Effects of: | ||||||||||||
(Higher) lower taxes on non-UK profits | (8 | ) | (29 | ) | 4 | |||||||
Net permanent differences between tax and accountinga | (100 | ) | (183 | ) | (12 | ) | ||||||
Adjustments in respect of earlier yearsb | 3 | 59 | 90 | |||||||||
Prior year non-UK losses used against current year profits | 16 | 120 | 9 | |||||||||
Non-UK losses not recognisedc | (9 | ) | (8 | ) | (34 | ) | ||||||
Other deferred tax assets not recognised | – | – | 6 | |||||||||
Lower taxes on profit on disposal of business | – | 3 | – | |||||||||
Re-measurement of deferred tax balances | 11 | 63 | 96 | |||||||||
Other non-recurring items | – | – | (19 | ) | ||||||||
Total taxation expense | (620 | ) | (485 | ) | (508 | ) | ||||||
Exclude specific items (note 8) | (87 | ) | (217 | ) | (166 | ) | ||||||
Total taxation expense before specific items | (707 | ) | (702 | ) | (674 | ) | ||||||
| a | Includes income that is not taxable or UK income taxable at a different rate, and expenses for which no tax relief is received. Examples include some types of depreciation and amortisation and the benefit of R&D tax incentives. |
| b | Reflects the differences between initial accounting estimates and tax returns submitted to tax authorities, including the release and establishment of provisions for uncertain tax positions. |
| c | Reflects losses made in countries where it has not been considered appropriate to recognise a deferred tax asset, as future taxable profits are not probable. |
| British Telecommunications plc Annual Report & Form 20-F 2018 | 127 | |||||
Table of Contents
Notes to the consolidated financial statements continued
Tax components of other comprehensive income
| Year ended 31 March | 2018 Tax credit (expense) £m | 2017 Tax credit (expense) £m | 2016 Tax credit (expense) £m | |||||||||
Tax on items that will not be reclassified to the income statement | ||||||||||||
Pension remeasurements | (346 | ) | 416 | (240 | ) | |||||||
Tax on items that have been or may be reclassified subsequently to the income statement | ||||||||||||
Exchange differences on translation of foreign operations | (9 | ) | 21 | 38 | ||||||||
Fair value movements on cash flow hedges | ||||||||||||
– net fair value gains or losses | 57 | (131 | ) | (72 | ) | |||||||
– recognised in income and expense | (47 | ) | 139 | 39 | ||||||||
| (345 | ) | 445 | (235 | ) | ||||||||
Current tax credita | 203 | 122 | 231 | |||||||||
Deferred tax (expense) credit | (548 | ) | 323 | (466 | ) | |||||||
| (345 | ) | 445 | (235 | ) | ||||||||
| a | Includes £212m (2016/17: £110m, 2015/16: £217m) relating to cash contributions made to reduce retirement benefit obligations. |
Tax (expense) credit recognised directly in equity
| Year ended 31 March | 2018 £m | 2017 £m | 2016 £m | |||||||||
Tax (expense) credit relating to share-based payments | (2 | ) | (6 | ) | 12 | |||||||
Deferred taxation
| | Fixed asset temporary differences £m | | | Retirement benefit obligations £m | a
| | Share- based payments | | | Tax losses £m | | | Other £m | | | Jurisdictional offset £m |
| | Total £m |
| ||||||||
At 1 April 2016 | 1,618 | (1,149 | ) | (54 | ) | (325 | ) | (75 | ) | – | 15 | |||||||||||||||||
(Credit) expense recognised in the income statement | (181 | ) | (82 | ) | 14 | 65 | (1 | ) | – | (185 | ) | |||||||||||||||||
(Credit) expense recognised in other comprehensive income | (5 | ) | (306 | ) | – | (3 | ) | (9 | ) | – | (323 | ) | ||||||||||||||||
Expense recognised in equity | – | – | 23 | – | – | – | 23 | |||||||||||||||||||||
Exchange differences | – | – | – | (7 | ) | – | – | (7 | ) | |||||||||||||||||||
At 31 March 2017 | 1,432 | (1,537 | ) | (17 | ) | (270 | ) | (85 | ) | – | (477 | ) | ||||||||||||||||
Non-current | ||||||||||||||||||||||||||||
Deferred tax asset | (117 | ) | (1,537 | ) | (17 | ) | (270 | ) | (96 | ) | 320 | (1,717 | ) | |||||||||||||||
Deferred tax liability | 1,549 | – | – | – | 11 | (320 | ) | 1,240 | ||||||||||||||||||||
At 1 April 2017 | 1,432 | (1,537 | ) | (17 | ) | (270 | ) | (85 | ) | – | (477 | ) | ||||||||||||||||
Expense (credit) recognised in the income statement | 11 | (104 | ) | 4 | 89 | – | – | – | ||||||||||||||||||||
Expense (credit) recognised in other comprehensive income | – | 558 | – | – | (10 | ) | – | 548 | ||||||||||||||||||||
Expense recognised in equity | – | – | 6 | – | – | – | 6 | |||||||||||||||||||||
Exchange differences | – | – | – | (2 | ) | 5 | – | 3 | ||||||||||||||||||||
Transfer to current tax | 17 | – | – | – | – | – | 17 | |||||||||||||||||||||
At 31 March 2018 | 1,460 | (1,083 | ) | (7 | ) | (183 | ) | (90 | ) | – | 97 | |||||||||||||||||
Non-current | ||||||||||||||||||||||||||||
Deferred tax asset | (41 | ) | (1,083 | ) | (7 | ) | (183 | ) | (90 | ) | 161 | (1,243 | ) | |||||||||||||||
Deferred tax liability | 1,501 | – | – | – | – | (161 | ) | 1,340 | ||||||||||||||||||||
At 31 March 2018 | 1,460 | (1,083 | ) | (7 | ) | (183 | ) | (90 | ) | – | 97 | |||||||||||||||||
| a | Includes a deferred tax asset of £2m (2016/17: £2m) arising on contributions payable to defined contribution pension plans. |
The majority of the deferred tax assets and liabilities noted above are anticipated to be realised after more than 12 months.
| 128 | British Telecommunications plc Annual Report & Form 20-F 2018 | |||||
Table of Contents
| THE STRATEGIC REPORT | GOVERNANCE | FINANCIAL STATEMENTS | ADDITIONAL INFORMATION | |||||||||
|
|
| ||||||||||
We’ve recognised a deferred tax asset at 31 March 2018 of £92m in respect of EE Limited’s historical tax losses. We expect to be able to utilise these against future taxable profits in EE Limited. If EE Limited’s business had been subject to a major change in the nature or conduct of trade on or before 5 February 2018, these losses would have been forfeited and a current tax liability of £382m would have been created. We do not consider it probable that major change arose.
Deferred tax balances for which there is a right of offset within the same jurisdiction are presented net on the face of the group balance sheet as permitted by IAS 12, with the exception of deferred tax related to our pension schemes which is disclosed within deferred tax assets.
What factors affect our future tax charges?
The rate of UK corporation tax will change from 19% to 17% on 1 April 2020. As deferred tax assets and liabilities are measured at the rates that are expected to apply in the periods of the reversal, deferred tax balances at 31 March 2018 have been calculated at the rate at which the relevant balance is expected to be recovered or settled. The impact of the reduction in rate was recognised as a deferred tax credit specific item of £63m in the 2016/17 income statement and as a deferred tax expense in reserves.
What are our unrecognised tax losses and other temporary differences?
At 31 March 2018 we had operating losses and other temporary differences carried forward in respect of which no deferred tax assets were recognised amounting to £4.1bn (2016/17: £4.4bn). Our other temporary differences have no expiry date restrictions. The expiry date of operating losses carried forward is dependent upon the tax law of the various territories in which the losses arose. A summary of expiry dates for losses in respect of which restrictions apply is set out below:
| At 31 March 2018 | £m | Expiry | ||||||
Restricted losses | ||||||||
Europe | 14 | 2019–2027 | ||||||
Americas | 204 | 2019-2037 | ||||||
Other | 2 | 2019–2027 | ||||||
Total restricted losses | 220 | |||||||
Unrestricted operating losses | 3,784 | No expiry | ||||||
Other temporary differences | 77 | No expiry | ||||||
Total | 4,081 | |||||||
At 31 March 2018 we had UK capital losses carried forward in respect of which no deferred tax assets were recognised amounting to £16.9bn (2016/17: £17.0bn). These losses have no expiry date, but we consider the future utilisation of these losses to be remote.
At 31 March 2018 the undistributed earnings of non-UK subsidiaries were £2.4bn (2016/17: £3.5bn). No deferred tax liabilities have been recognised in respect of these unremitted earnings because the group is in a position to control the timing of any dividends from subsidiaries and hence any tax consequences that may arise. Under current tax rules, tax of £23.0m (2016/17: £26.2m) would arise if these earnings were to be repatriated to the UK. On 29 March 2017, the UK Government notified the EU of its intention to withdraw membership from the EU. Depending on the outcome of negotiations we could cease to benefit from the EU Parent Subsidiary directive on dividends paid by our EU subsidiaries. In this event, additional tax of up to £23.9m could arise if the undistributed earnings of EU subsidiaries of £940m were to be repatriated to the UK.
What dividends have been paid and proposed for the year?
No dividend was paid to the parent company, BT Group Investments Limited, during 2017/18 (2016/17: £2,350m, 2015/16: £1,450m).
Subsequent to 31 March 2018 the directors have declared a final dividend of £2,500m payable in 2018/19 (2016/17: £nil, 2015/16: £2,350m).
| British Telecommunications plc Annual Report & Form 20-F 2018 | 129 | |||||
Table of Contents
Notes to the consolidated financial statements continued
| Goodwill £m | Customer relationships and brands £m | Telecoms licences and other £m | Internally developed software £m | Purchased software £m | Total £m | |||||||||||||||||||
Cost | ||||||||||||||||||||||||
At 1 April 2016 | 7,915 | 3,401 | 2,930 | 4,073 | 1,610 | 19,929 | ||||||||||||||||||
Acquisitions | 5 | – | – | – | – | 5 | ||||||||||||||||||
Additions | – | – | – | 483 | 138 | 621 | ||||||||||||||||||
Disposals and adjustmentsa | (23 | ) | – | – | (131 | ) | 2 | (152 | ) | |||||||||||||||
Transfers | – | – | – | (66 | ) | 62 | (4 | ) | ||||||||||||||||
Exchange differences | 145 | 21 | 15 | 4 | 41 | 226 | ||||||||||||||||||
At 31 March 2017 | 8,042 | 3,422 | 2,945 | 4,363 | 1,853 | 20,625 | ||||||||||||||||||
Additions | – | – | – | 517 | 125 | 642 | ||||||||||||||||||
Acquisitions | 14 | – | 3 | – | – | 17 | ||||||||||||||||||
Disposals and adjustmentsa | (3 | ) | – | (3 | ) | (55 | ) | (413 | ) | (474 | ) | |||||||||||||
Exchange differences | (100 | ) | (12 | ) | 6 | (3 | ) | 9 | (100 | ) | ||||||||||||||
At 31 March 2018 | 7,953 | 3,410 | 2,951 | 4,822 | 1,574 | 20,710 | ||||||||||||||||||
Accumulated amortisation | ||||||||||||||||||||||||
At 1 April 2016 | – | 418 | 131 | 2,747 | 1,175 | 4,471 | ||||||||||||||||||
Charge for the yearb | – | 383 | 140 | 556 | 101 | 1,180 | ||||||||||||||||||
Disposals and adjustmentsa | – | – | – | (114 | ) | (7 | ) | (121 | ) | |||||||||||||||
Exchange differences | – | 12 | 9 | 4 | 33 | 58 | ||||||||||||||||||
At 31 March 2017 | – | 813 | 280 | 3,193 | 1,302 | 5,588 | ||||||||||||||||||
Charge for the yearb | – | 379 | 141 | 525 | 78 | 1,123 | ||||||||||||||||||
Disposals and adjustmentsa | – | – | (3 | ) | (36 | ) | (426 | ) | (465 | ) | ||||||||||||||
Exchange differences | – | (1 | ) | 3 | (2 | ) | 9 | 9 | ||||||||||||||||
At 31 March 2018 | – | 1,191 | 421 | 3,680 | 963 | 6,255 | ||||||||||||||||||
Carrying amount | ||||||||||||||||||||||||
At 31 March 2018 | 7,953 | 2,219 | 2,530 | 1,142 | 611 | 14,455 | ||||||||||||||||||
At 31 March 2017 | 8,042 | 2,609 | 2,665 | 1,170 | 551 | 15,037 | ||||||||||||||||||
| a | Fully depreciated assets in the group’s fixed asset registers were reviewed during the year, as part of the group’s annual asset verification exercise, and certain assets that were no longer in use have been written off, reducing cost and accumulated depreciation by £0.4bn (2016/17: £nil). |
| b | Includes a £nil (2016/17: £62m ) specific item amortisation charge relating to the write-off of internally developed software as we integrate the EE and BT IT infrastructure. |
Goodwill
Goodwill recognised in a business combination does not generate cash flows independently of other assets or groups of assets. As a result, the recoverable amount, being the value in use, is determined at a cash generating unit (CGU) level.
How do we determine our CGUs?
The determination of our CGUs is judgemental. The identification of CGUs involves an assessment of whether the asset or group of assets generate largely independent cash inflows. This involves consideration of how our core assets are operated and whether these generate independent revenue streams. Our CGUs are deemed to be BT Consumer, EE, Business and Public Sector, Global Services and Wholesale and Ventures which are the same units we report in our segmental reporting.
For impairment purposes goodwill is tested at the lowest level within the entity at which the goodwill is monitored for internal management purposes, and cannot be larger than our operating segments. We test goodwill at the CGU level.
What critical estimates and assumptions have we made?
In 2016/17 we re-allocated goodwill among our CGUs based on the relative fair value of the business transferred to reflect our new customer-facing units structure effective as of 1 April 2016. We estimated the relative fair values on a discounted cash flow basis using the three-year financial plans effective at the time of the re-organisation. The assumptions used were set in the same way as those used in our value in use calculations as set out below.
Our value in use calculations require estimates in relation to uncertain items, including management’s expectations of future revenue growth, operating costs, profit margins, operating cash flows, and the discount rate for each CGU.
| 130 | British Telecommunications plc Annual Report & Form 20-F 2018 | |||||
Table of Contents
| THE STRATEGIC REPORT | GOVERNANCE | FINANCIAL STATEMENTS | ADDITIONAL INFORMATION | |||||||||
|
|
| ||||||||||
Future cash flows used in the value in use calculations are based on our latest BT Group plc Board approved five-year financial plans. Expectations about future growth reflect the expectations of growth in the markets to which the CGU relates. The future cash flows are discounted using a pre-tax discount rate that reflects current market assessments of the time value of money. The discount rate used in each CGU is adjusted for the risk specific to the asset, including the countries in which cash flow will be generated, for which the future cash flow estimates have not been adjusted.
The group is required to test goodwill acquired in a business combination annually for impairment. This was carried out as at 31 January 2018. The carrying value of goodwill and the key assumptions used in performing the annual impairment assessment and sensitivities are disclosed below.
How have we carried out our goodwill impairment review?
We perform an annual goodwill impairment review, based on our CGUs.
These CGUs represent the smallest identifiable groups of assets that generate cash inflows that are largely independent of the cash inflows from other groups of assets, and to which goodwill is allocated. From 1 April 2016, we re-organised our customer-facing units resulting in the change of the CGUs that have associated goodwill. We allocated goodwill to BT Consumer, EE, Business and Public Sector, Global Services and Wholesale and Ventures. Previously no goodwill was allocated to Wholesale and Ventures. In addition to goodwill being allocated to this CGU for the first time, there were changes to the amount allocated to the other CGUs as a result of the re-organisation. Goodwill is allocated to these CGUs as follows:
| Cost | BT Consumer £m | EE £m | Business £m | Global Services £m | Wholesale and Ventures £m | Total £m | ||||||||||||||||||
At 1 April 2016 | 1,183 | 4,917 | 662 | 1,153 | – | 7,915 | ||||||||||||||||||
Re-organisation | – | (2,149 | ) | 1,921 | (709 | ) | 937 | – | ||||||||||||||||
Exchange differences | – | – | 10 | 135 | – | 145 | ||||||||||||||||||
Acquisitions and disposals | – | – | (23 | ) | – | 5 | (18 | ) | ||||||||||||||||
At 31 March 2017 | 1,183 | 2,768 | 2,570 | 579 | 942 | 8,042 | ||||||||||||||||||
Exchange differences | – | – | (8 | ) | (92 | ) | – | (100 | ) | |||||||||||||||
Acquisitions and disposals | – | – | – | 11 | – | 11 | ||||||||||||||||||
At 31 March 2018 | 1,183 | 2,768 | 2,562 | 498 | 942 | 7,953 | ||||||||||||||||||
How do we calculate the recoverable amount?
The value in use of each CGU is determined using cash flow projections derived from financial plans approved by the BT Group plc Board covering a five-year period. They reflect management’s expectations of revenue, EBITDA growth, capital expenditure, working capital and operating cash flows, based on past experience and future expectations of business performance. Cash flows beyond the fifth year have been extrapolated using perpetuity growth rates.
What discount rate have we used?
The pre-tax discount rates applied to the cash flow forecasts are derived from our post-tax weighted average cost of capital. The assumptions used in the calculation of the group’s weighted average cost of capital are benchmarked to externally available data. The pre-tax discount rate used in performing the value in use calculation in 2017/18 was 8.4% (2016/17: 8.6%). We’ve used the same discount rate for all CGUs except Global Services where we have used 8.8% (2016/17: 9.0%) reflecting higher risk in some of the countries in which Global Services operates.
What growth rates have we used?
The perpetuity growth rates are determined based on the forecast market growth rates of the regions in which the CGU operates, and they reflect an assessment of the long-term growth prospects of that market. The growth rates have been benchmarked against external data for the relevant markets. None of the growth rates applied exceed the expected long-term average growth rates for those markets or sectors. The perpetuity growth rate for Global Services was 2.3% (2016/17: 2.4%) and 2.0% (2016/17: 2.0%) for Business and Public Sector, BT Consumer, EE and Wholesale and Ventures.
What sensitivities have we applied?
There is significant headroom in Business and Public Sector, BT Consumer, Wholesale and Ventures and EE. No reasonably possible changes in the key assumptions in isolation would cause the carrying amount of the CGUs to exceed the recoverable amount. For Global Services, the value in use exceeds the carrying value of the CGU by approximately £768m (2016/17: £586m). Any of the following changes in assumptions in isolation would cause the recoverable amount for the CGU to equal its carrying amount:
| – | reduction in the perpetuity growth rate from the 2.3% assumption applied to a revised assumption of a decline of 1.4%. |
| – | an increase in the discount rate from the 8.8% assumption applied to a revised assumption of 11.5%. |
| – | shortfalls in trading performance against forecast resulting in operating cash flows decreasing by 34% each year and in perpetuity. |
| British Telecommunications plc Annual Report & Form 20-F 2018 | 131 | |||||
Table of Contents
Notes to the consolidated financial statements continued
12. Property, plant and equipment
The plant and equipment in our networks is long-lived with cables and switching equipment operating for over ten years and underground ducts being used for decades. We also develop software for use in IT systems and platforms that support the products and services provided to our customers.
The carrying values of software, property, plant and equipment are disclosed below and in note 11. The useful lives applied to the principal categories of assets are disclosed on pages 115 and 116.
| | Land and buildings £m | a | | Network infrastructure £m | a
| | Other £m | b
| | Assets in course of construction £m | | | Total £m | | ||||||
Cost | ||||||||||||||||||||
At 31 March 2016 | 1,278 | 48,194 | 1,870 | 1,108 | 52,450 | |||||||||||||||
Additionsc | 6 | 40 | 128 | 2,672 | 2,846 | |||||||||||||||
Transfers | 14 | 2,393 | (1 | ) | (2,402 | ) | 4 | |||||||||||||
Disposals and adjustmentsd | (45 | ) | (1,637 | ) | (106 | ) | 30 | (1,758 | ) | |||||||||||
Exchange differences | 49 | 382 | 47 | 5 | 483 | |||||||||||||||
At 31 March 2017 | 1,302 | 49,372 | 1,938 | 1,413 | 54,025 | |||||||||||||||
Additionsc | 12 | 193 | 92 | 2,597 | 2,894 | |||||||||||||||
Transfers | 36 | 2,793 | 16 | (2,845 | ) | – | ||||||||||||||
Disposals and adjustmentsd | (82 | ) | (1,540 | ) | (119 | ) | (48 | ) | (1,789 | ) | ||||||||||
Exchange differences | (6 | ) | (35 | ) | (13 | ) | 1 | (53 | ) | |||||||||||
At 31 March 2018 | 1,262 | 50,783 | 1,914 | 1,118 | 55,077 | |||||||||||||||
Accumulated depreciation | ||||||||||||||||||||
At 31 March 2016 | 750 | 34,287 | 1,513 | – | 36,550 | |||||||||||||||
Charge for the year | 64 | 2,224 | 104 | – | 2,392 | |||||||||||||||
Disposals and adjustmentsd | (36 | ) | (1,627 | ) | (104 | ) | – | (1,767 | ) | |||||||||||
Exchange differences | 39 | 330 | 41 | – | 410 | |||||||||||||||
At 31 March 2017 | 817 | 35,214 | 1,554 | – | 37,585 | |||||||||||||||
Charge for the year | 57 | 2,213 | 121 | – | 2,391 | |||||||||||||||
Disposals and adjustmentsd | (96 | ) | (1,613 | ) | (107 | ) | – | (1,816 | ) | |||||||||||
Exchange differences | (5 | ) | (24 | ) | (10 | ) | – | (39 | ) | |||||||||||
At 31 March 2018 | 773 | 35,790 | 1,558 | – | 38,121 | |||||||||||||||
Carrying amount | ||||||||||||||||||||
At 31 March 2018 | 489 | 14,993 | 356 | 1,118 | 16,956 | |||||||||||||||
Engineering stores | – | – | – | 44 | 44 | |||||||||||||||
Total at 31 March 2018 | 489 | 14,993 | 356 | 1,162 | 17,000 | |||||||||||||||
At 31 March 2017 | 485 | 14,158 | 384 | 1,413 | 16,440 | |||||||||||||||
Engineering stores | – | – | – | 58 | 58 | |||||||||||||||
Total at 31 March 2017 | 485 | 14,158 | 384 | 1,471 | 16,498 | |||||||||||||||
| a | The carrying amount of the group’s property, plant and equipment includes an amount of £53m (2016/17: £73m) in respect of assets held under finance leases, comprising land and buildings of £42m (2016/17: £45m) and network infrastructure of £11m (2016/17: £28m). The depreciation expense on those assets in 2017/18 was £10m (2016/17: £10m), comprising land and buildings of £3m (2016/17: £3m) and network infrastructure of £7m (2016/17: £7m). |
| b | Other mainly comprises motor vehicles, computers and fixtures and fittings. |
| c | Net of grant funding of £74m (2016/17: £28m net grant deferral). |
| d | Fully depreciated assets in the group’s fixed asset registers were reviewed during the year, as part of the group’s annual asset verification exercise, and certain assets that were no longer in use have been written off, reducing cost and accumulated depreciation by £1.3bn (2016/17: £1.1bn). |
| At 31 March | 2018 £m | 2017 £m | ||||||
The carrying amount of land and buildings, including leasehold improvements, comprised: | ||||||||
Freehold | 261 | 269 | ||||||
Leasehold | 228 | 216 | ||||||
Total land and buildings | 489 | 485 | ||||||
Network infrastructure
Some of our network assets are jointly controlled by EE Limited with Hutchison 3G UK Limited. These relate to shared 3G network and certain elements of network for 4G rural sites. The net book value of the group’s share of assets controlled by its joint operation MBNL is £526m (2016/17: £591m) and is recorded within network infrastructure. Included within this is £132m (2016/17: £179m), being the group’s share of assets owned by its joint operation MBNL.
Within network infrastructure are assets with a net book value of £8.3bn (2016/17: £8.0bn) which have useful economic lives of more than 18 years.
| 132 | British Telecommunications plc Annual Report & Form 20-F 2018 | |||||
Table of Contents
| THE STRATEGIC REPORT | GOVERNANCE | FINANCIAL STATEMENTS | ADDITIONAL INFORMATION | |||||||||
|
|
| ||||||||||
What estimates and critical judgements have we made in accounting for our BDUK contracts?
The group receives government grants in relation to the BDUK programme and other rural superfast broadband contracts. Where we’ve achieved certain service levels, or delivered the network more efficiently than anticipated, we’ve an obligation to either re-invest or repay grant funding. Where this is the case, we assess and defer the income with a corresponding increase in capital expenditure. Assessing the timing of whether and when we change the estimated take-up assumption is judgemental as it involves considering information which is not always observable. Our consideration on whether and when to change the base case assumption is dependent on our expectation of the long term take-up trend.
Our assessment of how much grant income to defer includes consideration of the difference between the take-up percentage agreed with the local authority and the likelihood of actual take-up. The value of the government grants deferred is disclosed in note 17.
In the current year we had a net grant funding of £74m (2016/17: £28m net grant deferral) mainly related to our activity on the BDUK programme. Our base case assumption for take-up in BDUK areas has been increased to 41% (2016/17: 39%) following our review of the level of customer take-up. Based on the current build, a change in the take-up assumption of 4% would result in approximately a £50m movement in the amount deferred. To date we have a grant funding liability of £536m (2016/17: £446m).
All business combinations are accounted for using the acquisition method regardless of whether equity instruments or other assets are acquired. We didn’t make any material acquisitions in the year ended 31 March 2018 (2016/17: no material acquisitions). The acquisition of EE was completed in 2015/16 with the provisional acquisition accounting at 31 March 2016 and the final acquisition accounting was reflected during 2016/17.
Total £m | ||||
At 1 April 2016 | 225 | |||
Additions | 753 | |||
Amortisation | (714 | ) | ||
At 1 April 2017 | 264 | |||
Additions | 771 | |||
Amortisation | (763 | ) | ||
At 31 March 2018 | 272 | |||
Additions reflect TV programme rights for which the legally enforceable licence period has started during the year. Payments made for programme rights for which the legally enforceable licence period has not yet started are included within prepayments (see note 16).
TV programme rights commitments are disclosed in note 29.
| At 31 March | 2018 £m | 2017 £m | 2016 £m | |||||||||
Consumables | 22 | 24 | 26 | |||||||||
Work in progress | 6 | 23 | 11 | |||||||||
Finished goods | 211 | 180 | 152 | |||||||||
| 239 | 227 | 189 | ||||||||||
Inventories recognised as an expense during the year ended 31 March 2018 amounted to £2,588m (2016/17: £2,680m). These were included in ‘Operating costs’ in our income statement.
16. Trade and other receivables
We’ve made various judgements in accounting for trade and other receivables. These include long-term contracts and bad debt provisions.
Long-term customer contracts
Long-term customer contracts can extend over a number of financial years. During the contractual period recognition of costs and profits may be impacted by judgements and estimates made.
| British Telecommunications plc Annual Report & Form 20-F 2018 | 133 | |||||
Table of Contents
Notes to the consolidated financial statements continued
What critical estimates and assumptions have we made?
Estimates are required in assessing the lifetime profitability of a contract when determining whether we have an onerous contract liability. Where we have an onerous contract liability this would be classified in provisions and include an impairment of any receivables relating to these contracts.
The level of uncertainty in the estimates and assumptions supporting expected future revenues and costs can vary with the complexity of each contract and with the form of service delivery.
We’ve exercised judgement in assessing when the transition or transformation phase of a contract ends. This influences the timing of recognition of revenue and costs which are deferred until the transition or transformation phase ends unless these elements of a contract have standalone value.
How do we estimate and recognise contract losses?
We estimate and recognise immediately the entire estimated loss for a contract when we have evidence that the contract is unprofitable. Also if these estimates indicate that any contract will be less profitable than previously forecast, contract assets may have to be written down to the extent they are no longer considered to be fully recoverable. We perform ongoing profitability reviews of our contracts in order to determine whether the latest estimates are appropriate. Key factors reviewed include:
| – | Transaction volumes or other inputs affecting future revenues which can vary depending on customer requirements, plans, market position and other factors such as general economic conditions. |
| – | Our ability to achieve key contract milestones connected with the transition, development, transformation and deployment phases for customer contracts. |
| – | The status of commercial relations with customers and the implication for future revenue and cost projections. |
| – | Our estimates of future staff and third-party costs and the degree to which cost savings and efficiencies are deliverable. |
The carrying value of assets comprising the costs of the initial set-up, transition or transformation phase of long-term networked IT services contracts is disclosed below.
| At 31 March | 2018 £m | 2017 £m | 2016 £m | |||||||||
Non-current | ||||||||||||
Other assetsa | 317 | 360 | 218 | |||||||||
| a | Other assets includes costs relating to the initial set-up, transition or transformation phase of long-term networked IT services contracts of £145m (2016/17: £163m, 2015/16: £111m), and prepayments and leasing debtors of £172m (2016/17: £197m, 2015/16: £107m). |
| At 31 March | 2018 £m | 2017 £m | 2016 £m | |||||||||
Current | ||||||||||||
Trade receivables | 1,741 | 1,774 | 1,803 | |||||||||
Amounts owed by ultimate parent company | 15 | 25 | 9 | |||||||||
Prepaymentsa | 1,103 | 733 | 702 | |||||||||
Accrued income | 777 | 955 | 1,072 | |||||||||
Other receivablesb | 393 | 373 | 401 | |||||||||
| 4,029 | 3,860 | 3,987 | ||||||||||
| a | Prepayments includes £325m (2016/17: £nil, 2015/16: £nil) in respect of the acquisition of spectrum in April 2018. The spectrum auction bidding cut across the 2017/18 and 2018/19 financial years. Whilst £325m was on deposit with Ofcom at 31 March 2018, we went on to win spectrum for a total price of £304m and the excess deposit balance has since been refunded. This will be transferred to intangible assets in 2018/19. |
| b | Other receivables includes assets held for sale of £nil (2016/17: £22m, 2015/16: £nil). |
Trade receivables are stated after deducting allowances for doubtful debts, as follows:
2018 £m | 2017 £m | 2016 £m | ||||||||||
At 1 April | 303 | 195 | 196 | |||||||||
Expense | 129 | 211 | 77 | |||||||||
Utilised | (61 | ) | (114 | ) | (89 | ) | ||||||
Exchange differences | 4 | 11 | 11 | |||||||||
At 31 March | 375 | 303 | 195 | |||||||||
Included within the 2016/17 expense above are amounts for exposures relating to the Italian business investigation, as set out in note 8.
| 134 | British Telecommunications plc Annual Report & Form 20-F 2018 | |||||
Table of Contents
| THE STRATEGIC REPORT | GOVERNANCE | FINANCIAL STATEMENTS | ADDITIONAL INFORMATION | |||||||||
|
|
| ||||||||||
How do we assess recoverability of our receivables?
We provide services to consumer and business customers, mainly on credit terms. We know that certain debts due to us will not be paid through the default of a small number of our customers. Judgements are required in assessing the recoverability of trade receivables and whether a provision for doubtful debts may be required.
In estimating a provision for doubtful debts we consider historical experience alongside other factors such as the current state of the economy and particular industry issues. The value of the provision for doubtful debts is disclosed above.
Trade receivables are continuously monitored and allowances applied against trade receivables consist of both specific impairments and collective impairments based on our historical loss experiences for the relevant aged category as well as taking into account general economic conditions. Historical loss experience allowances are calculated by a customer-facing unit in order to reflect the specific nature of the customers relevant to that customer-facing unit.
Trade and other receivables are classified as loans and receivables and are held at amortised cost. The carrying amount of these balances approximates to fair value due to the short maturity of amounts receivable.
Note 25 provides further disclosure regarding the credit quality of our gross trade receivables. Trade receivables are due as follows:
| Past due and not specifically impaired | ||||||||||||||||||||||||||||
| At 31 March | Not past due £m | Trade receivables specifically impaired net of provision £m | Between 0 and 3 months £m | Between 3 and 6 months £m | Between 6 and 12 months £m | Over 12 months £m | Total £m | |||||||||||||||||||||
2018 | 1,251 | 61 | 293 | 44 | 25 | 67 | 1,741 | |||||||||||||||||||||
2017 | 1,184 | 146 | 292 | 17 | 41 | 94 | 1,774 | |||||||||||||||||||||
2016 | 1,152 | 98 | 368 | 51 | 44 | 90 | 1,803 | |||||||||||||||||||||
Gross trade receivables which have been specifically impaired amounted to £124m (2016/17: £238m, 2015/16: £192m).
Trade receivables not past due and accrued income are analysed below by customer-facing unit.
| Trade receivables not past due | Accrued income | |||||||||||||||||||||||||||
| At 31 March | 2018 £m | 2017 £m | 2016 £m | 2018 £m | 2017 £m | 2016 £m | ||||||||||||||||||||||
BT Consumer | 157 | 128 | 138 | 86 | 90 | 83 | ||||||||||||||||||||||
EE | 206 | 335 | 267 | 122 | 170 | 312 | ||||||||||||||||||||||
Business and Public Sector | 253 | 200 | 115 | 134 | 151 | 146 | ||||||||||||||||||||||
Global Services | 477 | 444 | 555 | 222 | 297 | 351 | ||||||||||||||||||||||
Wholesale and Ventures | 92 | 75 | 76 | 145 | 167 | 99 | ||||||||||||||||||||||
Openreach | 61 | 1 | 1 | 67 | 78 | 79 | ||||||||||||||||||||||
Other | 5 | 1 | – | 1 | 2 | 2 | ||||||||||||||||||||||
Total | 1,251 | 1,184 | 1,152 | 777 | 955 | 1,072 | ||||||||||||||||||||||
Given the broad and varied nature of our customer base, the analysis of trade receivables not past due and accrued income by customer-facing unit is considered the most appropriate disclosure of credit concentrations. Cash collateral held against trade and other receivables amounted to £6m (2016/17: £4m, 2015/16: £4m).
| British Telecommunications plc Annual Report & Form 20-F 2018 | 135 | |||||
Table of Contents
Notes to the consolidated financial statements continued
| At 31 March | 2018 £m | 2017 £m | 2016 £m | |||||||||
Current | ||||||||||||
Trade payables | 3,991 | 4,205 | 4,331 | |||||||||
Amounts owed to parent company | 50 | 63 | 70 | |||||||||
Other taxation and social security | 704 | 704 | 682 | |||||||||
Other payables | 428 | 648 | 527 | |||||||||
Accrued expenses | 492 | 382 | 418 | |||||||||
Deferred incomea | 1,525 | 1,474 | 1,435 | |||||||||
| 7,190 | 7,476 | 7,463 | ||||||||||
| At 31 March | 2018 £m | 2017 £m | 2016 £m | |||||||||
Non-current | ||||||||||||
Other payablesb | 871 | 885 | 876 | |||||||||
Deferred incomea | 455 | 413 | 230 | |||||||||
| 1,326 | 1,298 | 1,106 | ||||||||||
| a | Includes £132m (2016/17: £71m, 2015/16: £71m) current and £404m (2016/17: £375m, 2015/16: £187m)non-current liabilities relating to the Broadband Delivery UK programme, for which grants received by the group may be subject tore-investment or repayment depending on the level oftake-up. |
| b | Other payables relate to operating lease liabilities and deferred gains on a 2001 sale and finance leaseback transaction. |
Provisions and contingent liabilities
As disclosed below, our provisions principally relate to obligations arising from property rationalisation programmes, restructuring programmes, asset retirement obligations, network assets, insurance claims, litigation and regulatory risks.
What critical judgements have we made in accounting for provisions?
We exercise judgement in determining the timing and quantum of all provisions to be recognised. Our assessment includes consideration of whether we have a present obligation, whether payment is probable and if so whether the amount can be estimated reliably. As part of this assessment, we also assess the likelihood of contingent liabilities occurring in the future which are not recognised as liabilities on our balance sheet. By their nature, contingencies will be resolved only when one or more uncertain future events occur or fail to occur. We assess the likelihood that a potential claim or liability will arise and also quantify the possible range of financial outcomes where this can be reasonably determined. We’ve disclosed our assessment of contingent liabilities in note 29.
What other critical estimates and assumptions have we made?
Restructuring programmes involve estimation of the direct cost necessary for the restructuring and exclude items that are associated with ongoing activities. The amounts below exclude restructuring costs for which the timing and amount are certain. These are recognised as part of trade and other payables.
Under our property rationalisation programmes we’ve identified a number of surplus properties. Although efforts are being made to sublet this space, this is not always possible. Estimates have been made of the cost of vacant possession and of any shortfall arising from any potential sub-lease income being lower than the lease costs. Any such shortfall is recognised as a provision.
Asset retirement obligations involve an estimate of the cost to dismantle equipment and restore sites upon vacation and the timing of the event. The provision represents the group’s best estimate of the amount that may be required to settle the obligation.
Network asset provisions represent our future operational costs and vacant site rentals arising from obligations relating to network share agreements. Costs are expected to be incurred over a period of up to 20 years.
Our regulatory provision represents our best estimate of the cost to settle our present obligation in relation to historical regulatory matters. The charge for the year represents the outcome of management’s re-assessment of the estimates and regulatory risks across a range of issues, including price and service issues. The prices at which certain services are charged are regulated and may be subject to retrospective adjustment by regulators. Estimates are used in assessing the likely value of the regulatory risk.
In 2016/17 we recognised a £300m charge in relation to estimated Deemed Consent compensation payments. The precise amount of the compensation payments will result from discussions with the affected parties and as of 31 March 2018, we still consider this estimate to be appropriate. In 2016/17 a related fine of £42m was imposed and was recognised as a payable rather than as a provision. The fine and associated compensation payments totaling £342m were treated as a specific item charge in last year’s income statement. The remaining provision increases also reflected management’s estimates of regulatory risks across a range of issues, including price and service issues. These increased by £51m (2016/17: £126m), also treated as specific items, resulting from our reassessment of these other regulatory risks and in light of the regulatory decisions by Ofcom.
| 136 | British Telecommunications plc Annual Report & Form 20-F 2018 | |||||
Table of Contents
| THE STRATEGIC REPORT | GOVERNANCE | FINANCIAL STATEMENTS | ADDITIONAL INFORMATION | |||||||||
|
|
| ||||||||||
In respect of claims, litigation and regulatory risks, the group provides for anticipated costs where an outflow of resources is considered probable and a reasonable estimate can be made of the likely outcome.
Included within Other are contract loss provisions of £38m (2016/17: £29m) relating to the anticipated total losses in respect of certain contracts. It is expected that the majority of these provisions will be utilised in the next few years. Given the short period remaining to the finalisation of these contracts, any potential future changes to key assumptions made when estimating their future losses are not expected to have a significant impact. There is no single change in key variables that could materially affect future expected losses on these contracts. Also included in Other are amounts provided for the constructive obligations arising from insurance claims which will be utilised as the obligations are settled and amounts provided for exposures relating to the Italian business investigation, principally potential tax penalties.
For all risks, the ultimate liability may vary from the amounts provided and will be dependent upon the eventual outcome of any settlement. The estimates are discounted using a rate that reflects the passage of time and risk specific to the liability. An estimate is also required in assessing the timing of when a provision is recognised. The outcome of our estimate of the provisions is disclosed below.
| Restructuring £m | a
|
| Property £m |
| | Network ARO £m |
| | Network share £m |
|
| Regulatory £m |
|
| Litigation £m |
|
| Other £m |
|
| Total £m |
| |||||||||
At 31 March 2016 | 20 | 296 | 78 | 60 | 64 | 73 | 152 | 743 | ||||||||||||||||||||||||
Income statement expense | – | 38 | 27 | 5 | 426 | 6 | 34 | 536 | ||||||||||||||||||||||||
Unwind of discount | – | 12 | 2 | 2 | – | – | – | 16 | ||||||||||||||||||||||||
Utilised or released | (10 | ) | (54 | ) | (24 | ) | (17 | ) | (11 | ) | (11 | ) | (8 | ) | (135 | ) | ||||||||||||||||
Transfers | – | – | – | – | – | – | (3 | ) | (3 | ) | ||||||||||||||||||||||
Exchange differences | 1 | – | – | – | – | 1 | 2 | 4 | ||||||||||||||||||||||||
At 31 March 2017 | 11 | 292 | 83 | 50 | 479 | 69 | 177 | 1,161 | ||||||||||||||||||||||||
Income statement expense | 4 | 37 | 2 | – | 51 | 6 | 33 | 133 | ||||||||||||||||||||||||
Unwind of discount | – | 11 | 2 | 2 | – | – | – | 15 | ||||||||||||||||||||||||
Utilised or released | (2 | ) | (46 | ) | (16 | ) | (19 | ) | (210 | ) | (11 | ) | (32 | ) | (336 | ) | ||||||||||||||||
Transfers | – | – | – | – | – | – | 85 | 85 | ||||||||||||||||||||||||
Exchange differences | (1 | ) | – | – | – | – | – | (2 | ) | (3 | ) | |||||||||||||||||||||
At 31 March 2018 | 12 | 294 | 71 | 33 | 320 | 64 | 261 | 1,055 | ||||||||||||||||||||||||
| a | Restructuring costs for which the timing and amount are certain. These amounts are reflected in trade and other payables. |
At 31 March | 2018 £m | 2017 £m | 2016 £m | |||||||||
Analysed as: | ||||||||||||
Current | 603 | 625 | 178 | |||||||||
Non-current | 452 | 536 | 565 | |||||||||
| 1,055 | 1,161 | 743 | ||||||||||
Background to BT’s pension plans
The group has both defined benefit and defined contribution retirement benefit plans. The group’s main plans are in the UK and the largest by membership is the BT Pension Scheme (BTPS) which is a defined benefit plan that was closed to new entrants on 31 March 2001. After that date new entrants to BT in the UK have been able to join a defined contribution plan, currently the BT Retirement Saving Scheme (BTRSS), a contract-based arrangement.
In March 2018, BT announced the closure of Sections B and C of the BTPS to future benefit accrual (which represents over 99% of the BTPS active membership), having reached an agreement with the relevant Unions. BT currently expects to close the BTPS from 30 June 2018 when employees will join the BTRSS for future pension accrual.
EE operates the EE Pension Scheme (EEPS), which has a defined benefit section that was closed to future benefit accrual in 2014 and a defined contribution section which is open to new joiners.
| British Telecommunications plc Annual Report & Form 20-F 2018 | 137 | |||||
Table of Contents
Notes to the consolidated financial statements continued
| What are they? | How do they impact BT’s financial statements? | |||
Defined contribution plans | Benefits in a defined contribution plan are linked to: – contributions paid – the performance of each individual’s chosen investments – the form in which individuals choose to take their benefits.
Contributions are paid into an independently administered fund. | The income statement charge in respect of defined contribution plans represents the contribution payable by the group based upon a fixed percentage of employees’ pay.
The group has no exposure to investment and other experience risks. | ||
Defined benefit plans | Benefits in a defined benefit plan are: – determined by the plan rules, dependent on factors such as age, years of service and pensionable pay – not dependent upon actual contributions made by the company or members. | The income statement service cost in respect of defined benefit plans represents the increase in the defined benefit liability arising from pension benefits earned by active members in the current period.
The group is exposed to investment and other experience risks and may need to make additional contributions where it is estimated that the benefits will not be met from regular contributions, expected investment income and assets held. |
Amounts in the financial statements
Group income statement
The expense or income arising from all group retirement benefit arrangements recognised in the group income statement is shown below.
Year ended 31 March | 2018 £m | 2017 £m | 2016 £m | |||||||||
Recognised in the income statement before specific items | ||||||||||||
Service cost (including administration expenses & PPF levy): | ||||||||||||
– defined benefit plans | 376 | 281 | 301 | |||||||||
– defined contribution plans | 265 | 240 | 193 | |||||||||
Past service credita | (17 | ) | – | – | ||||||||
Total operating expense | 624 | 521 | 494 | |||||||||
Net interest expense on pensions deficit included in specific items (note 8) | 218 | 209 | 221 | |||||||||
Total recognised in the income statement | 842 | 730 | 715 | |||||||||
| a | Past service credit primarily relates to pension plans operating outside the UK which were closed to future accrual during the year. |
Group statement of comprehensive income
Remeasurements of the net pension obligation are recognised in full in the group statement of comprehensive income in the year in which they arise. These comprise the impact on the defined benefit obligation of changes in demographic and financial assumptions compared with the start of the year, actual experience being different to those assumptions and the return on plan assets being above or below the amount included in the net pension interest expense.
Group balance sheet
The net pension obligation in respect of defined benefit plans reported in the group balance sheet is set out below.
| 2018 | 2017 | |||||||||||||||||||||||||||
| At 31 March | Assets £m | Present value of liabilities £m | Deficit £m | Assets £m | Present value of liabilities £m | Deficit £m | ||||||||||||||||||||||
BTPS | 49,894 | (55,783 | ) | (5,889 | ) | 50,090 | (58,649 | ) | (8,559 | ) | ||||||||||||||||||
EEPS | 763 | (920 | ) | (157 | ) | 748 | (973 | ) | (225 | ) | ||||||||||||||||||
Other plansa | 299 | (624 | ) | (325 | ) | 274 | (578 | ) | (304 | ) | ||||||||||||||||||
Retirement benefit obligation | 50,956 | (57,327 | ) | (6,371 | ) | 51,112 | (60,200 | ) | (9,088 | ) | ||||||||||||||||||
Adjustments due to effect of asset ceiling (IFRIC 14) | – | – | ||||||||||||||||||||||||||
Deferred tax asset | 1,081 | 1,535 | ||||||||||||||||||||||||||
Net pension obligation | (5,290 | ) | (7,553 | ) | ||||||||||||||||||||||||
| a | Included in the present value of obligations of other plans is £97m (2016/17: £104m) related to unfunded pension arrangements. |
| 138 | British Telecommunications plc Annual Report & Form 20-F 2018 | |||||
Table of Contents
| THE STRATEGIC REPORT | GOVERNANCE | FINANCIAL STATEMENTS | ADDITIONAL INFORMATION | |||||||||
|
|
| ||||||||||
Included within trade and other payables in the group balance sheet is £17m (2016/17: £15m) in respect of contributions payable to defined contribution plans.
What is IFRIC 14 and how does it impact BT?
For some pension schemes, IFRIC 14 potentially:
| – | limits the amount of accounting surplus in a pension scheme that can be recognised as an asset on the balance sheet; and/or |
| – | requires additional pension liabilities to be recognised where scheduled future deficit contributions are greater than the unadjusted accounting deficit. |
BT is not required to limit any pensions surplus or recognise additional pensions liabilities in individual plans as economic benefits are available in the form of either future refunds or reductions to future contributions.
This is on the basis that paragraph 11(b) of IFRIC 14 applies enabling a refund of surplus following the gradual settlement of the liabilities over time until there are no members remaning in the scheme.
Movements in defined benefit plan assets and liabilities
The table below shows the movements on the pension assets and liabilities and shows where they are reflected in the financial statements.
| Assets £m | Liabilities £m | Deficit £m | ||||||||||
At 31 March 2016 | 43,968 | (50,350 | ) | (6,382 | ) | |||||||
Service cost (including administration expenses and PPF levy) | (44 | ) | (237 | ) | (281 | ) | ||||||
Interest on pension deficit | 1,413 | (1,622 | ) | (209 | ) | |||||||
Included in the group income statement | (490 | ) | ||||||||||
Return on plan assets above the amount included in the group income statement | 7,475 | – | 7,475 | |||||||||
Actuarial loss arising from changes in financial assumptionsa | – | (10,221 | ) | (10,221 | ) | |||||||
Actuarial loss arising from changes in demographic assumptionsa | – | (206 | ) | (206 | ) | |||||||
Actuarial gain arising from experience adjustmentsb | – | 163 | 163 | |||||||||
Included in the group statement of comprehensive income | (2,789 | ) | ||||||||||
Regular contributions by employer | 313 | – | 313 | |||||||||
Deficit contributions by employer | 274 | – | 274 | |||||||||
Included in the group cash flow statement | 587 | |||||||||||
Contributions by employees | 8 | (8 | ) | – | ||||||||
Benefits paid | (2,315 | ) | 2,315 | – | ||||||||
Foreign exchange | 20 | (34 | ) | (14 | ) | |||||||
Other movements | (14 | ) | ||||||||||
At 31 March 2017 | 51,112 | (60,200 | ) | (9,088 | ) | |||||||
Service cost (including administration expenses and PPF levy) | (67 | ) | (309 | ) | (376 | ) | ||||||
Past service credit | – | 17 | 17 | |||||||||
Interest on pension deficit | 1,201 | (1,419 | ) | (218 | ) | |||||||
Included in the group income statement | (577 | ) | ||||||||||
Return on plan assets above the amount included in the group income statement | 10 | – | 10 | |||||||||
Actuarial gain arising from changes in financial assumptionsa | – | 2,251 | 2,251 | |||||||||
Actuarial loss arising from changes in demographic assumptionsa | – | (221 | ) | (221 | ) | |||||||
Actuarial gain arising from experience adjustmentsb | – | 120 | 120 | |||||||||
Included in the group statement of comprehensive income | 2,160 | |||||||||||
Regular contributions by employer | 264 | – | 264 | |||||||||
Deficit contributions by employer | 872 | – | 872 | |||||||||
Included in the group cash flow statement | 1,136 | |||||||||||
Contributions by employees | 2 | (2 | ) | – | ||||||||
Benefits paid | (2,449 | ) | 2,449 | – | ||||||||
Foreign exchange | 11 | (13 | ) | (2 | ) | |||||||
Other movements | (2 | ) | ||||||||||
At 31 March 2018 | 50,956 | (57,327 | ) | (6,371 | ) | |||||||
| a | The actuarial gain or loss arises from changes in the assumptions used to value the defined benefit liabilities at the end of the year compared with the assumptions used at the start of the year. This includes both financial assumptions, which are based on market conditions at the year end, and demographic assumptions such as life expectancy. |
| b | The actuarial loss or gain arising from experience adjustments on defined benefit liabilities represents the impact on the liabilities of differences between actual experience during the year compared with the assumptions made at the start of the year. Such differences might arise, for example, from members choosing different benefit options at retirement, actual salary increases being different from those assumed or actual benefit increases being different to the pension increase assumption. |
| British Telecommunications plc Annual Report & Form 20-F 2018 | 139 | |||||
Table of Contents
Notes to the consolidated financial statements continued
How do we value our retirement benefit plans?
Valuation methodology
The IAS 19 liabilities are measured as the present value of the estimated future benefit cash flows to be paid by each scheme, calculated using the projected unit credit method. These calculations are performed for the group by professionally qualified independent actuaries.
The expected future benefit payments are based on a number of assumptions including future inflation, retirement ages, benefit options chosen and life expectancy and are therefore inherently uncertain. Actual benefit payments in a given year may be higher or lower, for example if members retire sooner or later than assumed, or take a greater or lesser cash lump sum at retirement than assumed.
What are our critical judgements, estimates and assumptions?
The accounting cost of these benefits and the present value of our pension liabilities involve judgements about uncertain events including the life expectancy of the members, the salary progression of our current employees, price inflation and the discount rate used to calculate the net present value of the future pension payments. We use estimates for all of these uncertain events in determining the pension costs and liabilities in our financial statements. Our assumptions reflect historical experience, external advice and our judgement regarding future expectations.
The fair value of some of our pension assets are made up of quoted and unquoted investments. The latter require more judgement as their values are not directly observable. The assumptions used in valuing unquoted investments are affected by current market conditions and trends which could result in changes in fair value after the measurement date.
How do we value the assets?
Under IAS 19, plan assets must be valued at the bid market value at the balance sheet date. For the main asset categories:
| – | Equities listed on recognised stock exchanges are valued at closing bid prices. |
| – | Properties are valued on the basis of open market value. |
| – | Bonds are measured using a combination of broker quotes and pricing models making assumptions for credit risk, market risk and market yield curves. |
| – | Holdings in investment funds are valued at fair value which is typically the Net Asset Value provided by the investment manager. |
| – | Certain unlisted investments are valued using a model based valuation such as a discounted cash flow. |
| – | The value of the longevity insurance contract held by the BTPS is measured by discounting the projected cash flows payable under the contract (projected by an actuary, consistent with the terms of the contract). |
Review of pension benefits
Following consultation with employees and the relevant unions, we announced a number of key changes to our main UK pension arrangements in March 2018:
| – | An increase to BT’s standard maximum contribution rate to 10% for employees building up benefits in the BTRSS, taking effect from |
| 1 | June 2018. |
| – | The closure of Sections B and C of the BTPS (representing over 99% of the BTPS active membership) to future benefit accrual, with the employees impacted by the change able to join the BTRSS for future pension provision, taking effect from 30 June 2018. |
| – | All employees impacted by the closure of the BTPS will receive transition payments into their BTRSS account for a period, as well as having a higher maximum BT contribution rate of 11% for a temporary period. The transition payments are 2% of pensionable salary for a period depending on the employee’s age. |
| – | We will establish a new ‘hybrid’ pension arrangement over the coming year for non-management employees in the BTPS at closure. This new arrangement will combine elements of both defined benefit and defined contribution pension arrangements and support those employees on lower pay scales, giving them another option for their retirement savings. We are aiming to have this in place by no later than 1 April 2019. |
These changes keep our pensions fair, flexible and affordable across BT in the UK.
Overview and governance of the BTPS
What is the profile of the BTPS?
At 31 March 2018 there were 293,000 members of the BTPS. Members belong to one of three sections depending upon the date they first joined the BTPS. The membership is analysed below.
| 140 | British Telecommunications plc Annual Report & Form 20-F 2018 | |||||
Table of Contents
| THE STRATEGIC REPORT | GOVERNANCE | FINANCIAL STATEMENTS | ADDITIONAL INFORMATION | |||||||||
|
|
| ||||||||||
Analysis of BTPS
Active members | Deferred members | Pensioners | Total | |||||||||||||
Sections A and B liabilities (£bn)a | 4.9 | 4.3 | 29.6 | 38.8 | ||||||||||||
Section C liabilities (£bn) | 7.7 | 5.7 | 3.6 | 17.0 | ||||||||||||
Total IAS 19 liabilities (£bn) | 12.6 | 10.0 | 33.2 | 55.8 | ||||||||||||
Total number of members | 30,000 | 60,500 | 202,500 | 293,000 | ||||||||||||
| a | Sections A and B have been aggregated in this table as Section A members have typically elected to take Section B benefits at retirement. |
The estimated duration of the BTPS liabilities, which is an indicator of the weighted average term of the liabilities, is around 16 years although the benefits payable by the BTPS are expected to be paid over more than 70 years. Whilst benefit payments are expected to increase over the earlier years, the value of the liabilities is expected to reduce.
The chart below illustrates the estimated benefits payable from the BTPS forecast using the IAS 19 assumptions.
Forecast benefits payable by the BTPS at 31 March 2018 (unaudited)
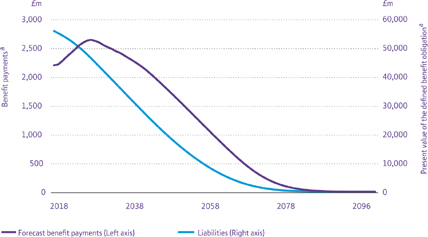
| a | Based on accrued benefits to 30 June 2017. |
What are the benefits under the BTPS?
Benefits earned for pensionable service prior to 1 April 2009 are based upon a member’s final salary and a normal pensionable age of 60.
Between 1 April 2009 and 30 June 2018, Section B and C active members accrue benefits based upon a career average re-valued earnings (CARE) basis and a normal pensionable age of 65. On a CARE basis benefits are built up based upon earnings in each year and the benefit accrued for each year is increased by the lower of inflation or the individual’s actual pay increase in each year to retirement.
Under the Scheme rules the determination of the rate of inflation for statutory minimum rates of revaluation and indexation for the majority of benefits is based upon either the Retail Prices Index (RPI) or the Consumer Prices Index (CPI) which apply to each category of member as shown below.
| Active members | Deferred members | Pensioners | ||||
| Section Ba | Benefits accrue on a CARE basis increasing at the lower of RPI or the individual’s actual pensionable pay increase | Preserved benefits are revalued before retirement based upon CPI | Increases in benefits in payment are currently based upon CPI | |||
| Section C | Increases in benefits in payment are currently based upon RPI up to a maximum of 5% |
| a | Section A members have typically elected to take Section B benefits at retirement. |
| British Telecommunications plc Annual Report & Form 20-F 2018 | 141 | |||||
Table of Contents
Notes to the consolidated financial statements continued
In December 2017, we sought a decision from the High Court as to whether it would be possible to change the index used to calculate pension increases paid in the future to members of Section C of the BTPS from RPI to another index.
In its judgment handed down on 19 January 2018, the High Court decided that it is currently not possible to change from RPI to another index. BT was then granted permission to appeal the decision to the Court of Appeal. The Court of Appeal hearing is due to take place in October 2018.
How is the BTPS governed and managed?
BT Pension Scheme Trustees Limited (the Trustee) has been appointed by BT as an independent trustee to administer and manage the BTPS on behalf of the members in accordance with the terms of the BTPS Trust Deed and Rules and relevant legislation (principally the Pension Schemes Act 1993, the Pensions Act 1995 and the Pensions Act 2004).
Under the terms of the Trust Deed there are nine Trustee directors, all of whom are appointed by BT, as illustrated below. Trustee directors are usually appointed for a three-year term but are then eligible for re-appointment.
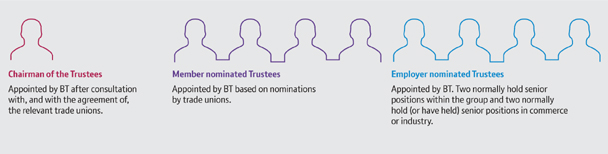
| 142 | British Telecommunications plc Annual Report & Form 20-F 2018 | |||||
Table of Contents
| THE STRATEGIC REPORT | GOVERNANCE | FINANCIAL STATEMENTS | ADDITIONAL INFORMATION | |||||||||
|
|
| ||||||||||
BTPS assets
Asset allocation
The allocation of assets between different classes of investment is reviewed regularly and is a key factor in the Trustee’s investment policy. The allocations reflect the Trustee’s views on the appropriate balance to be struck between seeking returns and incurring risk, and on the extent to which the assets should be allocated to match liabilities. Current market conditions and trends are regularly assessed which may lead to adjustments in the asset allocation.
The fair value of the assets of the BTPS analysed by asset category are shown below. These are subdivided by assets that have a quoted market price in an active market and those that do not (such as investment funds).
| 2018a | 2017a | |||||||||||||||||||||||||||||
| | Total assets £bn | | | of which quoted £bn | b
| | Total % | | | Total assets £bn | | | of which quoted £bn | b
| | Total % | | |||||||||||||
Growth | ||||||||||||||||||||||||||||||
Equities | UK | 0.5 | 0.5 | 1 | 0.7 | 0.6 | 2 | |||||||||||||||||||||||
| Overseas developed | 7.8 | 7.3 | 16 | 9.1 | 8.6 | 18 | ||||||||||||||||||||||||
| Emerging markets | 0.5 | 0.4 | 1 | 0.5 | 0.1 | 1 | ||||||||||||||||||||||||
Private Equity | 1.9 | – | 4 | 1.9 | – | 4 | ||||||||||||||||||||||||
Property | UK | 3.9 | – | 8 | 4.1 | – | 8 | |||||||||||||||||||||||
| Overseas | 1.2 | – | 2 | 1.7 | – | 3 | ||||||||||||||||||||||||
Other growth assets | Absolute Return fundsc | 1.5 | – | 3 | 2.3 | – | 5 | |||||||||||||||||||||||
| Non Core Creditd | 3.4 | 1.0 | 7 | 3.5 | 1.1 | 7 | ||||||||||||||||||||||||
| Mature Infrastructure | 1.4 | – | 3 | 1.7 | – | 3 | ||||||||||||||||||||||||
Liability matching | ||||||||||||||||||||||||||||||
Government bonds | UK Index Linked | 12.5 | 12.5 | 25 | 12.3 | 12.0 | 25 | |||||||||||||||||||||||
Investment grade credit | Global | 10.0 | 8.0 | 20 | 7.6 | 5.9 | 15 | |||||||||||||||||||||||
Cash, derivatives and other | ||||||||||||||||||||||||||||||
Cash balances | 3.8 | – | 7 | 1.7 | – | 3 | ||||||||||||||||||||||||
Longevity insurance contracte | (0.4 | ) | – | (1 | ) | (0.3 | ) | – | (1 | ) | ||||||||||||||||||||
Othernon-physical cashf | 1.9 | – | 4 | 3.3 | – | 7 | ||||||||||||||||||||||||
Total | 49.9 | 29.7 | 100 | 50.1 | 28.3 | 100 | ||||||||||||||||||||||||
| a | At 31 March 2018, the Scheme’s assets included equity issued by the group of £3m (2016/17: £nil) . The Scheme also held £10m (2016/17: £10m) of index-linked bonds issued by the group. |
| b | Assets with a quoted price in an active market. |
| c | This allocation seeks to generate returns irrespective of the direction of markets. Managers within this allocation will typically manage their portfoilios without close regard to a specific market benchmark. |
| d | This allocation includes a range of credit investments, including emerging market,sub-investment grade and unrated credit. The allocation seeks to exploit investment opportunities within credit markets using the expertise of a range of specialist investment managers. |
| e | The Trustee has hedged some of the Scheme’s longevity risk through a longevity insurance contract which was entered into in 2014. The value reflects experience to date on the contract from higher than expected deaths. This amount partly offsets a reduction recognised in the Scheme’s liabilities. |
| f | Non-physical cash includes offsets in future positions and cash collateral posted in relation to derivatives held by the Scheme. |
| British Telecommunications plc Annual Report & Form 20-F 2018 | 143 | |||||
Table of Contents
Notes to the consolidated financial statements continued
IAS 19 assumptions
The table below summarises the approach used to set the key IAS 19 assumptions for the BTPS.
| Approach to set the assumption | ||
Discount rate |
IAS 19 requires that the discount rate is determined by reference to market yields at the reporting date on high quality corporate bonds. The currency and term of these should be consistent with the currency and estimated term of the pension obligations.
The assumption is calculated by applying the projected BTPS benefit cash flows to a corporate bond yield curve constructed based on the yield onAA-rated corporate bonds.
In setting the yield curve, judgement is required on the selection of appropriate bonds to be included in the universe and the approach used to then derive the yield curve.
At 31 March 2018, the discount rate model used to select bonds and derive the yield curve was updated to better reflect yields on corporate bonds over the life of the Scheme. A key difference is that the revised model excludes bonds which have either an implicit or explicit Government guarantee, which is more consistent with the requirements of IAS19, and reflects developing practice. Both the old and revised models are standard models developed by our external actuary. The impact of this change is a £2.1bn reduction in the BTPS liabilities.
| |
| RPI inflation | The RPI inflation assumption is set using the entire inflation curve, weighted by projected BTPS benefit cash flows, and making an adjustment for an inflation risk premium (to reflect the extra premium paid by investors for inflation protection), which is currently assumed to be 20bps.
| |
| CPI inflation | CPI is assessed at a margin below RPI taking into account market forecasts and independent estimates of the expected difference.
| |
| Salary increases | Long-term salary increases for BTPS members are assumed to be equal to CPI inflation.
| |
| Pension increases | Benefits are assumed to increase in line with the RPI or CPI inflation assumptions, based on the relevant index for increasing benefits, as prescribed by the rules of the BTPS and summarised above.
| |
| Longevity | The longevity assumption has been updated to take into account: | |
– the actual mortality experience of the BTPS pensioners, based on a formal review conducted at the 2014 triennial funding valuation | ||
– future improvements in longevity based on a model published by UK actuarial profession’s Continuous Mortality Investigation (using the CMI 2016 Mortality Projections model with a 1.25% per year long-term improvement parameter).
| ||
The key financial assumptions used to measure the liabilities of the BTPS are shown below.
| Nominal rates (per year) | Real rates (per year)a | |||||||||||||||||||||||||||
| At 31 March | 2018 % | 2017 % | 2016 % | 2018 % | 2017 % | 2016 % | ||||||||||||||||||||||
Rate used to discount liabilities | 2.65 | 2.40 | 3.30 | (0.44 | ) | (0.78 | ) | 0.44 | ||||||||||||||||||||
Inflation – increase in RPI | 3.10 | 3.20 | 2.85 | – | – | – | ||||||||||||||||||||||
Inflation – increase in CPI | 2.00 | b | 2.00 | c | 1.65 | d | (1.1 | )b | (1.2 | )c | (1.2 | )d | ||||||||||||||||
| a | The real rate is calculated relative to RPI inflation. |
| b | Assumed to be 0.1% higher until 31 March 2023. |
| c | Assumed to be 0.5% higher until 31 March 2019. |
| d | Assumed to be 0.2% higher until 31 March 2017. |
The BTPS represents over 97% of the group’s retirement benefit obligation. While the financial assumptions may vary for each plan, the nominal financial assumptions weighted by liabilities across all plans are equal to the figures shown in the table above (to the nearest
0.05%).
| 144 | British Telecommunications plc Annual Report & Form 20-F 2018 | |||||
Table of Contents
| THE STRATEGIC REPORT | GOVERNANCE | FINANCIAL STATEMENTS | ADDITIONAL INFORMATION | |||||||||
|
|
| ||||||||||
Based on the IAS 19 longevity assumptions, the forecast life expectancies for BTPS members aged 60 are as follows:
| At 31 March | 2018 Number of years | 2017 Number of years | ||||||
Male in lower pay bracket | 25.8 | 26.2 | ||||||
Male in medium pay bracket | 27.1 | 27.5 | ||||||
Male in higher pay bracket | 28.5 | 28.9 | ||||||
Female in lower pay bracket | 28.5 | 28.9 | ||||||
Female in higher pay bracket | 28.7 | 29.2 | ||||||
Average improvement for a member retiring at age 60 in 10 years’ time | 0.7 | 1.0 | ||||||
Risks underlying the assumptions
Background
The BTPS faces similar risks to other UK DB schemes: things like future low investment returns, high inflation, longer life expectancy and regulatory changes may all mean the BTPS becomes more of a financial burden. Further details are set out on page 41.
Changes in external factors, such as interest rates, can have an impact on the IAS 19 assumptions, impacting the measurement of BTPS liabilities. These factors can also impact the Scheme assets. The BTPS hedges some of these risks, including longevity and currency using financial instruments and insurance contracts.
Some of the key financial risks, and mitigations, for the BTPS are set out in the table below.
| Changes in bond yields | A fall in yields onAA-rated corporate bonds, used to set the IAS 19 discount rate, will lead to an increase in the IAS 19 liabilities.
The BTPS’s assets include corporate bonds, government bonds and interest rate derivatives which are expected to partly offset the impact of movements in the discount rate. However, yields on these assets may diverge compared with the discount rate in some scenarios. | |
| Changes in inflation expectations | A significant proportion of the benefits paid to members are currently increased in line with RPI or CPI inflation. An increase in long-term inflation expectations will lead to an increase in the IAS 19 liabilities.
The BTPS’s assets include index-linked government bonds and inflation derivatives which are expected to partly offset the impact of movements in inflation expectations. | |
| Changes in life expectancy | An increase in the life expectancy of members will result in benefits being paid out for longer, leading to an increase in the BTPS liabilities.
The BTPS holds a longevity insurance contract which covers around 25% of the BTPS’s total exposure to improvements in longevity, providing long-term protection and income to the BTPS in the event that members live longer than currently expected. |
Other risks include volatile asset returns (ie where asset returns differ from the discount rate) and changes in legislation or regulation which impact the value of the liabilities or value of the assets.
Quantification
BT’s independent actuary has assessed the potential negative impact of the key risks that might occur no more than once in every 20 years illustrated as the following three scenarios:
| 1-in-20 events | ||||||||
| Scenario | 2018 | 2017 | ||||||
1. Fall in discount ratea | 1.10% | 1.00% | ||||||
2. Increase to inflation rateb | 0.70% | 0.90% | ||||||
3. Increase to life expectancy | 1.35 years | 1.35 years | ||||||
| a | Scenario assumes a fall in the yields on both government and corporate bonds. |
| b | Assuming RPI, CPI, pension increases and salary increases all increase by the same amount. |
| British Telecommunications plc Annual Report & Form 20-F 2018 | 145 | |||||
Table of Contents
Notes to the consolidated financial statements continued
The impact shown under each scenario looks at each event in isolation – in practice a combination of events could arise.
Sensitivity analysis of the principal assumptions to1-in-20
events used to measure BTPS liabilities
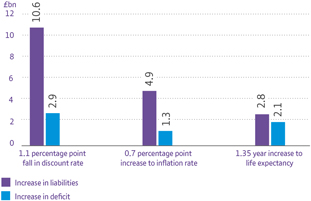
The sensitivity of the deficit allows for both the change in the liabilities and the assumed change in the assets. For example, the increase in the deficit under the life expectancy scenario incorporates the expected movement in the value of the insurance contract held to hedge longevity risk.
The sensitivities have been prepared using a similar approach as 2016/17 which involves calculating the liabilities and deficit using the alternative assumptions stated.
BTPS funding
Triennial funding valuation
The triennial valuation is carried out for the Trustee by a professionally qualified independent actuary. The purpose of the valuation is to design a funding plan to ensure that the BTPS has sufficient funds available to meet future benefit payments. The latest funding valuation was performed as at 30 June 2017. The next funding valuation will have an effective date of no later than 30 June 2020.
The valuation methodology for funding purposes, which is based on prudent assumptions, is broadly as follows:
| – | Assets are valued at market value at the valuation date. |
| – | Liabilities are measured on an actuarial funding basis using the projected unit credit method and discounted to their present value. |
The results of the two most recent triennial valuations are shown below.
June 2017 | June 2014 | |||||||
BTPS liabilities | (60.4) | (47.2) | ||||||
Market value of BTPS assets | 49.1 | 40.2 | ||||||
Funding deficit | (11.3 | ) | (7.0) | |||||
Percentage of accrued benefits covered by BTPS assets at the valuation date | 81.3% | 85.2% | ||||||
Percentage of accrued benefits on a solvency basis covered by the BTPS assets at the valuation date | 62.2% | 63.0% | ||||||
Between June 2014 and June 2017, the Scheme benefited from asset returns of 10.5% a year, that were higher than assumed under the 2014 funding assumptions, and £2.0bn of deficit contributions. The fall in long-term real interest rates resulted in an increase in liabilities, which has more than offset the improvements in the Scheme’s assets. There has been a reduction in the liabilities as a result of allowing for slower improvements to life expectancy being forecast by actuaries. This impact has been broadly offset by the impact of changes to the investment strategy that have reduced the current and future level of investment risk in the Scheme.
Key assumptions – funding valuation
These valuations were determined using the following prudent long-term assumptions.
| Nominal rates (per year) | Real rates (per year)a | |||||||||||||||||||
June 2017 % | June 2014 % | June 2017 % | June 2014 % | |||||||||||||||||
Average single equivalent discount rate | 2.6 | 4.5 | (0.8) | 1.0 | ||||||||||||||||
Average long-term increase in RPI | 3.4 | 3.5 | – | – | ||||||||||||||||
Average long-term increase in CPI | 2.4 | 2.5 | (1.0) | (1.0 | ) | |||||||||||||||
| a | The real rate is calculated relative to RPI inflation and is shown as a comparator. |
| 146 | British Telecommunications plc Annual Report & Form 20-F 2018 | |||||
Table of Contents
| THE STRATEGIC REPORT | GOVERNANCE | FINANCIAL STATEMENTS | ADDITIONAL INFORMATION | |||||||||
|
|
| ||||||||||
The discount rate at 30 June 2017 was derived from prudent return expectations above a risk-free yield curve based on gilt and swap rates. The discount rate reflects views of future returns at the valuation date, allowing for the Scheme to hold 45% of its investments in growth assets initially, beforede-risking to a low risk investment approach by 2034. This gives a prudent discount rate of 1.4% per year above the yield curve initially, trending down to 0.7% per year above the curve in the long-term. The assumption is equivalent to using a flat discount rate of 1.0% per year above the yield curve.
At the 2014 valuation, the funding approach assumed the Scheme would hold 60% of its investments in growth assets (such as equities and property) for a period, beforede-risking to alow-risk investment approach by 2034.
The average life expectancy assumptions at the valuation dates, for members 60 years of age, are as follows.
| Number of years from valuation date | June 2017 | June 2014 | ||||||
Male in lower pay bracket | 25.9 | 26.1 | ||||||
Male in medium pay bracket | 27.2 | 27.5 | ||||||
Male in high pay bracket | 28.6 | 29.0 | ||||||
Female in lower pay bracket | 28.6 | 28.9 | ||||||
Female in high pay bracket | 28.9 | 29.2 | ||||||
Average improvement for a member retiring at age 60 in 10 years’ time | 0.9 | 1.3 | ||||||
Payments made to the BTPS
| Year ended 31 March | 2018 £m | 2017 £m | ||||||
Ordinary contributions | 248 | 303 | ||||||
Deficit contributions | 850 | 250 | ||||||
Total contributions in the year | 1,098 | 553 | ||||||
Future funding obligations and recovery plan
Under the terms of the Trust Deed, the group is required to have a funding plan, determined at the conclusion of the triennial funding valuation, which is a legal agreement between BT and the Trustee and should address the deficit over a maximum period of 20 years.
In May 2018, the 2017 triennial funding valuation was finalised, agreed with the Trustee and certified by the Scheme Actuary. The funding deficit at 30 June 2017 was £11.3bn. The deficit will be met over a13-year period, maintaining the remaining period of the previous plan.
The deficit contributions have three components:
| – | Payments by BT over the three years to 31 March 2020 totalling £2.1bn. This is equal to the amount due over the same period under the previous recovery plan. £850m of this was paid in March 2018 and the remaining £1,250m is to be paid by 30 June 2019. |
| – | A further £2.0bn contribution, due to be funded from the proceeds of the issuance of bonds, which will be held by the BTPS. The bonds will be: |
| – | issued as soon as practicable under BT’s Euro Medium Term Note Programme |
| – | sterling denominated and have maturities ranging from 2033 to 2042 |
| – | £1.0bn fixed interest and £1.0bnCPI-linked. |
| – | For the 10 years from 1 April 2020 to 31 March 2030, BT will make annual payments of around £900m, typicaly by 31 March each year. |
| – | £400m of BT’s contribution in the financial year 2020/21 will be made by 30 June 2020. |
This means that the recovery plan includes material contributions by BT to the Scheme of £4.5bn by 30 June 2020, when the next valuation is expected to take place.
BT is scheduled to make future deficit payments to the BTPS in line with the table below.
| Year to 31 March | 2018 | 2019 | 2020 | 2021 | 2022 | 2023 | 2024 | 2025 | 2026 | 2027 | 2028 | 2029 | 2030 | |||||||||||||||||||||||||||||||||||||||
Deficit contribution (£m) | 850 | 2,000 | a | 1,250 | b | 900 | c | 900 | d | 907 | 907 | 907 | 907 | 907 | 907 | 907 | 907 | |||||||||||||||||||||||||||||||||||
a due to be paid shortly, but no later than 30 June 2019.
b payable by 30 June 2019.
c £400m payable by 30 June 2020.
d £200m payable by 30 June 2021.
| British Telecommunications plc Annual Report & Form 20-F 2018 | 147 | |||||
Table of Contents
Notes to the consolidated financial statements continued
Based on the 2017 funding valuation agreement, the group expects to make contributions of approximately £2,075m to the BTPS in 2018/19, comprising ordinary contributions of approximately £75m and deficit contributions of £2,000m. The reduction in the level of ordinary contributions primarily reflects the closure of the BTPS to Section B and C members, which is currently intended to take place on 30 June 2018. In addition, contributions towards the cost of administering the Scheme, PPF levies and providing future benefits for the remaining members will continue to be made after this date.
Other protections
The 2017 funding agreement with the Trustee included additional features for BT to provide support to the BTPS. These include:
| Feature | Detail | |||
| Shareholder distributions | BT will provide additional payments to the BTPS by the amount that shareholder distributions exceed a threshold.The threshold allows for 10% per year dividend per share growth plus £200m per year of share buybacks on a cumulative basis.
This will apply until 30 June 2021, or until the finalisation of the next valuation if earlier.
BT will also consult with the Trustee if it considers share buybacks in excess of £200m per year or making a special dividend. This obligation ison-going until otherwise terminated. | |||
| Material corporate events | In the event that BT generates net cash proceeds greater than £1.0bn from disposals (net of acquisitions) in any12-month period ending 30 June, BT will make additional contributions to the BTPS equal to one third of those net cash proceeds. This obligation applies until the next valuation is signed. | |||
| BT will consult with the Trustee if: | ||||
– it considers making acquisitions with a total cost of more than £1.0bn in any12-month period; or | ||||
– it considers making disposals of more than £1.0bn; or | ||||
– it considers making a Class 1 transaction (acquisition or disposal); or | ||||
– it is subject to a takeover offer. | ||||
| This obligation ison-going until otherwise terminated. | ||||
| BT will advise the Trustee should there be other material corporate events which would materially impact BT’s covenant to the BTPS. This obligation ison-going until otherwise terminated. | ||||
| Negative pledge | A negative pledge that future creditors will not be granted superior security to the BTPS in excess of a £1.5bn threshold, to cover both British Telecommunications plc and BT Group plc. | |||
| This provision applies until the deficit reduces to below £2.0bn at any subsequent funding valuation. | ||||
In the highly unlikely event that the group were to become insolvent there are additional protections of BTPS members’ benefits:
| Feature | Detail | |||
| Crown Guarantee | The Crown Guarantee was granted by the Government when the group was privatised in 1984 and would only come into effect upon the insolvency of BT. | |||
| The Trustee brought court proceedings to clarify the scope and extent of the Crown Guarantee. The Court of Appeal judgment on 16 July 2014 established that: | ||||
– the Crown Guarantee covers BT’s funding obligation in relation to the benefits of members of the BTPS who joined post-privatisation as well as those who joined pre-privatisation (subject to certain exceptions) | ||||
– the funding obligation to which the Crown Guarantee relates is measured with reference to BT’s obligation to pay deficit contributions under the rules of the BTPS. | ||||
| The Crown Guarantee is not taken into account for the purposes of the actuarial valuation of the BTPS and is an entirely separate matter, only being relevant in the highly unlikely event that BT became insolvent. | ||||
| Pension Protection Fund (PPF) | The Pension Protection Fund (PPF) may take over the BTPS and pay benefits not covered by the Crown Guarantee to members. | |||
| There are limits on the amounts paid by the PPF and the PPF would not provide exactly the same benefits as those provided under the BTPS Rules. | ||||
| 148 | British Telecommunications plc Annual Report & Form 20-F 2018 | |||||
Table of Contents
| THE STRATEGIC REPORT | GOVERNANCE | FINANCIAL STATEMENTS | ADDITIONAL INFORMATION | |||||||||
|
|
| ||||||||||
Other benefit plans
In addition to the BTPS, the group maintains benefit plans around the world with a focus on these being appropriate for the local market and culture.
EE Pension Scheme (EEPS)
The EEPS is the second largest defined benefit plan sponsored by the group with defined benefit liabilities of around £0.9bn. The EEPS also has a defined contribution section with around 11,500 active members.
At 31 March 2018, the defined benefit section’s assets are invested across a number of asset classes including global equities (28%), property and illiquid alternatives (22%), an absolute return portfolio (25%) and a liability driven investment portfolio (25%).
The triennial valuation of the defined benefit section was performed as at 31 December 2015, and agreed in March 2017. This showed a funding deficit of £141m. The group is scheduled to contribute £1.875m each month between 1 April 2018 and November 2020.
The next funding valuation will have an effective date of no later than 31 December 2018.
BTRSS
The BTRSS is the largest defined contribution scheme maintained by the group with around 35,000 active members. In the year to
31 March 2018, the group contributed £167m to the BTRSS.
Other schemes
BT operates a number of overseas pension schemes. In December 2017, BT closed two defined benefit plans which operate in the Netherlands. This resulted in a c£14m past service credit arising from the change in future indexation obligations. A further £3m past service credit was recognised in 2017/18 relating to various other pension plans operating outside the UK.
| British Telecommunications plc Annual Report & Form 20-F 2018 | 149 | |||||
Table of Contents
Notes to the consolidated financial statements continued
What share incentive arrangements do we have?
Our plans include savings-related share option plans for employees and those of participating subsidiaries, further share option plans for selected employees and a stock purchase plan for employees in the US. We also have several share plans for executives. All share-based payment plans are equity-settled. Details of these plans and an analysis of the total charge by type of award is set out below.
| Year ended 31 March | 2018 £m | 2017 £m | 2016 £m | |||||||||
Employee Saveshare Plans | 42 | 40 | 27 | |||||||||
Executive Share Plans: | ||||||||||||
Incentive Share Plan (ISP) | 16 | – | 21 | |||||||||
Deferred Bonus Plan (DBP) | 4 | 9 | 4 | |||||||||
Retention Share Plan (RSP)a | 21 | 8 | 1 | |||||||||
Other plans | 1 | – | 5 | |||||||||
| 84 | 57 | 58 | ||||||||||
| a | Re-presented to show RSPs separately from other plans. |
Employee Saveshare Plans
Under an HMRC-approved savings-related share option plan, employees save on a monthly basis, over a three or five-year period, towards the purchase of shares of BT Group plc at a fixed price determined when the option is granted. This price is usually set at a 20% discount to the market price for five-year plans and 10% for three-year plans. The options must be exercised within six months of maturity of the savings contract, otherwise they lapse. Similar plans operate for our overseas employees.
Incentive Share Plan (ISP)
Under the ISP, participants are only entitled to these shares of BT Group plc in full at the end of a three-year period if BT Group plc has met the relevantpre-determined corporate performance measures and if the participants are still employed by the group. For ISP awards granted in 2017/18, 2016/17 and 2015/16: 40% of each award is linked to a total shareholder return (TSR) target for a comparator group of companies from the beginning of the relevant performance period; 40% is linked to a three-year cumulative normalised free cash flow measure; and 20% to growth in underlying revenue excluding transit.
Deferred Bonus Plan (DBP)
Under the DBP, awards are granted annually to selected employees. Shares in BT Group plc are transferred to participants at the end of three years if they continue to be employed by the group throughout that period.
Retention Share Plan (RSP)
Under the RSP, awards are granted to selected employees. Shares of BT Group plc are transferred to participants at the end of a specified retention period if they continue to be employed by the group throughout that period.
Under the terms of the ISP, DBP and RSP, dividends or dividend equivalents earned on shares of BT Group plc during the conditional periods are reinvested in company shares for the potential benefit of the participants.
Employee Saveshare Plans
Movements in Employee Saveshare options are shown below.
| Movement in the number of share options | Weighted average exercise price | |||||||||||||||||||||||||||
| Year ended 31 March | 2018 millions | 2017 millions | 2016 millions | 2018 pence | 2017 pence | 2016 pence | ||||||||||||||||||||||
Outstanding at 1 April | 189 | 197 | 226 | 313 | 287 | 226 | ||||||||||||||||||||||
Granted | 69 | 44 | 47 | 250 | 362 | 385 | ||||||||||||||||||||||
Forfeited | (41 | ) | (18 | ) | (12 | ) | 328 | 345 | 306 | |||||||||||||||||||
Exercised | (30 | ) | (33 | ) | (63 | ) | 169 | 208 | 139 | |||||||||||||||||||
Expired | (12 | ) | (1 | ) | (1 | ) | 353 | 345 | 247 | |||||||||||||||||||
Outstanding at 31 March | 175 | 189 | 197 | 306 | 313 | 287 | ||||||||||||||||||||||
Exercisable at 31 March | – | – | – | 320 | 237 | 140 | ||||||||||||||||||||||
The weighted average share price for all options exercised during 2017/18 was 311p (2016/17: 357p, 2015/16: 463p).
| 150 | British Telecommunications plc Annual Report & Form 20-F 2018 | |||||
Table of Contents
| THE STRATEGIC REPORT | GOVERNANCE | FINANCIAL STATEMENTS | ADDITIONAL INFORMATION | |||||||||
|
|
| ||||||||||
The following table summarises information relating to options outstanding and exercisable under Employee Saveshare plans at
31 March 2018.
| Normal dates of vesting and exercise (based on calendar years) | Exercise price per share | Weighted average exercise price | Number of outstanding options millions | Weighted average remaining contractual life | ||||||||||||
2018 | 249p – 423p | 306p | 25 | 10 months | ||||||||||||
2019 | 319p – 397p | 333p | 53 | 22 months | ||||||||||||
2020 | 243p – 376p | 307p | 44 | 34 months | ||||||||||||
2021 | 353p | 353p | 17 | 46 months | ||||||||||||
2022 | 243p | 243p | 36 | 58 months | ||||||||||||
Total | 306p | 175 | 33 months | |||||||||||||
Executive share plans
Movements in executive share plan awards during 2017/18 are shown below:
Number of shares (millions) | ||||||||||||||||
| ISP | DBP | RSP | Total | |||||||||||||
At 1 April 2017 | 45 | 7 | 4 | 56 | ||||||||||||
Awards granted | 26 | 2 | 10 | 38 | ||||||||||||
Awards vested | – | (3 | ) | (2 | ) | (5 | ) | |||||||||
Awards lapsed | (20 | ) | – | (1 | ) | (21 | ) | |||||||||
Dividend shares reinvested | 3 | – | 1 | 4 | ||||||||||||
At 31 March 2018 | 54 | 6 | 12 | 72 | ||||||||||||
Fair values
The following table summarises the fair values and key assumptions used for valuing grants made under the Employee Saveshare plans and ISP in 2017/18, 2016/17 and 2015/16.
| 2018 | 2017 | 2016 | ||||||||||||||||||||||||||||||
| Year ended 31 March | Employee Saveshare | ISP | Employee Saveshare | ISP | Employee Saveshare | ISP | ||||||||||||||||||||||||||
Weighted average fair value | 56p | 202p | 72p | 328p | 81p | 364p | ||||||||||||||||||||||||||
Weighted average share price | 296p | 281p | 422p | 426p | 454p | 451p | ||||||||||||||||||||||||||
Weighted average exercise price | 250p | n/a | 362p | n/a | 385p | n/a | ||||||||||||||||||||||||||
Expected dividend yield | 3.12% – 3.21% | n/a | 2.9% – 3.4% | n/a | 3.2% –3.7% | n/a | ||||||||||||||||||||||||||
Risk free rates | 0.1% – 0.2% | 0.2% | 0.5% – 0.8% | 0.6% | 0.7% – 1.6% | 0.7% | ||||||||||||||||||||||||||
Expected volatility | 23.1% – 24.3% | 23.6% | 19.0% –21.5% | 21.8% | 19.7% –22.7% | 22.0% | ||||||||||||||||||||||||||
Employee Saveshare grants are valued using a Binomial options pricing model. Awards under the ISP are valued using Monte Carlo simulations. TSRs are generated for BT and the comparator group at the end of the three-year performance period, using each company’s volatility and the cross correlation between pairs of stocks.
Volatility has been determined by reference to BT Group plc’s historical volatility which is expected to reflect the BT Group plc’s share price in the future. An expected life of three months after vesting date is assumed for Employee Saveshare options. For all other awards the expected life is equal to the vesting period. The risk-free interest rate is based on the UK gilt curve in effect at the time of the grant, for the expected life of the option or award.
The fair values for the DBP and RSP were determined using the market price of the shares at the grant date. The weighted average share price for DBP awards granted in 2017/18 was 282p (2016/17: 421p, 2015/16: 451p) and for RSP awards granted in 2017/18 it was 282p (2016/17: 417p, 2015/16: 420p).
| British Telecommunications plc Annual Report & Form 20-F 2018 | 151 | |||||
Table of Contents
Notes to the consolidated financial statements continued
| At 31 March | 2018 £m | 2017 £m | 2016 £m | |||||||||
Non-current assets | ||||||||||||
Available-for-sale | 46 | 37 | 39 | |||||||||
Amounts owed by ultimate parent company | 2,983 | 1,371 | 1,409 | |||||||||
Amounts owed by parent company | 10,318 | 10,191 | 10,510 | |||||||||
Fair value through profit or loss | 7 | 7 | 7 | |||||||||
| 13,354 | 11,606 | 11,965 | ||||||||||
Current assets | ||||||||||||
Available-for-sale | 2,575 | 1,437 | 2,878 | |||||||||
Amounts owed by ultimate parent company | 34 | 28 | 26 | |||||||||
Amounts owed by parent company | 168 | 192 | 327 | |||||||||
Loans and receivables | 447 | 83 | 40 | |||||||||
| 3,224 | 1,740 | 3,271 | ||||||||||
Loans and receivables are held on the balance sheet at amortised cost and this approximates fair value. Loans and receivables consist of investments in term deposits denominated in Sterling of £416m (2016/17: £35m, 2015/16: £10m), in US Dollars of £27m (2016/17: £30m, 2015/16: £30m) and in other currencies £4m (2016/17: £18m, 2015/16: £nil).
Fair value hierarchy At 31 March 2018 | Level 1 £m | Level 2 £m | Level 3 £m | Total held at fair value £m | ||||||||||||
Non-current and current investments | ||||||||||||||||
Available-for-sale investments | 32 | 2,575 | 14 | 2,621 | ||||||||||||
Fair value through profit or loss | 7 | – | – | 7 | ||||||||||||
Total | 39 | 2,575 | 14 | 2,628 | ||||||||||||
| At 31 March 2017 | Level 1 £m | Level 2 £m | Level 3 £m | Total held at fair value £m | ||||||||||||
Non-current and current investments | ||||||||||||||||
Available-for-sale investments | 21 | 1,437 | 16 | 1,474 | ||||||||||||
Fair value through profit or loss | 7 | – | – | 7 | ||||||||||||
Total | 28 | 1,437 | 16 | 1,481 | ||||||||||||
| At 31 March 2016 | Level 1 £m | Level 2 £m | Level 3 £m | Total held at fair value £m | ||||||||||||
Non-current and current investments | ||||||||||||||||
Available-for-sale investments | 24 | 2,878 | 15 | 2,917 | ||||||||||||
Fair value through profit or loss | 7 | – | – | 7 | ||||||||||||
Total | 31 | 2,878 | 15 | 2,924 | ||||||||||||
The three levels of valuation methodology used are:
Level 1 – uses quoted prices in active markets for identical assets or liabilities.
Level 2 – uses inputs for the asset or liability other than quoted prices, that are observable either directly or indirectly.
Level 3 – uses inputs for the asset or liability that are not based on observable market data, such as internal models or other valuation method.
Level 2 balances classified asavailable-for-sale consist of investments in liquidity funds denominated in Sterling of £2,180m (2016/17: £900m, 2015/16: £2,430m) and in Euros of £395m (2016/17: £537m, 2015/16: £448m). The fair value of liquidity fund is calculated by using notional currency amounts adjusted by year end spot exchange rates.
Level 3 balances consist ofavailable-for-sale investments of £14m (2016/17: £16m, 2015/16: £15m) which represent investments in a number of private companies. In the absence of specific market data, these investments are held at cost, adjusted as necessary for impairments, which approximates to fair value.
| 152 | British Telecommunications plc Annual Report & Form 20-F 2018 | |||||
Table of Contents
| THE STRATEGIC REPORT | GOVERNANCE | FINANCIAL STATEMENTS | ADDITIONAL INFORMATION | |||||||||
|
|
| ||||||||||
| At 31 March | 2018 £m | 2017 £m | 2016 £m | |||||||||
Cash at bank and in hand | 439 | 467 | 893 | |||||||||
Cash equivalents | ||||||||||||
Loans and receivables | ||||||||||||
US deposits | 26 | 32 | 44 | |||||||||
UK deposits | 31 | 1 | 20 | |||||||||
Other deposits | 25 | 26 | 32 | |||||||||
Total cash equivalents | 82 | 59 | 96 | |||||||||
Total cash and cash equivalents | 521 | 526 | 989 | |||||||||
Bank overdrafts (note 23) | (29 | ) | (17 | ) | (537 | ) | ||||||
Cash and cash equivalents per the cash flow statement | 492 | 509 | 452 | |||||||||
The group’s cash and cash equivalents include restricted cash of £32m (2016/17: £43m, 2015/16: £51m), of which £29m (2016/17: £41m, 2015/16: £44m) was held in countries where local capital or exchange controls currently prevent us from accessing cash balances. The remaining balance of £3m (2016/17: £2m, 2015/16: £7m) was held in escrow accounts, or in commercial arrangements akin to escrow.
Cash equivalents are classified as loans and receivables and are held on the group balance sheet at amortised cost which equates to fair value.
| British Telecommunications plc Annual Report & Form 20-F 2018 | 153 | |||||
Table of Contents
Notes to the consolidated financial statements continued
23. Loans and other borrowings
Capital management policy
The capital structure is managed by BT Group plc, the ultimate parent of the group. Its capital management policy is set out in theReport of the Directorson page 90.
The table below shows the key components of external gross debt and of the increase of £2,195m this year.
| At 1 April 2017 £m | Issuance/ (maturities) £m | Fair value movements £m | Foreign exchange £m | Transfer to within one year £m | Accrued interest movements £m | At 31 March 2018 £m | ||||||||||||||||||||||
Debt due within one yeara | 2,632 | (1,401 | ) | (18 | ) | (95 | ) | 1,163 | – | 2,281 | ||||||||||||||||||
Debt due after one year | 10,081 | 3,760 | (60 | ) | (440 | ) | (1,347 | ) | – | 11,994 | ||||||||||||||||||
Cash flows from Derivatives related to net debt | – | (188 | ) | – | – | 188 | – | – | ||||||||||||||||||||
Overdrafts | – | 4 | – | – | (4 | ) | – | – | ||||||||||||||||||||
Impact of cross-currency swapsb | (1,419 | ) | – | – | 545 | – | – | (874) | ||||||||||||||||||||
Removal of the accrued interest and fair value adjustmentsc | (314 | ) | – | 78 | – | – | 10 | (226) | ||||||||||||||||||||
External gross debt | 10,980 | 2,175 | – | 10 | – | 10 | 13,175 | |||||||||||||||||||||
| a | Including accrued interest and bank overdrafts. |
| b | Translation of debt balances at swap rates where hedged by cross currency swaps. |
| c | Removal of accrued interest applied to reflect the effective interest rate method and removal of fair value adjustments. |
The table below gives the details of the listed bonds and other debt.
| At 31 March | 2018 £m | 2017 £m | 2016 £m | |||||||||
1.625% US$600m bond due June 2016a | – | – | 419 | |||||||||
8.50% £678m bond due December 2016 (minimum 7.50%b) | – | – | 696 | |||||||||
3.5%€500m bond due February 2017a | – | – | 398 | |||||||||
1.25% US$500m bond due February 2017a | – | – | 348 | |||||||||
6.625% £500m bond due June 2017a | – | 526 | 525 | |||||||||
5.95% US$1,100m bond due January 2018a | – | 891 | 775 | |||||||||
3.25%€600m bond due August 2018a | 541 | 539 | 510 | |||||||||
2.35% US$800m bond due February 2019a | 572 | 642 | 558 | |||||||||
4.38% £450m bond due March 2019 | 455 | 460 | 464 | |||||||||
1.125%€1,000m bond due June 2019a | 883 | 863 | 800 | |||||||||
8.625% £300m bond due March 2020 | 300 | 300 | 300 | |||||||||
0.625%€1,500m bond due March 2021a | 1,309 | 1,282 | 1,190 | |||||||||
0.5%€575m bond due June 2022a | 502 | – | – | |||||||||
1.125%€1,100m bond due March 2023a | 961 | 942 | 873 | |||||||||
1%€575m bond due June 2024a | 506 | – | – | |||||||||
1%€1,100m bond due November 2024a | 959 | – | – | |||||||||
3.50% £250m index linked bond due April 2025 | 419 | 403 | 396 | |||||||||
1.75%€1,300m bond due March 2026a | 1,137 | 1,113 | 1,032 | |||||||||
1.5%€1,150m bond due June 2027a | 1,009 | – | – | |||||||||
5.75% £600m bond due December 2028 | 721 | 731 | 741 | |||||||||
9.125% US$2,670m bond due December 2030a(minimum 8.625%b) | 1,943 | 2,191 | 1,910 | |||||||||
3.125% £500m bond due November 2031 | 502 | – | – | |||||||||
6.375% £500m bond due June 2037a | 522 | 522 | 522 | |||||||||
3.625% £250m bond due November 2047 | 250 | – | – | |||||||||
Total listed bonds | 13,491 | 11,405 | 12,457 | |||||||||
Finance leases | 223 | 229 | 233 | |||||||||
LIBOR + 0.95% £438m Syndicated loan facilities due April 2016 | – | – | 438 | |||||||||
2.21% £350m bank loan due December 2017 | – | 352 | 354 | |||||||||
Acquisition facility | – | – | 181 | |||||||||
Other loans | 532 | 710 | 561 | |||||||||
Bank overdrafts (note 22) | 29 | 17 | 537 | |||||||||
Amounts due to ultimate companyc | 1,061 | 1,183 | 1,024 | |||||||||
Total other loans and borrowings | 1,622 | 2,262 | 3,095 | |||||||||
Total loans and borrowings | 15,336 | 13,896 | 15,785 | |||||||||
| a | Designated in a cash flow hedge relationship. |
| b | The interest rate payable on this bond attracts an additional 0.25% for a downgrade by one credit rating by either Moody’s or S&P to the group’s senior unsecured debt below A3/A–respectively. In addition, if Moody’s or S&P subsequently increase the ratings then the interest rate will be decreased by 0.25% for each rating category upgrade by each rating agency. In no event will the interest rate be reduced below the minimum rate reflected in the above table. |
| c | Amounts due to ultimate parent company are denominated in Sterling and incur a floating rate of interest based on LIBOR. |
| 154 | British Telecommunications plc Annual Report & Form 20-F 2018 | |||||
Table of Contents
| THE STRATEGIC REPORT | GOVERNANCE | FINANCIAL STATEMENTS | ADDITIONAL INFORMATION | |||||||||
|
|
| ||||||||||
Unless previously designated in a fair value hedge relationship, all loans and other borrowings are carried on our balance sheet at amortised cost and in the table above. The fair value of listed bonds and other long-term borrowings is £14,878m (2016/17: £13,496m, 2015/16: £14,500m) and the fair value of finance leases is £253m (2016/17: £273m, 2015/16: £284m).
The fair value of our bonds and other long-term borrowings is estimated on the basis of quoted market prices (Level 1), or based on similar issuances where they exist (Level 2). The carrying amount of other loans and bank overdrafts equates to fair value due to the short maturity of these items (Level 3).
The interest rates payable on loans and borrowings disclosed above reflect the coupons on the underlying issued loans and borrowings and not the interest rates achieved through applying associated cross-currency and interest rate swaps in hedge arrangements.
Loans and other borrowings are analysed as follows:
| At 31 March | 2018 £m | 2017 £m | 2016 £m | |||||||||
Current liabilities | ||||||||||||
Listed bonds | 1,702 | 1,539 | 2,013 | |||||||||
Finance leases | 18 | 15 | 8 | |||||||||
Bank loans | – | 352 | – | |||||||||
Syndicated loan facilities | – | – | 619 | |||||||||
Other loans and bank overdraftsa | 561 | 726 | 1,096 | |||||||||
Amounts due to ultimate parent company | 17 | 159 | 20 | |||||||||
Total current liabilities | 2,298 | 2,791 | 3,756 | |||||||||
Non-current liabilities | ||||||||||||
Listed bonds | 11,789 | 9,866 | 10,444 | |||||||||
Finance leases | 205 | 214 | 225 | |||||||||
Bank loans | – | – | 354 | |||||||||
Other loans | – | 1 | 2 | |||||||||
Amounts due to ultimate parent company | 1,044 | 1,024 | 1,004 | |||||||||
Totalnon-current liabilities | 13,038 | 11,105 | 12,029 | |||||||||
Total | 15,336 | 13,896 | 15,785 | |||||||||
| a | Includes collateral received on swaps of £525m (2016/17: £702m, 2015/16: £553m). |
The carrying values disclosed in the above table reflect balances at amortised cost adjusted for accrued interest and fair value adjustments to the relevant loans or borrowings. These do not reflect the final principal repayments that will arise after taking account of the relevant derivatives in hedging relationships which are reflected in the table below. Apart from finance leases, all borrowings as at 31 March 2018, 2017 and 2016 were unsecured.
The principal repayments of loans and borrowings at hedged rates amounted to £14,219m (2016/17: £12,138m, 2015/16:
£14,756m) and repayments fall due as follows:
| 2018 | 2017 | 2016 | ||||||||||||||||||||||||||||||||||||||
| Effect of | Principal | Effect of | Principal | Effect of | Principal | |||||||||||||||||||||||||||||||||||
| hedging | repayments | hedging | repayments | hedging | repayments | |||||||||||||||||||||||||||||||||||
| Carrying | and | at hedged | Carrying | and | at hedged | Carrying | and | at hedged | ||||||||||||||||||||||||||||||||
| amount | interest | rates | amount | interest | rates | amount | interest | rates | ||||||||||||||||||||||||||||||||
| At 31 March | £m | £m | £m | £m | £m | £m | £m | £m | £m | |||||||||||||||||||||||||||||||
Within one year, or on demand | 2,289 | (308 | ) | 1,981 | 2,791 | (523 | ) | 2,268 | 3,756 | (252 | ) | 3,504 | ||||||||||||||||||||||||||||
Between one and two years | 1,192 | (66 | ) | 1,126 | 1,614 | (197 | ) | 1,417 | 1,632 | (216 | ) | 1,416 | ||||||||||||||||||||||||||||
Between two and three years | 1,332 | (154 | ) | 1,178 | 1,166 | (43 | ) | 1,123 | 1,488 | (72 | ) | 1,416 | ||||||||||||||||||||||||||||
Between three and four years | 18 | – | 18 | 1,295 | (121 | ) | 1,174 | 1,103 | 18 | 1,121 | ||||||||||||||||||||||||||||||
Between four and five years | 1,489 | (111 | ) | 1,378 | 12 | – | 12 | 1,199 | (26 | ) | 1,173 | |||||||||||||||||||||||||||||
After five years | 8,943 | (405 | ) | 8,538 | 6,868 | (724 | ) | 6,144 | 6,428 | (302 | ) | 6,126 | ||||||||||||||||||||||||||||
Total due for repayment after more than one year | 12,974 | (736 | ) | 12,238 | 10,955 | (1,085 | ) | 9,870 | 11,850 | (598 | ) | 11,252 | ||||||||||||||||||||||||||||
Total repayments | 15,263 | (1,044 | ) | 14,219 | 13,746 | (1,608 | ) | 12,138 | 15,606 | (850 | ) | 14,756 | ||||||||||||||||||||||||||||
Fair value adjustments | 73 | 150 | 179 | |||||||||||||||||||||||||||||||||||||
Total loans and other borrowings | 15,336 | 13,896 | 15,785 | |||||||||||||||||||||||||||||||||||||
| British Telecommunications plc Annual Report & Form 20-F 2018 | 155 | |||||
Table of Contents
Notes to the consolidated financial statements continued
Obligations under finance leases are analysed as follows:
| 2018 | 2017 | 2016 | 2018 | 2017 | 2016 | |||||||||||||||||||||
| Minimum lease payments | Repayment of outstanding lease obligations | |||||||||||||||||||||||||
| At 31 March | £m | £m | £m | £m | ||||||||||||||||||||||
Amounts payable under finance leases: | ||||||||||||||||||||||||||
Due within one year | 33 | 29 | 13 | 18 | 14 | 8 | ||||||||||||||||||||
Between two to five years | 122 | 102 | 105 | 71 | 50 | 51 | ||||||||||||||||||||
After five years | 193 | 237 | 265 | 130 | 165 | 174 | ||||||||||||||||||||
| 348 | 368 | 383 | 219 | 229 | 233 | |||||||||||||||||||||
Less: future finance charges | (129 | ) | (139 | ) | (150 | ) | – | – | – | |||||||||||||||||
Fair value adjustments for purchase price adjustment | 4 | – | – | 4 | – | – | ||||||||||||||||||||
Total finance lease obligations | 223 | 229 | 233 | 223 | 229 | 233 | ||||||||||||||||||||
Assets held under finance leases mainly consist of buildings and network assets. Our obligations under finance leases are secured by the lessors’ title to the leased assets.
| Year ended 31 March | 2018 £m | 2017 £m | 2016 £m | |||||||||
Finance expense | ||||||||||||
Interest on: | ||||||||||||
Financial liabilities at amortised cost and associated derivatives | 478 | 567 | 489 | |||||||||
Finance leases | 16 | 15 | 14 | |||||||||
Derivatives | 14 | 12 | 11 | |||||||||
Fair value movements on derivatives not in a designated hedge relationship | 1 | (2 | ) | (5 | ) | |||||||
Reclassification of cash flow hedge from other comprehensive income | 34 | (1 | ) | 3 | ||||||||
Unwinding of discount on provisions | 15 | 16 | 8 | |||||||||
Interest payable on ultimate parent company borrowings | 18 | 25 | 20 | |||||||||
Total finance expense before specific items | 576 | 632 | 540 | |||||||||
Specific items (note 8) | 218 | 210 | 229 | |||||||||
Total finance expense | 794 | 842 | 769 | |||||||||
| Year ended 31 March | 2018 £m | 2017 £m | 2016 £m | |||||||||
Finance income | ||||||||||||
Interest onavailable-for-sale investments | 5 | 6 | 8 | |||||||||
Interest on loans and receivables | 7 | 7 | 6 | |||||||||
Other interest and similar income | – | – | 23 | |||||||||
Interest income on loans to immediate and ultimate parent company | 203 | 219 | 352 | |||||||||
Total finance income | 215 | 232 | 389 | |||||||||
| Year ended 31 March | 2018 £m | 2017 £m | 2016 £m | |||||||||
Net finance expense before specific items | 361 | 400 | 151 | |||||||||
Specific items (note 8) | 218 | 210 | 229 | |||||||||
Net finance expense | 579 | 610 | 380 | |||||||||
| 156 | British Telecommunications plc Annual Report & Form 20-F 2018 | |||||
Table of Contents
| THE STRATEGIC REPORT | GOVERNANCE | FINANCIAL STATEMENTS | ADDITIONAL INFORMATION | |||||||||
|
|
| ||||||||||
25. Financial instruments and risk management
Risk management is performed by BT Group plc, the ultimate parent company of the group.
We issue or hold financial instruments mainly to finance our operations; to finance corporate transactions such as dividends, share buybacks and acquisitions; for the temporary investment of short-term funds; and to manage currency and interest rate risks. In addition, various financial instruments, for example trade receivables and payables arise directly from operations.
How do we manage financial risk?
Our activities expose us to a variety of financial risks: market risk (including interest rate risk and foreign exchange risk), credit risk and liquidity risk.
Treasury operation
We have a centralised treasury operation whose primary role is to manage liquidity and funding requirements as well as our exposure to associated financial and market risks, including credit risk, interest rate risk and foreign exchange risk.
Treasury policy
Treasury policy is set by the BT Group plc Board. Group treasury activities are subject to a set of controls appropriate for the magnitude of borrowing, investments and group-wide exposures. The BT Group plc Board has delegated authority to operate these policies to a series of panels responsible for the management of key treasury risks and operations. Appointment to and removal from the key panels requires approval from two of the following: the chairman, the chief executive or the chief financial officer BT Group plc.
There has been no change in the nature of our risk profile between 31 March 2018 and the date of approval of these financial statements.
How do we manage interest rate risk?
Management policy
Interest rate risk arises primarily from our long-term borrowings. Interest cash flow risk arises from borrowings issued at variable rates, partially offset by cash held at variable rates. Fair value interest rate risk arises from borrowings issued at fixed rates.
Our policy, as set by the BT Group plc Board, is to ensure that at least 70% of BT Group plc’s ongoing net debt is at fixed rates. Short-term interest rate management is delegated to the treasury operation while long-term interest rate management decisions require further approval by the BT Group plc group chief financial officer, group director tax, treasury and insurance or the group treasurer who each have been delegated such authority from the BT Group plc Board.
Hedging strategy
In order to manage our interest rate profile, we have entered into cross-currency and interest rate swap agreements to vary the amounts and periods for which interest rates on borrowings are fixed. The duration of the swap agreements matches the duration of the debt instruments. The majority of the group’s long-term borrowings are subject to fixed Sterling interest rates after applying the impact of these hedging instruments.
How do we manage foreign exchange risk?
Management policy
Foreign currency hedging activities protect the group from the risk that changes in exchange rates will adversely affect future net cash flows.
The BT Group plc Board’s policy for foreign exchange risk management defines the types of transactions typically covered, including significant operational, funding and currency interest exposures, and the period over which cover should extend for each type of transaction.
The BT Group plc Board has delegated short-term foreign exchange management to the treasury operation and long-term foreign exchange management decisions require further approval from the BT Group plc group chief financial officer, group director tax, treasury and insurance or the group treasurer.
Hedging strategy
A significant proportion of our external revenue and costs arise within the UK and are denominated in Sterling. Ournon-UK operations generally trade and are funded in their functional currency which limits their exposure to foreign exchange volatility.
| British Telecommunications plc Annual Report & Form 20-F 2018 | 157 | |||||
Table of Contents
Notes to the consolidated financial statements continued
We enter into forward currency contracts to hedge foreign currency capital purchases, purchase and sale commitments, interest expense and foreign currency investments. The commitments hedged are principally denominated in US Dollar, Euro and Asia Pacific region currencies. As a result, our exposure to foreign currency arises mainly onnon-UK subsidiary investments and on residual currency trading flows.
We use cross-currency swaps to swap foreign currency borrowings into Sterling.
The table below reflects the currency and interest rate profile of our loans and borrowings after the impact of hedging.
| 2018 | 2017 | 2016 | ||||||||||||||||||||||||||||||||||||||
| Floating | Floating | Floating | ||||||||||||||||||||||||||||||||||||||
| Fixed rate | rate | Fixed rate | rate | Fixed rate | rate | |||||||||||||||||||||||||||||||||||
| interest | interest | Total | interest | interest | Total | interest | interest | Total | ||||||||||||||||||||||||||||||||
| At 31 March | £m | £m | £m | £m | £m | £m | £m | £m | £m | |||||||||||||||||||||||||||||||
Sterling | 11,990 | 1,720 | 13,710 | 9,633 | 1,864 | 11,497 | 11,417 | 2,752 | 14,169 | |||||||||||||||||||||||||||||||
Euro | – | 509 | 509 | – | 641 | 641 | – | 587 | 587 | |||||||||||||||||||||||||||||||
Total | 11,990 | 2,229 | 14,219 | 9,633 | 2,505 | 12,138 | 11,417 | 3,339 | 14,756 | |||||||||||||||||||||||||||||||
Ratio of fixed to floating | 84% | 16% | 100% | 79% | 21% | 100% | 77% | 23% | 100% | |||||||||||||||||||||||||||||||
Weighted average effective fixed interest rate – Sterling | 4.4% | 4.9% | 6.0% | |||||||||||||||||||||||||||||||||||||
The floating rate loans and borrowings bear interest rates fixed in advance for periods ranging from one day to one year, primarily by reference to LIBOR quoted rates.
Sensitivity analysis
The income statement and shareholder’s equity are exposed to volatility arising from changes in interest rates and foreign exchange rates. To demonstrate this volatility, management have concluded that the following are reasonable benchmarks for performing sensitivity analysis:
| – | For interest, a 1% increase in interest rates and parallel shift in yield curves across Sterling, US Dollar and Euro currencies. |
| – | For foreign exchange, a 10% strengthening/weakening in Sterling against other currencies. |
The impact on equity, before tax, of a 1% increase in interest rates and a 10% strengthening in Sterling against other currencies is as detailed below:
| At 31 March | 2018 £m | 2017 £m | 2016 £m | |||||||||
Sterling interest rates | 628 | 554 | 626 | |||||||||
US Dollar interest rates | (267 | ) | (348 | ) | (374 | ) | ||||||
Euro interest rates | (401 | ) | (229 | ) | (263 | ) | ||||||
Sterling strengthening | (236 | ) | (269 | ) | (98 | ) | ||||||
A 1% decrease in interest rates and 10% weakening in Sterling against other currencies would have broadly the same impact in the opposite direction.
The impact on the group’s annual net finance expense of a 1% change in interest rates would have been a decrease of £143m (2016/17: £108m, 2015/16: £123m). Our exposure to foreign exchange volatility in the income statement, after hedging, (excluding translation exposures) would not have been material in 2017/18, 2016/17 and 2015/16.
Credit ratings
BT Group plc continues to target a BBB+/Baa1 credit rating over the cycle. We regularly review the liquidity of the group and our funding strategy takes account of medium-term requirements. These include the pension deficit and shareholder distributions.
Our December 2030 bond contains covenants which require us to pay higher rates of interest since our credit ratings fell below A3 in the case of Moody’s or A– in the case of Standard & Poor’s (S&P). Additional interest of 0.25% per year accrues for each ratings category downgrade by each agency below those levels effective from the next coupon date following a downgrade. Based on the total notional value of debt outstanding of £1.9bn at 31 March 2018, our finance expense would increase/decrease by approximately £10m a year if the group’s credit rating were to be downgraded/upgraded, respectively, by one credit rating category by both agencies.
| 158 | British Telecommunications plc Annual Report & Form 20-F 2018 | |||||
Table of Contents
| THE STRATEGIC REPORT | GOVERNANCE | FINANCIAL STATEMENTS | ADDITIONAL INFORMATION | |||||||||
|
|
| ||||||||||
Our credit ratings were as detailed below:
| 2018 | 2017 | 2016 | ||||||||||||||||||||||||||||||
| At 31 March | Rating | Outlook | Rating | Outlook | Rating | Outlook | ||||||||||||||||||||||||||
Rating agency | ||||||||||||||||||||||||||||||||
Moody’s | Baa2 | Stable | Baa1 | Negative | Baa2 | Positive | ||||||||||||||||||||||||||
Standard & Poor’s | BBB+ | Negative | BBB+ | Negative | BBB | Positive | ||||||||||||||||||||||||||
How do we manage liquidity risk?
Management policy
We maintain liquidity by entering into short and long-term financial instruments to support operational and other funding requirements, determined using short and long-term cash forecasts. These forecasts are supplemented by a financial headroom analysis which is used to assess funding adequacy for at least a12-month period. On at least an annual basis the BT Group plc Board reviews and approves the long-term funding requirements of the group and on an ongoing basis considers any related matters. We manage refinancing risk by limiting the amount of borrowing that matures within any specified period and having appropriate strategies in place to manage refinancing needs as they arise. The maturity profile of our loans and borrowings at 31 March 2018 is disclosed in note 23. We have term debt maturities of £1.6bn in 2018/19.
Our treasury operation reviews and manages our short-term requirements within the parameters of the policies set by the BT Group plc Board. We hold cash, cash equivalents and current investments in order to manage short-term liquidity requirements. At 31 March 2018 we had undrawn committed borrowing facilities of £2.1bn (2016/17: £2.1bn, 2015/16: £1.5bn) maturing in September 2021. The group has no material debt factoring arrangements in place. In the UK, the group has arranged for a funder to offer a supplier financing scheme to the group’s suppliers. This enables suppliers who sign up to the arrangement to sell their invoices to the funder and to be paid earlier than the invoice due date. The group assesses the arrangement against indicators to assess if debts which vendors have sold to the funder under the supplier financing scheme continue to meet the requirement to be disclosed as trade payables or should be classified as borrowings. At 31 March 2018 the payables met the criteria of trade payables.
Maturity analysis
The following table provides an analysis of the remaining contractually-agreed cash flows including interest payable for ournon-derivative financial liabilities on an undiscounted basis, which therefore differs from both the carrying value and fair value.
Non-derivative financial liabilities At 31 March 2018 | Loans and other borrowings £m | Interest on and other | Trade and other payables £m | Provisions £m | Total £m | |||||||||||||||
Due within one year | 2,120 | 468 | 4,961 | 54 | 7,603 | |||||||||||||||
Between one and two years | 1,192 | 421 | – | 34 | 1,647 | |||||||||||||||
Between two and three years | 1,332 | 381 | – | 25 | 1,738 | |||||||||||||||
Between three and four years | 18 | 374 | – | 43 | 435 | |||||||||||||||
Between four and five years | 1,489 | 372 | – | 19 | 1,880 | |||||||||||||||
After five years | 8,943 | 3,300 | – | 197 | 12,440 | |||||||||||||||
| 15,094 | 5,316 | 4,961 | 372 | 25,743 | ||||||||||||||||
Interest payments not yet accrued | – | (5,147 | ) | – | – | (5,147 | ) | |||||||||||||
Fair value adjustment | 73 | – | – | – | 73 | |||||||||||||||
Impact of discounting | – | – | – | (72 | ) | (72 | ) | |||||||||||||
Carrying value on the balance sheeta | 15,167 | 169 | 4,961 | 300 | 20,597 | |||||||||||||||
| a | Foreign currency-related cash flows were translated at closing rates as at the relevant reporting date. Future variable interest rate cash flows were calculated using the most recent rate applied at the relevant balance sheet date. |
| British Telecommunications plc Annual Report & Form 20-F 2018 | 159 | |||||
Table of Contents
Notes to the consolidated financial statements continued
Non-derivative financial liabilities At 31 March 2017 | Loans and other borrowings £m | Interest on and other | Trade and other payables £m | Provisions £m | Total £m | |||||||||||||||
Due within one year | 2,602 | 532 | 5,298 | 62 | 8,494 | |||||||||||||||
Between one and two years | 1,614 | 415 | – | 41 | 2,070 | |||||||||||||||
Between two and three years | 1,166 | 364 | – | 21 | 1,551 | |||||||||||||||
Between three and four years | 1,295 | 327 | – | 18 | 1,640 | |||||||||||||||
Between four and five years | 12 | 319 | – | 17 | 348 | |||||||||||||||
After five years | 6,868 | 2,726 | – | 310 | 9,904 | |||||||||||||||
| 13,557 | 4,683 | 5,298 | 469 | 24,007 | ||||||||||||||||
Interest payments not yet accrued | – | (4,494 | ) | – | – | (4,494 | ) | |||||||||||||
Fair value adjustment | 150 | – | – | – | 150 | |||||||||||||||
Impact of discounting | – | – | – | (177 | ) | (177 | ) | |||||||||||||
Carrying value on the balance sheeta | 13,707 | 189 | 5,298 | 292 | 19,486 | |||||||||||||||
| a | Foreign currency-related cash flows were translated at closing rates as at the relevant reporting date. Future variable interest rate cash flows were calculated using the most recent rate applied at the relevant balance sheet date. |
Non-derivative financial liabilities At 31 March 2016 | Loans and other | Interest on and other | Trade and other payables £m | Provisions £m | Total £m | |||||||||||||||
Due within one year | 3,558 | 513 | 5,346 | 50 | 9,467 | |||||||||||||||
Between one and two years | 1,632 | 435 | – | 30 | 2,097 | |||||||||||||||
Between two and three years | 1,488 | 357 | – | 25 | 1,870 | |||||||||||||||
Between three and four years | 1,103 | 343 | – | 15 | 1,461 | |||||||||||||||
Between four and five years | 1,199 | 308 | – | 16 | 1,523 | |||||||||||||||
After five years | 6,428 | 2,885 | – | 326 | 9,639 | |||||||||||||||
| 15,408 | 4,841 | 5,346 | 462 | 26,057 | ||||||||||||||||
Interest payments not yet accrued | – | (4,643 | ) | – | – | (4,643 | ) | |||||||||||||
Fair value adjustment | 179 | – | – | – | 179 | |||||||||||||||
Impact of discounting | – | – | – | (166 | ) | (166 | ) | |||||||||||||
Carrying value on the balance sheeta | 15,587 | 198 | 5,346 | 296 | 21,427 | |||||||||||||||
| a | Foreign currency-related cash flows were translated at closing rates as at the relevant reporting date. Future variable interest rate cash flows were calculated using the most recent rate applied at the relevant balance sheet date. |
Trade and other payables are held at amortised cost. The carrying amount of these balances approximates to fair value due to the short maturity of amounts payable.
The following table provides an analysis of the contractually agreed cash flows in respect of the group’s derivative financial instruments. Cash flows are presented on a net or gross basis in accordance with the settlement arrangements of the instruments.
| Derivatives – Analysed by earliest payment datea | Derivatives – Analysed based on holding instrument to maturity | |||||||||||||||||||||||||||||||||
Derivative financial liabilities At 31 March 2018 | Net settled £m | Gross settled £m | Gross settled £m | Total £m | Net settled £m | Gross settled £m | Gross settled £m | Total £m | ||||||||||||||||||||||||||
Due within one year | 140 | 587 | (547 | ) | 180 | 91 | 587 | (547 | ) | 131 | ||||||||||||||||||||||||
Between one and two years | 135 | 183 | (166 | ) | 152 | 91 | 183 | (166 | ) | 108 | ||||||||||||||||||||||||
Between two and three years | 156 | 442 | (446 | ) | 152 | 85 | 69 | (47 | ) | 107 | ||||||||||||||||||||||||
Between three and four years | 143 | 52 | (29 | ) | 166 | 80 | 68 | (47 | ) | 101 | ||||||||||||||||||||||||
Between four and five years | 161 | 52 | (29 | ) | 184 | 80 | 68 | (47 | ) | 101 | ||||||||||||||||||||||||
After five years | 291 | 2,234 | (2,149 | ) | 376 | 599 | 2,575 | (2,512 | ) | 662 | ||||||||||||||||||||||||
Totalb | 1,026 | 3,550 | (3,366 | ) | 1,210 | 1,026 | 3,550 | (3,366 | ) | 1,210 | ||||||||||||||||||||||||
| b | Foreign currency-related cash flows were translated at closing rates as at the relevant reporting date. Future variable interest rate cash flows were calculated using the most recent rate applied at the relevant balance sheet date. |
| 160 | British Telecommunications plc Annual Report & Form 20-F 2018 | |||||
Table of Contents
| THE STRATEGIC REPORT | GOVERNANCE | FINANCIAL STATEMENTS | ADDITIONAL INFORMATION | |||||||||
|
|
| ||||||||||
| Derivatives – Analysed by earliest payment datea | Derivatives – Analysed based on holding instrument to maturity | |||||||||||||||||||||||||||||||||
Derivative financial liabilities At 31 March 2017 | Net settled £m | Gross settled £m | Gross settled £m | Total £m | Net settled £m | Gross settled £m | Gross settled £m | Total £m | ||||||||||||||||||||||||||
Due within one year | 291 | 582 | (576 | ) | 297 | 92 | 582 | (576 | ) | 98 | ||||||||||||||||||||||||
Between one and two years | 296 | 1,139 | (1,097 | ) | 338 | 92 | 1,139 | (1,097 | ) | 134 | ||||||||||||||||||||||||
Between two and three years | 198 | – | – | 198 | 92 | – | – | 92 | ||||||||||||||||||||||||||
Between three and four years | 114 | – | – | 114 | 88 | – | – | 88 | ||||||||||||||||||||||||||
Between four and five years | 104 | – | – | 104 | 83 | – | – | 83 | ||||||||||||||||||||||||||
After five years | 123 | – | – | 123 | 679 | – | – | 679 | ||||||||||||||||||||||||||
Totalb | 1,126 | 1,721 | (1,673 | ) | 1,174 | 1,126 | 1,721 | (1,673 | ) | 1,174 | ||||||||||||||||||||||||
| Derivatives – Analysed by earliest payment datea | Derivatives –Analysed based on holding instrument to maturity | |||||||||||||||||||||||||||||||||
Derivative financial liabilities At 31 March 2016 | Net settled £m | Gross settled £m | Gross settled £m | Total £m | Net settled £m | Gross settled £m | Gross settled £m | Total £m | ||||||||||||||||||||||||||
Due within one year | 268 | 263 | (250 | ) | 281 | 91 | 263 | (250 | ) | 104 | ||||||||||||||||||||||||
Between one and two years | 386 | 38 | (27 | ) | 397 | 88 | 38 | (27 | ) | 99 | ||||||||||||||||||||||||
Between two and three years | 371 | 38 | (27 | ) | 382 | 88 | 38 | (27 | ) | 99 | ||||||||||||||||||||||||
Between three and four years | 60 | 838 | (836 | ) | 62 | 90 | 838 | (836 | ) | 92 | ||||||||||||||||||||||||
Between four and five years | 81 | 17 | (18 | ) | 80 | 84 | 17 | (18 | ) | 83 | ||||||||||||||||||||||||
After five years | – | 165 | (180 | ) | (15 | ) | 725 | 165 | (180 | ) | 710 | |||||||||||||||||||||||
Totalb | 1,166 | 1,359 | (1,338 | ) | 1,187 | 1,166 | 1,359 | (1,338 | ) | 1,187 | ||||||||||||||||||||||||
| a | Certain derivative financial instruments contain break clauses whereby either the group or bank counterparty can terminate the swap on certain dates and the mark to market position is settled in cash. |
| b | Foreign currency-related cash flows were translated at closing rates as at the relevant reporting date. Future variable interest rate cash flows were calculated using the most recent rate applied at the relevant balance sheet date. |
How do we manage credit risk?
Management policy
Our exposure to credit risk arises from financial assets transacted by the treasury operation (primarily derivatives, investments, cash and cash equivalents) and from trading-related receivables.
For treasury-related balances, the BT Group plc Board’s defined policy restricts exposure to any one counterparty by setting credit limits based on the credit quality as defined by Moody’s and S&P. The minimum credit ratings permitted with counterparties in respect of new transactions are A3/A– for long-term and P1/A1 for short-term investments. If counterparties in respect of existing transactions fall below the permitted criteria we will take action where appropriate.
The treasury operation continuously reviews the limits applied to counterparties and will adjust the limit according to the nature and credit standing of the counterparty, and in response to market conditions, up to the maximum allowable limit set by the BT Group plc Board.
Operational management policy
Our credit policy for trading-related financial assets is applied and managed by each of the customer-facing units to ensure compliance. The policy requires that the creditworthiness and financial strength of customers are assessed at inception and on an ongoing basis. Payment terms are set in accordance with industry standards. Where appropriate, we may minimise risks by requesting securities such as deposits, guarantees and letters of credit. We take proactive steps including constantly reviewing credit ratings of counterparties to minimise the impact of adverse market conditions on trading-related financial assets.
Exposures
The maximum credit risk exposure of the group’s financial assets at the balance sheet date is as follows:
| At 31 March | Notes | 2018 £m | 2017 £m | 2016 £m | ||||||||||||||||
Derivative financial assets | 1,509 | 2,246 | 1,639 | |||||||||||||||||
Investments | 21 | 16,578 | 13,346 | 15,236 | ||||||||||||||||
Trade and other receivablesc | 16 | 2,533 | 2,754 | 2,884 | ||||||||||||||||
Cash and cash equivalents | 22 | 521 | 526 | 989 | ||||||||||||||||
| 21,141 | 18,872 | 20,748 | ||||||||||||||||||
| c | The carrying amount excludes £317m (2016/17: £360m, 2015/16: £218m) ofnon-current trade and other receivables which relate tonon-financial assets, and £1,496m (2016/17: £1,106m, 2015/16: £1,103m) of prepayments and other receivables. |
| British Telecommunications plc Annual Report & Form 20-F 2018 | 161 | |||||
Table of Contents
Notes to the consolidated financial statements continued
The credit quality and credit concentration of cash equivalents, current asset investments and derivative financial assets are detailed in the tables below. Where the opinion of Moody’s and S&P differ, the lower rating is used.
| Moody’s/S&P credit rating of counterparty | 2018 £m | 2017 £m | 2016 £m | |||||||||
Aa2/AA and above | 2,575 | 1,444 | 2,878 | |||||||||
Aa3/AA– | 313 | 208 | 120 | |||||||||
A1/A+a | 651 | 952 | 64 | |||||||||
A2/Aa | 628 | 370 | 939 | |||||||||
A3/A–a | 180 | 204 | 160 | |||||||||
Baa1/BBB+a | 59 | 561 | 492 | |||||||||
Baa2/BBB and belowa | 207 | 86 | – | |||||||||
| 4,613 | 3,825 | 4,653 | ||||||||||
| a | We hold cash collateral of £492m (2016/17: £702m, 2015/16: £553m) in respect of derivative financial assets with certain counterparties. |
The concentration of credit risk for our trading balances is provided in note 16, which analyses outstanding balances by customer-facing unit. Where multiple transactions are undertaken with a single financial counterparty or group of related counterparties, we enter into netting arrangements to reduce our exposure to credit risk by making use of standard International Swaps and Derivatives Association (ISDA) documentation. We have also entered into credit support agreements with certain swap counterparties whereby, on a daily, weekly and monthly basis, the fair value position on notional £3,162m of long dated cross-currency swaps and interest rate swaps is collateralised. The related net cash outflow during the year was £220m (2016/17: inflow £100m, 2015/16: inflow £79m). The collateral paid and received is recognised within current asset investments and loans and other borrowings, respectively.
Offsetting of financial instruments
The table below shows our financial assets and liabilities that are subject to offset in the group’s balance sheet and the impact of enforceable master netting or similar agreements.
| Related amounts not set off in the balance sheet | ||||||||||||||||||
Financial assets and liabilities At 31 March 2018 | Amounts presented in the balance sheet £m | Right of set off with derivative counterparties £m | Cash collateral £m | Net amount £m | ||||||||||||||
Derivative financial assets | 1,509 | (754 | ) | (492 | ) | 263 | ||||||||||||
Derivative financial liabilities | (837 | ) | 754 | 60 | (23 | ) | ||||||||||||
Total | 672 | – | (432 | ) | 240 | |||||||||||||
| Related amounts not set off in the balance sheet | ||||||||||||||||||
Financial assets and liabilities At 31 March 2017 | Amounts presented in the balance sheet £m | Right of set off with derivative counterparties £m | Cash collateral £m | Net amount £m | ||||||||||||||
Derivative financial assets | 2,246 | (693 | ) | (702 | ) | 851 | ||||||||||||
Derivative financial liabilities | (903 | ) | 693 | 64 | (146 | ) | ||||||||||||
Total | 1,343 | – | (638 | ) | 705 | |||||||||||||
| Related amounts not set off in the balance sheet | ||||||||||||||||||
Financial assets and liabilities At 31 March 2016 | Amounts presented in the balance sheet £m | Right of set off with derivative counterparties £m | Cash collateral £m | Net amount £m | ||||||||||||||
Derivative financial assets | 1,639 | (456 | ) | (553 | ) | 630 | ||||||||||||
Derivative financial liabilities | (911 | ) | 456 | 40 | (415 | ) | ||||||||||||
Total | 728 | – | (513 | ) | 215 | |||||||||||||
| 162 | British Telecommunications plc Annual Report & Form 20-F 2018 | |||||
Table of Contents
| THE STRATEGIC REPORT | GOVERNANCE | FINANCIAL STATEMENTS | ADDITIONAL INFORMATION | |||||||||
|
|
| ||||||||||
Derivatives
All of our derivative financial instruments are held at fair value on the balance sheet. The fair values of outstanding swaps and foreign exchange contracts are estimated using discounted cash flow models and market rates of interest and foreign exchange at the balance sheet date.
| At 31 March 2018 | Current asset £m | Non-current asset £m | Current liability £m | Non-current liability £m | ||||||||||||
Designated in a cash flow hedge | 187 | 1,061 | 41 | 587 | ||||||||||||
Other | 10 | 251 | 9 | 200 | ||||||||||||
Total derivatives | 197 | 1,312 | 50 | 787 | ||||||||||||
| At 31 March 2017 | Current asset £m | Non-current £m | Current liability £m | Non-current £m | ||||||||||||
Designated in a cash flow hedge | 417 | 1,508 | 25 | 616 | ||||||||||||
Other | 11 | 310 | 9 | 253 | ||||||||||||
Total derivatives | 428 | 1,818 | 34 | 869 | ||||||||||||
| At 31 March 2016 | Current asset £m | Non-current asset £m | Current liability £m | Non-current liability £m | ||||||||||||
Designated in a cash flow hedge | 166 | 1,158 | 40 | 618 | ||||||||||||
Other | 11 | 304 | 8 | 245 | ||||||||||||
Total derivatives | 177 | 1,462 | 48 | 863 | ||||||||||||
All derivative financial instruments are categorised at Level 2 of the fair value hierarchy as defined in note 21, with the exception of a derivative energy contract which is classified at Level 3. The energy derivative was renegotiated during 2016/17 and has been designated as a cash flow hedge. On initial recognition of this contract a loss of £8m was deferred. The fair value of the energy derivative at 31 March 2018 was a liability of £1m (2016/17: liability of £8m, 2015/16: £nil ). It has been valued using assumptions on volumes, inflation and energy prices.
Hedging activities
Derivatives may qualify as hedges for accounting purposes if they meet the criteria for designation as fair value hedges or cash flow hedges in accordance with IAS 39.
Cash flow hedges
Instruments designated in a cash flow hedge include interest rate swaps and cross-currency swaps hedging Euro- and US Dollar- denominated borrowings. Forward currency contracts are taken out to hedgestep-up interest on currency denominated borrowings relating to the group’s 2030 US Dollar bond. The hedged cash flows will affect the group’s income statement as interest and principal amounts are repaid over the remaining term of the borrowings (see note 23).
We hedge forecast foreign currency purchases, principally denominated in US Dollar, Euro and Asia Pacific currencies 12 months forward with certain specific transactions hedged further forward. The related cash flows are recognised in the income statement over this period.
All cash flow hedges were effective in the period. See note 26 for details of the movements in the cash flow reserve.
Other derivatives
Our policy is not to use derivatives for speculative purposes. However, due to the complex nature of hedge accounting under IAS 39, some derivatives may not qualify for hedge accounting, or are specifically not designated as a hedge where natural offset is more appropriate. Derivative instruments that do not qualify for hedge accounting are classified as held for trading and held at fair value through profit or loss under IAS 39.
| British Telecommunications plc Annual Report & Form 20-F 2018 | 163 | |||||
Table of Contents
Notes to the consolidated financial statements continued
Other comprehensive income | ||||||||||||||||||||||||||||
| | Cash flow reserve £m | a
| | Available- for-sale reserve £m | b
| | Translation reserve £m | c
| | Merger and other reserves £m | d
| | Total £m | | ||||||||||||||
At 1 April 2015 | 55 | 18 | 278 | 858 | 1,209 | |||||||||||||||||||||||
Exchange differences | – | – | 29 | – | 29 | |||||||||||||||||||||||
Net fair value gain on cash flow hedges | 381 | – | – | – | 381 | |||||||||||||||||||||||
Recognised in income and expense | (230 | ) | – | – | – | (230 | ) | |||||||||||||||||||||
Fair value movement onavailable-for-sale assets | – | (2 | ) | – | – | (2 | ) | |||||||||||||||||||||
Tax recognised in other comprehensive income | (33 | ) | – | 38 | – | 5 | ||||||||||||||||||||||
At 1 April 2016 | 173 | 16 | 345 | 858 | 1,392 | |||||||||||||||||||||||
Exchange differences | – | – | 227 | – | 227 | |||||||||||||||||||||||
Net fair value gain on cash flow hedges | 884 | – | – | – | 884 | |||||||||||||||||||||||
Recognised in income and expense | (938 | ) | – | – | – | (938 | ) | |||||||||||||||||||||
Fair value movement onavailable-for-sale assets | – | (3 | ) | – | – | (3 | ) | |||||||||||||||||||||
Tax recognised in other comprehensive income | 8 | – | 21 | – | 29 | |||||||||||||||||||||||
At 31 March 2017 | 127 | 13 | 593 | 858 | 1,591 | |||||||||||||||||||||||
Exchange differencese | – | – | (188 | ) | – | (188 | ) | |||||||||||||||||||||
Net fair value loss on cash flow hedges | (368 | ) | – | – | – | (368 | ) | |||||||||||||||||||||
Recognised in income and expense | 277 | – | – | – | 277 | |||||||||||||||||||||||
Fair value movement onavailable-for-sale assets | – | 11 | – | – | 11 | |||||||||||||||||||||||
Tax recognised in other comprehensive income | 10 | – | (9 | ) | – | 1 | ||||||||||||||||||||||
Transfer to realised profit | (83 | ) | – | – | – | (83 | ) | |||||||||||||||||||||
At 31 March 2018 | (37 | ) | 24 | 396 | 858 | 1,241 | ||||||||||||||||||||||
| a | The cash flow reserve is used to record the effective portion of the cumulative net change in the fair value of cash flow hedging instruments related to hedged transactions that have not yet occurred. Amounts ‘recognised in income and expense’ include a net credit to the cash flow reserve of £295m (2016/17: charge of £941m, 2015/16: charge of £255m) relating to fair value movements on derivatives. The items generating these foreign exchange movements are in designated cash flow hedge relationships. |
| b | Theavailable-for-sale reserve is used to record the cumulative fair value gains and losses onavailable-for-sale financial assets. The cumulative gains and losses are recycled to the income statement on disposal of the assets. |
| c | The translation reserve is used to record cumulative translation differences on the assets and liabilities of foreign operations. The cumulative translation differences are recycled to the income statement on disposal of the foreign operation. |
| d | Excludes £1m (2016/17: £10m, 2015/16: £nil) of exchange differences in relation to retained earnings attributed tonon-controlling interests. |
| 164 | British Telecommunications plc Annual Report & Form 20-F 2018 | |||||
Table of Contents
| THE STRATEGIC REPORT | GOVERNANCE | FINANCIAL STATEMENTS | ADDITIONAL INFORMATION | |||||||||
|
|
| ||||||||||
27. Directors’ emoluments and pensions
The directors at 31 March 2018 were Glyn Parry who served throughout 2017/18 and Patrick Bradley, Neil Harris and Simon Lowth who were appointed on 17 October 2017. Sean Williams served as a director until 29 September 2017 and Linda Bruce-Watt served as a director from 29 September 2017 until 17 October 2017.
For the year ended 31 March 2018 the aggregate emoluments of the directors excluding deferred bonuses of £319,000 (2016/17: £88,000) was £2,525,000 (2016/17: £1,149,000). Deferred bonuses are payable in 5p ordinary shares of BT Group plc in three years’ time subject to continuous employment.
Retirement benefits were accruing to no directors (2016/17: one) under a money purchase scheme.
During the year no director exercised options (2016/17: none) under BT Group share option plans. Six directors who held office for the whole or part of the year (2016/17: three) received or are entitled to receive 5p ordinary shares of BT Group plc under BT long-term incentive plans. The aggregate value of BT Group plc shares which vested to directors during the year under BT long-term incentive plans was £179,000 (2016/17: £2,646,000).
The emoluments of the highest paid director excluding his deferred bonus of £302,400 (2016/17: £36,000) were £1,538,000 (2016/17: £492,000). He is entitled to receive 1,612,997 BT Group plc 5p ordinary shares under BT long-term incentive plans subject to continuous employment and in some cases to certain performance conditions being met.
Included in the above aggregate emoluments are those of Simon Lowth who is also a director of the ultimate holding company, BT Group plc. The directors do not believe it is practicable for the purposes of this report to apportion the amount of total emoluments received by him between his services as director of the company and his services as director of BT Group plc.
The emoluments of the directors are calculated in accordance with the statutory provisions applicable to the company.
28. Related party transactions
Key management personnel comprise executive andnon-executive directors and members of the BT Group plcExecutive Committee as well as the directors of the company.Compensation of key management personnel is disclosed in note 5.
Amounts paid to the group’s retirement benefit plans are set out in note 19.
British Telecommunications plc and certain of its subsidiaries act as a funder and deposit taker for cash related transactions for both its parent and ultimate parent company. The loan arrangements described below with these companies reflect this. Cash transactions usually arise where the parent and ultimate parent company are required to meet their external payment obligations or receive amounts from third parties. These principally relate to the payment of dividends, the buyback of shares, the exercise of share options and the issuance of ordinary shares. Transactions between the ultimate parent company, parent company and the group are settled on both a cash andnon-cash basis through these loan accounts depending on the nature of the transaction.
In 2001/02 the group demerged its former mobile phone business and as a result BT Group plc became the listed ultimate parent company of the remaining group. The demerger steps resulted in the formation of an intermediary holding company, BT Group Investments Limited, between BT Group plc and British Telecommunications plc. This intermediary company held an investment of £18.5bn in British Telecommunications plc which was funded by an intercompany loan facility with British Telecommunications plc.
No dividend was declared in relation to the year ended 31 March 2017 and therefore there was no settlement in the year ended 31 March 2018 (31 March 2017: £2,350m). A dividend of £2,500m has been declared in relation to the year ended 31 March 2018. This was declared after 31 March 2018 so no liability (amount owed to parent company) is recorded in these financial statements. See note 10 and the group statement of changes in equity.
The loan facilities with both the parent company and ultimate parent company accrue interest at a rate of LIBOR plus 102.5 basis points, and are subject to an overall maximum of £25bn and £10bn respectively. The parent company currently finances its obligations on the loan as they fall due through dividends paid by the company.
In 2015/16 the ultimate parent company of the group raised £1.0bn from an equity placing and entered into an additional intercompany loan agreement with British Telecommunications plc for this amount. This amount was raised to support BT Group plc’s planned acquisition of EE.
| British Telecommunications plc Annual Report & Form 20-F 2018 | 165 | |||||
Table of Contents
Notes to the consolidated financial statements continued
A summary of the balances with the parent and ultimate parent companies and the finance income or expense arising in respect of these balances is set out below:
| 2018 | 2017 | 2016 | ||||||||||||||||||||||||||||||||||
| Notes | Asset (liability) at 31 March £m | Finance income (expense) £m | Asset (liability) at 31 March £m | Finance income (expense) £m | Asset (liability) at 31 March £m | Finance income (expense) £m | ||||||||||||||||||||||||||||||
Amounts owed by (to) parent company | ||||||||||||||||||||||||||||||||||||
Loan facility –non-current assets investments | 21,24 | 10,318 | 169 | 10,191 | 191 | 10,510 | 326 | |||||||||||||||||||||||||||||
Loan facility – current asset investments | 21 | 168 | n/a | 192 | n/a | 327 | n/a | |||||||||||||||||||||||||||||
Trade and other payables | 17 | (50 | ) | n/a | (63 | ) | n/a | (70 | ) | n/a | ||||||||||||||||||||||||||
Amounts owed by (to) ultimate parent companya | ||||||||||||||||||||||||||||||||||||
Non-current assets investments | 21,24 | 2,983 | 34 | 1,371 | 28 | 1,409 | 26 | |||||||||||||||||||||||||||||
Non-current liabilities loans | 23 | (1,044 | ) | (18 | ) | (1,024 | ) | (25 | ) | (1,004 | ) | (20 | ) | |||||||||||||||||||||||
Trade and other receivables | 16 | 15 | n/a | 25 | n/a | 9 | n/a | |||||||||||||||||||||||||||||
Current asset investments | 21 | 34 | n/a | 28 | n/a | 26 | n/a | |||||||||||||||||||||||||||||
Current liabilities loans | 23 | (18 | ) | – | (159 | ) | – | (20 | ) | – | ||||||||||||||||||||||||||
a During the year we made cash payments of £1,722m to BT Group plc offset by the receipt of £45m from BT Group plc resulting in net cash outflow of £1,677m. In addition there are non cash movements of £63m onnon-current asset investments relating to interest on loans, employee share schemes and tax settlements made by BT plc on behalf of BT Group plc.
29. Financial commitments and contingent liabilities
Financial commitments were as follows:
| At 31 March | 2018 £m | 2017 £m | ||||||||||
Capital commitments | 993 | 889 | ||||||||||
Other commitments | 362 | 367 | ||||||||||
Device purchase commitments | 262 | 423 | ||||||||||
TV programme rights commitments | 2,823 | 2,644 | ||||||||||
Total | 4,440 | 4,323 | ||||||||||
TV programme rights commitments, mainly relating to football broadcast rights, are those for which the licence period has not yet started.
Future minimum operating lease payments were as follows:
| 2018 £m | 2017 £m | |||||||||||
Payable in the year ending 31 March: | ||||||||||||
2018 | – | 650 | ||||||||||
2019 | 600 | 610 | ||||||||||
2020 | 550 | 558 | ||||||||||
2021 | 513 | 532 | ||||||||||
2022 | 486 | 505 | ||||||||||
2023 | 463 | 475 | ||||||||||
Thereafter | 3,985 | 3,830 | ||||||||||
Total future minimum operating lease payments | 6,597 | 7,160 | ||||||||||
Operating lease commitments were mainly in respect of land and buildings which arose from a sale and operating leaseback transaction in 2001. Leases have an average term of 14 years (2016/17: 15 years) and rentals are fixed for an average of 14 years (2016/17: 15 years).
Other than as disclosed below, there were no contingent liabilities or guarantees at 31 March 2018 other than those arising in the ordinary course of the group’s business and on these no material losses are anticipated. We have insurance cover to certain limits for major risks on property and major claims in connection with legal liabilities arising in the course of our operations. Otherwise, the group generally carries its own risks.
| 166 | British Telecommunications plc Annual Report & Form 20-F 2018 | |||||
Table of Contents
| THE STRATEGIC REPORT | GOVERNANCE | FINANCIAL STATEMENTS | ADDITIONAL INFORMATION | |||||||||
|
|
| ||||||||||
Commitments and guarantees
BDUK
Under the Broadband Delivery UK programme, grants received by the group may be subject to reinvestment or repayment to the customer depending on the level oftake-up.
Telefónica UK Limited leases
We’ve provided guarantees relating to certain leases entered into by Telefónica UK Limited (formerly O2 UK Limited) prior to the demerger of mmO2 from BT on 19 November 2001. mmO2 plc (now part of the Telefónica Group) has given BT a counter indemnity for these guarantees. There is no exposure in the event of credit default in respect of amounts used to defease future lease obligations. The guarantee lasts until Telefónica UK Limited has discharged all its obligations.
Legal proceedings
The group is involved in various legal proceedings, including actual or threatened litigation, government or regulatory investigations. However, save as disclosed below, the group does not currently believe that there are any legal proceedings, or government or regulatory investigations that may have a material adverse impact on the operations or financial condition of the group. In respect of each of the claims below, the nature and progression of such proceedings and investigations can make it difficult to predict the impact they will have on the group. There are many reasons why we cannot make these assessments with certainty, including, among others, that they are in early stages, no damages or remedies have been specified, and/or the often slow pace of litigation.
Italian business
In the prior year, our parent company, BT Group plc, made an announcement with respect to the investigation into our Italian business. The issues in Italy have also resulted in engagement with certain of our regulators and other authorities. We are cooperating fully with these bodies.
Following this announcement, three purported securities class action complaints were filed against BT Group plc and certain current and former officers in United States courts. The two actions brought in New York have since been voluntarily dismissed by the plaintiffs in those actions. On 21 November 2017, the lead plaintiff in the District of New Jersey action filed an amended complaint brought on behalf of purchasers of BT Group ADRs between May 2013 and January 2017, regarding allegations that BT Group plc made materially false and/or misleading statements during the class period. On 22 January 2018 BT Group plc filed a motion to dismiss the amended complaint and the plaintiffs filed their reply to that motion on 23 March 2018. BT Group plc filed a response to their reply on 7 May 2018 and expect the court to schedule oral argument on the motion.
Phones 4U
In December 2016, the administrators of Phones 4U Limited (P4U) started legal proceedings in the High Court in the United Kingdom against EE, claiming payments under a retail trading agreement for sums then due in respect of revenues (net of costs) from certain customers prior to P4U entering administration. This sharing of revenue under the retail trading agreement was due to continue until September 2019, with related payments continuing until April 2021. On 8 May 2018 we reached a confidential agreement with the administrators of P4U to settle this matter. This settlement is in line with the accruals we held to cover potential payments required by EE.
Since 2015 the administrators have separately made allegations that EE and other mobile network operators colluded to procure P4U’s insolvency. We dispute these allegation vigorously and to date no proceedings have been issued.
Hutchinson 3G Limited
In May 2016, Hutchinson 3G Limited (H3G) brought legal proceedings in the High Court in the United Kingdom against EE, alleging breach of contract relating to alleged delays in the roll out of certain free carrier coverage to H3G. H3G is entitled to this free carrier coverage under arrangements agreed following the merger of Orange andT-Mobile, predecessors of EE. H3G claimed damages relating to loss of business of £167m. During the year the parties have resolved this matter to their mutual satisfaction and have discontinued the High Court proceedings.
Brazilian tax claims
The Brazilian state tax authorities have made tax demands against certain Brazilian subsidiaries relating to the Tax on Distribution of Goods and Services (ICMS), an indirect tax imposed on the provision of telecommunications services in Brazil. The state tax authorities are seeking to impose ICMS on revenues earned on activities that the company does not consider as being part of the provision of telecommunications services, such as equipment rental and managed services. We have disputed the basis on which ICMS is imposed and the rate which the tax authorities are seeking to apply. We currently have 32 ICMS cases with a current potential value of £219m all covering assessments made for the period up to 2012, except for one case valued at £1.2m that covers the period 2013 to 2016. The judicial process is likely to take many years. There are eight cases, worth approximately £43m, that are pending appeal before the Sao Paulo Court of Appeal. A hearing for these eight cases took place on 21 February 2018 and a further hearing will take place in the coming months.
| British Telecommunications plc Annual Report & Form 20-F 2018 | 167 | |||||
Table of Contents
Notes to the consolidated financial statements continued
Regulatory matters
In respect of regulatory risks, the group provides for anticipated costs where an outflow of resources is considered probable and a reasonable estimate can be made of the likely outcome. Estimates are used in assessing the likely value of the regulatory risk. The ultimate liability may vary from the amounts provided and will be dependent upon the eventual outcome of any settlement.
We hold provisions for regulatory risks. These provisions cover the following issues:
Deemed Consent
Deemed Consent is an agreed process between Openreach and its Communications Provider (CP) customers, which allows Openreach to halt the installation and reschedule the delivery date for providing dedicated business services (known as Ethernet) in a number of specific circumstances where it is beyond its control. Ofcom found that Openreach had breached its contractual and regulatory obligations by inadequately and retrospectively applying Deemed Consent to reduce compensation payments to CPs between January 2013 and December 2014.
We continue to estimate the total compensation payments will amount to around £300m. However, the precise amount will result from discussions with affected parties, and could result in lower or higher payments.
Other regulatory matters
The remaining provision reflects management’s estimates of regulatory risks across a range of issues, including price and service issues. The precise outcome of each matter depends on whether it becomes an active issue, and the extent to which negotiation or regulatory decision will result in financial settlement.
Changes to our segments
From 1 April 2018, our existing BT Consumer and EE divisions have been brought together into a combined division, Consumer, to drive converged products and accelerate transformation. From 1 October 2018, our existing Business and Public Sector and Wholesale and Ventures divisions will be brought together into a combined division, Enterprise, to accelerate transformation, simplify our operating model and strengthen accountabilities.
These businesses operated and were reported separately throughout 2017/18 and therefore have been presented as separate operating segments throughout these accounts.
These organisational changes do not impact the results of Global Services or Openreach and there is no impact on the total group results, balance sheet or cash flows. There are no internal revenue and costs between EE and BT Consumer. In 2017/18, there were £32m (2016/17: £22m, 2015/16: £24m) of internal revenue and costs between Business and Public Sector and Wholesale and Ventures.
We have set out below the segment analysis outlining the impacts of this change that will be applicable to the annual financial statements for 2018/19. Full details of the internal revenue and costs at the disaggregated level are provided in note 4.
Segment revenue and profit
| Year ended 31 March 2018 | Consumer £m | Enterprise £m | Global Services £m | Openreach £m | Other £m | Total £m | ||||||||||||||||||
Segment revenue | 10,360 | 6,540 | 5,013 | 5,123 | 8 | 27,044 | ||||||||||||||||||
Internal revenue | (103 | ) | (217 | ) | – | (2,978 | ) | – | (3,298 | ) | ||||||||||||||
Revenue from external customersa | 10,257 | 6,323 | 5,013 | 2,145 | 8 | 23,746 | ||||||||||||||||||
EBITDAb | 2,376 | 2,172 | 434 | 2,520 | 6 | 7,508 | ||||||||||||||||||
Depreciation and amortisation | (992 | ) | (676 | ) | (424 | ) | (1,360 | ) | (62 | ) | (3,514 | ) | ||||||||||||
Operating profit (loss)a | 1,384 | 1,496 | 10 | 1,160 | (56 | ) | 3,994 | |||||||||||||||||
Specific items | (610 | ) | ||||||||||||||||||||||
Operating profit | 3,384 | |||||||||||||||||||||||
Net finance expensec | (579 | ) | ||||||||||||||||||||||
Share of post tax loss of associates and joint ventures | (1 | ) | ||||||||||||||||||||||
Profit before tax | 2,804 | |||||||||||||||||||||||
| a | Before specific items. |
| b | EBITDA is stated before specific items and is the group’s profitability measure for segments. |
| c | Net finance expense includes specific item expense of £218m (2016/17: £210m, 2015/16: £229m). |
| 168 | British Telecommunications plc Annual Report & Form 20-F 2018 | |||||
Table of Contents
| THE STRATEGIC REPORT | GOVERNANCE | FINANCIAL STATEMENTS | ADDITIONAL INFORMATION | |||||||||
|
|
| ||||||||||
| Year ended 31 March 2017 | Consumer £m | Enterprise £m | Global £m | Openreach £m | Other £m | Total £m | ||||||||||||||||||
Segment revenue | 10,024 | 6,845 | 5,479 | 5,098 | 10 | 27,456 | ||||||||||||||||||
Internal revenue | (100 | ) | (238 | ) | – | (3,036 | ) | – | (3,374 | ) | ||||||||||||||
Revenue from external customersa | 9,924 | 6,607 | 5,479 | 2,062 | 10 | 24,082 | ||||||||||||||||||
EBITDAb | 2,168 | 2,362 | 495 | 2,633 | (10 | ) | 7,648 | |||||||||||||||||
Depreciation and amortisation | (989 | ) | (658 | ) | (439 | ) | (1,369 | ) | (55 | ) | (3,510 | ) | ||||||||||||
Operating profit (loss)a | 1,179 | 1,704 | 56 | 1,264 | (65 | ) | 4,138 | |||||||||||||||||
Specific items | (968 | ) | ||||||||||||||||||||||
Operating profit | 3,170 | |||||||||||||||||||||||
Net finance expensec | (610 | ) | ||||||||||||||||||||||
Share of post tax loss of associates and joint ventures | (9 | ) | ||||||||||||||||||||||
Profit before tax | 2,551 | |||||||||||||||||||||||
| Year ended 31 March 2016 | Consumer £m | Enterprise £m | Global Services £m | Openreach £m | Other £m | Total £m | ||||||||||||||||||
Segment revenue | 5,449 | 6,544 | 5,074 | 5,100 | 11 | 22,178 | ||||||||||||||||||
Internal revenue | (72 | ) | (169 | ) | – | (3,058 | ) | – | (3,299 | ) | ||||||||||||||
Revenue from external customersa | 5,377 | 6,375 | 5,074 | 2,042 | 11 | 18,879 | ||||||||||||||||||
EBITDAb | 1,228 | 2,169 | 479 | 2,659 | (77 | ) | 6,458 | |||||||||||||||||
Depreciation and amortisation | (353 | ) | (537 | ) | (422 | ) | (1,301 | ) | (18 | ) | (2,631 | ) | ||||||||||||
Operating profit (loss)a | 875 | 1,632 | 57 | 1,358 | (95 | ) | 3,827 | |||||||||||||||||
Specific items | (212 | ) | ||||||||||||||||||||||
Operating profit | 3,615 | |||||||||||||||||||||||
Net finance expensec | (380 | ) | ||||||||||||||||||||||
Share of post tax loss of associates and joint ventures | 6 | |||||||||||||||||||||||
Profit before tax | 3,241 | |||||||||||||||||||||||
| a | Before specific items. |
| b | EBITDA is stated before specific items and is the group’s profitability measure for segments. |
| c | Net finance expense includes specific item expense of £218m (2016/17: £210m, 2015/16: £229m). |
Internal revenue and costs
| Year ended 31 March 2018 | Consumer £m | Enterprise £m | Global £m | Openreach £m | Other £m | Total £m | ||||||||||||||||||
Internal revenue recorded by | ||||||||||||||||||||||||
Consumer | – | 65 | 20 | – | 18 | 103 | ||||||||||||||||||
Enterprise | 67 | – | 42 | 42 | 66 | 217 | ||||||||||||||||||
Global Services | – | – | – | – | – | – | ||||||||||||||||||
Openreach | 896 | 442 | 125 | – | 1,515 | 2,978 | ||||||||||||||||||
Total | 963 | 507 | 187 | 42 | 1,599 | 3,298 | ||||||||||||||||||
| Year ended 31 March 2017 | Consumer £m | Enterprise £m | Global £m | Openreach £m | Other £m | Total £m | ||||||||||||||||||
Internal revenue recorded by | ||||||||||||||||||||||||
Consumer | – | 62 | 20 | – | 18 | 100 | ||||||||||||||||||
Enterprise | 63 | – | 62 | 39 | 74 | 238 | ||||||||||||||||||
Global Services | – | – | – | – | – | – | ||||||||||||||||||
Openreach | 910 | 496 | 158 | – | 1,472 | 3,036 | ||||||||||||||||||
Total | 973 | 558 | 240 | 39 | 1,564 | 3,374 | ||||||||||||||||||
| Year ended 31 March 2016 | Consumer £m | Enterprise £m | Global Services £m | Openreach £m | Other £m | Total £m | ||||||||||||||||||
Internal revenue recorded by | ||||||||||||||||||||||||
Consumer | – | 31 | 23 | – | 18 | 72 | ||||||||||||||||||
Enterprise | 73 | – | 40 | 56 | – | 169 | ||||||||||||||||||
Global Services | – | – | – | – | – | – | ||||||||||||||||||
Openreach | 905 | 526 | 173 | – | 1,454 | 3,058 | ||||||||||||||||||
Total | 978 | 557 | 236 | 56 | 1,472 | 3,299 | ||||||||||||||||||
| British Telecommunications plc Annual Report & Form 20-F 2018 | 169 | |||||
Table of Contents
Notes to the consolidated financial statements continued
| Capital expenditure | ||||||||||||||||||||||||
| Year ended 31 March 2018 | Consumer £m | Enterprise £m | Global £m | Openreach £m | Other £m | Total £m | ||||||||||||||||||
Intangible assets | 236 | 180 | 92 | 70 | 64 | 642 | ||||||||||||||||||
Property, plant and equipment | 683 | 353 | 186 | 1,588 | 70 | 2,880 | ||||||||||||||||||
Capital expenditurea | 919 | 533 | 278 | 1,658 | 134 | 3,522 | ||||||||||||||||||
| Year ended 31 March 2017 | Consumer £m | BT Enterprise £m | Global £m | Openreach £m | Other £m | Total £m | ||||||||||||||||||
Intangible assets | 225 | 141 | 126 | 74 | 55 | 621 | ||||||||||||||||||
Property, plant and equipment | 628 | 360 | 235 | 1,499 | 111 | 2,833 | ||||||||||||||||||
Capital expenditurea | 853 | 501 | 361 | 1,573 | 166 | 3,454 | ||||||||||||||||||
| Year ended 31 March 2016 | Consumer £m | Enterprise £m | Global Services £m | Openreach £m | Other £m | Total £m | ||||||||||||||||||
Intangible assets | 117 | 106 | 62 | 62 | 65 | 412 | ||||||||||||||||||
Property, plant and equipment | 186 | 256 | 293 | 1,385 | 90 | 2,210 | ||||||||||||||||||
Capital expenditurea | 303 | 362 | 355 | 1,447 | 155 | 2,622 | ||||||||||||||||||
| a | Net of government grants. |
As at 31 March 2018, Consumer had 18,200 (2016/17: 17,900, 2015/16: 15,700) employees and an average of 18,000 (2016/17: 16,800, 2015/16: 7,600) for the year on a full-time equivalent basis. Enterprise had 13,900 as at 31 March 2018 (2016/17: 14,100, 2015/16: 14,000) and an average of 14,200 for the year ended 31 March 2018 (2016/17: 13,900, 2015/16: 13,100).
Consumer had trade receivables not passed due of £363m (2016/17: £463m, 2015/16: £405m) and accrued income of £208m (2016/17: £260m, 2015/16: £395m) as at 31 March 2018. Enterprise had trade receivables not passed due of £345m (2016/17: £275m, 2015/16: £191m) and accrued income of £279m (2016/17: £318m, 2015/16: £245m).
Contingent liabilities
Since the reporting date, we have reached a confidential settlement with the administrators of P4U regarding its claim for revenue share which relates to certain customers prior to P4U insolvency. This settlement is in line with the accruals we held to cover potential payments required by EE.
Acquisition of spectrum
In April 2018 we secured 40MHz of 3.4GHz spectrum at a cost of £304m allowing us to progress with our 5G plans and strengthening our position as the mobile network leader. The spectrum auction bidding cut across the 2017/18 and 2018/19 financial years. We had £325m on deposit with Ofcom at 31 March 2018, the excess deposit balance of £21m has since been refunded.
Strategy update
In May 2018 we are announcing an update to our strategy to accelerate leadership in converged connectivity and services. Our strategy will drive sustainable growth in value by focusing on delivering differentiated customer experiences, investing in integrated network leadership, and transforming our operating model and includes the repositioning of Global Services as a more focused digital business. This also includes the next phase of our restructuring programme. This programme involves the reduction of c13,000 mainly back office and middle management roles at a cost of £800m with a two–year payback and expected year three cash cost reduction of £1.5bn. The balances of the first phase of our restructuring programme (£60m of cost and removal of 1,200 FTE roles) and our EE integration programme (further run rate synergies of £110m) are included in the this wider transformation programme.
Triennial valuation of BT Pension Scheme
In May 2018 we concluded the 30 June 2017 triennial valuation of the BT Pension Scheme. Details are set out in note 19.
| 170 | British Telecommunications plc Annual Report & Form 20-F 2018 | |||||
Table of Contents
| THE STRATEGIC REPORT | GOVERNANCE | FINANCIAL STATEMENTS | ADDITIONAL INFORMATION | |||||||||
|
|
| ||||||||||
Financial statements of British Telecommunications plc
parent company balance sheet
British Telecommunications plc parent company balance sheet
Registered number 01800000
| At 31 March | Notes | 2018 £m | 2017a £m | |||||||||||||||||
Non-current assets | ||||||||||||||||||||
Intangible assets | 4 | 2,031 | 1,954 | |||||||||||||||||
Property, plant and equipment | 5 | 13,995 | 13,558 | |||||||||||||||||
Derivative financial instruments | 20 | 1,312 | 1,818 | |||||||||||||||||
Investments in subsidiary undertakings, associates and joint ventures | 6 | 23,889 | 27,554 | |||||||||||||||||
Other investmentsa | 7 | 14,805 | 13,881 | |||||||||||||||||
Trade and other receivables | 9 | 134 | 177 | |||||||||||||||||
Deferred tax assets | 17 | 1,044 | 1,504 | |||||||||||||||||
| 57,210 | 60,446 | |||||||||||||||||||
Current assets | ||||||||||||||||||||
Programme rights | 8 | 272 | 264 | |||||||||||||||||
Inventories | 72 | 89 | ||||||||||||||||||
Trade and other receivables | 9 | 2,300 | 2,077 | |||||||||||||||||
Current tax receivables | 217 | 3 | ||||||||||||||||||
Derivative financial instruments | 20 | 201 | 425 | |||||||||||||||||
Other investmentsa | 7 | 5,748 | 5,036 | |||||||||||||||||
Cash and cash equivalentsb | 288 | 286 | ||||||||||||||||||
| 9,098 | 8,180 | |||||||||||||||||||
Current liabilities | ||||||||||||||||||||
Loans and other borrowings | 10 | 18,494 | 19,999 | |||||||||||||||||
Derivative financial instruments | 20 | 50 | 33 | |||||||||||||||||
Trade and other payables | 11 | 4,239 | 4,178 | |||||||||||||||||
Provisions | 13 | 428 | 539 | |||||||||||||||||
| 23,211 | 24,749 | |||||||||||||||||||
Total assets less current liabilities
| 43,097 | 43,877 | ||||||||||||||||||
Non-current liabilities | ||||||||||||||||||||
Loans and other borrowings | 10 | 14,916 | 16,874 | |||||||||||||||||
Derivative financial instruments | 20 | 787 | 869 | |||||||||||||||||
Retirement benefit obligations | 17 | 5,958 | 8,632 | |||||||||||||||||
Other payables | 12 | 1,888 | 1,801 | |||||||||||||||||
Deferred taxation | 13 | 918 | 871 | |||||||||||||||||
Provisions | 13 | 291 | 323 | |||||||||||||||||
| 24,758 | 29,370 | |||||||||||||||||||
Equity | ||||||||||||||||||||
Ordinary shares | 2,172 | 2,172 | ||||||||||||||||||
Share premium | 8,000 | 8,000 | ||||||||||||||||||
Other reserves | 14 | 703 | 857 | |||||||||||||||||
Retained profitc | 7,464 | 3,478 | ||||||||||||||||||
Equity shareholder’s funds
| 18,339 | 14,507 | ||||||||||||||||||
| 43,097 | 43,877 | |||||||||||||||||||
| a | 2017 restated, see note 1 for further information |
| b | Includes cash of £232m (2016/17: £253m) and cash equivalents of £56m (2016/17: £33m). |
| c | As permitted by Section 408(3) of the Companies Act 2006, no income statement of the company is presented. The company’s profit for the financial year including dividends received from subsidiary undertakings was £2,057m (2016/17: £1,351m) before dividends paid of £nil (2016/17: £2,350m). |
The financial statements of the company on pages 171 to 207 were approved by the Board of Directors on 23 May 2018 and were signed on its behalf by
Simon Lowth
Director
| British Telecommunications plc Annual Report & Form 20-F 2018 | 171 | |||||
Table of Contents
Parent company statement of changes in equity
| Notes | | Share capital £m | a
| | Share premium account £m | b
| | Other reserves £m | c
| | Retained earnings £m | | | Total equity £m | ||||||||||
At 1 April 2016 | 2,172 | 8,000 | 900 | 6,688 | 17,760 | |||||||||||||||||||
Profit for the yeard | – | – | – | 1,351 | 1,351 | |||||||||||||||||||
Actuarial loss | 17 | – | – | – | (2,659 | ) | (2,659 | ) | ||||||||||||||||
Tax on actuarial loss | – | – | – | 419 | 419 | |||||||||||||||||||
Share-based payments | – | – | – | 44 | 44 | |||||||||||||||||||
Tax on share-based payments | – | – | – | (6 | ) | (6 | ) | |||||||||||||||||
Tax on items taken directly to equity | 14 | – | – | 6 | – | 6 | ||||||||||||||||||
Increase in fair value of cash flow hedges | 14 | – | – | 790 | – | 790 | ||||||||||||||||||
Dividends | – | – | – | (2,350 | ) | (2,350 | ) | |||||||||||||||||
Transferred to the income statement | 14 | – | – | (839 | ) | – | (839 | ) | ||||||||||||||||
Other | – | – | – | (9 | ) | (9 | ) | |||||||||||||||||
At 1 April 2017 | 2,172 | 8,000 | 857 | 3,478 | 14,507 | |||||||||||||||||||
Profit for the yeard | – | – | – | 2,057 | 2,057 | |||||||||||||||||||
Actuarial gain | 17 | – | – | – | 2,142 | 2,142 | ||||||||||||||||||
Tax on actuarial gain | – | – | – | (365 | ) | (365 | ) | |||||||||||||||||
Share-based payments | – | – | – | 71 | 71 | |||||||||||||||||||
Tax on share-based payments | – | – | – | (1 | ) | (1 | ) | |||||||||||||||||
Tax on items taken directly to equity | 14 | – | – | 12 | – | 12 | ||||||||||||||||||
Decrease in fair value of cash flow hedges | 14 | – | – | (360 | ) | – | (360 | ) | ||||||||||||||||
Dividends | – | – | – | – | – | |||||||||||||||||||
Transferred to the income statement | 14 | – | – | 277 | – | 277 | ||||||||||||||||||
Transfer to realised profit | – | – | (83 | ) | 83 | – | ||||||||||||||||||
Other | – | – | – | (1 | ) | (1 | ) | |||||||||||||||||
At 31 March 2018 | 2,172 | 8,000 | 703 | 7,464 | 18,339 | |||||||||||||||||||
| a | The allotted, called up and fully paid ordinary share capital of the company at 31 March 2018 and 31 March 2017 was £2,172m representing 8,689,755,905 ordinary shares of 25p each. |
| b | The share premium account, representing the premium on allotment of shares, and the capital redemption reserve are not available for distribution. |
| c | A breakdown of other reserves is provided in note 14. |
| d | As permitted by Section 408(3) of the Companies Act 2006, no income statement of the company is presented. The company’s profit for the financial year including dividends received from subsidiary undertakings was £2,057m (2016/17: £1,351m) before dividends paid of £nil (2016/17: £2,350m) |
| 172 | British Telecommunications plc Annual Report & Form 20-F 2018 | |||||
Table of Contents
| THE STRATEGIC REPORT | GOVERNANCE | FINANCIAL STATEMENTS | ADDITIONAL INFORMATION | |||||||||
|
|
| ||||||||||
Notes to the company financial statements
1. Basis of preparation
The term ‘company’ refers to British Telecommunications plc. These separate financial statements of the company have been prepared in accordance with the Companies Act 2006 as applicable to companies using Financial Reporting Standard 100 (FRS101).
The company meets the definition of a qualifying entity under FRS 100. Accordingly, these financial statements have been prepared in accordance with FRS 101 “Reduced disclosure framework”.
FRS 101 involves the application of International Financial Reporting Standards (IFRS) with a reduced level of disclosure.
The financial statements are prepared on a going concern basis and on the historical cost basis, except for certain financial and equity instruments that have been measured at fair value. The financial statements are presented in Sterling, the functional currency of the company.
The financial statements have been prepared on a consistent basis with the prior year with the exception of the following items:
During the year we reviewed the classification of loans to group undertakings. We determined that £1,417m of loans classified as current at 31 March 2017 should have beennon-current to reflect the directors’ expectations that settlement will not occur within 12 months from the balance sheet date. The impact at 31 March 2017 is an increase innon-current loans to group undertakings of £1,417m and a decrease in current loans to group undertakings of £1,417m. The balance sheet as at 31 March 2017 has been restated on that basis.
Exemptions
As permitted by Section 408(3) of the Companies Act 2006, the company’s income statement has not been presented.
The company has applied the exemptions available under FRS 101 in respect of the following disclosures:
| – | The requirements of paragraphs 45(b) and 46 to 52 of IFRS 2 ‘Share-based Payments’ in relation to group-settled share- based payments. |
| – | The requirements of IFRS 7 ‘Financial Instruments: Disclosures’. |
| – | The requirements of paragraphs 91 to 99 of IFRS 13 ‘Fair Value Measurement’. |
| – | The requirement in paragraph 38 of IAS 1 ‘Presentation of Financial Statements’ to present comparative information in respect of: |
(i) paragraph 79(a)(iv) of IAS 1 ‘Presentation of Financial Statements’; (ii) paragraph 73(e) of IAS 16 ‘Property, Plant and Equipment’; and (iii) paragraph 118(e) of IAS 38 ‘Intangible Assets’.
| – | The following paragraphs of IAS 1 ‘Presentation of Financial Statements’: |
| – | 10(d) (statement of cash flows); |
| – | 10(f) (third statement of financial position); |
| – | 16 (statement of compliance with all IFRS); |
| – | 38A (requirement for minimum of two primary statements including cash flow statements); |
| – | 38B-D (additional comparative information); |
| – | 40A-D (third statement of financial position); |
| – | 111 (cash flow statement information); and |
| – | 134 to 136 (capital management disclosures). |
| – | The requirements of IAS 7 ‘Statement of Cash Flows’. |
| – | The requirements of paragraph 17 of IAS 24 ‘Related Party Disclosures’. |
| – | The requirements in IAS 24 ‘Related Party Disclosures’ to disclose related party transactions entered into between two or more members of a group, provided that any subsidiary which is a party to the transaction is wholly owned by such a member. |
| – | The requirements of paragraphs 130(f)(ii), 130(f)(iii), 134(d) to 134(f) and 135(c) to 135(e) of IAS 36 ‘Impairment of Assets’. |
| – | The requirements of paragraphs 30 and 31 of IAS 8 Accounting Policies, Changes in Accounting Estimates and Errors. |
| – | IFRS 13 fair value measurement |
The company intends to continue to take advantage of these exemptions in future years.
Where required, equivalent disclosures have been given in the group accounts of British Telecommunications plc (BT plc).
2. Critical accounting estimates and key judgements
The preparation of financial statements in conformity with FRS 101 requires the use of accounting estimates and assumptions. It also requires management to exercise its judgement in the process of applying our accounting policies. We continually evaluate our estimates, assumptions and judgements based on available information and experience. As the use of estimates is inherent in financial reporting, actual results could differ from these estimates. Management has discussed its critical accounting estimates and associated disclosures with the British Telecommunications plc board. The areas involving a higher degree of judgement or complexity are described in the applicable notes to the financial statements. Critical accounting estimates and key judgements can be identified throughout the notes by the following symbol.
We have one new key judgement this year concerning the valuation of intercompany loan receivables.
| – | Current and deferred income tax, see note 13 (E). |
| – | Goodwill, see note 4 (E). |
| – | Government grants relating to Broadband Delivery UK (BDUK) contracts, see note 11 (E, J). |
| – | Long-term customer contracts, see note 9 (E). |
| – | Provisions and contingent liabilities, see note 13 (E, J). |
| – | Pension obligations, see note 17 (E, J). |
| – | Valuation of intercompany loan receivables, see note 7 (J) |
3. Significant accounting policies
The significant accounting policies applied in preparation of our financial statements are set out below. These policies have been applied consistently to all the years presented, unless otherwise stated.
| British Telecommunications plc Annual Report & Form 20-F 2018 | 173 | |||||
Table of Contents
Notes to the company financial statements continued
Retirement benefits
The company’s net obligation in respect of defined benefit pension plans is the present value of the defined benefit obligation less the fair value of the plan assets.
The calculation of the obligation is performed by a qualified actuary using the projected unit credit method and key actuarial assumptions at the balance sheet date.
The income statement expense is allocated between an operating charge and net finance income or expense. The operating charge reflects the increase in the defined benefit obligation resulting from the pension benefit earned by active employees in the current period, the costs of administering the plans and any past service costs/credits such as those arising from curtailments or settlements. The net finance income or expense reflects the interest on the net retirement benefit obligations recognised in the company balance sheet, based on the discount rate at the start of the year. Actuarial gains and losses are recognised in full in the period in which they occur and are presented in the company statement of comprehensive income.
The company also operates defined contribution pension plans and the income statement expense represents the contributions payable for the year.
Property, plant and equipment
Property, plant and equipment are included at historical cost, net of accumulated depreciation and any impairment charges. Property, plant and equipment acquired through business combinations are initially recorded at fair value and subsequently accounted for on the same basis as the company’s existing assets. An item of property, plant and equipment is derecognised on disposal or when no future economic benefits are expected to arise from the continued use of the asset. The difference between the sale proceeds and the net book value at the date of disposal is recognised in operating costs in the income statement.
Included within the cost of network infrastructure and equipment are direct and indirect labour costs, materials and directly attributable overheads.
Depreciation is provided on property, plant and equipment on a straight line basis from the time the asset is available for use, to write off the asset’s cost over the estimated useful life taking into account any expected residual value. Freehold land is not depreciated.
The lives assigned to principal categories of assets are as follows:
Land and buildings | ||
Freehold buildings | 14 to 50 years | |
Short term leasehold improvements | Shorter of 10 years or lease term | |
Leasehold land and buildings | Unexpired portion of lease or 40 years, whichever is the shorter
| |
Network infrastructure | ||
Transmission equipment: | ||
Duct | 40 years | |
Cable | 3 to 25 years | |
Fibre | 5 to 20 years | |
Exchange equipment | 2 to 13 years | |
Other network equipment
| 2 to 20 years | |
Other | ||
Motor vehicles | 2 to 9 years | |
Computers and office
| 3 to 6 years |
Assets held under finance leases are depreciated over the shorter of the lease term or their useful economic life. Residual values and useful lives are reassessed annually and, if necessary, changes are recognised prospectively.
Intangible assets
Identifiable intangible assets are recognised when the company controls the asset, it is probable that future economic benefits attributable to the asset will flow to the company and the cost of the asset can be reliably measured. All intangible assets, other than goodwill, are amortised over their useful economic life. The method of amortisation reflects the pattern in which the assets are expected to be consumed. If the pattern cannot be determined reliably, the straight line method is used.
Goodwill
Goodwill represents the excess of the cost of an acquisition over the fair value of the company’s share of the identifiable net assets (including intangible assets) of the acquired business.
For the purpose of impairment testing, we rely on the BT plc consolidated impairment assessment. See note 4 for further information.
Telecommunications licences
Licence fees paid to governments, which permit telecommunications activities to be operated for defined periods, are initially recorded at cost and amortised from the time the network is available for use to the end of the licence period or where our usage can extend beyond the initial licence period, over the period we expect to benefit from the use of the licences, which is typically 20 years.
| 174 | British Telecommunications plc Annual Report & Form 20-F 2018 | |||||
Table of Contents
| THE STRATEGIC REPORT | GOVERNANCE | FINANCIAL STATEMENTS | ADDITIONAL INFORMATION | |||||||||
|
|
| ||||||||||
Computer software
Computer software comprises computer software licences purchased from third parties, and also the cost of internally developed software. Computer software licences purchased from third parties are initially recorded at cost.
Costs directly associated with the production of internally developed software, including direct and indirect labour costs of development, are capitalised only where it is probable that the software will generate future economic benefits, the cost of the asset can be reliably measured and technical feasibility can be demonstrated, in which case it is capitalised as an intangible asset on the balance sheet. Costs which do not meet these criteria and research costs are expensed as incurred.
The company’s development costs which give rise to internally developed software include upgrading the network architecture or functionality and developing service platforms aimed at offering new services to the company’s customers. See research and development on page 17.
Other
Other intangible assets include website development costs and other licences. Items are capitalised at cost and amortised on a straight line basis over their useful economic life or the term of the contract.
Estimated useful economic lives
The estimated useful economic lives assigned to the principal categories of intangible assets are as follows:
– Computer software |
2 to 10 years | |
– Telecommunications licences
| 2 to 20 years
|
Programme rights
Programme rights are recognised on the balance sheet from the point at which the legally enforceable licence period begins. Rights for which the licence period has not started are disclosed as contractual commitments in note 16. Payments made to receive commissioned or acquired programming in advance of the legal right to broadcast the programmes are classified as prepayments.
Programme rights are initially recognised at cost and are amortised from the point at which they are available for use, on a straight line basis over the programming period, or the remaining licence term, as appropriate, this is generally 12 months. The amortisation charge is recorded within operating costs in the income statement.
Programmes produced internally are charged to the income statement over the period of the related broadcast.
Programme rights are tested for impairment in accordance with the company’s policy for impairment ofnon-financial assets set out below.
Investments in subsidiary undertakings
Investments in subsidiary undertakings are stated at cost and reviewed for impairment if there are indicators that the carrying value may not be recoverable. Investments in subsidiary undertakings are derecognised when the company no longer owns the shares of the subsidiary or the subsidiary is dissolved.
Inventories
Network maintenance equipment and equipment to be sold to customers are stated at the lower of cost or net realisable value, taking into account expected revenues from the sale of packages comprising a mobile handset and a subscription. Cost corresponds to purchase or production cost determined by either the first in first out (FIFO) or average cost method.
Provisions
Provisions are recognised when the company has a present legal or constructive obligation as a result of past events, it is probable that an outflow of resources will be required to settle the obligation and the amount can be reliably estimated. Provisions are determined by discounting the expected future cash flows at apre-tax rate that reflects current market assessments of the time value of money and the risks specific to the liability. Financial liabilities within provisions are initially recognised at fair value and subsequently carried at amortised cost using the effective interest method. Onerous lease provisions are measured at the lower of the cost to fulfil or to exit the contract.
Current and deferred income tax
Current income tax is calculated on the basis of the tax laws enacted or substantively enacted at the balance sheet date. The company periodically evaluates positions taken in tax returns with respect to situations in which applicable tax regulation is subject to interpretation, and the company establishes provisions where appropriate on the basis of the amounts expected to be paid to tax authorities.
Deferred tax is recognised, using the liability method, in respect of temporary differences between the carrying amount of the company’s assets and liabilities and their tax base. Deferred income tax assets and liabilities are offset when there is a legally enforceable right to offset current tax assets against current tax liabilities and where there is an intention to settle the balances on a net basis. Any remaining deferred tax asset is recognised only when, on the basis of all available evidence, it can be regarded as probable that there will be suitable taxable profits, in the foreseeable future against which the deductible temporary difference can be utilised.
Deferred tax is determined using tax rates that are expected to apply in the periods in which the asset is realised or liability settled, based on tax rates and laws that have been enacted or substantively enacted by the balance sheet date.
Impairment ofnon-financial assets
Intangible assets with finite useful lives and property, plant and equipment are tested for impairment if events or changes in circumstances (assessed at each reporting date) indicate that the carrying amount may not be recoverable. When an impairment test is performed, the recoverable amount is assessed by reference to the higher of the net present value of the expected future cash flows (value in use) of the relevant cash generating unit and the fair value less costs to dispose.
Goodwill is reviewed for impairment at least annually. Impairment losses are recognised in the income statement. If a cash generating unit is impaired, impairment losses are allocated firstly against goodwill, and secondly on apro-rata basis against intangible and other assets.
| British Telecommunications plc Annual Report & Form 20-F 2018 | 175 | |||||
Table of Contents
Notes to the company financial statements continued
Government grants
Government grants are recognised when there is reasonable assurance that the conditions associated with the grants have been complied with and the grants will be received.
Grants for the purchase or production of property, plant and equipment are initially recognised as deferred income; they are subsequently released on a straight line basis over the useful life of the associated asset. Grants for the reimbursement of operating expenditure are deducted from the related category of costs in the income statement. Government grants received relating to the BDUK programme and other rural superfast broadband contracts are accounted for as described under ‘Critical accounting estimates and key judgements’.
Once a government grant is recognised, any related deferred income is treated in accordance with IAS 20 ‘Accounting for Government Grants and Disclosure of Government Assistance’.
Foreign currencies
Foreign currency transactions are translated into the functional currency using the exchange rates prevailing at the date of the transaction. Foreign exchange gains and losses resulting from the settlement of transactions and the translation of monetary assets and liabilities denominated in foreign currencies at period end exchange rates are recognised in the income statement line which most appropriately reflects the nature of the item or transaction.
Research and development
Research expenditure is recognised in the income statement in the period in which it is incurred. Development expenditure, including the cost of internally developed software, is recognised in the income statement in the period in which it is incurred unless it is probable that economic benefits will flow to the company from the asset being developed, the cost of the asset can be reliably measured and technical feasibility can be demonstrated, in which case it is capitalised as an intangible asset on the balance sheet. Capitalisation ceases when the asset being developed is ready for use. Research and development costs include direct and indirect labour, materials and directly attributable overheads.
Leases
The determination of whether an arrangement is, or contains, a lease is based on the substance of the arrangement and requires an assessment of whether the fulfilment of the arrangement is dependent on the use of a specific asset or assets and whether the arrangement conveys the right to use the asset.
Leases of property, plant and equipment where the company holds substantially all the risks and rewards of ownership are classified as finance leases. Finance lease assets are capitalised at the commencement of the lease term at the lower of the present value of the minimum lease payments or the fair value of the leased asset. The obligations relating to finance leases, net of finance charges in respect of future periods, are recognised as liabilities. Leases are subsequently measured at amortised cost using the effective interest method.
Leases where a significant portion of the risks and rewards are held by the lessor are classified as operating leases. Rentals are charged to the income statement on a straight line basis over the period of the lease.
Share-based payments
The ultimate parent of BT plc, BT Group plc, operates a number of equity settled share-based arrangements, as detailed in note 20 to the BT plc consolidated financial statements, under which the company receives services from employees as consideration for equity instruments (share options and shares) of BT Group plc. In the company’s separate financial statements these are also accounted for as equity settled.
Equity settled share-based payments are measured at fair value at the date of grant. Market-based performance criteria andnon-vesting conditions (for example, the requirement for employees to make contributions to the share purchase programme) are reflected in this measurement of fair value. The fair value determined at the grant date is recognised as an expense on a straight line basis over the vesting period, based on the company’s estimate of the options or shares that will eventually vest and adjusted for the effect of non market-based vesting conditions. Fair value is measured using either the Binomial options pricing model or Monte Carlo simulations, whichever is more appropriate to the share-based payment arrangement.
Service and performance conditions are vesting conditions. Any other conditions arenon-vesting conditions which have to be taken into account to determine the fair value of equity instruments granted. In the case that an award or option does not vest as a result of a failure to meet anon-vesting condition that is within the control of either counterparty, this is accounted for as a cancellation. Cancellations are treated as accelerated vesting and all remaining future charges are immediately recognised in the income statement. As the requirement to save under an employee saveshare arrangement is anon-vesting condition, employee cancellations, other than through a termination of service, are treated as an accelerated vesting.
No adjustment is made to total equity for awards that lapse or are forfeited after the vesting date.
Financial instruments
Financial liabilities at amortised cost
Trade and other payables
Financial liabilities within trade and other payables are initially recognised at fair value, which is usually the original invoiced amount, and subsequently carried at amortised cost using the effective interest method.
Loans and other borrowings
Loans and other borrowings are initially recognised at the fair value of amounts received net of transaction costs. Loans and other borrowings are subsequently measured at amortised cost using the effective interest method and, if included in a fair value hedge relationship, arere-valued to reflect the fair value movements on the hedged risk associated with the loans and other borrowings. The resulting amortisation of fair value movements, onde-designation of the hedge, is recognised in the income statement.
| 176 | British Telecommunications plc Annual Report & Form 20-F 2018 | |||||
Table of Contents
| THE STRATEGIC REPORT | GOVERNANCE | FINANCIAL STATEMENTS | ADDITIONAL INFORMATION | |||||||||
|
|
| ||||||||||
Available-for-sale investments
Liquid and other investments are classified asavailable-for-sale investments and are initially recognised at fair value plus direct transaction costs. These arere-measured at subsequent reporting dates to fair value, with unrealised gains and losses (except for changes in exchange rates for monetary items, interest, dividends and impairment losses, which are recognised in the income statement) recognised in equity. When the financial asset is derecognised, the cumulative gain or loss previously recognised in equity is taken to the income statement, in the line that most appropriately reflects the nature of the item or transaction. On disposal or impairment of the investments, any gains and losses that have been deferred in other comprehensive income are reclassified to the income statement. Dividends on equity investments are recognised in the income statement when the company’s right to receive payment is established. Equity investments are recorded innon-current assets unless they are expected to be sold within one year.
Loans and receivables
Trade and other receivables
Trade and other receivables are initially recognised at fair value, which is usually the original invoiced amount, and are subsequently carried at amortised cost, using the effective interest method, less provisions made for doubtful receivables. Provisions are made specifically where there is evidence of a risk ofnon-payment, taking into account ageing, previous losses experienced and general economic conditions.
Cash and cash equivalents
Cash and cash equivalents comprise cash in hand and current balances with banks and similar institutions, which are readily convertible to cash and are subject to insignificant risk of changes in value and have an original maturity of three months or less. Bank overdrafts are included within loans and other borrowings, in current liabilities on the balance sheet.
Financial assets and liabilities at fair value through profit or loss
All of the company’s derivative financial instruments are held for trading and classified as fair value through profit or loss.
Derivative financial instruments
The company uses derivative financial instruments mainly to reduce exposure to foreign exchange and interest rate risks. The company’s policy is not to use derivatives for trading purposes. However, derivatives that do not qualify for hedge accounting or are specifically not designated as a hedge where natural offset is more appropriate are initially recognised and subsequently measured at fair value through profit and loss. Any direct transaction costs are recognised immediately in the income statement. Gains and losses onre-measurement are recognised in the income statement in the line that most appropriately reflects the nature of the item or transaction to which they relate.
Derivative financial instruments are classified as current assets or current liabilities where they have a maturity period within 12 months. Where derivative financial instruments have a maturity period greater than 12 months, they are classified within eithernon-current assets ornon-current liabilities.
Where the fair value of a derivative contract at initial recognition is not supported by observable market data and differs from the transaction price, a day one gain or loss will arise which is not recognised in the income statement. Such gains and losses are deferred and amortised to the income statement based on the remaining contractual term and as observable market data becomes available.
Hedge accounting
Where derivatives qualify for hedge accounting, recognition of any resultant gain or loss depends on the nature of the hedge. To qualify for hedge accounting, hedge documentation must be prepared at inception and the hedge must be expected to be highly effective both prospectively and retrospectively. The hedge is tested for effectiveness at inception and in subsequent periods in which the hedge remains in operation. Hedge accounting is discontinued when the hedging instrument expires, or is sold, terminated or no longer qualifies for hedge accounting or the company chooses to end the hedge relationship. The company designates certain derivatives as either cash flow hedges or fair value hedges.
Cash flow hedges
When a derivative financial instrument is designated as a hedge of the variability in cash flows of a recognised asset or liability, or a highly probable transaction, the effective part of any gain or loss on the derivative financial instrument is recognised directly in equity, in the cash flow reserve. For cash flow hedges of recognised assets or liabilities, the associated cumulative gain or loss is removed from equity and recognised in the same line of the income statement and in the same period or periods that the hedged transaction affects the income statement. Any ineffectiveness arising on a cash flow hedge of a recognised asset or liability is recognised immediately in the same income statement line as the hedged item. Where ineffectiveness arises on highly probable transactions, it is recognised in the income statement line which most appropriately reflects the nature of the item or transaction.
Fair value hedges
When a derivative financial instrument is designated as a hedge of the variability in fair value of a recognised asset or liability, or unrecognised firm commitment, the change in fair value of the derivative that is designated as a fair value hedge is recorded in the income statement at each reporting date, together with any changes in fair value of the hedged asset or liability that is attributable to the hedged risk.
Dividends
Dividend distributions are recognised as a liability in the year in which the dividends are approved by the board. Interim dividends are therefore recognised when they are paid; final dividends when authorised by the board.
| British Telecommunications plc Annual Report & Form 20-F 2018 | 177 | |||||
Table of Contents
Notes to the company financial statements
4. Intangible assets
| Software £m | Goodwill £m | Telecoms licences £m | Other £m | Total £m | ||||||||||||||||
Cost | ||||||||||||||||||||
At 1 April 2017 | 5,082 | 513 | 202 | 23 | 5,820 | |||||||||||||||
Acquisitions | – | 17 | – | – | 17 | |||||||||||||||
Additions | 539 | – | – | – | 539 | |||||||||||||||
Disposals and adjustments | (429 | ) | – | – | – | (429 | ) | |||||||||||||
At 31 March 2018
| 5,192 | 530 | 202 | 23 | 5,947 | |||||||||||||||
Accumulated amortisation | ||||||||||||||||||||
At 1 April 2017 | 3,866 | – | – | – | 3,866 | |||||||||||||||
Charge for the year | 481 | – | – | – | 481 | |||||||||||||||
Disposals and adjustments | (431 | ) | – | – | – | (431 | ) | |||||||||||||
At 31 March 2018
| 3,916 | – | – | – | 3,916 | |||||||||||||||
Net book value | ||||||||||||||||||||
At 31 March 2018 | 1,276 | 530 | 202 | 23 | 2,031 | |||||||||||||||
At 31 March 2017
| 1,216 | 513 | 202 | 23 | 1,954 | |||||||||||||||
Goodwill
Goodwill recognised in a business combination does not generate cash flows independently of other assets or groups of assets. As a result, the recoverable amount, being the value in use, is determined at a cash generating unit (CGU) level. The CGUs of the group headed by the company are BT Consumer, EE, Business and Public Sector, Global Services and Wholesale and Ventures. These CGUs represent the lowest level at which it is possible to identify largely independent cash flows and at which the goodwill is monitored for internal management purposes.
Goodwill in the company’s separate financial statements relates to the excess of cost over the value of the company’s share of the identifiable net assets acquired where the company has purchased a business. The amount forms a small portion of the goodwill recognised in the BT plc’s consolidated accounts and as such we rely on the impairment assessment performed at a BT plc consolidated level to support the valuation of goodwill in the company’s separate financial statements. Below we discuss the critical accounting estimates and assumptions made for BT plc’s consolidated impairment assessment to the extent that they are relevant to the company’s standalone financial statements. For further information including details of the sensitivities applied please see note 11 to the consolidated accounts.
What critical estimates and assumptions have we made for goodwill?
Our value in use calculations require estimates in relation to uncertain items, including management’s expectations of future revenue growth, operating costs, profit margins, operating cash flows, and the discount rate for the CGU.
Future cash flows used in the value in use calculations are based on our latest BT Group plc Board approved five-year financial plans. Expectations about future growth reflect the expectations of growth in the markets to which the CGU relates. The future cash flows are discounted using apre-tax discount rate that reflects current market assessments of the time value of money. The discount rate used is adjusted for the risk specific to the asset, for which the future cash flow estimates have not been adjusted.
The company is required to test goodwill acquired in a business combination annually for impairment. This was carried out as at 31 January 2018. The carrying value of goodwill and the key assumptions used in performing the annual impairment assessment and sensitivities are disclosed below.
How do we calculate the recoverable amount?
The value in use of the CGU is determined using cash flow projections derived from financial plans approved by the BT Group plc board covering a five-year period. They reflect management’s expectations of revenue, EBITDA growth, capital expenditure, working capital and operating cash flows, based on past experience and future expectations of business performance. Cash flows beyond the fifth-year period have been extrapolated using perpetuity growth rates.
What discount rate have we used?
Thepre-tax discount rates applied to the cash flow forecasts are derived from ourpost-tax weighted average cost of capital. The assumptions used in the calculation of the group’s weighted average cost of capital are benchmarked to externally available data. Thepre-tax discount rate used in performing the value in use calculation in 2017/18 was 8.4% (2016/17: 8.6%).
What growth rates have we used?
The perpetuity growth rates are determined based on the forecast market growth rates of the regions in which the CGU operates, and they reflect an assessment of the long-term growth prospects of that market. The growth rates have been benchmarked against external data for the relevant markets. None of the growth rates applied exceed the expected long-term average growth rates for those markets or sectors. The perpetuity growth rate used was 2.0% (2016/17: 2.0%).
| 178 | British Telecommunications plc Annual Report & Form 20-F 2018 | |||||
Table of Contents
| THE STRATEGIC REPORT | GOVERNANCE | FINANCIAL STATEMENTS | ADDITIONAL INFORMATION | |||||||||
|
|
| ||||||||||
5. Property, plant and equipment
The plant and equipment in our networks is long-lived with cables and switching equipment operating for over ten years and underground ducts being used for decades. We also develop software for use in IT systems and platforms that support the products and services provided to our customers.
The carrying values of software, property, plant and equipment are disclosed below and in note 4. The useful lives applied to the principal categories of assets are disclosed on pages 174 and 175.
| Land and buildings £m | Network infrastructurea £m | Otherb £m | Assets in course of construction £m | Total £m | ||||||||||||||||
Cost | ||||||||||||||||||||
At 1 April 2017 | 466 | 43,512 | 1,219 | 701 | 45,898 | |||||||||||||||
Additions | – | 29 | 69 | 2,073 | 2,171 | |||||||||||||||
Transfers | 28 | 2,014 | 1 | (2,043 | ) | – | ||||||||||||||
Disposals and adjustments | (16 | ) | (1,091 | ) | (28 | ) | – | (1,135 | ) | |||||||||||
At 31 March 2018
| 478 | 44,464 | 1,261 | 731 | 46,934 | |||||||||||||||
Depreciation | ||||||||||||||||||||
At 1 April 2017 | 267 | 31,113 | 1,018 | – | 32,398 | |||||||||||||||
Charge for the year | 19 | 1,638 | 65 | – | 1,722 | |||||||||||||||
Disposals and adjustmentsc | (15 | ) | (1,099 | ) | (23 | ) | – | (1,137 | ) | |||||||||||
At 31 March 2018
| 271 | 31,652 | 1,060 | – | 32,983 | |||||||||||||||
Net book value | ||||||||||||||||||||
At 31 March 2018 | 207 | 12,812 | 201 | 731 | 13,951 | |||||||||||||||
Engineering stores | – | – | – | 44 | 44 | |||||||||||||||
Total
| 207 | 12,812 | 201 | 775 | 13,995 | |||||||||||||||
At 31 March 2017 | 199 | 12,399 | 201 | 701 | 13,500 | |||||||||||||||
Engineering stores | – | – | – | 58 | 58 | |||||||||||||||
Total | 199 | 12,399 | 201 | 759 | 13,558 | |||||||||||||||
| At 31 March | 2018 £m | 2017 £m | ||||||||||||||||||
The net book value of land and buildings comprised: | ||||||||||||||||||||
Freehold | 41 | 33 | ||||||||||||||||||
Leasehold | 166 | 166 | ||||||||||||||||||
Total net book value of land and buildings
| 207 | 199 | ||||||||||||||||||
| a | The net book value of assets held under finance leases included within network infrastructure at 31 March 2018 was £189m (2016/17: £250m). The depreciation charge on those assets for the year ended 31 March 2018 was £95m (2016/17: £124m). Within network infrastructure are assets with net book value of £7.8bn (2016/17: £7.5bn) which have useful economic lives of more than 18 years. |
| b | Other mainly comprises motor vehicles, computers and fixtures and fittings. |
| c | Fully depreciated assets in the company’s fixed asset registers were reviewed during the year, as part of the BT Group plc annual asset verification exercise, and certain assets that were no longer in use have been written out, reducing cost and accumulated depreciation by £1.1bn (2016/17: £1.1bn). |
| British Telecommunications plc Annual Report & Form 20-F 2018 | 179 | |||||
Table of Contents
Notes to the company financial statements continued
6. Investments in subsidiary undertakings, associates and joint ventures
| Subsidiary undertakings £m | Associates and joint ventures £m | Total £m | ||||||||||
Cost | ||||||||||||
At 1 April 2017 | 44,532 | 145 | 44,677 | |||||||||
Additionsa | 19 | 7 | 26 | |||||||||
Disposalsa | (3,700 | ) | – | (3,700 | ) | |||||||
At 31 March 2018
| 40,851 | 152 | 41,003 | |||||||||
Provisions and amounts written off | ||||||||||||
At 1 April 2017 | 17,123 | – | 17,123 | |||||||||
Disposalsa | (9 | ) | – | (9 | ) | |||||||
At 31 March 2018
| 17,114 | – | 17,114 | |||||||||
Net book value at 31 March 2018
| 23,737 | 152 | 23,889 | |||||||||
Net book value at 31 March 2017 | 27,409 | 145 | 27,554 | |||||||||
| a | Additions and disposals principally arise due to transactions undertaken to simplify our legal entity hierarchy. |
Details of the company’s subsidiary undertakings are set out on pages 192 to 207.
7. Other investments
What critical judgements have we made in accounting for loans to group undertakings?
We extend loans to our subsidiaries in order to fund their activities. We annually consider whether there is an indication of impairment. This involves judgement in reviewing year-end financial position, current year performance, known indicators of future performance and cash-flows, one-off events and contingent liabilities and assets. Based on this if there is an indication that the loan receivable may be impaired we perform an assessment of the recoverable amount and make a provision for the portion that we consider irrecoverable. We exercise judgement in determining whether the loan is fully or partially recoverable, which includes making assumptions regarding the future performance of the subsidiary. These assumptions are normally based on financial plans or through extrapolating current performance taking into account past experience and known future events. During 2017/18 having performed this assessment we made a provision of £354m against these loans.
| At 31 March | 2018 £m | 2017a £m | ||||||
Non-current assets | ||||||||
Available-for-sale assets | 2 | 2 | ||||||
Loans to group undertakingsa | 1,502 | 2,317 | ||||||
Loans to parent undertakings | 13,301 | 11,562 | ||||||
Total non-current investments
| 14,805 | 13,881 | ||||||
Current assets | ||||||||
Available-for-sale assets | 2,575 | 1,437 | ||||||
Loans and receivables | 443 | 64 | ||||||
Loans to group undertakingsa | 2,528 | 3,315 | ||||||
Loans to parent undertakings | 202 | 220 | ||||||
Total current investments
| 5,748 | 5,036 | ||||||
| a | 2017 restated, see note 1 for further information |
Available-for-sale consist of investments in liquidity funds denominated in Sterling of £2,180m (2016/17: £900m) and in Euro of £395m (2016/17: £537m).
Loans and receivables consist of bank deposits totaling £443m (2016/17: £64m), £416m (2016/17: £34m) are denominated in Sterling and £27m (2016/17: £30m) are denominated in US Dollars.
Loans to group and parent undertakings total £17,533m (2016/17: £17,414m). These consist of amounts denominated in sterling of £14,778m (2016/17: £14,686m), Euros of £1,918m (2016/17: £1,862m), US Dollars of £78m (2016/17: £91m) and other currencies of £759m (2016/17: £775m).
| 180 | British Telecommunications plc Annual Report & Form 20-F 2018 | |||||
Table of Contents
| THE STRATEGIC REPORT | GOVERNANCE | FINANCIAL STATEMENTS | ADDITIONAL INFORMATION | |||||||||
|
|
| ||||||||||
8. Programme rights
| Total £m | ||||
At 1 April 2016
| 225 | |||
Additions
| 753 | |||
Amortisation | (714 | ) | ||
At 1 April 2017
| 264 | |||
Additions
| 771 | |||
Amortisation | (763 | ) | ||
At 31 March 2018 | 272 | |||
Additions reflect TV programme rights for which the legally enforceable licence period has started during the year. Payments made for programme rights for which the legally enforceable licence period has not yet started are included within prepayments (see note 9).
TV Programme rights commitments are disclosed in note 16.
9. Trade and other receivables
We’ve made various judgements in accounting for trade and other receivables. These include long-term contracts and bad debt provisions.
Long-term customer contracts
Long-term customer contracts can extend over a number of financial years. During the contractual period recognition of costs and profits may be impacted by judgements and estimates made.
What critical estimates and assumptions have we made?
Estimates are required in assessing the lifetime profitability of a contract when determining whether we have an onerous contract liability. Where we have an onerous contract liability this would be classified in provisions and include an impairment of any receivables relating to these contracts.
The level of uncertainty in the estimates and assumptions supporting expected future revenues and costs can vary with the complexity of each contract and with the form of service delivery.
We’ve exercised judgement in assessing when the transition or transformation phase of a contract ends. This influences the timing of recognition of revenue and costs which are deferred until the transition or transformation phase ends unless these elements of a contract have standalone value.
How do we estimate and recognise contract losses?
We estimate and recognise immediately the entire estimated loss for a contract when we have evidence that the contract is unprofitable. Also if these estimates indicate that any contract will be less profitable than previously forecast, contract assets may have to be written down to the extent they are no longer considered to be fully recoverable. We perform ongoing profitability reviews of our contracts in order to determine whether the latest estimates are appropriate. Key factors reviewed include:
| – | Transaction volumes or other inputs affecting future revenues which can vary depending on customer requirements, plans, market position and other factors such as general economic conditions. |
| – | Our ability to achieve key contract milestones connected with the transition, development, transformation and deployment phases for customer contracts. |
| – | The status of commercial relations with customers and the implication for future revenue and cost projections. |
| – | Our estimates of future staff and third-party costs and the degree to which cost savings and efficiencies are deliverable. |
| At 31 March | 2018 £m | 2017 £m | ||||||
Current receivables
| ||||||||
Trade receivables
| 756 | 632 | ||||||
Amount owed by group undertakings
| 510 | 411 | ||||||
Amount owed by parent undertakings
| – | 1 | ||||||
Other receivables
| 213 | 207 | ||||||
Accrued income
| 417 | 489 | ||||||
Prepayments | 404 | 337 | ||||||
Total current receivables
| 2,300 | 2,077 | ||||||
Non-current trade and other receivablesa
| 134 | 177 | ||||||
Total receivables | 2,434 | 2,254 | ||||||
| a | Primarily represents prepayments and costs relating to the initial set up, transition or transformation phase of long-term networked IT services contracts. |
| British Telecommunications plc Annual Report & Form 20-F 2018 | 181 | |||||
Table of Contents
Notes to the company financial statements continued
How do we assess recoverability of our receivables?
We provide services to consumer and business customers, mainly on credit terms. We know that certain debts due to us will not be paid through the default of a small number of our customers. Judgements are required in assessing the recoverability of trade receivables and whether a provision for doubtful debts may be required.
In estimating a provision for doubtful debts we consider historical experience alongside other factors such as the current state of the economy and particular industry issues.
Trade receivables are continuously monitored and allowances applied against trade receivables consist of both specific impairments and collective impairments based on our historical loss experiences for the relevant aged category as well as taking into account general economic conditions. Historical loss experience allowances are calculated by a customer-facing unit in order to reflect the specific nature of the customers relevant to that customer-facing unit.
10. Loans and other borrowings
The table below gives details of the listed bonds and other debt.
| At 31 March | 2018 £m | 2017 £m | ||||||
6.625% £500m bond due June 2017a
| – | 526 | ||||||
5.95% US$1,100m bond due January 2018a
| – | 891 | ||||||
2.35% US$800m bond due February 2019a
| 572 | 642 | ||||||
1.125%€1,000m bond due June 2019a
| 883 | 863 | ||||||
8.625% £300m bond due March 2020
| 300 | 300 | ||||||
0.625%€1,500m bond due March 2021a
| 1,309 | 1,282 | ||||||
0.5%€575m bond due June 2022a
| 502 | – | ||||||
1.125%€1,100m bond due March 2023a
| 961 | 942 | ||||||
1%€575m bond due June 2024a
| 506 | – | ||||||
1%€1,100m bond due November 2024a
| 959 | – | ||||||
3.50% £250m index linked bond due April 2025
| 419 | 403 | ||||||
1.75%€1,300m bond due March 2026a
| 1,137 | 1,113 | ||||||
1.5%€1,150m bond due June 2027a
| 1,009 | – | ||||||
5.75% £600m bond due December 2028
| 721 | 731 | ||||||
9.125% US$2,670m bond due December 2030a(minimum 8.625%b)
| 1,943 | 2,191 | ||||||
3.125% £500m bond due November 2031
| 502 | – | ||||||
6.375% £500m bond due June 2037a
| 522 | 522 | ||||||
3.625% £500m bond due November 2047 | 250 | – | ||||||
Total listed bonds | 12,495 | 10,406 | ||||||
Finance leases
| 112 | 114 | ||||||
Finance leases with group undertakingsc | 292 | 388 | ||||||
Total finance leases | 404 | 502 | ||||||
Loans from group undertakingsc
| 20,020 | 25,305 | ||||||
Other loans
| 474 | 652 | ||||||
Bank overdrafts | 17 | 8 | ||||||
Total other loans and borrowings | 20,511 | 25,965 | ||||||
Total loans and borrowings | 33,410 | 36,873 | ||||||
| a | Designated in a cash flow hedge relationship. |
| b | The interest rate payable on this bond attracts an additional 0.25% for a downgrade by one credit rating by either Moody’s or S&P to the company’s senior unsecured debt below A3/A-respectively. In addition, if Moody’s or S&P subsequently increase the ratings then the interest rate will be decreased by 0.25% for each rating category upgrade by each rating agency. In no event will the interest rate be reduced below the minimum rate reflected in the above table. |
| c | Loans from group undertakings including finance leases are £20,312m (2016/17: £25,693m). These consist of £16,336m (2016/17: £21,069m) denominated in Sterling, £2,728m (2016/17: £3,610m) denominated in Euros, £306m (2016/17: £308m) denominate in US dollars and £942m (2016/17: £706m) denominated in other currencies. Included within these balances are fixed interest bonds to group undertakings amounting £2,362m (2016/17: £2,670m) denominated in Sterling and £484m (2016/17: £655m) denominated in Euros with maturities between 2018 and 2025. |
The interest rates payable on loans and borrowings disclosed above reflect the coupons on the underlying issued loans and borrowings and not the interest rates achieved through applying associated cross-currency and interest rate swaps in hedge arrangements.
Unless previously designated in a fair value hedge relationship, all loans and other borrowings are carried in the company balance sheet and cost. The table above is presented at amortised cost. The fair value of listed bonds is £13,871m (2016/17: £12,116m) and the fair value of finance lease is £439m (2016/17: £546m).
| 182 | British Telecommunications plc Annual Report & Form 20-F 2018 | |||||
Table of Contents
| THE STRATEGIC REPORT | GOVERNANCE | FINANCIAL STATEMENTS | ADDITIONAL INFORMATION | |||||||||
|
|
| ||||||||||
Loans and other borrowings are analysed as follows:
| At 31 March | 2018 £m | 2017 £m | ||||||
Current liabilities
| ||||||||
Listed bonds
| 706 | 1,528 | ||||||
Finance leases
| 2 | 2 | ||||||
Finance lease with subsidiary undertakings
| 109 | 109 | ||||||
Loans from group undertakings
| 17,186 | 17,700 | ||||||
Other loans and bank overdrafts | 491 | 660 | ||||||
Total current liabilities | 18,494 | 19,999 | ||||||
Non-current liabilities
| ||||||||
Listed bonds
| 11,789 | 8,878 | ||||||
Finance leases
| 110 | 112 | ||||||
Finance lease with subsidiary undertakings
| 183 | 279 | ||||||
Loans from group undertakings | 2,834 | 7,605 | ||||||
Total non-current liabilities | 14,916 | 16,874 | ||||||
Total | 33,410 | 36,873 | ||||||
| At 31 March | 2018 £m | 2017 £m | ||||||
Repayments falling due as follows:
| ||||||||
Within one year, or on demand | 18,494 | 19,999 | ||||||
Between one and two years
| 1,282 | 1,770 | ||||||
Between two and three years
| 1,876 | 1,262 | ||||||
Between three and four years
| 493 | 5,090 | ||||||
Between four and five years
| 1,695 | 527 | ||||||
After five years | 9,512 | 8,103 | ||||||
Total due for repayment after more than one year | 14,858 | 16,752 | ||||||
Total repayments
| 33,352 | 36,751 | ||||||
Fair value adjustments for hedged risk | 58 | 122 | ||||||
Total loans and other borrowings | 33,410 | 36,873 | ||||||
| Minimum lease payments | Repayment of outstanding lease obligations | |||||||||||||||
| At 31 March | 2018 £m | 2017 £m | 2018 £m | 2017 £m | ||||||||||||
Amounts payable under finance leases:
| ||||||||||||||||
Within one year
| 130 | 132 | 111 | 111 | ||||||||||||
In the second to fifth years inclusive
| 247 | 352 | 192 | 289 | ||||||||||||
After five years | 145 | 153 | 101 | 102 | ||||||||||||
| 522 | 637 | 404 | 502 | |||||||||||||
Less: future finance charges | (118 | ) | (135 | ) | – | – | ||||||||||
Total finance lease obligations | 404 | 502 | 404 | 502 | ||||||||||||
The company’s obligations under finance leases are secured by the lessors’ title to the leased assets.
11. Current trade and other payables
What estimates and critical judgements have we made in accounting for our BDUK contracts?
The company receives government grants in relation to the BDUK programme and other rural superfast broadband contracts. Where we’ve achieved certain service levels, or delivered the network more efficiently than anticipated, we’ve an obligation to either re-invest or repay grant funding. Where this is the case, we hold the deferred income in a separate category that we do not release to the income statement. Assessing the timing of whether and when we change the estimated take-up assumption is judgemental as it involves considering information which is not always observable. Our consideration on whether and when to change the base case assumption is dependent on our expectation of the long term take-up trend.
Our assessment of how much grant income to hold separately and not release includes consideration of the difference between the take-up percentage agreed with the local authority and the likelihood of actual take-up. The value of the government grants deferred is disclosed below.
| British Telecommunications plc Annual Report & Form 20-F 2018 | 183 | |||||
Table of Contents
Notes to the company financial statements continued
In the current year we had a net grant funding of £74m (2016/17: £28m net grant deferral) mainly related to our activity on the BDUK programme. Our base case assumption for take-up in BDUK areas has been increased to 41% (2016/17: 39%) following our review of the level of customer take-up. Based on the current build, a change in the take-up assumption of 4% would result in approximately a £50m movement in the amount held separately and not released to the income statement. To date the deferred amount we hold separately and do not release to the income statement is £536m (2016/17: £446m), of this the current portion of £132m (2016/17: £71m) is disclosed below and the non-current portion of £404m (2016/17:£375m) is disclosed in note 12.
| At 31 March | 2018 £m | 2017 £m | ||||||
Trade payables
| 1,709 | 1,710 | ||||||
Amounts owed to group undertakings
| 581 | 557 | ||||||
Amounts owed to parent undertakings
| 50 | 63 | ||||||
Other taxation and social security
| 377 | 377 | ||||||
Other payables
| 266 | 322 | ||||||
Accrued expenses
| 264 | 191 | ||||||
Deferred incomea | 992 | 958 | ||||||
Total | 4,239 | 4,178 | ||||||
| a | Deferred income includes government grants received or accrued of £16m (2016/17: £24m) and the potential obligation to re-invest or repay grant funding of £132m (2016/17: £71m). |
12. Other non-current payables
| At 31 March | 2018 £m | 2017 £m | ||||||
Other payablesa
| 852 | 857 | ||||||
Deferred incomeb | 1,036 | 944 | ||||||
Total | 1,888 | 1,801 | ||||||
| a | Other mainly relate to operating lease liabilities. |
| b | Deferred income includes government grants received or accrued of £611m (2016/17: £546m) and the potential obligation to re-invest or repay grant funding of £404m (2016/17: £375m). Further information on BDUK grant funding is contained in note 11. |
13. Provisions
Provisions and contingent liabilities
As disclosed below, our provisions principally relate to obligations arising from property rationalisation programmes, insurance claims, litigation and regulatory risks.
What critical judgements have we made in accounting for provisions?
We exercise judgement in determining the timing and quantum of all provisions to be recognised. Our assessment includes consideration of whether we have a present obligation, whether payment is probable and if so whether the amount can be estimated reliably. As part of this assessment, we also assess the likelihood of contingent liabilities occurring in the future which are not recognised as liabilities on our balance sheet. By their nature, contingencies will be resolved only when one or more uncertain future events occur or fail to occur. We assess the likelihood that a potential claim or liability will arise and also quantify the possible range of financial outcomes where this can be reasonably determined. We’ve disclosed our assessment of contingent liabilities in note 16.
What other critical estimates and assumptions have we made?
Under our property rationalisation programmes we’ve identified a number of surplus properties. Although efforts are being made to sublet this space, this is not always possible. Estimates have been made of the cost of vacant possession and of any shortfall arising from any potential sub-lease income being lower than the lease costs. Any such shortfall is recognised as a provision.
Our regulatory provision represents our best estimate of the cost to settle our present obligation in relation to historical regulatory matters. The charge for the year represents the outcome of management’s re-assessment of the estimates and regulatory risks across a range of issues, including price and service issues. The prices at which certain services are charged are regulated and may be subject to retrospective adjustment by regulators. Estimates are used in assessing the likely value of the regulatory risk.
In 2016/17 we recognised a £300m charge in relation to estimated Deemed Consent compensation payments. The precise amount of the compensation payments will result from discussions with the affected parties and as of 31 March 2018, we still consider this estimate to be appropriate. In 2016/17 a related fine of £42m was imposed and was recognised as a payable rather than as a provision. The remaining provision increases also reflected management’s estimates of regulatory risks across a range of issues, including price and service issues. These increased by £51m (2016/17: £126m) resulting from our re-assessment of these other regulatory risks and in light of the regulatory decisions by Ofcom.
| 184 | British Telecommunications plc Annual Report & Form 20-F 2018 | |||||
Table of Contents
| THE STRATEGIC REPORT | GOVERNANCE | FINANCIAL STATEMENTS | ADDITIONAL INFORMATION | |||||||||
|
|
| ||||||||||
In respect of claims, litigation and regulatory risks, the company provides for anticipated costs where an outflow of resources is considered probable and a reasonable estimate can be made of the likely outcome.
Included within Other are contract loss provisions of £29m (2016/17 £23m) relating to the anticipated total losses in respect of certain contracts. It is expected that the majority of these provisions will be utilised in the next few years. Given the short period remaining to the finalisation of these contracts, any potential future changes to key assumptions made when estimating their future losses are not expected to have a significant impact. There is no single change in key variables that could materially affect future expected losses on these contracts. Also included in Other are amounts provided for constructive obligations arising from insurance claims which will be utilised as the obligations are settled.
For all risks, the ultimate liability may vary from the amounts provided and will be dependent upon the eventual outcome of any settlement. The estimates are discounted using a rate that reflects the passage of time and risk specific to the liability. An estimate is also required in assessing the timing of when a provision is recognised. The outcome of our estimate of the provisions is disclosed below.
| Provisions for liabilities and charges excluding deferred taxation | Property £m | Regulatory £m | Litigation £m | Othera £m | Total £m | |||||||||||||||
At 1 April 2017
| 227 | 479 | 48 | 108 | 862 | |||||||||||||||
Charged to the income statement
| 35 | 51 | – | 12 | 98 | |||||||||||||||
Unwind of discount
| 9 | – | – | – | 9 | |||||||||||||||
Utilised or released
| (27 | ) | (210 | ) | – | (18 | ) | (255 | ) | |||||||||||
Transfers | – | – | – | 5 | 5 | |||||||||||||||
At 31 March 2018 | 244 | 320 | 48 | 107 | 719 | |||||||||||||||
| a | Other provisions include contract loss provisions and amounts provided for legal or constructive obligations arising from insurance claims risks, which will be utilised as the obligations are settled. |
Analysed as:
| 2018 £m | 2017 £m | |||||||
Current | 428 | 539 | ||||||
Non current | 291 | 323 | ||||||
| 719 | 862 | |||||||
Taxation
The value of the company’s income tax asset is disclosed on the company balance sheet on page 171. The values of the company’s deferred tax assets and liabilities are disclosed in note 17 and below. Deferred tax liabilities are provided for in full on certain temporary differences.
What critical estimates do we make in accounting for taxation?
We seek to pay tax in accordance with the laws of the countries where we do business. However, in some areas these laws are unclear, and it can take many years to agree an outcome with a tax authority or through litigation. We estimate our tax on country-by-country and issue-by-issue bases. Our key uncertainties are whether our intra-group trading model will be accepted by a particular tax authority and whether intra-group payments are subject to withholding taxes. We provide for the most likely outcome where an outflow is probable, but the agreed amount can differ materially from our estimates. Approximately 80% by value of the provisions are under active tax authority examination and are therefore likely to be re-estimated or resolved in the coming 12 months. £215m (2016/17: £246m) is offset within current tax assets in relation to these uncertainties. Under a downside case an additional amount of £79m could be required. This amount is not provided as we don’t consider this outcome to be probable.
| £m | ||||
At 1 April 2017
| 871 | |||
Charge recognised in the income statement
| 29 | |||
Transfer to deferred tax asset
| 7 | |||
Transfer to current tax
| 17 | |||
Credit recognised in reserves | (6 | ) | ||
At 31 March 2018 | 918 | |||
| British Telecommunications plc Annual Report & Form 20-F 2018 | 185 | |||||
Table of Contents
Notes to the company financial statements continued
| At 31 March | 2018 £m | 2017 £m | ||||||
Tax effect of temporary differences due to:
| ||||||||
Excess capital allowances
| 965 | 923 | ||||||
Share-based payments
| (7 | ) | (18 | ) | ||||
Other | (40 | ) | (34 | ) | ||||
Total provision for deferred taxation | 918 | 871 | ||||||
The deferred taxation asset relating to the retirement benefit deficit is disclosed in note 17.
What factors affect our future tax charges?
The rate of UK corporation tax will change from 19% to 17% on 1 April 2020. As deferred tax assets and liabilities are measured at the rate that are expected to apply in the periods of reversal, deferred tax balances at 31 March 2018 have been calculated at the rate at which the relevant balance is expected to be recovered or settled.
14. Reconciliation of movement in other reserves
Cash flow reservea £m | Capital redemption reserveb £m | Total other reserves £m | ||||||||||
At 1 April 2016
| 148 | 752 | 900 | |||||||||
Net fair value gains
| 790 | – | 790 | |||||||||
Recognised in income statement in the year
| (839 | ) | – | (839 | ) | |||||||
Tax on items taken directly to equity | 6 | – | 6 | |||||||||
At 1 April 2017
| 105 | 752 | 857 | |||||||||
Net fair value losses
| (360 | ) | – | (360 | ) | |||||||
Recognised in income statement in the year
| 277 | – | 277 | |||||||||
Tax on items taken directly to equity
| 12 | – | 12 | |||||||||
Transfer to realised profit | (83 | ) | – | (83 | ) | |||||||
At 31 March 2018 | (49 | ) | 752 | 703 | ||||||||
| a | The cash flow reserve is used to record the effective portion of the cumulative net change in the fair value of cash flow hedging instruments related to hedged transactions that have not yet occurred. Amounts recognised in income statement in the year relate to fair value movements on derivatives. The items generating these foreign exchange movements are in designated cash flow hedge relationships. |
| b | The capital redemption reserve is not available for distribution. |
15. Related party transactions
The company is a wholly owned subsidiary of BT Group Investments Limited, which is the immediate parent company. BT Group Investments Limited is a wholly owned subsidiary of the ultimate holding company and controlling entity, BT Group plc.
Amounts paid out to the company’s retirement benefit plans are set out in note 17.
Copies of the ultimate holding company’s financial statements may be obtained from The Secretary, BT Group plc, 81 Newgate Street, London EC1A 7AJ.
The results of the company are included in the consolidated financial statements of BT Group plc. As permitted by FRS 101, paragraph 8(k) and the Companies Act 2006 the company is exempt from the requirements of IAS 24 Related Party Disclosures to disclose related party transactions entered into between two or more members of a group, provided that any subsidiary which is a party to the transaction is wholly owned by such member.
16. Financial commitments and contingent liabilities
Financial commitments were as follows:
| At 31 March | 2018 £m | 2017 £m | ||||||
Capital commitments | 661 | 452 | ||||||
TV programme rights commitments | 2,823 | 2,644 | ||||||
Other commitments | 6 | 1 | ||||||
Total | 3,490 | 3,097 | ||||||
| 186 | British Telecommunications plc Annual Report & Form 20-F 2018 | |||||
Table of Contents
| THE STRATEGIC REPORT | GOVERNANCE | FINANCIAL STATEMENTS | ADDITIONAL INFORMATION | |||||||||
|
|
| ||||||||||
As at 31 March 2018 TV programme rights commitments, mainly relating to football broadcast rights, are those for which the licence period has not yet started.
Future minimum operating lease payments for the company were as follows:
2018 £m | 2017 £m | |||||||
Payable in the year ending 31 March:
| ||||||||
2018
| – | 331 | ||||||
2019
| 334 | 329 | ||||||
2020
| 335 | 332 | ||||||
2021
| 341 | 339 | ||||||
2022
| 346 | 345 | ||||||
2023
| 353 | 351 | ||||||
Thereafter | 3,556 | 3,569 | ||||||
Total future minimum operating lease payments | 5,265 | 5,596 | ||||||
Operating lease commitments were mainly in respect of land and buildings which arose from a sale and operating leaseback transaction in 2001. Leases have an average term of 14 years (2016/17: 15 years) and rentals are fixed for an average of 14 years (2016/17: 15 years).
Other than as disclosed below, there were no contingent liabilities or guarantees at 31 March 2018, other than those arising in the ordinary course of the company’s business and on these no material losses are anticipated. The company has insurance cover to certain limits for major risks on property and major claims in connection with legal liabilities arising in the course of its operations. Otherwise, the company generally carries its own risks.
Commitments and guarantees
BDUK
Under the Broadband Delivery UK programme, grants received by the company may be subject to reinvestment or repayment to the customer depending on the level of take-up.
Telefónica UK Limited leases
We’ve provided guarantees relating to certain leases entered into by Telefónica UK Limited (formerly O2 UK Limited) prior to the demerger of mmO2 from BT on 19 November 2001. mmO2 plc (now part of the Telefónica Group) has given BT a counter indemnity for these guarantees. There is no exposure in the event of credit default in respect of amounts used to defease future lease obligations. The guarantee lasts until Telefónica UK Limited has discharged all its obligations.
| British Telecommunications plc Annual Report & Form 20-F 2018 | 187 | |||||
Table of Contents
Notes to the company financial statements continued
Regulatory matters
In respect of regulatory risks, the company provides for anticipated costs where an outflow of resources is considered probable and a reasonable estimate can be made of the likely outcome. Estimates are used in assessing the likely value of the regulatory risk. The ultimate liability may vary from the amounts provided and will be dependent upon the eventual outcome of any settlement.
We hold provisions for regulatory risks. These provisions cover the following issues:
Deemed Consent
Deemed Consent is an agreed process between Openreach and its Communications Provider (CP) customers, which allows Openreach to halt the installation and reschedule the delivery date for providing dedicated business services (known as Ethernet) in a number of specific circumstances where it is beyond its control. Ofcom found that Openreach had breached its contractual and regulatory obligations by inadequately and retrospectively applying Deemed Consent to reduce compensation payments to CPs between January 2013 and December 2014.
We continue to estimate the total compensation payments will amount to around £300m. However, the precise amount will result from discussions with affected parties, and could result in lower or higher payments.
Other regulatory matters
The remaining provision reflects management’s estimates of regulatory risks across a range of issues, including price and service issues. The precise outcome of each matter depends on whether it becomes an active issue, and the extent to which negotiation or regulatory decision will result in financial settlement.
17. Retirement benefit plans
Background
The company has both defined benefit and defined contribution retirement benefit plans. These plans are in the UK and the largest by membership is the BT Pension Scheme (BTPS) which is a defined benefit plan that was closed to new entrants on 31 March 2001. After that date new entrants have been able to join a defined contribution plan, currently the BT Retirement Saving Scheme (BTRSS), a contract-based arrangement.
What are our critical judgements, estimates and assumptions?
The accounting cost of these benefits and the present value of our pension liabilities involve judgements about uncertain events including the life expectancy of the members, the salary progression of our current employees, price inflation and the discount rate used to calculate the net present value of the future pension payments. We use estimates for all of these uncertain events in determining the pension costs and liabilities in our financial statements. Our assumptions reflect historical experience and our judgement regarding future expectations.
We also estimate the fair value of our pension assets which are made up of quoted and unquoted investments. The latter require more judgement as their values are not directly observable. The assumptions used in valuing unquoted investments are impacted by current market conditions and trends which could result in changes in fair value subsequent to measurement date.
| Year ended 31 March | 2018 £m | 2017 £m | ||||||
Current service cost:
| ||||||||
– defined benefit plans (including administration expenses and PPF levy)
| 364 | 269 | ||||||
– defined contribution plans | 181 | 160 | ||||||
Total operating expense | 545 | 429 | ||||||
Net interest expense on net pensions deficit | 206 | 200 | ||||||
Amount charged to profit before taxation | 751 | 629 | ||||||
The total operating charge relating to defined benefit plans was £365m (2016/17: £270m) of which £1m (2016/17: £1m) has been recharged to subsidiary undertakings who are participating employers in the BTPS. The company retains the full liability for the BTPS.
The income statement charge in respect of defined contribution schemes represents the contributions payable by the company based upon a fixed proportion of employees’ pay. The company has no exposure to investment and other experience risk.
| 188 | British Telecommunications plc Annual Report & Form 20-F 2018 | |||||
Table of Contents
| THE STRATEGIC REPORT | GOVERNANCE | FINANCIAL STATEMENTS | ADDITIONAL INFORMATION | |||||||||
|
|
| ||||||||||
Balance sheet
The net pension obligation in respect of defined benefit plans reported in the balance sheet is set out below:
| 2018 | 2017 | |||||||||||||||||||||||||||
| At 31 March | Assets £m | Present value of liabilities | Deficit £m | Assets £m | Present value of liabilities | Deficit £m | ||||||||||||||||||||||
BTPS
| 49,894 | (55,783 | ) | (5,889 | ) | 50,090 | (58,649 | ) | (8,559 | ) | ||||||||||||||||||
Other plansa | 33 | (102 | ) | (69 | ) | 34 | (107 | ) | (73 | ) | ||||||||||||||||||
Total asset (deficit) | 49,927 | (55,885 | ) | (5,958 | ) | 50,124 | (58,756 | ) | (8,632 | ) | ||||||||||||||||||
Impact of asset ceiling
| – | – | ||||||||||||||||||||||||||
Deferred tax asset | 1,042 | 1,502 | ||||||||||||||||||||||||||
Net pension obligation | (4,916 | ) | (7,130 | ) | ||||||||||||||||||||||||
| a | Included in the present value of liabilities of other plans is £61m (2016/17: £67m) related to unfunded pension arrangements. |
At 31 March 2018, £17m (2016/17: £11m) of contributions to defined contribution plans were outstanding and are reported under other creditors on the balance sheet. A deferred tax asset of £2m (2016/17: £2m) is recognised in relation to this.
Total deferred tax assets of £1,044m (2016/17: £1,504m) comprise £1,042m (2016/17: £1,502m) in respect of the defined benefit plan obligation and £2m (2016/17: £2m) in respect of the defined contribution plan.
Movements in defined benefit plan assets and liabilities are shown below:
Assets £m | Liabilities £m | Deficit £m | ||||||||||||||||||
At 1 April 2016 | 43,137 | (49,189 | ) | (6,052 | ) | |||||||||||||||
Acquisitionb
| 12 | (19 | ) | (7 | ) | |||||||||||||||
Current service cost (including administration expenses and PPF levy)
| (44 | ) | (226 | ) | (270 | ) | ||||||||||||||
Interest on pension deficit
| 1,386 | (1,586 | ) | (200 | ) | |||||||||||||||
Return on plan assets above pensions interest on assets
| 7,366 | – | 7,366 | |||||||||||||||||
Actuarial loss arising from changes in financial assumptions
| – | (9,885 | ) | (9,885 | ) | |||||||||||||||
Actuarial gain arising from experience adjustments
| – | 139 | 139 | |||||||||||||||||
Actuarial loss arising from changes in demographic assumptions
| – | (279 | ) | (279 | ) | |||||||||||||||
Regular contributions by employer
| 305 | – | 305 | |||||||||||||||||
Deficit contributions by employer
| 251 | – | 251 | |||||||||||||||||
Contributions by employees
| 8 | (8 | ) | – | ||||||||||||||||
Benefits paid | (2,297 | ) | 2,297 | – | ||||||||||||||||
At 1 April 2017
| 50,124 | (58,756 | ) | (8,632 | ) | |||||||||||||||
Current service cost (including administration expenses and PPF levy)
| (66 | ) | (299 | ) | (365 | ) | ||||||||||||||
Interest on pension deficit
| 1,177 | (1,383 | ) | (206 | ) | |||||||||||||||
Return on plan assets above pensions interest on assetsa
| 9 | – | 9 | |||||||||||||||||
Actuarial gain arising from changes in financial assumptions
| – | 2,196 | 2,196 | |||||||||||||||||
Actuarial loss arising from changes in demographic assumptions
| – | (222 | ) | (222 | ) | |||||||||||||||
Actuarial gain arising from experience adjustments
| – | 159 | 159 | |||||||||||||||||
Regular contributions by employer
| 252 | – | 252 | |||||||||||||||||
Deficit contributions by employer
| 851 | – | 851 | |||||||||||||||||
Contributions by employees
| 1 | (1 | ) | – | ||||||||||||||||
Benefits paid | (2,421 | ) | 2,421 | – | ||||||||||||||||
At 31 March 2018 | 49,927 | (55,885 | ) | (5,958 | ) | |||||||||||||||
| a | Actual return on plan assets in 2017/18 was £1,186m (2016/17 £8,752m). |
| b | On 1 April 2016 BT plc acquired the trade and assets of BT IT Services Limited as part of an ongoing entity rationalisation programme. |
BTPS
Information covering details of the BTPS, including the valuation methodology of scheme assets and liabilities, funding valuation and future funding obligations is disclosed in note 19 of the consolidated financial statements of BT plc.
| British Telecommunications plc Annual Report & Form 20-F 2018 | 189 | |||||
Table of Contents
Notes to the financial statements continued
18. Employees and directors
The average number of persons employed by the company (including directors) during the year was:
| Year ended 31 March | 2018 000 | 2017 000 | ||||||
Average monthly number of employeesa | 66.3 | 65.0 | ||||||
The aggregate staff costs were as follows:
| Year ended 31 March | 2018 £m | 2017 £m | ||||||
Wages and salaries
| 2,726 | 2,602 | ||||||
Share-based payments
| 61 | 40 | ||||||
Social security
| 300 | 318 | ||||||
Other pension costs | 545 | 429 | ||||||
| 3,632 | 3,389 | |||||||
| a | Includes an average of 28 non-UK employees (2016/17: 52 non UK employees). |
19. Directors’ remuneration
Information covering directors’ remuneration, interests in shares and share options of BT Group plc (the ultimate parent), pension benefits and loss of office is included in note 5 to the consolidated financial statements of BT plc.
20. Derivatives
All of the company’s derivative financial instruments are held at fair value on the company’s balance sheet. The fair values of outstanding swaps and foreign exchange contracts are estimated using discounted cash flow models and market rates of interest and foreign exchange at the balance sheet date.
| 31 March 2018 | Current £m | Non current £m | Current £m | Non current £m | ||||||||||||
Designated in a cash flow hedge
| 187 | 1,061 | 37 | 587 | ||||||||||||
Other | 14 | 251 | 13 | 200 | ||||||||||||
Total derivatives | 201 | 1,312 | 50 | 787 | ||||||||||||
| At 31 March 2017 | Current asset £m | Non current asset £m | Current £m | Non current liability £m | ||||||||||||
Designated in a cash flow hedge
| 414 | 1,508 | 24 | 616 | ||||||||||||
Other | 11 | 310 | 9 | 253 | ||||||||||||
Total derivatives | 425 | 1,818 | 33 | 869 | ||||||||||||
Hedging activities
Derivatives may qualify as hedges for accounting purposes if they meet the criteria for designation as fair value hedges or cash flow hedges in accordance with IAS 39.
Cash flow hedges
Instruments designated in a cash flow hedge include interest rate swaps and cross-currency swaps hedging Euro and US Dollar denominated borrowings. Forward currency contracts are taken out to hedge step-up interest on currency denominated borrowings relating to our 2030 US Dollar bond. The hedged cash flows will affect profit or loss as interest and principal amounts are repaid over the remaining term of the borrowings (see note 10).
Forecast foreign currency purchases, principally denominated in US Dollar, Euro and Asia Pacific currencies are hedged 12 months forward, with certain specific transactions hedged further forward. The related cash flows will be recognised in the income statement over this period.
All cash flow hedges were fully effective in the period. See note 14 for details of the movements in the cash flow hedge reserve.
Other derivatives
The company’s policy is not to use derivatives for speculative purposes. However, due to the complex nature of hedge accounting under IAS 39, some derivatives may not qualify for hedge accounting, or are specifically not designated as a hedge where natural offset is more appropriate. Derivative instruments that do not qualify for hedge accounting are classified as held for trading and held at fair value through profit or loss under IAS 39.
| 190 | British Telecommunications plc Annual Report & Form 20-F 2018 | |||||
Table of Contents
| THE STRATEGIC REPORT | GOVERNANCE | FINANCIAL STATEMENTS | ADDITIONAL INFORMATION | |||||||||
|
|
| ||||||||||
21. Post balance sheet events
Strategy update
In May 2018 BT Group plc announced an update to our strategy to accelerate leadership in converged connectivity and services. The strategy will drive sustainable growth in value by focusing on delivering differentiated customer experiences, investing in integrated network leadership, and transforming the operating model and includes the repositioning of Global Services as a more focused digital business. This also includes the next phase of the restructuring programme. Across BT Group plc this programme involves the reduction of c.13,000 mainly back office and middle management roles at a cost of £800m with a 2 year payback and expected year 3 cash cost reduction of £1.5bn. The balances of the first phase of the restructuring programme (£60m of cost and removal of 1,200 FTE roles) and our EE integration programme (further run rate synergies of £110m) are included in this wider transformation programme. The specific impact on the company is yet to be determined.
Triennial valuation of BT Pension Scheme
In May 2018 we concluded the 30 June 2017 triennial valuation of the BT Pension Scheme. Details are set out in note 19 of the consolidated financial statements.
| British Telecommunications plc Annual Report & Form 20-F 2018 | 191 | |||||
Table of Contents
Subsidiaries
| Company name | Activity | Group interest in allotted capitala | Registered Address and Country of incorporation | |||
Held directly | ||||||
Autumnwindow Limited | Property company | 100% ordinary | 81 Newgate Street, London, EC1A 7AJ, United Kingdom | |||
Autumnwindow No.2 Limited | Finance company | 100% ordinary | 81 Newgate Street, London, EC1A 7AJ, United Kingdom | |||
Autumnwindow No.3 Limited | Property company | 100% ordinary | 81 Newgate Street, London, EC1A 7AJ, United Kingdom | |||
BPSLP Limited | Communications related services, systems integration and products provider | 100% ordinary | 81 Newgate Street, London, EC1A 7AJ, United Kingdom | |||
BT Business Direct Limited | Technology equipment retailer | 100% ordinary | Alpha & Beta House, Enterprise Park, Horwich, Bolton, Lancs, BL6 6PE, United Kingdom | |||
BT Cables Limited | Manufacture of telecommunications and rail signalling cables | 100% ordinary | 81 Newgate Street, London, EC1A 7AJ, United Kingdom | |||
BT Centre Nominee 2 Limited | Property company | 100% ordinary | 81 Newgate Street, London, EC1A 7AJ, United Kingdom | |||
BT Corporate Trustee Limited | Finance company | 100% limited by guarantee | 81 Newgate Street, London, EC1A 7AJ, United Kingdom | |||
BT Directories Limited | In liquidation | 100% ordinary | BDO LLP, 55 Baker Street, London, W1U 7EU, United Kingdom | |||
BT Eighty-Four Limited | In liquidation | 100% ordinary | 1 More London Place, London, SE1 2AF, United Kingdom | |||
BT European Investments Limited | Investment/holding company | 100% ordinary | 81 Newgate Street, London, EC1A 7AJ, United Kingdom | |||
BT Facilities Services Limited | Provision of facilities management services | 100% ordinary | 81 Newgate Street, London, EC1A 7AJ, United Kingdom | |||
BT Fleet Limited | Fleet management | 100% ordinary | 81 Newgate Street, London, EC1A 7AJ, United Kingdom | |||
BT Global Services Luxembourg SARL | Communications related services, systems integration and products provider | 100% ordinary | 12 rue Eugene Ruppert, L 2453, Luxembourg | |||
BT Holdings Limited | Investment holding company | 100% ordinary | 81 Newgate Street, London, EC1A 7AJ, United Kingdom | |||
BT IT Services Limited | In liquidation | 100% ordinary | BDO LLP, 55 Baker Street, London, W1U 7EU, United Kingdom | |||
BT Italia S.p.A. | Communications related services and products provider | 99% ordinary | Via Tucidide 56, Torre 7, 20134, Milano, Italy | |||
BT Lancashire Services Limited | Communications related services and products provider | 100% ordinary | 81 Newgate Street, London, EC1A 7AJ, United Kingdom | |||
BT Law Limited | Provision of third party claims handling services | 100% ordinary | 81 Newgate Street, London, EC1A 7AJ, United Kingdom | |||
BT Leasing Limited | In liquidation | 100% ordinary | BDO LLP, 55 Baker Street, London, W1U 7EU, United Kingdom | |||
BT Managed Services Limited | Communications related services and products provider | 100% ordinary | 81 Newgate Street, London, EC1A 7AJ, United Kingdom | |||
BT Nederland N.V. | Communications related services and products provider | 100% ordinary | Minerva & Mercurius building, Herikerbergweg 2, 1101CM, Amsterdam Zuidoost, Netherlands | |||
BT Nominees Limited | Dormant | 100% ordinary | 81 Newgate Street, London, EC1A 7AJ, United Kingdom | |||
BT Property Holdings (Aberdeen) Limited | Property/holding company | 100% ordinary | 81 Newgate Street, London, EC1A 7AJ, United Kingdom | |||
BT Property Holdings (Oxford) Limited | Property/holding company | 100% ordinary | 81 Newgate Street, London, EC1A 7AJ, United Kingdom | |||
BT Property Limited | Dormant | 100% ordinary | 81 Newgate Street, London, EC1A 7AJ, United Kingdom | |||
BT Seventy-Three | In liquidation | 100% ordinary | BDO LLP, 55 Baker Street, London, W1U 7EU, United Kingdom | |||
BT Sle Euro Limited | Finance company | 100% ordinary | 81 Newgate Street, London, EC1A 7AJ, United Kingdom |
| 192 | British Telecommunications plc Annual Report & Form 20-F 2018 | |||||
Table of Contents
| THE STRATEGIC REPORT | GOVERNANCE | FINANCIAL STATEMENTS | ADDITIONAL INFORMATION | |||||||||
|
|
| ||||||||||
| Company name | Activity | Group interest in allotted capitala | Registered Address and Country of incorporation | |||
BT Sle USD Limited | Finance company | 100% ordinary | 81 Newgate Street, London, EC1A 7AJ, United Kingdom | |||
BT Solutions Limited | Communications related services, systems integration and products provider | 100% ordinary | 81 Newgate Street, London, EC1A 7AJ, United Kingdom | |||
BT Technology (Dalian) Company Limited. | Communications related services, systems integration and products provider | 100% registered | Building 16, 6th Floor, Room 602-B, No. 269 Wuyi Road, Hi-tech Park, Dalian, 116023, China | |||
BT US Investments Limited | Investment/holding company | 100% ordinary | Ogier House, The Esplanade, Parish, St Helier, Jersey, JE4 9WG, Jersey | |||
BTexact Technologies Limited | Finance company | 100% ordinary | 81 Newgate Street, London, EC1A 7AJ, United Kingdom | |||
BTexact Venturing Limited | Investment/holding company | 100% ordinary | 81 Newgate Street, London, EC1A 7AJ, United Kingdom | |||
Communications Global Network Services Limited | Communications related services and products provider | 100% ordinary | Century House, 16 Par-la-Ville Road, Hamilton, HM08, Bermuda | |||
dabs.com plc | Technology equipment retailer | 100% ordinary | Alpha & Beta House, Enterprise Park, Horwich, Bolton, Lancs, BL6 6PE, United Kingdom | |||
Deleteway Limited | In liquidation | 100% ordinary | 1 More London Place, London, SE1 2AF, United Kingdom | |||
Dublin London Network Limited | In liquidation | 55% ordinary | 2 Grand Canal Plaza, Upper Grand Canal Street, Dublin 4, Republic of Ireland | |||
EE Limited | Telecommunications | 100% ordinary | Trident Place, Mosquito Way, Hatfield, Hertfordshire, AL10 9BW, United Kingdom | |||
groupBT Limited | Communications related services, systems integration and products provider | 100% ordinary | 81 Newgate Street, London, EC1A 7AJ, United Kingdom | |||
Holland House (Northern) Limited | Property/holding company | 100% ordinary | Alexander Bain House, 15 York Street, Glasgow, G2 8LA, Scotland | |||
Ilford Trustees (Jersey) Limited | Investment company | 100% ordinary | 26 New Street, St Helier, JE2 3RA, Jersey | |||
Newgate Leasing Limited | In liquidation | 100% ordinary | BDO LLP, 55 Baker Street, London, W1U 7EU, United Kingdom | |||
Openreach Limited | Wired telecommunications activities | 100% ordinary | Kelvin House , 123 Judd Street, London, WC1H 9NP United Kingdom | |||
Pelipod Ltd | Supplier of delivery pods for supply chain solution | 100% ordinary | 81 Newgate Street, London, EC1A 7AJ, United Kingdom | |||
Plusnet plc | Broadband service provider | 100% ordinary | The Balance, 2 Pinfold Street, Sheffield, S1 2GU, United Kingdom | |||
Radianz Italia S.r.l. | Communications related services, systems integration and products provider | 100% ordinary | Via Correggio 5, 20097, San Donato Milanese, Milan, Italy | |||
Radianz Limited | Investment/holding company | 100% ordinary | 81 Newgate Street, London, EC1A 7AJ, United Kingdom | |||
Southgate Developments Limited | Investment/holding company | 100% ordinary | 81 Newgate Street, London, EC1A 7AJ, United Kingdom | |||
Tikit Limited | Software services products provider | 100% ordinary | 81 Newgate Street, London, EC1A 7AJ, United Kingdom | |||
Transcomm UK Limited | Communications related services and products provider | 100% ordinary | 81 Newgate Street, London, EC1A 7AJ, United Kingdom | |||
Held via other group companies | ||||||
América Inalámbrica S.A. | Communications related services, systems integration and products provider | 100% common | Calle 113, 7 - 21 Piso 11, Torre A. Oficina 1112, Bogota, Colombia | |||
Atlanet SpA | Communications related services, systems integration and products provider | 99% ordinary | Via Pianezza n° 123, Torino, Italy | |||
B. Telecomunicações, Cabo Verde, Sociedade Unipessoal, SA | In liquidation | 100% ordinary | Avenida Andrade Corvo, 30, Praia, CP63, Cabo Verde | |||
B.T. Communication Israel Ltd | Communications related services, systems integration and products provider | 100% ordinary | Beit Oz, 14 Abba Hillel Silver Rd, Ramat Gan, 52506, Israel | |||
Basictel SpA | Communications related services, systems integration and products provider | 99% ordinary | Via Tucidide 56, Torre 7, 20134, Milano, Italy | |||
Belmullet Limited | Investment company | 100% ordinary | Third Floor, St Georges Court, Upper Church Street, Douglas, IM1 1EE, Isle of Man |
| British Telecommunications plc Annual Report & Form 20-F 2018 | 193 | |||||
Table of Contents
Related undertakings continued
| Company name | Activity | Group interest in allotted capitala | Registered Address and Country of incorporation | |||
Bruning Limited | Finance company | 100% ordinary | 81 Newgate Street, London, EC1A 7AJ, United Kingdom | |||
BT (Barbados) Limited | Communications related services, systems integration and products provider | 100% ordinary | The Gabbles, Haggatt Hall, St Michael, Barbados | |||
BT (Germany) GmbH & Co. oHGc | Communications related services and products provider | 100% ordinary | Barthstraße 4, 80339, Munich, Germany | |||
BT (Gibraltar) Limited | Communications related services and products provider | 100% ordinary | Montagu Pavilion, 8-10 Queensway, Gibraltar | |||
BT (India) Private Limited | Communications related services and products provider | 100% ordinary | 11th Floor, Eros Corporate Tower, Opp. International Trade Tower, Nehru Place, New Delhi, 110019, India | |||
BT (India) Private Limited Singapore Branchd | Trade and export of network IT equipment | 100% – | 8 Changi Business Park Ave (South Tower), #08-51 UE Bizhub East, Singapore, 486018, Singapore | |||
BT (International) Holdings Limited | Investment/holding company | 100% ordinary | 81 Newgate Street, London, EC1A 7AJ, United Kingdom | |||
BT (International) Holdings Limited (Jordan) | Communications related services, systems integration and products provider | 100% ordinary | Al Mirad Building – Second Floor, Wadi Saqra Street Amman – P.O.Box 962178 Amman 11196, Jordan | |||
BT (Netherlands) Holdings B.V. | Holding company | 100% ordinary | Minerva & Mercurius building, Herikerbergweg 2, 1101CM, Amsterdam Zuidoost, Netherlands | |||
BT (Nigeria) Limited | Communications related services and products provider | 100% ordinary | ADOL House, 15 CIPM Avenue, Central Business District, Alausa, Ikeja, Lagos, Nigeria | |||
BT (RRS LP) Limited | Investment/holding company | 100% ordinary | 81 Newgate Street, London, EC1A 7AJ, United Kingdom | |||
BT (SL) Limited | Communications related services and products provider | 100% ordinary | 84 Dundas Street, Freetown, Sierra Leone | |||
BT (Vietnam) Co. Ltd. | Communications related services and products provider | 100% ordinary | 16th Floor, Saigon Tower, 29 Le Duan Road, District 1, Ho Chi Minh City, Socialist Republic of Vietnam | |||
BT Albania Limited SH.P.K | Communications related services and products provider | 100% ordinary | Rr. Murat Toptani, Eurocol Center, Kati 8, Tirana, Albania | |||
BT Algeria Communications SARL | Communications related services and products provider | 100% ordinary | 20 Micro zone d’Activités Dar El Madina, Bloc B, Loc N01 Hydra, Alger, 16000, Algeria | |||
BT Americas Holdings Inc. | Holding company | 100% common | c/o Corporation Service Company, 251 Little Falls Drive, Wilmington DE 19808, United States | |||
BT Americas Inc. | Communications related services, systems integration and products provider | 100% common | c/o Corporation Service Company, 251 Little Falls Drive, Wilmington DE 19808, United States | |||
BT Argentina S.R.L. | Communications related services and products provider | 100% ordinary | Lola Mora 421, 15th Floor, Puerto Madero, Buenos Aires, C1107DDA, Argentina | |||
BT Australasia Pty Limited | Communications related services and products provider | 100% ordinary 100% preference | Level 1, 76 Berry Street, North Sydney NSW 2060, Australia | |||
BT Australasia Pty Limited – New Zealand Branchd | Communications related services, systems integration and products provider | 100% – | c/- BDO Auckland, Level 4, 4 Graham Street, Auckland, 1010, New Zealand | |||
BT Austria GmbH | Communications related services, systems integration and products provider | 100% ordinary | Louis-Häfliger-Gasse 10, 1210, Wien, Austria | |||
BT Azerbaijan Limited, Limited Liability Company | Communications related services, systems integration and products provider | 100% ordinary | The Landmark III Building, 8th Floor, c/o Deloitte & Touche, 96 Nizami Street, Baku, AZ 1010, Azerbaijan | |||
BT Belgrade d.o.o | Communications related services, systems integration and products provider | 100% ordinary | Dimitrija Georgijevica Starike 20, Belgrade, 11070, Republic of Serbia | |||
BT BELRUS Foreign Limited Liability Company | Communications related services, systems integration and products provider | 100% ordinary | 58 Voronyanskogo St, Office 89, Minsk 220007, Belarus | |||
BT Bilisim Hizmetleri Anonim Şirketi | Communications related services, systems integration and products provider | 100% ordinary | Yenisahra Mahallesi, Yavuz Selim Caddesi No 19/A, Atasehir, Istanbul, Turkey | |||
BT Brasil Serviços de Telecomunicações Ltda | Communications related services, systems integration and products provider | 100% quotas | Rodovia SP 101, KM 9,5, Trecho Campinas- Monte Mor, Unidade 27, Bloco Beta, Distrito Industrial, Hortolandia - SP- CEP, Sao Paolo, 13185-900, Brazil |
| 194 | British Telecommunications plc Annual Report & Form 20-F 2018 | |||||
Table of Contents
| THE STRATEGIC REPORT | GOVERNANCE | FINANCIAL STATEMENTS | ADDITIONAL INFORMATION | |||||||||
|
|
| ||||||||||
| Company name | Activity | Group interest in allotted capitala | Registered Address and Country of incorporation | |||
BT Broadband Luxembourg Sàrl | Holding company | 100% ordinary | 12 rue Eugene Ruppert, L 2453, Luxembourg | |||
BT Bulgaria EOOD | Communications related services, systems integration and products provider | 100% ordinary | 51B Bulgaria Blvd., fl. 4, Sofia, 1404, Bulgaria | |||
BT Cables MEA FZE | Sale of telecommunications and rail signalling cables | 100% ordinary | Office No. TPOFCB0505, Jabal Ali, Dubai, United Arab Emirates | |||
BT Canada Inc. | Communications related services | 100% common | 200 King St W, Suite 1904, Toronto ON M5H 3T4, Canada | |||
BT China Communications Limited | Communications related services, systems integration and products provider | 50% ordinary | Unit 1537B, Floor 15th, No. 55, Xili Road, Shanghai Free Trade Zone, Shanghai, China | |||
BT China Limited | Communications related services, systems integration and products provider | 100% registered | Room 702A, Tower W3, Oriental Plaza, 1 East Chang An Avenue, Dongcheng, Beijing, 100738, China | |||
BT China Limited – Shanghai Branch Officed | Communications related services, systems integration and products provider | 100% – | Room 2101-2103, 21/F, International Capital Plaza, No. 1318 North Sichuan Road, Hong Kou District, Shanghai, 200080, China | |||
BT Colombia Limitada | Communications related services, systems integration and products provider | 100% quotas | Calle 113 , 7 - 21 Piso 11, Torre A. Oficina 1112, Bogota, Colombia | |||
BT Communications Bangladesh Limited | Communications related services, systems integration and products provider | 100% ordinary | House 51 (3rd Floor), Road 9, Block F, Banani, Dhaka, 1213, Bangladesh | |||
BT Communications do Brasil Limitada | Communications related services, technology consulting and products provider | 100% quotas | Avenida Das Naçôes Unidas, 4777- 14 andar- Parte- Jardim Universidade, São Paulo- SP- CEP- 05477- 000, Brazil | |||
BT Communications Ireland Group Limited | Holding company | 100% ordinary | 2 Grand Canal Plaza, Upper Grand Canal Street, Dublin 4, Republic of Ireland | |||
BT Communications Ireland Group Limited – UK Branchd | Communications related services, systems integration and products provider | 100% – | 81 Newgate Street, London, EC1A 7AJ, United Kingdom | |||
BT Communications Ireland Holdings Limited | Holding company | 100% ordinary | 2 Grand Canal Plaza, Upper Grand Canal Street, Dublin 4, Republic of Ireland | |||
BT Communications Ireland Limited | Telecommunications service provider | 100% ordinary | 2 Grand Canal Plaza, Upper Grand Canal Street, Dublin 4, Republic of Ireland | |||
BT Communications Kenya Limited | Communications related services, systems integration and products provider | 100% ordinary | 6th Floor, Virtual Offices, Morningside Office Park,Ngong Road, Nairobi, Kenya | |||
BT Communications Lanka (Private) Limited | Communications related services, systems integration and products provider | 100% ordinary | 65/2, Sir Chittampalam A., Gardiner Mawatha, Colombo, 2, Sri Lanka | |||
BT Communications Philippines Incorporated | Communications related services, systems integration and products provider | 100% ordinary | 18th Floor, Philamlife Tower, 8767 Paseo de Roxas, Makati City, 1226, Philippines | |||
BT Communications Sales LLC | Communications related services | 100% units | c/o Corporation Service Company, 251 Little Falls Drive, Wilmington DE 19808, United States | |||
BT Communications Sales, LLC Puerto Rico branchd | Communications related services | 100% – | The Prentice-Hall Corporation System, Puerto Rico, Inc., c/o Fast Solutions, LLC , Citi Tower, 252 Ponce de Leon Avenue, Floor 20, San Juan, Puerto Rico, 00918, Puerto Rico | |||
BT Communications Services South Africa (Pty) Limited | Communications related services, systems integration and products provider | 70% ordinary | BT Building, Woodmead North Office Park, 54 Maxwell Drive, Woodmead, South Africa | |||
BT Conferencing Video Inc. | Audio, video and web collaboration service provider | 100% common | c/o Corporation Service Company, 251 Little Falls Drive, Wilmington DE 19808, United States | |||
BT Cornwall Limited | Employment company | 100% ordinary | 81 Newgate Street, London, EC1A 7AJ, United Kingdom |
| British Telecommunications plc Annual Report & Form 20-F 2018 | 195 | |||||
Table of Contents
Related undertakings continued
| Company name | Activity | Group interest in allotted capitala | Registered Address and Country of incorporation | |||
BT Cote D’Ivoire | Communications related services, systems integration and products provider | 100% ordinary | 29 Boulevard Clozel, 01 BP 3586, Abidjan 01, Cote d’Ivoire | |||
BT de Panama, S.R.L. | Communications related services, systems integration and products provider | 100% ordinary | Edificio Credicorp Bank, Piso 3, Oficina 301, Cuidad de Panama, Panama | |||
BT Denmark ApS | Communications related services, systems integration and products provider | 100% ordinary | Havnegade 39, 1058, Kobenhavn K, Denmark | |||
BT Deutschland GmbH | Communications related services, systems integration and products provider | 100% ordinary | Barthstraße 4, 80339, Munich, Germany | |||
BT Dominican Republic, S. A. | Communications related services, systems integration and products provider | 100% ordinary | Av. Abraham Lincoln Esq. Jose Amado Soler, Edif. Progresso, Local 3-A, Sector Ens. Serralles, Santo Domingo, Dominican Republic | |||
BT e-Serv (India) Private Limited | Provision of IT enabled services | 100% equity | 11th Floor, Eros Corporate Tower, Opp. International Trade Tower, Nehru Place, New Delhi, 110019, India | |||
BT El Salvador, Limitada de Capital Variable | Communications related services, systems integration and products provider | 100% ordinary | Edificio Centro Profesional Madre Tierra, Local 10, Piso 1, Santa Elena, Antiguo Cuscatlan, El Salvador | |||
BT Enìa Telecomunicazioni S.P.A. | Communications related services | 87% ordinary | Strada S. Margherita n° 6/a, Parma, Italy | |||
BT ESPAÑA, Compañia de Servicios Globales de Telecommunicaciones, S.A | Communications related services and products provider | 100% ordinary | C/ Isabel Colbrand 6-8, 28050, Madrid, Spain | |||
BT Federal Inc. | Communications related services for US federal government | 100% common | c/o Corporation Service Company, 251 Little Falls Drive, Wilmington DE 19808, United States | |||
BT Fifty | Finance company | 100% ordinary | 81 Newgate Street, London, EC1A 7AJ, United Kingdom | |||
BT Fifty-One | Finance company | 100% ordinary | 81 Newgate Street, London, EC1A 7AJ, United Kingdom | |||
BT Fifty-Three Limited | Holding company | 100% ordinary | 81 Newgate Street, London, EC1A 7AJ, United Kingdom | |||
BT Forty-Nine | Holding company | 100% ordinary | 81 Newgate Street, London, EC1A 7AJ, United Kingdom | |||
BT France S.A.S. | Communications related services, systems integration and products provider | 100% ordinary | Tour Ariane, 5 place de la Pyramide, La Defense Cedex, 92088 PARIS, France | |||
BT Frontline Outsourcing Sdn Bhd | In liquidation | 100% ordinary | Menara BT, Level 8, Tower 3, Avenue 7, Bangsar South, No.8, Jalan Kerinchi, 59200, Kuala Lumpur, Malaysia | |||
BT Gabon Limited | In liquidation | 100% Franc CFA | Centre Ville Avenue Alfred, Marche Imm. 2 AG BP 3927, Libreville, Gabon | |||
BT Garrick GmbH | Holding company | 100% ordinary | Barthstraße 4, 80339, Munich, Germany | |||
BT Georgia Limited LLC | Communications related services, systems and products provider | 100% – | 74 Ilia Chavchavadze Avenue, Tbilisi, Georgia | |||
BT Ghana Limited | Provision of IT network services and IT solutions | 100% ordinary | 11 Adaman Loop, Tesano, Accra, Ghana | |||
BT Global (Venezuela) S.A. | Communications related services, systems integration and products provider | 100% ordinary | Edificio Parque Cristal, Torre Este, Piso 1, Ofic. 06, Av. Francisco de Miranda, Los Palos Grandes, Caracas, Venezuela | |||
BT Global Business Services Private Limited | Provision of IT enabled services | 100% ordinary | 11th Floor, Eros Corporate Tower, Opp. International Trade Tower, Nehru Place, New Delhi, 110019, India | |||
BT Global Communications (Ireland) Limited | Property company | 100% ordinary | 2 Grand Canal Plaza, Upper Grand Canal Street, Dublin 4, Republic of Ireland | |||
BT Global Communications (Mauritius) Limited | Communications related services, systems integration and products provider | 100% ordinary | 10 Frere Felix De Valois Street, Port Louis, Mauritius |
| 196 | British Telecommunications plc Annual Report & Form 20-F 2018 | |||||
Table of Contents
| THE STRATEGIC REPORT | GOVERNANCE | FINANCIAL STATEMENTS | ADDITIONAL INFORMATION | |||||||||
|
|
| ||||||||||
| Company name | Activity | Group interest in allotted capitala | Registered Address and Country of incorporation | |||
BT Global Communications do Brasil Limitadad | Communications related services, systems integration and products provider | 100% quotas | Avenida Das Naçôes Unidas, 4777- 17 andar- Parte- Jardim Universidade, São Paulo- SP- CEP, 05477- 000, Brazil | |||
BT Global Communications India Private Limited | Communications related services | 74% ordinary | 11th Floor, Eros Corporate Tower, Opp. International Trade Tower, Nehru Place, New Delhi, 110019, India | |||
BT Global Costa Rica SRL | Communications related services, systems integration and products provider | 100% ordinary | Centro Corporativo Internacional, Piso 1, Avenida 6 y 8, Calle 26 y 28, Barrio Don Bosco, Costa Rica | |||
BT Global Japan Corporation | Communications related services, systems integration and products provider | 100% ordinary | ARK Mori Building, 12-32 Akasaka, 1-Chome, Minato-Ku, Tokyo, 107 - 6024, Japan | |||
BT Global Services (Dalian) Co. Ltd. | Communications related services, systems integration and products provider | 100% registered | No. 31 Software Park Road, Tower A, Science & Technology Building, Dalian Software Park, Dalian, 116023, China | |||
BT Global Services (M) Sdn Bhd | Communications related services, systems integration and products provider | 100% ordinary | Menara BT, Level 8, Tower 3, Avenue 7, Bangsar South, No.8, Jalan Kerinchi, 59200, Kuala Lumpur, Malaysia | |||
BT Global Services Botswana (Proprietary) Limited | Communications related services, systems integration and products provider | 100% ordinary | Plot 113, Unit 28 Kgale Mews, Gaborone International Finance Park, Gaborone, PO BOX 1839, Botswana | |||
BT Global Services Korea Limited. | Communications related services, systems integration and products provider | 100% common | 8th Floor, KTB Building, 66 Yeoui-daero, Yeongdeungpo-gu, Seoul, 07325, Republic of Korea | |||
BT Global Services Limitedd | Communications related services, systems integration and products provider | 100% – | Via Mario Bianchini 15, 00142 Roma, Italy | |||
BT Global Services Limited | Communications related services, systems integration and products provider | 100% ordinary | 81 Newgate Street, London, EC1A 7AJ, United Kingdom | |||
BT Global Services Limited Londra Sucursala Bucurestid | Communications related services, systems integration and products provider | 100% – | 35-37 Oltenitei Str., Cladirea A1, Biroul Nr. 52, Bucharest, Sector 4, Romania | |||
BT Global Services Solutions Sdn Bhd | Communications related services, systems integration and products provider | 100% ordinary | Menara BT, Level 8, Tower 3, Avenue 7, Bangsar South, No.8, Jalan Kerinchi, 59200, Kuala Lumpur, Malaysia | |||
BT Global Services Technologies Pte. Ltd. | Communications related services, systems integration and products provider | 100% ordinary | 8 Changi Business Park Ave (South Tower), #08-51 UE Bizhub East, Singapore, 486018, Singapore | |||
BT Global Solutions Pte. Ltd. | Communications related services, systems integration and products provider | 100% ordinary | 8 Changi Business Park Ave (South Tower), #08-51 UE Bizhub East, Singapore, 486018, Singapore | |||
BT Global Technology (M) Sdn. Bhd. | Communications related services, systems integration and products provider | 100% ordinary | Menara BT, Level 8, Tower 3, Avenue 7, Bangsar South, No.8, Jalan Kerinchi, 59200, Kuala Lumpur, Malaysia | |||
BT GLOBALNE STORITVE, telekomunikacijske storitve, obdelava podatkov, podatkovnih baz; d.o.o. | Communications related services, systems integration and products provider | 100% ordinary | CESTA V MESTNI LOG 1, 1000 LJUBLJANA, Slovenia | |||
BT Guatemala S.A. | Communications related services, systems integration and products provider | 100% unique | 3 Avenida 13-78, Zona 10, Torre CitiBank, Nivel 2, Oficina 206, Guatemala, Guatemala | |||
BT Hong Kong Limited | Communications related services and products provider | 39% ordinary 61% preference | 38 Floor Dorset House, Taikoo Place, 979 King’s Road, Quarry Bay, Hong Kong | |||
BT Hong Kong Ltd. – Macau Branchd | Communications related services, systems integration and products provider | 100% – | Avenida da.Praia Grande, No. 367-371, Keng Ou Building, 15th andar C, em Macao, Macau | |||
BT International Holdings Limited & Co. LLC | Communications related services, systems integration and products provider | 100% ordinary | 413, 4th Floor, Maktabi Building, Wattayah, PC 112, Muscat, 2188, Oman |
| British Telecommunications plc Annual Report & Form 20-F 2018 | 197 | |||||
Table of Contents
Related undertakings continued
| Company name | Activity | Group interest in allotted capitala | Registered Address and Country of incorporation | |||
BT Jamaica Limited | Communications related services, systems integration and products provider | 100% ordinary | 26 Beechwood Avenue, Kingston 5, Jamaica | |||
BT Japan Corporation | Communications related services, systems integration and products provider | 100% ordinary | ARK Mori Building, 12-32 Akasaka, 1-Chome, Minato-Ku, Tokyo, 107 - 6024, Japan | |||
BT Jersey Limited | Communications related services | 100% ordinary | PO Box 264, Forum 4, Grenville Street, St Helier, JE4 8TQ, Jersey | |||
BT Kazakhstan LLP | Communications related services and products provider | 100% – | 36 Al Farabi Ave., Bldg. B, Almaty Financial District, Almaty, Republic of Kazakhstan, 050059, Kazakhstan | |||
BT LatAm (BVI) Corporation | Communications related services, systems integration and products provider | 100% common | Sea Meadow House, P.O. Box 116, Road Town, Tortola, British Virgin Islands | |||
BT LatAm (Nevada) Corp. | Communications related services | 100% common | c/o Corporation Service Company, 2215-B Renaissance Drive, Las Vegas, NV 89119, United States | |||
BT Latam Argentina S.A | Communications related services and products provider | 100% common | Lola Mora 421, 15th Floor, Puerto Madero, Buenos Aires, Buenos Aires, C1107DDA, Argentina | |||
BT LatAm Brasil Ltda. | Communications related services, systems integration and products provider | 100% quotas | Rodovia SP 101, KM 9,5, Trecho Campinas- Monte Mor, Unidade 27, Bloco Beta, Distrito Industrial, Hortolandia - SP- CEP, Sao Paolo, 13185-900, Brazil | |||
BT LatAm Colombia S.A. | Communications related services, systems integration and products provider | 100% common | Calle 113 , 7 - 21 Piso 11, Torre A. Oficina 1112, Bogota, Colombia | |||
BT LatAm Costa Rica, S.A. | Communications related services, systems integration and products provider | 100% common | Centro Corporativo Internacional, Piso 1, Avenida 6 y 8, Calle 26 y 28, Barrio Don Bosco, Costa Rica | |||
BT LatAm Dominicana, S.A. | Communications related services, systems integration and products provider | 100% common | Av. Abraham Lincoln Esq. Jose Amado Soler, Edif. Progresso, Local 3-A, Sector Ens. Serralles, Santo Domingo, Dominican Republic | |||
BT LatAm El Salvador, S.A. de CV | Communications related services, systems integration and products provider | 100% common | Edificio Centro Profesional Madre Tierra, Local 10, Piso 1, Santa Elena, Antiguo Cuscatlan, El Salvador | |||
BT LatAm Guatemala, S.A. | Communications related services, systems integration and products provider | 100% common | 3 Avenida 13-78, Zona 10, Torre CitiBank, Nivel 2, Oficina 206, Guatemala, Guatemala | |||
BT LatAm Holdings (Colombia) S. A. | Holding company | 100% common | Calle 113, 7 - 21 Piso 11, Torre A. Oficina 1112, Bogota, Colombia | |||
BT LatAm Holdings Brasil Ltda | Holding company | 100% common | Avenida Das Naçôes Unidas, 4777- 14 andar- Parte- Jardim Universidade, São Paulo- SP- CEP, 05477- 000, Brazil | |||
BT LatAm Holdings One, Inc. | Holding company | 100% common | c/o Corporation Service Company, 251 Little Falls Drive, Wilmington DE 19808, United States | |||
BT LatAm Holdings Three, Inc. | Holding company | 100% common | c/o Corporation Service Company, 251 Little Falls Drive, Wilmington DE 19808, United States | |||
BT LatAm Holdings Two, Inc. | Holding company | 100% common | c/o Corporation Service Company, 251 Little Falls Drive, Wilmington DE 19808, United States | |||
BT LatAm Honduras, S.A. | Communications related services, systems integration and products provider | 100% common | Edificio Plaza Azul, Piso 2 do Nivel, Local No. 26, Colonia Lomas del Guijarro Sur, Avenida Paris, Calle Viena, Tegucigalpa, Honduras | |||
BT LatAm México, S.A. de C.V. | Communications related services, systems integration and products provider | 100% common | Av. Renato Leduc 321, Col. Toriello Guerra, 14050 Mexico D.F. | |||
BT LatAm Nicaragua, S.A. | Communications related services, systems integration and products provider | 100% common | Edificio Invercasa, 5to Piso, Suite 505, Via Fontana, frente al colegio La Salle, Managua, Nicaragua | |||
BT LatAm Panama, Inc. | Communications related services, systems integration and products provider | 100% common | Edificio Credicorp Bank, Piso 3, Oficina 301, Cuidad de Panama, Panama | |||
BT LatAm Peru S.A.C. | Communications related services, systems integration and products provider | 100% common | Calle Martir Olaya, 129 of 1901, Miraflores, Lima, Peru | |||
BT LatAm Services, Inc. | Holding company | 100% common | c/o Corporation Service Company, 251 Little Falls Drive, Wilmington DE 19808, United States | |||
BT LatAm Venezuela, S.A. | Communications related services, | 100% ordinary | Av. Francisco de Miranda, Edificio Parque Cristal, Torre |
| 198 | British Telecommunications plc Annual Report & Form 20-F 2018 | |||||
Table of Contents
| THE STRATEGIC REPORT | GOVERNANCE | FINANCIAL STATEMENTS | ADDITIONAL INFORMATION | |||||||||
|
|
| ||||||||||
| Company name | Activity | Group interest in allotted capitala | Registered Address and Country of incorporation | |||
| systems integration and products provider | Este, Mezz 2, Local 28, Los Palos Grandes, Caracas 1060, Venezuela | |||||
BT LatAm, Inc. | Communications related services | 100% common | c/o Corporation Service Company, 251 Little Falls Drive, Wilmington DE 19808, United States | |||
BT Latvia Limited, Sabiedriba ar ierobezotu atbildibu | Communications related services, systems integration and products provider | 100% ordinary | Muitas iela 1A, Riga, LV-1010, Latvia | |||
BT Lease Holdings Limited | In liquidation | 100% ordinary | BDO LLP, 55 Baker Street, London, W1U 7EU, United Kingdom | |||
BT Lebanon S.A.L. | Communications related services, systems integration and products provider | 100% ordinary | Abou Hamad, Merheb, Nohra & Chedid Law Firm, Chbaro Street, 22nd Achrafieh Warde Building, 1st Floor, Beirut, P.O.BOX 165126, Lebanon | |||
BT LGS Limited | Employment company | 100% ordinary | 81 Newgate Street, London, EC1A 7AJ, United Kingdom | |||
BT Limitedd | Communications related services, systems integration and products provider | 100% – | Telecomlaan 9, 1831 Diegem, Belgium | |||
BT Limited | International telecommunications network systems provider | 100% ordinary | 81 Newgate Street, London, EC1A 7AJ, United Kingdom | |||
BT Limitedd | Dormant | 100% – | First Floor, Culross Court North, 16 Culross Road, Bryanston 2021, 2021, South Africa | |||
BT Limited Magyarorszagi Fiokteleped | Communications related services, systems integration and products provider | 100% – | Budafoki U. 91-93, Budapest, 1117, Hungary | |||
BT Limited Taiwan Branchd | Communications related services, systems integration and products provider | 100% – | Shin Kong Manhattan Building, 14F, No. 8, Sec. 5, Xinyi Road, Taipei, 11049, Taiwan | |||
BT Limited, Beijing Officed | Communications related services, systems integration and products provider | 100% – | No. 3 Dong San Huan Bei Lu, Chao Yang District, Beijing, 100027, China | |||
BT Limited, organizacni slozkad | Communications related services, systems integration and products provider | 100% – | Štětkova 1638, 18, Nusle, 140 00 Praha 4 , Czech Republic | |||
BT Luxembourg Investment Holdings Sarl | Holding company | 100% ordinary | 12 rue Eugene Ruppert, L 2453, Luxembourg | |||
BT Malawi Limited | Communications related services, systems integration and products provider | 100% ordinary | BDO Tax & Advisory Services (Pvt) Ltd, 6th Floor Unit House, 12 Victoria Street PO BOX 3038, Blantyre, Malawi | |||
BT Managed Services (No.2) Limited | Dormant | 100% ordinary | 81 Newgate Street, London, EC1A 7AJ, United Kingdom | |||
BT MDV Limited | Communications related services, systems integration and products provider | 100% ordinary | MD-2001, 65 Stefan cel Mare si Sfant Boulevard, office 806, Chisinau, Republic of Moldova | |||
BT MEA FZ-LLC | Communications related services, systems integration and products provider | 100% ordinary | Office No G03, Ground Floor, EIB Building No 04, Dubai, United Arab Emirates | |||
BT Montenegro DOO | Communications related services, systems integration and products provider | 100% – | Bulevar revolucije 7, Podgorica, 81000, Montenegro | |||
BT Moorgate LLC | Communications related services | 100% units | c/o Corporation Service Company, 251 Little Falls Drive, Wilmington DE 19808, United States | |||
BT Moorgate LLC – UK Branchd | Communications related services | 100% – | 81 Newgate Street, London, EC1A 7AJ, United Kingdom | |||
BT Moorgate One Limited | Finance company | 100% ordinary | 81 Newgate Street, London, EC1A 7AJ, United Kingdom | |||
BT Moorgate Two Limited | Finance company | 100% ordinary | 81 Newgate Street, London, EC1A 7AJ, United Kingdom | |||
BT Mozambique, Limitada | Communications related services, systems integration and products provider | 100% quotas | Av. 25 de Setembro, 1230, 3º, Bloco 5, Caixa Postal 4200, Maputo, 4200, Mozambique | |||
BT Multimedia (Malaysia) Sdn Bhd | In liquidation 100% ordinary | 100% ordinary | Level 1 to 8, Tower 3,, Avenue 7, Bangsar South, No. 8 Jalan Kerinchi, 59200 Kuala Lumpur, Malaysia | |||
BT Nederland N.V.d | Communications related services, systems integration and products provider | 100% – | Via Tucidide 56, Torre 7, 20134, Milano, Italy |
| British Telecommunications plc Annual Report & Form 20-F 2018 | 199 | |||||
Table of Contents
Related undertakings continued
| Company name | Activity | Group interest in allotted capitala | Registered Address and Country of incorporation | |||
BT Newco France S.A.S. | Dormant | 100% ordinary | 5, Place de la Pyramide, Tour Ariane, 92088, Paris la Defense CEDEX, France | |||
BT Newgate LLC | Communications related services | 100% units | c/o Corporation Service Company, 251 Little Falls Drive, Wilmington DE 19808, United States | |||
BT Newgate LLC – UK Branchd | Communications related services | 100% – | 81 Newgate Street, London, EC1A 7AJ, United Kingdom | |||
BT Nicaragua S.A. | Communications related services, systems integration and products provider | 100% capital | Edificio Invercasa, 5to Piso, Suite 505, Via Fontana, frente al colegio La Salle, Managua, Nicaragua | |||
BT Niger | In liquidation | 100% ordinary | 57, Rue des Sorkhos, BP 616, Niamey-Niger | |||
BT Nordics Finland Oy | Communications related services | 100% ordinary | Mannerheimvägen 12 B 6, 00100 Helsinki, Finland | |||
BT Nordics Sweden AB | Communications related services | 100% ordinary | Box 30005, 104 25, Stockholm, Sweden | |||
BT Pakistan (Private) Limited | Communications related services, systems integration and products provider | 100% ordinary | 2nd Floor, Block C, Lakson Square, Building No. 1, Sarwar Shaheed Road, Karachi, 74200, Pakistan | |||
BT Paraguay S.R.L. | Communications related services, systems integration and products provider | 100% quotas | Calle Humaita c/Ntra. Sra. de la Asuncion numero 145, Asuncion, Paraguay | |||
BT Peru S.R.L. | Communications related services, systems integration and products provider | 100% ordinary | Calle Martir Olaya, 129 of 1901, Miraflores, Lima, Peru | |||
BT Poland Spólka Z Ograniczoną Odpowiedzialnością | Communications related services, systems integration and products provider | 100% ordinary | Al. Armii Ludowej 14, 00-638 Warszawa, International Business Center, Poland | |||
BT Portugal – Telecomunicações, Unipessoal, Lda. | Communications related services, systems integration and products provider | 100% ordinary | Rua D. Francisco Manuel de Melo 21-1, 1070-085 Lisboa, Portugal | |||
BT Procure L.L.C. | Dormant | 100% units | c/o Corporation Service Company, 251 Little Falls Drive, Wilmington DE 19808, United States | |||
BT Professional Services (Germany) GmbH | Communications related services, systems integration and products provider | 100% – | Unterster Zwerchweg 61, 60599 Frankfurt am Main, Germany | |||
BT Professional Services (Holdings) N.V. | Holding company | 100% ordinary | Telecomlaan 9, 1831 Diegem, Belgium | |||
BT Professional Services (India) Private Limited | In liquidation | 100% ordinary | 602, Tower B, RMZ Infinity, Municipal No. 3, Old Madras Road, Benninganahalli, Bengaluru, Karnataka, 560016, India | |||
BT Professional Services (Luxembourg) S.A. | Communications related services, systems integration and products provider | 100% ordinary | 12 rue Eugene Ruppert, L 2453, Luxembourg | |||
BT Professional Services Nederland B.V. | Communications related services, systems integration and products provider | 100% ordinary | Minerva & Mercurius building, Herikerbergweg 2, 1101CM, Amsterdam Zuidoost, Netherlands | |||
BT ROC Kft | Communications related services, systems integration and products provider | 100% business | Budafoki út 91-13, 1117 Budapest, Hungary | |||
BT Services S.A.S. | Technology consulting and engineering services | 100% ordinary | Tour Ariane, 5 place de la Pyramide, La Defense Cedex, 92088 PARIS, France | |||
BT Seventy-Four Limited | In liquidation | 100% ordinary | BDO LLP, 55 Baker Street, London, W1U 7EU, United Kingdom | |||
BT Siam Limited | Communications related services, systems integration and products provider | 69% preference | Athenee Tower, 23rd Floor, (CEO Suite, Suite 38 & 40), 63 Wireless Road, Lumpini, Pathumwan, Bangkok, 10330, Thailand | |||
BT Singapore Pte. Ltd. | Communications related services and products provider | 100% ordinary | 8 Changi Business Park Ave (South Tower), #08-51 UE Bizhub East, Singapore, 486018, Singapore |
| 200 | British Telecommunications plc Annual Report & Form 20-F 2018 | |||||
Table of Contents
| THE STRATEGIC REPORT | GOVERNANCE | FINANCIAL STATEMENTS | ADDITIONAL INFORMATION | |||||||||
|
|
| ||||||||||
| Company name | Activity | Group interest in allotted capitala | Registered Address and Country of incorporation | |||
BT Sixty-Four Limited | Finance company | 100% ordinary | 81 Newgate Street, London, EC1A 7AJ, United Kingdom | |||
BT Slovakia s.r.o. | Communications related services, systems integration and products provider | 100% ordinary | Dvorakovo nabrezie 4, 811 02, Bratislava, Slovakia | |||
BT Sociedad De Responsabilidad Limitada | Communications related services, systems integration and products provider | 100% – | Colonia Lomas Del Guijarro sur, edificio Plaza azul, 2do. Nivel, local #26, Tegucigalpa, Honduras | |||
BT Solutions Limitedd | Communications related services, systems integration and products provider | 100% – | 236 Strovolos Avenue, Strovolos 2048, Nicosia, Cyprus | |||
BT Solutions Limited (Sucursal Ecuador)d | Communications related services, systems integration and products provider | 100% – | Av. Amazonas N21-252 y Carrión, Edificio Londres, 4° Piso, Quito, Ecuador | |||
BT Solutions Limitedd | Communications related services, systems integration and products provider | 100% – | Tower Gate Place, Tal-Qroqq Street, Msida MSD 1703, Malta | |||
BT Solutions Limitedd | Communications related services, systems integration and products provider | 100% – | PO Box 2184, 61 Bismarck Street, Windhoek, Namibia | |||
BT Solutions Limitedd | Communications related services, systems integration and products provider | 100% – | 2nd Floor CIC Building, 122-124 Frederick Street, Port of Spain, Trinidad and Tobago | |||
BT Solutions Limitedd | Communications related services, systems integration and products provider | 100% – | c/o BDO East Africa, Plot 22 Mbuya Road, Bugolobi, Kampala,, P.O. BOX 9113, Uganda | |||
BT Solutions Limitedd | Communications related services, systems integration and products provider | 100% | Plot No. 4015A, , Frost Building, Gallery Office Park , Lagos Road, Rhodespark, Lusaka, Lusaka Province, Zambia | |||
BT Solutions Limited (Bahrain Branch)d | Communications related services, systems integration and products provider | 100% – | Suite #650, 6th floor, Building No. 247, Road 1704, Diplomatic Area 317, Bahrain | |||
BT Solutions Limited – Kuwait Branchd | Communications related services, systems integration and products provider | 100% – | Block 2-A, 9th Floor, Ahmad Al Jaber Street, Sharq, Kuwait | |||
BT Solutions Limited – Morocco Branchd | Communications related services, systems integration and products provider | 100% – | 193, Avenue HASSAN II, Casablanca, MAROC s/c Domicilia services, Morocco | |||
BT Solutions Limited – Tanzania Branchd | Communications related services, systems integration and products provider | 100% – | BDO East Africa, 1st Floor-Wing B, Infotech Place, Mwai Kibaki Road, Dar es Salaam, Tanzania | |||
BT Solutions Limited Branch Office in Skopjed | Communications related services, systems integration and products provider | 100% – | Str. Dame Gruev no.8, 5th floor, Building “Dom na voenite invalidi”, SKOPJE 1000, Macedonia | |||
BT Solutions Limited Eesti Filiaald | Communications related services, systems integration and products provider | 100% – | A.H. Tammsaare tee 47, Tallinn, 11316, Estonia | |||
BT Solutions Limited Liability Company | Communications related services, systems integration and products provider | 100% – | Pravdy, 26, 127137, Moscow, Russian Federation | |||
BT Solutions Limited Podruznica Hrvatskad | Communications related services, systems integration and products provider | 100% – | Savska 64, 10 000 Zagreb, Croatia | |||
BT Solutions Limited Sucursal Boliviad | Communications related services, systems integration and products provider | 100% – | Avenida Arce esquina Rosendo Gutierrez, Edifico Multicentre Torre B, Piso 12, La Paz, Bolivia | |||
BT Solutions Limited Sucursal Uruguayd | Communications related services, systems integration and products provider | 100% – | Rincón 487 Piso 11, Montevideo, ZIP CODE 11.000, Uruguay |
| British Telecommunications plc Annual Report & Form 20-F 2018 | 201 | |||||
Table of Contents
Related undertakings continued
| Company name | Activity | Group interest in allotted capitala | Registered Address and Country of incorporation | |||
BT Solutions Limited Útibú á Íslandid | Communications related services, systems integration and products provider | 100% – | Skútuvogi 1e, 104 Reykjavík, Iceland | |||
BT Solutions Limited-Greek Branchd | Communications related services, systems integration and products provider | 100% – | 75 Patision Street, Athens, 10434, Greece | |||
BT Solutions Norway AS | Communications related services, systems integration and products provider | 100% ordinary | Munkedamsveien 45, c/o BDO AS, 0121 Oslo, Norway | |||
BT South Tyneside Limited | Employment company | 100% ordinary | 81 Newgate Street, London, EC1A 7AJ, United Kingdom | |||
BT Stemmer GmbH | Communications related services, systems integration and products provider | 100% ordinary | Peter Henlein Straße 2, 82140 Olching, Germany | |||
BT Switzerland AG | Communications related services and products provider | 100% ordinary | Richtistrasse 5, 8304 Wallisellen, Switzerland | |||
BT Systems (Malaysia) Sdn Bhd | Communications related services, systems integration and products provider | 100% ordinary | Menara BT, Level 8, Tower 3, Avenue 7, Bangsar South, No.8, Jalan Kerinchi, 59200, Kuala Lumpur, Malaysia | |||
BT Telconsult Limited | In liquidation | 100% ordinary | BDO LLP, 55 Baker Street, London, W1U 7EU, United Kingdom | |||
BT Telecom Egypt LLC | Communications related services, systems integration and products provider | 100% stakes | 1 Wadi El Nile St., Mohandessin, Giza, Cairo, Egypt | |||
BT Telecom India Private Limited | Investment/holding company | 74% ordinary | 11th Floor, Eros Corporate Tower, Opp. International TradeTower, Nehru Place, New Delhi, 110019, India | |||
BT Telecommunications Kenya Limited | In liquidation | 100% ordinary | P.O. BOX 10032-00100, Nairobi, Kenya | |||
BT Telekom Hizmetleri Anonim Şirketi | Communications related services, systems integration and products provider | 100% common | Barbaros Mahallesi, Yavuz Selim Caddesi No: 17/1 Ataşehir, İstanbul, Turkey | |||
BT Tunisia S.A.R.L | Communications related services, systems integration and products provider | 100% ordinary | BT chez BDO Tunisie, Immeuble, ENNOUR BUILDING, 3ème étage, Centre Urbain Nord 1082, Mahrajène Tunis, Tunisia | |||
BT UAE Limited | Communications related services, systems integration and products provider | 100% ordinary | 81 Newgate Street, London, EC1A 7AJ, United Kingdom | |||
BT UAE Limited – Abu Dhabi Branchd | Dormant | 100% – | Office No. (F6) International Business Center, Building, No. (27W10), Three Sails Tower, Cornish, Abu Dhabi, United Arab Emirates | |||
BT UAE Limited – Dubai Branch (1)d | Communications related services, systems integration and products provider | 100% – | Office no.206 BLOCK B, Diamond Business Center 1, Al Barsha South Third, Dubai, P.O.BOX 25205, United Arab Emirates | |||
BT UAE Limited – Dubai Branch (2)d | Communications related services, systems integration and products provider | 100% – | Office no.206 BLOCK B, Diamond Business Center 1, Al Barsha South Third, Dubai, P.O.BOX 25205, United Arab Emirates | |||
BT Ukraine Limited Liability Company | Communications related services, systems integration and products provider | 100% stakes | Office 702, 34, Lesi Ukrayinky Blvd., Kiev, Ukraine, 01042 | |||
BT US Investments Limited – UK branchd | Investment company | 100% – | 81 Newgate Street, London, EC1A 7AJ, United Kingdom | |||
BT United States L.L.C. | Holding company | 100% units | c/o Corporation Service Company, 251 Little Falls Drive, Wilmington DE 19808, United States | |||
BTIH Teleconsult Drustvo sa organicenom odgovornoscu za posredovanje i zastupanje d.o.o. Sarajevo | Architectural and engineering activities and technical consulting | 100% – | ul. Despiceva broj 3/II, Sarajevo, Sarajevo-Stari Grad, 71000, Bosnia and Herzegovina | |||
Canal Capital Investment Limited | Investment company | 100% ordinary | 2 Grand Canal Plaza, Upper Grand Canal Street, Dublin 4, Republic of Ireland | |||
Communications Global Network Services Limited – UK Branchd | Communications related services and products provider | 100% – | 81 Newgate Street, London, EC1A 7AJ, United Kingdom | |||
Communications Networking Services (UK) | Communications related services and products provider | 100% ordinary | 81 Newgate Street, London, EC1A 7AJ, United Kingdom | |||
Communicator (IOM) Limited – UK Branchd | Insurance | 100% – | 81 Newgate Street, London, EC1A 7AJ, United Kingdom | |||
Communicator Insurance Company | Investment company | 99% ordinary | Third Floor, St Georges Court, Upper Church Street, |
| 202 | British Telecommunications plc Annual Report & Form 20-F 2018 | |||||
Table of Contents
| THE STRATEGIC REPORT | GOVERNANCE | FINANCIAL STATEMENTS | ADDITIONAL INFORMATION | |||||||||
|
|
| ||||||||||
| Company name | Activity | Group interest in allotted capitala | Registered Address and Country of incorporation | |||
Limited | 1% preference | Douglas, IM1 1EE, Isle of Man | ||||
Communicator Limited | Investment company | 100% ordinary | Third Floor, St Georges Court, Upper Church Street, Douglas, IM1 1EE, Isle of Man | |||
Comsat de Guatemala S.A. | Dormant | 100% common | 3 Avenida 13-78, Zona 10, Torre CitiBank, Nivel 2, Oficina 206, Guatemala, Guatemala | |||
EE (Group) Limited | Dormant | 100% ordinary | Trident Place, Mosquito Way, Hatfield, Hertfordshire, AL10 9BW, United Kingdom | |||
EE Communications (South Africa) Proprietary Limited | Dormant | 100% ordinary | 24-18th Street, Menlo Park, Pretoria, 0081, South Africa | |||
EE Finance plc | Finance company | 100% ordinary | Trident Place, Mosquito Way, Hatfield, Hertfordshire, AL10 9BW, United Kingdom | |||
EE Pension Trustee Limited | Pension trustee company | 100% ordinary | Trident Place, Mosquito Way, Hatfield, Hertfordshire, AL10 9BW, United Kingdom | |||
EE Services Limited | Dormant | 100% ordinary | Trident Place, Mosquito Way, Hatfield, Hertfordshire, AL10 9BW, United Kingdom | |||
ERPTech S.p.A. | Communications related services, systems integration and products provider | 99% ordinary | Via Charles Robert Darwin, no 85, 20019, Settimo Milanese, Italy | |||
ESAT Telecommunications (UK) Limited | Dormant | 100% ordinary | 81 Newgate Street, London, EC1A 7AJ, United Kingdom | |||
Everything Everywhere Limited | Dormant | 100% ordinary | Trident Place, Mosquito Way, Hatfield, Hertfordshire, AL10 9BW, United Kingdom | |||
Extraclick Limited | Investment/holding company | 100% ordinary | 81 Newgate Street, London, EC1A 7AJ, United Kingdom | |||
Green House Group Pte Ltd | In liquidation | 100% ordinary | 600 North Bridge Road, #23-01 Parkview Square, 188778, Singapore | |||
Green House Solution Sdn Bhd | In liquidation | 100% ordinary | Menara BT, Level 8, Tower 3, Avenue 7, Bangsar South, No.8, Jalan Kerinchi, 59200, Kuala Lumpur, Malaysia | |||
iASPire.Net Pte Ltd | In liquidation | 95% ordinary | 8 Changi Business Park Ave (South Tower), #08-51 UE, Bizhub East, Singapore, 486018, Singapore | |||
Infocom Telecom LLC | Communications related services, systems integration and products provider | 100% charter | Miusskaya Square 7, 125811, Moscow, Russia | |||
Infonet China Limited | Communications related services, systems integration and products provider | 100% ordinary | 38th floor, Dorset House, Taikoo Place, 979 King’s Road, Island East, Hong Kong | |||
Infonet China Limited Beijing Representative Officed | Communications related services, systems integration and products provider | 100% – | Room 4C, 7/F, Tower W3, Oriental Plaza, 1 East Chang An Avenue, Dong Cheng District, Beijing, P. R. China | |||
Infonet Italia S.p.A | Dormant | 100% ordinary | Via Tucidide 56, Torre 7, 20134, Milano, Italy | |||
Infonet Primalliance Beijing Co. Ltd. | Communications related services, systems integration and products provider | 66% ordinary | Room 4B, 7/F, Tower W3, Oriental Plaza, 1 East Chang An Avenue, Dong Cheng District, Beijing, P. R. China | |||
Infonet Primalliance Co., Limited | Communications related services, systems integration and products provider | 100% ordinary | 38 Floor Dorset House, Taikoo Place, 979 King’s Road, Quarry Bay, Hong Kong | |||
Infonet Primalliance Holding Co. Ltd. | Holding company | 100% ordinary | Room 635-3, No. 2 BLDG, 351 Guo Shou Jing Road, Zhang Jiang High Technology Park, Shanghai, P. R. China | |||
Infonet Services (Hong Kong) Limited | In liquidation | 100% ordinary | 38 Floor Dorset House, Taikoo Place, 979 King’s Road, Quarry Bay, Hong Kong | |||
Infonet Services Corporation | Communications related services | 100% common | c/o Corporation Service Company, 251 Little Falls Drive, Wilmington DE 19808, United States | |||
IP Trade Financial SA | Finance company | 100% ordinary | Rue de L’Aêropostale 8, 4460 Grâce-Hollogne, Belgium | |||
IP Trade Network Corp | Provision of IT communication services | 100% common | c/o Corporation Service Company, 251 Little Falls Drive, Wilmington DE 19808 , United States |
| British Telecommunications plc Annual Report & Form 20-F 2018 | 203 | |||||
Table of Contents
Related undertakings continued
| Company name | Activity | Group interest in allotted capitala | Registered Address and Country of incorporation | |||
IP Trade Networks GmbH | Provision of IT communication services | 100% ordinary | Franfurterstrasse 21-25, 65760 Eschborn Taunus, Germany | |||
IP Trade Networks Limited | Provision of IT communication services | 100% ordinary | Room 1102, Lee Garden One, 33 Hysan Avenue, Causeway Bay, Hong Kong | |||
IP Trade Networks Ltd | Wired telecommunications activities | 100% ordinary | 81 Newgate Street, London, EC1A 7AJ, United Kingdom | |||
IP Trade SA | Provision of IT communication services | 100% category | Rue de L’Aêropostale 8, 4460 Grâce-Hollogne, Belgium | |||
IT Holdings, Inc | Dormant | 100% ordinary | 11th Floor, Page one Building,, 1215 Acacia Ave, Madrigal Business Park, Ayala Alabang, Muntinlupa city, Metro Manila, 1780, Philippines | |||
Mainline Communications Group Limited | Holding company | 100% ordinary | Trident Place, Mosquito Way, Hatfield, Hertfordshire, AL10 9BW, United Kingdom | |||
Mainline Digital Communications Limited | Distribution of mobile telephones and services | 100% ordinary | Trident Place, Mosquito Way, Hatfield, Hertfordshire, AL10 9BW, United Kingdom | |||
Mobilise Telecoms Limited | Dormant | 100% ordinary | Trident Place, Mosquito Way, Hatfield, Hertfordshire, AL10 9BW, United Kingdom | |||
M-Viron Limited | In liquidation | 100% ordinary | BDO LLP, 55 Baker Street, London, W1U 7EU, United Kingdom | |||
Newgate Communication (Sudan) Co. Ltd | In liquidation | 100% ordinary | Alskheikh Mustafa Building, Parlman Street, Khartoum, Sudan | |||
Newgate Street Secretaries Limited | Dormant | 100% ordinary | 81 Newgate Street, London, EC1A 7AJ, United Kingdom | |||
Numberrapid Limited | Communications related services, systems integration and products provider | 100% ordinary | 81 Newgate Street, London, EC1A 7AJ, United Kingdom | |||
Numberrapid Limitedd | Communications related services, systems integration and products provider | 100% – | 3 Baines Avenue, Box 334, Harare, Zimbabwe | |||
Nuova Societa di Telecomunicazioni SpA | Communications related services, systems integration and products provider | 99% ordinary | Via Tucidide 56, Torre 7, 20134, Milano, Italy | |||
Opimus S.A. de C.V. | Dormant | 100% common | Av. Renato Leduc 321, Col. Toriello Guerra, 14050 Mexico D.F. | |||
Orange FURBS Trustees Limited | Pension trustee company | 100% ordinary | Trident Place, Mosquito Way, Hatfield, Hertfordshire, AL10 9BW, United Kingdom | |||
Orange Home UK Limited | Dormant | 100% ordinary | Trident Place, Mosquito Way, Hatfield, Hertfordshire, AL10 9BW, United Kingdom | |||
Orange Personal Communications Services Limited | Holding company | 100% ordinary | Trident Place, Mosquito Way, Hatfield, Hertfordshire, AL10 9BW, United Kingdom | |||
Orange Services India Private Limited | Provision of call centre services | 100% ordinary | A-47, Hauz Khas, New Delhi, Delhi-DL, 110016, India | |||
Postgate Holding Company | In liquidation | 100% ordinary | BDO LLP, 55 Baker Street, London, W1U 7EU, United Kingdom | |||
Priestgate Limited | Holding company | 100% ordinary | Third Floor, St Georges Court, Upper Church Street, Douglas, IM1 1EE, Isle of Man | |||
PSPI-Subic, Inc | Dormant | 51% ordinary | c/o Sun Microsystems Phil Inc., 8767 Paseo de Roxas, Makati City, Philippines | |||
PT BT Communications Indonesia | Communications related services, systems integration and products provider | 95% ordinary | World Trade Centre 5, Lantai. 13, Jl. Jend. Sudirman Kav. 29-31, Kel. Karet Setiabudi, Jakarta Selatan, Jakarta, 12920, Indonesia | |||
PT BT Indonesia | Communications related services, systems integration and products provider | 100% ordinary | World Trade Centre 5, Lantai. 13, Jl. Jend. Sudirman Kav. 29-31, Kel. Karet Setiabudi, Jakarta Selatan, Jakarta, 12920, Indonesia | |||
PT Sun Microsystems Indonesia | Dormant | 60% ordinary | World Trade Centre 5, Lantai. 13, Jl. Jend. Sudirman Kav. 29-31, Kel. Karet Setiabudi, Jakarta Selatan, Jakarta, 12920, Indonesia | |||
Radianz Americas Inc. | Communications related services | 100% common | c/o Corporation Service Company, 251 Little Falls Drive, Wilmington DE 19808, United States | |||
Radianz Spain S.L. | In liquidation | 100% ordinary | C/ Isabel Colbrand 6-8, 28050, Madrid, Spain |
| 204 | British Telecommunications plc Annual Report & Form 20-F 2018 | |||||
Table of Contents
| THE STRATEGIC REPORT | GOVERNANCE | FINANCIAL STATEMENTS | ADDITIONAL INFORMATION | |||||||||
|
|
| ||||||||||
| Company name | Activity | Group interest in allotted capitala | Registered Address and Country of incorporation | |||
RDZ Netherlands BV | Communications related services, systems integration and products provider | 100% ordinary | Minerva & Mercurius building, Herikerbergweg 2, 1101CM, Amsterdam Zuidoost, Netherlands | |||
Sama Empreedimentos e Participações Limitada | Dormant | 100% common | Rua Arnaldo Quintela - 96, 1 Andar - Botafogo, CEP 22.280-070, Rio de Janeiro, Brazil | |||
Servicios de Telecomunicaciones BT Global Networks Chile Limitada | Communications related services, systems integration and products provider | 100% ordinary | Coronel Pereira Nº 62 Of. 207, Comuna Las Condes, Ciudad Santiago, Chile | |||
SEV Automotive and Plant Limited | Maintenance and repair of motor vehicles | 100% ordinary | 81 Newgate Street, London, EC1A 7AJ, United Kingdom | |||
Skeegle App Limited | In liquidation | 100% ordinary | BDO LLP, 55 Baker Street, London, W1U 7EU, United Kingdom | |||
Skeegle Holdings Limited | In liquidation | 100% ordinary | BDO LLP, 55 Baker Street, London, W1U 7EU, United Kingdom | |||
Skeegle Operations Limited | In liquidation | 100% ordinary | BDO LLP, 55 Baker Street, London, W1U 7EU, United Kingdom | |||
Sun Microsystems Philippines, Inc | Dormant | 51% common | 11th Floor, Page One Building, 1215 Acacia Avenue, Madrigal, Business park, Ayala Alabany, Muntinlupa city, 1780 City, Manila, 1780, Philippines | |||
Sun Vietnam Co., Ltd. | Dormant | 60% ordinary | 7th Floor, ESTAR Building, 147-149 Vo Van Tan Street, Ward 6, District 3, HCM City, Viet Nam | |||
Sun Vietnam Pte. Ltd. | Dormant | 60% ordinary | 8 Changi Business Park Ave (South Tower), #08-51 UE Bizhub East, Singapore, 486018, Singapore | |||
Syntone S.A.R.L. | Dormant | 99% ordinary | Espace Jet Business Class, 16/18 Lot Attoufik Sidi Maarouf, Casablanca, 20190, Morocco | |||
Tikit, Inc. | Software services products provider | 100% ordinary | 200 King Street W, Suite 1904, Toronto ON M5H 3TA, Canada | |||
Tudor Minstrel | Finance company | 100% ordinary | 81 Newgate Street, London, EC1A 7AJ, United Kingdom | |||
UAB BTH Vilnius | Communications related services and products provider | 100% ordinary | Aludariu str 2-33, LT-01113 Vilnius, Lithuania | |||
Whitestream Industries Limited | Investment/holding company | 100% ordinary | 2 Grand Canal Plaza, Upper Grand Canal Street, Dublin 4, Republic of Ireland |
| British Telecommunications plc Annual Report & Form 20-F 2018 | 205 | |||||
Table of Contents
Related undertakings continued
Joint ventures and joint operationsb
| Company name | Activity | Group interest in allotted capitala | Country of incorporation | Financial year end | Registered Address | |||||||||
Held via other group companies | ||||||||||||||
BT OnePhone Limited | Communications related services and products provider | 70% ordinary | UK | 31 March | 81 Newgate Street, London, EC1A 7AJ, United Kingdom | |||||||||
Mobile Broadband Network Limited | Joint venture between EE and Hutchison 3G UK Limited to manage network | 50% ordinary | UK | 31 December | 6 Anglo Office Park, 67 White Lion Road, Amersham, Buckinghamshire, HP7 9FB, United Kingdom | |||||||||
Rugby Radio Station (General Partner) Limited | Property investment | 50% ordinary | UK | 31 December | St Helen’s 1 Undershaft, London, EC3P 3DQ, United Kingdom | |||||||||
Rugby Radio Station (Nominee) Limited | Property company | 50% ordinary | UK | 31 December | St Helen’s 1 Undershaft, London, EC3P 3DQ, United Kingdom | |||||||||
Rugby Radio Station LP | Property company | 50% – | UK | 31 December | St Helen’s 1 Undershaft, London, EC3P 3DQ, United Kingdom | |||||||||
Interests in joint operations
EE Limited and Hutchison 3G UK Limited (together ‘the Companies’) each have a 50% share in the joint operation Mobile Broadband Network Limited (‘MBNL’). MBNL’s ongoing purpose is the operation and maintenance of mobile networks through a sharing arrangement. This includes the efficient management of shared infrastructure and networks on behalf of the Companies, acquiring certain network elements for shared use, and coordinating the deployment of new infrastructure and networks on either a shared or a unilateral basis (unilateral elements being network assets or services specific to one company only). The group headed by BT Group plc is committed to incurring 50% of costs in respect of restructuring the Shared Network, a similar proportion of the operating costs (which varies in line with usage), and 100% of any unilateral elements.
Guarantees for the joint operation are given by Deutsche Telekom AG and Hutchison Whampoa Limited. Deutsche Telekom, Orange and BT have agreed between them to manage any potential liability by arrangements between themselves.
The principal place of business of the joint operation is in the UK.
| 206 | British Telecommunications plc Annual Report & Form 20-F 2018 | |||||
Table of Contents
| THE STRATEGIC REPORT | GOVERNANCE | FINANCIAL STATEMENTS | ADDITIONAL INFORMATION | |||||||||
|
|
| ||||||||||
Associates
| Company name | Activity | Group interest In allotted capitala | Registered Address | |||
Held via other group companies | ||||||
British Telecom Al-Saudia Limited | Communications related services, systems integration and products provider | 49% other | New Acaria Commercial Complex, Al-Siteen Street, Malaz, Riyadh, Saudi Arabia | |||
BT Global Services (North Gulf) LLC | Communications related services, systems integration and products provider | 49% ordinary | 1413, 14th Floor, Al Fardan Office Tower, Doha, 31316, Qatar | |||
BT Siam Communications Co. Ltd. | Communications related services, systems integration and products provider | 49% class B | Athenee Tower, 23rd Floor, (CEO Suite, Suite 38 & 40), 63 Wireless Road, Lumpini, Pathumwan, Bangkok, 10330, Thailand | |||
Collectively Limited | In liquidation | 20% – | Kings Orchard, 1 Queen Street, Bristol, BS2 0HQ, United Kingdom | |||
Digital Mobile Spectrum Limited | Mitigation of interference to digital terrestrial television | 25% ordinary | 83 Baker Street, London, W1U 6AG, United Kingdom | |||
Ecquaria Limited | Communications related services, systems integration and products provider | 50% ordinary | Craigmuir Chambers, PO Box 71, Road Town, Tortora, British Virgin Islands | |||
ePLDTSunphilcox JV, Inc | Dormant | 20% ordinary | 32F Philam Life Tower, 8767 Paseo de Roxas, Makati City, Philippines | |||
I2 S.r.l | Communications related services, systems integration and products provider | 23% – | Via XII Ottobre 2N, 16121, Genova, Liguria, Italy | |||
Infonet Primalliance Shanghai Co. Ltd. | Communications related services, systems integration and products provider | 28% ordinary | Room 601, No. 2 BLDG, 750 West Zhong Shan Rd., Shanghai, 200051, P R China | |||
Infonet Primalliance Shenzhen Co. Ltd. | Communications related services, systems integration and products provider | 35% ordinary | Room 1206, Tower A, United Plaza, 5022 Bin He Avenue, Fu Tian District, Shenzhen, P. R. China | |||
Internet Matters Limited | Not for profit venture | 25% – | 6th Floor, One London Wall, London, EC2Y 5EB, United Kingdom | |||
Mahindra – BT Investment Company (Mauritius) Limited | Investment/holding company | 43% ordinary | c/o IFS, IFS Court, TwentyEight, Cybercity, Ebene, Mauritius | |||
Midland Communications Distribution Limited | Distribution and retailing of mobile telephones, associated equipment and airtime connections | 35% ordinary | Unit 1, Colwick Quays Business Park, Colwick, Nottingham, Nottinghamshire, NG4 2JY, United Kingdom | |||
QXN S.c.p.A. | Communications related services and products provider | 25% ordinary | Piazzale Luigi Sturzo, 23, 00144, Roma, Italy | |||
Real Time Content, Inc. | Provision of Cloud based video services | 21% common | Corporation Trust Center, 1209 Orange Street, City of Wilmington, County of New Castle 19801, United States of America | |||
SunPhilcox JV, Inc | Dormant | 20% ordinary | 32F Philam Life Tower, 8767 Paseo de Roxas, Makati City, Philippines | |||
Youview TV Limited | Not for profit venture – Development of software to provide TV platform services | 14% voting | 10 Lower Thames Street, Third Floor, London, EC3R 6YT, United Kingdom |
| a | The proportion of voting rights held corresponds to the aggregate interest in percentage held by the holding company and subsidiary undertakings. |
| b | All joint ventures are governed by a joint venture agreement or shareholder agreement. MBNL (page 206) is accounted for as a joint operation. |
| c | BT (Germany) GmbH & Co. oHG is making use of disclosure exemptions under the German Commercial Code Paragraph 264. |
| d | No shares issued for a branch. |
| British Telecommunications plc Annual Report & Form 20-F 2018 | 207 | |||||
Table of Contents
| THE STRATEGIC REPORT | GOVERNANCE | FINANCIAL STATEMENTS | ADDITIONAL INFORMATION | |||||||||
|
|
| ||||||||||

Additional
Information
| Additional information | |||||
| Alternative performance measures | 209 | |||||
| Information for Shareholders | 211 | |||||
| Cross-reference to Form20-F | 215 | |||||
| Annual Report 2018 | BT Group plc | 208 | ||||
Table of Contents
| THE STRATEGIC REPORT | GOVERNANCE | FINANCIAL STATEMENTS | ADDITIONAL INFORMATION | |||||||||
|
|
| ||||||||||
Alternative performance measures
Introduction
We assess the performance of the group using a variety of alternative performance measures. We principally discuss the group’s results on an ‘adjusted’ basis. The rationale for using adjusted measures is explained below. Results on an adjusted basis are presented before specific items.
We also explain financial performance using measures that are not defined under IFRS and are therefore termed‘non-GAAP’ measures (alternative performance measures). Thenon-GAAP measures we use are: the trend in underlying revenue excluding transit and adjusted EBITDA. A reconciliation from thesenon-GAAP measures to the nearest measure prepared in accordance with IFRS is presented below. The alternative performance measures we use may not be directly comparable with similarly titled measures used by other companies.
Specific items
The group’s income statement and segmental analysis separately identify trading results before specific items. The directors believe that presentation of the group’s results in this way is relevant to an understanding of the group’s financial performance, as specific items are identified by virtue of their size, nature or incidence. This presentation is consistent with the way that financial performance is measured by management and reported to the BT Group plc Board and the BT Group plc Executive Committee and assists in providing a meaningful analysis of the trading results of the group. In determining whether an event or transaction is specific, management considers quantitative as well as qualitative factors such as the frequency or predictability of occurrence.
Examples of charges or credits meeting the above definition and which have been presented as specific items in the current and/or prior years include acquisitions/disposals of businesses and investments, regulatory settlements, historical insurance or litigation claims, business restructuring programmes, asset impairment charges, property rationalisation programmes, net interest on pensions and the settlement of multiple tax years. In the event that other items meet the criteria, which are applied consistently from year to year, they are also treated as specific items.
Specific items are disclosed in note 8 to the consolidated financial statements.
Trends in underlying revenue excluding transit
Underlying revenue excluding transit is a measure that seeks to reflect the underlying performance of the group that will contribute to long-term sustainable profitable growth. As such this excludes the impact of acquisitions or disposals, foreign exchange movements and specific items. We exclude transit from the trends as transit traffic islow-margin and is affected by reductions in mobile termination rates. Given the significance of the EE acquisition to the group, in 2016/17 we calculated underlying revenue excluding transit adjusted for the acquisition of EE, as though EE had been part of the group from 1 April 2015. This is different from how we usually adjust for acquisitions.
A reconciliation from the increase in reported revenue, the most directly comparable IFRS measure, to the movement in underlying revenue, is set out below.
| 2018 | 2017 | |||||||
| Year ended 31 March | % | % | ||||||
(Decrease)/increase in reported revenue | (1.4 | ) | 26.6 | |||||
Specific items | – | 1.0 | ||||||
(Decrease)/increase in adjusted revenue | (1.4 | ) | 27.6 | |||||
Adjusted for the acquisition of EEa | – | (25.9 | ) | |||||
(Decrease)/increase in adjusted revenue | (1.4 | ) | 1.7 | |||||
Transit revenue | 0.6 | 0.1 | ||||||
Acquisitions and disposals | 0.1 | 0.1 | ||||||
Foreign exchange movements | (0.3 | ) | (2.1 | ) | ||||
Decrease in underlying revenue | (1.0 | ) | (0.2 | ) | ||||
| a | Includes EE’s historical financial information for 2016/17 as though it had been part of the group from 1 April 2015. |
EBITDA
In addition to measuring financial performance of the group and customer-facing units based on operating profit, we also measure performance based on EBITDA and adjusted EBITDA. EBITDA is defined as the group profit or loss before depreciation, amortisation, net finance expense and taxation. Adjusted EBITDA is defined as EBITDA before specific items. EBITDA is a common measure used by investors and analysts to evaluate the operating financial performance of companies, particularly in the telecommunications sector.
We consider EBITDA and adjusted EBITDA to be useful measures of our operating performance because they approximate the underlying operating cash flow by eliminating depreciation and amortisation. EBITDA and adjusted EBITDA are not direct measures of our liquidity, which is shown by our cash flow statement, and need to be considered in the context of our financial commitments.
| British Telecommunications plc Annual Report & Form 20-F 2018 | 209 |
Table of Contents
Alternative performance measures continued
A reconciliation from group operating profit, the most directly comparable IFRS measure, to group EBITDA and adjusted group EBITDA and a reconciliation of the trends in EBITDA adjusted for the acquisition of EE is provided below. A reconciliation between operating profit and adjusted EBITDA for our customer-facing units is set out in note 4 to the consolidated financial statements.
| 2018 | 2017 | 2016 | ||||||||||||||
| Year ended 31 March | £m | £m | £m | |||||||||||||
Operating profit | 3,384 | 3,170 | 3,615 | |||||||||||||
Depreciation and amortisation | 3,514 | 3,572 | 2,631 | |||||||||||||
EBITDA | 6,898 | 6,742 | 6,246 | |||||||||||||
Specific itemsa | 610 | 906 | 215 | |||||||||||||
Adjusted EBITDA | 7,508 | 7,648 | 6,461 | |||||||||||||
| 2018 | 2017 | |||||||||||||||
| Year ended 31 March | % | % | ||||||||||||||
Increase in EBITDA | 2.3 | 7.9 | ||||||||||||||
Specific items | (4.1 | ) | 10.5 | |||||||||||||
(Decrease) increase in adjusted EBITDA | (1.8 | ) | 18.4 | |||||||||||||
| a | Excludes amortisation specifics of £nil (2016/17: £62m, 2015/16: £nil). Specific items are set out in note 8 to the consolidated financial statements. |
| 210 | British Telecommunications plc Annual Report & Form 20-F 2018 | |||||
Table of Contents
| THE STRATEGIC REPORT | GOVERNANCE | FINANCIAL STATEMENTS | ADDITIONAL INFORMATION | |||||||||
|
|
| ||||||||||
Cautionary statement regarding forward-looking statements
This Annual Report contains certain forward-looking statements which are made in reliance on the safe harbour provisions of the US Private Securities Litigation Reform Act of 1995. These statements relate to analyses and other information which are based on forecasts of future results and estimates of amounts not yet determinable. These statements include, without limitation, those concerning: underlying revenue and revenue trends; EBITDA; free cash flow; capital expenditure; shareholder returns including dividends and share buyback; credit ratings; our group-wide transfomation and restructuring programme, cost transformation plans and restructuring costs; investment in and roll out of our fibre network, and its reach, innovations, increased speeds and speed availability; our broadband-based service and strategy; investment in 5G; our investment in TV, enhancing our TV service and BT Sport; the recovery plan, operating charge, regular cash contributions and interest expense for our defined benefit pension schemes; effective tax rate; growth opportunities in networked IT services, thepay-TV services market, broadband, and mobility and future voice; growth of, and opportunities available in, the communications industry and BT’s positioning to take advantage of those opportunities; further financial and other benefits to be realised from the EE acquisition; expectations regarding competition, market shares, prices and growth; expectations regarding the convergence of technologies; plans for the launch of new products and services; network performance and quality; the impact of regulatory initiatives, decisions and outcomes on operations, including the regulation of the UK fixed wholesale and retail businesses and the impact of the agreement reached with Ofcom, as a result of which BT formed Openreach Limited as a subsidiary with enhanced independence; BT’s possible or assumed future results of operations and/or those of its associates and joint ventures; investment plans; adequacy of capital; financing plans and refinancing requirements; demand for and access to broadband and the promotion of broadband by third-party service providers; improvements to the control environment; and those statements preceded by, followed by, or that include the words ‘aims’, ‘believes’, ‘expects’, ‘anticipates’, ‘intends’, ‘will’, ‘should’ ‘plans’, ‘strategy’, ‘future’, ‘likely’, ‘seeks’, ‘projects’, ‘estimates’ or similar expressions.
Although BT believes that the expectations reflected in these forward-looking statements are reasonable, it can give no assurance that these expectations will prove to have been correct. Because these statements involve risks and uncertainties, actual results may differ materially from those expressed or implied by these forward-looking statements. Factors that could cause differences between actual results and those implied by the forward-looking statements include, but are not limited to: material adverse changes in economic conditions in the markets served by BT whether as a result of the uncertainties arising from the UK’s exit from the EU or otherwise; future regulatory and legal actions, decisions, outcomes of appeal and conditions or requirements in BT’s operating areas, as well as competition from others; the impact of the agreement reached with Ofcom, as a result of which BT formed Openreach Limited as a subsidiary with enhanced independence; the results of any future spectrum auctions; selection by BT and its customer-facing units of the appropriate trading and marketing models for its products and services; technological innovations, including the cost of developing new products, networks and solutions and the need to increase expenditures for improving the quality of service; the anticipated benefits and advantages of new technologies, products and services not being realised; developments in the convergence of technologies; external threats to cyber security, data or resilience; political andgeo-political risks; prolonged adverse weather conditions resulting in a material increase in overtime, employee or other costs or impact on customer service; the timing of entry and profitability of BT in certain markets; significant changes in market shares for BT or its principal products and services; fluctuations in foreign currency exchange rates or interest rates; the underlying assumptions and estimates made in respect of major customer contracts proving unreliable; the aims and anticipated savings of our group-wide transformation and restructuring programme not being achieved; the anticipated benefits and synergies of the EE integration not being delivered; the improvements to the control environment following the investigations into BT’s Italian business being ineffective; and general financial market conditions affecting BT’s performance and ability to raise finance. Certain of these factors are discussed in more detail elsewhere in this Annual Report including, without limitation, in Our risks on pages 34 to 47. BT undertakes no obligation to update any forward-looking statements whether written or oral that may be made from time to time, whether as a result of new information, future events or otherwise.
Background
Telephone services in almost all of the UK were, until 1981, provided by the Post Office, which was a government department until 1969 when it was established as a state public corporation. In 1981, the postal and telecommunications services of the Post Office became the responsibility of two separate corporations, with British Telecommunications – under the trading name of British Telecom – taking over the telecommunications business.
British Telecommunications plc, the successor to the statutory corporation British Telecommunications, was incorporated in England and Wales on 1 April 1984 as a public limited company, wholly owned by the UK Government, as a result of the Telecommunications Act 1984. Between November 1984 and July 1993, the UK Government sold all of its shareholding in three public offerings.
BT Group plc, the ultimate parent company, was formed when the mmO2 business, comprising what had been BT’s mobile activities in the UK, the Netherlands, Germany and the Republic of Ireland, was demerged on 19 November 2001. British Telecommunications plc (BT plc) shares ceased trading on the London, New York and Tokyo stock exchanges on 16 November 2001. BT Group plc’s shares commenced trading on the London and New York stock exchanges on 19 November 2001. As a result of the transaction BT plc became a wholly-owned subsidiary of BT Group Investments Limited (BTGI), itself wholly owned by BT Group plc. Accordingly, the ordinary shares of BT plc werede-listed from the London Stock Exchange on 19 November 2001.
The registered office address of BT is 81 Newgate Street, London EC1A 7AJ. The company’s agent in the US is Richard Nohe, 620 Eighth Avenue, New York, NY 10018, US.
| British Telecommunications plc Annual Report & Form 20-F 2018 | 211 | |||||
Table of Contents
Information for shareholderscontinued
Articles of Association (Articles)
The following is a summary of the principal provisions of the Articles of British Telecommunications plc (BT), a copy of which has been filed with the Registrar of Companies. New Articles of Association were adopted on 5 August 2010 (as amended by a special resolution on 15 December 2017), largely to take account of changes in UK company law brought about by the Companies Act 2006 (2006 Act). Under the 2006 Act, the Memorandum of Association serves a more limited role as historical evidence of the formation of the company. Since August 2010, the provisions in relation to objects in BT’s Memorandum are deemed to form part of BT’s Articles, and have been deleted from those Articles because of shareholders passing a resolution to this effect. Under the 2006 Act, BT’s objects are unrestricted.
Articles
The following section when referring to the Board means BT plc Board.
(a) Voting rights
In the following description of the rights attaching to the shares in the company, a ‘holder of shares’ and a ‘member’ is, in either case, the person registered in the company’s register of members as the holder of the relevant shares.
Subject to certain restrictions, on a show of hands, every member present in person or by proxy at any general meeting has one vote and, on a poll, every member present in person or by proxy has one vote for each share which they hold.
Voting at any meeting of members is by a show of hands unless a poll is demanded by the chairman of the meeting or by any member at the meeting who is entitled to vote (or the member’s proxy).
(b) Changes in capital
The company may by ordinary resolution:
(i) consolidate, or consolidate and then divide, all or any of its share capital into shares of a larger amount than its existing shares;
(ii) divide its shares, or any of them, into shares of a smaller amount and the resolution may decide that, as between the shares resulting from the division, any of them may have any preference or advantage as compared with the others.
The company may also:
(i) buy back its own shares; and
(ii) by special resolution reduce its share capital, any capital redemption reserve and any share premium account.
(c) Dividends
The company’s members can declare dividends by passing an ordinary resolution, in addition to the powers of the Board, but no dividend can exceed the amount recommended by the Board. Dividends must be paid out of profits available for distribution. If the directors consider that the profits of the company justify such payments, they can pay interim and final dividends. Fixed dividends will be paid on any class of share on the dates stated for the payments of those dividends.
Any dividend which has not been claimed for 10 years after it was declared or became due for payment will be forfeited and belong to the company again unless the directors decide otherwise.
(d) Distribution of assets on winding up
If the company is wound up (whether the liquidation is voluntary, under supervision of a court or by a court) the liquidator can, with the authority of a special resolution passed by the members, divide among the members all or any part of the assets of the company.
This applies whether the assets consist of property of one kind or different kinds. For this purpose, the liquidator can place whatever value the liquidator considers fair on any property and decide how the division is carried out between members or different groups of members. The liquidator can also, with the same authority, transfer any assets to trustees upon trusts for the benefit of members which the liquidator decides. The liquidation of the company can then be finalised and the company dissolved. No past or present members can be compelled to accept any shares or other property under BT’s Articles which could give them a liability.
(e) Transfer of shares
Shares of the company may only be transferred in writing and either in the usual form or another form approved by the Board. A transfer form must be signed or made effective in some other way, by or on behalf of the person making the transfer and, unless the share is fully paid, by or on behalf of the person to whom the shares are being transferred.
(f) General meetings
The Board can decide to call general meetings. If there are not enough directors in the UK to call a general meeting, any director or member may call a general meeting.
(g) Directors’ remuneration
The directors are entitled to the remuneration set by the company by an ordinary resolution. The directors may be paid their expenses properly incurred in connection with the business of the company.
| 212 | British Telecommunications plc Annual Report & Form 20-F 2018 | |||||
Table of Contents
| THE STRATEGIC REPORT | GOVERNANCE | FINANCIAL STATEMENTS | ADDITIONAL INFORMATION | |||||||||
|
|
| ||||||||||
The directors can decide whether to provide pensions, annual payments or other allowances or benefits to any people including people who are or were directors of the company. The Board can decide to extend these arrangements to relations or dependants of, or people connected to these people. The Board can also decide to contribute to a scheme or fund or to pay premiums to a third party for these purposes. However, the company can only provide pension and other similar benefits to any director or former director who has not been employed by or held any other office or executive position, in BT Group plc or any of its subsidiary undertakings, including the company, or to relations or dependants of, or people connected to, those directors or former directors, if the members approve this by passing an ordinary resolution.
(h) Directors’ votes
A director need not be a member, but a director who is not a member can still attend and speak at members’ meetings. Unless BT’s Articles say otherwise, a director cannot vote on a resolution about a contract in which the director has an interest (this will also apply to interests of a person connected with the director).
If the legislation allows, a director can vote and be counted in the quorum on a resolution concerning a contract:
(I) in which the director has an interest of which the director is not aware; or which cannot reasonably be regarded as likely to give rise to a conflict of interest;
(II) in which the director has an interest only because the director is a holder of shares, debentures or other securities of BT, or by reason of any other interest in or through BT;
(III) which involves the giving of any security, guarantee or indemnity to the director or any other person for: money lent or obligations incurred by the director or by any other person at the request of or for the benefit of BT or the benefit of any of its subsidiary undertakings; or a debt or other obligation which is owed by BT or any of its subsidiary undertakings to that other person if the director has taken responsibility for all or any part of that debt or obligation by giving a guarantee, security or indemnity;
(IV) where BT or any of its subsidiary undertakings is offering any shares, debentures or other securities for subscription or purchase to which the director is or may be entitled to participate as a holder of BT or BT Group plc securities; or where the director will be involved in the underwriting orsub-underwriting;
(V) relating to any other company in which the director has an interest, directly or indirectly (including holding a position in that company) or is a shareholder, creditor, employee or otherwise involved in that company. These rights do not apply if the director owns 1% or more of that company or of the voting rights in that company;
(VI) relating to an arrangement for the benefit of BT employees or former employees of BT or any of BT’s subsidiary undertakings which only gives the directors the same benefits that are generally given to the employees or former employees to whom the arrangement relates;
(VII) relating to BT buying or renewing insurance for any liability for the benefit of directors or for the benefit of persons who include directors;
(VIII) relating to the giving of indemnities in favour of directors;
(IX) relating to the funding of expenditure by any director or directors: on defending criminal, civil or regulatory proceedings or actions against the director or the directors; in connection with an application to the court for relief; or on defending the director or the directors in any regulatory investigations; or which enables any director or directors to avoid incurring expenditure as described in this paragraph; and
(X) in which the director’s interest, or the interest of directors generally, has been authorised by an ordinary resolution.
Subject to the relevant legislation, the members can by passing an ordinary resolution ratify any particular contract or arrangement carried out in breach of those provisions.
(i) Retirement of directors
No person will be prevented from being or becoming a director simply because that person has reached the age of 70.
(j) Directors’ borrowing powers
To the extent that the legislation and BT’s Articles allow, the Board may exercise all the powers of the company to borrow money, to mortgage or charge its business, property and assets (present and future) and to issue debentures and other securities, and give security either outright or as collateral security for any debt, liability or obligation of the company or another person.
Further note on certain activities
In addition, under Section 219 of the Iran Threat Reduction and Syria Human Rights Act of 2012, which added Section 13 (r) to the Securities Exchange Act of 1934, we are required to disclose whether BT or any of its affiliates knowingly engaged in certain activities, transactions or dealings relating to Iran or certain designated individuals or entities. Disclosure is required even when the activities were conducted outside the US bynon-US entities and even when they were conducted in compliance with applicable law.
During 2017/18, certain of the group’snon-US subsidiaries or othernon-US entities conducted limited activities in, or with persons from, certain countries identified by the US Department of State as State Sponsors of Terrorism or otherwise subject to US sanctions.
These activities, which generally relate to the provision of communications services to embassies and diplomatic missions ofUS-allied governments, other Communication Providers, news organisations, multinational corporations and other customers that require global communications connectivity, are insignificant to the group’s financial condition and results of operations.
BT has a contract in place with Telecommunication Infrastructure Company (TIC), to make and receive voice calls from Iran to the UK.
BT entered into a Framework Agreement with Rafsanjan Industrial Complex (RIC) for business consultancy services in May 2010 and provided an initial consultancy engagement under phase 1 of the agreement. In February 2011, phase 2 was agreed with RIC however
| British Telecommunications plc Annual Report & Form 20-F 2018 | 213 | |||||
Table of Contents
Information for shareholderscontinued
BT stopped work in December 2011 due to the geopolitical situation. RIC made an advance payment to BT of€384,120 to carry out the phase 2 work. We continue to explore whether the amount can be refunded.
BT’s subsidiary, EE (the acquisition of which was completed on 29 January 2016), has in place roaming partner agreements with Mobile Company of Iran (MCI), and Taliya Company (also known as Rafsanjan Industrial Complex). These bilateral agreements allow the transmission of mobile calls. There has been no traffic with Taliya in 2017/18. The value of the gross revenue to EE under these contracts is less than £25,000, although no payments have been made or received in 2017/18.
Limitations affecting security holders
There are no limitations under the laws of the United Kingdom restricting the right of non-residents to hold or to vote shares in the company.
Documents on display
All reports and other information that BT files with the US Securities and Exchange Commission (SEC) may be inspected at the SEC’s public reference facilities at Room 1580, 100 F Street, NE Washington, DC, 20549, US. These reports may be accessed via the SEC’s website at www.sec.gov.
| 214 | British Telecommunications plc Annual Report & Form 20-F 2018 | |||||
Table of Contents
| THE STRATEGIC REPORT | GOVERNANCE | FINANCIAL STATEMENTS | ADDITIONAL INFORMATION | |||||||||
|
|
| ||||||||||
The information in this document that is referred to in the following table shall be deemed to be filed with the Securities and Exchange Commission for all purposes. None of the websites referred to in this Annual Report 2018, including where a link is provided, nor any of the information contained on such websites is incorporated by reference in the Form20-F.
Required item in Form20-F Item | Where information can be found in this Annual Report Section | Page | ||||||
| ||||||||
4 | Information on the company | |||||||
| ||||||||
4A | History and development of the company | Additional information | ||||||
Information for shareholders | ||||||||
Background | 211 | |||||||
Group performance | ||||||||
Capital expenditure | 84 | |||||||
Report of the Directors | ||||||||
Statutory information | ||||||||
Capital management and funding policy | 90 | |||||||
4B | Business overview | Our strategy | 2 | |||||
Our business model | 12 | |||||||
Our resources and culture | 16 | |||||||
Our stakeholders | 22 | |||||||
Our customer-facing units | 48 | |||||||
Our corporate units | 79 | |||||||
Consolidated financial statements | ||||||||
Notes to the consolidated financial statements | ||||||||
Segment information | 119 | |||||||
Additional information | ||||||||
Information for shareholders | ||||||||
Cautionary statement regarding forward-looking statements | 211 | |||||||
Further note on certain activities | 213 | |||||||
4C | Organisational structure | Our business model | 12 | |||||
4D | Property, plants and equipment | Related undertakings | 192 | |||||
Our resources and culture | ||||||||
Our networks and physical assets | 16 | |||||||
Properties | 17 | |||||||
Consolidated financial statements | ||||||||
Notes to the consolidated financial statements | ||||||||
Property, plant and equipment
| 132 | |||||||
| ||||||||
5 | Operating and financial review and prospects | |||||||
| ||||||||
5A | Operating results | Our customer-facing units | 48 | |||||
Our corporate units | 79 | |||||||
Group performance | 82 | |||||||
Our stakeholders | 22 | |||||||
Additional information | ||||||||
Alternative performance measures | 209 | |||||||
Information for shareholders | ||||||||
Cautionary statement regarding forward-looking statements | 211 | |||||||
5B | Liquidity and capital resources | Group performance | 82 | |||||
Additional information | ||||||||
Information for shareholders | ||||||||
Cautionary statement regarding forward-looking statements | 211 | |||||||
Consolidated financial statements | ||||||||
Notes to the consolidated financial statements | ||||||||
Loans and other borrowings | 154 | |||||||
Financial instruments and risk management | 157 | |||||||
Financial commitments and contingent liabilities | 166 | |||||||
5C | Research and development, patents and licences | Our resources and culture | ||||||
Research and development | 17 | |||||||
| British Telecommunications plc Annual Report & Form 20-F 2018 | 215 | |||||
Table of Contents
Cross reference to Form20-Fcontinued
Required item in Form20-F Item | Where information can be found in this Annual Report Section | Page | ||||||
| ||||||||
5D | Trend information | Group performance | 82 | |||||
Additional information | ||||||||
Information for shareholders | ||||||||
Cautionary statement regarding forward-looking statements | 211 | |||||||
5E | Off-balance sheet arrangements | Report of the Directors | ||||||
Statutory information | ||||||||
Off-balance sheet arrangements | 91 | |||||||
5F | Tabular disclosure of contractual obligations | Group performance | ||||||
Contractual obligations and commitments | 88 | |||||||
| ||||||||
6 | Directors, senior management and employees | |||||||
| ||||||||
6D | Employees | Our stakeholders | 22 | |||||
Consolidated financial statements | ||||||||
Notes to the consolidated financial statements | ||||||||
Employees | 123 | |||||||
| ||||||||
7 | Major shareholders and related party transactions | |||||||
| ||||||||
7B | Related party transactions | Consolidated financial statements | ||||||
Notes to the consolidated financial statements | ||||||||
Related party transactions | 165 | |||||||
| ||||||||
8 | Financial information | |||||||
| ||||||||
8A | Consolidated statements and other financial | |||||||
information | See Item 18 below | |||||||
Report of the Directors | ||||||||
Statutory information | ||||||||
Dividend | 90 | |||||||
Legal proceedings | 91 | |||||||
Group performance | ||||||||
Dividends | 84 | |||||||
Consolidated financial statements | ||||||||
Notes to the consolidated financial statements | ||||||||
Financial commitments and contingent liabilities | 166 | |||||||
Additional information | ||||||||
Information for shareholders | ||||||||
Articles of Association (Articles) | ||||||||
Dividends | 212 | |||||||
8B | Significant changes | Report of the Directors | ||||||
Statutory information | ||||||||
Going concern | 91 | |||||||
| ||||||||
10 | Additional information | |||||||
| ||||||||
10B | Memorandum and articles of association | Additional information | ||||||
Information for shareholders | ||||||||
Articles of Association (Articles) | 212 | |||||||
10D | Exchange controls | Additional information | ||||||
Information for shareholders | ||||||||
Limitations affecting security holders | 214 | |||||||
10H | Documents on display | Additional information | ||||||
Information for shareholders | ||||||||
Documents on display | 214 | |||||||
| ||||||||
11 | Quantitative and qualitative disclosures about | Consolidated financial statements | ||||||
market risk | Notes to the consolidated financial statements | |||||||
Significant accounting policies | ||||||||
Financial instruments | 118 | |||||||
Financial instruments and risk management | 157 | |||||||
| 216 | British Telecommunications plc Annual Report & Form 20-F 2018 | |||||
Table of Contents
| THE STRATEGIC REPORT | GOVERNANCE | FINANCIAL STATEMENTS | ADDITIONAL INFORMATION | |||||||||
|
|
| ||||||||||
Required item in Form20-F Item | Where information can be found in this Annual Report Section | Page | ||||||
| ||||||||
15 | Controls and Procedures | Report of the Directors | ||||||
Statutory information | ||||||||
UK Internal control and risk management | 92 | |||||||
US Sarbanes-Oxley Act of 2002 | 92 | |||||||
Report of Independent Registered Public Accounting Firm | 105 | |||||||
16C | Principal accountants fees and services | Report of the Directors | ||||||
Statutory information | ||||||||
Auditors | 91 | |||||||
Consolidated financial statements | ||||||||
Notes to the consolidated financial statements | ||||||||
Audit, audit related and othernon-audit services
| 124 | |||||||
| ||||||||
18 | Financial statements | Report of Independent Registered Public Accounting Firm | 105 | |||||
Consolidated financial statements | 106 | |||||||
Notes to the consolidated financial statements
| 111 | |||||||
| ||||||||
| British Telecommunications plc Annual Report & Form 20-F 2018 | 217 | |||||
Table of Contents
British Telecommunications plc
Registered office: 81 Newgate Street, London EC1A 7AJ Registered in England No. 1800000
Produced by BT Group Typeset by Donnelley Financial Solutions
Printed in England by Leycol Printers Ltd Printed on elemental chlorine-free paper Sourced from sustainably managed forests
www.bt.com
PHME 82597 |
By Appointment to Her Majesty The Queen Suppliers of Communications, Broadband And Networked Services BT London |