SECURITIES AND EXCHANGE COMMISSION
EXCHANGE ACT OF 1934 (AMENDMENT NO. ___)
| Filed by Registrant | þ | |
| Filed by a Party other than the Registrant | o |
| þ | Preliminary Proxy Statement. | |
| o | Confidential, for Use of the Commission Only (as permitted by Rule 14a-6(e)(2)). | |
| o | Definitive Proxy Statement. | |
| o | Definitive Additional Materials. | |
| o | Soliciting Material Pursuant to Section 240.14a-12. |
| þ | No fee required. | |
| o | Fee computed on table below per Exchange Act Rules 14a-6(i)(1) and 0-11. |
| (1) | Title of each class of securities to which transaction applies: |
| (2) | Aggregate number of securities to which transaction applies: |
| (3) | Per unit price or other underlying value of transaction computed pursuant to Exchange Act Rule 0-11 (set forth the amount on which the filing fee is calculated and state how it was determined): |
| (4) | Proposed maximum aggregate value of transaction: |
| (5) | Total fee paid: |
| o | Fee paid previously with preliminary materials. | |
| o | Check box if any part of the fee is offset as provided by Exchange Act Rule 0-11(a)(2) and identify the filing for which the offsetting fee was paid previously. Identify the previous filing by registration statement number, or the form or schedule and the date of its filing. |
| (1) | Amount Previously Paid: |
| (2) | Form, Schedule or Registration Statement No.: |
| (3) | Filing Party: |
| (4) | Date Filed: |
| Q. | Why am I receiving this Proxy Statement? | |
| A. | You are a stockholder of one or more series (each a “Fund” and, collectively, the “Funds”) of First American Investment Funds, Inc. (the “Company”). FAF Advisors, Inc. (“FAF”), a wholly-owned subsidiary of U.S. Bank National Association (“U.S. Bank”), serves as investment adviser and administrator to each Fund. On July 29, 2010, U.S. Bank and FAF entered into a definitive agreement with Nuveen Investments, Inc. (“Nuveen”), Nuveen Asset Management (“NAM”) and certain Nuveen affiliates whereby NAM will acquire a portion of the asset management business of FAF (the “Transaction”). The acquired business includes the assets of FAF used in providing investment advisory services, research, sales and distribution in connection with equity, fixed income, real estate, global infrastructure and asset allocation investment products (other than the money market business and closed-end funds advised by FAF), including the Funds. In connection with the Transaction, the Board of Directors of the Company (the “Board”) considered a number of proposals designed to integrate the Funds into the Nuveen family of funds, including the appointment of NAM as investment adviser and Nuveen Investments, LLC as distributor to the Funds. |
| Q. | What proposals are stockholders being asked to consider? |
| A. | You are being asked to approve a new investment advisory agreement (the “New Advisory Agreement”) for each Fund with NAM and a newsub-advisory agreement for each Fund between NAM and a wholly-owned subsidiary of NAM that is expected to be formed pursuant to an internal restructuring (the “NAMSub-Advisory Agreement”). NAM will enter into thissub-advisory agreement at the later of the closing of the internal restructuring or the closing of the Transaction. If you are a shareholder of the International Fund or the International Select Fund, you are also being asked to approve a newsub-advisory agreement between NAM and your Fund’s currentsub-advisor (each a “New InternationalSub-Advisory Agreement”). You also are being asked to consider the election of a new Board. | |
| Q. | How will the Transaction affect me as a Fund stockholder? | |
| A. | Your Fund will be integrated into the Nuveen family of funds and be rebranded as a Nuveen Fund. Upon the closing of the Transaction, NAM will not only serve as investment adviser to the Funds, but will also provide many related services such as administration, marketing and distribution, and shareholder services. Shortly after closing of the Transaction, you will have access to all of the investment choices and all of the shareholder services available to Nuveen shareholders. The investment objective of your Fund and its principal investment strategies are not expected to change as a result of the Transaction. Except for the tax free bond funds, the portfolio managers for each Fund in place immediately prior to the Transaction are expected to remain the same. |
| The Board, FAF and NAM believe that the Transaction may benefit each Fund’s stockholders in a number of ways, including: the potential for lower investment management fees as assets increase as a result of management fee breakpoints, lower overall fund expenses as the Funds realize economies of scale from being part of a larger fund complex, expanded investment choices within the fund complex and affiliation with a well-recognized fund sponsor. | ||
| Q. | How does the proposed New Advisory Agreement differ from the current agreement? | |
| A. | While the investment advisory services to be provided under the proposed New Advisory Agreement are similar to those under the current investment advisory agreement between the Company and FAF (the “Current Advisory Agreement”), there are some differences in the terms of the Agreements. One important difference is that the fee rate under the New Advisory Agreement will be comprised of a fund-level fee rate and a complex-wide level fee rate, both of which include breakpoints, while the Current Advisory |
1
| Agreement only charges a fund-level fee rate which, in most cases, does not include breakpoints. Another important difference is that the services provided by NAM under the New Advisory Agreement include certain administrative services, whereas under the current structure, these administrative services and certain additional services are provided pursuant to a separate administrative agreement between the Funds and FAF (the “Current Administrative Agreement”) and administrative fees are paid by the Funds separately from advisory fees. Accordingly, the fee rates paid under the New Advisory Agreement are higher for most Funds than the fee rates paid under the Current Advisory Agreement because the services to be provided under the New Advisory Agreement are more extensive than those provided under the Current Advisory Agreement. The maximum fee rates payable under the New Advisory Agreement are lower than the total fees payable under the Current Advisory Agreement and the Current Administrative Agreement, in the aggregate. However, certain services provided to the Funds under the Current Administrative Agreement will not be provided to the Funds under the New Advisory Agreement and will be delegated to other service providers and paid for separately from the advisory fee by the Funds. Similarly, certain fees paid by FAF under the Current Administrative Agreement will not be paid by NAM under the New Advisory Agreement and will be paid for directly by the Funds. |
| Immediately following the Transaction, the net expense ratio for each Fund is expected to be the same or lower than the Fund’s net expense ratio as of June 30, 2010, adjusted in the case of certain Funds to reflect a decrease in net assets resulting from redemptions by the U.S. Bank 401(k) Plan expected to occur prior to the closing of the Transaction, assuming the Fund’s net assets at the time of closing the Transaction are no lower than their adjusted June 30 level. The anticipated redemptions by the U.S. Bank 401(k) Plan are unrelated to the Transaction. |
| Comparisons of certain provisions of the New Advisory Agreement and the Current Advisory Agreement are included in the enclosed Proxy Statement and a form of the New Advisory Agreement is included as an appendix. | ||
| Q. | How do the proposed New InternationalSub-Advisory Agreements differ from the current agreements? | |
| A. | The terms of the New InternationalSub-Advisory Agreements are identical in all material respects to those of the currentsub-advisory agreements between FAF and eachsub-advisor for the International Fund and International Select Fund (the “Current InternationalSub-Advisory Agreements”), except for their dates of effectiveness and term. The fee rates payable by NAM to eachsub-advisor under the New InternationalSub-Advisory Agreements are identical to those paid by FAF under the Current InternationalSub-Advisory Agreements. |
| Comparisons of certain provisions of the New InternationalSub-Advisory Agreements and the Current InternationalSub-Advisory Agreements are included in the enclosed Proxy Statement and forms of the New InternationalSub-Advisory Agreements are included as appendices. | ||
| Q. | Who are being nominated to serve as directors? | |
| A. | There are ten nominees, one of whom currently serves on the Board. The other nine nominees currently serve as directors or trustees to various Nuveen funds and were recommended by the current Board to serve upon the closing of the Transaction. It is expected that the current member of the Board who is being nominated will join the boards of other Nuveen Funds. The proposed use of a single board for all funds in the Nuveen family of funds is expected to result in enhanced supervision, administrative efficiencies and cost savings. | |
| Q. | What happens if the proposals are not approved? | |
| A. | The closing of the Transaction is subject to the satisfaction or waiver of customary conditions. If the closing conditions are not satisfied or waived, the Transaction will not close. If the Transaction does not close, none of the proposals in the enclosed Proxy Statement will take effect and the current Board will continue to serve and will take such actions as it deems in the best interest of the Funds. |
2
| If the Transaction closes but the stockholders of a specific Fund have not approved a New Advisory Agreement, the then current Board will take such actions as it deems in the best interest of the Fund, which may include terminating the Current Advisory Agreement and entering into an interim investment advisory agreement with NAM. | ||
| Q. | How does my Fund’s Board recommend that I vote? | |
| A. | The Board recommends that you vote FOR the approval of the New Advisory Agreement and NAMSub-Advisory Agreement, FOR the approval of any NewSub-Advisory Agreement, if applicable, and FOR the election of the nominees as listed in the enclosed Proxy Statement. | |
| Q. | Who will pay for the proxy solicitation? | |
| A. | The expenses associated with the proxy materials, including the preparation, printing and mailing of the enclosed proxy cards, the accompanying notice and proxy statement will not be borne by any Fund. NAM and U.S. Bank will share any costs associated with the preparation, printing and mailing of the proxy statement, solicitation of proxy votes and the costs of holding the stockholder meetings. | |
| Q. | Who do I call if I have questions? | |
| A. | If you need any assistance, or have any questions regarding the proposals or how to vote your shares, please call The Altman Group, your Fund’s proxy solicitor, at(800) 317-8033. Please have your proxy materials available when you call. | |
| Q. | How do I vote my shares? | |
| A. | You can vote your shares by completing and signing the enclosed proxy card, and mailing it in the enclosed postage-paid envelope. Alternatively, you may vote by telephone by calling the toll-free number on the proxy card or by computer by going to the Internet address provided on the proxy card and following the instructions, using your proxy card as a guide. | |
| Q. | Will anyone contact me? | |
| A. | You may receive a call from The Altman Group to verify that you received your proxy materials, to answer any questions you may have about the proposals and to encourage you to vote your proxy. |
| We recognize the inconvenience of the proxy solicitation process and would not impose on you if we did not believe that the matters being proposed were important and in the best interests of the Funds. Once your vote has been registered with the proxy solicitor, your name will be removed from the solicitor’sfollow-up contact list. |
3
MINNEAPOLIS, MINNESOTA 55402
(800) 677-3863
DECEMBER 17, 2010
1
2
MINNEAPOLIS, MINNESOTA 55402
(800) 677-3863
1
| Outstanding | ||
Fund | Shares | |
| California Tax Free Fund | ||
| Colorado Tax Free Fund | ||
| Core Bond Fund | ||
| Equity Income Fund | ||
| Equity Index Fund | ||
| Global Infrastructure Fund | ||
| High Income Bond Fund | ||
| Inflation Protected Securities Fund | ||
| Intermediate Government Bond Fund | ||
| Intermediate Tax Free Fund | ||
| Intermediate Term Bond Fund | ||
| International Fund | ||
| International Select Fund | ||
| Large Cap Growth Opportunities Fund | ||
| Large Cap Select Fund | ||
| Large Cap Value Fund | ||
| Mid Cap Growth Opportunities Fund | ||
| Mid Cap Index Fund | ||
| Mid Cap Select Fund | ||
| Mid Cap Value Fund | ||
| Minnesota Intermediate Tax Free Fund | ||
| Minnesota Tax Free Fund | ||
| Missouri Tax Free Fund | ||
| Nebraska Tax Free Fund | ||
| Ohio Tax Free Fund | ||
| Oregon Intermediate Tax Free Fund | ||
| Quantitative Large Cap Core Fund | ||
| Real Estate Securities Fund | ||
| Short Tax Free Fund | ||
| Short Term Bond Fund | ||
| Small Cap Growth Opportunities Fund | ||
| Small Cap Index Fund | ||
| Small Cap Select Fund | ||
| Small Cap Value Fund | ||
| Tactical Market Opportunities Fund | ||
| Tax Free Fund | ||
| Total Return Bond Fund |
2
Proposal | Affected Funds | Page Number | ||
| Proposal 1: To approve an investment advisory agreement with Nuveen Asset Management and an investmentsub-advisory agreement between Nuveen Asset Management and Nuveen Asset Management, LLC. | Each Fund, voting separately. | |||
| Proposal 2: To approve asub-advisory agreement between Nuveen Asset Management and each Fund’s currentSub-Advisors. | International Fund International Select Fund In each case, voting separately. | |||
| Proposal 3: To elect ten directors to the Board of Directors. | All Funds, voting together. | |||
| Proposal 4: To transact such other business as may properly come before the Special Meeting. | Each Fund, voting separately. |
3
Current Fund Name | New Fund Name | |
| Minnesota Tax Free Fund | Minnesota Municipal Bond Fund | |
| Minnesota Intermediate Tax Free Fund | Minnesota Intermediate Municipal Bond Fund | |
| Nebraska Tax Free Fund | Nebraska Municipal Bond Fund | |
| Oregon Intermediate Tax Free Fund | Oregon Intermediate Municipal Bond Fund |
4
AGREEMENT AND NAMSUB-ADVISORY AGREEMENT
5
6
| • | NAM provides advisory and certain administrative services pursuant to a single agreement and a single fee, while FAF provides advisory and administrative services pursuant to separate agreements and separate fees; | |
| • | Under the new fee structure, certain expenses that are currently covered through the administrative fee will not be covered through the new advisory fee, but will be paid directly by the Fund; | |
| • | The new management fee schedule is comprised of a fund-level fee rate and a complex-wide fee rate, while the current management fee schedule is only comprised of a fund-level fee rate; and | |
| • | The new management fee schedule includes fund-level and complex-level breakpoints, while the current fee schedules generally do not include breakpoints. |
| Current Management | ||||
Fund | Fee Rate | |||
| California Tax Free Fund | 0.50 | % | ||
| Colorado Tax Free Fund | 0.50 | % | ||
| Core Bond Fund | 0.50 | % | ||
| Equity Income Fund(1) | 0.65 | % | ||
| Equity Index Fund | 0.25 | % | ||
| Global Infrastructure Fund | 0.90 | % | ||
| High Income Bond Fund | 0.70 | % | ||
| Inflation Protected Securities Fund | 0.50 | % | ||
| Intermediate Government Bond Fund | 0.50 | % | ||
| Intermediate Tax Free Fund | 0.50 | % | ||
| Intermediate Term Bond Fund | 0.50 | % | ||
| International Fund | 1.00 | % | ||
| International Select Fund | 1.00 | % | ||
| Large Cap Growth Opportunities Fund(1) | 0.65 | % | ||
7
| Current Management | ||||
Fund | Fee Rate | |||
| Large Cap Select Fund(1) | 0.65 | % | ||
| Large Cap Value Fund(1) | 0.65 | % | ||
| Mid Cap Growth Opportunities Fund | 0.70 | % | ||
| Mid Cap Index Fund | 0.25 | % | ||
| Mid Cap Select Fund | 0.70 | % | ||
| Mid Cap Value Fund | 0.70 | % | ||
| Minnesota Intermediate Tax Free Fund | 0.50 | % | ||
| Minnesota Tax Free Fund | 0.50 | % | ||
| Missouri Tax Free Fund | 0.50 | % | ||
| Nebraska Tax Free Fund | 0.50 | % | ||
| Ohio Tax Free Fund | 0.50 | % | ||
| Oregon Intermediate Tax Free Fund | 0.50 | % | ||
| Quantitative Large Cap Core Fund | 0.30 | % | ||
| Real Estate Securities Fund | 0.70 | % | ||
| Short Tax Free Fund | 0.50 | % | ||
| Short Term Bond Fund | 0.50 | % | ||
| Small Cap Growth Opportunities Fund | 1.00 | % | ||
| Small Cap Index Fund | 0.40 | % | ||
| Small Cap Select Fund | 0.70 | % | ||
| Small Cap Value Fund | 0.70 | % | ||
| Tactical Market Opportunities Fund | 0.75 | % | ||
| Tax Free Fund | 0.50 | % | ||
| Total Return Bond Fund | 0.60 | % | ||
| (1) | The Current Advisory Agreement provides for a breakpoint schedule with respect to each of Large Cap Growth Opportunities Fund, Large Cap Select Fund, Large Cap Value Fund, and Equity Income Fund. The advisory fee paid separately by each of these Funds is based on an annual rate of 0.65% for the first $3 billion of each Fund’s average daily net assets; 0.625% for average daily net assets in excess of $3 billion up to $5 billion; and 0.60% for average daily net assets in excess of $5 billion. |
| Complex-Wide Assets | Annual Effective Rate at | |||
Breakpoint Level | Breakpoint Level | |||
| ($ billion) | (%) | |||
| First $8 billion | 0.250 | |||
| Next $17 billion | 0.235 | |||
| Next $25 billion | 0.220 | |||
| Over $50 billion | 0.200 | |||
8
| Assets of | ||||||||||||||||||||||||
| First | Next | Next | Next | Next | $2 Billion | |||||||||||||||||||
Fund | $125 Million | $125 Million | $250 Million | $500 Million | $1 Billion | or More | ||||||||||||||||||
| California Tax Free Fund | 0.45 | % | 0.4375 | % | 0.4250 | % | 0.4125 | % | 0.4000 | % | 0.3750 | % | ||||||||||||
| Colorado Tax Free Fund | 0.45 | % | 0.4375 | % | 0.4250 | % | 0.4125 | % | 0.4000 | % | 0.3750 | % | ||||||||||||
| Core Bond Fund | 0.45 | % | 0.4375 | % | 0.4250 | % | 0.4125 | % | 0.4000 | % | 0.3750 | % | ||||||||||||
| Equity Income Fund | 0.60 | % | 0.5875 | % | 0.5750 | % | 0.5625 | % | 0.5500 | % | 0.5250 | % | ||||||||||||
| Equity Index Fund | 0.10 | % | 0.0875 | % | 0.0750 | % | 0.0625 | % | 0.0500 | % | 0.0250 | % | ||||||||||||
| Global Infrastructure Fund | 0.75 | % | 0.7375 | % | 0.7250 | % | 0.7125 | % | 0.7000 | % | 0.6750 | % | ||||||||||||
| High Income Bond Fund | 0.60 | % | 0.5875 | % | 0.5750 | % | 0.5625 | % | 0.5500 | % | 0.5250 | % | ||||||||||||
| Inflation Protected Securities Fund | 0.45 | % | 0.4375 | % | 0.4250 | % | 0.4125 | % | 0.4000 | % | 0.3750 | % | ||||||||||||
| Intermediate Government Bond Fund | 0.45 | % | 0.4375 | % | 0.4250 | % | 0.4125 | % | 0.4000 | % | 0.3750 | % | ||||||||||||
| Intermediate Tax Free Fund | 0.40 | % | 0.3875 | % | 0.3750 | % | 0.3625 | % | 0.3500 | % | 0.3250 | % | ||||||||||||
| Intermediate Term Bond Fund | 0.45 | % | 0.4375 | % | 0.4250 | % | 0.4125 | % | 0.4000 | % | 0.3750 | % | ||||||||||||
| International Fund | 0.85 | % | 0.8375 | % | 0.8250 | % | 0.8125 | % | 0.8000 | % | 0.7750 | % | ||||||||||||
| International Select Fund | 0.85 | % | 0.8375 | % | 0.8250 | % | 0.8125 | % | 0.8000 | % | 0.7750 | % | ||||||||||||
| Large Cap Growth Opportunities Fund | 0.65 | % | 0.6375 | % | 0.6250 | % | 0.6125 | % | 0.6000 | % | 0.5750 | % | ||||||||||||
| Large Cap Select Fund | 0.55 | % | 0.5375 | % | 0.5250 | % | 0.5125 | % | 0.5000 | % | 0.4750 | % | ||||||||||||
| Large Cap Value Fund | 0.55 | % | 0.5375 | % | 0.5250 | % | 0.5125 | % | 0.5000 | % | 0.4750 | % | ||||||||||||
| Mid Cap Growth Opportunities Fund | 0.70 | % | 0.6875 | % | 0.6750 | % | 0.6625 | % | 0.6500 | % | 0.6250 | % | ||||||||||||
| Mid Cap Index Fund | 0.15 | % | 0.1375 | % | 0.1250 | % | 0.1125 | % | 0.1000 | % | 0.0750 | % | ||||||||||||
| Mid Cap Select Fund | 0.70 | % | 0.6875 | % | 0.6750 | % | 0.6625 | % | 0.6500 | % | 0.6250 | % | ||||||||||||
| Mid Cap Value Fund | 0.70 | % | 0.6875 | % | 0.6750 | % | 0.6625 | % | 0.6500 | % | 0.6250 | % | ||||||||||||
| Minnesota Intermediate Tax Free Fund | 0.35 | % | 0.3375 | % | 0.3250 | % | 0.3125 | % | 0.3000 | % | 0.2750 | % | ||||||||||||
| Minnesota Tax Free Fund | 0.35 | % | 0.3375 | % | 0.3250 | % | 0.3125 | % | 0.3000 | % | 0.2750 | % | ||||||||||||
| Missouri Tax Free Fund | 0.45 | % | 0.4375 | % | 0.4250 | % | 0.4125 | % | 0.4000 | % | 0.3750 | % | ||||||||||||
| Nebraska Tax Free Fund | 0.35 | % | 0.3375 | % | 0.3250 | % | 0.3125 | % | 0.3000 | % | 0.2750 | % | ||||||||||||
| Ohio Tax Free Fund | 0.45 | % | 0.4375 | % | 0.4250 | % | 0.4125 | % | 0.4000 | % | 0.3750 | % | ||||||||||||
| Oregon Intermediate Tax Free Fund | 0.35 | % | 0.3375 | % | 0.3250 | % | 0.3125 | % | 0.3000 | % | 0.2750 | % | ||||||||||||
| Quantitative Large Cap Core Fund | 0.30 | % | 0.2875 | % | 0.2750 | % | 0.2625 | % | 0.2500 | % | 0.2250 | % | ||||||||||||
| Real Estate Securities Fund | 0.70 | % | 0.6875 | % | 0.6750 | % | 0.6625 | % | 0.6500 | % | 0.6250 | % | ||||||||||||
| Short Tax Free Fund | 0.25 | % | 0.2375 | % | 0.2250 | % | 0.2125 | % | 0.2000 | % | 0.1750 | % | ||||||||||||
9
| Assets of | ||||||||||||||||||||||||
| First | Next | Next | Next | Next | $2 Billion | |||||||||||||||||||
Fund | $125 Million | $125 Million | $250 Million | $500 Million | $1 Billion | or More | ||||||||||||||||||
| Short Term Bond Fund | 0.30 | % | 0.2875 | % | 0.2750 | % | 0.2625 | % | 0.2500 | % | 0.2250 | % | ||||||||||||
| Small Cap Growth Opportunities Fund | 0.80 | % | 0.7875 | % | 0.7750 | % | 0.7625 | % | 0.7500 | % | 0.7250 | % | ||||||||||||
| Small Cap Index Fund | 0.15 | % | 0.1375 | % | 0.1250 | % | 0.1125 | % | 0.1000 | % | 0.0750 | % | ||||||||||||
| Small Cap Select Fund | 0.70 | % | 0.6875 | % | 0.6750 | % | 0.6625 | % | 0.6500 | % | 0.6250 | % | ||||||||||||
| Small Cap Value Fund | 0.70 | % | 0.6875 | % | 0.6750 | % | 0.6625 | % | 0.6500 | % | 0.6250 | % | ||||||||||||
| Tactical Market Opportunities Fund | 0.60 | % | 0.5875 | % | 0.5750 | % | 0.5625 | % | 0.5500 | % | 0.5250 | % | ||||||||||||
| Tax Free Fund | 0.40 | % | 0.3875 | % | 0.3750 | % | 0.3625 | % | 0.3500 | % | 0.3250 | % | ||||||||||||
| Total Return Bond Fund | 0.45 | % | 0.4375 | % | 0.4250 | % | 0.4125 | % | 0.4000 | % | 0.3750 | % | ||||||||||||
| Complex-Level Asset | Effective Rate at | |||
Breakpoint Level | Breakpoint Level | |||
| ($ billion) | (%) | |||
| 55 | 0.2000 | |||
| 56 | 0.1996 | |||
| 57 | 0.1989 | |||
| 60 | 0.1961 | |||
| 63 | 0.1931 | |||
| 66 | 0.1900 | |||
| 71 | 0.1851 | |||
| 76 | 0.1806 | |||
| 80 | 0.1773 | |||
| 91 | 0.1691 | |||
| 125 | 0.1599 | |||
| 200 | 0.1505 | |||
| 250 | 0.1469 | |||
| 300 | 0.1445 | |||
10
11
| Compensation | ||||
Fund | Percentage | |||
| California Tax Free Fund | 38.4615 | % | ||
| Colorado Tax Free Fund | 38.4615 | % | ||
| Core Bond Fund | 38.4615 | % | ||
| Equity Income Fund | 50.0000 | % | ||
| Equity Index Fund | 33.3333 | % | ||
| Global Infrastructure Fund | 57.8947 | % | ||
| High Income Bond Fund | 50.0000 | % | ||
| Inflation Protected Securities Fund | 38.4615 | % | ||
| Intermediate Government Bond Fund | 38.4615 | % | ||
| Intermediate Tax Free Fund | 41.6667 | % | ||
| Intermediate Term Bond Fund | 38.4615 | % | ||
| International Fund | 30.0000 | % | ||
| International Select Fund | 30.0000 | % | ||
| Large Cap Growth Opportunities Fund | 47.0588 | % | ||
| Large Cap Select Fund | 53.3333 | % | ||
| Large Cap Value Fund | 53.3333 | % | ||
| Mid Cap Growth Opportunities Fund | 55.5556 | % | ||
| Mid Cap Index Fund | 28.5714 | % | ||
| Mid Cap Select Fund | 55.5556 | % | ||
| Mid Cap Value Fund | 55.5556 | % | ||
| Minnesota Intermediate Tax Free Fund | 45.4545 | % | ||
12
| Compensation | ||||
Fund | Percentage | |||
| Minnesota Tax Free Fund | 45.4545 | % | ||
| Missouri Tax Free Fund | 38.4615 | % | ||
| Nebraska Tax Free Fund | 45.4545 | % | ||
| Ohio Tax Free Fund | 38.4615 | % | ||
| Oregon Intermediate Tax Free Fund | 45.4545 | % | ||
| Quantitative Large Cap Core Fund | 50.0000 | % | ||
| Real Estate Securities Fund | 50.0000 | % | ||
| Short Tax Free Fund | 44.4444 | % | ||
| Short Term Bond Fund | 40.0000 | % | ||
| Small Cap Growth Opportunities Fund | 50.0000 | % | ||
| Small Cap Index Fund | 42.8571 | % | ||
| Small Cap Select Fund | 55.5556 | % | ||
| Small Cap Value Fund | 55.5556 | % | ||
| Tactical Market Opportunities Fund | 50.0000 | % | ||
| Tax Free Fund | 41.6667 | % | ||
| Total Return Bond Fund | 46.1538 | % | ||
13
14
15
Sub-Advisor | Fund | |
| Altrinsic Global Advisors, LLC | International Fund, International Select Fund | |
| Hansberger Global Investors, Inc. | International Fund, International Select Fund | |
| Lazard Asset Management, LLC | International Select Fund |
16
17
| Aggregate Assets of | ||
Sub-Advisory Portfolio Assets | Fee Per Annum | |
| First $150 Million | 0.45% | |
| Next $350 Million | 0.37% | |
| Over $500 Million | 0.35% |
| Aggregate Assets of | ||
Sub-Advisory Portfolios | Fee Per Annum | |
| First $425 Million | 0.40% | |
| Over $425 Million | 0.30% |
Sub-Advisory Portfolio Assets | Fee Per Annum | |
| First $112.5 million | 0.75% | |
| Next $37.5 Million | 0.70% | |
| Next $37.5 Million | 0.65% | |
| Over $187.5 Million | 0.60% |
18
19
20
| Position(s) | Term of | Number of | |||||||||
| Proposed to | Office and | Nuveen-Affiliate | Public Directorships | ||||||||
| Name, Address | Be Held with | Length of | Principal Occupation(s) | Advised Funds | Held During Past | ||||||
(Year of Birth) | Each Fund | Time Served | During Past Five Years | to Be Overseen** | Five Years | ||||||
| Robert P. Bremner† (1940) | Director | N/A* | Private Investor and Management Consultant; Treasurer and Director, Humanities Council, Washington, D.C. | [246]*** | N/A | ||||||
| Jack B. Evans† (1948) | Director | N/A* | President, The Hall-Perrine Foundation, a private philanthropic corporation (since 1996); Director and Chairman, United Fire Group, a publicly held company; President Pro Tem of the Board of Regents for the State of Iowa University System; Director, Gazette Companies; Life Trustee of Coe College and the Iowa College Foundation; formerly, Director, Alliant Energy; formerly, Director, Federal Reserve Bank of Chicago; formerly, President and Chief Operating Officer, SCI Financial Group, Inc., a regional financial services firm. | [246] | See Principal Occupation Description | ||||||
| William C. Hunter† (1948) | Director | N/A* | Dean, Tippie College of Business, University of Iowa (since 2006); Director (since 2004) of Xerox Corporation; Director (since 2005) of Beta Gamma Sigma International Society; formerly, Dean and Distinguished Professor of Finance, School of Business at the University of Connecticut (2003-2006); formerly, Director (1997-2007), Credit Research Center at Georgetown University; formerly, Senior Vice President and Director of Research at the Federal Reserve Bank of Chicago (1995-2003). | [246] | See Principal Occupation Description | ||||||
| David J. Kundert† (1942) | Director | N/A* | Director, Northwestern Mutual Wealth Management Company; retired (since 2004) as Chairman, JPMorgan Fleming Asset Management, President and CEO, Banc One Investment Advisors Corporation, and President, One Group Mutual Funds; prior thereto, Executive Vice President, Bank One Corporation and Chairman and CEO, Banc One Investment Management Group; member of the Board of Regents, Luther College; member of the Wisconsin Bar Association; member of Board of Directors, Friends of Boerner Botanical Gardens; member of Board of Directors and Chair of the Investment Committee, Greater Milwaukee Foundation | [246]*** | See Principal Occupation Description | ||||||
21
| Position(s) | Term of | Number of | |||||||||
| Proposed to | Office and | Nuveen-Affiliate | Public Directorships | ||||||||
| Name, Address | Be Held with | Length of | Principal Occupation(s) | Advised Funds | Held During Past | ||||||
(Year of Birth) | Each Fund | Time Served | During Past Five Years | to Be Overseen** | Five Years | ||||||
| William J. Schneider† (1944) | Director | N/A* | Chairman of Miller-Valentine Partners Ltd., a real estate investment company; formerly, Senior Partner and Chief Operating Officer (retired) of Miller-Valentine Group; Member, University of Dayton Business School Advisory Council; Member, Mid-America Health System Board; formerly Member and Chair, Dayton Philharmonic Orchestra Board; formerly, Member, Business Advisory Council, Cleveland Federal Reserve Bank. | [246]*** | See Principal Occupation Description | ||||||
| Judith M. Stockdale† (1947) | Director | N/A* | Executive Director, Gaylord and Dorothy Donnelley Foundation (since 1994); prior thereto, Executive Director, Great Lakes Protection Fund (1990-1994). | [246]*** | N/A | ||||||
| Carole E. Stone† (1947) | Director | N/A* | Director, C2 Options Exchange, Incorporated (since 2009); Director, Chicago Board Options Exchange (since 2006); formerly, Commissioner, New York State Commission on Public Authority Reform (2005-2010); formerly, Chair, New York Racing Association Oversight Board (2005-2007). | [246]*** | See Principal Occupation Description | ||||||
| Virginia L. Stringer¥ (1944) | Director | Director of the Company’s Board since 1987* | Board member, Mutual Fund Directors Forum; Member, Governing Board, Investment Company Institute’s Independent Directors Council; governance consultant and non-profit board member; former Owner and President, Strategic Management Resources, Inc., a management consulting firm; previously held several executive positions in general management, marketing and human resources at IBM and The Pillsbury Company; Independent Director, First American Fund Complex since 1987 and Chair since 1997. | [246] | See Principal Occupation Description | ||||||
22
| Position(s) | Term of | Number of | |||||||||
| Proposed to | Office and | Nuveen-Affiliate | Public Directorships | ||||||||
| Name, Address | Be Held with | Length of | Principal Occupation(s) | Advised Funds | Held During Past | ||||||
(Year of Birth) | Each Fund | Time Served | During Past Five Years | to Be Overseen** | Five Years | ||||||
| Terence J. Toth† (1959) | Director | N/A* | Director, Legal & General Investment Management America, Inc. (since 2008); Managing Partner, Promus Capital (since 2008); formerly, CEO and President, Northern Trust Global Investments (2004-2007); Executive Vice President, Quantitative Management & Securities Lending (2000-2004); prior thereto, various positions with Northern Trust Company (since 1994); member: Goodman Theatre Board (since 2004) Chicago Fellowship Board (since 2005), University of Illinois Leadership Council Board (since 2007) and Catalyst Schools of Chicago Board (since 2008); formerly, member: Northern Trust Mutual Funds Board (2005-2007), Northern Trust Global Investments Board (2004-2007); Northern Trust Japan Board (2004-2007), Northern Trust Securities Inc. Board (2003-2007) and Northern Trust Hong Kong Board (1997-2004). | [246] | See Principal Occupation Description | ||||||
| Interested Nominee: | |||||||||||
| John P. Amboian‡† (1961) | Director | N/A* | Chief Executive Officer and Chairman (since 2007), Director (since 1999) of Nuveen Investments, Inc.; Chief Executive Officer (since 2007) of Nuveen Asset Management and Nuveen Investments Advisors, Inc. | [246] | See Principal Occupation Description | ||||||
| ¥ | The address of the Director Nominee isc/o FAF Advisors, 800 Nicolet Mall, Minneapolis, Minnesota 55402. | |
| † | The address of the Director Nominee isc/o Nuveen Investments, Inc., 333 West Wacker Drive, Chicago, IL 60606. | |
| * | Each Director Nominee will serve until his or her successor is elected and qualifies, or his or her earlier death, resignation or removal as provided in the Company’s Articles and Bylaws. | |
| ** | The disclosure in this column assumes that the New Advisory Agreement is approved for each Fund, and thus includes each of the 41 funds in the FAF fund complex that are a part of the Transaction and the Nuveen Funds. | |
| *** | Also serves as a trustee of the Nuveen Diversified Commodity Fund, an exchange-traded commodity pool managed by Nuveen Commodities Asset Management, LLC, an affiliate of Nuveen Asset Management. | |
| ‡ | “Interested person,” as defined in the 1940 Act, of the Nuveen-sponsored funds by reason of being an officer of Nuveen. |
23
24
25
26
| Committee Function | Committee Members | |||
| Audit Committee | The purposes of the Committee are (1) to oversee the Funds’ accounting and financial reporting policies and practices, their internal controls and, as appropriate, the internal controls of certain service providers; (2) to oversee the quality of the Funds’ financial statements and the independent audit thereof; (3) to assist Board oversight of the Funds’ compliance with legal and regulatory requirements; and (4) to act as a liaison between the Funds’ independent auditors and the full Board of Directors. The Audit Committee, together with the Board of Directors, has the ultimate authority and responsibility to select, evaluate and, where appropriate, replace the outside auditor (or to nominate the outside auditor to be proposed for stockholder approval in any proxy statement). The Funds have adopted an Audit Committee Charter which is attached asExhibit K. | Leonard W. Kedrowski (Chair) Benjamin R. Field III John P. Kayser Richard K. Riederer Virginia L. Stringer (ex-officio) | ||
| Pricing Committee | The Committee is responsible for valuing portfolio securities for which market quotations are not readily available, pursuant to procedures established by the Board of Directors. | Roger A. Gibson (Chair) James M. Wade Benjamin R. Field III Virginia L. Stringer (ex-officio) | ||
| Governance Committee | The Committee has responsibilities relating to (1) Board and Committee composition; (2) Committee structure; (3) director education; and (4) governance practices. The Governance Committee Charter is attached asExhibit L. | Joseph D. Strauss (Chair) James M. Wade Victoria J. Herget Virginia L. Stringer (ex-officio) |
27
| • | the name, address, and business, educational,and/or other pertinent background of the person being recommended; | |
| • | a statement concerning whether the person is “independent” within the meaning of New York Stock Exchange and American Stock Exchange listing standards, and is not an “interested person” of the Company, as that term is defined in the 1940 Act; | |
| • | any other information that the Fund would be required to include in a proxy statement concerning the person if he or she were nominated; and | |
| • | the name and address of the person submitting the recommendation, together with the number of Fund shares held by such person and the period for which the shares have been held. |
28
29
30
31
| • | $1,000 for attending the first day of an in-person Board of Directors meeting ($1,500 in the case of the Chair); | |
| • | $2,000 for attending the second day of an in-person Board of Directors meeting ($3,000 in the case of the Chair); | |
| • | $1,000 for attending the third day of an in-person Board of Directors meeting ($1,500 in the case of the Chair), assuming the third day ends no later than early afternoon; and | |
| • | $500 for in-person attendance at any committee meeting ($750 in the case of the Chair of each committee). |
32
33
34
35
36
MANAGEMENT AGREEMENT
BETWEEN
NUVEEN ASSET MANAGEMENT
A-1
A-2
A-3
A-4
| BY |
| BY |
A-5
MANAGEMENT AGREEMENT
Fund | Effective Date | Initial Term | ||
| California Tax Free Fund | ||||
| Colorado Tax Free Fund | ||||
| Core Bond Fund | ||||
| Equity Income Fund | ||||
| Equity Index Fund | ||||
| Global Infrastructure Fund | ||||
| High Income Bond Fund | ||||
| Inflation Protected Securities Fund | ||||
| Intermediate Government Bond Fund | ||||
| Intermediate Tax Free Fund | ||||
| Intermediate Term Bond Fund | ||||
| International Fund | ||||
| International Select Fund | ||||
| Large Cap Growth Opportunities Fund | ||||
| Large Cap Select Fund | ||||
| Large Cap Value Fund | ||||
| Mid Cap Growth Opportunities Fund | ||||
| Mid Cap Index Fund | ||||
| Mid Cap Select Fund | ||||
| Mid Cap Value Fund | ||||
| Minnesota Intermediate Municipal Bond Fund | ||||
| Minnesota Municipal Bond Fund | ||||
| Missouri Tax Free Fund | ||||
| Nebraska Municipal Bond Fund | ||||
| Ohio Tax Free Fund | ||||
| Oregon Intermediate Municipal Bond Fund | ||||
| Quantitative Large Cap Core Fund | ||||
| Real Estate Securities Fund | ||||
| Short Tax Free Fund | ||||
| Short Term Bond Fund | ||||
| Small Cap Growth Opportunities Fund | ||||
| Small Cap Index Fund | ||||
| Small Cap Select Fund | ||||
| Small Cap Value Fund | ||||
| Tactical Market Opportunities Fund | ||||
| Tax Free Fund | ||||
| Total Return Bond Fund |
A-6
MANAGEMENT AGREEMENT
| Assets of | ||||||||||||||||||||||||
| First | Next | Next | Next | Next | $2 Billion | |||||||||||||||||||
Fund | $125 Million | $125 Million | $250 Million | $500 Million | $1 Billion | or More | ||||||||||||||||||
| California Tax Free Fund | 0.45 | % | 0.4375 | % | 0.4250 | % | 0.4125 | % | 0.4000 | % | 0.3750 | % | ||||||||||||
| Colorado Tax Free Fund | 0.45 | % | 0.4375 | % | 0.4250 | % | 0.4125 | % | 0.4000 | % | 0.3750 | % | ||||||||||||
| Core Bond Fund | 0.45 | % | 0.4375 | % | 0.4250 | % | 0.4125 | % | 0.4000 | % | 0.3750 | % | ||||||||||||
| Equity Income Fund | 0.60 | % | 0.5875 | % | 0.5750 | % | 0.5625 | % | 0.5500 | % | 0.5250 | % | ||||||||||||
| Equity Index Fund | 0.10 | % | 0.0875 | % | 0.0750 | % | 0.0625 | % | 0.0500 | % | 0.0250 | % | ||||||||||||
| Global Infrastructure Fund | 0.75 | % | 0.7375 | % | 0.7250 | % | 0.7125 | % | 0.7000 | % | 0.6750 | % | ||||||||||||
| High Income Bond Fund | 0.60 | % | 0.5875 | % | 0.5750 | % | 0.5625 | % | 0.5500 | % | 0.5250 | % | ||||||||||||
| Inflation Protected Securities Fund | 0.45 | % | 0.4375 | % | 0.4250 | % | 0.4125 | % | 0.4000 | % | 0.3750 | % | ||||||||||||
| Intermediate Government Bond Fund | 0.45 | % | 0.4375 | % | 0.4250 | % | 0.4125 | % | 0.4000 | % | 0.3750 | % | ||||||||||||
| Intermediate Tax Free Fund | 0.40 | % | 0.3875 | % | 0.3750 | % | 0.3625 | % | 0.3500 | % | 0.3250 | % | ||||||||||||
| Intermediate Term Bond Fund | 0.45 | % | 0.4375 | % | 0.4250 | % | 0.4125 | % | 0.4000 | % | 0.3750 | % | ||||||||||||
| International Fund | 0.85 | % | 0.8375 | % | 0.8250 | % | 0.8125 | % | 0.8000 | % | 0.7750 | % | ||||||||||||
| International Select Fund | 0.85 | % | 0.8375 | % | 0.8250 | % | 0.8125 | % | 0.8000 | % | 0.7750 | % | ||||||||||||
| Large Cap Growth Opportunities Fund | 0.65 | % | 0.6375 | % | 0.6250 | % | 0.6125 | % | 0.6000 | % | 0.5750 | % | ||||||||||||
| Large Cap Select Fund | 0.55 | % | 0.5375 | % | 0.5250 | % | 0.5125 | % | 0.5000 | % | 0.4750 | % | ||||||||||||
| Large Cap Value Fund | 0.55 | % | 0.5375 | % | 0.5250 | % | 0.5125 | % | 0.5000 | % | 0.4750 | % | ||||||||||||
| Mid Cap Growth Opportunities Fund | 0.70 | % | 0.6875 | % | 0.6750 | % | 0.6625 | % | 0.6500 | % | 0.6250 | % | ||||||||||||
| Mid Cap Index Fund | 0.15 | % | 0.1375 | % | 0.1250 | % | 0.1125 | % | 0.1000 | % | 0.0750 | % | ||||||||||||
| Mid Cap Select Fund | 0.70 | % | 0.6875 | % | 0.6750 | % | 0.6625 | % | 0.6500 | % | 0.6250 | % | ||||||||||||
| Mid Cap Value Fund | 0.70 | % | 0.6875 | % | 0.6750 | % | 0.6625 | % | 0.6500 | % | 0.6250 | % | ||||||||||||
| Minnesota Intermediate Municipal Bond Fund | 0.35 | % | 0.3375 | % | 0.3250 | % | 0.3125 | % | 0.3000 | % | 0.2750 | % | ||||||||||||
| Minnesota Municipal Bond Fund | 0.35 | % | 0.3375 | % | 0.3250 | % | 0.3125 | % | 0.3000 | % | 0.2750 | % | ||||||||||||
| Missouri Tax Free Fund | 0.45 | % | 0.4375 | % | 0.4250 | % | 0.4125 | % | 0.4000 | % | 0.3750 | % | ||||||||||||
| Nebraska Municipal Bond Fund | 0.35 | % | 0.3375 | % | 0.3250 | % | 0.3125 | % | 0.3000 | % | 0.2750 | % | ||||||||||||
| Ohio Tax Free Fund | 0.45 | % | 0.4375 | % | 0.4250 | % | 0.4125 | % | 0.4000 | % | 0.3750 | % | ||||||||||||
| Oregon Intermediate Municipal Bond Fund | 0.35 | % | 0.3375 | % | 0.3250 | % | 0.3125 | % | 0.3000 | % | 0.2750 | % | ||||||||||||
| Quantitative Large Cap Core Fund | 0.30 | % | 0.2875 | % | 0.2750 | % | 0.2625 | % | 0.2500 | % | 0.2250 | % | ||||||||||||
| Real Estate Securities Fund | 0.70 | % | 0.6875 | % | 0.6750 | % | 0.6625 | % | 0.6500 | % | 0.6250 | % | ||||||||||||
| Short Tax Free Fund | 0.25 | % | 0.2375 | % | 0.2250 | % | 0.2125 | % | 0.2000 | % | 0.1750 | % | ||||||||||||
| Short Term Bond Fund | 0.30 | % | 0.2875 | % | 0.2750 | % | 0.2625 | % | 0.2500 | % | 0.2250 | % | ||||||||||||
| Small Cap Growth Opportunities Fund | 0.80 | % | 0.7875 | % | 0.7750 | % | 0.7625 | % | 0.7500 | % | 0.7250 | % | ||||||||||||
A-7
| Assets of | ||||||||||||||||||||||||
| First | Next | Next | Next | Next | $2 Billion | |||||||||||||||||||
Fund | $125 Million | $125 Million | $250 Million | $500 Million | $1 Billion | or More | ||||||||||||||||||
| Small Cap Index Fund | 0.15 | % | 0.1375 | % | 0.1250 | % | 0.1125 | % | 0.1000 | % | 0.0750 | % | ||||||||||||
| Small Cap Select Fund | 0.70 | % | 0.6875 | % | 0.6750 | % | 0.6625 | % | 0.6500 | % | 0.6250 | % | ||||||||||||
| Small Cap Value Fund | 0.70 | % | 0.6875 | % | 0.6750 | % | 0.6625 | % | 0.6500 | % | 0.6250 | % | ||||||||||||
| Tactical Market Opportunities Fund | 0.60 | % | 0.5875 | % | 0.5750 | % | 0.5625 | % | 0.5500 | % | 0.5250 | % | ||||||||||||
| Tax Free Fund | 0.40 | % | 0.3875 | % | 0.3750 | % | 0.3625 | % | 0.3500 | % | 0.3250 | % | ||||||||||||
| Total Return Bond Fund | 0.45 | % | 0.4375 | % | 0.4250 | % | 0.4125 | % | 0.4000 | % | 0.3750 | % | ||||||||||||
| Complex-Level Asset | Effective Rate | |||
Breakpoint Level | at Breakpoint Level | |||
| ($ billion) | (%) | |||
| 55 | 0.2000 | |||
| 56 | 0.1996 | |||
| 57 | 0.1989 | |||
| 60 | 0.1961 | |||
| 63 | 0.1931 | |||
| 66 | 0.1900 | |||
| 71 | 0.1851 | |||
| 76 | 0.1806 | |||
| 80 | 0.1773 | |||
| 91 | 0.1691 | |||
| 125 | 0.1599 | |||
| 200 | 0.1505 | |||
| 250 | 0.1469 | |||
| 300 | 0.1445 | |||
A-8
A-9
Dated: , 20 | ||
| ATTEST | ||
By: Vice President | ||
| ATTEST | NUVEEN ASSET MANAGEMENT | |
By: Managing Director |
A-10
INVESTMENTSUB-ADVISORY AGREEMENT
B-1
B-2
B-3
| If to Manager: | If to Sub-Advisor: | |
| Nuveen Asset Management 333 West Wacker Drive Chicago, Illinois 60606 Attention: [Mr. John P. Amboian] | Nuveen Asset Management, LLC 333 West Wacker Drive Chicago, Illinois 60606 Attention: Mr. William T. Huffman | |
| With a copy to: | ||
| Nuveen Investments, Inc. 333 West Wacker Drive Chicago, Illinois 60606 Attention: General Counsel |
| NUVEEN ASSET MANAGEMENT a Delaware corporation | NUVEEN ASSET MANAGEMENT, LLC, a Delaware limited liability company | |
| By: | By: | |
| Title: | Title: |
B-4
| Compensation | ||||||||
Fund | Effective Date | Period End | Percentage | |||||
| California Tax Free Fund | 38.4615 | % | ||||||
| Colorado Tax Free Fund | 38.4615 | % | ||||||
| Core Bond Fund | 38.4615 | % | ||||||
| Equity Income Fund | 50.0000 | % | ||||||
| Equity Index Fund | 33.3333 | % | ||||||
| Global Infrastructure Fund | 57.8947 | % | ||||||
| High Income Bond Fund | 50.0000 | % | ||||||
| Inflation Protected Securities Fund | 38.4615 | % | ||||||
| Intermediate Government Bond Fund | 38.4615 | % | ||||||
| Intermediate Tax Free Fund | 41.6667 | % | ||||||
| Intermediate Term Bond Fund | 38.4615 | % | ||||||
| International Fund | 52.3810 | % | ||||||
| International Select Fund | 30.0000 | % | ||||||
| Large Cap Growth Opportunities Fund | 30.0000 | % | ||||||
| Large Cap Select Fund | 53.3333 | % | ||||||
| Large Cap Value Fund | 53.3333 | % | ||||||
| Mid Cap Growth Opportunities Fund | 55.5556 | % | ||||||
| Mid Cap Index Fund | 28.5714 | % | ||||||
| Mid Cap Select Fund | 55.5556 | % | ||||||
| Mid Cap Value Fund | 55.5556 | % | ||||||
| Minnesota Intermediate Tax Free Fund | 45.4545 | % | ||||||
| Minnesota Tax Free Fund | 45.4545 | % | ||||||
| Missouri Tax Free Fund | 38.4615 | % | ||||||
| Nebraska Tax Free Fund | 45.4545 | % | ||||||
| Ohio Tax Free Fund | 38.4615 | % | ||||||
| Oregon Intermediate Tax Free Fund | 45.4545 | % | ||||||
| Quantitative Large Cap Core Fund | 50.0000 | % | ||||||
| Real Estate Securities Fund | 50.0000 | % | ||||||
| Short Tax Free Fund | 44.4444 | % | ||||||
| Short Term Bond Fund | 40.0000 | % | ||||||
| Small Cap Growth Opportunities Fund | 50.0000 | % | ||||||
| Small Cap Index Fund | 42.8571 | % | ||||||
| Small Cap Select Fund | 55.5556 | % | ||||||
| Small Cap Value Fund | 55.5556 | % | ||||||
| Tactical Market Opportunities Fund | 50.0000 | % | ||||||
| Tax Free Fund | 41.6667 | % | ||||||
| Total Return Bond Fund | 46.1538 | % | ||||||
B-5
INVESTMENTSUB-ADVISORY AGREEMENT
Nuveen Investment Funds, Inc.
International Fund
International Select Fund
C-1
C-2
C-3
C-4
C-5
C-6
| By: |
| Name: |
| Title: |
| By: |
| Name: |
| Title: |
C-7
Aggregate Assets of Sub-Advisory Portfolios | Fee Per Annum | |||
| First $150 million | 0.45 | % | ||
| Next $350 million | 0.37 | % | ||
| Over $500 million | 0.35 | % | ||
C-8
INVESTMENTSUB-ADVISORY AGREEMENT
Nuveen Investment Funds, Inc.
International Fund
C-9
C-10
C-11
C-12
C-13
C-14
| By: |
| Name: |
| Title: |
| By: |
| Name: |
| Title: |
C-15
Aggregate Assets of Sub-Advisory Portfolios | Fee Per Annum | |||
| First $425 million | 0.40 | % | ||
| Over $425 million | 0.30 | % | ||
C-16
INVESTMENTSUB-ADVISORY AGREEMENT
C-17
C-18
C-19
C-20
C-21
C-22
| By: |
| Name: |
| Title: |
| By: |
| Name: |
| Title: |
C-23
Sub-Advisory Portfolio Assets | Fee Per Annum | |||
| First $112.5 million | 0.75 | % | ||
| Next $37.5 million | 0.70 | % | ||
| Next $37.5 million | 0.65 | % | ||
| Over $187.5 million | 0.60 | % | ||
C-24
| Effective Date of | Date Last Approved | Date Last Approved | ||||
Fund Name | Agreement | by Stockholders | by Board | |||
| California Tax Free Fund | February 1, 2000 | February 1, 2000 | June 17, 2010 | |||
| Colorado Tax Free Fund | February 1, 2000 | February 1, 2000 | June 17, 2010 | |||
| Core Bond Fund | April 2, 1991 | April 2, 1991 | June 17, 2010 | |||
| Equity Income Fund | January 31, 1994 | January 31, 1994 | June 17, 2010 | |||
| Equity Index Fund | September 15, 1992 | September 15, 1992 | June 17, 2010 | |||
| Global Infrastructure Fund | December 5, 2007 | December 14, 2007 | June 17, 2010 | |||
| High Income Bond Fund | February 28, 2001 | August 30, 2001 | June 17, 2010 | |||
| Inflation Protected Securities Fund | October 1, 2004 | October 1, 2004 | June 17, 2010 | |||
| Intermediate Government Bond Fund | October 25, 2002 | October 25, 2002 | June 17, 2010 | |||
| Intermediate Tax Free Fund | April 2, 1991 | April 2, 1991 | June 17, 2010 | |||
| Intermediate Term Bond Fund | September 15, 1992 | September 15, 1992 | June 17, 2010 | |||
| International Fund | December 31, 1993 | April 4, 1994 | June 17, 2010 | |||
| International Select Fund | December 20, 2006 | December 19, 2006 | June 17, 2010 | |||
| Large Cap Growth Opportunities Fund | May 2, 2001 | August 31, 2001 | June 17, 2010 | |||
| Large Cap Select Fund | December 4, 2002 | January 31, 2003 | June 17, 2010 | |||
| Large Cap Value Fund | April 2, 1991 | April 2, 1991 | June 17, 2010 | |||
| Mid Cap Growth Opportunities Fund | May 2, 2001 | August 31, 2001 | June 17, 2010 | |||
| Mid Cap Index Fund | May 2, 2001 | August 31, 2001 | June 17, 2010 | |||
| Mid Cap Select Fund | December 31, 1993 | April 4, 1994 | June 17, 2010 | |||
| Mid Cap Value Fund | April 2, 1991 | April 2, 1991 | June 17, 2010 | |||
| Minnesota Intermediate Tax Free Fund | December 31, 1993 | February 25, 1994 | June 17, 2010 | |||
| Minnesota Tax Free Fund | July 24, 1998 | July 10, 1998 | June 17, 2010 | |||
| Missouri Tax Free Fund | May 2, 2001 | August 31, 2001 | June 17, 2010 | |||
| Nebraska Tax Free Fund | February 28, 2001 | February 28, 2001 | June 17, 2010 | |||
| Ohio Tax Free Fund | April 30, 2002 | April 30, 2002 | June 17, 2010 | |||
| Oregon Intermediate Tax Free Fund | August 5, 1997 | August 8, 2007 | June 17, 2010 | |||
| Quantitative Large Cap Core Fund | June 20, 2007 | July 30, 2007 | June 17, 2010 | |||
| Real Estate Securities Fund | June 12, 1995 | June 30, 1995 | June 17, 2010 | |||
| Short Tax Free Fund | October 25, 2002 | October 25, 2002 | June 17, 2010 | |||
| Short Term Bond Fund | September 15, 1992 | September 15, 1992 | June 17, 2010 | |||
| Small Cap Growth Opportunities Fund | May 2, 2001 | August 31, 2001 | June 17, 2010 | |||
| Small Cap Index Fund | May 2, 2001 | August 31, 2001 | June 17, 2010 | |||
| Small Cap Select Fund | May 2, 2001 | August 31, 2001 | June 17, 2010 | |||
| Small Cap Value Fund | November 21, 1997 | October 31, 1997 | June 17, 2010 | |||
| Tactical Market Opportunities Fund | September 16, 2009 | December 29, 2009 | June 17, 2010 | |||
| Tax Free Fund | July 24, 1998 | July 10, 1998 | June 17, 2010 | |||
| Total Return Bond Fund | February 1, 2000 | February 1, 2000 | June 17, 2010 |
Exhibit A-1
| Effective Date of | Date Last Approved | Date Last Approved | ||||
| Agreement | by Stockholders | by Board | ||||
Sub-Advisory Agreement with Altrinsic Global Advisors, LLC for International Select Fund | November 27, 2006 | December 19, 2006 | June 17, 2010 | |||
Sub-Advisory Agreement with Altrinsic Global Advisors, LLC for International Fund | November 3, 2008 | September 18, 2008 | June 17, 2010 | |||
Sub-Advisory Agreement with Hansberger Global Investors, Inc. for International Select Fund | February 22, 2007 | May 17, 2007 | June 17, 2010 | |||
Sub-Advisory Agreement with Hansberger Global Investors, Inc. for International Fund | November 3, 2008 | September 18, 2008 | June 17, 2010 | |||
Sub-Advisory Agreement with Lazard Asset Management, LLC for International Select Fund | November 27, 2006 | December 19, 2006 | June 17, 2010 |
Exhibit A-2
Fund | Nuveen Funds with similar investment objective and policies | |
| Equity Income Fund | Nuveen NWQ Equity Income Fund Nuveen Santa Barbara Dividend Growth Fund | |
| Large Cap Growth Opportunities Fund, Large Cap Select Fund, & Large Cap Value Fund | Nuveen NWQ Large-Cap Value Fund, Nuveen Symphony Large-Cap Growth Fund, Nuveen Winslow Large-Cap Growth Fund, Nuveen Symphony Large-Cap Value Fund, Nuveen Multi-Manager Large-Cap Value Fund, Nuveen Santa Barbara Growth Fund, & Nuveen Symphony Optimized Alpha Fund | |
| Mid Cap Growth Opportunities Fund, Mid Cap Select Fund, & Mid Cap Value Fund | Nuveen Symphony Mid-Cap Core Fund, Nuveen NWQ Small/Mid Cap Value Fund, Nuveen Symphony Small/Mid Cap Core Fund, & Nuveen NWQ Multi-Cap Value Fund | |
| Small Cap Growth Opportunities Fund, Small Cap Select Fund, & Small Cap Value Fund, | Nuveen NWQ Small-Cap Value Fund | |
| International Fund, & International Select Fund | Nuveen Tradewinds International Value Fund, Nuveen Santa Barbara Global Equity Fund, Nuveen Tradewinds Global All-Cap Fund, Nuveen Santa International Equity Fund, Nuveen Tradewinds Value Opportunities Fund, Nuveen Symphony International Equity Fund, Nuveen Tradewinds Japan Fund, Nuveen Tradewinds Emerging Markets Fund, & Nuveen Tradewinds Global Flexible Allocation Fund | |
| Global Infrastructure Fund | Nuveen Tradewinds Global Resources Fund | |
| Real Estate Securities Fund, Tactical Market Opportunities Fund | Nuveen Santa Barbara Ecologic Equity Fund, Nuveen Santa Barbara Growth Plus Fund, Nuveen Tradewinds Global All-Cap Plus Fund, & Nuveen NWQ Preferred Securities Fund | |
| Quantitative Large Cap Core Fund, Equity Index Fund, Small Cap Index Fund, & Mid Cap Index Fund | Nuveen U.S. Equity Completeness Fund, Nuveen Enhanced Core Equity Fund, & Nuveen Enhanced Mid-Cap Fund | |
| Short Term Bond Fund, Core Bond Fund, High Income Bond Fund, Intermediate Term Bond Fund, Inflation Protected Securities Fund, & Total Return Bond Fund | Nuveen Short Duration Bond Fund, Nuveen Multi-Strategy Core Bond Fund Nuveen High Yield Bond Fund, Nuveen Preferred Securities Fund, & Nuveen Symphony Credit Opportunities Fund |
Exhibit B-1
Fund | Nuveen Funds with similar investment objective and policies | |
| Short Tax Free Fund, Intermediate Tax Free Fund, Tax Free Fund, Intermediate Government Bond Fund California Tax Free Fund, Colorado Tax Free Fund, Minnesota Intermediate Tax Free Fund, Minnesota Tax Free Fund. Missouri Tax Free Fund, Nebraska Tax Free Fund, Ohio Tax Free Fund, & Oregon Intermediate Tax Free Fund | Nuveen Limited Term Municipal Bond Fund, Nuveen All-American Municipal Bond Fund Nuveen High Yield Municipal Bond Fund, & Nuveen Intermediate Duration Municipal Bond Fund Nuveen Arizona Municipal Bond Fund Nuveen Colorado Municipal Bond Fund Nuveen Florida Preference Municipal Bond Fund Nuveen Maryland Municipal Bond Fund Nuveen New Mexico Municipal Bond Fund Nuveen Pennsylvania Municipal Bond Fund Nuveen Virginia Municipal Bond Fund Nuveen California High Yield Municipal Bond Fund Nuveen California Insured Municipal Bond Fund Nuveen California Municipal Bond Fund Nuveen Connecticut Municipal Bond Fund Nuveen Massachusetts Insured Municipal Bond Fund Nuveen Massachusetts Municipal Bond Fund Nuveen New Jersey Municipal Bond Fund Nuveen New York Insured Municipal Bond Fund Nuveen New York Municipal Bond Fund Nuveen Georgia Municipal Bond Fund Nuveen Louisiana Municipal Bond Fund Nuveen North Carolina Municipal Bond Fund Nuveen Tennessee Municipal Fund Nuveen Kansas Municipal Bond Fund Nuveen Kentucky Municipal Bond Fund Nuveen Michigan Municipal Bond Fund Nuveen Missouri Municipal Bond Fund Nuveen Ohio Municipal Bond Fund Nuveen Wisconsin Municipal Bond Fund |
| Management Fee Schedules | ||||||||||
| Fund Managed Assets as of | Percentage of | Fund-level Fee | ||||||||
Nuveen Fund | September 30, 2010 | Managed Assets | Rate | |||||||
Mutual Funds | ||||||||||
(A) Equity Income | ||||||||||
| Nuveen NWQ Equity Income Fund | $ | 1,093,996 | For the first $125 million | 0.5000 | % | |||||
| For the next $125 million | 0.4875 | % | ||||||||
| For the next $250 million | 0.4750 | % | ||||||||
| For the next $500 million | 0.4625 | % | ||||||||
| For the next $1 billion | 0.4500 | % | ||||||||
| For net assets over $2 billion | 0.4250 | % | ||||||||
| Nuveen Santa Barbara Dividend Growth Fund | $ | 119,160,688 | For the first $125 million | 0.5000 | % | |||||
| For the next $125 million | 0.4875 | % | ||||||||
| For the next $250 million | 0.4750 | % | ||||||||
| For the next $500 million | 0.4625 | % | ||||||||
| For the next $1 billion | 0.4500 | % | ||||||||
| For net assets over $2 billion | 0.4250 | % | ||||||||
Exhibit B-2
| Management Fee Schedules | ||||||||||
| Fund Managed Assets as of | Percentage of | Fund-level Fee | ||||||||
Nuveen Fund | September 30, 2010 | Managed Assets | Rate | |||||||
(B) Large Cap | ||||||||||
| Nuveen NWQ Large-Cap Value Fund | $ | 284,994,807 | For the first $125 million | 0.5500 | % | |||||
| For the next $125 million | 0.5375 | % | ||||||||
| For the next $250 million | 0.5250 | % | ||||||||
| For the next $500 million | 0.5125 | % | ||||||||
| For the next $1 billion | 0.5000 | % | ||||||||
| For net assets over $2 billion | 0.4750 | % | ||||||||
| Nuveen Symphony Large-Cap Growth Fund | $ | 8,620,167 | For the first $125 million | 0.5000 | % | |||||
| For the next $125 million | 0.4875 | % | ||||||||
| For the next $250 million | 0.4750 | % | ||||||||
| For the next $500 million | 0.4625 | % | ||||||||
| For the next $1 billion | 0.4500 | % | ||||||||
| For net assets over $2 billion | 0.4250 | % | ||||||||
| Nuveen Winslow Large Cap Growth | $ | 32,307,325 | For the first $125 million | 0.5500 | % | |||||
| For the next $125 million | 0.5375 | % | ||||||||
| For the next $250 million | 0.5250 | % | ||||||||
| For the next $500 million | 0.5125 | % | ||||||||
| For the next $1 billion | 0.5000 | % | ||||||||
| For net assets over $2 billion | 0.4750 | % | ||||||||
| Nuveen Symphony Large Cap Value Fund | $ | 1,113,270 | For the first $125 million | 0.5000 | % | |||||
| For the next $125 million | 0.4875 | % | ||||||||
| For the next $250 million | 0.4750 | % | ||||||||
| For the next $500 million | 0.4625 | % | ||||||||
| For the next $1 billion | 0.4500 | % | ||||||||
| For net assets over $2 billion | 0.4250 | % | ||||||||
| Nuveen Multi-Manager Large-Cap Value Fund | $ | 318,988,663 | For the first $125 million | 0.5500 | % | |||||
| For the next $125 million | 0.5375 | % | ||||||||
| For the next $250 million | 0.5250 | % | ||||||||
| For the next $500 million | 0.5125 | % | ||||||||
| For the next $1 billion | 0.5000 | % | ||||||||
| For net assets over $2 billion | 0.4750 | % | ||||||||
| Nuveen Santa Barbara Growth Fund | $ | 37,956,702 | For the first $125 million | 0.5000 | % | |||||
| For the next $125 million | 0.4875 | % | ||||||||
| For the next $250 million | 0.4750 | % | ||||||||
| For the next $500 million | 0.4625 | % | ||||||||
| For the next $1 billion | 0.4500 | % | ||||||||
| For net assets over $2 billion | 0.4250 | % | ||||||||
Exhibit B-3
| Management Fee Schedules | ||||||||||
| Fund Managed Assets as of | Percentage of | Fund-level Fee | ||||||||
Nuveen Fund | September 30, 2010 | Managed Assets | Rate | |||||||
| Nuveen Symphony Optimized Alpha Fund | $ | 2,447,061 | For the first $125 million | 0.5000 | % | |||||
| For the next $125 million | 0.4875 | % | ||||||||
| For the next $250 million | 0.4750 | % | ||||||||
| For the next $500 million | 0.4625 | % | ||||||||
| For the next $1 billion | 0.4500 | % | ||||||||
| For net assets over $2 billion | 0.4250 | % | ||||||||
(C) Mid Cap/SMID | ||||||||||
| Nuveen Symphony Mid-Cap Core Fund | $ | 1,169,701 | For the first $125 million | 0.5500 | % | |||||
| For the next $125 million | 0.5375 | % | ||||||||
| For the next $250 million | 0.5250 | % | ||||||||
| For the next $500 million | 0.5125 | % | ||||||||
| For the next $1 billion | 0.5000 | % | ||||||||
| For net assets over $2 billion | 0.4750 | % | ||||||||
| Nuveen NWQ Small Mid/Cap Value Fund | $ | 12,434,838 | For the first $125 million | 0.6000 | % | |||||
| For the next $125 million | 0.5875 | % | ||||||||
| For the next $250 million | 0.5750 | % | ||||||||
| For the next $500 million | 0.5625 | % | ||||||||
| For the next $1 billion | 0.5500 | % | ||||||||
| For net assets over $2 billion | 0.5250 | % | ||||||||
| Nuveen Symphony Small-mid Cap Core Fund | $ | 989,448 | For the first $125 million | 0.6000 | % | |||||
| For the next $125 million | 0.5875 | % | ||||||||
| For the next $250 million | 0.5750 | % | ||||||||
| For the next $500 million | 0.5625 | % | ||||||||
| For the next $1 billion | 0.5500 | % | ||||||||
| For net assets over $2 billion | 0.5250 | % | ||||||||
| Nuveen NWQ Multi-Cap Value Fund | $ | 414,333,557 | For the first $125 million | 0.6300 | % | |||||
| For the next $125 million | 0.6175 | % | ||||||||
| For the next $250 million | 0.6050 | % | ||||||||
| For the next $500 million | 0.5925 | % | ||||||||
| For the next $1 billion | 0.5800 | % | ||||||||
| For net assets over $2 billion | 0.5550 | % | ||||||||
(D) Small Cap | ||||||||||
| Nuveen NWQ Small-Cap Value Fund | $ | 92,448,928 | For the first $125 million | 0.7500 | % | |||||
| For the next $125 million | 0.7375 | % | ||||||||
| For the next $250 million | 0.7250 | % | ||||||||
| For the next $500 million | 0.7125 | % | ||||||||
| For the next $1 billion | 0.7000 | % | ||||||||
| For net assets over $2 billion | 0.6750 | % | ||||||||
Exhibit B-4
| Management Fee Schedules | ||||||||||
| Fund Managed Assets as of | Percentage of | Fund-level Fee | ||||||||
Nuveen Fund | September 30, 2010 | Managed Assets | Rate | |||||||
(E) Global/International | ||||||||||
| Nuveen Tradewinds International Value Fund | $ | 1,221,043,204 | For the first $125 million | 0.6900 | % | |||||
| For the next $125 million | 0.6775 | % | ||||||||
| For the next $250 million | 0.6650 | % | ||||||||
| For the next $500 million | 0.6525 | % | ||||||||
| For the next $1 billion | 0.6400 | % | ||||||||
| For net assets over $2 billion | 0.6150 | % | ||||||||
| Nuveen Santa Barbara Global Equity Fund | $ | 1,476,532 | For the first $125 million | 0.6500 | % | |||||
| For the next $125 million | 0.6375 | % | ||||||||
| For the next $250 million | 0.6250 | % | ||||||||
| For the next $500 million | 0.6125 | % | ||||||||
| For the next $1 billion | 0.6000 | % | ||||||||
| For net assets over $2 billion | 0.5750 | % | ||||||||
| Nuveen Tradewinds Global All-Cap Fund | $ | 1,082,341,253 | For the first $125 million | 0.6900 | % | |||||
| For the next $125 million | 0.6775 | % | ||||||||
| For the next $250 million | 0.6650 | % | ||||||||
| For the next $500 million | 0.6525 | % | ||||||||
| For the next $1 billion | 0.6400 | % | ||||||||
| For net assets over $2 billion | 0.6150 | % | ||||||||
| Nuveen Santa Barbara International Equity Fund | $ | 1,610,940 | For the first $125 million | 0.6500 | % | |||||
| For the next $125 million | 0.6375 | % | ||||||||
| For the next $250 million | 0.6250 | % | ||||||||
| For the next $500 million | 0.6125 | % | ||||||||
| For the next $1 billion | 0.6000 | % | ||||||||
| For net assets over $2 billion | 0.5750 | % | ||||||||
| Nuveen Tradewinds Value Opportunities Fund | $ | 2,196,901,929 | For the first $125 million | 0.6300 | % | |||||
| For the next $125 million | 0.6175 | % | ||||||||
| For the next $250 million | 0.6050 | % | ||||||||
| For the next $500 million | 0.5925 | % | ||||||||
| For the next $1 billion | 0.5800 | % | ||||||||
| For net assets over $2 billion | 0.5550 | % | ||||||||
| Nuveen Symphony International Equity Fund | $ | 820,724 | For the first $125 million | 0.6000 | % | |||||
| For the next $125 million | 0.5875 | % | ||||||||
| For the next $250 million | 0.5750 | % | ||||||||
| For the next $500 million | 0.5625 | % | ||||||||
| For the next $1 billion | 0.5500 | % | ||||||||
| For net assets over $2 billion | 0.5250 | % | ||||||||
| Nuveen Tradewinds Japan Fund | $ | 4,350,886 | For the first $125 million | 0.7000 | % | |||||
Exhibit B-5
| Management Fee Schedules | ||||||||||
| Fund Managed Assets as of | Percentage of | Fund-level Fee | ||||||||
Nuveen Fund | September 30, 2010 | Managed Assets | Rate | |||||||
| For the next $125 million | 0.6875 | % | ||||||||
| For the next $250 million | 0.6750 | % | ||||||||
| For the next $500 million | 0.6625 | % | ||||||||
| For the next $1 billion | 0.6500 | % | ||||||||
| For net assets over $2 billion | 0.6250 | % | ||||||||
| Nuveen Tradewinds Emerging Markets Fund | $ | 24,819,308 | For the first $125 million | 1.0000 | % | |||||
| For the next $125 million | 0.9875 | % | ||||||||
| For the next $250 million | 0.9750 | % | ||||||||
| For the next $500 million | 0.9625 | % | ||||||||
| For the next $1 billion | 0.9500 | % | ||||||||
| For net assets over $2 billion | 0.9250 | % | ||||||||
| Nuveen Tradewinds Global Flexible Allocation Fund | $ | 1,065,860 | For the first $125 million | 0.7000 | % | |||||
| For the next $125 million | 0.6875 | % | ||||||||
| For the next $250 million | 0.6750 | % | ||||||||
| For the next $500 million | 0.6625 | % | ||||||||
| For the next $1 billion | 0.6500 | % | ||||||||
| For net assets over $2 billion | 0.6250 | % | ||||||||
(F) Global Resources | ||||||||||
| Nuveen Tradewinds Global Resources Fund | $ | 24,729,344 | For the first $125 million | 0.7000 | % | |||||
| For the next $125 million | 0.6875 | % | ||||||||
| For the next $250 million | 0.6750 | % | ||||||||
| For the next $500 million | 0.6625 | % | ||||||||
| For the next $1 billion | 0.6500 | % | ||||||||
| For net assets over $2 billion | 0.6250 | % | ||||||||
(G) Specialized Equity | ||||||||||
| Nuveen Santa Barbara EcoLogic Equity Fund | $ | 1,243,418 | For the first $125 million | 0.5000 | % | |||||
| For the next $125 million | 0.4875 | % | ||||||||
| For the next $250 million | 0.4750 | % | ||||||||
| For the next $500 million | 0.4625 | % | ||||||||
| For the next $1 billion | 0.4500 | % | ||||||||
| For net assets over $2 billion | 0.4250 | % | ||||||||
| Nuveen Santa Barbara Growth Plus Fund | $ | 1,231,014 | For the first $125 million | 0.8000 | % | |||||
| For the next $125 million | 0.7875 | % | ||||||||
| For the next $250 million | 0.7750 | % | ||||||||
| For the next $500 million | 0.7625 | % | ||||||||
| For the next $1 billion | 0.7500 | % | ||||||||
| For net assets over $2 billion | 0.7250 | % | ||||||||
| Nuveen Tradewinds Global All-Cap Plus Fund | $ | 30,561,697 | For the first $125 million | 0.9000 | % | |||||
Exhibit B-6
| Management Fee Schedules | ||||||||||
| Fund Managed Assets as of | Percentage of | Fund-level Fee | ||||||||
Nuveen Fund | September 30, 2010 | Managed Assets | Rate | |||||||
| For the next $125 million | 0.8875 | % | ||||||||
| For the next $250 million | 0.8750 | % | ||||||||
| For the next $500 million | 0.8625 | % | ||||||||
| For the next $1 billion | 0.8500 | % | ||||||||
| For net assets over $2 billion | 0.8250 | % | ||||||||
| Nuveen NWQ Preferred Securities Fund | $ | 2,255,479 | For the first $125 million | 0.5500 | % | |||||
| For the next $125 million | 0.5375 | % | ||||||||
| For the next $250 million | 0.5250 | % | ||||||||
| For the next $500 million | 0.5125 | % | ||||||||
| For the next $1 billion | 0.5000 | % | ||||||||
| For net assets over $2 billion | 0.4750 | % | ||||||||
(H) Quantitative Equity | ||||||||||
| Nuveen U.S. Equity Completeness Fund | $ | 6,903,100 | 0.3500 | % | ||||||
| Nuveen Enhanced Core Equity Fund | $ | 2,728,339 | For the first $125 million | 0.3000 | % | |||||
| For the next $125 million | 0.2875 | % | ||||||||
| For the next $250 million | 0.2750 | % | ||||||||
| For the next $500 million | 0.2625 | % | ||||||||
| For the next $1 billion | 0.2500 | % | ||||||||
| For net assets over $2 billion | 0.2250 | % | ||||||||
| Nuveen Enhanced Mid-Cap Fund | $ | 2,475,392 | For the first $125 million | 0.3500 | % | |||||
| For the next $125 million | 0.3375 | % | ||||||||
| For the next $250 million | 0.3250 | % | ||||||||
| For the next $500 million | 0.3125 | % | ||||||||
| For the next $1 billion | 0.3000 | % | ||||||||
| For net assets over $2 billion | 0.2750 | % | ||||||||
(I) Taxable Fixed Income | ||||||||||
| Nuveen Short Duration Bond Fund | $ | 186,886,127 | For the first $125 million | 0.2000 | % | |||||
| For the next $125 million | 0.1875 | % | ||||||||
| For the next $250 million | 0.1750 | % | ||||||||
| For the next $500 million | 0.1625 | % | ||||||||
| For the next $1 billion | 0.1500 | % | ||||||||
| For net assets over $2 billion | 0.1250 | % | ||||||||
| Nuveen Multi-Strategy Core Bond Fund | $ | 90,243,007 | For the first $125 million | 0.3000 | % | |||||
| For the next $125 million | 0.2875 | % | ||||||||
| For the next $250 million | 0.2750 | % | ||||||||
| For the next $500 million | 0.2625 | % | ||||||||
| For the next $1 billion | 0.2500 | % | ||||||||
| For net assets over $2 billion | 0.2250 | % | ||||||||
| Nuveen High Yield Bond Fund | $ | 146,120,010 | For the first $125 million | 0.4000 | % | |||||
Exhibit B-7
| Management Fee Schedules | ||||||||||
| Fund Managed Assets as of | Percentage of | Fund-level Fee | ||||||||
Nuveen Fund | September 30, 2010 | Managed Assets | Rate | |||||||
| For the next $125 million | 0.3875 | % | ||||||||
| For the next $250 million | 0.3750 | % | ||||||||
| For the next $500 million | 0.3625 | % | ||||||||
| For the next $1 billion | 0.3500 | % | ||||||||
| For net assets over $2 billion | 0.3250 | % | ||||||||
| Nuveen Preferred Securities Fund | $ | 637,000,228 | For the first $125 million | 0.5500 | % | |||||
| For the next $125 million | 0.5375 | % | ||||||||
| For the next $250 million | 0.5250 | % | ||||||||
| For the next $500 million | 0.5125 | % | ||||||||
| For the next $1 billion | 0.5000 | % | ||||||||
| For net assets over $2 billion | 0.4750 | % | ||||||||
| Nuveen Symphony Credit Opportunities Fund | $ | 23,275,175 | For the first $125 million | 0.4500 | % | |||||
| For the next $125 million | 0.4375 | % | ||||||||
| For the next $250 million | 0.4250 | % | ||||||||
| For the next $500 million | 0.4125 | % | ||||||||
| For the next $1 billion | 0.4000 | % | ||||||||
| For net assets over $2 billion | 0.3750 | % | ||||||||
(J) Municipal Income | ||||||||||
| Nuveen Limited Term Municipal Bond Fund | $ | 2,421,493,174 | For the first $125 million | 0.2500 | % | |||||
| For the next $125 million | 0.2375 | % | ||||||||
| For the next $250 million | 0.2250 | % | ||||||||
| For the next $500 million | 0.2125 | % | ||||||||
| For the next $1 billion | 0.2000 | % | ||||||||
| For the next $3 billion | 0.1750 | % | ||||||||
| For net assets over $5 billion | 0.1625 | % | ||||||||
| Nuveen Intermediate Duration Municipal Bond Fund | $ | 2,594,880,601 | For the first $125 million | 0.3000 | % | |||||
| For the next $125 million | 0.2875 | % | ||||||||
| For the next $250 million | 0.2750 | % | ||||||||
| For the next $500 million | 0.2625 | % | ||||||||
| For the next $1 billion | 0.2500 | % | ||||||||
| For the next $3 billion | 0.2250 | % | ||||||||
| For net assets over $5 billion | 0.2125 | % | ||||||||
NuveenAll-American Municipal Bond Fund | $ | 671,562,237 | For the first $125 million | 0.3000 | % | |||||
| For the next $125 million | 0.2875 | % | ||||||||
| For the next $250 million | 0.2750 | % | ||||||||
| For the next $500 million | 0.2625 | % | ||||||||
| For the next $1 billion | 0.2500 | % | ||||||||
| For the next $3 billion | 0.2250 | % | ||||||||
| For net assets over $5 billion | 0.2125 | % | ||||||||
Exhibit B-8
| Management Fee Schedules | ||||||||||
| Fund Managed Assets as of | Percentage of | Fund-level Fee | ||||||||
Nuveen Fund | September 30, 2010 | Managed Assets | Rate | |||||||
| Nuveen High Yield Municipal Bond Fund | $ | 5,552,150,181 | For the first $125 million | 0.4000 | % | |||||
| For the next $125 million | 0.3875 | % | ||||||||
| For the next $250 million | 0.3750 | % | ||||||||
| For the next $500 million | 0.3625 | % | ||||||||
| For the next $1 billion | 0.3500 | % | ||||||||
| For net assets over $2 billion | 0.3250 | % | ||||||||
| Nuveen Arizona Municipal Bond Fund | $ | 69,237,087 | For the first $125 million | 0.3500 | % | |||||
| For the next $125 million | 0.3375 | % | ||||||||
| For the next $250 million | 0.3250 | % | ||||||||
| For the next $500 million | 0.3125 | % | ||||||||
| For the next $1 billion | 0.3000 | % | ||||||||
| For the next $3 billion | 0.2750 | % | ||||||||
| For net assets over $5 billion | 0.2500 | % | ||||||||
| Nuveen California High Yield Municipal Bond Fund | $ | 133,153,255 | For the first $125 million | 0.4000 | % | |||||
| For the next $125 million | 0.3875 | % | ||||||||
| For the next $250 million | 0.3750 | % | ||||||||
| For the next $500 million | 0.3625 | % | ||||||||
| For the next $1 billion | 0.3500 | % | ||||||||
| For net assets over $2 billion | 0.3250 | % | ||||||||
| Nuveen California Insured Municipal Bond Fund | $ | 190,397,923 | For the first $125 million | 0.3500 | % | |||||
| For the next $125 million | 0.3375 | % | ||||||||
| For the next $250 million | 0.3250 | % | ||||||||
| For the next $500 million | 0.3125 | % | ||||||||
| For the next $1 billion | 0.3000 | % | ||||||||
| For the next $3 billion | 0.2750 | % | ||||||||
| For net assets over $5 billion | 0.2500 | % | ||||||||
| Nuveen California Municipal Bond Fund | $ | 308,846,273 | For the first $125 million | 0.3500 | % | |||||
| For the next $125 million | 0.3375 | % | ||||||||
| For the next $250 million | 0.3250 | % | ||||||||
| For the next $500 million | 0.3125 | % | ||||||||
| For the next $1 billion | 0.3000 | % | ||||||||
| For the next $3 billion | 0.2750 | % | ||||||||
| For net assets over $5 billion | 0.2500 | % | ||||||||
| Nuveen Colorado Municipal Bond Fund | $ | 46,199,527 | For the first $125 million | 0.3500 | % | |||||
| For the next $125 million | 0.3375 | % | ||||||||
| For the next $250 million | 0.3250 | % | ||||||||
| For the next $500 million | 0.3125 | % | ||||||||
| For the next $1 billion | 0.3000 | % | ||||||||
Exhibit B-9
| Management Fee Schedules | ||||||||||
| Fund Managed Assets as of | Percentage of | Fund-level Fee | ||||||||
Nuveen Fund | September 30, 2010 | Managed Assets | Rate | |||||||
| For the next $3 billion | 0.2750 | % | ||||||||
| For net assets over $5 billion | 0.2500 | % | ||||||||
| Nuveen Connecticut Municipal Bond Fund | $ | 362,646,011 | For the first $125 million | 0.3500 | % | |||||
| For the next $125 million | 0.3375 | % | ||||||||
| For the next $250 million | 0.3250 | % | ||||||||
| For the next $500 million | 0.3125 | % | ||||||||
| For the next $1 billion | 0.3000 | % | ||||||||
| For the next $3 billion | 0.2750 | % | ||||||||
| For net assets over $5 billion | 0.2500 | % | ||||||||
| Nuveen Florida Preference Municipal Bond Fund | $ | 181,870,285 | For the first $125 million | 0.3500 | % | |||||
| For the next $125 million | 0.3375 | % | ||||||||
| For the next $250 million | 0.3250 | % | ||||||||
| For the next $500 million | 0.3125 | % | ||||||||
| For the next $1 billion | 0.3000 | % | ||||||||
| For the next $3 billion | 0.2750 | % | ||||||||
| For net assets over $5 billion | 0.2500 | % | ||||||||
| Nuveen Georgia Municipal Bond Fund | $ | 192,619,050 | For the first $125 million | 0.3500 | % | |||||
| For the next $125 million | 0.3375 | % | ||||||||
| For the next $250 million | 0.3250 | % | ||||||||
| For the next $500 million | 0.3125 | % | ||||||||
| For the next $1 billion | 0.3000 | % | ||||||||
| For the next $3 billion | 0.2750 | % | ||||||||
| For net assets over $5 billion | 0.2500 | % | ||||||||
| Nuveen Kansas Municipal Bond Fund | $ | 185,552,069 | For the first $125 million | 0.3500 | % | |||||
| For the next $125 million | 0.3375 | % | ||||||||
| For the next $250 million | 0.3250 | % | ||||||||
| For the next $500 million | 0.3125 | % | ||||||||
| For the next $1 billion | 0.3000 | % | ||||||||
| For the next $3 billion | 0.2750 | % | ||||||||
| For net assets over $5 billion | 0.2500 | % | ||||||||
| Nuveen Kentucky Municipal Bond Fund | $ | 458,379,063 | For the first $125 million | 0.3500 | % | |||||
| For the next $125 million | 0.3375 | % | ||||||||
| For the next $250 million | 0.3250 | % | ||||||||
| For the next $500 million | 0.3125 | % | ||||||||
| For the next $1 billion | 0.3000 | % | ||||||||
| For the next $3 billion | 0.2750 | % | ||||||||
| For net assets over $5 billion | 0.2500 | % | ||||||||
| Nuveen Louisiana Municipal Bond Fund | $ | 100,323,969 | For the first $125 million | 0.3500 | % | |||||
Exhibit B-10
| Management Fee Schedules | ||||||||||
| Fund Managed Assets as of | Percentage of | Fund-level Fee | ||||||||
Nuveen Fund | September 30, 2010 | Managed Assets | Rate | |||||||
| For the next $125 million | 0.3375 | % | ||||||||
| For the next $250 million | 0.3250 | % | ||||||||
| For the next $500 million | 0.3125 | % | ||||||||
| For the next $1 billion | 0.3000 | % | ||||||||
| For the next $3 billion | 0.2750 | % | ||||||||
| For net assets over $5 billion | 0.2500 | % | ||||||||
| Nuveen Maryland Municipal Bond Fund | $ | 190,108,557 | For the first $125 million | 0.3500 | % | |||||
| For the next $125 million | 0.3375 | % | ||||||||
| For the next $250 million | 0.3250 | % | ||||||||
| For the next $500 million | 0.3125 | % | ||||||||
| For the next $1 billion | 0.3000 | % | ||||||||
| For the next $3 billion | 0.2750 | % | ||||||||
| For net assets over $5 billion | 0.2500 | % | ||||||||
| Nuveen Massachusetts Insured Municipal Bond Fund | $ | 90,968,194 | For the first $125 million | 0.3500 | % | |||||
| For the next $125 million | 0.3375 | % | ||||||||
| For the next $250 million | 0.3250 | % | ||||||||
| For the next $500 million | 0.3125 | % | ||||||||
| For the next $1 billion | 0.3000 | % | ||||||||
| For the next $3 billion | 0.2750 | % | ||||||||
| For net assets over $5 billion | 0.2500 | % | ||||||||
| Nuveen Massachusetts Municipal Bond Fund | $ | 140,310,500 | For the first $125 million | 0.3500 | % | |||||
| For the next $125 million | 0.3375 | % | ||||||||
| For the next $250 million | 0.3250 | % | ||||||||
| For the next $500 million | 0.3125 | % | ||||||||
| For the next $1 billion | 0.3000 | % | ||||||||
| For the next $3 billion | 0.2750 | % | ||||||||
| For net assets over $5 billion | 0.2500 | % | ||||||||
| Nuveen Michigan Municipal Bond Fund | $ | 211,450,877 | For the first $125 million | 0.3500 | % | |||||
| For the next $125 million | 0.3375 | % | ||||||||
| For the next $250 million | 0.3250 | % | ||||||||
| For the next $500 million | 0.3125 | % | ||||||||
| For the next $1 billion | 0.3000 | % | ||||||||
| For the next $3 billion | 0.2750 | % | ||||||||
| For net assets over $5 billion | 0.2500 | % | ||||||||
| Nuveen Missouri Municipal Bond Fund | $ | 248,484,931 | For the first $125 million | 0.3500 | % | |||||
| For the next $125 million | 0.3375 | % | ||||||||
| For the next $250 million | 0.3250 | % | ||||||||
| For the next $500 million | 0.3125 | % | ||||||||
| For the next $1 billion | 0.3000 | % | ||||||||
Exhibit B-11
| Management Fee Schedules | ||||||||||
| Fund Managed Assets as of | Percentage of | Fund-level Fee | ||||||||
Nuveen Fund | September 30, 2010 | Managed Assets | Rate | |||||||
| For the next $3 billion | 0.2750 | % | ||||||||
| For net assets over $5 billion | 0.2500 | % | ||||||||
| Nuveen New Jersey Municipal Bond Fund | $ | 263,619,787 | For the first $125 million | 0.3500 | % | |||||
| For the next $125 million | 0.3375 | % | ||||||||
| For the next $250 million | 0.3250 | % | ||||||||
| For the next $500 million | 0.3125 | % | ||||||||
| For the next $1 billion | 0.3000 | % | ||||||||
| For the next $3 billion | 0.2750 | % | ||||||||
| For net assets over $5 billion | 0.2500 | % | ||||||||
| Nuveen New Mexico Municipal Bond Fund | $ | 82,105,612 | For the first $125 million | 0.3500 | % | |||||
| For the next $125 million | 0.3375 | % | ||||||||
| For the next $250 million | 0.3250 | % | ||||||||
| For the next $500 million | 0.3125 | % | ||||||||
| For the next $1 billion | 0.3000 | % | ||||||||
| For the next $3 billion | 0.2750 | % | ||||||||
| For net assets over $5 billion | 0.2500 | % | ||||||||
| Nuveen New York Insured Municipal Bond Fund | $ | 303,107,934 | For the first $125 million | 0.3500 | % | |||||
| For the next $125 million | 0.3375 | % | ||||||||
| For the next $250 million | 0.3250 | % | ||||||||
| For the next $500 million | 0.3125 | % | ||||||||
| For the next $1 billion | 0.3000 | % | ||||||||
| For the next $3 billion | 0.2750 | % | ||||||||
| For net assets over $5 billion | 0.2500 | % | ||||||||
| Nuveen New York Municipal Bond Fund | $ | 463,133,230 | For the first $125 million | 0.3500 | % | |||||
| For the next $125 million | 0.3375 | % | ||||||||
| For the next $250 million | 0.3250 | % | ||||||||
| For the next $500 million | 0.3125 | % | ||||||||
| For the next $1 billion | 0.3000 | % | ||||||||
| For the next $3 billion | 0.2750 | % | ||||||||
| For net assets over $5 billion | 0.2500 | % | ||||||||
| Nuveen North Carolina Municipal Bond Fund | $ | 455,587,694 | For the first $125 million | 0.3500 | % | |||||
| For the next $125 million | 0.3375 | % | ||||||||
| For the next $250 million | 0.3250 | % | ||||||||
| For the next $500 million | 0.3125 | % | ||||||||
| For the next $1 billion | 0.3000 | % | ||||||||
| For the next $3 billion | 0.2750 | % | ||||||||
| For net assets over $5 billion | 0.2500 | % | ||||||||
| Nuveen Ohio Municipal Bond Fund | $ | 520,578,517 | For the first $125 million | 0.3500 | % | |||||
Exhibit B-12
| Management Fee Schedules | ||||||||||
| Fund Managed Assets as of | Percentage of | Fund-level Fee | ||||||||
Nuveen Fund | September 30, 2010 | Managed Assets | Rate | |||||||
| For the next $125 million | 0.3375 | % | ||||||||
| For the next $250 million | 0.3250 | % | ||||||||
| For the next $500 million | 0.3125 | % | ||||||||
| For the next $1 billion | 0.3000 | % | ||||||||
| For the next $3 billion | 0.2750 | % | ||||||||
| For net assets over $5 billion | 0.2500 | % | ||||||||
| Nuveen Pennsylvania Municipal Bond Fund | $ | 287,184,813 | For the first $125 million | 0.3500 | % | |||||
| For the next $125 million | 0.3375 | % | ||||||||
| For the next $250 million | 0.3250 | % | ||||||||
| For the next $500 million | 0.3125 | % | ||||||||
| For the next $1 billion | 0.3000 | % | ||||||||
| For the next $3 billion | 0.2750 | % | ||||||||
| For net assets over $5 billion | 0.2500 | % | ||||||||
| Nuveen Tennessee Municipal Fund | $ | 412,928,981 | For the first $125 million | 0.3500 | % | |||||
| For the next $125 million | 0.3375 | % | ||||||||
| For the next $250 million | 0.3250 | % | ||||||||
| For the next $500 million | 0.3125 | % | ||||||||
| For the next $1 billion | 0.3000 | % | ||||||||
| For the next $3 billion | 0.2750 | % | ||||||||
| For net assets over $5 billion | 0.2500 | % | ||||||||
| Nuveen Virginia Municipal Bond Fund | $ | 398,852,957 | For the first $125 million | 0.3500 | % | |||||
| For the next $125 million | 0.3375 | % | ||||||||
| For the next $250 million | 0.3250 | % | ||||||||
| For the next $500 million | 0.3125 | % | ||||||||
| For the next $1 billion | 0.3000 | % | ||||||||
| For the next $3 billion | 0.2750 | % | ||||||||
| For net assets over $5 billion | 0.2500 | % | ||||||||
| Nuveen Wisconsin Municipal Bond Fund | $ | 64,825,282 | For the first $125 million | 0.3500 | % | |||||
| For the next $125 million | 0.3375 | % | ||||||||
| For the next $250 million | 0.3250 | % | ||||||||
| For the next $500 million | 0.3125 | % | ||||||||
| For the next $1 billion | 0.3000 | % | ||||||||
| For the next $3 billion | 0.2750 | % | ||||||||
| For net assets over $5 billion | 0.2500 | % | ||||||||
Exhibit B-13
| Current/Temporary | ||||||||||||
| Current/Temporary | Expense Cap | Permanent | ||||||||||
| Expense Cap | Expiration Date | Expense Cap | ||||||||||
Mutual Funds | ||||||||||||
(A) Equity Income | ||||||||||||
| Nuveen NWQ Equity Income Fund | 0.900 | % | October 31, 2012 | 1.150 | % | |||||||
| Nuveen Santa Barbara Dividend Growth Fund | 1.000 | % | November 30, 2011 | 1.250 | % | |||||||
(B) Large Cap | ||||||||||||
| Nuveen NWQ Large Cap Value Fund | 1.100 | % | October 31, 2011 | 1.350 | % | |||||||
| Nuveen Symphony Large-Cap Growth Fund | 1.000 | % | January 31, 2012 | 1.350 | % | |||||||
| Nuveen Winslow Large Cap Growth Fund | 0.800 | % | November 30, 2012 | 1.250 | % | |||||||
| Nuveen Symphony Large Cap Value Fund | 1.000 | % | January 31, 2012 | 1.300 | % | |||||||
| Nuveen Multi-Manager Large-Cap Value Fund | 0.950 | % | October 31, 2011 | 1.200 | % | |||||||
| Nuveen Santa Barbara Growth Fund | 1.000 | % | November 30, 2011 | 1.400 | % | |||||||
| Nuveen Symphony Optimized Alpha Fund | 1.000 | % | January 31, 2012 | 1.450 | % | |||||||
(C) Mid Cap/SMID | ||||||||||||
| Nuveen Symphony Mid Cap Core Fund | 1.150 | % | January 31, 2012 | 1.400 | % | |||||||
| Nuveen NWQ Small/Mid-Cap Value Fund | 1.100 | % | October 31, 2011 | 1.450 | % | |||||||
| Nuveen Symphony Small-Mid Cap Core Fund | 1.100 | % | January 31, 2012 | 1.500 | % | |||||||
| Nuveen NWQ Multi-Cap Value Fund | N/A | N/A | N/A | |||||||||
(D) Small Cap | ||||||||||||
| Nuveen NWQ Small-Cap Value Fund | N/A | N/A | 1.500 | % | ||||||||
(E) Global/International | ||||||||||||
| Nuveen Tradewinds International Value Fund | N/A | N/A | N/A | |||||||||
| Nuveen Santa Barbara Global Equity Fund | 1.200 | % | November 30, 2012 | 1.450 | % | |||||||
| Nuveen Tradewinds Global All-Cap Fund | N/A | N/A | 1.550 | % | ||||||||
| Nuveen Santa Barbara International Equity Fund | 1.200 | % | November 30, 2012 | 1.450 | % | |||||||
| Nuveen Tradewinds Value Opportunities Fund | N/A | N/A | 1.500 | % | ||||||||
| Nuveen Symphony International Equity Fund | 1.130 | % | January 31, 2012 | 1.380 | % | |||||||
| Nuveen Tradewinds Japan Fund | 1.250 | % | November 30, 2011 | 1.500 | % | |||||||
| Nuveen Tradewinds Emerging Markets Fund | 1.600 | % | November 30, 2011 | 1.850 | % | |||||||
| Nuveen Tradewinds Global Flexible Allocation Fund | 1.150 | % | November 30, 2013 | 1.400 | % | |||||||
(F) Global Resources | ||||||||||||
| Nuveen Tradewinds Global Resources Fund | 1.250 | % | November 30, 2011 | 1.550 | % | |||||||
(G) Specialized Equity | ||||||||||||
| Nuveen Santa Barbara EcoLogic Equity Fund | 1.000 | % | November 30, 2011 | 1.250 | % | |||||||
| Nuveen Santa Barbara Growth Plus Fund | 1.250 | % | November 30, 2011 | 1.600 | % | |||||||
| Nuveen Tradewinds Global All-Cap Plus Fund | 1.450 | % | November 30, 2011 | 1.850 | % | |||||||
| Nuveen NWQ Preferred Securities Fund | 0.750 | % | May 31, 2013 | 1.250 | % | |||||||
(H) Quantitative Equity | ||||||||||||
| Nuveen U.S. Equity Completeness Fund | 0.800 | % | October 31, 2011 | 1.050 | % | |||||||
| Nuveen Enhanced Core Equity Fund | 0.500 | % | October 31, 2011 | 1.000 | % | |||||||
| Nuveen Enhanced Mid-Cap Fund | 0.550 | % | October 31, 2011 | 1.050 | % | |||||||
Exhibit B-14
| Current/Temporary | ||||||||||||
| Current/Temporary | Expense Cap | Permanent | ||||||||||
| Expense Cap | Expiration Date | Expense Cap | ||||||||||
(I) Taxable Fixed Income | ||||||||||||
| Nuveen Short Duration Bond Fund | 0.600 | % | January 31, 2011 | N/A | ||||||||
| Nuveen Multi-Strategy Core Bond Fund | 0.700 | % | January 31, 2011 | N/A | ||||||||
| Nuveen High Yield Bond Fund | 0.950 | % | January 31, 2011 | N/A | ||||||||
| Nuveen Preferred Securities Fund | 0.750 | % | May 31, 2011 | 1.250 | % | |||||||
| Nuveen Symphony Credit Opportunities Fund | 0.850 | % | January 31, 2013 | 1.350 | % | |||||||
(J) Municipal Income | ||||||||||||
| Nuveen Limited Term Municipal Bond Fund | N/A | N/A | N/A | |||||||||
| Nuveen Intermediate Duration Municipal Bond Fund | N/A | N/A | 0.750 | % | ||||||||
NuveenAll-American Municipal Bond Fund | N/A | N/A | N/A | |||||||||
| Nuveen High Yield Municipal Bond Fund | N/A | N/A | N/A | |||||||||
| Nuveen Arizona Municipal Bond Fund | N/A | N/A | N/A | |||||||||
| Nuveen Colorado Municipal Bond Fund | N/A | N/A | N/A | |||||||||
| Nuveen Florida Preference Municipal Bond Fund | N/A | N/A | N/A | |||||||||
| Nuveen Maryland Municipal Bond Fund | N/A | N/A | N/A | |||||||||
| Nuveen New Mexico Municipal Bond Fund | N/A | N/A | N/A | |||||||||
| Nuveen Pennsylvania Municipal Bond Fund | N/A | N/A | N/A | |||||||||
| Nuveen Virginia Municipal Bond Fund | N/A | N/A | N/A | |||||||||
| Nuveen California High Yield Municipal Bond Fund | N/A | N/A | 1.000 | % | ||||||||
| Nuveen California Insured Municipal Bond Fund | N/A | N/A | 0.975 | % | ||||||||
| Nuveen California Municipal Bond Fund | N/A | N/A | 0.750 | % | ||||||||
| Nuveen Connecticut Municipal Bond Fund | N/A | N/A | N/A | |||||||||
| Nuveen Massachusetts Insured Municipal Bond Fund | N/A | N/A | 0.975 | % | ||||||||
| Nuveen Massachusetts Municipal Bond Fund | N/A | N/A | 0.750 | % | ||||||||
| Nuveen New Jersey Municipal Bond Fund | N/A | N/A | N/A | |||||||||
| Nuveen New York Insured Municipal Bond Fund | N/A | N/A | 0.975 | % | ||||||||
| Nuveen New York Municipal Bond Fund | N/A | N/A | 0.750 | % | ||||||||
| Nuveen Georgia Municipal Bond Fund | N/A | N/A | N/A | |||||||||
| Nuveen Louisiana Municipal Bond Fund | N/A | N/A | N/A | |||||||||
| Nuveen North Carolina Municipal Bond Fund | N/A | N/A | N/A | |||||||||
| Nuveen Tennessee Municipal Fund | N/A | N/A | N/A | |||||||||
| Nuveen Kansas Municipal Bond Fund | N/A | N/A | N/A | |||||||||
| Nuveen Kentucky Municipal Bond Fund | N/A | N/A | N/A | |||||||||
| Nuveen Michigan Municipal Bond Fund | N/A | N/A | N/A | |||||||||
| Nuveen Missouri Municipal Bond Fund | N/A | N/A | N/A | |||||||||
| Nuveen Ohio Municipal Bond Fund | N/A | N/A | 0.750 | % | ||||||||
| Nuveen Wisconsin Municipal Bond Fund | N/A | N/A | N/A | |||||||||
Exhibit B-15
| Complex-Level | Effective | |||
| Asset Breakpoint | Complex-Level | |||
Level | Fee Rate | |||
| $55 billion | 0.2000 | % | ||
| $56 billion | 0.1996 | % | ||
| $57 billion | 0.1989 | % | ||
| $60 billion | 0.1961 | % | ||
| $63 billion | 0.1931 | % | ||
| $66 billion | 0.1900 | % | ||
| $71 billion | 0.1851 | % | ||
| $76 billion | 0.1806 | % | ||
| $80 billion | 0.1773 | % | ||
| $91 billion | 0.1691 | % | ||
| $125 billion | 0.1599 | % | ||
| $200 billion | 0.1505 | % | ||
| $250 billion | 0.1469 | % | ||
| $300 billion | 0.1445 | % | ||
Exhibit B-16
| Aggregate Fees That | ||||||||||
| Aggregate Fees | Would Have Been | |||||||||
Fund | Fiscal Year End | Paid to FAF ($)(1) | Paid to NAM ($)(2) | |||||||
| California Tax Free Fund | June 30 | 270,647 | 389,531 | |||||||
| Colorado Tax Free Fund | June 30 | 118,458 | 231,810 | |||||||
| Core Bond Fund | June 30 | 8,762,080 | 8,245,732 | |||||||
| Equity Income Fund | October 31 | 6,424,489 | 5,724,031 | |||||||
| Equity Index Fund | October 31 | 2,916,521 | 2,198,613 | |||||||
| Global Infrastructure Fund | October 31 | 356,425 | 332,653 | |||||||
| High Income Bond Fund | June 30 | 2,425,402 | 2,298,708 | |||||||
| Inflation Protected Securities Fund | June 30 | 640,616 | 614,052 | |||||||
| Intermediate Government Bond Fund | June 30 | 512,158 | 566,721 | |||||||
| Intermediate Tax Free Fund | June 30 | 4,776,097 | 4,219,685 | |||||||
| Intermediate Term Bond Fund | June 30 | 5,099,790 | 4,829,410 | |||||||
| International Fund | October 31 | 8,318,829 | 7,593,686 | |||||||
| International Select Fund | October 31 | 7,760,582 | 7,409,003 | |||||||
| Large Cap Growth Opportunities Fund | October 31 | 5,077,479 | 4,719,282 | |||||||
| Large Cap Select Fund | October 31 | 1,290,485 | 1,102,399 | |||||||
| Large Cap Value Fund | October 31 | 3,483,821 | 2,938,392 | |||||||
| Mid Cap Growth Opportunities Fund | October 31 | 11,916,786 | 10,834,412 | |||||||
| Mid Cap Index Fund | October 31 | 812,895 | 749,522 | |||||||
| Mid Cap Select Fund | October 31 | 170,208 | 216,726 | |||||||
| Mid Cap Value Fund | October 31 | 5,694,611 | 5,186,122 | |||||||
| Minnesota Intermediate Tax Free Fund | June 30 | 1,257,165 | 1,158,817 | |||||||
| Minnesota Tax Free Fund | June 30 | 830,080 | 887,515 | |||||||
| Missouri Tax Free Fund | June 30 | 805,033 | 901,993 | |||||||
| Nebraska Tax Free Fund | June 30 | 2,403 | 124,392 | |||||||
| Ohio Tax Free Fund | June 30 | 72,003 | 198,650 | |||||||
| Oregon Intermediate Tax Free Fund | June 30 | 857,439 | 824,672 | |||||||
| Quantitative Large Cap Core Fund | October 31 | 450,556 | 406,463 | |||||||
| Real Estate Securities Fund | October 31 | 11,997,646 | 9,881,835 | |||||||
| Short Tax Free Fund | June 30 | 1,331,083 | 1,167,772 | |||||||
| Short Term Bond Fund | June 30 | 2,924,686 | 2,624,026 | |||||||
| Small Cap Growth Opportunities Fund | October 31 | 1,647,657 | 1,439,782 | |||||||
| Small Cap Index Fund | October 31 | — | 36,756 | |||||||
| Small Cap Select Fund | October 31 | 6,811,983 | 5,900,749 | |||||||
| Small Cap Value Fund | October 31 | 1,857,685 | 1,704,502 | |||||||
| Tactical Market Opportunities Fund | October 31 | — | — | |||||||
| Tax Free Fund | June 30 | 2,866,142 | 2,667,001 | |||||||
Exhibit C-1
| Aggregate Fees That | ||||||||||
| Aggregate Fees | Would Have Been | |||||||||
Fund | Fiscal Year End | Paid to FAF ($)(1) | Paid to NAM ($)(2) | |||||||
| Total Return Bond Fund | June 30 | 4,665,844 | 4,242,608 | |||||||
| (1) | “Aggregate Fees Paid to FAF” include aggregate fees paid to FAF under the Current Advisory Agreement and the Current Administrative Agreement, less any advisory, administrative and distribution(12b-1) fees waived by FAF. | |
| (2) | “Aggregate Fees That Would Have Been Paid to NAM” include aggregate fees that would have been paid to NAM had the New Advisory Agreement been in effect, less any advisory and distribution(12b-1) fees NAM would have waived. |
Exhibit C-2
| Other Business, Profession, Vocation | ||
Name and Position with NAM | or Employment During Past Two Years | |
| John P. Amboian, Chief Executive Officer and Director | Chief Executive Officer and Chairman (since 2007) and Director (since 1999) of Nuveen Investments, Inc.; Chief Executive Officer (since 2007) of Nuveen Investments Advisors, Inc. | |
| Michael T. Atkinson, Vice President | Vice President (since 2002) of Nuveen Investments, LLC; Vice President and Assistant Secretary of the Nuveen Funds. | |
| Stuart J. Cohen, Managing Director, Assistant Secretary and Assistant General Counsel | Managing Director, Assistant Secretary and Assistant General Counsel of Nuveen Investments, LLC; Managing Director and Assistant Secretary of Nuveen Investments Holdings, Inc. and Nuveen Investments Advisers Inc.; Vice President and Assistant Secretary of NWQ Investment Management Company, LLC, Nuveen HydePark Group, LLC, Nuveen Investment Solutions, Inc., Tradewinds Global Investors, LLC, NWQ Holdings, LLC, Santa Barbara Asset Management, LLC, Symphony Asset Management LLC and Winslow Capital Management, Inc. | |
| Lorna C. Ferguson, Managing Director | Managing Director (since 2004) of Nuveen Investments, LLC; Vice President of the Nuveen Funds. | |
| Stephen D. Foy, Senior Vice President | Senior Vice President (since 2010) and Funds Controller (since 1998), previously, Vice President (1993-2010) of Nuveen Investments, LLC; Vice President and Controller of the Nuveen Funds; Certified Public Accountant. | |
| Scott S. Grace, Managing Director and Treasurer | Managing Director, Corporate Finance & Development, Treasurer (since September 2009) of Nuveen Investments, LLC; Vice President and Treasurer of the Nuveen Funds; Managing Director and Treasurer of Nuveen Investment Solutions, Inc., Nuveen Investments Advisers, Inc. and Nuveen Investments Holdings, Inc.; Vice President and Treasurer of NWQ Investment Management Company, LLC, Tradewinds Global Investors, LLC, Symphony Asset Management LLC and Winslow Capital Management, Inc.; Vice President of Santa Barbara Asset Management, LLC; formerly, Treasurer (2006-2009), Senior Vice President (2008-2009), previously, Vice President (2006-2008) of Janus Capital Group, Inc.; formerly, Senior Associate in Morgan Stanley’s Global Financial Services Group (2000-2003); Chartered Accountant Designation. |
Exhibit D-1
| Other Business, Profession, Vocation | ||
Name and Position with NAM | or Employment During Past Two Years | |
| Sherri A. Hlavacek, Managing Director and Corporate Controller | Managing Director and Corporate Controller of Nuveen Investments, Inc., Nuveen Investments, LLC, Nuveen Investments Advisers Inc. and Nuveen Investments Holdings, Inc.; Vice President and Controller of Nuveen Investment Solutions, Inc., NWQ Investment Management Company, LLC, NWQ Holdings, LLC, Tradewinds Global Investors, LLC, Symphony Asset Management LLC, Santa Barbara Asset Management, LLC and Nuveen HydePark Group, LLC; Certified Public Accountant. | |
| William T. Huffman, Chief Operating Officer, Municipal Fixed Income | Vice President of the Nuveen Municipal Funds; previously, Chairman, President and Chief Executive Officer (2002-2007) of Northern Trust Global Advisors, Inc. and Chief Executive Officer (2007) of Northern Trust Global Investments Limited; Certified Public Accountant. | |
| Mary E. Keefe, Managing Director and Chief Compliance Officer | Managing Director (since 2004) and Director of Compliance of Nuveen Investments, Inc.; Managing Director and Chief Compliance Officer of Nuveen Investments, LLC, Nuveen Investments Advisers Inc., Symphony Asset Management LLC, Santa Barbara Asset Management, LLC, Nuveen Investment Solutions, Inc. and Nuveen HydePark Group, LLC; Vice President and Assistant Secretary of NWQ Holdings, LLC and Winslow Capital Management, Inc. | |
| Walter M. Kelly, Senior Vice President and Assistant Secretary | Senior Vice President (since 2008), formerly, Vice President, formerly, Assistant Vice President and Assistant General Counsel (2003-2006) of Nuveen Investments, LLC; Vice President and Chief Compliance Officer of the Nuveen Funds; previously, Assistant Vice President and Assistant Secretary of the Nuveen Funds (2003-2006). | |
| David J. Lamb, Senior Vice President | Senior Vice President (since 2009), formerly, Vice President (2000-2009) of Nuveen Investments, LLC; Vice President of the Nuveen Funds; Certified Public Accountant. | |
| Tina M. Lazar, Senior Vice President | Senior Vice President (since 2009), formerly, Vice President (1999-2009) of Nuveen Investments, LLC; Vice President of the Nuveen Funds. |
Exhibit D-2
| Other Business, Profession, Vocation | ||
Name and Position with NAM | or Employment During Past Two Years | |
| John L. MacCarthy, Executive Vice President and Secretary and Director | Executive Vice President (since 2008), formerly, Senior Vice President (2006-2008), Secretary and General Counsel (since 2006) of Nuveen Investments, Inc., Nuveen Investments, LLC, and Nuveen Investments Holdings, Inc.; Executive Vice President (since 2008), formerly, Senior Vice President (2006-2008) and Secretary (since 2006) of Nuveen Investments Advisers Inc., NWQ Holdings, LLC, NWQ Investment Management Company, LLC, Tradewinds Global Investors, LLC, Symphony Asset Management LLC, Santa Barbara Asset Management, LLC, Nuveen HydePark Group, LLC and Nuveen Investment Solutions, Inc.; Director, Vice President and Secretary of Winslow Capital Management, Inc. | |
| Larry W. Martin, Senior Vice President and Assistant Secretary | Senior Vice President, Assistant Secretary and Assistant General Counsel of Nuveen Investments, LLC; Vice President (since 2005) and Assistant Secretary of Nuveen Investments, Inc.; Vice President and Assistant Secretary of the Nuveen Funds; Vice President and Assistant Secretary of Nuveen Investments Advisers Inc. (since 2002), NWQ Investment Management Company, LLC (since 2002), Symphony Asset Management LLC (since 2003), Tradewinds Global Investors, LLC and Santa Barbara Asset Management LLC (since 2006) and Nuveen HydePark Group, LLC and Nuveen Investment Solutions, Inc. (since 2007) and of Winslow Capital Management, Inc. (since 2010); Vice President and Assistant Secretary (since 2010) of Nuveen Commodities Asset Management, LLC. | |
| Kevin J. McCarthy, Managing Director and Assistant Secretary | Managing Director (since 2008), formerly, Vice President (2007-2008) of Nuveen Investments, LLC; Vice President and Secretary of the Nuveen Funds; Vice President and Assistant Secretary of Nuveen Investment Advisers Inc., NWQ Investment Management Company, LLC, Tradewinds Global Investors, LLC, NWQ Holdings, LLC, Symphony Asset Management LLC, Santa Barbara Asset Management, LLC, Nuveen HydePark Group, LLC and Nuveen Investment Solutions, Inc. and of Winslow Capital Management, Inc. (since 2010); Vice President and Secretary (since 2010) of Nuveen Commodities Asset Management LLC; prior thereto, Partner, Bell, Boyd & Lloyd LLP (1997-2007). | |
| John V. Miller, Chief Investment Officer and Managing Director | Managing Director (since 2007), formerly, Vice President (2002-2007) of Nuveen Investments, LLC; Vice President of the Nuveen Municipal Funds; Chartered Financial Analyst. |
Exhibit D-3
| Other Business, Profession, Vocation | ||
Name and Position with NAM | or Employment During Past Two Years | |
| Glenn R. Richter, Executive Vice President and Director | Executive Vice President, Chief Administrative Officer of Nuveen Investments, Inc. (since 2006); Executive Vice President of Nuveen Investments, LLC; Executive Vice President of Nuveen Investments Holdings, Inc.; Chief Administrative Officer of NWQ Holdings, LLC. | |
| Christopher M. Rohrbacher, Vice President and Assistant Secretary | Vice President and Assistant Secretary of Nuveen Investments, LLC (since 2008); Vice President and Assistant Secretary of the Nuveen Funds; Vice President and Assistant Secretary (since 2010) of Nuveen Commodities Asset Management, LLC; prior thereto, Associate, Skadden, Arps, Slate Meagher & Flom LLP (2002-2008). | |
| Mark L. Winget, Vice President and Assistant Secretary | Vice President and Assistant Secretary of Nuveen Investments, LLC (since 2008); Vice President and Assistant Secretary of the Nuveen Funds; Vice President and Assistant Secretary (since 2010) of Nuveen Commodities Asset Management, LLC; prior thereto, Counsel, Vedder Price P.C. (1997-2007). | |
| Gifford R. Zimmerman, Managing Director, Assistant Secretary and Associate General Counsel | Managing Director (since 2002), Assistant Secretary and Associate General Counsel of Nuveen Investments, LLC; Managing Director (since 2004) and Assistant Secretary (since 1994) of Nuveen Investments, Inc.; Chief Administrative Officer of the Nuveen Funds; Vice President and Assistant Secretary of NWQ Investment Management Company, LLC (since 2002); Vice President and Assistant Secretary of Nuveen Investments Advisers Inc. (since 2002); Managing Director, Associate General Counsel and Assistant Secretary of Symphony Asset Management LLC (since 2003); Vice President and Assistant Secretary of Tradewinds Global Investors, LLC and Santa Barbara Asset Management, LLC (since 2006), and Nuveen HydePark Group, LLC and Nuveen Investment Solutions, Inc. (since 2007) and of Winslow Capital Management, Inc. (since 2010); Chief Administrative Officer and Chief Compliance Officer (since 2010) of Nuveen Commodities Asset Management, LLC; Chartered Financial Analyst. |
Exhibit D-4
| Other Business, Profession, Vocation | ||
Name and Position with Altrinsic | or Employment During Past Two Years | |
| John D. Hock, CIO and Portfolio Manager/Analyst | None | |
| John L. DeVita, Portfolio Manager/Analyst | None | |
| Rehan Chaudhri, Portfolio Manager/Analyst | None | |
| Deborah Judd, Chief Compliance Officer | None |
| Other Business, Profession, Vocation | ||
Name and Position with Hansberger | or Employment During Past Two Years | |
Directors | ||
| Holt, Ronald CEO, President, Co-CIO — Value Team, Ultimate Designated Person | Ron Holt serves on the HGI Board of Directors as well as our Management and Executive Committees. In his role as Co-Chief Investment Officer, Ron is responsible for the oversight and implementation of the team’s investment philosophy and process. Ron joined HGI in 1997 as an analyst with coverage of several global industries and regions. Later he became a Portfolio Manager as well as Director of Research for the Value team. Ron began his career at Merrill Lynch in 1991. He holds an MBA in Finance from New York University’s Stern School of Business and a Bachelor of Arts in Economics from Columbia University. Ron is a CFA charter holder and a member of the CFA Institute. | |
| Hendry, Bev COO, Treasurer | Bev Hendry serves on HGI’s Board of Directors, as well as our Management and Executive Committees. In his role at the firm, he oversees operations, finance, client service, marketing and product development. Prior to joining the firm in 2008, Bev worked at Aberdeen Asset Management Inc. where he was as a managing director for over 20 years. At AAM, he led the North and South American operations and was responsible for launching new products, maintaining relationships with third-party providers and overseeing client relationships. Bev holds a Master of Arts — Economics and Statistics from the University of Aberdeen in his native Scotland. |
Exhibit D-5
| Other Business, Profession, Vocation | ||
Name and Position with Hansberger | or Employment During Past Two Years | |
| Tibbles, Tom CIO — Growth Team & Managing Director — Canada | Tom Tibbles serves on the HGI Board of Directors as well as our Management and Executive Committees. In his role as Chief Investment Officer for the Growth team, he is responsible for asset allocation and risk management decisions. Prior to joining the firm in 1999, Tom headed up the Global Equity Team at Indago Capital Management in Toronto, an affiliate of Canada Life. He holds a Bachelor of Commerce degree with distinction from the University of Toronto, Trinity College. While attending the University of Toronto, he was awarded the Martin R. Lindsay Scholarship for performance in advanced finance and a Trinity College Scholarship for overall performance. He is a CFA charter holder and a member of the Toronto Society of Financial Analysts. | |
| Portfolio Mgmt/Research | ||
| Alzuru, Francisco Managing Director — Emerging Market Research | Francisco Alzuru is a senior member of the Value investment team. His responsibilities also include managing the Emerging Markets portfolio with Aureole Foong. Prior to joining the firm in 1995, Francisco was a Vice President and Senior Research Analyst at Vestcorp Partners, a Latin American based investment bank, where he was involved in both the sell and buy side research effort in Venezuela and Peru. Francisco holds a Bachelor of Science Degree in Urban Planning from the Universidad Simon Bolivar in Caracas, Venezuela and a Masters in Finance from Oklahoma City University. He is a CFA charter holder and a member of the CFA Institute, as well as the CFA Society of South Florida. He is fluent in Spanish. | |
| Chan, Quardy VP — Research | Quardy Chan is a senior member of the Value investment team. She joined HGI in 1996 after working for a Canadian financial advisor and IBM Hong Kong. Quardy completed the Canadian Securities Course and was working towards the Certified General Accountants designation before returning to Hong Kong. Having spent eight years living and working in Canada, she has a unique balance of local insight into Asia as well as an understanding of western business practices. Quardy graduated from York University with a Bachelor of Business Administration, majoring in Finance and is a CFA charter holder. She is fluent in Cantonese. |
Exhibit D-6
| Other Business, Profession, Vocation | ||
Name and Position with Hansberger | or Employment During Past Two Years | |
| Denisova, Elena VP — Research | Elena Denisova works as Research Analyst covering Metals & Mining as well as Chemicals for the Value team. Prior to joining the firm in 1996, Elena was a Senior Research Analyst with the Institute of World Economy and International Relations at the Russian Academy of Sciences. Elena served as a visiting researcher with the Institute for Development Studies at the University of Helsinki, Finland and with the Russian Information Center, International Center in Washington D.C. She participated in several projects of IMEMO dealing with the analysis and prognosis of Russia’s transition to the market economy, its current economic trends and post privatization consulting of Russian companies. Elena is a graduate of Moscow State University with a major in Political Economy. She also received a Ph.D. in Development Economics from the Institute of World Economy and International Relations, USSR Academy of Sciences. She is fluent in Russian. | |
| Foong, Aureole Managing Director — Emerging Markets Research | Aureole Foong is a senior member of the Value investment team. His responsibilities also include managing the Emerging Markets portfolio with Francisco Alzuru. Prior to joining the firm in 1997, Aureole was a Director of Peregrine Asset Management where he was a portfolio manager responsible for several mutual funds and private accounts investing in regional Asian markets. He was part of the original team that helped build a US$700 million business in three years for the Peregrine group. Prior to Peregrine, Aureole was with Unifund, a private investment firm headquartered in Geneva with over $2.5 billion in global assets. Aureole was based in Bangkok and Hong Kong where he was a portfolio manager responsible for the Asian markets. His experience also includes working at Morgan Stanley in New York, Los Angeles and Hong Kong in their Private Client Services group. Aureole started his investment career in 1987. He received his MBA and a Bachelor of Science in Computer Science from the University of Southern California in Los Angeles. He speaks Cantonese, Mandarin, Malay and Indonesian. |
Exhibit D-7
| Other Business, Profession, Vocation | ||
Name and Position with Hansberger | or Employment During Past Two Years | |
| Graham, Trevor SVP — Research | Trevor Graham joined the growth team as a senior research analyst in 2004. Prior to joining the firm, Trevor worked as an associate quantitative analyst for Phillips, Hager & North Investment Management Ltd.. At PHN he managed an active country/passive Non-North American equity portfolio prior to it becoming an active fund. He then became a fundamental analyst covering the energy, utilities, basic materials and industrials sectors. Later he also assumed coverage of the U.S. equity market and had global (ex Canada) sector responsibilities. Trevor’s team was responsible for managing C$3.5 billion in assets. Trevor holds a Bachelor of Commerce in International Finance from the University of Victoria. He is a CFA charter holder and a member of the Toronto Society of Financial Analysts. | |
| Grant, Eva VP — Research | Eva Grant joined the growth team in 2003 as a research analyst. Eva previously was a Research Associate with ScotiaMcLeod Inc., focused on equity research concentrating on the chemical and fertilizer industries. She also developed earnings and simulation models and company comparisons leading to financial forecasts, earnings estimates and target prices. She began her career in the investment industry with a Canadian investment bank upon receiving her Honors Bachelor of Commerce degree from McMaster University. She is a CFA charter holder and a member of the Toronto Society of Financial Analysts. | |
| Gretsky, Victoria SVP — Research | Victoria Gretsky serves as Senior Research Analyst of the Value team primarily covering Health Care Equipment & Services, Paper & Forest Products and Communications Equipment and on a regional basis covers the EMEA region with Francisco Alzuru and Aureole Foong. Prior to joining the firm in 1996, she was a research analyst for Optimum Consulting, a Russian based firm which specialized in restructuring Russian companies during privatization. In this position she worked on corporate finance and business strategy development. Victoria holds a Master’s degree in Computer Science from Moscow State Technical University. She is fluent in Russian |
Exhibit D-8
| Other Business, Profession, Vocation | ||
Name and Position with Hansberger | or Employment During Past Two Years | |
| Ho, Stephen SVP — Research | Stephen joined the Value team in 1999 and is a Portfolio Manager and a senior member of the investment team. Prior to joining the firm, Stephen worked with American International Group in New York and Asia. His responsibilities included managing assets of $2.5 billion in global and Asian equity mandates for mutual funds and institutional clients. Stephen received his MBA in Finance and International Business from Columbia University and his Bachelor of Arts in Economics and International Relations from the University of Pennsylvania. He started his investment career in 1986. He is fluent in Cantonese and also speaks Mandarin. | |
| McLaughlin, Moira SVP — Research | Moira McLachlan joined the firm in 2004 and is a senior member of the value investment team. Her research coverage includes European Banks and the economies in the Eurozone. She also serves as a portfolio manager. Prior to joining the firm, Moira spent 8 years at Mackenzie Investment Management, where she served as a research analyst and portfolio manager. In her final role at Mackenzie as Head of International Equities, she was responsible for the management of nearly $500 million in international equities. She received a Masters of International Business Studies from the University of South Carolina, a Bachelor of Science in Multinational Business Administration and a Bachelor of Arts in Spanish Literature from Florida State University. Moira is a CFA charter holder and a member of the CFA Institute. She is fluent in Spanish and Portuguese. | |
| Meave, Patricia VP — Research | Patricia Meave is a Research Analyst covering global Capital Goods, as well as part of the Financial sector for the Value team. Prior to joining the firm in 2005, Patricia was a Senior Research Equity Analyst at Variant Research Corporation, an independent research firm covering the Financial Sector. Patricia’s experience also includes several years as a Research Equity Analyst for Security Management Company covering the Financial and Industrial Sectors. Patricia was a Fulbright Scholar, who obtained her Master’s Degree in Economics and Finance from the MBA program at the University of Kansas, where she also received her Bachelor of Science Degree in Accounting and Finance. She is a CFA charter holder and a member of the CFA Institute. She is fluent in Spanish and is a native of Bolivia. |
Exhibit D-9
| Other Business, Profession, Vocation | ||
Name and Position with Hansberger | or Employment During Past Two Years | |
| Poon, Mark Managing Director — Asia | Mark Poon has been a member of the Value team since 1996. Prior to focusing on equity research, he also worked on our trading desk. Prior to joining the firm in 1996, Mark was head of emerging markets trading for Templeton’s US$7 billion Emerging Markets Fund, which invested in over 30 countries globally. Mark was instrumental in developing Templeton’s emerging markets database, as well as the trading & settlements team and computer systems for their emerging markets’ activities. Previously Mark worked with the Korea Development Bank trading fixed income instruments. He also has experience trading foreign exchange and money market products with the Hang Seng Bank in Hong Kong. Mark started his investment career in 1986 and holds a Bachelor of Science in Finance from the University College Dublin, a National University in Dublin, Ireland. He is fluent in Cantonese. | |
| Reeves, Lauretta (Retz) Co-CIO — Value Team & Managing Director of Research Technology | Lauretta “Retz” Reeves joined the firm in 1996 and serves as Co-Chief Investment Officer of the Value team. She is currently also a Portfolio Manager and Senior Research Analyst covering Healthcare. Prior to joining HGI, Retz was Senior Vice President at Templeton Investment Counsel, Inc. in the research and portfolio management group. She was also portfolio manager for several separate accounts and mutual funds which in total exceeded $1 billion of assets. Retz received her MBA from Nova-Southeastern University and her undergraduate degree in business management from Florida International University. She is a CFA charter holder and member of the CFA Institute. | |
| Seyfulmulukov, Iskander VP — Research | Iskander Seyfulmulukov is the Value team’s Energy research analyst. Prior to joining the firm in 2000, he was a senior researcher for the Institute of World Economy and International Relations of the Russian Academy of Sciences, specializing in the international oil and gas industry. Iskander served as a visiting researcher with the Brookings Institution in Washington D.C., and with El Colegio de Mexico in Mexico City. He graduated from Moscow State Institute of International Relations and holds a Ph.D. in Economics. He is fluent in Russian and speaks French and Spanish. |
Exhibit D-10
| Other Business, Profession, Vocation | ||
Name and Position with Hansberger | or Employment During Past Two Years | |
| Shankar, Ramdas VP — India | R. Shankar is part of the Value investment team with responsibilities for research coverage of the Indian market. Prior to joining the firm in 2006, he worked with Templeton Emerging Markets Funds as an Investment Manager with responsibilities for Indian equities. R. Shankar was instrumental in establishing Templeton’s research presence in India and building up an exposure in Indian equities in excess of $650 million. He is an associate member of the Institute of Chartered Accountants of India and has received a postgraduate diploma in finance from Indian Institute of Management, Bangalore. | |
| Tan, Patrick SVP — Research | Patrick Tan joined the firm in April 1999 and is a senior member of the growth investment team. Patrick has worked with Tom Tibbles and Barry Lockhart since 1994, when they were part of the global equity team at Indago Capital Management. As an equity analyst, Patrick was responsible for quantitative analysis of portfolios, program trading, research technology, database management and performance measurement. He holds a Bachelor of Arts degree in Commerce and Economics from the University of Toronto. | |
| Zdzienicki, Greg VP — Research | Greg Zdzienicki joined the growth team in a senior product specialist role. As such, he interfaces with clients and the firm’s marketing group as the liaison to the team. Prior to joining the firm in 2007, he worked at HSBC Investments (Canada) Ltd. as a Senior Research Analyst. Greg also worked for Manulife Financial as a Manager, where he was responsible for Investment Management research and selection, as well as ongoing due diligence for Canadian, U.S. and EAFE equity and fixed income mandates. He began his career in the investment industry with the Bank of Montreal. Greg received his Bachelor of Arts degree from York University. | |
Marketing | ||
| Alfaro, Brenda VP — Marketing | Brenda Alfaro is based in the Fort Lauderdale headquarters and is responsible for institutional business development. Prior to joining the firm in 2010, Brenda worked at Paradigm Asset Management in the institutional marketing and client service department. Brenda received her Master’s in Social Science Administration from Case Western Reserve University and her Bachelor’s degree from Florida International University. She is fluent in Spanish. |
Exhibit D-11
| Other Business, Profession, Vocation | ||
Name and Position with Hansberger | or Employment During Past Two Years | |
| DiNallo, Matthew VP — Client Service | Matt DiNallo is based in Fort Lauderdale and responsible for managing the firm’s relationship with new and existing institutional clients. Prior to joining the firm in 2008, Matt was a senior product manager in its Institutional Services division of Fidelity Investments. Prior to that, he was a product manager for the Investment Product Management & Analysis division of Prudential Financial Corp. Matt holds an MBA degree from The George Washington University and a BS degree from Central Connecticut State University. He is a CFA charter holder and a member of the CFA Institute. | |
| Orley, Evelyn SVP — Marketing | Evelyn Orley joined HGI in 2004 and is located in Solana Beach, California. She is responsible for institutional business development and client relationship management. Evelyn began her investment management career at Freeman Associates Investment Management. Prior experiences include sports marketing for Executive Sports International and working in the wealth management department of Credit Suisse in her hometown of Zurich, Switzerland. In addition, she spent seven years as a professional golfer on the LPGA, the European and Asian Tours. Tour accomplishments include victories in the Singapore and Swiss Opens. Evelyn received a Bachelor of Science degree in Political Science from Duke University where she twice earned All American recognition for golf. She is fluent in German, French and Spanish. | |
| Seidman, Keith VP — Marketing | Keith Seidman is based in Harrison, NY and is responsible for institutional business development and client relationship management in the Eastern US States. Keith has 20 years institutional sales experience. Prior to joining the firm in 2008, he was a Managing Director for Robeco Investment Management Company, where he was responsible for the development of new business in the institutional marketplace for both traditional and alternative strategies. Previously he worked in sales at Vencast and StockVal Inc. He was also a mutual fund wholesaler at Oppenheimer Management and worked at Gordon Haskett & Company. Keith began his career as an account executive at AT&T Information Systems. He holds a Bachelor of Science degree in Business Finance and Administration from Virginia Commonwealth University. |
Exhibit D-12
| Other Business, Profession, Vocation | ||
Name and Position with Hansberger | or Employment During Past Two Years | |
| Vinikoor, Jason VP — Marketing | Jason Vinikoor joined HGI in 2005 and is based in the Fort Lauderdale headquarters. He is responsible for institutional business development in the Southeastern United States and Puerto Rico. Prior to joining HGI, Jason worked at Lazard Asset Management in the Institutional Marketing Department. He was based in Lazard’s New York headquarters from 1998-2003 and London affiliate from 2003-2005. Jason earned his MBA degree from the University of Florida Warrington College of Business and received a Bachelor of Arts in Communications from the University of Pennsylvania. | |
Admin/Ops/Legal | ||
| Davis, Jessica VP — Benefits & Office Administration | Jessica Davis is responsible for all aspects of the corporate Human Resources management and Office Administration of our domestic and international offices. Jessica joined HGI in 1997 as a Research Assistant. She supported the research & investment team with a wide array of research, portfolio management, and research technology reporting needs. Jessica holds her Bachelor of Science in Finance and Economics from Fisk University, and an MBA in Finance from Nova Southeastern University. She is a member of the Society of Human Resource Management (SHRM). | |
| Finn, John VP — Trading | John Finn joined HGI in 2003 and works on the trading desk in our Fort Lauderdale headquarters. John began his investment career as an Assistant International Trader at Ivy Funds in Boca Raton, Florida before he joined Morgan Stanley’s retail brokerage group. He received his Bachelor of Science from the University of North Carolina at Wilmington. | |
| Foglia, Mary SVP — Director of Trading | Mary Foglia is responsible for coordinating HGI’s dual trading operations in Fort Lauderdale and Hong Kong. Prior to joining the firm in 1997, Mary served over nine years as a trader and administrator in both developed and emerging markets at Templeton Investment Counsel Inc. Prior to that Mary was responsible for all European trading at Wellington Management in Boston. She started her industry career in 1986, and has a Bachelor of Science from St. Benedicts College in Minnesota and a degree in Hispanic language from the University of Barcelona in Spain. | |
| Lemanski, David Chief Administrative Officer | David Lemanski oversees the information technology, trading and operations areas at HGI. Prior to joining the firm in 1995, David worked for Palm Beach Capital Management and Templeton Investment Counsel, Inc. He received a Bachelor of Science degree in Finance and Accounting from Florida State University. He is also a certified public accountant. |
Exhibit D-13
| Other Business, Profession, Vocation | ||
Name and Position with Hansberger | or Employment During Past Two Years | |
| Moore-Wester, Susan Chief Compliance Officer | Susan Moore-Wester has primary responsibility for compliance-related matters at HGI. In her function as Chief Compliance Officer, Susan reports to Ron Holt. Prior to joining the firm in 2005, Susan was a Securities Compliance Examiner with the U.S. Securities and Exchange Commission - Southeast Regional Office, in Miami, FL. She also worked as Portfolio Compliance Manager at Franklin Templeton. Susan also served as the Senior Director of the Membership and Registration Department of the Chicago Mercantile Exchange. She received her MBA from the University of Chicago and her BS in Education from the State University of New York College of Arts and Sciences. | |
| Ng, Gwen VP — Trading | Gwen Ng works on the trading desk in the Hong Kong office. She originally joined HGI in 1996 as the Office Administrator. Previously, Gwen worked in the hospitality industry in Hong Kong and Singapore for over 10 years. She is fluent in Cantonese, Hokkien and Mandarin and is a native of Singapore. | |
| Pelletier, Sharon SVP — Investment Operations & Account Administration | Sharon Pelletier is responsible for the overall management of the Account Administration and Operations Department. Prior to joining the firm in 1997, Sharon worked in the back office at Franklin Templeton, where she was responsible for managing approximately $12 billion of assets under management for their separate account business. Sharon has close to 30 years of Account Administration experience. She is a graduate of the University of Florida’s Trust Management School. | |
| Powers, Andrew SVP & Managing Director of IT | Andrew Powers is responsible for HGI’s technology infrastructure, application development and systems integration. Prior to joining the firm in 1996, he worked for the University of Miami’s IT Department where he supervised the PC training program and help desk. He was also the lead Sybase instructor for UM’s Information Systems Institute, and taught Computer Information Systems classes at their School of Business Administration. Andrew completed a Masters program at the University of Miami consisting of an MBA and MS in Computer Information Systems, and holds a certificate in Telecommunications Management. He also received a BBA in Finance from the University of Miami. |
Exhibit D-14
| Other Business, Profession, Vocation | ||
Name and Position with Hansberger | or Employment During Past Two Years | |
| Riddles, Neil Performance Manager | Neil Riddles is responsible for the performance measurement function. Prior to joining the firm in 2001, he was Senior Vice President - Director of Performance Analysis at Templeton Global Investors Inc. Neil’s experience also includes working at the consulting firm of Rogers, Casey & Associates, Inc., where he specialized in the application of equity risk models, constructed customized benchmarks and enhanced portfolio reporting. Neil is very active in the committees governing the AIMR PPS and GIPS standards and currently serves as chairman of the North American Investment Performance Committee (NAIPC). He is also on the advisory board of the Journal of Performance Measurement, the CIPM Advisory Council, and is an author and frequent speaker on performance measurement related topics. Neil earned his MBA degree from the Hagan School of Business at Iona College. He is a CFA charter holder and has a Certificate in Investment Performance Measurement. | |
| Smiley, Eileen General Counsel | Eileen Smiley is HGI’s General Counsel. Prior to joining the firm in 2010, Ms. Smiley had extensive regulatory, law firm and in-house experience working in the asset management industry, including Wellington Management Company, LLP (2007-2010), USAA (2003- 2006), Morrison & Foerster, LLP (1999-2003), and at the U.S. Securities and Exchange Commission in the Divisions of Investment Management and Enforcement in Washington, DC. (1991-1998). Ms. Smiley has her J.D. from the University of California at Davis and a B.A. Degree in History from Trinity College in Hartford, CT. | |
| Yan, Richard VP & Controller | Richard Yan is responsible for HGI’s financial operations, including financial and tax reporting, business planning, and budgeting. Prior to joining the firm in 2006, he worked at Ernst and Young LLP, planning and performing audits and other attestation engagements. Richard received his Bachelor of Business Administration, Accounting, from Florida Atlantic University. He is a Certified Public Accountant, State of Florida and a member of the Florida Institute of Certified Public Accountants. |
| Other Business, Profession, Vocation | ||
Name and Position with Lazard | or Employment During Past Two Years | |
Exhibit D-15
| Position with the | Term of Office and | Principal Occupation(s) | ||||
Name and Year of Birth | Company | Length of Time Served | During Past 5 Years | |||
| Thomas S. Schreier, Jr. 1962 | President | Re-elected by the Board annually; President of FAIF since February 2001 | Chief Executive Officer of FAF Advisors, Inc.; Chief Investment Officer of FAF Advisors, Inc. since September 2007. | |||
| Jeffery M. Wilson 1956 | Vice President | Re-elected by the Board annually, Vice President — Administration of FAIF since March 2000 | Senior Vice President of FAF Advisors, Inc. | |||
| Charles D. Gariboldi, Jr. 1959 | Treasurer | Re-elected by the Board annually; Treasurer of FAIF since December 2004 | Mutual Funds Treasurer, FAF Advisors, Inc. | |||
| Jill M. Stevenson 1965 | Assistant Treasurer | Re-elected by the Board annually; Assistant Treasurer of FAIF since September 2005 | Mutual Funds Assistant Treasurer, FAF Advisors, Inc., since September 2005; prior thereto, Director, Senior Project Manager, FAF Advisors, Inc. | |||
| David H. Lui 1960 | Chief Compliance Officer | Re-elected by the Board annually; Chief Compliance Officer of FAIF since March 2005 | Chief Compliance Officer, FAF Advisors, Inc. | |||
| Cynthia C. DeRuyter 1973 | Anti-Money Laundering Officer | Re-elected by the Board annually; Anti-Money Laundering Officer of FAIF since June 2010 | Compliance Director, FAF Advisors, Inc., since March 2010; prior thereto, Compliance Manager, RSM McGladrey, Inc., since March 2006; prior thereto, Compliance Manager, FAF Advisors, Inc. | |||
| Kathleen L. Prudhomme 1953 | Secretary | Re-elected by the Board annually; Secretary of FAIF since December 2004; prior thereto, Assistant Secretary of FAIF since September 1998 | Deputy General Counsel, FAF Advisors, Inc. |
Exhibit D-16
| Position with the | Term of Office and | Principal Occupation(s) | ||||
Name and Year of Birth | Company | Length of Time Served | During Past 5 Years | |||
| James D. Alt 1951 | Assistant Secretary | Re-elected by the Board annually; Assistant Secretary of FAIF since December 2004; Secretary of FAIF from June 2002 through December 2004; Assistant Secretary of FAIF from September 1998 through June 2002 | Partner, Dorsey & Whitney LLP, a Minneapolis-based law firm. | |||
| James R. Arnold 1957 | Assistant Secretary | Re-elected by the Board annually; Assistant Secretary of FAIF since June 2003 | Senior Vice President, U.S. Bancorp Fund Services, LLC. | |||
| Richard J. Ertel 1967 | Assistant Secretary | Re-elected by the Board annually; Assistant Secretary of FAIF since June 2006 and from June 2003 through August 2004 | Counsel, FAF Advisors, Inc., since May 2006; prior thereto, Counsel, Ameriprise Financial Services, Inc. | |||
| Michael W. Kremenak 1978 | Assistant Secretary | Re-elected by the Board annually; Assistant Secretary of FAIF since February 2009 | Counsel, FAF Advisors, Inc., since January 2009; prior thereto, Associate, Skadden, Arps, Slate, Meagher & Flom LLP from September 2005 to January 2009. |
Exhibit D-17
| Pro | Pro | Pro | Pro | Pro | ||||||||||||||||||||||||||||||||||||
| Current | Forma | Current | Forma | Current | Forma | Current | Forma | Current | Forma | |||||||||||||||||||||||||||||||
California Tax Free Fund | Class A | Class A | Class B | Class B | Class C | Class C | Class R | Class R | Class Y | Class Y | ||||||||||||||||||||||||||||||
| Management Fees | 0.72 | % | 0.65 | % | — | — | 0.72 | % | 0.65 | % | — | — | 0.72 | % | 0.65 | % | ||||||||||||||||||||||||
| Distribution (12b-1) Fees | 0.25 | % | 0.20 | % | — | — | 0.65 | % | 0.65 | % | — | — | 0.00 | % | 0.00 | % | ||||||||||||||||||||||||
| Other Expenses | 0.17 | % | 0.10 | % | — | — | 0.17 | % | 0.10 | % | — | — | 0.17 | % | 0.10 | % | ||||||||||||||||||||||||
| Gross Annual Operating Expenses | 1.14 | % | 0.95 | % | — | — | 1.54 | % | 1.40 | % | — | — | 0.89 | % | 0.75 | % | ||||||||||||||||||||||||
| Less 12b-1 Fee Waiver/ Reimbursement | (0.10 | )% | (0.05 | )% | — | — | 0.00 | % | 0.00 | % | — | — | 0.00 | % | 0.00 | % | ||||||||||||||||||||||||
| Less Expense Reimbursement | (0.39 | )% | (0.25 | )% | — | — | (0.39 | )% | (0.25 | )% | — | — | (0.39 | )% | (0.25 | )% | ||||||||||||||||||||||||
| Net Annual Operating Expenses | 0.65 | % | 0.65 | % | — | — | 1.15 | % | 1.15 | % | — | — | 0.50 | % | 0.50 | % | ||||||||||||||||||||||||
| Pro | Pro | Pro | Pro | Pro | ||||||||||||||||||||||||||||||||||||
| Current | Forma | Current | Forma | Current | Forma | Current | Forma | Current | Forma | |||||||||||||||||||||||||||||||
Colorado Tax Free Fund | Class A | Class A | Class B | Class B | Class C | Class C | Class R | Class R | Class Y | Class Y | ||||||||||||||||||||||||||||||
| Management Fees | 0.72 | % | 0.65 | % | — | — | 0.72 | % | 0.65 | % | — | — | 0.72 | % | 0.65 | % | ||||||||||||||||||||||||
| Distribution (12b-1) Fees | 0.25 | % | 0.20 | % | — | — | 0.65 | % | 0.65 | % | — | — | 0.00 | % | 0.00 | % | ||||||||||||||||||||||||
| Other Expenses | 0.24 | % | 0.14 | % | — | — | 0.24 | % | 0.14 | % | — | — | 0.24 | % | 0.14 | % | ||||||||||||||||||||||||
| Gross Annual Operating Expenses | 1.21 | % | 0.99 | % | — | — | 1.61 | % | 1.44 | % | — | — | 0.96 | % | 0.79 | % | ||||||||||||||||||||||||
| Less Expense Reimbursement | (0.46 | )% | (0.29 | )% | — | — | (0.46 | )% | (0.29 | )% | — | — | (0.46 | )% | (0.29 | )% | ||||||||||||||||||||||||
| Net Annual Operating Expenses | 0.75 | % | 0.70 | % | — | — | 1.15 | % | 1.15 | % | — | — | 0.50 | % | 0.50 | % | ||||||||||||||||||||||||
| Pro | Pro | Pro | Pro | Pro | ||||||||||||||||||||||||||||||||||||
| Current | Forma | Current | Forma | Current | Forma | Current | Forma | Current | Forma | |||||||||||||||||||||||||||||||
Core Bond Fund | Class A | Class A | Class B | Class B | Class C | Class C | Class R | Class R | Class Y | Class Y | ||||||||||||||||||||||||||||||
| Management Fees | 0.72 | % | 0.62 | % | 0.72 | % | 0.62 | % | 0.72 | % | 0.62 | % | 0.72 | % | 0.62 | % | 0.72 | % | 0.62 | % | ||||||||||||||||||||
| Distribution (12b-1) Fees | 0.25 | % | 0.25 | % | 1.00 | % | 1.00 | % | 1.00 | % | 1.00 | % | 0.50 | % | 0.50 | % | 0.00 | % | 0.00 | % | ||||||||||||||||||||
| Other Expenses | 0.05 | % | 0.08 | % | 0.05 | % | 0.08 | % | 0.05 | % | 0.08 | % | 0.05 | % | 0.08 | % | 0.05 | % | 0.08 | % | ||||||||||||||||||||
| Gross Annual Operating Expenses | 1.02 | % | 0.95 | % | 1.77 | % | 1.70 | % | 1.77 | % | 1.70 | % | 1.27 | % | 1.20 | % | 0.77 | % | 0.70 | % | ||||||||||||||||||||
| Less Expense Reimbursement | (0.07 | )% | 0.00 | % | (0.07 | )% | 0.00 | % | (0.07 | )% | 0.00 | % | (0.07 | )% | 0.00 | % | (0.07 | )% | 0.00 | % | ||||||||||||||||||||
| Net Annual Operating Expenses | 0.95 | % | 0.95 | % | 1.70 | % | 1.70 | % | 1.70 | % | 1.70 | % | 1.20 | % | 1.20 | % | 0.70 | % | 0.70 | % | ||||||||||||||||||||
| Forma | Forma | Forma | Forma | Forma | ||||||||||||||||||||||||||||||||||||
Equity Income Fund | Class A | Class A | Class B | Class B | Class C | Class C | Class R | Class R | Class Y | Class Y | ||||||||||||||||||||||||||||||
| Management Fees | 0.87 | % | 0.78 | % | 0.87 | % | 0.78 | % | 0.87 | % | 0.78 | % | 0.87 | % | 0.78 | % | 0.87 | % | 0.78 | % | ||||||||||||||||||||
| Distribution (12b-1) Fees | 0.25 | % | 0.25 | % | 1.00 | % | 1.00 | % | 1.00 | % | 1.00 | % | 0.50 | % | 0.50 | % | 0.00 | % | 0.00 | % | ||||||||||||||||||||
| Other Expenses | 0.07 | % | 0.12 | % | 0.07 | % | 0.12 | % | 0.07 | % | 0.12 | % | 0.07 | % | 0.12 | % | 0.07 | % | 0.12 | % | ||||||||||||||||||||
| Annual Operating Expenses | 1.19 | % | 1.15 | % | 1.94 | % | 1.90 | % | 1.94 | % | 1.90 | % | 1.44 | % | 1.40 | % | 0.94 | % | 0.90 | % | ||||||||||||||||||||
Exhibit E-1
| Pro | Pro | Pro | Pro | Pro | ||||||||||||||||||||||||||||||||||||
| Current | Forma | Current | Forma | Current | Forma | Current | Forma | Current | Forma | |||||||||||||||||||||||||||||||
Equity Index Fund | Class A | Class A | Class B | Class B | Class C | Class C | Class R | Class R | Class Y | Class Y | ||||||||||||||||||||||||||||||
| Management Fees | 0.47 | % | 0.27 | % | 0.47 | % | 0.27 | % | 0.47 | % | 0.27 | % | 0.47 | % | 0.27 | % | 0.47 | % | 0.27 | % | ||||||||||||||||||||
| Distribution (12b-1) Fees | 0.25 | % | 0.25 | % | 1.00 | % | 1.00 | % | 1.00 | % | 1.00 | % | 0.50 | % | 0.50 | % | 0.00 | % | 0.00 | % | ||||||||||||||||||||
| Other Expenses | 0.08 | % | 0.15 | % | 0.08 | % | 0.15 | % | 0.08 | % | 0.15 | % | 0.08 | % | 0.15 | % | 0.08 | % | 0.15 | % | ||||||||||||||||||||
| Gross Annual Operating Expenses | 0.80 | % | 0.67 | % | 1.55 | % | 1.42 | % | 1.55 | % | 1.42 | % | 1.05 | % | 0.92 | % | 0.55 | % | 0.42 | % | ||||||||||||||||||||
| Less Expense Reimbursement | (0.18 | )% | (0.05 | )% | (0.18 | )% | (0.05 | )% | (0.18 | )% | (0.05 | )% | (0.18 | )% | (0.05 | )% | (0.18 | )% | (0.05 | )% | ||||||||||||||||||||
| Net Annual Operating Expenses | 0.62 | % | 0.62 | % | 1.37 | % | 1.37 | % | 1.37 | % | 1.37 | % | 0.87 | % | 0.87 | % | 0.37 | % | 0.37 | % | ||||||||||||||||||||
| Pro | Pro | Pro | Pro | Pro | ||||||||||||||||||||||||||||||||||||
| Current | Forma | Current | Forma | Current | Forma | Current | Forma | Current | Forma | |||||||||||||||||||||||||||||||
Global Infrastructure Fund | Class A | Class A | Class B | Class B | Class C | Class C | Class R | Class R | Class Y | Class Y | ||||||||||||||||||||||||||||||
| Management Fees | 1.12 | % | 0.95 | % | — | — | 1.12 | % | 0.95 | % | 1.12 | % | 0.95 | % | 1.12 | % | 0.95 | % | ||||||||||||||||||||||
| Distribution (12b-1) Fees | 0.25 | % | 0.25 | % | — | — | 1.00 | % | 1.00 | % | 0.50 | % | 0.50 | % | 0.00 | % | 0.00 | % | ||||||||||||||||||||||
| Other Expenses | 0.60 | % | 0.62 | % | — | — | 0.60 | % | 0.62 | % | 0.60 | % | 0.62 | % | 0.60 | % | 0.62 | % | ||||||||||||||||||||||
| Gross Annual Operating Expenses | 1.97 | % | 1.82 | % | — | — | 2.72 | % | 2.57 | % | 2.22 | % | 2.07 | % | 1.72 | % | 1.57 | % | ||||||||||||||||||||||
| Less Expense Reimbursement | (0.72 | )% | (0.57 | )% | — | — | (0.72 | )% | (0.57 | )% | (0.72 | )% | (0.57 | )% | (0.72 | )% | (0.57 | )% | ||||||||||||||||||||||
| Net Annual Operating Expenses | 1.25 | % | 1.25 | % | — | — | 2.00 | % | 2.00 | % | 1.50 | % | 1.50 | % | 1.00 | % | 1.00 | % | ||||||||||||||||||||||
| Pro | Pro | Pro | Pro | Pro | ||||||||||||||||||||||||||||||||||||
| Current | Forma | Current | Forma | Current | Forma | Current | Forma | Current | Forma | |||||||||||||||||||||||||||||||
High Income Bond Fund | Class A | Class A | Class B | Class B | Class C | Class C | Class R | Class R | Class Y | Class Y | ||||||||||||||||||||||||||||||
| Management Fees | 0.92 | % | 0.79 | % | 0.92 | % | 0.79 | % | 0.92 | % | 0.79 | % | 0.92 | % | 0.79 | % | 0.92 | % | 0.79 | % | ||||||||||||||||||||
| Distribution (12b-1) Fees | 0.25 | % | 0.25 | % | 1.00 | % | 1.00 | % | 1.00 | % | 1.00 | % | 0.50 | % | 0.50 | % | 0.00 | % | 0.00 | % | ||||||||||||||||||||
| Other Expenses | 0.13 | % | 0.15 | % | 0.13 | % | 0.15 | % | 0.13 | % | 0.15 | % | 0.13 | % | 0.15 | % | 0.13 | % | 0.15 | % | ||||||||||||||||||||
| Acquired Fund Fees and Expenses | 0.06 | % | 0.06 | % | 0.06 | % | 0.06 | % | 0.06 | % | 0.06 | % | 0.06 | % | 0.06 | % | 0.06 | % | 0.06 | % | ||||||||||||||||||||
| Gross Annual Operating Expenses | 1.36 | % | 1.25 | % | 2.11 | % | 2.00 | % | 2.11 | % | 2.00 | % | 1.61 | % | 1.50 | % | 1.11 | % | 1.00 | % | ||||||||||||||||||||
| Less Expense Reimbursement | (0.20 | )% | (0.09 | )% | (0.20 | )% | (0.09 | )% | (0.20 | )% | (0.09 | )% | (0.20 | )% | (0.09 | )% | (0.20 | )% | (0.09 | )% | ||||||||||||||||||||
| Net Annual Operating Expenses | 1.16 | % | 1.16 | % | 1.91 | % | 1.91 | % | 1.91 | % | 1.91 | % | 1.41 | % | 1.41 | % | 0.91 | % | 0.91 | % | ||||||||||||||||||||
| Pro | Pro | Pro | Pro | Pro | ||||||||||||||||||||||||||||||||||||
| Current | Forma | Current | Forma | Current | Forma | Current | Forma | Current | Forma | |||||||||||||||||||||||||||||||
Inflation Protected Securities Fund | Class A | Class A | Class B | Class B | Class C | Class C | Class R | Class R | Class Y | Class Y | ||||||||||||||||||||||||||||||
| Management Fees | 0.72 | % | 0.64 | % | — | — | 0.72 | % | 0.64 | % | 0.72 | % | 0.64 | % | 0.72 | % | 0.64 | % | ||||||||||||||||||||||
| Distribution (12b-1) Fees | 0.25 | % | 0.25 | % | — | — | 1.00 | % | 1.00 | % | 0.50 | % | 0.50 | % | 0.00 | % | 0.00 | % | ||||||||||||||||||||||
| Other Expenses | 0.16 | % | 0.21 | % | — | — | 0.16 | % | 0.21 | % | 0.16 | % | 0.21 | % | 0.16 | % | 0.21 | % | ||||||||||||||||||||||
| Gross Annual Operating Expenses | 1.13 | % | 1.10 | % | — | — | 1.88 | % | 1.85 | % | 1.38 | % | 1.35 | % | 0.88 | % | 0.85 | % | ||||||||||||||||||||||
| Less Expense Reimbursement | (0.28 | )% | (0.25 | )% | — | — | (0.28 | )% | (0.25 | )% | (0.28 | )% | (0.25 | )% | (0.28 | )% | (0.25 | )% | ||||||||||||||||||||||
| Net Annual Operating Expenses | 0.85 | % | 0.85 | % | — | — | 1.60 | % | 1.60 | % | 1.10 | % | 1.10 | % | 0.60 | % | 0.60 | % | ||||||||||||||||||||||
| Pro | Pro | Pro | Pro | Pro | ||||||||||||||||||||||||||||||||||||
| Current | Forma | Current | Forma | Current | Forma | Current | Forma | Current | Forma | |||||||||||||||||||||||||||||||
Intermediate Government Bond Fund | Class A | Class A | Class B | Class B | Class C | Class C | Class R | Class R | Class Y | Class Y | ||||||||||||||||||||||||||||||
| Management Fees | 0.72 | % | 0.65 | % | — | — | 0.72 | % | 0.65 | % | 0.72 | % | 0.65 | % | 0.72 | % | 0.65 | % | ||||||||||||||||||||||
| Distribution (12b-1) Fees | 0.25 | % | 0.25 | % | — | — | 1.00 | % | 1.00 | % | 0.50 | % | 0.50 | % | 0.00 | % | 0.00 | % | ||||||||||||||||||||||
| Other Expenses | 0.28 | % | 0.17 | % | — | — | 0.28 | % | 0.17 | % | 0.28 | % | 0.17 | % | 0.28 | % | 0.17 | % | ||||||||||||||||||||||
| Acquired Fund Fees and Expenses | 0.01 | % | 0.01 | % | — | — | 0.01 | % | 0.01 | % | 0.01 | % | 0.01 | % | 0.01 | % | 0.01 | % | ||||||||||||||||||||||
| Gross Annual Operating Expenses | 1.26 | % | 1.08 | % | — | — | 2.01 | % | 1.83 | % | 1.51 | % | 1.33 | % | 1.01 | % | 0.83 | % | ||||||||||||||||||||||
| Less 12b-1 Fee Waiver/ Reimbursement | (0.10 | )% | (0.10 | )% | — | — | 0.00 | % | 0.00 | % | (0.10 | )% | 0.00 | % | 0.00 | % | 0.00 | % | ||||||||||||||||||||||
| Less Expense Reimbursement | (0.40 | )% | (0.22 | )% | — | — | (0.40 | )% | (0.22 | )% | (0.40 | )% | (0.22 | )% | (0.40 | )% | (0.22 | )% | ||||||||||||||||||||||
| Net Annual Operating Expenses | 0.76 | % | 0.76 | % | — | — | 1.61 | % | 1.61 | % | 1.01 | % | 1.11 | % | 0.61 | % | 0.61 | % | ||||||||||||||||||||||
Exhibit E-2
| Pro | Pro | Pro | Pro | Pro | ||||||||||||||||||||||||||||||||||||
| Current | Forma | Current | Forma | Current | Forma | Current | Forma | Current | Forma | |||||||||||||||||||||||||||||||
Intermediate Tax Free | Class A | Class A | Class B | Class B | Class C | Class C | Class R | Class R | Class Y | Class Y | ||||||||||||||||||||||||||||||
| Management Fees | 0.72 | % | 0.57 | % | — | — | 0.72 | % | 0.57 | % | — | — | 0.72 | % | 0.57 | % | ||||||||||||||||||||||||
| Distribution (12b-1) Fees | 0.25 | % | 0.20 | % | — | — | 0.65 | % | 0.65 | % | — | — | 0.00 | % | 0.00 | % | ||||||||||||||||||||||||
| Other Expenses | 0.04 | % | 0.06 | % | — | — | 0.04 | % | 0.06 | % | — | — | 0.04 | % | 0.06 | % | ||||||||||||||||||||||||
| Gross Annual Operating Expenses | 1.01 | % | 0.83 | % | — | — | 1.41 | % | 1.28 | % | — | — | 0.76 | % | 0.63 | % | ||||||||||||||||||||||||
| Less 12b-1 Fee Waiver/ Reimbursement | (0.20 | )% | (0.08 | )% | — | — | 0.00 | % | 0.00 | % | — | — | 0.00 | % | 0.00 | % | ||||||||||||||||||||||||
| Less Expense Reimbursement | (0.06 | )% | 0.00 | % | — | — | (0.06 | )% | 0.00 | % | — | — | (0.06 | )% | 0.00 | % | ||||||||||||||||||||||||
| Net Annual Operating Expenses | 0.75 | % | 0.75 | % | — | — | 1.35 | % | 1.28 | % | — | — | 0.70 | % | 0.63 | % | ||||||||||||||||||||||||
| Pro | Pro | Pro | Pro | Pro | ||||||||||||||||||||||||||||||||||||
| Current | Forma | Current | Forma | Current | Forma | Current | Forma | Current | Forma | |||||||||||||||||||||||||||||||
Intermediate Term Bond Fund | Class A | Class A | Class B | Class B | Class C | Class C | Class R | Class R | Class Y | Class Y | ||||||||||||||||||||||||||||||
| Management Fees | 0.72 | % | 0.63 | % | — | — | — | — | — | — | 0.72 | % | 0.63 | % | ||||||||||||||||||||||||||
| Distribution (12b-1) Fees | 0.25 | % | 0.25 | % | — | — | — | — | — | — | 0.00 | % | 0.00 | % | ||||||||||||||||||||||||||
| Other Expenses | 0.03 | % | 0.07 | % | — | — | — | — | — | — | 0.03 | % | 0.07 | % | ||||||||||||||||||||||||||
| Acquired Fund Fees and Expenses | 0.01 | % | 0.01 | % | — | — | — | — | — | — | 0.01 | % | 0.01 | % | ||||||||||||||||||||||||||
| Gross Annual Operating Expenses | 1.01 | % | 0.96 | % | — | — | — | — | — | — | 0.76 | % | 0.71 | % | ||||||||||||||||||||||||||
| Less 12b-1 Fee Waiver/ Reimbursement | (0.10 | )% | (0.10 | )% | — | — | — | — | — | — | 0.00 | % | 0.00 | % | ||||||||||||||||||||||||||
| Less Expense Reimbursement | (0.05 | )% | 0.00 | % | — | — | — | — | — | — | (0.05 | )% | 0.00 | % | ||||||||||||||||||||||||||
| Net Annual Operating Expenses | 0.86 | % | 0.86 | % | — | — | — | — | — | — | 0.71 | % | 0.71 | % | ||||||||||||||||||||||||||
| Pro | Pro | Pro | Pro | Pro | ||||||||||||||||||||||||||||||||||||
| Current | Forma | Current | Forma | Current | Forma | Current | Forma | Current | Forma | |||||||||||||||||||||||||||||||
International Fund | Class A | Class A | Class B | Class B | Class C | Class C | Class R | Class R | Class Y | Class Y | ||||||||||||||||||||||||||||||
| Management Fees | 1.22 | % | 1.03 | % | 1.22 | % | 1.03 | % | 1.22 | % | 1.03 | % | 1.22 | % | 1.03 | % | 1.22 | % | 1.03 | % | ||||||||||||||||||||
| Distribution (12b-1) Fees | 0.25 | % | 0.25 | % | 1.00 | % | 1.00 | % | 1.00 | % | 1.00 | % | 0.50 | % | 0.50 | % | 0.00 | % | 0.00 | % | ||||||||||||||||||||
| Other Expenses | 0.12 | % | 0.13 | % | 0.12 | % | 0.13 | % | 0.12 | % | 0.13 | % | 0.12 | % | 0.13 | % | 0.12 | % | 0.13 | % | ||||||||||||||||||||
| Acquired Fund Fees and Expenses | 0.01 | % | 0.01 | % | 0.01 | % | 0.01 | % | 0.01 | % | 0.01 | % | 0.01 | % | 0.01 | % | 0.01 | % | 0.01 | % | ||||||||||||||||||||
| Gross Annual Operating Expenses | 1.60 | % | 1.42 | % | 2.35 | % | 2.17 | % | 2.35 | % | 2.17 | % | 1.85 | % | 1.67 | % | 1.35 | % | 1.17 | % | ||||||||||||||||||||
| Less Expense Reimbursement | (0.10 | )% | 0.00 | % | (0.10 | )% | 0.00 | % | (0.10 | )% | 0.00 | % | (0.10 | )% | 0.00 | % | (0.10 | )% | 0.00 | % | ||||||||||||||||||||
| Net Annual Operating Expenses | 1.50 | % | 1.42 | % | 2.25 | % | 2.17 | % | 2.25 | % | 2.17 | % | 1.75 | % | 1.67 | % | 1.25 | % | 1.17 | % | ||||||||||||||||||||
| Pro | Pro | Pro | Pro | Pro | ||||||||||||||||||||||||||||||||||||
| Current | Forma | Current | Forma | Current | Forma | Current | Forma | Current | Forma | |||||||||||||||||||||||||||||||
International Select Fund | Class A | Class A | Class B | Class B | Class C | Class C | Class R | Class R | Class Y | Class Y | ||||||||||||||||||||||||||||||
| Management Fees | 1.22 | % | 1.03 | % | — | — | 1.22 | % | 1.03 | % | 1.22 | % | 1.03 | % | 1.22 | % | 1.03 | % | ||||||||||||||||||||||
| Distribution (12b-1) Fees | 0.25 | % | 0.25 | % | — | — | 1.00 | % | 1.00 | % | 0.50 | % | 0.50 | % | 0.00 | % | 0.00 | % | ||||||||||||||||||||||
| Other Expenses | 0.17 | % | 0.21 | % | — | — | 0.17 | % | 0.21 | % | 0.17 | % | 0.21 | % | 0.17 | % | 0.21 | % | ||||||||||||||||||||||
| Acquired Fund Fees and Expenses | 0.02 | % | 0.02 | % | — | — | 0.02 | % | 0.02 | % | 0.02 | % | 0.02 | % | 0.02 | % | 0.02 | % | ||||||||||||||||||||||
| Gross Annual Operating Expenses | 1.66 | % | 1.51 | % | — | — | 2.41 | % | 2.26 | % | 1.91 | % | 1.76 | % | 1.41 | % | 1.26 | % | ||||||||||||||||||||||
| Less Expense Reimbursement | (0.15 | )% | 0.00 | % | — | — | (0.15 | )% | 0.00 | % | (0.15 | )% | 0.00 | % | (0.15 | )% | 0.00 | % | ||||||||||||||||||||||
| Net Annual Operating Expenses | 1.51 | % | 1.51 | % | — | — | 2.26 | % | 2.26 | % | 1.76 | % | 1.76 | % | 1.26 | % | 1.26 | % | ||||||||||||||||||||||
| Pro | Pro | Pro | Pro | Pro | ||||||||||||||||||||||||||||||||||||
| Current | Forma | Current | Forma | Current | Forma | Current | Forma | Current | Forma | |||||||||||||||||||||||||||||||
Large Cap Growth Opportunities Fund | Class A | Class A | Class B | Class B | Class C | Class C | Class R | Class R | Class Y | Class Y | ||||||||||||||||||||||||||||||
| Management Fees | 0.87 | % | 0.83 | % | 0.87 | % | 0.83 | % | 0.87 | % | 0.83 | % | 0.87 | % | 0.83 | % | 0.87 | % | 0.83 | % | ||||||||||||||||||||
| Distribution (12b-1) Fees | 0.25 | % | 0.25 | % | 1.00 | % | 1.00 | % | 1.00 | % | 1.00 | % | 0.50 | % | 0.50 | % | 0.00 | % | 0.00 | % | ||||||||||||||||||||
| Other Expenses | 0.10 | % | 0.16 | % | 0.10 | % | 0.16 | % | 0.10 | % | 0.16 | % | 0.10 | % | 0.16 | % | 0.10 | % | 0.16 | % | ||||||||||||||||||||
| Gross Annual Operating Expenses | 1.22 | % | 1.24 | % | 1.97 | % | 1.99 | % | 1.97 | % | 1.99 | % | 1.47 | % | 1.49 | % | 0.97 | % | 0.99 | % | ||||||||||||||||||||
| Less Expense Reimbursement | 0.00 | % | (0.02 | )% | 0.00 | % | (0.02 | )% | 0.00 | % | (0.02 | )% | 0.00 | % | (0.02 | )% | 0.00 | % | (0.02 | )% | ||||||||||||||||||||
| Net Annual Operating Expenses | 1.22 | % | 1.22 | % | 1.97 | % | 1.97 | % | 1.97 | % | 1.97 | % | 1.47 | % | 1.47 | % | 0.97 | % | 0.97 | % | ||||||||||||||||||||
Exhibit E-3
| Pro | Pro | Pro | Pro | Pro | ||||||||||||||||||||||||||||||||||||
| Current | Forma | Current | Forma | Current | Forma | Current | Forma | Current | Forma | |||||||||||||||||||||||||||||||
Large Cap Select Fund | Class A | Class A | Class B | Class B | Class C | Class C | Class R | Class R | Class Y | Class Y | ||||||||||||||||||||||||||||||
| Management Fees | 0.87 | % | 0.75 | % | — | — | 0.87 | % | 0.75 | % | 0.87 | % | 0.75 | % | 0.87 | % | 0.75 | % | ||||||||||||||||||||||
| Distribution (12b-1) Fees | 0.25 | % | 0.25 | % | — | — | 1.00 | % | 1.00 | % | 0.50 | % | 0.50 | % | 0.00 | % | 0.00 | % | ||||||||||||||||||||||
| Other Expenses | 0.22 | % | 0.20 | % | — | — | 0.22 | % | 0.20 | % | 0.22 | % | 0.20 | % | 0.22 | % | 0.20 | % | ||||||||||||||||||||||
| Gross Annual Operating Expenses | 1.34 | % | 1.20 | % | — | — | 2.09 | % | 1.95 | % | 1.59 | % | 1.45 | % | 1.09 | % | 0.95 | % | ||||||||||||||||||||||
| Pro | Pro | Pro | Pro | Pro | ||||||||||||||||||||||||||||||||||||
| Current | Forma | Current | Forma | Current | Forma | Current | Forma | Current | Forma | |||||||||||||||||||||||||||||||
Large Cap Value Fund | Class A | Class A | Class B | Class B | Class C | Class C | Class R | Class R | Class Y | Class Y | ||||||||||||||||||||||||||||||
| Management Fees | 0.87 | % | 0.74 | % | 0.87 | % | 0.74 | % | 0.87 | % | 0.74 | % | 0.87 | % | 0.74 | % | 0.87 | % | 0.74 | % | ||||||||||||||||||||
| Distribution (12b-1) Fees | 0.25 | % | 0.25 | % | 1.00 | % | 1.00 | % | 1.00 | % | 1.00 | % | 0.50 | % | 0.50 | % | 0.00 | % | 0.00 | % | ||||||||||||||||||||
| Other Expenses | 0.16 | % | 0.19 | % | 0.16 | % | 0.19 | % | 0.16 | % | 0.19 | % | 0.16 | % | 0.19 | % | 0.16 | % | 0.19 | % | ||||||||||||||||||||
| Gross Annual Operating Expenses | 1.28 | % | 1.18 | % | 2.03 | % | 1.93 | % | 2.03 | % | 1.93 | % | 1.53 | % | 1.43 | % | 1.03 | % | 0.93 | % | ||||||||||||||||||||
| Pro | Pro | Pro | Pro | Pro | ||||||||||||||||||||||||||||||||||||
| Current | Forma | Current | Forma | Current | Forma | Current | Forma | Current | Forma | |||||||||||||||||||||||||||||||
Mid Cap Growth Opportunities Fund | Class A | Class A | Class B | Class B | Class C | Class C | Class R | Class R | Class Y | Class Y | ||||||||||||||||||||||||||||||
| Management Fees | 0.92 | % | 0.87 | % | 0.92 | % | 0.87 | % | 0.92 | % | 0.87 | % | 0.92 | % | 0.87 | % | 0.92 | % | 0.87 | % | ||||||||||||||||||||
| Distribution (12b-1) Fees | 0.25 | % | 0.25 | % | 1.00 | % | 1.00 | % | 1.00 | % | 1.00 | % | 0.50 | % | 0.50 | % | 0.00 | % | 0.00 | % | ||||||||||||||||||||
| Other Expenses | 0.06 | % | 0.14 | % | 0.06 | % | 0.14 | % | 0.06 | % | 0.14 | % | 0.06 | % | 0.14 | % | 0.06 | % | 0.14 | % | ||||||||||||||||||||
| Gross Annual Operating Expenses | 1.23 | % | 1.26 | % | 1.98 | % | 2.01 | % | 1.98 | % | 2.01 | % | 1.48 | % | 1.51 | % | 0.98 | % | 1.01 | % | ||||||||||||||||||||
| Less Expense Reimbursement | 0.00 | % | (0.03 | )% | 0.00 | % | (0.03 | )% | 0.00 | % | (0.03 | )% | 0.00 | % | (0.03 | )% | 0.00 | % | (0.03 | )% | ||||||||||||||||||||
| Net Annual Operating Expenses | 1.23 | % | 1.23 | % | 1.98 | % | 1.98 | % | 1.98 | % | 1.98 | % | 1.48 | % | 1.48 | % | 0.98 | % | 0.98 | % | ||||||||||||||||||||
| Pro | Pro | Pro | Pro | Pro | ||||||||||||||||||||||||||||||||||||
| Current | Forma | Current | Forma | Current | Forma | Current | Forma | Current | Forma | |||||||||||||||||||||||||||||||
Mid Cap Index Fund | Class A | Class A | Class B | Class B | Class C | Class C | Class R | Class R | Class Y | Class Y | ||||||||||||||||||||||||||||||
| Management Fees | 0.47 | % | 0.34 | % | — | — | 0.47 | % | 0.34 | % | 0.47 | % | 0.34 | % | 0.47 | % | 0.34 | % | ||||||||||||||||||||||
| Distribution (12b-1) Fees | 0.25 | % | 0.25 | % | — | — | 1.00 | % | 1.00 | % | 0.50 | % | 0.50 | % | 0.00 | % | 0.00 | % | ||||||||||||||||||||||
| Other Expenses | 0.14 | % | 0.18 | % | — | — | 0.14 | % | 0.18 | % | 0.14 | % | 0.18 | % | 0.14 | % | 0.18 | % | ||||||||||||||||||||||
| Acquired Fund Fees and Expenses | 0.02 | % | 0.02 | % | — | — | 0.02 | % | 0.02 | % | 0.02 | % | 0.02 | % | 0.02 | % | 0.02 | % | ||||||||||||||||||||||
| Gross Annual Operating Expenses | 0.88 | % | 0.79 | % | — | — | 1.63 | % | 1.54 | % | 1.13 | % | 1.04 | % | 0.63 | % | 0.54 | % | ||||||||||||||||||||||
| Less Expense Reimbursement | (0.11 | )% | (0.02 | )% | — | — | (0.11 | )% | (0.02 | )% | (0.11 | )% | (0.02 | )% | (0.11 | )% | (0.02 | )% | ||||||||||||||||||||||
| Net Annual Operating Expenses | 0.77 | % | 0.77 | % | — | — | 1.52 | % | 1.52 | % | 1.02 | % | 1.02 | % | 0.52 | % | 0.52 | % | ||||||||||||||||||||||
| Pro | Pro | Pro | Pro | Pro | ||||||||||||||||||||||||||||||||||||
| Current | Forma | Current | Forma | Current | Forma | Current | Forma | Current | Forma | |||||||||||||||||||||||||||||||
Mid Cap Select Fund | Class A | Class A | Class B | Class B | Class C | Class C | Class R | Class R | Class Y | Class Y | ||||||||||||||||||||||||||||||
| Management Fees | 0.92 | % | 0.90 | % | 0.92 | % | 0.90 | % | 0.92 | % | 0.90 | % | — | — | 0.92 | % | 0.90 | % | ||||||||||||||||||||||
| Distribution (12b-1) Fees | 0.25 | % | 0.25 | % | 1.00 | % | 1.00 | % | 1.00 | % | 1.00 | % | — | — | 0.00 | % | 0.00 | % | ||||||||||||||||||||||
| Other Expenses | 0.77 | % | 0.66 | % | 0.77 | % | 0.66 | % | 0.77 | % | 0.66 | % | — | — | 0.77 | % | 0.66 | % | ||||||||||||||||||||||
| Gross Annual Operating Expenses | 1.94 | % | 1.81 | % | 2.69 | % | 2.56 | % | 2.69 | % | 2.56 | % | — | — | 1.69 | % | 1.56 | % | ||||||||||||||||||||||
| Less Expense Reimbursement | (0.53 | )% | (0.40 | )% | (0.53 | )% | (0.40 | )% | (0.53 | )% | (0.40 | )% | — | — | (0.53 | )% | (0.40 | )% | ||||||||||||||||||||||
| Net Annual Operating Expenses | 1.41 | % | 1.41 | % | 2.16 | % | 2.16 | % | 2.16 | % | 2.16 | % | — | — | 1.16 | % | 1.16 | % | ||||||||||||||||||||||
| Pro | Pro | Pro | Pro | Pro | ||||||||||||||||||||||||||||||||||||
| Current | Forma | Current | Forma | Current | Forma | Current | Forma | Current | Forma | |||||||||||||||||||||||||||||||
Mid Cap Value Fund | Class A | Class A | Class B | Class B | Class C | Class C | Class R | Class R | Class Y | Class Y | ||||||||||||||||||||||||||||||
| Management Fees | 0.92 | % | 0.88 | % | 0.92 | % | 0.88 | % | 0.92 | % | 0.88 | % | 0.92 | % | 0.88 | % | 0.92 | % | 0.88 | % | ||||||||||||||||||||
| Distribution (12b-1) Fees | 0.25 | % | 0.25 | % | 1.00 | % | 1.00 | % | 1.00 | % | 1.00 | % | 0.50 | % | 0.50 | % | 0.00 | % | 0.00 | % | ||||||||||||||||||||
| Other Expenses | 0.09 | % | 0.17 | % | 0.09 | % | 0.17 | % | 0.09 | % | 0.17 | % | 0.09 | % | 0.17 | % | 0.09 | % | 0.17 | % | ||||||||||||||||||||
| Gross Annual Operating Expenses | 1.26 | % | 1.30 | % | 2.01 | % | 2.05 | % | 2.01 | % | 2.05 | % | 1.51 | % | 1.55 | % | 1.01 | % | 1.05 | % | ||||||||||||||||||||
| Less Expense Reimbursement | 0.00 | % | (0.04 | )% | 0.00 | % | (0.04 | )% | 0.00 | % | (0.04 | )% | 0.00 | % | (0.04 | )% | 0.00 | % | (0.04 | )% | ||||||||||||||||||||
| Net Annual Operating Expenses | 1.26 | % | 1.26 | % | 2.01 | % | 2.01 | % | 2.01 | % | 2.01 | % | 1.51 | % | 1.51 | % | 1.01 | % | 1.01 | % | ||||||||||||||||||||
Exhibit E-4
| Pro | Pro | Pro | Pro | Pro | ||||||||||||||||||||||||||||||||||||
| Current | Forma | Current | Forma | Current | Forma | Current | Forma | Current | Forma | |||||||||||||||||||||||||||||||
Minnesota Intermediate Tax Free Fund | Class A | Class A | Class B | Class B | Class C | Class C | Class R | Class R | Class Y | Class Y | ||||||||||||||||||||||||||||||
| Management Fees | 0.72 | % | 0.54 | % | — | — | 0.72 | % | 0.54 | % | — | — | 0.72 | % | 0.54 | % | ||||||||||||||||||||||||
| Distribution (12b-1) Fees | 0.25 | % | 0.20 | % | — | — | 0.65 | % | 0.65 | % | — | — | 0.00 | % | 0.00 | % | ||||||||||||||||||||||||
| Other Expenses | 0.12 | % | 0.07 | % | — | — | 0.12 | % | 0.07 | % | — | — | 0.12 | % | 0.07 | % | ||||||||||||||||||||||||
| Acquired Fund Fees and Expenses | 0.01 | % | 0.01 | % | — | — | 0.01 | % | 0.01 | % | — | — | 0.01 | % | 0.01 | % | ||||||||||||||||||||||||
| Gross Annual Operating Expenses | 1.10 | % | 0.82 | % | — | — | 1.50 | % | 1.27 | % | — | — | 0.85 | % | 0.62 | % | ||||||||||||||||||||||||
| Less 12b-1 Fee Waiver/ Reimbursement | (0.20 | )% | (0.06 | )% | — | — | 0.00 | % | 0.00 | % | — | — | 0.00 | % | 0.00 | % | ||||||||||||||||||||||||
| Less Expense Reimbursement | (0.14 | )% | 0.00 | % | — | — | (0.14 | )% | 0.00 | % | — | — | (0.14 | )% | 0.00 | % | ||||||||||||||||||||||||
| Net Annual Operating Expenses | 0.76 | % | 0.76 | % | — | — | 1.36 | % | 1.27 | % | — | — | 0.71 | % | 0.62 | % | ||||||||||||||||||||||||
| Pro | Pro | Pro | Pro | Pro | ||||||||||||||||||||||||||||||||||||
| Current | Forma | Current | Forma | Current | Forma | Current | Forma | Current | Forma | |||||||||||||||||||||||||||||||
Minnesota Tax Free Fund | Class A | Class A | Class B | Class B | Class C | Class C | Class R | Class R | Class Y | Class Y | ||||||||||||||||||||||||||||||
| Management Fees | 0.72 | % | 0.54 | % | — | — | 0.72 | % | 0.54 | % | — | — | 0.72 | % | 0.54 | % | ||||||||||||||||||||||||
| Distribution (12b-1) Fees | 0.25 | % | 0.20 | % | — | — | 0.65 | % | 0.65 | % | — | — | 0.00 | % | 0.00 | % | ||||||||||||||||||||||||
| Other Expenses | 0.14 | % | 0.11 | % | — | — | 0.14 | % | 0.11 | % | — | — | 0.14 | % | 0.11 | % | ||||||||||||||||||||||||
| Acquired Fund Fees and Expenses | 0.01 | % | 0.01 | % | — | — | 0.01 | % | 0.01 | % | — | — | 0.01 | % | 0.01 | % | ||||||||||||||||||||||||
| Gross Annual Operating Expenses | 1.12 | % | 0.86 | % | — | — | 1.52 | % | 1.31 | % | — | — | 0.87 | % | 0.66 | % | ||||||||||||||||||||||||
| Less 12b-1 Fee Waiver/ Reimbursement | (0.10 | )% | (0.01 | )% | — | — | 0.00 | % | 0.00 | % | — | — | 0.00 | % | 0.00 | % | ||||||||||||||||||||||||
| Less Expense Reimbursement | (0.17 | )% | 0.00 | % | — | — | (0.17 | )% | 0.00 | % | — | — | (0.17 | )% | 0.00 | % | ||||||||||||||||||||||||
| Net Annual Operating Expenses | 0.85 | % | 0.85 | % | — | — | 1.35 | % | 1.31 | % | — | — | 0.70 | % | 0.66 | % | ||||||||||||||||||||||||
| Pro | Pro | Pro | Pro | Pro | ||||||||||||||||||||||||||||||||||||
| Current | Forma | Current | Forma | Current | Forma | Current | Forma | Current | Forma | |||||||||||||||||||||||||||||||
Missouri Tax Free Fund | Class A | Class A | Class B | Class B | Class C | Class C | Class R | Class R | Class Y | Class Y | ||||||||||||||||||||||||||||||
| Management Fees | 0.72 | % | 0.65 | % | — | — | 0.72 | % | 0.65 | % | — | — | 0.72 | % | 0.65 | % | ||||||||||||||||||||||||
| Distribution (12b-1) Fees | 0.25 | % | 0.20 | % | — | — | 0.65 | % | 0.65 | % | — | — | 0.00 | % | 0.00 | % | ||||||||||||||||||||||||
| Other Expenses | 0.12 | % | 0.08 | % | — | — | 0.12 | % | 0.08 | % | — | — | 0.12 | % | 0.08 | % | ||||||||||||||||||||||||
| Gross Annual Operating Expenses | 1.09 | % | 0.93 | % | — | — | 1.49 | % | 1.38 | % | — | — | 0.84 | % | 0.73 | % | ||||||||||||||||||||||||
| Less 12b-1 Fee Waiver/ Reimbursement | (0.10 | )% | (0.05 | )% | — | — | 0.00 | % | 0.00 | % | — | — | 0.00 | % | 0.00 | % | ||||||||||||||||||||||||
| Less Expense Reimbursement | (0.15 | )% | (0.04 | )% | — | — | (0.15 | )% | (0.04 | )% | — | — | (0.15 | )% | (0.04 | )% | ||||||||||||||||||||||||
| Net Annual Operating Expenses | 0.84 | % | 0.84 | % | — | — | 1.34 | % | 1.34 | % | — | — | 0.69 | % | 0.69 | % | ||||||||||||||||||||||||
| Pro | Pro | Pro | Pro | Pro | ||||||||||||||||||||||||||||||||||||
| Current | Forma | Current | Forma | Current | Forma | Current | Forma | Current | Forma | |||||||||||||||||||||||||||||||
Nebraska Tax Free Fund | Class A | Class A | Class B | Class B | Class C | Class C | Class R | Class R | Class Y | Class Y | ||||||||||||||||||||||||||||||
| Management Fees | 0.72 | % | 0.55 | % | — | — | 0.72 | % | 0.55 | % | — | — | 0.72 | % | 0.55 | % | ||||||||||||||||||||||||
| Distribution (12b-1) Fees | 0.25 | % | 0.20 | % | — | — | 0.65 | % | 0.65 | % | — | — | 0.00 | % | 0.00 | % | ||||||||||||||||||||||||
| Other Expenses | 0.46 | % | 0.20 | % | — | — | 0.46 | % | 0.20 | % | — | — | 0.46 | % | 0.20 | % | ||||||||||||||||||||||||
| Acquired Fund Fees and Expenses | 0.01 | % | 0.01 | % | — | — | 0.01 | % | 0.01 | % | — | — | 0.01 | % | 0.01 | % | ||||||||||||||||||||||||
| Gross Annual Operating Expenses | 1.44 | % | 0.96 | % | — | — | 1.84 | % | 1.41 | % | — | — | 1.19 | % | 0.76 | % | ||||||||||||||||||||||||
| Less 12b-1 Fee Waiver/ Reimbursement | 0.00 | % | 0.00 | % | — | — | 0.00 | % | 0.00 | % | — | — | 0.00 | % | 0.00 | % | ||||||||||||||||||||||||
| Less Expense Reimbursement | (0.68 | )% | (0.25 | )% | — | — | (0.68 | )% | (0.25 | )% | — | — | (0.68 | )% | (0.25 | )% | ||||||||||||||||||||||||
| Net Annual Operating Expenses | 0.76 | % | 0.71 | % | — | — | 1.16 | % | 1.16 | % | — | — | 0.51 | % | 0.51 | % | ||||||||||||||||||||||||
Exhibit E-5
| Pro | Pro | Pro | Pro | Pro | ||||||||||||||||||||||||||||||||||||
| Current | Forma | Current | Forma | Current | Forma | Current | Forma | Current | Forma | |||||||||||||||||||||||||||||||
Ohio Tax Free Fund | Class A | Class A | Class B | Class B | Class C | Class C | Class R | Class R | Class Y | Class Y | ||||||||||||||||||||||||||||||
| Management Fees | 0.72 | % | 0.65 | % | — | — | 0.72 | % | 0.65 | % | — | — | 0.72 | % | 0.65 | % | ||||||||||||||||||||||||
| Distribution (12b-1) Fees | 0.25 | % | 0.20 | % | — | — | 0.65 | % | 0.65 | % | — | — | 0.00 | % | 0.00 | % | ||||||||||||||||||||||||
| Other Expenses | 0.33 | % | 0.14 | % | — | — | 0.33 | % | 0.14 | % | — | — | 0.33 | % | 0.14 | % | ||||||||||||||||||||||||
| Acquired Fund Fees and Expenses | 0.01 | % | 0.01 | % | — | — | 0.01 | % | 0.01 | % | — | — | 0.01 | % | 0.01 | % | ||||||||||||||||||||||||
| Gross Annual Operating Expenses | 1.31 | % | 1.00 | % | — | — | 1.71 | % | 1.45 | % | — | — | 1.06 | % | 0.80 | % | ||||||||||||||||||||||||
| Less 12b-1 Fee Waiver/ Reimbursement | 0.00 | % | 0.00 | % | — | — | 0.00 | % | 0.00 | % | — | — | 0.00 | % | 0.00 | % | ||||||||||||||||||||||||
| Less Expense Reimbursement | (0.55 | )% | (0.29 | )% | — | — | (0.55 | )% | (0.29 | )% | — | — | (0.55 | )% | (0.29 | )% | ||||||||||||||||||||||||
| Net Annual Operating Expenses | 0.76 | % | 0.71 | % | — | — | 1.16 | % | 1.16 | % | — | — | 0.51 | % | 0.51 | % | ||||||||||||||||||||||||
| Pro | Pro | Pro | Pro | Pro | ||||||||||||||||||||||||||||||||||||
| Current | Forma | Current | Forma | Current | Forma | Current | Forma | Current | Forma | |||||||||||||||||||||||||||||||
Oregon Intermediate Tax Free Fund | Class A | Class A | Class B | Class B | Class C | Class C | Class R | Class R | Class Y | Class Y | ||||||||||||||||||||||||||||||
| Management Fees | 0.72 | % | 0.55 | % | — | — | — | — | — | — | 0.72 | % | 0.55 | % | ||||||||||||||||||||||||||
| Distribution (12b-1) Fees | 0.25 | % | 0.20 | % | — | — | — | — | — | — | 0.00 | % | 0.00 | % | ||||||||||||||||||||||||||
| Other Expenses | 0.11 | % | 0.06 | % | — | — | — | — | — | — | 0.11 | % | 0.06 | % | ||||||||||||||||||||||||||
| Gross Annual Operating Expenses | 1.08 | % | 0.81 | % | — | — | — | — | — | — | 0.83 | % | 0.61 | % | ||||||||||||||||||||||||||
| Less 12b-1 Fee Waiver/ Reimbursement | (0.10 | )% | 0.00 | % | — | — | — | — | — | — | 0.00 | % | 0.00 | % | ||||||||||||||||||||||||||
| Less Expense Reimbursement | (0.14 | )% | 0.00 | % | — | — | — | — | — | — | (0.14 | )% | 0.00 | % | ||||||||||||||||||||||||||
| Net Annual Operating Expenses | 0.84 | % | 0.81 | % | — | — | — | — | — | — | 0.69 | % | 0.61 | % | ||||||||||||||||||||||||||
| Pro | Pro | Pro | Pro | Pro | ||||||||||||||||||||||||||||||||||||
| Current | Forma | Current | Forma | Current | Forma | Current | Forma | Current | Forma | |||||||||||||||||||||||||||||||
Quantitative Large Cap Core Fund | Class A | Class A | Class B | Class B | Class C | Class C | Class R | Class R | Class Y | Class Y | ||||||||||||||||||||||||||||||
| Management Fees | 0.52 | % | 0.50 | % | — | — | 0.52 | % | 0.50 | % | 0.52 | % | 0.50 | % | 0.52 | % | 0.50 | % | ||||||||||||||||||||||
| Distribution (12b-1) Fees | 0.25 | % | 0.25 | % | — | — | 1.00 | % | 1.00 | % | 0.50 | % | 0.50 | % | 0.00 | % | 0.00 | % | ||||||||||||||||||||||
| Other Expenses | 0.19 | % | 0.19 | % | — | — | 0.19 | % | 0.19 | % | 0.19 | % | 0.19 | % | 0.19 | % | 0.19 | % | ||||||||||||||||||||||
| Acquired Fund Fees and Expenses | 0.02 | % | 0.02 | % | — | — | 0.02 | % | 0.02 | % | 0.02 | % | 0.02 | % | 0.02 | % | 0.02 | % | ||||||||||||||||||||||
| Gross Annual Operating Expenses | 0.98 | % | 0.96 | % | — | — | 1.73 | % | 1.71 | % | 1.23 | % | 1.21 | % | 0.73 | % | 0.71 | % | ||||||||||||||||||||||
| Less Expense Reimbursement | (0.26 | )% | (0.24 | )% | — | — | (0.26 | )% | (0.24 | )% | (0.26 | )% | (0.24 | )% | (0.26 | )% | (0.24 | )% | ||||||||||||||||||||||
| Net Annual Operating Expenses | 0.72 | % | 0.72 | % | — | — | 1.47 | % | 1.47 | % | 0.97 | % | 0.97 | % | 0.47 | % | 0.47 | % | ||||||||||||||||||||||
| Pro | Pro | Pro | Pro | Pro | ||||||||||||||||||||||||||||||||||||
| Current | Forma | Current | Forma | Current | Forma | Current | Forma | Current | Forma | |||||||||||||||||||||||||||||||
Real Estate Securities Fund | Class A | Class A | Class B | Class B | Class C | Class C | Class R | Class R | Class Y | Class Y | �� | |||||||||||||||||||||||||||||
| Management Fees | 0.92 | % | 0.87 | % | 0.92 | % | 0.87 | % | 0.92 | % | 0.87 | % | 0.92 | % | 0.87 | % | 0.92 | % | 0.87 | % | ||||||||||||||||||||
| Distribution (12b-1) Fees | 0.25 | % | 0.25 | % | 1.00 | % | 1.00 | % | 1.00 | % | 1.00 | % | 0.50 | % | 0.50 | % | 0.00 | % | 0.00 | % | ||||||||||||||||||||
| Other Expenses | 0.06 | % | 0.22 | % | 0.06 | % | 0.22 | % | 0.06 | % | 0.22 | % | 0.06 | % | 0.22 | % | 0.06 | % | 0.22 | % | ||||||||||||||||||||
| Gross Annual Operating Expenses | 1.23 | % | 1.34 | % | 1.98 | % | 2.09 | % | 1.98 | % | 2.09 | % | 1.48 | % | 1.59 | % | 0.98 | % | 1.09 | % | ||||||||||||||||||||
| Less Expense Reimbursement | 0.00 | % | (0.11 | )% | 0.00 | % | (0.11 | )% | 0.00 | % | (0.11 | )% | 0.00 | % | (0.11 | )% | 0.00 | % | (0.11 | )% | ||||||||||||||||||||
| Net Annual Operating Expenses | 1.23 | % | 1.23 | % | 1.98 | % | 1.98 | % | 1.98 | % | 1.98 | % | 1.48 | % | 1.48 | % | 0.98 | % | 0.98 | % | ||||||||||||||||||||
| Pro | Pro | Pro | Pro | Pro | ||||||||||||||||||||||||||||||||||||
| Current | Forma | Current | Forma | Current | Forma | Current | Forma | Current | Forma | |||||||||||||||||||||||||||||||
Short Tax Free Fund | Class A | Class A | Class B | Class B | Class C | Class C | Class R | Class R | Class Y | Class Y | ||||||||||||||||||||||||||||||
| Management Fees | 0.72 | % | 0.44 | % | — | — | — | — | — | — | 0.72 | % | 0.44 | % | ||||||||||||||||||||||||||
| Distribution (12b-1) Fees | 0.25 | % | 0.20 | % | — | — | — | — | — | — | 0.00 | % | 0.00 | % | ||||||||||||||||||||||||||
| Other Expenses | 0.09 | % | 0.07 | % | — | — | — | — | — | — | 0.09 | % | 0.07 | % | ||||||||||||||||||||||||||
| Acquired Fund Fees and Expenses | 0.01 | % | 0.01 | % | — | — | — | — | — | — | 0.01 | % | 0.01 | % | ||||||||||||||||||||||||||
| Gross Annual Operating Expenses | 1.07 | % | 0.72 | % | — | — | — | — | — | — | 0.82 | % | 0.52 | % | ||||||||||||||||||||||||||
| Less 12b-1 Fee Waiver/ Reimbursement | (0.10 | )% | 0.00 | % | — | — | — | — | — | — | 0.00 | % | 0.00 | % | ||||||||||||||||||||||||||
| Less Expense Reimbursement | (0.22 | )% | 0.00 | % | — | — | — | — | — | — | (0.22 | )% | 0.00 | % | ||||||||||||||||||||||||||
| Net Annual Operating Expenses | 0.75 | % | 0.72 | % | — | — | — | — | — | — | 0.60 | % | 0.52 | % | ||||||||||||||||||||||||||
Exhibit E-6
| Pro | Pro | Pro | Pro | Pro | ||||||||||||||||||||||||||||||||||||
| Current | Forma | Current | Forma | Current | Forma | Current | Forma | Current | Forma | |||||||||||||||||||||||||||||||
Short Term Bond Fund | Class A | Class A | Class B | Class B | Class C | Class C | Class R | Class R | Class Y | Class Y | ||||||||||||||||||||||||||||||
| Management Fees | 0.72 | % | 0.48 | % | — | — | 0.72 | % | 0.48 | % | — | — | 0.72 | % | 0.48 | % | ||||||||||||||||||||||||
| Distribution (12b-1) Fees | 0.25 | % | 0.25 | % | — | — | 1.00 | % | 1.00 | % | — | — | 0.00 | % | 0.00 | % | ||||||||||||||||||||||||
| Other Expenses | 0.08 | % | 0.07 | % | — | — | 0.08 | % | 0.07 | % | — | — | 0.08 | % | 0.07 | % | ||||||||||||||||||||||||
| Acquired Fund Fees and Expenses | 0.01 | % | 0.01 | % | — | — | 0.01 | % | 0.01 | % | — | — | 0.01 | % | 0.01 | % | ||||||||||||||||||||||||
| Gross Annual Operating Expenses | 1.06 | % | 0.81 | % | — | — | 1.81 | % | 1.56 | % | — | — | 0.81 | % | 0.56 | % | ||||||||||||||||||||||||
| Less 12b-1 Fee Waiver/ Reimbursement | (0.10 | )% | (0.05 | )% | — | — | 0.00 | % | 0.00 | % | — | — | 0.00 | % | 0.00 | % | ||||||||||||||||||||||||
| Less Expense Reimbursement | (0.20 | )% | 0.00 | % | — | — | (0.20 | )% | 0.00 | % | — | — | (0.20 | )% | 0.00 | % | ||||||||||||||||||||||||
| Net Annual Operating Expenses | 0.76 | % | 0.76 | % | — | — | 1.61 | % | 1.56 | % | — | — | 0.61 | % | 0.56 | % | ||||||||||||||||||||||||
| Pro | Pro | Pro | Pro | Pro | ||||||||||||||||||||||||||||||||||||
| Current | Forma | Current | Forma | Current | Forma | Current | Forma | Current | Forma | |||||||||||||||||||||||||||||||
Small Cap Growth Opportunities Fund | Class A | Class A | Class B | Class B | Class C | Class C | Class R | Class R | Class Y | Class Y | ||||||||||||||||||||||||||||||
| Management Fees | 1.22 | % | 1.00 | % | 1.22 | % | 1.00 | % | 1.22 | % | 1.00 | % | 1.22 | % | 1.00 | % | 1.22 | % | 1.00 | % | ||||||||||||||||||||
| Distribution (12b-1) Fees | 0.25 | % | 0.25 | % | 1.00 | % | 1.00 | % | 1.00 | % | 1.00 | % | 0.50 | % | 0.50 | % | 0.00 | % | 0.00 | % | ||||||||||||||||||||
| Other Expenses | 0.24 | % | 0.34 | % | 0.24 | % | 0.34 | % | 0.24 | % | 0.34 | % | 0.24 | % | 0.34 | % | 0.24 | % | 0.34 | % | ||||||||||||||||||||
| Acquired Fund Fees and Expenses | 0.01 | % | 0.01 | % | 0.01 | % | 0.01 | % | 0.01 | % | 0.01 | % | 0.01 | % | 0.01 | % | 0.01 | % | 0.01 | % | ||||||||||||||||||||
| Gross Annual Operating Expenses | 1.72 | % | 1.60 | % | 2.47 | % | 2.35 | % | 2.47 | % | 2.35 | % | 1.97 | % | 1.85 | % | 1.47 | % | 1.35 | % | ||||||||||||||||||||
| Less Expense Reimbursement | (0.24 | )% | (0.12 | )% | (0.24 | )% | (0.12 | )% | (0.24 | )% | (0.12 | )% | (0.24 | )% | (0.12 | )% | (0.24 | )% | (0.12 | )% | ||||||||||||||||||||
| Net Annual Operating Expenses | 1.48 | % | 1.48 | % | 2.23 | % | 2.23 | % | 2.23 | % | 2.23 | % | 1.73 | % | 1.73 | % | 1.23 | % | 1.23 | % | ||||||||||||||||||||
| Pro | Pro | Pro | Pro | Pro | ||||||||||||||||||||||||||||||||||||
| Current | Forma | Current | Forma | Current | Forma | Current | Forma | Current | Forma | |||||||||||||||||||||||||||||||
Small Cap Index Fund | Class A | Class A | Class B | Class B | Class C | Class C | Class R | Class R | Class Y | Class Y | ||||||||||||||||||||||||||||||
| Management Fees | 0.62 | % | 0.35 | % | — | — | 0.62 | % | 0.35 | % | 0.62 | % | 0.35 | % | 0.62 | % | 0.35 | % | ||||||||||||||||||||||
| Distribution (12b-1) Fees | 0.25 | % | 0.25 | % | — | — | 1.00 | % | 1.00 | % | 0.50 | % | 0.50 | % | 0.00 | % | 0.00 | % | ||||||||||||||||||||||
| Other Expenses | 0.62 | % | 0.52 | % | — | — | 0.62 | % | 0.52 | % | 0.62 | % | 0.52 | % | 0.62 | % | 0.52 | % | ||||||||||||||||||||||
| Acquired Fund Fees and Expenses | 0.05 | % | 0.05 | % | — | — | 0.05 | % | 0.05 | % | 0.05 | % | 0.05 | % | 0.05 | % | 0.05 | % | ||||||||||||||||||||||
| Gross Annual Operating Expenses | 1.54 | % | 1.17 | % | — | — | 2.29 | % | 1.92 | % | 1.79 | % | 1.42 | % | 1.29 | % | 0.92 | % | ||||||||||||||||||||||
| Less Expense Reimbursement | (0.66 | )% | (0.29 | )% | — | — | (0.66 | )% | (0.29 | )% | (0.66 | )% | (0.29 | )% | (0.66 | )% | (0.29 | )% | ||||||||||||||||||||||
| Net Annual Operating Expenses | 0.88 | % | 0.88 | % | — | — | 1.63 | % | 1.63 | % | 1.13 | % | 1.13 | % | 0.63 | % | 0.63 | % | ||||||||||||||||||||||
| Pro | Pro | Pro | Pro | Pro | ||||||||||||||||||||||||||||||||||||
| Current | Forma | Current | Forma | Current | Forma | Current | Forma | Current | Forma | |||||||||||||||||||||||||||||||
Small Cap Select Fund | Class A | Class A | Class B | Class B | Class C | Class C | Class R | Class R | Class Y | Class Y | ||||||||||||||||||||||||||||||
| Management Fees | 0.92 | % | 0.88 | % | 0.92 | % | 0.88 | % | 0.92 | % | 0.88 | % | 0.92 | % | 0.88 | % | 0.92 | % | 0.88 | % | ||||||||||||||||||||
| Distribution (12b-1) Fees | 0.25 | % | 0.25 | % | 1.00 | % | 1.00 | % | 1.00 | % | 1.00 | % | 0.50 | % | 0.50 | % | 0.00 | % | 0.00 | % | ||||||||||||||||||||
| Other Expenses | 0.08 | % | 0.20 | % | 0.08 | % | 0.20 | % | 0.08 | % | 0.20 | % | 0.08 | % | 0.20 | % | 0.08 | % | 0.20 | % | ||||||||||||||||||||
| Acquired Fund Fees and Expenses | 0.01 | % | 0.01 | % | 0.01 | % | 0.01 | % | 0.01 | % | 0.01 | % | 0.01 | % | 0.01 | % | 0.01 | % | 0.01 | % | ||||||||||||||||||||
| Gross Annual Operating Expenses | 1.26 | % | 1.34 | % | 2.01 | % | 2.09 | % | 2.01 | % | 2.09 | % | 1.51 | % | 1.59 | % | 1.01 | % | 1.09 | % | ||||||||||||||||||||
| Less Expense Reimbursement | 0.00 | % | (0.08 | )% | 0.00 | % | (0.08 | )% | 0.00 | % | (0.08 | )% | 0.00 | % | (0.08 | )% | 0.00 | % | (0.08 | )% | ||||||||||||||||||||
| Net Annual Operating Expenses | 1.26 | % | 1.26 | % | 2.01 | % | 2.01 | % | 2.01 | % | 2.01 | % | 1.51 | % | 1.51 | % | 1.01 | % | 1.01 | % | ||||||||||||||||||||
| Pro | Pro | Pro | Pro | Pro | ||||||||||||||||||||||||||||||||||||
| Current | Forma | Current | Forma | Current | Forma | Current | Forma | Current | Forma | |||||||||||||||||||||||||||||||
Small Cap Value Fund | Class A | Class A | Class B | Class B | Class C | Class C | Class R | Class R | Class Y | Class Y | ||||||||||||||||||||||||||||||
| Management Fees | 0.92 | % | 0.90 | % | — | — | 0.92 | % | 0.90 | % | 0.92 | % | 0.90 | % | 0.92 | % | 0.90 | % | ||||||||||||||||||||||
| Distribution (12b-1) Fees | 0.25 | % | 0.25 | % | — | — | 1.00 | % | 1.00 | % | 0.50 | % | 0.50 | % | 0.00 | % | 0.00 | % | ||||||||||||||||||||||
| Other Expenses | 0.27 | % | 0.34 | % | — | — | 0.27 | % | 0.34 | % | 0.27 | % | 0.34 | % | 0.27 | % | 0.34 | % | ||||||||||||||||||||||
| Acquired Fund Fees and Expenses | 0.01 | % | 0.01 | % | — | — | 0.01 | % | 0.01 | % | 0.01 | % | 0.01 | % | 0.01 | % | 0.01 | % | ||||||||||||||||||||||
| Gross Annual Operating Expenses | 1.45 | % | 1.50 | % | — | — | 2.20 | % | 2.25 | % | 1.70 | % | 1.75 | % | 1.20 | % | 1.25 | % | ||||||||||||||||||||||
| Less Expense Reimbursement | 0.00 | % | (0.05 | )% | — | — | 0.00 | % | (0.05 | )% | 0.00 | % | (0.05 | )% | 0.00 | % | (0.05 | )% | ||||||||||||||||||||||
| Net Annual Operating Expenses | 1.45 | % | 1.45 | % | — | — | 2.20 | % | 2.20 | % | 1.70 | % | 1.70 | % | 1.20 | % | 1.20 | % | ||||||||||||||||||||||
Exhibit E-7
| Pro | Pro | Pro | Pro | Pro | ||||||||||||||||||||||||||||||||||||
| Current | Forma | Current | Forma | Current | Forma | Current | Forma | Current | Forma | |||||||||||||||||||||||||||||||
Tactical Market Opportunities Fund | Class A | Class A | Class B | Class B | Class C | Class C | Class R | Class R | Class Y | Class Y | ||||||||||||||||||||||||||||||
| Management Fees | — | — | — | — | — | — | — | — | 0.91 | % | 0.80 | % | ||||||||||||||||||||||||||||
| Distribution (12b-1) Fees | — | — | — | — | — | — | — | — | 0.00 | % | 0.00 | % | ||||||||||||||||||||||||||||
| Other Expenses | — | — | — | — | — | — | — | — | 5.64 | % | 3.17 | % | ||||||||||||||||||||||||||||
| Acquired Fund Fees and Expenses | — | — | — | — | — | — | — | — | 0.11 | % | 0.11 | % | ||||||||||||||||||||||||||||
| Gross Annual Operating Expenses | — | — | — | — | — | — | — | — | 6.66 | % | 4.08 | % | ||||||||||||||||||||||||||||
| Less Expense Reimbursement | — | — | — | — | — | — | — | — | (5.60 | )% | (3.02 | )% | ||||||||||||||||||||||||||||
| Net Annual Operating Expenses | — | — | — | — | — | — | — | — | 1.06 | % | 1.06 | % | ||||||||||||||||||||||||||||
| Pro | Pro | Pro | Pro | Pro | ||||||||||||||||||||||||||||||||||||
| Current | Forma | Current | Forma | Current | Forma | Current | Forma | Current | Forma | |||||||||||||||||||||||||||||||
Tax Free Fund | Class A | Class A | Class B | Class B | Class C | Class C | Class R | Class R | Class Y | Class Y | ||||||||||||||||||||||||||||||
| Management Fees | 0.72 | % | 0.58 | % | — | — | 0.72 | % | 0.58 | % | — | — | 0.72 | % | 0.58 | % | ||||||||||||||||||||||||
| Distribution (12b-1) Fees | 0.25 | % | 0.20 | % | — | — | 0.65 | % | 0.65 | % | — | — | 0.00 | % | 0.00 | % | ||||||||||||||||||||||||
| Other Expenses | 0.05 | % | 0.07 | % | — | — | 0.05 | % | 0.07 | % | — | — | 0.05 | % | 0.07 | % | ||||||||||||||||||||||||
| Acquired Fund Fees and Expenses | 0.01 | % | 0.01 | % | — | — | 0.01 | % | 0.01 | % | — | — | 0.01 | % | 0.01 | % | ||||||||||||||||||||||||
| Gross Annual Operating Expenses | 1.03 | % | 0.86 | % | — | — | 1.43 | % | 1.31 | % | — | — | 0.78 | % | 0.66 | % | ||||||||||||||||||||||||
| Less 12b-1 Fee Waiver/ Reimbursement | (0.20 | )% | (0.11 | )% | — | — | 0.00 | % | 0.00 | % | — | — | 0.00 | % | 0.00 | % | ||||||||||||||||||||||||
| Less Expense Reimbursement | (0.08 | )% | 0.00 | % | — | — | (0.08 | )% | 0.00 | % | — | — | (0.08 | )% | 0.00 | % | ||||||||||||||||||||||||
| Net Annual Operating Expenses | 0.75 | % | 0.75 | % | — | — | 1.35 | % | 1.31 | % | — | — | 0.70 | % | 0.66 | % | ||||||||||||||||||||||||
| Pro | Pro | Pro | Pro | Pro | ||||||||||||||||||||||||||||||||||||
| Current | Forma | Current | Forma | Current | Forma | Current | Forma | Current | Forma | |||||||||||||||||||||||||||||||
Total Return Bond Fund | Class A | Class A | Class B | Class B | Class C | Class C | Class R | Class R | Class Y | Class Y | ||||||||||||||||||||||||||||||
| Management Fees | 0.82 | % | 0.63 | % | 0.82 | % | 0.63 | % | 0.82 | % | 0.63 | % | 0.82 | % | 0.63 | % | 0.82 | % | 0.63 | % | ||||||||||||||||||||
| Distribution (12b-1) Fees | 0.25 | % | 0.25 | % | 1.00 | % | 1.00 | % | 1.00 | % | 1.00 | % | 0.50 | % | 0.50 | % | 0.00 | % | 0.00 | % | ||||||||||||||||||||
| Other Expenses | 0.06 | % | 0.08 | % | 0.06 | % | 0.08 | % | 0.06 | % | 0.08 | % | 0.06 | % | 0.08 | % | 0.06 | % | 0.08 | % | ||||||||||||||||||||
| Acquired Fund Fees and Expenses | 0.01 | % | 0.01 | % | 0.01 | % | 0.01 | % | 0.01 | % | 0.01 | % | 0.01 | % | 0.01 | % | 0.01 | % | 0.01 | % | ||||||||||||||||||||
| Gross Annual Operating Expenses | 1.14 | % | 0.97 | % | 1.89 | % | 1.72 | % | 1.89 | % | 1.72 | % | 1.39 | % | 1.22 | % | 0.89 | % | 0.72 | % | ||||||||||||||||||||
| Less 12b-1 Fee Waiver/ Reimbursement | (0.11 | )% | (0.09 | )% | (0.11 | )% | 0.00 | % | 0.00 | % | 0.00 | % | (0.11 | )% | 0.00 | % | 0.00 | % | 0.00 | % | ||||||||||||||||||||
| Less Expense Reimbursement | (0.15 | )% | 0.00 | % | (0.15 | )% | 0.00 | % | (0.15 | )% | 0.00 | % | (0.15 | )% | 0.00 | % | (0.15 | )% | 0.00 | % | ||||||||||||||||||||
| Net Annual Operating Expenses | 0.88 | % | 0.88 | % | 1.63 | % | 1.72 | % | 1.74 | % | 1.72 | % | 1.13 | % | 1.22 | % | 0.74 | % | 0.72 | % | ||||||||||||||||||||
Exhibit E-8
| Pro | Pro | Pro | Pro | |||||||||||||||||||||||||||||||||||||||||||||||||||||
| Current | Forma | Current | Forma | Current | Forma | Current | Forma | |||||||||||||||||||||||||||||||||||||||||||||||||
| Class B | Class B | Class B | Class B | Class C | Class C | Class C | Class C | |||||||||||||||||||||||||||||||||||||||||||||||||
| assuming | assuming | assuming no | assuming no | assuming | assuming | assuming no | assuming no | |||||||||||||||||||||||||||||||||||||||||||||||||
| Pro | redemption | redemption | redemption | redemption | redemption | redemption | redemption | redemption | Pro | Pro | ||||||||||||||||||||||||||||||||||||||||||||||
| Current | Forma | at end of | at end of | at end of | at end of | at end of | at end of | at end of | at end of | Current | Forma | Current | Forma | |||||||||||||||||||||||||||||||||||||||||||
California Tax Free Fund | Class A | Class A | each period | each period | each period | each period | each period | each period | each period | each period | Class R | Class R | Class Y | Class Y | ||||||||||||||||||||||||||||||||||||||||||
| 1 Year | 489 | 484 | — | — | — | — | 117 | 117 | 117 | 117 | — | — | 51 | 51 | ||||||||||||||||||||||||||||||||||||||||||
| 3 Year | 676 | 651 | — | — | — | — | 408 | 393 | 408 | 393 | — | — | 204 | 188 | ||||||||||||||||||||||||||||||||||||||||||
| 5 Year | 933 | 866 | — | — | — | — | 764 | 717 | 764 | 717 | — | — | 415 | 366 | ||||||||||||||||||||||||||||||||||||||||||
| 10 Year | 1,666 | 1,483 | — | — | — | — | 1,766 | 1,635 | 1,766 | 1,635 | — | — | 1,022 | 882 | ||||||||||||||||||||||||||||||||||||||||||
| Pro | Pro | Pro | Pro | |||||||||||||||||||||||||||||||||||||||||||||||||||||
| Current | Forma | Current | Forma | Current | Forma | Current | Forma | |||||||||||||||||||||||||||||||||||||||||||||||||
| Class B | Class B | Class B | Class B | Class C | Class C | Class C | Class C | |||||||||||||||||||||||||||||||||||||||||||||||||
| assuming | assuming | assuming no | assuming no | assuming | assuming | assuming no | assuming no | |||||||||||||||||||||||||||||||||||||||||||||||||
| Pro | redemption | redemption | redemption | redemption | redemption | redemption | redemption | redemption | Pro | Pro | ||||||||||||||||||||||||||||||||||||||||||||||
| Current | Forma | at end of | at end of | at end of | at end of | at end of | at end of | at end of | at end of | Current | Forma | Current | Forma | |||||||||||||||||||||||||||||||||||||||||||
Colorado Tax Free Fund | Class A | Class A | each period | each period | each period | each period | each period | each period | each period | each period | Class R | Class R | Class Y | Class Y | ||||||||||||||||||||||||||||||||||||||||||
| 1 Year | 498 | 489 | — | — | — | — | 117 | 117 | 117 | 117 | — | — | 51 | 51 | ||||||||||||||||||||||||||||||||||||||||||
| 3 Year | 703 | 665 | — | — | — | — | 416 | 397 | 416 | 397 | — | — | 212 | 193 | ||||||||||||||||||||||||||||||||||||||||||
| 5 Year | 974 | 889 | — | — | — | — | 787 | 730 | 787 | 730 | — | — | 439 | 380 | ||||||||||||||||||||||||||||||||||||||||||
| 10 Year | 1,748 | 1,530 | — | — | — | — | 1,831 | 1,673 | 1,831 | 1,673 | — | — | 1,091 | 922 | ||||||||||||||||||||||||||||||||||||||||||
| Pro | Pro | Pro | Pro | |||||||||||||||||||||||||||||||||||||||||||||||||||||
| Current | Forma | Current | Forma | Current | Forma | Current | Forma | |||||||||||||||||||||||||||||||||||||||||||||||||
| Class B | Class B | Class B | Class B | Class C | Class C | Class C | Class C | |||||||||||||||||||||||||||||||||||||||||||||||||
| assuming | assuming | assuming no | assuming no | assuming | assuming | assuming no | assuming no | |||||||||||||||||||||||||||||||||||||||||||||||||
| Pro | redemption | redemption | redemption | redemption | redemption | redemption | redemption | redemption | Pro | Pro | ||||||||||||||||||||||||||||||||||||||||||||||
| Current | Forma | at end of | at end of | at end of | at end of | at end of | at end of | at end of | at end of | Current | Forma | Current | Forma | |||||||||||||||||||||||||||||||||||||||||||
Core Bond Fund | Class A | Class A | each period | each period | each period | each period | each period | each period | each period | each period | Class R | Class R | Class Y | Class Y | ||||||||||||||||||||||||||||||||||||||||||
| 1 Year | 518 | 518 | 673 | 673 | 173 | 173 | 173 | 173 | 173 | 173 | 122 | 122 | 72 | 72 | ||||||||||||||||||||||||||||||||||||||||||
| 3 Year | 722 | 715 | 843 | 836 | 543 | 536 | 543 | 536 | 543 | 536 | 389 | 381 | 232 | 224 | ||||||||||||||||||||||||||||||||||||||||||
| 5 Year | 951 | 928 | 1,046 | 1,023 | 946 | 923 | 946 | 923 | 946 | 923 | 683 | 660 | 414 | 390 | ||||||||||||||||||||||||||||||||||||||||||
| 10 Year | 1,607 | 1,542 | 1,874 | 1,810 | 1,874 | 1,810 | 2,072 | 2,009 | 2,072 | 2,009 | 1,521 | 1,455 | 941 | 871 | ||||||||||||||||||||||||||||||||||||||||||
Exhibit E-9
| Pro | Pro | Pro | Pro | |||||||||||||||||||||||||||||||||||||||||||||||||||||
| Current | Forma | Current | Forma | Current | Forma | Current | Forma | |||||||||||||||||||||||||||||||||||||||||||||||||
| Class B | Class B | Class B | Class B | Class C | Class C | Class C | Class C | |||||||||||||||||||||||||||||||||||||||||||||||||
| assuming | assuming | assuming no | assuming no | assuming | assuming | assuming no | assuming no | |||||||||||||||||||||||||||||||||||||||||||||||||
| Pro | redemption | redemption | redemption | redemption | redemption | redemption | redemption | redemption | Pro | Pro | ||||||||||||||||||||||||||||||||||||||||||||||
| Current | Forma | at end of | at end of | at end of | at end of | at end of | at end of | at end of | at end of | Current | Forma | Current | Forma | |||||||||||||||||||||||||||||||||||||||||||
Equity Income Fund | Class A | Class A | each period | each period | each period | each period | each period | each period | each period | each period | Class R | Class R | Class Y | Class Y | ||||||||||||||||||||||||||||||||||||||||||
| 1 Year | 665 | 685 | 697 | 693 | 197 | 193 | 197 | 193 | 197 | 193 | 147 | 143 | 96 | 92 | ||||||||||||||||||||||||||||||||||||||||||
| 3 Year | 907 | 919 | 909 | 897 | 609 | 597 | 609 | 597 | 609 | 597 | 456 | 443 | 300 | 287 | ||||||||||||||||||||||||||||||||||||||||||
| 5 Year | 1,168 | 1,172 | 1,147 | 1,126 | 1,047 | 1,026 | 1,047 | 1,026 | 1,047 | 1,026 | 787 | 766 | 520 | 498 | ||||||||||||||||||||||||||||||||||||||||||
| 10 Year | 1,914 | 1,892 | 2,070 | 2,027 | 2,070 | 2,027 | 2,264 | 2,222 | 2,264 | 2,222 | 1,724 | 1,680 | 1,155 | 1,108 | ||||||||||||||||||||||||||||||||||||||||||
| Pro | Pro | Pro | Pro | |||||||||||||||||||||||||||||||||||||||||||||||||||||
| Current | Forma | Current | Forma | Current | Forma | Current | Forma | |||||||||||||||||||||||||||||||||||||||||||||||||
| Class B | Class B | Class B | Class B | Class C | Class C | Class C | Class C | |||||||||||||||||||||||||||||||||||||||||||||||||
| assuming | assuming | assuming no | assuming no | assuming | assuming | assuming no | assuming no | |||||||||||||||||||||||||||||||||||||||||||||||||
| Pro | redemption | redemption | redemption | redemption | redemption | redemption | redemption | redemption | Pro | Pro | ||||||||||||||||||||||||||||||||||||||||||||||
| Current | Forma | at end of | at end of | at end of | at end of | at end of | at end of | at end of | at end of | Current | Forma | Current | Forma | |||||||||||||||||||||||||||||||||||||||||||
Equity Index Fund | Class A | Class A | each period | each period | each period | each period | each period | each period | each period | each period | Class R | Class R | Class Y | Class Y | ||||||||||||||||||||||||||||||||||||||||||
| 1 Year | 610 | 63 | 639 | 639 | 139 | 139 | 139 | 139 | 139 | 139 | 89 | 89 | 38 | 38 | ||||||||||||||||||||||||||||||||||||||||||
| 3 Year | 756 | 204 | 753 | 739 | 453 | 439 | 453 | 439 | 453 | 439 | 297 | 283 | 139 | 124 | ||||||||||||||||||||||||||||||||||||||||||
| 5 Year | 935 | 363 | 910 | 867 | 810 | 767 | 810 | 767 | 810 | 767 | 544 | 499 | 270 | 225 | ||||||||||||||||||||||||||||||||||||||||||
| 10 Year | 1,453 | 825 | 1,611 | 1,488 | 1,611 | 1,488 | 1,814 | 1,693 | 1,814 | 1,693 | 1,249 | 1,122 | 654 | 520 | ||||||||||||||||||||||||||||||||||||||||||
| Pro | Pro | Pro | Pro | |||||||||||||||||||||||||||||||||||||||||||||||||||||
| Current | Forma | Current | Forma | Current | Forma | Current | Forma | |||||||||||||||||||||||||||||||||||||||||||||||||
| Class B | Class B | Class B | Class B | Class C | Class C | Class C | Class C | |||||||||||||||||||||||||||||||||||||||||||||||||
| assuming | assuming | assuming no | assuming no | assuming | assuming | assuming no | assuming no | |||||||||||||||||||||||||||||||||||||||||||||||||
| Pro | redemption | redemption | redemption | redemption | redemption | redemption | redemption | redemption | Pro | Pro | ||||||||||||||||||||||||||||||||||||||||||||||
| Current | Forma | at end of | at end of | at end of | at end of | at end of | at end of | at end of | at end of | Current | Forma | Current | Forma | |||||||||||||||||||||||||||||||||||||||||||
Global Infrastructure Fund | Class A | Class A | each period | each period | each period | each period | each period | each period | each period | each period | Class R | Class R | Class Y | Class Y | ||||||||||||||||||||||||||||||||||||||||||
| 1 Year | 670 | 695 | — | — | — | — | 203 | 203 | 203 | 203 | 153 | 153 | 102 | 102 | ||||||||||||||||||||||||||||||||||||||||||
| 3 Year | 999 | 1,007 | — | — | — | — | 704 | 688 | 704 | 688 | 552 | 536 | 397 | 381 | ||||||||||||||||||||||||||||||||||||||||||
| 5 Year | 1,424 | 1,400 | — | — | — | — | 1,308 | 1,260 | 1,308 | 1,260 | 1,054 | 1,006 | 794 | 744 | ||||||||||||||||||||||||||||||||||||||||||
| 10 Year | 2,606 | 2,498 | — | — | — | — | 2,942 | 2,817 | 2,942 | 2,817 | 2,438 | 2,306 | 1,906 | 1,768 | ||||||||||||||||||||||||||||||||||||||||||
Exhibit E-10
| Pro | Pro | Pro | Pro | |||||||||||||||||||||||||||||||||||||||||||||||||||||
| Current | Forma | Current | Forma | Current | Forma | Current | Forma | |||||||||||||||||||||||||||||||||||||||||||||||||
| Class B | Class B | Class B | Class B | Class C | Class C | Class C | Class C | |||||||||||||||||||||||||||||||||||||||||||||||||
| assuming | assuming | assuming no | assuming no | assuming | assuming | assuming no | assuming no | |||||||||||||||||||||||||||||||||||||||||||||||||
| Pro | redemption | redemption | redemption | redemption | redemption | redemption | redemption | redemption | Pro | Pro | ||||||||||||||||||||||||||||||||||||||||||||||
| Current | Forma | at end of | at end of | at end of | at end of | at end of | at end of | at end of | at end of | Current | Forma | Current | Forma | |||||||||||||||||||||||||||||||||||||||||||
High Income Bond Fund | Class A | Class A | each period | each period | each period | each period | each period | each period | each period | each period | Class R | Class R | Class Y | Class Y | ||||||||||||||||||||||||||||||||||||||||||
| 1 Year | 538 | 588 | 694 | 694 | 194 | 194 | 194 | 194 | 194 | 194 | 144 | 144 | 93 | 93 | ||||||||||||||||||||||||||||||||||||||||||
| 3 Year | 799 | 835 | 921 | 910 | 621 | 610 | 621 | 610 | 621 | 610 | 468 | 456 | 312 | 300 | ||||||||||||||||||||||||||||||||||||||||||
| 5 Year | 1,100 | 1,112 | 1,196 | 1,161 | 1,096 | 1,061 | 1,096 | 1,061 | 1,096 | 1,061 | 837 | 801 | 572 | 535 | ||||||||||||||||||||||||||||||||||||||||||
| 10 Year | 1,956 | 1,899 | 2,217 | 2,119 | 2,217 | 2,119 | 2,409 | 2,312 | 2,409 | 2,312 | 1,876 | 1,775 | 1,315 | 1,208 | ||||||||||||||||||||||||||||||||||||||||||
| Pro | Pro | Pro | Pro | |||||||||||||||||||||||||||||||||||||||||||||||||||||
| Current | Forma | Current | Forma | Current | Forma | Current | Forma | |||||||||||||||||||||||||||||||||||||||||||||||||
| Class B | Class B | Class B | Class B | Class C | Class C | Class C | Class C | |||||||||||||||||||||||||||||||||||||||||||||||||
| assuming | assuming | assuming no | assuming no | assuming | assuming | assuming no | assuming no | |||||||||||||||||||||||||||||||||||||||||||||||||
| Pro | redemption | redemption | redemption | redemption | redemption | redemption | redemption | redemption | Pro | Pro | ||||||||||||||||||||||||||||||||||||||||||||||
| Inflation Protected | Current | Forma | at end of | at end of | at end of | at end of | at end of | at end of | at end of | at end of | Current | Forma | Current | Forma | ||||||||||||||||||||||||||||||||||||||||||
Securities Fund | Class A | Class A | each period | each period | each period | each period | each period | each period | each period | each period | Class R | Class R | Class Y | Class Y | ||||||||||||||||||||||||||||||||||||||||||
| 1 Year | 508 | 508 | — | — | — | — | 163 | 163 | 163 | 163 | 112 | 112 | 61 | 61 | ||||||||||||||||||||||||||||||||||||||||||
| 3 Year | 714 | 711 | — | — | — | — | 535 | 532 | 535 | 532 | 380 | 377 | 223 | 220 | ||||||||||||||||||||||||||||||||||||||||||
| 5 Year | 968 | 958 | — | — | — | — | 963 | 953 | 963 | 953 | 700 | 690 | 431 | 421 | ||||||||||||||||||||||||||||||||||||||||||
| 10 Year | 1,692 | 1,664 | — | — | — | — | 2,154 | 2,127 | 2,154 | 2,127 | 1,607 | 1,579 | 1,031 | 1,001 | ||||||||||||||||||||||||||||||||||||||||||
| Pro | Pro | Pro | Pro | |||||||||||||||||||||||||||||||||||||||||||||||||||||
| Current | Forma | Current | Forma | Current | Forma | Current | Forma | |||||||||||||||||||||||||||||||||||||||||||||||||
| Class B | Class B | Class B | Class B | Class C | Class C | Class C | Class C | |||||||||||||||||||||||||||||||||||||||||||||||||
| assuming | assuming | assuming no | assuming no | assuming | assuming | assuming no | assuming no | |||||||||||||||||||||||||||||||||||||||||||||||||
| Pro | redemption | redemption | redemption | redemption | redemption | redemption | redemption | redemption | Pro | Pro | ||||||||||||||||||||||||||||||||||||||||||||||
| Intermediate | Current | Forma | at end of | at end of | at end of | at end of | at end of | at end of | at end of | at end of | Current | Forma | Current | Forma | ||||||||||||||||||||||||||||||||||||||||||
Government Bond Fund | Class A | Class A | each period | each period | each period | each period | each period | each period | each period | each period | Class R | Class R | Class Y | Class Y | ||||||||||||||||||||||||||||||||||||||||||
| 1 Year | 301 | 375 | — | — | — | — | 164 | 164 | 164 | 164 | 103 | 113 | 62 | 62 | ||||||||||||||||||||||||||||||||||||||||||
| 3 Year | 516 | 570 | — | — | — | — | 551 | 532 | 551 | 532 | 376 | 377 | 240 | 220 | ||||||||||||||||||||||||||||||||||||||||||
| 5 Year | 804 | 816 | — | — | — | — | 1,007 | 948 | 1,007 | 948 | 726 | 686 | 478 | 416 | ||||||||||||||||||||||||||||||||||||||||||
| 10 Year | 1,625 | 1,520 | — | — | — | — | 2,271 | 2,111 | 2,271 | 2,111 | 1,713 | 1,562 | 1,161 | 983 | ||||||||||||||||||||||||||||||||||||||||||
Exhibit E-11
| Pro | Pro | Pro | Pro | |||||||||||||||||||||||||||||||||||||||||||||||||||||
| Current | Forma | Current | Forma | Current | Forma | Current | Forma | |||||||||||||||||||||||||||||||||||||||||||||||||
| Class B | Class B | Class B | Class B | Class C | Class C | Class C | Class C | |||||||||||||||||||||||||||||||||||||||||||||||||
| assuming | assuming | assuming no | assuming no | assuming | assuming | assuming no | assuming no | |||||||||||||||||||||||||||||||||||||||||||||||||
| Pro | redemption | redemption | redemption | redemption | redemption | redemption | redemption | redemption | Pro | Pro | ||||||||||||||||||||||||||||||||||||||||||||||
| Intermediate | Current | Forma | at end of | at end of | at end of | at end of | at end of | at end of | at end of | at end of | Current | Forma | Current | Forma | ||||||||||||||||||||||||||||||||||||||||||
Tax Free Fund | Class A | Class A | each period | each period | each period | each period | each period | each period | each period | each period | Class R | Class R | Class Y | Class Y | ||||||||||||||||||||||||||||||||||||||||||
| 1 Year | 300 | 374 | — | — | — | — | 137 | 130 | 137 | 130 | — | — | 72 | 64 | ||||||||||||||||||||||||||||||||||||||||||
| 3 Year | 487 | 541 | — | — | — | — | 434 | 406 | 434 | 406 | — | — | 231 | 202 | ||||||||||||||||||||||||||||||||||||||||||
| 5 Year | 720 | 731 | — | — | — | — | 759 | 702 | 759 | 702 | — | — | 410 | 351 | ||||||||||||||||||||||||||||||||||||||||||
| 10 Year | 1,386 | 1,280 | — | — | — | — | 1,680 | 1,545 | 1,680 | 1,545 | — | — | 931 | 786 | ||||||||||||||||||||||||||||||||||||||||||
| Pro | Pro | Pro | Pro | |||||||||||||||||||||||||||||||||||||||||||||||||||||
| Current | Forma | Current | Forma | Current | Forma | Current | Forma | |||||||||||||||||||||||||||||||||||||||||||||||||
| Class B | Class B | Class B | Class B | Class C | Class C | Class C | Class C | |||||||||||||||||||||||||||||||||||||||||||||||||
| assuming | assuming | assuming no | assuming no | assuming | assuming | assuming no | assuming no | |||||||||||||||||||||||||||||||||||||||||||||||||
| Pro | redemption | redemption | redemption | redemption | redemption | redemption | redemption | redemption | Pro | Pro | ||||||||||||||||||||||||||||||||||||||||||||||
| Intermediate | Current | Forma | at end of | at end of | at end of | at end of | at end of | at end of | at end of | at end of | Current | Forma | Current | Forma | ||||||||||||||||||||||||||||||||||||||||||
Term Bond Fund | Class A | Class A | each period | each period | each period | each period | each period | each period | each period | each period | Class R | Class R | Class Y | Class Y | ||||||||||||||||||||||||||||||||||||||||||
| 1 Year | 311 | 385 | — | — | — | — | — | — | — | — | — | — | 73 | 73 | ||||||||||||||||||||||||||||||||||||||||||
| 3 Year | 509 | 577 | — | — | — | — | — | — | — | — | — | — | 233 | 227 | ||||||||||||||||||||||||||||||||||||||||||
| 5 Year | 741 | 796 | — | — | — | — | — | — | — | — | — | — | 412 | 395 | ||||||||||||||||||||||||||||||||||||||||||
| 10 Year | 1,406 | 1,425 | — | — | — | — | — | — | — | — | — | — | 933 | 883 | ||||||||||||||||||||||||||||||||||||||||||
| Pro | Pro | Pro | Pro | |||||||||||||||||||||||||||||||||||||||||||||||||||||
| Current | Forma | Current | Forma | Current | Forma | Current | Forma | |||||||||||||||||||||||||||||||||||||||||||||||||
| Class B | Class B | Class B | Class B | Class C | Class C | Class C | Class C | |||||||||||||||||||||||||||||||||||||||||||||||||
| assuming | assuming | assuming no | assuming no | assuming | assuming | assuming no | assuming no | |||||||||||||||||||||||||||||||||||||||||||||||||
| Pro | redemption | redemption | redemption | redemption | redemption | redemption | redemption | redemption | Pro | Pro | ||||||||||||||||||||||||||||||||||||||||||||||
| Current | Forma | at end of | at end of | at end of | at end of | at end of | at end of | at end of | at end of | Current | Forma | Current | Forma | |||||||||||||||||||||||||||||||||||||||||||
International Fund | Class A | Class A | each period | each period | each period | each period | each period | each period | each period | each period | Class R | Class R | Class Y | Class Y | ||||||||||||||||||||||||||||||||||||||||||
| 1 Year | 694 | 711 | 728 | 720 | 228 | 220 | 228 | 220 | 228 | 220 | 178 | 170 | 127 | 119 | ||||||||||||||||||||||||||||||||||||||||||
| 3 Year | 1,008 | 998 | 1,014 | 979 | 714 | 679 | 714 | 679 | 714 | 679 | 562 | 526 | 407 | 372 | ||||||||||||||||||||||||||||||||||||||||||
| 5 Year | 1,355 | 1,307 | 1,337 | 1,264 | 1,237 | 1,164 | 1,237 | 1,164 | 1,237 | 1,164 | 982 | 907 | 720 | 644 | ||||||||||||||||||||||||||||||||||||||||||
| 10 Year | 2,329 | 2,179 | 2,483 | 2,313 | 2,483 | 2,313 | 2,670 | 2,503 | 2,670 | 2,503 | 2,152 | 1,976 | 1,606 | 1,420 | ||||||||||||||||||||||||||||||||||||||||||
Exhibit E-12
| Pro | Pro | Pro | Pro | |||||||||||||||||||||||||||||||||||||||||||||||||||||
| Current | Forma | Current | Forma | Current | Forma | Current | Forma | |||||||||||||||||||||||||||||||||||||||||||||||||
| Class B | Class B | Class B | Class B | Class C | Class C | Class C | Class C | |||||||||||||||||||||||||||||||||||||||||||||||||
| assuming | assuming | assuming no | assuming no | assuming | assuming | assuming no | assuming no | |||||||||||||||||||||||||||||||||||||||||||||||||
| Pro | redemption | redemption | redemption | redemption | redemption | redemption | redemption | redemption | Pro | Pro | ||||||||||||||||||||||||||||||||||||||||||||||
| International | Current | Forma | at end of | at end of | at end of | at end of | at end of | at end of | at end of | at end of | Current | Forma | Current | Forma | ||||||||||||||||||||||||||||||||||||||||||
Select Fund | Class A | Class A | each period | each period | each period | each period | each period | each period | each period | each period | Class R | Class R | Class Y | Class Y | ||||||||||||||||||||||||||||||||||||||||||
| 1 Year | 695 | 720 | — | — | — | — | 229 | 229 | 229 | 229 | 179 | 179 | 128 | 128 | ||||||||||||||||||||||||||||||||||||||||||
| 3 Year | 1,016 | 1,025 | — | — | — | — | 722 | 706 | 722 | 706 | 570 | 554 | 416 | 400 | ||||||||||||||||||||||||||||||||||||||||||
| 5 Year | 1,375 | 1,351 | — | — | — | — | 1,258 | 1,210 | 1,258 | 1,210 | 1,003 | 954 | 742 | 692 | ||||||||||||||||||||||||||||||||||||||||||
| 10 Year | 2,383 | 2,273 | — | — | — | — | 2,723 | 2,595 | 2,723 | 2,595 | 2,208 | 2,073 | 1,664 | 1,523 | ||||||||||||||||||||||||||||||||||||||||||
| Pro | Pro | Pro | Pro | |||||||||||||||||||||||||||||||||||||||||||||||||||||
| Current | Forma | Current | Forma | Current | Forma | Current | Forma | |||||||||||||||||||||||||||||||||||||||||||||||||
| Class B | Class B | Class B | Class B | Class C | Class C | Class C | Class C | |||||||||||||||||||||||||||||||||||||||||||||||||
| assuming | assuming | assuming no | assuming no | assuming | assuming | assuming no | assuming no | |||||||||||||||||||||||||||||||||||||||||||||||||
| Pro | redemption | redemption | redemption | redemption | redemption | redemption | redemption | redemption | Pro | Pro | ||||||||||||||||||||||||||||||||||||||||||||||
| Large Cap Growth | Current | Forma | at end of | at end of | at end of | at end of | at end of | at end of | at end of | at end of | Current | Forma | Current | Forma | ||||||||||||||||||||||||||||||||||||||||||
Opportunities Fund | Class A | Class A | each period | each period | each period | each period | each period | each period | each period | each period | Class R | Class R | Class Y | Class Y | ||||||||||||||||||||||||||||||||||||||||||
| 1 Year | 667 | 692 | 700 | 700 | 200 | 200 | 200 | 200 | 200 | 200 | 150 | 150 | 99 | 99 | ||||||||||||||||||||||||||||||||||||||||||
| 3 Year | 916 | 942 | 918 | 920 | 618 | 620 | 618 | 620 | 618 | 620 | 465 | 467 | 309 | 311 | ||||||||||||||||||||||||||||||||||||||||||
| 5 Year | 1,183 | 1,213 | 1,162 | 1,169 | 1,062 | 1,069 | 1,062 | 1,069 | 1,062 | 1,069 | 803 | 809 | 536 | 543 | ||||||||||||||||||||||||||||||||||||||||||
| 10 Year | 1,946 | 1,985 | 2,102 | 2,120 | 2,102 | 2,120 | 2,296 | 2,313 | 2,296 | 2,313 | 1,757 | 1,776 | 1,190 | 1,209 | ||||||||||||||||||||||||||||||||||||||||||
| Pro | Pro | Pro | Pro | |||||||||||||||||||||||||||||||||||||||||||||||||||||
| Current | Forma | Current | Forma | Current | Forma | Current | Forma | |||||||||||||||||||||||||||||||||||||||||||||||||
| Class B | Class B | Class B | Class B | Class C | Class C | Class C | Class C | |||||||||||||||||||||||||||||||||||||||||||||||||
| assuming | assuming | assuming no | assuming no | assuming | assuming | assuming no | assuming no | |||||||||||||||||||||||||||||||||||||||||||||||||
| Pro | redemption | redemption | redemption | redemption | redemption | redemption | redemption | redemption | Pro | Pro | ||||||||||||||||||||||||||||||||||||||||||||||
| Current | Forma | at end of | at end of | at end of | at end of | at end of | at end of | at end of | at end of | Current | Forma | Current | Forma | |||||||||||||||||||||||||||||||||||||||||||
Large Cap Select Fund | Class A | Class A | each period | each period | each period | each period | each period | each period | each period | each period | Class R | Class R | Class Y | Class Y | ||||||||||||||||||||||||||||||||||||||||||
| 1 Year | 679 | 690 | — | — | — | — | 212 | 198 | 212 | 198 | 162 | 148 | 111 | 97 | ||||||||||||||||||||||||||||||||||||||||||
| 3 Year | 951 | 934 | — | — | — | — | 655 | 612 | 655 | 612 | 502 | 459 | 347 | 303 | ||||||||||||||||||||||||||||||||||||||||||
| 5 Year | 1,244 | 1,197 | — | — | — | — | 1,124 | 1,052 | 1,124 | 1,052 | 866 | 792 | 601 | 525 | ||||||||||||||||||||||||||||||||||||||||||
| 10 Year | 2,074 | 1,946 | — | — | — | — | 2,421 | 2,275 | 2,421 | 2,275 | 1,889 | 1,735 | 1,329 | 1,166 | ||||||||||||||||||||||||||||||||||||||||||
Exhibit E-13
| Pro | Pro | Pro | Pro | |||||||||||||||||||||||||||||||||||||||||||||||||||||
| Current | Forma | Current | Forma | Current | Forma | Current | Forma | |||||||||||||||||||||||||||||||||||||||||||||||||
| Class B | Class B | Class B | Class B | Class C | Class C | Class C | Class C | |||||||||||||||||||||||||||||||||||||||||||||||||
| assuming | assuming | assuming no | assuming no | assuming | assuming | assuming no | assuming no | |||||||||||||||||||||||||||||||||||||||||||||||||
| Pro | redemption | redemption | redemption | redemption | redemption | redemption | redemption | redemption | Pro | Pro | ||||||||||||||||||||||||||||||||||||||||||||||
| Current | Forma | at end of | at end of | at end of | at end of | at end of | at end of | at end of | at end of | Current | Forma | Current | Forma | |||||||||||||||||||||||||||||||||||||||||||
Large Cap Value Fund | Class A | Class A | each period | each period | each period | each period | each period | each period | each period | each period | Class R | Class R | Class Y | Class Y | ||||||||||||||||||||||||||||||||||||||||||
| 1 Year | 673 | 688 | 706 | 696 | 206 | 196 | 206 | 196 | 206 | 196 | 156 | 146 | 105 | 95 | ||||||||||||||||||||||||||||||||||||||||||
| 3 Year | 934 | 928 | 937 | 906 | 637 | 606 | 637 | 606 | 637 | 606 | 483 | 452 | 328 | 296 | ||||||||||||||||||||||||||||||||||||||||||
| 5 Year | 1,214 | 1,187 | 1,193 | 1,142 | 1,093 | 1,042 | 1,093 | 1,042 | 1,093 | 1,042 | 834 | 782 | 569 | 515 | ||||||||||||||||||||||||||||||||||||||||||
| 10 Year | 2,010 | 1,924 | 2,166 | 2,059 | 2,166 | 2,059 | 2,358 | 2,254 | 2,358 | 2,254 | 1,824 | 1,713 | 1,259 | 1,143 | ||||||||||||||||||||||||||||||||||||||||||
| Pro | Pro | Pro | Pro | |||||||||||||||||||||||||||||||||||||||||||||||||||||
| Current | Forma | Current | Forma | Current | Forma | Current | Forma | |||||||||||||||||||||||||||||||||||||||||||||||||
| Class B | Class B | Class B | Class B | Class C | Class C | Class C | Class C | |||||||||||||||||||||||||||||||||||||||||||||||||
| assuming | assuming | assuming no | assuming no | assuming | assuming | assuming no | assuming no | |||||||||||||||||||||||||||||||||||||||||||||||||
| Pro | redemption | redemption | redemption | redemption | redemption | redemption | redemption | redemption | Pro | Pro | ||||||||||||||||||||||||||||||||||||||||||||||
| Mid Cap Growth | Current | Forma | at end of | at end of | at end of | at end of | at end of | at end of | at end of | at end of | Current | Forma | Current | Forma | ||||||||||||||||||||||||||||||||||||||||||
Opportunities Fund | Class A | Class A | each period | each period | each period | each period | each period | each period | each period | each period | Class R | Class R | Class Y | Class Y | ||||||||||||||||||||||||||||||||||||||||||
| 1 Year | 668 | 693 | 701 | 701 | 201 | 201 | 201 | 201 | 201 | 201 | 151 | 151 | 100 | 100 | ||||||||||||||||||||||||||||||||||||||||||
| 3 Year | 919 | 946 | 921 | 925 | 621 | 625 | 621 | 625 | 621 | 625 | 468 | 471 | 312 | 315 | ||||||||||||||||||||||||||||||||||||||||||
| 5 Year | 1,188 | 1,221 | 1,168 | 1,177 | 1,068 | 1,077 | 1,068 | 1,077 | 1,068 | 1,077 | 808 | 818 | 542 | 552 | ||||||||||||||||||||||||||||||||||||||||||
| 10 Year | 1,957 | 2,005 | 2,113 | 2,139 | 2,113 | 2,139 | 2,306 | 2,333 | 2,306 | 2,333 | 1,768 | 1,796 | 1,201 | 1,231 | ||||||||||||||||||||||||||||||||||||||||||
| Pro | Pro | Pro | Pro | |||||||||||||||||||||||||||||||||||||||||||||||||||||
| Current | Forma | Current | Forma | Current | Forma | Current | Forma | |||||||||||||||||||||||||||||||||||||||||||||||||
| Class B | Class B | Class B | Class B | Class C | Class C | Class C | Class C | |||||||||||||||||||||||||||||||||||||||||||||||||
| assuming | assuming | assuming no | assuming no | assuming | assuming | assuming no | assuming no | |||||||||||||||||||||||||||||||||||||||||||||||||
| Pro | redemption | redemption | redemption | redemption | redemption | redemption | redemption | redemption | Pro | Pro | ||||||||||||||||||||||||||||||||||||||||||||||
| Current | Forma | at end of | at end of | at end of | at end of | at end of | at end of | at end of | at end of | Current | Forma | Current | Forma | |||||||||||||||||||||||||||||||||||||||||||
Mid Cap Index Fund | Class A | Class A | each period | each period | each period | each period | each period | each period | each period | each period | Class R | Class R | Class Y | Class Y | ||||||||||||||||||||||||||||||||||||||||||
| 1 Year | 624 | 79 | — | — | — | — | 155 | 155 | 155 | 155 | 104 | 104 | 53 | 53 | ||||||||||||||||||||||||||||||||||||||||||
| 3 Year | 794 | 248 | — | — | — | — | 492 | 482 | 492 | 482 | 337 | 327 | 179 | 169 | ||||||||||||||||||||||||||||||||||||||||||
| 5 Year | 990 | 435 | — | — | — | — | 865 | 836 | 865 | 836 | 600 | 570 | 329 | 298 | ||||||||||||||||||||||||||||||||||||||||||
| 10 Year | 1,555 | 974 | — | — | — | — | 1,914 | 1,831 | 1,914 | 1,831 | 1,354 | 1,267 | 765 | 673 | ||||||||||||||||||||||||||||||||||||||||||
Exhibit E-14
| Pro | Pro | Pro | Pro | |||||||||||||||||||||||||||||||||||||||||||||||||||||
| Current | Forma | Current | Forma | Current | Forma | Current | Forma | |||||||||||||||||||||||||||||||||||||||||||||||||
| Class B | Class B | Class B | Class B | Class C | Class C | Class C | Class C | |||||||||||||||||||||||||||||||||||||||||||||||||
| assuming | assuming | assuming no | assuming no | assuming | assuming | assuming no | assuming no | |||||||||||||||||||||||||||||||||||||||||||||||||
| Pro | redemption | redemption | redemption | redemption | redemption | redemption | redemption | redemption | Pro | Pro | ||||||||||||||||||||||||||||||||||||||||||||||
| Current | Forma | at end of | at end of | at end of | at end of | at end of | at end of | at end of | at end of | Current | Forma | Current | Forma | |||||||||||||||||||||||||||||||||||||||||||
Mid Cap Select Fund | Class A | Class A | each period | each period | each period | each period | each period | each period | each period | each period | Class R | Class R | Class Y | Class Y | ||||||||||||||||||||||||||||||||||||||||||
| 1 Year | 686 | 710 | 719 | 719 | 219 | 219 | 219 | 219 | 219 | 219 | — | — | 118 | 118 | ||||||||||||||||||||||||||||||||||||||||||
| 3 Year | 1,026 | 1,036 | 1,032 | 1,018 | 732 | 718 | 732 | 718 | 732 | 718 | — | — | 426 | 412 | ||||||||||||||||||||||||||||||||||||||||||
| 5 Year | 1,444 | 1,426 | 1,428 | 1,387 | 1,328 | 1,287 | 1,328 | 1,287 | 1,328 | 1,287 | — | — | 815 | 772 | ||||||||||||||||||||||||||||||||||||||||||
| 10 Year | 2,606 | 2,515 | 2,759 | 2,649 | 2,759 | 2,649 | 2,942 | 2,833 | 2,942 | 2,833 | — | — | 1,906 | 1,786 | ||||||||||||||||||||||||||||||||||||||||||
| Pro | Pro | Pro | Pro | |||||||||||||||||||||||||||||||||||||||||||||||||||||
| Current | Forma | Current | Forma | Current | Forma | Current | Forma | |||||||||||||||||||||||||||||||||||||||||||||||||
| Class B | Class B | Class B | Class B | Class C | Class C | Class C | Class C | |||||||||||||||||||||||||||||||||||||||||||||||||
| assuming | assuming | assuming no | assuming no | assuming | assuming | assuming no | assuming no | |||||||||||||||||||||||||||||||||||||||||||||||||
| Pro | redemption | redemption | redemption | redemption | redemption | redemption | redemption | redemption | Pro | Pro | ||||||||||||||||||||||||||||||||||||||||||||||
| Current | Forma | at end of | at end of | at end of | at end of | at end of | at end of | at end of | at end of | Current | Forma | Current | Forma | |||||||||||||||||||||||||||||||||||||||||||
Mid Cap Value Fund | Class A | Class A | each period | each period | each period | each period | each period | each period | each period | each period | Class R | Class R | Class Y | Class Y | ||||||||||||||||||||||||||||||||||||||||||
| 1 Year | 671 | 696 | 704 | 704 | 204 | 204 | 204 | 204 | 204 | 204 | 154 | 154 | 103 | 103 | ||||||||||||||||||||||||||||||||||||||||||
| 3 Year | 928 | 956 | 930 | 935 | 630 | 635 | 630 | 635 | 630 | 635 | 477 | 482 | 322 | 326 | ||||||||||||||||||||||||||||||||||||||||||
| 5 Year | 1,204 | 1,239 | 1,183 | 1,196 | 1,083 | 1,096 | 1,083 | 1,096 | 1,083 | 1,096 | 824 | 837 | 558 | 571 | ||||||||||||||||||||||||||||||||||||||||||
| 10 Year | 1,989 | 2,046 | 2,144 | 2,180 | 2,144 | 2,180 | 2,338 | 2,373 | 2,338 | 2,373 | 1,802 | 1,838 | 1,236 | 1,275 | ||||||||||||||||||||||||||||||||||||||||||
| Pro | Pro | Pro | Pro | |||||||||||||||||||||||||||||||||||||||||||||||||||||
| Current | Forma | Current | Forma | Current | Forma | Current | Forma | |||||||||||||||||||||||||||||||||||||||||||||||||
| Class B | Class B | Class B | Class B | Class C | Class C | Class C | Class C | |||||||||||||||||||||||||||||||||||||||||||||||||
| assuming | assuming | assuming no | assuming no | assuming | assuming | assuming no | assuming no | |||||||||||||||||||||||||||||||||||||||||||||||||
| Pro | redemption | redemption | redemption | redemption | redemption | redemption | redemption | redemption | Pro | Pro | ||||||||||||||||||||||||||||||||||||||||||||||
| Minnesota Intermediate | Current | Forma | at end of | at end of | at end of | at end of | at end of | at end of | at end of | at end of | Current | Forma | Current | Forma | ||||||||||||||||||||||||||||||||||||||||||
Tax Free Fund | Class A | Class A | each period | each period | each period | each period | each period | each period | each period | each period | Class R | Class R | Class Y | Class Y | ||||||||||||||||||||||||||||||||||||||||||
| 1 Year | 301 | 375 | — | — | — | — | 138 | 129 | 138 | 129 | — | — | 73 | 63 | ||||||||||||||||||||||||||||||||||||||||||
| 3 Year | 499 | 542 | — | — | — | — | 446 | 403 | 446 | 403 | — | — | 243 | 199 | ||||||||||||||||||||||||||||||||||||||||||
| 5 Year | 751 | 730 | — | — | — | — | 791 | 697 | 791 | 697 | — | — | 443 | 346 | ||||||||||||||||||||||||||||||||||||||||||
| 10 Year | 1,474 | 1,272 | — | — | — | — | 1,766 | 1,534 | 1,766 | 1,534 | — | — | �� | 1,022 | 774 | |||||||||||||||||||||||||||||||||||||||||
Exhibit E-15
| Pro | Pro | Pro | Pro | |||||||||||||||||||||||||||||||||||||||||||||||||||||
| Current | Forma | Current | Forma | Current | Forma | Current | Forma | |||||||||||||||||||||||||||||||||||||||||||||||||
| Class B | Class B | Class B | Class B | Class C | Class C | Class C | Class C | |||||||||||||||||||||||||||||||||||||||||||||||||
| assuming | assuming | assuming no | assuming no | assuming | assuming | assuming no | assuming no | |||||||||||||||||||||||||||||||||||||||||||||||||
| Pro | redemption | redemption | redemption | redemption | redemption | redemption | redemption | redemption | Pro | Pro | ||||||||||||||||||||||||||||||||||||||||||||||
| Current | Forma | at end of | at end of | at end of | at end of | at end of | at end of | at end of | at end of | Current | Forma | Current | Forma | |||||||||||||||||||||||||||||||||||||||||||
Minnesota Tax Free Fund | Class A | Class A | each period | each period | each period | each period | each period | each period | each period | each period | Class R | Class R | Class Y | Class Y | ||||||||||||||||||||||||||||||||||||||||||
| 1 Year | 508 | 503 | — | — | — | — | 137 | 133 | 137 | 133 | — | — | 72 | 67 | ||||||||||||||||||||||||||||||||||||||||||
| 3 Year | 713 | 681 | — | — | — | — | 446 | 415 | 446 | 415 | — | — | 243 | 211 | ||||||||||||||||||||||||||||||||||||||||||
| 5 Year | 964 | 875 | — | — | — | — | 796 | 718 | 796 | 718 | — | — | 448 | 368 | ||||||||||||||||||||||||||||||||||||||||||
| 10 Year | 1,683 | 1,434 | — | — | — | — | 1,783 | 1,579 | 1,783 | 1,579 | — | — | 1,040 | 822 | ||||||||||||||||||||||||||||||||||||||||||
| Pro | Pro | Pro | Pro | |||||||||||||||||||||||||||||||||||||||||||||||||||||
| Current | Forma | Current | Forma | Current | Forma | Current | Forma | |||||||||||||||||||||||||||||||||||||||||||||||||
| Class B | Class B | Class B | Class B | Class C | Class C | Class C | Class C | |||||||||||||||||||||||||||||||||||||||||||||||||
| assuming | assuming | assuming no | assuming no | assuming | assuming | assuming no | assuming no | |||||||||||||||||||||||||||||||||||||||||||||||||
| Pro | redemption | redemption | redemption | redemption | redemption | redemption | redemption | redemption | Pro | Pro | ||||||||||||||||||||||||||||||||||||||||||||||
| Current | Forma | at end of | at end of | at end of | at end of | at end of | at end of | at end of | at end of | Current | Forma | Current | Forma | |||||||||||||||||||||||||||||||||||||||||||
Missouri Tax Free Fund | Class A | Class A | each period | each period | each period | each period | each period | each period | each period | each period | Class R | Class R | Class Y | Class Y | ||||||||||||||||||||||||||||||||||||||||||
| 1 Year | 507 | 502 | — | — | — | — | 136 | 136 | 136 | 136 | — | — | 70 | 70 | ||||||||||||||||||||||||||||||||||||||||||
| 3 Year | 708 | 686 | — | — | — | — | 441 | 429 | 441 | 429 | — | — | 237 | 225 | ||||||||||||||||||||||||||||||||||||||||||
| 5 Year | 953 | 896 | — | — | — | — | 784 | 747 | 784 | 747 | — | — | 436 | 398 | ||||||||||||||||||||||||||||||||||||||||||
| 10 Year | 1,653 | 1,499 | — | — | — | — | 1,753 | 1,650 | 1,753 | 1,650 | — | — | 1,009 | 899 | ||||||||||||||||||||||||||||||||||||||||||
| Pro | Pro | Pro | Pro | |||||||||||||||||||||||||||||||||||||||||||||||||||||
| Current | Forma | Current | Forma | Current | Forma | Current | Forma | |||||||||||||||||||||||||||||||||||||||||||||||||
| Class B | Class B | Class B | Class B | Class C | Class C | Class C | Class C | |||||||||||||||||||||||||||||||||||||||||||||||||
| assuming | assuming | assuming no | assuming no | assuming | assuming | assuming no | assuming no | |||||||||||||||||||||||||||||||||||||||||||||||||
| Pro | redemption | redemption | redemption | redemption | redemption | redemption | redemption | redemption | Pro | Pro | ||||||||||||||||||||||||||||||||||||||||||||||
| Current | Forma | at end of | at end of | at end of | at end of | at end of | at end of | at end of | at end of | Current | Forma | Current | Forma | |||||||||||||||||||||||||||||||||||||||||||
Nebraska Tax Free Fund | Class A | Class A | each period | each period | each period | each period | each period | each period | each period | each period | Class R | Class R | Class Y | Class Y | ||||||||||||||||||||||||||||||||||||||||||
| 1 Year | 499 | 489 | — | — | — | — | 118 | 118 | 118 | 118 | — | — | 52 | 52 | ||||||||||||||||||||||||||||||||||||||||||
| 3 Year | 729 | 664 | — | — | — | — | 443 | 396 | 443 | 396 | — | — | 239 | 191 | ||||||||||||||||||||||||||||||||||||||||||
| 5 Year | 1,051 | 881 | — | — | — | — | 865 | 722 | 865 | 722 | — | — | 519 | 372 | ||||||||||||||||||||||||||||||||||||||||||
| 10 Year | 1,960 | 1,504 | — | — | — | — | 2,043 | 1,646 | 2,043 | 1,646 | — | — | 1,318 | 894 | ||||||||||||||||||||||||||||||||||||||||||
Exhibit E-16
| Pro | Pro | Pro | Pro | |||||||||||||||||||||||||||||||||||||||||||||||||||||
| Current | Forma | Current | Forma | Current | Forma | Current | Forma | |||||||||||||||||||||||||||||||||||||||||||||||||
| Class B | Class B | Class B | Class B | Class C | Class C | Class C | Class C | |||||||||||||||||||||||||||||||||||||||||||||||||
| assuming | assuming | assuming no | assuming no | assuming | assuming | assuming no | assuming no | |||||||||||||||||||||||||||||||||||||||||||||||||
| Pro | redemption | redemption | redemption | redemption | redemption | redemption | redemption | redemption | Pro | Pro | ||||||||||||||||||||||||||||||||||||||||||||||
| Current | Forma | at end of | at end of | at end of | at end of | at end of | at end of | at end of | at end of | Current | Forma | Current | Forma | |||||||||||||||||||||||||||||||||||||||||||
Ohio Tax Free Fund | Class A | Class A | each period | each period | each period | each period | each period | each period | each period | each period | Class R | Class R | Class Y | Class Y | ||||||||||||||||||||||||||||||||||||||||||
| 1 Year | 499 | 489 | — | — | — | — | 118 | 118 | 118 | 118 | — | — | 52 | 52 | ||||||||||||||||||||||||||||||||||||||||||
| 3 Year | 716 | 668 | — | — | — | — | 428 | 400 | 428 | 400 | — | — | 225 | 196 | ||||||||||||||||||||||||||||||||||||||||||
| 5 Year | 1,009 | 894 | — | — | — | — | 822 | 736 | 822 | 736 | — | — | 475 | 386 | ||||||||||||||||||||||||||||||||||||||||||
| 10 Year | 1,842 | 1,541 | — | — | — | — | 1,925 | 1,684 | 1,925 | 1,684 | — | — | 1,192 | 934 | ||||||||||||||||||||||||||||||||||||||||||
| Pro | Pro | Pro | Pro | |||||||||||||||||||||||||||||||||||||||||||||||||||||
| Current | Forma | Current | Forma | Current | Forma | Current | Forma | |||||||||||||||||||||||||||||||||||||||||||||||||
| Class B | Class B | Class B | Class B | Class C | Class C | Class C | Class C | |||||||||||||||||||||||||||||||||||||||||||||||||
| assuming | assuming | assuming no | assuming no | assuming | assuming | assuming no | assuming no | |||||||||||||||||||||||||||||||||||||||||||||||||
| Pro | redemption | redemption | redemption | redemption | redemption | redemption | redemption | redemption | Pro | Pro | ||||||||||||||||||||||||||||||||||||||||||||||
| Oregon Intermediate | Current | Forma | at end of | at end of | at end of | at end of | at end of | at end of | at end of | at end of | Current | Forma | Current | Forma | ||||||||||||||||||||||||||||||||||||||||||
Tax Free Fund | Class A | Class A | each period | each period | each period | each period | each period | each period | each period | each period | Class R | Class R | Class Y | Class Y | ||||||||||||||||||||||||||||||||||||||||||
| 1 Year | 309 | 380 | — | — | — | — | — | — | — | — | — | — | 70 | 62 | ||||||||||||||||||||||||||||||||||||||||||
| 3 Year | 513 | 551 | — | — | — | — | — | — | — | — | — | — | 236 | 195 | ||||||||||||||||||||||||||||||||||||||||||
| 5 Year | 760 | 736 | — | — | — | — | — | — | — | — | — | — | 432 | 340 | ||||||||||||||||||||||||||||||||||||||||||
| 10 Year | 1,469 | 1,272 | — | — | — | — | — | — | — | — | — | — | 999 | 762 | ||||||||||||||||||||||||||||||||||||||||||
| Pro | Pro | Pro | Pro | |||||||||||||||||||||||||||||||||||||||||||||||||||||
| Current | Forma | Current | Forma | Current | Forma | Current | Forma | |||||||||||||||||||||||||||||||||||||||||||||||||
| Class B | Class B | Class B | Class B | Class C | Class C | Class C | Class C | |||||||||||||||||||||||||||||||||||||||||||||||||
| assuming | assuming | assuming no | assuming no | assuming | assuming | assuming no | assuming no | |||||||||||||||||||||||||||||||||||||||||||||||||
| Pro | redemption | redemption | redemption | redemption | redemption | redemption | redemption | redemption | Pro | Pro | ||||||||||||||||||||||||||||||||||||||||||||||
| Quantitative | Current | Forma | at end of | at end of | at end of | at end of | at end of | at end of | at end of | at end of | Current | Forma | Current | Forma | ||||||||||||||||||||||||||||||||||||||||||
Large Cap Core Fund | Class A | Class A | each period | each period | each period | each period | each period | each period | each period | each period | Class R | Class R | Class Y | Class Y | ||||||||||||||||||||||||||||||||||||||||||
| 1 Year | 619 | 74 | — | — | — | — | 150 | 150 | 150 | 150 | 99 | 99 | 48 | 48 | ||||||||||||||||||||||||||||||||||||||||||
| 3 Year | 795 | 257 | — | — | — | — | 493 | 491 | 493 | 491 | 338 | 335 | 180 | 178 | ||||||||||||||||||||||||||||||||||||||||||
| 5 Year | 1,013 | 483 | — | — | — | — | 889 | 882 | 889 | 882 | 624 | 618 | 353 | 346 | ||||||||||||||||||||||||||||||||||||||||||
| 10 Year | 1,639 | 1,133 | — | — | — | — | 1,996 | 1,978 | 1,996 | 1,978 | 1,441 | 1,422 | 856 | 836 | ||||||||||||||||||||||||||||||||||||||||||
Exhibit E-17
| Pro | Pro | Pro | Pro | |||||||||||||||||||||||||||||||||||||||||||||||||||||
| Current | Forma | Current | Forma | Current | Forma | Current | Forma | |||||||||||||||||||||||||||||||||||||||||||||||||
| Class B | Class B | Class B | Class B | Class C | Class C | Class C | Class C | |||||||||||||||||||||||||||||||||||||||||||||||||
| assuming | assuming | assuming no | assuming no | assuming | assuming | assuming no | assuming no | |||||||||||||||||||||||||||||||||||||||||||||||||
| Pro | redemption | redemption | redemption | redemption | redemption | redemption | redemption | redemption | Pro | Pro | ||||||||||||||||||||||||||||||||||||||||||||||
| Current | Forma | at end of | at end of | at end of | at end of | at end of | at end of | at end of | at end of | Current | Forma | Current | Forma | |||||||||||||||||||||||||||||||||||||||||||
Real Estate Securities Fund | Class A | Class A | each period | each period | each period | each period | each period | each period | each period | each period | Class R | Class R | Class Y | Class Y | ||||||||||||||||||||||||||||||||||||||||||
| 1 Year | 668 | 693 | 701 | 701 | 201 | 201 | 201 | 201 | 201 | 201 | 151 | 151 | 100 | 100 | ||||||||||||||||||||||||||||||||||||||||||
| 3 Year | 919 | 954 | 921 | 933 | 621 | 633 | 621 | 633 | 621 | 633 | 468 | 480 | 312 | 324 | ||||||||||||||||||||||||||||||||||||||||||
| 5 Year | 1,188 | 1,247 | 1,168 | 1,203 | 1,068 | 1,103 | 1,068 | 1,103 | 1,068 | 1,103 | 808 | 844 | 542 | 579 | ||||||||||||||||||||||||||||||||||||||||||
| 10 Year | 1,957 | 2,076 | 2,113 | 2,211 | 2,113 | 2,211 | 2,306 | 2,403 | 2,306 | 2,403 | 1,768 | 1,870 | 1,201 | 1,308 | ||||||||||||||||||||||||||||||||||||||||||
| Pro | Pro | Pro | Pro | |||||||||||||||||||||||||||||||||||||||||||||||||||||
| Current | Forma | Current | Forma | Current | Forma | Current | Forma | |||||||||||||||||||||||||||||||||||||||||||||||||
| Class B | Class B | Class B | Class B | Class C | Class C | Class C | Class C | |||||||||||||||||||||||||||||||||||||||||||||||||
| assuming | assuming | assuming no | assuming no | assuming | assuming | assuming no | assuming no | |||||||||||||||||||||||||||||||||||||||||||||||||
| Pro | redemption | redemption | redemption | redemption | redemption | redemption | redemption | redemption | Pro | Pro | ||||||||||||||||||||||||||||||||||||||||||||||
| Current | Forma | at end of | at end of | at end of | at end of | at end of | at end of | at end of | at end of | Current | Forma | Current | Forma | |||||||||||||||||||||||||||||||||||||||||||
Short Tax Free Fund | Class A | Class A | each period | each period | each period | each period | each period | each period | each period | each period | Class R | Class R | Class Y | Class Y | ||||||||||||||||||||||||||||||||||||||||||
| 1 Year | 300 | 297 | — | — | — | — | — | — | — | — | — | — | 61 | 53 | ||||||||||||||||||||||||||||||||||||||||||
| 3 Year | 494 | 450 | — | — | — | — | — | — | — | — | — | — | 217 | 167 | ||||||||||||||||||||||||||||||||||||||||||
| 5 Year | 739 | 617 | — | — | — | — | — | — | — | — | — | — | 411 | 291 | ||||||||||||||||||||||||||||||||||||||||||
| 10 Year | 1,443 | 1,099 | — | — | — | — | — | — | — | — | — | — | 971 | 653 | ||||||||||||||||||||||||||||||||||||||||||
| Pro | Pro | Pro | Pro | |||||||||||||||||||||||||||||||||||||||||||||||||||||
| Current | Forma | Current | Forma | Current | Forma | Current | Forma | |||||||||||||||||||||||||||||||||||||||||||||||||
| Class B | Class B | Class B | Class B | Class C | Class C | Class C | Class C | |||||||||||||||||||||||||||||||||||||||||||||||||
| assuming | assuming | assuming no | assuming no | assuming | assuming | assuming no | assuming no | |||||||||||||||||||||||||||||||||||||||||||||||||
| Pro | redemption | redemption | redemption | redemption | redemption | redemption | redemption | redemption | Pro | Pro | ||||||||||||||||||||||||||||||||||||||||||||||
| Current | Forma | at end of | at end of | at end of | at end of | at end of | at end of | at end of | at end of | Current | Forma | Current | Forma | |||||||||||||||||||||||||||||||||||||||||||
Short Term Bond Fund | Class A | Class A | each period | each period | each period | each period | each period | each period | each period | each period | Class R | Class R | Class Y | Class Y | ||||||||||||||||||||||||||||||||||||||||||
| 1 Year | 301 | 301 | — | — | — | — | 164 | 159 | 164 | 159 | — | — | 62 | 57 | ||||||||||||||||||||||||||||||||||||||||||
| 3 Year | 495 | 468 | — | — | — | — | 530 | 493 | 530 | 493 | — | — | 218 | 179 | ||||||||||||||||||||||||||||||||||||||||||
| 5 Year | 738 | 655 | — | — | — | — | 942 | 850 | 942 | 850 | — | — | 409 | 313 | ||||||||||||||||||||||||||||||||||||||||||
| 10 Year | 1,436 | 1,195 | — | — | — | — | 2,093 | 1,856 | 2,093 | 1,856 | — | — | 963 | 701 | ||||||||||||||||||||||||||||||||||||||||||
Exhibit E-18
| Pro | Pro | Pro | Pro | |||||||||||||||||||||||||||||||||||||||||||||||||||||
| Current | Forma | Current | Forma | Current | Forma | Current | Forma | |||||||||||||||||||||||||||||||||||||||||||||||||
| Class B | Class B | Class B | Class B | Class C | Class C | Class C | Class C | |||||||||||||||||||||||||||||||||||||||||||||||||
| assuming | assuming | assuming no | assuming no | assuming | assuming | assuming no | assuming no | |||||||||||||||||||||||||||||||||||||||||||||||||
| Pro | redemption | redemption | redemption | redemption | redemption | redemption | redemption | redemption | Pro | Pro | ||||||||||||||||||||||||||||||||||||||||||||||
| Small Cap Growth | Current | Forma | at end of | at end of | at end of | at end of | at end of | at end of | at end of | at end of | Current | Forma | Current | Forma | ||||||||||||||||||||||||||||||||||||||||||
Opportunities Fund | Class A | Class A | each period | each period | each period | each period | each period | each period | each period | each period | Class R | Class R | Class Y | Class Y | ||||||||||||||||||||||||||||||||||||||||||
| 1 Year | 692 | 717 | 726 | 726 | 226 | 226 | 226 | 226 | 226 | 226 | 176 | 176 | 125 | 125 | ||||||||||||||||||||||||||||||||||||||||||
| 3 Year | 1,017 | 1,028 | 1,023 | 1,010 | 723 | 710 | 723 | 710 | 723 | 710 | 571 | 558 | 416 | 403 | ||||||||||||||||||||||||||||||||||||||||||
| 5 Year | 1,388 | 1,374 | 1,371 | 1,333 | 1,271 | 1,233 | 1,271 | 1,233 | 1,271 | 1,233 | 1,017 | 978 | 756 | 716 | ||||||||||||||||||||||||||||||||||||||||||
| 10 Year | 2,430 | 2,346 | 2,583 | 2,480 | 2,583 | 2,480 | 2,769 | 2,667 | 2,769 | 2,667 | 2,256 | 2,149 | 1,715 | 1,602 | ||||||||||||||||||||||||||||||||||||||||||
| Pro | Pro | Pro | Pro | |||||||||||||||||||||||||||||||||||||||||||||||||||||
| Current | Forma | Current | Forma | Current | Forma | Current | Forma | |||||||||||||||||||||||||||||||||||||||||||||||||
| Class B | Class B | Class B | Class B | Class C | Class C | Class C | Class C | |||||||||||||||||||||||||||||||||||||||||||||||||
| assuming | assuming | assuming no | assuming no | assuming | assuming | assuming no | assuming no | |||||||||||||||||||||||||||||||||||||||||||||||||
| Pro | redemption | redemption | redemption | redemption | redemption | redemption | redemption | redemption | Pro | Pro | ||||||||||||||||||||||||||||||||||||||||||||||
| Current | Forma | at end of | at end of | at end of | at end of | at end of | at end of | at end of | at end of | Current | Forma | Current | Forma | |||||||||||||||||||||||||||||||||||||||||||
Small Cap Index Fund | Class A | Class A | each period | each period | each period | each period | each period | each period | each period | each period | Class R | Class R | Class Y | Class Y | ||||||||||||||||||||||||||||||||||||||||||
| 1 Year | 635 | 90 | — | — | — | — | 166 | 166 | 166 | 166 | 115 | 115 | 64 | 64 | ||||||||||||||||||||||||||||||||||||||||||
| 3 Year | 884 | 313 | — | — | — | — | 585 | 545 | 585 | 545 | 431 | 391 | 275 | 234 | ||||||||||||||||||||||||||||||||||||||||||
| 5 Year | 1,222 | 586 | — | — | — | — | 1,101 | 981 | 1,101 | 981 | 843 | 720 | 577 | 451 | ||||||||||||||||||||||||||||||||||||||||||
| 10 Year | 2,174 | 1,367 | — | — | — | — | 2,520 | 2,195 | 2,520 | 2,195 | 1,993 | 1,650 | 1,437 | 1,077 | ||||||||||||||||||||||||||||||||||||||||||
| Pro | Pro | Pro | Pro | |||||||||||||||||||||||||||||||||||||||||||||||||||||
| Current | Forma | Current | Forma | Current | Forma | Current | Forma | |||||||||||||||||||||||||||||||||||||||||||||||||
| Class B | Class B | Class B | Class B | Class C | Class C | Class C | Class C | |||||||||||||||||||||||||||||||||||||||||||||||||
| assuming | assuming | assuming no | assuming no | assuming | assuming | assuming no | assuming no | |||||||||||||||||||||||||||||||||||||||||||||||||
| Pro | redemption | redemption | redemption | redemption | redemption | redemption | redemption | redemption | Pro | Pro | ||||||||||||||||||||||||||||||||||||||||||||||
| Current | Forma | at end of | at end of | at end of | at end of | at end of | at end of | at end of | at end of | Current | Forma | Current | Forma | |||||||||||||||||||||||||||||||||||||||||||
Small Cap Select Fund | Class A | Class A | each period | each period | each period | each period | each period | each period | each period | each period | Class R | Class R | Class Y | Class Y | ||||||||||||||||||||||||||||||||||||||||||
| 1 Year | 671 | 696 | 704 | 704 | 204 | 204 | 204 | 204 | 204 | 204 | 154 | 154 | 103 | 103 | ||||||||||||||||||||||||||||||||||||||||||
| 3 Year | 928 | 960 | 930 | 939 | 630 | 639 | 630 | 639 | 630 | 639 | 477 | 486 | 322 | 330 | ||||||||||||||||||||||||||||||||||||||||||
| 5 Year | 1,204 | 1,252 | 1,183 | 1,209 | 1,083 | 1,109 | 1,083 | 1,109 | 1,083 | 1,109 | 824 | 850 | 558 | 585 | ||||||||||||||||||||||||||||||||||||||||||
| 10 Year | 1,989 | 2,081 | 2,144 | 2,216 | 2,144 | 2,216 | 2,338 | 2,408 | 2,338 | 2,408 | 1,802 | 1,875 | 1,236 | 1,314 | ||||||||||||||||||||||||||||||||||||||||||
Exhibit E-19
| Pro | Pro | Pro | Pro | |||||||||||||||||||||||||||||||||||||||||||||||||||||
| Current | Forma | Current | Forma | Current | Forma | Current | Forma | |||||||||||||||||||||||||||||||||||||||||||||||||
| Class B | Class B | Class B | Class B | Class C | Class C | Class C | Class C | |||||||||||||||||||||||||||||||||||||||||||||||||
| assuming | assuming | assuming no | assuming no | assuming | assuming | assuming no | assuming no | |||||||||||||||||||||||||||||||||||||||||||||||||
| Pro | redemption | redemption | redemption | redemption | redemption | redemption | redemption | redemption | Pro | Pro | ||||||||||||||||||||||||||||||||||||||||||||||
| Current | Forma | at end of | at end of | at end of | at end of | at end of | at end of | at end of | at end of | Current | Forma | Current | Forma | |||||||||||||||||||||||||||||||||||||||||||
Small Cap Value Fund | Class A | Class A | each period | each period | each period | each period | each period | each period | each period | each period | Class R | Class R | Class Y | Class Y | ||||||||||||||||||||||||||||||||||||||||||
| 1 Year | 689 | 714 | — | — | — | — | 223 | 223 | 223 | 223 | 173 | 173 | 122 | 122 | ||||||||||||||||||||||||||||||||||||||||||
| 3 Year | 983 | 1,012 | — | — | — | — | 688 | 693 | 688 | 693 | 536 | 541 | 381 | 386 | ||||||||||||||||||||||||||||||||||||||||||
| 5 Year | 1,299 | 1,337 | — | — | �� | — | — | 1,180 | 1,196 | 1,180 | 1,196 | 923 | 939 | 660 | 676 | |||||||||||||||||||||||||||||||||||||||||
| 10 Year | 2,190 | 2,254 | — | — | — | — | 2,534 | 2,577 | 2,534 | 2,577 | 2,009 | 2,054 | 1,455 | 1,502 | ||||||||||||||||||||||||||||||||||||||||||
| Pro | Pro | Pro | Pro | |||||||||||||||||||||||||||||||||||||||||||||||||||||
| Current | Forma | Current | Forma | Current | Forma | Current | Forma | |||||||||||||||||||||||||||||||||||||||||||||||||
| Class B | Class B | Class B | Class B | Class C | Class C | Class C | Class C | |||||||||||||||||||||||||||||||||||||||||||||||||
| assuming | assuming | assuming no | assuming no | assuming | assuming | assuming no | assuming no | |||||||||||||||||||||||||||||||||||||||||||||||||
| Pro | redemption | redemption | redemption | redemption | redemption | redemption | redemption | redemption | Pro | Pro | ||||||||||||||||||||||||||||||||||||||||||||||
| Tactical Market | Current | Forma | at end of | at end of | at end of | at end of | at end of | at end of | at end of | at end of | Current | Forma | Current | Forma | ||||||||||||||||||||||||||||||||||||||||||
Opportunities Fund | Class A | Class A | each period | each period | each period | each period | each period | each period | each period | each period | Class R | Class R | Class Y | Class Y | ||||||||||||||||||||||||||||||||||||||||||
| 1 Year | — | — | — | — | — | — | — | — | — | — | — | — | 108 | 108 | ||||||||||||||||||||||||||||||||||||||||||
| 3 Year | — | — | — | — | — | — | — | — | — | — | — | — | 934 | 663 | ||||||||||||||||||||||||||||||||||||||||||
| 5 Year | — | — | — | — | — | — | — | — | — | — | — | — | 2,326 | 1,561 | ||||||||||||||||||||||||||||||||||||||||||
| 10 Year | — | — | — | — | — | — | — | — | — | — | — | — | 5,608 | 3,879 | ||||||||||||||||||||||||||||||||||||||||||
| Pro | Pro | Pro | Pro | |||||||||||||||||||||||||||||||||||||||||||||||||||||
| Current | Forma | Current | Forma | Current | Forma | Current | Forma | |||||||||||||||||||||||||||||||||||||||||||||||||
| Class B | Class B | Class B | Class B | Class C | Class C | Class C | Class C | |||||||||||||||||||||||||||||||||||||||||||||||||
| assuming | assuming | assuming no | assuming no | assuming | assuming | assuming no | assuming no | |||||||||||||||||||||||||||||||||||||||||||||||||
| Pro | redemption | redemption | redemption | redemption | redemption | redemption | redemption | redemption | Pro | Pro | ||||||||||||||||||||||||||||||||||||||||||||||
| Current | Forma | at end of | at end of | at end of | at end of | at end of | at end of | at end of | at end of | Current | Forma | Current | Forma | |||||||||||||||||||||||||||||||||||||||||||
Tax Free Fund | Class A | Class A | each period | each period | each period | each period | each period | each period | each period | each period | Class R | Class R | Class Y | Class Y | ||||||||||||||||||||||||||||||||||||||||||
| 1 Year | 498 | 493 | — | — | — | — | 137 | 133 | 137 | 133 | — | — | 72 | 67 | ||||||||||||||||||||||||||||||||||||||||||
| 3 Year | 684 | 661 | — | — | — | — | 436 | 415 | 436 | 415 | — | — | 233 | 211 | ||||||||||||||||||||||||||||||||||||||||||
| 5 Year | 916 | 856 | — | — | — | — | 766 | 718 | 766 | 718 | — | — | 417 | 368 | ||||||||||||||||||||||||||||||||||||||||||
| 10 Year | 1,581 | 1,416 | — | — | — | — | 1,699 | 1,579 | 1,699 | 1,579 | — | — | 951 | 822 | ||||||||||||||||||||||||||||||||||||||||||
Exhibit E-20
| Pro | Pro | Pro | Pro | |||||||||||||||||||||||||||||||||||||||||||||||||||||
| Current | Forma | Current | Forma | Current | Forma | Current | Forma | |||||||||||||||||||||||||||||||||||||||||||||||||
| Class B | Class B | Class B | Class B | Class C | Class C | Class C | Class C | |||||||||||||||||||||||||||||||||||||||||||||||||
| assuming | assuming | assuming no | assuming no | assuming | assuming | assuming no | assuming no | |||||||||||||||||||||||||||||||||||||||||||||||||
| Pro | redemption | redemption | redemption | redemption | redemption | redemption | redemption | redemption | Pro | Pro | ||||||||||||||||||||||||||||||||||||||||||||||
| Current | Forma | at end of | at end of | at end of | at end of | at end of | at end of | at end of | at end of | Current | Forma | Current | Forma | |||||||||||||||||||||||||||||||||||||||||||
Total Return Bond Fund | Class A | Class A | each period | each period | each period | each period | each period | each period | each period | each period | Class R | Class R | Class Y | Class Y | ||||||||||||||||||||||||||||||||||||||||||
| 1 Year | 511 | 511 | 666 | 675 | 166 | 175 | 177 | 175 | 177 | 175 | 115 | 124 | 76 | 74 | ||||||||||||||||||||||||||||||||||||||||||
| 3 Year | 721 | 703 | 842 | 842 | 542 | 542 | 564 | 542 | 564 | 542 | 388 | 387 | 253 | 230 | ||||||||||||||||||||||||||||||||||||||||||
| 5 Year | 977 | 921 | 1,072 | 1,033 | 972 | 933 | 993 | 933 | 993 | 933 | 710 | 670 | 463 | 401 | ||||||||||||||||||||||||||||||||||||||||||
| 10 Year | 1,706 | 1,548 | 1,972 | 1,831 | 1,972 | 1,831 | 2,186 | 2,030 | 2,186 | 2,030 | 1,622 | 1,477 | 1,068 | 894 | ||||||||||||||||||||||||||||||||||||||||||
Exhibit E-21
| Net Assets as of | Management/Sub-advisory | Advised or | ||||
Fund | September 30, 2010 | fees received | Sub-Advised | |||
| Northern Trust Multi-Manager International Equity Fund | $533.3 million | * | Sub-Advised |
| * | Pursuant to an exemptive order issued to the fund by the SEC, the fund is not required to disclose fees paid to asub-advisor. |
Exhibit F-1
Director Nominees | Aggregate Compensation Paid ($) | |||
| John P. Amboian | 0 | |||
| Robert P. Bremner | 265,996 | |||
| Jack B. Evans | 239,830 | |||
| William C. Hunter | 194,333 | |||
| David J. Kundert | 252,913 | |||
| William J. Schneider | 258,133 | |||
| Judith M. Stockdale | 219,480 | |||
| Carole E. Stone | 186,750 | |||
| Terence J. Toth | 247,289 | |||
| Virginia L. Stringer | 0 | |||
| Total Compensation | ||||||||
| Aggregate Compensation | from Company and Fund | |||||||
Current Directors | from Company ($) | Complex ($) | ||||||
| Benjamin R. Field | 111,199 | 161,500 | ||||||
| Roger A. Gibson | 120,408 | 174,875 | ||||||
| Victoria J. Herget | 122,216 | 177,500 | ||||||
| John P. Kayser | 109,478 | 159,000 | ||||||
| Leonard W. Kedrowski | 124,109 | 180,250 | ||||||
| Richard K. Riederer | 109,134 | 158,500 | ||||||
| Joseph D. Strauss | 117,740 | 171,000 | ||||||
| Virginia L. Stringer | 194,513 | 282,500 | ||||||
| James M. Wade | 110,166 | 160,000 | ||||||
Exhibit G-1
| John P. | Robert P. | Jack B. | William C. | David J. | William J. | Judith M. | Carole E. | Terence J. | Virginia L. | |||||||||||
Fund | Amboian | Bremner | Evans | Hunter | Kundert | Schneider | Stockdale | Stone | Toth | Stringer | ||||||||||
| California Tax Free Fund | $0 | $0 | $0 | $0 | $0 | $0 | $0 | $0 | $0 | $0 | ||||||||||
| Colorado Tax Free Fund | $0 | $0 | $0 | $0 | $0 | $0 | $0 | $0 | $0 | $0 | ||||||||||
| Core Bond Fund | $0 | $0 | $0 | $0 | $0 | $0 | $0 | $0 | $0 | $0 | ||||||||||
| Equity Income Fund | $0 | $0 | $0 | $0 | $0 | $0 | $0 | $0 | $0 | $0 | ||||||||||
| Equity Index Fund | $0 | $0 | $0 | $0 | $0 | $0 | $0 | $0 | $0 | $0 | ||||||||||
| Global Infrastructure Fund | $0 | $0 | $0 | $0 | $0 | $0 | $0 | $0 | $0 | $10,001-50,000 | ||||||||||
| High Income Bond Fund | $0 | $0 | $0 | $0 | $0 | $0 | $0 | $0 | $0 | $0 | ||||||||||
| Inflation Protected Securities Fund | $0 | $0 | $0 | $0 | $0 | $0 | $0 | $0 | $0 | $0 | ||||||||||
| Intermediate Government Bond Fund | $0 | $0 | $0 | $0 | $0 | $0 | $0 | $0 | $0 | $0 | ||||||||||
| Intermediate Tax Free Fund | $0 | $0 | $0 | $0 | $0 | $0 | $0 | $0 | $0 | $0 | ||||||||||
| Intermediate Term Bond Fund | $0 | $0 | $0 | $0 | $0 | $0 | $0 | $0 | $0 | $0 | ||||||||||
| International Fund | $0 | $0 | $0 | $0 | $0 | $0 | $0 | $0 | $0 | $10,001-50,000 | ||||||||||
| International Select Fund | $0 | $0 | $0 | $0 | $0 | $0 | $0 | $0 | $0 | $50,001-100,000 | ||||||||||
| Large Cap Growth Opportunities Fund | $0 | $0 | $0 | $0 | $0 | $0 | $0 | $0 | $0 | $10,001-50,000 | ||||||||||
| Large Cap Select Fund | $0 | $0 | $0 | $0 | $0 | $0 | $0 | $0 | $0 | $0 | ||||||||||
| Large Cap Value Fund | $0 | $0 | $0 | $0 | $0 | $0 | $0 | $0 | $0 | $10,001-50,000 | ||||||||||
| Mid Cap Growth Opportunities Fund | $0 | $0 | $0 | $0 | $0 | $0 | $0 | $0 | $0 | $10,001-100,000 | ||||||||||
| Mid Cap Index Fund | $0 | $0 | $0 | $0 | $0 | $0 | $0 | $0 | $0 | $10,001-50,000 | ||||||||||
| Mid Cap Select Fund | $0 | $0 | $0 | $0 | $0 | $0 | $0 | $0 | $0 | $0 | ||||||||||
| Mid Cap Value Fund | $0 | $0 | $0 | $0 | $0 | $0 | $0 | $0 | $0 | $10,001-50,000 | ||||||||||
| Minnesota Intermediate Tax Free Fund | $0 | $0 | $0 | $0 | $0 | $0 | $0 | $0 | $0 | $0 | ||||||||||
| Minnesota Tax Free Fund | $0 | $0 | $0 | $0 | $0 | $0 | $0 | $0 | $0 | $0 | ||||||||||
| Missouri Tax Free Fund | $0 | $0 | $0 | $0 | $0 | $0 | $0 | $0 | $0 | $0 | ||||||||||
| Nebraska Tax Free Fund | $0 | $0 | $0 | $0 | $0 | $0 | $0 | $0 | $0 | $0 | ||||||||||
| Ohio Tax Free Fund | $0 | $0 | $0 | $0 | $0 | $0 | $0 | $0 | $0 | $0 | ||||||||||
| Oregon Intermediate Tax Free Fund | $0 | $0 | $0 | $0 | $0 | $0 | $0 | $0 | $0 | $0 | ||||||||||
| Quantitative Large Cap Core Fund | $0 | $0 | $0 | $0 | $0 | $0 | $0 | $0 | $0 | $0 | ||||||||||
| Real Estate Securities Fund | $0 | $0 | $0 | $0 | $0 | $0 | $0 | $0 | $0 | $0 | ||||||||||
| Short Tax Free Fund | $0 | $0 | $0 | $0 | $0 | $0 | $0 | $0 | $0 | $0 | ||||||||||
| Short Term Bond Fund | $0 | $0 | $0 | $0 | $0 | $0 | $0 | $0 | $0 | $0 | ||||||||||
| Small Cap Growth Opportunities Fund | $0 | $0 | $0 | $0 | $0 | $0 | $0 | $0 | $0 | $0 | ||||||||||
| Small Cap Index Fund | $0 | $0 | $0 | $0 | $0 | $0 | $0 | $0 | $0 | $10,001-50,000 | ||||||||||
| Small Cap Select Fund | $0 | $0 | $0 | $0 | $0 | $0 | $0 | $0 | $0 | $50,001-100,000 | ||||||||||
| Small Cap Value Fund | $0 | $0 | $0 | $0 | $0 | $0 | $0 | $0 | $0 | $10,001-50,000 | ||||||||||
| Tactical Market Opportunities Fund | $0 | $0 | $0 | $0 | $0 | $0 | $0 | $0 | $0 | $0 | ||||||||||
| Tax Free Fund | $0 | $0 | $0 | $0 | $0 | $0 | $0 | $0 | $0 | $0 | ||||||||||
| Total Return Bond Fund | $0 | $0 | $0 | $0 | $0 | $0 | $0 | $0 | $0 | $0 | ||||||||||
| Aggregate Range of Equity Securities in All Nuveen/FAF Funds to Be Overseen by the Director Nominees | Over $100,000 | Over $100,000 | Over $100,000 | Over $100,000 | Over $100,000 | Over $100,000 | Over $100,000 | Over $100,000 | Over $100,000 | Over $100,000 |
Exhibit H-1
| Board and Committee Meetings | ||||||||||||||||
| No. of Meetings Held | ||||||||||||||||
Fund | Board | Audit | Governance | Pricing | ||||||||||||
| California Tax Free Fund | 5 | 5 | 3 | 4 | ||||||||||||
| Colorado Tax Free Fund | 5 | 5 | 3 | 4 | ||||||||||||
| Core Bond Fund | 5 | 5 | 3 | 4 | ||||||||||||
| Equity Income Fund | 6 | 6 | 2 | 5 | ||||||||||||
| Equity Index Fund | 6 | 6 | 2 | 5 | ||||||||||||
| Global Infrastructure Fund | 6 | 6 | 2 | 5 | ||||||||||||
| High Income Bond Fund | 5 | 5 | 3 | 4 | ||||||||||||
| Inflation Protected Securities Fund | 5 | 5 | 3 | 4 | ||||||||||||
| Intermediate Government Bond Fund | 5 | 5 | 3 | 4 | ||||||||||||
| Intermediate Tax Free Fund | 5 | 5 | 3 | 4 | ||||||||||||
| Intermediate Term Bond Fund | 5 | 5 | 3 | 4 | ||||||||||||
| International Fund | 6 | 6 | 2 | 5 | ||||||||||||
| International Select Fund | 7 | 6 | 2 | 5 | ||||||||||||
| Large Cap Growth Opportunities Fund | 6 | 6 | 2 | 5 | ||||||||||||
| Large Cap Select Fund | 6 | 6 | 2 | 5 | ||||||||||||
| Large Cap Value Fund | 6 | 6 | 2 | 5 | ||||||||||||
| Mid Cap Growth Opportunities Fund | 6 | 6 | 2 | 5 | ||||||||||||
| Mid Cap Index Fund | 6 | 6 | 2 | 5 | ||||||||||||
| Mid Cap Select Fund | 6 | 6 | 2 | 5 | ||||||||||||
| Mid Cap Value Fund | 6 | 6 | 2 | 5 | ||||||||||||
| Minnesota Intermediate Tax Free Fund | 5 | 5 | 3 | 4 | ||||||||||||
| Minnesota Tax Free Fund | 5 | 5 | 3 | 4 | ||||||||||||
| Missouri Tax Free Fund | 5 | 5 | 3 | 4 | ||||||||||||
| Nebraska Tax Free Fund | 5 | 5 | 3 | 4 | ||||||||||||
| Ohio Tax Free Fund | 5 | 5 | 3 | 4 | ||||||||||||
| Oregon Intermediate Tax Free Fund | 5 | 5 | 3 | 4 | ||||||||||||
| Quantitative Large Cap Core Fund | 6 | 6 | 2 | 5 | ||||||||||||
| Real Estate Securities Fund | 6 | 6 | 2 | 5 | ||||||||||||
| Short Tax Free Fund | 5 | 5 | 3 | 4 | ||||||||||||
| Short Term Bond Fund | 5 | 5 | 3 | 4 | ||||||||||||
| Small Cap Growth Opportunities Fund | 6 | 6 | 2 | 5 | ||||||||||||
| Small Cap Index Fund | 6 | 6 | 2 | 5 | ||||||||||||
| Small Cap Select Fund | 6 | 6 | 2 | 5 | ||||||||||||
| Small Cap Value Fund | 6 | 6 | 2 | 5 | ||||||||||||
| Tactical Market Opportunities Fund | 6 | 6 | 2 | 5 | ||||||||||||
| Tax Free Fund | 5 | 5 | 3 | 4 | ||||||||||||
| Total Return Bond Fund | 5 | 5 | 3 | 4 | ||||||||||||
Exhibit I-1
| Number of | ||||||||||||||||
Fund | Stockholder | Address | Shares Owned | Percentage | ||||||||||||
| California Tax Free Fund | ||||||||||||||||
| Colorado Tax Free Fund | ||||||||||||||||
| Core Bond Fund | ||||||||||||||||
| Equity Income Fund | ||||||||||||||||
| Equity Index Fund | ||||||||||||||||
| Global Infrastructure Fund | ||||||||||||||||
| High Income Bond Fund | ||||||||||||||||
| Inflation Protected Securities Fund | ||||||||||||||||
| Intermediate Government Bond Fund | ||||||||||||||||
| Intermediate Tax Free Fund | ||||||||||||||||
| Intermediate Term Bond Fund | ||||||||||||||||
| International Fund | ||||||||||||||||
| International Select Fund | ||||||||||||||||
| Large Cap Growth Opportunities Fund | ||||||||||||||||
| Large Cap Select Fund | ||||||||||||||||
| Large Cap Value Fund | ||||||||||||||||
| Mid Cap Growth Opportunities Fund | ||||||||||||||||
| Mid Cap Index Fund | ||||||||||||||||
| Mid Cap Select Fund | ||||||||||||||||
| Mid Cap Value Fund | ||||||||||||||||
| Minnesota Intermediate Tax Free Fund | ||||||||||||||||
| Minnesota Tax Free Fund | ||||||||||||||||
| Missouri Tax Free Fund | ||||||||||||||||
| Nebraska Tax Free Fund | ||||||||||||||||
| Ohio Tax Free Fund | ||||||||||||||||
| Oregon Intermediate Tax Free Fund | ||||||||||||||||
| Quantitative Large Cap Core Fund | ||||||||||||||||
| Real Estate Securities Fund | ||||||||||||||||
| Short Tax Free Fund | ||||||||||||||||
| Short Term Bond Fund | ||||||||||||||||
| Small Cap Growth Opportunities Fund | ||||||||||||||||
| Small Cap Index Fund | ||||||||||||||||
| Small Cap Select Fund | ||||||||||||||||
| Small Cap Value Fund | ||||||||||||||||
| Tactical Market Opportunities Fund | ||||||||||||||||
| Tax Free Fund | ||||||||||||||||
| Total Return Bond Fund | ||||||||||||||||
Exhibit J-1
AUDIT COMMITTEE CHARTER
[As amended May 11, 2004]
Exhibit K-1
Exhibit K-2
Exhibit K-3
GOVERNANCE COMMITTEE CHARTER
(as of November 3, 2009)
Exhibit L-1
Exhibit L-2
Fund | Fees Paid ($) | |||
| California Tax Free Fund | 220,343 | |||
| Colorado Tax Free Fund | 142,669 | |||
| Core Bond Fund | 2,952,494 | |||
| Equity Income Fund | 1,378,544 | |||
| Equity Index Fund | 2,033,961 | |||
| Global Infrastructure Fund | 89,679 | |||
| High Income Bond Fund | 727,938 | |||
| Inflation Protected Securities Fund | 341,896 | |||
| Intermediate Government Bond Fund | 298,949 | |||
| Intermediate Tax Free Fund | 1,631,259 | |||
| Intermediate Term Bond Fund | 1,714,118 | |||
| International Fund | 1,384,683 | |||
| International Select Fund | 761,556 | |||
| Large Cap Growth Opportunities Fund | 1,044,167 | |||
| Large Cap Select Fund | 350,923 | |||
| Large Cap Value Fund | 855,860 | |||
| Mid Cap Growth Opportunities Fund | 2,147,476 | |||
| Mid Cap Index Fund | 361,720 | |||
| Mid Cap Select Fund | 102,243 | |||
| Mid Cap Value Fund | 1,189,236 | |||
| Minnesota Intermediate Tax Free Fund | 476,475 | |||
| Minnesota Tax Free Fund | 362,783 | |||
| Missouri Tax Free Fund | 332,435 | |||
| Nebraska Tax Free Fund | 91,975 | |||
| Ohio Tax Free Fund | 122,354 | |||
| Oregon Intermediate Tax Free Fund | 333,216 | |||
| Quantitative Large Cap Core Fund | 217,949 | |||
| Real Estate Securities Fund | 1,496,079 | |||
| Short Tax Free Fund | 584,982 | |||
| Short Term Bond Fund | 1,223,974 | |||
| Small Cap Growth Opportunities Fund | 234,117 | |||
| Small Cap Index Fund | 105,678 | |||
| Small Cap Select Fund | 1,154,941 | |||
| Small Cap Value Fund | 366,224 | |||
| Tactical Market Opportunities Fund | — | |||
| Tax Free Fund | 1,026,078 | |||
| Total Return Bond Fund | 1,499,005 | |||
Exhibit M-1

| First American Investment Funds, Inc. 800 Nicollet Mall Minneapolis, MN 55402Fund Name Here THIS PROXY IS SOLICITED BY THE BOARD OF DIRECTORS The undersigned appoints Charles D. Gariboldi, Jr., Kathleen L. Prudhomme, Jeffery M. Wilson, and Richard J. Ertel, or any one of them, as proxies of the undersigned, with full power of substitution, to cast all eligible votes held by the undersigned at a Special Meeting of Stockholders, to be held at the offices of FAF Advisors, Inc., 800 Nicollet Mall, 3rd Floor-Training Room A, Minneapolis, Minnesota 55402, on December 17, 2010, at 11:00 a.m., Central time, and at any adjournment thereof, with all powers the undersigned would possess if present in person. All previous proxies given with respect to the Special Meeting are revoked. Receipt of the Notice of Special Meeting of Stockholders and the accompanying Proxy Statement is hereby acknowledged. THIS PROXY WILL BE VOTED AS INSTRUCTED ON THE MATTER SET FORTH ON THE REVERSE SIDE. IT IS UNDERSTOOD THAT IF NO CHOICE IS SPECIFIED, THIS PROXY WILL BE VOTED “FOR” THE PROPOSALS. UPON ALL OTHER MATTERS THE PROXIES SHALL VOTE AS THEY DEEM IN THE BEST INTERESTS OF THE FUND. THE BOARD OF DIRECTORS RECOMMENDS THAT YOU VOTE “FOR” THE PROPOSALS. NOTE: Please sign exactly as your name appears on this proxy card. Joint owners should each sign. When signing as executor, administrator, attorney, trustee, guardian or custodian for a minor, please give full title as such. If a corporation, this signature should be that of an authorized officer, please sign in full corporate name and indicate the signer’s title. Signature Date Additional Signatures (if held jointly) DatePlease fold here — Do not tear or separate YOUR VOTE IS IMPORTANT, NO MATTER HOW MANY SHARES YOU OWN. THE MATTERS WE ARE SUBMITTING FOR YOUR CONSIDERATION ARE SIGNIFICANT TO THE FUND AND TO YOU AS A FUND STOCKHOLDER. PLEASE TAKE THE TIME TO READ THE PROXY STATEMENT AND CAST YOUR VOTE.For your convenience we have setup several convenient methods to vote your proxy. Please vote by using one of the following methods detailed below:1. Internet:Log on to www.proxyonline.com. Make sure to have this proxy card available when you plan to vote your shares. Control Number:2. Phone:Simply dial toll-free XXX-XXX-XXXX. Please have this proxy card available at the time of the call.3. Mail:Simply sign, date, and complete the reverse side of this proxy card and return it in the postage paid envelope provided. 123456789123 If you would like another copy of the proxy material, they are available at www.proxyonline.com. You will need your control number above to log in. For any questions regarding the proposals or how to cast your vote, call toll-free XXX-XXX-XXXX.THE BOARD OF DIRECTORS RECOMMENDS THAT YOU VOTE “FOR” THE PROPOSALS. “TAG ID” “CUSIP” |
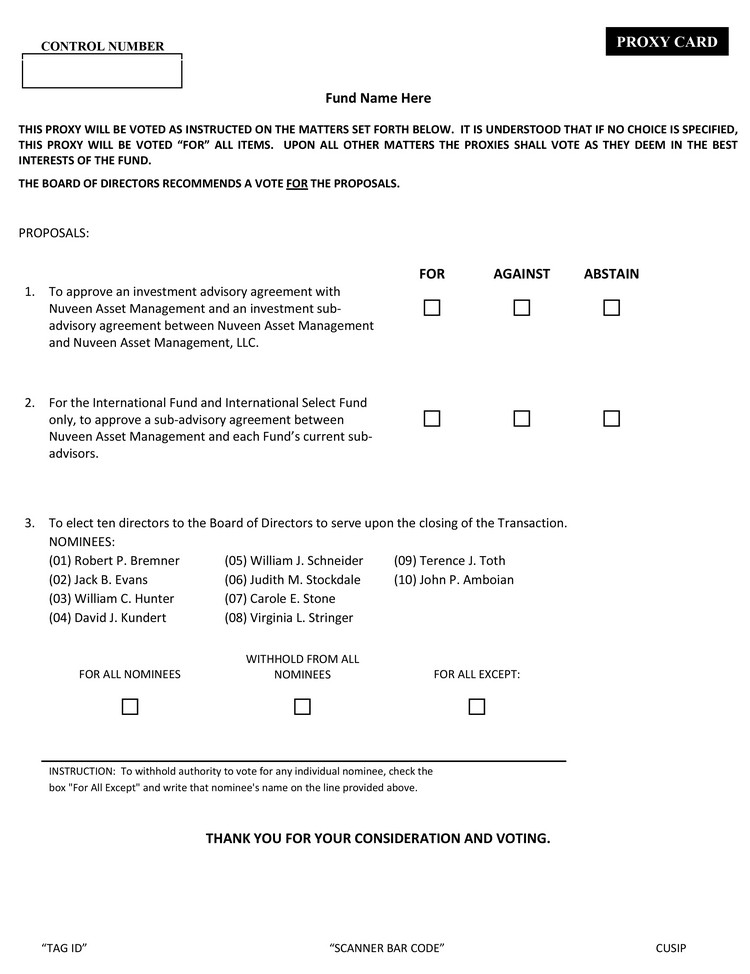
| CONTROL NUMBER PROXY CARD Fund Name Here THIS PROXY WILL BE VOTED AS INSTRUCTED ON THE MATTERS SET FORTH BELOW. IT IS UNDERSTOOD THAT IF NO CHOICE IS SPECIFIED, THIS PROXY WILL BE VOTED “FOR” ALL ITEMS. UPON ALL OTHER MATTERS THE PROXIES SHALL VOTE AS THEY DEEM IN THE BEST INTERESTS OF THE FUND. THE BOARD OF DIRECTORS RECOMMENDS A VOTEFOR THE PROPOSALS. PROPOSALS:FOR AGAINST ABSTAIN 1. To approve an investment advisory agreement with Nuveen Asset Management and an investment sub-advisory agreement between Nuveen Asset Management and Nuveen Asset Management, LLC. 2. For the International Fund and International Select Fund only, to approve a sub-advisory agreement between Nuveen Asset Management and each Fund’s current sub-advisors. 3. To elect ten directors to the Board of Directors to serve upon the closing of the Transaction. NOMINEES: (01) Robert P. Bremner (02) Jack B. Evans (03) William C. Hunter (04) David J. Kundert (05) William J. Schneider (06) Judith M. Stockdale (07) Carole E. Stone (08) Virginia L. Stringer (09) Terence J. Toth (10) John P. Amboian FOR ALL NOMINEES WITHHOLD FROM ALL NOMINEES FOR ALL EXCEPT: INSTRUCTION: To withhold authority to vote for any individual nominee, check the box “For All Except” and write that nominee’s name on the line provided above.THANK YOU FOR YOUR CONSIDERATION AND VOTING. “TAG ID” “SCANNER BAR CODE” CUSIP |