As filed with the Securities and Exchange Commission on July 23, 2012
File No. 333-
SECURITIES AND EXCHANGE COMMISSION
Washington, D.C. 20549
FORM N-14
REGISTRATION STATEMENT
UNDER
THE SECURITIES ACT OF 1933
¨ Pre-Effective Amendment No.
¨ Post-Effective Amendment No.
NUVEEN INVESTMENT FUNDS, INC.
(Exact Name of Registrant as Specified in Charter)
333 West Wacker Drive
Chicago, Illinois 60606
(Address of Principal Executive Offices, Zip Code)
Registrant’s Telephone Number, including Area Code (312) 917-7700
Kevin J. McCarthy
Vice President and Secretary
333 West Wacker Drive
Chicago, Illinois 60606
(Name and Address of Agent for Service)
Copy to:
| | |
Deborah Bielicke Eades Vedder Price P.C. 222 North LaSalle Street Chicago, Illinois 60601 | | Eric F. Fess Chapman and Cutler LLP 111 West Monroe Street Chicago, Illinois 60603 |
Approximate date of proposed public offering: As soon as practicable after the effective date of this Registration Statement.
TITLE OF SECURITIES BEING REGISTERED: Shares of Common Stock (par value $0.0001 per share) of the Registrant.
No filing fee is required because of reliance on Section 24(f) and an indefinite number of shares have previously been registered pursuant to Rule 24f-2 under the Investment Company Act of 1940.
It is proposed that this filing will become effective on August 22, 2012 pursuant to Rule 488 under the Securities Act of 1933.

Important Information for
Nuveen Large Cap Value Fund Shareholders
At a special meeting of shareholders of Nuveen Large Cap Value Fund (the “Acquired Fund”), a series of Nuveen Investment Funds, Inc. (the “Corporation”), you will be asked to vote upon an important change affecting your fund. The purpose of the special meeting is to allow you to vote on a reorganization of your fund into Nuveen Dividend Value Fund (the “Acquiring Fund”), another series of the Corporation. If the reorganization is approved and completed, you will become a shareholder of the Acquiring Fund. The Acquired Fund and the Acquiring Fund are collectively referred to herein as the “Funds.”
Although we recommend that you read the complete Proxy Statement/Prospectus, for your convenience, we have provided the following brief overview of the issue to be voted on.
| Q. | Why am I receiving this Proxy Statement/Prospectus? |
| A. | Nuveen Fund Advisors, Inc. (“Nuveen Fund Advisors”), each Fund’s investment adviser, has proposed the reorganization of the Acquired Fund into the Acquiring Fund as part of an initiative to eliminate certain redundancies among the products it offers and in an effort to achieve certain operating efficiencies. |
| Q. | What advantages will the reorganization produce for Acquired Fund shareholders? |
| A. | Nuveen Fund Advisors and the Board of Directors of the Corporation (the “Board”) believe that shareholders of the Acquired Fund will benefit from operational efficiencies and economies of scale that are expected to arise as a result of the larger net asset size of the Acquiring Fund following the reorganization. These operational efficiencies and economies of scale are expected to result in lower gross and net expenses for shareholders of the Acquired Fund. |
| Q. | What are the similarities between the investment policies of the Funds? |
| A. | The investment objective of the Acquired Fund is capital appreciation, with current income as the Fund’s secondary objective. The investment objective of the Acquiring Fund is long-term growth of capital and income. Although the investment objectives of the Funds are not the same, they are similar and the Funds employ similar investment strategies to achieve their investment objectives. The Acquired Fund invests, under normal market conditions, at least 80% of its net assets, plus the amount of any borrowings for investment purposes, in common stocks of large-capitalization companies, defined as companies that have market capitalizations of $5 billion or greater at the time of purchase. The Acquiring Fund invests, under normal market conditions, at least 80% of its net assets, plus the amount of any borrowings for investment purposes, in equity securities of companies which in the opinion of the Fund’s sub-adviser have the ability to pay above average dividends and finance expected growth, have strong management and are trading at attractive valuations. The Acquiring Fund has no restrictions on the capitalization levels of the companies in which it invests, but all of the Acquiring Fund’s equity securities must provide current income at the time of purchase. A more detailed comparison of the investment objectives, policies and risks of the Funds is contained in the Proxy Statement/Prospectus. |
| Q. | What will happen if shareholders do not approve the reorganization? |
| A. | If the reorganization is not approved by shareholders, the Board will take such actions as it deems to be in the best interests of the Acquired Fund, which may include additional solicitation, continuing to operate the Fund as a stand-alone fund, or liquidating the Fund. |
| Q. | Will Acquired Fund shareholders receive new shares in exchange for their current shares? |
| A. | Yes. If shareholders approve the reorganization and it is completed, each Acquired Fund shareholder will receive shares of the Acquiring Fund in an amount equal in total value to the total value of the Acquired Fund shares surrendered by such shareholder. |
| Q. | Will this reorganization create a taxable event for me? |
| A. | No. The reorganization is intended to qualify as a tax-free reorganization for federal income tax purposes. It is expected that you will recognize no gain or loss for federal income tax purposes as a direct result of the reorganization. Prior to the closing of the reorganization, the Acquired Fund expects to distribute all of its net investment income and net capital gains, if any. Such a distribution may be taxable to the Acquired Fund’s shareholders for federal income tax purposes. Due to the Acquired Fund’s capital loss carryforwards, a net capital gain distribution is not expected. However, in light of realized capital gains in the Acquiring Fund’s portfolio that may not be distributed prior to the reorganization, and in light of unrealized capital gains currently in the acquiring Fund’s portfolio, you may be subject to higher capital gain distributions in the future than you would have been absent the reorganization. |
| Q. | How do total operating expenses compare between the two Funds? |
| A. | The total operating expenses of the Acquiring Fund immediately following the reorganization are expected to be lower than the total operating expenses of the Acquired Fund for all share classes. |
| Q. | Who will bear the costs of the reorganization? |
| A. | The reorganization is expected to result in cost savings for each Fund. The Acquired Fund’s projected cost savings are expected due to the operational efficiencies and economies of scale that the larger combined fund should experience. The Acquiring Fund’s projected cost savings consist of management fees expected to be reimbursed pursuant to the proposed management fee reimbursement arrangement that will be implemented if shareholders approve the reorganization and it is completed. In light of these anticipated cost savings, the costs of the reorganization will be allocated between the Funds ratably up to each Fund’s projected cost savings during the first year following the reorganization. Nuveen Fund Advisors estimates that the costs of the reorganization will be approximately $154,000 and that the cost savings during the first year following the reorganization will be approximately $232,000 for the Acquired Fund and $234,000 for the Acquiring Fund. As a result, each of the Acquired Fund and the Acquiring Fund are expected to be charged approximately $77,000. To the extent that such reorganization expenses otherwise exceed the projected cost savings for the Funds during the first year following the reorganization, Nuveen Fund Advisors or its affiliates (“Nuveen”) will pay such expenses. In addition, to the extent that the payment of these expenses would cause a Fund’s expenses to exceed its expense cap for all share classes in effect through December 31, 2012, Nuveen will reimburse such expenses to the extent necessary to operate within the cap. Based on current expense levels it is anticipated that the Acquired Fund’s expenses will exceed its expense cap and that Nuveen will reimburse approximately $12,000 of reorganization expenses charged to the |
| | Acquired Fund. The Funds are expected to recover their costs of the reorganization within the first year following the reorganization assuming that annual cost savings occur at the level shown above. If the reorganization is not approved or completed, Nuveen will pay all such reorganization expenses. |
| Q. | What is the timetable for the reorganization? |
| A. | If approved by shareholders on , 2012, the reorganization is expected to occur at the close of business on , 2012. |
| Q. | Whom do I call if I have questions? |
| A. | If you need any assistance, or have any questions regarding the proposal or how to vote your shares, please call Computershare Fund Services, your proxy solicitor, at (866) 905-8160 from 8 a.m. to 10 p.m. Central time on Monday through Friday or 11 a.m. to 5 p.m. Central time on Saturday. Please have your proxy materials available when you call. |
| Q. | How do I vote my shares? |
| A. | You may vote by mail, telephone or over the Internet: |
| | • | | To vote by mail, please mark, sign, date and mail the enclosed proxy card. No postage is required if mailed in the United States. |
| | • | | To vote by telephone, please call the toll-free number located on your proxy card and follow the recorded instructions, using your proxy card as a guide. |
| | • | | To vote over the Internet, go to the Internet address provided on your proxy card and follow the instructions, using your proxy card as a guide. |
| Q. | Will Nuveen contact me? |
| A. | You may receive a call from representatives of Computershare Fund Services, the proxy solicitation firm retained by Nuveen, to verify that you received your proxy materials and to answer any questions you may have about the reorganization. |
| Q. | How does the Board suggest that I vote? |
| A. | After careful consideration, the Board has agreed unanimously that the reorganization is in the best interests of your Fund and recommends that you vote “FOR” the reorganization. |
, 2012
Dear Shareholders:
We are pleased to invite you to the special meeting of shareholders of Nuveen Large Cap Value Fund (the “Special Meeting”). The Special Meeting is scheduled for , 2012, at [ : ] p.m., Central time, at the offices of Nuveen Investments, Inc., 333 West Wacker Drive, Chicago, Illinois 60606.
At the Special Meeting, you will be asked to consider and approve a very important proposal. Subject to shareholder approval, Nuveen Dividend Value Fund (the “Acquiring Fund”) will acquire all the assets and liabilities of Nuveen Large Cap Value Fund (the “Acquired Fund” and together with the Acquiring Fund, the “Funds” and each a “Fund”) in exchange solely for shares of the Acquiring Fund, which will be distributed in complete liquidation of the Acquired Fund to the shareholders of the Acquired Fund (the “Reorganization”).
Nuveen Fund Advisors, Inc. (“Nuveen Fund Advisors”), each Fund’s investment adviser, has proposed the Reorganization involving the Acquired Fund, as well as a number of other reorganizations involving other funds advised by Nuveen Fund Advisors, to eliminate certain redundancies among the products it offers and in an effort to achieve certain operating efficiencies.
The Reorganization is being proposed because Nuveen Fund Advisors and the Board of Directors of Nuveen Investment Funds, Inc. (the “Board”) believe that the shareholders of the Acquired Fund will benefit from potential operating efficiencies and economies of scale that may be achieved by combining the Funds pursuant to the Reorganization. Following the Reorganization, the Acquiring Fund is expected to have lower gross and net total operating expenses than the Acquired Fund had prior to the Reorganization. The Board believes the Reorganization is in the best interests of the Acquired Fund and recommends that you vote “For” the proposed Reorganization.
The attached Proxy Statement/Prospectus has been prepared to give you information about this proposal.
All shareholders are cordially invited to attend the Special Meeting. In order to avoid delay and additional expense, and to assure that your shares are represented, please vote as promptly as possible, whether or not you plan to attend the Special Meeting. You may vote by mail, telephone or over the Internet.
| | • | | To vote by mail, please mark, sign, date and mail the enclosed proxy card. No postage is required if mailed in the United States. |
| | • | | To vote by telephone, please call the toll-free number located on your proxy card and follow the recorded instructions, using your proxy card as a guide. |
| | • | | To vote over the Internet, go to the Internet address provided on your proxy card and follow the instructions, using your proxy card as a guide. |
We appreciate your continued support and confidence in Nuveen and our family of funds.
|
| Very truly yours, |
|
Kevin J. McCarthy Vice President and Secretary |
, 2012
NUVEEN Large Cap Value Fund
NOTICE OF SPECIAL MEETING OF SHAREHOLDERS
TO BE HELD ON , 2012
To the Shareholders:
Notice is hereby given that a special meeting of shareholders of Nuveen Large Cap Value Fund (the “Acquired Fund”), a series of Nuveen Investment Funds, Inc. (the “Corporation”), a Maryland corporation, will be held at the offices of Nuveen Investments, Inc., 333 West Wacker Drive, Chicago, Illinois 60606, on , 2012 at [ : p.m.], Central time (the “Special Meeting”), for the following purposes:
1. To approve an Agreement and Plan of Reorganization (and the related transactions) which provides for (i) the transfer of all the assets of the Acquired Fund to Nuveen Dividend Value Fund (the “Acquiring Fund”) in exchange solely for voting shares of common stock of the Acquiring Fund and the assumption by the Acquiring Fund of all the liabilities of the Acquired Fund; and (ii) the distribution by the Acquired Fund of Class A, Class C, Class R3 and Class I shares of the Acquiring Fund to the shareholders of Class A, Class C, Class R3 and Class I shares, respectively, of the Acquired Fund in complete liquidation and termination of the Acquired Fund (the “Reorganization”). A vote in favor of the Reorganization will be considered a vote in favor of an amendment to the Corporation’s Articles of Incorporation effecting the Reorganization.
2. To transact such other business as may properly come before the Special Meeting.
Only shareholders of record as of the close of business on , 2012 are entitled to vote at the Special Meeting or any adjournments or postponements thereof.
All shareholders are cordially invited to attend the Special Meeting. In order to avoid delay and additional expense, and to assure that your shares are represented, please vote as promptly as possible, whether or not you plan to attend the Special Meeting. You may vote by mail, telephone or over the Internet.
| | • | | To vote by mail, please mark, sign, date and mail the enclosed proxy card. No postage is required if mailed in the United States. |
| | • | | To vote by telephone, please call the toll-free number located on your proxy card and follow the recorded instructions, using your proxy card as a guide. |
| | • | | To vote over the Internet, go to the Internet address provided on your proxy card and follow the instructions, using your proxy card as a guide. |
|
Kevin J. McCarthy
Vice President and Secretary |
Proxy Statement/Prospectus
Dated , 2012
Relating to the Acquisition of the Assets and Liabilities of NUVEEN LARGE CAP VALUE FUND by NUVEEN DIVIDEND VALUE FUND (formerly Nuveen Equity Income Fund)
This Proxy Statement/Prospectus is being furnished to shareholders of Nuveen Large Cap Value Fund (the “Acquired Fund”), a series of Nuveen Investment Funds, Inc. (the “Corporation”), a Maryland corporation and an open-end investment company registered under the Investment Company Act of 1940, as amended (the “1940 Act”), and relates to the special meeting of shareholders of the Acquired Fund to be held at the offices of Nuveen Investments, Inc., 333 West Wacker Drive, Chicago, Illinois 60606, on , 2012 at [ : p.m.], Central time and at any and all adjournments and postponements thereof (the “Special Meeting”). This Proxy Statement/Prospectus is provided in connection with the solicitation by the Board of Directors of the Corporation (the “Board”) of proxies to be voted at the Special Meeting, and any and all adjournments or postponements thereof. The purpose of the Special Meeting is to consider the proposed reorganization (the “Reorganization”) of the Acquired Fund into Nuveen Dividend Value Fund (formerly Nuveen Equity Income Fund) (the “Acquiring Fund”), a series the Corporation. The Acquired Fund and the Acquiring Fund are referred to herein collectively as the “Funds” and individually as a “Fund.” If shareholders approve the Reorganization and it is completed, shareholders of the Acquired Fund will receive shares of the corresponding class of the Acquiring Fund with the same total value as the total value of the Acquired Fund shares surrendered by such shareholders. The Board has determined that the Reorganization is in the best interests of the Acquired Fund. The address, principal executive office and telephone number of the Funds and the Corporation is 333 West Wacker Drive, Chicago, Illinois 60606, (800) 257-8787.
A vote in favor of the Reorganization will be considered a vote in favor of an amendment to the Corporation’s Articles of Incorporation effecting the Reorganization.
The enclosed proxy and this Proxy Statement/Prospectus are first being sent to shareholders of the Acquired Fund on or about , 2012. Shareholders of record as of the close of business on , 2012 are entitled to vote at the Special Meeting and any adjournments or postponements thereof.
The Securities and Exchange Commission has not approved or disapproved these securities or determined whether the information in this Proxy Statement/Prospectus is truthful or complete. Any representation to the contrary is a criminal offense.
This Proxy Statement/Prospectus concisely sets forth the information shareholders of the Acquired Fund should know before voting on the Reorganization (in effect, investing in Class A, Class C, Class R3 and Class I shares of the Acquiring Fund) and constitutes an offering of Class A, Class C, Class R3 and Class I shares of common stock, par value $0.0001 per share, of the Acquiring Fund. Please read it carefully and retain it for future reference.
The following documents have been filed with the Securities and Exchange Commission (“SEC”) and are incorporated into this Proxy Statement/Prospectus by reference and also accompany this Proxy Statement/Prospectus:
| | (i) | the Corporation’s prospectus dated February 29, 2012, as supplemented through the date of this Proxy Statement/Prospectus, relating to the Funds; and |
| | (ii) | the unaudited financial statements contained in the Corporation’s Semi-Annual Report relating to each Fund for the six-month period ended April 30, 2012. |
The following documents contain additional information about the Funds, have been filed with the SEC and are incorporated into this Proxy Statement/Prospectus by reference:
| | (i) | the Statement of Additional Information relating to the proposed Reorganization, dated , 2012 (the “Reorganization SAI”); |
| | (ii) | the Corporation’s statement of additional information dated February 29, 2012, as supplemented through the date of this Proxy Statement/Prospectus, relating to the Funds; and |
| | (iii) | the audited financial statements contained in the Corporation’s Annual Report relating to each Fund for the fiscal year ended October 31, 2011. |
No other parts of the documents referenced above are incorporated by reference herein.
Copies of the foregoing may be obtained without charge by calling or writing the Funds at the telephone number or address shown above. If you wish to request the Reorganization SAI, please ask for the “Reorganization SAI.” In addition, the Acquiring Fund will furnish, without charge, a copy of its most recent annual report and semi-annual report to a shareholder upon request. Any such request should be directed to the Acquiring Fund by calling (800) 257-8787 or by writing the Acquiring Fund at 333 West Wacker Drive, Chicago, Illinois 60606.
The Corporation is subject to the informational requirements of the Securities Exchange Act of 1934, as amended, and the 1940 Act, and in accordance therewith files reports and other information with the SEC. Reports, proxy statements, registration statements and other information filed by the Corporation (including the registration statement relating to the Acquiring Fund on Form N-14 of which this Proxy Statement/Prospectus is a part) may be inspected without charge and copied (for a duplication fee at prescribed rates) at the SEC’s Public Reference Room at 100 F Street, N.E., Washington, D.C. 20549 or at the SEC’s Northeast Regional Office (3 World Financial Center, New York, New York 10281) or Midwest Regional Office (175 W. Jackson Boulevard, Suite 900, Chicago, Illinois 60604). You may call the SEC at (202) 551-8090 for information about the operation of the Public Reference Room. You may obtain copies of this information, with payment of a duplication fee, by electronic request at the following e-mail address: publicinfo@sec.gov, or by writing the SEC’s Public Reference Branch, Office of Consumer Affairs and Information Services, Securities and Exchange Commission, Washington, D.C. 20549. You may also access reports and other information about the Funds on the EDGAR database on the SEC’s Internet site at http://www.sec.gov.
TABLE OF CONTENTS
i
TABLE OF CONTENTS
(continued)
ii
SUMMARY
The following is a summary of, and is qualified by reference to, the more complete information contained in this Proxy Statement/Prospectus and the information attached hereto or incorporated herein by reference, including the Agreement and Plan of Reorganization. As discussed more fully below and elsewhere in this Proxy Statement/Prospectus, the Board believes the proposed Reorganization is in the best interests of each Fund and that the interests of each Fund’s existing shareholders would not be diluted as a result of the Reorganization. If the Reorganization is approved and completed, shareholders of the Acquired Fund will become shareholders of the Acquiring Fund and will cease to be shareholders of the Acquired Fund.
Shareholders should read the entire Proxy Statement/Prospectus carefully together with the Acquiring Fund’s Prospectus that accompanies this Proxy Statement/Prospectus, which is incorporated herein by reference. This Proxy Statement/Prospectus constitutes an offering of Class A, Class C, Class R3 and Class I shares of the Acquiring Fund only.
Background
Nuveen Fund Advisors, Inc. (“Nuveen Fund Advisors” or the “Adviser”), each Fund’s investment adviser, has proposed the reorganization of the Acquired Fund into the Acquiring Fund, as well as a number of other fund reorganizations between funds with similar investment objectives and policies, as part of an initiative to eliminate certain redundancies among the products it offers and in an effort to achieve certain operating efficiencies.
The Reorganization
This Proxy Statement/Prospectus is being furnished to shareholders of the Acquired Fund in connection with the proposed combination of the Acquired Fund with and into the Acquiring Fund pursuant to the terms and conditions of the Agreement and Plan of Reorganization dated , 2012 by the Corporation, on behalf of the Acquired Fund and the Acquiring Fund, and Nuveen Fund Advisors (the “Agreement”). The Agreement provides for (i) the transfer of all the assets of the Acquired Fund to the Acquiring Fund in exchange solely for Class A, Class C, Class R3 and Class I voting shares of common stock, par value $0.0001 per share, of the Acquiring Fund and the assumption by the Acquiring Fund of all the liabilities of the Acquired Fund; and (ii) the distribution by the Acquired Fund of Class A, Class C, Class R3 and Class I shares of the Acquiring Fund to the shareholders of the corresponding class of the Acquired Fund in complete liquidation and termination of the Acquired Fund as soon as practicable following the Closing Date (as defined herein).
If shareholders approve the Reorganization and it is completed, Acquired Fund shareholders will become shareholders of the Acquiring Fund. The Board has determined that the Reorganization is in the best interests of the Acquired Fund and that the interests of existing shareholders will not be diluted as a result of the Reorganization. The Board unanimously approved the Reorganization and the Agreement at a meeting held on May 21-23, 2012. The Board recommends a vote “FOR” the Reorganization.
If shareholders approve the Reorganization, the Reorganization is expected to result in cost savings for each Fund. The Acquired Fund’s projected cost savings are expected due to the operational efficiencies and economies of scale that the larger combined fund should experience. The Acquiring Fund’s projected cost savings consist of management fees expected to be reimbursed pursuant to the proposed management fee reimbursement arrangement that will be implemented if shareholders
approve the Reorganization and it is completed. This arrangement is intended to maintain the Acquiring Fund’s operating expenses at levels experienced during the fiscal year ended October 31, 2011. For the twelve-month period ended April 30, 2012, the Acquiring Fund experienced gross total operating expenses of 1.16%, 1.91%, 1.41% and 0.91% for Class A, Class C, Class R3 and Class I shares, respectively, which are higher than those experienced during the fiscal year ended October 31, 2011 as shown in the “Annual Fund Operating Expenses” table. Accordingly, the proposed management fee reimbursement arrangement is projected to benefit the Acquiring Fund. In light of the anticipated cost savings, the costs of the Reorganization will be allocated between the Funds ratably up to each Fund’s projected cost savings during the first year following the Reorganization. Nuveen Fund Advisors estimates that the costs of the Reorganization will be approximately $154,000 and that the cost savings during the first year following the Reorganization will be approximately $232,000 for the Acquired Fund and $234,000 for the Acquiring Fund. As a result, each of the Acquired Fund and the Acquiring Fund are expected to be charged approximately $77,000. To the extent that such Reorganization expenses otherwise exceed the projected cost savings for the Funds during the first year following the Reorganization, Nuveen Fund Advisors or its affiliates (“Nuveen”) will pay such expenses. In addition, to the extent that the payment of these expenses would cause a Fund’s expenses to exceed its expense cap for all share classes in effect through December 31, 2012, Nuveen will reimburse such expenses to the extent necessary to operate within the cap. Based on current expense levels it is anticipated that the Acquired Fund’s expenses will exceed its expense cap and that Nuveen will reimburse approximately $12,000 of Reorganization expenses charged to the Acquired Fund. The Funds are expected to recover their costs of the Reorganization within the first year following the Reorganization assuming that annual cost savings occur at the level shown above. If the Reorganization is not approved or completed, Nuveen will pay all such Reorganization expenses.
The Board is asking shareholders of the Acquired Fund to approve the Reorganization at the Special Meeting to be held on , 2012. Approval of the Reorganization requires the affirmative vote of the holders of a majority of the total number of shares outstanding and entitled to vote. See “Voting Information and Requirements” below.
If shareholders of the Acquired Fund approve the Reorganization, it is expected that the Reorganization will occur at the close of business on , 2012 (the “Closing Date”), but it may be at a different time as described herein. If the Reorganization is not approved, the Board will take such action as it deems to be in the best interests of the Acquired Fund. The Closing Date may be delayed and the Reorganization may be abandoned at any time by the mutual agreement of the parties. In addition, either Fund may at its option terminate the Agreement at or before the Closing Date due to (i) a breach by any other party of any representation, warranty, or agreement contained in the Agreement to be performed at or before the Closing Date, if not cured within 30 days, (ii) a condition precedent to the obligations of the terminating party that has not been met and it reasonably appears that it will not or cannot be met, or (iii) a determination by the Board that the consummation of the transactions contemplated by the Agreement is not in the best interests of a Fund.
Reasons for the Proposed Reorganization
The Board believes that the proposed Reorganization would be in the best interests of each Fund. In approving the Reorganization, the Board considered a number of principal factors in reaching its determination, including the following:
| | • | | the similarities and differences in the Funds’ investment objectives and principal investment strategies; |
2
| | • | | the Funds’ relative risks; |
| | • | | the Funds’ relative sizes; |
| | • | | the relative investment performance of the Funds and portfolio managers; |
| | • | | the relative fees and expense ratios of the Funds, including caps on the Funds’ expenses agreed to by the Adviser; |
| | • | | the anticipated tax-free nature of the Reorganization; |
| | • | | the expected costs of the Reorganization and the extent to which the Funds would bear any such costs; |
| | • | | the terms of the Reorganization and whether the Reorganization would dilute the interests of shareholders of the Funds; |
| | • | | the effect of the Reorganization on shareholder services and shareholder rights; |
| | • | | alternatives to the Reorganization; and |
| | • | | any potential benefits of the Reorganization to the Adviser and its affiliates as a result of the Reorganization. |
For a more detailed discussion of the Board’s considerations regarding the approval of the Reorganization, see “The Board’s Approval of the Reorganization.”
Distribution, Purchase, Redemption, Exchange of Shares and Dividends
The Funds have identical procedures for purchasing, exchanging and redeeming shares. The Acquired Fund offers four classes of shares: Class A, Class C, Class R3 and Class I Shares. The Acquiring Fund offers five classes of shares: Class A, Class B, Class C, Class R3 and Class I Shares. The corresponding classes of each Fund have the same investment eligibility criteria. The Acquiring Fund normally declares and pays dividends from net investment income quarterly. The Acquired Fund’s dividends from net investment income, if any, are normally declared and paid annually. Each Fund declares and pays any taxable capital gains or other taxable distributions once a year at year end. See “Comparison of the Funds—Distribution, Purchase, Redemption, Exchange of Shares and Dividends” below for a more detailed discussion.
Material Federal Income Tax Consequences of the Reorganization
As a condition to closing, the Funds will receive an opinion from Vedder Price P.C. (which will be based on certain factual representations and certain customary assumptions and exclusions) substantially to the effect that the Reorganization will qualify as a tax-free reorganization under Section 368(a) of the Internal Revenue Code of 1986, as amended (the “Code”). Accordingly, it is expected that neither Fund will recognize gain or loss for federal income tax purposes as a direct result of the Reorganization. In connection with the Reorganization, a portion of the Acquired Fund’s portfolio assets may be sold prior to the Reorganization, which could result in the Acquired Fund declaring taxable distributions to its shareholders on or prior to the Closing Date. However, it is not
3
expected that any material portfolio sales (i.e., more than 5% of the Acquired Fund assets) will occur solely in connection with the Reorganization. In addition, the Acquired Fund recently experienced a change in its portfolio management team, and, as a result, the Acquired Fund may have material portfolio sales prior to the Reorganization. For a more detailed discussion of the federal income tax consequences of the Reorganization, please see “The Proposed Reorganization—Material Federal Income Tax Consequences” below.
COMPARISON OF THE FUNDS
Investment Objectives
The Funds have similar investment objectives. The Acquired Fund’s investment objective is capital appreciation. The Acquired Fund’s secondary objective is current income. The Acquiring Fund’s investment objective is long-term growth of capital and income. The investment objective of each Fund may be changed without shareholder approval upon providing notice at least 60 days in advance.
Investment Strategies
The Acquired Fund and the Acquiring Fund also have similar principal investment strategies and risks. The similarities and differences of the principal investment strategies of the Funds are:
| | |
| Acquired Fund | | Acquiring Fund |
| |
• Under normal market conditions, the Fund invests at least 80% of net assets, plus the amount of any borrowings for investment purposes, in common stocks of large-capitalization companies, defined as companies that have market capitalizations of $5 billion or greater at the time of purchase. | | • Under normal market conditions, the Fund invests at least 80% of its net assets, plus the amount of any borrowings for investment purposes, in equity securities of companies that, in the opinion of the Fund’s sub-adviser, have the ability to pay above average dividends and finance expected growth, have strong management, and are trading at attractive valuations. |
| |
• In selecting stocks, the Fund’s sub-adviser invests in companies that it believes are undervalued relative to other companies in the same industry or market, exhibit good or improving fundamentals, and exhibit an identifiable catalyst that could close the gap between market value and fair value over the next one to two years. | | |
4
| | |
| Acquired Fund | | Acquiring Fund |
| |
| | • The Fund will attempt to maintain a dividend that will grow over time. As a result, higher-yielding equity securities will generally represent the core holdings of the Fund. However, the Fund also may invest in lower-yielding, higher-growth equity securities if the sub-adviser believes they will help balance the portfolio. |
| |
| | • The Fund’s equity securities include common stocks, convertible preferred stocks, and corporate debt securities that are convertible into common stocks. All such equity securities will provide current income at the time of purchase. |
| |
| | • The Fund may invest in convertible debt securities without regard to their ratings, and therefore may hold convertible debt securities which are rated lower than investment grade. |
| |
• The Fund may invest up to 15% of its total assets in non-dollar denominated equity securities of non-U.S. issuers. | | • The Fund may invest up to 15% of its total assets in non-dollar denominated equity securities of non-U.S. issuers. |
| |
• The Fund may invest up to 25% of its assets, collectively, in non-dollar denominated equity securities of non-U.S. issuers and in dollar-denominated equity securities of non-U.S. issuers that are either listed on a U.S. stock exchange or represented by depositary receipts that may or may not be sponsored by a domestic bank. | | • The Fund may invest up to 25% of its assets, collectively, in non-dollar denominated equity securities of non-U.S. issuers and in dollar-denominated equity securities of non-U.S. issuers that are either listed on a U.S. stock exchange or represented by depositary receipts that may or may not be sponsored by a domestic bank. |
| |
• Up to 15% of the Fund’s total assets may be invested in equity securities of emerging market issuers. A country is considered to be an “emerging market” if it is defined as such by Morgan Stanley Capital International Inc. | | • Up to 15% of the Fund’s total assets may be invested in equity securities of emerging market issuers. A country is considered to be an “emerging market” if it is defined as such by Morgan Stanley Capital International Inc. |
5
| | |
| Acquired Fund | | Acquiring Fund |
| |
• The Fund may utilize options, futures contracts, options on futures contracts, and forward foreign currency exchange contracts (“derivatives”). The Fund may use these derivatives to manage market or business risk, enhance the Fund’s return, or hedge against adverse movements in currency exchange rates. | | • The Fund may utilize options, futures contracts, options on futures contracts, and forward foreign currency exchange contracts (“derivatives”). The Fund may use these derivatives to manage market or business risk, enhance the Fund’s return, or hedge against adverse movements in currency exchange rates. |
Comparison of Principal Investment Strategies
Although the investment objectives of the Funds are not the same, they are similar and the Funds employ similar investment strategies to achieve their investment objectives. Under normal market conditions, the Acquired Fund invests at least 80% of its net assets, plus the amount of any borrowings for investment purposes, in common stocks of large-capitalization companies, defined as companies that have market capitalizations of $5 billion or greater at the time of purchase. Under normal market conditions, the Acquiring Fund invests at least 80% of its net assets, plus the amount of any borrowings for investment purposes, in equity securities which in the opinion of the Fund’s sub-adviser have the ability to pay above average dividends and finance expected growth, have strong management and are trading at attractive valuations. The Acquiring Fund has no restrictions on the capitalization levels of the companies in which it invests, but all of the Fund’s equity securities must provide current income at the time of purchase.
The Acquiring Fund invests in equity securities, which may include common stocks, convertible preferred stocks and corporate debt securities that are convertible into common stocks. The Acquired Fund invests in common stocks, but it does not invest in convertible preferred stocks or convertible debt securities as a principal strategy.
Both Funds have the same principal investment strategies regarding investment in foreign securities, emerging market securities and derivatives.
In evaluating the Reorganization, each Acquired Fund shareholder should consider the risks of investing in the Acquiring Fund. The principal risks of investing in the Acquiring Fund are described in the section below entitled “Risk Factors.”
The Reorganization may result in one-time brokerage costs for the Acquired Fund to the extent it is necessary for the Acquired Fund to sell holdings prior to the Reorganization so that the Acquiring Fund’s portfolio immediately following the Reorganization remains in compliance with its investment policies and restrictions. If the Reorganization had occurred as of April 30, 2012, the Acquired Fund would not have been required to dispose of its securities in order to comply with the Acquiring Fund’s investment policies and restrictions, and would not have sold any material portion (i.e., more than 5% of its assets) of the securities in its portfolio solely as a result of the Reorganization.
Fees and Expenses
The tables below provide information about the fees and expenses attributable to each class of shares of the Funds, and the pro forma fees and expenses of the combined fund. You may qualify for
6
sales charge discounts on purchases of Class A shares if you and your family invest, or agree to invest in the future, at least $50,000 in a Fund or other Nuveen mutual funds. Shareholder fees reflect the fees currently in effect for each Fund as of their fiscal year ended October 31, 2011. The pro forma fees and expenses are based on the amounts shown in the table for each Fund, assuming the Reorganization occurred as of October 31, 2011.
Shareholder Fees
(paid directly from your investment)
| | | | | | |
| | | Acquired
Fund | | Acquiring
Fund | | Combined
Fund Pro
Forma |
Maximum Sales Charge (Load) Imposed on Purchases (as a percentage of offering price) | | | | | | |
Class A | | 5.75% | | 5.75% | | 5.75% |
Class C | | None | | None | | None |
Class R3 | | None | | None | | None |
Class I | | None | | None | | None |
Maximum Deferred Sales Charge (Load) (as a percentage of the lesser of purchase price or redemption proceeds) | | | | | | |
Class A | | None | | None | | None |
Class C1 | | 1.00% | | 1.00% | | 1.00% |
Class R3 | | None | | None | | None |
Class I | | None | | None | | None |
Maximum Sales Charge (Load) Imposed on Reinvested Dividends | | | | | | |
Class A | | None | | None | | None |
Class C | | None | | None | | None |
Class R3 | | None | | None | | None |
Class I | | None | | None | | None |
Exchange Fees | | | | | | |
Class A | | None | | None | | None |
Class C | | None | | None | | None |
Class R3 | | None | | None | | None |
Class I | | None | | None | | None |
Annual Low Balance Account fee (for accounts under $1,000)2 | | | | | | |
Class A | | $15 | | $15 | | $15 |
Class C | | $15 | | $15 | | $15 |
Class R3 | | None | | None | | None |
Class I | | $15 | | $15 | | $15 |
| 1 | The CDSC on Class C shares applies only to redemptions within 12 months of purchase. |
| 2 | Fee applies to the following types of accounts under $1,000 held directly with the Fund: individual retirement accounts (IRAs), Coverdell Education Savings Accounts and accounts established pursuant to the Uniform Transfers to Minors Act (UTMA) or Uniform Gifts to Minors Act (UGMA). |
7
Annual Fund Operating Expenses
(expenses that you pay each year as a percentage of the value of your investment)
| | | | | | |
| | | Acquired
Fund | | Acquiring
Fund | | Combined
Fund Pro
Forma1 |
Management Fees | | | | | | |
Class A | | 0.75% | | 0.77% | | 0.77% |
Class C | | 0.75% | | 0.77% | | 0.77% |
Class R3 | | 0.75% | | 0.77% | | 0.77% |
Class I | | 0.75% | | 0.77% | | 0.77% |
Distribution and Service (12b-1) Fees | | | | | | |
Class A | | 0.25% | | 0.25% | | 0.25% |
Class C | | 1.00% | | 1.00% | | 1.00% |
Class R3 | | 0.50% | | 0.50% | | 0.50% |
Class I | | 0.00% | | 0.00% | | 0.00% |
Other Expenses | | | | | | |
Class A | | 0.19% | | 0.12% | | 0.13% |
Class C | | 0.19% | | 0.12% | | 0.13% |
Class R3 | | 0.19% | | 0.12% | | 0.13% |
Class I | | 0.19% | | 0.12% | | 0.13% |
Total Annual Fund Operating Expenses2 | | | | | | |
Class A | | 1.19% | | 1.14% | | 1.15% |
Class C | | 1.94% | | 1.89% | | 1.90% |
Class R3 | | 1.44% | | 1.39% | | 1.40% |
Class I | | 0.94% | | 0.89% | | 0.90% |
Fee Waivers and/or Expense Reimbursements | | | | | | |
Class A | | 0.00% | | 0.00% | | (0.01%)3 |
Class C | | 0.00% | | 0.00% | | (0.01%)3 |
Class R3 | | 0.00% | | 0.00% | | (0.01%)3 |
Class I | | 0.00% | | 0.00% | | (0.01%)3 |
Total Annual Fund Operating Expenses–After Fee Waivers and/or Expense Reimbursements | | | | | | |
Class A | | 1.19% | | 1.14% | | 1.14% |
Class C | | 1.94% | | 1.89% | | 1.89% |
Class R3 | | 1.44% | | 1.39% | | 1.39% |
Class I | | 0.94% | | 0.89% | | 0.89% |
| 1 | Pro forma expenses do not include the expenses to be charged to the Funds in connection with the Reorganization. See “The Proposed Reorganization—Reorganization Expenses” for additional information about these expenses. |
| 2 | Expenses have been restated to reflect current contractual fees and estimated other expenses. |
| 3 | If the Reorganization is approved by shareholders and completed, Nuveen Fund Advisors has agreed to waive fees and/or reimburse expenses through October 31, 2013 so that Total Annual Fund Operating Expenses (excluding 12b-1 distribution and/or service fees, interest expenses, taxes, fees incurred in acquiring and disposing of portfolio securities and extraordinary expenses) do not exceed 1.14%, 1.89%, 1.39% and 0.89% for Class A, Class C, Class R3 and Class I, respectively, of average daily net assets. The expense limitation will not be terminated or modified prior to that date without the approval of the Board. |
Example
The example below is intended to help you compare the cost of investing in each Fund and the pro forma cost of investing in the combined fund. The example assumes you invest $10,000 in a Fund for the time periods indicated (based on information in the tables above) and then either redeem or do not
8
redeem your shares at the end of a period. The example assumes that your investment has a 5% return each year and that a Fund’s expenses remain at the level shown in the table above. Expense caps are taken into account for the periods stated in the table above. Although your actual costs may be higher or lower, based on these assumptions your costs would be:
| | | | | | |
| | | Acquired
Fund | | Acquiring
Fund | | Combined
Fund Pro
Forma |
1 Year | | | | | | |
Assuming you sold your shares at the end of each period | | | | | | |
Class A | | $ 689 | | $ 685 | | $ 685 |
Class C | | $ 197 | | $ 192 | | $ 192 |
Class R3 | | $ 147 | | $ 142 | | $ 142 |
Class I | | $ 96 | | $ 91 | | $ 91 |
Assuming you kept your shares | | | | | | |
Class A | | $ 689 | | $ 685 | | $ 685 |
Class C | | $ 197 | | $ 192 | | $ 192 |
Class R3 | | $ 147 | | $ 142 | | $ 142 |
Class I | | $ 96 | | $ 91 | | $ 91 |
| | | |
3 Years | | | | | | |
Assuming you sold your shares at the end of each period | | | | | | |
Class A | | $ 931 | | $ 916 | | $ 918 |
Class C | | $ 609 | | $ 594 | | $ 596 |
Class R3 | | $ 456 | | $ 440 | | $ 442 |
Class I | | $ 300 | | $ 284 | | $ 286 |
Assuming you kept your shares | | | | | | |
Class A | | $ 931 | | $ 916 | | $ 918 |
Class C | | $ 609 | | $ 594 | | $ 596 |
Class R3 | | $ 456 | | $ 440 | | $ 442 |
Class I | | $ 300 | | $ 284 | | $ 286 |
| | | |
5 Years | | | | | | |
Assuming you sold your shares at the end of each period | | | | | | |
Class A | | $1,192 | | $1,167 | | $1,171 |
Class C | | $1,047 | | $1,021 | | $1,025 |
Class R3 | | $ 787 | | $ 761 | | $ 765 |
Class I | | $ 520 | | $ 493 | | $ 497 |
Assuming you kept your shares | | | | | | |
Class A | | $1,192 | | $1,167 | | $1,171 |
Class C | | $1,047 | | $1,021 | | $1,025 |
Class R3 | | $ 787 | | $ 761 | | $ 765 |
Class I | | $ 520 | | $ 493 | | $ 497 |
9
| | | | | | |
| | | Acquired
Fund | | Acquiring
Fund | | Combined
Fund Pro
Forma |
| | | |
10 Years | | | | | | |
Assuming you sold your shares at the end of each period | | | | | | |
Class A | | $1,935 | | $1,881 | | $1,891 |
Class C | | $2,264 | | $2,212 | | $2,221 |
Class R3 | | $1,724 | | $1,669 | | $1,679 |
Class I | | $1,155 | | $1,096 | | $1,107 |
Assuming you kept your shares | | | | | | |
Class A | | $1,935 | | $1,881 | | $1,891 |
Class C | | $2,264 | | $2,212 | | $2,221 |
Class R3 | | $1,724 | | $1,669 | | $1,679 |
Class I | | $1,155 | | $1,096 | | $1,107 |
Portfolio Turnover
Each Fund pays transaction costs, such as commissions, when it buys and sells securities (or “turns over” its portfolio). A higher portfolio turnover rate may indicate higher transaction costs and may result in higher taxes when Fund shares are held in a taxable account. These costs, which are not reflected in annual fund operating expenses or in the example, affect each Fund’s performance. During their most recent fiscal periods for which financial statements are available, the Funds had the following portfolio turnover rates:
| | | | | | | | |
Fund | | Fiscal Year Ended | | Rate | | Semi-Annual Period Ended | | Rate |
Acquired Fund | | 10/31/11 | | 114% | | 4/30/12 | | 47% |
Acquiring Fund | | 10/31/11 | | 33% | | 4/30/12 | | 11% |
After the Reorganization is completed, the portfolio managers of the Acquiring Fund may, in their discretion, sell securities acquired from the Acquired Fund. To the extent that the portfolio managers choose to sell a significant percentage of such securities, the Acquiring Fund’s portfolio turnover rate and brokerage costs may be higher than they otherwise would have been.
Risk Factors
In evaluating the Reorganization, you should consider carefully the risks of the Acquiring Fund to which you will be subject if the Reorganization is approved and completed. Investing in a mutual fund involves risk, including the risk that you may receive little or no return on your investment or even that you may lose part or all of your investment. Because of these and other risks, you should consider an investment in the Acquiring Fund to be a long-term investment. An investment in the Acquiring Fund may not be appropriate for all shareholders. For a complete description of the risks of an investment in the Acquiring Fund, see the section in the Acquiring Fund’s Prospectus entitled “Principal Risks.”
Because the Funds have similar investment strategies, the principal risks of each Fund are similar. The principal risks of investing in the Acquiring Fund are described below. An investment in the Acquired Fund is also subject to certain of these risks; however, it is not subject to credit risk, high yield securities risk or interest rate risk as principal risks. In addition, the principal risks of the
10
Acquired Fund include investment focus risk, because of the Fund’s focus on investments in large-cap stocks and its emphasis on value style investing.
Credit Risk. Credit risk is the risk that an issuer of a debt security may be unable or unwilling to make interest and principal payments when due and the related risk that the value of a debt security may decline because of concerns about the issuer’s ability or willingness to make such payments. In addition, parties to other financial contracts with the Fund could default on their obligations.
Derivatives Risk. The use of derivatives involves additional risks and transaction costs which could leave the Fund in a worse position than if it had not used these instruments. Derivatives may entail investment exposures that are greater than their cost would suggest. As a result, a small investment in derivatives could have a large impact on performance.
Equity Securities Risk. Equity securities may decline significantly in price over short or extended periods of time, and such declines may occur in the equity market as a whole, or they may occur in only a particular country, company, industry, or sector of the market.
High Yield Securities Risk. High yield securities generally are less liquid, have more volatile prices, and have greater credit risk than investment grade securities.
Interest Rate Risk. Interest rate risk is the risk that the value of the Fund’s portfolio will decline because of rising interest rates.
Non-U.S./Emerging Markets Risk. Non-U.S. issuers or U.S. issuers with significant non-U.S. operations may be subject to risks in addition to those of issuers located in or that principally operate in the United States as a result of, among other things, political, social and economic developments abroad and different legal, regulatory and tax environments. These additional risks may be heightened for securities of issuers located in, or with significant operations in, emerging market countries. Also, changes in currency exchange rates may affect the Fund’s net asset value, the value of dividends and interest earned, and gains and losses realized on the sale of securities.
Fundamental Investment Restrictions
The Funds have identical fundamental investment restrictions that cannot be changed without shareholder approval. In addition, each Fund is a diversified fund. As diversified funds, each Fund, with respect to 75% of its assets, may not invest more than 5% of its total assets in the securities of any one issuer (other than securities issued by other investment companies or by the U.S. government, its agencies, instrumentalities or authorities) and may not purchase more than 10% of the outstanding voting securities of any one issuer.
Performance Information
The total returns of the Funds for the periods ended December 31, 2011, based on historical fees and expenses for each period, are set forth in the bar charts and tables below.
The following bar charts and tables provide some indication of the potential risks of investing in each Fund. Each Fund’s past performance (before and after taxes) is not necessarily an indication of how the Fund will perform in the future. Updated performance information is available at www.nuveen.com/MF/products/performancesummary.aspx or by calling (800) 257-8787.
11
The bar charts below show the annual calendar year returns for each Fund’s Class A shares. The performance of the other share classes will differ due to their different expense structures. The bar charts and highest/lowest quarterly and year-to-date returns that follow do not reflect sales charges, and if these charges were reflected, the returns would be less than those shown. The tables below show the average annual returns for the periods ended December 31, 2011 for each Fund. The tables also show how each Fund’s performance compares with the returns of a broad measure of market performance and an index of funds with similar investment objectives. In addition, the Acquiring Fund’s performance is compared to the Standard & Poor’s 500® Index and Standard & Poor’s 500® Dividend Only Stocks as these were the Fund’s previous benchmarks. Going forward, the Acquiring Fund’s performance will be compared to the Russell 1000® Value Index because it more closely reflects the Fund’s investment universe. This information is intended to help you assess the variability of Fund returns (and consequently, the potential risks of a Fund investment).
All after-tax returns are calculated using the historical highest individual federal marginal income tax rates and do not reflect the impact of state and local taxes. After-tax returns are shown for Class A shares only; after-tax returns for Class C, Class R3 and Class I shares will vary. Your own actual after-tax returns will depend on your specific tax situation and may differ from what is shown here. After-tax returns are not relevant to investors who hold fund shares in tax-deferred accounts such as IRAs or employer-sponsored retirement plans.
Both the bar charts and the tables assume that all distributions have been reinvested. Performance reflects fee waivers, if any, in effect during the periods presented. If any such waivers were not in place, performance would be reduced.
Prior to July 1, 2004, Class R3 shares were designated Class S shares, which had lower fees and expenses. The performance information in the table prior to July 1, 2004 is based on the performance of the Class S shares. If current fees and expenses had been in effect, performance would have been lower.
Acquired Fund – Class A Annual Total Return
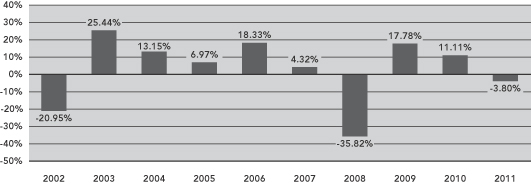
During the periods shown in the bar chart, the Acquired Fund’s Class A highest and lowest calendar quarter returns were 15.62% and -19.74%, respectively, for the quarters ended September 30, 2009 and December 31, 2008. The Acquired Fund’s Class A year-to-date return through June 30, 2012 was 5.81%.
12
Acquiring Fund – Class A Total Return
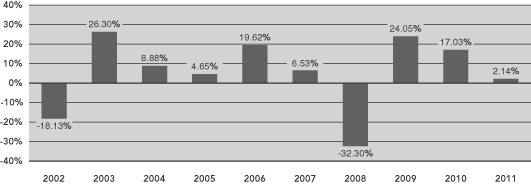
During the periods shown in the bar chart, the Acquiring Fund’s Class A highest and lowest calendar quarter returns were 16.68% and -17.11%, respectively, for the quarters ended June 30, 2003 and December 31, 2008. The Acquiring Fund’s Class A year-to-date return through June 30, 2012 was 7.04%.
| | | | | | |
| | | Average Annual Total Returns for the
Periods Ended December 31, 2011 |
Acquired Fund | | 1 Year | | 5 Years | | 10 Years |
Class A (return before taxes) | | (9.32)% | | (4.50)% | | 1.21% |
Class A (return after taxes on distributions) | | (9.38)% | | (5.16)% | | 0.55% |
Class A (return after taxes on distributions and sale of fund shares) | | (5.99)% | | (3.83)% | | 0.94% |
Class C (return before taxes) | | (4.53)% | | (4.09)% | | 1.04% |
Class R3 (return before taxes) | | (4.06)% | | (3.61)% | | 1.61% |
Class I (return before taxes) | | (3.60)% | | (3.13)% | | 2.07% |
Russell 1000® Value Index (reflects no deduction for fees, expenses or taxes) | | 0.39% | | (2.64)% | | 3.89% |
Lipper Large-Cap Value Classification Average (reflects no deduction for taxes or certain expenses) | | (2.15)% | | (2.67)% | | 2.87% |
| |
| | | Average Annual Total Returns for the
Periods Ended December 31, 2011 |
Acquiring Fund | | 1 Year | | 5 Years | | 10 Years |
Class A (return before taxes) | | (3.76)% | | 0.16% | | 3.57% |
Class A (return after taxes on distributions) | | (4.06)% | | (0.45)% | | 2.94% |
Class A (return after taxes on distributions and sale of fund shares) | | (2.04)% | | 0.07% | | 2.97% |
Class C (return before taxes) | | 1.37% | | 0.60% | | 3.41% |
Class R3 (return before taxes) | | 1.96% | | 1.08% | | 3.98% |
Class I (return before taxes) | | 2.39% | | 1.61% | | 4.45% |
Russell 1000® Value Index (reflects no deduction for fees, expenses or taxes) | | 0.39% | | (2.64)% | | 3.89% |
Standard & Poor’s 500® Index (reflects no deduction for fees, expenses or taxes) | | 2.11% | | (0.25)% | | 2.92% |
Standard & Poor’s 500® Dividend Only Stocks (reflects no deduction for fees, expenses or taxes) | | 1.68% | | (0.56)% | | 2.61% |
Lipper Equity Income Classification Average (reflects no deduction for taxes or certain expenses) | | 3.07% | | 0.44% | | 4.42% |
13
Investment Adviser and Sub-Adviser
Both Funds are managed by Nuveen Fund Advisors, which offers advisory and investment management services to a broad range of mutual fund clients. Nuveen Fund Advisors has overall responsibility for management of the Funds, oversees the management of the Funds’ portfolios, manages the Funds’ business affairs and provides certain clerical, bookkeeping and other administrative services. Nuveen Fund Advisors is located at 333 West Wacker Drive, Chicago, Illinois 60606. Nuveen Fund Advisors is a subsidiary of Nuveen Investments, Inc. (“Nuveen Investments”). On November 13, 2007, Nuveen Investments was acquired by investors led by Madison Dearborn Partners, LLC, which is a private equity investment firm based in Chicago, Illinois. The Nuveen family of advisers has been providing advice to investment companies since 1976.
Nuveen Fund Advisors has selected its affiliate, Nuveen Asset Management, LLC (“Nuveen Asset Management”), located at 333 West Wacker Drive, Chicago, Illinois 60606, to serve as a sub-adviser to each of the Funds. Nuveen Asset Management manages the investment of the Funds’ assets on a discretionary basis, subject to the supervision of Nuveen Fund Advisors.
The Funds are managed by the same portfolio managers. Cori B. Johnson, CFA, has managed the Acquiring Fund since August 1994 and the Acquired Fund since April 2012. Ms. Johnson entered the financial services industry in 1981 and joined FAF Advisors, Inc. (“FAF”) in 1985. She joined Nuveen Asset Management on January 1, 2011 in connection with its acquisition of a portion of FAF’s asset management business.
Gerald C. Bren, CFA, has managed the Acquiring Fund since August 1994 and the Acquired Fund since April 2012. Mr. Bren entered the financial services industry when he joined FAF in 1972. He joined Nuveen Asset Management on January 1, 2011 in connection with its acquisition of a portion of FAF’s asset management business. Mr. Bren has announced that he will retire from Nuveen Asset Management on December 31, 2012. He will continue to act as a portfolio manager for the Funds until that time.
Derek M. Sadowsky has managed the Acquiring Fund since February 2012 and the Acquired Fund since April 2012. He entered the financial services industry in 1998 and joined Nuveen Asset Management on January 1, 2011 in connection with its acquisition of a portion of FAF’s asset management business. Prior to joining FAF in 2010, Mr. Sadowsky was an analyst at State Street Global Advisors in charge of the global basic materials sector. Previously, he was an associate at Putnam Investments where he worked on the global basic materials team, and served as an associate at Citigroup covering the domestic chemical sector.
For a complete description of the advisory services provided to the Acquiring Fund, see the section of the Fund’s Prospectus entitled “Who Manages the Funds” and the sections of the Fund’s Statement of Additional Information entitled “Investment Adviser” and “Sub-Adviser.” Additional information about the portfolio manager compensation structure, other accounts managed by the portfolio managers and the portfolio managers’ ownership of securities in the Funds is provided in the Funds’ Statement of Additional Information.
14
Advisory and Other Fees
Pursuant to investment management agreements between Nuveen Fund Advisors and the Corporation, on behalf of the Funds, each Fund pays Nuveen Fund Advisors fund-level fees, payable monthly, at the annual rates set forth below:
| | | | | | |
Acquired Fund - Management Fee | | Acquiring Fund - Management Fee |
Average Daily Net Assets | | Fee Rate | | Average Daily Net Assets | | Fee Rate |
| | | |
For the first $125 million | | 0.5500% | | For the first $125 million | | 0.6000% |
For the next $125 million | | 0.5375% | | For the next $125 million | | 0.5875% |
For the next $250 million | | 0.5250% | | For the next $250 million | | 0.5750% |
For the next $500 million | | 0.5125% | | For the next $500 million | | 0.5625% |
For the next $1 billion | | 0.5000% | | For the next $1 billion | | 0.5500% |
For net assets over $2 billion | | 0.4750% | | For net assets over $2 billion | | 0.5250% |
In addition to the fund-level fee, each Fund pays a complex-level fee. The maximum complex-level fee is 0.20% of the Fund’s average daily net assets, based upon complex-level “eligible assets” of $55 billion. Therefore, the maximum management fee rate for each Fund is the fund-level fee rate plus 0.20%. As complex-level eligible assets increase, the complex-level fee rate decreases pursuant to a breakpoint schedule. Each Fund’s individual complex-level fee rate is determined by taking the current overall complex-level fee rate, which is based on the aggregate amount of the “eligible assets” of all Nuveen funds, and making an upward adjustment to that rate (subject to the maximum 0.20% rate noted above) based upon the percentage of the Fund’s assets, if any, that are not “eligible assets.” For each Nuveen Fund that was formerly a First American Fund, including both of the Funds, the portion of the Fund’s assets classified as “eligible assets” excludes some or all of the Fund’s assets, based on the Fund’s size relative to its size at the time Nuveen Fund Advisors became the Fund’s investment adviser. The Acquired Fund has experienced net redemptions subsequent to that time, and its complex-level fee rate therefore is slightly higher than the complex-level fee rate for the Acquiring Fund. As of April 30, 2012, the complex-level fee rate applicable to the Acquiring Fund was 0.1922%, and the rate applicable to the Acquired Fund was 0.1998%. Currently, none of the Acquired Fund’s assets are eligible assets, and the Acquired Fund’s assets will retain their status as ineligible assets after the Reorganization for purposes of calculating the combined fund’s complex-level fee. As a result, the combined fund will have a slightly higher complex-level fee rate than the Acquiring Fund. Information regarding the Board’s approval of the investment management agreements for the Funds is currently available in the Funds’ annual reports to shareholders for the fiscal year ended October 31, 2011.
If the Reorganization is approved by shareholders and completed, Nuveen Fund Advisors has agreed to waive fees and/or reimburse expenses for the combined fund so that total annual fund operating expenses, excluding 12b-1 distribution and/or service fees, interest expenses, taxes, fees incurred in acquiring and disposing of portfolio securities and extraordinary expenses, after fee waivers and/or expense reimbursements do not exceed 1.14%, 1.89%, 1.39% and 0.89% of the average daily net assets of Class A, Class C, Class R3 and Class I, respectively. The fee waiver and expense reimbursement will not be terminated prior to October 31, 2013 without approval of the Board.
In addition, Nuveen Fund Advisors has agreed to reimburse management fees across all share classes of both Funds through December 31, 2012 to the extent necessary so that total annual fund operating expenses, excluding 12b-1 distribution and service fees, interest expenses, taxes, fees incurred in acquiring and disposing of portfolio securities, acquired fund fees and expenses and
15
extraordinary expenses, do not exceed 0.95% for the Acquiring Fund and 1.06% for the Acquired Fund, provided that in no event will Nuveen Fund Advisors be required to make any reimbursements that would result in an annualized net management fee of less than 0.78% for the Acquiring Fund and 0.74% for the Acquired Fund. This management fee reimbursement arrangement will not be terminated prior to that time without approval of the Board. However, the total operating expenses of each Fund currently are below these expense limits.
For the Funds’ fiscal year ended October 31, 2011, each Fund paid its investment adviser (Nuveen Fund Advisors beginning on January 1, 2011 and FAF prior to January 1, 2011) the following management fees (net of any fee waivers and expense reimbursements) as a percentage of average net assets:
| | |
| | | Management Fee Rate |
Acquired Fund | | 0.72% |
Acquiring Fund | | 0.75% |
Each Fund has adopted a distribution and service plan (the “Plan”) pursuant to Rule 12b-1 under the 1940 Act. Under the Plans, Class C shares and Class R3 shares are subject to a distribution fee, and Class A shares, Class C and Class R3 shares are subject to a service fee. Class I shares are not subject to either distribution or service fees.
Under the Plan, for each Fund (a) Class A shares are subject to an annual service fee of 0.25% of the average daily net assets of Class A shares, (b) Class C shares are subject to (i) an annual distribution fee of 0.75% of the average daily net assets of Class C shares and (ii) an annual service fee of 0.25% of the average daily net assets of Class C shares, and (c) Class R3 shares are subject to (i) an annual distribution fee of 0.25% of the average daily net assets of Class R3 shares and (ii) an annual service fee of 0.25% of the average daily net assets of Class R3 shares. For a complete description of these arrangements for the Acquiring Fund, see the section of the Fund’s Prospectus entitled “What Share Classes We Offer” and the section of the Fund’s Statement of Additional Information entitled “Distributor.”
Board Members and Officers
Both Funds are series of the Corporation and, as a result, have the same Board and the same officers. The management of each Fund, including general oversight of the duties performed by Nuveen Fund Advisors under the Investment Management Agreement for each Fund, is the responsibility of the Board. There are currently ten members of the Board, one of whom is an “interested person” (as defined in the 1940 Act) and nine of whom are not interested persons (the “independent board members”). The names and business addresses of the board members and officers of the Acquiring Fund and their principal occupations and other affiliations during the past five years are set forth under “Management” in the Statement of Additional Information for the Acquiring Fund and are incorporated herein by reference.
Distribution, Purchase, Redemption, Exchange of Shares and Dividends
The Acquired Fund offers four classes of shares: Class A, Class C, Class R3 and Class I shares. The Acquiring Fund offers five classes of shares: Class A, Class B, Class C, Class R3 and Class I shares. You may purchase, redeem or exchange shares of the Funds on any business day, which is any
16
day the New York Stock Exchange is open for business. You may purchase, redeem or exchange shares of each Fund through a financial advisor or other financial intermediary or directly from such Fund. No initial sales charge or contingent deferred sales charges will be imposed on shares of the Acquiring Fund received or shares of the Acquired Fund exchanged in connection with the Reorganization. Any purchases of any class of shares made after the Reorganization will be subject to the standard fee structure applicable to such class. Class B shares of the Acquiring Fund are available only through exchanges and dividend reinvestments by current Class B shareholders and are not offered through this Proxy Statement/Prospectus. The Acquiring Fund’s initial and subsequent investment minimums generally are set forth in the following table, although the Fund may reduce or waive the minimums in some cases. The Acquired Fund’s investment minimums for Class A, Class C, Class R3 and Class I shares are identical to the Acquiring Fund’s investment minimums for Class A, Class C, Class R3 and Class I shares, respectively.
| | | | | | |
| | | Class A and Class C | | Class R3 | | Class I |
| | | |
| Eligibility and Minimum Initial Investment | | $3,000 for all accounts except: • $2,500 for Traditional/Roth IRA accounts. • $2,000 for Coverdell Education Savings Accounts. • $250 for accounts opened through fee-based programs. • No minimum for retirement plans. | | Available only through certain retirement plans. No minimum. | | Available only through fee-based programs and to other limited categories of investors as described in the prospectus. $100,000 for all accounts except: • $250 for clients of financial intermediaries and family offices that have accounts holding Class I shares with an aggregate value of at least $100,000 (or that are expected to reach this level). • No minimum for certain other categories of eligible investors as described in the prospectus. |
| Minimum Additional Investment | | $100 | | No minimum. | | No minimum. |
For a complete description of purchase, redemption and exchange options, see the section of the Acquiring Fund’s Prospectus entitled “How You Can Buy and Sell Shares,” and “General Information,” and the section of the Acquiring Fund’s Statement of Additional Information entitled “Purchase and Redemption of Fund Shares.”
The Acquiring Fund normally declares and pays dividends from net investment income quarterly. The Acquired Fund’s dividends from net investment income, if any, are normally declared and paid annually. Each Fund declares and pays any taxable capital gains or other taxable distributions once a year at year end. If the Reorganization is approved by the shareholders of the Acquired Fund, the Acquired Fund intends to distribute to its shareholders, prior to the closing of the Reorganization, all its net investment income and net capital gains, if any, for the period ending on the Closing Date. Due to the Acquired Fund’s capital loss carryforwards, a net capital gain distribution is not expected. However, in light of realized capital gains in the Acquiring Fund’s portfolio that may not be distributed prior to the Reorganization, and in light of unrealized capital gains currently in the Acquiring Fund’s portfolio, Acquired Fund shareholders may be subject to higher capital gain distributions in the future than they would have been absent the Reorganization. See “Material Federal Income Tax Consequences” below.
17
Tax Information
The Funds’ distributions are taxable and will generally be taxed as ordinary income or capital gains.
Payments to Broker-Dealers and Other Financial Intermediaries
If you purchase shares of a Fund through a broker-dealer or other financial intermediary (such as a bank or financial advisor), the Fund, its distributor or its investment adviser may pay the intermediary for the sale of Fund shares and related services. These payments may create a conflict of interest by influencing the broker-dealer or other financial intermediary and your salesperson to recommend the Fund over another investment. Ask your financial advisor or visit your financial intermediary’s website for more information.
Further Information
Additional information concerning the Acquiring Fund and Acquired Fund is contained in this Proxy Statement/Prospectus and additional information regarding the Acquiring Fund is contained in the accompanying Acquiring Fund prospectus. The cover page of this Proxy Statement/Prospectus describes how you may obtain further information.
THE PROPOSED REORGANIZATION
The proposed Reorganization will be governed by the Agreement, a form of which is attached as Appendix I. The Agreement provides that the Acquired Fund will transfer all its assets to the Acquiring Fund solely in exchange for the issuance of full and fractional voting shares of the Acquiring Fund and the assumption by the Acquiring Fund of all the liabilities of the Acquired Fund. The closing of the Reorganization will take place at the close of business on the Closing Date. The following discussion of the Agreement is qualified in its entirety by the full text of the Agreement.
The Acquired Fund will transfer all its assets to the Acquiring Fund, and in exchange, the Acquiring Fund will assume all the liabilities of the Acquired Fund and deliver to the Acquired Fund a number of full and fractional shares of the Acquiring Fund having a net asset value equal to the value of the assets of the Acquired Fund less the liabilities of the Acquired Fund assumed by the Acquiring Fund. At the designated time on the Closing Date as set forth in the Agreement, the Acquired Fund will distribute in complete liquidation of the Acquired Fund, pro rata to its shareholders of record, all Acquiring Fund shares received by the Acquired Fund. This distribution will be accomplished by the transfer of the Acquiring Fund shares credited to the account of the Acquired Fund on the books of the Acquiring Fund to open accounts on the share records of the Acquiring Fund in the name of the Acquired Fund shareholders, and representing the respective pro rata number of Acquiring Fund shares due such shareholders. All issued and outstanding shares of the Acquired Fund will simultaneously be canceled on the books of the Acquired Fund. As a result of the proposed Reorganization, each Acquired Fund Class A, Class C, Class R3 and Class I shareholder will receive a number of Acquiring Fund Class A, Class C, Class R3 and Class I shares, respectively, equal in value, as of the close of regular trading on the New York Stock Exchange on the Closing Date, to the value of the Acquired Fund Class A, Class C, Class R3 and Class I shares surrendered by such shareholder.
18
The Board has determined that the proposed Reorganization is in the best interests of each Fund and that the interests of existing shareholders will not be diluted as a result of the transactions contemplated by the Agreement.
The consummation of the Reorganization is subject to the terms and conditions of, and the representations and warranties being true as set forth in, the Agreement. The Agreement may be terminated by mutual agreement of the Funds. In addition, either Fund may at its option terminate the Agreement at or before the Closing Date due to (i) a breach by any other party of any representation, warranty, or agreement to be performed at or before the Closing Date, if not cured within 30 days, (ii) a condition precedent to the obligations of the terminating party that has not been met and it reasonably appears that it will not or cannot be met, or (iii) a determination by the Board that the consummation of the transactions contemplated by the Agreement is not in the best interests of a Fund.
The Acquired Fund will, within a reasonable period of time before the Closing Date, furnish the Acquiring Fund with a list of the Acquired Fund’s portfolio securities and other investments. The Acquiring Fund will, within a reasonable period of time before the Closing Date, furnish the Acquired Fund with a list of the securities, if any, on the Acquired Fund’s list referred to above that do not conform to the Acquiring Fund’s investment objective, policies, and restrictions. The Acquired Fund, if requested by the Acquiring Fund, will dispose of securities on the Acquiring Fund’s list before the Closing Date. In addition, if it is determined that the portfolios of the Funds, when aggregated, would contain investments exceeding certain percentage limitations imposed upon the Acquiring Fund with respect to such investments, the Acquired Fund, if requested by the Acquiring Fund, will dispose of a sufficient amount of such investments as may be necessary to avoid violating such limitations as of the Closing Date. The sale of such investments could result in taxable distributions to shareholders of the Acquired Fund prior to the Reorganization. Notwithstanding the foregoing, nothing in the Agreement will require the Acquired Fund to dispose of any investments or securities if, in the reasonable judgment of the Board or the Adviser, such disposition would adversely affect the tax-free nature of the Reorganization for federal income tax purposes or would otherwise not be in the best interests of the Acquired Fund. However, the Funds do not expect that any material portfolio sales (i.e., more than 5% of the Acquired Fund’s net assets) will occur solely in connection with the Reorganization.
As noted above, if the Reorganization had occurred as of April 30, 2012, the Acquired Fund would not have been required to dispose of its securities in order to comply with the Acquiring Fund’s investment policies and restrictions, and would not have sold any material portion (i.e., more than 5% of its net assets) of the securities in its portfolio solely as a result of the Reorganization. In addition, the Acquired Fund recently experienced a change in its portfolio management team, and, as a result, the Acquired Fund may have material portfolio sales prior to the Reorganization. Due to the Acquired Fund’s capital loss carryforwards, any portfolio sales by the Acquired Fund that occur prior to the Reorganization are not expected to result in any capital gain distributions to Acquired Fund shareholders. However, in light of realized capital gains in the Acquiring Fund’s portfolio that may not be distributed prior to the Reorganization, and in light of unrealized capital gains currently in the Acquiring Fund’s portfolio, Acquired Fund shareholders may be subject to higher capital gain distributions in the future than they would have been absent the Reorganization. See “Material Federal Income Tax Consequences” below.
Description of Securities to be Issued
Shares of Common Stock. The Acquiring Fund has established and designated five classes of shares, par value $0.0001 per share, including Class A, Class C, Class R3 and Class I shares. The
19
Corporation’s articles of incorporation (the “Articles of Incorporation”) permit the Board, in its sole discretion, and subject to compliance with the 1940 Act, to further subdivide the shares of the Acquiring Fund into one or more other classes of shares.
Voting Rights of Shareholders. Holders of shares of the Acquiring Fund are entitled to one vote per share on matters as to which they are entitled to vote, with fractional shares voting proportionally. The Acquiring Fund operates as a series of the Corporation, an open-end management investment company registered with the SEC under the 1940 Act. The Corporation currently has 32 series, including the Acquiring Fund and the Acquired Fund, and the Board may, in its sole discretion, create additional series from time to time. Separate votes generally are taken by each series on matters affecting an individual series. In addition to the specific voting rights described above, shareholders of the Acquiring Fund are entitled, under current law, to vote with respect to certain other matters, including changes in fundamental investment policies and restrictions. Moreover, shareholders owning at least 10% of the outstanding shares of the Corporation may request that the Board call a shareholders’ meeting for the purpose of voting on the removal of one or more Board members.
Continuation of Shareholder Accounts and Plans; Share Certificates
If the Reorganization is approved, the Acquiring Fund will establish an account for each Acquired Fund shareholder containing the appropriate number of shares of the appropriate class of the Acquiring Fund. The shareholder services and shareholder programs of the Funds are substantially the same. Shareholders of the Acquired Fund who are accumulating shares through systematic investing, or who are receiving payments under the systematic withdrawal plan, will retain the same rights and privileges after the Reorganization through plans maintained by the Acquiring Fund. No certificates for Acquiring Fund shares will be issued as part of the Reorganization.
Service Providers
U.S. Bank National Association serves as the custodian for the assets of each Fund. Boston Financial Data Services, Inc. serves as the Funds’ transfer, shareholder services, and dividend paying agent. Ernst & Young LLP served as the independent auditors for each Fund through the fiscal year ended October 31, 2011, resigning on December 30, 2011. A different firm currently serves as the independent registered public accounting firm for the Funds.
Material Federal Income Tax Consequences
As a condition to each Fund’s obligation to consummate the Reorganization, each Fund will receive a tax opinion from Vedder Price P.C. (which opinion will be based on certain factual representations and certain customary assumptions and exclusions) substantially to the effect that, on the basis of the existing provisions of the Code, current administrative rules and court decisions, for federal income tax purposes:
| | 1. | The transfer of all the assets of the Acquired Fund to the Acquiring Fund in exchange solely for Acquiring Fund shares and the assumption by the Acquiring Fund of all the liabilities of the Acquired Fund, followed by the pro rata, by class, distribution to the Acquired Fund shareholders of all the Acquiring Fund shares received by the Acquired Fund in complete liquidation of the Acquired Fund, will constitute a “reorganization” within the meaning of Section 368(a) of the Code, and the Acquiring Fund and the Acquired Fund will each be a “party to a reorganization” within the meaning of Section 368(b) of the Code with respect to the Reorganization. |
20
| | 2. | No gain or loss will be recognized by the Acquiring Fund upon the receipt of all the assets of the Acquired Fund solely in exchange for Acquiring Fund shares and the assumption by the Acquiring Fund of all the liabilities of the Acquired Fund. |
| | 3. | No gain or loss will be recognized by the Acquired Fund upon the transfer of all the Acquired Fund’s assets to the Acquiring Fund solely in exchange for Acquiring Fund shares and the assumption by the Acquiring Fund of all the liabilities of the Acquired Fund or upon the distribution (whether actual or constructive) of all such Acquiring Fund shares to the Acquired Fund shareholders solely in exchange for such shareholders’ shares of the Acquired Fund in complete liquidation of the Acquired Fund. |
| | 4. | No gain or loss will be recognized by Acquired Fund shareholders upon the exchange of their Acquired Fund shares solely for Acquiring Fund shares pursuant to the Reorganization. |
| | 5. | The aggregate basis of the Acquiring Fund shares received by each Acquired Fund shareholder pursuant to the Reorganization will be the same as the aggregate basis of the Acquired Fund shares exchanged therefor by such shareholder. The holding period of the Acquiring Fund shares received by each Acquired Fund shareholder will include the period during which the Acquired Fund shares exchanged therefor were held by such shareholder, provided such Acquired Fund shares are held as capital assets at the effective time of the Reorganization. |
| | 6. | The basis of the Acquired Fund’s assets acquired by the Acquiring Fund will be the same as the basis of such assets to the Acquired Fund immediately before the Reorganization. The holding period of the assets of the Acquired Fund in the hands of the Acquiring Fund will include the period during which those assets were held by the Acquired Fund. |
No opinion will be expressed as to (1) the effect of the Reorganization on (A) the Acquired Fund or the Acquiring Fund with respect to any asset as to which any unrealized gain or loss is required to be recognized for federal income tax purposes at the end of a taxable year (or on the termination thereof) under a mark-to-market system of accounting, (B) any Acquired Fund shareholder that is required to recognize unrealized gains and losses for U.S. federal income tax purposes under a mark-to-market system of accounting, or (C) the Acquired Fund or the Acquiring Fund with respect to any stock held in a passive foreign investment company as defined in Section 1297(a) of the Code or (2) any other federal tax issues (except those set forth above) and all state, local or foreign tax issues of any kind.
Prior to the closing of the Reorganization, the Acquired Fund will declare a distribution to its shareholders, which together with all previous distributions, will have the effect of distributing to shareholders all its net investment income and realized net capital gains (after reduction by any available capital loss carryforwards), if any, through the closing of the Reorganization. This distribution will be taxable to shareholders who are subject to federal income tax and may include net capital gains resulting from the sale of portfolio assets discussed below. Additional distributions may be made if necessary. However, due to the Acquired Fund’s capital loss carryforwards, a net capital gain distribution is not expected. All dividends and distributions will be reinvested in additional shares of the Acquired Fund unless a shareholder has made an election to receive dividends and distributions in cash. Dividends and distributions are treated the same for federal income tax purposes whether received in cash or additional shares.
21
To the extent that a portion of the Acquired Fund’s portfolio assets are sold prior to the Reorganization, the federal income tax effect of such sales would depend on the holding periods of such assets and the difference between the price at which such portfolio assets were sold and the Fund’s basis in such assets. Any net capital gains (net long-term capital gain in excess of any net short-term capital loss) recognized in these sales, after the application of any available capital loss carryforwards (capital losses from prior taxable years that may be used to offset future capital gains), would be distributed to the Acquired Fund’s shareholders as capital gain dividends. Any net short-term capital gains (in excess of any net long-term capital loss and after application of any available capital loss carryforwards) would be distributed as ordinary dividends. All such distributions would be made during or with respect to the Acquired Fund’s taxable year in which the sale occurs and would be taxable to shareholders who are subject to federal income tax. However, due to the Acquired Fund’s capital loss carryforwards, it is not expected that any such portfolio sales would result in capital gain distributions to Acquired Fund shareholders.
After the Reorganization, the Acquiring Fund’s ability to use the Acquired Fund’s or the Acquiring Fund’s pre-Reorganization capital losses, if any, may be limited under certain federal income tax rules applicable to reorganizations of this type. Therefore, in certain circumstances, shareholders may pay federal income tax sooner, or may pay more federal income taxes, than they would have had the Reorganization not occurred. The effect of these potential limitations, will depend on a number of factors, including the amount of the losses, the amount of gains to be offset, the exact timing of the Reorganization and the amount of unrealized capital gains in the Funds at the time of the Reorganization. However, even if the Reorganization did not occur, it is likely that the Acquired Fund would be unable to utilize a significant portion of its carryforwards.
At April 30, 2012, the Funds had unused capital loss carryforwards available for federal income tax purposes to be applied against future capital gains, if any. If not applied, the capital loss carryforwards will expire as follows:
| | | | | | | | |
| | | Acquiring Fund | | | Acquired Fund | |
Expiration Date: | | | | | | | | |
10/31/2016 | | $ | — | | | $ | 3,269,086 | |
10/31/2017 | | | — | | | | 80,887,118 | |
| | | | | | | | |
Total | | $ | — | | | $ | 84,156,204 | |
| | | | | | | | |
In addition, shareholders of the Acquired Fund will receive a proportionate share of any taxable income and gains realized by the Acquiring Fund and not distributed to its shareholders prior to the Reorganization when such income and gains are eventually distributed by the Acquiring Fund. As a result, shareholders of the Acquired Fund may receive a greater amount of taxable distributions than they would have had the Reorganization not occurred.
This description of the federal income tax consequences of the Reorganization is made without regard to the particular facts and circumstances of any shareholder. Shareholders are urged to consult their own tax advisors as to the specific consequences to them of the Reorganization, including the applicability and effect of state, local, non-U.S. and other tax laws.
Reorganization Expenses
The expenses associated with the Reorganization include, but are not limited to, legal and auditing fees, the costs of printing and distributing this Proxy Statement/Prospectus, and the solicitation
22
expenses discussed below. If shareholders approve the Reorganization, the Reorganization is expected to result in cost savings for each Fund. The Acquired Fund’s projected cost savings are expected due to the operational efficiencies and economies of scale that the larger combined fund should experience. The Acquiring Fund’s projected cost savings consist of management fees expected to be reimbursed pursuant to the proposed management fee reimbursement arrangement that will be implemented if shareholders approve the reorganization and it is completed. This arrangement is intended to maintain the Acquiring Fund’s operating expenses at levels experienced during the fiscal year ended October 31, 2011. For the twelve-month period ended April 30, 2012, the Acquiring Fund experienced gross total operating expenses of 1.16%, 1.91%, 1.41% and 0.91% for Class A, Class C, Class R3 and Class I shares, respectively, which are higher than those experienced during the fiscal year ended October 31, 2011 as shown in the “Annual Fund Operating Expenses” table. Accordingly, the proposed management fee reimbursement arrangement is projected to benefit the Acquiring Fund. In light of the anticipated cost savings, the costs of the Reorganization will be allocated between the Funds ratably up to each Fund’s projected cost savings during the first year following the Reorganization. Nuveen Fund Advisors estimates that the costs of the Reorganization will be approximately $154,000 and that the cost savings during the first year following the Reorganization will be approximately $232,000 for the Acquired Fund and $234,000 for the Acquiring Fund. As a result, each of the Acquired Fund and the Acquiring Fund are expected to be charged approximately $77,000. To the extent that such Reorganization expenses otherwise exceed the projected cost savings for the Funds during the first year following the Reorganization, Nuveen will pay such expenses. In addition, to the extent that the payment of these expenses would cause a Fund’s expenses to exceed its expense cap for all share classes in effect through December 31, 2012, Nuveen will reimburse such expenses to the extent necessary to operate within the cap. Based on current expense levels it is anticipated that the Acquired Fund’s expenses will exceed its expense cap and that Nuveen will reimburse approximately $12,000 of Reorganization expenses charged to the Acquired Fund. The Funds are expected to recover their costs of the Reorganization within the first year following the Reorganization assuming that annual cost savings occur at the level shown above. If the Reorganization is not approved or completed, Nuveen will pay all such Reorganization expenses.
The Acquired Fund has engaged Computershare Fund Services to assist in the solicitation of proxies at an estimated cost of $14,400, which is included in the expense estimate above.
Capitalization
The following table sets forth the capitalization of the Acquired Fund and the Acquiring Fund as of April 30, 2012, and the pro forma capitalization of the combined fund as if the Reorganization had occurred on that date. These numbers may differ at the Closing Date.
23
Capitalization Table as of April 30, 2012 (Unaudited)
| | | | | | | | | | | | | | | | |
| | | Acquired Fund | | | Acquiring Fund | | | Pro Forma
Adjustments | | | Pro Forma
Combined Fund | |
Net Assets | | | | | | | | | | | | | | | | |
Class A | | $ | 49,346,442 | | | $ | 210,162,755 | | | $ | (389,402 | )(a) | | $ | 259,119,795 | (a) |
Class B | | | N/A | | | | 2,037,261 | | | | (129 | )(a) | | | 2,037,132 | (a) |
Class C | | | 1,228,687 | | | | 24,466,191 | | | | (10,912 | )(a) | | | 25,683,966 | (a) |
Class R3 | | | 485,666 | | | | 17,311,780 | | | | (4,797 | )(a) | | | 17,792,649 | (a) |
Class I | | | 101,245,208 | | | | 963,630,473 | | | | (832,617 | )(a) | | | 1,064,043,064 | (a) |
| | | | | | | | | | | | | | | | |
Total | | $ | 152,306,003 | | | $ | 1,217,608,460 | | | $ | (1,237,857 | ) | | $ | 1,368,676,606 | |
| | | | | | | | | | | | | | | | |
Shares Outstanding | | | | | | | | | | | | | | | | |
Class A | | | 3,045,019 | | | | 14,471,331 | | | | 327,180 | (b) | | | 17,843,530 | (b) |
Class B | | | N/A | | | | 141,629 | | | | — | | | | 141,629 | |
Class C | | | 77,575 | | | | 1,702,864 | | | | 7,296 | (b) | | | 1,787,735 | (b) |
Class R3 | | | 30,136 | | | | 1,194,228 | | | | 3,114 | (b) | | | 1,227,478 | (b) |
Class I | | | 6,216,659 | | | | 65,844,971 | | | | 649,142 | (b) | | | 72,710,772 | (b) |
| | | | | | | | | | | | | | | | |
Total | | | 9,369,389 | | | | 83,355,023 | | | | 986,732 | | | | 93,711,144 | |
| | | | | | | | | | | | | | | | |
Net Asset Value Per Share | | | | | | | | | | | | | | | | |
Class A | | $ | 16.21 | | | $ | 14.52 | | | | | | | $ | 14.52 | |
Class B | | | N/A | | | $ | 14.38 | | | | | | | $ | 14.38 | |
Class C | | $ | 15.84 | | | $ | 14.37 | | | | | | | $ | 14.37 | |
Class R3 | | $ | 16.12 | | | $ | 14.50 | | | | | | | $ | 14.50 | |
Class I | | $ | 16.29 | | | $ | 14.63 | | | | | | | $ | 14.63 | |
| | | | |
Shares Authorized | | | | | | | | | | | | | | | | |
Class A | | | 2 billion | | | | 2 billion | | | | | | | | 2 billion | |
Class B | | | N/A | | | | 2 billion | | | | | | | | 2 billion | |
Class C | | | 2 billion | | | | 2 billion | | | | | | | | 2 billion | |
Class R3 | | | 2 billion | | | | 2 billion | | | | | | | | 2 billion | |
Class I | | | 2 billion | | | | 2 billion | | | | | | | | 2 billion | |
| (a) | Figures reflect the costs associated with the proposed Reorganization, estimated to be approximately $154,000, of which $77,000 will be charged to each of the Acquired Fund and the Acquiring Fund if the Reorganization is approved. These costs are allocated among each Fund’s share classes based on relative net assets. To the extent that payment of these expenses would cause a Fund to exceed its expense cap for all share classes in effect through December 31, 2012, Nuveen will reimburse the portion of the expenses necessary for the Fund to operate within the cap. Based on current expense levels it is anticipated that the Acquired Fund’s expenses will exceed its expense cap and Nuveen will reimburse approximately $12,000 of Reorganization expenses charged to the Acquired Fund. Furthermore, figures assume the Acquired Fund distributes its undistributed net investment income of $1,095,857 to its shareholders prior to the Reorganization. |
| (b) | Figures reflect the issuance by the Acquiring Fund of approximately 3,372,199 Class A shares, 84,871 Class C shares, 33,250 Class R3 shares and 6,865,801 Class I shares to shareholders of the corresponding share class of the Acquired Fund in connection with the proposed Reorganization. |
Legal Matters
Certain legal matters concerning the issuance of Class A, Class C, Class R3 and Class I shares of the Acquiring Fund will be passed on by Dorsey & Whitney LLP, 50 South Sixth Street, Minneapolis, Minnesota 55402, and the federal income tax consequences of the Reorganization will be passed on by Vedder Price P.C., 222 North LaSalle Street, Chicago, Illinois 60601.
24
Information Filed with the Securities and Exchange Commission
This Proxy Statement/Prospectus and the related Statement of Additional Information do not contain all the information set forth in the registration statements and the exhibits relating thereto and the annual and semi-annual reports which the Funds have filed with the SEC pursuant to the requirements of the Securities Act of 1933, as amended, and the 1940 Act, to which reference is hereby made. The SEC file number for the registration statement containing the current Prospectus and Statement of Additional Information for the Acquiring Fund and Acquired Fund is Registration No. 811-05309. Such Prospectus and Statement of Additional Information relating to the Funds are incorporated herein by reference.
THE BOARD’S APPROVAL OF THE REORGANIZATION
Based on the considerations described below, the Board of each Fund has determined that the Reorganization would be in the best interests of each Fund and that the interests of each Fund’s existing shareholders would not be diluted as a result of the Reorganization. The Board has approved the Reorganization and recommends that the Acquired Fund shareholders vote in favor of the Reorganization.
In preparation for the meeting of the Board held on May 21-23, 2012 (the “Meeting”) at which the Reorganization was considered, the Adviser provided the Board with information regarding the proposed Reorganization, including the rationale therefor and alternatives considered to the Reorganization of the Funds. Prior to approving the Reorganization, the independent board members reviewed the foregoing information with their independent legal counsel and with management, reviewed with independent legal counsel applicable law and their duties in considering such matters, and met with independent legal counsel in a private session without management present. In approving the Reorganization, the Board considered a number of principal factors in reaching its determination, including the following:
| | • | | the similarities and differences in the Funds’ investment objectives and principal investment strategies; |
| | • | | the Funds’ relative risks; |
| | • | | the Funds’ relative sizes; |
| | • | | the relative investment performance of the Funds and portfolio managers; |
| | • | | the relative fees and expense ratios of the Funds, including caps on the Funds’ expenses agreed to by the Adviser; |
| | • | | the anticipated tax-free nature of the Reorganization; |
| | • | | the expected costs of the Reorganization and the extent to which the Funds would bear any such costs; |
| | • | | the terms of the Reorganization and whether the Reorganization would dilute the interests of shareholders of the Funds; |
25
| | • | | the effect of the Reorganization on shareholder services and shareholder rights; |
| | • | | alternatives to the Reorganization; and |
| | • | | any potential benefits of the Reorganization to the Adviser and its affiliates as a result of the Reorganization. |
Investment Similarities and Differences
Based on the information presented, the Board noted that the investment objectives of the Funds were similar, although not the same. In this regard, the investment objective of the Acquiring Fund is long-term growth of capital and income. The investment objective of the Acquired Fund is capital appreciation, with current income as the Acquired Fund’s secondary objective. The Board further noted that the principal investment strategies of the Acquired Fund and Acquiring Fund appear similar, although there are certain differences. Under normal market conditions, the Acquiring Fund invests at least 80% of its net assets, plus the amount of any borrowings for investment purposes, in equity securities of companies that, in the opinion of the Fund’s sub-adviser, have the ability to pay above average dividends and finance expected growth, have strong management, and are trading at attractive valuations. Under normal market conditions, the Acquired Fund invests at least 80% of its net assets, plus the amount of any borrowings for investment purposes, in common stocks of large-capitalization companies. In terms of differences, the Board recognized that, in contrast to the Acquired Fund, the Acquiring Fund has no restrictions on the capitalization levels of the companies in which it invests, but that the equity securities in which the Acquiring Fund invests pursuant to its principal investment strategy must provide current income at the time of purchase. In addition, the Board observed that the Acquiring Fund’s principal investment strategy with respect to investing in equity securities may include convertible debt securities, whereas the Acquired Fund’s principal investment strategies do not include investing in convertible debt securities.
Relative Risks
The Board noted that because the Funds’ investment strategies are similar, the principal risks of investing in the Funds are also similar, subject to certain differences, including the following. Because, as indicated above, the Acquiring Fund may invest in convertible debt securities as a principal investment strategy, it is subject to credit risk, high yield securities risk and interest rate risk as principal risks. The Acquired Fund, in turn, is subject to investment focus risk given its focus on investments in large-cap stocks and its emphasis on value style investing. Both Funds are subject to certain additional risks, including derivatives risk, equity securities risk and the risks of investing in non-U.S. issuers and emerging markets.
Relative Sizes
The Board noted that the Acquiring Fund was larger than the Acquired Fund and that combining the Funds should provide additional benefits to shareholders of the Acquired Fund as fixed operating expenses of the Acquiring Fund following the Reorganization will be spread over a larger asset base. The Reorganization may therefore lower the total expense ratio borne by shareholders of the Acquired Fund as noted in more detail below.
26
Investment Performance and Portfolio Managers
The Board considered the investment performance of the Funds over various periods and noted that, as of recently, they are managed by the same portfolio managers, who would also continue to manage the combined fund. The Board observed, among other things, that with respect to Class A shares, the Acquiring Fund has outperformed the Acquired Fund over the one-, three-, five- and ten-year periods ending March 31, 2012 and for each of the past four calendar years.
Fees and Expense Ratios
The Board considered the fees and expense ratios of each class of the Funds (including estimated expenses of the Acquiring Fund following the Reorganization) and the impact of expense caps, if any. The Board noted that although the management fees of the Acquiring Fund are currently slightly higher than those of the Acquired Fund, the total annual fund operating expenses of each applicable class of the Acquiring Fund are lower than those of the Acquired Fund. In addition, the Board considered the estimated expenses of each class of shares of the Acquiring Fund following the Reorganization. In this regard, the Board noted that the Reorganization was expected to result in a decrease in total operating expenses for all share classes of the Acquired Fund. The Board also recognized that while total operating expenses for the Acquiring Fund were expected to increase slightly, the Adviser had agreed to an expense cap through October 31, 2013 in order to maintain such expenses at levels experienced during the fiscal year ended October 31, 2011.
The Board also recognized that the management fees for the Funds are comprised of fund-level and complex-level fees. Pursuant to the complex-wide fee arrangement, the fees of funds in the Nuveen complex are reduced as assets in the fund complex reach certain levels. The complex-wide fee arrangement seeks to provide the benefits of economies of scale to fund shareholders when total fund complex assets increase, even if assets of a particular fund are unchanged or decrease. The Board observed that complex-level fees were lower for the Acquiring Fund than for the Acquired Fund. When the Funds became part of the Nuveen complex, a portion of each Fund’s assets were deemed ineligible for purposes of calculating the effective complex-wide fee rate. Because the Acquired Fund has experienced net redemptions since it became part of the Nuveen complex, all of such Fund’s assets are currently ineligible assets. Accordingly, the combined fund will participate in complex-wide fee savings to a slightly lesser degree than the Acquiring Fund.
Tax Consequences of the Reorganization
The Board considered the tax implications of the Reorganization. The Board noted that the Reorganization will be structured with the intention that it qualify as a tax-free reorganization for federal income tax purposes. The Board further recognized that with fund reorganizations, applicable tax laws could impose limits on the amount of capital loss carryforwards that an acquiring fund may use in any one year. In this regard, because the Acquired Fund had significant capital loss carryforwards, the Board recognized that these limits may preclude the Acquiring Fund from fully utilizing the Acquired Fund’s capital loss carryforwards (although it was likely that the Acquired Fund would be unable to utilize a significant portion of its carryforwards even if the Reorganization did not occur). The Board further noted that there may be some gains or losses resulting from portfolio realignment related to the Reorganization. The Board also recognized that in light of realized and unrealized portfolio appreciation in the portfolio of the combined fund, Acquired Fund shareholders may be subject to higher capital gains distributions in the future than they would have been absent the Reorganization.
27
Costs of the Reorganization
The Board considered the projected cost savings of each Fund following the Reorganization. The costs of the Reorganization will be allocated between the Funds ratably up to each Fund’s projected cost savings during the first year following the Reorganization. If the Reorganization is not ultimately completed, Nuveen will bear the expenses incurred in connection with the proposed Reorganization.
Dilution
The terms of the Reorganization are intended to avoid dilution of the interests of the shareholders of the Funds. In this regard, shareholders of each class of shares of the Acquired Fund will receive the same class of shares in the Acquiring Fund, equal in value to the shares of the Acquired Fund held.
Effect on Shareholder Services and Shareholder Rights
The Board noted that shareholders of the Acquired Fund will receive the same class of shares of the Acquiring Fund, which are subject to the same distribution and service fees. The Board also considered that the Acquired Fund and the Acquiring Fund are both series of a Maryland corporation. As a result, the attributes of a share of each entity are the same.
Alternatives to the Reorganization
The Board could have decided to continue the Funds in their present form or to liquidate the Acquired Fund, but did not believe either alternative would be in the best interests of shareholders. The Board recognized that the Acquired Fund, which had been in net redemptions in recent years, was expected to continue to see further redemptions and that the development of future distribution opportunities for it as a separate fund were unlikely. The Board also could have decided to liquidate the Acquired Fund; however, the Board did not believe this option was in the best interests of shareholders of the Acquired Fund as liquidation is a taxable event which could result in the realization of taxable capital gains to shareholders depending on the shareholder’s cost basis, and the loss of any potential benefit that the Acquired Fund’s capital loss carryovers might have provided. Further, shareholders of the Acquired Fund would be prevented from experiencing the benefits provided by an increase in assets.
Potential Benefits to Nuveen Fund Advisors and Affiliates
The Board recognized that the Reorganization may result in some benefits and economies for the Adviser and its affiliates. These may include, for example, a reduction in the level of operational expenses incurred for administrative, compliance and portfolio management services as a result of the elimination of the Acquired Fund as a separate fund in the Nuveen complex.
Conclusion
The Board, including the independent board members, approved the Reorganization, concluding that the Reorganization is in the best interests of both Funds and that the interests of existing shareholders of the Funds will not be diluted as a result of the Reorganization. The Board did not identify any single factor discussed above as all-important or controlling, but considered all such factors together in approving the Reorganization.
28
OTHER INFORMATION
Shareholders of the Funds
The following tables set forth the percentage of ownership of each person who, as of , 2012, the record date with respect to the Special Meeting, owns of record, or is known by the Funds to own of record or beneficially, 5% or more of any class of shares of either Fund. The tables also set forth the estimated percentage of shares of the combined fund that would have been owned by such parties if the Reorganization had occurred on , 2012. These amounts may differ on the Closing Date. Shareholders who have the power to vote a larger percentage of shares (at least 25% of the voting shares) of a Fund can control the Fund and determine the outcome of a shareholder meeting.
| | | | | | |
Acquired Fund |
Class | | Name and Address of Owner | | Percentage of
Ownership | | Estimated Pro
Forma Percentage of
Ownership of the
Combined Fund
After the
Reorganization |
Class Shares | | | | . % | | . % |
| | | | | | |
| | | | | | |
Acquiring Fund |
Class | | Name and Address of Owner | | Percentage of
Ownership | | Estimated Pro
Forma Percentage of
Ownership of the
Combined Fund
After the
Reorganization |
Class Shares | | | | . % | | . % |
| | | | | | |
[At the close of business on , 2012, there were Class A shares, Class C, Class R3 shares and Class I shares of the Acquired Fund outstanding. As of , 2012, the board members and officers of the Acquired Fund as a group owned less than 1% of the total outstanding shares of the Acquired Fund and as a group owned less than 1% of each class of shares of the Acquired Fund.
At the close of business on , 2012, there were Class A shares, Class B shares, Class C shares, Class R3 and Class I shares of the Acquiring Fund outstanding. As of , 2012, the board members and officers of the Acquiring Fund as a group owned less than 1% of the total outstanding shares of the Acquiring Fund and as a group owned less than 1% of each class of shares of the Acquiring Fund.]
Shareholder Proposals
The Funds generally do not hold annual shareholders’ meetings, but will hold special meetings as required or deemed desirable. Because the Funds do not hold regular meetings of shareholders, the
29
anticipated date of the next shareholder meeting cannot be provided. To be considered for inclusion in the proxy statement for any meeting of shareholders, a shareholder proposal must be submitted a reasonable time before the proxy statement for the meeting is mailed. Whether a proposal is included in the proxy statement will be determined in accordance with applicable federal and state laws. The timely submission of a proposal does not guarantee its inclusion. Shareholders wishing to submit proposals for inclusion in a proxy statement for a shareholder meeting should send their written proposal to the respective Fund at 333 West Wacker Drive, Chicago, Illinois 60606.
Shareholder Communications
Shareholders who want to communicate with the Board or any individual board member should write to their Fund, to the attention of Lorna Ferguson, Manager of Fund Board Relations, Nuveen Investments, 333 West Wacker Drive, Chicago, Illinois 60606. The letter should indicate that you are a Fund shareholder, and identify the Fund (or Funds). If the communication is intended for a specific board member and so indicates, it will be sent only to that board member. If a communication does not indicate a specific board member, it will be sent to the chair of the nominating and governance committee and to the Board’s independent legal counsel for further distribution as deemed appropriate by such persons.
Proxy Statement/Prospectus Delivery
Please note that only one Proxy Statement/Prospectus may be delivered to two or more shareholders of the Acquired Fund who share an address, unless the Fund has received instructions to the contrary. To request a separate copy of the Proxy Statement/Prospectus, or for instructions as to how to request a separate copy of such document or as to how to request a single copy if multiple copies of such document are received, shareholders should contact the Acquired Fund at 333 West Wacker Drive, Chicago, Illinois 60606 or by calling (800) 257-8787.
VOTING INFORMATION AND REQUIREMENTS
Holders of shares of the Acquired Fund are entitled to one vote per share on matters as to which they are entitled to vote, with fractional shares voting proportionally.
Approval of the Reorganization will require the affirmative vote of the holders of a majority of the total number of shares outstanding and entitled to vote of the Acquired Fund. A vote in favor of the Reorganization will also be considered a vote in favor of an amendment to the Corporation’s Articles of Incorporation effecting the Reorganization.
Each valid proxy given by a shareholder of the Acquired Fund will be voted by the persons named in the proxy in accordance with the instructions marked thereon and as the persons named in the proxy may determine on such other business as may come before the Special Meeting on which shareholders are entitled to vote. If no designation is made, the proxy will be voted by the persons named in the proxy, as recommended by the Board, “FOR” approval of the Reorganization. Abstentions and broker non-votes (i.e., shares held by brokers or nominees, typically in “street name,” as to which (i) instructions have not been received from beneficial owners or persons entitled to vote and (ii) the broker or nominee does not have discretionary voting power on a particular matter) count as present for purposes of determining quorum but do not count as votes “FOR” the proposal and have the same
30
effect as a vote “AGAINST” the proposal. The presence in person or by proxy of the holders of ten percent (10%) of the shares of the Acquired Fund issued and outstanding and entitled to vote at the Special Meeting shall constitute a quorum for the transaction of any business.
Shareholders who execute proxies may revoke them at any time before they are voted by filing with the Acquired Fund a written notice of revocation, by delivering a duly executed proxy bearing a later date, or by attending the Special Meeting and voting in person. The giving of a proxy will not affect your right to vote in person if you attend the Special Meeting and wish to do so.
It is not anticipated that any action will be asked of the shareholders of the Acquired Fund other than as indicated above, but if other matters are properly brought before the Special Meeting, it is intended that the persons named in the proxy will vote in accordance with their judgment.
If a quorum is not obtained or if a quorum is present but sufficient votes in favor of a proposal are not received by the scheduled time of the Special Meeting, the holders of a majority of shares present in person or by proxy and entitled to vote shall have the power to adjourn the Special Meeting to permit further solicitation of proxies. The Special Meeting may be adjourned without notice other than announcement at the Special Meeting for not more than 120 days after the Record Date for the Special Meeting. At such adjourned meeting at which the requisite shares entitled to vote thereat shall be represented, any business may be transacted which could have been transacted at the meeting as originally notified. Prior to being convened, the Special Meeting may be postponed for not more than 120 days after the Record Date for the Special Meeting.
Proxies of shareholders of the Acquired Fund are solicited by the Board. Additional solicitation may be made by mail, telephone, telegraph or personal interview by representatives of the Adviser or Nuveen, or by dealers or their representatives.
, 2012
Please sign and return your proxy promptly.
Your vote is important and your participation
in the affairs of your Fund does make a difference.
31
APPENDIX I
AGREEMENT AND PLAN OF REORGANIZATION
THIS AGREEMENT AND PLAN OF REORGANIZATION (the “Agreement”) is made as of this day of , 2012 by Nuveen Investment Funds, Inc., a Maryland corporation (the “Corporation”), on behalf of and between Nuveen Dividend Value Fund, a series of the Corporation (the “Acquiring Fund”), and Nuveen Large Cap Value Fund, a series of the Corporation (the “Acquired Fund” and, together with the Acquiring Fund, the “Funds”), and Nuveen Fund Advisors, Inc., the investment adviser to the Funds (the “Adviser”) (for purposes of Section 9.1 of the Agreement only).
This Agreement is intended to be, and is adopted as, a plan of reorganization within the meaning of Section 368(a) of the Internal Revenue Code of 1986, as amended (the “Code”), and the Treasury Regulations promulgated thereunder. The reorganization will consist of: (i) the transfer of all the assets of the Acquired Fund to the Acquiring Fund in exchange solely for Class A, Class C, Class R3 and Class I voting shares of common stock, par value $0.0001 per share, of the Acquiring Fund (“Acquiring Fund Shares”) and the assumption by the Acquiring Fund of all the liabilities of the Acquired Fund; and (ii) the pro rata distribution of all the Acquiring Fund Shares to the shareholders of each corresponding class of the Acquired Fund, in complete liquidation and termination of the Acquired Fund as provided herein, all upon the terms and conditions set forth in this Agreement (the “Reorganization”). The foregoing will be effected pursuant to this Agreement and to an amendment to the Corporation’s Amended and Restated Articles of Incorporation (“Articles of Incorporation”) in substantially the form attached hereto as Exhibit A (the “Amendment”) to be adopted in accordance with the Maryland General Corporation Law.
WHEREAS, each Fund is a separate series of the Corporation, and the Corporation is an open-end, management investment company registered under the Investment Company Act of 1940, as amended (the “1940 Act”);
WHEREAS, the Acquired Fund owns securities that generally are assets of the character in which the Acquiring Fund is permitted to invest;
WHEREAS, the Acquiring Fund is authorized to issue the Acquiring Fund Shares; and
WHEREAS, the Board of Directors of the Corporation (the “Board”) has made the determinations required by Rule 17a-8 under the 1940 Act with respect to the Acquired Fund and Acquiring Fund.
NOW, THEREFORE, in consideration of the premises and of the covenants and agreements hereinafter set forth, the parties hereto covenant and agree as follows:
ARTICLE I
TRANSFER OF ASSETS OF THE ACQUIRED FUND IN EXCHANGE FOR ACQUIRING FUND SHARES AND THE ASSUMPTION OF THE ACQUIRED FUND LIABILITIES AND TERMINATION AND LIQUIDATION OF THE ACQUIRED FUND
1.1 THE EXCHANGE. Subject to the terms and conditions contained herein and on the basis of the representations and warranties contained herein, the Acquired Fund agrees to transfer all of its assets, as set forth in Section 1.2, to the Acquiring Fund. In consideration therefor, the Acquiring Fund agrees: (i) to deliver to the Acquired Fund the number of full and fractional Class A, Class C, Class R3
I-1
and Class I Acquiring Fund Shares, computed in the manner set forth in Section 2.3 herein; and (ii) to assume all the liabilities of the Acquired Fund, as set forth in Section 1.3. All Acquiring Fund Shares delivered to the Acquired Fund shall be delivered at net asset value without a sales load, commission or other similar fee being imposed. In the event that Class A shares of the Acquiring Fund are transferred in the Reorganization to former holders of Class A shares of the Acquired Fund with respect to which the front-end sales charge was waived due to a purchase of $1 million or more, the Acquiring Fund agrees that, in determining whether a deferred sales charge is payable upon the sale of such Class A shares of the Acquiring Fund, it shall give credit for the period during which the holder thereof held such Acquired Fund shares. Such transactions shall take place at the closing provided for in Section 3.1 (the “Closing”).
1.2 ASSETS TO BE TRANSFERRED. The Acquired Fund shall transfer all of its assets to the Acquiring Fund, including, without limitation, all cash, securities, commodities, interests in futures, dividends or interest receivables owned by the Acquired Fund and any deferred or prepaid expenses shown as an asset on the books of the Acquired Fund on the Closing Date, as such term is defined in Section 3.1.
The Acquired Fund will, within a reasonable period of time before the Closing Date, furnish the Acquiring Fund with a list of the Acquired Fund’s portfolio securities and other investments. The Acquiring Fund will, within a reasonable period of time before the Closing Date, furnish the Acquired Fund with a list of the securities, if any, on the Acquired Fund’s list referred to above that do not conform to the Acquiring Fund’s investment objective, policies, and restrictions. The Acquired Fund, if requested by the Acquiring Fund, will dispose of securities on the Acquiring Fund’s list before the Closing Date. In addition, if it is determined that the portfolios of the Acquired Fund and the Acquiring Fund, when aggregated, would contain investments exceeding certain percentage limitations imposed upon the Acquiring Fund with respect to such investments, the Acquired Fund, if requested by the Acquiring Fund, will dispose of a sufficient amount of such investments as may be necessary to avoid violating such limitations as of the Closing Date. Notwithstanding the foregoing, nothing herein will require the Acquired Fund to dispose of any investments or securities if, in the reasonable judgment of the Board or the Adviser, such disposition would adversely affect the status of the Reorganization as a “reorganization” as such term is used in the Code or would otherwise not be in the best interests of the Acquired Fund.
1.3 LIABILITIES TO BE ASSUMED. The Acquired Fund will endeavor to discharge all of its known liabilities and obligations to the extent possible before the Closing Date. Notwithstanding the foregoing, any liabilities not so discharged shall be assumed by the Acquiring Fund, which assumed liabilities shall include all of the Acquired Fund’s liabilities, debts, obligations, and duties of whatever kind or nature, whether absolute, accrued, contingent, or otherwise, whether or not arising in the ordinary course of business, whether or not determinable at the Closing Date, and whether or not specifically referred to in this Agreement.
1.4 LIQUIDATING DISTRIBUTION. As of the Effective Time, as such term is defined in Section 3.1, the Acquired Fund will make a liquidating distribution of each class of the Acquiring Fund Shares received pursuant to Section 1.1 to its shareholders of record of each corresponding class of shares, determined as of the close of business on the Closing Date, as such term is defined in Section 3.1 (collectively, the “Acquired Fund Shareholders”), on a pro rata basis within that class. Such distribution will be accomplished with respect to each class of shares of the Acquired Fund by the transfer of the Acquiring Fund Shares of the corresponding class then credited to the account of the
I-2
Acquired Fund on the books of the Acquiring Fund to open accounts on the share records of the Acquiring Fund in the names of Acquired Fund Shareholders of such class. The Acquiring Fund shall not issue certificates representing Acquiring Fund Shares in connection with such transfer. As of the Effective Time, as such term is defined in Section 3.1, all issued and outstanding shares of the Acquired Fund shall be cancelled on the books of the Acquired Fund and retired.
1.5 OWNERSHIP OF SHARES. Ownership of Acquiring Fund Shares will be shown on the books of the Acquiring Fund’s transfer agent. Acquiring Fund Shares will be issued simultaneously to the Acquired Fund, in an amount computed in the manner set forth in Section 2.3.
1.6 TRANSFER TAXES. Any transfer taxes payable upon the issuance of Acquiring Fund Shares in a name other than the registered holder of the Acquired Fund shares on the books of the Acquired Fund as of that time shall, as a condition of such issuance and transfer, be paid by the person to whom such Acquiring Fund Shares are to be issued and transferred.
1.7 LIQUIDATION AND TERMINATION. The Acquired Fund shall completely liquidate and be dissolved, terminated and have its affairs wound up in accordance with Maryland state law, promptly following the Closing Date and the making of all distributions pursuant to Section 1.4, but in no event later than 12 months following the Closing Date.
1.8 BOARD REPORTING. Any reporting responsibility of the Acquired Fund including, without limitation, the responsibility for filing of regulatory reports, tax returns or other documents with the Securities and Exchange Commission (the “Commission”), any state securities commission and any federal, state or local tax authorities or any other relevant regulatory authority, is and shall remain the responsibility of the Acquired Fund.
1.9 BOOKS AND RECORDS. All books and records of the Acquired Fund, including all books and records required to be maintained under the 1940 Act, and the rules and regulations thereunder, shall be available to the Acquiring Fund from and after the Closing Date and shall be turned over to the Acquiring Fund as soon as practicable following the Closing Date.
ARTICLE II
VALUATION
2.1 VALUATION OF ASSETS. The value of the Acquired Fund’s assets and liabilities shall be computed as of the close of regular trading on the New York Stock Exchange (“NYSE”) on the Closing Date (such time and date being hereinafter called the “Valuation Time”), using the valuation procedures set forth in the Acquiring Fund’s Prospectus and Statement of Additional Information (in effect as of the Closing Date) or such other valuation procedures as shall be mutually agreed upon by the parties.
2.2 VALUATION OF SHARES. The net asset value per share per class of Acquiring Fund Shares shall be the net asset value per share for such class computed as of the Valuation Time, using the valuation procedures set forth in Section 2.1.
2.3 SHARES TO BE ISSUED. The number of Acquiring Fund Shares to be issued (including fractional shares, if any) in consideration for the net assets as described in Article I, shall be determined with respect to each class by dividing the value of the assets net of liabilities with respect
I-3
to each class of shares of the Acquired Fund determined in accordance with Section 2.1 by the net asset value of an Acquiring Fund share of the corresponding class determined in accordance with Section 2.2.
2.4 EFFECT OF SUSPENSION IN TRADING. In the event that on the Closing Date, either: (a) the NYSE or another primary exchange on which the portfolio securities of the Acquiring Fund or the Acquired Fund are purchased or sold shall be closed to trading or trading on such exchange shall be restricted; or (b) trading or the reporting of trading on the NYSE or elsewhere shall be disrupted so that accurate appraisal of the value of the net assets of the Acquiring Fund or the Acquired Fund is impracticable, the Closing Date shall be postponed until the first business day when trading is fully resumed and reporting is restored.
ARTICLE III
CLOSING AND CLOSING DATE
3.1 CLOSING DATE. The Closing shall occur on , 2012 or such other date as the parties may agree (the “Closing Date”). Unless otherwise provided, all acts taking place at the Closing shall be deemed to take place as of immediately after the Valuation Time on the Closing Date (the “Effective Time”). The Closing shall be held as of the close of business at the offices of Vedder Price P.C. in Chicago, Illinois or at such other time and/or place as the parties may agree.
3.2 CUSTODIAN’S CERTIFICATE. The Acquired Fund shall cause its custodian to deliver to the Acquiring Fund at the Closing a certificate of an authorized officer stating that: (a) the Acquired Fund’s portfolio securities, cash, and any other assets shall have been delivered in proper form to the Acquiring Fund on the Closing Date; and (b) all necessary taxes, including all applicable federal and state stock transfer stamps, if any, shall have been paid, or provision for payment shall have been made, in conjunction with the delivery of portfolio securities by the Acquired Fund.
3.3 TRANSFER AGENT’S CERTIFICATE. The Acquired Fund shall cause its transfer agent to deliver to the Acquiring Fund at the Closing a certificate of an authorized officer stating that its records contain the names and addresses of all the Class A, Class C, Class R3 and Class I Acquired Fund Shareholders, and the number and percentage ownership of outstanding shares per class owned by each such shareholder immediately prior to the Closing. The Acquiring Fund shall issue and deliver or cause its transfer agent to issue and deliver to the Acquired Fund a confirmation evidencing the Class A, Class C, Class R3 and Class I Acquiring Fund Shares to be credited on the Closing Date to the Secretary of the Corporation or provide evidence satisfactory to the Acquired Fund that such Acquiring Fund Shares have been credited to the Acquired Fund’s account on the books of the Acquiring Fund.
3.4 DELIVERY OF ADDITIONAL ITEMS. At the Closing, each party shall deliver to the other such bills of sale, checks, assignments, share certificates, receipts and other documents, if any, as such other party or its counsel may reasonably request to effect the transactions contemplated by this Agreement.
I-4
ARTICLE IV
REPRESENTATIONS AND WARRANTIES
4.1 REPRESENTATIONS OF THE ACQUIRED FUND. The Corporation, on behalf of the Acquired Fund, represents and warrants as follows:
(a) The Corporation is a corporation duly organized, validly existing and in good standing under the laws of the State of Maryland.
(b) The Acquired Fund is a separate series of the Corporation duly authorized in accordance with the applicable provisions of the Corporation’s Articles of Incorporation.
(c) The Corporation is registered as an open-end management investment company under the 1940 Act, and such registration is in full force and effect.
(d) The Acquired Fund is not, and the execution, delivery, and performance of this Agreement (subject to shareholder approval) will not result, in the violation of any provision of the Corporation’s Articles of Incorporation or By-Laws or of any material agreement, indenture, instrument, contract, lease, or other undertaking to which the Acquired Fund is a party or by which it is bound.
(e) Except as otherwise disclosed in writing to and accepted by the Acquiring Fund, the Acquired Fund has no material contracts or other commitments that will be terminated with liability to it before the Closing Date.
(f) No litigation, administrative proceeding, or investigation of or before any court or governmental body is presently pending or to its knowledge threatened against the Acquired Fund or any of its properties or assets, which, if adversely determined, would materially and adversely affect its financial condition, the conduct of its business, or the ability of the Acquired Fund to carry out the transactions contemplated by this Agreement. The Acquired Fund knows of no facts that might form the basis for the institution of such proceedings and is not a party to or subject to the provisions of any order, decree, or judgment of any court or governmental body that materially and adversely affects its business or its ability to consummate the transactions contemplated herein.
(g) The financial statements of the Acquired Fund as of October 31, 2011, and for the fiscal year then ended have been prepared in accordance with generally accepted accounting principles and have been audited by independent auditors, and such statements (copies of which have been furnished to the Acquiring Fund) fairly reflect the financial condition of the Acquired Fund as of October 31, 2011, and there are no known contingent liabilities of the Acquired Fund as of such date that are not disclosed in such statements.
(h) The financial statements of the Acquired Fund as of April 30, 2012 and for the period then ended have been prepared in accordance with generally accepted accounting principles, and such statements (copies of which have been furnished to the Acquiring Fund) fairly reflect the financial condition of the Acquired Fund as of April 30, 2012, and there are no known contingent liabilities of the Acquired Fund as of such date that are not disclosed in such statements.
(i) Since the date of the financial statements referred to in subsection (h) above, there have been no material adverse changes in the Acquired Fund’s financial condition, assets,
I-5
liabilities or business (other than changes occurring in the ordinary course of business) and there are no known contingent liabilities of the Acquired Fund arising after such date. For the purposes of this subsection (i), a decline in the net asset value of the Acquired Fund shall not constitute a material adverse change.
(j) All federal, state, local and other tax returns and reports of the Acquired Fund required by law to be filed by it (taking into account permitted extensions for filing) have been timely filed and are complete and correct in all material respects. All federal, state, local and other taxes of the Acquired Fund required to be paid (whether or not shown on any such return or report) have been paid, or provision shall have been made for the payment thereof and any such unpaid taxes are properly reflected on the financial statements referred to in subsection (h) above. To the best of the Acquired Fund’s knowledge, no tax authority is currently auditing or preparing to audit the Acquired Fund, and no assessment for taxes, interest, additions to tax or penalties has been asserted against the Acquired Fund.
(k) All issued and outstanding shares of the Acquired Fund are, and as of the Closing Date will be, duly and validly issued and outstanding, fully paid and non-assessable by the Acquired Fund. All the issued and outstanding shares of the Acquired Fund will, at the time of the Closing, be held by the persons and in the amounts set forth in the records of the Acquired Fund’s transfer agent as provided in Section 3.3. The Acquired Fund has no outstanding options, warrants or other rights to subscribe for or purchase any shares of the Acquired Fund, and has no outstanding securities convertible into shares of the Acquired Fund.
(l) At the Closing, the Acquired Fund will have good and marketable title to the Acquired Fund’s assets to be transferred to the Acquiring Fund pursuant to Section 1.2, and full right, power, and authority to sell, assign, transfer, and deliver such assets, and the Acquiring Fund will acquire good and marketable title thereto, subject to no restrictions on the full transfer thereof, including such restrictions as might arise under the Securities Act of 1933, as amended (the “1933 Act”), except those restrictions as to which the Acquiring Fund has received notice and necessary documentation at or prior to the Closing.
(m) The execution, delivery and performance of this Agreement have been duly authorized by all necessary action on the part of the Acquired Fund including the determinations of the Board required by Rule 17a-8(a) of the 1940 Act. Subject to approval by the Acquired Fund shareholders, this Agreement constitutes a valid and binding obligation of the Acquired Fund, enforceable in accordance with its terms, subject as to enforcement, to bankruptcy, insolvency, reorganization, moratorium, and other laws relating to or affecting creditors’ rights and to general equity principles.
(n) The information to be furnished by the Acquired Fund for use in no-action letters, applications for orders, registration statements, proxy materials and other documents that may be necessary in connection with the transactions contemplated herein shall be accurate and complete in all material respects and shall comply in all material respects with federal securities and other laws and regulations.
(o) From the effective date of the Registration Statement (as defined in Section 5.7), through the time of the meeting of the Acquired Fund shareholders and on the Closing Date, any written information furnished by the Corporation with respect to the Acquired Fund for use in the Proxy Materials (as defined in Section 5.7), or any other materials provided in connection with the
I-6
Reorganization, does not and will not contain any untrue statement of a material fact or omit to state a material fact required to be stated or necessary to make the statements, in light of the circumstances under which such statements were made, not misleading.
(p) For each taxable year of its operations (including the taxable year ending on the Closing Date), the Acquired Fund has been treated as a separate corporation for federal income tax purposes pursuant to Section 851(g) of the Code, has met the requirements of Subchapter M of the Code for qualification as a regulated investment company and has elected to be treated as such, has been eligible to compute and has computed its federal income tax under Section 852 of the Code, and will have distributed on or prior to the Closing Date all its investment company taxable income (determined without regard to the deduction for dividends paid), the excess of its interest income excludable from gross income under Section 103(a) of the Code over its deductions disallowed under Sections 265 and 171(a)(2) of the Code, and its net capital gain (as such terms are defined in the Code) that has accrued or will accrue on or prior to the Closing Date.
4.2 REPRESENTATIONS OF THE ACQUIRING FUND. The Corporation, on behalf of the Acquiring Fund, represents and warrants as follows:
(a) The Corporation is a corporation duly organized, validly existing and in good standing under the laws of the State of Maryland.
(b) The Acquiring Fund is a separate series of the Corporation duly authorized in accordance with the applicable provisions of the Corporation’s Articles of Incorporation.
(c) The Corporation is registered as an open-end management investment company under the 1940 Act, and such registration is in full force and effect.
(d) The Acquiring Fund is not, and the execution, delivery and performance of this Agreement will not result, in a violation of the Corporation’s Articles of Incorporation or By-Laws or of any material agreement, indenture, instrument, contract, lease, or other undertaking to which the Acquiring Fund is a party or by which it is bound.
(e) No litigation, administrative proceeding or investigation of or before any court or governmental body is presently pending or to its knowledge threatened against the Acquiring Fund or any of its properties or assets, which, if adversely determined, would materially and adversely affect its financial condition, the conduct of its business or the ability of the Acquiring Fund to carry out the transactions contemplated by this Agreement. The Acquiring Fund knows of no facts that might form the basis for the institution of such proceedings and it is not a party to or subject to the provisions of any order, decree, or judgment of any court or governmental body that materially and adversely affects its business or its ability to consummate the transaction contemplated herein.
(f) The financial statements of the Acquiring Fund as of October 31, 2011 and for the fiscal year then ended have been prepared in accordance with generally accepted accounting principles and have been audited by independent auditors, and such statements (copies of which have been furnished to the Acquired Fund) fairly reflect the financial condition of the Acquiring Fund as of October 31, 2011, and there are no known contingent liabilities of the Acquiring Fund as of such date that are not disclosed in such statements.
(g) The financial statements of the Acquiring Fund as of April 30, 2012 and for the period then ended have been prepared in accordance with generally accepted accounting principles,
I-7
and such statements (copies of which have been furnished to the Acquired Fund) fairly reflect the financial condition of the Acquiring Fund as of April 30, 2012, and there are no known contingent liabilities of the Acquiring Fund as of such date that are not disclosed in such statements.
(h) Since the date of the financial statements referred to in subsection (g) above, there have been no material adverse changes in the Acquiring Fund’s financial condition, assets, liabilities or business (other than changes occurring in the ordinary course of business) and there are no known contingent liabilities of the Acquiring Fund arising after such date. For the purposes of this subsection (h), a decline in the net asset value of the Acquiring Fund shall not constitute a material adverse change.
(i) All federal, state, local and other tax returns and reports of the Acquiring Fund required by law to be filed by it (taking into account permitted extensions for filing) have been timely filed and are complete and correct in all material respects. All federal, state, local and other taxes of the Acquiring Fund required to be paid (whether or not shown on any such return or report) have been paid or provision shall have been made for their payment and any such unpaid taxes are properly reflected on the financial statements referred to in subsection (g) above. To the best of the Acquiring Fund’s knowledge, no tax authority is currently auditing or preparing to audit the Acquiring Fund, and no assessment for taxes, interest, additions to tax or penalties has been asserted against the Acquiring Fund.
(j) All issued and outstanding shares of the Acquiring Fund are, and, as of the Closing Date will be, duly and validly issued and outstanding, fully paid and non-assessable by the Acquiring Fund. The Acquiring Fund has no outstanding options, warrants, or other rights to subscribe for or purchase shares of the Acquiring Fund, and there are no outstanding securities convertible into shares of the Acquiring Fund.
(k) The execution, delivery and performance of this Agreement have been duly authorized by all necessary action on the part of the Acquiring Fund, including the determination of the Board required pursuant to Rule 17a-8(a) of the 1940 Act. This Agreement constitutes a valid and binding obligation of the Acquiring Fund, enforceable in accordance with its terms, subject as to enforcement, to bankruptcy, insolvency, reorganization, moratorium, and other laws relating to or affecting creditors’ rights and to general equity principles.
(l) The Acquiring Fund Shares to be issued and delivered to the Acquired Fund for the account of the Acquired Fund Shareholders pursuant to the terms of this Agreement will, at the Closing Date, have been duly authorized. When so issued and delivered, such shares will be duly and validly issued shares of the Acquiring Fund, and will be fully paid and non-assessable.
(m) The information to be furnished by the Acquiring Fund for use in no-action letters, applications for orders, registration statements, proxy materials, and other documents that may be necessary in connection with the transactions contemplated herein shall be accurate and complete in all material respects and shall comply in all material respects with federal securities and other laws and regulations.
(n) From the effective date of the Registration Statement (as defined in Section 5.7), through the time of the meeting of the Acquired Fund shareholders and on the Closing Date, any written information furnished by the Corporation with respect to the Acquiring Fund for use in the Proxy Materials (as defined in Section 5.7), or any other materials provided in connection with the
I-8
Reorganization, does not and will not contain any untrue statement of a material fact or omit to state a material fact required to be stated or necessary to make the statements, in light of the circumstances under which such statements were made, not misleading.
(o) For each taxable year of its operation, the Acquiring Fund has been treated as a separate corporation for federal income tax purposes pursuant to Section 851(g) of the Code, has met the requirements of Subchapter M of the Code for qualification as a regulated investment company and has elected to be treated as such, has been eligible to compute and has computed its federal income tax under Section 852 of the Code. In addition, the Acquiring Fund will satisfy each of the foregoing with respect to its taxable year that includes the Closing Date.
(p) The Acquiring Fund agrees to use all reasonable efforts to obtain the approvals and authorizations required by the 1933 Act, the 1940 Act, and any state securities laws as it may deem appropriate in order to continue its operations after the Closing Date.
ARTICLE V
COVENANTS OF THE FUNDS
5.1 OPERATION IN ORDINARY COURSE. Subject to Sections 1.2 and 8.5, each of the Acquiring Fund and the Acquired Fund will operate its respective business in the ordinary course between the date of this Agreement and the Closing Date, it being understood that such ordinary course of business will include customary dividends and distributions, any other distribution necessary or desirable to avoid federal income or excise taxes, and shareholder purchases and redemptions.
5.2 APPROVAL OF SHAREHOLDERS. The Corporation will call a special meeting of the Acquired Fund shareholders to consider and act upon this Agreement (or transactions contemplated thereby) and to take all other appropriate action necessary to obtain approval of the transactions contemplated herein.
5.3 INVESTMENT REPRESENTATION. The Acquired Fund covenants that the Acquiring Fund Shares to be issued pursuant to this Agreement are not being acquired for the purpose of making any distribution, other than in connection with the Reorganization and in accordance with the terms of this Agreement.
5.4 ADDITIONAL INFORMATION. The Acquired Fund will assist the Acquiring Fund in obtaining such information as the Acquiring Fund reasonably requests concerning the beneficial ownership of the Acquired Fund’s shares.
5.5 FURTHER ACTION. Subject to the provisions of this Agreement, each Fund will take or cause to be taken, all action, and do or cause to be done, all things reasonably necessary, proper or advisable to consummate and make effective the transactions contemplated by this Agreement, including any actions required to be taken after the Closing Date.
5.6 STATEMENT OF EARNINGS AND PROFITS. As promptly as practicable, but in any case within 60 days after the Closing Date, the Acquired Fund shall furnish the Acquiring Fund, in such form as is reasonably satisfactory to the Acquiring Fund and which shall be certified by the Corporation’s Controller or Treasurer, a statement of the earnings and profits of the Acquired Fund for
I-9
federal income tax purposes, as well as any net operating loss carryovers and capital loss carryovers, that will be carried over to the Acquiring Fund pursuant to Section 381 of the Code.
5.7 PREPARATION OF REGISTRATION STATEMENT AND PROXY MATERIALS. The Corporation will prepare and file with the Commission a registration statement on Form N-14 relating to the Acquiring Fund Shares to be issued to the Acquired Fund Shareholders (the “Registration Statement”). The Registration Statement shall include a proxy statement of the Acquired Fund and a prospectus of the Acquiring Fund relating to the transaction contemplated by this Agreement. The Registration Statement shall be in compliance with the 1933 Act, the Securities Exchange Act of 1934, as amended (the “1934 Act”), and the 1940 Act, as applicable. Each party will provide the other party with the materials and information necessary to prepare the proxy statement and related materials (the “Proxy Materials”), for inclusion therein, in connection with the meeting of the Acquired Fund’s shareholders to consider the approval of this Agreement and the transactions contemplated herein.
5.8 TAX STATUS OF REORGANIZATION. The intention of the parties is that the Reorganization will qualify as a reorganization within the meaning of Section 368(a) of the Code. None of the Acquired Fund, the Acquiring Fund or the Corporation shall take any action, or cause any action to be taken (including, without limitation, the filing of any tax return), that is inconsistent with such treatment or results in the failure of the transaction to qualify as a reorganization within the meaning of Section 368(a) of the Code. At or prior to the Closing Date, the Acquired Fund, the Acquiring Fund and the Corporation will take such action, or cause such action to be taken, as is reasonably necessary to enable counsel to render the tax opinion contemplated herein in Section 8.9.
ARTICLE VI
CONDITION PRECEDENT TO OBLIGATIONS OF THE ACQUIRED FUND
The obligations of the Acquired Fund to consummate the transactions provided for herein shall be subject to the following condition:
6.1 All representations, covenants, and warranties of the Acquiring Fund contained in this Agreement shall be true and correct in all material respects as of the date hereof and as of the Closing Date, with the same force and effect as if made on and as of the Closing Date. The Acquiring Fund shall have delivered to the Acquired Fund a certificate executed in the Acquiring Fund’s name by the Corporation’s President or Vice President and its Controller or Treasurer, in form and substance satisfactory to the Acquired Fund and dated as of the Closing Date, to such effect and as to such other matters as the Acquired Fund shall reasonably request.
ARTICLE VII
CONDITIONS PRECEDENT TO OBLIGATIONS OF THE ACQUIRING FUND
The obligations of the Acquiring Fund to consummate the transactions provided for herein shall be subject to the following conditions:
7.1 All representations, covenants, and warranties of the Acquired Fund contained in this Agreement shall be true and correct in all material respects as of the date hereof and as of the Closing
I-10
Date, with the same force and effect as if made on and as of the Closing Date. The Acquired Fund shall have delivered to the Acquiring Fund on the Closing Date a certificate executed in the Acquired Fund’s name by the Corporation’s President or Vice President and the Controller or Treasurer, in form and substance satisfactory to the Acquiring Fund and dated as of the Closing Date, to such effect and as to such other matters as the Acquiring Fund shall reasonably request.
7.2 The Acquired Fund shall have delivered to the Acquiring Fund a statement of the Acquired Fund’s assets and liabilities, together with a list of the Acquired Fund’s portfolio securities showing the tax basis of such securities by lot and the holding periods of such securities, as of the Closing Date, certified by the Controller or Treasurer of the Corporation.
ARTICLE VIII
FURTHER CONDITIONS PRECEDENT
The obligations of the Acquired Fund and the Acquiring Fund hereunder shall also be subject to the following:
8.1 This Agreement and the transactions contemplated herein, with respect to the Acquired Fund, shall have been approved by the requisite vote of the holders of the outstanding shares of the Acquired Fund in accordance with applicable law and the provisions of the Corporation’s Articles of Incorporation and By-Laws. Notwithstanding anything herein to the contrary, neither the Acquiring Fund nor the Acquired Fund may waive the conditions set forth in this Section 8.1.
8.2 On the Closing Date, the Commission shall not have issued an unfavorable report under Section 25(b) of the 1940 Act, or instituted any proceeding seeking to enjoin the consummation of the transactions contemplated by this Agreement under Section 25(c) of the 1940 Act. Furthermore, no action, suit or other proceeding shall be threatened or pending before any court or governmental agency in which it is sought to restrain or prohibit, or obtain damages or other relief in connection with this Agreement or the transactions contemplated herein.
8.3 All required consents of other parties and all other consents, orders, and permits of federal, state and local regulatory authorities (including those of the Commission and of state securities authorities, including any necessary “no-action” positions and exemptive orders from such federal and state authorities) to permit consummation of the transactions contemplated herein shall have been obtained.
8.4 The Registration Statement shall have become effective under the 1933 Act, and no stop orders suspending the effectiveness thereof shall have been issued. To the best knowledge of the parties to this Agreement, no investigation or proceeding for that purpose shall have been instituted or be pending, threatened or contemplated under the 1933 Act.
8.5 The Acquired Fund shall have declared and paid a dividend or dividends which, together with all previous such dividends, shall have the effect of distributing to its shareholders all of the Acquired Fund’s investment company taxable income for all taxable periods ending on or before the Closing Date (computed without regard to any deduction for dividends paid), if any, plus the excess of its interest income excludible from gross income under Section 103(a) of the Code, if any, over its deductions disallowed under Sections 265 and 171(a)(2) of the Code for all taxable periods ending on
I-11
or before the Closing Date and all of its net capital gains realized in all taxable periods ending on or before the Closing Date (after reduction for any available capital loss carry forward).
8.6 The Acquired Fund shall have delivered to the Acquiring Fund on the Closing Date a certificate executed in its name by the Corporation’s President or Senior Vice President, in a form reasonably satisfactory to the Acquiring Fund and dated as of the Closing Date, to the effect that the representations and warranties of the Corporation, on behalf of the Acquired Fund, made in this Agreement are true and correct on and as of the Closing Date and as to such other matters as the Acquiring Fund shall reasonably request. The Acquiring Fund shall have delivered to the Acquired Fund on the Closing Date a certificate executed in its name by the Corporation’s President or Senior Vice President, in a form reasonably satisfactory to the Acquired Fund and dated as of the Closing Date, to the effect that the representations and warranties of the Corporation, on behalf of the Acquiring Fund, made in this Agreement are true and correct on and as of the Closing Date and as to such other matters as the Acquired Fund shall reasonably request.
8.7 The Acquiring Fund shall have received on the Closing Date an opinion from counsel, dated as of the Closing Date, substantially to the effect that:
(a) The Corporation is a corporation validly existing and in good standing under the laws of the State of Maryland.
(b) The Agreement has been duly authorized, executed and delivered by the Corporation, on behalf of the Acquired Fund, and constitutes a valid and legally binding obligation of the Corporation, on behalf of the Acquired Fund, enforceable in accordance with its terms.
(c) The execution and delivery of the Agreement by the Corporation, on behalf of the Acquired Fund, did not, and the exchange of the Acquired Fund’s assets for Acquiring Fund Shares pursuant to the Agreement will not, violate the Corporation’s Articles of Incorporation or By-Laws.
(d) To the knowledge of such counsel, and without any independent investigation, (i) the Corporation is registered as an investment company with the Commission and is not subject to any stop order; and (ii) all regulatory consents, authorizations, approvals or filings required to be obtained or made by the Acquired Fund under the federal laws of the United States of America or the laws of the State of Maryland for the transfer of the Acquired Fund’s assets and liabilities for Acquiring Fund Shares pursuant to the Agreement have been obtained or made.
8.8 The Acquired Fund shall have received on the Closing Date an opinion from counsel, dated as of the Closing Date, substantially to the effect that:
(a) The Corporation is a corporation validly existing and in good standing under the laws of the State of Maryland.
(b) The Agreement has been duly authorized, executed and delivered by the Corporation, on behalf of the Acquiring Fund, and constitutes a valid and legally binding obligation of the Corporation, on behalf of the Acquiring Fund, enforceable in accordance with its terms.
(c) The execution and delivery of the Agreement by the Corporation, on behalf of the Acquiring Fund, did not, and the issuance of Acquiring Fund Shares pursuant to the Agreement will not, violate the Corporation’s Articles of Incorporation or By-Laws.
I-12
(d) To the knowledge of such counsel, and without any independent investigation, (i) the Corporation is registered as an investment company with the Commission and is not subject to any stop order; and (ii) all regulatory consents, authorizations, approvals or filings required to be obtained or made by the Acquiring Fund under the federal laws of the United States of America or the laws of the State of Maryland for the issuance of Acquiring Fund Shares pursuant to the Agreement have been obtained or made.
8.9 The Funds shall have received an opinion of Vedder Price P.C. addressed to the Acquiring Fund and the Acquired Fund substantially to the effect that for federal income tax purposes:
(a) The transfer of all the Acquired Fund’s assets to the Acquiring Fund in exchange solely for Acquiring Fund Shares and the assumption by the Acquiring Fund of all the liabilities of the Acquired Fund followed by the pro rata, by class, distribution to the Acquired Fund Shareholders of all the Acquiring Fund Shares received by the Acquired Fund in complete liquidation of the Acquired Fund will constitute a “reorganization” within the meaning of Section 368(a) of the Code and the Acquiring Fund and the Acquired Fund will each be a “party to a reorganization,” within the meaning of Section 368(b) of the Code, with respect to the Reorganization.
(b) No gain or loss will be recognized by the Acquiring Fund upon the receipt of all the assets of the Acquired Fund solely in exchange for Acquiring Fund Shares and the assumption by the Acquiring Fund of all the liabilities of the Acquired Fund.
(c) No gain or loss will be recognized by the Acquired Fund upon the transfer of all the Acquired Fund’s assets to the Acquiring Fund solely in exchange for Acquiring Fund Shares and the assumption by the Acquiring Fund of all the liabilities of the Acquired Fund or upon the distribution (whether actual or constructive) of such Acquiring Fund Shares to the Acquired Fund Shareholders solely in exchange for such shareholders’ shares of the Acquired Fund in complete liquidation of the Acquired Fund.
(d) No gain or loss will be recognized by the Acquired Fund Shareholders upon the exchange of their Acquired Fund shares solely for Acquiring Fund Shares in the Reorganization.
(e) The aggregate basis of the Acquiring Fund Shares received by each Acquired Fund Shareholder pursuant to the Reorganization will be the same as the aggregate basis of the Acquired Fund shares exchanged therefor by such shareholder. The holding period of the Acquiring Fund Shares received by each Acquired Fund Shareholder will include the period during which the Acquired Fund shares exchanged therefor were held by such shareholder, provided such Acquired Fund shares are held as capital assets at the time of the Reorganization.
(f) The basis of the Acquired Fund’s assets transferred to the Acquiring Fund will be the same as the basis of such assets to the Acquired Fund immediately before the Reorganization. The holding period of the assets of the Acquired Fund in the hands of the Acquiring Fund will include the period during which those assets were held by the Acquired Fund.
No opinion will be expressed as to (1) the effect of the Reorganization on (A) the Acquired Fund or the Acquiring Fund with respect to any asset as to which any unrealized gain or loss is required to be recognized for federal income tax purposes at the end of a taxable year (or on the termination thereof) under a mark-to-market system of accounting, (B) any Acquired Fund shareholder that is required to recognize unrealized gains and losses for federal income tax purposes under a
I-13
mark-to-market system of accounting, or (C) the Acquired Fund or the Acquiring Fund with respect to any stock held in a passive foreign investment company as defined in Section 1297(a) of the Code or (2) any other federal tax issues (except those set forth above) and all state, local or foreign tax issues of any kind.
Such opinion shall be based on customary assumptions and such representations as Vedder Price P.C. may reasonably request of the Funds, and the Acquired Fund and the Acquiring Fund will cooperate to make and certify the accuracy of such representations. Notwithstanding anything herein to the contrary, neither the Acquiring Fund nor the Acquired Fund may waive the conditions set forth in this Section 8.9.
ARTICLE IX
EXPENSES
9.1 Each of the Acquired Fund and the Acquiring Fund will pay expenses incurred in connection with the Reorganization based on its portion of the projected cost savings during the first year following the Reorganization. Reorganization expenses include, without limitation: (a) expenses associated with the preparation and filing of the Registration Statement and other Proxy Materials; (b) postage; (c) printing; (d) accounting fees; (e) legal fees incurred by each Fund; (f) solicitation costs of the transaction; and (g) other related administrative or operational costs. To the extent that the payment of Reorganization expenses would cause the Acquired Fund or the Acquiring Fund to exceed its expense cap then in effect, the Adviser or an affiliate will reimburse the portion of expenses necessary for the Fund to operate within its cap. The Adviser or an affiliate will pay the expenses incurred in connection with the Reorganization to the extent such expenses exceed the projected cost savings. If the Reorganization is not consummated, the Adviser or an affiliate will bear the expenses incurred in connection with the Reorganization.
9.2 Each party represents and warrants to the other that there is no person or entity entitled to receive any broker’s fees or similar fees or commission payments in connection with the transactions provided for herein.
9.3 Notwithstanding the foregoing, expenses will in any event be paid by the party directly incurring such expenses if and to the extent that the payment by the other party of such expenses would result in the disqualification of the Acquired Fund or the Acquiring Fund, as the case may be, as a regulated investment company within the meaning of Section 851 of the Code.
ARTICLE X
ENTIRE AGREEMENT; SURVIVAL OF WARRANTIES
10.1 The parties agree that no party has made to the other parties any representation, warranty and/or covenant not set forth herein, and that this Agreement constitutes the entire agreement between and among the parties.
10.2 The representations, warranties, and covenants contained in this Agreement or in any document delivered pursuant to or in connection with this Agreement shall not survive the consummation of the transactions contemplated hereunder.
I-14
ARTICLE XI
TERMINATION
11.1 This Agreement may be terminated by the mutual agreement of the parties and such termination may be effected by the Corporation’s President or Vice President without further action by the Board. In addition, either Fund may, at its option, terminate this Agreement at or before the Closing Date due to:
(a) a breach by any other party of any representation, warranty, or agreement contained herein to be performed at or before the Closing Date, if not cured within 30 days;
(b) a condition precedent to the obligations of the terminating party that has not been met and it reasonably appears that it will not or cannot be met; or
(c) a determination by the Board that the consummation of the transactions contemplated herein is not in the best interests of the Acquired Fund or Acquiring Fund.
11.2 In the event of any such termination, in the absence of willful default, there shall be no liability for damages on the part of the Corporation, the Directors of the Corporation, the Acquired Fund, the Acquiring Fund, the Adviser, or the Corporation’s or Adviser’s officers.
ARTICLE XII
AMENDMENTS
12.1 This Agreement may be amended, modified, or supplemented in such manner as may be mutually agreed upon in writing by the officers of the Corporation as specifically authorized by the Board; provided, however, that following the meeting of the Acquired Fund shareholders called by the Acquired Fund pursuant to Section 5.2 of this Agreement, no such amendment may have the effect of changing the provisions for determining the number of Acquiring Fund Shares to be issued to the Acquired Fund Shareholders under this Agreement to the detriment of such shareholders without their further approval.
ARTICLE XIII
HEADINGS; COUNTERPARTS; GOVERNING LAW; ASSIGNMENT;
LIMITATION OF LIABILITY
13.1 The article and section headings contained in this Agreement are for reference purposes only and shall not affect in any way the meaning or interpretation of this Agreement.
13.2 This Agreement may be executed in any number of counterparts, each of which shall be deemed an original.
13.3 This Agreement shall be governed by and construed in accordance with the laws of the State of Maryland.
13.4 This Agreement shall bind and inure to the benefit of the parties hereto and their respective successors and assigns, but, except as provided in this section, no assignment or transfer hereof or of any rights or obligations hereunder shall be made by any party without the written consent of the other parties. Nothing herein expressed or implied is intended or shall be construed to confer upon or give any person, firm, or corporation, other than the parties hereto and their respective successors and assigns, any rights or remedies under or by reason of this Agreement.
[SIGNATURE PAGE FOLLOWS]
I-15
IN WITNESS WHEREOF, the parties have duly executed this Agreement, all as of the date first written above.
|
NUVEEN INVESTMENT FUNDS, INC., on behalf of Nuveen Dividend Value Fund |
|
By: |
Name: Kathleen Prudhomme |
Title: Vice President and Assistant Secretary |
|
ACKNOWLEDGED: |
|
By: |
Name: |
Title: |
|
NUVEEN INVESTMENT FUNDS, INC., on behalf of Nuveen Large Cap Value Fund |
|
By: |
Name: Kathleen Prudhomme |
Title: Vice President and Assistant Secretary |
|
ACKNOWLEDGED: |
|
By: |
Name: |
Title: |
|
The undersigned is a party to this Agreement for the purposes of Section 9.1 only: |
|
NUVEEN FUND ADVISORS, INC. |
|
By: |
Name: Kevin J. McCarthy |
Title: Managing Director |
|
ACKNOWLEDGED: |
|
By: |
Name: |
Title: |
I-16
EXHIBIT A TO AGREEMENT AND PLAN OF REORGANIZATION
ARTICLES OF AMENDMENT
TO
AMENDED AND RESTATED ARTICLES OF INCORPORATION
OF
NUVEEN INVESTMENT FUNDS, INC.
The undersigned officer of Nuveen Investment Funds, Inc. (the “Corporation”), a Maryland corporation, hereby certifies that the following amendments to the Corporation’s Amended and Restated Articles of Incorporation have been advised by the Corporation’s Board of Directors and approved by the Corporation’s stockholders in the manner required by the Maryland General Corporation Law, such amendment to become effective , 2012 at the Effective Time referred to below:
WHEREAS, the Corporation is registered as an open-end management investment company (i.e., a mutual fund) under the Investment Company Act of 1940 and offers its shares to the public in several classes (i.e., series), each of which represents a separate and distinct portfolio of assets;
WHEREAS, it is desirable and in the best interests of the holders of the Class D shares of the Corporation (also known as “Nuveen Large Cap Value Fund”) that the assets belonging to such class be transferred to Nuveen Dividend Value Fund, a series of the Corporation, in exchange for Class A, Class C, Class R3 and Class I shares of Nuveen Dividend Value Fund, which are to be delivered to former Nuveen Large Cap Value Fund holders;
WHEREAS, Nuveen Large Cap Value Fund and Nuveen Dividend Value Fund have entered into an Agreement and Plan of Reorganization providing for the foregoing transactions; and
WHEREAS, in order to bind all holders of shares of Nuveen Large Cap Value Fund to the foregoing transactions and as set forth in the Agreement and Plan of Reorganization, and in particular to bind such holders to the exchange of their shares of Nuveen Large Cap Value Fund for Class A, Class C, Class R3 and Class I shares of Nuveen Dividend Value Fund, it is necessary to adopt an amendment to the Corporation’s Amended and Restated Articles of Incorporation.
NOW, THEREFORE, BE IT RESOLVED, that effective as of the Effective Time referred to below, the Corporation’s Amended and Restated Articles of Incorporation be, and the same hereby are, amended to add the following Article IV(EE) immediately following Article IV(DD) thereof:
Article IV(EE). (a) For purposes of this Article IV(EE), the following terms shall have the following meanings:
“Corporation” means this corporation.
“Acquired Fund” means the Corporation’s Nuveen Large Cap Value Fund, which is represented by the Corporation’s Class D shares.
“Class A Acquired Fund Shares” means the Corporation’s Class D Common Shares.
I-17
“Class C Acquired Fund Shares” means the Corporation’s Class D, Series 4 Common Shares.
“Class R3 Acquired Fund Shares” means the Corporation’s Class D, Series 5 Common Shares.
“Class I Acquired Fund Shares” means the Corporation’s Class D, Series 2 Common Shares.
“Acquiring Fund” means Nuveen Dividend Value Fund, which is represented by the Corporation’s Class T Common Shares.
“Class A Acquiring Fund Shares” means the Corporation’s Class T Common Shares.
“Class C Acquiring Fund Shares” means the Corporation’s Class T, Series 4 Common Shares.
“Class R3 Acquiring Fund Shares” means the Corporation’s Class T, Series 5 Common Shares.
“Class I Acquiring Fund Shares” means the Corporation’s Class T, Series 3 Common Shares.
“Closing” means the occurrence of the transactions set forth in (b) and (c) below on the Closing Date.
“Closing Date” means , 2012.
“Effective Time” means immediately after the Valuation Time on the Closing Date.
“Plan” means the Agreement and Plan of Reorganization dated , 2012 on behalf of the Acquiring Fund and the Acquired Fund.
“Valuation Time” means the close of regular trading on the New York Stock Exchange on the Closing Date.
(b) As of the Effective Time, the Acquired Fund will transfer all of its assets to the Acquiring Fund, including, without limitation, all cash, securities, commodities, interests in futures, dividends or interest receivables owned by the Acquired Fund and any deferred or prepaid expenses shown as an asset on the books of the Acquired Fund on the Closing Date.
(c) As of the Effective Time, the Acquiring Fund will: (i) deliver to the Acquired Fund the number of full and fractional Class A, Class C, Class R3 and Class I Acquiring Fund Shares, computed in the manner set forth in (d) below; and (ii) assume all the liabilities of the Acquired Fund not discharged by the Acquired Fund, which assumed liabilities shall include all of the Acquired Fund’s liabilities, debts, obligations, and duties of whatever kind or nature, whether absolute, accrued, contingent, or otherwise, whether or not arising in the ordinary course of business, whether or not determinable at the Closing Date, and whether or not specifically referred to in the Plan or herein.
I-18
(d) The number of Class A, Class C, Class R3 and Class I Acquiring Fund Shares to be delivered to holders of Class A Acquired Fund Shares, Class C Acquired Fund Shares, Class R3 Acquired Fund Shares and Class I Acquired Fund Shares, respectively, shall be determined as follows:
(i) Acquiring Fund Shares to be issued (including fractional shares, if any) in consideration for the Acquired Fund’s net assets as described in (b) and (c) above, shall be determined with respect to Class A, Class C, Class R3 and Class I of the Acquired Fund Shares by dividing the value of the assets net of liabilities with respect to each such class of shares determined in accordance with (ii) below by the net asset value of an Acquiring Fund share of the corresponding class determined in accordance with (iii) below.
(ii) The value of the Acquired Fund’s assets and liabilities shall be computed as of the Valuation Time, using the valuation procedures set forth in the Acquiring Fund’s Prospectus and Statement of Additional Information (in effect as of the Closing Date) or such other valuation procedures as shall be mutually agreed upon by the parties.
(iii) As of the Effective Time, the Acquired Fund will distribute the Acquiring Fund Shares received pursuant to (c) above to its shareholders of record with respect to each corresponding class of shares, determined as of the close of business on the Closing Date (the “Acquired Fund Shareholders”), on a pro rata basis within that class. Such distribution will be accomplished with respect to Class A, Class C, Class R3 and Class I Acquired Fund Shares by the transfer of the Acquiring Fund Shares of the corresponding class then credited to the account of the Acquired Fund on the books of the Acquiring Fund to open accounts on the share records of the Acquiring Fund in the names of Acquired Fund Shareholders of such class. The Acquiring Fund shall not issue certificates representing Acquiring Fund Shares in connection with such transfer. As of the Effective Time, all issued and outstanding shares of the Acquired Fund shall be cancelled on the books of the Acquired Fund and retired.
(iv) As soon as practicable after the Closing Date and the making of the foregoing distribution, the Acquired Fund will thereupon proceed to completely liquidate and be dissolved, terminated and have its affairs wound up in accordance with Maryland state law.
(e) From and after the Effective Time, the Acquired Fund shares cancelled and retired pursuant to paragraph (d)(iii) above shall have the status of authorized and unissued Class D common shares of the Corporation, without designation as to series.
The undersigned officer of the Corporation hereby acknowledges, in the name and on behalf of the Corporation, the foregoing Articles of Amendment to be the corporate act of the Corporation and further certifies that, to the best of his or her knowledge, information and belief, the matters and facts set forth therein with respect to the approval thereof are true in all material respects, under the penalties of perjury.
I-19
IN WITNESS WHEREOF, the Corporation has caused these Articles of Amendment to be signed in its name and on its behalf by its President or a Vice President and witnessed by its Secretary or an Assistant Secretary on [ ], 2012.
| | |
NUVEEN INVESTMENT FUNDS, INC. |
| |
By: | | |
| | [ ] |
Its: | | [Title] |
I-20
EVERY SHAREHOLDER’S VOTE IS IMPORTANT
| | | | |
| | EASY VOTING OPTIONS: |
| | 
| | VOTE ON THE INTERNET Log on to: www.proxy-direct.com Follow the on-screen instructions available 24 hours |
| | |
| | 
| | VOTE BY PHONE Call 1-800-337-3503 Follow the recorded instructions available 24 hours |
| | |
| | 
| | VOTE BY MAIL Vote, sign and date this Proxy Card and return in the postage-paid envelope |
| | |
| | 
| | VOTE IN PERSON Attend Shareholder Meeting 333 West Wacker Dr. Chicago, IL, 60606 on , 2012 |
Please detach at perforation before mailing.
| | | | |
| PROXY | | NUVEEN LARGE CAP VALUE FUND SPECIAL MEETING OF SHAREHOLDERS TO BE HELD ON , 2012 | | PROXY |
THIS PROXY IS BEING SOLICITED BY THE BOARD OF DIRECTORS. The undersigned shareholder(s) of the Nuveen Large Cap Value Fund, revoking previous proxies, hereby appoints Kevin J. McCarthy, Kathleen Prudhomme and Christopher Rohrbacher, or any one of them true and lawful attorneys with power of substitution of each, to vote all shares of Nuveen Large Cap Value Fund which the undersigned is entitled to vote, at the Special Meeting of Shareholders to be held on , 2012, at : p.m. Central time, at the offices of Nuveen Investments, Inc., 333 West Wacker Drive, Chicago, Illinois, 60606, and at any adjournment or postponement thereof as indicated on the reverse side. In their discretion, the proxy holders named above are authorized to vote upon such other matters as may properly come before the meeting.
Receipt of the Notice of the Special Meeting and the accompanying Proxy Statement/Prospectus is hereby acknowledged. The shares of Nuveen Large Cap Value Fund represented hereby will be voted as indicated or FOR the proposal if no choice is indicated.
| | | | | | |
| | VOTE VIA THE INTERNET: www.proxy-direct.com VOTE VIA THE TELEPHONE: 1-800-337-3503 |
| | | | | | |
| | | | | | |
| | Note: Please sign exactly as your name(s) appear(s) on this card. When signing as attorney, executor, administrator, trustee, guardian or as custodian for a minor, please sign your name and give your full title as such. If signing on behalf of a corporation, please sign the full corporate name and your name and indicate your title. If you are a partner signing for a partnership, please sign the partnership name, your name and indicate your title. Joint owners should each sign these instructions. Please sign, date and return. |
| |
| | |
| | Signature and Title, if applicable |
| |
| | |
| | Signature (if held jointly) |
| |
| | |
| | Date | | | | [CFS Doc Code] |
EVERY SHAREHOLDER’S VOTE IS IMPORTANT
Important Notice Regarding the Availability of Proxy Materials for the
Nuveen Large Cap Value Fund
Shareholders Meeting to Be Held on , 2012.
The Proxy Statement and Proxy Card for this meeting are available at: www.proxy-direct.com/nuv-23865
IF YOU VOTE ON THE INTERNET OR BY TELEPHONE,
YOU NEED NOT RETURN THIS PROXY CARD
Please detach at perforation before mailing.
The Board of Directors recommends a vote “FOR” the following proposal.
TO VOTE, MARK BLOCKS BELOW IN BLUE OR BLACK INK. Example: ¢
| | | | | | | | |
| | | | FOR | | AGAINST | | ABSTAIN |
| 1. | | To approve an Agreement and Plan of Reorganization (and the related transactions) which provides for (i) the transfer of all the assets of Nuveen Large Cap Value Fund (the “Acquired Fund”) to Nuveen Dividend Value Fund (the “Acquiring Fund”) in exchange solely for voting shares of common stock of the Acquiring Fund and the assumption by the Acquiring Fund of all the liabilities of the Acquired Fund; and (ii) the distribution by the Acquired Fund of all the shares of each class of the Acquiring Fund to the holders of shares of the corresponding class of the Acquired Fund in complete liquidation and termination of the Acquired Fund (the “Reorganization”). A vote in favor of the Reorganization will be considered a vote in favor of an amendment to the Corporation’s Articles of Incorporation effecting the Reorganization. | | ¨ | | ¨ | | ¨ |
| | | | |
| 2. | | To transact such other business as may properly come before the Special Meeting or any adjournment or postponement thereof. | | | | | | |
PLEASE SIGN AND DATE ON THE REVERSE SIDE
[CFS Doc Code]
NUVEEN DIVIDEND VALUE FUND
NUVEEN LARGE CAP VALUE FUND
SUPPLEMENT DATED JULY 12, 2012
TO THE PROSPECTUS DATED FEBRUARY 29, 2012,
AS SUPPLEMENTED MAY 14, 2012
Gerald C. Bren has announced that he will retire from Nuveen Asset Management, LLC on December 31, 2012. He will continue to act as a portfolio manager for Nuveen Dividend Value Fund and Nuveen Large Cap Value Fund (the “Funds”) until that time. Cori B. Johnson and Derek M. Sadowsky will continue to serve as portfolio managers for the Funds.
PLEASE KEEP THIS WITH YOUR PROSPECTUS
FOR FUTURE REFERENCE
MGN-FLCVP-0712P
NUVEEN LARGE CAP VALUE FUND
SUPPLEMENT DATED MAY 29, 2012
TO THE PROSPECTUS DATED FEBRUARY 29, 2012,
AS SUPPLEMENTED MAY 14, 2012
Proposed Reorganization of
Nuveen Large Cap Value Fund into
Nuveen Dividend Value Fund
The Board of Directors of Nuveen Investment Funds, Inc. (“NIF”) has approved the reorganization of Nuveen Large Cap Value Fund (the “Acquired Fund”) into Nuveen Dividend Value Fund (the “Acquiring Fund”). In order for the reorganization to occur, it must be approved by the shareholders of the Acquired Fund.
If the Acquired Fund’s shareholders approve the reorganization, the Acquired Fund will transfer all of its assets and liabilities to the Acquiring Fund in exchange for Acquiring Fund shares of equal value. These Acquiring Fund shares will then be distributed to Acquired Fund shareholders and the Acquired Fund will be terminated. As a result of these transactions, Acquired Fund shareholders will become shareholders of the Acquiring Fund and will cease to be shareholders of the Acquired Fund. Each Acquired Fund shareholder will receive Acquiring Fund shares with a total value equal to the total value of that shareholder’s Acquired Fund shares immediately prior to the closing of the reorganization.
A special meeting of the Acquired Fund’s shareholders for the purpose of voting on the reorganization is expected to be held in early October 2012. If the required approval is obtained, it is anticipated that the reorganization will be consummated shortly after the special shareholder meeting. Further information regarding the proposed reorganization will be contained in proxy materials that are expected to be sent to shareholders of the Acquired Fund in late August 2012.
The Acquired Fund will continue sales and redemptions of its shares as described in the prospectus until shortly before its reorganization. However, holders of shares purchased after the record date set for the Acquired Fund’s special meeting of shareholders will not be entitled to vote those shares at the special meeting.
PLEASE KEEP THIS WITH YOUR PROSPECTUS
FOR FUTURE REFERENCE
MGN-FLCVP-0512P
Mutual Funds
Prospectus
February 29, 2012, as supplemented May 14, 2012
Nuveen Equity Funds
For investors seeking the potential for long-term capital appreciation.
| | | | | | | | | | |
| | | Class / Ticker Symbol |
| | | | | |
| Fund Name | | Class A | | Class B | | Class C | | Class R3 | | Class I |
Nuveen Dividend Value Fund | | FFEIX | | FAEBX | | FFECX | | FEISX | | FAQIX |
Nuveen Equity Index Fund | | FAEIX | | FAEQX | | FCEIX | | FADSX | | FEIIX |
Nuveen International Fund | | FAIAX | | — | | FIACX | | ARQIX | | FAICX |
Nuveen International Select Fund | | ISACX | | — | | ICCSX | | ISRCX | | ISYCX |
Nuveen Large Cap Growth Opportunities Fund | | FRGWX | | FETBX | | FAWCX | | FLCYX | | FIGWX |
Nuveen Large Cap Select Fund | | FLRAX | | — | | FLYCX | | FLSSX | | FLRYX |
Nuveen Large Cap Value Fund | | FASKX | | — | | FALVX | | FAVSX | | FSKIX |
Nuveen Mid Cap Growth Opportunities Fund | | FRSLX | | FMQBX | | FMECX | | FMEYX | | FISGX |
Nuveen Mid Cap Index Fund | | FDXAX | | — | | FDXCX | | FMCYX | | FIMEX |
Nuveen Mid Cap Select Fund | | FATAX | | — | | FTACX | | — | | FATCX |
Nuveen Mid Cap Value Fund | | FASEX | | FAESX | | FACSX | | FMVSX | | FSEIX |
Nuveen Quantitative Enhanced Core Equity Fund | | FQCAX | | — | | FQCCX | | — | | FQCYX |
Nuveen Small Cap Growth Opportunities Fund | | FRMPX | | FROBX | | FMPCX | | FMPYX | | FIMPX |
Nuveen Small Cap Index Fund | | FMDAX | | — | | FPXCX | | ARSCX | | ASETX |
Nuveen Small Cap Select Fund | | EMGRX | | ARSBX | | FHMCX | | ASEIX | | ARSTX |
Nuveen Small Cap Value Fund | | FSCAX | | — | | FSCVX | | FSVSX | | FSCCX |
Nuveen Tactical Market Opportunities Fund | | NTMAX | | — | | NTMCX | | — | | FGTYX |
The Securities and Exchange Commission has not approved or disapproved these securities or passed upon the adequacy of this prospectus. Any representation to the contrary is a criminal offense.

Table of Contents
|
| NOT FDIC OR GOVERNMENT INSURED MAY LOSE VALUE NO BANK GUARANTEE |
ii
Section 1 Fund Summaries
Nuveen Dividend Value Fund
(formerly Nuveen Equity Income Fund)
Investment Objective
The investment objective of the fund is long-term growth of capital and income.
Fees and Expenses of the Fund
This table describes the fees and expenses that you may pay if you buy and hold shares of the fund. You may qualify for sales charge discounts if you and your family invest, or agree to invest in the future, at least $50,000 in the fund or in other Nuveen Mutual Funds. More information about these and other discounts, as well as eligibility requirements for each share class, is available from your financial advisor and in “What Share Classes We Offer” on page 92 of the fund’s prospectus, “How to Reduce Your Sales Charge” on page 94 of the prospectus and “Purchase and Redemption of Fund Shares” on page S-94 of the fund’s statement of additional information.
Shareholder Fees
(fees paid directly from your investment)
| | | | | | | | | | | | | | | | | | | | |
| | | Class A | | | Class B | | | Class C | | | Class R3 | | | Class I | |
Maximum Sales Charge (Load) Imposed on Purchases
(as a percentage of offering price) | | | 5.75% | | | | None | | | | None | | | | None | | | | None | |
Maximum Deferred Sales Charge (Load)
(as a percentage of the lesser of purchase price or redemption proceeds)1 | | | None | | | | 5.00% | | | | 1.00% | | | | None | | | | None | |
| Maximum Sales Charge (Load) Imposed on Reinvested Dividends | | | None | | | | None | | | | None | | | | None | | | | None | |
| Exchange Fee | | | None | | | | None | | | | None | | | | None | | | | None | |
| Annual Low Balance Account Fee (for accounts under $1,000)2 | | | $15 | | | | $15 | | | | $15 | | | | None | | | | $15 | |
Annual Fund Operating Expenses
(expenses that you pay each year as a percentage of the value of your investment)
| | | | | | | | | | | | | | | | | | | | |
| | | Class A | | | Class B | | | Class C | | | Class R3 | | | Class I | |
| Management Fees | | | 0.77% | | | | 0.77% | | | | 0.77% | | | | 0.77% | | | | 0.77% | |
| Distribution and/or Service (12b-1) Fees | | | 0.25% | | | | 1.00% | | | | 1.00% | | | | 0.50% | | | | 0.00% | |
| Other Expenses | | | 0.12% | | | | 0.12% | | | | 0.12% | | | | 0.12% | | | | 0.12% | |
| Total Annual Fund Operating Expenses3 | | | 1.14% | | | | 1.89% | | | | 1.89% | | | | 1.39% | | | | 0.89% | |
| 1 | The CDSC on Class B shares declines over a six-year period from purchase. The CDSC on Class C shares applies only to redemptions within 12 months of purchase. |
| 2 | Fee applies to the following types of accounts under $1,000 held directly with the fund: individual retirement accounts (IRAs), Coverdell Education Savings Accounts and accounts established pursuant to the Uniform Transfers to Minors Act (UTMA) or Uniform Gifts to Minors Act (UGMA). |
| 3 | Expenses have been restated to reflect current contractual fees and estimated other expenses. |
Example
The following example is intended to help you compare the cost of investing in the fund with the cost of investing in other mutual funds. The example assumes that you invest $10,000 in the fund for the time periods indicated and then either redeem or do not redeem your shares at the end of a period. The example also assumes that your investment has a 5% return each year and that the fund’s operating expenses remain the same. Although your actual costs may be higher or lower, based on these assumptions your costs would be:
| | | | | | | | | | | | | | | | | | | | | | | | | | | | | | | | | | | | | | | | | | | | |
| | | Redemption | | No Redemption |
| | | A | | | B | | | C | | | R3 | | | I | | | | | A | | | B | | | C | | | R3 | | | I | | | |
| 1 Year | | $ | 685 | | | $ | 692 | | | $ | 192 | | | $ | 142 | | | $ | 91 | | | | | $ | 685 | | | $ | 192 | | | $ | 192 | | | $ | 142 | | | $ | 91 | | | |
| 3 Years | | $ | 916 | | | $ | 894 | | | $ | 594 | | | $ | 440 | | | $ | 284 | | | | | $ | 916 | | | $ | 594 | | | $ | 594 | | | $ | 440 | | | $ | 284 | | | |
| 5 Years | | $ | 1,167 | | | $ | 1,121 | | | $ | 1,021 | | | $ | 761 | | | $ | 493 | | | | | $ | 1,167 | | | $ | 1,021 | | | $ | 1,021 | | | $ | 761 | | | $ | 493 | | | |
| 10 Years | | $ | 1,881 | | | $ | 2,016 | | | $ | 2,212 | | | $ | 1,669 | | | $ | 1,096 | | | | | $ | 1,881 | | | $ | 2,016 | | | $ | 2,212 | | | $ | 1,669 | | | $ | 1,096 | | | |
2
Section 1 Fund Summaries
Portfolio Turnover
The fund pays transaction costs, such as commissions, when it buys and sells securities (or “turns over” its portfolio). A higher portfolio turnover rate may indicate higher transaction costs and may result in higher taxes when fund shares are held in a taxable account. These costs, which are not reflected in annual fund operating expenses or in the example, affect the fund’s performance. During the most recent fiscal year, the fund’s portfolio turnover rate was 33% of the average value of its portfolio.
Principal Investment Strategies
Under normal market conditions, the fund invests at least 80% of its net assets, plus the amount of any borrowings for investment purposes, in equity securities of companies that, in the opinion of the fund’s sub-adviser, have the ability to pay above average dividends and finance expected growth, have strong management, and are trading at attractive valuations. The fund’s sub-adviser will generally sell a security if the security is no longer expected to meet the sub-adviser’s dividend or growth expectations or if a better alternative exists in the marketplace.
The fund will attempt to maintain a dividend that will grow over time. As a result, higher-yielding equity securities will generally represent the core holdings of the fund. However, the fund also may invest in lower-yielding, higher-growth equity securities if the sub-adviser believes they will help balance the portfolio. The fund’s equity securities include common stocks, convertible preferred stocks, and corporate debt securities that are convertible into common stocks. All such equity securities will provide current income at the time of purchase.
The fund invests in convertible debt securities in pursuit of both long-term growth of capital and income. The securities’ conversion features provide long-term growth potential, while interest payments on the securities provide income. The fund may invest in convertible debt securities without regard to their ratings, and therefore may hold convertible debt securities which are rated lower than investment grade.
The fund may invest up to 15% of its total assets in non-dollar denominated equity securities of non-U.S. issuers. In addition, the fund may invest up to 25% of its assets, collectively, in non-dollar denominated equity securities of non-U.S. issuers and in dollar-denominated equity securities of non-U.S. issuers that are either listed on a U.S. stock exchange or represented by depositary receipts that may or may not be sponsored by a domestic bank. Up to 15% of the fund’s total assets may be invested in equity securities of emerging market issuers. A country is considered to be an “emerging market” if it is defined as such by Morgan Stanley Capital International Inc.
The fund may utilize options, futures contracts, options on futures contracts, and forward foreign currency exchange contracts (“derivatives”). The fund may use these derivatives to manage market or business risk, enhance the fund’s return, or hedge against adverse movements in currency exchange rates.
Principal Risks
The value of your investment in this fund will change daily, which means you could lose money. An investment in the fund is not a deposit of a bank and is not insured or guaranteed by the Federal Deposit Insurance Corporation or any other government agency. The principal risks of investing in this fund include:
Credit Risk—Credit risk is the risk that an issuer of a debt security may be unable or unwilling to make interest and principal payments when due and the related risk that the value of a debt security may decline because of concerns about the issuer’s ability or willingness to make such payments. In addition, parties to other financial contracts with the fund could default on their obligations.
Derivatives Risk—The use of derivatives involves additional risks and transaction costs which could leave the fund in a worse position than if it had not used these instruments. Derivatives may entail investment exposures that are greater than their cost would suggest. As a result, a small investment in derivatives could have a large impact on performance.
Equity Security Risk—Equity securities may decline significantly in price over short or extended periods of time, and such declines may occur in the equity market as a whole, or they may occur in only a particular country, company, industry, or sector of the market.
High Yield Securities Risk—High yield securities generally are less liquid, have more volatile prices, and have greater credit risk than investment grade securities.
Interest Rate Risk—Interest rate risk is the risk that the value of the fund’s portfolio will decline because of rising interest rates.
Section 1 Fund Summaries
3
Non-U.S./Emerging Markets Risk—Non-U.S. issuers or U.S. issuers with significant non-U.S. operations may be subject to risks in addition to those of issuers located in or that principally operate in the United States as a result of, among other things, political, social and economic developments abroad and different legal, regulatory and tax environments. These additional risks may be heightened for securities of issuers located in, or with significant operations in, emerging market countries. Also, changes in currency exchange rates may affect the fund’s net asset value, the value of dividends and interest earned, and gains and losses realized on the sale of securities.
Fund Performance
The following bar chart and table provide some indication of the potential risks of investing in the fund. The fund’s past performance (before and after taxes) is not necessarily an indication of how the fund will perform in the future. Updated performance information is available at www.nuveen.com/MF/products/performancesummary.aspx or by calling (800) 257-8787.
The bar chart below shows the variability of the fund’s performance from year to year for Class A shares. The performance of the other share classes will differ due to their different expense structures. The bar chart and highest/lowest quarterly returns that follow do not reflect sales charges, and if these charges were reflected, the returns would be less than those shown.
Class A Annual Total Return
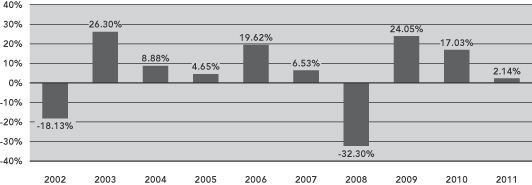
During the ten-year period ended December 31, 2011, the fund’s highest and lowest quarterly returns were 16.68% and –17.11%, respectively, for the quarters ended June 30, 2003 and December 31, 2008.
The table below shows the variability of the fund’s average annual returns and how they compare over the time periods indicated with those of a broad measure of market performance and an index of funds with similar investment objectives. Previously, the fund used the Standard & Poor’s 500® Index and Standard & Poor’s 500® Dividend Only Stocks as benchmarks. Going forward, the fund’s performance will be compared to the Russell 1000® Value Index because it more closely reflects the fund’s investment universe. All after-tax returns are calculated using the historical highest individual federal marginal income tax rates and do not reflect the impact of state and local taxes. After-tax returns are shown for Class A shares only; after-tax returns for other share classes will vary. Your own actual after-tax returns will depend on your specific tax situation and may differ from what is shown here. After-tax returns are not relevant to investors who hold fund shares in tax-deferred accounts such as IRAs or employer-sponsored retirement plans.
Both the bar chart and the table assume that all distributions have been reinvested. Performance reflects fee waivers, if any, in effect during the periods presented. If any such waivers were not in place, returns would be reduced.
Prior to July 1, 2004, Class R3 shares were designated Class S shares, which had lower fees and expenses. The performance information in the table prior to July 1, 2004 is based on the performance of the Class S shares. If current fees and expenses had been in effect, performance would have been lower.
4
Section 1 Fund Summaries
| | | | | | | | | | | | | | | | |
| | | | | | Average Annual Total Returns
for the Periods Ended December 31, 2011 | |
| | | Inception
Date | | | 1 Year | | | 5 Years | | | 10 Years | |
| Class A (return before taxes) | | | 12/18/92 | | | | (3.76 | )% | | | 0.16 | % | | | 3.57 | % |
| Class A (return after taxes on distributions) | | | | | | | (4.06 | )% | | | (0.45 | )% | | | 2.94 | % |
| Class A (return after taxes on distributions and sale of fund shares) | | | | | | | (2.04 | )% | | | 0.07 | % | | | 2.97 | % |
| Class B (return before taxes) | | | 8/15/94 | | | | (3.63 | )% | | | 0.42 | % | | | 3.41 | % |
| Class C (return before taxes) | | | 2/1/99 | | | | 1.37 | % | | | 0.60 | % | | | 3.41 | % |
| Class R3 (return before taxes) | | | 9/24/01 | | | | 1.96 | % | | | 1.08 | % | | | 3.98 | % |
| Class I (return before taxes) | | | 8/2/94 | | | | 2.39 | % | | | 1.61 | % | | | 4.45 | % |
Russell 1000® Value Index
(reflects no deduction for fees, expenses or taxes) | | | | | | | 0.39 | % | | | (2.64 | )% | | | 3.89 | % |
Standard & Poor’s 500® Index
(reflects no deduction for fees, expenses or taxes) | | | | | | | 2.11 | % | | | (0.25 | )% | | | 2.92 | % |
Standard & Poor’s 500® Dividend
Only Stocks (reflects no deduction for fees, expenses or taxes) | | | | | | | 1.68 | % | | | (0.56 | )% | | | 2.61 | % |
Lipper Equity Income Classification Average
(reflects no deduction for taxes or certain expenses) | | | | | | | 3.07 | % | | | 0.44 | % | | | 4.42 | % |
Management
Investment Adviser
Nuveen Fund Advisors, Inc.
Sub-Adviser
Nuveen Asset Management, LLC
Portfolio Managers
| | | | |
Name | | Title | | Portfolio Manager of Fund Since |
| | |
| Cori B. Johnson, CFA | | Senior Vice President | | August 1994 |
| Gerald C. Bren, CFA | | Senior Vice President | | August 1994 |
| Derek M. Sadowsky | | Vice President | | February 2012 |
Section 1 Fund Summaries
5
Purchase and Sale of Fund Shares
You may purchase, redeem or exchange shares of the fund on any business day, which is any day the New York Stock Exchange is open for business. You may purchase, redeem or exchange shares of the fund either through a financial advisor or other financial intermediary or directly from the fund. Class B shares are available only through exchanges and dividend reinvestments by current Class B shareholders. The fund’s initial and subsequent investment minimums generally are as follows, although the fund may reduce or waive the minimums in some cases:
| | | | | | |
| | | Class A and Class C | | Class R3 | | Class I |
| Eligibility and Minimum Initial Investment | | $3,000 for all accounts except: • $2,500 for Traditional/Roth IRA accounts. • $2,000 for Coverdell Education Savings Accounts. • $250 for accounts opened
through fee-based programs. • No minimum for retirement
plans. | | Available only
through certain
retirement plans. No minimum. | | Available only through fee-based programs and certain retirement plans, and to other limited categories of investors as described in the prospectus. $100,000 for all accounts except: • $250 for clients of financial intermediaries and family offices that have accounts holding Class I shares with an aggregate value of at least $100,000 (or that are expected to reach this level). • No minimum for eligible retirement plans and certain other categories of eligible investors as described in the prospectus. |
| Minimum Additional Investment | | $100 | | No minimum. | | No minimum. |
Tax Information
The fund’s distributions are taxable and will generally be taxed as ordinary income or capital gains.
Payments to Broker-Dealers and Other Financial Intermediaries
If you purchase shares of the fund through a broker-dealer or other financial intermediary (such as a bank or financial advisor), the fund, its distributor or its investment adviser may pay the intermediary for the sale of fund shares and related services. These payments may create a conflict of interest by influencing the broker-dealer or other financial intermediary and your salesperson to recommend the fund over another investment. Ask your financial advisor or visit your financial intermediary’s website for more information.
6
Section 1 Fund Summaries
Nuveen Equity Index Fund
Investment Objective
The investment objective of the fund is to provide investment results that correspond to the performance of the Standard & Poor’s 500® Index (S&P 500 Index).
Fees and Expenses of the Fund
This table describes the fees and expenses that you may pay if you buy and hold shares of the fund. You may qualify for sales charge discounts if you and your family invest, or agree to invest in the future, at least $50,000 in the fund or in other Nuveen Mutual Funds. More information about these and other discounts, as well as eligibility requirements for each share class, is available from your financial advisor and in “What Share Classes We Offer” on page 92 of the fund’s prospectus and “Purchase and Redemption of Fund Shares” on page S-94 of the fund’s statement of additional information.
Shareholder Fees
(fees paid directly from your investment)
| | | | | | | | | | | | | | | | | | | | |
| | | Class A | | | Class B | | | Class C | | | Class R3 | | | Class I | |
Maximum Sales Charge (Load) Imposed on Purchases
(as a percentage of offering price) | | | None | | | | None | | | | None | | | | None | | | | None | |
Maximum Deferred Sales Charge (Load)
(as a percentage of the lesser of purchase price or redemption proceeds)1 | | | None | | | | 5.00% | | | | 1.00% | | | | None | | | | None | |
| Maximum Sales Charge (Load) Imposed on Reinvested Dividends | | | None | | | | None | | | | None | | | | None | | | | None | |
| Exchange Fee | | | None | | | | None | | | | None | | | | None | | | | None | |
| Annual Low Balance Account Fee (for accounts under $1,000)2 | | | $15 | | | | $15 | | | | $15 | | | | None | | | | $15 | |
Annual Fund Operating Expenses
(expenses that you pay each year as a percentage of the value of your investment)
| | | | | | | | | | | | | | | | | | | | |
| | | Class A | | | Class B | | | Class C | | | Class R3 | | | Class I | |
| Management Fees | | | 0.28% | | | | 0.28% | | | | 0.28% | | | | 0.28% | | | | 0.28% | |
| Distribution and/or Service (12b-1) Fees | | | 0.25% | | | | 1.00% | | | | 1.00% | | | | 0.50% | | | | 0.00% | |
| Other Expenses | | | 0.14% | | | | 0.14% | | | | 0.14% | | | | 0.14% | | | | 0.14% | |
| Acquired Fund Fees and Expenses | | | 0.01% | | | | 0.01% | | | | 0.01% | | | | 0.01% | | | | 0.01% | |
| Total Annual Fund Operating Expenses3 | | | 0.68% | | | | 1.43% | | | | 1.43% | | | | 0.93% | | | | 0.43% | |
| Fee Waivers and/or Expense Reimbursements | | | (0.07)% | | | | (0.07)% | | | | (0.07)% | | | | (0.07)% | | | | (0.07)% | |
| Total Annual Fund Operating Expenses After Fee Waivers and/or Expense Reimbursements4 | | | 0.61% | | | | 1.36% | | | | 1.36% | | | | 0.86% | | | | 0.36% | |
| 1 | The CDSC on Class B shares declines over a six-year period from purchase. The CDSC on Class C shares applies only to redemptions within 12 months of purchase. |
| 2 | Fee applies to the following types of accounts under $1,000 held directly with the fund: individual retirement accounts (IRAs), Coverdell Education Savings Accounts and accounts established pursuant to the Uniform Transfers to Minors Act (UTMA) or Uniform Gifts to Minors Act (UGMA). |
| 3 | Expenses have been restated to reflect current contractual fees and estimated other expenses. |
| 4 | The fund’s investment adviser has contractually agreed to waive fees and/or reimburse other fund expenses through February 28, 2013 so that total annual fund operating expenses, after fee waivers and/or expense reimbursements and excluding Acquired Fund Fees and Expenses, do not exceed 0.62%, 1.37%, 1.37%, 0.87%, and 0.37% for Class A, Class B, Class C, Class R3 and Class I shares, respectively. Fee waivers and/or expense reimbursements will not be terminated prior to that time without the approval of the fund’s board of directors. |
Section 1 Fund Summaries
7
Example
The following example is intended to help you compare the cost of investing in the fund with the cost of investing in other mutual funds. The example assumes that you invest $10,000 in the fund for the time periods indicated and then either redeem or do not redeem your shares at the end of a period. The example also assumes that your investment has a 5% return each year, that the fund’s operating expenses remain the same, and the contractual fee waivers currently in place are not renewed beyond February 28, 2013. Although your actual costs may be higher or lower, based on these assumptions your costs would be:
| | | | | | | | | | | | | | | | | | | | | | | | | | | | | | | | | | | | | | | | | | | | |
| | | Redemption | | No Redemption |
| | | A | | | B | | | C | | | R3 | | | I | | | | | A | | | B | | | C | | | R3 | | | I | | | |
| 1 Year | | $ | 62 | | | $ | 638 | | | $ | 138 | | | $ | 88 | | | $ | 37 | | | | | $ | 62 | | | $ | 138 | | | $ | 138 | | | $ | 88 | | | $ | 37 | | | |
| 3 Years | | $ | 211 | | | $ | 746 | | | $ | 446 | | | $ | 289 | | | $ | 131 | | | | | $ | 211 | | | $ | 446 | | | $ | 446 | | | $ | 289 | | | $ | 131 | | | |
| 5 Years | | $ | 372 | | | $ | 875 | | | $ | 775 | | | $ | 508 | | | $ | 234 | | | | | $ | 372 | | | $ | 775 | | | $ | 775 | | | $ | 508 | | | $ | 234 | | | |
| 10 Years | | $ | 840 | | | $ | 1,503 | | | $ | 1,707 | | | $ | 1,137 | | | $ | 535 | | | | | $ | 840 | | | $ | 1,503 | | | $ | 1,707 | | | $ | 1,137 | | | $ | 535 | | | |
Portfolio Turnover
The fund pays transaction costs, such as commissions, when it buys and sells securities (or “turns over” its portfolio). A higher portfolio turnover rate may indicate higher transaction costs and may result in higher taxes when fund shares are held in a taxable account. These costs, which are not reflected in annual fund operating expenses or in the example, affect the fund’s performance. During the most recent fiscal year, the fund’s portfolio turnover rate was 2% of the average value of its portfolio.
Principal Investment Strategies
Under normal market conditions, the fund generally invests at least 90% of its net assets, plus the amount of any borrowings for investment purposes, in common stocks included in the S&P 500 Index. The S&P 500 Index is an unmanaged market-value weighted index consisting of 500 stocks chosen for market size, liquidity, sector performance and other factors. The index tracks the performance of the large cap U.S. equity market. Reconstitution of the index occurs both on a quarterly and ongoing basis. As of December 30, 2011, market capitalizations of companies in the S&P 500 Index ranged from approximately $1.2 billion to $406.3 billion.
The fund’s sub-adviser believes that the fund’s objective can best be achieved by investing in common stocks of approximately 90% to 100% of the issues included in the S&P 500 Index, depending on the size of the fund. A computer program is used to identify which stocks should be purchased or sold in order to replicate, as closely as possible, the composition of the S&P 500 Index.
Because the fund may not always hold all of the stocks included in the S&P 500 Index, and because the fund has expenses and the index does not, the fund will not duplicate the index’s performance precisely. However, the fund’s sub-adviser believes there should be a close correlation between the fund’s performance and that of the S&P 500 Index in both rising and falling markets. The fund will attempt to achieve a correlation between the performance of its portfolio and that of the S&P 500 Index of at least 95%, without taking into account expenses of the fund. A perfect correlation would be indicated by a figure of 100%, which would be achieved if the fund’s net asset value, including the value of its dividends and capital gains distributions, increased or decreased in exact proportion to changes in the S&P 500 Index. If the fund is unable to achieve a correlation of 95% over time, the fund’s board of directors will consider alternative strategies for the fund.
The fund may invest in stock index futures contracts, options on stock indices, and options on stock index futures (“derivatives”) on the S&P 500 Index. The fund makes these investments to maintain the liquidity needed to meet redemption requests, to increase the level of fund assets devoted to replicating the composition of the S&P 500 Index, and to reduce transaction costs.
8
Section 1 Fund Summaries
Principal Risks
The value of your investment in this fund will change daily, which means you could lose money. An investment in the fund is not a deposit of a bank and is not insured or guaranteed by the Federal Deposit Insurance Corporation or any other government agency. The principal risks of investing in this fund include:
Derivatives Risk—The use of derivatives involves additional risks and transaction costs which could leave the fund in a worse position than if it had not used these instruments. Derivatives may entail investment exposures that are greater than their cost would suggest. As a result, a small investment in derivatives could have a large impact on performance.
Equity Security Risk—Equity securities may decline significantly in price over short or extended periods of time, and such declines may occur in the equity market as a whole, or they may occur in only a particular country, company, industry, or sector of the market.
Failure to Match Index Performance—The fund may not replicate the performance of the S&P 500 Index.
Fund Performance
The following bar chart and table provide some indication of the potential risks of investing in the fund. The fund’s past performance (before and after taxes) is not necessarily an indication of how the fund will perform in the future. Updated performance information is available at www.nuveen.com/MF/products/performancesummary.aspx or by calling (800) 257-8787.
The bar chart below shows the variability of the fund’s performance from year to year for Class A shares. The performance of the other share classes will differ due to their different expense structures.
Class A Annual Total Return
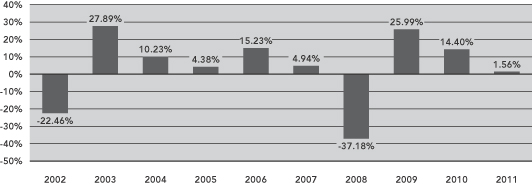
During the ten-year period ended December 31, 2011, the fund’s highest and lowest quarterly returns were 15.79% and –22.00%, respectively, for the quarters ended June 30, 2009 and December 31, 2008.
The table below shows the variability of the fund’s average annual returns and how they compare over the time periods indicated with those of a broad measure of market performance and an index of funds with similar investment objectives. All after-tax returns are calculated using the historical highest individual federal marginal income tax rates and do not reflect the impact of state and local taxes. After-tax returns are shown for Class A shares only; after-tax returns for other share classes will vary. Your own actual after-tax returns will depend on your specific tax situation and may differ from what is shown here. After-tax returns are not relevant to investors who hold fund shares in tax-deferred accounts such as IRAs or employer-sponsored retirement plans.
Both the bar chart and the table assume that all distributions have been reinvested. Performance reflects fee waivers, if any, in effect during the periods presented. If any such waivers were not in place, returns would be reduced.
Prior to July 1, 2004, Class R3 shares were designated Class S shares, which had lower fees and expenses. The performance information in the table prior to July 1, 2004 is based on the performance of the Class S shares. If current fees and expenses had been in effect, performance would have been lower.
Section 1 Fund Summaries
9
| | | | | | | | | | | | | | | | |
| | | | | | Average Annual Total Returns
for the Periods Ended December 31, 2011 | |
| | | Inception
Date | | | 1 Year | | | 5 Years | | | 10 Years | |
| Class A (return before taxes) | | | 12/14/92 | | | | 1.56 | % | | | (0.71 | )% | | | 2.41 | % |
| Class A (return after taxes on distributions) | | | | | | | 0.20 | % | | | (1.42 | )% | | | 1.91 | % |
| Class A (return after taxes on distributions and sale of fund shares) | | | | | | | 2.75 | % | | | (0.63 | )% | | | 2.02 | % |
| Class B (return before taxes) | | | 8/15/94 | | | | (3.88 | )% | | | (1.62 | )% | | | 1.64 | % |
| Class C (return before taxes) | | | 2/1/99 | | | | 0.79 | % | | | (1.45 | )% | | | 1.64 | % |
| Class R3 (return before taxes) | | | 9/24/01 | | | | 1.30 | % | | | (0.96 | )% | | | 2.22 | % |
| Class I (return before taxes) | | | 2/4/94 | | | | 1.77 | % | | | (0.47 | )% | | | 2.67 | % |
| Standard and Poor’s 500® Index (reflects no deduction for fees, expenses or taxes) | | | | | | | 2.11 | % | | | (0.25 | )% | | | 2.92 | % |
Lipper S&P 500 Index Objective Classification Average
(reflects no deduction for taxes or certain expenses) | | | | | | | 1.52 | % | | | (0.78 | )% | | | 2.38 | % |
Management
Investment Adviser
Nuveen Fund Advisors, Inc.
Sub-Adviser
Nuveen Asset Management, LLC
Portfolio Managers
| | | | |
Name | | Title | | Portfolio Manager of Fund Since |
| | |
| Walter A. French | | Senior Vice President | | October 1999 |
| David A. Friar | | Assistant Vice President | | September 2000 |
10
Section 1 Fund Summaries
Purchase and Sale of Fund Shares
You may purchase, redeem or exchange shares of the fund on any business day, which is any day the New York Stock Exchange is open for business. You may purchase, redeem or exchange shares of the fund either through a financial advisor or other financial intermediary or directly from the fund. Class B shares are available only through exchanges and dividend reinvestments by current Class B shareholders. The fund’s initial and subsequent investment minimums generally are as follows, although the fund may reduce or waive the minimums in some cases:
| | | | | | | | |
| | | Class A | | Class C | | Class R3 | | Class I |
Eligibility and Minimum Initial Investment | | Available only through fee- based programs and certain retirement plans. $250 minimum for accounts opened through fee-based programs. No minimum for retirement plans. | | $3,000 for all accounts except: • $2,500 for Traditional/Roth IRA accounts. • $2,000 for Coverdell Education Savings Accounts. • $250 for accounts opened through fee-based programs. • No minimum for retirement plans. | | Available only through certain retirement plans. No minimum. | | Available only through fee-based programs and certain retirement plans, and to other limited categories of investors as described in the prospectus. $100,000 for all accounts except: • $250 for clients of financial intermediaries and family offices that have accounts holding Class I shares with an aggregate value of at least $100,000 (or that are expected to reach this level). • No minimum for eligible retirement plans and certain other categories of eligible investors as described in the prospectus. |
| Minimum Additional Investment | | $100 | | $100 | | No minimum. | | No minimum. |
Tax Information
The fund’s distributions are taxable and will generally be taxed as ordinary income or capital gains.
Payments to Broker-Dealers and Other Financial Intermediaries
If you purchase shares of the fund through a broker-dealer or other financial intermediary (such as a bank or financial advisor), the fund, its distributor or its investment adviser may pay the intermediary for the sale of fund shares and related services. These payments may create a conflict of interest by influencing the broker-dealer or other financial intermediary and your salesperson to recommend the fund over another investment. Ask your financial advisor or visit your financial intermediary’s website for more information.
Section 1 Fund Summaries
11
Nuveen International Fund
Investment Objective
The investment objective of the fund is long-term growth of capital.
Fees and Expenses of the Fund
This table describes the fees and expenses that you may pay if you buy and hold shares of the fund. You may qualify for sales charge discounts if you and your family invest, or agree to invest in the future, at least $50,000 in the fund or in other Nuveen Mutual Funds. More information about these and other discounts, as well as eligibility requirements for each share class, is available from your financial advisor and in “What Share Classes We Offer” on page 92 of the fund’s prospectus, “How to Reduce Your Sales Charge” on page 94 of the prospectus and “Purchase and Redemption of Fund Shares” on page S-94 of the fund’s statement of additional information.
Shareholder Fees
(fees paid directly from your investment)
| | | | | | | | | | | | | | | | |
| | | Class A | | | Class C | | | Class R3 | | | Class I | |
Maximum Sales Charge (Load) Imposed on Purchases
(as a percentage of offering price) | | | 5.75% | | | | None | | | | None | | | | None | |
Maximum Deferred Sales Charge (Load)
(as a percentage of the lesser of purchase price or redemption proceeds)1 | | | None | | | | 1.00% | | | | None | | | | None | |
| Maximum Sales Charge (Load) Imposed on Reinvested Dividends | | | None | | | | None | | | | None | | | | None | |
| Exchange Fee | | | None | | | | None | | | | None | | | | None | |
| Annual Low Balance Account Fee (for accounts under $1,000)2 | | | $15 | | | | $15 | | | | None | | | | $15 | |
Annual Fund Operating Expenses
(expenses that you pay each year as a percentage of the value of your investment)
| | | | | | | | | | | | | | | | |
| | | Class A | | | Class C | | | Class R3 | | | Class I | |
| Management Fees | | | 1.03% | | | | 1.03% | | | | 1.03% | | | | 1.03% | |
| Distribution and/or Service (12b-1) Fees | | | 0.25% | | | | 1.00% | | | | 0.50% | | | | 0.00% | |
| Other Expenses | | | 0.13% | | | | 0.13% | | | | 0.13% | | | | 0.13% | |
| Acquired Fund Fees and Expenses | | | 0.02% | | | | 0.02% | | | | 0.02% | | | | 0.02% | |
| Total Annual Fund Operating Expenses3 | | | 1.43% | | | | 2.18% | | | | 1.68% | | | | 1.18% | |
| 1 | The CDSC on Class C shares applies only to redemptions within 12 months of purchase. |
| 2 | Fee applies to the following types of accounts under $1,000 held directly with the fund: individual retirement accounts (IRAs), Coverdell Education Savings Accounts and accounts established pursuant to the Uniform Transfers to Minors Act (UTMA) or Uniform Gifts to Minors Act (UGMA). |
| 3 | Expenses have been restated to reflect current contractual fees and estimated other expenses. |
12
Section 1 Fund Summaries
Example
The following example is intended to help you compare the cost of investing in the fund with the cost of investing in other mutual funds. The example assumes that you invest $10,000 in the fund for the time periods indicated and then either redeem or do not redeem your shares at the end of a period. The example also assumes that your investment has a 5% return each year and that the fund’s operating expenses remain the same. Although your actual costs may be higher or lower, based on these assumptions your costs would be:
| | | | | | | | | | | | | | | | | | | | | | | | | | | | | | | | | | | | |
| | | Redemption | | No Redemption |
| | | A | | | C | | | R3 | | | I | | | | | A | | | C | | | R3 | | | I | | | |
| 1 Year | | $ | 712 | | | $ | 221 | | | $ | 171 | | | $ | 120 | | | | | $ | 712 | | | $ | 221 | | | $ | 171 | | | $ | 120 | | | |
| 3 Years | | $ | 1,001 | | | $ | 682 | | | $ | 530 | | | $ | 375 | | | | | $ | 1,001 | | | $ | 682 | | | $ | 530 | | | $ | 375 | | | |
| 5 Years | | $ | 1,312 | | | $ | 1,169 | | | $ | 913 | | | $ | 649 | | | | | $ | 1,312 | | | $ | 1,169 | | | $ | 913 | | | $ | 649 | | | |
| 10 Years | | $ | 2,190 | | | $ | 2,513 | | | $ | 1,987 | | | $ | 1,432 | | | | | $ | 2,190 | | | $ | 2,513 | | | $ | 1,987 | | | $ | 1,432 | | | |
Portfolio Turnover
The fund pays transaction costs, such as commissions, when it buys and sells securities (or “turns over” its portfolio). A higher portfolio turnover rate may indicate higher transaction costs and may result in higher taxes when fund shares are held in a taxable account. These costs, which are not reflected in annual fund operating expenses or in the example, affect the fund’s performance. During the most recent fiscal year, the fund’s portfolio turnover rate was 72% of the average value of its portfolio.
Principal Investment Strategies
Under normal market conditions, the fund invests primarily in equity securities of non-U.S. issuers that trade in U.S. or non-U.S. markets, depositary receipts representing shares of non-U.S. issuers, and exchange-traded funds and other investment companies (“investment companies”) that provide exposure to non-U.S. issuers. The fund considers an issuer to be non-U.S. if it is organized, domiciled, or has a principal place of business outside the United States. The fund diversifies its investments among a number of different countries throughout the world and may invest in companies of any size.
The fund employs a “multi-style, multi-manager” approach whereby one of the fund’s sub-advisers, Nuveen Asset Management, LLC (“Nuveen Asset Management”), allocates portions of the fund’s assets among the different sub-advisers (including itself) who employ distinct investment styles. The fund uses the following principal investment styles, which are intended to complement one another:
| • | | Growth Style emphasizes investments in the equity securities of companies with superior growth characteristics, including superior profitability, secular growth, sustainable competitive advantage, and strong capital structure. |
| • | | Value Style emphasizes investments in equity securities of companies trading below intrinsic valuations with stable returns and companies trading at steep discounts to intrinsic valuations with catalysts for an improvement in returns. |
When determining how to allocate the fund’s assets between sub-advisers, Nuveen Asset Management considers a variety of factors. These factors include a sub-adviser’s investment style and performance record, as well as the characteristics of the sub-adviser’s typical portfolio investments. These characteristics may include capitalization size, growth and profitability measures, valuation measures, economic sector weightings, and earnings and price volatility statistics. The allocations between the sub-advisers will vary over time according to prospective returns and risks associated with the various investment styles.
Up to 15% of the fund’s total assets may be invested in equity securities of emerging markets issuers. A country is considered to be an “emerging market” if it is defined as such by Morgan Stanley Capital International Inc.
The fund may utilize options, futures contracts, options on futures contracts, and forward foreign currency exchange contracts (“derivatives”). The fund may use these derivatives to manage market or business risk, enhance the fund’s return, or hedge against adverse movements in currency exchange rates.
The portion of the fund’s assets managed by Nuveen Asset Management are used to facilitate cash flows to and from the other sub-advisers, meet redemption requests, and pay fund expenses. Nuveen Asset Management may also utilize these assets to increase the fund’s exposure to certain companies, industry sectors, countries, regions, or investment styles, and for such other reasons as it deems advisable. Nuveen Asset Management may invest these assets in equity securities issued by U.S. and non-U.S. companies (up to 10% of the fund’s total assets), derivatives, investment companies and money market instruments and other short-term securities.
Section 1 Fund Summaries
13
Principal Risks
The value of your investment in this fund will change daily, which means you could lose money. An investment in the fund is not a deposit of a bank and is not insured or guaranteed by the Federal Deposit Insurance Corporation or any other government agency. The principal risks of investing in this fund include:
Derivatives Risk—The use of derivatives involves additional risks and transaction costs which could leave the fund in a worse position than if it had not used these instruments. Derivatives may entail investment exposures that are greater than their cost would suggest. As a result, a small investment in derivatives could have a large impact on performance.
Equity Security Risk—Equity securities may decline significantly in price over short or extended periods of time, and such declines may occur in the equity market as a whole, or they may occur in only a particular country, company, industry, or sector of the market.
Multi-Manager Risk—Each sub-adviser makes investment decisions independently and it is possible that the security selection process of the sub-advisers may not complement one another. The sub-advisers selected may underperform the market generally or other sub-advisers that could have been selected.
Non-U.S./Emerging Markets Risk—Non-U.S. issuers or U.S. issuers with significant non-U.S. operations may be subject to risks in addition to those of issuers located in or that principally operate in the United States as a result of, among other things, political, social and economic developments abroad and different legal, regulatory and tax environments. These additional risks may be heightened for securities of issuers located in, or with significant operations in, emerging market countries. Also, changes in currency exchange rates may affect the fund’s net asset value, the value of dividends and interest earned, and gains and losses realized on the sale of securities.
Other Investment Companies Risk—When the fund invests in other investment companies, you bear both your proportionate share of fund expenses and, indirectly, the expenses of the other investment companies.
Smaller Company Risk—Small-cap stocks involve substantial risk. Prices of small-cap stocks may be subject to more abrupt or erratic movements, and to wider fluctuations, than stock prices of larger, more established companies or the market averages in general. It may be difficult to sell small-cap stocks at the desired time and price. While mid-cap stocks may be slightly less volatile than small-cap stocks, they still involve similar risks.
Fund Performance
The following bar chart and table provide some indication of the potential risks of investing in the fund. The fund’s past performance (before and after taxes) is not necessarily an indication of how the fund will perform in the future. Updated performance information is available at www.nuveen.com/MF/products/performancesummary.aspx or by calling (800) 257-8787.
The bar chart below shows the variability of the fund’s performance from year to year for Class A shares. The performance of the other share classes will differ due to their different expense structures. The bar chart and highest/lowest quarterly returns that follow do not reflect sales charges, and if these charges were reflected, the returns would be less than those shown.
Class A Annual Total Return
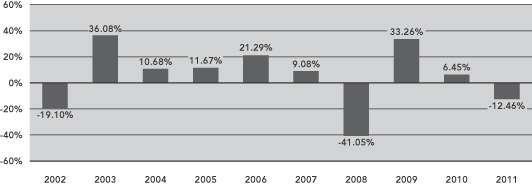
During the ten-year period ended December 31, 2011, the fund’s highest and lowest quarterly returns were 22.24% and –20.22%, respectively, for the quarters ended June 30, 2009 and December 31, 2008.
14
Section 1 Fund Summaries
The table below shows the variability of the fund’s average annual returns and how they compare over the time periods indicated with those of a broad measure of market performance and an index of funds with similar investment objectives. All after-tax returns are calculated using the historical highest individual federal marginal income tax rates and do not reflect the impact of state and local taxes. After-tax returns are shown for Class A shares only; after-tax returns for other share classes will vary. Your own actual after-tax returns will depend on your specific tax situation and may differ from what is shown here. After-tax returns are not relevant to investors who hold fund shares in tax-deferred accounts such as IRAs or employer-sponsored retirement plans.
Both the bar chart and the table assume that all distributions have been reinvested. Performance reflects fee waivers, if any, in effect during the periods presented. If any such waivers were not in place, returns would be reduced.
Prior to July 1, 2004, Class R3 shares were designated Class S shares, which had lower fees and expenses. The performance information in the table prior to July 1, 2004 is based on the performance of the Class S shares. If current fees and expenses had been in effect, performance would have been lower.
| | | | | | | | | | | | | | | | |
| | | | | | Average Annual Total Returns
for the Periods Ended
December 31, 2011 | |
| | | Inception
Date | | | 1 Year | | | 5 Years | | | 10 Years | |
| Class A (return before taxes) | | | 5/2/94 | | | | (17.50 | )% | | | (5.53 | )% | | | 2.19 | % |
| Class A (return after taxes on distributions) | | | | | | | (18.95 | )% | | | (5.99 | )% | | | 2.04 | % |
| Class A (return after taxes on distributions and sale of fund shares) | | | | | | | (7.73 | )% | | | (4.17 | )% | | | 2.32 | % |
| Class C (return before taxes) | | | 9/24/01 | | | | (13.15 | )% | | | (5.12 | )% | | | 2.02 | % |
| Class R3 (return before taxes) | | | 4/24/94 | | | | (12.70 | )% | | | (4.59 | )% | | | 2.54 | % |
| Class I (return before taxes) | | | 4/4/94 | | | | (12.34 | )% | | | (4.19 | )% | | | 3.04 | % |
| MSCI EAFE Index (reflects no deduction for fees, expenses or taxes) | | | | | | | (11.73 | )% | | | (4.26 | )% | | | 5.12 | % |
Lipper International Large-Cap Growth Classification Average
(reflects no deduction for taxes or certain expenses) | | | | | | | (13.24 | )% | | | (3.13 | )% | | | 4.37 | % |
Management
Investment Adviser
Nuveen Fund Advisors, Inc.
Sub-Advisers
Nuveen Asset Management, LLC (“Nuveen Asset Management”)
Altrinsic Global Advisors, LLC (“Altrinsic”)
Hansberger Global Investors, Inc. (“HGI”)
Section 1 Fund Summaries
15
Portfolio Managers
| | | | |
Name | | Title | | Portfolio Manager of Fund Since |
| Nuveen Asset Management | | | | |
| Keith B. Hembre, CFA | | Managing Director | | November 2008 |
| Walter A. French | | Senior Vice President | | November 2008 |
| David A. Friar | | Assistant Vice President | | February 2010 |
| Derek B. Bloom, CFA | | Vice President | | February 2010 |
| | |
| Altrinsic | | | | |
| John Hock, CFA | | Chief Investment Officer | | November 2008 |
| John L. DeVita, CFA | | Principal | | November 2008 |
| Rehan Chaudhri | | Principal | | November 2008 |
| | |
| HGI | | | | |
| Thomas R.H. Tibbles, CFA | | Chief Investment Officer - Growth Team and Managing Director - Canada | | November 2008 |
| Barry A. Lockhart, CFA | | Deputy Managing Director - Canada | | November 2008 |
| Trevor Graham, CFA | | Senior Vice President - Research | | November 2008 |
| Patrick Tan | | Senior Vice President - Research | | November 2008 |
Purchase and Sale of Fund Shares
You may purchase, redeem or exchange shares of the fund on any business day, which is any day the New York Stock Exchange is open for business. You may purchase, redeem or exchange shares of the fund either through a financial advisor or other financial intermediary or directly from the fund. The fund’s initial and subsequent investment minimums generally are as follows, although the fund may reduce or waive the minimums in some cases:
| | | | | | |
| | | Class A and Class C | | Class R3 | | Class I |
| Eligibility and Minimum Initial Investment | | $3,000 for all accounts except: • $2,500 for Traditional/Roth IRA accounts. • $2,000 for Coverdell Education Savings Accounts. • $250 for accounts opened through fee- based programs. • No minimum for retirement plans. | | Available only through certain retirement plans. No minimum. | | Available only through fee-based programs and certain retirement plans, and to other limited categories of investors as described in the prospectus. $100,000 for all accounts except: • $250 for clients of financial intermediaries and family offices that have accounts holding Class I shares with an aggregate value of at least $100,000 (or that are expected to reach this level). • No minimum for eligible retirement plans and certain other categories of eligible investors as described in the prospectus. |
| Minimum Additional Investment | | $100 | | No minimum. | | No minimum. |
Tax Information
The fund’s distributions are taxable and will generally be taxed as ordinary income or capital gains.
Payments to Broker-Dealers and Other Financial Intermediaries
If you purchase shares of the fund through a broker-dealer or other financial intermediary (such as a bank or financial advisor), the fund, its distributor or its investment adviser may pay the intermediary for the sale of fund shares and related services. These payments may create a conflict of interest by influencing the broker-dealer or other financial intermediary and your salesperson to recommend the fund over another investment. Ask your financial advisor or visit your financial intermediary’s website for more information.
16
Section 1 Fund Summaries
Nuveen International Select Fund
Investment Objective
The investment objective of the fund is long-term growth of capital.
Fees and Expenses of the Fund
This table describes the fees and expenses that you may pay if you buy and hold shares of the fund. You may qualify for sales charge discounts if you and your family invest, or agree to invest in the future, at least $50,000 in the fund or in other Nuveen Mutual Funds. More information about these and other discounts, as well as eligibility requirements for each share class, is available from your financial advisor and in “What Share Classes We Offer” on page 92 of the fund’s prospectus, “How to Reduce Your Sales Charge” on page 94 of the prospectus and “Purchase and Redemption of Fund Shares” on page S-94 of the fund’s statement of additional information.
Shareholder Fees
(fees paid directly from your investment)
| | | | | | | | | | | | | | | | |
| | | Class A | | | Class C | | | Class R3 | | | Class I | |
| Maximum Sales Charge (Load) Imposed on Purchases (as a percentage of offering price) | | | 5.75% | | | | None | | | | None | | | | None | |
Maximum Deferred Sales Charge (Load)
(as a percentage of the lesser of purchase price or redemption proceeds)1 | | | None | | | | 1.00% | | | | None | | | | None | |
| Maximum Sales Charge (Load) Imposed on Reinvested Dividends | | | None | | | | None | | | | None | | | | None | |
| Exchange Fee | | | None | | | | None | | | | None | | | | None | |
| Annual Low Balance Account Fee (for accounts under $1,000)2 | | | $15 | | | | $15 | | | | None | | | | $15 | |
Annual Fund Operating Expenses
(expenses that you pay each year as a percentage of the value of your investment)
| | | | | | | | | | | | | | | | |
| | | Class A | | | Class C | | | Class R3 | | | Class I | |
| Management Fees | | | 1.03% | | | | 1.03% | | | | 1.03% | | | | 1.03% | |
| Distribution and/or Service (12b-1) Fees | | | 0.25% | | | | 1.00% | | | | 0.50% | | | | 0.00% | |
| Other Expenses | | | 0.15% | | | | 0.15% | | | | 0.15% | | | | 0.15% | |
| Acquired Fund Fees and Expenses | | | 0.03% | | | | 0.03% | | | | 0.03% | | | | 0.03% | |
| Total Annual Fund Operating Expenses3 | | | 1.46% | | | | 2.21% | | | | 1.71% | | | | 1.21% | |
| 1 | The CDSC on Class C shares applies only to redemptions within 12 months of purchase. |
| 2 | Fee applies to the following types of accounts under $1,000 held directly with the fund: individual retirement accounts (IRAs), Coverdell Education Savings Accounts and accounts established pursuant to the Uniform Transfers to Minors Act (UTMA) or Uniform Gifts to Minors Act (UGMA). |
| 3 | Expenses have been restated to reflect current contractual fees and estimated other expenses. |
Example
The following example is intended to help you compare the cost of investing in the fund with the cost of investing in other mutual funds. The example assumes that you invest $10,000 in the fund for the time periods indicated and then either redeem or do not redeem your shares at the end of a period. The example also assumes that your investment has a 5% return each year and that the fund’s operating expenses remain the same. Although your actual costs may be higher or lower, based on these assumptions your costs would be:
| | | | | | | | | | | | | | | | | | | | | | | | | | | | | | | | | | | | |
| | | Redemption | | | | | No Redemption | | | |
| | | A | | | C | | | R3 | | | I | | | | | A | | | C | | | R3 | | | I | | | |
| 1 Year | | $ | 715 | | | $ | 224 | | | $ | 174 | | | $ | 123 | | | | | $ | 715 | | | $ | 224 | | | $ | 174 | | | $ | 123 | | | |
| 3 Years | | $ | 1,010 | | | $ | 691 | | | $ | 539 | | | $ | 384 | | | | | $ | 1,010 | | | $ | 691 | | | $ | 539 | | | $ | 384 | | | |
| 5 Years | | $ | 1,327 | | | $ | 1,185 | | | $ | 928 | | | $ | 665 | | | | | $ | 1,327 | | | $ | 1,185 | | | $ | 928 | | | $ | 665 | | | |
| 10 Years | | $ | 2,221 | | | $ | 2,544 | | | $ | 2,019 | | | $ | 1,466 | | | | | $ | 2,221 | | | $ | 2,544 | | | $ | 2,019 | | | $ | 1,466 | | | |
Section 1 Fund Summaries
17
Portfolio Turnover
The fund pays transaction costs, such as commissions, when it buys and sells securities (or “turns over” its portfolio). A higher portfolio turnover rate may indicate higher transaction costs and may result in higher taxes when fund shares are held in a taxable account. These costs, which are not reflected in annual fund operating expenses or in the example, affect the fund’s performance. During the most recent fiscal year, the fund’s portfolio turnover rate was 59% of the average value of its portfolio.
Principal Investment Strategies
Under normal market conditions, the fund invests primarily in equity securities of non-U.S. issuers that trade in U.S. or non-U.S. markets, depositary receipts representing shares of non-U.S. issuers, and exchange-traded funds and other investment companies (“investment companies”) that provide exposure to non-U.S. issuers. The fund considers an issuer to be non-U.S. if it is organized, domiciled, or has a principal place of business outside the United States. The fund diversifies its investments among a number of different countries throughout the world and may invest in companies of any size.
The fund employs a “multi-style, multi-manager” approach whereby one of the fund’s sub-advisers, Nuveen Asset Management, LLC (“Nuveen Asset Management”), allocates portions of the fund’s assets among the different sub-advisers (including itself) who employ distinct investment styles. The fund uses the following principal investment styles, which are intended to complement one another:
| • | | Growth Style emphasizes investments in equity securities of companies with superior growth characteristics, including superior profitability, secular growth, sustainable competitive advantage, and strong capital structure. |
| • | | Value Style emphasizes investments in equity securities of companies trading below intrinsic valuations with stable returns and companies trading at steep discounts to intrinsic valuations with catalysts for an improvement in returns. |
| • | | Emerging Markets Style emphasizes investments in equity securities of companies whose principal activities are located in emerging market countries that are believed to be undervalued based on their earnings, cash flow or asset values. A country is considered to be an “emerging market” if it is defined as such by Morgan Stanley Capital International, Inc. |
When determining how to allocate the fund’s assets among sub-advisers, Nuveen Asset Management considers a variety of factors. These factors include a sub-adviser’s investment style and performance record, as well as the characteristics of the sub-adviser’s typical portfolio investments. These characteristics may include capitalization size, growth and profitability measures, valuation measures, economic sector weightings, and earnings and price volatility statistics. The allocations among the sub-advisers will vary over time according to prospective returns and risks associated with the various investment styles.
The fund may utilize options, futures contracts, options on futures contracts, and forward foreign currency exchange contracts (“derivatives”). The fund may use these derivatives to manage market or business risk, enhance the fund’s return, or hedge against adverse movements in currency exchange rates.
The portion of the fund’s assets managed by Nuveen Asset Management are used to facilitate cash flows to and from the other sub-advisers, meet redemption requests, and pay fund expenses. Nuveen Asset Management may also utilize these assets to increase the fund’s exposure to certain companies, industry sectors, countries, regions, or investment styles, and for such other reasons as it deems advisable. Nuveen Asset Management may invest these assets in equity securities issued by U.S. and non-U.S. companies (up to 10% of the fund’s total assets), derivatives, investment companies, and money market instruments and other short-term securities.
Principal Risks
The value of your investment in this fund will change daily, which means you could lose money. An investment in the fund is not a deposit of a bank and is not insured or guaranteed by the Federal Deposit Insurance Corporation or any other government agency. The principal risks of investing in this fund include:
Derivatives Risk—The use of derivatives involves additional risks and transaction costs which could leave the fund in a worse position than if it had not used these instruments. Derivatives may entail investment exposures that are greater than their cost would suggest. As a result, a small investment in derivatives could have a large impact on performance.
18
Section 1 Fund Summaries
Equity Security Risk—Equity securities may decline significantly in price over short or extended periods of time, and such declines may occur in the equity market as a whole, or they may occur in only a particular country, company, industry, or sector of the market.
Multi-Manager Risk—Each sub-adviser makes investment decisions independently and it is possible that the security selection process of the sub-advisers may not complement one another. The sub-advisers selected may underperform the market generally or other sub-advisers that could have been selected.
Non-U.S./Emerging Markets Risk—Non-U.S. issuers or U.S. issuers with significant non-U.S. operations may be subject to risks in addition to those of issuers located in or that principally operate in the United States as a result of, among other things, political, social and economic developments abroad and different legal, regulatory and tax environments. These additional risks may be heightened for securities of issuers located in, or with significant operations in, emerging market countries. Also, changes in currency exchange rates may affect the fund’s net asset value, the value of dividends and interest earned, and gains and losses realized on the sale of securities.
Other Investment Companies Risk—When the fund invests in other investment companies, you bear both your proportionate share of fund expenses and, indirectly, the expenses of the other investment companies.
Smaller Company Risk—Small-cap stocks involve substantial risk. Prices of small-cap stocks may be subject to more abrupt or erratic movements, and to wider fluctuations, than stock prices of larger, more established companies or the market averages in general. It may be difficult to sell small-cap stocks at the desired time and price. While mid-cap stocks may be slightly less volatile than small-cap stocks, they still involve similar risks.
Fund Performance
The following bar chart and table provide some indication of the potential risks of investing in the fund. The fund’s past performance (before and after taxes) is not necessarily an indication of how the fund will perform in the future. Updated performance information is available at www.nuveen.com/MF/products/performancesummary.aspx or by calling (800) 257-8787.
The bar chart below shows the variability of the fund’s performance from year to year for Class A shares. The performance of the other share classes will differ due to their different expense structures. The bar chart and highest/lowest quarterly returns that follow do not reflect sales charges, and if these charges were reflected, the returns would be less than those shown.
Class A Annual Total Return
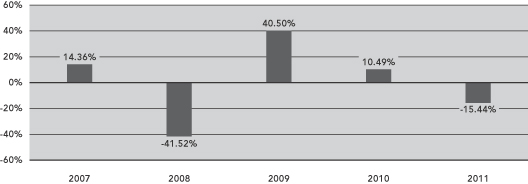
During the five-year period ended December 31, 2011, the fund’s highest and lowest quarterly returns were 24.92% and –21.70%, respectively, for the quarters ended June 30, 2009 and December 31, 2008.
The table below shows the variability of the fund’s average annual returns and how they compare over the time periods indicated with those of a broad measure of market performance and an index of funds with similar investment objectives. All after-tax returns are calculated using the historical highest individual federal marginal income tax rates and do not reflect the impact of state and local taxes. After-tax returns are shown for Class A shares only; after-tax returns for other share classes will vary. Your own actual after-tax returns will depend on your specific tax situation and may differ from what is shown here. After-tax returns are not relevant to investors who hold fund shares in tax-deferred accounts such as IRAs or employer-sponsored retirement plans.
Section 1 Fund Summaries
19
Both the bar chart and the table assume that all distributions have been reinvested. Performance reflects fee waivers, if any, in effect during the periods presented. If any such waivers were not in place, returns would be reduced.
| | | | | | | | | | | | | | | | |
| | | | | | Average Annual Total Returns
for the Periods Ended
December 31, 2011 | |
| | | Inception
Date | | | 1 Year | | | 5 Years | | | Since
Inception | |
| Class A (return before taxes) | | | 12/21/06 | | | | (20.33 | )% | | | (3.71 | )% | | | (3.61 | )% |
| Class A (return after taxes on distributions) | | | | | | | (20.45 | )% | | | (3.76 | )% | | | (3.66 | )% |
| Class A (return after taxes on distributions and sale of fund shares) | | | | | | | (12.64 | )% | | | (2.95 | )% | | | (2.87 | )% |
| Class C (return before taxes) | | | 12/21/06 | | | | (16.09 | )% | | | (3.30 | )% | | | (3.20 | )% |
| Class R3 (return before taxes) | | | 12/21/06 | | | | (17.12 | )% | | | (3.15 | )% | | | (3.05 | )% |
| Class I (return before taxes) | | | 12/21/06 | | | | (15.28 | )% | | | (2.33 | )% | | | (2.23 | )% |
MSCI All Country World Investable Market Index ex USA
(reflects no deduction for fees, expenses or taxes) | | | | | | | (13.33 | )% | | | (2.48 | )% | | | (2.31 | )% |
Lipper International Large-Cap Growth Classification Average
(reflects no deduction for taxes or certain expenses) | | | | | | | (13.24 | )% | | | (3.13 | )% | | | (3.02 | )% |
Management
Investment Adviser
Nuveen Fund Advisors, Inc.
Sub-Advisers
Nuveen Asset Management, LLC (“Nuveen Asset Management”)
Altrinsic Global Advisors, LLC (“Altrinsic”)
Hansberger Global Investors, Inc. (“HGI”)
Lazard Asset Management LLC (“Lazard”)
Portfolio Managers
| | | | |
Name | | Title | | Portfolio Manager of Fund Since |
| | |
| Nuveen Asset Management | | | | |
| Keith B. Hembre, CFA | | Managing Director | | December 2006 |
| Walter A. French | | Senior Vice President | | December 2006 |
| David A. Friar | | Assistant Vice President | | February 2010 |
| Derek B. Bloom, CFA | | Vice President | | February 2010 |
| | |
| Altrinsic | | | | |
| John Hock, CFA | | Chief Investment Officer | | December 2006 |
| John L. DeVita, CFA | | Principal | | December 2006 |
| Rehan Chaudhri | | Principal | | December 2006 |
| | |
| HGI | | | | |
| Thomas R.H. Tibbles, CFA | | Chief Investment Officer - Growth Team and Managing Director - Canada | | December 2006 |
| Barry A. Lockhart, CFA | | Deputy Managing Director - Canada | | December 2006 |
| Trevor Graham, CFA | | Senior Vice President -Research | | December 2006 |
| Patrick Tan | | Senior Vice President -Research | | December 2006 |
| | |
| Lazard | | | | |
| James M. Donald, CFA | | Managing Director & Head of Emerging Markets Group | | December 2006 |
| John R. Reinsberg | | Deputy Chairman & Head of International and Global Products | | December 2006 |
20
Section 1 Fund Summaries
Purchase and Sale of Fund Shares
You may purchase, redeem or exchange shares of the fund on any business day, which is any day the New York Stock Exchange is open for business. You may purchase, redeem or exchange shares of the fund either through a financial advisor or other financial intermediary or directly from the fund. The fund’s initial and subsequent investment minimums generally are as follows, although the fund may reduce or waive the minimums in some cases:
| | | | | | |
| | | Class A and Class C | | Class R3 | | Class I |
| Eligibility and Minimum Initial Investment | | $3,000 for all accounts except: • $2,500 for Traditional/Roth IRA accounts. • $2,000 for Coverdell Education Savings Accounts. • $250 for accounts opened
through fee-based programs. • No minimum for retirement plans. | | Available only through certain retirement plans. No minimum. | | Available only through fee-based programs and certain retirement plans, and to other limited categories of investors as described in the prospectus. $100,000 for all accounts except: • $250 for clients of financial intermediaries and family offices that have accounts holding Class I shares with an aggregate value of at least $100,000 (or that are expected to reach this level). • No minimum for eligible retirement plans and certain other categories of eligible investors as described in the prospectus. |
| Minimum Additional Investment | | $100 | | No minimum. | | No minimum. |
Tax Information
The fund’s distributions are taxable and will generally be taxed as ordinary income or capital gains.
Payments to Broker-Dealers and Other Financial Intermediaries
If you purchase shares of the fund through a broker-dealer or other financial intermediary (such as a bank or financial advisor), the fund, its distributor or its investment adviser may pay the intermediary for the sale of fund shares and related services. These payments may create a conflict of interest by influencing the broker-dealer or other financial intermediary and your salesperson to recommend the fund over another investment. Ask your financial advisor or visit your financial intermediary’s website for more information.
Section 1 Fund Summaries
21
Nuveen Large Cap Growth Opportunities Fund
Investment Objective
The investment objective of the fund is long-term growth of capital.
Fees and Expenses of the Fund
This table describes the fees and expenses that you may pay if you buy and hold shares of the fund. You may qualify for sales charge discounts if you and your family invest, or agree to invest in the future, at least $50,000 in the fund or in other Nuveen Mutual Funds. More information about these and other discounts, as well as eligibility requirements for each share class, is available from your financial advisor and in “What Share Classes We Offer” on page 92 of the fund’s prospectus, “How to Reduce Your Sales Charge” on page 94 of the prospectus and “Purchase and Redemption of Fund Shares” on page S-94 of the fund’s statement of additional information.
Shareholder Fees
(fees paid directly from your investment)
| | | | | | | | | | | | | | | | | | | | |
| | | Class A | | | Class B | | | Class C | | | Class R3 | | | Class I | |
Maximum Sales Charge (Load) Imposed on Purchases
(as a percentage of offering price) | | | 5.75% | | | | None | | | | None | | | | None | | | | None | |
Maximum Deferred Sales Charge (Load)
(as a percentage of the lesser of purchase price or redemption proceeds)1 | | | None | | | | 5.00% | | | | 1.00% | | | | None | | | | None | |
| Maximum Sales Charge (Load) Imposed on Reinvested Dividends | | | None | | | | None | | | | None | | | | None | | | | None | |
| Exchange Fee | | | None | | | | None | | | | None | | | | None | | | | None | |
| Annual Low Balance Account Fee (for accounts under $1,000)2 | | | $15 | | | | $15 | | | | $15 | | | | None | | | | $15 | |
Annual Fund Operating Expenses
(expenses that you pay each year as a percentage of the value of your investment)
| | | | | | | | | | | | | | | | | | | | |
| | | Class A | | | Class B | | | Class C | | | Class R3 | | | Class I | |
| Management Fees | | | 0.83% | | | | 0.83% | | | | 0.83% | | | | 0.83% | | | | 0.83% | |
| Distribution and/or Service (12b-1) Fees | | | 0.25% | | | | 1.00% | | | | 1.00% | | | | 0.50% | | | | 0.00% | |
| Other Expenses | | | 0.13% | | | | 0.13% | | | | 0.13% | | | | 0.13% | | | | 0.13% | |
| Total Annual Fund Operating Expenses3 | | | 1.21% | | | | 1.96% | | | | 1.96% | | | | 1.46% | | | | 0.96% | |
| 1 | The CDSC on Class B shares declines over a six-year period from purchase. The CDSC on Class C shares applies only to redemptions within 12 months of purchase. |
| 2 | Fee applies to the following types of accounts under $1,000 held directly with the fund: individual retirement accounts (IRAs), Coverdell Education Savings Accounts and accounts established pursuant to the Uniform Transfers to Minors Act (UTMA) or Uniform Gifts to Minors Act (UGMA). |
| 3 | Expenses have been restated to reflect current contractual fees and estimated other expenses. |
Example
The following example is intended to help you compare the cost of investing in the fund with the cost of investing in other mutual funds. The example assumes that you invest $10,000 in the fund for the time periods indicated and then either redeem or do not redeem your shares at the end of a period. The example also assumes that your investment has a 5% return each year and that the fund’s operating expenses remain the same. Although your actual costs may be higher or lower, based on these assumptions your costs would be:
| | | | | | | | | | | | | | | | | | | | | | | | | | | | | | | | | | | | | | | | | | | | |
| | | Redemption | | | | | No Redemption | | | |
| | | A | | | B | | | C | | | R3 | | | I | | | | | A | | | B | | | C | | | R3 | | | I | | | |
| 1 Year | | $ | 691 | | | $ | 699 | | | $ | 199 | | | $ | 149 | | | $ | 98 | | | | | $ | 691 | | | $ | 199 | | | $ | 199 | | | $ | 149 | | | $ | 98 | | | |
| 3 Years | | $ | 937 | | | $ | 915 | | | $ | 615 | | | $ | 462 | | | $ | 306 | | | | | $ | 937 | | | $ | 615 | | | $ | 615 | | | $ | 462 | | | $ | 306 | | | |
| 5 Years | | $ | 1,202 | | | $ | 1,157 | | | $ | 1,057 | | | $ | 797 | | | $ | 531 | | | | | $ | 1,202 | | | $ | 1,057 | | | $ | 1,057 | | | $ | 797 | | | $ | 531 | | | |
| 10 Years | | $ | 1,957 | | | $ | 2,091 | | | $ | 2,285 | | | $ | 1,746 | | | $ | 1,178 | | | | | $ | 1,957 | | | $ | 2,091 | | | $ | 2,285 | | | $ | 1,746 | | | $ | 1,178 | | | |
22
Section 1 Fund Summaries
Portfolio Turnover
The fund pays transaction costs, such as commissions, when it buys and sells securities (or “turns over” its portfolio). A higher portfolio turnover rate may indicate higher transaction costs and may result in higher taxes when fund shares are held in a taxable account. These costs, which are not reflected in annual fund operating expenses or in the example, affect the fund’s performance. During the most recent fiscal year, the fund’s portfolio turnover rate was 88% of the average value of its portfolio.
Principal Investment Strategies
Under normal market conditions, the fund invests at least 80% of net assets, plus the amount of any borrowings for investment purposes, in common stocks of large-capitalization companies, defined as companies that have market capitalizations of $5 billion or greater at the time of purchase.
In selecting stocks, the fund’s sub-adviser invests in companies that it believes exhibit the potential for superior growth based on factors such as above average growth in revenue and earnings, strong competitive position, strong management, and sound financial condition. The fund’s sub-adviser will generally sell a stock if the stock hits its price target, the company’s fundamentals or competitive position significantly deteriorate, or if a better alternative exists in the marketplace.
The fund may invest up to 15% of its total assets in non-dollar denominated equity securities of non-U.S. issuers. In addition, the fund may invest up to 25% of its assets, collectively, in non-dollar denominated equity securities of non-U.S. issuers and in dollar-denominated equity securities of non-U.S. issuers that are either listed on a U.S. stock exchange or represented by depositary receipts that may or may not be sponsored by a domestic bank. Up to 15% of the fund’s total assets may be invested in equity securities of emerging market issuers. A country is considered to be an “emerging market” if it is defined as such by Morgan Stanley Capital International Inc.
The fund may utilize options, futures contracts, options on futures contracts, and forward foreign currency exchange contracts (“derivatives”). The fund may use these derivatives to manage market or business risk, enhance the fund’s return, or hedge against adverse movements in currency exchange rates.
Principal Risks
The value of your investment in this fund will change daily, which means you could lose money. An investment in the fund is not a deposit of a bank and is not insured or guaranteed by the Federal Deposit Insurance Corporation or any other government agency. The principal risks of investing in this fund include:
Derivatives Risk—The use of derivatives involves additional risks and transaction costs which could leave the fund in a worse position than if it had not used these instruments. Derivatives may entail investment exposures that are greater than their cost would suggest. As a result, a small investment in derivatives could have a large impact on performance.
Equity Security Risk—Equity securities may decline significantly in price over short or extended periods of time, and such declines may occur in the equity market as a whole, or they may occur in only a particular country, company, industry, or sector of the market.
Investment Focus Risk—Different types of stocks tend to shift in and out of favor depending on market and economic conditions. The fund emphasizes a growth style of investing and therefore seeks companies experiencing high rates of current growth; such companies may be more volatile than other types of investments. Furthermore, because the fund focuses its investments in large-cap stocks, the fund may not benefit from gains in smaller cap sectors of the market.
Non-U.S./Emerging Markets Risk—Non-U.S. issuers or U.S. issuers with significant non-U.S. operations may be subject to risks in addition to those of issuers located in or that principally operate in the United States as a result of, among other things, political, social and economic developments abroad and different legal, regulatory and tax environments. These additional risks may be heightened for securities of issuers located in, or with significant operations in, emerging market countries. Also, changes in currency exchange rates may affect the fund’s net asset value, the value of dividends and interest earned, and gains and losses realized on the sale of securities.
Fund Performance
The following bar chart and table provide some indication of the potential risks of investing in the fund. The fund’s past performance (before and after taxes) is not necessarily an indication of how the fund will perform in the future. Updated performance information is available at www.nuveen.com/MF/products/performancesummary.aspx or by calling (800) 257-8787.
Section 1 Fund Summaries
23
The bar chart below shows the variability of the fund’s performance from year to year for Class A shares. The performance of the other share classes will differ due to their different expense structures. The bar chart and highest/lowest quarterly returns that follow do not reflect sales charges, and if these charges were reflected, the returns would be less than those shown.
Class A Annual Total Return
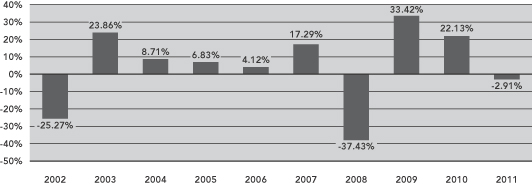
During the ten-year period ended December 31, 2011, the fund’s highest and lowest quarterly returns were 16.55% and –21.12%, respectively, for the quarters ended September 30, 2010 and December 31, 2008.
The table below shows the variability of the fund’s average annual returns and how they compare over the time periods indicated with those of a broad measure of market performance and an index of funds with similar investment objectives. All after-tax returns are calculated using the historical highest individual federal marginal income tax rates and do not reflect the impact of state and local taxes. After-tax returns are shown for Class A shares only; after-tax returns for other share classes will vary. Your own actual after-tax returns will depend on your specific tax situation and may differ from what is shown here. After-tax returns are not relevant to investors who hold fund shares in tax-deferred accounts such as IRAs or employer-sponsored retirement plans.
Both the bar chart and the table assume that all distributions have been reinvested. Performance reflects fee waivers, if any, in effect during the periods presented. If any such waivers were not in place, returns would be reduced.
Prior to July 1, 2004, Class R3 shares were designated Class S shares, which had lower fees and expenses. The performance information in the table prior to July 1, 2004 is based on the performance of the Class S shares. If current fees and expenses had been in effect, performance would have been lower.
| | | | | | | | | | | | | | | | |
| | | | | | Average Annual Total Returns for the Periods Ended December 31, 2011 | |
| | | Inception
Date | | | 1 Year | | | 5 Years | | | 10 Years | |
| Class A (return before taxes) | | | 1/9/95 | | | | (8.49 | )% | | | 1.82 | % | | | 2.05 | % |
| Class A (return after taxes on distributions) | | | | | | | (9.01 | )% | | | 1.39 | % | | | 1.81 | % |
| Class A (return after taxes on distributions and sale of fund shares) | | | | | | | (4.85 | )% | | | 1.52 | % | | | 1.74 | % |
| Class B (return before taxes) | | | 3/1/99 | | | | (8.27 | )% | | | 2.09 | % | | | 1.89 | % |
| Class C (return before taxes) | | | 9/24/01 | | | | (3.64 | )% | | | 2.26 | % | | | 1.89 | % |
| Class R3 (return before taxes) | | | 11/27/00 | | | | (3.17 | )% | | | 2.77 | % | | | 2.46 | % |
| Class I (return before taxes) | | | 12/29/92 | | | | (2.69 | )% | | | 3.29 | % | | | 2.91 | % |
| Russell 1000® Growth Index (reflects no deduction for fees, expenses or taxes) | | | | | | | 2.64 | % | | | 2.50 | % | | | 2.60 | % |
Lipper Large-Cap Growth Classification Average
(reflects no deduction for taxes or certain expenses) | | | | | | | (1.91 | )% | | | 0.96 | % | | | 1.94 | % |
Management
Investment Adviser
Nuveen Fund Advisors, Inc.
Sub-Adviser
Nuveen Asset Management, LLC
24
Section 1 Fund Summaries
Portfolio Managers
| | | | |
Name | | Title | | Portfolio Manager of Fund Since |
| | |
| Harold R. Goldstein | | Senior Vice President | | July 2002 |
| Scott M. Mullinix, CFA | | Senior Vice President | | April 2006 |
| James A. Diedrich, CFA | | Senior Vice President | | February 2006 |
Purchase and Sale of Fund Shares
You may purchase, redeem or exchange shares of the fund on any business day, which is any day the New York Stock Exchange is open for business. You may purchase, redeem or exchange shares of the fund either through a financial advisor or other financial intermediary or directly from the fund. Class B shares are available only through exchanges and dividend reinvestments by current Class B shareholders. The fund’s initial and subsequent investment minimums generally are as follows, although the fund may reduce or waive the minimums in some cases:
| | | | | | |
| | | Class A and Class C | | Class R3 | | Class I |
Eligibility and
Minimum Initial
Investment | | $3,000 for all accounts except: • $2,500 for Traditional/Roth IRA accounts. • $2,000 for Coverdell Education Savings Accounts. • $250 for accounts opened through fee-based programs. • No minimum for retirement plans. | | Available only through certain retirement plans. No minimum. | | Available only through fee-based programs and certain retirement plans, and to other limited categories of investors as described in the prospectus. $100,000 for all accounts except: • $250 for clients of financial intermediaries and family offices that have accounts holding Class I shares with an aggregate value of at least $100,000 (or that are expected to reach this level). • No minimum for eligible retirement plans and certain other categories of eligible investors as described in the prospectus. |
| Minimum Additional Investment | | $100 | | No minimum. | | No minimum. |
Tax Information
The fund’s distributions are taxable and will generally be taxed as ordinary income or capital gains.
Payments to Broker-Dealers and Other Financial Intermediaries
If you purchase shares of the fund through a broker-dealer or other financial intermediary (such as a bank or financial advisor), the fund, its distributor or its investment adviser may pay the intermediary for the sale of fund shares and related services. These payments may create a conflict of interest by influencing the broker-dealer or other financial intermediary and your salesperson to recommend the fund over another investment. Ask your financial advisor or visit your financial intermediary’s website for more information.
Section 1 Fund Summaries
25
Nuveen Large Cap Select Fund
Investment Objective
The investment objective of the fund is capital appreciation.
Fees and Expenses of the Fund
This table describes the fees and expenses that you may pay if you buy and hold shares of the fund. You may qualify for sales charge discounts if you and your family invest, or agree to invest in the future, at least $50,000 in the fund or in other Nuveen Mutual Funds. More information about these and other discounts, as well as eligibility requirements for each share class, is available from your financial advisor and in “What Share Classes We Offer” on page 92 of the fund’s prospectus, “How to Reduce Your Sales Charge” on page 94 of the prospectus and “Purchase and Redemption of Fund Shares” on page S-94 of the fund’s statement of additional information.
Shareholder Fees
(fees paid directly from your investment)
| | | | | | | | | | | | | | | | |
| | | Class A | | | Class C | | | Class R3 | | | Class I | |
Maximum Sales Charge (Load) Imposed on Purchases
(as a percentage of offering price) | | | 5.75% | | | | None | | | | None | | | | None | |
Maximum Deferred Sales Charge (Load)
(as a percentage of the lesser of purchase price or redemption proceeds)1 | | | None | | | | 1.00% | | | | None | | | | None | |
| Maximum Sales Charge (Load) Imposed on Reinvested Dividends | | | None | | | | None | | | | None | | | | None | |
| Exchange Fee | | | None | | | | None | | | | None | | | | None | |
| Annual Low Balance Account Fee (for accounts under $1,000)2 | | | $15 | | | | $15 | | | | None | | | | $15 | |
Annual Fund Operating Expenses
(expenses that you pay each year as a percentage of the value of your investment)
| | | | | | | | | | | | | | | | |
| | | Class A | | | Class C | | | Class R3 | | | Class I | |
| Management Fees | | | 0.75% | | | | 0.75% | | | | 0.75% | | | | 0.75% | |
| Distribution and/or Service (12b-1) Fees | | | 0.25% | | | | 1.00% | | | | 0.50% | | | | 0.00% | |
| Other Expenses | | | 0.19% | | | | 0.19% | | | | 0.19% | | | | 0.19% | |
| Total Annual Fund Operating Expenses3 | | | 1.19% | | | | 1.94% | | | | 1.44% | | | | 0.94% | |
| 1 | The CDSC on Class C shares applies only to redemptions within 12 months of purchase. |
| 2 | Fee applies to the following types of accounts under $1,000 held directly with the fund: individual retirement accounts (IRAs), Coverdell Education Savings Accounts and accounts established pursuant to the Uniform Transfers to Minors Act (UTMA) or Uniform Gifts to Minors Act (UGMA). |
| 3 | Expenses have been restated to reflect current contractual fees and estimated other expenses. |
Example
The following example is intended to help you compare the cost of investing in the fund with the cost of investing in other mutual funds. The example assumes that you invest $10,000 in the fund for the time periods indicated and then either redeem or do not redeem your shares at the end of a period. The example also assumes that your investment has a 5% return each year and that the fund’s operating expenses remain the same. Although your actual costs may be higher or lower, based on these assumptions your costs would be:
| | | | | | | | | | | | | | | | | | | | | | | | | | | | | | | | | | | | |
| | | Redemption | | | | | No Redemption | | | |
| | | A | | | C | | | R3 | | | I | | | | | A | | | C | | | R3 | | | I | | | |
| 1 Year | | $ | 689 | | | $ | 197 | | | $ | 147 | | | $ | 96 | | | | | $ | 689 | | | $ | 197 | | | $ | 147 | | | $ | 96 | | | |
| 3 Years | | $ | 931 | | | $ | 609 | | | $ | 456 | | | $ | 300 | | | | | $ | 931 | | | $ | 609 | | | $ | 456 | | | $ | 300 | | | |
| 5 Years | | $ | 1,192 | | | $ | 1,047 | | | $ | 787 | | | $ | 520 | | | | | $ | 1,192 | | | $ | 1,047 | | | $ | 787 | | | $ | 520 | | | |
| 10 Years | | $ | 1,935 | | | $ | 2,264 | | | $ | 1,724 | | | $ | 1,155 | | | | | $ | 1,935 | | | $ | 2,264 | | | $ | 1,724 | | | $ | 1,155 | | | |
26
Section 1 Fund Summaries
Portfolio Turnover
The fund pays transaction costs, such as commissions, when it buys and sells securities (or “turns over” its portfolio). A higher portfolio turnover rate may indicate higher transaction costs and may result in higher taxes when fund shares are held in a taxable account. These costs, which are not reflected in annual fund operating expenses or in the example, affect the fund’s performance. During the most recent fiscal year, the fund’s portfolio turnover rate was 139% of the average value of its portfolio.
Principal Investment Strategies
Under normal market conditions, the fund invests at least 80% of net assets, plus the amount of any borrowings for investment purposes, in common stocks of large-capitalization companies, defined as companies that have market capitalizations of $5 billion or greater at the time of purchase.
The sub-adviser will select companies based on a combination of value and growth objectives, seeking companies that meet at least two of the following criteria:
| • | | Attractively valued relative to other companies in the same industry or market. |
| • | | Strong or improving cash flows, revenue and earnings growth, or other fundamentals. |
| • | | Strong competitive position. |
| • | | An identifiable catalyst that could increase the value of the company’s stock over the next one or two years. |
The fund’s sub-adviser will generally sell a stock if the stock hits its price target, the company’s fundamentals or competitive position significantly deteriorate, or if a better alternative exists in the marketplace.
The fund may invest up to 15% of its total assets in non-dollar denominated equity securities of non-U.S. issuers. In addition, the fund may invest up to 25% of its assets, collectively, in non-dollar denominated equity securities of non-U.S. issuers and in dollar-denominated equity securities of non-U.S. issuers that are either listed on a U.S. stock exchange or represented by depositary receipts that may or may not be sponsored by a domestic bank. Up to 15% of the fund’s total assets may be invested in equity securities of emerging market issuers. A country is considered to be an “emerging market” if it is defined as such by Morgan Stanley Capital International Inc.
The fund may utilize options, futures contracts, options on futures contracts, and forward foreign currency exchange contracts (“derivatives”). The fund may use these derivatives to manage market or business risk, enhance the fund’s return, or hedge against adverse movements in currency exchange rates.
Principal Risks
The value of your investment in this fund will change daily, which means you could lose money. An investment in the fund is not a deposit of a bank and is not insured or guaranteed by the Federal Deposit Insurance Corporation or any other government agency. The principal risks of investing in this fund include:
Derivatives Risk—The use of derivatives involves additional risks and transaction costs which could leave the fund in a worse position than if it had not used these instruments. Derivatives may entail investment exposures that are greater than their cost would suggest. As a result, a small investment in derivatives could have a large impact on performance.
Equity Security Risk—Equity securities may decline significantly in price over short or extended periods of time, and such declines may occur in the equity market as a whole, or they may occur in only a particular country, company, industry, or sector of the market.
Non-U.S./Emerging Markets Risk—Non-U.S. issuers or U.S. issuers with significant non-U.S. operations may be subject to risks in addition to those of issuers located in or that principally operate in the United States as a result of, among other things, political, social and economic developments abroad and different legal, regulatory and tax environments. These additional risks may be heightened for securities of issuers located in, or with significant operations in, emerging market countries. Also, changes in currency exchange rates may affect the fund’s net asset value, the value of dividends and interest earned, and gains and losses realized on the sale of securities.
Section 1 Fund Summaries
27
Fund Performance
The following bar chart and table provide some indication of the potential risks of investing in the fund. The fund’s past performance (before and after taxes) is not necessarily an indication of how the fund will perform in the future. Updated performance information is available at www.nuveen.com/MF/products/performancesummary.aspx or by calling (800) 257-8787.
The bar chart below shows the variability of the fund’s performance from year to year for Class A shares. The performance of the other share classes will differ due to their different expense structures. The bar chart and highest/lowest quarterly returns that follow do not reflect sales charges, and if these charges were reflected, the returns would be less than those shown.
Class A Annual Total Return
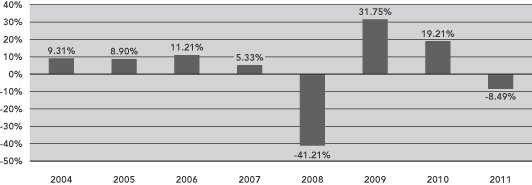
During the eight-year period ended December 31, 2011, the fund’s highest and lowest quarterly returns were 17.42% and –23.26%, respectively, for the quarters ended September 30, 2009 and December 31, 2008.
The table below shows the variability of the fund’s average annual returns and how they compare over the time periods indicated with those of a broad measure of market performance and an index of funds with similar investment objectives. All after-tax returns are calculated using the historical highest individual federal marginal income tax rates and do not reflect the impact of state and local taxes. After-tax returns are shown for Class A shares only; after-tax returns for other share classes will vary. Your own actual after-tax returns will depend on your specific tax situation and may differ from what is shown here. After-tax returns are not relevant to investors who hold fund shares in tax-deferred accounts such as IRAs or employer-sponsored retirement plans.
Both the bar chart and the table assume that all distributions have been reinvested. Performance reflects fee waivers, if any, in effect during the periods presented. If any such waivers were not in place, returns would be reduced.
Prior to July 1, 2004, Class R3 shares were designated Class S shares, which had lower fees and expenses. The performance information in the table prior to July 1, 2004 is based on the performance of the Class S shares. If current fees and expenses had been in effect, performance would have been lower.
| | | | | | | | | | | | | | | | |
| | | | | | Average Annual Total Returns
for the Periods Ended December 31, 2011 | |
| | | Inception
Date | | | 1 Year | | | 5 Years | | | Since
Inception | |
| Class A (return before taxes) | | | 1/31/03 | | | | (13.78 | )% | | | (3.46 | )% | | | 4.04 | % |
| Class A (return after taxes on distributions) | | | | | | | (13.78 | )% | | | (4.21 | )% | | | 3.33 | % |
| Class A (return after taxes on distributions and sale of fund shares) | | | | | | | (8.96 | )% | | | (3.16 | )% | | | 3.26 | % |
| Class C (return before taxes) | | | 1/31/03 | | | | (9.15 | )% | | | (3.06 | )% | | | 3.92 | % |
| Class R3 (return before taxes) | | | 1/31/03 | | | | (8.65 | )% | | | (2.52 | )% | | | 4.50 | % |
| Class I (return before taxes) | | | 1/31/03 | | | | (8.27 | )% | | | (2.04 | )% | | | 5.00 | % |
| Standard & Poor’s 500® Index (reflects no deduction for fees, expenses or taxes) | | | | | | | 2.11 | % | | | (0.25 | )% | | | 6.54 | % |
Lipper Large-Cap Core Classification Average
(reflects no deduction for taxes or certain expenses) | | | | | | | (0.67 | )% | | | (0.87 | )% | | | 5.87 | % |
28
Section 1 Fund Summaries
Management
Investment Adviser
Nuveen Fund Advisors, Inc.
Sub-Adviser
Nuveen Asset Management, LLC
Portfolio Managers
| | | | |
Name | | Title | | Portfolio Manager of Fund Since |
David A. Chalupnik, CFA | | Managing Director | | January 2003 |
Anthony R. Burger, CFA | | Senior Vice President | | October 2004 |
Purchase and Sale of Fund Shares
You may purchase, redeem or exchange shares of the fund on any business day, which is any day the New York Stock Exchange is open for business. You may purchase, redeem or exchange shares of the fund either through a financial advisor or other financial intermediary or directly from the fund. The fund’s initial and subsequent investment minimums generally are as follows, although the fund may reduce or waive the minimums in some cases:
| | | | | | |
| | | Class A and Class C | | Class R3 | | Class I |
| Eligibility and Minimum Initial Investment | | $3,000 for all accounts except: • $2,500 for Traditional/Roth IRA accounts. • $2,000 for Coverdell Education Savings Accounts. • $250 for accounts opened through fee-based programs. • No minimum for retirement plans. | | Available only through certain retirement plans. No minimum. | | Available only through fee-based programs and certain retirement plans, and to other limited categories of investors as described in the prospectus. $100,000 for all accounts except: • $250 for clients of financial intermediaries and family offices that have accounts holding Class I shares with an aggregate value of at least $100,000 (or that are expected to reach this level). • No minimum for eligible retirement plans and certain other categories of eligible investors as described in the prospectus. |
Minimum
Additional Investment | | $100 | | No minimum. | | No minimum. |
Tax Information
The fund’s distributions are taxable and will generally be taxed as ordinary income or capital gains.
Payments to Broker-Dealers and Other Financial Intermediaries
If you purchase shares of the fund through a broker-dealer or other financial intermediary (such as a bank or financial advisor), the fund, its distributor or its investment adviser may pay the intermediary for the sale of fund shares and related services. These payments may create a conflict of interest by influencing the broker-dealer or other financial intermediary and your salesperson to recommend the fund over another investment. Ask your financial advisor or visit your financial intermediary’s website for more information.
Section 1 Fund Summaries
29
Nuveen Large Cap Value Fund
Investment Objective
The investment objective of the fund is capital appreciation. Current income is a secondary objective of the fund.
Fees and Expenses of the Fund
This table describes the fees and expenses that you may pay if you buy and hold shares of the fund. You may qualify for sales charge discounts if you and your family invest, or agree to invest in the future, at least $50,000 in the fund or in other Nuveen Mutual Funds. More information about these and other discounts, as well as eligibility requirements for each share class, is available from your financial advisor and in “What Share Classes We Offer” on page 92 of the fund’s prospectus, “How to Reduce Your Sales Charge” on page 94 of the prospectus and “Purchase and Redemption of Fund Shares” on page S-94 of the fund’s statement of additional information.
Shareholder Fees
(fees paid directly from your investment)
| | | | | | | | | | | | | | | | |
| | | Class A | | | Class C | | | Class R3 | | | Class I | |
Maximum Sales Charge (Load) Imposed on Purchases
(as a percentage of offering price) | | | 5.75% | | | | None | | | | None | | | | None | |
Maximum Deferred Sales Charge (Load)
(as a percentage of the lesser of purchase price or redemption proceeds)1 | | | None | | | | 1.00% | | | | None | | | | None | |
| Maximum Sales Charge (Load) Imposed on Reinvested Dividends | | | None | | | | None | | | | None | | | | None | |
| Exchange Fee | | | None | | | | None | | | | None | | | | None | |
| Annual Low Balance Account Fee (for accounts under $1,000)2 | | | $15 | | | | $15 | | | | None | | | | $15 | |
Annual Fund Operating Expenses
(expenses that you pay each year as a percentage of the value of your investment)
| | | | | | | | | | | | | | | | |
| | | Class A | | | Class C | | | Class R3 | | | Class I | |
| Management Fees | | | 0.75% | | | | 0.75% | | | | 0.75% | | | | 0.75% | |
| Distribution and/or Service (12b-1) Fees | | | 0.25% | | | | 1.00% | | | | 0.50% | | | | 0.00% | |
| Other Expenses | | | 0.19% | | | | 0.19% | | | | 0.19% | | | | 0.19% | |
| Total Annual Fund Operating Expenses3 | | | 1.19% | | | | 1.94% | | | | 1.44% | | | | 0.94% | |
| 1 | The CDSC on Class C shares applies only to redemptions within 12 months of purchase. |
| 2 | Fee applies to the following types of accounts under $1,000 held directly with the fund: individual retirement accounts (IRAs), Coverdell Education Savings Accounts and accounts established pursuant to the Uniform Transfers to Minors Act (UTMA) or Uniform Gifts to Minors Act (UGMA). |
| 3 | Expenses have been restated to reflect current contractual fees and estimated other expenses. |
Example
The following example is intended to help you compare the cost of investing in the fund with the cost of investing in other mutual funds. The example assumes that you invest $10,000 in the fund for the time periods indicated and then either redeem or do not redeem your shares at the end of a period. The example also assumes that your investment has a 5% return each year and that the fund’s operating expenses remain the same. Although your actual costs may be higher or lower, based on these assumptions your costs would be:
| | | | | | | | | | | | | | | | | | | | | | | | | | | | | | | | | | | | |
| | | Redemption | | No Redemption |
| | | A | | | C | | | R3 | | | I | | | | | A | | | C | | | R3 | | | I | | | |
| 1 Year | | $ | 689 | | | $ | 197 | | | $ | 147 | | | $ | 96 | | | | | $ | 689 | | | $ | 197 | | | $ | 147 | | | $ | 96 | | | |
| 3 Years | | $ | 931 | | | $ | 609 | | | $ | 456 | | | $ | 300 | | | | | $ | 931 | | | $ | 609 | | | $ | 456 | | | $ | 300 | | | |
| 5 Years | | $ | 1,192 | | | $ | 1,047 | | | $ | 787 | | | $ | 520 | | | | | $ | 1,192 | | | $ | 1,047 | | | $ | 787 | | | $ | 520 | | | |
| 10 Years | | $ | 1,935 | | | $ | 2,264 | | | $ | 1,724 | | | $ | 1,155 | | | | | $ | 1,935 | | | $ | 2,264 | | | $ | 1,724 | | | $ | 1,155 | | | |
30
Section 1 Fund Summaries
Portfolio Turnover
The fund pays transaction costs, such as commissions, when it buys and sells securities (or “turns over” its portfolio). A higher portfolio turnover rate may indicate higher transaction costs and may result in higher taxes when fund shares are held in a taxable account. These costs, which are not reflected in annual fund operating expenses or in the example, affect the fund’s performance. During the most recent fiscal year, the fund’s portfolio turnover rate was 114% of the average value of its portfolio.
Principal Investment Strategies
Under normal market conditions, the fund invests at least 80% of net assets, plus the amount of any borrowings for investment purposes, in common stocks of large-capitalization companies, defined as companies that have market capitalizations of $5 billion or greater at the time of purchase.
In selecting stocks, the fund’s sub-adviser invests in companies that it believes are undervalued relative to other companies in the same industry or market, exhibit good or improving fundamentals, and exhibit an identifiable catalyst that could close the gap between market value and fair value over the next one to two years. The fund’s sub-adviser will generally sell a stock if the stock hits its price target, the company’s fundamentals or competitive position significantly deteriorate, or if a better alternative exists in the marketplace.
The fund may invest up to 15% of its total assets in non-dollar denominated equity securities of non-U.S. issuers. In addition, the fund may invest up to 25% of its assets, collectively, in non-dollar denominated equity securities of non-U.S. issuers and in dollar-denominated equity securities of non-U.S. issuers that are either listed on a U.S. stock exchange or represented by depositary receipts that may or may not be sponsored by a domestic bank. Up to 15% of the fund’s total assets may be invested in equity securities of emerging market issuers. A country is considered to be an “emerging market” if it is defined as such by Morgan Stanley Capital International Inc.
The fund may utilize options, futures contracts, options on futures contracts, and forward foreign currency exchange contracts (“derivatives”). The fund may use these derivatives to manage market or business risk, enhance the fund’s return, or hedge against adverse movements in currency exchange rates.
Principal Risks
The value of your investment in this fund will change daily, which means you could lose money. An investment in the fund is not a deposit of a bank and is not insured or guaranteed by the Federal Deposit Insurance Corporation or any other government agency. The principal risks of investing in this fund include:
Derivatives Risk—The use of derivatives involves additional risks and transaction costs which could leave the fund in a worse position than if it had not used these instruments. Derivatives may entail investment exposures that are greater than their cost would suggest. As a result, a small investment in derivatives could have a large impact on performance.
Equity Security Risk—Equity securities may decline significantly in price over short or extended periods of time, and such declines may occur in the equity market as a whole, or they may occur in only a particular country, company, industry, or sector of the market.
Investment Focus Risk—Different types of stocks tend to shift in and out of favor depending on market and economic conditions. The fund emphasizes a value style of investing and therefore seeks undervalued companies with characteristics for improved valuations; such companies are subject to the risk that the valuations never improve. Furthermore, because the fund focuses its investments in large-cap stocks, the fund may not benefit from gains in smaller cap sectors of the market.
Non-U.S./Emerging Markets Risk—Non-U.S. issuers or U.S. issuers with significant non-U.S. operations may be subject to risks in addition to those of issuers located in or that principally operate in the United States as a result of, among other things, political, social and economic developments abroad and different legal, regulatory and tax environments. These additional risks may be heightened for securities of issuers located in, or with significant operations in, emerging market countries. Also, changes in currency exchange rates may affect the fund’s net asset value, the value of dividends and interest earned, and gains and losses realized on the sale of securities.
Fund Performance
The following bar chart and table provide some indication of the potential risks of investing in the fund. The fund’s past performance (before and after taxes) is not necessarily an indication of how the fund will perform in the future. Updated performance information is available at www.nuveen.com/MF/products/performancesummary.aspx or by calling (800) 257-8787.
Section 1 Fund Summaries
31
The bar chart below shows the variability of the fund’s performance from year to year for Class A shares. The performance of the other share classes will differ due to their different expense structures. The bar chart and highest/lowest quarterly returns that follow do not reflect sales charges, and if these charges were reflected, the returns would be less than those shown.
Class A Annual Total Return

During the ten-year period ended December 31, 2011, the fund’s highest and lowest quarterly returns were 15.62% and –19.74%, respectively, for the quarters ended September 30, 2009 and December 31, 2008.
The table below shows the variability of the fund’s average annual returns and how they compare over the time periods indicated with those of a broad measure of market performance and an index of funds with similar investment objectives. All after-tax returns are calculated using the historical highest individual federal marginal income tax rates and do not reflect the impact of state and local taxes. After-tax returns are shown for Class A shares only; after-tax returns for other share classes will vary. Your own actual after-tax returns will depend on your specific tax situation and may differ from what is shown here. After-tax returns are not relevant to investors who hold fund shares in tax-deferred accounts such as IRAs or employer-sponsored retirement plans.
Both the bar chart and the table assume that all distributions have been reinvested. Performance reflects fee waivers, if any, in effect during the periods presented. If any such waivers were not in place, returns would be reduced.
Prior to July 1, 2004, Class R3 shares were designated Class S shares, which had lower fees and expenses. The performance information in the table prior to July 1, 2004 is based on the performance of the Class S shares. If current fees and expenses had been in effect, performance would have been lower.
| | | | | | | | | | | | | | | | |
| | | | | | Average Annual Total Returns
for the Periods Ended December 31, 2011 | |
| | | Inception Date | | | 1 Year | | | 5 Years | | | 10 Years | |
| Class A (return before taxes) | | | 12/22/87 | | | | (9.32 | )% | | | (4.50 | )% | | | 1.21 | % |
| Class A (return after taxes on distributions) | | | | | | | (9.38 | )% | | | (5.16 | )% | | | 0.55 | % |
| Class A (return after taxes on distributions and sale of fund shares) | | | | | | | (5.99 | )% | | | (3.83 | )% | | | 0.94 | % |
| Class C (return before taxes) | | | 2/1/99 | | | | (4.53 | )% | | | (4.09 | )% | | | 1.04 | % |
| Class R3 (return before taxes) | | | 9/24/01 | | | | (4.06 | )% | | | (3.61 | )% | | | 1.61 | % |
| Class I (return before taxes) | | | 2/4/94 | | | | (3.60 | )% | | | (3.13 | )% | | | 2.07 | % |
| Russell 1000® Value Index (reflects no deduction for fees, expenses or taxes) | | | | | | | 0.39 | % | | | (2.64 | )% | | | 3.89 | % |
Lipper Large-Cap Value Classification Average
(reflects no deduction for taxes or certain expenses) | | | | | | | (2.15 | )% | | | (2.67 | )% | | | 2.87 | % |
32
Section 1 Fund Summaries
Management
Investment Adviser
Nuveen Fund Advisors, Inc.
Sub-Adviser
Nuveen Asset Management, LLC
Portfolio Managers
| | | | |
Name | | Title | | Portfolio Manager of Fund Since |
| | |
| Cori B. Johnson, CFA | | Senior Vice President | | April 2012 |
| Gerald C. Bren, CFA | | Senior Vice President | | April 2012 |
| Derek M. Sadowsky | | Vice President | | April 2012 |
Purchase and Sale of Fund Shares
You may purchase, redeem or exchange shares of the fund on any business day, which is any day the New York Stock Exchange is open for business. You may purchase, redeem or exchange shares of the fund either through a financial advisor or other financial intermediary or directly from the fund. The fund’s initial and subsequent investment minimums generally are as follows, although the fund may reduce or waive the minimums in some cases:
| | | | | | |
| | | Class A and Class C | | Class R3 | | Class I |
| Eligibility and Minimum Initial Investment | | $3,000 for all accounts except: • $2,500 for Traditional/Roth IRA accounts. • $2,000 for Coverdell Education Savings Accounts. • $250 for accounts opened through fee-based programs. • No minimum for retirement plans. | | Available only through certain retirement plans. No minimum. | | Available only through fee-based programs and certain retirement plans, and to other limited categories of investors as described in the prospectus. $100,000 for all accounts except: • $250 for clients of financial intermediaries and family offices that have accounts holding Class I shares with an aggregate value of at least $100,000 (or that are expected to reach this level). • No minimum for eligible retirement plans and certain other categories of eligible investors as described in the prospectus. |
Minimum
Additional Investment | | $100 | | No minimum. | | No minimum. |
Tax Information
The fund’s distributions are taxable and will generally be taxed as ordinary income or capital gains.
Payments to Broker-Dealers and Other Financial Intermediaries
If you purchase shares of the fund through a broker-dealer or other financial intermediary (such as a bank or financial advisor), the fund, its distributor or its investment adviser may pay the intermediary for the sale of fund shares and related services. These payments may create a conflict of interest by influencing the broker-dealer or other financial intermediary and your salesperson to recommend the fund over another investment. Ask your financial advisor or visit your financial intermediary’s website for more information.
Section 1 Fund Summaries
33
Nuveen Mid Cap Growth Opportunities Fund
Investment Objective
The investment objective of the fund is capital appreciation.
Fees and Expenses of the Fund
This table describes the fees and expenses that you may pay if you buy and hold shares of the fund. You may qualify for sales charge discounts if you and your family invest, or agree to invest in the future, at least $50,000 in the fund or in other Nuveen Mutual Funds. More information about these and other discounts, as well as eligibility requirements for each share class, is available from your financial advisor and in “What Share Classes We Offer” on page 92 of the fund’s prospectus, “How to Reduce Your Sales Charge” on page 94 of the prospectus and “Purchase and Redemption of Fund Shares” on page S-94 of the fund’s statement of additional information.
Shareholder Fees
(fees paid directly from your investment)
| | | | | | | | | | | | | | | | | | | | |
| | | Class A | | | Class B | | | Class C | | | Class R3 | | | Class I | |
Maximum Sales Charge (Load) Imposed on Purchases
(as a percentage of offering price) | | | 5.75% | | | | None | | | | None | | | | None | | | | None | |
Maximum Deferred Sales Charge (Load)
(as a percentage of the lesser of purchase price or redemption proceeds)1 | | | None | | | | 5.00% | | | | 1.00% | | | | None | | | | None | |
| Maximum Sales Charge (Load) Imposed on Reinvested Dividends | | | None | | | | None | | | | None | | | | None | | | | None | |
| Exchange Fee | | | None | | | | None | | | | None | | | | None | | | | None | |
| Annual Low Balance Account Fee (for accounts under $1,000)2 | | | $15 | | | | $15 | | | | $15 | | | | None | | | | $15 | |
Annual Fund Operating Expenses
(expenses that you pay each year as a percentage of the value of your investment)
| | | | | | | | | | | | | | | | | | | | |
| | | Class A | | | Class B | | | Class C | | | Class R3 | | | Class I | |
| Management Fees | | | 0.87% | | | | 0.87% | | | | 0.87% | | | | 0.87% | | | | 0.87% | |
| Distribution and/or Service (12b-1) Fees | | | 0.25% | | | | 1.00% | | | | 1.00% | | | | 0.50% | | | | 0.00% | |
| Other Expenses | | | 0.16% | | | | 0.16% | | | | 0.16% | | | | 0.16% | | | | 0.16% | |
| Total Annual Fund Operating Expenses3 | | | 1.28% | | | | 2.03% | | | | 2.03% | | | | 1.53% | | | | 1.03% | |
| 1 | The CDSC on Class B shares declines over a six-year period from purchase. The CDSC on Class C shares applies only to redemptions within 12 months of purchase. |
| 2 | Fee applies to the following types of accounts under $1,000 held directly with the fund: individual retirement accounts (IRAs), Coverdell Education Savings Accounts and accounts established pursuant to the Uniform Transfers to Minors Act (UTMA) or Uniform Gifts to Minors Act (UGMA). |
| 3 | Expenses have been restated to reflect current contractual fees and estimated other expenses. |
Example
The following example is intended to help you compare the cost of investing in the fund with the cost of investing in other mutual funds. The example assumes that you invest $10,000 in the fund for the time periods indicated and then either redeem or do not redeem your shares at the end of a period. The example also assumes that your investment has a 5% return each year and that the fund’s operating expenses remain the same. Although your actual costs may be higher or lower, based on these assumptions your costs would be:
| | | | | | | | | | | | | | | | | | | | | | | | | | | | | | | | | | | | | | | | | | | | |
| | | Redemption | | | | | No Redemption | | | |
| | | A | | | B | | | C | | | R3 | | | I | | | | | A | | | B | | | C | | | R3 | | | I | | | |
| 1 Year | | $ | 698 | | | $ | 706 | | | $ | 206 | | | $ | 156 | | | $ | 105 | | | | | $ | 698 | | | $ | 206 | | | $ | 206 | | | $ | 156 | | | $ | 105 | | | |
| 3 Years | | $ | 958 | | | $ | 937 | | | $ | 637 | | | $ | 483 | | | $ | 328 | | | | | $ | 958 | | | $ | 637 | | | $ | 637 | | | $ | 483 | | | $ | 328 | | | |
| 5 Years | | $ | 1,237 | | | $ | 1,193 | | | $ | 1,093 | | | $ | 834 | | | $ | 569 | | | | | $ | 1,237 | | | $ | 1,093 | | | $ | 1,093 | | | $ | 834 | | | $ | 569 | | | |
| 10 Years | | $ | 2,031 | | | $ | 2,166 | | | $ | 2,358 | | | $ | 1,824 | | | $ | 1,259 | | | | | $ | 2,031 | | | $ | 2,166 | | | $ | 2,358 | | | $ | 1,824 | | | $ | 1,259 | | | |
34
Section 1 Fund Summaries
Portfolio Turnover
The fund pays transaction costs, such as commissions, when it buys and sells securities (or “turns over” its portfolio). A higher portfolio turnover rate may indicate higher transaction costs and may result in higher taxes when fund shares are held in a taxable account. These costs, which are not reflected in annual fund operating expenses or in the example, affect the fund’s performance. During the most recent fiscal year, the fund’s portfolio turnover rate was 114% of the average value of its portfolio.
Principal Investment Strategies
Under normal market conditions, the fund invests at least 80% of net assets, plus the amount of any borrowings for investment purposes, in common stocks of mid-capitalization companies, defined as companies that have market capitalizations at the time of purchase within the market capitalization range of the companies in the Russell Midcap® Index immediately after its most recent reconstitution prior to such purchase. It is expected that reconstitution of the index will occur each year at the end of June. Immediately after the most recent reconstitution, the range was $520 million to $17.9 billion.
In selecting stocks, the fund’s sub-adviser invests in companies that it believes exhibit the potential for superior growth based on factors such as above-average growth in revenue and earnings, strong competitive position, strong management, and sound financial condition. The fund’s sub-adviser will generally sell a stock if the stock hits its price target, the company’s fundamentals or competitive position significantly deteriorate, or if a better alternative exists in the marketplace.
Under certain market conditions, the fund may frequently invest in companies at the time of their initial public offering.
The fund may invest up to 15% of its total assets in non-dollar denominated equity securities of non-U.S. issuers. In addition, the fund may invest up to 25% of its assets, collectively, in non-dollar denominated equity securities of non-U.S. issuers and in dollar-denominated equity securities of non-U.S. issuers that are either listed on a U.S. stock exchange or represented by depositary receipts that may or may not be sponsored by a domestic bank. Up to 15% of the fund’s total assets may be invested in equity securities of emerging market issuers. A country is considered to be an “emerging market” if it is defined as such by Morgan Stanley Capital International Inc.
The fund may utilize options, futures contracts, options on futures contracts, and forward foreign currency exchange contracts (“derivatives”). The fund may use these derivatives to manage market or business risk, enhance the fund’s return, or hedge against adverse movements in currency exchange rates.
Principal Risks
The value of your investment in this fund will change daily, which means you could lose money. An investment in the fund is not a deposit of a bank and is not insured or guaranteed by the Federal Deposit Insurance Corporation or any other government agency. The principal risks of investing in this fund include:
Derivatives Risk—The use of derivatives involves additional risks and transaction costs which could leave the fund in a worse position than if it had not used these instruments. Derivatives may entail investment exposures that are greater than their cost would suggest. As a result, a small investment in derivatives could have a large impact on performance.
Equity Security Risk—Equity securities may decline significantly in price over short or extended periods of time, and such declines may occur in the equity market as a whole, or they may occur in only a particular country, company, industry, or sector of the market.
Investment Focus Risk—Different types of stocks tend to shift in and out of favor depending on market and economic conditions. The fund emphasizes a growth style of investing and therefore seeks companies experiencing high rates of current growth; such companies may be more volatile than other types of investments.
Mid-Cap Stock Risk—Stocks of mid-cap companies may be subject to more abrupt or erratic market movements than those of larger, more established companies or the market averages in general.
Non-U.S./Emerging Markets Risk—Non-U.S. issuers or U.S. issuers with significant non-U.S. operations may be subject to risks in addition to those of issuers located in or that principally operate in the United States as a result of, among other things, political, social and economic developments abroad and different legal, regulatory and tax environments. These additional risks may be heightened for securities of issuers located in, or with significant operations in, emerging market countries. Also, changes in currency exchange rates may affect the fund’s net asset value, the value of dividends and interest earned, and gains and losses realized on the sale of securities.
Section 1 Fund Summaries
35
Fund Performance
The following bar chart and table provide some indication of the potential risks of investing in the fund. The fund’s past performance (before and after taxes) is not necessarily an indication of how the fund will perform in the future. Updated performance information is available at www.nuveen.com/MF/products/performancesummary.aspx or by calling (800) 257-8787.
The bar chart below shows the variability of the fund’s performance from year to year for Class A shares. The performance of the other share classes will differ due to their different expense structures. The bar chart and highest/lowest quarterly returns that follow do not reflect sales charges, and if these charges were reflected, the returns would be less than those shown.
Class A Annual Total Return
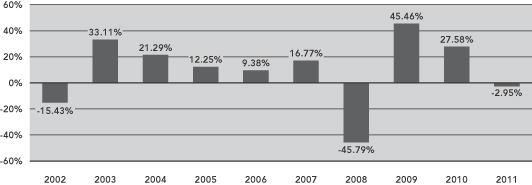
During the ten-year period ended December 31, 2011, the fund’s highest and lowest quarterly returns were 18.22% and –25.45%, respectively, for the quarters ended September 30, 2010 and December 31, 2008.
The table below shows the variability of the fund’s average annual returns and how they compare over the time periods indicated with those of a broad measure of market performance and an index of funds with similar investment objectives. All after-tax returns are calculated using the historical highest individual federal marginal income tax rates and do not reflect the impact of state and local taxes. After-tax returns are shown for Class A shares only; after-tax returns for other share classes will vary. Your own actual after-tax returns will depend on your specific tax situation and may differ from what is shown here. After-tax returns are not relevant to investors who hold fund shares in tax-deferred accounts such as IRAs or employer-sponsored retirement plans.
Both the bar chart and the table assume that all distributions have been reinvested. Performance reflects fee waivers, if any, in effect during the periods presented. If any such waivers were not in place, returns would be reduced.
Prior to July 1, 2004, Class R3 shares were designated Class S shares, which had lower fees and expenses. The performance information in the table prior to July 1, 2004 is based on the performance of the Class S shares. If current fees and expenses had been in effect, performance would have been lower.
| | | | | | | | | | | | | | | | |
| | | | | | Average Annual Total Returns
for the Periods Ended December 31, 2011 | |
| | | Inception
Date | | | 1 Year | | | 5 Years | | | 10 Years | |
| Class A (return before taxes) | | | 1/9/95 | | | | (8.53 | )% | | | 1.44 | % | | | 6.06 | % |
| Class A (return after taxes on distributions) | | | | | | | (9.10 | )% | | | 0.95 | % | | | 5.03 | % |
| Class A (return after taxes on distributions and sale of fund shares) | | | | | | | (4.82 | )% | | | 1.19 | % | | | 4.98 | % |
| Class B (return before taxes) | | | 3/1/99 | | | | (8.28 | )% | | | 1.71 | % | | | 5.89 | % |
| Class C (return before taxes) | | | 9/24/01 | | | | (3.68 | )% | | | 1.89 | % | | | 5.91 | % |
| Class R3 (return before taxes) | | | 12/11/00 | | | | (3.21 | )% | | | 2.40 | % | | | 6.49 | % |
| Class I (return before taxes) | | | 12/28/89 | | | | (2.72 | )% | | | 2.91 | % | | | 6.96 | % |
Russell Midcap® Growth Index (reflects no
deduction for fees, expenses or taxes) | | | | | | | (1.65 | )% | | | 2.44 | % | | | 5.29 | % |
Lipper Multi-Cap Growth Classification Average
(reflects no deduction for taxes or certain expenses) | | | | | | | (3.59 | )% | | | 1.27 | % | | | 3.25 | % |
36
Section 1 Fund Summaries
Management
Investment Adviser
Nuveen Fund Advisors, Inc.
Sub-Adviser
Nuveen Asset Management, LLC
Portfolio Managers
| | | | |
Name | | Title | | Portfolio Manager of Fund Since |
James A. Diedrich, CFA | | Senior Vice President | | February 2006 |
Harold R. Goldstein | | Senior Vice President | | September 2005 |
Scott M. Mullinix, CFA | | Senior Vice President | | April 2006 |
Purchase and Sale of Fund Shares
You may purchase, redeem or exchange shares of the fund on any business day, which is any day the New York Stock Exchange is open for business. You may purchase, redeem or exchange shares of the fund either through a financial advisor or other financial intermediary or directly from the fund. Class B shares are available only through exchanges and dividend reinvestments by current Class B shareholders. The fund’s initial and subsequent investment minimums generally are as follows, although the fund may reduce or waive the minimums in some cases:
| | | | | | |
| | | Class A and Class C | | Class R3 | | Class I |
| Eligibility and Minimum Initial Investment | | $3,000 for all accounts except: • $2,500 for Traditional/Roth IRA accounts. • $2,000 for Coverdell Education Savings Accounts. • $250 for accounts opened through fee-based programs. • No minimum for retirement plans. | | Available only through certain retirement plans. No minimum. | | Available only through fee-based programs and certain retirement plans, and to other limited categories of investors as described in the prospectus. $100,000 for all accounts except: • $250 for clients of financial intermediaries and family offices that have accounts holding Class I shares with an aggregate value of at least $100,000 (or that are expected to reach this level). • No minimum for eligible retirement plans and certain other categories of eligible investors as described in the prospectus. |
| Minimum Additional Investment | | $100 | | No minimum. | | No minimum. |
Tax Information
The fund’s distributions are taxable and will generally be taxed as ordinary income or capital gains.
Payments to Broker-Dealers and Other Financial Intermediaries
If you purchase shares of the fund through a broker-dealer or other financial intermediary (such as a bank or financial advisor), the fund, its distributor or its investment adviser may pay the intermediary for the sale of fund shares and related services. These payments may create a conflict of interest by influencing the broker-dealer or other financial intermediary and your salesperson to recommend the fund over another investment. Ask your financial advisor or visit your financial intermediary’s website for more information.
Section 1 Fund Summaries
37
Nuveen Mid Cap Index Fund
Investment Objective
The investment objective of the fund is to provide investment results that correspond to the performance of the Standard & Poor’s MidCap 400® Index (S&P MidCap 400 Index).
Fees and Expenses of the Fund
This table describes the fees and expenses that you may pay if you buy and hold shares of the fund. You may qualify for sales charge discounts if you and your family invest, or agree to invest in the future, at least $50,000 in the fund or in other Nuveen Mutual Funds. More information about these and other discounts, as well as eligibility requirements for each share class, is available from your financial advisor and in “What Share Classes We Offer” on page 92 of the fund’s prospectus and “Purchase and Redemption of Fund Shares” on page S-94 of the fund’s statement of additional information.
Shareholder Fees
(fees paid directly from your investment)
| | | | | | | | | | | | | | | | |
| | | Class A | | | Class C | | | Class R3 | | | Class I | |
Maximum Sales Charge (Load) Imposed on Purchases
(as a percentage of offering price) | | | None | | | | None | | | | None | | | | None | |
Maximum Deferred Sales Charge (Load)
(as a percentage of the lesser of purchase price or redemption proceeds)1 | | | None | | | | 1.00% | | | | None | | | | None | |
| Maximum Sales Charge (Load) Imposed on Reinvested Dividends | | | None | | | | None | | | | None | | | | None | |
| Exchange Fee | | | None | | | | None | | | | None | | | | None | |
| Annual Low Balance Account Fee (for accounts under $1,000)2 | | | $15 | | | | $15 | | | | None | | | | $15 | |
Annual Fund Operating Expenses
(expenses that you pay each year as a percentage of the value of your investment)
| | | | | | | | | | | | | | | | |
| | | Class A | | | Class C | | | Class R3 | | | Class I | |
| Management Fees | | | 0.33% | | | | 0.33% | | | | 0.33% | | | | 0.33% | |
| Distribution and/or Service (12b-1) Fees | | | 0.25% | | | | 1.00% | | | | 0.50% | | | | 0.00% | |
| Other Expenses | | | 0.32% | | | | 0.32% | | | | 0.32% | | | | 0.32% | |
| Acquired Fund Fees and Expenses | | | 0.03% | | | | 0.03% | | | | 0.03% | | | | 0.03% | |
| Total Annual Fund Operating Expenses3 | | | 0.93% | | | | 1.68% | | | | 1.18% | | | | 0.68% | |
| Fee Waivers and/or Expense Reimbursements | | | (0.17)% | | | | (0.17)% | | | | (0.17)% | | | | (0.17)% | |
| Total Annual Fund Operating Expenses After Fee Waivers and/or Expense Reimbursements4 | | | 0.76% | | | | 1.51% | | | | 1.01% | | | | 0.51% | |
| 1 | The CDSC on Class C shares applies only to redemptions within 12 months of purchase. |
| 2 | Fee applies to the following types of accounts under $1,000 held directly with the fund: individual retirement accounts (IRAs), Coverdell Education Savings Accounts and accounts established pursuant to the Uniform Transfers to Minors Act (UTMA) or Uniform Gifts to Minors Act (UGMA). |
| 3 | Expenses have been restated to reflect current contractual fees and estimated other expenses. |
| 4 | The fund’s investment adviser has contractually agreed to waive fees and/or reimburse other fund expenses through February 28, 2013 so that total annual fund operating expenses, after fee waivers and/or expense reimbursements and excluding Acquired Fund Fees and Expenses, do not exceed 0.75%, 1.50%, 1.00%, and 0.50% for Class A, Class C, Class R3 and Class I shares, respectively. Fee waivers and/or expense reimbursements will not be terminated prior to that time without the approval of the fund’s board of directors. |
Example
The following example is intended to help you compare the cost of investing in the fund with the cost of investing in other mutual funds. The example assumes that you invest $10,000 in the fund for the time periods indicated and then either redeem or do not redeem your shares at the end of a period. The example also assumes that your investment has a 5% return each year, that the fund’s operating expenses remain the same, and the contractual fee waivers currently in place are not renewed beyond February 28, 2013. Although your actual costs may be higher or lower, based on these assumptions your costs would be:
| | | | | | | | | | | | | | | | | | | | | | | | | | | | | | | | | | | | |
| | | Redemption | | | | | No Redemption |
| | | A | | | C | | | R3 | | | I | | | | | A | | | C | | | R3 | | | I | | | |
| 1 Year | | $ | 78 | | | $ | 154 | | | $ | 103 | | | $ | 52 | | | | | $ | 78 | | | $ | 154 | | | $ | 103 | | | $ | 52 | | | |
| 3 Years | | $ | 279 | | | $ | 513 | | | $ | 358 | | | $ | 200 | | | | | $ | 279 | | | $ | 513 | | | $ | 358 | | | $ | 200 | | | |
| 5 Years | | $ | 498 | | | $ | 897 | | | $ | 633 | | | $ | 362 | | | | | $ | 498 | | | $ | 897 | | | $ | 633 | | | $ | 362 | | | |
| 10 Years | | $ | 1,127 | | | $ | 1,973 | | | $ | 1,417 | | | $ | 830 | | | | | $ | 1,127 | | | $ | 1,973 | | | $ | 1,417 | | | $ | 830 | | | |
38
Section 1 Fund Summaries
Portfolio Turnover
The fund pays transaction costs, such as commissions, when it buys and sells securities (or “turns over” its portfolio). A higher portfolio turnover rate may indicate higher transaction costs and may result in higher taxes when fund shares are held in a taxable account. These costs, which are not reflected in annual fund operating expenses or in the example, affect the fund’s performance. During the most recent fiscal year, the fund’s portfolio turnover rate was 23% of the average value of its portfolio.
Principal Investment Strategies
Under normal market conditions, the fund generally invests at least 90% of its net assets, plus the amount of any borrowings for investment purposes, in common stocks included in the S&P MidCap 400 Index. This index is an unmanaged market-value weighted index consisting of 400 stocks chosen for market size, liquidity, sector representation and other factors that represents the mid range sector of the U.S. stock market. Reconstitution of the index occurs both on a quarterly and ongoing basis. As of December 31, 2011, market capitalizations of companies in the S&P MidCap 400 Index ranged from approximately $490 million to $7.5 billion.
The fund’s sub-adviser believes that the fund’s objective can best be achieved by investing in common stocks of approximately 90% to 100% of the issues included in the S&P MidCap 400 Index, depending on the size of the fund. A computer program is used to identify which stocks should be purchased or sold in order to replicate, as closely as practicable, the composition of the S&P MidCap 400 Index.
Because the fund may not always hold all of the stocks included in the S&P MidCap 400 Index, and because the fund has expenses and the index does not, the fund will not duplicate the index’s performance precisely. However, the fund’s sub-adviser believes there should be a close correlation between the fund’s performance and that of the S&P MidCap 400 Index in both rising and falling markets. The fund will attempt to achieve a correlation between the performance of its portfolio and that of the S&P MidCap 400 Index of at least 95%, without taking into account expenses of the fund. A perfect correlation would be indicated by a figure of 100%, which would be achieved if the fund’s net asset value, including the value of its dividends and capital gains distributions, increased or decreased in exact proportion to changes in the S&P MidCap 400 Index. If the fund is unable to achieve a correlation of 95% over time, the fund’s board of directors will consider alternative strategies for the fund.
The fund may invest in stock index futures contracts, options on stock indices, and options on stock index futures (“derivatives”) on the S&P MidCap 400 Index. The fund makes these investments to maintain the liquidity needed to meet redemption requests, to increase the level of fund assets devoted to replicating the composition of the S&P MidCap 400 Index, and to reduce transaction costs.
Principal Risks
The value of your investment in this fund will change daily, which means you could lose money. An investment in the fund is not a deposit of a bank and is not insured or guaranteed by the Federal Deposit Insurance Corporation or any other government agency. The principal risks of investing in this fund include:
Derivatives Risk—The use of derivatives involves additional risks and transaction costs which could leave the fund in a worse position than if it had not used these instruments. Derivatives may entail investment exposures that are greater than their cost would suggest. As a result, a small investment in derivatives could have a large impact on performance.
Equity Security Risk—Equity securities may decline significantly in price over short or extended periods of time, and such declines may occur in the equity market as a whole, or they may occur in only a particular country, company, industry, or sector of the market.
Failure to Match Index Performance—The fund may not replicate the performance of the S&P MidCap 400 Index.
Mid-Cap Stock Risk—Stocks of mid-cap companies may be subject to more abrupt or erratic market movements than those of larger, more established companies or the market averages in general.
Section 1 Fund Summaries
39
Fund Performance
The following bar chart and table provide some indication of the potential risks of investing in the fund. The fund’s past performance (before and after taxes) is not necessarily an indication of how the fund will perform in the future. Updated performance information is available at www.nuveen.com/MF/products/performancesummary.aspx or by calling (800) 257-8787.
The bar chart below shows the variability of the fund’s performance from year to year for Class A shares. The performance of the other share classes will differ due to their different expense structures.
Class A Annual Total Return

During the ten-year period ended December 31, 2011, the fund’s highest and lowest quarterly returns were 19.81% and –25.52%, respectively, for the quarters ended September 30, 2009 and December 31, 2008.
The table below shows the variability of the fund’s average annual returns and how they compare over the time periods indicated with those of a broad measure of market performance and an index of funds with similar investment objectives. All after-tax returns are calculated using the historical highest individual federal marginal income tax rates and do not reflect the impact of state and local taxes. After-tax returns are shown for Class A shares only; after-tax returns for other share classes will vary. Your own actual after-tax returns will depend on your specific tax situation and may differ from what is shown here. After-tax returns are not relevant to investors who hold fund shares in tax-deferred accounts such as IRAs or employer-sponsored retirement plans.
Both the bar chart and the table assume that all distributions have been reinvested. Performance reflects fee waivers, if any, in effect during the periods presented. If any such waivers were not in place, returns would be reduced.
Prior to July 1, 2004, Class R3 shares were designated Class S shares, which had lower fees and expenses. The performance information in the table prior to July 1, 2004 is based on the performance of the Class S shares. If current fees and expenses had been in effect, performance would have been lower.
| | | | | | | | | | | | | | | | |
| | | | | | Average Annual Total Returns
for the Periods Ended December 31, 2011 | |
| | | Inception
Date | | | 1 Year | | | 5 Years | | | 10 Years | |
| Class A (return before taxes) | | | 11/4/99 | | | | (2.20 | )% | | | 2.84 | % | | | 6.42 | % |
| Class A (return after taxes on distributions) | | | | | | | (2.80 | )% | | | 2.01 | % | | | 5.60 | % |
| Class A (return after taxes on distributions and sale of fund shares) | | | | | | | (0.67 | )% | | | 2.28 | % | | | 5.43 | % |
| Class C (return before taxes) | | | 9/24/01 | | | | (3.00 | )% | | | 2.06 | % | | | 5.63 | % |
| Class R3 (return before taxes) | | | 11/27/00 | | | | (2.41 | )% | | | 2.59 | % | | | 6.21 | % |
| Class I (return before taxes) | | | 11/4/99 | | | | (1.94 | )% | | | 3.10 | % | | | 6.69 | % |
Standard & Poor’s MidCap 400® Index
(reflects no deduction for fees, expenses or taxes) | | | | | | | (1.73 | )% | | | 3.32 | % | | | 7.04 | % |
Lipper Mid-Cap Core Classification Average
(reflects no deduction for taxes or certain expenses) | | | | | | | (3.57 | )% | | | 1.11 | % | | | 5.32 | % |
40
Section 1 Fund Summaries
Management
Investment Adviser
Nuveen Fund Advisors, Inc.
Sub-Adviser
Nuveen Asset Management, LLC
Portfolio Managers
| | | | |
Name | | Title | | Portfolio Manager of Fund Since |
Walter A. French | | Senior Vice President | | March 2001 |
David A. Friar | | Assistant Vice President | | March 2001 |
Purchase and Sale of Fund Shares
You may purchase, redeem or exchange shares of the fund on any business day, which is any day the New York Stock Exchange is open for business. You may purchase, redeem or exchange shares of the fund either through a financial advisor or other financial intermediary or directly from the fund. The fund’s initial and subsequent investment minimums generally are as follows, although the fund may reduce or waive the minimums in some cases:
| | | | | | | | |
| | | Class A | | Class C | | Class R3 | | Class I |
| Eligibility and Minimum Initial Investment | | Available only through fee- based programs and certain retirement plans. $250 minimum for accounts opened through fee-based programs. No minimum for retirement plans. | | $3,000 for all accounts except: • $2,500 for Traditional/Roth IRA accounts. • $2,000 for Coverdell Education Savings Accounts. • $250 for accounts opened through fee-based programs. • No minimum for retirement plans. | | Available only through certain retirement plans. No minimum. | | Available only through fee-based programs and certain retirement plans, and to other limited categories of investors as described in the prospectus. $100,000 for all accounts except: • $250 for clients of financial intermediaries and family offices that have accounts holding Class I shares with an aggregate value of at least $100,000 (or that are expected to reach this level). • No minimum for eligible retirement plans and certain other categories of eligible investors as described in the prospectus. |
| Minimum Additional Investment | | $100 | | $100 | | No minimum. | | No minimum. |
Tax Information
The fund’s distributions are taxable and will generally be taxed as ordinary income or capital gains.
Payments to Broker-Dealers and Other Financial Intermediaries
If you purchase shares of the fund through a broker-dealer or other financial intermediary (such as a bank or financial advisor), the fund, its distributor or its investment adviser may pay the intermediary for the sale of fund shares and related services. These payments may create a conflict of interest by influencing the broker-dealer or other financial intermediary and your salesperson to recommend the fund over another investment. Ask your financial advisor or visit your financial intermediary’s website for more information.
Section 1 Fund Summaries
41
Nuveen Mid Cap Select Fund
Investment Objective
The investment objective of the fund is long-term growth of capital.
Fees and Expenses of the Fund
This table describes the fees and expenses that you may pay if you buy and hold shares of the fund. You may qualify for sales charge discounts if you and your family invest, or agree to invest in the future, at least $50,000 in the fund or in other Nuveen Mutual Funds. More information about these and other discounts, as well as eligibility requirements for each share class, is available from your financial advisor and in “What Share Classes We Offer” on page 92 of the fund’s prospectus, “How to Reduce Your Sales Charge” on page 94 of the prospectus and “Purchase and Redemption of Fund Shares” on page S-94 of the fund’s statement of additional information.
Shareholder Fees
(fees paid directly from your investment)
| | | | | | | | | | | | |
| | | Class A | | | Class C | | | Class I | |
Maximum Sales Charge (Load) Imposed on Purchases
(as a percentage of offering price) | | | 5.75% | | | | None | | | | None | |
Maximum Deferred Sales Charge (Load) (as a percentage of the lesser of purchase price or redemption proceeds)1 | | | None | | | | 1.00% | | | | None | |
| Maximum Sales Charge (Load) Imposed on Reinvested Dividends | | | None | | | | None | | | | None | |
| Exchange Fee | | | None | | | | None | | | | None | |
| Annual Low Balance Account Fee (for accounts under $1,000)2 | | | $15 | | | | $15 | | | | $15 | |
Annual Fund Operating Expenses
(expenses that you pay each year as a percentage of the value of your investment)
| | | | | | | | | | | | |
| | | Class A | | | Class C | | | Class I | |
| Management Fees | | | 0.90% | | | | 0.90% | | | | 0.90% | |
| Distribution and/or Service (12b-1) Fees | | | 0.25% | | | | 1.00% | | | | 0.00% | |
| Other Expenses | | | 0.69% | | | | 0.69% | | | | 0.69% | |
| Total Annual Fund Operating Expenses3 | | | 1.84% | | | | 2.59% | | | | 1.59% | |
| Fee Waivers and/or Expense Reimbursements | | | (0.43)% | | | | (0.43)% | | | | (0.43)% | |
| Total Annual Fund Operating Expenses After Fee Waivers and/or Expense Reimbursements4 | | | 1.41% | | | | 2.16% | | | | 1.16% | |
| 1 | The CDSC on Class C shares applies only to redemptions within 12 months of purchase. |
| 2 | Fee applies to the following types of accounts under $1,000 held directly with the fund: individual retirement accounts (IRAs), Coverdell Education Savings Accounts and accounts established pursuant to the Uniform Transfers to Minors Act (UTMA) or Uniform Gifts to Minors Act (UGMA). |
| 3 | Expenses have been restated to reflect current contractual fees and estimated other expenses. |
| 4 | The fund’s investment adviser has contractually agreed to waive fees and/or reimburse other fund expenses through February 28, 2013 so that total annual fund operating expenses, after fee waivers and/or expense reimbursements and excluding Acquired Fund Fees and Expenses, do not exceed 1.41%, 2.16%, and 1.16% for Class A, Class C and Class I shares, respectively. Fee waivers and/or expense reimbursements will not be terminated prior to that time without the approval of the fund’s board of directors. |
Example
The following example is intended to help you compare the cost of investing in the fund with the cost of investing in other mutual funds. The example assumes that you invest $10,000 in the fund for the time periods indicated and then either redeem or do not redeem your shares at the end of a period. The example also assumes that your investment has a 5% return each year, that the fund’s operating expenses remain the same, and the contractual fee waivers currently in place are not renewed beyond February 28, 2013. Although your actual costs may be higher or lower, based on these assumptions your costs would be:
| | | | | | | | | | | | | | | | | | | | | | | | | | | | |
| | | Redemption | | No Redemption |
| | | A | | | C | | | I | | | | | A | | | C | | | I | | | |
| 1 Year | | $ | 710 | | | $ | 219 | | | $ | 118 | | | | | $ | 710 | | | $ | 219 | | | $ | 118 | | | |
| 3 Years | | $ | 1,081 | | | $ | 765 | | | $ | 460 | | | | | $ | 1,081 | | | $ | 765 | | | $ | 460 | | | |
| 5 Years | | $ | 1,476 | | | $ | 1,337 | | | $ | 825 | | | | | $ | 1,476 | | | $ | 1,337 | | | $ | 825 | | | |
| 10 Years | | $ | 2,576 | | | $ | 2,893 | | | $ | 1,853 | | | | | $ | 2,576 | | | $ | 2,893 | | | $ | 1,853 | | | |
42
Section 1 Fund Summaries
Portfolio Turnover
The fund pays transaction costs, such as commissions, when it buys and sells securities (or “turns over” its portfolio). A higher portfolio turnover rate may indicate higher transaction costs and may result in higher taxes when fund shares are held in a taxable account. These costs, which are not reflected in annual fund operating expenses or in the example, affect the fund’s performance. During the most recent fiscal year, the fund’s portfolio turnover rate was 148% of the average value of its portfolio.
Principal Investment Strategies
Under normal market conditions, the fund invests at least 80% of net assets, plus the amount of any borrowings for investment purposes, in common stocks of mid-capitalization companies, defined as companies that have market capitalizations at the time of purchase within the market capitalization range of the companies in the Russell Midcap® Index immediately after its most recent reconstitution prior to such purchase. It is expected that reconstitution of the index will occur each year at the end of June. Immediately after the most recent reconstitution, the range was $520 million to $17.9 billion.
In selecting stocks, the fund’s sub-adviser invests in companies that it believes meet one or more of the following criteria:
| • | | Attractively valued relative to other companies in the same industry or market. |
| • | | Strong or improving cash flows, revenue and earnings growth, or other fundamentals. |
| • | | Strong competitive position. |
| • | | An identifiable catalyst that could increase the value of the company’s stock over the next one or two years. |
The fund’s sub-adviser will generally sell a stock if the stock hits its price target, the company’s fundamentals or competitive position significantly deteriorate, or if a better alternative exists in the marketplace.
The fund may invest up to 15% of its total assets in non-dollar denominated equity securities of non-U.S. issuers. In addition, the fund may invest up to 25% of its assets, collectively, in non-dollar denominated equity securities of non-U.S. issuers and in dollar-denominated equity securities of non-U.S. issuers that are either listed on a U.S. stock exchange or represented by depositary receipts that may or may not be sponsored by a domestic bank. Up to 15% of the fund’s total assets may be invested in equity securities of emerging market issuers. A country is considered to be an “emerging market” if it is defined as such by Morgan Stanley Capital International Inc.
The fund may utilize options, futures contracts, options on futures contracts, and forward foreign currency exchange contracts (“derivatives”). The fund may use these derivatives to manage market or business risk, enhance the fund’s return, or hedge against adverse movements in currency exchange rates.
Principal Risks
The value of your investment in this fund will change daily, which means you could lose money. An investment in the fund is not a deposit of a bank and is not insured or guaranteed by the Federal Deposit Insurance Corporation or any other government agency. The principal risks of investing in this fund include:
Derivatives Risk—The use of derivatives involves additional risks and transaction costs which could leave the fund in a worse position than if it had not used these instruments. Derivatives may entail investment exposures that are greater than their cost would suggest. As a result, a small investment in derivatives could have a large impact on performance.
Equity Security Risk—Equity securities may decline significantly in price over short or extended periods of time, and such declines may occur in the equity market as a whole, or they may occur in only a particular country, company, industry, or sector of the market.
Mid-Cap Stock Risk—Stocks of mid-cap companies may be subject to more abrupt or erratic market movements than those of larger, more established companies or the market averages in general.
Non-U.S./Emerging Markets Risk—Non-U.S. issuers or U.S. issuers with significant non-U.S. operations may be subject to risks in addition to those of issuers located in or that principally operate in the United States as a result of, among other things, political, social and economic developments abroad and different legal, regulatory and tax environments. These additional risks may be heightened for securities of issuers located in, or with significant operations in, emerging market countries. Also, changes in currency exchange rates may affect the fund’s net asset value, the value of dividends and interest earned, and gains and losses realized on the sale of securities.
Section 1 Fund Summaries
43
Fund Performance
The following bar chart and table provide some indication of the potential risks of investing in the fund. The fund’s past performance (before and after taxes) is not necessarily an indication of how the fund will perform in the future. Updated performance information is available at www.nuveen.com/MF/products/performancesummary.aspx or by calling (800) 257-8787.
The bar chart below shows the variability of the fund’s performance from year to year for Class A shares. The performance of the other share classes will differ due to their different expense structures. The bar chart and highest/lowest quarterly returns that follow do not reflect sales charges, and if these charges were reflected, the returns would be less than those shown.
Class A Annual Total Return
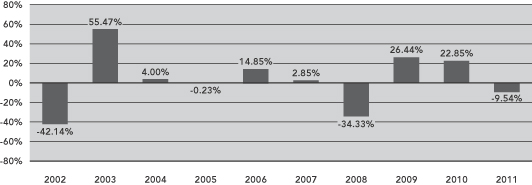
During the ten-year period ended December 31, 2011, the fund’s highest and lowest quarterly returns were 28.88% and –29.44%, respectively, for the quarters ended June 30, 2003 and September 30, 2002.
The table below shows the variability of the fund’s average annual returns and how they compare over the time periods indicated with those of a broad measure of market performance and an index of funds with similar investment objectives. All after-tax returns are calculated using the historical highest individual federal marginal income tax rates and do not reflect the impact of state and local taxes. After-tax returns are shown for Class A shares only; after-tax returns for other share classes will vary. Your own actual after-tax returns will depend on your specific tax situation and may differ from what is shown here. After-tax returns are not relevant to investors who hold fund shares in tax-deferred accounts such as IRAs or employer-sponsored retirement plans.
Both the bar chart and the table assume that all distributions have been reinvested. Performance reflects fee waivers, if any, in effect during the periods presented. If any such waivers were not in place, returns would be reduced.
Performance for periods prior to May 4, 2009 reflects the fund’s operation using different investment strategies than are currently in place. Effective October 3, 2005, the fund’s principal investment strategy was changed from investing primarily in technology stocks to investing primarily in common stocks of small- and mid-capitalization companies, and the fund’s name changed from First American Technology Fund to First American Small-Mid Cap Core Fund. Thereafter, effective May 4, 2009, the fund’s principal investment strategy was changed from investing primarily in common stocks of small- and mid-capitalization companies to investing primarily in common stocks of mid-capitalization companies, and the fund’s name changed from First American Small-Mid Cap Core Fund to First American Mid Cap Select Fund.
44
Section 1 Fund Summaries
| | | | | | | | | | | | | | | | |
| | | | | | Average Annual Total Returns
for the Periods Ended
December 31, 2011 | |
| | | Inception
Date | | | 1 Year | | | 5 Years | | | 10 Years | |
| Class A (return before taxes) | | | 4/4/94 | | | | (14.77 | )% | | | (2.21 | )% | | | (0.42 | )% |
| Class A (return after taxes on distributions) | | | | | | | (14.77 | )% | | | (2.22 | )% | | | (0.43 | )% |
| Class A (return after taxes on distributions and sale of fund shares) | | | | | | | (9.60 | )% | | | (1.87 | )% | | | (0.36 | )% |
| Class C (return before taxes) | | | 2/1/00 | | | | (10.22 | )% | | | (1.78 | )% | | | (0.58 | )% |
| Class I (return before taxes) | | | 4/4/94 | | | | (9.33 | )% | | | (0.78 | )% | | | 0.43 | % |
| Russell Midcap® Index (reflects no deduction for fees, expenses or taxes) | | | | | | | (1.55 | )% | | | 1.41 | % | | | 6.99 | % |
Lipper Mid-Cap Growth Classification Average
(reflects no deduction for taxes or certain expenses) | | | | | | | (4.30 | )% | | | 2.19 | % | | | 4.36 | % |
Management
Investment Adviser
Nuveen Fund Advisors, Inc.
Sub-Adviser
Nuveen Asset Management, LLC
Portfolio Managers
| | | | |
Name | | Title | | Portfolio Manager of Fund Since |
| | |
| Anthony R. Burger, CFA | | Senior Vice President | | May 2005 |
| Scott M. Tonneson, CFA | | Vice President | | February 2012 |
Purchase and Sale of Fund Shares
You may purchase, redeem or exchange shares of the fund on any business day, which is any day the New York Stock Exchange is open for business. You may purchase, redeem or exchange shares of the fund either through a financial advisor or other financial intermediary or directly from the fund. The fund’s initial and subsequent investment minimums generally are as follows, although the fund may reduce or waive the minimums in some cases:
| | | | |
| | | Class A and Class C | | Class I |
| Eligibility and Minimum Initial Investment | | $3,000 for all accounts except: • $2,500 for Traditional/Roth IRA accounts. • $2,000 for Coverdell Education Savings Accounts. • $250 for accounts opened through fee-based programs. • No minimum for retirement plans. | | Available only through fee-based programs and certain retirement plans, and to other limited categories of investors as described in the prospectus. $100,000 for all accounts except: • $250 for clients of financial intermediaries and family offices that have accounts holding Class I shares with an aggregate value of at least $100,000 (or that are expected to reach this level). • No minimum for eligible retirement plans and certain other categories of eligible investors as described in the prospectus. |
| Minimum Additional Investment | | $100 | | No minimum. |
Section 1 Fund Summaries
45
Tax Information
The fund’s distributions are taxable and will generally be taxed as ordinary income or capital gains.
Payments to Broker-Dealers and Other Financial Intermediaries
If you purchase shares of the fund through a broker-dealer or other financial intermediary (such as a bank or financial advisor), the fund, its distributor or its investment adviser may pay the intermediary for the sale of fund shares and related services. These payments may create a conflict of interest by influencing the broker-dealer or other financial intermediary and your salesperson to recommend the fund over another investment. Ask your financial advisor or visit your financial intermediary’s website for more information.
46
Section 1 Fund Summaries
Nuveen Mid Cap Value Fund
Investment Objective
The investment objective of the fund is capital appreciation.
Fees and Expenses of the Fund
This table describes the fees and expenses that you may pay if you buy and hold shares of the fund. You may qualify for sales charge discounts if you and your family invest, or agree to invest in the future, at least $50,000 in the fund or in other Nuveen Mutual Funds. More information about these and other discounts, as well as eligibility requirements for each share class, is available from your financial advisor and in “What Share Classes We Offer” on page 92 of the fund’s prospectus, “How to Reduce Your Sales Charge” on page 94 of the prospectus and “Purchase and Redemption of Fund Shares” on page S-94 of the fund’s statement of additional information.
Shareholder Fees
(fees paid directly from your investment)
| | | | | | | | | | | | | | | | | | | | |
| | | Class A | | | Class B | | | Class C | | | Class R3 | | | Class I | |
Maximum Sales Charge (Load) Imposed on Purchases
(as a percentage of offering price) | | | 5.75% | | | | None | | | | None | | | | None | | | | None | |
Maximum Deferred Sales Charge (Load)
(as a percentage of the lesser of purchase price or redemption proceeds)1 | | | None | | | | 5.00% | | | | 1.00% | | | | None | | | | None | |
| Maximum Sales Charge (Load) Imposed on Reinvested Dividends | | | None | | | | None | | | | None | | | | None | | | | None | |
| Exchange Fee | | | None | | | | None | | | | None | | | | None | | | | None | |
| Annual Low Balance Account Fee (for accounts under $1,000)2 | | | $15 | | | | $15 | | | | $15 | | | | None | | | | $15 | |
Annual Fund Operating Expenses
(expenses that you pay each year as a percentage of the value of your investment)
| | | | | | | | | | | | | | | | | | | | |
| | | Class A | | | Class B | | | Class C | | | Class R3 | | | Class I | |
| Management Fees | | | 0.89% | | | | 0.89% | | | | 0.89% | | | | 0.89% | | | | 0.89% | |
| Distribution and/or Service (12b-1) Fees | | | 0.25% | | | | 1.00% | | | | 1.00% | | | | 0.50% | | | | 0.00% | |
| Other Expenses | | | 0.18% | | | | 0.18% | | | | 0.18% | | | | 0.18% | | | | 0.18% | |
| Total Annual Fund Operating Expenses3 | | | 1.32% | | | | 2.07% | | | | 2.07% | | | | 1.57% | | | | 1.07% | |
| 1 | The CDSC on Class B shares declines over a six-year period from purchase. The CDSC on Class C shares applies only to redemptions within 12 months of purchase. |
| 2 | Fee applies to the following types of accounts under $1,000 held directly with the fund: individual retirement accounts (IRAs), Coverdell Education Savings Accounts and accounts established pursuant to the Uniform Transfers to Minors Act (UTMA) or Uniform Gifts to Minors Act (UGMA). |
| 3 | Expenses have been restated to reflect current contractual fees and estimated other expenses. |
Example
The following example is intended to help you compare the cost of investing in the fund with the cost of investing in other mutual funds. The example assumes that you invest $10,000 in the fund for the time periods indicated and then either redeem or do not redeem your shares at the end of a period. The example also assumes that your investment has a 5% return each year and that the fund’s operating expenses remain the same. Although your actual costs may be higher or lower, based on these assumptions your costs would be:
| | | | | | | | | | | | | | | | | | | | | | | | | | | | | | | | | | | | | | | | | | | | |
| | | Redemption | | | | | No Redemption | | | |
| | | A | | | B | | | C | | | R3 | | | I | | | | | A | | | B | | | C | | | R3 | | | I | | | |
| 1 Year | | $ | 702 | | | $ | 710 | | | $ | 210 | | | $ | 160 | | | $ | 109 | | | | | $ | 702 | | | $ | 210 | | | $ | 210 | | | $ | 160 | | | $ | 109 | | | |
| 3 Years | | $ | 969 | | | $ | 949 | | | $ | 649 | | | $ | 496 | | | $ | 340 | | | | | $ | 969 | | | $ | 649 | | | $ | 649 | | | $ | 496 | | | $ | 340 | | | |
| 5 Years | | $ | 1,257 | | | $ | 1,214 | | | $ | 1,114 | | | $ | 855 | | | $ | 590 | | | | | $ | 1,257 | | | $ | 1,114 | | | $ | 1,114 | | | $ | 855 | | | $ | 590 | | | |
| 10 Years | | $ | 2,074 | | | $ | 2,208 | | | $ | 2,400 | | | $ | 1,867 | | | $ | 1,306 | | | | | $ | 2,074 | | | $ | 2,208 | | | $ | 2,400 | | | $ | 1,867 | | | $ | 1,306 | | | |
Section 1 Fund Summaries
47
Portfolio Turnover
The fund pays transaction costs, such as commissions, when it buys and sells securities (or “turns over” its portfolio). A higher portfolio turnover rate may indicate higher transaction costs and may result in higher taxes when fund shares are held in a taxable account. These costs, which are not reflected in annual fund operating expenses or in the example, affect the fund’s performance. During the most recent fiscal year, the fund’s portfolio turnover rate was 123% of the average value of its portfolio.
Principal Investment Strategies
Under normal market conditions, the fund invests at least 80% of net assets, plus the amount of any borrowings for investment purposes, in common stocks of mid-capitalization companies, defined as companies that have market capitalizations at the time of purchase within the market capitalization range of the companies in the Russell Midcap® Index immediately after its most recent reconstitution prior to such purchase. It is expected that reconstitution of the index will occur each year at the end of June. Immediately after the most recent reconstitution, the range was $520 million to $17.9 billion.
In selecting stocks, the fund’s sub-adviser invests in companies that it believes are undervalued relative to other companies in the same industry or market, exhibit good or improving fundamentals, and exhibit an identifiable catalyst that could close the gap between market value and fair value over the next one to two years. The fund’s sub-adviser will generally sell a stock if the stock hits its price target, the company’s fundamentals or competitive position significantly deteriorate, or if a better alternative exists in the marketplace.
The fund may invest up to 15% of its total assets in non-dollar denominated equity securities of non-U.S. issuers. In addition, the fund may invest up to 25% of its assets, collectively, in non-dollar denominated equity securities of non-U.S. issuers and in dollar-denominated equity securities of non-U.S. issuers that are either listed on a U.S. stock exchange or represented by depositary receipts that may or may not be sponsored by a domestic bank. Up to 15% of the fund’s total assets may be invested in equity securities of emerging market issuers. A country is considered to be an “emerging market” if it is defined as such by Morgan Stanley Capital International Inc.
The fund may utilize options, futures contracts, options on futures contracts, and forward foreign currency exchange contracts (“derivatives”). The fund may use these derivatives to manage market or business risk, enhance the fund’s return, or hedge against adverse movements in currency exchange rates.
Principal Risks
The value of your investment in this fund will change daily, which means you could lose money. An investment in the fund is not a deposit of a bank and is not insured or guaranteed by the Federal Deposit Insurance Corporation or any other government agency. The principal risks of investing in this fund include:
Derivatives Risk—The use of derivatives involves additional risks and transaction costs which could leave the fund in a worse position than if it had not used these instruments. Derivatives may entail investment exposures that are greater than their cost would suggest. As a result, a small investment in derivatives could have a large impact on performance.
Equity Security Risk—Equity securities may decline significantly in price over short or extended periods of time, and such declines may occur in the equity market as a whole, or they may occur in only a particular country, company, industry, or sector of the market.
Investment Focus Risk—Different types of stocks tend to shift in and out of favor depending on market and economic conditions. The fund emphasizes a value style of investing and therefore seeks undervalued companies with characteristics for improved valuations; such companies are subject to the risk that the valuations never improve.
Mid-Cap Stock Risk—Stocks of mid-cap companies may be subject to more abrupt or erratic market movements than those of larger, more established companies or the market averages in general.
Non-U.S./Emerging Markets Risk—Non-U.S. issuers or U.S. issuers with significant non-U.S. operations may be subject to risks in addition to those of issuers located in or that principally operate in the United States as a result of, among other things, political, social and economic developments abroad and different legal, regulatory and tax environments. These additional risks may be heightened for securities of issuers located in, or with significant operations in, emerging market countries. Also, changes in currency exchange rates may affect the fund’s net asset value, the value of dividends and interest earned, and gains and losses realized on the sale of securities.
48
Section 1 Fund Summaries
Fund Performance
The following bar chart and table provide some indication of the potential risks of investing in the fund. The fund’s past performance (before and after taxes) is not necessarily an indication of how the fund will perform in the future. Updated performance information is available at www.nuveen.com/MF/products/performancesummary.aspx or by calling (800) 257-8787.
The bar chart below shows the variability of the fund’s performance from year to year for Class A shares. The performance of the other share classes will differ due to their different expense structures. The bar chart and highest/lowest quarterly returns that follow do not reflect sales charges, and if these charges were reflected, the returns would be less than those shown.
Class A Annual Total Return
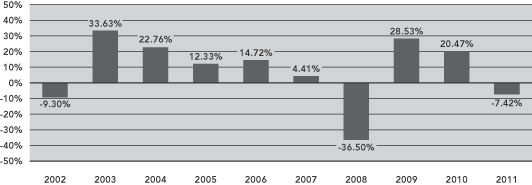
During the ten-year period ended December 31, 2011, the fund’s highest and lowest quarterly returns were 18.57% and –21.15%, respectively, for the quarters ended September 30, 2009 and September 30, 2011.
The table below shows the variability of the fund’s average annual returns and how they compare over the time periods indicated with those of a broad measure of market performance and an index of funds with similar investment objectives. All after-tax returns are calculated using the historical highest individual federal marginal income tax rates and do not reflect the impact of state and local taxes. After-tax returns are shown for Class A shares only; after-tax returns for other share classes will vary. Your own actual after-tax returns will depend on your specific tax situation and may differ from what is shown here. After-tax returns are not relevant to investors who hold fund shares in tax-deferred accounts such as IRAs or employer-sponsored retirement plans.
Both the bar chart and the table assume that all distributions have been reinvested. Performance reflects fee waivers, if any, in effect during the periods presented. If any such waivers were not in place, returns would be reduced.
Prior to July 1, 2004, Class R3 shares were designated Class S shares, which had lower fees and expenses. The performance information in the table prior to July 1, 2004 is based on the performance of the Class S shares. If current fees and expenses had been in effect, performance would have been lower.
| | | | | | | | | | | | | | | | |
| | | | | | Average Annual Total Returns
for the Periods Ended December 31, 2011 | |
| | | Inception
Date | | | 1 Year | | | 5 Years | | | 10 Years | |
| Class A (return before taxes) | | | 12/22/87 | | | | (12.74 | )% | | | (2.18 | )% | | | 5.56 | % |
| Class A (return after taxes on distributions) | | | | | | | (12.82 | )% | | | (2.60 | )% | | | 5.07 | % |
| Class A (return after taxes on distributions and sale of fund shares) | | | | | | | (8.18 | )% | | | (1.91 | )% | | | 4.77 | % |
| Class B (return before taxes) | | | 8/15/94 | | | | (12.70 | )% | | | (1.93 | )% | | | 5.40 | % |
| Class C (return before taxes) | | | 2/1/99 | | | | (8.14 | )% | | | (1.76 | )% | | | 5.39 | % |
| Class R3 (return before taxes) | | | 9/24/01 | | | | (7.65 | )% | | | (1.26 | )% | | | 5.99 | % |
| Class I (return before taxes) | | | 2/4/94 | | | | (7.22 | )% | | | (0.78 | )% | | | 6.45 | % |
| Russell Midcap® Value Index (reflects no deduction for fees, expenses or taxes) | | | | | | | (1.38 | )% | | | 0.04 | % | | | 7.67 | % |
Lipper Mid-Cap Value Classification Average
(reflects no deduction for taxes or certain expenses) | | | | | | | (4.65 | )% | | | (0.53 | )% | | | 5.84 | % |
Section 1 Fund Summaries
49
Management
Investment Adviser
Nuveen Fund Advisors, Inc.
Sub-Adviser
Nuveen Asset Management, LLC
Portfolio Managers
| | | | |
Name | | Title | | Portfolio Manager of Fund Since |
| | |
| David A. Chalupnik, CFA | | Managing Director | | April 2012 |
| Karen L. Bowie, CFA | | Senior Vice President | | April 2012 |
Purchase and Sale of Fund Shares
You may purchase, redeem or exchange shares of the fund on any business day, which is any day the New York Stock Exchange is open for business. You may purchase, redeem or exchange shares of the fund either through a financial advisor or other financial intermediary or directly from the fund. Class B shares are available only through exchanges and dividend reinvestments by current Class B shareholders. The fund’s initial and subsequent investment minimums generally are as follows, although the fund may reduce or waive the minimums in some cases:
| | | | | | |
| | | Class A and Class C | | Class R3 | | Class I |
Eligibility and
Minimum Initial
Investment | | $3,000 for all accounts except: • $2,500 for Traditional/Roth IRA accounts. • $2,000 for Coverdell Education Savings Accounts. • $250 for accounts opened through fee-based programs. • No minimum for retirement plans. | | Available only through certain retirement plans. No minimum. | | Available only through fee-based programs and certain retirement plans, and to other limited categories of investors as described in the prospectus. $100,000 for all accounts except: • $250 for clients of financial intermediaries and family offices that have accounts holding Class I shares with an aggregate value of at least $100,000 (or that are expected to reach this level). • No minimum for eligible retirement plans and certain other categories of eligible investors as described in the prospectus. |
| Minimum Additional Investment | | $100 | | No minimum. | | No minimum. |
Tax Information
The fund’s distributions are taxable and will generally be taxed as ordinary income or capital gains.
Payments to Broker-Dealers and Other Financial Intermediaries
If you purchase shares of the fund through a broker-dealer or other financial intermediary (such as a bank or financial advisor), the fund, its distributor or its investment adviser may pay the intermediary for the sale of fund shares and related services. These payments may create a conflict of interest by influencing the broker-dealer or other financial intermediary and your salesperson to recommend the fund over another investment. Ask your financial advisor or visit your financial intermediary’s website for more information.
50
Section 1 Fund Summaries
Nuveen Quantitative Enhanced Core Equity Fund
Investment Objective
The investment objective of the fund is to provide, over the long term, a total return that exceeds the total return of the Standard & Poor’s 500® Index (S&P 500 Index).
Fees and Expenses of the Fund
This table describes the fees and expenses that you may pay if you buy and hold shares of the fund. You may qualify for sales charge discounts if you and your family invest, or agree to invest in the future, at least $50,000 in the fund or in other Nuveen Mutual Funds. More information about these and other discounts, as well as eligibility requirements for each share class, is available from your financial advisor and in “What Share Classes We Offer” on page 92 of the fund’s prospectus and “Purchase and Redemption of Fund Shares” on page S-94 of the fund’s statement of additional information.
Shareholder Fees
(fees paid directly from your investment)
| | | | | | | | | | | | |
| | | Class A | | | Class C | | | Class I | |
Maximum Sales Charge (Load) Imposed on Purchases
(as a percentage of offering price) | | | None | | | | None | | | | None | |
Maximum Deferred Sales Charge (Load)
(as a percentage of the lesser of purchase price or redemption proceeds)1 | | | None | | | | 1.00% | | | | None | |
| Maximum Sales Charge (Load) Imposed on Reinvested Dividends | | | None | | | | None | | | | None | |
| Exchange Fee | | | None | | | | None | | | | None | |
| Annual Low Balance Account Fee (for accounts under $1,000)2 | | | $15 | | | | $15 | | | | $15 | |
Annual Fund Operating Expenses (expenses that you pay each year as a percentage of the value of your investment) | | | | | | | | | | | | |
| | | Class A | | | Class C | | | Class I | |
| Management Fees | | | 0.50% | | | | 0.50% | | | | 0.50% | |
| Distribution and/or Service (12b-1) Fees | | | 0.25% | | | | 1.00% | | | | 0.00% | |
| Other Expenses | | | 0.13% | | | | 0.13% | | | | 0.13% | |
| Acquired Fund Fees and Expenses | | | 0.01% | | | | 0.01% | | | | 0.01% | |
| Total Annual Fund Operating Expenses3 | | | 0.89% | | | | 1.64% | | | | 0.64% | |
| Fee Waivers and/or Expense Reimbursements | | | (0.18)% | | | | (0.18)% | | | | (0.18)% | |
| Total Annual Fund Operating Expenses After Fee Waivers and/or Expense Reimbursements4 | | | 0.71% | | | | 1.46% | | | | 0.46% | |
| 1 | The CDSC on Class C shares applies only to redemptions within 12 months of purchase. |
| 2 | Fee applies to the following types of accounts under $1,000 held directly with the fund: individual retirement accounts (IRAs), Coverdell Education Savings Accounts and accounts established pursuant to the Uniform Transfers to Minors Act (UTMA) or Uniform Gifts to Minors Act (UGMA). |
| 3 | Expenses have been restated to reflect current contractual fees and estimated other expenses. |
| 4 | The fund’s investment adviser has contractually agreed to waive fees and/or reimburse other fund expenses through February 28, 2013 so that total annual fund operating expenses, after fee waivers and/or expense reimbursements and excluding any Acquired Fund Fees and Expenses, do not exceed 0.70%, 1.45%, and 0.45% for Class A, Class C and Class I shares, respectively. Fee waivers and/or expense reimbursements will not be terminated prior to that time without the approval of the fund’s board of directors. |
Example
The following example is intended to help you compare the cost of investing in the fund with the cost of investing in other mutual funds. The example assumes that you invest $10,000 in the fund for the time periods indicated and then either redeem or do not redeem your shares at the end of a period. The example also assumes that your investment has a 5% return each year, that the fund’s operating expenses remain the same, and the contractual fee waivers currently in place are not renewed beyond February 28, 2013. Although your actual costs may be higher or lower, based on these assumptions your costs would be:
| | | | | | | | | | | | | | | | | | | | | | | | | | | | |
| | | Redemption | | No Redemption |
| | | A | | | C | | | I | | | | | A | | | C | | | I | | | |
| 1 Year | | $ | 73 | | | $ | 149 | | | $ | 47 | | | | | $ | 73 | | | $ | 149 | | | $ | 47 | | | |
| 3 Years | | $ | 266 | | | $ | 500 | | | $ | 187 | | | | | $ | 266 | | | $ | 500 | | | $ | 187 | | | |
| 5 Years | | $ | 475 | | | $ | 875 | | | $ | 339 | | | | | $ | 475 | | | $ | 875 | | | $ | 339 | | | |
| 10 Years | | $ | 1,080 | | | $ | 1,929 | | | $ | 781 | | | | | $ | 1,080 | | | $ | 1,929 | | | $ | 781 | | | |
Section 1 Fund Summaries
51
Portfolio Turnover
The fund pays transaction costs, such as commissions, when it buys and sells securities (or “turns over” its portfolio). A higher portfolio turnover rate may indicate higher transaction costs and may result in higher taxes when fund shares are held in a taxable account. These costs, which are not reflected in annual fund operating expenses or in the example, affect the fund’s performance. During the most recent fiscal year, the fund’s portfolio turnover rate was 159% of the average value of its portfolio.
Principal Investment Strategies
Under normal market conditions, the fund invests at least 80% of its net assets, plus the amount of any borrowings for investment purposes, in equity securities. The fund will seek to achieve its investment objective by primarily investing in companies that have market capitalizations at the time of purchase within the range of market capitalizations of companies in the S&P 500 Index. The S&P 500 Index is an unmanaged index of 500 stocks chosen for market size, liquidity and industry group representation, with a focus on the large cap segment of the market. The market capitalizations of companies in the S&P 500 Index ranged from approximately $1.2 billion to $406.3 billion as of December 31, 2011, with an average market capitalization of approximately $22.8 billion. Although the fund may from time to time emphasize smaller or larger capitalization companies within this range as a result of the quantitative process discussed below, the sub-adviser anticipates that generally the fund’s capitalization weightings will be similar to those of the S&P 500 Index. The fund’s investments may include common stocks of non-U.S. issuers which are listed on a U.S. stock exchange.
The fund is actively managed using a proprietary quantitative process which projects a stock’s performance based upon a variety of factors, such as the stock’s growth or value style, market capitalization, earnings volatility, earnings yield, financial leverage and currency sensitivity. This process tracks the historical performance of each of these factors against relevant economic and market variables, and then determines how each of the factors is expected to perform given today’s economic conditions. The process then measures the relative sensitivity of each of the stocks in the fund’s investable universe to the various factors and projects each stock’s performance based on this sensitivity. Stocks are selected for purchase or sale using an optimization formula which is designed to maximize the fund’s overall projected return within the constraints that have been established to limit the fund’s tracking error as compared to the S&P 500 Index.
The fund may buy and sell stock index futures contracts. The fund may use futures contracts to manage market or business risk or enhance the fund’s return. The fund may also invest in exchange-traded funds in order to reduce cash balances in the fund and increase the level of fund assets exposed to common stocks.
Principal Risks
The value of your investment in this fund will change daily, which means you could lose money. An investment in the fund is not a deposit of a bank and is not insured or guaranteed by the Federal Deposit Insurance Corporation or any other government agency. The principal risks of investing in this fund include:
Equity Security Risk—Equity securities may decline significantly in price over short or extended periods of time, and such declines may occur in the equity market as a whole, or they may occur in only a particular country, company, industry, or sector of the market.
Futures Contract Risk—The use of futures contracts involves additional risks and transaction costs which could leave the fund in a worse position than if it had not used these instruments. Futures contracts may entail investment exposures that are greater than their cost would suggest. As a result, a small investment in futures contracts could have a large impact on performance.
Non-U.S. Investment Risk—Non-U.S. issuers or U.S. issuers with significant non-U.S. operations may be subject to risks in addition to those of issuers located in or that principally operate in the United States as a result of, among other things, political, social and economic developments abroad and different legal, regulatory and tax environments. These additional risks may be heightened for securities of issuers located in, or with significant operations in, emerging market countries. Also, changes in currency exchange rates may affect the fund’s net asset value, the value of dividends and interest earned, and gains and losses realized on the sale of securities.
Other Investment Companies Risk—When the fund invests in other investment companies, you bear both your proportionate share of fund expenses and, indirectly, the expenses of the other investment companies.
52
Section 1 Fund Summaries
Fund Performance
The following bar chart and table provide some indication of the potential risks of investing in the fund. The fund’s past performance (before and after taxes) is not necessarily an indication of how the fund will perform in the future. Updated performance information is available at www.nuveen.com/MF/products/performancesummary.aspx or by calling (800) 257-8787.
The bar chart below shows the variability of the fund’s performance from year to year for Class A shares. The performance of the other share classes will differ due to their different expense structures.
Class A Annual Total Return
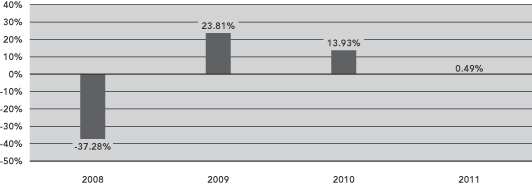
During the four-year period ended December 31, 2011, the fund’s highest and lowest quarterly returns were 14.99% and –20.58%, respectively, for the quarters ended June 30, 2009 and December 31, 2008.
The table below shows the variability of the fund’s average annual returns and how they compare over the time periods indicated with those of a broad measure of market performance and an index of funds with similar investment objectives. All after-tax returns are calculated using the historical highest individual federal marginal income tax rates and do not reflect the impact of state and local taxes. After-tax returns are shown for Class A shares only; after-tax returns for other share classes will vary. Your own actual after-tax returns will depend on your specific tax situation and may differ from what is shown here. After-tax returns are not relevant to investors who hold fund shares in tax-deferred accounts such as IRAs or employer-sponsored retirement plans.
Both the bar chart and the table assume that all distributions have been reinvested. Performance reflects fee waivers, if any, in effect during the periods presented. If any such waivers were not in place, returns would be reduced.
| | | | | | | | | | | | |
| | | | | | Average Annual Total Returns
for the Periods Ended
December 31, 2011 | |
| | | Inception
Date | | | 1 Year | | | Since
Inception | |
| Class A (return before taxes) | | | 7/31/07 | | | | 0.49 | % | | | (1.83 | )% |
| Class A (return after taxes on distributions) | | | | | | | (0.06 | )% | | | (2.18 | )% |
| Class A (return after taxes on distributions and sale of fund shares) | | | | | | | 0.94 | % | | | (1.60 | )% |
| Class C (return before taxes) | | | 7/31/07 | | | | (0.28 | )% | | | (2.55 | )% |
| Class I (return before taxes) | | | 7/31/07 | | | | 0.70 | % | | | (1.59 | )% |
| Standard & Poor’s 500® Index (reflects no deduction for fees, expenses or taxes) | | | | | | | 2.11 | % | | | (1.09 | )% |
Lipper Large-Cap Core Classification Average
(reflects no deduction for taxes or certain expenses) | | | | | | | (0.67 | )% | | | (1.91 | )% |
Section 1 Fund Summaries
53
Management
Investment Adviser
Nuveen Fund Advisors, Inc.
Sub-Adviser
Nuveen Asset Management, LLC
Portfolio Managers
| | | | |
Name | | Title | | Portfolio Manager of Fund Since |
| | |
| Walter A. French | | Senior Vice President | | July 2007 |
| David R. Cline | | Vice President | | July 2007 |
| David A. Friar | | Assistant Vice President | | July 2007 |
| Keith B. Hembre | | Managing Director | | July 2007 |
Purchase and Sale of Fund Shares
You may purchase, redeem or exchange shares of the fund on any business day, which is any day the New York Stock Exchange is open for business. You may purchase, redeem or exchange shares of the fund either through a financial advisor or other financial intermediary or directly from the fund. The fund’s initial and subsequent investment minimums generally are as follows, although the fund may reduce or waive the minimums in some cases:
| | | | | | |
| | | Class A | | Class C | | Class I |
| Eligibility and Minimum Initial Investment | | Available only through fee- based programs and certain retirement plans. $250 minimum for accounts opened through fee-based programs. No minimum for retirement plans. | | $3,000 for all accounts except: • $2,500 for Traditional/Roth IRA accounts. • $2,000 for Coverdell Education Savings Accounts. • $250 for accounts opened through fee-based programs. • No minimum for retirement plans. | | Available only through fee-based programs and certain retirement plans, and to other limited categories of investors as described in the prospectus. $100,000 for all accounts except: • $250 for clients of financial intermediaries and family offices that have accounts holding Class I shares with an aggregate value of at least $100,000 (or that are expected to reach this level). • No minimum for eligible retirement plans and certain other categories of eligible investors as described in the prospectus. |
| Minimum Additional Investment | | $100 | | $100 | | No minimum. |
Tax Information
The fund’s distributions are taxable and will generally be taxed as ordinary income or capital gains.
Payments to Broker-Dealers and Other Financial Intermediaries
If you purchase shares of the fund through a broker-dealer or other financial intermediary (such as a bank or financial advisor), the fund, its distributor or its investment adviser may pay the intermediary for the sale of fund shares and related services. These payments may create a conflict of interest by influencing the broker-dealer or other financial intermediary and your salesperson to recommend the fund over another investment. Ask your financial advisor or visit your financial intermediary’s website for more information.
54
Section 1 Fund Summaries
Nuveen Small Cap Growth Opportunities Fund
Investment Objective
The investment objective of the fund is growth of capital.
Fees and Expenses of the Fund
This table describes the fees and expenses that you may pay if you buy and hold shares of the fund. You may qualify for sales charge discounts if you and your family invest, or agree to invest in the future, at least $50,000 in the fund or in other Nuveen Mutual Funds. More information about these and other discounts, as well as eligibility requirements for each share class, is available from your financial advisor and in “What Share Classes We Offer” on page 92 of the fund’s prospectus, “How to Reduce Your Sales Charge” on page 94 of the prospectus and “Purchase and Redemption of Fund Shares” on page S-94 of the fund’s statement of additional information.
Shareholder Fees
(fees paid directly from your investment)
| | | | | | | | | | | | | | | | | | | | |
| | | Class A | | | Class B | | | Class C | | | Class R3 | | | Class I | |
Maximum Sales Charge (Load) Imposed on Purchases
(as a percentage of offering price) | | | 5.75% | | | | None | | | | None | | | | None | | | | None | |
Maximum Deferred Sales Charge (Load)
(as a percentage of the lesser of purchase price or redemption proceeds)1 | | | None | | | | 5.00% | | | | 1.00% | | | | None | | | | None | |
| Maximum Sales Charge (Load) Imposed on Reinvested Dividends | | | None | | | | None | | | | None | | | | None | | | | None | |
| Exchange Fee | | | None | | | | None | | | | None | | | | None | | | | None | |
| Annual Low Balance Account Fee (for accounts under $1,000)2 | | | $15 | | | | $15 | | | | $15 | | | | None | | | | $15 | |
Annual Fund Operating Expenses
(expenses that you pay each year as a percentage of the value of your investment)
| | | | | | | | | | | | | | | | | | | | |
| | | Class A | | | Class B | | | Class C | | | Class R3 | | | Class I | |
| Management Fees | | | 1.00% | | | | 1.00% | | | | 1.00% | | | | 1.00% | | | | 1.00% | |
| Distribution and/or Service (12b-1) Fees | | | 0.25% | | | | 1.00% | | | | 1.00% | | | | 0.50% | | | | 0.00% | |
| Other Expenses | | | 0.28% | | | | 0.28% | | | | 0.28% | | | | 0.28% | | | | 0.28% | |
| Acquired Fund Fees and Expenses | | | 0.01% | | | | 0.01% | | | | 0.01% | | | | 0.01% | | | | 0.01% | |
| Total Annual Fund Operating Expenses3 | | | 1.54% | | | | 2.29% | | | | 2.29% | | | | 1.79% | | | | 1.29% | |
| Fee Waivers and/or Expense Reimbursements | | | (0.06)% | | | | (0.06)% | | | | (0.06)% | | | | (0.06)% | | | | (0.06)% | |
| Total Annual Fund Operating Expenses After Fee Waivers and/or Expense Reimbursements4 | | | 1.48% | | | | 2.23% | | | | 2.23% | | | | 1.73% | | | | 1.23% | |
| 1 | The CDSC on Class B shares declines over a six-year period from purchase. The CDSC on Class C shares applies only to redemptions within 12 months of purchase. |
| 2 | Fee applies to the following types of accounts under $1,000 held directly with the fund: individual retirement accounts (IRAs), Coverdell Education Savings Accounts and accounts established pursuant to the Uniform Transfers to Minors Act (UTMA) or Uniform Gifts to Minors Act (UGMA). |
| 3 | Expenses have been restated to reflect current contractual fees and estimated other expenses. |
| 4 | The fund’s investment adviser has contractually agreed to waive fees and/or reimburse other fund expenses through February 28, 2013 so that total annual fund operating expenses, after fee waivers and/or expense reimbursements and excluding Acquired Fund Fees and Expenses, do not exceed 1.47%, 2.22%, 2.22%, 1.72%, and 1.22% for Class A, Class B, Class C, Class R3 and Class I shares, respectively. Fee waivers and/or expense reimbursements will not be terminated prior to that time without the approval of the fund’s board of directors. |
Example
The following example is intended to help you compare the cost of investing in the fund with the cost of investing in other mutual funds. The example assumes that you invest $10,000 in the fund for the time periods indicated and then either redeem or do not redeem your shares at the end of a period. The example also assumes that your investment has a 5% return each year, that the fund’s operating expenses remain the same, and the contractual fee waivers currently in place are not renewed beyond February 28, 2013. Although your actual costs may be higher or lower, based on these assumptions your costs would be:
| | | | | | | | | | | | | | | | | | | | | | | | | | | | | | | | | | | | | | | | | | | | |
| | | Redemption | | No Redemption |
| | | A | | | B | | | C | | | R3 | | | I | | | | | A | | | B | | | C | | | R3 | | | I | | | |
| 1 Year | | $ | 717 | | | $ | 726 | | | $ | 226 | | | $ | 176 | | | $ | 125 | | | | | $ | 717 | | | $ | 226 | | | $ | 226 | | | $ | 176 | | | $ | 125 | | | |
| 3 Years | | $ | 1,028 | | | $ | 1,010 | | | $ | 710 | | | $ | 557 | | | $ | 403 | | | | | $ | 1,028 | | | $ | 710 | | | $ | 710 | | | $ | 557 | | | $ | 403 | | | |
| 5 Years | | $ | 1,361 | | | $ | 1,320 | | | $ | 1,220 | | | $ | 964 | | | $ | 702 | | | | | $ | 1,361 | | | $ | 1,220 | | | $ | 1,220 | | | $ | 964 | | | $ | 702 | | | |
| 10 Years | | $ | 2,299 | | | $ | 2,433 | | | $ | 2,621 | | | $ | 2,100 | | | $ | 1,551 | | | | | $ | 2,299 | | | $ | 2,433 | | | $ | 2,621 | | | $ | 2,100 | | | $ | 1,551 | | | |
Section 1 Fund Summaries
55
Portfolio Turnover
The fund pays transaction costs, such as commissions, when it buys and sells securities (or “turns over” its portfolio). A higher portfolio turnover rate may indicate higher transaction costs and may result in higher taxes when fund shares are held in a taxable account. These costs, which are not reflected in annual fund operating expenses or in the example, affect the fund’s performance. During the most recent fiscal year, the fund’s portfolio turnover rate was 118% of the average value of its portfolio.
Principal Investment Strategies
Under normal market conditions, the fund invests at least 80% of net assets, plus the amount of any borrowings for investment purposes, in common stocks of small-capitalization companies, defined as companies that have market capitalizations of less than $3 billion at the time of purchase.
In selecting stocks, the fund’s sub-adviser invests in companies that it believes exhibit the potential for superior growth based on factors such as above-average growth in revenue and earnings, strong competitive position, strong management, and sound financial condition. The fund’s sub-adviser will generally sell a stock if the stock hits its price target, the company’s fundamentals or competitive position significantly deteriorate, or if a better alternative exists in the marketplace.
Under certain market conditions, the fund may frequently invest in companies at the time of their initial public offering.
The fund may invest up to 15% of its total assets in non-dollar denominated equity securities of non-U.S. issuers. In addition, the fund may invest up to 25% of its assets, collectively, in non-dollar denominated equity securities of non-U.S. issuers and in dollar-denominated equity securities of non-U.S. issuers that are either listed on a U.S. stock exchange or represented by depositary receipts that may or may not be sponsored by a domestic bank. Up to 15% of the fund’s total assets may be invested in equity securities of emerging market issuers. A country is considered to be an “emerging market” if it is defined as such by Morgan Stanley Capital International Inc.
The fund may utilize options, futures contracts, options on futures contracts, and forward foreign currency exchange contracts (“derivatives”). The fund may use these derivatives to manage market or business risk, enhance the fund’s return, or hedge against adverse movements in currency exchange rates.
Principal Risks
The value of your investment in this fund will change daily, which means you could lose money. An investment in the fund is not a deposit of a bank and is not insured or guaranteed by the Federal Deposit Insurance Corporation or any other government agency. The principal risks of investing in this fund include:
Derivatives Risk—The use of derivatives involves additional risks and transaction costs which could leave the fund in a worse position than if it had not used these instruments. Derivatives may entail investment exposures that are greater than their cost would suggest. As a result, a small investment in derivatives could have a large impact on performance.
Equity Security Risk—Equity securities may decline significantly in price over short or extended periods of time, and such declines may occur in the equity market as a whole, or they may occur in only a particular country, company, industry, or sector of the market.
Investment Focus Risk—Different types of stocks tend to shift in and out of favor depending on market and economic conditions. The fund emphasizes a growth style of investing and therefore seeks companies experiencing high rates of current growth; such companies may be more volatile than other types of investments.
Non-U.S./Emerging Markets Risk—Non-U.S. issuers or U.S. issuers with significant non-U.S. operations may be subject to risks in addition to those of issuers located in or that principally operate in the United States as a result of, among other things, political, social and economic developments abroad and different legal, regulatory and tax environments. These additional risks may be heightened for securities of issuers located in, or with significant operations in, emerging market countries. Also, changes in currency exchange rates may affect the fund’s net asset value, the value of dividends and interest earned, and gains and losses realized on the sale of securities.
Small-Cap Stock Risk—Small-cap stocks may involve greater risks than large-cap stocks. Prices of small-cap stocks may be subject to more abrupt or erratic movements, and to wider fluctuations, than stock prices of larger, more established companies or the market averages in general. It may be difficult to sell small-cap stocks at the desired time and price.
56
Section 1 Fund Summaries
Fund Performance
The following bar chart and table provide some indication of the potential risks of investing in the fund. The fund’s past performance (before and after taxes) is not necessarily an indication of how the fund will perform in the future. Updated performance information is available at www.nuveen.com/MF/products/performancesummary.aspx or by calling (800) 257-8787.
The bar chart below shows the variability of the fund’s performance from year to year for Class A shares. The performance of the other share classes will differ due to their different expense structures. The bar chart and highest/lowest quarterly returns that follow do not reflect sales charges, and if these charges were reflected, the returns would be less than those shown.
Class A Annual Total Return
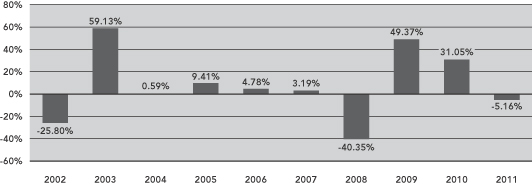
During the ten-year period ended December 31, 2011, the fund’s highest and lowest quarterly returns were 34.11% and –28.23%, respectively, for the quarters ended June 30, 2003 and December 31, 2008.
The table below shows the variability of the fund’s average annual returns and how they compare over the time periods indicated with those of a broad measure of market performance and an index of funds with similar investment objectives. All after-tax returns are calculated using the historical highest individual federal marginal income tax rates and do not reflect the impact of state and local taxes. After-tax returns are shown for Class A shares only; after-tax returns for other share classes will vary. Your own actual after-tax returns will depend on your specific tax situation and may differ from what is shown here. After-tax returns are not relevant to investors who hold fund shares in tax-deferred accounts such as IRAs or employer-sponsored retirement plans.
Both the bar chart and the table assume that all distributions have been reinvested. Performance reflects fee waivers, if any, in effect during the periods presented. If any such waivers were not in place, returns would be reduced.
Prior to July 1, 2004, Class R3 shares were designated Class S shares, which had lower fees and expenses. The performance information in the table prior to July 1, 2004 is based on the performance of the Class S shares. If current fees and expenses had been in effect, performance would have been lower.
Section 1 Fund Summaries
57
| | | | | | | | | | | | | | | | |
| | | | | | Average Annual Total Returns
for the Periods Ended December 31, 20111 | |
| | | Inception
Date | | | 1 Year | | | 5 Years | | | 10 Years | |
| Class A (return before taxes) | | | 8/1/95 | | | | (10.61 | )% | | | 1.50 | % | | | 3.91 | % |
| Class A (return after taxes on distributions) | | | | | | | (10.81 | )% | | | 0.95 | % | | | 2.53 | % |
| Class A (return after taxes on distributions and sale of fund shares) | | | | | | | (6.64 | )% | | | 1.00 | % | | | 2.66 | % |
| Class B (return before taxes) | | | 3/1/99 | | | | (10.53 | )% | | | 1.75 | % | | | 3.73 | % |
| Class C (return before taxes) | | | 9/24/01 | | | | (5.89 | )% | | | 1.94 | % | | | 3.74 | % |
| Class R3 (return before taxes) | | | 12/11/00 | | | | (5.43 | )% | | | 2.44 | % | | | 4.34 | % |
| Class I (return before taxes) | | | 8/1/95 | | | | (4.92 | )% | | | 2.96 | % | | | 4.78 | % |
Russell 2000® Growth Index
(reflects no deduction for fees, expenses or taxes) | | | | | | | (2.91 | )% | | | 2.09 | % | | | 4.48 | % |
Lipper Small-Cap Growth Classification Average
(reflects no deduction for taxes or certain expenses) | | | | | | | (3.35 | )% | | | 1.47 | % | | | 4.23 | % |
| 1 | On 12/12/02, the fund changed its main investment strategy to invest primarily in securities of companies with market capitalizations within the range of companies in the Russell 2000 Index. Previously, the fund invested primarily in companies with market capitalizations of below $500 million at the time of purchase. |
Management
Investment Adviser
Nuveen Fund Advisors, Inc.
Sub-Adviser
Nuveen Asset Management, LLC
Portfolio Managers
| | | | |
Name | | Title | | Portfolio Manager of Fund Since |
| | |
| Robert S. McDougall, CFA | | Senior Vice President | | May 2004 |
| Jon A. Loth, CFA | | Vice President | | October 2007 |
58
Section 1 Fund Summaries
Purchase and Sale of Fund Shares
You may purchase, redeem or exchange shares of the fund on any business day, which is any day the New York Stock Exchange is open for business. You may purchase, redeem or exchange shares of the fund either through a financial advisor or other financial intermediary or directly from the fund. Class B shares are available only through exchanges and dividend reinvestments by current Class B shareholders. The fund’s initial and subsequent investment minimums generally are as follows, although the fund may reduce or waive the minimums in some cases:
| | | | | | |
| | | Class A and Class C | | Class R3 | | Class I |
| Eligibility and Minimum Initial Investment | | $3,000 for all accounts except: • $2,500 for Traditional/Roth IRA accounts. • $2,000 for Coverdell Education Savings Accounts. • $250 for accounts opened through fee-based programs. • No minimum for retirement plans. | | Available only through certain retirement plans. No minimum. | | Available only through fee-based programs and certain retirement plans, and to other limited categories of investors as described in the prospectus. $100,000 for all accounts except: • $250 for clients of financial intermediaries and family offices that have accounts holding Class I shares with an aggregate value of at least $100,000 (or that are expected to reach this level). • No minimum for eligible retirement plans and certain other categories of eligible investors as described in the prospectus. |
| Minimum Additional Investment | | $100 | | No minimum. | | No minimum. |
Tax Information
The fund’s distributions are taxable and will generally be taxed as ordinary income or capital gains.
Payments to Broker-Dealers and Other Financial Intermediaries
If you purchase shares of the fund through a broker-dealer or other financial intermediary (such as a bank or financial advisor), the fund, its distributor or its investment adviser may pay the intermediary for the sale of fund shares and related services. These payments may create a conflict of interest by influencing the broker-dealer or other financial intermediary and your salesperson to recommend the fund over another investment. Ask your financial advisor or visit your financial intermediary’s website for more information.
Section 1 Fund Summaries
59
Nuveen Small Cap Index Fund
Investment Objective
The investment objective of the fund is to provide investment results that correspond to the performance of the Russell 2000® Index (Russell 2000 Index).
Fees and Expenses of the Fund
This table describes the fees and expenses that you may pay if you buy and hold shares of the fund. You may qualify for sales charge discounts if you and your family invest, or agree to invest in the future, at least $50,000 in the fund or in other Nuveen Mutual Funds. More information about these and other discounts, as well as eligibility requirements for each share class, is available from your financial advisor and in “What Share Classes We Offer” on page 92 of the fund’s prospectus and “Purchase and Redemption of Fund Shares” on page S-94 of the fund’s statement of additional information.
Shareholder Fees
(fees paid directly from your investment)
| | | | | | | | | | | | | | | | |
| | | Class A | | | Class C | | | Class R3 | | | Class I | |
| Maximum Sales Charge (Load) Imposed on Purchases (as a percentage of offering price) | | | None | | | | None | | | | None | | | | None | |
Maximum Deferred Sales Charge (Load)
(as a percentage of the lesser of purchase price or redemption proceeds)1 | | | None | | | | 1.00% | | | | None | | | | None | |
| Maximum Sales Charge (Load) Imposed on Reinvested Dividends | | | None | | | | None | | | | None | | | | None | |
| Exchange Fee | | | None | | | | None | | | | None | | | | None | |
| Annual Low Balance Account Fee (for accounts under $1,000)2 | | | $15 | | | | $15 | | | | None | | | | $15 | |
Annual Fund Operating Expenses (expenses that you pay each year as a percentage of the value of your investment) | | | | | | | | | | | | | | | | |
| | | Class A | | | Class C | | | Class R3 | | | Class I | |
| Management Fees | | | 0.35% | | | | 0.35% | | | | 0.35% | | | | 0.35% | |
| Distribution and/or Service (12b-1) Fees | | | 0.25% | | | | 1.00% | | | | 0.50% | | | | 0.00% | |
| Other Expenses | | | 0.48% | | | | 0.48% | | | | 0.48% | | | | 0.48% | |
| Acquired Fund Fees and Expenses | | | 0.06% | | | | 0.06% | | | | 0.06% | | | | 0.06% | |
| Total Annual Fund Operating Expenses3 | | | 1.14% | | | | 1.89% | | | | 1.39% | | | | 0.89% | |
| Fee Waivers and/or Expense Reimbursements | | | (0.25)% | | | | (0.25)% | | | | (0.25)% | | | | (0.25)% | |
| Total Annual Fund Operating Expenses After Fee Waivers and/or Expense Reimbursements4 | | | 0.89% | | | | 1.64% | | | | 1.14% | | | | 0.64% | |
| 1 | The CDSC on Class C shares applies only to redemptions within 12 months of purchase. |
| 2 | Fee applies to the following types of accounts under $1,000 held directly with the fund: individual retirement accounts (IRAs), Coverdell Education Savings Accounts and accounts established pursuant to the Uniform Transfers to Minors Act (UTMA) or Uniform Gifts to Minors Act (UGMA). |
| 3 | Expenses have been restated to reflect current contractual fees and estimated other expenses. |
| 4 | The fund’s investment adviser has contractually agreed to waive fees and/or reimburse other fund expenses through February 28, 2013 so that total annual fund operating expenses, after fee waivers and/or expense reimbursements and excluding Acquired Fund Fees and Expenses, do not exceed 0.83%, 1.58%, 1.08%, and 0.58% for Class A, Class C, Class R3 and Class I shares, respectively. Fee waivers and/or expense reimbursements will not be terminated prior to that time without the approval of the fund’s board of directors. |
Example
The following example is intended to help you compare the cost of investing in the fund with the cost of investing in other mutual funds. The example assumes that you invest $10,000 in the fund for the time periods indicated and then either redeem or do not redeem your shares at the end of a period. The example also assumes that your investment has a 5% return each year, that the fund’s operating expenses remain the same, and the contractual fee waivers currently in place are not renewed beyond February 28, 2013. Although your actual costs may be higher or lower, based on these assumptions your costs would be:
| | | | | | | | | | | | | | | | | | | | | | | | | | | | | | | | | | | | |
| | | Redemption | | No Redemption |
| | | A | | | C | | | R3 | | | I | | | | | A | | | C | | | R3 | | | I | | | |
| 1 Year | | $ | 91 | | | $ | 167 | | | $ | 116 | | | $ | 65 | | | | | $ | 91 | | | $ | 167 | | | $ | 116 | | | $ | 65 | | | |
| 3 Years | | $ | 337 | | | $ | 570 | | | $ | 415 | | | $ | 259 | | | | | $ | 337 | | | $ | 570 | | | $ | 415 | | | $ | 259 | | | |
| 5 Years | | $ | 603 | | | $ | 998 | | | $ | 737 | | | $ | 469 | | | | | $ | 603 | | | $ | 998 | | | $ | 737 | | | $ | 469 | | | |
| 10 Years | | $ | 1,364 | | | $ | 2,191 | | | $ | 1,647 | | | $ | 1,073 | | | | | $ | 1,364 | | | $ | 2,191 | | | $ | 1,647 | | | $ | 1,073 | | | |
60
Section 1 Fund Summaries
Portfolio Turnover
The fund pays transaction costs, such as commissions, when it buys and sells securities (or “turns over” its portfolio). A higher portfolio turnover rate may indicate higher transaction costs and may result in higher taxes when fund shares are held in a taxable account. These costs, which are not reflected in annual fund operating expenses or in the example, affect the fund’s performance. During the most recent fiscal year, the fund’s portfolio turnover rate was 14% of the average value of its portfolio.
Principal Investment Strategies
Under normal market conditions, the fund generally invests at least 90% of its net assets, plus the amount of any borrowings for investment purposes, in common stocks included in the Russell 2000 Index. This index measures the performance of the 2,000 smallest companies in the Russell 3000 Index (which is made up of the 3,000 largest U.S. companies based on total market capitalization). Reconstitution of the index occurs annually. As of December 31, 2011, market capitalizations of companies in the Russell 2000 Index ranged from approximately $16 million to $3.7 billion.
The fund’s sub-adviser believes that the fund’s objective can best be achieved by investing in common stocks of at least 90% of the issues included in the Russell 2000 Index, depending on the size of the fund. A computer program is used to identify which stocks should be purchased or sold in order to replicate, as closely as practicable, the composition of the Russell 2000 Index.
Because the fund may not always hold all of the stocks included in the Russell 2000 Index, and because the fund has expenses and the index does not, the fund will not duplicate the index’s performance precisely. However, the fund’s sub-adviser believes there should be a close correlation between the fund’s performance and that of the Russell 2000 Index in both rising and falling markets. The fund will attempt to achieve a correlation between the performance of its portfolio and that of the Russell 2000 Index of at least 95%, without taking into account expenses of the fund. A perfect correlation would be indicated by a figure of 100%, which would be achieved if the fund’s net asset value, including the value of its dividends and capital gains distributions, increased or decreased in exact proportion to changes in the Russell 2000 Index. If the fund is unable to achieve a correlation of 95% over time, the fund’s board of directors will consider alternative strategies for the fund.
The fund may invest in stock index futures contracts, options on stock indices, and options on stock index futures (“derivatives”) on the Russell 2000 Index. The fund makes these investments to maintain the liquidity needed to meet redemption requests, to increase the level of fund assets devoted to replicating the composition of the Russell 2000 Index, and to reduce transaction costs.
Principal Risks
The value of your investment in this fund will change daily, which means you could lose money. An investment in the fund is not a deposit of a bank and is not insured or guaranteed by the Federal Deposit Insurance Corporation or any other government agency. The principal risks of investing in this fund include:
Derivatives Risk—The use of derivatives involves additional risks and transaction costs which could leave the fund in a worse position than if it had not used these instruments. Derivatives may entail investment exposures that are greater than their cost would suggest. As a result, a small investment in derivatives could have a large impact on performance.
Equity Security Risk—Equity securities may decline significantly in price over short or extended periods of time, and such declines may occur in the equity market as a whole, or they may occur in only a particular country, company, industry, or sector of the market.
Failure to Match Index Performance—The fund may not replicate the performance of the Russell 2000 Index.
Small-Cap Stock Risk—Small-cap stocks may involve greater risks than large-cap stocks. Prices of small-cap stocks may be subject to more abrupt or erratic movements, and to wider fluctuations, than stock prices of larger, more established companies or the market averages in general. It may be difficult to sell small-cap stocks at the desired time and price.
Section 1 Fund Summaries
61
Fund Performance
The following bar chart and table provide some indication of the potential risks of investing in the fund. The fund’s past performance (before and after taxes) is not necessarily an indication of how the fund will perform in the future. Updated performance information is available at www.nuveen.com/MF/products/performancesummary.aspx or by calling (800) 257-8787.
The bar chart below shows the variability of the fund’s performance from year to year for Class A shares. The performance of the other share classes will differ due to their different expense structures.
Class A Annual Total Return
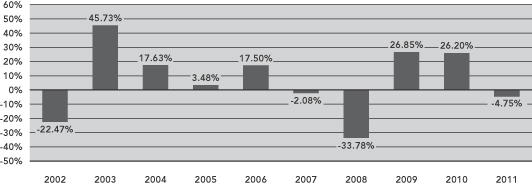
During the ten-year period ended December 31, 2011, the fund’s highest and lowest quarterly returns were 22.96% and –25.79%, respectively, for the quarters ended June 30, 2003 and December 31, 2008.
The table below shows the variability of the fund’s average annual returns and how they compare over the time periods indicated with those of a broad measure of market performance and an index of funds with similar investment objectives. All after-tax returns are calculated using the historical highest individual federal marginal income tax rates and do not reflect the impact of state and local taxes. After-tax returns are shown for Class A shares only; after-tax returns for other share classes will vary. Your own actual after-tax returns will depend on your specific tax situation and may differ from what is shown here. After-tax returns are not relevant to investors who hold fund shares in tax-deferred accounts such as IRAs or employer-sponsored retirement plans.
Both the bar chart and the table assume that all distributions have been reinvested. Performance reflects fee waivers, if any, in effect during the periods presented. If any such waivers were not in place, returns would be reduced.
Prior to July 1, 2004, Class R3 shares were designated Class S shares, which had lower fees and expenses. The performance information in the table prior to July 1, 2004 is based on the performance of the Class S shares. If current fees and expenses had been in effect, performance would have been lower.
| | | | | | | | | | | | | | | | |
| | | | | | Average Annual Total Returns for the Periods Ended December 31, 2011 | |
| | | Inception
Date | | | 1 Year | | | 5 Years | | | 10 Years | |
| Class A (return before taxes) | | | 12/30/98 | | | | (4.75 | )% | | | (0.23 | )% | | | 4.80 | % |
| Class A (return after taxes on distributions) | | | | | | | (4.79 | )% | | | (1.23 | )% | | | 3.80 | % |
| Class A (return after taxes on distributions and sale of fund shares) | | | | | | | (3.03 | )% | | | (0.43 | )% | | | 3.95 | % |
| Class C (return before taxes) | | | 9/24/01 | | | | (5.47 | )% | | | (0.99 | )% | | | 3.98 | % |
| Class R3 (return before taxes) | | | 12/30/98 | | | | (4.92 | )% | | | (0.48 | )% | | | 4.55 | % |
| Class I (return before taxes) | | | 12/30/98 | | | | (4.49 | )% | | | 0.02 | % | | | 5.03 | % |
| Russell 2000® Index (reflects no deduction for fees, expenses or taxes) | | | | | | | (4.18 | )% | | | 0.15 | % | | | 5.62 | % |
Lipper Small-Cap Core Classification Average
(reflects no deduction for taxes or certain expenses) | | | | | | | (3.41 | )% | | | 0.45 | % | | | 6.00 | % |
62
Section 1 Fund Summaries
Management
Investment Adviser
Nuveen Fund Advisors, Inc.
Sub-Adviser
Nuveen Asset Management, LLC
Portfolio Managers
| | | | |
Name | | Title | | Portfolio Manager of Fund Since |
| | |
| Walter A. French | | Senior Vice President | | March 2001 |
| David A. Friar | | Assistant Vice President | | March 2001 |
Purchase and Sale of Fund Shares
You may purchase, redeem or exchange shares of the fund on any business day, which is any day the New York Stock Exchange is open for business. You may purchase, redeem or exchange shares of the fund either through a financial advisor or other financial intermediary or directly from the fund. The fund’s initial and subsequent investment minimums generally are as follows, although the fund may reduce or waive the minimums in some cases:
| | | | | | | | |
| | | Class A | | Class C | | Class R3 | | Class I |
| Eligibility and Minimum Initial Investment | | Available only through fee-based programs and certain retirement plans. $250 minimum for accounts opened through fee-based programs. No minimum for retirement plans. | | $3,000 for all accounts except: • $2,500 for Traditional/Roth IRA accounts. • $2,000 for Coverdell Education Savings Accounts. • $250 for accounts opened through fee- based programs. • No minimum for retirement plans. | | Available only through certain retirement plans. No minimum. | | Available only through fee-based programs and certain retirement plans, and to other limited categories of investors as described in the prospectus. $100,000 for all accounts except: • $250 for clients of financial intermediaries and family offices that have accounts holding Class I shares with an aggregate value of at least $100,000 (or that are expected to reach this level). • No minimum for eligible retirement plans and certain other categories of eligible investors as described in the prospectus. |
| Minimum Additional Investment | | $100 | | $100 | | No minimum. | | No minimum. |
Tax Information
The fund’s distributions are taxable and will generally be taxed as ordinary income or capital gains.
Payments to Broker-Dealers and Other Financial Intermediaries
If you purchase shares of the fund through a broker-dealer or other financial intermediary (such as a bank or financial advisor), the fund, its distributor or its investment adviser may pay the intermediary for the sale of fund shares and related services. These payments may create a conflict of interest by influencing the broker-dealer or other financial intermediary and your salesperson to recommend the fund over another investment. Ask your financial advisor or visit your financial intermediary’s website for more information.
Section 1 Fund Summaries
63
Nuveen Small Cap Select Fund
Investment Objective
The investment objective of the fund is capital appreciation.
Fees and Expenses of the Fund
This table describes the fees and expenses that you may pay if you buy and hold shares of the fund. You may qualify for sales charge discounts if you and your family invest, or agree to invest in the future, at least $50,000 in the fund or in other Nuveen Mutual Funds. More information about these and other discounts, as well as eligibility requirements for each share class, is available from your financial advisor and in “What Share Classes We Offer” on page 92 of the fund’s prospectus, “How to Reduce Your Sales Charge” on page 94 of the prospectus and “Purchase and Redemption of Fund Shares” on page S-94 of the fund’s statement of additional information.
Shareholder Fees
(fees paid directly from your investment)
| | | | | | | | | | | | | | | | | | | | |
| | | Class A | | | Class B | | | Class C | | | Class R3 | | | Class I | |
Maximum Sales Charge (Load) Imposed on Purchases
(as a percentage of offering price) | | | 5.75% | | | | None | | | | None | | | | None | | | | None | |
Maximum Deferred Sales Charge (Load)
(as a percentage of the lesser of purchase price or redemption proceeds)1 | | | None | | | | 5.00% | | | | 1.00% | | | | None | | | | None | |
| Maximum Sales Charge (Load) Imposed on Reinvested Dividends | | | None | | | | None | | | | None | | | | None | | | | None | |
| Exchange Fee | | | None | | | | None | | | | None | | | | None | | | | None | |
| Annual Low Balance Account Fee (for accounts under $1,000)2 | | | $15 | | | | $15 | | | | $15 | | | | None | | | | $15 | |
Annual Fund Operating Expenses
(expenses that you pay each year as a percentage of the value of your investment)
| | | | | | | | | | | | | | | | | | | | |
| | | Class A | | | Class B | | | Class C | | | Class R3 | | | Class I | |
| Management Fees | | | 0.88% | | | | 0.88% | | | | 0.88% | | | | 0.88% | | | | 0.88% | |
| Distribution and/or Service (12b-1) Fees | | | 0.25% | | | | 1.00% | | | | 1.00% | | | | 0.50% | | | | 0.00% | |
| Other Expenses | | | 0.19% | | | | 0.19% | | | | 0.19% | | | | 0.19% | | | | 0.19% | |
| Total Annual Fund Operating Expenses3 | | | 1.32% | | | | 2.07% | | | | 2.07% | | | | 1.57% | | | | 1.07% | |
| 1 | The CDSC on Class B shares declines over a six-year period from purchase. The CDSC on Class C shares applies only to redemptions within 12 months of purchase. |
| 2 | Fee applies to the following types of accounts under $1,000 held directly with the fund: individual retirement accounts (IRAs), Coverdell Education Savings Accounts and accounts established pursuant to the Uniform Transfers to Minors Act (UTMA) or Uniform Gifts to Minors Act (UGMA). |
| 3 | Expenses have been restated to reflect current contractual fees and estimated other expenses. |
Example
The following example is intended to help you compare the cost of investing in the fund with the cost of investing in other mutual funds. The example assumes that you invest $10,000 in the fund for the time periods indicated and then either redeem or do not redeem your shares at the end of a period. The example also assumes that your investment has a 5% return each year and that the fund’s operating expenses remain the same. Although your actual costs may be higher or lower, based on these assumptions your costs would be:
| | | | | | | | | | | | | | | | | | | | | | | | | | | | | | | | | | | | | | | | | | | | |
| | | Redemption | | | | | No Redemption | | | |
| | | A | | | B | | | C | | | R3 | | | I | | | | | A | | | B | | | C | | | R3 | | | I | | | |
| 1 Year | | $ | 702 | | | $ | 710 | | | $ | 210 | | | $ | 160 | | | $ | 109 | | | | | $ | 702 | | | $ | 210 | | | $ | 210 | | | $ | 160 | | | $ | 109 | | | |
| 3 Years | | $ | 969 | | | $ | 949 | | | $ | 649 | | | $ | 496 | | | $ | 340 | | | | | $ | 969 | | | $ | 649 | | | $ | 649 | | | $ | 496 | | | $ | 340 | | | |
| 5 Years | | $ | 1,257 | | | $ | 1,214 | | | $ | 1,114 | | | $ | 855 | | | $ | 590 | | | | | $ | 1,257 | | | $ | 1,114 | | | $ | 1,114 | | | $ | 855 | | | $ | 590 | | | |
| 10 Years | | $ | 2,074 | | | $ | 2,208 | | | $ | 2,400 | | | $ | 1,867 | | | $ | 1,306 | | | | | $ | 2,074 | | | $ | 2,208 | | | $ | 2,400 | | | $ | 1,867 | | | $ | 1,306 | | | |
64
Section 1 Fund Summaries
Portfolio Turnover
The fund pays transaction costs, such as commissions, when it buys and sells securities (or “turns over” its portfolio). A higher portfolio turnover rate may indicate higher transaction costs and may result in higher taxes when fund shares are held in a taxable account. These costs, which are not reflected in annual fund operating expenses or in the example, affect the fund’s performance. During the most recent fiscal year, the fund’s portfolio turnover rate was 69% of the average value of its portfolio.
Principal Investment Strategies
Under normal market conditions, the fund invests at least 80% of net assets, plus the amount of any borrowings for investment purposes, in common stocks of small-capitalization companies, defined as companies that have market capitalizations of less than $3 billion at the time of purchase.
In selecting stocks, the fund’s sub-adviser invests in companies that it believes meet one or more of the following criteria:
| • | | Attractively valued relative to other companies in the same industry or market. |
| • | | Strong or improving cash flows, revenue and earnings growth, or other fundamentals. |
| • | | Strong competitive position. |
| • | | Strong management teams. |
| • | | An identifiable catalyst that could increase the value of the company’s stock over the next one or two years. |
The fund’s sub-adviser will generally sell a stock if the stock hits its price target, the company’s fundamentals or competitive position significantly deteriorate, or if a better alternative exists in the marketplace.
Under certain market conditions, the fund may frequently invest in companies at the time of their initial public offering.
The fund may invest up to 15% of its total assets in non-dollar denominated equity securities of non-U.S. issuers. In addition, the fund may invest up to 25% of its assets, collectively, in non-dollar denominated equity securities of non-U.S. issuers and in dollar-denominated equity securities of non-U.S. issuers that are either listed on a U.S. stock exchange or represented by depositary receipts that may or may not be sponsored by a domestic bank. Up to 15% of the fund’s total assets may be invested in equity securities of emerging market issuers. A country is considered to be an “emerging market” if it is defined as such by Morgan Stanley Capital International Inc.
The fund may utilize options, futures contracts, options on futures contracts, and forward foreign currency exchange contracts (“derivatives”). The fund may use these derivatives to manage market or business risk, enhance the fund’s return, or hedge against adverse movements in currency exchange rates.
Principal Risks
The value of your investment in this fund will change daily, which means you could lose money. An investment in the fund is not a deposit of a bank and is not insured or guaranteed by the Federal Deposit Insurance Corporation or any other government agency. The principal risks of investing in this fund include:
Derivatives Risk—The use of derivatives involves additional risks and transaction costs which could leave the fund in a worse position than if it had not used these instruments. Derivatives may entail investment exposures that are greater than their cost would suggest. As a result, a small investment in derivatives could have a large impact on performance.
Equity Security Risk—Equity securities may decline significantly in price over short or extended periods of time, and such declines may occur in the equity market as a whole, or they may occur in only a particular country, company, industry, or sector of the market.
Non-U.S./Emerging Markets Risk—Non-U.S. issuers or U.S. issuers with significant non-U.S. operations may be subject to risks in addition to those of issuers located in or that principally operate in the United States as a result of, among other things, political, social and economic developments abroad and different legal, regulatory and tax environments. These additional risks may be heightened for securities of issuers located in, or with significant operations in, emerging market countries. Also, changes in currency exchange rates may affect the fund’s net asset value, the value of dividends and interest earned, and gains and losses realized on the sale of securities.
Small-Cap Stock Risk—Small-cap stocks may involve greater risks than large-cap stocks. Prices of small-cap stocks may be subject to more abrupt or erratic movements, and to wider fluctuations, than stock prices of larger, more established companies or the market averages in general. It may be difficult to sell small-cap stocks at the desired time and price.
Section 1 Fund Summaries
65
Fund Performance
The following bar chart and table provide some indication of the potential risks of investing in the fund. The fund’s past performance (before and after taxes) is not necessarily an indication of how the fund will perform in the future. Updated performance information is available at www.nuveen.com/MF/products/performancesummary.aspx or by calling (800) 257-8787.
The bar chart below shows the variability of the fund’s performance from year to year for Class A shares. The performance of the other share classes will differ due to their different expense structures. The bar chart and highest/lowest quarterly returns that follow do not reflect sales charges, and if these charges were reflected, the returns would be less than those shown.
Class A Annual Total Return
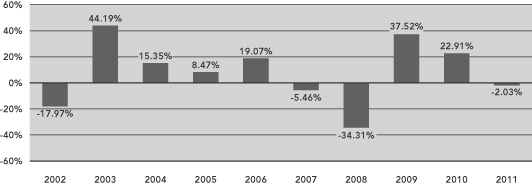
During the ten-year period ended December 31, 2011, the fund’s highest and lowest quarterly returns were 21.20% and –23.68%, respectively, for the quarters ended December 31, 2011 and September 30, 2011.
The table below shows the variability of the fund’s average annual returns and how they compare over the time periods indicated with those of a broad measure of market performance and an index of funds with similar investment objectives. All after-tax returns are calculated using the historical highest individual federal marginal income tax rates and do not reflect the impact of state and local taxes. After-tax returns are shown for Class A shares only; after-tax returns for other share classes will vary. Your own actual after-tax returns will depend on your specific tax situation and may differ from what is shown here. After-tax returns are not relevant to investors who hold fund shares in tax-deferred accounts such as IRAs or employer-sponsored retirement plans.
Both the bar chart and the table assume that all distributions have been reinvested. Performance reflects fee waivers, if any, in effect during the periods presented. If any such waivers were not in place, returns would be reduced.
Prior to July 1, 2004, Class R3 shares were designated Class S shares, which had lower fees and expenses. The performance information in the table prior to July 1, 2004 is based on the performance of the Class S shares. If current fees and expenses had been in effect, performance would have been lower.
| | | | | | | | | | | | | | | | |
| | | | | | Average Annual Total Returns
for the Periods Ended December 31, 2011 | |
| | | Inception
Date | | | 1 Year | | | 5 Years | | | 10 Years | |
| Class A (return before taxes) | | | 5/6/92 | | | | (7.70 | )% | | | (0.62 | )% | | | 5.50 | % |
| Class A (return after taxes on distributions) | | | | | | | (8.04 | )% | | | (0.91 | )% | | | 3.93 | % |
| Class A (return after taxes on distributions and sale of fund shares) | | | | | | | (4.58 | )% | | | (0.56 | )% | | | 4.15 | % |
| Class B (return before taxes) | | | 3/6/95 | | | | (7.56 | )% | | | (0.39 | )% | | | 5.33 | % |
| Class C (return before taxes) | | | 9/24/01 | | | | (2.83 | )% | | | (0.20 | )% | | | 5.33 | % |
| Class R3 (return before taxes) | | | 1/3/94 | | | | (2.31 | )% | | | 0.30 | % | | | 5.93 | % |
| Class I (return before taxes) | | | 5/6/92 | | | | (1.87 | )% | | | 0.80 | % | | | 6.38 | % |
| Russell 2000® Index (reflects no deduction for fees, expenses or taxes) | | | | | | | (4.18 | )% | | | 0.15 | % | | | 5.62 | % |
Lipper Small-Cap Core Classification Average
(reflects no deduction for taxes or certain expenses) | | | | | | | (3.41 | )% | | | 0.45 | % | | | 6.00 | % |
66
Section 1 Fund Summaries
Management
Investment Adviser
Nuveen Fund Advisors, Inc.
Sub-Adviser
Nuveen Asset Management, LLC
Portfolio Managers
| | | | |
Name | | Title | | Portfolio Manager of Fund Since |
| | |
Allen D. Steinkopf, CFA | | Senior Vice President | | July 2004 |
Mark A. Traster, CFA | | Vice President | | December 2008 |
Purchase and Sale of Fund Shares
You may purchase, redeem or exchange shares of the fund on any business day, which is any day the New York Stock Exchange is open for business. You may purchase, redeem or exchange shares of the fund either through a financial advisor or other financial intermediary or directly from the fund. Class B shares are available only through exchanges and dividend reinvestments by current Class B shareholders. The fund’s initial and subsequent investment minimums generally are as follows, although the fund may reduce or waive the minimums in some cases:
| | | | | | |
| | | Class A and Class C | | Class R3 | | Class I |
| Eligibility and Minimum Initial Investment | | $3,000 for all accounts except: • $2,500 for Traditional/Roth IRA accounts. • $2,000 for Coverdell Education Savings Accounts. • $250 for accounts opened through fee-based programs. • No minimum for retirement plans. | | Available only through certain retirement plans. No minimum. | | Available only through fee-based programs and certain retirement plans, and to other limited categories of investors as described in the prospectus. $100,000 for all accounts except: • $250 for clients of financial intermediaries and family offices that have accounts holding Class I shares with an aggregate value of at least $100,000 (or that are expected to reach this level). • No minimum for eligible retirement plans and certain other categories of eligible investors as described in the prospectus. |
| Minimum Additional Investment | | $100 | | No minimum. | | No minimum. |
Tax Information
The fund’s distributions are taxable and will generally be taxed as ordinary income or capital gains.
Payments to Broker-Dealers and Other Financial Intermediaries
If you purchase shares of the fund through a broker-dealer or other financial intermediary (such as a bank or financial advisor), the fund, its distributor or its investment adviser may pay the intermediary for the sale of fund shares and related services. These payments may create a conflict of interest by influencing the broker-dealer or other financial intermediary and your salesperson to recommend the fund over another investment. Ask your financial advisor or visit your financial intermediary’s website for more information.
Section 1 Fund Summaries
67
Nuveen Small Cap Value Fund
Investment Objective
The investment objective of the fund is capital appreciation.
Fees and Expenses of the Fund
This table describes the fees and expenses that you may pay if you buy and hold shares of the fund. You may qualify for sales charge discounts if you and your family invest, or agree to invest in the future, at least $50,000 in the fund or in other Nuveen Mutual Funds. More information about these and other discounts, as well as eligibility requirements for each share class, is available from your financial advisor and in “What Share Classes We Offer” on page 92 of the fund’s prospectus, “How to Reduce Your Sales Charge” on page 94 of the prospectus and “Purchase and Redemption of Fund Shares” on page S-94 of the fund’s statement of additional information.
Shareholder Fees
(fees paid directly from your investment)
| | | | | | | | | | | | | | | | |
| | | Class A | | | Class C | | | Class R3 | | | Class I | |
Maximum Sales Charge (Load) Imposed on Purchases
(as a percentage of offering price) | | | 5.75% | | | | None | | | | None | | | | None | |
Maximum Deferred Sales Charge (Load)
(as a percentage of the lesser of purchase price or redemption proceeds)1 | | | None | | | | 1.00% | | | | None | | | | None | |
| Maximum Sales Charge (Load) Imposed on Reinvested Dividends | | | None | | | | None | | | | None | | | | None | |
| Exchange Fee | | | None | | | | None | | | | None | | | | None | |
| Annual Low Balance Account Fee (for accounts under $1,000)2 | | | $15 | | | | $15 | | | | None | | | | $15 | |
Annual Fund Operating Expenses (expenses that you pay each year as a percentage of the value of your investment) | | | | | | | | | | | | | | | | |
| | | Class A | | | Class C | | | Class R3 | | | Class I | |
| Management Fees | | | 0.90% | | | | 0.90% | | | | 0.90% | | | | 0.90% | |
| Distribution and/or Service (12b-1) Fees | | | 0.25% | | | | 1.00% | | | | 0.50% | | | | 0.00% | |
| Other Expenses | | | 0.30% | | | | 0.30% | | | | 0.30% | | | | 0.30% | |
| Acquired Fund Fees and Expenses | | | 0.09% | | | | 0.09% | | | | 0.09% | | | | 0.09% | |
| Total Annual Fund Operating Expenses3 | | | 1.54% | | | | 2.29% | | | | 1.79% | | | | 1.29% | |
| 1 | The CDSC on Class C shares applies only to redemptions within 12 months of purchase. |
| 2 | Fee applies to the following types of accounts under $1,000 held directly with the fund: individual retirement accounts (IRAs), Coverdell Education Savings Accounts and accounts established pursuant to the Uniform Transfers to Minors Act (UTMA) or Uniform Gifts to Minors Act (UGMA). |
| 3 | Expenses have been restated to reflect current contractual fees and estimated other expenses. |
Example
The following example is intended to help you compare the cost of investing in the fund with the cost of investing in other mutual funds. The example assumes that you invest $10,000 in the fund for the time periods indicated and then either redeem or do not redeem your shares at the end of a period. The example also assumes that your investment has a 5% return each year and that the fund’s operating expenses remain the same. Although your actual costs may be higher or lower, based on these assumptions your costs would be:
| | | | | | | | | | | | | | | | | | | | | | | | | | | | | | | | | | | | |
| | | Redemption | | | No Redemption | | | | | | |
| | | A | | | C | | | R3 | | | I | | | | | A | | | C | | | R3 | | | I | | | |
| 1 Year | | $ | 723 | | | $ | 232 | | | $ | 182 | | | $ | 131 | | | | | $ | 723 | | | $ | 232 | | | $ | 182 | | | $ | 131 | | | |
| 3 Years | | $ | 1,033 | | | $ | 715 | | | $ | 563 | | | $ | 409 | | | | | $ | 1,033 | | | $ | 715 | | | $ | 563 | | | $ | 409 | | | |
| 5 Years | | $ | 1,366 | | | $ | 1,225 | | | $ | 970 | | | $ | 708 | | | | | $ | 1,366 | | | $ | 1,225 | | | $ | 970 | | | $ | 708 | | | |
| 10 Years | | $ | 2,304 | | | $ | 2,626 | | | $ | 2,105 | | | $ | 1,556 | | | | | $ | 2,304 | | | $ | 2,626 | | | $ | 2,105 | | | $ | 1,556 | | | |
68
Section 1 Fund Summaries
Portfolio Turnover
The fund pays transaction costs, such as commissions, when it buys and sells securities (or “turns over” its portfolio). A higher portfolio turnover rate may indicate higher transaction costs and may result in higher taxes when fund shares are held in a taxable account. These costs, which are not reflected in annual fund operating expenses or in the example, affect the fund’s performance. During the most recent fiscal year, the fund’s portfolio turnover rate was 41% of the average value of its portfolio.
Principal Investment Strategies
Under normal market conditions, the fund invests at least 80% of net assets, plus the amount of any borrowings for investment purposes, in common stocks of small-capitalization companies, defined as companies that have market capitalizations of less than $3 billion at the time of purchase.
In selecting stocks, the fund’s sub-adviser invests in companies that it believes meet at least two of the following criteria:
| • | | Undervalued relative to other companies in the same industry or market; |
| • | | Good or improving fundamentals; and |
| • | | An identifiable catalyst that could close the gap between market value and fair value over the next one to two years. |
The fund’s sub-adviser will generally sell a stock if the stock hits its price target, the company’s fundamentals or competitive position significantly deteriorate, or if a better alternative exists in the marketplace.
The fund may invest up to 15% of its total assets in non-dollar denominated equity securities of non-U.S. issuers. In addition, the fund may invest up to 25% of its assets, collectively, in non-dollar denominated equity securities of non-U.S. issuers and in dollar-denominated equity securities of non-U.S. issuers that are either listed on a U.S. stock exchange or represented by depositary receipts that may or may not be sponsored by a domestic bank. Up to 15% of the fund’s total assets may be invested in equity securities of emerging market issuers. A country is considered to be an “emerging market” if it is defined as such by Morgan Stanley Capital International Inc.
The fund may utilize options, futures contracts, options on futures contracts, and forward foreign currency exchange contracts (“derivatives”). The fund may use these derivatives to manage market or business risk, enhance the fund’s return, or hedge against adverse movements in currency exchange rates.
Principal Risks
The value of your investment in this fund will change daily, which means you could lose money. An investment in the fund is not a deposit of a bank and is not insured or guaranteed by the Federal Deposit Insurance Corporation or any other government agency. The principal risks of investing in this fund include:
Derivatives Risk—The use of derivatives involves additional risks and transaction costs which could leave the fund in a worse position than if it had not used these instruments. Derivatives may entail investment exposures that are greater than their cost would suggest. As a result, a small investment in derivatives could have a large impact on performance.
Equity Security Risk—Equity securities may decline significantly in price over short or extended periods of time, and such declines may occur in the equity market as a whole, or they may occur in only a particular country, company, industry, or sector of the market.
Investment Focus Risk—Different types of stocks tend to shift in and out of favor depending on market and economic conditions. The fund emphasizes a value style of investing and therefore seeks undervalued companies with characteristics for improved valuations; such companies are subject to the risk that the valuations never improve.
Non-U.S./Emerging Markets Risk—Non-U.S. issuers or U.S. issuers with significant non-U.S. operations may be subject to risks in addition to those of issuers located in or that principally operate in the United States as a result of, among other things, political, social and economic developments abroad and different legal, regulatory and tax environments. These additional risks may be heightened for securities of issuers located in, or with significant operations in, emerging market countries. Also, changes in currency exchange rates may affect the fund’s net asset value, the value of dividends and interest earned, and gains and losses realized on the sale of securities.
Section 1 Fund Summaries
69
Small-Cap Stock Risk—Small-cap stocks may involve greater risks than large-cap stocks. Prices of small-cap stocks may be subject to more abrupt or erratic movements, and to wider fluctuations, than stock prices of larger, more established companies or the market averages in general. It may be difficult to sell small-cap stocks at the desired time and price.
Fund Performance
The following bar chart and table provide some indication of the potential risks of investing in the fund. The fund’s past performance (before and after taxes) is not necessarily an indication of how the fund will perform in the future. Updated performance information is available at www.nuveen.com/MF/products/performancesummary.aspx or by calling (800) 257-8787.
The bar chart below shows the variability of the fund’s performance from year to year for Class A shares. The performance of the other share classes will differ due to their different expense structures. The bar chart and highest/lowest quarterly returns that follow do not reflect sales charges, and if these charges were reflected, the returns would be less than those shown.
Class A Annual Total Return
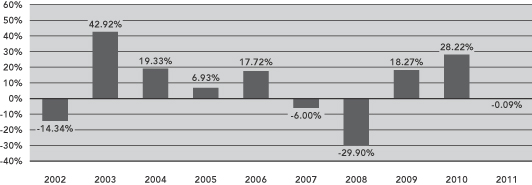
During the ten-year period ended December 31, 2011, the fund’s highest and lowest quarterly returns were 19.73% and –22.12%, respectively, for the quarters ended December 31, 2011 and December 31, 2008.
The table below shows the variability of the fund’s average annual returns and how they compare over the time periods indicated with those of a broad measure of market performance and an index of funds with similar investment objectives. All after-tax returns are calculated using the historical highest individual federal marginal income tax rates and do not reflect the impact of state and local taxes. After-tax returns are shown for Class A shares only; after-tax returns for other share classes will vary. Your own actual after-tax returns will depend on your specific tax situation and may differ from what is shown here. After-tax returns are not relevant to investors who hold fund shares in tax-deferred accounts such as IRAs or employer-sponsored retirement plans.
Both the bar chart and the table assume that all distributions have been reinvested. Performance reflects fee waivers, if any, in effect during the periods presented. If any such waivers were not in place, returns would be reduced.
Prior to July 1, 2004, Class R3 shares were designated Class S shares, which had lower fees and expenses. The performance information in the table prior to July 1, 2004 is based on the performance of the Class S shares. If current fees and expenses had been in effect, performance would have been lower.
70
Section 1 Fund Summaries
| | | | | | | | | | | | | | | | |
| | | | | | Average Annual Total Returns
for the Periods Ended
December 31, 2011 | |
| | | Inception
Date | | | 1 Year | | | 5 Years | | | 10 Years | |
| Class A (return before taxes) | | | 1/1/88 | | | | (5.80 | )% | | | (1.21 | )% | | | 5.64 | % |
| Class A (return after taxes on distributions) | | | | | | | (5.80 | )% | | | (1.76 | )% | | | 4.26 | % |
| Class A (return after taxes on distributions and sale of fund shares) | | | | | | | (3.77 | )% | | | (1.19 | )% | | | 4.56 | % |
| Class C (return before taxes) | | | 2/1/99 | | | | (0.78 | )% | | | (0.78 | )% | | | 5.47 | % |
| Class R3 (return before taxes) | | | 9/24/01 | | | | (0.35 | )% | | | (0.27 | )% | | | 6.08 | % |
| Class I (return before taxes) | | | 1/1/88 | | | | 0.25 | % | | | 0.22 | % | | | 6.53 | % |
Russell 2000® Value Index
(reflects no deduction for fees, expenses or taxes) | | | | | | | (5.50 | )% | | | (1.87 | )% | | | 6.40 | % |
Lipper Small-Cap Value Classification Average
(reflects no deduction for taxes or certain expenses) | | | | | | | (5.20 | )% | | | (0.08 | )% | | | 6.90 | % |
Management
Investment Adviser
Nuveen Fund Advisors, Inc.
Sub-Adviser
Nuveen Asset Management, LLC
Portfolio Manager
| | | | |
Name | | Title | | Portfolio Manager of Fund Since |
| | |
| Karen L. Bowie, CFA | | Senior Vice President | | July 2005 |
Section 1 Fund Summaries
71
Purchase and Sale of Fund Shares
You may purchase, redeem or exchange shares of the fund on any business day, which is any day the New York Stock Exchange is open for business. You may purchase, redeem or exchange shares of the fund either through a financial advisor or other financial intermediary or directly from the fund. The fund’s initial and subsequent investment minimums generally are as follows, although the fund may reduce or waive the minimums in some cases:
| | | | | | |
| | | Class A and Class C | | Class R3 | | Class I |
| Eligibility and Minimum Initial Investment | | $3,000 for all accounts except: • $2,500 for Traditional/Roth IRA accounts. • $2,000 for Coverdell Education Savings Accounts. • $250 for accounts opened through fee-based programs. • No minimum for retirement plans. | | Available only through certain retirement plans. No minimum. | | Available only through fee-based programs and certain retirement plans, and to other limited categories of investors as described in the prospectus. $100,000 for all accounts except: • $250 for clients of financial intermediaries and family offices that have accounts holding Class I shares with an aggregate value of at least $100,000 (or that are expected to reach this level). • No minimum for eligible retirement plans and certain other categories of eligible investors as described in the prospectus. |
| Minimum Additional Investment | | $100 | | No minimum. | | No minimum. |
Tax Information
The fund’s distributions are taxable and will generally be taxed as ordinary income or capital gains.
Payments to Broker-Dealers and Other Financial Intermediaries
If you purchase shares of the fund through a broker-dealer or other financial intermediary (such as a bank or financial advisor), the fund, its distributor or its investment adviser may pay the intermediary for the sale of fund shares and related services. These payments may create a conflict of interest by influencing the broker-dealer or other financial intermediary and your salesperson to recommend the fund over another investment. Ask your financial advisor or visit your financial intermediary’s website for more information.
72
Section 1 Fund Summaries
Nuveen Tactical Market Opportunities Fund
Investment Objective
The investment objective of the fund is to earn a positive total return over a reasonable period of time, regardless of market conditions.
Fees and Expenses of the Fund
This table describes the fees and expenses that you may pay if you buy and hold shares of the fund. You may qualify for sales charge discounts if you and your family invest, or agree to invest in the future, at least $50,000 in the fund or in other Nuveen Mutual Funds. More information about these and other discounts, as well as eligibility requirements for each share class, is available from your financial advisor and in “What Share Classes We Offer” on page 92 of the fund’s prospectus, “How to Reduce Your Sales Charge” on page 94 of the prospectus and “Purchase and Redemption of Fund Shares” on page S-94 of the fund’s statement of additional information.
Shareholder Fees
(fees paid directly from your investment)
| | | | | | | | | | | | |
| | | Class A | | | Class C | | | Class I | |
Maximum Sales Charge (Load) Imposed on Purchases
(as a percentage of offering price) | | | 5.75% | | | | None | | | | None | |
Maximum Deferred Sales Charge (Load)
(as a percentage of the lesser of purchase price or redemption proceeds)1 | | | None | | | | 1.00% | | | | None | |
| Maximum Sales Charge (Load) Imposed on Reinvested Dividends | | | None | | | | None | | | | None | |
| Exchange Fee | | | None | | | | None | | | | None | |
| Annual Low Balance Account Fee (for accounts under $1,000)2 | | | $15 | | | | $15 | | | | $15 | |
Annual Fund Operating Expenses (expenses that you pay each year as a percentage of the value of your investment) | | | | | | | | | | | | |
| | | Class A | | | Class C | | | Class I | |
| Management Fees | | | 0.79% | | | | 0.79% | | | | 0.79% | |
| Distribution and/or Service (12b-1) Fees | | | 0.25% | | | | 1.00% | | | | 0.00% | |
| Other Expenses | | | 0.39% | | | | 0.39% | | | | 0.39% | |
| Acquired Fund Fees and Expenses | | | 0.23% | | | | 0.23% | | | | 0.23% | |
| Total Annual Fund Operating Expenses3 | | | 1.66% | | | | 2.41% | | | | 1.41% | |
| Fee Waivers and/or Expense Reimbursement | | | (0.24)% | | | | (0.24)% | | | | (0.24)% | |
| Total Annual Fund Operating Expenses After Fee Waivers and/or Expense Reimbursements4 | | | 1.42% | | | | 2.17% | | | | 1.17% | |
| 1 | The CDSC on Class C shares applies only to redemptions within 12 months of purchase. |
| 2 | Fee applies to the following types of accounts under $1,000 held directly with the fund: individual retirement accounts (IRAs), Coverdell Education Savings Accounts and accounts established pursuant to the Uniform Transfers to Minors Act (UTMA) or Uniform Gifts to Minors Act (UGMA). |
| 3 | Expenses have been restated to reflect current contractual fees and estimated other expenses. |
| 4 | The fund’s investment adviser has contractually agreed to waive fees and/or reimburse other fund expenses through February 28, 2013 so that total annual fund operating expenses, after fee waivers and/or expense reimbursements and excluding Acquired Fund Fees and Expenses, do not exceed 1.20%, 1.95%, and 0.95% for Class A, Class C and Class I shares, respectively. Fee waivers and/or expense reimbursements will not be terminated prior to that time without the approval of the fund’s board of directors. |
Example
The following example is intended to help you compare the cost of investing in the fund with the cost of investing in other mutual funds. The example assumes that you invest $10,000 in the fund for the time periods indicated and then either redeem or do not redeem your shares at the end of a period. The example also assumes that your investment has a 5% return each year, that the fund’s operating expenses remain the same, and the contractual fee waivers currently in place are not renewed beyond February 28, 2013. Although your actual costs may be higher or lower, based on these assumptions your costs would be:
| | | | | | | | | | | | | | | | | | | | | | | | | | | | |
| | | Redemption | | No Redemption |
| | | A | | | C | | | I | | | | | A | | | C | | | I | | | |
| 1 Year | | $ | 711 | | | $ | 220 | | | $ | 119 | | | | | $ | 711 | | | $ | 220 | | | $ | 119 | | | |
| 3 Years | | $ | 1,046 | | | $ | 729 | | | $ | 423 | | | | | $ | 1,046 | | | $ | 729 | | | $ | 423 | | | |
| 5 Years | | $ | 1,404 | | | $ | 1,264 | | | $ | 748 | | | | | $ | 1,404 | | | $ | 1,264 | | | $ | 748 | | | |
| 10 Years | | $ | 2,408 | | | $ | 2,728 | | | $ | 1,670 | | | | | $ | 2,408 | | | $ | 2,728 | | | $ | 1,670 | | | |
Section 1 Fund Summaries
73
Portfolio Turnover
The fund pays transaction costs, such as commissions, when it buys and sells securities (or “turns over” its portfolio). A higher portfolio turnover rate may indicate higher transaction costs and may result in higher taxes when fund shares are held in a taxable account. These costs, which are not reflected in annual fund operating expenses or in the example, affect the fund’s performance. During the most recent fiscal period, the fund’s portfolio turnover rate was 177% of the average value of its portfolio.
Principal Investment Strategies
Under normal market conditions, the fund will seek to outperform the Merrill Lynch 3 Month Treasury Bill Index (the “Treasury Bill Index”) by 400 basis points, or 4%, on an annualized basis. The Treasury Bill Index is comprised of a single U.S. Treasury issue with approximately three months to final maturity, purchased at the beginning of each month and held for one full month. At the end of the month, that issue is sold and rolled into a newly selected issue. U.S. Treasury bills are backed by the full faith and credit of the U.S. government, and are generally considered a risk free investment. Investing in the fund, on the other hand, involves certain risks, including the risk of loss. In addition, an investment in the fund will be more volatile than an investment in U.S. Treasury bills. The fund’s portfolio managers will manage volatility by attempting to limit the fund’s tracking error relative to the Treasury Bill Index to a level consistent with achieving the return that the fund is seeking.
The fund seeks to outperform the Treasury Bill Index over a reasonable period of time, although there is no guarantee that it will be able to do so. Over shorter periods of time, investment returns will fluctuates as market conditions vary and may be lower than those of the Treasury Bill Index. Thus, the fund is designed for investors with longer term investment horizons – generally at least three years or more.
The fund seeks to achieve its objective by investing its assets across the following asset classes:
| | • | | U.S., international and emerging market equity securities, |
| | • | | U.S., international and emerging market debt securities, including high-yield debt securities, |
| | • | | High quality, short-term debt securities and money market funds. |
The fund generally gains exposure to the above asset classes by investing in derivative instruments and exchange-traded funds (“ETFs”), except that the fund invests directly in U.S. Treasury obligations, non-U.S. government obligations that have an investment grade rating from at least one rating agency and money market funds.
The fund will use derivative instruments such as options; futures contracts, including futures on equity and commodities indices, interest rate and currency futures; options on futures contracts; interest rate caps and floors; foreign currency contracts; options on foreign currencies; interest rate, total return, currency and credit default swaps; and options on the foregoing types of swap agreements. Derivatives may be entered into on established exchanges, either in the U.S. or in non-U.S. countries, or through privately negotiated transactions referred to as over-the-counter derivatives. In using derivatives, the fund may take both long positions (the values of which move in the same direction as the prices of the underlying investment, pool of investments, index or currency) and short positions (the values of which move in the opposite direction from the price of the underlying investment, pool of investments, index or currency).
The fund’s sub-adviser may allocate the fund’s assets among the different asset classes in different proportions at different times. The fund is not required to allocate its investments among the asset classes in any fixed proportion, nor is it limited by investment style or by the issuer’s location, size, market capitalization or industry sector. The fund may have none or some of its assets invested in each asset class in relative proportions that change over time based on market and economic conditions.
The sub-adviser allocates assets among the various asset classes based on its forecasted returns and its risk assessment for each asset class. The sub-adviser will seek to take advantage of both investment opportunities that are believed to have a high probability of success (long investment) and a high probability of failure (short investment). The sub-adviser regularly assesses and manages the overall risk profile of the fund’s portfolio, based on the fund’s exposure to each asset class, the volatility of the asset classes, and the correlation of returns among the different asset classes.
74
Section 1 Fund Summaries
Principal Risks
The value of your investment in this fund will change daily, which means you could lose money. An investment in the fund is not a deposit of a bank and is not insured or guaranteed by the Federal Deposit Insurance Corporation or any other government agency. The principal risks of investing in this fund include:
Commodities Risk—Commodities markets historically have been extremely volatile, and the performance of securities that provide exposure to those markets therefore also may be highly volatile.
Credit Risk—Credit risk is the risk that an issuer of a debt security may be unable or unwilling to make interest and principal payments when due and the related risk that the value of a debt security may decline because of concerns about the issuer’s ability or willingness to make such payments. In addition, parties to other financial contracts with the fund could default on their obligations.
Derivatives Risk—The use of derivatives involves additional risks and transaction costs which could leave the fund in a worse position than if it had not used these instruments. Derivatives may entail investment exposures that are greater than their cost would suggest. As a result, a small investment in derivatives could have a large impact on performance.
Equity Security Risk—Equity securities may decline significantly in price over short or extended periods of time, and such declines may occur in the equity market as a whole, or they may occur in only a particular country, company, industry, or sector of the market.
ETF Risk—An ETF is subject to the risks of the underlying securities that it holds. In addition, for index-based ETFs, the performance of an ETF may diverge from the performance of such index (commonly known as tracking error). ETFs are subject to fees and expenses (like management fees and operating expenses) that do not apply to an index and the fund will indirectly bear its proportionate share of any management fees and other expenses paid by the ETFs in which it invests.
Frequent Trading Risk—Frequent trading of portfolio securities may produce capital gains, which are taxable to shareholders when distributed. Frequent trading may also increase the amount of commissions or mark-ups to broker-dealers that the fund pays when it buys and sells securities, which may detract from the fund’s performance.
High Yield Securities Risk—High yield securities generally are less liquid, have more volatile prices, and have greater credit risk than investment grade securities.
Interest Rate Risk—Interest rate risk is the risk that the value of the fund’s portfolio will decline because of rising interest rates.
Non-U.S./Emerging Markets Risk—Non-U.S. issuers or U.S. issuers with significant non-U.S. operations may be subject to risks in addition to those of issuers located in or that principally operate in the United States as a result of, among other things, political, social and economic developments abroad and different legal, regulatory and tax environments. These additional risks may be heightened for securities of issuers located in, or with significant operations in, emerging market countries. Also, changes in currency exchange rates may affect the fund’s net asset value, the value of dividends and interest earned, and gains and losses realized on the sale of securities.
Other Investment Companies Risk—When the fund invests in other investment companies, you bear both your proportionate share of fund expenses and, indirectly, the expenses of the other investment companies.
Fund Performance
The following bar chart and table provide some indication of the potential risks of investing in the fund. The fund’s past performance (before and after taxes) is not necessarily an indication of how the fund will perform in the future. Updated performance information is available at www.nuveen.com/MF/products/performancesummary.aspx or by calling (800) 257-8787.
Section 1 Fund Summaries
75
The bar chart below shows the variability of the fund’s performance from year to year for Class I shares.
Class I Annual Total Return
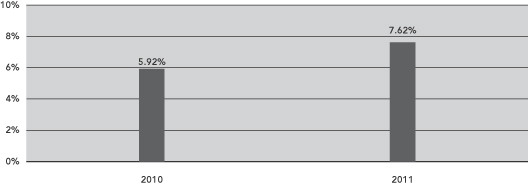
During the two-year period ended December 31, 2011, the fund’s highest and lowest quarterly returns were 4.45% and -0.20%, respectively, for the quarters ended September 30, 2010 and June 30, 2010.
The table below shows the variability of the fund’s average annual returns and how they compare over the time periods indicated with those of a broad measure of market performance and an index of funds with similar investment objectives. All after-tax returns are calculated using the historical highest individual federal marginal income tax rates and do not reflect the impact of state and local taxes. After-tax returns are shown for Class I shares only. Your own actual after-tax returns will depend on your specific tax situation and may differ from what is shown here. After-tax returns are not relevant to investors who hold fund shares in tax-deferred accounts such as IRAs or employer-sponsored retirement plans.
Both the bar chart and the table assume that all distributions have been reinvested. Performance reflects fee waivers, if any, in effect during the periods presented. If any such waivers were not in place, returns would be reduced.
Performance is not shown for Class A or Class C shares, which have not been offered for a full calendar year.
| | | | | | | | | | | | |
| | | | | | Average Annual Total Returns
for the Periods Ended
December 31, 2011 | |
| | | Inception
Date | | | 1 Year | | | Since
Inception
(Class I) | |
| Class I (return before taxes) | | | 12/30/09 | | | | 7.62 | % | | | 6.65 | % |
| Class I (return after taxes on distributions) | | | | | | | 6.94 | % | | | 6.17 | % |
| Class I (return after taxes on distributions and sale of fund shares) | | | | | | | 5.04 | % | | | 5.43 | % |
BofA Merrill Lynch 3-Month U.S. Treasury Bill Index
(reflects no deduction for fees, expenses or taxes) | | | | 0.10 | % | | | 0.11 | % |
Lipper Flexible Portfolio Classification Average
(reflects no deduction for taxes or certain expenses) | | | | (1.24 | )% | | | 5.20 | % |
Management
Investment Adviser
Nuveen Fund Advisors, Inc.
Sub-Adviser
Nuveen Asset Management, LLC
76
Section 1 Fund Summaries
Portfolio Managers
| | | | |
Name | | Title | | Portfolio Manager of Fund Since |
| | |
| David R. Cline | | Vice President | | December 2009 |
| Walter A. French | | Senior Vice President | | December 2009 |
| David A. Friar | | Assistant Vice President | | December 2009 |
| Keith B. Hembre, CFA | | Managing Director | | December 2009 |
| Derek B. Bloom, CFA | | Vice President | | February 2011 |
Purchase and Sale of Fund Shares
You may purchase, redeem or exchange shares of the fund on any business day, which is any day the New York Stock Exchange is open for business. You may purchase, redeem or exchange shares of the fund either through a financial advisor or other financial intermediary or directly from the fund. The fund’s initial and subsequent investment minimums generally are as follows, although the fund may reduce or waive the minimums in some cases:
| | | | |
| | | Class A and Class C | | Class I |
| Eligibility and Minimum Initial Investment | | $3,000 for all accounts except: • $2,500 for Traditional/Roth IRA accounts. • $2,000 for Coverdell Education Savings Accounts. • $250 for accounts opened through fee-based programs. • No minimum for retirement plans. | | Available only through fee-based programs and certain retirement plans, and to other limited categories of investors as described in the prospectus. $100,000 for all accounts except: • $250 for clients of financial intermediaries and family offices that have accounts holding Class I shares with an aggregate value of at least $100,000 (or that are expected to reach this level). • No minimum for eligible retirement plans and certain other categories of eligible investors as described in the prospectus. |
| Minimum Additional Investment | | $100 | | No minimum. |
Tax Information
The fund’s distributions are taxable and will generally be taxed as ordinary income or capital gains.
Payments to Broker-Dealers and Other Financial Intermediaries
If you purchase shares of the fund through a broker-dealer or other financial intermediary (such as a bank or financial advisor), the fund, its distributor or its investment adviser may pay the intermediary for the sale of fund shares and related services. These payments may create a conflict of interest by influencing the broker-dealer or other financial intermediary and your salesperson to recommend the fund over another investment. Ask your financial advisor or visit your financial intermediary’s website for more information.
Section 1 Fund Summaries
77
Section 2 How We Manage Your Money
To help you better understand the funds, this section includes a detailed discussion of the funds’ investment and risk management strategies. For a more complete discussion of these matters, please see the statement of additional information, which is available by calling (800) 257-8787 or by visiting Nuveen’s website at www.nuveen.com.

Nuveen Fund Advisors, Inc. (“Nuveen Fund Advisors”), the funds’ investment adviser, offers advisory and investment management services to a broad range of mutual fund clients. Nuveen Fund Advisors has overall responsibility for management of the funds, oversees the management of the funds’ portfolios, manages the funds’ business affairs and provides certain clerical, bookkeeping and other administrative services. Nuveen Fund Advisors is located at 333 West Wacker Drive, Chicago, Illinois 60606. Nuveen Fund Advisors is a subsidiary of Nuveen Investments, Inc. (“Nuveen Investments”). On November 13, 2007, Nuveen Investments was acquired by investors led by Madison Dearborn Partners, LLC, which is a private equity investment firm based in Chicago, Illinois. The Nuveen family of advisers has been providing advice to investment companies since 1976.
Nuveen Fund Advisors has selected its affiliate, Nuveen Asset Management, LLC (“Nuveen Asset Management”), located at 333 West Wacker Drive, Chicago, Illinois 60606, to serve as sub-adviser to each fund. Nuveen Asset Management manages the investment of the funds’ assets on a discretionary basis, subject to the supervision of Nuveen Fund Advisors.
In addition to Nuveen Asset Management, Altrinsic Global Advisors, LLC (“Altrinsic”) and Hansberger Global Investors, Inc. (“HGI”) serve as sub-advisers for Nuveen International Fund and Altrinsic, HGI and Lazard Asset Management LLC (“Lazard”) serve as sub-advisers for Nuveen International Select Fund.
Altrinsic, located at 8 Sound Shore Drive, Greenwich, Connecticut 06830, was established in 2000 and is an employee-controlled and majority-owned firm specializing in global and international investment management. As of December 31, 2011, Altrinsic had assets under management of approximately $10.7 billion. Altrinsic’s investment philosophy is based on value creation and the belief that a company’s valuation is a function of its future financial productivity (i.e., sustainable returns-on-capital relative to cost of capital) adjusted for associated risk. In implementing its philosophy, Altrinsic’s team capitalizes on inefficiencies (i.e. mispriced securities) in the world’s equity markets by taking a long-term view and leveraging proprietary individual-company analysis, global industry knowledge, and a distinctive cross-border frame of reference. Predicated on the time-tested principles of fundamental value investing, Altrinsic’s investment approach is bottom-up, fundamentally driven, internationally focused, and all-cap. Altrinsic has been providing advice to investment companies since 2006.
HGI, located at 401 East Las Olas Boulevard, Suite 1700, Fort Lauderdale, Florida 33301, is a wholly-owned subsidiary of Hansberger Group, Inc., which is a subsidiary of Natixis Global Asset Management, L.P. The firm was founded in 1994. As of December 31, 2011, HGI had assets under management of approximately $6.5 billion. HGI’s investment process begins with a series of quantitative screens that identify those companies with superior growth characteristics, including superior profitability, secular growth, sustainable competitive advantage, and strong capital structure. These screens are intended to identify those companies that have consistently been industry and market leaders. The result is HGI’s “Star List” of companies. The Star List companies are then rated based on their relative growth valuation and price momentum. HGI then generally narrows the universe to the most
78
Section 2 How We Manage Your Money
attractive 80 to 100 stocks in their ranking. Through rigorous fundamental analysis of each company, HGI uses a “Buy Profile” of six factors to select 60 to 70 stocks to build the portfolio. HGI generally sells a security if the buy profile deteriorates (often because the price target is met or the company’s fundamentals change) or if the portfolio is fully invested and a better investment opportunity arises. HGI has been providing advice to investment companies since 1997.
Lazard, 30 Rockefeller Plaza, New York, New York 10112, is a wholly owned subsidiary of Lazard Frères & Co., LLC. As of December 31, 2011, Lazard had assets under management of approximately $128.0 billion. Lazard employs a bottom-up, relative value approach in selecting stocks that includes proprietary database screening, accounting validation, fundamental analysis, and portfolio construction/risk evaluation. Lazard seeks to identify individual stocks of companies whose principal activities are located in emerging market countries that are believed to be undervalued based on their earnings, cash flow or asset values. Lazard has been providing advice to investment companies since 1991.
The portfolio managers primarily responsible for the funds’ management are:
Nuveen Dividend Value Fund. Cori B. Johnson, CFA, has managed the fund since August 1994. Ms. Johnson entered the financial services industry in 1981 and joined FAF Advisors, Inc. (“FAF”) in 1985. She joined Nuveen Asset Management on January 1, 2011 in connection with its acquisition of a portion of FAF’s asset management business.
Gerald C. Bren, CFA, has managed the fund since August 1994. Mr. Bren entered the financial services industry when he joined FAF in 1972. He joined Nuveen Asset Management on January 1, 2011 in connection with its acquisition of a portion of FAF’s asset management business.
Derek M. Sadowsky has managed the fund since February 2012. He entered the financial services industry in 1998 and joined Nuveen Asset Management on January 1, 2011 in connection with its acquisition of a portion of FAF’s asset management business. Prior to joining FAF in 2010, Mr. Sadowsky was an analyst at State Street Global Advisors in charge of the global basic materials sector. Previously, he was an associate at Putnam Investments where he worked on the global basic materials team, and served as an associate at Citigroup covering the domestic chemical sector.
Nuveen Equity Index Fund. Walter A. French has managed the fund since October 1999. Mr. French entered the financial services industry in 1974 and joined FAF in 1999. He joined Nuveen Asset Management on January 1, 2011 in connection with its acquisition of a portion of FAF’s asset management business.
David A. Friar has managed the fund since September 2000. Mr. Friar entered the financial services industry in 1998 and joined FAF in 1999. He joined Nuveen Asset Management on January 1, 2011 in connection with its acquisition of a portion of FAF’s asset management business.
Nuveen International Fund. Nuveen Asset Management allocates the management of the fund’s assets among the fund’s sub-advisers.
The following individuals have been primarily responsible, since November 2008, for the day-to-day management of the portion of the fund managed by Altrinsic: John Hock, CFA, John L. DeVita, CFA and Rehan Chaudhri.
| | • | | Mr. Hock founded Altrinsic Global Advisors in 2000 and has been its Chief Investment Officer since inception. Prior to Altrinsic, Mr. Hock was a portfolio manager with Hansberger Global Investors. He began his global equity career in 1990. |
| | • | | Mr. DeVita, Principal, has been a portfolio manager of Altrinsic Global Advisors since its founding in 2000. Prior to Altrinsic, Mr. DeVita was an equity analyst with Arnhold & S. Bleichroeder Advisors and Société Générale Asset Management. He began his global equity career in 1991. |
Section 2 How We Manage Your Money
79
| | • | | Mr. Chaudhri, Principal, has been a portfolio manager of Altrinsic Global Advisors since 2003. Prior to Altrinsic, Mr. Chaudhri was a portfolio manager with Lazard Asset Management. He began his global equity career in 1993. |
The following individuals have been primarily responsible, since November 2008, for the day-to-day management of the portion of the fund managed by HGI: Thomas R. H. Tibbles, CFA, Barry A. Lockhart, CFA, Trevor Graham, CFA, and Patrick Tan.
| | • | | Mr. Tibbles joined HGI in 1999 as Managing Director of Canada. Prior to joining HGI, he was head of the Global Equity Team at Indago Capital Management in Toronto, which was an affiliate of Canada Life. He began his career in the investment industry in 1986. |
| | • | | Mr. Lockhart joined HGI in 1999 and serves as Deputy Managing Director—Canada. Prior to joining HGI, he was a portfolio manager of foreign equity securities for Indago Capital Management. He began his career in the investment industry in 1989. |
| | • | | Mr. Graham joined HGI in 2004 and serves as Senior Vice President—Research. Prior to joining HGI, he maintained several different positions, including portfolio management and fundamental analyst for Phillips, Hager & North Investment Management Ltd., where he was employed from 1996 to 2004. |
| | • | | Mr. Tan, Senior Vice President—Research, joined HGI in 1999. Prior to joining HGI, he was an Analyst at Indago Capital Management from July 1997 to March 1999. He has more than five years of investment-related experience. |
Mr. Tibbles, as team leader, has ultimate authority and veto power over all buy and sell decisions. All team members are responsible for research coverage which is assigned by global industry sectors, recommending stocks and recommending subsequent buy and sell decisions.
The following individuals are primarily responsible for the day-to-day management of the portion of the fund managed by Nuveen Asset Management: Keith B. Hembre, CFA, Walter A. French, David A. Friar, and Derek B. Bloom, CFA.
| | • | | Mr. Hembre has managed the fund since November 2008. Mr. Hembre entered the financial services industry in 1992 and joined FAF in 1997. He joined Nuveen Asset Management on January 1, 2011 in connection with its acquisition of a portion of FAF’s asset management business. |
| | • | | Mr. French has managed the fund since November 2008. Information on Mr. French appears above under “Nuveen Equity Index Fund.” |
| | • | | Mr. Friar has managed the fund since February 2010. Information on Mr. Friar appears above under “Nuveen Equity Index Fund.” |
| | • | | Mr. Bloom has managed the fund since February 2010. Mr. Bloom entered the financial services industry in 2002 and joined FAF in 2003. He joined Nuveen Asset Management on January 1, 2011 in connection with its acquisition of a portion of FAF’s asset management business. |
Nuveen International Select Fund. Nuveen Asset Management allocates the fund’s assets among the fund’s sub-advisers.
The following individuals have been primarily responsible, since the fund’s inception, for the day-to-day management of the portion of the fund managed by Altrinsic: John Hock, CFA, John L. DeVita, CFA, and Rehan Chaudhri. Information on Mr. Hock, Mr. DeVita and Mr. Chaudhri appears above under “Nuveen International Fund.”
The following individuals have been primarily responsible, since the fund’s inception, for the day-to-day management of the portion of the fund managed by HGI: Thomas R. H. Tibbles, CFA, Barry A. Lockhart, CFA, Trevor Graham, CFA, and Patrick Tan. Information on Mr. Tibbles, Mr. Lockhart, Mr. Graham and Mr. Tan appears above under “Nuveen International Fund.”
80
Section 2 How We Manage Your Money
The following individuals have been primarily responsible, since the fund’s inception, for the day-to-day management of the portion of the fund managed by Lazard: James M. Donald and John R. Reinsberg.
| | • | | Mr. Donald is a Managing Director and Head of the Emerging Markets Group at Lazard. He joined Lazard in 1996 and is a CFA Charterholder. Mr. Donald has been working in the investment industry for 21 years. |
| | • | | Mr. Reinsberg is a Deputy Chairman and Head of International and Global Products at Lazard. He also oversees the day-to-day operations of Lazard’s international equity investment team. He joined Lazard in 1992 and has 25 years investment experience. |
The following individuals are primarily responsible for the day-to-day management of the portion of the fund managed by Nuveen Asset Management: Keith B. Hembre, CFA, Walter A. French, David A. Friar and Derek B. Bloom, CFA.
| | • | | Mr. Hembre has managed the fund since its inception. Information on Mr. Hembre appears above under “Nuveen International Fund.” |
| | • | | Mr. French has managed the fund since its inception. Information on Mr. French appears above under “Nuveen Equity Index Fund.” |
| | • | | Mr. Friar has managed the fund since February 2010. Information on Mr. Friar appears above under “Nuveen Equity Index Fund.” |
| | • | | Mr. Bloom has managed the fund since February 2010. Information on Mr. Bloom appears above under “Nuveen International Fund.” |
Nuveen Large Cap Growth Opportunities Fund. Harold R. Goldstein has managed the fund since July 2002. Mr. Goldstein entered the financial services industry in 1982 and joined FAF in 2002. He joined Nuveen Asset Management on January 1, 2011 in connection with its acquisition of a portion of FAF’s asset management business.
Scott M. Mullinix, CFA, has managed the fund since April 2006. Mr. Mullinix entered the financial services industry in 1989 and joined FAF in 2006. He joined Nuveen Asset Management on January 1, 2011 in connection with its acquisition of a portion of FAF’s asset management business.
James A. Diedrich, CFA, has managed the fund since February 2006. Mr. Diedrich entered the financial services industry in 1984 and joined FAF in 2006. He joined Nuveen Asset Management on January 1, 2011 in connection with its acquisition of a portion of FAF’s asset management business.
Nuveen Large Cap Select Fund. David A. Chalupnik, CFA, has managed the fund since January 2003. Mr. Chalupnik entered the financial services industry in 1984 and joined FAF in 2002. He joined Nuveen Asset Management on January 1, 2011 in connection with its acquisition of a portion of FAF’s asset management business.
Anthony R. Burger, CFA, has managed the fund since October 2004. He entered the financial services industry in 1994 and joined FAF in 2003. He joined Nuveen Asset Management on January 1, 2011 in connection with its acquisition of a portion of FAF’s asset management business.
Nuveen Large Cap Value Fund. Cori B. Johnson has managed the fund since April 2012. Information on Ms. Johnson appears above under “Nuveen Dividend Value Fund.”
Gerald C. Bren has managed the fund since April 2012. Information on Mr. Bren appears above under “Nuveen Dividend Value Fund.”
Derek M. Sadowsky has managed the fund since April 2012. Information on Mr. Sadowsky appears above under “Nuveen Dividend Value Fund.”
Nuveen Mid Cap Growth Opportunities Fund. James A. Diedrich has managed the fund since February 2006. Information on Mr. Diedrich appears above under “Nuveen Large Cap Growth Opportunities Fund.”
Harold R. Goldstein has managed the fund since September 2005. Information on Mr. Goldstein appears above under “Nuveen Large Cap Growth Opportunities Fund.”
Section 2 How We Manage Your Money
81
Scott Mullinix has managed the fund since April 2006. Information on Mr. Mullinix appears above under “Nuveen Large Cap Growth Opportunities Fund.”
Nuveen Mid Cap Index Fund. Walter A. French has managed the fund since March 2001. Information on Mr. French appears above under “Nuveen Equity Index Fund.”
David A. Friar has managed the fund since March 2001. Information on Mr. Friar appears above under “Nuveen Equity Index Fund.”
Nuveen Mid Cap Select Fund. Anthony R. Burger, CFA, has managed the fund since May 2005. Information on Mr. Burger appears above under “Nuveen Large Cap Select Fund.”
Scott M. Tonneson, CFA, has managed the fund since February 2012. Mr. Tonneson began working in the financial industry in 1994 and joined FAF in 2007. Prior to that, he worked at Ameriprise Financial as a quantitative equity analyst, business analyst, and account analyst. He joined Nuveen Asset Management on January 1, 2011, in connection with its acquisition of a portion of FAF’s asset management business.
Nuveen Mid Cap Value Fund. David A. Chalupnik has managed the fund since April 2012. Information on Mr. Chalupnik appears above under “Nuveen Large Cap Select Fund.”
Karen L. Bowie, CFA, has managed the fund since April 2012. Ms. Bowie entered the financial services industry when she joined FAF in 1984, and she rejoined FAF in 1999. She joined Nuveen Asset Management on January 1, 2011 in connection with its acquisition of a portion of FAF’s asset management business.
Nuveen Quantitative Enhanced Core Equity Fund. Walter A. French has managed the fund since its inception. Information on Mr. French appears above under “Nuveen Equity Index Fund.”
David R. Cline has managed the fund since the fund’s inception. Mr. Cline entered the financial services industry when he joined FAF in 1989. He joined Nuveen Asset Management on January 1, 2011 in connection with its acquisition of a portion of FAF’s asset management business.
David A. Friar has managed the fund since its inception. Information on Mr. Friar appears above under “Nuveen Equity Index Fund.”
Keith B. Hembre, CFA, has managed the fund since the fund’s inception. Information on Mr. Hembre appears above under “Nuveen International Fund.”
Nuveen Small Cap Growth Opportunities Fund. Robert S. McDougall, CFA, has managed the fund since May 2004. He entered the financial services industry in 1988 and joined FAF in 2004. He joined Nuveen Asset Management on January 1, 2011 in connection with its acquisition of a portion of FAF’s asset management business.
Jon A. Loth, CFA, has managed the fund since October 2007. He previously was an equity analyst for FAF. Mr. Loth entered the financial services industry in 1994 and joined FAF in 2004. He joined Nuveen Asset Management on January 1, 2011 in connection with its acquisition of a portion of FAF’s asset management business.
Nuveen Small Cap Index Fund. Walter A. French has managed the fund since March 2001. Information on Mr. French appears above under “Nuveen Equity Index Fund.”
David A. Friar has managed the fund since March 2001. Information on Mr. Friar appears above under “Nuveen Equity Index Fund.”
Nuveen Small Cap Select Fund. Allen D. Steinkopf, CFA, has managed the fund since July 2004. He entered the financial services industry in 1993 and joined FAF in 2003. He joined Nuveen Asset Management on January 1, 2011 in connection with its acquisition of a portion of FAF’s asset management business.
Mark A. Traster, CFA, has managed the fund since December 2008. Mr. Traster entered the financial services industry in 1992 and joined FAF in 2004. He joined Nuveen Asset Management on January 1, 2011 in connection with its acquisition of a portion of FAF’s asset management business.
82
Section 2 How We Manage Your Money
Nuveen Small Cap Value Fund. Karen L. Bowie, has managed the fund since July 2005. Information on Ms. Bowie appears above under “Nuveen Mid Cap Value Fund.”
Nuveen Tactical Market Opportunities Fund. David R. Cline has managed the fund since December 2009. Information on Mr. Cline appears above under “Nuveen Quantitative Enhanced Core Equity Fund.”
Walter A. French has managed the fund since December 2009. Information on Mr. French appears above under “Nuveen Equity Index Fund.”
David A. Friar has managed the fund since December 2009. Information on Mr. Friar appears above under “Nuveen Equity Index Fund.”
Keith B. Hembre, CFA, has managed the fund since the fund’s inception in December 2009. Information on Mr. Hembre appears above under “Nuveen International Fund.”
Derek B. Bloom, CFA, has managed the fund since February 2011. Information on Mr. Bloom appears above under “Nuveen International Fund.”
Additional information about the portfolio managers’ compensation, other accounts managed by the portfolio managers and the portfolio managers’ ownership of securities in the funds is provided in the statement of additional information.
Management Fees
The management fee schedule for each fund consists of two components: a fund-level fee, based only on the amount of assets within a fund, and a complex-level fee, based on the aggregate amount of all eligible fund assets managed by Nuveen Fund Advisors.
The annual fund-level fee, payable monthly, is based upon the average daily net assets of each fund as follows:
| | | | | | | | | | | | | | | | | | | | | | | | | | | | | | | | |
| Average Daily Net Assets | | Nuveen
Dividend
Value
Fund | | | Nuveen Equity Index Fund | | | Nuveen Inter-
national Fund | | | Nuveen Inter- national Select Fund | | | Nuveen
Large
Cap
Growth
Oppor-
tunities
Fund | | | Nuveen
Large
Cap
Select
Fund | | | Nuveen
Large
Cap
Value
Fund | | | Nuveen
Mid
Cap
Growth
Oppor-
tunities
Fund | |
| For the first $125 million | | | 0.6000 | % | | | 0.1000 | % | | | 0.8500 | % | | | 0.8500 | % | | | 0.6500 | % | | | 0.5500 | % | | | 0.5500 | % | | | 0.7000 | % |
| For the next $125 million | | | 0.5875 | % | | | 0.0875 | % | | | 0.8375 | % | | | 0.8375 | % | | | 0.6375 | % | | | 0.5375 | % | | | 0.5375 | % | | | 0.6875 | % |
| For the next $250 million | | | 0.5750 | % | | | 0.0750 | % | | | 0.8250 | % | | | 0.8250 | % | | | 0.6250 | % | | | 0.5250 | % | | | 0.5250 | % | | | 0.6750 | % |
| For the next $500 million | | | 0.5625 | % | | | 0.0625 | % | | | 0.8125 | % | | | 0.8125 | % | | | 0.6125 | % | | | 0.5125 | % | | | 0.5125 | % | | | 0.6625 | % |
| For the next $1 billion | | | 0.5500 | % | | | 0.0500 | % | | | 0.8000 | % | | | 0.8000 | % | | | 0.6000 | % | | | 0.5000 | % | | | 0.5000 | % | | | 0.6500 | % |
| For net assets over $2 billion | | | 0.5250 | % | | | 0.0250 | % | | | 0.7750 | % | | | 0.7750 | % | | | 0.5750 | % | | | 0.4750 | % | | | 0.4750 | % | | | 0.6250 | % |
| | | | | | | | | | | | | | | | | | | | | | | | | | | | | | | | | | | | |
| Average Daily Net Assets | | Nuveen Mid
Cap Index Fund | | | Nuveen
Mid
Cap
Select
Fund | | | Nuveen
Mid
Cap
Value
Fund | | | Nuveen Quanti- tative Enhanced Core
Equity Fund | | | Nuveen
Small
Cap
Growth
Oppor-
tunities
Fund | | | Nuveen Small
Cap Index Fund | | | Nuveen
Small Cap
Select
Fund | | | Nuveen Small
Cap Value Fund | | | Nuveen
Tactical
Market
Oppor- tunities
Fund | |
| For the first $125 million | | | 0.1500 | % | | | 0.7000 | % | | | 0.7000 | % | | | 0.3000 | % | | | 0.8000 | % | | | 0.1500 | % | | | 0.7000 | % | | | 0.7000 | % | | | 0.6000 | % |
| For the next $125 million | | | 0.1375 | % | | | 0.6875 | % | | | 0.6875 | % | | | 0.2875 | % | | | 0.7875 | % | | | 0.1375 | % | | | 0.6875 | % | | | 0.6875 | % | | | 0.5875 | % |
| For the next $250 million | | | 0.1250 | % | | | 0.6750 | % | | | 0.6750 | % | | | 0.2750 | % | | | 0.7750 | % | | | 0.1250 | % | | | 0.6750 | % | | | 0.6750 | % | | | 0.5750 | % |
| For the next $500 million | | | 0.1125 | % | | | 0.6625 | % | | | 0.6625 | % | | | 0.2625 | % | | | 0.7625 | % | | | 0.1125 | % | | | 0.6625 | % | | | 0.6625 | % | | | 0.5625 | % |
| For the next1 $1 billion | | | 0.1000 | % | | | 0.6500 | % | | | 0.6500 | % | | | 0.2500 | % | | | 0.7500 | % | | | 0.1000 | % | | | 0.6500 | % | | | 0.6500 | % | | | 0.5500 | % |
| For net assets over $2 billion | | | 0.0750 | % | | | 0.6250 | % | | | 0.6250 | % | | | 0.2250 | % | | | 0.7250 | % | | | 0.0750 | % | | | 0.6250 | % | | | 0.6250 | % | | | 0.5250 | % |
Each fund’s complex-level fee rate is determined by taking the current overall complex-level fee rate, which is based on the aggregate amount of the “eligible assets” of all Nuveen funds, and making, as appropriate, an upward adjustment to that rate based upon the percentage of the particular fund’s assets that are not “eligible assets.” The maximum overall complex-level fee rate is 0.2000% of a fund’s
Section 2 How We Manage Your Money
83
average daily net assets, which is based upon complex-level eligible assets of $55 billion, with the complex-level fee rate decreasing incrementally for eligible assets above that level. Fund-specific complex-level fee rates will not exceed the maximum overall complex-level fee rate of 0.2000%. As of December 31, 2011, the funds’ complex-level fee rates were as follows:
| | | | |
| | | Complex-Level Fee Rate | |
| Nuveen Dividend Value Fund | | | 0.1953 | % |
| Nuveen Equity Index Fund | | | 0.2000 | % |
| Nuveen International Fund | | | 0.2000 | % |
| Nuveen International Select Fund | | | 0.2000 | % |
| Nuveen Large Cap Growth Opportunities Fund | | | 0.1997 | % |
| Nuveen Large Cap Select Fund | | | 0.2000 | % |
| Nuveen Large Cap Value Fund | | | 0.2000 | % |
| Nuveen Mid Cap Growth Opportunities Fund | | | 0.1993 | % |
| Nuveen Mid Cap Index Fund | | | 0.1945 | % |
| Nuveen Mid Cap Select Fund | | | 0.2000 | % |
| Nuveen Mid Cap Value Fund | | | 0.2000 | % |
| Nuveen Quantitative Enhanced Core Equity Fund | | | 0.2000 | % |
| Nuveen Small Cap Growth Opportunities Fund | | | 0.2000 | % |
| Nuveen Small Cap Index Fund | | | 0.1978 | % |
| Nuveen Small Cap Select Fund | | | 0.2000 | % |
| Nuveen Small Cap Value Fund | | | 0.2000 | % |
| Nuveen Tactical Market Opportunities Fund | | | 0.1814 | % |
The table below reflects management fees paid to FAF (prior to January 1, 2011) and to Nuveen Fund Advisors (starting on January 1, 2011), after taking into account any fee waivers, for the funds’ most recently completed fiscal year. FAF provided advisory services pursuant to a different management agreement with a different fee schedule. FAF did not provide any administrative services under that agreement.
| | | | |
| | | Management Fee
as a % of Average
Daily Net Assets | |
| Nuveen Dividend Value Fund | | | 0.75 | % |
| Nuveen Equity Index Fund | | | 0.19 | % |
| Nuveen International Fund | | | 1.02 | % |
| Nuveen International Select Fund | | | 1.02 | % |
| Nuveen Large Cap Growth Opportunities Fund | | | 0.80 | % |
| Nuveen Large Cap Select Fund | | | 0.73 | % |
| Nuveen Large Cap Value Fund | | | 0.72 | % |
| Nuveen Mid Cap Growth Opportunities Fund | | | 0.84 | % |
| Nuveen Mid Cap Index Fund | | | 0.28 | % |
| Nuveen Mid Cap Select Fund | | | 0.31 | % |
| Nuveen Mid Cap Value Fund | | | 0.83 | % |
| Nuveen Quantitative Enhanced Core Equity Fund | | | 0.28 | % |
| Nuveen Small Cap Growth Opportunities Fund | | | 0.91 | % |
| Nuveen Small Cap Index Fund | | | 0.02 | % |
| Nuveen Small Cap Select Fund | | | 0.80 | % |
| Nuveen Small Cap Value Fund | | | 0.84 | % |
| Nuveen Tactical Market Opportunities Fund | | | 0.54 | % |
Nuveen Fund Advisors has contractually agreed to waive fees and/or reimburse expenses through February 28, 2013 so that total annual fund operating expenses, after fee waivers and/or expense reimbursements and
84
Section 2 How We Manage Your Money
excluding acquired fund fees and expenses, for the following funds do not exceed the percentages of the average daily net assets listed below of any class of fund shares.
| | | | | | | | | | | | | | | | | | | | |
| Fund | | Class A | | | Class B | | | Class C | | | Class R3 | | | Class I | |
| Nuveen Equity Index Fund | | | 0.62 | % | | | 1.37 | % | | | 1.37 | % | | | 0.87 | % | | | 0.37 | % |
| Nuveen International Fund | | | 1.49 | % | | | — | | | | 2.24 | % | | | 1.74 | % | | | 1.24 | % |
| Nuveen International Select Fund | | | 1.49 | % | | | — | | | | 2.24 | % | | | 1.74 | % | | | 1.24 | % |
| Nuveen Mid Cap Index Fund | | | 0.75 | % | | | — | | | | 1.50 | % | | | 1.00 | % | | | 0.50 | % |
| Nuveen Mid Cap Select Fund | | | 1.41 | % | | | — | | | | 2.16 | % | | | — | | | | 1.16 | % |
| Nuveen Mid Cap Value Fund | | | 1.34 | % | | | 2.09 | % | | | 2.09 | % | | | 1.59 | % | | | 1.09 | % |
| Nuveen Quantitative Enhanced Core Equity Fund | | | 0.70 | % | | | — | | | | 1.45 | % | | | — | | | | 0.45 | % |
| Nuveen Small Cap Growth Opportunities Fund | | | 1.47 | % | | | 2.22 | % | | | 2.22 | % | | | 1.72 | % | | | 1.22 | % |
| Nuveen Small Cap Index Fund | | | 0.83 | % | | | — | | | | 1.58 | % | | | 1.08 | % | | | 0.58 | % |
| Nuveen Small Cap Value Fund | | | 1.50 | % | | | — | | | | 2.25 | % | | | 1.75 | % | | | 1.25 | % |
| Nuveen Tactical Market Opportunities Fund | | | 1.20 | % | | | — | | | | 1.95 | % | | | — | | | | 0.95 | % |
The expense limitations described above may be terminated or modified prior to that date only with the approval of the Board of Directors of the funds.
Nuveen Fund Advisors has agreed to reimburse management fees across all share classes through December 31, 2012, for the funds listed in the table below, to the extent necessary to maintain Class I share total annual operating expenses, not including any acquired fund fees and expenses, at the applicable percentage of daily net assets listed in the Maximum Expense Level column of the table below, provided that in no event will Nuveen Fund Advisors be required to make any reimbursements that would result in an annualized net management fee of less than the applicable percentage of daily net assets listed in the Minimum Management Fee column of the below.
| | | | | | | | |
| Fund | | Maximum Expense Level | | | Minimum Management Fee | |
| Nuveen Dividend Value Fund | | | 0.95 | % | | | 0.78 | % |
| Nuveen Large Cap Growth Opportunities Fund | | | 0.98 | % | | | 0.80 | % |
| Nuveen Large Cap Select Fund | | | 1.13 | % | | | 0.75 | % |
| Nuveen Large Cap Value Fund | | | 1.06 | % | | | 0.74 | % |
| Nuveen Mid Cap Growth Opportunities Fund | | | 0.99 | % | | | 0.84 | % |
| Nuveen Small Cap Select Fund | | | 1.00 | % | | | 0.80 | % |
Information regarding the Board of Directors’ approval of the investment management agreements for the funds is currently available in the funds’ annual reports to shareholders for the fiscal year ended October 31, 2011.

The funds’ investment objectives, which are described in the “Fund Summaries” section, may be changed without shareholder approval. If a fund’s investment objective changes, you will be notified at least 60 days in advance. The funds’ investment policies may be changed by the Board of Directors without shareholder approval unless otherwise noted in this prospectus or the statement of additional information.
The funds’ principal investment strategies are discussed in the “Fund Summaries” section. These are the strategies that the funds’ investment adviser and sub-adviser(s) believe are most likely to be important in trying to achieve the funds’ investment objectives. This section provides more information about these strategies, as well as information about some additional strategies that the funds’ sub-adviser(s) uses, or may use, to achieve the funds’ objectives. You should be aware that each fund may also use strategies and invest in securities that are not
Section 2 How We Manage Your Money
85
described in this prospectus, but that are described in the statement of additional information. For a copy of the statement of additional information, call Nuveen Investor Services at (800) 257-8787 or visit Nuveen’s website at www.nuveen.com.
Securities Lending
Each fund, other than Nuveen Tactical Market Opportunities Fund, may lend securities representing up to one-third of the value of its total assets to broker-dealers, banks, and other institutions to generate additional income. When a fund loans its portfolio securities, it will receive, at the inception of each loan, cash collateral equal to at least 102% of the value of the loaned securities. Under these funds’ securities lending agreement, the securities lending agent will generally bear the risk that a borrower may default on its obligation to return loaned securities. The funds, however, will be responsible for the risks associated with the investment of cash collateral. A fund may lose money on its investment of cash collateral or may fail to earn sufficient income on its investment to meet its obligations to the borrower.
When a dividend is paid on a security that is out on loan, the borrower receives the dividend and in turn makes a payment of the same amount to the fund. Dividends, if they constitute “qualified dividends,” are taxable at the same rate as long-term capital gains. These payments made by borrowers, however, are not qualified dividends, and are taxable at higher ordinary income rates. As a result, some of the distributions received by shareholders who hold fund shares in taxable accounts may be subject to taxation at a higher rate than if the fund had not loaned its portfolio securities.
Temporary Investments
In an attempt to respond to adverse market, economic, political, or other conditions, each fund may temporarily invest without limit in cash and in U.S. dollar-denominated high-quality money market instruments and other short-term securities, including money market funds. Being invested in these securities may keep a fund from participating in a market upswing and prevent the fund from achieving its investment objective.
Foreign Government Obligations
As a principal investment strategy, Nuveen Tactical Market Opportunities Fund may purchase foreign government obligations that are non-dollar denominated or dollar denominated. While the foreign government obligations that the fund may purchase must have an investment grade rating from at least one rating agency, it is possible that such obligations will be issued by governments of emerging market countries. If the rating of a security is reduced below investment grade after purchase, the fund is not required to sell the security, but may consider doing so.
ETFs and Money Market Funds
As a principal investment strategy, Nuveen International Fund, Nuveen International Select Fund, Nuveen Quantitative Enhanced Core Equity Fund and Nuveen Tactical Market Opportunities Fund may invest in securities of other open-end or closed-end investment companies, including exchange-traded funds (“ETFs”), that invest primarily in securities of the types in which the funds may invest directly. An ETF is an investment company that holds a portfolio of securities generally designed to track the performance of a securities index, including industry, sector, country and region indexes. ETFs trade on a securities exchange and their shares may, at times, trade at a premium or discount to their net asset value. In addition, the funds will incur brokerage costs when purchasing and selling shares of ETFs. The funds will not invest in leveraged ETFs.
Generally, investments in ETFs are subject to statutory limitations prescribed by the 1940 Act. These limitations include a prohibition on a fund acquiring more than 3% of the voting shares of any other investment company, and a prohibition on investing more than 5% of a fund’s total assets in the securities of any one investment company or more than 10% of its total assets, in the aggregate, in investment company
86
Section 2 How We Manage Your Money
securities. Many ETFs, however, have obtained exemptive relief from the Securities and Exchange Commission (“SEC”) to permit unaffiliated funds to invest in the ETFs’ shares beyond these statutory limitations, subject to certain conditions and pursuant to a contractual arrangement between the ETFs and the investing funds. Nuveen Tactical Market Opportunities Fund intends to rely on these exemptive orders in order to invest in unaffiliated ETFs beyond the foregoing statutory limitations. Subject to certain conditions, Nuveen Tactical Market Opportunities Fund also may invest in money market funds beyond the statutory limits described above.
Portfolio Holdings
A description of the funds’ policies and procedures with respect to the disclosure of the funds’ portfolio holdings is available in the funds’ statement of additional information. Certain portfolio holdings information for each fund is available on the funds’ website—www.nuveen.com—by clicking the “Our Products—Mutual Funds” link on the home page and following the applicable link for your fund in the “Search Mutual Fund Family” section. By following these links, you can obtain a list of your fund’s top ten holdings as of the end of the most recent month. A complete list of portfolio holdings information is generally made available on the funds’ website ten business days after the end of the month. This information will remain available on the website until the funds file with the Securities and Exchange Commission their annual, semi-annual or quarterly holdings report for the fiscal period that includes the date(s) as of which the website information is current.

Risk is inherent in all investing. Investing in a mutual fund—even the most conservative—involves risk, including the risk that you may receive little or no return on your investment or even that you may lose part or all of your investment. Therefore, before investing you should consider carefully the principal risks for each fund and the other risks listed alphabetically below that you assume when you invest in the funds. Because of these risks, you should consider an investment in the funds to be a long-term investment.
Principal Risks
Commodities risk: Nuveen Tactical Market Opportunities Fund may invest in instruments providing exposure to commodities as a principal investment strategy. Commodities markets historically have been extremely volatile, and the performance of securities that provide an exposure to those markets therefore also may be highly volatile. Commodity prices are affected by factors such as the cost of producing commodities, changes in consumer demand for commodities, the hedging and trading strategies of producers and consumers of commodities, speculative trading in commodities by commodity pools and other market participants, disruptions in commodity supply, drought, floods, weather, livestock disease, embargoes, tariffs, and international economic, political, and regulatory developments. Suspensions or disruptions of market trading in the commodities markets and related futures markets may adversely affect the value of securities providing an exposure to the commodities markets.
Credit risk: Nuveen Dividend Value Fund and Nuveen Tactical Market Opportunities Fund are subject to the principal risk that the issuers of debt securities held by the fund, or to which the fund has exposure, will not make payments on the securities. There is also the risk that an issuer could suffer adverse changes in financial condition that could lower the credit quality of a security. This could lead to greater volatility in the price of the security and in shares of the fund. Also, a change in the credit quality rating of a bond could affect the bond’s liquidity and make it more difficult for the fund to sell. When the fund purchases unrated securities, it will depend on the sub-adviser’s analysis of credit risk without the assessment of an independent rating organization, such as Moody’s or Standard & Poor’s.
Section 2 How We Manage Your Money
87
Derivatives risk: The use of derivatives presents risks different from, and possibly greater than, the risks associated with investing directly in traditional securities. Among the risks presented are market risk, credit risk, management risk and liquidity risk. Derivatives can be highly volatile, illiquid and difficult to value, and there is the risk that changes in the value of a derivative held by a fund will not correlate with the underlying instruments or the fund’s other investments.
The use of derivatives can lead to losses because of adverse movements in the price or value of the underlying asset, index or rate, which may be magnified by certain features of the derivatives. Derivative instruments also involve the risk that a loss may be sustained as a result of the failure of the counterparty to the derivative instruments to make required payments or otherwise comply with the derivative instruments’ terms. These risks are heightened when the management team uses derivatives to enhance a fund’s return or as a substitute for a position or security, rather than solely to hedge (or offset) the risk of a position or security held by the fund.
In addition, when a fund invests in certain derivative securities, including, but not limited to, when-issued securities, forward commitments, futures contracts and interest rate swaps, it is effectively leveraging its investments, which could result in exaggerated changes in the net asset value of the funds’ shares and can result in losses that exceed the amount originally invested. The success of a fund’s derivatives strategies will depend on the sub-adviser’s ability to assess and predict the impact of market or economic developments on the underlying asset, index or rate and the derivative itself, without the benefit of observing the performance of the derivative under all possible market conditions. A fund may also enter into over-the-counter (OTC) transactions in derivatives. Transactions in the OTC markets generally are conducted on a principal-to-principal basis. The terms and conditions of these instruments generally are not standardized and tend to be more specialized or complex, and the instruments may be harder to value. In addition, certain derivative instruments and markets may not be liquid, which means the fund may not be able to close out a derivatives transaction in a cost-efficient manner.
Short positions in derivatives may involve greater risks than long positions, as the risk of loss is theoretically unlimited (unlike a long position, in which the risk of loss may be limited to the amount invested).
Equity security risk: Equity securities may decline significantly in price over short or extended periods of time. Price changes may occur in the market as a whole, or they may occur in only a particular country, company, industry, or sector of the market. In addition, the types of securities in which a particular fund invests, such as value stocks, growth stocks, large-capitalization stocks, mid-capitalization stocks, small-capitalization stocks and/or micro-capitalization stocks, may underperform the market as a whole.
ETF risk: As a principal investment strategy, Nuveen Tactical Market Opportunities Fund may invest in ETFs. Like any fund, an ETF is subject to the risks of the underlying securities that it holds. In addition, investments in ETFs present certain risks that do not apply to investments in traditional mutual funds. While an ETF seeks to achieve the same returns as a particular market index, the performance of an ETF may diverge from the performance of such index (commonly known as tracking error). ETFs are subject to fees and expenses (like management fees and operating expenses) that do not apply to an index. Moreover, ETFs are limited in their ability to perfectly replicate the composition of an index and ETF shares may trade at a premium or discount to their net asset value. As ETFs trade on an exchange, they are subject to the risks of any exchange-traded instrument, including: (i) an active trading market for its shares may not develop or be maintained, (ii) trading of its shares may be halted by the exchange, and (iii) its shares may be delisted from the exchange.
Failure to match index performance: The ability of Nuveen Equity Index Fund, Nuveen Mid Cap Index Fund and Nuveen Small Cap Index Fund to replicate the performance of their respective indices may be affected by, among other things, changes in securities markets, the manner in which performance of the index is
88
Section 2 How We Manage Your Money
calculated, changes in the composition of the index, the amount and timing of cash flows into and out of the fund, commissions, sales charges (if any), and other expenses.
Frequent trading risk: Frequent trading of fund securities may produce capital gains, which are taxable to shareholders when distributed. Frequent trading may also increase the amount of commissions or mark-ups to broker-dealers that a fund pays when it buys and sells securities, which may detract from the fund’s performance.
Futures contract risk: The use of futures contracts involves additional risks and transaction costs which could leave the fund in a worse position than if it had not used these instruments. Futures contracts may entail investment exposures that are greater than their cost would suggest. As a result, a small investment in futures contracts could have a large impact on performance.
High yield securities risk: As a principal investment strategy, Nuveen Dividend Value Fund may invest in securities which are rated lower than investment grade. Nuveen Tactical Market Opportunities Fund may invest in instruments providing exposure to securities that are rated lower than investment grade as a principal investment strategy. High yield securities usually offer higher yields than investment grade securities, but also involve more risk. High yield securities may be more susceptible to real or perceived adverse economic conditions than investment grade securities. In addition, the secondary trading market may be less liquid, meaning that it may be more difficult to sell or buy a security at a favorable price or time. Consequently, a fund may have to accept a lower price to sell a security, sell other securities to raise cash, or give up an investment opportunity, any of which could have a negative impact on the fund’s performance. High yield securities generally have more volatile prices and carry more risk to principal than investment grade securities.
Interest rate risk: Nuveen Dividend Value Fund and Nuveen Tactical Market Opportunities Fund may invest in or have exposure to debt securities as a principal investment strategy. Debt securities fluctuate in value with changes in interest rates. In general, debt securities will increase in value when interest rates fall and decrease in value when interest rates rise. Longer-term debt securities are generally more sensitive to interest rate changes.
Investment focus risk: Different types of stocks tend to shift in and out of favor depending on market and economic conditions. Funds that emphasize a growth style of investing often seek companies experiencing high rates of current growth; such companies may be more volatile than other types of investments. Funds that emphasize a value style of investing often seek undervalued companies with characteristics for improved valuations; such companies are subject to the risk that the valuations never improve. Certain funds invest in companies with new, limited or cyclical product lines, services, markets, distribution channels or financial resources, or companies where the management of such companies may be dependent upon one or a few key people, or companies conducting initial public offerings or other major corporate events such as acquisitions, mergers, or liquidations; such companies can be subject to more abrupt or erratic market movements than stocks of larger, more established companies or the stock markets in general.
Mid-cap stock risk: While stocks of mid-cap companies may be slightly less volatile than those of small-cap companies, they still involve substantial risk. Mid-cap companies may have limited product lines, markets or financial resources, and they may be dependent on a limited management group. Stocks of mid-cap companies may be subject to more abrupt or erratic market movements than those of larger, more established companies or the market averages in general.
Multi-manager risk: Because each sub-adviser of Nuveen International Fund and Nuveen International Select Fund makes investment decisions independently, it is possible that the security selection process of the sub-advisers may not complement one another. As a result, each fund’s exposure to a given security, industry, sector or market capitalization could be smaller or larger than would be the case if the fund was managed by a single sub-adviser. It is possible that one or more of the
Section 2 How We Manage Your Money
89
sub-advisers may, at any time, take positions that may be opposite of positions taken by other sub-advisers. In such cases, the funds will incur brokerage and other transaction costs, without accomplishing any net investment results. Sub-advisers also may be competing with one another for similar positions at the same time, which could have the result of increasing a security’s cost. The multi-manager approach could increase each fund’s portfolio turnover rates which may result in higher levels of realized capital gains or losses with respect to each fund’s portfolio securities, and higher brokerage commissions and other transaction costs. The sub-advisers selected may underperform the market generally or other sub-advisers that could have been selected for the funds.
Non-U.S./emerging markets risk: Nuveen International Fund and Nuveen International Select Fund invest primarily in equity securities that trade in markets other than the United States. Nuveen Tactical Market Opportunities Fund may invest in foreign government obligations that have an investment grade rating from at least one rating agency, and may have exposure to securities that were issued or trade outside the United States. Each other fund, other than Nuveen Equity Index Fund, Nuveen Mid Cap Index Fund, Nuveen Small Cap Index Fund and Nuveen Quantitative Enhanced Core Equity Fund, may also invest in equity securities that trade in markets other than the United States as a principal investment strategy. Non-U.S. companies or U.S. companies with significant non-U.S. operations may be subject to risks in addition to those of companies that principally operate in the United States due to political, social and economic developments abroad, different regulatory environments and laws, potential seizure by the government of company assets, higher taxation, withholding taxes on dividends and interest and limitations on the use or transfer of portfolio assets. To the extent a fund is allowed to invest in depositary receipts, the fund will be subject to many of the same risks as when investing directly in non-U.S. securities. The holder of an unsponsored depositary receipt may have limited voting rights and may not receive as much information about the issuer of the underlying securities as would the holder of a sponsored depositary receipt.
Other non-U.S. investment risks include the following:
| | • | | Enforcing legal rights may be difficult, costly and slow in non-U.S. countries, and there may be special problems enforcing claims against non-U.S. governments. |
| | • | | Non-U.S. companies may not be subject to accounting standards or governmental supervision comparable to U.S. companies, and there may be less public information about their operations. |
| | • | | Non-U.S. markets may be less liquid and more volatile than U.S. markets. |
| | • | | The U.S. and non-U.S. markets often rise and fall at different times or by different amounts due to economic or other developments particular to a given country or region. This phenomenon would tend to lower the overall price volatility of a portfolio that included both U.S. and non-U.S. securities. Sometimes, however, global trends will cause the U.S. and non-U.S. markets to move in the same direction, reducing or eliminating the risk reduction benefit of international investing. |
| | • | | Because the non-U.S. securities in which the funds invest, with the exception of American Depositary Receipts, generally trade in currencies other than the U.S. dollar, changes in currency exchange rates will affect the fund’s net asset value, the value of dividends and interest earned, and gains and losses realized on the sale of securities. A strong U.S. dollar relative to these other currencies will adversely affect the value of the fund. |
| | • | | Securities of companies traded in many countries outside the United States, particularly emerging markets countries, may be subject to further risks due to the inexperience of local investment professionals and financial institutions, the possibility of permanent or temporary termination of trading, and greater spreads between bid and asked prices for securities. In addition, non-U.S. exchanges and investment professionals are subject to less governmental regulation, and commissions may be higher than in the United States. Also, there may be delays in the settlement of non-U.S. exchange transactions. |
90
Section 2 How We Manage Your Money
| | • | | A fund’s income from non-U.S. issuers may be subject to non-U.S. withholding taxes. In some countries, the fund also may be subject to taxes on trading profits and, on certain securities transactions, transfer or stamp duties tax. To the extent non-U.S. income taxes are paid by the fund, U.S. shareholders may be entitled to a credit or deduction for U.S. tax purposes. |
| | • | | Some countries, particularly emerging markets, restrict to varying degrees foreign investment in their securities markets. In some circumstances, these restrictions may limit or preclude investment in certain countries or may increase the cost of investing in securities of particular companies. |
| | • | | Emerging markets generally do not have the level of market efficiency and strict standards in accounting and securities regulation to be on par with advanced economies. Investments in emerging markets come with much greater risk due to political instability, domestic infrastructure problems, currency volatility and limited equity opportunities (many large companies may still be “state-run” or private). Also, local exchanges may not offer liquid markets for outside investors. |
Other investment companies: Nuveen International Fund, Nuveen International Select Fund, Nuveen Quantitative Enhanced Core Equity Fund and Nuveen Tactical Market Opportunities Fund may invest in other investment companies as a principal investment strategy. When a fund invests in other investment companies, you bear both your proportionate share of fund expenses and, indirectly, the expenses of the other investment companies.
Small-cap stock risk: As a principal investment strategy, Nuveen Small Cap Growth Opportunities Fund, Nuveen Small Cap Index Fund, Nuveen Small Cap Select Fund and Nuveen Small Cap Value Fund invest in small-cap stocks, which involve substantial risk. Stocks of small-cap companies involve substantial risk. These companies may lack the management expertise, financial resources, product diversification, and competitive strengths of larger companies. Prices of small-cap stocks may be subject to more abrupt or erratic movements than stock prices of larger, more established companies or the market averages in general. In addition, the frequency and volume of their trading may be less than is typical of larger companies, making them subject to wider price fluctuations. In some cases, there could be difficulties in selling the stocks of small-cap companies at the desired time and price. Stocks at the bottom end of the capitalization range of small-cap companies sometimes are referred to as “micro-cap” stocks. These stocks may be subject to extreme price volatility, as well as limited liquidity and limited research.
Smaller company risk: Prices of small-cap stocks may be subject to more abrupt or erratic movements, and to wider fluctuations, than stock prices of larger, more established companies or the market averages in general. It may be difficult to sell small-cap stocks at the desired time and price. While mid-cap stocks may be slightly less volatile than small-cap stocks, they still involve similar risks. As a principal investment strategy, Nuveen Mid Cap Growth Opportunities Fund, Nuveen Mid Cap Index Fund, Nuveen Mid Cap Select Fund, and Nuveen Mid Cap Value Fund invest in mid-cap stocks.
Other Risks
Inflation risk: The value of assets or income from investments may be less in the future as inflation decreases the value of money. As inflation increases, the value of a fund’s assets can decline, as can the value of a fund’s distributions.
Small fund risk: Nuveen Large Cap Select Fund and Nuveen Mid Cap Select Fund currently have less assets than similar funds, and like other relatively small funds, large inflows and outflows may impact a fund’s market exposure for limited periods of time, causing a fund’s performance to vary from that of a fund’s model portfolio. This impact may be positive or negative, depending on the direction of market movement during the period affected. The funds have policies in place which seek to reduce the impact of these flows where Nuveen Fund Advisors has prior knowledge of them.
Section 2 How We Manage Your Money
91
Section 3 How You Can Buy and Sell Shares
The funds offer multiple classes of shares, each with a different combination of sales charges, fees, eligibility requirements and other features. Your financial advisor can help you determine which class is best for you. For further details, please see the statement of additional information.

Class A Shares
Nuveen Equity Index Fund, Nuveen Mid Cap Index Fund, Nuveen Small Cap Index Fund and Nuveen Quantitative Large Cap Core Fund only issue Class A shares for purchase by certain retirement plans and by qualifying clients of investment advisers, financial planners or other financial intermediaries that charge periodic or asset-based fees for their service. Class A shares are offered to these investors at their net asset value per share with no up-front sales charge.
For all other funds, you can purchase Class A shares at the offering price, which is the net asset value per share plus an up-front sales charge. You may qualify for a reduced sales charge, or the sales charge may be waived, as described in “How to Reduce Your Sales Charge.” Class A shares are also subject to an annual service fee of 0.25% of your fund’s average daily net assets, which compensates your financial advisor or other financial intermediary for providing ongoing service to you. Nuveen Securities, LLC (the “Distributor”), a subsidiary of Nuveen Investments and the distributor of the funds, retains the up-front sales charge and the service fee on accounts with no financial intermediary of record. The up-front Class A sales charges for the funds are as follows:
| | | | | | | | | | | | |
| Amount of Purchase | | Sales Charge as %
of Public Offering Price | | | Sales Charge as %
of Net Amount Invested | | | Maximum Financial Intermediary Commission as % of Public Offering Price | |
| Less than $50,000 | | | 5.75 | % | | | 6.10 | % | | | 5.00 | % |
| $50,000 but less than $100,000 | | | 4.50 | | | | 4.71 | | | | 4.00 | |
| $100,000 but less than $250,000 | | | 3.75 | | | | 3.90 | | | | 3.25 | |
| $250,000 but less than $500,000 | | | 2.75 | | | | 2.83 | | | | 2.50 | |
| $500,000 but less than $1,000,000 | | | 2.00 | | | | 2.04 | | | | 1.75 | |
| $1,000,000 and over* | | | — | | | | — | | | | 1.00 | |
| | * | You can purchase $1 million or more of Class A shares at net asset value without an up-front sales charge. The Distributor pays financial intermediaries of record a commission equal to 1% of the first $2.5 million, plus 0.75% of the next $2.5 million, plus 0.50% of the amount over $5 million. Unless you are eligible for a waiver, you may be assessed a contingent deferred sales charge (“CDSC”) of 1% if you redeem any of your shares within 12 months of purchase. See “How to Sell Shares—Contingent Deferred Sales Charge” below for more information. |
Class B Shares
Nuveen International Fund, Nuveen International Select Fund, Nuveen Large Cap Select Fund, Nuveen Large Cap Value Fund, Nuveen Mid Cap Index Fund, Nuveen Mid Cap Select Fund, Nuveen Quantitative Enhanced Core Equity Fund, Nuveen Small Cap Index Fund, Nuveen Small Cap Value Fund and Nuveen Tactical Market Opportunities Fund do not issue Class B shares. The remaining funds will issue Class B shares upon the exchange of Class B shares from another Nuveen Mutual Fund or for purposes of dividend reinvestment, but Class B shares are not available for new accounts or for additional investment into existing accounts.
Class B shares are subject to annual distribution and service fees of 1% of your fund’s average daily net assets. The annual 0.25% service fee compensates your financial advisor or other financial intermediary for providing ongoing service to you. The annual 0.75% distribution fee compensates the Distributor for paying your
92
Section 3 How You Can Buy and Sell Shares
financial advisor or other financial intermediary a 4.25% up-front sales commission, which includes an advance of the first year’s service fee. The Distributor retains the service and distribution fees on accounts with no financial intermediary of record. If you redeem your shares within six years of purchase, you will normally pay a CDSC as shown in the schedule below. The CDSC is based on your purchase price or redemption proceeds, whichever is lower. You do not pay a CDSC on any Class B shares you purchase by reinvesting dividends.
| | | | | | | | | | | | | | | | | | | | | | | | | | | | |
| Years Since Purchase | | 0-1 | | | 1-2 | | | 2-3 | | | 3-4 | | | 4-5 | | | 5-6 | | | Over 6 | |
| CDSC | | | 5 | % | | | 5 | % | | | 4 | % | | | 3 | % | | | 2 | % | | | 1 | % | | | None | |
Class B shares automatically convert to Class A shares eight years after you buy them so that the distribution fees you pay over the life of your investment are limited. You will continue to pay an annual service fee on any converted Class B shares.
Class C Shares
You can purchase Class C shares at the offering price, which is the net asset value per share without any up-front sales charge. Class C shares are subject to annual distribution and service fees of 1% of your fund’s average daily net assets. The annual 0.25% service fee compensates your financial advisor or other financial intermediary for providing ongoing service to you. The annual 0.75% distribution fee compensates the Distributor for paying your financial advisor or other financial intermediary an ongoing sales commission as well as an advance of the first year’s service and distribution fees. The Distributor retains the service and distribution fees on accounts with no financial intermediary of record. If you redeem your shares within 12 months of purchase, you will normally pay a 1% CDSC, which is calculated on the lower of your purchase price or redemption proceeds. You do not pay a CDSC on any Class C shares you purchase by reinvesting dividends. Class C shares do not convert.
The funds have established a limit to the amount of Class C shares that may be purchased by an individual investor. See the statement of additional information for more information.
Class R3 Shares
Nuveen Mid Cap Select Fund, Nuveen Quantitative Enhanced Core Equity Fund and Nuveen Tactical Market Opportunities Fund do not issue Class R3 shares. You can purchase Class R3 shares of the remaining funds at the offering price, which is the net asset value per share without any up-front sales charge. Class R3 shares are subject to annual distribution and service fees of 0.50% of your fund’s average daily net assets. Class R3 shares are only available for purchase by eligible retirement plans. Class R3 shares are not available to traditional and Roth IRAs, Coverdell Education Savings Accounts, SEPs, SAR-SEPs, SIMPLE IRAs or individual 403(b) plans. See the statement of additional information for more information.
Class I Shares
You can purchase Class I shares at the offering price, which is the net asset value per share without any up-front sales charge. As Class I shares are not subject to sales charges or ongoing service or distribution fees, they have lower ongoing expenses than the other classes.
Class I shares are available for purchase by clients of financial intermediaries who charge such clients an ongoing fee for advisory, investment, consulting or related services. Such clients may include individuals, corporations, endowments and foundations. The minimum initial investment for such clients is $100,000, but this minimum will be lowered to $250 for clients of financial intermediaries that have accounts holding Class I shares with an aggregate value of at least $100,000. The Distributor may also lower the minimum to $250 for clients of financial intermediaries anticipated to reach this Class I share holdings level.
Class I shares are also available for purchase by family offices and their clients. A family office is a company that provides certain financial and other services to a high net worth family or families. The minimum initial investment for family offices and
Section 3 How You Can Buy and Sell Shares
93
their clients is $100,000, but this minimum will be lowered to $250 for clients of family offices that have accounts holding Class I shares with an aggregate value of at least $100,000. The Distributor may also lower the minimum to $250 for clients of family offices anticipated to reach this Class I share holdings level.
Class I shares are also available for purchase, with no minimum initial investment, by the following categories of investors:
| | • | | Certain employer-sponsored retirement plans. |
| | • | | Certain bank or broker-affiliated trust departments. |
| | • | | Advisory accounts of Nuveen Fund Advisors and its affiliates. |
| | • | | Current and former trustees/directors of any Nuveen Fund, and their immediate family members (as defined in the statement of additional information). |
| | • | | Officers, directors and former directors of Nuveen Investments and its affiliates, and their immediate family members. |
| | • | | Full-time and retired employees of Nuveen Investments and its affiliates, and their immediate family members. |
| | • | | Certain financial intermediary personnel, and their immediate family members. |
Please refer to the statement of additional information for more information about Class A, Class B, Class C, Class R3 and Class I shares, including more detailed program descriptions and eligibility requirements. Additional information is also available from your financial advisor, who can also help you prepare any necessary application forms.

The funds offer a number of ways to reduce or eliminate the up-front sales charge on Class A shares. See “What Share Classes We Offer” (above) for a discussion of eligibility requirements for purchasing Class I shares.
Class A Sales Charge Reductions
| | • | | Rights of Accumulation. In calculating the appropriate sales charge on a purchase of Class A shares of a fund, you may be able to add the amount of your purchase to the value, based on the current net asset value per share, of all of your prior purchases of any Nuveen Mutual Fund. |
| | • | | Letter of Intent. Subject to certain requirements, you may purchase Class A shares of a fund at the sales charge rate applicable to the total amount of the purchases you intend to make over a 13-month period. |
For purposes of calculating the appropriate sales charge as described under Rights of Accumulation and Letter of Intent above, you may include purchases by (i) you, (ii) your spouse or domestic partner and children under the age of 21 years, and (iii) a corporation, partnership or sole proprietorship that is 100% owned by any of the persons in (i) or (ii). In addition, a trustee or other fiduciary can count all shares purchased for a single trust, estate or other single fiduciary account that has multiple accounts (including one or more employee benefit plans of the same employer).
Class A Sales Charge Waivers
Class A shares of a fund may be purchased at net asset value without a sales charge as follows:
| | • | | Purchases of $1,000,000 or more. |
| | • | | Monies representing reinvestment of Nuveen Mutual Fund distributions. |
| | • | | Certain employer-sponsored retirement plans. |
| | • | | Employees of Nuveen Investments and its affiliates. Purchases by full-time and retired employees of Nuveen Investments and its affiliates and such employees’ immediate family members (as defined in the statement of additional information). |
| | • | | Current and former trustees/directors of the Nuveen Funds. |
| | • | | Financial intermediary personnel. Purchases by any person who, for at least the last 90 days, has been an officer, director, or employee of any financial intermediary or any such person’s immediate family member. |
94
Section 3 How You Can Buy and Sell Shares
| | • | | Certain trust departments. Purchases by bank or broker-affiliated trust departments investing funds over which they exercise exclusive discretionary investment authority and that are held in a fiduciary, agency, advisory, custodial or similar capacity. |
| | • | | Additional categories of investors. Purchases made by: (i) investors purchasing on a periodic fee, asset-based fee or no transaction fee basis through a broker-dealer sponsored mutual fund purchase program; and (ii) clients of investment advisers, financial planners or other financial intermediaries that charge periodic or asset-based fees for their services. |
In order to obtain a sales charge reduction or waiver, it may be necessary at the time of purchase for you to inform the funds or your financial advisor of the existence of other accounts in which there are holdings eligible to be aggregated for such purposes. You may need to provide the funds or your financial advisor information or records, such as account statements, in order to verify your eligibility for a sales charge reduction or waiver. This may include account statements of family members and information regarding Nuveen Mutual Fund shares held in accounts with other financial advisors. You or your financial advisor must notify the Distributor at the time of each purchase if you are eligible for any of these programs. The funds may modify or discontinue these programs at any time.

Fund shares may be purchased on any business day, which is any day the New York Stock Exchange (the “NYSE”) is open for business. Generally, the NYSE is closed on weekends and national holidays. The share price you pay depends on when the Distributor receives your order and on the share class you are purchasing. Orders received before the close of trading on a business day (normally, 4:00 p.m. New York time) will receive that day’s closing share price; otherwise, you will receive the next business day’s price.
You may purchase fund shares (1) through a financial advisor or (2) directly from the funds.
Through a Financial Advisor
You may buy shares through your financial advisor, who can handle all the details for you, including opening a new account. Financial advisors can also help you review your financial needs and formulate long-term investment goals and objectives. In addition, financial advisors generally can help you develop a customized financial plan, select investments and monitor and review your portfolio on an ongoing basis to help assure your investments continue to meet your needs as circumstances change. Financial advisors (including brokers or agents) are paid for providing ongoing investment advice and services, either from fund sales charges and fees or by charging you a separate fee in lieu of a sales charge.
Financial advisors or other dealer firms may charge their customers a processing or service fee in connection with the purchase or redemption of fund shares. The amount and applicability of such a fee is determined and disclosed to customers by each individual dealer. Processing or service fees typically are fixed, nominal dollar amounts and are in addition to the sales and other charges described in this prospectus and the statement of additional information. Your dealer will provide you with specific information about any processing or service fees you will be charged. Shares you purchase through your financial advisor or other intermediary will normally be held with that firm. For more information, please contact your financial advisor.
Directly from the Funds
Eligible investors may purchase shares directly from the funds.
| | • | | By wire. You can purchase shares by making a wire transfer from your bank. Before making an initial investment by wire, you must submit a new account form to a fund. After receiving your form, a service representative will contact |
Section 3 How You Can Buy and Sell Shares
95
| | you with your account number and wiring instructions. Your order will be priced at the next closing share price based on the share class of your fund, calculated after your funds’ custodian receives your payment by wire. Wired funds must be received prior to 4:00 p.m. New York time to be eligible for same day pricing. Neither your fund nor the transfer agent are responsible for the consequences of delays resulting from the banking or Federal Reserve wire system, or from incomplete wiring instructions. Before making any additional purchases by wire, you should call Nuveen Investor Services at (800) 257-8787. You cannot purchase shares by wire on days when federally chartered banks are closed. |
| | • | | By mail. You may open an account directly with the funds and buy shares by completing an application and mailing it along with your check to: Nuveen Investor Services, P.O. Box 8530, Boston, Massachusetts 02266-8530. Applications may be obtained at www.nuveen.com or by calling (800) 257-8787. No third party checks will be accepted. |
The funds do not consider the U.S. Postal Service or other independent delivery services to be their agents. Therefore, deposit in the mail or with such services, or receipt at the post office box above, of purchase orders or redemption requests does not constitute receipt by the transfer agent of the funds.
| | • | | On-line. Existing shareholders with direct accounts may process certain account transactions on-line. You may purchase additional shares or exchange shares between existing, identically registered direct accounts. You can also look up your account balance, history and dividend information, as well as order duplicate account statements and tax forms from the funds’ website. To access your account, click the “Our Products—Mutual Funds” link on www.nuveen.com and then choose “Account Access” under the “Shareholder Resources” tab. The system will walk you through the log-in process. To purchase shares on-line, you must have established Fund Direct privileges on your account prior to the requested transaction. See “Special Services—Fund Direct” below. |
| | • | | By telephone. Existing shareholders with direct accounts may also process account transactions via the funds’ automated information line. Simply call (800) 257-8787, press 1 for mutual funds and the voice menu will walk you through the process. To purchase shares by telephone, you must have established Fund Direct privileges on your account prior to the requested transaction. See “Special Services—Fund Direct” below. |

To help make your investing with us easy and efficient, we offer you the following services at no extra cost. Your financial advisor can help you complete the forms for these services, or you can call Nuveen Investor Services at (800) 257-8787 for copies of the necessary forms.
Systematic Investing
Once you have opened an account satisfying the applicable investment minimum, systematic investing allows you to make regular additional investments through automatic deductions from your bank account, directly from your paycheck, or from exchanging shares from another mutual fund account. The minimum automatic deduction is $100 per month. There is no charge to participate in your fund’s systematic investment plan. You can stop the deductions at any time by notifying your fund in writing.
| | • | | From your bank account. You can make systematic investments of $100 or more per month by authorizing your fund to draw pre-authorized checks on your bank account. |
| | • | | From your paycheck. With your employer’s consent, you can make systematic investments each pay period (collectively meeting the monthly minimum of $100) by authorizing your employer to deduct monies from your paycheck. |
96
Section 3 How You Can Buy and Sell Shares
| | • | | Systematic exchanging. You can make systematic investments by authorizing the Distributor to exchange shares from one Nuveen Mutual Fund account into another identically registered Nuveen Mutual Fund account of the same share class. |
Systematic Withdrawal
If the value of your fund account is at least $10,000, you may request to have $50 or more withdrawn automatically from your account. You may elect to receive payments monthly, quarterly, semi-annually or annually, and may choose to receive a check, have the monies transferred directly into your bank account, paid to a third party or sent payable to you at an address other than your address of record. You must complete the appropriate section of the account application or Account Update Form to participate in each fund’s systematic withdrawal plan.
You should not establish systematic withdrawals if you intend to make concurrent purchases of Class A or Class C shares because you may unnecessarily pay a sales charge or CDSC on these purchases.
Exchanging Shares
You may exchange fund shares into an identically registered account for the same class of another Nuveen Mutual Fund available in your state. Your exchange must meet the minimum purchase requirements of the fund into which you are exchanging. You may also, under certain limited circumstances, exchange between certain classes of shares of the same fund, subject to the payment of any applicable CDSC. Please consult the statement of additional information for details.
Each fund reserves the right to revise or suspend the exchange privilege, limit the amount or number of exchanges, or reject any exchange. Shareholders will be provided with at least 60 days’ notice of any material revision to or termination of the exchange privilege.
Because an exchange between funds is treated for tax purposes as a purchase and sale, any gain may be subject to tax. An exchange between classes of shares of the same fund may not be considered a taxable event. You should consult your tax advisor about the tax consequences of exchanging your shares.
Fund DirectSM
The Fund Direct Program allows you to link your fund account to your bank account, transfer money electronically between these accounts and perform a variety of account transactions, including purchasing shares by telephone and investing through a systematic investment plan. You may also have dividends, distributions, redemption payments or systematic withdrawal plan payments sent directly to your bank account.
Reinstatement Privilege
If you redeem fund shares, you may reinvest all or part of your redemption proceeds up to one year later without incurring any additional charges. You may only reinvest into the same share class you redeemed. If you paid a CDSC, your fund will refund your CDSC and reinstate your holding period for purposes of calculating the CDSC. You may use this reinstatement privilege only once for any redemption. The reinstatement privilege is not available for Class B shares.

You may sell (redeem) your shares on any business day. You will receive the share price next determined after your fund has received your properly completed redemption request. Your redemption request must be received before the close of trading on the NYSE (normally, 4:00 p.m. New York time) for you to receive that day’s price. The fund will normally mail your check the next business day after a redemption request is received, but in no event more than seven days after your request is received. If you are selling shares purchased recently with a check, your redemption proceeds will not be mailed until your check has cleared, which may
Section 3 How You Can Buy and Sell Shares
97
take up to ten business days from your purchase date.
You may sell your shares (1) through a financial advisor or (2) directly to the funds.
Through a Financial Advisor
You may sell your shares through your financial advisor, who can prepare the necessary documentation. Your financial advisor may charge for this service.
Directly to the Funds
| | • | | By mail. You can sell your shares at any time by sending a written request to the appropriate fund, c/o Nuveen Investor Services, P.O. Box 8530, Boston, Massachusetts 02266-8530. Your request must include the following information: |
| | • | | Your name and account number; |
| | • | | The dollar or share amount you wish to redeem; |
| | • | | The signature of each owner exactly as it appears on the account; |
| | • | | The name of the person to whom you want your redemption proceeds paid (if other than to the shareholder of record); |
| | • | | The address where you want your redemption proceeds sent (if other than the address of record); |
| | • | | Any certificates you have for the shares; and |
| | • | | Any required signature guarantees. |
After you have established your account, signatures on a written request must be guaranteed if:
| | • | | You would like redemption proceeds payable or sent to any person, address or bank account other than that on record; |
| | • | | You have changed the address on your fund’s records within the last 30 days; |
| | • | | Your redemption request is in excess of $50,000; or |
| | • | | You are requesting a change in ownership on your account. |
Non-financial transactions, including establishing or modifying certain services such as changing bank information on an account, will require a signature guarantee or signature verification from a Medallion Signature Guarantee Program member or other acceptable form of authentication from a financial institution source. In addition to the situations described above, the funds reserve the right to require a signature guarantee, or another acceptable form of signature verification, in other instances based on the circumstances of a particular situation.
A signature guarantee assures that a signature is genuine and protects shareholders from unauthorized account transfers. Banks, savings and loan associations, trust companies, credit unions, broker-dealers and member firms of a national securities exchange may guarantee signatures. Call your financial intermediary to determine if it has this capability. A notary public is not an acceptable signature guarantor. Proceeds from a written redemption request will be sent to you by check unless another form of payment is requested.
| | • | | On-line. You may redeem shares or exchange shares between existing, identically registered accounts on-line. To access your account, click the “Our Products—Mutual Funds” link on www.nuveen.com and then choose “Account Access” under the “Shareholder Resources” tab. The system will walk you through the log-in process. On-line redemptions are not available for shares owned in certificate form and, with respect to redemptions where the proceeds are payable by check, may not exceed $50,000. Checks will only be issued to you as the shareholder of record and mailed to your address of record. If you have established Fund Direct privileges, you may have redemption proceeds transferred electronically to your bank account. |
98
Section 3 How You Can Buy and Sell Shares
An Important Note About Telephone Transactions
Although Nuveen Investor Services has certain safeguards and procedures to confirm the identity of callers, it will not be liable for losses resulting from following telephone instructions it reasonably believes to be genuine. Also, you should verify your trade confirmations immediately upon receipt.
| | • | | By telephone. If your account is held with your fund and not in your brokerage account, and you have authorized telephone redemption privileges, call (800) 257-8787 to redeem your shares, press 1 for mutual funds and the voice menu will walk you through the process. Telephone redemptions are not available for shares owned in certificate form and, with respect to redemptions where the proceeds are payable by check, may not exceed $50,000. Checks will only be issued to you as the shareholder of record and mailed to your address of record, normally the next business day after the redemption request is received. If you have established Fund Direct privileges, you may have redemption proceeds transferred electronically to your bank account. In this case, the redemption proceeds will be transferred to your bank on the next business day after the redemption request is received. You should contact your bank for further information concerning the timing of the credit of the redemption proceeds in your bank account. |
Contingent Deferred Sales Charge
If you redeem Class A, Class B or Class C shares that are subject to a CDSC, you may be assessed a CDSC upon redemption. When you redeem Class A, Class B or Class C shares subject to a CDSC, your fund will first redeem any shares that are not subject to a CDSC, and then redeem the shares you have owned for the longest period of time, unless you ask the fund to redeem your shares in a different order. No CDSC is imposed on shares you buy through the reinvestment of dividends and capital gains. The CDSC holding period is calculated on a monthly basis and begins on the first day of the month in which the purchase was made. When you redeem shares subject to a CDSC, the CDSC is calculated on the lower of your purchase price or redemption proceeds, deducted from your redemption proceeds, and paid to the Distributor. The CDSC may be waived under certain special circumstances as described in the statement of additional information.
Accounts with Low Balances
The funds reserve the right to liquidate or assess a low balance fee on any account (other than accounts holding Class R3 shares) held directly with the funds that has a balance that has fallen below the account balance minimum of $1,000 for any reason, including market fluctuations.
If a fund elects to exercise the right to assess a low balance fee, then annually the fund will assess a $15 low balance account fee on certain accounts with balances under the account balance minimum that are IRAs, Coverdell Education Savings Accounts, or accounts established pursuant to the UTMA or UGMA. At the same time, other accounts with balances under the account balance minimum will be liquidated, with proceeds being mailed to the address of record. Prior to the assessment of any low balance fee or liquidation of low balance accounts, affected shareholders will receive a communication notifying them of the pending action, thereby providing time to ensure that balances are at or above the account balance minimum prior to any fee assessment or account liquidation. You will not be assessed a CDSC if your account is liquidated.
Redemptions In-Kind
The funds generally pay redemption proceeds in cash. Under unusual conditions that make cash payment unwise and for the protection of existing shareholders, the funds may pay all or a portion of your redemption proceeds in securities or other fund assets. Although it is unlikely that your shares would be redeemed in-kind, you would probably have to pay brokerage costs to sell the securities distributed to you, as well as taxes on any capital gains from that sale.
Section 3 How You Can Buy and Sell Shares
99
Section 4 General Information
To help you understand the tax implications of investing in the funds, this section includes important details about how the funds make distributions to shareholders. We discuss some other fund policies as well. Please consult the statement of additional information and your tax advisor for more information about taxes.

Dividends from a fund’s net investment income are normally declared and paid quarterly for Nuveen Dividend Value Fund and Nuveen Equity Index Fund. For each other fund, dividends from net investment income, if any, are normally declared and paid annually. For each of the funds, any capital gains are normally distributed at least once each year.
Payment and Reinvestment Options
The funds automatically reinvest your dividends in additional fund shares unless you request otherwise. You may request to have your dividends paid to you by check, sent via electronic funds transfer through ACH, or reinvested in shares of another Nuveen Mutual Fund. For further information, contact your financial advisor or call Nuveen Investor Services at (800) 257-8787. If you request that your distributions be paid by check but those distributions cannot be delivered because of an incorrect mailing address, or if a distribution check remains uncashed for six months, the undelivered or uncashed distributions and all future distributions will be reinvested in fund shares at the current net asset value.
Non-U.S. Income Tax Considerations
Investment income that the funds receive from their non-U.S. investments may be subject to non-U.S. income taxes, which generally will reduce fund distributions. However, the United States has entered into tax treaties with many non-U.S. countries that may entitle you to certain tax benefits.
Taxes and Tax Reporting
The funds will make distributions that may be taxed as ordinary income (which may be taxable at different rates, depending on the sources of the distributions) or capital gains (which may be taxable at different rates, depending on the length of time a fund holds its assets). Dividends from a fund’s long-term capital gains are generally taxable as capital gains, while dividends from short-term capital gains and net investment income are generally taxable as ordinary income. However, certain ordinary income distributions received from a fund that are determined to be qualified dividend income may be taxed at tax rates equal to those applicable to long-term capital gains. The tax you pay on a given capital gains distribution depends generally on how long the fund has held the portfolio securities it sold. It does not depend on how long you have owned your fund shares. Dividends generally do not qualify for a dividends received deduction if you are a corporate shareholder.
Early in each year, you will receive a statement detailing the amount and nature of all dividends and capital gains that you were paid during the prior year. If you hold your investment at the firm where you purchased your fund shares, you will receive the statement from that firm. If you hold your shares directly with the fund, the Distributor will send you the statement. The tax status of your dividends is the same whether you reinvest your dividends or elect to receive them in cash. The sale of shares in your account may produce a gain or loss, and is a taxable event. For tax purposes, an exchange of shares between funds is generally the same as a sale.
100
Section 4 General Information
Please note that if you do not furnish your fund with your correct Social Security number or employer identification number, you fail to provide certain certifications to your fund, you fail to certify whether you are a U.S. citizen or U.S. resident alien, or the Internal Revenue Service notifies the fund to withhold, federal law requires your fund to withhold federal income tax from your distributions and redemption proceeds at the applicable withholding rate.
Buying or Selling Shares Close to a Record Date
Buying fund shares shortly before the record date for a taxable dividend or capital gain distribution is commonly known as “buying the dividend.” The entire dividend may be taxable to you even though a portion of the dividend effectively represents a return of your purchase price.
Foreign Tax Credit
A regulated investment company with more than 50% of the value of its assets in stock or other securities of non-U.S. corporations at the close of a taxable year or that is a qualified fund of funds may, for such taxable year, elect to pass the regulated investment company’s foreign tax credits through to its investors.
Cost Basis Method
For shares acquired on or after January 1, 2012, you may elect a cost basis method to apply to all existing and future accounts you may establish. The cost basis method you select will determine the order in which shares are redeemed and how your cost basis information is calculated and subsequently reported to you and to the Internal Revenue Service. Please consult your tax advisor to determine which cost basis method best suits your specific situation. If you hold your account directly with a fund, please contact Nuveen Investor Services at (800) 257-8787 for instructions on how to make your election. If you hold your account with a financial intermediary, please contact that financial intermediary for instructions on how to make your election. If you hold your account directly with a fund and do not elect a cost basis method, your account will default to the average cost basis method. For a definition of “average cost basis method,” please see the glossary. Financial intermediaries choose their own default method.

The Distributor serves as the selling agent and distributor of the funds’ shares. In this capacity, the Distributor manages the offering of the funds’ shares and is responsible for all sales and promotional activities. In order to reimburse the Distributor for its costs in connection with these activities, including compensation paid to financial intermediaries, each fund has adopted a distribution and service plan under Rule 12b-1 under the 1940 Act. See “How You Can Buy and Sell Shares—What Share Classes We Offer” for a description of the distribution and service fees paid under this plan.
Under the plan, the Distributor receives a distribution fee for Class B, Class C and Class R3 shares primarily for providing compensation to financial intermediaries, including the Distributor, in connection with the distribution of shares. The Distributor receives a service fee for Class A, Class B, Class C and Class R3 shares to compensate financial intermediaries, including the Distributor, for providing ongoing account services to shareholders. These services may include establishing and maintaining shareholder accounts, answering shareholder inquiries and providing other personal services to shareholders. These fees also compensate the Distributor for other expenses, including printing and distributing prospectuses to persons other than shareholders, and preparing, printing, and distributing advertising materials, sales literature and reports to shareholders used in connection with the sale of shares. Because these fees are paid out of the funds’ assets on an ongoing basis, over time these fees will increase the cost of your investment and may cost
Section 4 General Information
101
you more than paying other types of sales charges. Long- term holders of Class B, Class C and Class R3 shares may pay more in distribution and service fees and CDSCs (Class B and Class C shares only) than the economic equivalent of the maximum front-end sales charge permitted under the Financial Industry Regulatory Authority Conduct Rules.
Other Payments to Financial Intermediaries
In addition to the sales commissions and certain payments from distribution and service fees to financial intermediaries as previously described, the Distributor may from time to time make additional payments, out of its own resources, to certain financial intermediaries that sell shares of Nuveen Mutual Funds in order to promote the sales and retention of fund shares by those firms and their customers. The amounts of these payments vary by financial intermediary and, with respect to a given firm, are typically calculated by reference to the amount of the firm’s recent gross sales of Nuveen Mutual Fund shares and/or total assets of Nuveen Mutual Funds held by the firm’s customers. The level of payments that the Distributor is willing to provide to a particular financial intermediary may be affected by, among other factors, the firm’s total assets held in and recent net investments into Nuveen Mutual Funds, the firm’s level of participation in Nuveen Mutual Fund sales and marketing programs, the firm’s compensation program for its registered representatives who sell fund shares and provide services to fund shareholders, and the asset class of the Nuveen Mutual Funds for which these payments are provided. For 2011, these payments in the aggregate were approximately 0.070% to 0.073% of the assets in the Nuveen Mutual Funds, although payments to particular financial intermediaries can be significantly higher. The statement of additional information contains additional information about these payments, including the names of the firms to which payments are made. The Distributor may also make payments to financial intermediaries in connection with sales meetings, due diligence meetings, prospecting seminars and other meetings at which the Distributor promotes its products and services.
In connection with the availability of Nuveen Mutual Funds within selected mutual fund no-transaction fee institutional platforms and fee-based wrap programs (together, “Platform Programs”) at certain financial intermediaries, the Distributor also makes payments out of its own assets to those firms as compensation for certain recordkeeping, shareholder communications and other account administration services provided to Nuveen Mutual Fund shareholders who own their fund shares in these Platform Programs. These payments are in addition to the service fee and any applicable omnibus sub-accounting fees paid to these firms with respect to these services by the Nuveen Mutual Funds out of fund assets.
The amounts of payments to a financial intermediary could be significant, and may create an incentive for the intermediary or its representatives to recommend or offer shares of the funds to you. The intermediary may elevate the prominence or profile of the funds within the intermediary’s organization by, for example, placing the funds on a list of preferred or recommended funds and/or granting the Distributor and/or its affiliates preferential or enhanced opportunities to promote the funds in various ways within the intermediary’s organization.

The price you pay for your shares is based on your fund’s net asset value per share, which is determined as of the close of trading (normally 4:00 p.m. New York time) on each day the NYSE is open for business. Net asset value is calculated for each class of each fund by taking the value of the class’ total assets, including interest or dividends accrued but not yet collected, less all liabilities, and dividing by the total number of shares outstanding. The result, rounded to the nearest cent, is the net asset value per share. All valuations are subject to review by the funds’ Board of Directors or its designee.
102
Section 4 General Information
In determining net asset value, portfolio instruments generally are valued using prices provided by independent pricing services or obtained from other sources, such as broker-dealer quotations, all as approved by the Board of Directors. Independent pricing services typically value non-equity portfolio instruments utilizing a range of market-based inputs and assumptions, including readily available market quotations obtained from broker-dealers making markets in such instruments, cash flows, and transactions for comparable instruments. In pricing certain securities, particularly less liquid and lower quality securities, the pricing services may consider information about a security, its issuer, or market activity provided by the funds’ investment adviser or sub-adviser. Equity securities and ETFs generally are valued at the last reported sales price or official closing price on an exchange, if available. Non-U.S. securities and currencies are valued in U.S. dollars based on non-U.S. currency exchange rate quotations supplied by an independent quotation service.
If a price cannot be obtained from a pricing service or other pre-approved source, or if Nuveen Fund Advisors deems such price to be unreliable, a portfolio instrument may be valued by a fund at its fair value as determined in good faith by the Board of Directors or its designee. As a general principle, the fair value of a portfolio instrument is the amount that an owner might reasonably expect to receive upon the instrument’s current sale. A range of factors and analysis may be considered when determining fair value, including relevant market data, interest rates, credit considerations and/or issuer-specific news. For non-U.S. traded securities whose principal local markets close before the close of the NYSE, a fund may adjust the local closing price based upon such factors as developments in non-U.S. markets, the performance of U.S. securities markets and the performance of instruments trading in U.S. markets that represent non-U.S. securities. A fund may rely on an independent fair valuation service in making any such fair value determinations for non-U.S. securities based upon such factors as developments in non-U.S. markets, the performance of U.S. securities markets and the performance of instruments trading in U.S. markets that represent non-U.S. securities.
If a fund holds securities that are principally traded on non-U.S. markets, the value of such securities may change on days when shareholders will not be able to purchase or redeem the fund’s shares.

The funds are intended for long-term investment and should not be used for excessive trading. Excessive trading in the funds’ shares can disrupt portfolio management, lead to higher operating costs, and cause other operating inefficiencies for the funds. However, the funds are also mindful that shareholders may have valid reasons for periodically purchasing and redeeming fund shares.
Accordingly, the funds have adopted a Frequent Trading Policy that seeks to balance the funds’ need to prevent excessive trading in fund shares while offering investors the flexibility in managing their financial affairs to make periodic purchases and redemptions of fund shares.
The funds’ Frequent Trading Policy generally limits an investor to four “round trip” trades in a 12-month period. A “round trip” is the purchase and subsequent redemption of fund shares, including by exchange. Each side of a round trip may be comprised of either a single transaction or a series of closely-spaced transactions. The funds may also suspend the trading privileges of any investor who makes a round trip within a 30-day period if the purchase and redemption are of substantially similar dollar amounts and represent at least 25% of the value of the investor’s account.
The funds primarily receive share purchase and redemption orders through third-party financial intermediaries, some of whom rely on the use of omnibus accounts. An omnibus account typically includes multiple investors and provides the funds only with a net purchase or redemption amount on any given day where multiple purchases, redemptions and exchanges of shares occur in the account. The identity of individual purchasers, redeemers and exchangers whose orders are aggregated in omnibus accounts, and the size of their orders, will generally not be known by the
Section 4 General Information
103
funds. Despite the funds’ efforts to detect and prevent frequent trading, the funds may be unable to identify frequent trading because the netting effect in omnibus accounts often makes it more difficult to identify frequent traders. The Distributor has entered into agreements with financial intermediaries that maintain omnibus accounts with the funds’ transfer agent. Under the terms of these agreements, the financial intermediaries undertake to cooperate with the Distributor in monitoring purchase, exchange and redemption orders by their customers in order to detect and prevent frequent trading in the funds through such accounts. Technical limitations in operational systems at such intermediaries or at the Distributor may also limit the funds’ ability to detect and prevent frequent trading. In addition, the funds may permit certain financial intermediaries, including broker-dealer and retirement plan administrators, among others, to enforce their own internal policies and procedures concerning frequent trading. Such policies may differ from the funds’ Frequent Trading Policy and may be approved for use in instances where the funds reasonably believe that the intermediary’s policies and procedures effectively discourage inappropriate trading activity. Shareholders holding their accounts with such intermediaries may wish to contact the intermediary for information regarding its frequent trading policy. Although the funds do not knowingly permit frequent trading, they cannot guarantee that they will be able to identify and restrict all frequent trading activity.
The funds reserve the right in their sole discretion to waive unintentional or minor violations (including transactions below certain dollar thresholds) if they determine that doing so would not harm the interests of fund shareholders. In addition, certain categories of redemptions may be excluded from the application of the Frequent Trading Policy, as described in more detail in the statement of additional information. These include, among others, redemptions pursuant to systematic withdrawal plans, redemptions in connection with the total disability or death of the investor, involuntary redemptions by operation of law, redemptions in payment of account or plan fees, and certain redemptions by retirement plans, including redemptions in connection with qualifying loans or hardship withdrawals, termination of plan participation, return of excess contributions, and required minimum distributions. The funds may also modify or suspend the Frequent Trading Policy without notice during periods of market stress or other unusual circumstances.
The funds reserve the right to impose restrictions on purchases or exchanges that are more restrictive than those stated above if they determine, in their sole discretion, that a transaction or a series of transactions involves market timing or excessive trading that may be detrimental to fund shareholders. The funds also reserve the right to reject any purchase order, including exchange purchases, for any reason. For example, a fund may refuse purchase orders if the fund would be unable to invest the proceeds from the purchase order in accordance with the fund’s investment policies and/or objective, or if the fund would be adversely affected by the size of the transaction, the frequency of trading in the account or various other factors. For more information about the funds’ Frequent Trading Policy and its enforcement, see “Purchase and Redemption of Fund Shares—Frequent Trading Policy” in the statement of additional information.

The custodian of the assets of the funds other than Nuveen International Fund and Nuveen International Select Fund is U.S. Bank National Association, 60 Livingston Avenue, St. Paul, MN 55101. The custodian of the assets of Nuveen International Fund and Nuveen International Select Fund is State Street Bank and Trust Company, 2 Avenue de Lafayette, LCC/5 Boston, MA 02111. The funds’ transfer, shareholder services and dividend paying agent, Boston Financial Data Services, Inc., P.O. Box 8530, Boston, Massachusetts 02266-8530, performs bookkeeping, data processing and administrative services for the maintenance of shareholder accounts.
104
Section 4 General Information

For disclaimers relating to the indices for Nuveen Equity Index Fund and Nuveen Mid Cap Index Fund, please see the statement of additional information.
Nuveen Small Cap Index Fund is not promoted, sponsored or endorsed by, nor in any way affiliated with Frank Russell Company. Frank Russell Company is not responsible for and has not reviewed Nuveen Small Cap Index Fund nor any associated literature or publications and Frank Russell Company makes no representation or warranty, express or implied, as to their accuracy, or completeness, or otherwise. Please see the statement of additional information for further restrictions and information regarding the Russell Index(es).
Section 4 General Information
105
Section 5 Financial Highlights
The tables that follow present performance information about the share classes of each fund offered during the most recently completed fiscal year. This information is intended to help you understand each fund’s financial performance for the past five years or, if shorter, the period of operations for the fund or class of shares. Some of this information reflects financial results for a single fund share held throughout the period. Total returns in the tables represent the rate that you would have earned or lost on an investment in the fund, assuming you reinvested all of your dividends and distributions.
The information below has been derived from the financial statements audited by Ernst & Young LLP, an independent registered public accounting firm, whose report, along with the funds’ financial statements, is included in the funds’ annual report, which is available upon request.
Nuveen Dividend Value Fund
| | | | | | | | | | | | | | | | | | | | | | | | | | | | | | | | | | | | | | | | | | | | | | | | | | | | |
Class
(Commencement
Date) | | | | | Investment Operations | | | Less Distributions | | | | | | | | | Ratios/Supplemental Data | |
| | | | | | | | | | | | | | | | | | Ratios to Average
Net Assets After
Reimbursement(d) | | | | |
Year Ended
October 31, | | Beginning
Net Asset
Value | | | Net
Investment
Income
(Loss)(a) | | | Net
Realized/
Unrealized
Gain (Loss) | | | Total | | | Net
Investment
Income | | | Capital
Gains(b) | | | Total | | | Ending Net Asset Value | | | Total
Return(c) | | | Ending
Net
Assets
(000) | | | Expenses | | | Net
Investment
Income
(Loss) | | | Portfolio
Turnover
Rate | |
| | | | | | | | | | | | |
| Class A (12/92) | | | | | | | | | | | | | | | | | | | | | | | | | | | | | | | | | | | | | | | | | | | | | | | | | |
| 2011 | | $ | 12.42 | | | $ | .27 | | | $ | .63 | | | $ | .90 | | | $ | (.27 | ) | | $ | — | | | $ | (.27 | ) | | $ | 13.05 | | | | 7.28 | % | | $ | 176,954 | | | | 1.14 | % | | | 2.05 | % | | | 33 | % |
| 2010 | | | 10.76 | | | | .34 | | | | 1.63 | | | | 1.97 | | | | (.31 | ) | | | — | | | | (.31 | ) | | | 12.42 | | | | 18.46 | | | | 125,226 | | | | 1.17 | | | | 2.89 | | | | 29 | |
| 2009 | | | 10.09 | | | | .29 | | | | .71 | | | | 1.00 | | | | (.33 | ) | | | — | | | | (.33 | ) | | | 10.76 | | | | 10.32 | | | | 100,059 | | | | 1.19 | | | | 3.00 | | | | 48 | |
| 2008 | | | 16.43 | | | | .33 | | | | (5.28 | ) | | | (4.95 | ) | | | (.29 | ) | | | (1.10 | ) | | | (1.39 | ) | | | 10.09 | | | | (32.51 | ) | | | 100,824 | | | | 1.17 | | | | 2.45 | | | | 32 | |
| 2007 | | | 15.90 | | | | .29 | | | | 1.96 | | | | 2.25 | | | | (.29 | ) | | | (1.43 | ) | | | (1.72 | ) | | | 16.43 | | | | 15.24 | | | | 179,379 | | | | 1.16 | | | | 1.83 | | | | 20 | |
| | | | | | | | | | | | |
| Class B (8/94) | | | | | | | | | | | | | | | | | | | | | | | | | | | | | | | | | | | | | | | | | | | | | | | | | |
| 2011 | | | 12.25 | | | | .17 | | | | .61 | | | | .78 | | | | (.10 | ) | | | — | | | | (.10 | ) | | | 12.93 | | | | 6.45 | | | | 3,016 | | | | 1.89 | | | | 1.32 | | | | 33 | |
| 2010 | | | 10.61 | | | | .24 | | | | 1.61 | | | | 1.85 | | | | (.21 | ) | | | — | | | | (.21 | ) | | | 12.25 | | | | 17.59 | | | | 5,039 | | | | 1.92 | | | | 2.07 | | | | 29 | |
| 2009 | | | 9.96 | | | | .22 | | | | .68 | | | | .90 | | | | (.25 | ) | | | — | | | | (.25 | ) | | | 10.61 | | | | 9.41 | | | | 7,237 | | | | 1.94 | | | | 2.28 | | | | 48 | |
| 2008 | | | 16.23 | | | | .22 | | | | (5.19 | ) | | | (4.97 | ) | | | (.20 | ) | | | (1.10 | ) | | | (1.30 | ) | | | 9.96 | | | | (32.95 | ) | | | 9,113 | | | | 1.92 | | | | 1.69 | | | | 32 | |
| 2007 | | | 15.75 | | | | .17 | | | | 1.94 | | | | 2.11 | | | | (.20 | ) | | | (1.43 | ) | | | (1.63 | ) | | | 16.23 | | | | 14.40 | | | | 16,893 | | | | 1.91 | | | | 1.09 | | | | 20 | |
| | | | | | | | | | | | |
| Class C (2/99) | | | | | | | | | | | | | | | | | | | | | | | | | | | | | | | | | | | | | | | | | | | | | | | | | |
| 2011 | | | 12.26 | | | | .17 | | | | .62 | | | | .79 | | | | (.13 | ) | | | — | | | | (.13 | ) | | | 12.92 | | | | 6.42 | | | | 18,714 | | | | 1.89 | | | | 1.31 | | | | 33 | |
| 2010 | | | 10.63 | | | | .26 | | | | 1.60 | | | | 1.86 | | | | (.23 | ) | | | — | | | | (.23 | ) | | | 12.26 | | | | 17.60 | | | | 11,107 | | | | 1.92 | | | | 2.22 | | | | 29 | |
| 2009 | | | 9.98 | | | | .21 | | | | .69 | | | | .90 | | | | (.25 | ) | | | — | | | | (.25 | ) | | | 10.63 | | | | 9.41 | | | | 4,921 | | | | 1.94 | | | | 2.23 | | | | 48 | |
| 2008 | | | 16.26 | | | | .22 | | | | (5.20 | ) | | | (4.98 | ) | | | (.20 | ) | | | (1.10 | ) | | | (1.30 | ) | | | 9.98 | | | | (32.95 | ) | | | 4,625 | | | | 1.92 | | | | 1.69 | | | | 32 | |
| 2007 | | | 15.78 | | | | .17 | | | | 1.94 | | | | 2.11 | | | | (.20 | ) | | | (1.43 | ) | | | (1.63 | ) | | | 16.26 | | | | 14.37 | | | | 9,241 | | | | 1.91 | | | | 1.09 | | | | 20 | |
| | | | | | | | | | | | |
| Class R3 (9/01)(e) | | | | | | | | | | | | | | | | | | | | | | | | | | | | | | | | | | | | | | | | | | | | | | | | | |
| 2011 | | | 12.41 | | | | .23 | | | | .63 | | | | .86 | | | | (.24 | ) | | | — | | | | (.24 | ) | | | 13.03 | | | | 6.93 | | | | 12,092 | | | | 1.41 | | | | 1.75 | | | | 33 | |
| 2010 | | | 10.76 | | | | .30 | | | | 1.64 | | | | 1.94 | | | | (.29 | ) | | | — | | | | (.29 | ) | | | 12.41 | | | | 18.16 | | | | 1,204 | | | | 1.39 | | | | 2.50 | | | | 29 | |
| 2009 | | | 10.08 | | | | .28 | | | | .68 | | | | .96 | | | | (.28 | ) | | | — | | | | (.28 | ) | | | 10.76 | | | | 9.92 | | | | 122 | | | | 1.45 | | | | 2.94 | | | | 48 | |
| 2008 | | | 16.41 | | | | .29 | | | | (5.26 | ) | | | (4.97 | ) | | | (.26 | ) | | | (1.10 | ) | | | (1.36 | ) | | | 10.08 | | | | (32.64 | ) | | | 535 | | | | 1.42 | | | | 2.20 | | | | 32 | |
| 2007 | | | 15.88 | | | | .23 | | | | 1.98 | | | | 2.21 | | | | (.25 | ) | | | (1.43 | ) | | | (1.68 | ) | | | 16.41 | | | | 14.98 | | | | 940 | | | | 1.41 | | | | 1.48 | | | | 20 | |
| | | | | | | | | | | | |
| Class I (8/94)(e) | | | | | | | | | | | | | | | | | | | | | | | | | | | | | | | | | | | | | | | | | | | | | | | | | |
| 2011 | | | 12.53 | | | | .31 | | | | .64 | | | | .95 | | | | (.32 | ) | | | — | | | | (.32 | ) | | | 13.16 | | | | 7.56 | | | | 861,754 | | | | .89 | | | | 2.31 | | | | 33 | |
| 2010 | | | 10.85 | | | | .37 | | | | 1.65 | | | | 2.02 | | | | (.34 | ) | | | — | | | | (.34 | ) | | | 12.53 | | | | 18.78 | | | | 684,540 | | | | .92 | | | | 3.10 | | | | 29 | |
| 2009 | | | 10.18 | | | | .32 | | | | .70 | | | | 1.02 | | | | (.35 | ) | | | — | | | | (.35 | ) | | | 10.85 | | | | 10.51 | | | | 570,690 | | | | .94 | | | | 3.25 | | | | 48 | |
| 2008 | | | 16.55 | | | | .36 | | | | (5.30 | ) | | | (4.94 | ) | | | (.33 | ) | | | (1.10 | ) | | | (1.43 | ) | | | 10.18 | | | | (32.29 | ) | | | 574,162 | | | | .92 | | | | 2.70 | | | | 32 | |
| 2007 | | | 16.00 | | | | .33 | | | | 1.98 | | | | 2.31 | | | | (.33 | ) | | | (1.43 | ) | | | (1.76 | ) | | | 16.55 | | | | 15.54 | | | | 1,061,433 | | | | .91 | | | | 2.09 | | | | 20 | |
| (a) | Per share Net Investment Income (Loss) is calculated using the average daily shares method. |
| (b) | Distributions from Capital Gains include short-term capital gains, if any. |
| (c) | Total Return is the combination of changes in net asset value without any sales charge, reinvested dividend income at net asset value and reinvested capital gains distributions at net asset value, if any. Total Return is not annualized. |
| (d) | After expense reimbursement from the Adviser, where applicable. Ratios do not reflect the effect of custodian fee credits earned on the Fund’s net cash on deposit with the custodian bank, where applicable. |
| (e) | Effective January 18, 2011, Class R Shares and Class Y Shares previously offered by FAF Advisors, Inc. were renamed Class R3 Shares and Class I Shares, respectively. |
106
Section 5 Financial Highlights
Nuveen Equity Index Fund
| | | | | | | | | | | | | | | | | | | | | | | | | | | | | | | | | | | | | | | | | | | | | | | | | | | | |
Class
(Commencement
Date) | | | Investment Operations | | | Less Distributions | | | | | | | | | Ratios/Supplemental Data | |
| | | | | | | | | | | | | | | | | | | | | | | | | | | | | | | Ratios to Average
Net Assets After
Reimbursement(d) | | | | |
Year Ended
October 31, | | Beginning
Net Asset
Value | | | Net
Investment
Income
(Loss)(a) | | | Net
Realized/
Unrealized
Gain (Loss) | | | Total | | | Net
Investment
Income | | | Capital
Gains(b) | | | Total | | | Ending
Net
Asset
Value | | | Total
Return(c) | | | Ending
Net
Assets
(000) | | | Expenses | | | Net
Investment
Income
(Loss) | | | Portfolio
Turnover
Rate | |
| | | | | | | | | | | |
| CLASS A (12/92) | | | | | | | | | | | | | | | | | | | | | | | | | | | | | | | | | | | | | | | | | | | | | |
| 2011 | | $ | 21.51 | | | $ | .30 | | | $ | 1.26 | | | $ | 1.56 | | | $ | (.26 | ) | | $ | (1.37 | ) | | $ | (1.63 | ) | | $ | 21.44 | | | | 7.41 | % | | $ | 119,172 | | | | .62 | % | | | 1.37 | % | | | 2 | % |
| 2010 | | | 18.86 | | | | .29 | | | | 2.70 | | | | 2.99 | | | | (.30 | ) | | | (.04 | ) | | | (.34 | ) | | | 21.51 | | | | 15.94 | | | | 119,761 | | | | .61 | | | | 1.41 | | | | 4 | |
| 2009 | | | 17.61 | | | | .34 | | | | 1.27 | | | | 1.61 | | | | (.36 | ) | | | — | | | | (.36 | ) | | | 18.86 | | | | 9.51 | | | | 115,213 | | | | .62 | | | | 2.03 | | | | 10 | |
| 2008 | | | 28.67 | | | | .42 | | | | (10.57 | ) | | | (10.15 | ) | | | (.38 | ) | | | (.53 | ) | | | (.91 | ) | | | 17.61 | | | | (36.35 | ) | | | 114,654 | | | | .62 | | | | 1.74 | | | | 4 | |
| 2007 | | | 25.80 | | | | .37 | | | | 3.16 | | | | 3.53 | | | | (.36 | ) | | | (.30 | ) | | | (.66 | ) | | | 28.67 | | | | 13.93 | | | | 213,957 | | | | .62 | | | | 1.37 | | | | 4 | |
| | | | | | | | | | | |
| CLASS B (8/94) | | | | | | | | | | | | | | | | | | | | | | | | | | | | | | | | | | | | | | | | | | | | | |
| 2011 | | | 21.19 | | | | .14 | | | | 1.24 | | | | 1.38 | | | | (.10 | ) | | | (1.37 | ) | | | (1.47 | ) | | | 21.10 | | | | 6.60 | | | | 4,227 | | | | 1.37 | | | | .63 | | | | 2 | |
| 2010 | | | 18.58 | | | | .13 | | | | 2.66 | | | | 2.79 | | | | (.14 | ) | | | (.04 | ) | | | (.18 | ) | | | 21.19 | | | | 15.07 | | | | 7,351 | | | | 1.36 | | | | .67 | | | | 4 | |
| 2009 | | | 17.35 | | | | .22 | | | | 1.25 | | | | 1.47 | | | | (.24 | ) | | | — | | | | (.24 | ) | | | 18.58 | | | | 8.69 | | | | 9,822 | | | | 1.37 | | | | 1.33 | | | | 10 | |
| 2008 | | | 28.27 | | | | .24 | | | | (10.42 | ) | | | (10.18 | ) | | | (.21 | ) | | | (.53 | ) | | | (.74 | ) | | | 17.35 | | | | (36.82 | ) | | | 12,856 | | | | 1.37 | | | | .99 | | | | 4 | |
| 2007 | | | 25.47 | | | | .17 | | | | 3.11 | | | | 3.28 | | | | (.18 | ) | | | (.30 | ) | | | (.48 | ) | | | 28.27 | | | | 13.05 | | | | 31,343 | | | | 1.37 | | | | .63 | | | | 4 | |
| | | | | | | | | | | |
| CLASS C (2/99) | | | | | | | | | | | | | | | | | | | | | | | | | | | | | | | | | | | | | | | | | | | | | |
| 2011 | | | 21.32 | | | | .13 | | | | 1.26 | | | | 1.39 | | | | (.10 | ) | | | (1.37 | ) | | | (1.47 | ) | | | 21.24 | | | | 6.61 | | | | 8,261 | | | | 1.37 | | | | .62 | | | | 2 | |
| 2010 | | | 18.70 | | | | .13 | | | | 2.67 | | | | 2.80 | | | | (.14 | ) | | | (.04 | ) | | | (.18 | ) | | | 21.32 | | | | 15.05 | | | | 8,651 | | | | 1.36 | | | | .66 | | | | 4 | |
| 2009 | | | 17.46 | | | | .21 | | | | 1.26 | | | | 1.47 | | | | (.23 | ) | | | — | | | | (.23 | ) | | | 18.70 | | | | 8.69 | | | | 8,661 | | | | 1.37 | | | | 1.31 | | | | 10 | |
| 2008 | | | 28.45 | | | | .24 | | | | (10.48 | ) | | | (10.24 | ) | | | (.22 | ) | | | (.53 | ) | | | (.75 | ) | | | 17.46 | | | | (36.83 | ) | | | 9,784 | | | | 1.37 | | | | .99 | | | | 4 | |
| 2007 | | | 25.62 | | | | .17 | | | | 3.14 | | | | 3.31 | | | | (.18 | ) | | | (.30 | ) | | | (.48 | ) | | | 28.45 | | | | 13.09 | | | | 19,585 | | | | 1.37 | | | | .62 | | | | 4 | |
| | | | | | | | | | | |
| CLASS R3 (9/01)(e) | | | | | | | | | | | | | | | | | | | | | | | | | | | | | | | | | | | | | | | | | | | | | |
| 2011 | | | 21.47 | | | | .25 | | | | 1.26 | | | | 1.51 | | | | (.21 | ) | | | (1.37 | ) | | | (1.58 | ) | | | 21.40 | | | | 7.15 | | | | 14,218 | | | | .87 | | | | 1.13 | | | | 2 | |
| 2010 | | | 18.83 | | | | .23 | | | | 2.70 | | | | 2.93 | | | | (.25 | ) | | | (.04 | ) | | | (.29 | ) | | | 21.47 | | | | 15.63 | | | | 12,979 | | | | .86 | | | | 1.15 | | | | 4 | |
| 2009 | | | 17.58 | | | | .29 | | | | 1.28 | | | | 1.57 | | | | (.32 | ) | | | — | | | | (.32 | ) | | | 18.83 | | | | 9.27 | | | | 10,915 | | | | .87 | | | | 1.73 | | | | 10 | |
| 2008 | | | 28.63 | | | | .35 | | | | (10.54 | ) | | | (10.19 | ) | | | (.33 | ) | | | (.53 | ) | | | (.86 | ) | | | 17.58 | | | | (36.51 | ) | | | 9,463 | | | | .87 | | | | 1.49 | | | | 4 | |
| 2007 | | | 25.77 | | | | .29 | | | | 3.17 | | | | 3.46 | | | | (.30 | ) | | | (.30 | ) | | | (.60 | ) | | | 28.63 | | | | 13.65 | | | | 7,230 | | | | .87 | | | | 1.07 | | | | 4 | |
| | | | | | | | | | | |
| CLASS I (2/94)(e) | | | | | | | | | | | | | | | | | | | | | | | | | | | | | | | | | | | | | | | | | | | | | |
| 2011 | | | 21.50 | | | | .36 | | | | 1.26 | | | | 1.62 | | | | (.32 | ) | | | (1.37 | ) | | | (1.69 | ) | | | 21.43 | | | | 7.68 | | | | 597,030 | | | | .37 | | | | 1.63 | | | | 2 | |
| 2010 | | | 18.86 | | | | .34 | | | | 2.69 | | | | 3.03 | | | | (.35 | ) | | | (.04 | ) | | | (.39 | ) | | | 21.50 | | | | 16.18 | | | | 749,210 | | | | .36 | | | | 1.66 | | | | 4 | |
| 2009 | | | 17.61 | | | | .38 | | | | 1.27 | | | | 1.65 | | | | (.40 | ) | | | — | | | | (.40 | ) | | | 18.86 | | | | 9.78 | | | | 827,145 | | | | .37 | | | | 2.31 | | | | 10 | |
| 2008 | | | 28.66 | | | | .48 | | | | (10.56 | ) | | | (10.08 | ) | | | (.44 | ) | | | (.53 | ) | | | (.97 | ) | | | 17.61 | | | | (36.18 | ) | | | 954,582 | | | | .37 | | | | 1.99 | | | | 4 | |
| 2007 | | | 25.79 | | | | .44 | | | | 3.16 | | | | 3.60 | | | | (.43 | ) | | | (.30 | ) | | | (.73 | ) | | | 28.66 | | | | 14.22 | | | | 1,714,008 | | | | .37 | | | | 1.62 | | | | 4 | |
| (a) | Per share Net Investment Income (Loss) is calculated using the average daily shares method. |
| (b) | Distributions from Capital Gains include short-term capital gains, if any. |
| (c) | Total Return is the combination of changes in net asset value, reinvested dividend income at net asset value and reinvested capital gains distributions at net asset value, if any. Total Return is not annualized. |
| (d) | After expense reimbursement from the Adviser, where applicable. Ratios do not reflect the effect of custodian fee credits earned on the Fund’s net cash on deposit with the custodian bank, where applicable. |
| (e) | Effective January 18, 2011, Class R Shares and Class Y Shares previously offered by FAF Advisors, Inc. were renamed Class R3 Shares and Class I Shares, respectively. |
Section 5 Financial Highlights
107
Nuveen International Fund
| | | | | | | | | | | | | | | | | | | | | | | | | | | | | | | | | | | | | | | | | | | | | | | | | | | | |
Class
(Commencement
Date) | | | | | Investment Operations | | | Less Distributions | | | | | | | | | Ratios/Supplemental Data | |
| | | | | | | | | | | | | | | | | | | | | | | | | | | | | | | | | Ratios to Average
Net Assets After
Reimbursement(d) | | | | |
Year Ended
October 31, | | Beginning
Net Asset
Value | | | Net
Investment
Income
(Loss)(a) | | | Net
Realized/
Unrealized
Gain (Loss) | | | Total | | | Net
Investment
Income | | | Capital
Gains(b) | | | Total | | | Ending
Net
Asset
Value | | | Total
Return(c) | | | Ending
Net
Assets
(000) | | | Expenses | | | Net
Investment
Income
(Loss) | | | Portfolio
Turnover
Rate | |
| | | | | | | | | | | | | |
| Class A (5/94) | | | | | | | | | | | | | | | | | | | | | | | | | | | | | | | | | | | | | | | | | | | | | | | | | | | | |
| 2011 | | $ | 11.62 | | | $ | .10 | | | $ | (.55 | ) | | $ | (.45 | ) | | $ | (.05 | ) | | $ | — | | | $ | (.05 | ) | | $ | 11.12 | | | | (3.93 | )% | | $ | 22,328 | | | | 1.46 | % | | | .84 | % | | | 72 | % |
| 2010 | | | 10.78 | | | | .07 | | | | .81 | | | | .88 | | | | (.04 | ) | | | — | | | | (.04 | ) | | | 11.62 | | | | 8.21 | | | | 26,698 | | | | 1.48 | | | | .62 | | | | 56 | |
| 2009 | | | 8.68 | | | | .09 | | | | 2.09 | | | | 2.18 | | | | (.08 | ) | | | — | | | | (.08 | ) | | | 10.78 | | | | 25.29 | | | | 27,995 | | | | 1.49 | | | | 1.00 | | | | 231 | |
| 2008 | | | 17.15 | | | | .26 | | | | (7.14 | ) | | | (6.88 | ) | | | (.14 | ) | | | (1.45 | ) | | | (1.59 | ) | | | 8.68 | | | | (43.82 | ) | | | 25,342 | | | | 1.49 | | | | 1.92 | | | | 18 | |
| 2007 | | | 14.80 | | | | .15 | | | | 2.59 | | | | 2.74 | | | | (.13 | ) | | | (.26 | ) | | | (.39 | ) | | | 17.15 | | | | 18.92 | | | | 56,705 | | | | 1.49 | | | | .97 | | | | 14 | |
| | | | | | | | | | | | | |
| Class C (9/01) | | | | | | | | | | | | | | | | | | | | | | | | | | | | | | | | | | | | | | | | | | | | | | | | | | | | |
| 2011 | | | 11.03 | | | | .01 | | | | (.53 | ) | | | (.52 | ) | | | — | | | | — | | | | — | | | | 10.51 | | | | (4.71 | ) | | | 1,987 | | | | 2.21 | | | | .10 | | | | 72 | |
| 2010 | | | 10.26 | | | | (.02 | ) | | | .79 | | | | .77 | | | | — | | | | — | | | | — | | | | 11.03 | | | | 7.50 | | | | 2,607 | | | | 2.23 | | | | (.14 | ) | | | 56 | |
| 2009 | | | 8.25 | | | | .02 | | | | 1.99 | | | | 2.01 | | | | — | | | | — | | | | — | | | | 10.26 | | | | 24.36 | | | | 3,269 | | | | 2.24 | | | | .24 | | | | 231 | |
| 2008 | | | 16.36 | | | | .15 | | | | (6.79 | ) | | | (6.64 | ) | | | (.02 | ) | | | (1.45 | ) | | | (1.47 | ) | | | 8.25 | | | | (44.21 | ) | | | 3,232 | | | | 2.24 | | | | 1.20 | | | | 18 | |
| 2007 | | | 14.13 | | | | .03 | | | | 2.48 | | | | 2.51 | | | | (.02 | ) | | | (.26 | ) | | | (.28 | ) | | | 16.36 | | | | 18.09 | | | | 7,173 | | | | 2.24 | | | | .20 | | | | 14 | |
| | | | | | | | | | | | | |
| Class R3 (4/94)(e) | | | | | | | | | | | | | | | | | | | | | | | | | | | | | | | | | | | | | | | | | | | | | | | | | | | | |
| 2011 | | | 11.61 | | | | .07 | | | | (.54 | ) | | | (.47 | ) | | | (.03 | ) | | | — | | | | (.03 | ) | | | 11.11 | | | | (4.10 | ) | | | 11 | | | | 1.68 | | | | .59 | | | | 72 | |
| 2010 | | | 10.78 | | | | .04 | | | | .82 | | | | .86 | | | | (.03 | ) | | | — | | | | (.03 | ) | | | 11.61 | | | | 7.94 | | | | 6 | | | | 1.73 | | | | .38 | | | | 56 | |
| 2009 | | | 8.67 | | | | .07 | | | | 2.11 | | | | 2.18 | | | | (.07 | ) | | | — | | | | (.07 | ) | | | 10.78 | | | | 25.39 | | | | 5 | | | | 1.74 | | | | .73 | | | | 231 | |
| 2008 | | | 17.17 | | | | .19 | | | | (7.10 | ) | | | (6.91 | ) | | | (.14 | ) | | | (1.45 | ) | | | (1.59 | ) | | | 8.67 | | | | (43.94 | ) | | | 2 | | | | 1.74 | | | | 1.40 | | | | 18 | |
| 2007 | | | 14.81 | | | | .10 | | | | 2.61 | | | | 2.71 | | | | (.09 | ) | | | (.26 | ) | | | (.35 | ) | | | 17.17 | | | | 18.66 | | | | 4 | | | | 1.74 | | | | .60 | | | | 14 | |
| | | | | | | | | | | | | |
| Class I (4/94)(e) | | | | | | | | | | | | | | | | | | | | | | | | | | | | | | | | | | | | | | | | | | | | | | | | | | | | |
| 2011 | | | 11.78 | | | | .14 | | | | (.59 | ) | | | (.45 | ) | | | (.08 | ) | | | — | | | | (.08 | ) | | | 11.25 | | | | (3.90 | ) | | | 141,264 | | | | 1.21 | | | | 1.17 | | | | 72 | |
| 2010 | | | 10.92 | | | | .10 | | | | .83 | | | | .93 | | | | (.07 | ) | | | — | | | | (.07 | ) | | | 11.78 | | | | 8.52 | | | | 652,664 | | | | 1.23 | | | | .87 | | | | 56 | |
| 2009 | | | 8.81 | | | | .11 | | | | 2.12 | | | | 2.23 | | | | (.12 | ) | | | — | | | | (.12 | ) | | | 10.92 | | | | 25.68 | | | | 680,309 | | | | 1.24 | | | | 1.25 | | | | 231 | |
| 2008 | | | 17.38 | | | | .30 | | | | (7.24 | ) | | | (6.94 | ) | | | (.18 | ) | | | (1.45 | ) | | | (1.63 | ) | | | 8.81 | | | | (43.68 | ) | | | 658,276 | | | | 1.24 | | | | 2.19 | | | | 18 | |
| 2007 | | | 14.99 | | | | .19 | | | | 2.62 | | | | 2.81 | | | | (.16 | ) | | | (.26 | ) | | | (.42 | ) | | | 17.38 | | | | 19.23 | | | | 1,670,810 | | | | 1.24 | | | | 1.21 | | | | 14 | |
| (a) | Per share Net Investment Income (Loss) is calculated using the average daily shares method. |
| (b) | Distributions from Capital Gains include short-term capital gains, if any. |
| (c) | Total Return is the combination of changes in net asset value without any sales charge, reinvested dividend income at net asset value and reinvested capital gains distributions at net asset value, if any. Total Return is not annualized. |
| (d) | After expense reimbursement from the Adviser, where applicable. Ratios do not reflect the effect of custodian fee credits earned on the Fund’s net cash on deposit with the custodian bank, where applicable. |
| (e) | Effective January 18, 2011, Class R Shares and Class Y Shares previously offered by FAF Advisors, Inc. were renamed Class R3 Shares and Class I Shares, respectively. |
108
Section 5 Financial Highlights
Nuveen International Select Fund
| | | | | | | | | | | | | | | | | | | | | | | | | | | | | | | | | | | | | | | | | | | | | | | | | | | | |
Class
(Commencement
Date) | | | | | Investment Operations | | | Less Distributions | | | | | | | | | Ratios/Supplemental Data | |
| | | | | | | | | | | | | | | | | | Ratios to Average
Net Assets After
Reimbursement(d) | | | | |
Year Ended
October 31, | | Beginning
Net Asset
Value | | | Net
Investment
Income
(Loss)(a) | | | Net
Realized/
Unrealized
Gain (Loss) | | | Total | | | Net
Investment
Income | | | Capital
Gains(b) | | | Total | | | Ending
Net
Asset
Value | | | Total
Return(c) | | | Ending
Net
Assets
(000) | | | Expenses | | | Net
Investment
Income
(Loss) | | | Portfolio
Turnover
Rate | |
| | | | | | | | | | | | | |
| Class A (12/06) | | | | | | | | | | | | | | | | | | | | | | | | | | | | | | | | | | | | | | | | | | | | | | | | | | | | |
| 2011 | | $ | 9.54 | | | $ | .09 | | | $ | (.72 | ) | | $ | (.63 | ) | | $ | (.06 | ) | | $ | — | | | $ | (.06 | ) | | $ | 8.85 | | | | (6.70 | )% | | $ | 4,388 | | | | 1.46 | % | | | .96 | % | | | 59 | % |
| 2010 | | | 8.48 | | | | .06 | | | | 1.02 | | | | 1.08 | | | | (.02 | ) | | | — | | | | (.02 | ) | | | 9.54 | | | | 12.72 | | | | 5,530 | | | | 1.49 | | | | .69 | | | | 47 | |
| 2009 | | | 6.53 | | | | .07 | | | | 2.00 | | | | 2.07 | | | | (.12 | ) | | | — | | | | (.12 | ) | | | 8.48 | | | | 32.32 | | | | 3,029 | | | | 1.49 | | | | 1.04 | | | | 64 | |
| 2008 | | | 12.15 | | | | .15 | | | | (5.52 | ) | | | (5.37 | ) | | | (.06 | ) | | | (.19 | ) | | | (.25 | ) | | | 6.53 | | | | (45.00 | ) | | | 1,904 | | | | 1.49 | | | | 1.52 | | | | 63 | |
| 2007(f) | | | 10.00 | | | | .09 | | | | 2.07 | | | | 2.16 | | | | (.01 | ) | | | — | | | | (.01 | ) | | | 12.15 | | | | 21.58 | | | | 3,228 | | | | 1.49 | * | | | .95 | * | | | 45 | |
| | | | | | | | | | | | | |
| Class C (12/06) | | | | | | | | | | | | | | | | | | | | | | | | | | | | | | | | | | | | | | | | | | | | | | | | | | | | |
| 2011 | | | 9.43 | | | | .02 | | | | (.72 | ) | | | (.70 | ) | | | (.01 | ) | | | — | | | | (.01 | ) | | | 8.72 | | | | (7.45 | ) | | | 717 | | | | 2.21 | | | | .21 | | | | 59 | |
| 2010 | | | 8.42 | | | | .01 | | | | 1.00 | | | | 1.01 | | | | — | | | | — | | | | — | | | | 9.43 | | | | 12.00 | | | | 816 | | | | 2.24 | | | | .08 | | | | 47 | |
| 2009 | | | 6.46 | | | | .03 | | | | 1.97 | | | | 2.00 | | | | (.04 | ) | | | — | | | | (.04 | ) | | | 8.42 | | | | 31.43 | | | | 244 | | | | 2.24 | | | | .40 | | | | 64 | |
| 2008 | | | 12.07 | | | | .09 | | | | (5.48 | ) | | | (5.39 | ) | | | (.03 | ) | | | (.19 | ) | | | (.22 | ) | | | 6.46 | | | | (45.39 | ) | | | 226 | | | | 2.24 | | | | .92 | | | | 63 | |
| 2007(f) | | | 10.00 | | | | .03 | | | | 2.04 | | | | 2.07 | | | | — | | | | — | | | | — | | | | 12.07 | | | | 20.75 | | | | 287 | | | | 2.24 | * | | | .30 | * | | | 45 | |
| | | | | | | | | | | | | |
| Class R3 (12/06)(e) | | | | | | | | | | | | | | | | | | | | | | | | | | | | | | | | | | | | | | | | | | | | | | | | | | | | |
| 2011 | | | 9.48 | | | | .10 | | | | (.91 | ) | | | (.81 | ) | | | — | | | | — | | | | — | | | | 8.67 | | | | (8.54 | ) | | | 13 | | | | 1.67 | | | | 1.02 | | | | 59 | |
| 2010 | | | 8.42 | | | | .05 | | | | 1.01 | | | | 1.06 | | | | — | | | | — | | | | — | | | | 9.48 | | | | 12.59 | | | | 7 | | | | 1.74 | | | | .53 | | | | 47 | |
| 2009 | | | 6.52 | | | | .09 | | | | 1.94 | | | | 2.03 | | | | (.13 | ) | | | — | | | | (.13 | ) | | | 8.42 | | | | 31.99 | | | | 19 | | | | 1.74 | | | | 1.30 | | | | 64 | |
| 2008 | | | 12.12 | | | | .08 | | | | (5.46 | ) | | | (5.38 | ) | | | (.03 | ) | | | (.19 | ) | | | (.22 | ) | | | 6.52 | | | | (45.10 | ) | | | 48 | | | | 1.74 | | | | .90 | | | | 63 | |
| 2007(f) | | | 10.00 | | | | .07 | | | | 2.06 | | | | 2.13 | | | | (.01 | ) | | | — | | | | (.01 | ) | | | 12.12 | | | | 21.27 | | | | 17 | | | | 1.74 | * | | | .77 | * | | | 45 | |
| | | | | | | | | | | | | |
| Class I (12/06)(e) | | | | | | | | | | | | | | | | | | | | | | | | | | | | | | | | | | | | | | | | | | | | | | | | | | | | |
| 2011 | | | 9.57 | | | | .12 | | | | (.74 | ) | | | (.62 | ) | | | (.08 | ) | | | — | | | | (.08 | ) | | | 8.87 | | | | (6.60 | ) | | | 578,597 | | | | 1.21 | | | | 1.23 | | | | 59 | |
| 2010 | | | 8.49 | | | | .09 | | | | 1.02 | | | | 1.11 | | | | (.03 | ) | | | — | | | | (.03 | ) | | | 9.57 | | | | 13.14 | | | | 848,165 | | | | 1.24 | | | | .98 | | | | 47 | |
| 2009 | | | 6.55 | | | | .08 | | | | 2.01 | | | | 2.09 | | | | (.15 | ) | | | — | | | | (.15 | ) | | | 8.49 | | | | 32.68 | | | | 584,667 | | | | 1.24 | | | | 1.17 | | | | 64 | |
| 2008 | | | 12.17 | | | | .17 | | | | (5.52 | ) | | | (5.35 | ) | | | (.08 | ) | | | (.19 | ) | | | (.27 | ) | | | 6.55 | | | | (44.86 | ) | | | 249,805 | | | | 1.24 | | | | 1.72 | | | | 63 | |
| 2007(f) | | | 10.00 | | | | .13 | | | | 2.05 | | | | 2.18 | | | | (.01 | ) | | | — | | | | (.01 | ) | | | 12.17 | | | | 21.78 | | | | 343,161 | | | | 1.24 | * | | | 1.36 | * | | | 45 | |
| (a) | Per share Net Investment Income (Loss) is calculated using the average daily shares method. |
| (b) | Distributions from Capital Gains include short-term capital gains, if any. |
| (c) | Total Return is the combination of changes in net asset value without any sales charge, reinvested dividend income at net asset value and reinvested capital gains distributions at net asset value, if any. Total Return is not annualized. |
| (d) | After expense reimbursement from the Adviser, where applicable. Ratios do not reflect the effect of custodian fee credits earned on the Fund’s net cash on deposit with the custodian bank, where applicable. |
| (e) | Effective January 18, 2011, Class R Shares and Class Y Shares previously offered by FAF Advisors, Inc. were renamed Class R3 Shares and Class I Shares, respectively. |
| (f) | For the period December 21, 2006 (commencement of operations) through October 31, 2007. |
Section 5 Financial Highlights
109
Nuveen Large Cap Growth Opportunities Fund
| | | | | | | | | | | | | | | | | | | | | | | | | | | | | | | | | | | | | | | | | | | | | | | | | | | | |
Class
(Commencement
Date) | | | | | Investment Operations | | | Less Distributions | | | | | | | | | Ratios/Supplemental Data | |
| | | | | | | | | | | | | | | | | | | | | | | | | | | | | | | | | Ratios to Average
Net Assets After
Reimbursement(d) | | | | |
Year Ended
October 31, | | Beginning
Net Asset
Value | | | Net
Investment
Income
(Loss)(a) | | | Net
Realized/
Unrealized
Gain (Loss) | | | Total | | | Net
Investment
Income | | | Capital
Gains(b) | | | Total | | | Ending
Net
Asset
Value | | | Total
Return(c) | | | Ending
Net
Assets
(000) | | | Expenses | | | Net
Investment
Income
(Loss) | | | Portfolio
Turnover
Rate | |
| | | | | | | | | | | | |
| Class A (1/95) | | | | | | | | | | | | | | | | | | | | | | | | | | | | | | | | | | | | | | | | | | | | | | | | | |
| 2011 | | $ | 30.24 | | | $ | (.15 | ) | | $ | 2.83 | | | $ | 2.68 | | | $ | — | | | $ | — | | | $ | — | | | $ | 32.92 | | | | 8.86 | % | | $ | 84,875 | | | | 1.20 | % | | | (.46 | )% | | | 88 | % |
| 2010 | | | 24.23 | | | | (.09 | ) | | | 6.15 | | | | 6.06 | | | | (.05 | ) | | | — | | | | (.05 | ) | | | 30.24 | | | | 25.03 | | | | 66,409 | | | | 1.20 | | | | (.35 | ) | | | 106 | |
| 2009 | | | 21.52 | | | | .05 | | | | 2.68 | | | | 2.73 | | | | (.02 | ) | | | — | | | | (.02 | ) | | | 24.23 | | | | 12.73 | | | | 56,963 | | | | 1.22 | | | | .24 | | | | 112 | |
| 2008 | | | 36.27 | | | | .02 | | | | (11.65 | ) | | | (11.63 | ) | | | — | | | | (3.12 | ) | | | (3.12 | ) | | | 21.52 | | | | (34.81 | ) | | | 53,430 | | | | 1.20 | | | | .07 | | | | 92 | |
| 2007 | | | 29.58 | | | | (.05 | ) | | | 7.08 | | | | 7.03 | | | | — | | | | (.34 | ) | | | (.34 | ) | | | 36.27 | | | | 24.01 | | | | 96,514 | | | | 1.19 | | | | (.15 | ) | | | 102 | |
| | | | | | | | | | | | |
| Class B (3/99) | | | | | | | | | | | | | | | | | | | | | | | | | | | | | | | | | | | | | | | | | | | | | | | | | |
| 2011 | | | 27.68 | | | | (.36 | ) | | | 2.58 | | | | 2.22 | | | | — | | | | — | | | | — | | | | 29.90 | | | | 8.02 | | | | 2,411 | | | | 1.95 | | | | (1.19 | ) | | | 88 | |
| 2010 | | | 22.31 | | | | (.26 | ) | | | 5.63 | | | | 5.37 | | | | — | | | | — | | | | — | | | | 27.68 | | | | 24.07 | | | | 3,473 | | | | 1.95 | | | | (1.06 | ) | | | 106 | |
| 2009 | | | 19.93 | | | | (.09 | ) | | | 2.47 | | | | 2.38 | | | | — | | | | — | | | | — | | | | 22.31 | | | | 11.94 | | | | 4,749 | | | | 1.97 | | | | (.48 | ) | | | 112 | |
| 2008 | | | 34.08 | | | | (.19 | ) | | | (10.84 | ) | | | (11.03 | ) | | | — | | | | (3.12 | ) | | | (3.12 | ) | | | 19.93 | | | | (35.33 | ) | | | 5,907 | | | | 1.95 | | | | (.68 | ) | | | 92 | |
| 2007 | | | 28.01 | | | | (.27 | ) | | | 6.68 | | | | 6.41 | | | | — | | | | (.34 | ) | | | (.34 | ) | | | 34.08 | | | | 23.13 | | | | 11,955 | | | | 1.94 | | | | (.90 | ) | | | 102 | |
| | | | | | | | | | | | |
| Class C (9/01) | | | | | | | | | | | | | | | | | | | | | | | | | | | | | | | | | | | | | | | | | | | | | | | | | |
| 2011 | | | 28.30 | | | | (.37 | ) | | | 2.64 | | | | 2.27 | | | | — | | | | — | | | | — | | | | 30.57 | | | | 8.02 | | | | 7,832 | | | | 1.95 | | | | (1.21 | ) | | | 88 | |
| 2010 | | | 22.81 | | | | (.27 | ) | | | 5.76 | | | | 5.49 | | | | — | | | | — | | | | — | | | | 28.30 | | | | 24.07 | | | | 4,220 | | | | 1.95 | | | | (1.08 | ) | | | 106 | |
| 2009 | | | 20.38 | | | | (.10 | ) | | | 2.53 | | | | 2.43 | | | | — | | | | — | | | �� | — | | | | 22.81 | | | | 11.92 | | | | 4,509 | | | | 1.97 | | | | (.51 | ) | | | 112 | |
| 2008 | | | 34.77 | | | | (.19 | ) | | | (11.08 | ) | | | (11.27 | ) | | | — | | | | (3.12 | ) | | | (3.12 | ) | | | 20.38 | | | | (35.31 | ) | | | 4,368 | | | | 1.95 | | | | (.68 | ) | | | 92 | |
| 2007 | | | 28.58 | | | | (.28 | ) | | | 6.81 | | | | 6.53 | | | | — | | | | (.34 | ) | | | (.34 | ) | | | 34.77 | | | | 23.09 | | | | 8,506 | | | | 1.94 | | | | (.90 | ) | | | 102 | |
| | | | | | | | | | | | |
| Class R3 (11/00)(e) | | | | | | | | | | | | | | | | | | | | | | | | | | | | | | | | | | | | | | | | | | | | | | | | | |
| 2011 | | | 29.83 | | | | (.23 | ) | | | 2.79 | | | | 2.56 | | | | — | | | | — | | | | — | | | | 32.39 | | | | 8.58 | | | | 3,431 | | | | 1.45 | | | | (.72 | ) | | | 88 | |
| 2010 | | | 23.92 | | | | (.16 | ) | | | 6.07 | | | | 5.91 | | | | — | | | | — | | | | — | | | | 29.83 | | | | 24.71 | | | | 742 | | | | 1.45 | | | | (.59 | ) | | | 106 | |
| 2009 | | | 21.26 | | | | (.01 | ) | | | 2.67 | | | | 2.66 | | | | — | | | | — | | | | — | | | | 23.92 | | | | 12.51 | | | | 667 | | | | 1.47 | | | | (.05 | ) | | | 112 | |
| 2008 | | | 35.97 | | | | (.05 | ) | | | (11.54 | ) | | | (11.59 | ) | | | — | | | | (3.12 | ) | | | (3.12 | ) | | | 21.26 | | | | (35.00 | ) | | | 454 | | | | 1.45 | | | | (.18 | ) | | | 92 | |
| 2007 | | | 29.41 | | | | (.12 | ) | | | 7.02 | | | | 6.90 | | | | — | | | | (.34 | ) | | | (.34 | ) | | | 35.97 | | | | 23.70 | | | | 566 | | | | 1.44 | | | | (.39 | ) | | | 102 | |
| | | | | | | | | | | | |
| Class I (12/92)(e) | | | | | | | | | | | | | | | | | | | | | | | | | | | | | | | | | | | | | | | | | | | | | | | | | |
| 2011 | | | 31.33 | | | | (.06 | ) | | | 2.92 | | | | 2.86 | | | | — | | | | — | | | | — | | | | 34.19 | | | | 9.13 | | | | 435,619 | | | | .95 | | | | (.17 | ) | | | 88 | |
| 2010 | | | 25.09 | | | | (.03 | ) | | | 6.38 | | | | 6.35 | | | | (.11 | ) | | | — | | | | (.11 | ) | | | 31.33 | | | | 25.34 | | | | 546,605 | | | | .95 | | | | (.10 | ) | | | 106 | |
| 2009 | | | 22.31 | | | | .11 | | | | 2.77 | | | | 2.88 | | | | (.10 | ) | | | — | | | | (.10 | ) | | | 25.09 | | | | 13.02 | | | | 482,222 | | | | .97 | | | | .48 | | | | 112 | |
| 2008 | | | 37.42 | | | | .10 | | | | (12.07 | ) | | | (11.97 | ) | | | (.02 | ) | | | (3.12 | ) | | | (3.14 | ) | | | 22.31 | | | | (34.65 | ) | | | 417,337 | | | | .95 | | | | .32 | | | | 92 | |
| 2007 | | | 30.48 | | | | .03 | | | | 7.30 | | | | 7.33 | | | | (.05 | ) | | | (.34 | ) | | | (.39 | ) | | | 37.42 | | | | 24.32 | | | | 749,865 | | | | .94 | | | | .11 | | | | 102 | |
| (a) | Per share Net Investment Income (Loss) is calculated using the average daily shares method. |
| (b) | Distributions from Capital Gains include short-term capital gains, if any. |
| (c) | Total Return is the combination of changes in net asset value without any sales charge, reinvested dividend income at net asset value and reinvested capital gains distributions at net asset value, if any. Total Return is not annualized. |
| (d) | After expense reimbursement from the Adviser, where applicable. Ratios do not reflect the effect of custodian fee credits earned on the Fund’s net cash on deposit with the custodian bank, where applicable. |
| (e) | Effective January 18, 2011, Class R Shares and Class Y Shares previously offered by FAF Advisors, Inc. were renamed Class R3 Shares and Class I Shares, respectively. |
110
Section 5 Financial Highlights
Nuveen Large Cap Select Fund
| | | | | | | | | | | | | | | | | | | | | | | | | | | | | | | | | | | | | | | | | | | | | | | | | | | | |
Class
(Commencement
Date) | | | | | Investment Operations | | | Less Distributions | | | | | | | | | Ratios/Supplemental Data | |
| | | | | | | | | | | | | | | | | | | | | | | | | | | | | | | | | Ratios to Average
Net Assets(d) | | | | |
Year Ended
October 31, | | Beginning
Net Asset
Value | | | Net
Investment
Income
(Loss)(a) | | | Net
Realized/
Unrealized
Gain (Loss) | | | Total | | | Net
Investment
Income | | | Capital
Gains(b) | | | Total | | | Ending
Net
Asset
Value | | | Total
Return(c) | | | Ending
Net
Assets
(000) | | | Expenses | | | Net
Investment
Income
(Loss) | | | Portfolio
Turnover
Rate | |
| | | | | | | | | | | | |
| Class A (1/03) | | | | | | | | | | | | | | | | | | | | | | | | | | | | | | | | | | | | | | | | | | | | | | | | | |
| 2011 | | $ | 11.65 | | | $ | (.02 | ) | | $ | .10 | | | $ | .08 | | | $ | — | | | $ | — | | | $ | — | | | $ | 11.73 | | | | .69 | % | | $ | 2,938 | | | | 1.20 | % | | | (.18 | )% | | | 139 | % |
| 2010 | | | 9.80 | | | | (.01 | ) | | | 1.92 | | | | 1.91 | | | | (.06 | ) | | | — | | | | (.06 | ) | | | 11.65 | | | | 19.49 | | | | 3,487 | | | | 1.32 | | | | (.06 | ) | | | 140 | |
| 2009 | | | 8.83 | | | | .04 | | | | .97 | | | | 1.01 | | | | (.04 | ) | | | — | | | | (.04 | ) | | | 9.80 | | | | 11.54 | | | | 3,292 | | | | 1.29 | | | | .52 | | | | 185 | |
| 2008 | | | 17.05 | | | | .06 | | | | (6.04 | ) | | | (5.98 | ) | | | (.04 | ) | | | (2.20 | ) | | | (2.24 | ) | | | 8.83 | | | | (39.81 | ) | | | 3,608 | | | | 1.21 | | | | .49 | | | | 210 | |
| 2007 | | | 15.18 | | | | .03 | | | | 2.12 | | | | 2.15 | | | | (.03 | ) | | | (.25 | ) | | | (.28 | ) | | | 17.05 | | | | 14.36 | | | | 7,998 | | | | 1.19 | | | | .20 | | | | 138 | |
| | | | | | | | | | | | |
| Class C (1/03) | | | | | | | | | | | | | | | | | | | | | | | | | | | | | | | | | | | | | | | | | | | | | | | | | |
| 2011 | | | 11.22 | | | | (.11 | ) | | | .10 | | | | (.01 | ) | | | — | | | | — | | | | — | | | | 11.21 | | | | (.09 | ) | | | 183 | | | | 1.95 | | | | (.90 | ) | | | 139 | |
| 2010 | | | 9.46 | | | | (.08 | ) | | | 1.84 | | | | 1.76 | | | | — | | | | — | | | | — | | | | 11.22 | | | | 18.60 | | | | 175 | | | | 2.07 | | | | (.79 | ) | | | 140 | |
| 2009 | | | 8.56 | | | | (.02 | ) | | | .93 | | | | .91 | | | | (.01 | ) | | | — | | | | (.01 | ) | | | 9.46 | | | | 10.64 | | | | 186 | | | | 2.05 | | | | (.23 | ) | | | 185 | |
| 2008 | | | 16.69 | | | | (.03 | ) | | | (5.90 | ) | | | (5.93 | ) | | | — | | | | (2.20 | ) | | | (2.20 | ) | | | 8.56 | | | | (40.38 | ) | | | 180 | | | | 1.96 | | | | (.26 | ) | | | 210 | |
| 2007 | | | 14.95 | | | | (.09 | ) | | | 2.08 | | | | 1.99 | | | | — | | | | (.25 | ) | | | (.25 | ) | | | 16.69 | | | | 13.45 | | | | 325 | | | | 1.94 | | | | (.57 | ) | | | 138 | |
| | | | | | | | | | | | |
| Class R3 (1/03)(e) | | | | | | | | | | | | | | | | | | | | | | | | | | | | | | | | | | | | | | | | | | | | | | | | | |
| 2011 | | | 11.54 | | | | (.05 | ) | | | .10 | | | | .05 | | | | — | | | | — | | | | — | | | | 11.59 | | | | .43 | | | | 112 | | | | 1.45 | | | | (.42 | ) | | | 139 | |
| 2010 | | | 9.74 | | | | (.03 | ) | | | 1.89 | | | | 1.86 | | | | (.06 | ) | | | — | | | | (.06 | ) | | | 11.54 | | | | 19.11 | | | | 117 | | | | 1.58 | | | | (.32 | ) | | | 140 | |
| 2009 | | | 8.78 | | | | .01 | | | | .98 | | | | .99 | | | | (.03 | ) | | | — | | | | (.03 | ) | | | 9.74 | | | | 11.31 | | | | 66 | | | | 1.56 | | | | .12 | | | | 185 | |
| 2008 | | | 16.97 | | | | .03 | | | | (6.00 | ) | | | (5.97 | ) | | | (.02 | ) | | | (2.20 | ) | | | (2.22 | ) | | | 8.78 | | | | (39.94 | ) | | | 20 | | | | 1.46 | | | | .24 | | | | 210 | |
| 2007 | | | 15.12 | | | | — | * | | | 2.11 | | | | 2.11 | | | | (.01 | ) | | | (.25 | ) | | | (.26 | ) | | | 16.97 | | | | 14.09 | | | | 37 | | | | 1.44 | | | | .02 | | | | 138 | |
| | | | | | | | | | | | |
| Class I (1/03)(e) | | | | | | | | | | | | | | | | | | | | | | | | | | | | | | | | | | | | | | | | | | | | | | | | | |
| 2011 | | | 11.71 | | | | .01 | | | | .10 | | | | .11 | | | | (.02 | ) | | | — | | | | (.02 | ) | | | 11.80 | | | | .89 | | | | 58,314 | | | | .95 | | | | .07 | | | | 139 | |
| 2010 | | | 9.85 | | | | .02 | | | | 1.92 | | | | 1.94 | | | | (.08 | ) | | | — | | | | (.08 | ) | | | 11.71 | | | | 19.75 | | | | 130,803 | | | | 1.07 | | | | .21 | | | | 140 | |
| 2009 | | | 8.87 | | | | .07 | | | | .96 | | | | 1.03 | | | | (.05 | ) | | | — | | | | (.05 | ) | | | 9.85 | | | | 11.81 | | | | 147,231 | | | | 1.04 | | | | .82 | | | | 185 | |
| 2008 | | | 17.10 | | | | .09 | | | | (6.05 | ) | | | (5.96 | ) | | | (.07 | ) | | | (2.20 | ) | | | (2.27 | ) | | | 8.87 | | | | (39.63 | ) | | | 207,904 | | | | .96 | | | | .74 | | | | 210 | |
| 2007 | | | 15.22 | | | | .07 | | | | 2.13 | | | | 2.20 | | | | (.07 | ) | | | (.25 | ) | | | (.32 | ) | | | 17.10 | | | | 14.65 | | | | 449,201 | | | | .94 | | | | .45 | | | | 138 | |
| (a) | Per share Net Investment Income (Loss) is calculated using the average daily shares method. |
| (b) | Distributions from Capital Gains include short-term capital gains, if any. |
| (c) | Total Return is the combination of changes in net asset value without any sales charge, reinvested dividend income at net asset value and reinvested capital gains distributions at net asset value, if any. Total Return is not annualized. |
| (d) | Ratios do not reflect the effect of custodian fee credits earned on the Fund’s net cash on deposit with the custodian bank, where applicable. |
| (e) | Effective January 18, 2011, Class R Shares and Class Y Shares previously offered by FAF Advisors, Inc. were renamed Class R3 Shares and Class I Shares, respectively. |
| * | Rounds to less than $.01 per share. |
Section 5 Financial Highlights
111
Nuveen Large Cap Value Fund
| | | | | | | | | | | | | | | | | | | | | | | | | | | | | | | | | | | | | | | | | | | | | | | | | | | | |
Class
(Commencement
Date) | | | | | Investment Operations | | | Less Distributions | | | | | | | | | Ratios/Supplemental Data | |
| | | | | | | | | | | | | | | | | | | | | | | | | | | | | | | | | Ratios to Average
Net Assets After
Reimbursement(d) | | | | |
Year Ended
October 31, | | Beginning
Net Asset
Value | | | Net
Investment
Income
(Loss)(a) | | | Net
Realized/
Unrealized
Gain (Loss) | | | Total | | | Net
Investment
Income | | | Capital
Gains(b) | | | Total | | | Ending
Net
Asset
Value | | | Total
Return(c) | | | Ending
Net
Assets
(000) | | | Expenses | | | Net
Investment
Income
(Loss) | | | Portfolio
Turnover
Rate | |
| | | | | | | | | | | | |
| Class A (12/87) | | | | | | | | | | | | | | | | | | | | | | | | | | | | | | | | | | | | | | | | | | | | | | | | | |
| 2011 | | $ | 14.32 | | | $ | .08 | | | $ | .21 | | | $ | .29 | | | $ | (.19 | ) | | $ | — | | | $ | (.19 | ) | | $ | 14.42 | | | | 1.98 | % | | $ | 46,659 | | | | 1.24 | % | | | .56 | % | | | 114 | % |
| 2010 | | | 13.14 | | | | .09 | | | | 1.27 | | | | 1.36 | | | | (.18 | ) | | | — | | | | (.18 | ) | | | 14.32 | | | | 10.36 | | | | 52,567 | | | | 1.23 | | | | .63 | | | | 135 | |
| 2009 | | | 12.88 | | | | .18 | | | | .22 | | | | .40 | | | | (.14 | ) | | | — | | | | (.14 | ) | | | 13.14 | | | | 3.24 | | | | 55,401 | | | | 1.22 | | | | 1.49 | | | | 68 | |
| 2008 | | | 22.61 | | | | .25 | | | | (7.02 | ) | | | (6.77 | ) | | | (.16 | ) | | | (2.80 | ) | | | (2.96 | ) | | | 12.88 | | | | (34.00 | ) | | | 60,870 | | | | 1.19 | | | | 1.41 | | | | 90 | |
| 2007 | | | 22.12 | | | | .23 | | | | 2.19 | | | | 2.42 | | | | (.24 | ) | | | (1.69 | ) | | | (1.93 | ) | | | 22.61 | | | | 11.60 | | | | 113,223 | | | | 1.17 | | | | 1.05 | | | | 81 | |
| | | | | | | | | | | | |
| Class C (2/99) | | | | | | | | | | | | | | | | | | | | | | | | | | | | | | | | | | | | | | | | | | | | | | | | | |
| 2011 | | | 13.97 | | | | (.03 | ) | | | .21 | | | | .18 | | | | (.06 | ) | | | — | | | | (.06 | ) | | | 14.09 | | | | 1.28 | | | | 1,094 | | | | 1.99 | | | | (.19 | ) | | | 114 | |
| 2010 | | | 12.81 | | | | (.01 | ) | | | 1.22 | | | | 1.21 | | | | (.05 | ) | | | — | | | | (.05 | ) | | | 13.97 | | | | 9.45 | | | | 1,337 | | | | 1.98 | | | | (.10 | ) | | | 135 | |
| 2009 | | | 12.59 | | | | .09 | | | | .21 | | | | .30 | | | | (.08 | ) | | | — | | | | (.08 | ) | | | 12.81 | | | | 2.47 | | | | 2,016 | | | | 1.97 | | | | .76 | | | | 68 | |
| 2008 | | | 22.21 | | | | .11 | | | | (6.86 | ) | | | (6.75 | ) | | | (.07 | ) | | | (2.80 | ) | | | (2.87 | ) | | | 12.59 | | | | (34.46 | ) | | | 2,643 | | | | 1.94 | | | | .66 | | | | 90 | |
| 2007 | | | 21.81 | | | | .07 | | | | 2.14 | | | | 2.21 | | | | (.12 | ) | | | (1.69 | ) | | | (1.81 | ) | | | 22.21 | | | | 10.71 | | | | 4,587 | | | | 1.92 | | | | .31 | | | | 81 | |
| | | | | | | | | | | | |
| Class R3 (9/01)(e) | | | | | | | | | | | | | | | | | | | | | | | | | | | | | | | | | | | | | | | | | | | | | | | | | |
| 2011 | | | 14.24 | | | | .05 | | | | .21 | | | | .26 | | | | (.18 | ) | | | — | | | | (.18 | ) | | | 14.32 | | | | 1.74 | | | | 768 | | | | 1.49 | | | | .33 | | | | 114 | |
| 2010 | | | 13.09 | | | | .05 | | | | 1.26 | | | | 1.31 | | | | (.16 | ) | | | — | | | | (.16 | ) | | | 14.24 | | | | 10.04 | | | | 794 | | | | 1.49 | | | | .35 | | | | 135 | |
| 2009 | | | 12.85 | | | | .13 | | | | .23 | | | | .36 | | | | (.12 | ) | | | — | | | | (.12 | ) | | | 13.09 | | | | 2.96 | | | | 340 | | | | 1.47 | | | | 1.06 | | | | 68 | |
| 2008 | | | 22.57 | | | | .20 | | | | (6.99 | ) | | | (6.79 | ) | | | (.13 | ) | | | (2.80 | ) | | | (2.93 | ) | | | 12.85 | | | | (34.13 | ) | | | 174 | | | | 1.44 | | | | 1.18 | | | | 90 | |
| 2007 | | | 22.10 | | | | .17 | | | | 2.17 | | | | 2.34 | | | | (.18 | ) | | | (1.69 | ) | | | (1.87 | ) | | | 22.57 | | | | 11.25 | | | | 188 | | | | 1.42 | | | | .78 | | | | 81 | |
| | | | | | | | | | | | |
| Class I (2/94)(e) | | | | | | | | | | | | | | | | | | | | | | | | | | | | | | | | | | | | | | | | | | | | | | | | | |
| 2011 | | | 14.41 | | | | .15 | | | | .18 | | | | .33 | | | | (.23 | ) | | | — | | | | (.23 | ) | | | 14.51 | | | | 2.22 | | | | 104,949 | | | | .99 | | | | .96 | | | | 114 | |
| 2010 | | | 13.23 | | | | .12 | | | | 1.27 | | | | 1.39 | | | | (.21 | ) | | | — | | | | (.21 | ) | | | 14.41 | | | | 10.54 | | | | 286,736 | | | | .98 | | | | .89 | | | | 135 | |
| 2009 | | | 12.95 | | | | .21 | | | | .23 | | | | .44 | | | | (.16 | ) | | | — | | | | (.16 | ) | | | 13.23 | | | | 3.54 | | | | 335,589 | | | | .97 | | | | 1.76 | | | | 68 | |
| 2008 | | | 22.69 | | | | .29 | | | | (7.04 | ) | | | (6.75 | ) | | | (.19 | ) | | | (2.80 | ) | | | (2.99 | ) | | | 12.95 | | | | (33.80 | ) | | | 401,006 | | | | .94 | | | | 1.66 | | | | 90 | |
| 2007 | | | 22.19 | | | | .29 | | | | 2.18 | | | | 2.47 | | | | (.28 | ) | | | (1.69 | ) | | | (1.97 | ) | | | 22.69 | | | | 11.83 | | | | 726,512 | | | | .92 | | | | 1.30 | | | | 81 | |
| (a) | Per share Net Investment Income (Loss) is calculated using the average daily shares method. |
| (b) | Distributions from Capital Gains include short-term capital gains, if any. |
| (c) | Total Return is the combination of changes in net asset value without any sales charge, reinvested dividend income at net asset value and reinvested capital gains distributions at net asset value, if any. Total Return is not annualized. |
| (d) | After expense reimbursement from the Adviser, where applicable. Ratios do not reflect the effect of custodian fee credits earned on the Fund’s net cash on deposit with the custodian bank, where applicable. |
| (e) | Effective January 18, 2011, Class R Shares and Class Y Shares previously offered by FAF Advisors Inc. were renamed Class R3 Shares and Class I Shares, respectively. |
112
Section 5 Financial Highlights
Nuveen Mid Cap Growth Opportunities Fund
| | | | | | | | | | | | | | | | | | | | | | | | | | | | | | | | | | | | | | | | | | | | | | | | | | | | |
Class
(Commencement
Date) | | | | | Investment Operations | | | Less Distributions | | | | | | | | | Ratios/Supplemental Data | |
| | | | | | | | | | | | | | | | | | Ratios to Average
Net Assets After
Reimbursement(d) | | | | |
Year Ended
October 31, | | Beginning
Net Asset
Value | | | Net
Investment
Income
(Loss)(a) | | | Net
Realized/
Unrealized
Gain (Loss) | | | Total | | | Net
Investment
Income | | | Capital
Gains(b) | | | Total | | | Ending
Net
Asset
Value | | | Total
Return(c) | | | Ending
Net
Assets
(000) | | | Expenses | | | Net
Investment
Income
(Loss) | | | Portfolio
Turnover
Rate | |
| | | | | | | | | | | | |
| Class A (1/95) | | | | | | | | | | | | | | | | | | | | | | | | | | | | | | | | | | | | | | | | | | | | | | | | | |
| 2011 | | $ | 37.26 | | | $ | (.22 | ) | | $ | 4.32 | | | $ | 4.10 | | | $ | — | | | $ | — | | | $ | — | | | $ | 41.36 | | | | 11.00 | % | | $ | 289,038 | | | | 1.26 | % | | | (.53 | )% | | | 114 | % |
| 2010 | | | 28.83 | | | | (.18 | ) | | | 8.61 | | | | 8.43 | | | | — | | | | — | | | | — | | | | 37.26 | | | | 29.24 | | | | 275,040 | | | | 1.23 | | | | (.57 | ) | | | 114 | |
| 2009 | | | 23.88 | | | | (.08 | ) | | | 5.03 | | | | 4.95 | | | | — | | | | — | | | | — | | | | 28.83 | | | | 20.73 | | | | 231,743 | | | | 1.23 | | | | (.33 | ) | | | 123 | |
| 2008 | | | 46.57 | | | | (.16 | ) | | | (17.86 | ) | | | (18.02 | ) | | | — | | | | (4.67 | ) | | | (4.67 | ) | | | 23.88 | | | | (42.75 | ) | | | 209,052 | | | | 1.22 | | | | (.43 | ) | | | 113 | |
| 2007 | | | 41.43 | | | | (.24 | ) | | | 9.19 | | | | 8.95 | | | | — | | | | (3.81 | ) | | | (3.81 | ) | | | 46.57 | | | | 23.36 | | | | 425,995 | | | | 1.21 | | | | (.56 | ) | | | 96 | |
| | | | | | | | | | | | |
| Class B (3/99) | | | | | | | | | | | | | | | | | | | | | | | | | | | | | | | | | | | | | | | | | | | | | | | | | |
| 2011 | | | 32.62 | | | | (.46 | ) | | | 3.77 | | | | 3.31 | | | | — | | | | — | | | | — | | | | 35.93 | | | | 10.15 | | | | 4,127 | | | | 2.01 | | | | (1.26 | ) | | | 114 | |
| 2010 | | | 25.43 | | | | (.37 | ) | | | 7.56 | | | | 7.19 | | | | — | | | | — | | | | — | | | | 32.62 | | | | 28.27 | | | | 5,490 | | | | 1.98 | | | | (1.31 | ) | | | 114 | |
| 2009 | | | 21.22 | | | | (.23 | ) | | | 4.44 | | | | 4.21 | | | | — | | | | — | | | | — | | | | 25.43 | | | | 19.84 | | | | 6,762 | | | | 1.98 | | | | (1.06 | ) | | | 123 | |
| 2008 | | | 42.21 | | | | (.38 | ) | | | (15.94 | ) | | | (16.32 | ) | | | — | | | | (4.67 | ) | | | (4.67 | ) | | | 21.22 | | | | (43.18 | ) | | | 7,241 | | | | 1.97 | | | | (1.18 | ) | | | 113 | |
| 2007 | | | 38.15 | | | | (.51 | ) | | | 8.38 | | | | 7.87 | | | | — | | | | (3.81 | ) | | | (3.81 | ) | | | 42.21 | | | | 22.47 | | | | 15,820 | | | | 1.96 | | | | (1.31 | ) | | | 96 | |
| | | | | | | | | | | | |
| Class C (9/01) | | | | | | | | | | | | | | | | | | | | | | | | | | | | | | | | | | | | | | | | | | | | | | | | | |
| 2011 | | | 34.21 | | | | (.49 | ) | | | 3.98 | | | | 3.49 | | | | — | | | | — | | | | — | | | | 37.70 | | | | 10.20 | | | | 14,314 | | | | 2.01 | | | | (1.28 | ) | | | 114 | |
| 2010 | | | 26.67 | | | | (.39 | ) | | | 7.93 | | | | 7.54 | | | | — | | | | — | | | | — | | | | 34.21 | | | | 28.27 | | | | 13,564 | | | | 1.98 | | | | (1.32 | ) | | | 114 | |
| 2009 | | | 22.26 | | | | (.24 | ) | | | 4.65 | | | | 4.41 | | | | — | | | | — | | | | — | | | | 26.67 | | | | 19.81 | | | | 12,894 | | | | 1.98 | | | | (1.07 | ) | | | 123 | |
| 2008 | | | 44.03 | | | | (.40 | ) | | | (16.70 | ) | | | (17.10 | ) | | | — | | | | (4.67 | ) | | | (4.67 | ) | | | 22.26 | | | | (43.16 | ) | | | 13,011 | | | | 1.97 | | | | (1.18 | ) | | | 113 | |
| 2007 | | | 39.65 | | | | (.53 | ) | | | 8.72 | | | | 8.19 | | | | — | | | | (3.81 | ) | | | (3.81 | ) | | | 44.03 | | | | 22.42 | | | | 28,891 | | | | 1.96 | | | | (1.31 | ) | | | 96 | |
| | | | | | | | | | | | |
| Class R3 (12/00)(e) | | | | | | | | | | | | | | | | | | | | | | | | | | | | | | | | | | | | | | | | | | | | | | | | | |
| 2011 | | | 36.58 | | | | (.31 | ) | | | 4.23 | | | | 3.92 | | | | — | | | | — | | | | — | | | | 40.50 | | | | 10.72 | | | | 34,929 | | | | 1.51 | | | | (.77 | ) | | | 114 | |
| 2010 | | | 28.37 | | | | (.26 | ) | | | 8.47 | | | | 8.21 | | | | — | | | | — | | | | — | | | | 36.58 | | | | 28.94 | | | | 33,772 | | | | 1.48 | | | | (.82 | ) | | | 114 | |
| 2009 | | | 23.56 | | | | (.14 | ) | | | 4.95 | | | | 4.81 | | | | — | | | | — | | | | — | | | | 28.37 | | | | 20.42 | | | | 26,822 | | | | 1.48 | | | | (.59 | ) | | | 123 | |
| 2008 | | | 46.11 | | | | (.24 | ) | | | (17.64 | ) | | | (17.88 | ) | | | — | | | | (4.67 | ) | | | (4.67 | ) | | | 23.56 | | | | (42.88 | ) | | | 21,246 | | | | 1.47 | | | | (.69 | ) | | | 113 | |
| 2007 | | | 41.15 | | | | (.34 | ) | | | 9.11 | | | | 8.77 | | | | — | | | | (3.81 | ) | | | (3.81 | ) | | | 46.11 | | | | 23.06 | | | | 29,490 | | | | 1.46 | | | | (.81 | ) | | | 96 | |
| | | | | | | | | | | | |
| Class I (12/89)(e) | | | | | | | | | | | | | | | | | | | | | | | | | | | | | | | | | | | | | | | | | | | | | | | | | |
| 2011 | | | 40.09 | | | | (.10 | ) | | | 4.63 | | | | 4.53 | | | | — | | | | — | | | | — | | | | 44.62 | | | | 11.30 | | | | 728,843 | | | | 1.01 | | | | (.21 | ) | | | 114 | |
| 2010 | | | 30.94 | | | | (.11 | ) | | | 9.26 | | | | 9.15 | | | | — | | | | — | | | | — | | | | 40.09 | | | | 29.57 | | | | 993,053 | | | | .98 | | | | (.31 | ) | | | 114 | |
| 2009 | | | 25.57 | | | | (.02 | ) | | | 5.39 | | | | 5.37 | | | | — | | | | — | | | | — | | | | 30.94 | | | | 21.00 | | | | 907,825 | | | | .98 | | | | (.09 | ) | | | 123 | |
| 2008 | | | 49.40 | | | | (.07 | ) | | | (19.09 | ) | | | (19.16 | ) | | | — | | | | (4.67 | ) | | | (4.67 | ) | | | 25.57 | | | | (42.59 | ) | | | 732,559 | | | | .97 | | | | (.18 | ) | | | 113 | |
| 2007 | | | 43.62 | | | | (.14 | ) | | | 9.73 | | | | 9.59 | | | | — | | | | (3.81 | ) | | | (3.81 | ) | | | 49.40 | | | | 23.68 | | | | 1,478,374 | | | | .96 | | | | (.31 | ) | | | 96 | |
| (a) | Per share Net Investment Income (Loss) is calculated using the average daily shares method. |
| (b) | Distributions from Capital Gains include short-term capital gains, if any. |
| (c) | Total Return is the combination of changes in net asset value without any sales charge, reinvested dividend income at net asset value and reinvested capital gains distributions at net asset value, if any. Total Return is not annualized. |
| (d) | After expense reimbursement from the Adviser, where applicable. Ratios do not reflect the effect of custodian fee credits earned on the Fund’s net cash on deposit with the custodian bank, where applicable. |
| (e) | Effective January 18, 2011, Class R Shares and Class Y Shares previously offered by FAF Advisors, Inc. were renamed Class R3 Shares and Class I Shares, respectively. |
Section 5 Financial Highlights
113
Nuveen Mid Cap Index Fund
| | | | | | | | | | | | | | | | | | | | | | | | | | | | | | | | | | | | | | | | | | | | | | | | | | | | |
Class
(Commencement
Date) | | | | | Investment Operations | | | Less Distributions | | | | | | | | | Ratios/Supplemental Data | |
| | | | | | | | | | | | | | | | | | | | | | | | | | | | | | | | | Ratios to Average
Net Assets After
Reimbursement(d) | | | | |
Year Ended
October 31, | | Beginning
Net Asset
Value | | | Net
Investment
Income
(Loss)(a) | | | Net
Realized/
Unrealized
Gain (Loss) | | | Total | | | Net
Investment
Income | | | Capital
Gains(b) | | | Total | | | Ending Net Asset Value | | | Total
Return(c) | | | Ending
Net
Assets
(000) | | | Expenses | | | Net
Investment
Income
(Loss) | | | Portfolio
Turnover
Rate | |
| | | | | | | | | | | | | |
| Class A (11/99) | | | | | | | | | | | | | | | | | | | | | | | | | | | | | | | | | | | | | | | | | | | | | | | | | | | | |
| 2011 | | $ | 11.98 | | | $ | .05 | | | $ | .92 | | | $ | .97 | | | $ | (.08 | ) | | $ | — | | | $ | (.08 | ) | | $ | 12.87 | | | | 8.07 | % | | $ | 68,856 | | | | .75 | % | | | .36 | % | | | 23 | % |
| 2010 | | | 9.52 | | | | .09 | | | | 2.45 | | | | 2.54 | | | | (.08 | ) | | | — | | | | (.08 | ) | | | 11.98 | | | | 26.79 | | | | 36,499 | | | | .74 | | | | .82 | | | | 8 | |
| 2009 | | | 8.83 | | | | .09 | | | | 1.27 | | | | 1.36 | | | | (.07 | ) | | | (.60 | ) | | | (.67 | ) | | | 9.52 | | | | 17.53 | | | | 22,766 | | | | .75 | | | | 1.15 | | | | 18 | |
| 2008 | | | 15.69 | | | | .13 | | | | (5.30 | ) | | | (5.17 | ) | | | (.10 | ) | | | (1.59 | ) | | | (1.69 | ) | | | 8.83 | | | | (36.46 | ) | | | 11,374 | | | | .74 | | | | 1.04 | | | | 15 | |
| 2007 | | | 14.25 | | | | .15 | | | | 2.08 | | | | 2.23 | | | | (.13 | ) | | | (.66 | ) | | | (.79 | ) | | | 15.69 | | | | 16.32 | | | | 17,868 | | | | .75 | | | | 1.02 | | | | 15 | |
| | | | | | | | | | | | | |
| Class C (9/01) | | | | | | | | | | | | | | | | | | | | | | | | | | | | | | | | | | | | | | | | | | | | | | | | | | | | |
| 2011 | | | 11.67 | | | | (.05 | ) | | | .89 | | | | .84 | | | | — | | | | — | | | | — | | | | 12.51 | | | | 7.20 | | | | 3,302 | | | | 1.50 | | | | (.39 | ) | | | 23 | |
| 2010 | | | 9.28 | | | | .01 | | | | 2.39 | | | | 2.40 | | | | (.01 | ) | | | — | | | | (.01 | ) | | | 11.67 | | | | 25.86 | | | | 3,100 | | | | 1.49 | | | | .07 | | | | 8 | |
| 2009 | | | 8.64 | | | | .04 | | | | 1.23 | | | | 1.27 | | | | (.03 | ) | | | (.60 | ) | | | (.63 | ) | | | 9.28 | | | | 16.68 | | | | 2,766 | | | | 1.50 | | | | .48 | | | | 18 | |
| 2008 | | | 15.41 | | | | .04 | | | | (5.19 | ) | | | (5.15 | ) | | | (.03 | ) | | | (1.59 | ) | | | (1.62 | ) | | | 8.64 | | | | (36.91 | ) | | | 3,101 | | | | 1.48 | | | | .30 | | | | 15 | |
| 2007 | | | 14.03 | | | | .04 | | | | 2.03 | | | | 2.07 | | | | (.03 | ) | | | (.66 | ) | | | (.69 | ) | | | 15.41 | | | | 15.39 | | | | 5,287 | | | | 1.50 | | | | .28 | | | | 15 | |
| | | | | | | | | | | | | |
| Class R3 (11/00)(e) | | | | | | | | | | | | | | | | | | | | | | | | | | | | | | | | | | | | | | | | | | | | | | | | | | | | |
| 2011 | | | 11.86 | | | | .01 | | | | .92 | | | | .93 | | | | (.06 | ) | | | — | | | | (.06 | ) | | | 12.73 | | | | 7.83 | | | | 65,060 | | | | 1.00 | | | | .11 | | | | 23 | |
| 2010 | | | 9.43 | | | | .06 | | | | 2.43 | | | | 2.49 | | | | (.06 | ) | | | — | | | | (.06 | ) | | | 11.86 | | | | 26.48 | | | | 26,458 | | | | .99 | | | | .56 | | | | 8 | |
| 2009 | | | 8.76 | | | | .07 | | | | 1.26 | | | | 1.33 | | | | (.06 | ) | | | (.60 | ) | | | (.66 | ) | | | 9.43 | | | | 17.29 | | | | 12,212 | | | | 1.00 | | | | .89 | | | | 18 | |
| 2008 | | | 15.60 | | | | .10 | | | | (5.27 | ) | | | (5.17 | ) | | | (.08 | ) | | | (1.59 | ) | | | (1.67 | ) | | | 8.76 | | | | (36.66 | ) | | | 8,157 | | | | 1.00 | | | | .80 | | | | 15 | |
| 2007 | | | 14.19 | | | | .11 | | | | 2.07 | | | | 2.18 | | | | (.11 | ) | | | (.66 | ) | | | (.77 | ) | | | 15.60 | | | | 16.01 | | | | 5,913 | | | | 1.00 | | | | .78 | | | | 15 | |
| | | | | | | | | | | | | |
| Class I (11/99)(e) | | | | | | | | | | | | | | | | | | | | | | | | | | | | | | | | | | | | | | | | | | | | | | | | | | | | |
| 2011 | | | 12.03 | | | | .08 | | | | .91 | | | | .99 | | | | (.10 | ) | | | — | | | | (.10 | ) | | | 12.92 | | | | 8.23 | | | | 170,174 | | | | .50 | | | | .63 | | | | 23 | |
| 2010 | | | 9.55 | | | | .12 | | | | 2.46 | | | | 2.58 | | | | (.10 | ) | | | — | | | | (.10 | ) | | | 12.03 | | | | 27.13 | | | | 202,542 | | | | .49 | | | | 1.07 | | | | 8 | |
| 2009 | | | 8.84 | | | | .12 | | | | 1.27 | | | | 1.39 | | | | (.08 | ) | | | (.60 | ) | | | (.68 | ) | | | 9.55 | | | | 17.92 | | | | 163,432 | | | | .50 | | | | 1.47 | | | | 18 | |
| 2008 | | | 15.70 | | | | .17 | | | | (5.31 | ) | | | (5.14 | ) | | | (.13 | ) | | | (1.59 | ) | | | (1.72 | ) | | | 8.84 | | | | (36.31 | ) | | | 177,038 | | | | .49 | | | | 1.29 | | | | 15 | |
| 2007 | | | 14.27 | | | | .19 | | | | 2.07 | | | | 2.26 | | | | (.17 | ) | | | (.66 | ) | | | (.83 | ) | | | 15.70 | | | | 16.52 | | | | 333,784 | | | | .50 | | | | 1.29 | | | | 15 | |
| (a) | Per share Net Investment Income (Loss) is calculated using the average daily shares method. |
| (b) | Distributions from Capital Gains include short-term capital gains, if any. |
| (c) | Total Return is the combination of changes in net asset value, reinvested dividend income at net asset value and reinvested capital gains distributions at net asset value, if any. Total Return is not annualized. |
| (d) | After expense reimbursement from the Adviser, where applicable. Ratios do not reflect the effect of custodian fee credits earned on the Fund’s net cash on deposit with the custodian bank, where applicable. |
| (e) | Effective January 18, 2011, Class R Shares and Class Y Shares previously offered by FAF Advisors, Inc. were renamed Class R3 Shares and Class I Shares, respectively. |
114
Section 5 Financial Highlights
Nuveen Mid Cap Select Fund(f)
| | | | | | | | | | | | | | | | | | | | | | | | | | | | | | | | | | | | | | | | | | | | | | | | | | | | |
Class
(Commencement
Date) | | | | | Investment Operations | | | Less Distributions | | | | | | | | | Ratios/Supplemental Data | |
| | | | | | | | | | | | | | | | | | | | | | | | | | | | Ratios to Average
Net Assets After
Reimbursement(d) | | | | |
Year Ended
October 31, | | Beginning
Net Asset
Value | | | Net
Investment
Income
(Loss)(a) | | | Net
Realized/
Unrealized
Gain (Loss) | | | Total | | | Net
Investment
Income | | | Capital
Gains(b) | | | Total | | | Ending
Net
Asset
Value | | | Total
Return(c) | | | Ending
Net
Assets
(000) | | | Expenses | | | Net
Investment
Income
(Loss) | | | Portfolio
Turnover
Rate | |
| | | | | | | | | | | |
| Class A (4/94) | | | | | | | | | | | | | | | | | | | | | | | | | | | | | | | | | | | | | | | | | | | | | |
| 2011 | | $ | 9.31 | | | $ | (.05 | ) | | $ | .22 | | | $ | .17 | | | $ | — | | | $ | — | | | $ | — | | | $ | 9.48 | | | | 1.83 | % | | $ | 10,829 | | | | 1.41 | % | | | (.48 | )% | | | 148 | % |
| 2010 | | | 7.65 | | | | (.02 | ) | | | 1.70 | | | | 1.68 | | | | (.02 | ) | | | — | | | | (.02 | ) | | | 9.31 | | | | 22.03 | | | | 12,402 | | | | 1.41 | | | | (.27 | ) | | | 154 | |
| 2009 | | | 7.00 | | | | .03 | | | | .62 | | | | .65 | | | | — | | | | — | | | | — | | | | 7.65 | | | | 9.32 | | | | 12,487 | | | | 1.41 | | | | .49 | | | | 186 | |
| 2008 | | | 10.64 | | | | (.01 | ) | | | (3.63 | ) | | | (3.64 | ) | | | — | | | | — | | | | — | | | | 7.00 | | | | (34.21 | ) | | | 12,848 | | | | 1.41 | | | | (.13 | ) | | | 170 | |
| 2007 | | | 9.57 | | | | (.02 | ) | | | 1.09 | | | | 1.07 | | | | — | | | | — | | | | — | | | | 10.64 | | | | 11.18 | | | | 21,817 | | | | 1.41 | | | | (.20 | ) | | | 151 | |
| | | | | | | | | | | |
| Class C (2/00) | | | | | | | | | | | | | | | | | | | | | | | | | | | | | | | | | | | | | | | | | | | | | |
| 2011 | | | 8.61 | | | | (.11 | ) | | | .20 | | | | .09 | | | | — | | | | — | | | | — | | | | 8.70 | | | | 1.05 | | | | 1,771 | | | | 2.16 | | | | (1.22 | ) | | | 148 | |
| 2010 | | | 7.12 | | | | (.08 | ) | | | 1.57 | | | | 1.49 | | | | — | | | | — | | | | — | | | | 8.61 | | | | 20.93 | | | | 2,332 | | | | 2.16 | | | | (1.03 | ) | | | 154 | |
| 2009 | | | 6.56 | | | | (.01 | ) | | | .57 | | | | .56 | | | | — | | | | — | | | | — | | | | 7.12 | | | | 8.54 | | | | 2,526 | | | | 2.16 | | | | (.24 | ) | | | 186 | |
| 2008 | | | 10.04 | | | | (.08 | ) | | | (3.40 | ) | | | (3.48 | ) | | | — | | | | — | | | | — | | | | 6.56 | | | | (34.66 | ) | | | 3,068 | | | | 2.16 | | | | (.88 | ) | | | 170 | |
| 2007 | | | 9.09 | | | | (.09 | ) | | | 1.04 | | | | .95 | | | | — | | | | — | | | | — | | | | 10.04 | | | | 10.45 | | | | 5,190 | | | | 2.16 | | | | (.96 | ) | | | 151 | |
| | | | | | | | | | | |
| Class I (4/94)(e) | | | | | | | | | | | | | | | | | | | | | | | | | | | | | | | | | | | | | | | | | | | | | |
| 2011 | | | 9.71 | | | | (.02 | ) | | | .22 | | | | .20 | | | | — | | | | — | | | | — | | | | 9.91 | | | | 2.06 | | | | 16,646 | | | | 1.16 | | | | (.23 | ) | | | 148 | |
| 2010 | | | 7.98 | | | | — | * | | | 1.77 | | | | 1.77 | | | | (.04 | ) | | | — | | | | (.04 | ) | | | 9.71 | | | | 22.26 | | | | 23,076 | | | | 1.16 | | | | (.03 | ) | | | 154 | |
| 2009 | | | 7.31 | | | | .06 | | | | .64 | | | | .70 | | | | (.03 | ) | | | — | | | | (.03 | ) | | | 7.98 | | | | 9.62 | | | | 27,030 | | | | 1.16 | | | | .81 | | | | 186 | |
| 2008 | | | 11.09 | | | | .01 | | | | (3.79 | ) | | | (3.78 | ) | | | — | | | | — | | | | — | | | | 7.31 | | | | (34.08 | ) | | | 40,409 | | | | 1.16 | | | | .12 | | | | 170 | |
| 2007 | | | 9.95 | | | | — | * | | | 1.15 | | | | 1.15 | | | | (.01 | ) | | | — | | | | (.01 | ) | | | 11.09 | | | | 11.62 | | | | 79,574 | | | | 1.16 | | | | .02 | | | | 151 | |
| (a) | Per share Net Investment Income (Loss) is calculated using the average daily shares method. |
| (b) | Distributions from Capital Gains include short-term capital gains, if any. |
| (c) | Total Return is the combination of changes in net asset value without any sales charge, reinvested dividend income at net asset value and reinvested capital gains distributions at net asset value, if any. Total Return is not annualized. |
| (d) | After expense reimbursement from the Adviser, where applicable. Ratios do not reflect the effect of custodian fee credits earned on the Fund’s net cash on deposit with the custodian bank, where applicable. |
| (e) | Effective January 18, 2011, Class Y Shares previously offered by FAF Advisors, Inc. were renamed Class I Shares. |
| (f) | The financial highlights for the period from November 1, 2006 through May 3, 2009 are those of Small-Mid Cap Core Fund, which changed its principal investment strategies and changed its name to Mid Cap Select Fund on May 4, 2009. |
| * | Rounds to less than $.01 per share. |
Section 5 Financial Highlights
115
Nuveen Mid Cap Value Fund
| | | | | | | | | | | | | | | | | | | | | | | | | | | | | | | | | | | | | | | | | | | | | | | | | | | | |
Class
(Commencement
Date) | | | | | Investment Operations | | | Less Distributions | | | | | | | | | Ratios/Supplemental Data | |
| | | | | | | | | | | | | | | | | | Ratios to Average
Net Assets After
Reimbursement(d) | | | | |
Year Ended
October 31, | | Beginning
Net Asset
Value | | | Net
Investment
Income
(Loss)(a) | | | Net
Realized/
Unrealized
Gain (Loss) | | | Total | | | Net
Investment
Income | | | Capital
Gains(b) | | | Total | | | Ending
Net
Asset
Value | | | Total
Return(c) | | | Ending
Net
Assets
(000) | | | Expenses | | | Net
Investment
Income
(Loss) | | | Portfolio
Turnover
Rate | |
| | | | | | | | | | | | |
| Class A (12/87) | | | | | | | | | | | | | | | | | | | | | | | | | | | | | | | | | | | | | | | | | | | | | | | | | |
| 2011 | | $ | 22.20 | | | $ | .07 | | | $ | (.19 | ) | | $ | (.12 | ) | | $ | (.25 | ) | | $ | — | | | $ | (.25 | ) | | $ | 21.83 | | | | (.64 | )% | | $ | 52,334 | | | | 1.31 | % | | | .30 | % | | | 123 | % |
| 2010 | | | 18.28 | | | | .12 | | | | 4.00 | | | | 4.12 | | | | (.20 | ) | | | — | | | | (.20 | ) | | | 22.20 | | | | 22.65 | | | | 76,667 | | | | 1.25 | | | | .58 | | | | 123 | |
| 2009 | | | 16.13 | | | | .24 | | | | 1.99 | | | | 2.23 | | | | (.08 | ) | | | — | | | | (.08 | ) | | | 18.28 | | | | 13.95 | | | | 130,222 | | | | 1.25 | | | | 1.52 | | | | 106 | |
| 2008 | | | 27.83 | | | | .21 | | | | (9.92 | ) | | | (9.71 | ) | | | (.16 | ) | | | (1.83 | ) | | | (1.99 | ) | | | 16.13 | | | | (37.32 | ) | | | 124,275 | | | | 1.23 | | | | .90 | | | | 93 | |
| 2007 | | | 26.65 | | | | .14 | | | | 2.78 | | | | 2.92 | | | | (.16 | ) | | | (1.58 | ) | | | (1.74 | ) | | | 27.83 | | | | 11.47 | | | | 254,342 | | | | 1.22 | | | | .58 | | | | 95 | |
| | | | | | | | | | | | |
| Class B (8/94) | | | | | | | | | | | | | | | | | | | | | | | | | | | | | | | | | | | | | | | | | | | | | | | | | |
| 2011 | | | 20.87 | | | | (.10 | ) | | | (.18 | ) | | | (.28 | ) | | | (.07 | ) | | | — | | | | (.07 | ) | | | 20.52 | | | | (1.35 | ) | | | 2,073 | | | | 2.06 | | | | (.45 | ) | | | 123 | |
| 2010 | | | 17.21 | | | | (.04 | ) | | | 3.78 | | | | 3.74 | | | | (.08 | ) | | | — | | | | (.08 | ) | | | 20.87 | | | | 21.77 | | | | 2,815 | | | | 2.00 | | | | (.20 | ) | | | 123 | |
| 2009 | | | 15.22 | | | | .13 | | | | 1.87 | | | | 2.00 | | | | (.01 | ) | | | — | | | | (.01 | ) | | | 17.21 | | | | 13.13 | | | | 3,481 | | | | 1.98 | | | | .85 | | | | 106 | |
| 2008 | | | 26.48 | | | | .03 | | | | (9.39 | ) | | | (9.36 | ) | | | (.07 | ) | | | (1.83 | ) | | | (1.90 | ) | | | 15.22 | | | | (37.82 | ) | | | 4,133 | | | | 1.98 | | | | .14 | | | | 93 | |
| 2007 | | | 25.50 | | | | (.05 | ) | | | 2.65 | | | | 2.60 | | | | (.04 | ) | | | (1.58 | ) | | | (1.62 | ) | | | 26.48 | | | | 10.67 | | | | 8,360 | | | | 1.97 | | | | (.13 | ) | | | 95 | |
| | | | | | | | | | | | |
| Class C (2/99) | | | | | | | | | | | | | | | | | | | | | | | | | | | | | | | | | | | | | | | | | | | | | | | | | |
| 2011 | | | 21.36 | | | | (.10 | ) | | | (.18 | ) | | | (.28 | ) | | | (.09 | ) | | | — | | | | (.09 | ) | | | 20.99 | | | | (1.35 | ) | | | 8,957 | | | | 2.06 | | | | (.45 | ) | | | 123 | |
| 2010 | | | 17.61 | | | | (.04 | ) | | | 3.86 | | | | 3.82 | | | | (.07 | ) | | | — | | | | (.07 | ) | | | 21.36 | | | | 21.74 | | | | 11,564 | | | | 2.00 | | | | (.21 | ) | | | 123 | |
| 2009 | | | 15.58 | | | | .12 | | | | 1.92 | | | | 2.04 | | | | (.01 | ) | | | — | | | | (.01 | ) | | | 17.61 | | | | 13.10 | | | | 12,040 | | | | 2.00 | | | | .80 | | | | 106 | |
| 2008 | | | 27.05 | | | | .03 | | | | (9.60 | ) | | | (9.57 | ) | | | (.07 | ) | | | (1.83 | ) | | | (1.90 | ) | | | 15.58 | | | | (37.80 | ) | | | 13,154 | | | | 1.98 | | | | .14 | | | | 93 | |
| 2007 | | | 26.02 | | | | (.06 | ) | | | 2.72 | | | | 2.66 | | | | (.05 | ) | | | (1.58 | ) | | | (1.63 | ) | | | 27.05 | | | | 10.66 | | | | 26,141 | | | | 1.97 | | | | (.18 | ) | | | 95 | |
| | | | | | | | | | | | |
| Class R3 (9/01)(e) | | | | | | | | | | | | | | | | | | | | | | | | | | | | | | | | | | | | | | | | | | | | | | | | | |
| 2011 | | | 22.05 | | | | .01 | | | | (.19 | ) | | | (.18 | ) | | | (.17 | ) | | | — | | | | (.17 | ) | | | 21.70 | | | | (.87 | ) | | | 15,310 | | | | 1.56 | | | | .06 | | | | 123 | |
| 2010 | | | 18.15 | | | | .06 | | | | 3.99 | | | | 4.05 | | | | (.15 | ) | | | — | | | | (.15 | ) | | | 22.05 | | | | 22.40 | | | | 20,195 | | | | 1.50 | | | | .30 | | | | 123 | |
| 2009 | | | 16.04 | | | | .19 | | | | 1.98 | | | | 2.17 | | | | (.06 | ) | | | — | | | | (.06 | ) | | | 18.15 | | | | 13.63 | | | | 25,664 | | | | 1.50 | | | | 1.21 | | | | 106 | |
| 2008 | | | 27.72 | | | | .15 | | | | (9.87 | ) | | | (9.72 | ) | | | (.13 | ) | | | (1.83 | ) | | | (1.96 | ) | | | 16.04 | | | | (37.47 | ) | | | 23,423 | | | | 1.49 | | | | .64 | | | | 93 | |
| 2007 | | | 26.56 | | | | .06 | | | | 2.78 | | | | 2.84 | | | | (.10 | ) | | | (1.58 | ) | | | (1.68 | ) | | | 27.72 | | | | 11.18 | | | | 29,752 | | | | 1.47 | | | | .29 | | | | 95 | |
| | | | | | | | | | | | |
| Class I (2/94)(e) | | | | | | | | | | | | | | | | | | | | | | | | | | | | | | | | | | | | | | | | | | | | | | | | | |
| 2011 | | | 22.37 | | | | .15 | | | | (.22 | ) | | | (.07 | ) | | | (.31 | ) | | | — | | | | (.31 | ) | | | 21.99 | | | | (.42 | ) | | | 151,409 | | | | 1.06 | | | | .65 | | | | 123 | |
| 2010 | | | 18.42 | | | | .16 | | | | 4.05 | | | | 4.21 | | | | (.26 | ) | | | — | | | | (.26 | ) | | | 22.37 | | | | 22.98 | | | | 470,266 | | | | 1.00 | | | | .78 | | | | 123 | |
| 2009 | | | 16.24 | | | | .28 | | | | 2.01 | | | | 2.29 | | | | (.11 | ) | | | — | | | | (.11 | ) | | | 18.42 | | | | 14.24 | | | | 440,968 | | | | 1.00 | | | | 1.76 | | | | 106 | |
| 2008 | | | 27.98 | | | | .27 | | | | (9.99 | ) | | | (9.72 | ) | | | (.19 | ) | | | (1.83 | ) | | | (2.02 | ) | | | 16.24 | | | | (37.17 | ) | | | 415,486 | | | | .99 | | | | 1.14 | | | | 93 | |
| 2007 | | | 26.77 | | | | .22 | | | | 2.80 | | | | 3.02 | | | | (.23 | ) | | | (1.58 | ) | | | (1.81 | ) | | | 27.98 | | | | 11.79 | | | | 772,178 | | | | .97 | | | | .86 | | | | 95 | |
| (a) | Per share Net Investment Income (Loss) is calculated using the average daily shares method. |
| (b) | Distributions from Capital Gains include short-term capital gains, if any. |
| (c) | Total Return is the combination of changes in net asset value without any sales charge, reinvested dividend income at net asset value and reinvested capital gains distributions at net asset value, if any. Total Return is not annualized. |
| (d) | After expense reimbursement from the Adviser, where applicable. Ratios do not reflect the effect of custodian fee credits earned on the Fund’s net cash on deposit with the custodian bank, where applicable. |
| (e) | Effective January 18, 2011, Class R Shares and Class Y Shares previously offered by FAF Advisors, Inc. were renamed Class R3 Shares and Class I Shares, respectively. |
116
Section 5 Financial Highlights
Nuveen Quantitative Enhanced Core Equity Fund
| | | | | | | | | | | | | | | | | | | | | | | | | | | | | | | | | | | | | | | | | | | | | | | | | | | | |
Class
(Commencement
Date) | | | | | Investment Operations | | | Less Distributions | | | | | | | | | Ratios/Supplemental Data | |
| | | | | | | | | | | | | | | | | | | | | | | | | | | | | | | | | Ratios to Average
Net Assets After
Reimbursement(d) | | | | |
Year Ended
October 31, | | Beginning
Net Asset
Value | | | Net
Investment
Income
(Loss)(a) | | | Net
Realized/
Unrealized
Gain (Loss) | | | Total | | | Net
Investment
Income | | | Capital
Gains(b) | | | Total | | | Ending
Net
Asset
Value | | | Total
Return(c) | | | Ending
Net
Assets
(000) | | | Expenses | | | Net
Investment
Income
(Loss) | | | Portfolio
Turnover
Rate | |
| | | | | | | | | | | | | |
| Class A (7/07) | | | | | | | | | | | | | | | | | | | | | | | | | | | | | | | | | | | | | | | | | | | | | | | | | | | | |
| 2011 | | $ | 20.50 | | | $ | .31 | | | $ | 1.02 | | | $ | 1.33 | | | $ | (.26 | ) | | $ | — | | | $ | (.26 | ) | | $ | 21.57 | | | | 6.50 | % | | $ | 164 | | | | .70 | % | | | 1.41 | % | | | 159 | % |
| 2010 | | | 18.01 | | | | .25 | | | | 2.48 | | | | 2.73 | | | | (.24 | ) | | | — | | | | (.24 | ) | | | 20.50 | | | | 15.24 | | | | 253 | | | | .70 | | | | 1.28 | | | | 142 | |
| 2009 | | | 16.56 | | | | .31 | | | | 1.29 | | | | 1.60 | | | | (.15 | ) | | | — | | | | (.15 | ) | | | 18.01 | | | | 9.87 | | | | 243 | | | | .69 | | | | 1.94 | | | | 75 | |
| 2008 | | | 26.90 | | | | .40 | | | | (10.21 | ) | | | (9.81 | ) | | | (.29 | ) | | | (.24 | ) | | | (.53 | ) | | | 16.56 | | | | (37.08 | ) | | | 118 | | | | .70 | | | | 1.77 | | | | 153 | |
| 2007(f) | | | 25.00 | | | | .06 | | | | 1.91 | | | | 1.97 | | | | (.07 | ) | | | — | | | | (.07 | ) | | | 26.90 | | | | 7.89 | | | | 131 | | | | .70 | * | | | .91 | * | | | 55 | |
| | | | | | | | | | | | | |
| Class C (7/07) | | | | | | | | | | | | | | | | | | | | | | | | | | | | | | | | | | | | | | | | | | | | | | | | | | | | |
| 2011 | | | 20.50 | | | | .12 | | | | 1.06 | | | | 1.18 | | | | (.28 | ) | | | — | | | | (.28 | ) | | | 21.40 | | | | 5.76 | | | | 108 | | | | 1.45 | | | | .56 | | | | 159 | |
| 2010 | | | 17.91 | | | | .08 | | | | 2.51 | | | | 2.59 | | | | — | | | | — | | | | — | | | | 20.50 | | | | 14.46 | | | | 14 | | | | 1.45 | | | | .43 | | | | 142 | |
| 2009 | | | 16.51 | | | | .24 | | | | 1.24 | | | | 1.48 | | | | (.08 | ) | | | — | | | | (.08 | ) | | | 17.91 | | | | 9.05 | | | | 4 | | | | 1.44 | | | | 1.57 | | | | 75 | |
| 2008 | | | 26.88 | | | | .23 | | | | (10.20 | ) | | | (9.97 | ) | | | (.16 | ) | | | (.24 | ) | | | (.40 | ) | | | 16.51 | | | | (37.58 | ) | | | 10 | | | | 1.45 | | | | .99 | | | | 153 | |
| 2007(f) | | | 25.00 | | | | .02 | | | | 1.90 | | | | 1.92 | | | | (.04 | ) | | | — | | | | (.04 | ) | | | 26.88 | | | | 7.69 | | | | 15 | | | | 1.45 | * | | | .23 | * | | | 55 | |
| | | | | | | | | | | | | |
| Class I (7/07)(e) | | | | | | | | | | | | | | | | | | | | | | | | | | | | | | | | | | | | | | | | | | | | | | | | | | | | |
| 2011 | | | 20.57 | | | | .37 | | | | 1.03 | | | | 1.40 | | | | (.33 | ) | | | — | | | | (.33 | ) | | | 21.64 | | | | 6.79 | | | | 107,734 | | | | .45 | | | | 1.68 | | | | 159 | |
| 2010 | | | 18.04 | | | | .29 | | | | 2.51 | | | | 2.80 | | | | (.27 | ) | | | — | | | | (.27 | ) | | | 20.57 | | | | 15.61 | | | | 203,316 | | | | .45 | | | | 1.50 | | | | 142 | |
| 2009 | | | 16.57 | | | | .35 | | | | 1.29 | | | | 1.64 | | | | (.17 | ) | | | — | | | | (.17 | ) | | | 18.04 | | | | 10.13 | | | | 146,180 | | | | .44 | | | | 2.19 | | | | 75 | |
| 2008 | | | 26.90 | | | | .44 | | | | (10.20 | ) | | | (9.76 | ) | | | (.33 | ) | | | (.24 | ) | | | (.57 | ) | | | 16.57 | | | | (36.93 | ) | | | 89,270 | | | | .45 | | | | 1.99 | | | | 153 | |
| 2007(f) | | | 25.00 | | | | .11 | | | | 1.87 | | | | 1.98 | | | | (.08 | ) | | | — | | | | (.08 | ) | | | 26.90 | | | | 7.93 | | | | 48,745 | | | | .45 | * | | | 1.73 | * | | | 55 | |
| (a) | Per share Net Investment Income (Loss) is calculated using the average daily shares method. |
| (b) | Distributions from Capital Gains include short-term capital gains, if any. |
| (c) | Total Return is the combination of changes in net asset value, reinvested dividend income at net asset value and reinvested capital gains distributions at net asset value, if any. Total Return is not annualized. |
| (d) | After expense reimbursement from the Adviser, where applicable. Ratios do not reflect the effect of custodian fee credits earned on the Fund’s net cash on deposit with the custodian bank, where applicable. |
| (e) | Effective January 18, 2011, Class Y Shares previously offered by FAF Advisors, Inc. were renamed Class I Shares. |
| (f) | For the period July 31, 2007 (commencement of operations) through October 31, 2007. |
Section 5 Financial Highlights
117
Nuveen Small Cap Growth Opportunities Fund
| | | | | | | | | | | | | | | | | | | | | | | | | | | | | | | | | | | | | | | | | | | | | | | | | | | | |
Class
(Commencement
Date) | | | | | Investment Operations | | | Less Distributions | | | | | | | | | Ratios/Supplemental Data | |
| | | | | | | | | | | | | | | | | | | | | | | | | | | | | | | | | Ratios to Average
Net Assets After
Reimbursement(d) | | | | |
Year Ended
October 31, | | Beginning
Net Asset
Value | | | Net
Investment
Income
(Loss)(a) | | | Net
Realized/
Unrealized
Gain (Loss) | | | Total | | | Net
Investment
Income | | | Capital
Gains(b) | | | Total | | | Ending
Net
Asset
Value | | | Total
Return(c) | | | Ending
Net
Assets
(000) | | | Expenses | | | Net
Investment
Income
(Loss) | | | Portfolio
Turnover
Rate | |
| | | | | | | | | | |
| Class A (8/95) | | | | | | | | | | | | | | | | | | | | | | | | | | | | | | | | | | | | | | | | | |
| 2011 | | $ | 19.04 | | | $ | (.24 | ) | | $ | 1.61 | | | $ | 1.37 | | | $ | — | | | $ | — | | | $ | — | | | $ | 20.41 | | | | 7.20 | % | | $ | 36,188 | | | | 1.47 | % | | | (1.12 | )% | | | 118 | % |
| 2010 | | | 14.55 | | | | (.18 | ) | | | 4.67 | | | | 4.49 | | | | — | | | | — | | | | — | | | | 19.04 | | | | 30.86 | | | | 39,501 | | | | 1.47 | | | | (1.05 | ) | | | 142 | |
| 2009 | | | 11.96 | | | | (.11 | ) | | | 2.70 | | | | 2.59 | | | | — | | | | — | | | | — | | | | 14.55 | | | | 21.66 | | | | 30,202 | | | | 1.47 | | | | (.89 | ) | | | 169 | |
| 2008 | | | 21.65 | | | | (.14 | ) | | | (7.97 | ) | | | (8.11 | ) | | | — | | | | (1.58 | ) | | | (1.58 | ) | | | 11.96 | | | | (40.07 | ) | | | 29,022 | | | | 1.46 | | | | (.82 | ) | | | 138 | |
| 2007 | | | 20.49 | | | | (.19 | ) | | | 2.67 | | | | 2.48 | | | | — | | | | (1.32 | ) | | | (1.32 | ) | | | 21.65 | | | | 12.81 | | | | 149,231 | | | | 1.47 | | | | (.89 | ) | | | 118 | |
| | | | | | | | | | |
| Class B (3/99) | | | | | | | | | | | | | | | | | | | | | | | | | | | | | | | | | | | | | | | | | |
| 2011 | | | 16.66 | | | | (.35 | ) | | | 1.41 | | | | 1.06 | | | | — | | | | — | | | | — | | | | 17.72 | | | | 6.36 | | | | 1,482 | | | | 2.22 | | | | (1.86 | ) | | | 118 | |
| 2010 | | | 12.82 | | | | (.27 | ) | | | 4.11 | | | | 3.84 | | | | — | | | | — | | | | — | | | | 16.66 | | | | 29.95 | | | | 2,088 | | | | 2.22 | | | | (1.79 | ) | | | 142 | |
| 2009 | | | 10.62 | | | | (.18 | ) | | | 2.38 | | | | 2.20 | | | | — | | | | — | | | | — | | | | 12.82 | | | | 20.72 | | | | 2,025 | | | | 2.22 | | | | (1.64 | ) | | | 169 | |
| 2008 | | | 19.56 | | | | (.23 | ) | | | (7.13 | ) | | | (7.36 | ) | | | — | | | | (1.58 | ) | | | (1.58 | ) | | | 10.62 | | | | (40.55 | ) | | | 1,978 | | | | 2.21 | | | | (1.57 | ) | | | 138 | |
| 2007 | | | 18.76 | | | | (.31 | ) | | | 2.43 | | | | 2.12 | | | | — | | | | (1.32 | ) | | | (1.32 | ) | | | 19.56 | | | | 12.03 | | | | 4,467 | | | | 2.22 | | | | (1.65 | ) | | | 118 | |
| | | | | | | | | | |
| Class C (9/01) | | | | | | | | | | | | | | | | | | | | | | | | | | | | | | | | | | | | | | | | | |
| 2011 | | | 17.46 | | | | (.36 | ) | | | 1.48 | | | | 1.12 | | | | — | | | | — | | | | — | | | | 18.58 | | | | 6.41 | | | | 1,546 | | | | 2.22 | | | | (1.87 | ) | | | 118 | |
| 2010 | | | 13.44 | | | | (.28 | ) | | | 4.30 | | | | 4.02 | | | | — | | | | — | | | | — | | | | 17.46 | | | | 29.91 | | | | 1,596 | | | | 2.22 | | | | (1.80 | ) | | | 142 | |
| 2009 | | | 11.13 | | | | (.19 | ) | | | 2.50 | | | | 2.31 | | | | — | | | | — | | | | — | | | | 13.44 | | | | 20.75 | | | | 1,341 | | | | 2.22 | | | | (1.66 | ) | | | 169 | |
| 2008 | | | 20.41 | | | | (.24 | ) | | | (7.46 | ) | | | (7.70 | ) | | | — | | | | (1.58 | ) | | | (1.58 | ) | | | 11.13 | | | | (40.53 | ) | | | 1,104 | | | | 2.21 | | | | (1.56 | ) | | | 138 | |
| 2007 | | | 19.53 | | | | (.33 | ) | | | 2.53 | | | | 2.20 | | | | — | | | | (1.32 | ) | | | (1.32 | ) | | | 20.41 | | | | 11.96 | | | | 2,295 | | | | 2.22 | | | | (1.64 | ) | | | 118 | |
| | | | | | | | | | |
| Class R3 (12/00)(e) | | | | | | | | | | | | | | | | | | | | | | | | | | | | | | | | | | | | | | | | | |
| 2011 | | | 18.74 | | | | (.29 | ) | | | 1.59 | | | | 1.30 | | | | — | | | | — | | | | — | | | | 20.04 | | | | 6.94 | | | | 2,334 | | | | 1.72 | | | | (1.37 | ) | | | 118 | |
| 2010 | | | 14.36 | | | | (.22 | ) | | | 4.60 | | | | 4.38 | | | | — | | | | — | | | | — | | | | 18.74 | | | | 30.50 | | | | 2,185 | | | | 1.72 | | | | (1.31 | ) | | | 142 | |
| 2009 | | | 11.83 | | | | (.16 | ) | | | 2.69 | | | | 2.53 | | | | — | | | | — | | | | — | | | | 14.36 | | | | 21.39 | | | | 1,469 | | | | 1.72 | | | | (1.24 | ) | | | 169 | |
| 2008 | | | 21.49 | | | | (.17 | ) | | | (7.91 | ) | | | (8.08 | ) | | | — | | | | (1.58 | ) | | | (1.58 | ) | | | 11.83 | | | | (40.24 | ) | | | 433 | | | | 1.72 | | | | (1.04 | ) | | | 138 | |
| 2007 | | | 20.39 | | | | (.24 | ) | | | 2.66 | | | | 2.42 | | | | — | | | | (1.32 | ) | | | (1.32 | ) | | | 21.49 | | | | 12.56 | | | | 522 | | | | 1.72 | | | | (1.17 | ) | | | 118 | |
| | | | | | | | | | |
| Class I (8/95)(e) | | | | | | | | | | | | | | | | | | | | | | | | | | | | | | | | | | | | | | | | | |
| 2011 | | | 20.51 | | | | (.19 | ) | | | 1.72 | | | | 1.53 | | | | — | | | | — | | | | — | | | | 22.04 | | | | 7.46 | | | | 63,866 | | | | 1.22 | | | | (.84 | ) | | | 118 | |
| 2010 | | | 15.63 | | | | (.15 | ) | | | 5.03 | | | | 4.88 | | | | — | | | | — | | | | — | | | | 20.51 | | | | 31.22 | | | | 141,215 | | | | 1.22 | | | | (.80 | ) | | | 142 | |
| 2009 | | | 12.81 | | | | (.09 | ) | | | 2.91 | | | | 2.82 | | | | — | | | | — | | | | — | | | | 15.63 | | | | 22.01 | | | | 103,423 | | | | 1.22 | | | | (.67 | ) | | | 169 | |
| 2008 | | | 23.03 | | | | (.10 | ) | | | (8.54 | ) | | | (8.64 | ) | | | — | | | | (1.58 | ) | | | (1.58 | ) | | | 12.81 | | | | (39.97 | ) | | | 75,355 | | | | 1.22 | | | | (.56 | ) | | | 138 | |
| 2007 | | | 21.66 | | | | (.15 | ) | | | 2.84 | | | | 2.69 | | | | — | | | | (1.32 | ) | | | (1.32 | ) | | | 23.03 | | | | 13.10 | | | | 154,456 | | | | 1.22 | | | | (.64 | ) | | | 118 | |
| (a) | Per share Net Investment Income (Loss) is calculated using the average daily shares method. |
| (b) | Distributions from Capital Gains include short-term capital gains, if any. |
| (c) | Total Return is the combination of changes in net asset value without any sales charge, reinvested dividend income at net asset value and reinvested capital gains distributions at net asset value, if any. Total Return is not annualized. |
| (d) | After expense reimbursement from the Adviser, where applicable. Ratios do not reflect the effect of custodian fee credits earned on the Fund’s net cash on deposit with the custodian bank, where applicable. |
| (e) | Effective January 18, 2011, Class R Shares and Class Y Shares previously offered by FAF Advisors, Inc. were renamed Class R3 Shares and Class I Shares, respectively. |
118
Section 5 Financial Highlights
Nuveen Small Cap Index Fund
| | | | | | | | | | | | | | | | | | | | | | | | | | | | | | | | | | | | | | | | | | | | | | | | | | | | |
Class
(Commencement
Date) | | | | | Investment Operations | | | Less Distributions | | | | | | | | | Ratios/Supplemental Data | |
| | | | | | | | | | | | | | | | | | Ratios to Average
Net Assets After
Reimbursement(d) | | | | |
Year Ended
October 31, | | Beginning
Net Asset
Value | | | Net
Investment
Income
(Loss)(a) | | | Net
Realized/
Unrealized
Gain (Loss) | | | Total | | | Net
Investment
Income | | | Capital
Gains(b) | | | Total | | | Ending
Net
Asset
Value | | | Total
Return(c) | | | Ending
Net
Assets
(000) | | | Expenses | | | Net
Investment
Income
(Loss) | | | Portfolio
Turnover
Rate | |
| | | | | | | | | | | | | |
| Class A (12/98) | | | | | | | | | | | | | | | | | | | | | | | | | | | | | | | | | | | | | | | | | | | | | | | | | | | | |
| 2011 | | $ | 9.89 | | | $ | .05 | | | $ | .55 | | | $ | .60 | | | $ | (.06 | ) | | $ | — | | | $ | (.06 | ) | | $ | 10.43 | | | | 6.03 | % | | $ | 19,406 | | | | .83 | % | | | .50 | % | | | 14 | % |
| 2010 | | | 7.90 | | | | .05 | | | | 1.99 | | | | 2.04 | | | | (.05 | ) | | | — | | | | (.05 | ) | | | 9.89 | | | | 25.91 | | | | 12,667 | | | | .79 | | | | .55 | | | | 12 | |
| 2009 | | | 8.91 | | | | .06 | | | | .27 | | | | .33 | | | | (.07 | ) | | | (1.27 | ) | | | (1.34 | ) | | | 7.90 | | | | 6.34 | | | | 8,591 | | | | .82 | | | | .87 | | | | 22 | |
| 2008 | | | 15.37 | | | | .13 | | | | (4.88 | ) | | | (4.75 | ) | | | (.10 | ) | | | (1.61 | ) | | | (1.71 | ) | | | 8.91 | | | | (34.15 | ) | | | 6,043 | | | | .82 | | | | 1.09 | | | | 19 | |
| 2007 | | | 16.23 | | | | .14 | | | | 1.13 | | | | 1.27 | | | | (.12 | ) | | | (2.01 | ) | | | (2.13 | ) | | | 15.37 | | | | 8.56 | | | | 9,109 | | | | .83 | | | | .92 | | | | 12 | |
| | | | | | | | | | | | | |
| Class C (9/01) | | | | | | | | | | | | | | | | | | | | | | | | | | | | | | | | | | | | | | | | | | | | | | | | | | | | |
| 2011 | | | 9.52 | | | | (.03 | ) | | | .53 | | | | .50 | | | | — | | | | — | | | | — | | | | 10.02 | | | | 5.25 | | | | 1,330 | | | | 1.58 | | | | (.26 | ) | | | 14 | |
| 2010 | | | 7.62 | | | | (.02 | ) | | | 1.92 | | | | 1.90 | | | | — | | | | — | | | | — | | | | 9.52 | | | | 24.93 | | | | 1,645 | | | | 1.54 | | | | (.20 | ) | | | 12 | |
| 2009 | | | 8.66 | | | | .01 | | | | .26 | | | | .27 | | | | (.04 | ) | | | (1.27 | ) | | | (1.31 | ) | | | 7.62 | | | | 5.60 | | | | 1,380 | | | | 1.57 | | | | .17 | | | | 22 | |
| 2008 | | | 15.02 | | | | .04 | | | | (4.76 | ) | | | (4.72 | ) | | | (.03 | ) | | | (1.61 | ) | | | (1.64 | ) | | | 8.66 | | | | (34.67 | ) | | | 1,531 | | | | 1.57 | | | | .34 | | | | 19 | |
| 2007 | | | 15.92 | | | | .03 | | | | 1.10 | | | | 1.13 | | | | (.02 | ) | | | (2.01 | ) | | | (2.03 | ) | | | 15.02 | | | | 7.78 | | | | 2,916 | | | | 1.58 | | | | .17 | | | | 12 | |
| | | | | | | | | | | | | |
| Class R3 (12/98)(e) | | | | | | | | | | | | | | | | | | | | | | | | | | | | | | | | | | | | | | | | | | | | | | | | | | | | |
| 2011 | | | 9.66 | | | | .03 | | | | .53 | | | | .56 | | | | (.04 | ) | | | — | | | | (.04 | ) | | | 10.18 | | | | 5.79 | | | | 11,824 | | | | 1.08 | | | | .24 | | | | 14 | |
| 2010 | | | 7.73 | | | | .03 | | | | 1.94 | | | | 1.97 | | | | (.04 | ) | | | — | | | | (.04 | ) | | | 9.66 | | | | 25.55 | | | | 4,795 | | | | 1.04 | | | | .30 | | | | 12 | |
| 2009 | | | 8.76 | | | | .04 | | | | .26 | | | | .30 | | | | (.06 | ) | | | (1.27 | ) | | | (1.33 | ) | | | 7.73 | | | | 6.08 | | | | 2,512 | | | | 1.07 | | | | .55 | | | | 22 | |
| 2008 | | | 15.16 | | | | .10 | | | | (4.81 | ) | | | (4.71 | ) | | | (.08 | ) | | | (1.61 | ) | | | (1.69 | ) | | | 8.76 | | | | (34.33 | ) | | | 1,121 | | | | 1.08 | | | | .87 | | | | 19 | |
| 2007 | | | 16.04 | | | | .11 | | | | 1.11 | | | | 1.22 | | | | (.09 | ) | | | (2.01 | ) | | | (2.10 | ) | | | 15.16 | | | | 8.34 | | | | 703 | | | | 1.08 | | | | .71 | | | | 12 | |
| | | | | | | | | | | | | |
| Class I (12/98)(e) | | | | | | | | | | | | | | | | | | | | | | | | | | | | | | | | | | | | | | | | | | | | | | | | | | | | |
| 2011 | | | 9.91 | | | | .08 | | | | .55 | | | | .63 | | | | (.08 | ) | | | — | | | | (.08 | ) | | | 10.46 | | | | 6.33 | | | | 40,135 | | | | .58 | | | | .75 | | | | 14 | |
| 2010 | | | 7.91 | | | | .07 | | | | 2.00 | | | | 2.07 | | | | (.07 | ) | | | — | | | | (.07 | ) | | | 9.91 | | | | 26.22 | | | | 47,179 | | | | .54 | | | | .80 | | | | 12 | |
| 2009 | | | 8.92 | | | | .09 | | | | .25 | | | | .34 | | | | (.08 | ) | | | (1.27 | ) | | | (1.35 | ) | | | 7.91 | | | | 6.50 | | | | 43,179 | | | | .57 | | | | 1.19 | | | | 22 | |
| 2008 | | | 15.37 | | | | .16 | | | | (4.88 | ) | | | (4.72 | ) | | | (.12 | ) | | | (1.61 | ) | | | (1.73 | ) | | | 8.92 | | | | (33.95 | ) | | | 54,932 | | | | .57 | | | | 1.33 | | | | 19 | |
| 2007 | | | 16.23 | | | | .18 | | | | 1.13 | | | | 1.31 | | | | (.16 | ) | | | (2.01 | ) | | | (2.17 | ) | | | 15.37 | | | | 8.84 | | | | 114,343 | | | | .58 | | | | 1.16 | | | | 12 | |
| (a) | Per share Net Investment Income (Loss) is calculated using the average daily shares method. |
| (b) | Distributions from Capital Gains include short-term capital gains, if any. |
| (c) | Total Return is the combination of changes in net asset value, reinvested dividend income at net asset value and reinvested capital gains distributions at net asset value, if any. Total Return is not annualized. |
| (d) | After expense reimbursement from the Adviser, where applicable. Ratios do not reflect the effect of custodian fee credits earned on the Fund’s net cash on deposit with the custodian bank, where applicable. |
| (e) | Effective January 18, 2011, Class R Shares and Class Y Shares previously offered by FAF Advisors, Inc. were renamed Class R3 Shares and Class I Shares, respectively. |
Section 5 Financial Highlights
119
Nuveen Small Cap Select Fund
| | | | | | | | | | | | | | | | | | | | | | | | | | | | | | | | | | | | | | | | | | | | | | | | | | | | |
Class
(Commencement
Date) | | | | | Investment Operations | | | Less Distributions | | | | | | | | | Ratios/Supplemental Data | |
| | | | | | | | | | | | | | | | | | | | | | | | | | | | | | | | | Ratios to Average
Net Assets After
Reimbursement(d) | | | | |
Year Ended
October 31, | | Beginning
Net Asset
Value | | | Net
Investment
Income
(Loss)(a) | | | Net
Realized/
Unrealized
Gain (Loss) | | | Total | | | Net
Investment
Income | | | Capital
Gains(b) | | | Total | | | Ending
Net
Asset
Value | | | Total
Return(c) | | | Ending
Net
Assets
(000) | | | Expenses | | | Net
Investment
Income
(Loss) | | | Portfolio
Turnover
Rate | |
| | | | | | | | | | | | |
| Class A (5/92) | | | | | | | | | | | | | | | | | | | | | | | | | | | | | | | | | | | | | | | | | | | | | | | | | |
| 2011 | | $ | 11.72 | | | $ | (.09 | ) | | $ | .81 | | | $ | .72 | | | $ | — | | | $ | — | | | $ | — | | | $ | 12.44 | | | | 6.14 | % | | $ | 275,994 | | | | 1.30 | % | | | (.70 | )% | | | 69 | % |
| 2010 | | | 9.53 | | | | (.05 | ) | | | 2.24 | | | | 2.19 | | | | — | | | | — | | | | — | | | | 11.72 | | | | 22.98 | | | | 339,826 | | | | 1.24 | | | | (.48 | ) | | | 88 | |
| 2009 | | | 8.27 | | | | (.01 | ) | | | 1.27 | | | | 1.26 | | | | — | | | | — | | | | — | | | | 9.53 | | | | 15.24 | | | | 295,348 | | | | 1.26 | | | | (.09 | ) | | | 99 | |
| 2008 | | | 14.06 | | | | (.02 | ) | | | (4.92 | ) | | | (4.94 | ) | | | — | | | | (.85 | ) | | | (.85 | ) | | | 8.27 | | | | (37.00 | ) | | | 166,698 | | | | 1.26 | | | | (.15 | ) | | | 92 | |
| 2007 | | | 15.12 | | | | (.02 | ) | | | 1.04 | | | | 1.02 | | | | — | | | | (2.08 | ) | | | (2.08 | ) | | | 14.06 | | | | 7.35 | | | | 238,129 | | | | 1.23 | | | | (.22 | ) | | | 97 | |
| | | | | | | | | | | | |
| Class B (3/95) | | | | | | | | | | | | | | | | | | | | | | | | | | | | | | | | | | | | | | | | | | | | | | | | | |
| 2011 | | | 9.27 | | | | (.15 | ) | | | .65 | | | | .50 | | | | — | | | | — | | | | — | | | | 9.77 | | | | 5.39 | | | | 2,866 | | | | 2.05 | | | | (1.45 | ) | | | 69 | |
| 2010 | | | 7.60 | | | | (.10 | ) | | | 1.77 | | | | 1.67 | | | | — | | | | — | | | | — | | | | 9.27 | | | | 21.97 | | | | 3,925 | | | | 1.99 | | | | (1.22 | ) | | | 88 | |
| 2009 | | | 6.64 | | | | (.05 | ) | | | 1.01 | | | | .96 | | | | — | | | | — | | | | — | | | | 7.60 | | | | 14.46 | | | | 5,511 | | | | 2.01 | | | | (.80 | ) | | | 99 | |
| 2008 | | | 11.56 | | | | (.08 | ) | | | (3.99 | ) | | | (4.07 | ) | | | — | | | | (.85 | ) | | | (.85 | ) | | | 6.64 | | | | (37.52 | ) | | | 6,249 | | | | 2.01 | | | | (.90 | ) | | | 92 | |
| 2007 | | | 12.88 | | | | (.11 | ) | | | .87 | | | | .76 | | | | — | | | | (2.08 | ) | | | (2.08 | ) | | | 11.56 | | | | 6.51 | | | | 13,720 | | | | 1.98 | | | | (.97 | ) | | | 97 | |
| | | | | | | | | | | | |
| Class C (9/01) | | | | | | | | | | | | | | | | | | | | | | | | | | | | | | | | | | | | | | | | | | | | | | | | | |
| 2011 | | | 10.65 | | | | (.17 | ) | | | .74 | | | | .57 | | | | — | | | | — | | | | — | | | | 11.22 | | | | 5.35 | | | | 14,009 | | | | 2.05 | | | | (1.45 | ) | | | 69 | |
| 2010 | | | 8.73 | | | | (.12 | ) | | | 2.04 | | | | 1.92 | | | | — | | | | — | | | | — | | | | 10.65 | | | | 21.99 | | | | 17,393 | | | | 1.99 | | | | (1.23 | ) | | | 88 | |
| 2009 | | | 7.63 | | | | (.06 | ) | | | 1.16 | | | | 1.10 | | | | — | | | | — | | | | — | | | | 8.73 | | | | 14.42 | | | | 16,938 | | | | 2.01 | | | | (.80 | ) | | | 99 | |
| 2008 | | | 13.13 | | | | (.09 | ) | | | (4.56 | ) | | | (4.65 | ) | | | — | | | | (.85 | ) | | | (.85 | ) | | | 7.63 | | | | (37.44 | ) | | | 17,062 | | | | 2.01 | | | | (.90 | ) | | | 92 | |
| 2007 | | | 14.36 | | | | (.12 | ) | | | .97 | | | | .85 | | | | — | | | | (2.08 | ) | | | (2.08 | ) | | | 13.13 | | | | 6.46 | | | | 34,505 | | | | 1.98 | | | | (.95 | ) | | | 97 | |
| | | | | | | | | | | | |
| Class R3 (1/94)(e) | | | | | | | | | | | | | | | | | | | | | | | | | | | | | | | | | | | | | | | | | | | | | | | | | |
| 2011 | | | 11.46 | | | | (.12 | ) | | | .79 | | | | .67 | | | | — | | | | — | | | | — | | | | 12.13 | | | | 5.85 | | | | 20,044 | | | | 1.55 | | | | (.95 | ) | | | 69 | |
| 2010 | | | 9.34 | | | | (.08 | ) | | | 2.20 | | | | 2.12 | | | | — | | | | — | | | | — | | | | 11.46 | | | | 22.70 | | | | 18,047 | | | | 1.49 | | | | (.71 | ) | | | 88 | |
| 2009 | | | 8.12 | | | | (.03 | ) | | | 1.25 | | | | 1.22 | | | | — | | | | — | | | | — | | | | 9.34 | | | | 15.02 | | | | 24,701 | | | | 1.51 | | | | (.31 | ) | | | 99 | |
| 2008 | | | 13.86 | | | | (.04 | ) | | | (4.85 | ) | | | (4.89 | ) | | | — | | | | (.85 | ) | | | (.85 | ) | | | 8.12 | | | | (37.19 | ) | | | 23,069 | | | | 1.51 | | | | (.40 | ) | | | 92 | |
| 2007 | | | 14.98 | | | | (.05 | ) | | | 1.01 | | | | .96 | | | | — | | | | (2.08 | ) | | | (2.08 | ) | | | 13.86 | | | | 6.99 | | | | 38,181 | | | | 1.48 | | | | (.43 | ) | | | 97 | |
| | | | | | | | | | | | |
| Class I (5/92)(e) | | | | | | | | | | | | | | | | | | | | | | | | | | | | | | | | | | | | | | | | | | | | | | | | | |
| 2011 | | | 12.73 | | | | (.06 | ) | | | .87 | | | | .81 | | | | — | | | | — | | | | — | | | | 13.54 | | | | 6.36 | | | | 273,983 | | | | 1.05 | | | | (.45 | ) | | | 69 | |
| 2010 | | | 10.33 | | | | (.03 | ) | | | 2.44 | | | | 2.41 | | | | (.01 | ) | | | — | | | | (.01 | ) | | | 12.73 | | | | 23.30 | | | | 400,042 | | | | .99 | | | | (.23 | ) | | | 88 | |
| 2009 | | | 8.94 | | | | .02 | | | | 1.37 | | | | 1.39 | | | | — | | | | — | | | | — | | | | 10.33 | | | | 15.55 | | | | 322,658 | | | | 1.01 | | | | .19 | | | | 99 | |
| 2008 | | | 15.10 | | | | .01 | | | | (5.31 | ) | | | (5.30 | ) | | | (.01 | ) | | | (.85 | ) | | | (.86 | ) | | | 8.94 | | | | (36.86 | ) | | | 289,685 | | | | 1.01 | | | | .10 | | | | 92 | |
| 2007 | | | 16.06 | | | | .01 | | | | 1.11 | | | | 1.12 | | | | — | | | | (2.08 | ) | | | (2.08 | ) | | | 15.10 | | | | 7.58 | | | | 691,488 | | | | .98 | | | | .03 | | | | 97 | |
| (a) | Per share Net Investment Income (Loss) is calculated using the average daily shares method. |
| (b) | Distributions from Capital Gains include short-term capital gains, if any. |
| (c) | Total Return is the combination of changes in net asset value without any sales charge, reinvested dividend income at net asset value and reinvested capital gains distributions at net asset value, if any. Total Return is not annualized. |
| (d) | After expense reimbursement from the Adviser, where applicable. Ratios do not reflect the effect of custodian fee credits earned on the Fund’s net cash on deposit with the custodian bank, where applicable. |
| (e) | Effective January 18, 2011, Class R Shares and Class Y Shares previously offered by FAF Advisors, Inc. were renamed Class R3 Shares and Class I Shares, respectively. |
120
Section 5 Financial Highlights
Nuveen Small Cap Value Fund
| | | | | | | | | | | | | | | | | | | | | | | | | | | | | | | | | | | | | | | | | | | | | | | | | | | | |
Class
(Commencement
Date) | | | | | Investment Operations | | | Less Distributions | | | | | | | | | Ratios/Supplemental Data | |
| | | | | | | | | | | | | | | | | | | | | | | | | | | | | | | | | Ratios to Average
Net Assets After
Reimbursement(d) | | | | |
Year Ended
October 31, | | Beginning
Net Asset
Value | | | Net
Investment
Income
(Loss)(a) | | | Net
Realized/
Unrealized
Gain (Loss) | | | Total | | | Net
Investment
Income | | | Capital
Gains(b) | | | Total | | | Ending
Net
Asset
Value | | | Total
Return(c) | | | Ending
Net
Assets
(000) | | | Expenses | | | Net
Investment
Income
(Loss) | | | Portfolio
Turnover
Rate | |
| | | | | | | | | | | | |
| Class A (8/94) | | | | | | | | | | | | | | | | | | | | | | | | | | | | | | | | | | | | | | | | | | | | | | | | | |
| 2011 | | $ | 10.26 | | | $ | (.05 | ) | | $ | 1.09 | | | $ | 1.04 | | | $ | — | | | $ | — | | | $ | — | | | $ | 11.30 | | | | 10.14 | % | | $ | 31,814 | | | | 1.46 | % | | | (.40 | )% | | | 41 | % |
| 2010 | | | 8.22 | | | | (.01 | ) | | | 2.07 | | | | 2.06 | | | | (.02 | ) | | | — | | | | (.02 | ) | | | 10.26 | | | | 25.15 | | | | 32,332 | | | | 1.34 | | | | (.11 | ) | | | 58 | |
| 2009 | | | 8.12 | | | | .03 | | | | .15 | | | | .18 | | | | (.08 | ) | | | — | | | | (.08 | ) | | | 8.22 | | | | 2.40 | | | | 29,026 | | | | 1.37 | | | | .46 | | | | 73 | |
| 2008 | | | 13.52 | | | | .08 | | | | (3.97 | ) | | | (3.89 | ) | | | (.14 | ) | | | (1.37 | ) | | | (1.51 | ) | | | 8.12 | | | | (31.75 | ) | | | 28,344 | | | | 1.31 | | | | .75 | | | | 49 | |
| 2007 | | | 15.38 | | | | .12 | | | | .48 | | | | .60 | | | | (.02 | ) | | | (2.44 | ) | | | (2.46 | ) | | | 13.52 | | | | 4.18 | | | | 53,498 | | | | 1.26 | | | | .90 | | | | 63 | |
| | | | | | | | | | | | |
| Class C (2/99) | | | | | | | | | | | | | | | | | | | | | | | | | | | | | | | | | | | | | | | | | | | | | | | | | |
| 2011 | | | 9.08 | | | | (.12 | ) | | | .97 | | | | .85 | | | | — | | | | — | | | | — | | | | 9.93 | | | | 9.36 | | | | 1,498 | | | | 2.21 | | | | (1.18 | ) | | | 41 | |
| 2010 | | | 7.31 | | | | (.07 | ) | | | 1.84 | | | | 1.77 | | | | — | | | | — | | | | — | | | | 9.08 | | | | 24.21 | | | | 1,843 | | | | 2.09 | | | | (.86 | ) | | | 58 | |
| 2009 | | | 7.22 | | | | (.02 | ) | | | .13 | | | | .11 | | | | (.02 | ) | | | — | | | | (.02 | ) | | | 7.31 | | | | 1.56 | | | | 2,080 | | | | 2.12 | | | | (.27 | ) | | | 73 | |
| 2008 | | | 12.19 | | | | — | * | | | (3.54 | ) | | | (3.54 | ) | | | (.06 | ) | | | (1.37 | ) | | | (1.43 | ) | | | 7.22 | | | | (32.23 | ) | | | 2,373 | | | | 2.06 | | | | — | ** | | | 49 | |
| 2007 | | | 14.17 | | | | .02 | | | | .44 | | | | .46 | | | | — | | | | (2.44 | ) | | | (2.44 | ) | | | 12.19 | | | | 3.42 | | | | 4,006 | | | | 2.01 | | | | .14 | | | | 63 | |
| | | | | | | | | | | | |
| Class R3 (9/01)(e) | | | | | | | | | | | | | | | | | | | | | | | | | | | | | | | | | | | | | | | | | | | | | | | | | |
| 2011 | | | 10.11 | | | | (.07 | ) | | | 1.07 | | | | 1.00 | | | | — | | | | — | | | | — | | | | 11.11 | | | | 9.89 | | | | 2,246 | | | | 1.71 | | | | (.65 | ) | | | 41 | |
| 2010 | | | 8.10 | | | | (.03 | ) | | | 2.04 | | | | 2.01 | | | | — | | | | — | | | | — | | | | 10.11 | | | | 24.85 | | | | 2,111 | | | | 1.59 | | | | (.35 | ) | | | 58 | |
| 2009 | | | 8.00 | | | | .01 | | | | .15 | | | | .16 | | | | (.06 | ) | | | — | | | | (.06 | ) | | | 8.10 | | | | 2.14 | | | | 2,327 | | | | 1.62 | | | | .19 | | | | 73 | |
| 2008 | | | 13.35 | | | | .05 | | | | (3.91 | ) | | | (3.86 | ) | | | (.12 | ) | | | (1.37 | ) | | | (1.49 | ) | | | 8.00 | | | | (31.90 | ) | | | 2,159 | | | | 1.56 | | | | .50 | | | | 49 | |
| 2007 | | | 15.24 | | | | .10 | | | | .47 | | | | .57 | | | | (.02 | ) | | | (2.44 | ) | | | (2.46 | ) | | | 13.35 | | | | 3.96 | | | | 3,263 | | | | 1.51 | | | | .72 | | | | 63 | |
| | | | | | | | | | | | |
| Class I (8/94)(e) | | | | | | | | | | | | | | | | | | | | | | | | | | | | | | | | | | | | | | | | | | | | | | | | | |
| 2011 | | | 10.55 | | | | (.02 | ) | | | 1.12 | | | | 1.10 | | | | — | | | | — | | | | — | | | | 11.65 | | | | 10.43 | | | | 48,596 | | | | 1.21 | | | | (.16 | ) | | | 41 | |
| 2010 | | | 8.45 | | | | .01 | | | | 2.13 | | | | 2.14 | | | | (.04 | ) | | | — | | | | (.04 | ) | | | 10.55 | | | | 25.43 | | | | 180,875 | | | | 1.09 | | | | .14 | | | | 58 | |
| 2009 | | | 8.36 | | | | .05 | | | | .15 | | | | .20 | | | | (.11 | ) | | | — | | | | (.11 | ) | | | 8.45 | | | | 2.59 | | | | 149,515 | | | | 1.12 | | | | .72 | | | | 73 | |
| 2008 | | | 13.87 | | | | .11 | | | | (4.08 | ) | | | (3.97 | ) | | | (.17 | ) | | | (1.37 | ) | | | (1.54 | ) | | | 8.36 | | | | (31.56 | ) | | | 158,112 | | | | 1.06 | | | | 1.00 | | | | 49 | |
| 2007 | | | 15.71 | | | | .16 | | | | .49 | | | | .65 | | | | (.05 | ) | | | (2.44 | ) | | | (2.49 | ) | | | 13.87 | | | | 4.45 | | | | 302,683 | | | | 1.01 | | | | 1.15 | | | | 63 | |
| (a) | Per share Net Investment Income (Loss) is calculated using the average daily shares method. |
| (b) | Distributions from Capital Gains include short-term capital gains, if any. |
| (c) | Total Return is the combination of changes in net asset value without any sales charge, reinvested dividend income at net asset value and reinvested capital gains distributions at net asset value, if any. Total Return is not annualized. |
| (d) | After expense reimbursement from the Adviser, where applicable. Ratios do not reflect the effect of custodian fee credits earned on the Fund’s net cash on deposit with the custodian bank, where applicable. |
| (e) | Effective January 18, 2011, Class R Shares and Class Y Shares previously offered by FAF Advisors Inc. were renamed Class R3 Shares and Class I Shares, respectively. |
| * | Rounds to less than $.01 per share. |
| ** | Rounds to less than .01%. |
Section 5 Financial Highlights
121
Nuveen Tactical Market Opportunities Fund
| | | | | | | | | | | | | | | | | | | | | | | | | | | | | | | | | | | | | | | | | | | | | | | | | | | | |
Class
(Commencement
Date) | | | | | Investment Operations | | | Less Distributions | | | | | | | | | Ratios/Supplemental Data | |
| | | | | | | | | | | | | | | | | | | | | | | | | | | Ratios to Average Net
Assets After
Reimbursement(d) | | | | |
Year Ended
October 31, | | Beginning
Net Asset
Value | | | Net
Investment
Income
(Loss)(a) | | | Net
Realized/
Unrealized
Gain (Loss) | | | Total | | | Net
Investment
Income | | | Capital
Gains(b) | | | Total | | | Ending
Net
Asset
Value | | | Total
Return(c) | | | Ending
Net
Assets
(000) | | | Expenses | | | Net
Investment
Income
(Loss) | | | Portfolio
Turnover
Rate | |
| | | | | | | | | | | | | |
| Class A (2/11) | | | | | | | | | | | | | | | | | | | | | | | | | | | | | | | | | | | | | | | | | | | | | | | | | | | | |
| 2011(e) | | $ | 10.59 | | | $ | .04 | | | $ | .59 | | | $ | .63 | | | $ | — | | | $ | — | | | $ | — | | | $ | 11.22 | | | | 5.95 | % | | $ | 3,558 | | | | 1.19 | %** | | | .54 | % | | | 177 | % |
| | | | | | | | | | | | | |
| Class C (2/11) | | | | | | | | | | | | | | | | | | | | | | | | | | | | | | | | | | | | | | | | | | | | | | | | | | | | |
| 2011(e) | | | 10.59 | | | | — | * | | | .58 | | | | .58 | | | | — | | | | — | | | | — | | | | 11.17 | | | | 5.48 | | | | 475 | | | | 1.94 | ** | | | — | *** | | | 177 | |
| | | | | | | | | | | | | |
| Class I (12/09)(f) | | | | | | | | | | | | | | | | | | | | | | | | | | | | | | | | | | | | | | | | | | | | | | | | | | | | |
| 2011 | | | 10.62 | | | | .14 | | | | .59 | | | | .73 | | | | (.08 | ) | | | (.02 | ) | | | (.10 | ) | | | 11.25 | | | | 6.95 | | | | 48,860 | | | | .94 | | | | 1.25 | | | | 177 | |
| 2010(g) | | | 10.00 | | | | .02 | | | | .60 | | | | .62 | | | | — | | | | — | | | | — | | | | 10.62 | | | | 6.20 | | | | 27,300 | | | | .92 | ** | | | 1.39 | ** | | | 156 | |
| (a) | Per share Net Investment Income (Loss) is calculated using the average daily shares method. |
| (b) | Distributions from Capital Gains include short-term capital gains, if any. |
| (c) | Total Return is the combination of changes in net asset value without any sales charge, reinvested dividend income at net asset value and reinvested capital gains distributions at net asset value, if any. Total Return is not annualized. |
| (d) | After expense reimbursement from the Adviser, where applicable. Ratios do not reflect the effect of custodian fee credits earned on the Fund’s net cash on deposit with the custodian bank, where applicable. |
| (e) | For the period February 24, 2011 (commencement of operations) through October 31, 2011. |
| (f) | Effective January 18, 2011, Class Y Shares previously offered by FAF Advisors, Inc. were renamed Class I Shares. |
| (g) | For the period December 30, 2009 (commencement of operations) through October 31, 2010. |
| * | Rounds to less than $.01 per share. |
| *** | Annualized expense ratio rounds to less than .01%. |
122
Section 5 Financial Highlights
Section 6 Glossary of Investment Terms
| | • | | American Depositary Receipts (“ADRs”): Certificates issued by a U.S. depositary bank that represent a bank’s holdings of a stated number of shares of a non-U.S. company. ADRs are typically bought and sold in the same manner as U.S. securities (although investors can also purchase the non-U.S. securities overseas and convert them to ADRs, and likewise can convert an ADR to its underlying non-U.S. security and sell it overseas) and are priced in U.S. dollars. ADRs carry most of the risks of investing directly in non-U.S. equity securities. |
| | • | | Average cost basis method: Calculating cost basis by determining the average price paid for fund shares that may have been purchased at different times for different prices. |
| | • | | BofA Merrill Lynch 3-Month U.S. Treasury Bill Index: An unmanaged index that is comprised of a single U.S. Treasury issue with approximately three months to final maturity, purchased at the beginning of each month and held for one full month. At the end of the month, that issue is sold and rolled into a newly selected issue. |
| | • | | Derivatives: Financial instruments whose performance is derived from the performance of an underlying asset, security or index. Derivatives may be used to hedge risk, to exchange a floating rate or return for a fixed rate of return or to gain investment exposure. Derivatives include futures, options and swaps, among other instruments. |
| | • | | Emerging markets: The financial markets of developing economies in countries with low per capita income in the initial stages of their industrialization cycles. They generally do not have the level of market efficiency and strict standards in accounting and securities regulation to be on par with advanced economies. Investments in emerging markets come with much greater risk due to political instability, domestic infrastructure problems, currency volatility and limited equity opportunities (many large companies may still be “state-run” or private). Also, local exchanges may not offer liquid markets for outside investors. |
| | • | | Futures: Derivative contracts obligating buyers to purchase an asset or sellers to sell an asset at a predetermined future date and price. Futures contracts detail the quality and quantity of the underlying asset; they are standardized to facilitate trading on a futures exchange. |
| | • | | Lipper Equity Income Classification Average: Represents the average annualized total return for all reporting funds in the Lipper Equity Income Classification. |
| | • | | Lipper Flexible Portfolio Classification Average: Represents the average annualized total return for all reporting funds in the Lipper Flexible Portfolio Classification. |
| | • | | Lipper International Large-Cap Growth Classification Average: Represents the average annualized total return for all reporting funds in the Lipper International Large-Cap Growth Classification. |
| | • | | Lipper Large-Cap Core Classification Average: Represents the average annualized total return for all reporting funds in the Lipper Large-Cap Core Classification. |
| | • | | Lipper Large-Cap Growth Classification Average: Represents the average annualized total return for all reporting funds in the Lipper Large-Cap Growth Classification. |
Section 6 Glossary of Investment Terms
123
| | • | | Lipper Large-Cap Value Classification Average: Represents the average annualized total return for all reporting funds in the Lipper Large-Cap Value Classification. |
| | • | | Lipper Mid-Cap Core Classification Average: Represents the average annualized total return for all reporting funds in the Lipper Mid-Cap Core Classification. |
| | • | | Lipper Mid-Cap Growth Classification Average: Represents the average annualized total return for all reporting funds in the Lipper Mid-Cap Growth Classification. |
| | • | | Lipper Mid-Cap Value Classification Average: Represents the average annualized total return for all reporting funds in the Lipper Mid-Cap Value Classification. |
| | • | | Lipper Multi-Cap Growth Classification Average: Represents the average annualized total return for all reporting funds in the Lipper Multi-Cap Growth Classification. |
| | • | | Lipper S&P 500 Index Objective Classification Average: Represents the average annualized total return for all reporting funds in the Lipper S&P 500 Index Objective Classification. |
| | • | | Lipper Small-Cap Core Classification Average: Represents the average annualized total return for all reporting funds in the Lipper Small-Cap Core Classification. |
| | • | | Lipper Small-Cap Growth Classification Average: Represents the average annualized total return for all reporting funds in the Lipper Small-Cap Growth Classification. |
| | • | | Lipper Small-Cap Value Classification Average: Represents the average annualized total return for all reporting funds in the Lipper Small-Cap Value Classification. |
| | • | | MSCI (Morgan Stanley Capital International) All Country World Investable Market Index ex USA: An unmanaged index that tracks the performance of small-, mid-, and large-capitalization stocks of non-U.S. companies representing developed and emerging markets around the world that collectively comprise most foreign stock markets. |
| | • | | MSCI (Morgan Stanley Capital International) EAFE (Europe, Australasia, Far East) Index: A free float-adjusted market capitalization weighted index designed to measure developed market equity performance, excluding the U.S. and Canada. |
| | • | | Options: Derivative contracts giving buyers the right to buy or to sell shares of a specified stock at a specified price on or before a given date. There are also options on currencies and other financial assets. |
| | • | | Russell 1000® Growth Index: An index that measures the performance of those Russell 1000 companies with higher price-to-book ratios and higher forecasted growth values. |
| | • | | Russell 1000® Value Index: An index that measures the performance of those Russell 1000 companies with lower price-to-book ratios and lower forecasted growth values. |
| | • | | Russell 2000® Index: An unmanaged small-cap index that measures the performance of the 2,000 smallest companies in the Russell 3000 Index. |
124
Section 6 Glossary of Investment Terms
| | • | | Russell 2000® Growth Index: An unmanaged index that measures the performance of those companies in the Russell 2000 Index (a small cap index) with higher price-to-book ratios and higher forecasted growth values. |
| | • | | Russell 2000® Value Index: Measures the performance of those firms in the Russell 2000® Index with lower price-to-book ratios and lower forecasted growth values. |
| | • | | Russell Midcap® Growth Index: An unmanaged index that measures the performance of those companies in the Russell Midcap Index (a mid-cap index) with higher price-to-book ratios and higher forecasted growth values. |
| | • | | Russell Midcap® Index: An index constructed to provide a comprehensive and unbiased barometer for the mid-cap segment of the equity market which includes the smallest 800 securities within the Russell 1000® Index. |
| | • | | Russell Midcap® Value Index: An unmanaged index that measures the performance of those companies in the Russell Midcap Index with lower price-to-book ratios and lower forecasted growth values. |
| | • | | S&P 500® Index: An index that tracks the 500 leading companies in the leading industries in the U.S. economy. |
| | • | | Standard & Poor’s 500® Dividend Only Stocks: A custom benchmark composed of companies in the Standard & Poor’s 500® Index that have an indicated annual dividend. |
| | • | | Standard & Poor’s MidCap 400® Index: An unmanaged market value weighted index of 400 mid-cap companies. |
| | • | | Swaps: Derivative contracts in which two parties agree to exchange one stream of cash flows for another stream. Swap agreements define the dates when the cash flows will be paid and how the cash flows are calculated. |
Section 6 Glossary of Investment Terms
125
Nuveen Mutual Funds
Nuveen offers a variety of mutual funds designed to help you reach your financial goals. The funds below are grouped by category.
Municipal-National
All-American Municipal Bond
High Yield Municipal Bond
Inflation Protected Municipal Bond
Intermediate Duration Municipal Bond
Limited Term Municipal Bond
Short Term Municipal Bond
Municipal-State
Arizona Municipal Bond
California High Yield Municipal Bond
California Municipal Bond
Colorado Municipal Bond
Connecticut Municipal Bond
Georgia Municipal Bond
Kansas Municipal Bond
Kentucky Municipal Bond
Louisiana Municipal Bond
Maryland Municipal Bond
Massachusetts Municipal Bond
Michigan Municipal Bond
Minnesota Intermediate Municipal Bond
Minnesota Municipal Bond
Missouri Municipal Bond
Municipal-State (continued)
Nebraska Municipal Bond
New Jersey Municipal Bond
New Mexico Municipal Bond
New York Municipal Bond
North Carolina Municipal Bond
Ohio Municipal Bond
Oregon Intermediate Municipal Bond
Pennsylvania Municipal Bond
Tennessee Municipal Bond
Virginia Municipal Bond
Wisconsin Municipal Bond
Taxable Fixed Income
Core Plus Bond
Global Total Return Bond
High Income Bond
Inflation Protected Securities
Intermediate Government Bond
Intermediate Term Bond
Preferred Securities
Short Term Bond
Strategic Income
Symphony Credit Opportunities
Symphony Floating Rate Income
Global/International
International
International Select
Santa Barbara Global Growth
Santa Barbara International Growth
Global/International (continued)
Symphony International Equity
Tradewinds Emerging Markets
Tradewinds Global All-Cap
Tradewinds Global All-Cap Plus
Tradewinds Global Flexible Allocation
Tradewinds Global Resources
Tradewinds International Value
Tradewinds Japan
Tradewinds Small-Cap Opportunities
Value
Dividend Value
Large Cap Value
Mid Cap Value
Multi-Manager Large-Cap Value
NWQ Large-Cap Value
NWQ Multi-Cap Value
NWQ Small-Cap Value
NWQ Small/Mid-Cap Value
Small Cap Value
Symphony Large-Cap Value
Tradewinds Value Opportunities
Growth
Large Cap Growth Opportunities
Mid Cap Growth Opportunities
Santa Barbara Growth
Small Cap Growth Opportunities
Symphony Large-Cap Growth
Winslow Large-Cap Growth
Core
Large Cap Select
Mid Cap Select
Santa Barbara Dividend Growth
Small Cap Select
Symphony Mid-Cap Core
Symphony Optimized Alpha
Symphony Small-Mid Cap Core
Real Assets
Global Infrastructure
Real Asset Income
Real Estate Securities
Asset Allocation
Strategy Aggressive Growth Allocation
Strategy Balanced Allocation
Strategy Conservative Allocation
Strategy Growth Allocation
Tactical Market Opportunities
Quantitative/Enhanced
Quantitative Enhanced Core Equity
Index
Equity Index
Mid Cap Index
Small Cap Index
Several additional sources of information are available to you, including the codes of ethics adopted by the funds, Nuveen Investments and Nuveen Fund Advisors. The statement of additional information, incorporated by reference into this prospectus, contains detailed information on the policies and operation of the funds included in this prospectus. Additional information about the funds’ investments is available in the annual and semi-annual reports to shareholders. In the funds’ annual reports, you will find a discussion of the market conditions and investment strategies that significantly affected the funds’ performance during their last fiscal year. The funds’ most recent statement of additional information, annual and semi-annual reports and certain other information are available, free of charge, by calling Nuveen Investor Services at (800) 257-8787, on the funds’ website at www.nuveen.com, or through your financial advisor. Shareholders may call the toll free number above with any inquiries.
You may also obtain this and other fund information directly from the Securities and Exchange Commission (“SEC”). Reports and other information about the funds are available on the EDGAR Database on the SEC’s website at http://www.sec.gov or in person at the SEC’s Public Reference Room in Washington, D.C. Call the SEC at (202) 551-8090 for room hours and operation. You may also request fund information by sending an e-mail request to publicinfo@sec.gov or by writing to the SEC’s Public Reference Section at 100 F Street, NE, Washington, D.C. 20549-1520. The SEC may charge a copying fee for this information.
The funds are series of Nuveen Investment Funds, Inc., whose Investment Company Act file number is 811-05309.
Distributed by
Nuveen Securities, LLC
333 West Wacker Drive
Chicago, Illinois 60606
(800) 257-8787
www.nuveen.com
MPR-FSTK-0512D
STATEMENT OF ADDITIONAL INFORMATION
NUVEEN DIVIDEND VALUE FUND
(formerly Nuveen Equity Income Fund)
Relating to the Acquisition of the Assets and Liabilities of
NUVEEN LARGE CAP VALUE FUND
333 West Wacker Dr.
Chicago, Illinois 60606
Telephone: (312) 917-7700
This Statement of Additional Information (“SAI”) is not a prospectus but should be read in conjunction with the Proxy Statement/Prospectus dated , 2012 for use in connection with the special meeting of shareholders (the “Special Meeting”) of Nuveen Large Cap Value Fund (the “Acquired Fund”), a series of Nuveen Investment Funds, Inc. (the “Corporation”), to be held on , 2012. At the Special Meeting, shareholders of the Acquired Fund will be asked to approve the reorganization (the “Reorganization”) of the Acquired Fund into Nuveen Dividend Value Fund (formerly Nuveen Equity Income Fund) (the “Acquiring Fund”; the Acquired Fund and the Acquiring Fund are collectively referred to as the “Funds”) as described in the Proxy Statement/Prospectus. Copies of the Proxy Statement/Prospectus may be obtained at no charge by writing to the Corporation at the address shown above or by calling (800) 257-8787. Capitalized terms used herein that are not defined have the same meaning as in the Proxy Statement/Prospectus.
Further information about the Funds is contained in the Funds’ Statement of Additional Information dated February 29, 2012, as supplemented through the date of this SAI, which is incorporated herein by reference only insofar as it relates to the Acquired Fund or Acquiring Fund. No other parts are incorporated by reference herein.
The unaudited pro forma financial information, attached hereto as Appendix A, is intended to present the financial condition and related results of operations of the Acquiring Fund as if the Reorganization had been consummated on April 30, 2012.
The audited financial statements and related independent registered public accounting firm’s report for the Funds are contained in the Funds’ Annual Report for the fiscal year ended October 31, 2011, and the unaudited financial statements for the Funds are contained in the Funds’ Semi-Annual Report for the six-month period ended April 30, 2012, each of which is incorporated herein by reference only insofar as they relate to the Funds. No other parts of the Annual Report or Semi-Annual Report are incorporated by reference herein.
The date of this Statement of Additional Information is , 2012.
S-1
Appendix A
Pro Forma Financial Information
The unaudited pro forma financial information set forth below is for informational purposes only and does not purport to be indicative of the financial condition that actually would have resulted if the Reorganization had been consummated. These pro forma numbers have been estimated in good faith based on information regarding the Acquired Fund and Acquiring Fund as of April 30, 2012. The unaudited pro forma financial information should be read in conjunction with the historical financial statements of the Acquired Fund and Acquiring Fund, which are available in their annual and semi-annual shareholder reports.
Narrative Description of the Pro Forma Effects of the Reorganization
Note 1 — Reorganization
The unaudited pro forma information has been prepared to give effect to the proposed reorganization of the Acquired Fund into the Acquiring Fund pursuant to an Agreement and Plan of Reorganization (the “Plan”) as if the Reorganization occurred on April 30, 2012.
| | |
Acquired Fund | | Acquiring Fund |
Nuveen Large Cap Value Fund | | Nuveen Dividend Value Fund |
Note 2 — Basis of Pro Forma
The Reorganization will be accounted for as a tax-free reorganization for federal income tax purposes; therefore, no gain or loss will be recognized by the Acquiring Fund or its shareholders as a direct result of the Reorganization. The Acquired Fund and the Acquiring Fund are both registered open-end management investment companies. The Reorganization would be accomplished by the acquisition of all of the assets and the assumption of all of the liabilities of the Acquired Fund by the Acquiring Fund in exchange for shares of the Acquiring Fund, followed by the distribution of such shares to Acquired Fund shareholders in complete liquidation of the Acquired Fund. The pro forma financial information has been adjusted to reflect the assumption that the Acquired Fund distributes its undistributed net investment income of $1,095,857 to its shareholders prior to the Reorganization. The table below shows the class and shares that Acquired Fund shareholders would have received had the Reorganization occurred on the period ended date in Note 1.
| | | | |
Acquired Fund Share Class | | Acquiring Fund Shares Issued | | Acquiring Fund Share Class |
Class A | | 3,372,199 | | Class A |
Class C | | 84,871 | | Class C |
Class R3 | | 33,250 | | Class R3 |
Class I | | 6,865,801 | | Class I |
In accordance with accounting principles generally accepted in the United States of America, the Reorganization will be accounted for as a tax-free reorganization for federal income tax purposes. For financial reporting purposes, the historical cost basis of the investments received from the Acquired Fund will be carried forward to align ongoing reporting of the realized and unrealized gains and losses of the surviving fund (which will be the Acquiring Fund) with amounts distributable to shareholders for tax purposes.
A-1
| | | | | | | | |
Fund | | Net Assets | | | As-of Date | |
Nuveen Large Cap Value Fund (Acquired Fund) | | $ | 152,306,003 | | | | April 30, 2012 | |
Nuveen Dividend Value Fund (Acquiring Fund) | | $ | 1,217,608,460 | | | | April 30, 2012 | |
Nuveen Dividend Value Fund (Pro Forma Combined Fund) | | $ | 1,368,676,606 | | | | April 30, 2012 | |
Note 3 — Pro Forma Expense Adjustments
The table below reflects adjustments to annual expenses made to the Pro Forma Combined Fund financial information as if the Reorganization had taken place on the first day of the period as disclosed in Note 1 using the fees and expenses information shown in the Proxy Statement/Prospectus. The pro forma information has been derived from the books and records used in calculating daily net asset values of the Acquired Fund and Acquiring Fund and has been prepared in accordance with accounting principles generally accepted in the United States of America which require management to make estimates and assumptions that affect this information. Percentages presented below are the increase (decrease) in expenses divided by the Pro Forma Combined Fund net assets presented in Note 2. Actual results could differ from those estimates. No other significant pro forma effects are expected to result from the Reorganization.
| | | | | | | | |
| | | Increase (Decrease) | |
Net Expense Category | | Dollar Amount | | | Percentage | |
Management fees1 | | $ | 5,075 | | | | 0.00 | %4 |
Expense reimbursement2 | | $ | (407,182 | ) | | | (0.03 | %) |
Custodian’s fees and expenses3 | | $ | (25,777 | ) | | | (0.00 | %)4 |
Professional fees3 | | $ | (21,875 | ) | | | (0.00 | %)4 |
Shareholders’ reports – printing and mailing expenses3 | | $ | (14,508 | ) | | | (0.00 | %)4 |
Federal and State registration fees3 | | $ | (1,998 | ) | | | (0.00 | %)4 |
| | | | | | | | |
Total Pro Forma Net Expense Adjustment | | $ | (466,265 | ) | | | (0.03 | %) |
| | | | | | | | |
| (1) | Reflects the impact of applying the Acquiring Fund’s fund-level management fee rates following the Reorganization to the combined fund’s average net assets, as well as reflecting a decrease in eligible assets for the complex-level management fee following the Reorganization. |
| (2) | Reflects the increase in expense reimbursement payments the adviser would have made to the Combined Fund if the Reorganization had occurred on the first day of the period disclosed in Note 1. |
| (3) | Reflects the anticipated reduction of certain duplicative expenses eliminated as a result of the Reorganization. |
| (4) | Rounds to less than 0.01% or (0.01%). |
No significant accounting policies will change as a result of the Reorganization, specifically policies regarding security valuation or compliance with Subchapter M of the Internal Revenue Code of 1986, as amended. No significant changes to any existing contracts of the Acquiring Fund are expected as a result of the Reorganization.
Note 4 — Reorganization Costs
Nuveen Fund Advisors estimates that expenses for the Reorganization will be approximately $154,000, of which $77,000 is expected to be charged to the Acquired Fund. These costs represent the estimated nonrecurring expenses of the Acquired Fund carrying out its obligations under the Plan and consist of management’s estimate of professional services fees, printing costs and mailing charges related to the proposed Reorganization to be borne by the Acquired Fund. Nuveen will absorb any Reorganization costs in excess of the Acquired Fund’s expected cost savings of approximately $232,000. To the extent
A-2
that payment of these costs would cause the Acquired Fund to exceed its expense cap for all share classes in effect through December 31, 2012, Nuveen will reimburse the portion of the expenses necessary for the Fund to operate within the cap. Based on current expense levels, it is anticipated that Nuveen will reimburse approximately $12,000 of Reorganization expenses charged to the Acquired Fund. The Acquiring Fund is expected to be charged approximately $77,000 of expenses in connection with the Reorganization. The Funds are expected to recover their costs of the Reorganization within the first year following the Reorganization assuming that annual cost savings occur at the levels shown above. The pro forma financial information included in Note 2 has been adjusted for any costs related to the Reorganization to be borne by the Funds. Nuveen will bear 100% of these costs and expenses if the Reorganization is not consummated.
If the Reorganization had occurred as of April 30, 2012, the Acquired Fund would not have been required to dispose of its securities in order to comply with the Acquiring Fund’s investment policies and restrictions, and would have not sold any material portion (i.e., more than 5% of its net assets) of the securities in its portfolio solely as a result of the Reorganization.
Note 5 — Accounting Survivor
The Acquiring Fund will be the accounting survivor. The surviving fund will have the portfolio management team, portfolio composition, strategies, investment objective, expense structure and policies/restrictions of the Acquiring Fund.
Note 6 — Capital Loss Carryforward
At April 30, 2012, the Funds had unused capital loss carryforwards available for federal income tax purposes to be applied against future capital gains, if any. If not applied, the capital loss carryforwards will expire as follows:
| | | | | | | | |
| | | Acquiring Fund | | | Acquired Fund | |
Expiration Date: | | | | | | | | |
10/31/2016 | | $ | — | | | $ | 3,269,086 | |
10/31/2017 | | | — | | | | 80,887,118 | |
| | | | | | | | |
Total | | $ | — | | | $ | 84,156,204 | |
| | | | | | | | |
A-3
SUPPLEMENT DATED JULY 3, 2012
NUVEEN DIVIDEND VALUE FUND
NUVEEN EQUITY INDEX FUND
NUVEEN INTERNATIONAL FUND
NUVEEN INTERNATIONAL SELECT FUND
NUVEEN LARGE CAP GROWTH OPPORTUNITIES FUND
NUVEEN LARGE CAP SELECT FUND
NUVEEN LARGE CAP VALUE FUND
NUVEEN MID CAP GROWTH OPPORTUNITIES FUND
NUVEEN MID CAP INDEX FUND
NUVEEN MID CAP SELECT FUND
NUVEEN MID CAP VALUE FUND
NUVEEN QUANTITATIVE ENHANCED CORE EQUITY FUND
NUVEEN SMALL CAP GROWTH OPPORTUNITIES FUND
NUVEEN SMALL CAP INDEX FUND
NUVEEN SMALL CAP SELECT FUND
NUVEEN SMALL CAP VALUE FUND
NUVEEN TACTICAL MARKET OPPORTUNITIES FUND
To the Statement of Additional Information dated February 29, 2012
NUVEEN GLOBAL INFRASTRUCTURE FUND
NUVEEN REAL ASSET INCOME FUND
NUVEEN REAL ESTATE SECURITIES FUND
To the Statement of Additional Information dated February 29, 2012
| 1. | The following paragraph is added after the fourth paragraph of the section “Purchase and Redemption of Fund Shares—Additional Payments to Financial Intermediaries: |
The Adviser and/or the Distributor may also make other additional payments out of its own assets as described under “Other Payments” below.
| 2. | The second sentence of the section “Purchase and Redemption of Fund Shares—Additional Payments to Financial Intermediaries—Marketing Support Payments and Program Servicing Payments—Marketing Support Payments” is deleted and replaced with the following sentence: |
In addition, Intermediaries may be compensated for enabling representatives of the Adviser and/or the Distributor to participate in and/or present at conferences or seminars, sales or training programs for invited registered representatives and other employees, client and investor events and other events sponsored by the Intermediary.
| 3. | The second sentence of the section “Purchase and Redemption of Fund Shares—Additional Payments to Financial Intermediaries—Marketing Support Payments and Program Servicing Payments—Marketing Support and Program Servicing Payment Guidelines” is deleted and replaced with the following sentence: |
In connection with the sale of a business by U.S. Bank N.A. to Great-West Life & Annuity Insurance Company (“Great-West”), the Adviser and/or the Distributor has a services agreement with GWFS Equities, Inc., an affiliate of Great-West, which provides for payments of up to 0.60% of the average net assets of Fund shares attributable to GWFS Equities, Inc. on an annual basis.
| 4. | The first sentence of the first paragraph of the section “Purchase and Redemption of Fund Shares—Additional Payments to Financial Intermediaries—Other Payments” is deleted and replaced with the following sentence: |
From time to time, the Adviser and/or the Distributor, at its expense, may provide other compensation to Intermediaries that sell or arrange for the sale of shares of the Funds, which may be in addition to marketing support and program servicing payments described above.
| 5. | The last two sentences of the second paragraph of the section “Purchase and Redemption of Fund Shares—Additional Payments to Financial Intermediaries—Other Payments” are deleted and replaced with the following sentence: |
The Adviser and/or the Distributor make payments for such events as they deem appropriate, subject to its internal guidelines and applicable law.
| 6. | The fourth paragraph of the section “Purchase and Redemption of Fund Shares—Additional Payments to Financial Intermediaries—Other Payments” is deleted and replaced with the following paragraph: |
Representatives of the Distributor or its affiliates may receive additional compensation from the Adviser and/or the Distributor if certain targets are met for sales of one or more Nuveen Mutual Funds. Such compensation may vary by Fund and by Intermediary.
PLEASE KEEP THIS WITH YOUR
FUND’S STATEMENT OF ADDITIONAL INFORMATION
FOR FUTURE REFERENCE
MGN-FSTKSAI-0712P
NUVEEN DIVIDEND VALUE FUND
NUVEEN EQUITY INDEX FUND
NUVEEN INTERNATIONAL FUND
NUVEEN INTERNATIONAL SELECT FUND
NUVEEN LARGE CAP GROWTH OPPORTUNITIES FUND
NUVEEN LARGE CAP SELECT FUND
NUVEEN LARGE CAP VALUE FUND
NUVEEN MID CAP GROWTH OPPORTUNITIES FUND
NUVEEN MID CAP INDEX FUND
NUVEEN MID CAP SELECT FUND
NUVEEN MID CAP VALUE FUND
NUVEEN QUANTITATIVE ENHANCED CORE EQUITY FUND
NUVEEN SMALL CAP GROWTH OPPORTUNITIES FUND
NUVEEN SMALL CAP INDEX FUND
NUVEEN SMALL CAP SELECT FUND
NUVEEN SMALL CAP VALUE FUND
NUVEEN TACTICAL MARKET OPPORTUNITIES FUND
SUPPLEMENT DATED MAY 14, 2012
TO THE STATEMENT OF ADDITIONAL INFORMATION
DATED FEBRUARY 29, 2012
| | 1. | The fifth sentence of the first paragraph under “Statement of Additional Information” on the front cover is deleted in its entirety and replaced with the following sentence: |
To obtain copies of the Prospectus or the Funds’ Annual Report(s) at no charge, write the applicable Fund, c/o Nuveen Investor Services, P.O. Box 8530, Boston, Massachusetts 02266-8530, or call (800) 257-8787.
| | 2. | The first paragraph of the section “Service Providers—Transfer Agent” is deleted in its entirety and replaced with the following paragraph: |
Boston Financial Data Services, Inc. (“BFDS”), P.O. Box 8530, Boston, Massachusetts 02266-8530 serves as the Funds’ transfer, shareholder services, and dividend paying agent.
| | 3. | The following two sentences replace the first sentence of the second paragraph of the section “Service Providers—Transfer Agent”: |
Prior to May 12, 2012, USBFS served as the Funds’ transfer agent. The following table sets forth transfer agent fees, excluding out-of-pocket expenses, paid by the Funds to USBFS for the fiscal years ended October 31, 2009, October 31, 2010 and October 31, 2011:
| | 4. | The first paragraph of the section “Purchase and Redemption of Fund Shares—Class A Shares” is deleted in its entirety and replaced with the following paragraph: |
Class A shares may be purchased at a public offering price equal to the applicable net asset value per share plus an up-front sales charge imposed at the time of purchase as set
forth in the Prospectus. Shareholders may qualify for a reduced sales charge, or the sales charge may be waived in its entirety, as described below. Class A shares of the Funds are also subject to an annual service fee of 0.25%. See “Distribution and Service Plan.”
| | 5. | The first two paragraphs of the section “Purchase and Redemption of Fund Shares —Shareholder Programs—Exchange Privilege” are deleted in their entirety and replaced with the following two paragraphs: |
You may exchange fund shares into an identically registered account for the same class of another Nuveen Mutual Fund available in your state. Your exchange must meet the minimum purchase requirements of the fund into which you are exchanging. You may also, under certain limited circumstances, exchange between certain classes of shares of the same Fund. An exchange between classes of shares of the same Fund may not be considered a taxable event; please consult your own tax advisor for further information.
If you hold your shares directly with the Fund, you may exchange your shares by either sending a written request to the applicable Fund, c/o Nuveen Investor Services, P.O. Box 8530, Boston, Massachusetts 02266-8530 or by calling Nuveen Investor Services toll free at (800) 257-8787.
| | 6. | The first paragraph of the section “Purchase and Redemption of Fund Shares—Shareholder Programs—Reinstatement Privilege” is deleted in its entirety and replaced with the following paragraph: |
If you redeemed Class A or Class C shares of a Fund or any other Nuveen Mutual Fund that were subject to a sales charge or a CDSC, you have up to one year to reinvest all or part of the full amount of the redemption in the same class of shares of the Fund at net asset value. The reinstatement privilege for Class B shares is no longer available. This reinstatement privilege can be exercised only once for any redemption, and reinvestment will be made at the net asset value next calculated after reinstatement of the appropriate class of Fund shares. If you reinstate shares that were subject to a CDSC, your holding period as of the redemption date also will be reinstated for purposes of calculating a CDSC and the CDSC paid at redemption will be refunded. The federal income tax consequences of any capital gain realized on a redemption will not be affected by reinstatement, but a capital loss may be disallowed in whole or in part depending on the timing, the amount of the reinvestment and the fund from which the redemption occurred.
| | 7. | The first sentence of the second paragraph of the section “Purchase and Redemption of Fund Shares—General Matters” is deleted in its entirety and replaced with the following sentence: |
If you choose to invest in a Fund, an account will be opened and maintained for you by BFDS, the Funds’ shareholder services agent.
PLEASE KEEP THIS WITH YOUR
FUND’S STATEMENT OF ADDITIONAL INFORMATION
FOR FUTURE REFERENCE
MGN-FSTKSAI-0512P
NUVEEN LARGE CAP VALUE FUND
NUVEEN MID CAP VALUE FUND
SUPPLEMENT DATED APRIL 10, 2012
TO THE STATEMENT OF ADDITIONAL INFORMATION DATED
FEBRUARY 29, 2012
Cori B. Johnson, CFA, Gerald C. Bren, CFA, and Derek M. Sadowsky have been named portfolio managers of Nuveen Large Cap Value Fund, replacing the fund’s current portfolio managers, effective immediately.
Karen L. Bowie, CFA, and David A. Chalupnik, CFA, have been named portfolio managers of Nuveen Mid Cap Value Fund, replacing the fund’s current portfolio managers, effective immediately.
There have been no changes in either fund’s investment objectives or policies.
PLEASE KEEP THIS WITH YOUR STATEMENT OF ADDITIONAL INFORMATION
FOR FUTURE REFERENCE
MGN-MLSAI-0412P
NUVEEN DIVIDEND VALUE FUND
NUVEEN EQUITY INDEX FUND
NUVEEN INTERNATIONAL FUND
NUVEEN INTERNATIONAL SELECT FUND
NUVEEN LARGE CAP GROWTH OPPORTUNITIES FUND
NUVEEN LARGE CAP SELECT FUND
NUVEEN LARGE CAP VALUE FUND
NUVEEN MID CAP GROWTH OPPORTUNITIES FUND
NUVEEN MID CAP INDEX FUND
NUVEEN MID CAP SELECT FUND
NUVEEN MID CAP VALUE FUND
NUVEEN QUANTITATIVE ENHANCED CORE EQUITY FUND
NUVEEN SMALL CAP GROWTH OPPORTUNITIES FUND
NUVEEN SMALL CAP INDEX FUND
NUVEEN SMALL CAP SELECT FUND
NUVEEN SMALL CAP VALUE FUND
NUVEEN TACTICAL MARKET OPPORTUNITIES FUND
SUPPLEMENT DATED MARCH 12, 2012
TO THE STATEMENT OF ADDITIONAL INFORMATION DATED FEBRUARY 29, 2012
Effective March 31, 2012, the third sentence of the section “Disclosure of Portfolio Holdings” is deleted in its entirety and replaced with the following sentence:
A complete list of portfolio holdings information is generally made available on the Funds’ website ten business days after the end of the month.
PLEASE KEEP THIS WITH YOUR
FUND’S STATEMENT OF ADDITIONAL INFORMATION
FOR FUTURE REFERENCE
MGN-FSTKSAI-0312P
February 29, 2012
Nuveen Dividend Value Fund
Ticker Symbols: Class A���FFEIX, Class B—FAEBX, Class C—FFECX, Class R3—FEISX, Class I—FAQIX
Nuveen Equity Index Fund
Ticker Symbols: Class A—FAEIX, Class B—FAEQX, Class C—FCEIX, Class R3—FADSX, Class I—FEIIX
Nuveen International Fund
Ticker Symbols: Class A—FAIAX, Class C—FIACX, Class R3—ARQIX, Class I—FAICX
Nuveen International Select Fund
Ticker Symbols: Class A—ISACX, Class C—ICCSX, Class R3—ISRCX, Class I—ISYCX
Nuveen Large Cap Growth Opportunities Fund
Ticker Symbols: Class A—FRGWX, Class B—FETBX, Class C—FAWCX, Class R3—FLCYX, Class I—FIGWX
Nuveen Large Cap Select Fund
Ticker Symbols: Class A—FLRAX, Class C—FLYCX, Class R3—FLSSX, Class I—FLRYX
Nuveen Large Cap Value Fund
Ticker Symbols: Class A—FASKX, Class C—FALVX, Class R3—FAVSX, Class I—FSKIX
Nuveen Mid Cap Growth Opportunities Fund
Ticker Symbols: Class A—FRSLX, Class B—FMQBX, Class C—FMECX, Class R3—FMEYX, Class I—FISGX
Nuveen Mid Cap Index Fund
Ticker Symbols: Class A—FDXAX, Class C—FDXCX, Class R3—FMCYX, Class I—FIMEX
Nuveen Mid Cap Select Fund
Ticker Symbols: Class A—FATAX, Class C—FTACX, Class I—FATCX
Nuveen Mid Cap Value Fund
Ticker Symbols: Class A—FASEX, Class B—FAESX, Class C—FACSX, Class R3—FMVSX, Class I—FSEIX
Nuveen Quantitative Enhanced Core Equity Fund
Ticker Symbols: Class A—FQCAX, Class C—FQCCX, Class I—FQCYX
Nuveen Small Cap Growth Opportunities Fund
Ticker Symbols: Class A—FRMPX, Class B—FROBX, Class C—FMPCX, Class R3—FMPYX, Class I—FIMPX
Nuveen Small Cap Index Fund
Ticker Symbols: Class A—FMDAX, Class C—FPXCX, Class R3—ARSCX, Class I—ASETX
Nuveen Small Cap Select Fund
Ticker Symbols: Class A—EMGRX, Class B—ARSBX, Class C—FHMCX, Class R3—ASEIX, Class I—ARSTX
Nuveen Small Cap Value Fund
Ticker Symbols: Class A—FSCAX, Class C—FSCVX, Class R3—FSVSX, Class I—FSCCX
Nuveen Tactical Market Opportunities Fund
Ticker Symbols: Class A—NTMAX, Class C—NTMCX, Class I—FGTYX
STATEMENT OF ADDITIONAL INFORMATION
This Statement of Additional Information (“SAI”) relates to the Class A, Class B, Class C, Class R3 and Class I shares, as applicable, of the funds named above (each individually a “Fund,” and collectively the “Funds”), each of which is a series of Nuveen Investment Funds, Inc. (“NIF”). This Statement of Additional Information is not a prospectus, but should be read in conjunction with the current Prospectus dated February 29, 2012. The financial statements included as part of the Funds’ Annual Reports to shareholders for the fiscal year ended October 31, 2011 are incorporated by reference into this Statement of Additional Information. This Statement of Additional Information is incorporated into the Funds’ Prospectus by reference. To obtain copies of the Prospectus or the Funds’ Annual Report(s) at no charge, write the applicable Fund, c/o Nuveen Investor Services, P.O. Box 701, Milwaukee, Wisconsin 53201-0701, or call (800) 257-8787. You can also find the Funds’ Prospectus, Statement of Additional Information, and Annual Reports online at www.nuveen.com. Please retain this Statement of Additional Information for future reference.
S-1
TABLE OF CONTENTS
S-2
S-3
GENERAL INFORMATION
Nuveen Investment Funds, Inc. was incorporated in the state of Maryland on August 20, 1987 under the name “SECURAL Mutual Funds, Inc.” The Board of Directors and shareholders, at meetings held January 10, 1991, and April 2, 1991, respectively, approved amendments to the Articles of Incorporation providing that the name “SECURAL Mutual Funds, Inc.” be changed to “First American Investment Funds, Inc.” At a meeting held February 27, 2011, the Board of Directors approved the name “First American Investment Funds, Inc.” be changed to “Nuveen Investment Funds, Inc.”
NIF is organized as a series fund and currently issues its shares in 37 series. Each series of shares represents a separate investment portfolio with its own investment objective and policies (in essence, a separate mutual fund). Nuveen Equity Index Fund, Nuveen Mid Cap Index Fund, and Nuveen Small Cap Index Fund are referred to herein collectively as the “Index Funds.” Nuveen Quantitative Enhanced Core Equity Fund was formerly named Nuveen Quantitative Large Cap Core Fund. Nuveen Dividend Value Fund was formerly named Nuveen Equity Income Fund.
Each Fund is a diversified open-end management investment company.
Shareholders may purchase shares of each Fund through separate classes, Class A, Class B (only Nuveen Dividend Value Fund, Nuveen Equity Index Fund, Nuveen Large Cap Growth Opportunities Fund, Nuveen Mid Cap Growth Opportunities Fund, Nuveen Mid Cap Value Fund, Nuveen Small Cap Growth Opportunities Fund, and Nuveen Small Cap Select Fund and only under limited circumstances as described in the Funds’ Prospectus), Class C, Class R3 (except for Nuveen Mid Cap Select Fund, Nuveen Quantitative Enhanced Core Equity Fund, and Nuveen Tactical Market Opportunities Fund), and Class I shares. The different share classes provide for variations in distribution costs, shareholder servicing fees, voting rights and dividends. To the extent permitted by the Investment Company Act of 1940, as amended (the “1940 Act”), the Funds may also provide for variations in other costs among the classes. In addition, a sales load is imposed on the sale of Class A, Class B and Class C shares of the Funds. Except for the foregoing differences among the classes pertaining to costs and fees, each share of each Fund represents an equal proportionate interest in that Fund.
The Articles of Incorporation and Bylaws of NIF provide that meetings of shareholders be held as determined by the Board of Directors and as required by the 1940 Act. Maryland corporation law requires a meeting of shareholders to be held upon the written request of shareholders holding 10% or more of the voting shares of NIF, with the cost of preparing and mailing the notice of such meeting payable by the requesting shareholders. The 1940 Act requires a shareholder vote for, among other things, all amendments to fundamental investment policies and restrictions, for approval of investment advisory contracts and amendments thereto, and for amendments to Rule 12b-1 distribution plans.
INVESTMENT RESTRICTIONS
In addition to the investment objectives and policies set forth in the Prospectus and under the caption “Investment Policies and Techniques” below, each Fund is subject to the investment restrictions set forth below. The investment restrictions set forth in paragraphs 1 through 8 below are fundamental and cannot be changed with respect to a Fund without approval by the holders of a majority of the outstanding shares of that Fund as defined in the 1940 Act, that is, by the lesser of the vote of (a) 67% of the shares of the Fund present at a meeting where more than 50% of the outstanding shares are present in person or by proxy, or (b) more than 50% of the outstanding shares of the Fund.
None of the Funds will:
1. Concentrate its investments in a particular industry, except that any Fund with one or more industry concentrations implied by its name shall, in normal market conditions, concentrate in securities of issues within that industry or industries. For purposes of this limitation, the U.S. Government is not considered a member of any industry. Whether the Fund is concentrating in an industry shall be determined in accordance with the 1940 Act, as interpreted or modified from time to time by any regulatory authority having jurisdiction.
S-4
2. Borrow money or issue senior securities, except as permitted under the 1940 Act, as interpreted or modified from time to time by any regulatory authority having jurisdiction.
3. With respect to 75% of its total assets, purchase securities of an issuer (other than (i) securities issued by other investment companies, (ii) securities issued by the U.S. Government, its agencies, instrumentalities or authorities, or (iii) repurchase agreements fully collateralized by U.S. Government securities) if (a) such purchase would, at the time, cause more than 5% of the Fund’s total assets taken at market value to be invested in the securities of such issuer; or (b) such purchase would, at the time, result in more than 10% of the outstanding voting securities of such issuer being held by the Fund.
4. Invest in companies for the purpose of control or management.
5. Purchase physical commodities or contracts relating to physical commodities. For Nuveen Tactical Market Opportunities Fund, this restriction shall not prohibit the Fund from investing in investment companies that provide exposure to commodities, options on commodity indices, commodity futures contracts and options thereon, commodity-related swap agreements, and other commodity-related derivative instruments.
6. Purchase or sell real estate unless as a result of ownership of securities or other instruments, but this shall not prevent the Funds from investing in securities or other instruments backed by real estate or interests therein or in securities of companies that deal in real estate or mortgages.
7. Act as an underwriter of securities of other issuers, except to the extent that, in connection with the disposition of portfolio securities, it may be deemed an underwriter under applicable laws.
8. Make loans except as permitted under the 1940 Act, as interpreted or modified from time to time by any regulatory authority having jurisdiction.
For purposes of applying the limitation set forth in number 1 above, according to the current interpretation by the Securities and Exchange Commission (“SEC”), a Fund would be concentrated in an industry if more than 25% of its total assets, based on current market value at the time of purchase, were invested in that industry. The Funds will generally use industry classifications provided by the Global Industry Classification System.
For purposes of applying the limitation set forth in number 2 above, under the 1940 Act as currently in effect, a Fund is not permitted to issue senior securities, except that a Fund may borrow from any bank if immediately after such borrowing the value of the Fund’s total assets is at least 300% of the principal amount of all of the Fund’s borrowings (i.e., the principal amount of the borrowings may not exceed 33 1/3% of the Fund’s total assets). In the event that such asset coverage shall at any time fall below 300% the Fund shall, within three days thereafter (not including Sundays and holidays) reduce the amount of its borrowings to an extent that the asset coverage of such borrowing shall be at least 300%.
For purposes of applying the limitation set forth in number 8 above, there are no limitations with respect to unsecured loans made by a Fund to an unaffiliated party. However, when a Fund loans its portfolio securities, the obligation on the part of the Fund to return collateral upon termination of the loan could be deemed to involve the issuance of a senior security within the meaning of Section 18(f) of the 1940 Act. In order to avoid violation of Section 18(f), the Fund may not make a loan of portfolio securities if, as a result, more than one-third of its total asset value (at market value computed at the time of making a loan) would be on loan.
The following restrictions are non-fundamental and may be changed by NIF’s Board of Directors without a shareholder vote:
None of the Funds will:
1. Invest more than 15% of its net assets in all forms of illiquid investments.
2. Borrow money in an amount exceeding 10% of the borrowing Fund’s total assets. None of the Funds will borrow money for leverage purposes. For the purpose of this investment
S-5
restriction, the use of options and futures transactions and the purchase of securities on a when-issued or delayed delivery basis shall not be deemed the borrowing of money. No Fund will make additional investments while its borrowings exceed 5% of total assets.
3. Make short sales of securities.
4. Lend portfolio securities representing in excess of one-third of the value of its total assets.
5. Pledge any assets, except in connection with any permitted borrowing and then in amounts not in excess of one-third of the Fund’s total assets, provided that for the purposes of this restriction, margin deposits, security interests, liens and collateral arrangements with respect to options, futures contracts, options on futures contracts, and other permitted investments and techniques are not deemed to be a pledge of assets for purposes of this limitation.
6. Acquire any securities of registered open-end investment companies or registered unit investment trusts in reliance on subparagraph (F) or subparagraph (G) of Section 12(d)(1) of the 1940 Act. This restriction does not apply to Nuveen Tactical Market Opportunities Fund.
With respect to the non-fundamental restriction set forth in number 1 above, the Fund will monitor portfolio liquidity on an ongoing basis and, in the event more than 15% of the Fund’s net assets are invested in illiquid investments, the Fund will reduce its holdings of illiquid securities in an orderly fashion in order to maintain adequate liquidity.
The Board of Directors has adopted guidelines and procedures under which the Fund’s investment adviser is to determine whether the following types of securities which may be held by the Fund are “liquid” and to report to the Board concerning its determinations: (i) securities eligible for resale pursuant to Rule 144A under the Securities Act of 1933; (ii) commercial paper issued in reliance on the “private placement” exemption from registration under Section 4(2) of the Securities Act of 1933, whether or not it is eligible for resale pursuant to Rule 144A; (iii) interest-only and principal-only, inverse floating and inverse interest-only securities issued or guaranteed by the U.S. Government or its agencies or instrumentalities; and (iv) municipal leases and securities that represent interests in municipal leases.
With respect to any Fund that has adopted an investment strategy pursuant to Rule 35d-1 of the 1940 Act, whereby at least 80% of the Fund’s net assets (plus the amount of any borrowings for investment purposes) must be invested in a strategy suggested by the Fund’s name, a policy has been adopted by the Funds to provide shareholders with at least 60 days’ notice in the event of a planned change to the investment strategy. Such notice to shareholders will meet the requirements of Rule 35d-1(c).
INVESTMENT POLICIES AND TECHNIQUES
The principal investment strategies of each Fund are set forth in the Funds’ Prospectus. Additional information concerning principal investment strategies of the Funds, and other investment strategies that may be used by the Funds, is set forth below. The Funds have attempted to identify investment strategies that will be employed in pursuing each Fund’s investment objective. Additional information concerning the Funds’ investment restrictions is set forth above under “Investment Restrictions.”
If a percentage limitation on investments by a Fund stated in this SAI or the Prospectus is adhered to at the time of an investment, a later increase or decrease in percentage resulting from changes in asset value will not be deemed to violate the limitation except in the case of the limitations on borrowing. To the extent a Fund is limited to investing in securities with specified ratings or of a certain credit quality, the Fund is not required to sell a security if its rating is reduced or its credit quality declines after purchase, but may consider doing so. Descriptions of the rating categories of Standard & Poor’s Ratings Services, a division of The McGraw-Hill Companies, Inc. (“Standard & Poor’s”), Fitch, Inc. (“Fitch”) and Moody’s Investors Service, Inc. (“Moody’s”) are contained in Appendix A.
Each Fund has one or more sub-adviser that is responsible for the day-to-day management of such Fund’s investment portfolio (each a “Sub-Adviser” and, collectively, the “Sub-Advisers”).
Asset Coverage Requirements
To the extent required by SEC guidelines, a Fund will only engage in transactions that expose it to an obligation to another party if it owns either (a) an offsetting position for the same type of
S-6
financial asset, or (b) cash or liquid securities, designated on the Fund’s books or held in a segregated account, with a value sufficient at all times to cover its potential obligations not covered as provided in (a). Examples of transactions governed by these asset coverage requirements include, for example, options written by the Funds, futures contracts and options on futures contracts, forward currency contracts, swaps, and when-issued and delayed delivery transactions. Assets used as offsetting positions, designated on a Fund’s books, or held in a segregated account cannot be sold while the positions requiring cover are open unless replaced with other appropriate assets. As a result, the commitment of a large portion of assets to be used as offsetting positions or to be designated or segregated in such a manner could impede portfolio management or the ability to meet redemption requests or other current obligations.
Commodity-Linked Securities
As a principal investment strategy, Nuveen Tactical Market Opportunities Fund may invest in commodity-linked exchange-traded funds (“ETFs”) and derivative securities, which are designed to provide investment exposure to commodities without direct investment in physical commodities or commodities futures contracts. Commodities to which the Fund may gain exposure include assets such as oil, gas, industrial and precious metals, livestock, and agricultural or meat products, or other items that have tangible properties. The Fund may invest in securities that give it exposure to various commodities and commodity sectors. The value of commodity-linked securities held by the Fund may be affected by a variety of factors, including, but not limited to, overall market movements and other factors affecting the value of particular industries or commodities, such as weather, disease, embargoes, acts of war or terrorism, or political and regulatory developments.
The prices of commodity-linked securities may move in different directions than investments in traditional equity and debt securities. For example, during periods of rising inflation, debt securities have historically tended to decline in value due to the general increase in prevailing interest rates. Conversely, during those same periods of rising inflation, the prices of certain commodities, such as oil and metals, have historically tended to increase. Of course, there cannot be any guarantee that these investments will perform in that manner in the future, and at certain times the price movements of commodity-linked securities have been parallel to those of debt and equity securities. Commodities have historically tended to increase and decrease in value during different parts of the business cycle than financial assets. Nevertheless, at various times, commodities prices may move in tandem with the prices of financial assets and thus may not provide overall portfolio diversification benefits.
Convertible Securities
Nuveen Dividend Value Fund may invest in convertible securities as a principal investment strategy. Each other Fund, other than Nuveen Tactical Market Opportunities Fund, may invest in such securities as a non-principal investment strategy. Convertible securities are bonds, debentures, notes, or other securities that may be converted or exchanged (by the holder or by the issuer) into shares of the underlying common stock (or cash or securities of equivalent value) at a stated exchange ratio. A convertible security may also be called for redemption or conversion by the issuer after a particular date and under certain circumstances (including a specified price) established upon issue. If a convertible security held by a Fund is called for redemption or conversion, the Fund could be required to tender it for redemption, convert it into the underlying common stock, or sell it to a third party.
Convertible securities generally have less potential for gain or loss than common stocks. Convertible securities generally provide yields higher than the underlying common stocks, but generally lower than comparable non-convertible securities. Because of this higher yield, convertible securities generally sell at prices above their “conversion value,” which is the current market value of the stock to be received upon conversion. The difference between this conversion value and the price of convertible securities will vary over time depending on changes in the value of the underlying common stocks and interest rates. When the underlying common stocks decline in value, convertible securities will tend not to decline to the same extent because of the interest or dividend payments and the repayment of principal at maturity for certain types of convertible securities. However, securities that are convertible other than at the option of the holder generally do not limit the potential for loss to the same extent as securities convertible at the option of the holder. When the
S-7
underlying common stocks rise in value, the value of convertible securities may also be expected to increase. At the same time, however, the difference between the market value of convertible securities and their conversion value will narrow, which means that the value of convertible securities will generally not increase to the same extent as the value of the underlying common stocks. Because convertible securities may also be interest-rate sensitive, their value may increase as interest rates fall and decrease as interest rates rise. Convertible securities are also subject to credit risk, and are often lower-quality securities.
Derivatives
Each Fund may use derivative instruments as a principal investment strategy, as described below. Generally, a derivative is a financial contract the value of which depends upon, or is derived from, the value of an underlying asset, reference rate or index. Derivatives generally take the form of contracts under which the parties agree to payments between them based upon the performance of a wide variety of underlying references, such as stocks, bonds, loans, commodities, interest rates, currency exchange rates, and various domestic and foreign indices. Derivative instruments that some or all of the Funds may use include options contracts, futures contracts, options on futures contracts, forward currency contracts and swap transactions, all of which are described in more detail below.
The Funds may use derivatives for a variety of reasons, including as a substitute for investing directly in securities and currencies, as an alternative to selling a security short, as part of a hedging strategy (that is, for the purpose of reducing risk to a Fund), or for other purposes related to the management of the Funds. Derivatives permit a Fund to increase or decrease the level of risk, or change the character of the risk, to which its portfolio is exposed in much the same way as the Fund can increase or decrease the level of risk, or change the character of the risk, of its portfolio by making investments in specific securities. However, derivatives may entail investment exposures that are greater than their cost would suggest. As a result, a small investment in derivatives could have a large impact on a Fund’s performance.
Derivatives can be volatile and involve various types and degrees of risk, depending upon the characteristics of the particular derivative and the portfolio as a whole. If a Fund invests in derivatives at inopportune times or judges market conditions incorrectly, such investments may lower the Fund’s return or result in a loss. A Fund also could experience losses or limit its gains if the performance of its derivatives is poorly correlated with the underlying instruments or the Fund’s other investments, or if the Fund is unable to liquidate its position because of an illiquid secondary market. The market for derivatives is, or suddenly can become, illiquid. Changes in liquidity may result in significant, rapid and unpredictable changes in the prices for derivatives.
While transactions in some derivatives may be effected on established exchanges, many other derivatives are privately negotiated and entered into in the over-the-counter market with a single counterparty. When exchange-traded derivatives are purchased and sold, a clearing agency associated with the exchange stands between each buyer and seller and effectively guarantees performance of each contract, either on a limited basis through a guaranty fund or to the full extent of the clearing agency’s balance sheet. Transactions in over-the-counter derivatives have no such protection. Each party to an over-the-counter derivative bears the risk that its direct counterparty will default. In addition, over-the-counter derivatives may be less liquid than exchange-traded derivatives since the other party to the transaction may be the only investor with sufficient understanding of the derivative to be interested in bidding for it.
Derivatives generally involve leverage in the sense that the investment exposure created by the derivative is significantly greater than the Fund’s initial investment in the derivative. As discussed above under “—Asset Coverage Requirements,” a Fund may be required to segregate permissible liquid assets, or engage in other permitted measures, to “cover” the Fund’s obligations relating to its transactions in derivatives. For example, in the case of futures contracts or forward contracts that are not contractually required to cash settle, a Fund must set aside liquid assets equal to such contracts’ full notional value (generally, the total numerical value of the asset underlying a future or forward contract at the time of valuation) while the positions are open. With respect to futures contracts or forward contracts that are contractually required to cash settle, however, a Fund is permitted to set aside liquid assets in an amount equal to the Fund’s daily mark-to-market net obligation (i.e., the
S-8
Fund’s daily net liability) under the contracts, if any, rather than such contracts’ full notional value. By setting aside assets equal to only its net obligations under cash-settled futures and forward contracts, the Fund may employ leverage to a greater extent than if the Fund were required to segregate assets equal to the full notional value of such contracts.
Derivatives also may involve other types of leverage. For example, an instrument linked to the value of a securities index may return income calculated as a multiple of the price movement of the underlying index. This leverage will increase the volatility of these derivatives since they may increase or decrease in value more quickly than the underlying instruments.
The particular derivative instruments the Funds can use are described below. A Fund’s portfolio managers may decide not to employ some or all of these instruments, and there is no assurance that any derivatives strategy used by a Fund will succeed. The Funds may employ new derivative instruments and strategies when they are developed, if those investment methods are consistent with the particular Fund’s investment objective and are permissible under applicable regulations governing the Fund.
Futures and Options on Futures
The Funds may engage in futures transactions as a principal investment strategy. The Funds may buy and sell futures contracts that relate to: (1) interest rates, (2) debt securities, (3) bond indices, (4) foreign currencies, (5) stock indices, and (6) individual stocks. The Funds also may buy and write options on the futures contracts in which they may invest (“futures options”) and may write straddles, which consist of a call and a put option on the same futures contract. The Funds will only write options and straddles which are “covered.” This means that, when writing a call option, a Fund must either segregate liquid assets with a value equal to the fluctuating market value of the optioned futures contract, or the Fund must own an option to purchase the same futures contract having an exercise price that is (i) equal to or less than the exercise price of the call written, or (ii) greater than the exercise price of the call written, provided the difference is maintained by the Fund in segregated liquid assets. When writing a put option, a Fund must segregate liquid assets in an amount not less than the exercise price, or own a put option on the same futures contract where the exercise price of the put held is (i) equal to or greater than the exercise price of the put written, or (ii) less than the exercise price of the put written, provided the difference is maintained by the Fund in segregated liquid assets. A straddle will be covered when sufficient assets are deposited to meet the Fund’s immediate obligations. A Fund may use the same liquid assets to cover both the call and put options in a straddle where the exercise price of the call and put are the same, or the exercise price of the call is higher than that of the put. In such cases, the Fund will also segregate liquid assets equivalent to the amount, if any, by which the put is “in the money.” The Funds may only enter into futures contracts and futures options which are standardized and traded on a U.S. or foreign exchange, board of trade or similar entity, or quoted on an automated quotation system.
A futures contract is an agreement between two parties to buy and sell a security, index, interest rate, or currency (each a “financial instrument”) for a set price on a future date. Certain futures contracts, such as futures contracts relating to individual securities, call for making or taking delivery of the underlying financial instrument. However, these contracts generally are closed out before delivery by entering into an offsetting purchase or sale of a matching futures contract (same exchange, underlying financial instrument, and delivery month). Other futures contracts, such as futures contracts on interest rates and indices, do not call for making or taking delivery of the underlying financial instrument, but rather are agreements pursuant to which two parties agree to take or make delivery of an amount of cash equal to the difference between the value of the financial instrument at the close of the last trading day of the contract and the price at which the contract was originally written. These contracts also may be settled by entering into an offsetting futures contract.
Unlike when a Fund purchases or sells a security, no price is paid or received by a Fund upon the purchase or sale of a futures contract. Initially, a Fund will be required to deposit with the futures broker, known as a futures commission merchant (“FCM”), an amount of cash or securities equal to a varying specified percentage of the contract amount. This amount is known as initial margin. The margin deposit is intended to ensure completion of the contract. Minimum initial margin requirements are established by the futures exchanges and may be revised. In addition, FCMs may establish margin
S-9
deposit requirements that are higher than the exchange minimums. Cash held in the margin account generally is not income producing. However, coupon-bearing securities, such as Treasury securities, held in margin accounts generally will earn income. Subsequent payments to and from the FCM, called variation margin, will be made on a daily basis as the price of the underlying financial instrument fluctuates, making the futures contract more or less valuable, a process known as marking the contract to market. Changes in variation margin are recorded by a Fund as unrealized gains or losses. At any time prior to expiration of the futures contract, a Fund may elect to close the position by taking an opposite position that will operate to terminate its position in the futures contract. A final determination of variation margin is then made, additional cash is required to be paid by or released to the Fund, and the Fund realizes a gain or loss. In the event of the bankruptcy or insolvency of an FCM that holds margin on behalf of a Fund, the Fund may be entitled to the return of margin owed to it only in proportion to the amount received by the FCM’s other customers, potentially resulting in losses to the Fund. Futures transactions also involve brokerage costs and the Fund may have to segregate additional liquid assets in accordance with applicable SEC requirements. See “—Asset Coverage Requirements” above.
A futures option gives the purchaser of such option the right, in return for the premium paid, to assume a long position (call) or short position (put) in a futures contract at a specified exercise price at any time during the period of the option. Upon exercise of a call option, the purchaser acquires a long position in the futures contract and the writer is assigned the opposite short position. Upon the exercise of a put option, the opposite is true. Futures options possess many of the same characteristics as options on securities, currencies and indices (discussed below under “—Options Transactions”).
Limitations on the Use of Futures and Futures Options. The Commodities Futures Trading Commission has eliminated limitations on futures trading by certain regulated entities including registered investment companies. Consequently, registered investment companies may engage in unlimited futures transactions and options thereon provided they have claimed an exclusion from regulation as a commodity pool operator. NIF, on behalf of each of its series, has claimed such an exclusion. Thus, each Fund may use futures contracts and options thereon to the extent consistent with its investment objective. The requirements for qualification as a regulated investment company may limit the extent to which a Fund may enter into futures transactions. See “Taxation.”
VIX Futures. Nuveen Tactical Market Opportunities Fund may buy and sell futures contracts that track the level of the Chicago Board Options Exchange (“CBOE”) Volatility Index (“VIX”). The CBOE Volatility Index is based upon the prices of options on the S&P 500 Index that are listed on the CBOE, and is designed to reflect investors’ projection of future (30-day) stock market volatility. The value of VIX futures is dependent on the movements in the expected volatility of stock prices; it is not dependent on the direction of stock prices. Thus, VIX futures provide a way for Nuveen Tactical Market Opportunities Fund to seek to either hedge certain of its portfolio positions or to profit by correctly forecasting the future volatility in the stock market. Please see below for a description of the principal risks associated with futures, including VIX futures.
Risks Associated with Futures and Futures Options. There are risks associated with the use of futures contracts and futures options. A purchase or sale of a futures contract may result in a loss in excess of the amount invested in the futures contract.
If futures are used for hedging purposes, there can be no guarantee that there will be a correlation between price movements in the futures contract and in the underlying financial instruments that are being hedged. This could result from differences between the financial instruments being hedged and the financial instruments underlying the standard contracts available for trading (e.g., differences in interest rate levels, maturities and the creditworthiness of issuers). In addition, price movements of futures contracts may not correlate perfectly with price movements of the financial instruments underlying the futures contracts due to certain market distortions.
Successful use of futures by the Funds also is subject to a Sub-Adviser’s ability to predict correctly movements in the direction of the relevant market. For example, if a Fund uses futures to hedge against the possibility of a decline in the market value of securities held in its portfolio and the prices of such securities increase instead, the Fund will lose part or all of the benefit of the increased value of
S-10
the securities which it has hedged because it will have offsetting losses in its futures positions. Furthermore, if in such circumstances the Fund has insufficient cash, it may have to sell securities to meet daily variation margin requirements. The Fund may have to sell such securities at a time when it may be disadvantageous to do so.
There can be no assurance that a liquid market will exist at a time when a Fund seeks to close out a futures or a futures option position, and the Fund would remain obligated to meet margin requirements until the position is closed. Futures exchanges may limit the amount of fluctuation permitted in certain futures contract prices during a single trading day. The daily limit establishes the maximum amount that the price of a futures contract may vary either up or down from the previous day’s settlement price at the end of the current trading session. Once the daily limit has been reached in a futures contract subject to the limit, no more trades may be made on that day at a price beyond that limit. The daily limit governs only price movements during a particular trading day and therefore does not limit potential losses because the limit may work to prevent the liquidation of unfavorable positions. For example, futures prices have occasionally moved to the daily limit for several consecutive trading days with little or no trading, thereby preventing prompt liquidation of positions and subjecting some holders of futures contracts to substantial losses.
Additional Risks Associated with Commodity Futures Contracts. There are several additional risks associated with transactions in commodity futures contracts.
Storage. Unlike the financial futures markets, in the commodity futures markets there are costs of physical storage associated with purchasing the underlying commodity. The price of the commodity futures contract will reflect the storage costs of purchasing the physical commodity, including the time value of money invested in the physical commodity. To the extent that the storage costs for an underlying commodity change while the Fund is invested in futures contracts on that commodity, the value of the futures contract may change proportionately.
Reinvestment. In the commodity futures markets, producers of the underlying commodity may decide to hedge the price risk of selling the commodity by selling futures contracts today to lock in the price of the commodity at the time of delivery. In order to induce speculators to purchase the other side of the same futures contract, the commodity producer generally must sell the futures contract at a lower price than the expected future spot price. Conversely, if most hedgers in the futures market are purchasing futures contracts to hedge against a rise in prices, then speculators will only sell the other side of the futures contract at a higher futures price than the expected future spot price of the commodity. The changing nature of the hedgers and speculators in the commodity markets will influence whether futures prices are above or below the expected future spot price, which can have significant implications for the Fund. If the nature of hedgers and speculators in futures markets has shifted when it is time for the Fund to reinvest the proceeds of a maturing contract in a new futures contract, the Fund might reinvest at higher or lower futures prices, or choose to pursue other investments.
Other Economic Factors. The commodities which underlie commodity futures contracts may be subject to additional economic and non-economic variables, such as drought, floods, weather, livestock disease, embargoes, tariffs, and international economic, political and regulatory developments. These factors may have a larger impact on commodity prices and commodity-linked instruments, including futures contracts, than on traditional securities. Certain commodities are also subject to limited pricing flexibility because of supply and demand factors. Others are subject to broad price fluctuations as a result of the volatility of the prices for certain raw materials and the instability of supplies of other materials. These additional variables may create additional investment risks which subject the Fund’s investments to greater volatility than investments in traditional securities.
Forward Currency Contracts and other Foreign Currency Transactions
The Funds (other than Nuveen Quantitative Enhanced Core Equity Fund and the Index Funds) may enter into forward currency contracts as a principal investment strategy. A forward currency contract involves an obligation to purchase or sell a specific currency at a future date, which may be any fixed number of days from the date of the contract agreed upon by the parties, at a price set at the time of the contract. These contracts are traded directly between currency traders (usually large
S-11
commercial banks) and their customers. Unlike futures contracts, which are standardized contracts, forward contracts can be specifically drawn to meet the needs of the parties that enter into them. The parties to a forward currency contract may agree to offset or terminate the contract before its maturity, or may hold the contract to maturity and complete the contemplated exchange. Because forward contracts are not traded on an exchange, the Funds are subject to the credit and performance risk of the counterparties to such contracts.
The following summarizes the principal currency management strategies involving forward contracts that may be used by the Funds. These Funds also may use currency futures contracts and options thereon (see “—Futures and Options on Futures” above), and put and call options on foreign currencies (see “—Options Transactions” below) for the same purposes.
Transaction Hedges. When a Fund enters into a contract for the purchase or sale of a security denominated in a foreign currency, or when it anticipates receiving dividend payments in a foreign currency, the Fund might wish to lock in the U.S. dollar price of the security or the U.S. dollar equivalent of the dividend payments. To do so, the Fund could enter into a forward contract for the purchase or sale of the amount of foreign currency involved in the underlying transaction at a fixed amount of U.S. dollars per unit of the foreign currency. This is known as a “transaction hedge.” A transaction hedge will protect a Fund against a loss from an adverse change in the currency exchange rate during the period between the date on which the security is purchased or sold or on which the payment is declared, and the date on which the payment is made or received. Forward contracts to purchase or sell a foreign currency may also be used by a Fund in anticipation of future purchases or sales of securities denominated in a foreign currency, even if the specific investments have not yet been selected by a Sub-Adviser. This strategy is sometimes referred to as “anticipatory hedging.”
Position Hedges. A Fund could also use forward contracts to lock in the U.S. dollar value of portfolio positions. This is known as a “position hedge.” When a Fund believes that a foreign currency might suffer a substantial decline against the U.S. dollar, it could enter into a forward contract to sell an amount of that foreign currency approximating the value of some or all of the Fund’s portfolio securities denominated in that foreign currency. When a Fund believes that the U.S. dollar might suffer a substantial decline against a foreign currency, it could enter into a forward contract to buy that foreign currency for a fixed dollar amount. Alternatively, a Fund could enter into a forward contract to sell a different foreign currency for a fixed U.S. dollar amount if the Fund believes that the U.S. dollar value of that foreign currency will fall whenever there is a decline in the U.S. dollar value of the currency in which portfolio securities of the Fund are denominated. This is referred to as a “cross hedge.”
Shifting Currency Exposure. A Fund may also enter into forward contracts to shift its investment exposure from one currency into another. This may include shifting exposure from U.S. dollars to foreign currency or from one foreign currency to another foreign currency. This strategy tends to limit exposure to the currency sold, and increase exposure to the currency that is purchased, much as if a Fund had sold a security denominated in one currency and purchased an equivalent security denominated in another currency.
Risks Associated with Forward Currency Transactions. A Sub-Adviser’s decision whether to enter into foreign currency transactions will depend in part on its view regarding the direction and amount in which exchange rates are likely to move. The forecasting of movements in exchange rates is extremely difficult, so that it is highly uncertain whether a currency management strategy, if undertaken, would be successful. To the extent that a Sub-Adviser’s view regarding future exchange rates proves to have been incorrect, a Fund may realize losses on its foreign currency transactions. Even if a foreign currency hedge is effective in protecting a Fund from losses resulting from unfavorable changes in exchange rates between the U.S. dollar and foreign currencies, it also would limit the gains which might be realized by the Fund from favorable changes in exchange rates.
Options Transactions
To the extent set forth below, the Funds may purchase put and call options on specific securities (including groups or “baskets” of specific securities), interest rates, stock indices, bond indices, and/or foreign currencies. In addition, the Funds may write put and call options on such financial instruments. Options on futures contracts are discussed above under “— Futures and Options on Futures.”
S-12
Options on Securities. As a principal investment strategy, the Funds (other than the Index Funds) may purchase put and call options on securities they own or have the right to acquire. A put option on a security gives the purchaser of the option the right (but not the obligation) to sell, and the writer of the option the obligation to buy, the underlying security at a stated price (the “exercise price”) at any time before the option expires. A call option on a security gives the purchaser the right (but not the obligation) to buy, and the writer the obligation to sell, the underlying security at the exercise price at any time before the option expires. The purchase price for a put or call option is the “premium” paid by the purchaser for the right to sell or buy.
A Fund may purchase put options to hedge against a decline in the value of its portfolio. By using put options in this way, a Fund would reduce any profit it might otherwise have realized in the underlying security by the amount of the premium paid for the put option and by transaction costs. In similar fashion, a Fund may purchase call options to protect against an increase in the price of securities that the Fund anticipates purchasing in the future, a practice sometimes referred to as “anticipatory hedging.” The premium paid for the call option plus any transaction costs will reduce the benefit, if any, realized by the Fund upon exercise of the option, and, unless the price of the underlying security rises sufficiently, the option may expire unexercised.
Options on Interest Rates and Indices. As principal investment strategies, the Funds may purchase put and call options on interest rates and on stock and bond indices. An option on interest rates or on an index gives the holder the right to receive, upon exercise of the option, an amount of cash if the closing value of the underlying interest rate or index is greater than, in the case of a call, or less than, in the case of a put, the exercise price of the option. This amount of cash is equal to the difference between the exercise-settlement value of the interest rate option or the closing price of the index and the exercise price of the option expressed in dollars times a specified multiple (the “multiplier”). The writer of the option is obligated, for the premium received, to make delivery of this amount. Settlements for interest rate and index options are always in cash.
Options on Currencies. The Funds (other than Nuveen Quantitative Enhanced Core Equity Fund and the Index Funds) may purchase put and call options on foreign currencies as a principal investment strategy. A foreign currency option provides the option buyer with the right to buy or sell a stated amount of foreign currency at the exercise price at a specified date or during the option period. A call option gives its owner the right, but not the obligation, to buy the currency, while a put option gives its owner the right, but not the obligation, to sell the currency. The option seller (writer) is obligated to fulfill the terms of the option sold if it is exercised. However, either seller or buyer may close its position during the option period in the secondary market for such options at any time prior to expiration.
A foreign currency call option rises in value if the underlying currency appreciates. Conversely, a foreign currency put option rises in value if the underlying currency depreciates. While purchasing a foreign currency option may protect a Fund against an adverse movement in the value of a foreign currency, it would limit the gain which might result from a favorable movement in the value of the currency. For example, if the Fund were holding securities denominated in an appreciating foreign currency and had purchased a foreign currency put to hedge against a decline in the value of the currency, it would not have to exercise its put. In such an event, however, the amount of the Fund’s gain would be offset in part by the premium paid for the option. Similarly, if the Fund entered into a contract to purchase a security denominated in a foreign currency and purchased a foreign currency call to hedge against a rise in the value of the currency between the date of purchase and the settlement date, the Fund would not need to exercise its call if the currency instead depreciated in value. In such a case, the Fund could acquire the amount of foreign currency needed for settlement in the spot market at a lower price than the exercise price of the option.
Writing Options. The Funds may write (sell) covered put and call options as a principal investment strategy. These transactions would be undertaken principally to produce additional income. The Funds receive a premium from writing options which it retains whether or not the option is exercised. The Funds may write covered straddles consisting of a combination of a call and a put written on the same underlying instrument.
The Funds will write options only if they are “covered.” In the case of a call option on a security, the option is covered if the Fund owns the security underlying the call or has an absolute and
S-13
immediate right to acquire that security without additional cash consideration (or, if additional cash consideration is required, cash or other liquid assets in such amount are segregated) upon conversion or exchange of the securities held by the Fund. For a call option on an index or currency, the option is covered if the Fund segregates liquid assets in an amount equal to the contract value of the index or currency. A call option is also covered if the Fund holds a call on the same security, index or currency as the call written where the exercise price of the call held is (i) equal to or less than the exercise price of the call written, or (ii) greater than the exercise price of the call written, provided the difference is maintained by the Fund in segregated liquid assets. A put option on a security, currency or index is “covered” if the Fund segregates liquid assets equal to the exercise price. A put option is also covered if the Fund holds a put on the same security, currency or index as the put written where the exercise price of the put held is (i) equal to or greater than the exercise price of the put written, or (ii) less than the exercise price of the put written, provided the difference is maintained by the Fund in segregated liquid assets. A straddle will be covered when sufficient assets are deposited to meet the Fund’s immediate obligations. The Fund may use the same liquid assets to cover both the call and put options in a straddle where the exercise price of the call and put are the same, or the exercise price of the call is higher than that of the put. In such cases, the Fund will also segregate liquid assets equivalent to the amount, if any, by which the put is “in the money.”
Expiration or Exercise of Options. If an option written by a Fund expires unexercised, the Fund realizes a capital gain equal to the premium received at the time the option was written. If an option purchased by a Fund expires unexercised, the Fund realizes a capital loss equal to the premium paid. Prior to the earlier of exercise or expiration, an exchange traded option may be closed out by an offsetting purchase or sale of an option of the same series (type, exchange, underlying security, currency or index, exercise price, and expiration). There can be no assurance, however, that a closing purchase or sale transaction can be effected when the Fund desires.
A Fund may sell put or call options it has previously purchased, which could result in a net gain or loss depending on whether the amount realized on the sale is more or less than the premium and other transaction costs paid on the put or call option which is sold. Prior to exercise or expiration, an option may be closed out by an offsetting purchase or sale of an option of the same series. A Fund will realize a capital gain from a closing purchase transaction if the cost of the closing option is less than the premium received from writing the option, or, if it is more, the Fund will realize a capital loss. If the premium received from a closing sale transaction is more than the premium paid to purchase the option, the Fund will realize a capital gain or, if it is less, the Fund will realize a capital loss. The principal factors affecting the market value of a put or a call option include supply and demand, interest rates, the current market price of the underlying security, currency or index in relation to the exercise price of the option, the volatility of the underlying security, currency or index, and the time remaining until the expiration date.
Risks Associated with Options Transactions. There are several risks associated with options transactions. For example, there are significant differences between the securities and options markets that could result in an imperfect correlation between these markets, causing a given transaction not to achieve its objectives. A decision as to whether, when and how to use options involves the exercise of skill and judgment, and even a well-conceived transaction may be unsuccessful to some degree because of market behavior or unexpected events.
When a Fund purchases a put or call option, it risks a total loss of the premium paid for the option, plus any transaction costs, if the price of the underlying security does not increase or decrease sufficiently to justify the exercise of such option. Also, where a put or call option on a particular security is purchased to hedge against price movements in a related security, the price of the put or call option may move more or less than the price of the related security.
There can be no assurance that a liquid market will exist when a Fund seeks to close out an option position. If a Fund were unable to close out an option that it had purchased on a security, it would have to exercise the option in order to realize any profit or the option may expire worthless. If a Fund were unable to close out a covered call option that it had written on a security, it would not be able to sell the underlying security unless the option expired without exercise. There is also a risk that, if restrictions on exercise were imposed, a Fund might be unable to exercise an option it had purchased.
S-14
With respect to options written by the Funds during the option period, the covered call writer has, in return for the premium on the option, given up the opportunity to profit from a price increase in the underlying security above the exercise price, but, as long as its obligation as a writer continues, has retained the risk of loss should the price of the underlying security decline. The writer of an option has no control over the time when it may be required to fulfill its obligations as a writer of the option. Once an option writer has received an exercise notice, it cannot effect a closing purchase transaction in order to terminate its obligation under the option and must deliver the underlying security at the exercise price.
Swap Transactions
Nuveen Tactical Market Opportunities Fund may enter into total return, interest rate, currency and credit default swap agreements and interest rate caps, floors and collars as a principal investment strategy. The Fund may also enter into options on the foregoing types of swap agreements (“swap options”).
The Fund may enter into swap transactions for any purpose consistent with its investment objectives and strategies, such as for the purpose of attempting to obtain or preserve a particular return or spread at a lower cost than obtaining a return or spread through purchases and/or sales of instruments in other markets, to protect against currency fluctuations, as a duration management technique, to protect against an increase in the price of securities the Fund anticipates purchasing at a later date, to reduce risk arising from the ownership of a particular instrument, or to gain exposure to certain securities, sectors or markets in the most economical way possible.
Swap agreements are two party contracts entered into primarily by institutional investors for a specified period of time. In a standard swap transaction, two parties agree to exchange the returns (or differentials in rates of return) earned or realized on a particular predetermined asset, reference rate or index. The gross returns to be exchanged or swapped between the parties are generally calculated with respect to a notional amount, e.g., the return on or increase in value of a particular dollar amount invested at a particular interest rate or in a basket of securities representing a particular index. The notional amount of the swap agreement generally is only used as a basis upon which to calculate the obligations that the parties to the swap agreement have agreed to exchange. The Fund’s current obligations under a net swap agreement will be accrued daily (offset against any amounts owed to the Fund) and any accrued but unpaid net amounts owed to a swap counterparty will be covered by assets determined to be liquid by a Sub-Adviser. See “—Asset Coverage Requirements” above.
Interest Rate Swaps, Caps, Collars and Floors. Interest rate swaps are bilateral contracts in which each party agrees to make periodic payments to the other party based on different referenced interest rates (e.g., a fixed rate and a floating rate) applied to a specified notional amount. The purchase of an interest rate floor entitles the purchaser, to the extent that a specified index falls below a predetermined interest rate, to receive payments of interest on a notional principal amount from the party selling such interest rate floor. The purchase of an interest rate cap entitles the purchaser, to the extent that a specified index rises above a predetermined interest rate, to receive payments of interest on a notional principal amount from the party selling such interest rate cap. Interest rate collars involve selling a cap and purchasing a floor or vice versa to protect the Fund against interest rate movements exceeding given minimum or maximum levels.
Currency Swaps. A currency swap is an agreement between two parties to exchange equivalent fixed amounts in two different currencies for a fixed period of time. The exchange of currencies at the inception date of the contract takes place at the current spot rate. Such an agreement may provide that, for the duration of the swap, each party pays interest to the other on the received amount at an agreed upon fixed or floating interest rate. When the contract ends, the parties re-exchange the currencies at the initial exchange rate, a specified rate, or the then current spot rate. Some currency swaps may not provide for exchanging currencies, but only for exchanging interest cash flows.
Total Return Swaps. In a total return swap, one party agrees to pay the other the “total return” of a defined underlying asset during a specified period, in return for periodic payments based on a fixed or variable interest rate or the total return from other underlying assets. A total return swap may be applied to any underlying asset but is most commonly used with equity indices, single stocks, bonds and defined baskets of loans and mortgages. The Fund might enter into a total return swap involving an underlying index or basket of securities to create exposure to a potentially widely-diversified range
S-15
of securities in a single trade. An index total return swap can be used by the portfolio managers to assume risk, without the complications of buying the component securities from what may not always be the most liquid of markets.
Credit Default Swaps. A credit default swap is a bilateral contract that enables an investor to buy or sell protection against a defined-issuer credit event. The Fund may enter into credit default swap agreements either as a buyer or a seller. The Fund may buy protection to attempt to mitigate the risk of default or credit quality deterioration in one or more of its individual holdings or in a segment of the fixed income securities market to which it has exposure, or to take a “short” position in individual bonds or market segments which it does not own. The Fund may sell protection in an attempt to gain exposure to the credit quality characteristics of particular bonds or market segments without investing directly in those bonds or market segments.
As the buyer of protection in a credit default swap, the Fund will pay a premium (by means of an upfront payment or a periodic stream of payments over the term of the agreement) in return for the right to deliver a referenced bond or group of bonds to the protection seller and receive the full notional or par value (or other agreed upon value) upon a default (or similar event) by the issuer(s) of the underlying referenced obligation(s). If no default occurs, the protection seller would keep the stream of payments and would have no further obligation to the Fund. Thus, the cost to the Fund would be the premium paid with respect to the agreement. If a credit event occurs, however, the Fund may elect to receive the full notional value of the swap in exchange for an equal face amount of deliverable obligations of the reference entity that may have little or no value. The Fund bears the risk that the protection seller may fail to satisfy its payment obligations.
If the Fund is a seller of protection in a credit default swap and no credit event occurs, the Fund would generally receive an up-front payment or a periodic stream of payments over the term of the swap. If a credit event occurs, however, generally the Fund would have to pay the buyer the full notional value of the swap in exchange for an equal face amount of deliverable obligations of the reference entity that may have little or no value. As the protection seller, the Fund effectively adds economic leverage to its portfolio because, in addition to being subject to investment exposure on its total net assets, the Fund is subject to investment exposure on the notional amount of the swap. Thus, the Fund bears the same risk as it would by buying the reference obligations directly, plus the additional risks related to obtaining investment exposure through a derivative instrument discussed below under “—Risks Associated with Swap Transactions.”
Swap Options. A swap option is a contract that gives a counterparty the right (but not the obligation), in return for payment of a premium, to enter into a new swap agreement or to shorten, extend, cancel, or otherwise modify an existing swap agreement at some designated future time on specified terms. A cash-settled option on a swap gives the purchaser the right, in return for the premium paid, to receive an amount of cash equal to the value of the underlying swap as of the exercise date. The Fund may write (sell) and purchase put and call swap options. Depending on the terms of the particular option agreement, the Fund generally will incur a greater degree of risk when it writes a swap option than when it purchases a swap option. When the Fund purchases a swap option, it risks losing only the amount of the premium it has paid should it decide to let the option expire unexercised. However, when the Fund writes a swap option, upon exercise of the option the Fund will become obligated according to the terms of the underlying agreement.
Risks Associated with Swap Transactions. The use of swap transactions is a highly specialized activity which involves strategies and risks different from those associated with ordinary portfolio security transactions. If a Sub-Adviser is incorrect in its forecasts of default risks, market spreads or other applicable factors the investment performance of the Fund would diminish compared with what it would have been if these techniques were not used. As the protection seller in a credit default swap, the Fund effectively adds economic leverage to its portfolio because, in addition to being subject to investment exposure on its total net assets, the Fund is subject to investment exposure on the notional amount of the swap. The Fund may only close out a swap, cap, floor, collar or other two-party contract with its particular counterparty, and may only transfer a position with the consent of that counterparty. In addition, the price at which the Fund may close out such a two party contract may not correlate with the price change in the underlying reference asset. If the counterparty defaults, the Fund will have contractual remedies, but there can be no assurance that the counterparty will be
S-16
able to meet its contractual obligations or that the Fund will succeed in enforcing its rights. It also is possible that developments in the derivatives market, including potential government regulation, could adversely affect the Fund’s ability to terminate existing swap or other agreements or to realize amounts to be received under such agreements.
Exchange-Traded Funds
Nuveen International Fund, Nuveen International Select Fund, Nuveen Quantitative Enhanced Core Equity Fund, and Nuveen Tactical Market Opportunities Fund may invest in ETFs as a principal investment strategy. The other Funds may invest in ETFs as a non-principal investment strategy. ETFs are a type of index fund bought and sold on a securities exchange. An ETF trades like common stock and represents a portfolio of securities designed to track a particular market index. A Fund could purchase an ETF to gain exposure to all or a portion of the U.S. market, a foreign market, a region, a commodity, a currency, or to any other index that an ETF tracks. The risks of owning an ETF generally reflect the risks of owning the underlying securities they are designed to track, although lack of liquidity in an ETF could result in it being more volatile and ETFs have management fees that increase their costs. An ETF may fail to accurately track the returns of the market segment or index that it is designed to track, and the price of an ETF’s shares may fluctuate. In addition, because they, unlike traditional mutual funds, are traded on an exchange, ETFs are subject to the following risks: (i) the performance of the ETF may not replicate the performance of the underlying index that it is designed to track; (ii) the market price of the ETF’s shares may trade at a premium or discount to the ETF’s net asset value; (iii) an active trading market for an ETF may not develop or be maintained; and (iv) there is no assurance that the requirements of the exchange necessary to maintain the listing of the ETF will continue to be met or remain unchanged. In the event substantial market or other disruptions affecting ETFs should occur in the future, the liquidity and value of the Fund’s shares could also be substantially and adversely affected.
An investment company’s investments in other investment companies are typically subject to statutory limitations prescribed by the 1940 Act. Many ETFs, however, have obtained exemptive relief from the SEC to permit unaffiliated funds (such as a Fund) to invest in their shares beyond these statutory limits, subject to certain conditions and pursuant to contractual arrangements between the ETFs and the investing funds. Nuveen Tactical Market Opportunities Fund may rely on these exemptive orders in investing in ETFs.
Exchange-Traded Notes
The Funds may invest in exchange-traded notes (“ETNs”) as a non-principal investment strategy. ETNs are a type of senior, unsecured, unsubordinated debt security issued by financial institutions that combines both aspects of bonds and ETFs. An ETN’s returns are based on the performance of a market index minus fees and expenses. Similar to ETFs, ETNs are listed on an exchange and traded in the secondary market. However, unlike an ETF, an ETN can be held until the ETN’s maturity, at which time the issuer will pay a return linked to the performance of the market index to which the ETN is linked minus certain fees.
Unlike regular bonds, ETNs do not make periodic interest payments and principal is not protected. ETNs are subject to credit risk and the value of an ETN may drop due to a downgrade in the issuer’s credit rating, despite the underlying market benchmark or strategy remaining unchanged. The value of an ETN may also be influenced by time to maturity, level of supply and demand for the ETN, volatility and lack of liquidity in underlying assets, changes in the applicable interest rates, changes in the issuer’s credit rating, and economic, legal, political, or geographic events that affect the referenced underlying asset. When a Fund invests in ETNs it will bear its proportionate share of any fees and expenses borne by the ETN. A Fund’s decision to sell its ETN holdings may be limited by the availability of a secondary market. In addition, although an ETN may be listed on an exchange, the issuer may not be required to maintain the listing and there can be no assurance that a secondary market will exist for an ETN.
ETNs are also subject to tax risk. No assurance can be given that the Internal Revenue Service (“IRS”) will accept, or a court will uphold, how the Funds characterize and treat ETNs for tax purposes. Further, the IRS and Congress have considered proposals that would change the timing and character of income and gains from ETNs.
An ETN that is tied to a specific market benchmark or strategy may not be able to replicate and maintain exactly the composition and relative weighting of securities, commodities or other
S-17
components in the applicable market benchmark or strategy. Some ETNs that use leverage can, at times, be relatively illiquid and, thus, they may be difficult to purchase or sell at a fair price. Leveraged ETNs are subject to the same risk as other instruments that use leverage in any form.
The market value of ETN shares may differ from their market benchmark or strategy. This difference in price may be due to the fact that the supply and demand in the market for ETN shares at any point in time is not always identical to the supply and demand in the market for the securities, commodities or other components underlying the market benchmark or strategy that the ETN seeks to track. As a result, there may be times when an ETN share trades at a premium or discount to its market benchmark or strategy.
Fixed Income Securities
The Funds, other than Nuveen Tactical Market Opportunities Fund, may invest in the fixed income securities described below as either a principal or non-principal investment strategy, as indicated. Nuveen Tactical Market Opportunities Fund may invest in instruments that give it exposure to debt obligations as a principal investment strategy. These securities are subject to (i) interest rate risk (the risk that increases in market interest rates will cause declines in the value of debt securities held by a Fund); (ii) credit risk (the risk that the issuers of debt securities held by a Fund default in making required payments); and (iii) call or prepayment risk (the risk that a borrower may exercise the right to prepay a debt obligation before its stated maturity, requiring a Fund to reinvest the prepayment at a lower interest rate).
U.S. Government Securities
Each Fund, other than Nuveen Tactical Market Opportunities Fund, may invest in U.S. government securities as a non-principal investment strategy. Nuveen Tactical Market Opportunities Fund may invest in U.S. Treasury obligations as a principal investment strategy. The U.S. government securities in which the Funds may invest are either issued or guaranteed by the U.S. government, its agencies or instrumentalities. The U.S. government securities in which the Funds invest principally are:
| | • | | direct obligations of the U.S. Treasury, such as U.S. Treasury bills, notes, and bonds; |
| | • | | notes, bonds, and discount notes issued and guaranteed by U.S. government agencies and instrumentalities supported by the full faith and credit of the United States; |
| | • | | notes, bonds, and discount notes of U.S. government agencies or instrumentalities which receive or have access to federal funding; and |
| | • | | notes, bonds, and discount notes of other U.S. government instrumentalities supported only by the credit of the instrumentalities. |
U.S. Treasury obligations include separately traded interest and principal component parts of such obligations, known as Separately Traded Registered Interest and Principal Securities (“STRIPS”), which are transferable through the Federal book-entry system. STRIPS are sold as zero coupon securities, which means that they are sold at a substantial discount and redeemed at face value at their maturity date without interim cash payments of interest or principal. This discount is accreted over the life of the security, and such accretion will constitute the income earned on the security for both accounting and tax purposes. Because of these features, such securities may be subject to greater interest rate volatility than interest paying U.S. Treasury obligations.
The government securities in which the Funds may invest are backed in a variety of ways by the U.S. government or its agencies or instrumentalities. Some of these securities, such as Government National Mortgage Association (“GNMA”) mortgage-backed securities, are backed by the full faith and credit of the U.S. government. Other securities, such as obligations of the Federal National Mortgage Association (“FNMA”) or the Federal Home Loan Mortgage Corporation (“FHLMC”) are backed by the credit of the agency or instrumentality issuing the obligations but not the full faith and credit of the U.S. government. No assurances can be given that the U.S. government will provide financial support to these other agencies or instrumentalities because it is not obligated to do so. See “– Agency Pass-Through Certificates” below for a description of these securities.
S-18
Agency Pass-Through Certificates
The Funds, other than Nuveen Tactical Market Opportunities Fund, may invest in Agency Pass-Through Certificates to the same extent they can invest in U.S. government securities. Agency Pass-Through Certificates are mortgage pass-through certificates representing undivided interests in pools of residential mortgage loans. Distribution of principal and interest on the mortgage loans underlying an Agency Pass-Through Certificate is an obligation of or guaranteed by GNMA, FNMA or FHLMC. GNMA is a wholly owned corporate instrumentality of the United States within the Department of Housing and Urban Development. The guarantee of GNMA with respect to GNMA certificates is backed by the full faith and credit of the United States, and GNMA is authorized to borrow from the U.S. Treasury in an amount which is at any time sufficient to enable GNMA, with no limitation as to amount, to perform its guarantee.
FNMA is a federally chartered and privately owned corporation organized and existing under federal law. Although the Secretary of the Treasury of the United States has discretionary authority to lend funds to FNMA, neither the United States nor any agency thereof is obligated to finance FNMA’s operations or to assist FNMA in any other manner.
FHLMC is a federally chartered corporation organized and existing under federal law, the common stock of which is owned by the Federal Home Loan Banks. Neither the United States nor any agency thereof is obligated to finance FHLMC’s operations or to assist FHLMC in any other manner.
The mortgage loans underlying GNMA certificates are partially or fully guaranteed by the Federal Housing Administration or the Veterans Administration, while the mortgage loans underlying FNMA certificates and FHLMC certificates are conventional mortgage loans which are, in some cases, insured by private mortgage insurance companies. Agency Pass-Through Certificates may be issued in a single class with respect to a given pool of mortgage loans or in multiple classes.
The residential mortgage loans evidenced by Agency Pass-Through Certificates generally are secured by first mortgages on one- to four-family residential dwellings. Such mortgage loans generally have final maturities ranging from 15 to 40 years and generally provide for monthly payments in amounts sufficient to amortize their original principal amounts by the maturity dates. Each monthly payment on such mortgage loans generally includes both an interest component and a principal component, so that the holder of the mortgage loans receives both interest and a partial return of principal in each monthly payment. In general, such mortgage loans can be prepaid by the borrowers at any time without any prepayment penalty. In addition, many such mortgage loans contain a “due-on-sale” clause requiring the loans to be repaid in full upon the sale of the property securing the loans. Because residential mortgage loans generally provide for monthly amortization and may be prepaid in full at any time, the weighted average maturity of a pool of residential mortgage loans is likely to be substantially shorter than its stated final maturity date. The rate at which a pool of residential mortgage loans is prepaid may be influenced by many factors and is not predictable with precision.
Corporate Debt Securities
Each Fund, other than Nuveen Tactical Market Opportunities Fund, may invest in corporate debt securities as a non-principal investment strategy. Nuveen Tactical Market Opportunities Fund may invest in instruments that give it exposure to corporate debt securities as a principal investment strategy. Corporate debt securities are fully taxable debt obligations issued by corporations. These securities fund capital improvements, expansions, debt refinancing or acquisitions that require more capital than would ordinarily be available from a single lender. Investors in corporate debt securities lend money to the issuing corporation in exchange for interest payments and repayment of the principal at a set maturity date. Rates on corporate debt securities are set according to prevailing interest rates at the time of the issue, the credit rating of the issuer, the length of the maturity and other terms of the security, such as a call feature. Corporate debt securities are subject to the risk of an issuer’s inability to meet principal and interest payments on the obligations and may also be subject to price volatility due to such factors as market interest rates, market perception of the creditworthiness of the issuer and general market liquidity. In addition, corporate restructurings, such as mergers, leveraged buyouts, takeovers or similar corporate transactions are often financed by an increase in a corporate issuer’s debt securities. As a result of the added debt burden, the credit
S-19
quality and market value of an issuer’s existing debt securities may decline significantly. Except as described below under “– Debt Obligations Rated Less than Investment Grade,” investments in nonconvertible corporate debt securities will be limited to investment-grade securities, defined as securities which are rated at the time of purchase by two of Moody’s, Standard & Poor’s and Fitch not less than Baa, BBB and BBB (or the equivalent short-term ratings), respectively, unless only one of those rating agencies provides a rating, in which case that rating must be at least Baa or BBB, or which are of comparable quality in the judgment of a Sub-Adviser.
Repurchase Agreements
Each of the Funds, other than Nuveen Tactical Market Opportunities Fund, may invest in repurchase agreements as a non-principal investment strategy. Ordinarily, a Fund does not expect its investment in repurchase agreements to exceed 10% of its total assets. However, because a Fund may invest without limit in cash and short-term securities for temporary defensive purposes, there is no limit on a Fund’s ability to invest in repurchase agreements. A repurchase agreement involves the purchase by a Fund of securities with the agreement that after a stated period of time, the original seller will buy back the same securities (“collateral”) at a predetermined price or yield. Repurchase agreements involve certain risks not associated with direct investments in securities. If the original seller defaults on its obligation to repurchase as a result of its bankruptcy or otherwise, the purchasing Fund will seek to sell the collateral, which could involve costs or delays. Although collateral (which may consist of any fixed income security which is an eligible investment for the Fund entering into the repurchase agreement) will at all times be maintained in an amount equal to the repurchase price under the agreement (including accrued interest), a Fund would suffer a loss if the proceeds from the sale of the collateral were less than the agreed-upon repurchase price. A Sub-Adviser will monitor the creditworthiness of the firms with which the Funds enter into repurchase agreements.
The Funds’ custodian will hold the securities underlying any repurchase agreement, or the securities will be part of the Federal Reserve/Treasury Book Entry System. The market value of the collateral underlying the repurchase agreement will be determined on each business day. If at any time the market value of the collateral falls below the repurchase price under the repurchase agreement (including any accrued interest), the appropriate Fund will promptly receive additional collateral (so the total collateral is an amount at least equal to the repurchase price plus accrued interest).
Debt Obligations Rated Less Than Investment Grade
The Funds may invest in, and Nuveen Tactical Market Opportunities Fund may invest in instruments that give it exposure to, both investment grade and non-investment grade debt obligations. Debt obligations rated less than “investment grade” are sometimes referred to as “high yield securities” or “junk bonds.” To be consistent with the ratings methodology used by Barclays, a debt obligation is considered to be rated “investment grade” if two of Moody’s, Standard & Poor’s and Fitch rate the security investment-grade (i.e. at least Baa, BBB and BBB, respectively). If ratings are provided by only two of those rating agencies, the more conservative rating is used to determine whether the security is investment-grade. If only one of those rating agencies provides a rating, that rating is used. Nuveen Dividend Value Fund may invest up to 5% of its total assets in debt obligations without regard to their ratings. Each other Fund may invest in non-investment grade debt obligations rated at least B by two of Standard & Poor’s, Moody’s and Fitch, unless only one of those rating agencies rates the security, in which case that rating must be at least B, or in unrated securities determined to be of comparable quality.
The “equity securities” in which certain Funds may invest include corporate debt obligations which are convertible into common stock (see “—Convertible Securities” above). Nuveen Dividend Value Fund may invest in convertible securities without regard to their ratings, and therefore may hold convertible securities that are rated less than investment grade. Each of the other Funds may invest up to 5% of its net assets in less than investment grade convertible securities.
Yields on non-investment grade debt obligations will fluctuate over time. The prices of such obligations have been found to be less sensitive to interest rate changes than higher rated obligations, but more sensitive to adverse economic changes or individual corporate developments. Also, during an economic downturn or period of rising interest rates, highly leveraged issuers may experience financial stress which could adversely affect their ability to service principal and interest payment obligations, to meet projected business goals, and to obtain additional financing. In
S-20
addition, periods of economic uncertainty and changes can be expected to result in increased volatility of market prices of non-investment grade debt obligations. If the issuer of a security held by a Fund defaulted, the Fund might incur additional expenses to seek recovery.
In addition, the secondary trading market for non-investment grade debt obligations may be less developed than the market for investment grade obligations. This may make it more difficult for a Fund to value and dispose of such obligations. Adverse publicity and investor perceptions, whether or not based on fundamental analysis, may decrease the values and liquidity of non-investment grade obligations, especially in a thin secondary trading market.
Certain risks also are associated with the use of credit ratings as a method for evaluating non-investment grade debt obligations. For example, credit ratings evaluate the safety of principal and interest payments, not the market value risk of such obligations. In addition, credit rating agencies may not timely change credit ratings to reflect current events. Thus, the success of a Fund’s use of non-investment grade debt obligations may be more dependent on a Sub-Adviser’s own credit analysis than is the case with investment grade obligations.
Variable, Floating, and Fixed Rate Debt Obligations
The debt obligations in which the Funds invest or have exposure to as either a principal or non-principal investment strategy may have variable, floating, or fixed interest rates. Variable rate securities provide for periodic adjustments in the interest rate. Floating rate securities are generally offered at an initial interest rate which is at or above prevailing market rates. The interest rate paid on floating rate securities is then reset periodically (commonly every 90 days) to an increment over some predetermined interest rate index. Commonly utilized indices include the three-month Treasury bill rate, the 180-day Treasury bill rate, the one-month or three-month London Interbank Offered Rate (LIBOR), the prime rate of a bank, the commercial paper rates, or the longer-term rates on U.S. Treasury securities. Variable and floating rate securities are relatively long-term instruments that often carry demand features permitting the holder to demand payment of principal at any time or at specified intervals prior to maturity. In order to most effectively use these securities, a Sub-Adviser must correctly assess probable movements in interest rates. If a Sub-Adviser incorrectly forecasts such movements, a Fund could be adversely affected by use of variable and floating rate securities.
Fixed rate securities pay a fixed rate of interest and tend to exhibit more price volatility during times of rising or falling interest rates than securities with variable or floating rates of interest. The value of fixed rate securities will tend to fall when interest rates rise and rise when interest rates fall. The value of variable or floating rate securities, on the other hand, fluctuates much less in response to market interest rate movements than the value of fixed rate securities. This is because variable and floating rate securities behave like short-term instruments in that the rate of interest they pay is subject to periodic adjustments according to a specified formula, usually with reference to some interest rate index or market interest rate. Fixed rate securities with short-term characteristics are not subject to the same price volatility as fixed rate securities without such characteristics. Therefore, they behave more like variable or floating rate securities with respect to price volatility.
Inflation Protected Securities
Nuveen Tactical Market Opportunities Fund may invest in inflation protected securities as a principal investment strategy. Two structures are common. The U.S. Treasury and some other issuers use a structure that accrues inflation into the principal value of the bond. Most other issuers pay out the inflation accruals as part of a semiannual coupon.
Inflation protected securities issued by the U.S. Treasury have maturities of five, ten, twenty or thirty years, although it is possible that securities with other maturities will be issued in the future. The U.S. Treasury securities pay interest on a semi-annual basis, equal to a fixed percentage of the inflation-adjusted principal amount. For example, if the Fund purchased an inflation protected bond with a par value of $1,000 and a 3% real rate of return coupon (payable 1.5% semi-annually), and inflation over the first six months were 1%, the mid-year par value of the bond would be $1,010 and the first semi-annual interest payment would be $15.15 ($1,010 times 1.5%). If inflation during the second half of the year resulted in the whole years’ inflation equaling 3%, the end-of-year par value of the bond would be $1,030 and the second semi-annual interest payment would be $15.45 ($1,030 times 1.5%).
S-21
If the periodic adjustment rate measuring inflation falls, the principal value of U.S. Treasury inflation protected securities will be adjusted downward, and consequently the interest payable on these securities (calculated with respect to a smaller principal amount) will be reduced. Repayment of the original bond principal upon maturity (as adjusted for inflation) is guaranteed in the case of U.S. Treasury inflation protected bonds, even during a period of deflation. However, the current market value of the bonds is not guaranteed, and will fluctuate. Other inflation-protected securities that accrue inflation into their principal value may or may not provide a similar guarantee. If a guarantee of principal is not provided, the adjusted principal value of the bond repaid at maturity may be less than the original principal.
The value of inflation-protected securities is expected to change in response to changes in real interest rates. Real interest rates in turn are tied to the relationship between nominal interest rates and the rate of inflation. Therefore, if inflation were to rise at a faster rate than nominal interest rates, real interest rates might decline, leading to an increase in value of inflation protected securities. In contrast, if nominal interest rates increased at a faster rate than inflation, real interest rates might rise, leading to a decrease in value of inflation-protected securities.
The periodic adjustment of U.S. inflation protected bonds is tied to the Consumer Price Index for Urban Consumers (“CPI-U”), which is calculated monthly by the U.S. Bureau of Labor Statistics. The CPI-U is a measurement of changes in the cost of living, made up of components such as housing, food, transportation and energy. Inflation protected securities issued by a foreign government are generally adjusted to reflect a comparable inflation index, calculated by that government. There can be no assurance that the CPI-U or any foreign inflation index will accurately measure the real rate of inflation in the prices of goods and services. Moreover, there can be no assurance that the rate of inflation in a foreign country will be correlated to the rate of inflation in the United States. If the market perceives that the adjustment mechanism of an inflation-protected security does not accurately adjust for inflation, the value of the security could be adversely affected.
While inflation protected securities are expected to be protected from long-term inflationary trends, short-term increases in inflation may lead to a decline in value. The calculation of the inflation index ratio for inflation protected securities issued by the U.S. Treasury incorporates an approximate three-month lag, which may have an effect on the trading price of the securities, particularly during periods of significant, rapid changes in the inflation index. To the extent that inflation has increased during the three months prior to an interest payment, that interest payment will not be protected from the inflation increase. Further, to the extent that inflation has increased during the final three months of a security’s maturity, the final value of the security will not be protected against that increase, which will negatively impact the value of the security. If interest rates rise due to reasons other than inflation (for example, due to changes in currency exchange rates), investors in inflation-protected securities may not be protected to the extent that the increase is not reflected in the bond’s inflation measure.
Any increase in the principal amount of an inflation-protected security will be considered taxable income to the Fund, even though the Fund does not receive its principal until maturity.
Sovereign Debt Obligations
Nuveen Tactical Market Opportunities Fund may invest in instruments that give it exposure to sovereign debt obligations and may invest in foreign government obligations that have an investment grade rating from at least one rating agency. Investments in sovereign debt obligations involve special risks which are not present in corporate debt securities. The foreign issuer of the sovereign debt or the foreign governmental authorities that control the repayment of the debt may be unable or unwilling to repay principal or interest when due, and there may be limited recourse in the event of a default. During periods of economic uncertainty, the market prices of sovereign debt, and the net asset value of the Fund, to the extent it invests in such securities, may be more volatile than prices of U.S. debt issuers. In the past, certain foreign countries have encountered difficulties in servicing their debt obligations, withheld payments of principal and interest and declared moratoria on the payment of principal and interest on their sovereign debt.
A sovereign debtor’s willingness or ability to repay principal and pay interest in a timely manner may be affected by, among other factors, its cash flow situation, the extent of its foreign currency reserves, the availability of sufficient foreign exchange, the relative size of the debt service burden,
S-22
the sovereign debtor’s policy toward principal international lenders and local political constraints. Sovereign debtors may also be dependent on expected disbursements from foreign governments, multilateral agencies and other entities to reduce principal and interest arrearages on their debt. The failure of a sovereign debtor to implement economic reforms, achieve specified levels of economic performance or repay principal or interest when due may result in the cancellation of third party commitments to lend funds to the sovereign debtor, which may further impair such debtor’s ability or willingness to service its debts.
Foreign Securities
General. Under normal market conditions, Nuveen International Fund and Nuveen International Select Fund invest principally in foreign securities, Nuveen Tactical Market Opportunities Fund may have exposure to foreign securities as a principal investment strategy, and the other Funds (other than Nuveen Quantitative Enhanced Core Equity Fund and the Index Funds) each may invest up to 25% of its total assets in foreign securities. To the extent described above under “– Derivatives – Forward Currency Contracts and Other Foreign Currency Transactions,” the Funds’ investments in foreign securities may include investments in securities which are purchased and sold in foreign currencies. Foreign securities may include debt securities of governmental and corporate issuers, preferred stock, common stock, and convertible securities of corporate issuers, rights and warrants to buy common stocks, depositary receipts evidencing ownership of shares of a foreign issuer, and exchange traded funds and other investment companies that provide exposure to foreign issuers.
Investment in foreign securities is subject to special investment risks that differ in some respects from those related to investments in securities of U.S. domestic issuers. These risks include political, social or economic instability in the country of the issuer, the difficulty of predicting international trade patterns, the possibility of the imposition of exchange controls, expropriation, limits on removal of currency or other assets, nationalization of assets, foreign withholding and income taxation, and foreign trading practices (including higher trading commissions, custodial charges and delayed settlements). Foreign securities also may be subject to greater fluctuations in price than securities issued by U.S. corporations. The principal markets on which these securities trade may have less volume and liquidity, and may be more volatile, than securities markets in the United States.
In addition, there may be less publicly available information about a foreign company than about a U.S. domiciled company. Foreign companies generally are not subject to uniform accounting, auditing and financial reporting standards comparable to those applicable to U.S. domestic companies. There is also generally less government regulation of securities exchanges, brokers and listed companies abroad than in the United States. Confiscatory taxation or diplomatic developments could also affect investment in those countries. In addition, foreign branches of U.S. banks, foreign banks and foreign issuers may be subject to less stringent reserve requirements and to different accounting, auditing, reporting, and record keeping standards than those applicable to domestic branches of U.S. banks and U.S. domestic issuers.
Emerging Markets. Each Fund, with the exception of Nuveen Quantitative Enhanced Core Equity Fund and the Index Funds, may invest in or have exposure to securities issued by governmental and corporate issuers that are located in emerging market countries as a principal investment strategy. Investments in securities of issuers in emerging market countries may be subject to potentially higher risks than investments in developed countries. These risks include (i) less social, political and economic stability; (ii) the small current size of the markets for such securities and the currently low or nonexistent volume of trading, which may result in a lack of liquidity and in greater price volatility; (iii) certain national policies which may restrict a Fund’s investment opportunities, including restrictions on investment in issuers or industries deemed sensitive to national interests; (iv) foreign taxation; (v) the absence of developed structures governing private or foreign investment or allowing for judicial redress for injury to private property; (vi) the limited development and recent emergence, in certain countries, of a capital market structure or market-oriented economy; and (vii) the possibility that recent favorable economic developments in certain countries may be slowed or reversed by unanticipated political or social events in such countries.
Despite the dissolution of the Soviet Union, the Communist Party may continue to exercise a significant role in certain (particularly Eastern European) countries. To the extent of the Communist
S-23
Party’s influence, investments in such countries will involve risks of nationalization, expropriation and confiscatory taxation. The communist governments of a number of such countries expropriated large amounts of private property in the past, in many cases without adequate compensation, and there can be no assurance that such expropriation will not occur in the future. In the event of such expropriation, a Fund could lose a substantial portion of any investments it has made in the affected countries. Further, no accounting standards exist in many developing countries. Finally, even though certain currencies may be convertible into U.S. dollars, the conversion rates may be artificial to the actual market values and may be adverse to Fund shareholders.
Certain countries, which do not have market economies, are characterized by an absence of developed legal structures governing private and foreign investments and private property. Certain countries require governmental approval prior to investments by foreign persons, or limit the amount of investment by foreign persons in a particular company, or limit the investment of foreign persons to only a specific class of securities of a company that may have less advantageous terms than securities of the company available for purchase by nationals.
Authoritarian governments in certain countries may require that a governmental or quasi-governmental authority act as custodian of the Funds’ assets invested in such country. To the extent such governmental or quasi-governmental authorities do not satisfy the requirements of the 1940 Act to act as foreign custodians of the Funds’ cash and securities, the Funds’ investment in such countries may be limited or may be required to be effected through intermediaries. The risk of loss through governmental confiscation may be increased in such countries.
Depositary Receipts. The Funds’, other than Nuveen Tactical Market Opportunities Fund’s, investments in foreign securities may include investment in depositary receipts, including American Depositary Receipts (ADRs), European Depositary Receipts (EDRs), and Global Depositary Receipts (GDRs). U.S. dollar-denominated ADRs, which are traded in the United States on exchanges or over-the-counter, are issued by domestic banks. ADRs represent the right to receive securities of foreign issuers deposited in a domestic bank or a correspondent bank. ADRs do not eliminate all the risk inherent in investing in the securities of foreign issuers. However, by investing in ADRs rather than directly in foreign issuers’ stock, a Fund can avoid currency risks during the settlement period for either purchases or sales. In general, there is a large, liquid market in the United States for many ADRs. The information available for ADRs is subject to the accounting, auditing and financial reporting standards of the domestic market or exchange on which they are traded, which standards are more uniform and more exacting than those to which many foreign issuers may be subject. The Funds also may invest in EDRs, GDRs, and in other similar instruments representing securities of foreign companies. EDRs and GDRs are securities that are typically issued by foreign banks or foreign trust companies, although U.S. banks or U.S. trust companies may issue them. EDRs and GDRs are structured similarly to the arrangements of ADRs. EDRs, in bearer form, are designed for use in European securities markets and are not necessarily denominated in the currency of the underlying security.
Certain depositary receipts, typically those denominated as unsponsored, require the holders thereof to bear most of the costs of the facilities while issuers of sponsored facilities normally pay more of the costs thereof. The depository of an unsponsored facility frequently is under no obligation to distribute shareholder communications received from the issuer of the deposited securities or to pass through the voting rights to facility holders in respect to the deposited securities, whereas the depository of a sponsored facility typically distributes shareholder communications and passes through voting rights.
Foreign Securities Exchanges. Fixed commissions on foreign securities exchanges are generally higher than negotiated commissions on U.S. exchanges. Foreign markets also have different clearance and settlement procedures, and in some markets there have been times when settlements have been unable to keep pace with the volume of securities transactions, making it difficult to conduct such transactions. Delays in settlement could result in temporary periods when a portion of the assets of a Fund is uninvested. In addition, settlement problems could cause a Fund to miss attractive investment opportunities or to incur losses due to an inability to sell or deliver securities in a timely fashion. In the event of a default by an issuer of foreign securities, it may be more difficult for a Fund to obtain or to enforce a judgment against the issuer.
S-24
Index Participations and Index Participation Contracts
The Index Funds may invest in index participations and index participation contracts as a non-principal investment strategy. Index participations and index participation contracts provide the equivalent of a position in the securities comprising an index, with each security’s representation equaling its index weighting. Moreover, their holders are entitled to payments equal to the dividends paid by the underlying index securities. Generally, the value of an index participation or index participation contract will rise and fall along with the value of the related index.
Lending of Portfolio Securities
In order to generate additional income, as a non-principal investment strategy each of the Funds, other than Nuveen Tactical Market Opportunities Fund, may lend portfolio securities representing up to one-third of the value of its total assets to broker-dealers, banks or other institutional borrowers of securities. As with other extensions of credit, there may be risks of delay in recovery of the securities or even loss of rights in the collateral should the borrower of the securities fail financially. However, the Funds will only enter into domestic loan arrangements with broker-dealers, banks, or other institutions which a Sub-Adviser has determined are creditworthy under guidelines established by the Board of Directors. The Funds will pay a portion of the income earned on the lending transaction to the placing broker and may pay administrative and custodial fees in connection with these loans.
In these loan arrangements, the Funds will receive collateral in the form of cash, U.S. government securities or other high-grade debt obligations equal to at least 102% of the value of the securities loaned as determined at the time of loan origination. This collateral must be valued daily by a Sub-Adviser or the applicable Fund’s lending agent and, if the market value of the loaned securities increases, the borrower must furnish additional collateral to the lending Fund. During the time portfolio securities are on loan, the borrower pays the lending Fund any dividends or interest paid on the securities. Loans are subject to termination at any time by the lending Fund or the borrower. While a Fund does not have the right to vote securities on loan, it would terminate the loan and regain the right to vote if that were considered important with respect to the investment.
When a Fund lends portfolio securities to a borrower, payments in lieu of dividends made by the borrower to the Fund will not constitute “qualified dividends” taxable at the same rate as long-term capital gains, even if the actual dividends would have constituted qualified dividends had the Fund held the securities. See “Taxation.”
Money Market Funds
Nuveen Tactical Market Opportunities Fund may invest, to the extent permitted by the 1940 Act, in securities issued by money market funds as a principal investment strategy. As a shareholder of another investment company, the Fund would bear, along with other shareholders, its pro rata portion of that company’s expenses, including advisory fees. These expenses would be in addition to the advisory and other expenses that the Fund bears directly in connection with its own operations. Investment companies in which the Fund may invest may also impose a sales or distribution charge in connection with the purchase or redemption of their shares and other types of commissions or charges. Such charges will be payable by the Fund and, therefore, will be borne indirectly by their shareholders.
Other Investment Companies
Each Fund may invest in other investment companies, such as mutual funds, closed-end funds, and exchange-traded funds (“ETFs”). Nuveen International Fund, Nuveen International Select Fund, Nuveen Quantitative Enhanced Core Equity Fund and Nuveen Tactical Market Opportunities Fund may do so as a principal investment strategy. Under the 1940 Act, a Fund’s investment in such securities, subject to certain exceptions, currently is limited to 3% of the total voting stock of any one investment company; 5% of the Fund’s total assets with respect to any one investment company; and 10% of a Fund’s total assets in the aggregate. As described in the Funds’ Prospectus, Nuveen Tactical Market Opportunities Fund intends to rely on exemptive orders in order to invest in unaffiliated ETFs beyond the foregoing statutory limitations. A Fund’s investments in other investment companies may include money market mutual funds. Investments in money market funds are not subject to the percentage limitations set forth above.
S-25
If a Fund invests in other investment companies, Fund shareholders will bear not only their proportionate share of the Fund’s expenses, but also, indirectly, the similar expenses of the underlying investment companies. Shareholders would also be exposed to the risks associated not only to the Fund, but also to the portfolio investments of the underlying investment companies. Shares of certain closed-end funds may at times be acquired only at market prices representing premiums to their net asset values. Shares acquired at a premium to their net asset value may be more likely to subsequently decline in price, resulting in a loss to the Fund and its shareholders. The underlying securities in an ETF may not follow the price movements of the industry or sector the ETF is designed to track. Trading in an ETF may be halted if the trading in one or more of the ETF’s underlying securities is halted, which could result in the ETF being more volatile.
Preferred Stock
Nuveen Dividend Value Fund, Nuveen International Fund, and Nuveen International Select Fund may invest in preferred stock as a principal investment strategy. Each other Fund, other than Nuveen Tactical Market Opportunities Fund, may invest in preferred stock as a non-principal investment strategy. Preferred stock, unlike common stock, offers a stated dividend rate payable from the issuer’s earnings. Preferred stock dividends may be cumulative or non-cumulative, participating, or auction rate. If interest rates rise, the fixed dividend on preferred stocks may be less attractive, causing the price of preferred stocks to decline. Preferred stock may have mandatory sinking fund provisions, as well as call/redemption provisions prior to maturity, a negative feature when interest rates decline. Except as described above under “– Fixed Income Securities – Debt Obligations Rated Less than Investment Grade,” investments in nonconvertible preferred stock will be limited to investment-grade securities, defined as securities which are rated at the time of purchase by two of Moody’s, Standard & Poor’s and Fitch not less than Baa, BBB and BBB (or the equivalent short-term ratings), respectively, unless only one of those rating agencies provides a rating, in which case that rating must be at least Baa or BBB, or which are of comparable quality in the judgment of a Sub-Adviser.
Real Estate Investment Trust (“REIT”) Securities
Each Fund, other than Nuveen Tactical Market Opportunities Fund, may invest in securities of real estate investment trusts as a non-principal investment strategy. REITs are publicly traded corporations or trusts that specialize in acquiring, holding, and managing residential, commercial or industrial real estate. A REIT is not taxed at the entity level on income distributed to its shareholders or unitholders if it distributes to shareholders or unitholders at least 90% of its taxable income for each taxable year and complies with regulatory requirements relating to its organization, ownership, assets and income.
REITs generally can be classified as Equity REITs, Mortgage REITs and Hybrid REITs. An Equity REIT invests the majority of its assets directly in real property and derives its income primarily from rents and from capital gains on real estate appreciation which are realized through property sales. A Mortgage REIT invests the majority of its assets in real estate mortgage loans and services its income primarily from interest payments. A Hybrid REIT combines the characteristics of an Equity REIT and a Mortgage REIT.
The real estate industry has been subject to substantial fluctuations and declines on a local, regional and national basis in the past and may continue to be in the future. Real property values and income from real property may decline due to general and local economic conditions, overbuilding and increased competition, increases in property taxes and operating expenses, changes in zoning laws, casualty or condemnation losses, regulatory limitations on rents, changes in neighborhoods and in demographics, increases in market interest rates, or other factors. Factors such as these may adversely affect companies which own and operate real estate directly, companies which lend to such companies, and companies which service the real estate industry.
Equity REITs will be affected by changes in the values of and income from the properties they own, while Mortgage REITs may be affected by the credit quality of the mortgage loans they hold. In addition, REITs are dependent on specialized management skills and on their ability to generate cash flow for operating purposes and to make distributions to shareholders or unitholders. REITs may have limited diversification and are subject to risks associated with obtaining financing for real property, as well as to the risk of self-liquidation. REITs also can be adversely affected by their failure to qualify for tax-free pass-through treatment of their income under the Code or their failure to maintain an
S-26
exemption from registration under the 1940 Act. By investing in REITs indirectly through the Funds, a shareholder bears not only a proportionate share of the expenses of the Fund, but also may indirectly bear similar expenses of some of the REITs in which it invests.
Royalty Trusts
Each Fund, other than Nuveen Tactical Market Opportunities Fund, may invest in publicly-traded royalty trusts as a non-principal investment strategy. Royalty trusts are income-oriented equity investments that indirectly, through the ownership of trust units, provide investors (called “unit holders”) with exposure to energy sector assets such as coal, oil and natural gas. Royalty trusts are structured similarly to REITs. A royalty trust generally acquires an interest in natural resource companies or chemical companies and distributes the income it receives to the investors of the royalty trust. A sustained decline in demand for crude oil, natural gas and refined petroleum products could adversely affect income and royalty trust revenues and cash flows. Factors that could lead to a decrease in market demand include a recession or other adverse economic conditions, an increase in the market price of the underlying commodity, higher taxes or other regulatory actions that increase costs, or a shift in consumer demand for such products. A rising interest rate environment could adversely impact the performance of royalty trusts. Rising interest rates could limit the capital appreciation of royalty trusts because of the increased availability of alternative investments at more competitive yields.
Short-Term Temporary Investments
In an attempt to respond to adverse market, economic, political or other conditions, the Funds, other than Nuveen Tactical Market Opportunities Fund, may temporarily invest without limit in a variety of short-term instruments such as rated commercial paper and variable amount master demand notes; U.S. dollar-denominated time and savings deposits (including certificates of deposit); bankers’ acceptances; obligations of the U.S. government or its agencies or instrumentalities; repurchase agreements collateralized by eligible investments of a Fund; securities of other mutual funds that invest primarily in debt obligations with remaining maturities of 13 months or less (which investments also are subject to an advisory fee); and other similar high-quality short-term U.S. dollar-denominated obligations.
The Funds may also invest in Eurodollar certificates of deposit issued by foreign branches of U.S. or foreign banks; Eurodollar time deposits, which are U.S. dollar-denominated deposits in foreign branches of U.S. or foreign banks; and Yankee certificates of deposit, which are U.S. dollar-denominated certificates of deposit issued by U.S. branches of foreign banks and held in the United States. In each instance, these Funds may only invest in bank instruments issued by an institution which has capital, surplus and undivided profits of more than $100 million or the deposits of which are insured by the Bank Insurance Fund or the Savings Association Insurance Fund.
When-Issued and Delayed Delivery Transactions
Each of the Funds, other than the Index Funds and Nuveen Tactical Market Opportunities Fund, may purchase securities on a when-issued or delayed delivery basis as a non-principal investment strategy. When such a transaction is negotiated, the purchase price is fixed at the time the purchase commitment is entered, but delivery of and payment for the securities take place at a later date. A Fund will not accrue income with respect to securities purchased on a when-issued or delayed delivery basis prior to their stated delivery date.
The purchase of securities on a when-issued or delayed delivery basis exposes a Fund to risk because the securities may decrease in value prior to delivery. In addition, a Fund’s purchase of securities on a when-issued or delayed delivery basis while remaining substantially fully invested could increase the amount of the Fund’s total assets that are subject to market risk, resulting in increased sensitivity of net asset value to changes in market prices. A seller’s failure to deliver securities to a Fund could prevent the Fund from realizing a price or yield considered to be advantageous.
When a Fund agrees to purchase securities on a when-issued or delayed delivery basis, the Fund will segregate cash or liquid securities in an amount sufficient to meet the Fund’s purchase commitments. It may be expected that a Fund’s net assets will fluctuate to a greater degree when it sets aside securities to cover such purchase commitments than when it sets aside cash. In addition,
S-27
because a Fund will set aside cash or liquid securities to satisfy its purchase commitments, its liquidity and the ability of a Sub-Adviser to manage it might be affected in the event its commitments to purchase when-issued or delayed delivery securities ever became significant. Under normal market conditions, however, a Fund’s commitments to purchase when-issued or delayed delivery securities will not exceed 25% of the value of its total assets.
Index Disclaimers
Nuveen Equity Index Fund
Nuveen Equity Index Fund is not sponsored, endorsed, sold or promoted by Standard & Poor’s, a division of The McGraw-Hill Companies, Inc. (“S&P”). S&P makes no representation or warranty, express or implied, to the owners of Nuveen Equity Index Fund or any member of the public regarding the advisability of investing in securities generally or in Nuveen Equity Index Fund particularly or the ability of the S&P 500 Index to track general stock market performance. S&P’s only relationship to NIF is the licensing of certain trademarks and trade names of S&P and of the S&P 500 Index which is determined, composed and calculated by S&P without regard to NIF or Nuveen Equity Index Fund. S&P has no obligation to take the needs of NIF or the owners of Nuveen Equity Index Fund into consideration in determining, composing or calculating the S&P 500 Index. S&P is not responsible for and has not participated in the determination of the prices and amount of Nuveen Equity Index Fund or the timing of the issuance or sale of Nuveen Equity Index Fund or in the determination or calculation of the equation by which Nuveen Equity Index Fund is to be converted into cash. S&P has no obligation or liability in connection with the administration, marketing or trading of Nuveen Equity Index Fund.
S&P DOES NOT GUARANTEE THE ACCURACY AND/OR THE COMPLETENESS OF THE S&P 500 INDEX OR ANY DATA INCLUDED THEREIN AND S&P SHALL HAVE NO LIABILITY FOR ANY ERRORS, OMISSIONS, OR INTERRUPTIONS THEREIN. S&P MAKES NO WARRANTY, EXPRESS OR IMPLIED, AS TO RESULTS TO BE OBTAINED BY NIF, OWNERS OF NUVEEN EQUITY INDEX FUND OR ANY OTHER PERSON OR ENTITY FROM THE USE OF THE S&P 500 INDEX OR ANY DATA INCLUDED THEREIN. S&P MAKES NO EXPRESS OR IMPLIED WARRANTIES, AND EXPRESSLY DISCLAIMS ALL WARRANTIES OF MERCHANTABILITY OR FITNESS FOR A PARTICULAR PURPOSE OR USE WITH RESPECT TO THE S&P 500 INDEX OR ANY DATA INCLUDED THEREIN. WITHOUT LIMITING ANY OF THE FOREGOING, IN NO EVENT SHALL S&P HAVE ANY LIABILITY FOR ANY SPECIAL, PUNITIVE, INDIRECT, OR CONSEQUENTIAL DAMAGES (INCLUDING LOST PROFITS), EVEN IF NOTIFIED OF THE POSSIBILITY OF SUCH DAMAGES.
Nuveen Mid Cap Index Fund
Nuveen Mid Cap Index Fund is not sponsored, endorsed, sold or promoted by Standard & Poor’s, a division of The McGraw-Hill Companies, Inc. (“S&P”). S&P makes no representation or warranty, express or implied, to the owners of Nuveen Mid Cap Index Fund or any member of the public regarding the advisability of investing in securities generally or in Nuveen Mid Cap Index Fund particularly or the ability of the S&P MidCap 400 Index to track general stock market performance. S&P’s only relationship to NIF is the licensing of certain trademarks and trade names of S&P and of the S&P MidCap 400 Index which is determined, composed and calculated by S&P without regard to NIF or Nuveen Mid Cap Index Fund. S&P has no obligation to take the needs of NIF or the owners of Nuveen Mid Cap Index Fund into consideration in determining, composing or calculating the S&P MidCap 400 Index. S&P is not responsible for and has not participated in the determination of the prices and amount of Nuveen Mid Cap Index Fund or the timing of the issuance or sale of Nuveen Mid Cap Index Fund or in the determination or calculation of the equation by which Nuveen Mid Cap Index Fund is to be converted into cash. S&P has no obligation or liability in connection with the administration, marketing or trading of Nuveen Mid Cap Index Fund.
S&P DOES NOT GUARANTEE THE ACCURACY AND/OR THE COMPLETENESS OF THE S&P MidCap 400 INDEX OR ANY DATA INCLUDED THEREIN AND S&P SHALL HAVE NO LIABILITY FOR ANY ERRORS, OMISSIONS, OR INTERRUPTIONS THEREIN. S&P MAKES NO WARRANTY, EXPRESS OR IMPLIED, AS TO RESULTS TO BE OBTAINED BY NIF, OWNERS OF NUVEEN MID CAP INDEX FUND, OR ANY OTHER PERSON OR ENTITY FROM THE USE OF THE S&P MidCap 400 INDEX OR ANY DATA INCLUDED THEREIN. S&P MAKES NO EXPRESS OR IMPLIED WARRANTIES, AND
S-28
EXPRESSLY DISCLAIMS ALL WARRANTIES OF MERCHANTABILITY OR FITNESS FOR A PARTICULAR PURPOSE OR USE WITH RESPECT TO THE S&P MidCap 400 INDEX OR ANY DATA INCLUDED THEREIN. WITHOUT LIMITING ANY OF THE FORGOING, IN NO EVENT SHALL S&P HAVE ANY LIABILITY FOR ANY SPECIAL, PUNITIVE, INDIRECT, OR CONSEQUENTIAL DAMAGES (INCLUDING LOST PROFITS), EVEN IF NOTIFIED OF THE POSSIBILITY OF SUCH DAMAGES.
Nuveen Small Cap Index Fund
Frank Russell Company reserves the right, at any time and without notice, to alter, amend, terminate or in any way change the Russell Indexes. Frank Russell Company has no obligation to take the needs of any particular fund or its participants or any other product or person into consideration in determining, composing or calculating any of the Russell Indexes.
Frank Russell Company’s publication of the Russell Indexes in no way suggests or implies an opinion by Frank Russell Company as to the attractiveness or appropriateness of investment in any or all securities upon which the Russell Indexes are based. FRANK RUSSELL COMPANY MAKES NO REPRESENTATION, WARRANTY, OR GUARANTEE AS TO THE ACCURACY, COMPLETENESS, RELIABILITY, OR OTHERWISE OF THE RUSSELL INDEXES OR ANY DATA INCLUDED IN THE RUSSELL INDEXES. FRANK RUSSELL COMPANY MAKES NO REPRESENTATION, WARRANTY OR GUARANTEE REGARDING THE USE, OR THE RESULTS OF USE, OF THE RUSSELL INDEXES OR ANY DATA INCLUDED THEREIN, OR ANY SECURITY (OR COMBINATION THEREOF) COMPRISING THE RUSSELL INDEXES. FRANK RUSSELL COMPANY MAKES NO OTHER EXPRESS OR IMPLIED WARRANTY, AND EXPRESSLY DISCLAIMS ANY WARRANTY, OF ANY KIND, INCLUDING WITHOUT LIMITATION, ANY WARRANTY OF MERCHANTABILITY OR FITNESS FOR A PARTICULAR PURPOSE WITH RESPECT TO THE RUSSELL INDEX(ES) OR ANY DATA OR ANY SECURITY (OR COMBINATION THEREOF) INCLUDED THEREIN.
S-29
MANAGEMENT
The management of NIF, including general supervision of the duties performed for the Funds by Nuveen Fund Advisors, Inc. (“Nuveen Fund Advisors” or the “Adviser”) under the Management Agreement, is the responsibility of the Board of Directors. The number of directors of NIF is ten, one of whom is an “interested person” (as the term “interested person” is defined in the 1940 Act) and nine of whom are not interested persons (referred to herein as “independent directors”). None of the independent directors has ever been a trustee, director or employee of, or consultant to, the Adviser or its affiliates. The names, business addresses and birthdates of the directors and officers of the Funds, their principal occupations and other affiliations during the past five years, the number of portfolios each oversees and other directorships they hold are set forth below. The directors of NIF are directors or trustees, as the case may be, of 105 Nuveen-sponsored open-end funds (the “Nuveen Mutual Funds”) and 133 Nuveen-sponsored closed-end funds (collectively with the Nuveen Mutual Funds, the “Nuveen Funds”).
| | | | | | | | | | |
Name, Business Address
and Birthdate | | Position(s)
Held with
NIF | | Term of Office
and Length of
Time Served with
NIF | | Principal Occupation(s)
During Past Five Years | | Number of
Portfolios
in Fund
Complex
Overseen by
Director | | Other
Directorships
Held by
Director
During Past
Five Years |
| | |
Independent Directors: | | | | |
| | | | | |
Robert P. Bremner* 333 West Wacker Drive Chicago, IL 60606 (8/22/40) | | Chairman of the Board and Director | | Term—Indefinite** Length of Service—
Since 2011 | | Private Investor and Management Consultant; Treasurer and Director, Humanities Council of Washington, D.C.; Board Member, Independent Directors Council affiliated with the Investment Company Institute. | | 238 | | N/A |
| | | | | |
Jack B. Evans 333 West Wacker Drive Chicago, IL 60606 (10/22/48) | | Director | | Term—Indefinite** Length of Service—
Since 2011 | | President, The Hall-Perrine Foundation, a private philanthropic corporation (since 1996); Member, Board of Regents for the State of Iowa University System; Director, Source Media Group; Life Trustee of Coe College and the Iowa College Foundation; formerly, Director, Federal Reserve Bank of Chicago; formerly, President and Chief Operating Officer, SCI Financial Group, Inc., a regional financial services firm. | | 238 | | Director and Chairman, United Fire Group, a publicly held company; formerly, Director, Alliant Energy. |
S-30
| | | | | | | | | | |
Name, Business Address
and Birthdate | | Position(s)
Held with
NIF | | Term of Office
and Length of
Time Served with
NIF | | Principal Occupation(s)
During Past Five Years | | Number of
Portfolios
in Fund
Complex
Overseen by
Director | | Other
Directorships
Held by
Director
During Past
Five Years |
| | | | | |
William C. Hunter 333 West Wacker Drive Chicago, IL 60606 (3/6/48) | | Director | | Term—Indefinite** Length of Service—
Since 2011 | | Dean (since 2006), Tippie College of Business, University of Iowa; Director (since 2005), Beta Gamma Sigma International Honor Society; Director of Wellmark, Inc. (since 2009); formerly, Director (1997-2007), Credit Research Center at Georgetown University; formerly, Dean and Distinguished Professor of Finance, School of Business at the University of Connecticut (2003-2006); previously, Senior Vice President and Director of Research at the Federal Reserve Bank of Chicago (1995-2003). | | 238 | | Director (since 2004) of Xerox Corporation. |
| | | | | |
David J. Kundert* 333 West Wacker Drive Chicago, IL 60606 (10/28/42) | | Director | | Term—Indefinite** Length of Service—
Since 2011 | | Director, Northwestern Mutual Wealth Management Company; retired (since 2004) as Chairman, JPMorgan Fleming Asset Management, President and CEO, Banc One Investment Advisors Corporation, and President, One Group Mutual Funds; prior thereto, Executive Vice President, Bank One Corporation and Chairman and CEO, Banc One Investment Management Group; Member, Board of Regents, Luther College; Member of the Wisconsin Bar Association; Member of Board of Directors, Friends of Boerner Botanical Gardens; Member of Board of Directors and Chair of Investment Committee, Greater Milwaukee Foundation. | | 238 | | N/A |
S-31
| | | | | | | | | | |
Name, Business Address
and Birthdate | | Position(s)
Held with
NIF | | Term of Office
and Length of
Time Served with
NIF | | Principal Occupation(s)
During Past Five Years | | Number of
Portfolios
in Fund
Complex
Overseen by
Director | | Other
Directorships
Held by
Director
During Past
Five Years |
| | | | | |
William J. Schneider* 333 West Wacker Drive Chicago, IL 60606 (9/24/44) | | Director | | Term—Indefinite** Length of Service—
Since 2011 | | Chairman of Miller-Valentine Partners Ltd., a real estate investment company; Member, Mid-America Health System Board; Member, University of Dayton Business School Advisory Council; formerly, Senior Partner and Chief Operating Officer (retired, 2004) of Miller-Valentine Group; formerly, Member, Dayton Philharmonic Orchestra Association; formerly, Director, Dayton Development Coalition; formerly, Member, Business Advisory Council, Cleveland Federal Reserve Bank. | | 238 | | N/A |
| | | | | |
Judith M. Stockdale 333 West Wacker Drive Chicago, IL 60606 (12/29/47) | | Director | | Term—Indefinite** Length of Service—
Since 2011 | | Executive Director, Gaylord and Dorothy Donnelley Foundation (since 1994); prior thereto, Executive Director, Great Lakes Protection Fund (1990-1994). | | 238 | | N/A |
| | | | | |
Carole E. Stone* 333 West Wacker Drive Chicago, IL 60606 (6/28/47) | | Director | | Term—Indefinite** Length of Service—
Since 2011 | | Director, C2 Options Exchange, Incorporated (since 2009); formerly, Commissioner, New York State Commission on Public Authority Reform (2005-2010); formerly, Chair, New York Racing Association Oversight Board (2005-2007). | | 238 | | Director, Chicago Board Options Exchange (since 2006). |
| | | | | |
Virginia L. Stringer 333 West Wacker Drive Chicago, IL 60606 (8/16/44) | | Director | | Term—Indefinite** Length of Service—
Since 1987 | | Board Member, Mutual Fund Directors Forum; Member, Governing Board, Investment Company Institute’s Independent Directors Council; Governance consultant and non-profit board member; former Owner and President, Strategic Management Resources, Inc., a management consulting firm; previously, held several executive positions in general management, marketing and human resources at IBM and The Pillsbury Company. | | 238 | | Previously, Independent Director (1987-2010) and Chair (1997-2010), First American Fund Complex. |
S-32
| | | | | | | | | | |
Name, Business Address
and Birthdate | | Position(s)
Held with
NIF | | Term of Office
and Length of
Time Served with
NIF | | Principal Occupation(s)
During Past Five Years | | Number of
Portfolios
in Fund
Complex
Overseen by
Director | | Other
Directorships
Held by
Director
During Past
Five Years |
| | | | | |
Terence J. Toth* 333 West Wacker Drive Chicago, IL 60606 (9/29/59) | | Director | | Term—Indefinite** Length of Service—
Since 2011 | | Director, Legal & General Investment Management America, Inc. (since 2008); Managing Partner, Promus Capital (since 2008); formerly, CEO and President, Northern Trust Global Investments (2004-2007); Executive Vice President, Quantitative Management & Securities Lending (2000-2004); prior thereto, various positions with Northern Trust Company (since 1994); Member, Goodman Theatre Board (since 2004), Chicago Fellowship Board (since 2005) and Catalyst Schools of Chicago Board (since 2008); formerly, Member, Northern Trust Mutual Funds Board (2005-2007), Northern Trust Global Investments Board (2004-2007), Northern Trust Japan Board (2004-2007), Northern Trust Securities Inc. Board (2003-2007) and Northern Trust Hong Kong Board (1997-2004). | | 238 | | N/A |
| | | | | |
Interested Director: | | | | | | | | | | |
| | | | | |
John P. Amboian*** 333 West Wacker Drive Chicago, IL 60606 (6/14/61) | | Director | | Term—Indefinite** Length of Service—
Since 2011 | | Chief Executive Officer and Chairman (since 2007) and Director (since 1999) of Nuveen Investments, Inc.; formerly, President (1999-2007); Chief Executive Officer (since 2007) of Nuveen Investments Advisers Inc.; Director (since 1998), formerly, Chief Executive Officer (2007-2010) of Nuveen Fund Advisors, Inc. | | 238 | | N/A |
| * | | Also serves as a trustee of Nuveen Diversified Commodity Fund, an exchange-traded commodity pool managed by Nuveen Commodities Asset Management, LLC, an affiliate of the Adviser. |
| ** | | Each director serves an indefinite term until his or her successor is elected. |
| *** | | Mr. Amboian is an “interested person” of NIF, as defined in the 1940 Act, by reason of his positions with Nuveen Investments, Inc. (“Nuveen Investments”) and certain of its subsidiaries. |
S-33
| | | | | | | | |
Name, Business Address and Birthdate | | Position(s) Held
with NIF | | Term of
Office and
Length of
Time Served
with NIF | | Principal Occupation(s)
During Past Five Years | | Number of
Portfolios
in Fund
Complex
Overseen by
Officer |
| | | |
Officers of NIF: | | | | | | |
| | | | |
Gifford R. Zimmerman 333 West Wacker Drive Chicago, IL 60606
(9/9/56) | | Chief Administrative Officer | | Term—Until August 2012 Length of Service—Since 2011 | | Managing Director (since 2002), Assistant Secretary and Associate General Counsel of Nuveen Securities, LLC; Managing Director (since 2002), Assistant Secretary (since 1997) and Co-General Counsel (since 2011) of Nuveen Fund Advisors, Inc.; Managing Director, Assistant Secretary and Associate General Counsel of Nuveen Asset Management, LLC (since 2011); Managing Director (since 2004) and Assistant Secretary (since 1994) of Nuveen Investments, Inc.; Vice President and Assistant Secretary of NWQ Investment Management Company, LLC (since 2002); Vice President and Assistant Secretary of Nuveen Investments Advisers Inc. (since 2002); Managing Director, Associate General Counsel and Assistant Secretary of Symphony Asset Management LLC (since 2003); Vice President and Assistant Secretary of Santa Barbara Asset Management, LLC (since 2006), Nuveen HydePark Group, LLC and Nuveen Investment Solutions, Inc. (since 2007), and Winslow Capital Management, Inc. (since 2010); Chief Administrative Officer and Chief Compliance Officer (since 2006) of Nuveen Commodities Asset Management, LLC; Chartered Financial Analyst. | | 238 |
| | | | |
Margo L. Cook 333 West Wacker Drive Chicago, IL 60606 (4/11/64) | | Vice President | | Term—Until August 2012 Length of Service—Since 2011 | | Executive Vice President (since 2008) of Nuveen Investments, Inc. and Nuveen Fund Advisors, Inc. (since 2011); Managing Director—Investment Services of Nuveen Commodities Asset Management, LLC (since August 2011); previously, Head of Institutional Asset Management (2007-2008) of Bear Stearns Asset Management; Head of Institutional Asset Management (1986-2007) of Bank of NY Mellon; Chartered Financial Analyst. | | 238 |
| | | | |
Lorna C. Ferguson 333 West Wacker Drive Chicago, IL 60606 (10/24/45) | | Vice President | | Term—Until August 2012 Length of Service—Since 2011 | | Managing Director (since 2004) of Nuveen Securities, LLC; Managing Director (since 2005) of Nuveen Fund Advisors, Inc. | | 238 |
| | | | |
Stephen D. Foy 333 West Wacker Drive Chicago, IL 60606 (5/31/54) | | Vice President and Controller | | Term—Until August 2012 Length of Service—Since 2011 | | Senior Vice President (since 2010), formerly, Vice President (2004-2010) and Funds Controller of Nuveen Securities, LLC; Vice President of Nuveen Fund Advisors, Inc. (since 2005); Chief Financial Officer (since 2010) of Nuveen Commodities Asset Management, LLC; Certified Public Accountant. | | 238 |
S-34
| | | | | | | | |
Name, Business Address and Birthdate | | Position(s)
Held with
NIF | | Term of Office
and Length of
Time Served with
NIF | | Principal Occupation(s)
During Past Five Years | | Number of
Portfolios
in Fund
Complex
Overseen by
Officer |
| | | | |
Scott S. Grace 333 West Wacker Drive Chicago, IL 60606 (8/20/70) | | Vice President and Treasurer | | Term—Until August 2012 Length of Service—Since 2011 | | Managing Director, Corporate Finance & Development, Treasurer (since 2009) of Nuveen Securities, LLC; Managing Director and Treasurer (since 2009) of Nuveen Investment Solutions, Inc., Nuveen Investments Advisers Inc., Nuveen Investments Holdings, Inc., Nuveen Fund Advisors, Inc. and (since 2011) Nuveen Asset Management, LLC; Vice President and Treasurer of NWQ Investment Management Company, LLC, Tradewinds Global Investors, LLC, Symphony Asset Management LLC and Winslow Capital Management, Inc.; Vice President of Santa Barbara Asset Management, LLC; formerly, Treasurer (2006-2009), Senior Vice President (2008-2009), previously, Vice President (2006-2008) of Janus Capital Group, Inc.; formerly, Senior Associate in Morgan Stanley’s Global Financial Services Group (2000-2003); Chartered Accountant. | | 238 |
| | | | |
Walter M. Kelly 333 West Wacker Drive Chicago, IL 60606 (2/24/70) | | Vice President and Chief Compliance Officer | | Term—Until August 2012 Length of Service—Since 2011 | | Senior Vice President (since 2008) and Assistant Secretary (since 2003) of Nuveen Fund Advisors, Inc. | | 238 |
| | | | |
Tina M. Lazar 333 West Wacker Drive Chicago, IL 60606 (8/27/61) | | Vice President | | Term—Until August 2012 Length of Service—Since 2011 | | Senior Vice President (since 2010), formerly, Vice President (2005-2010) of Nuveen Fund Advisors, Inc. | | 238 |
| | | | |
Kevin J. McCarthy 333 West Wacker Drive Chicago, IL 60606 (3/26/66) | | Vice President and Secretary | | Term—Until August 2012 Length of Service—Since 2011 | | Managing Director (since 2008), formerly, Vice President (2007-2008) of Nuveen Securities, LLC; Managing Director (since 2008), Vice President and Assistant Secretary (since 2007) and Co-General Counsel (since 2011) of Nuveen Fund Advisors, Inc.; Managing Director, Assistant Secretary and Associate General Counsel (since 2011) of Nuveen Asset Management, LLC; Vice President and Assistant Secretary of Nuveen Investments Advisers Inc., NWQ Investment Management Company, LLC, NWQ Holdings, LLC, Symphony Asset Management LLC, Santa Barbara Asset Management, LLC, Nuveen HydePark Group, LLC, Nuveen Investment Solutions, Inc. and Winslow Capital Management, Inc. (since 2010); Vice President and Secretary (since 2010) of Nuveen Commodities Asset Management, LLC; prior thereto, Partner, Bell, Boyd & Lloyd LLP (1997-2007). | | 238 |
S-35
| | | | | | | | |
Name, Business Address and Birthdate | | Position(s)
Held with
NIF | | Term of Office
and Length of
Time Served with
NIF | | Principal Occupation(s)
During Past Five Years | | Number of
Portfolios
in Fund
Complex
Overseen by
Officer |
| | | | |
Kathleen L. Prudhomme 901 Marquette Avenue Minneapolis, MN 55402 (3/30/53) | | Vice President and Assistant Secretary | | Term—Until August 2012 Length of Service—Since 2011 | | Managing Director and Assistant Secretary of Nuveen Securities, LLC (since 2011); Managing Director, Assistant Secretary and Co-General Counsel (since 2011) of Nuveen Fund Advisors, Inc.; Managing Director, Assistant Secretary and Associate General Counsel (since 2011) of Nuveen Asset Management, LLC; formerly, Deputy General Counsel, FAF Advisors, Inc. (2004-2010). | | 238 |
| | | | |
Jeffery M. Wilson 333 West Wacker Drive Chicago, IL 60606 (3/13/56) | | Vice President | | Term—Until August 2012 Length of Service—Since 2011 | | Senior Vice President of Nuveen Securities, LLC (since 2011); formerly, Senior Vice President of FAF Advisors, Inc. (2000-2010). | | 105 |
S-36
Board Leadership Structure and Risk Oversight
The Board of Directors (the “Board” or “Board of Directors”) oversees the operations and management of the Funds, including the duties performed for the Funds by the Adviser. The Board has adopted a unitary board structure. A unitary board consists of one group of directors who serve on the board of every fund in the Nuveen Fund complex. In adopting a unitary board structure, the directors seek to provide effective governance through establishing a board, the overall composition of which will, as a body, possess the appropriate skills, independence and experience to oversee the Nuveen Funds’ business. With this overall framework in mind, when the Board, through its Nominating and Governance Committee discussed below, seeks nominees for the Board, the directors consider, not only the candidate’s particular background, skills and experience, among other things, but also whether such background, skills and experience enhance the Board’s diversity and at the same time complement the Board given its current composition and the mix of skills and experiences of the incumbent directors. The Nominating and Governance Committee believes that the Board generally benefits from diversity of background, experience and views among its members, and considers this a factor in evaluating the composition of the Board, but has not adopted any specific policy on diversity or any particular definition of diversity.
The Board believes the unitary board structure enhances good and effective governance, particularly given the nature of the structure of the investment company complex. Funds in the same complex generally are served by the same service providers and personnel and are governed by the same regulatory scheme which raises common issues that must be addressed by the directors across the fund complex (such as compliance, valuation, liquidity, brokerage, trade allocation or risk management). The Board believes it is more efficient to have a single board review and oversee common policies and procedures which increases the Board’s knowledge and expertise with respect to the many aspects of fund operations that are complex-wide in nature. The unitary structure also enhances the Board’s influence and oversight over the investment adviser and other service providers.
In an effort to enhance the independence of the Board, the Board also has a Chairman that is an independent director. The Board recognizes that a chairman can perform an important role in setting the agenda for the Board, establishing the boardroom culture, establishing a point person on behalf of the Board for fund management, and reinforcing the Board’s focus on the long-term interests of shareholders. The Board recognizes that a chairman may be able to better perform these functions without any conflicts of interests arising from a position with fund management. Accordingly, the directors have elected Robert P. Bremner as the independent Chairman of the Board. Specific responsibilities of the Chairman include: (i) presiding at all meetings of the Board and of the shareholders; (ii) seeing that all orders and resolutions of the directors are carried into effect; and (iii) maintaining records of and, whenever necessary, certifying all proceedings of the directors and the shareholders.
Although the Board has direct responsibility over various matters (such as advisory contracts, underwriting contracts and fund performance), the Board also exercises certain of its oversight responsibilities through several committees that it has established and which report back to the full Board. The Board believes that a committee structure is an effective means to permit directors to focus on particular operations or issues affecting the Nuveen Funds, including risk oversight. More specifically, with respect to risk oversight, the Board has delegated matters relating to valuation and compliance to certain committees (as summarized below) as well as certain aspects of investment risk. In addition, the Board believes that the periodic rotation of directors among the different committees allows the directors to gain additional and different perspectives of a Nuveen Fund’s operations. The Board has established five standing committees: the Executive Committee, the Dividend Committee, the Audit Committee, the Compliance, Risk Management and Regulatory Oversight Committee and the Nominating and Governance Committee. The Board may also from time to time create ad hoc committees to focus on particular issues as the need arises. The membership and functions of the standing committees are summarized below.
The Executive Committee, which meets between regular meetings of the Board, is authorized to exercise all of the powers of the Board. The members of the Executive Committee are Robert P. Bremner, Chair, Judith M. Stockdale and John P. Amboian. During the fiscal year ended October 31, 2011, the Executive Committee did not meet.
S-37
The Audit Committee assists the Board in the oversight and monitoring of the accounting and reporting policies, processes and practices of the Nuveen Funds, and the audits of the financial statements of the Nuveen Funds; the quality and integrity of the financial statements of the Nuveen Funds; the Nuveen Funds’ compliance with legal and regulatory requirements relating to the Nuveen Funds’ financial statements; the independent auditors’ qualifications, performance and independence; and the pricing procedures of the Nuveen Funds and the Adviser’s internal valuation group. It is the responsibility of the Audit Committee to select, evaluate and replace any independent auditors (subject only to Board and, if applicable, shareholder ratification) and to determine their compensation. The Audit Committee is also responsible for, among other things, overseeing the valuation of securities comprising the Nuveen Funds’ portfolios. Subject to the Board’s general supervision of such actions, the Audit Committee addresses any valuation issues, oversees the Nuveen Funds’ pricing procedures and actions taken by the Adviser’s internal valuation group which provides regular reports to the committee, reviews any issues relating to the valuation of the Nuveen Funds’ securities brought to its attention and considers the risks to the Nuveen Funds in assessing the possible resolutions to these matters. The Audit Committee may also consider any financial risk exposures for the Nuveen Funds in conjunction with performing its functions.
To fulfill its oversight duties, the Audit Committee receives annual and semi-annual reports and has regular meetings with the external auditors for the Nuveen Funds and the Adviser’s internal audit group. The Audit Committee also may review in a general manner the processes the Board or other Board committees have in place with respect to risk assessment and risk management as well as compliance with legal and regulatory matters relating to the Nuveen Funds’ financial statements. The committee operates under a written charter adopted and approved by the Board. Members of the Audit Committee shall be independent (as set forth in the charter) and free of any relationship that, in the opinion of the directors, would interfere with their exercise of independent judgment as an Audit Committee member. The members of the Audit Committee are Robert P. Bremner, David J. Kundert, Chair, William J. Schneider, Carole E. Stone and Terence J. Toth, each of whom is an independent director of the Nuveen Funds. During the fiscal year ended October 31, 2011, the Audit Committee met four times.
The Nominating and Governance Committee is responsible for seeking, identifying and recommending to the Board qualified candidates for election or appointment to the Board. In addition, the Nominating and Governance Committee oversees matters of corporate governance, including the evaluation of Board performance and processes, the assignment and rotation of committee members, and the establishment of corporate governance guidelines and procedures, to the extent necessary or desirable, and matters related thereto. Although the unitary and committee structure has been developed over the years and the Nominating and Governance Committee believes the structure has provided efficient and effective governance, the committee recognizes that as demands on the Board evolve over time (such as through an increase in the number of funds overseen or an increase in the complexity of the issues raised), the committee must continue to evaluate the Board and committee structures and their processes and modify the foregoing as may be necessary or appropriate to continue to provide effective governance. Accordingly, the Nominating and Governance Committee has a separate meeting each year to, among other things, review the Board and committee structures, their performance and functions, and recommend any modifications thereto or alternative structures or processes that would enhance the Board’s governance of the Nuveen Funds.
In addition, the Nominating and Governance Committee, among other things, makes recommendations concerning the continuing education of directors; monitors performance of legal counsel and other service providers; establishes and monitors a process by which security holders are able to communicate in writing with members of the Board; and periodically reviews and makes recommendations about any appropriate changes to director compensation. In the event of a vacancy on the Board, the Nominating and Governance Committee receives suggestions from various sources, including shareholders, as to suitable candidates. Suggestions should be sent in writing to Lorna Ferguson, Manager of Fund Board Relations, Nuveen Investments, 333 West Wacker Drive, Chicago, IL 60606. The Nominating and Governance Committee sets appropriate standards and requirements for nominations for new directors and reserves the right to interview any and all candidates and to make the final selection of any new directors. In considering a candidate’s qualifications, each candidate must meet certain basic requirements, including relevant skills and experience, time availability (including the time requirements for due diligence site visits to sub-advisers and service
S-38
providers) and, if qualifying as an independent director candidate, independence from the Adviser, sub-advisers, Nuveen Securities, LLC (the “Distributor”) and other service providers, including any affiliates of these entities. These skill and experience requirements may vary depending on the current composition of the Board, since the goal is to ensure an appropriate range of skills, diversity and experience, in the aggregate. Accordingly, the particular factors considered and weight given to these factors will depend on the composition of the Board and the skills and backgrounds of the incumbent directors at the time of consideration of the nominees. All candidates, however, must meet high expectations of personal integrity, independence, governance experience and professional competence. All candidates must be willing to be critical within the Board and with management and yet maintain a collegial and collaborative manner toward other Board members. The committee operates under a written charter adopted and approved by the Board. This committee is composed of the independent directors of the Nuveen Funds. Accordingly, the members of the Nominating and Governance Committee are Robert P. Bremner, Chair, Jack B. Evans, William C. Hunter, David J. Kundert, William J. Schneider, Judith M. Stockdale, Carole E. Stone, Virginia L. Stringer and Terence J. Toth. During the fiscal year ended October 31, 2011, the Nominating and Governance Committee met five times.
The Dividend Committee is authorized to declare distributions on the Nuveen Funds’ shares, including, but not limited to, regular and special dividends, capital gains and ordinary income distributions. The members of the Dividend Committee are Jack B. Evans, Chair, Judith M. Stockdale and Terence J. Toth. During the fiscal year ended October 31, 2011, the Dividend Committee met two times.
The Compliance, Risk Management and Regulatory Oversight Committee (the “Compliance Committee”) is responsible for the oversight of compliance issues, risk management and other regulatory matters affecting the Nuveen Funds that are not otherwise the jurisdiction of the other committees. The Board has adopted and periodically reviews policies and procedures designed to address the Nuveen Funds’ compliance and risk matters. As part of its duties, the Compliance Committee reviews the policies and procedures relating to compliance matters and recommends modifications thereto as necessary or appropriate to the full Board; develops new policies and procedures as new regulatory matters affecting the Nuveen Funds arise from time to time; evaluates or considers any comments or reports from examinations from regulatory authorities and responses thereto; and performs any special reviews, investigations or other oversight responsibilities relating to risk management, compliance and/or regulatory matters as requested by the Board.
In addition, the Compliance Committee is responsible for risk oversight, including, but not limited to, the oversight of risks related to investments and operations. Such risks include, among other things, exposures to particular issuers, market sectors, or types of securities; risks related to product structure elements, such as leverage; and techniques that may be used to address those risks, such as hedging and swaps. In assessing issues brought to the committee’s attention or in reviewing a particular policy, procedure, investment technique or strategy, the Compliance Committee evaluates the risks to the Nuveen Funds in adopting a particular approach compared to the anticipated benefits to the Nuveen Funds and their shareholders. In fulfilling its obligations, the Compliance Committee meets on a quarterly basis, and at least once a year in person. The Compliance Committee receives written and oral reports from the Nuveen Funds’ Chief Compliance Officer (“CCO”) and meets privately with the CCO at each of its quarterly meetings. The CCO also provides an annual report to the full Board regarding the operations of the Nuveen Funds’ and other service providers’ compliance programs as well as any recommendations for modifications thereto. The Compliance Committee also receives reports from the Adviser’s investment services group regarding various investment risks. Notwithstanding the foregoing, the full Board also participates in discussions with management regarding certain matters relating to investment risk, such as the use of leverage and hedging. The investment services group therefore also reports to the full Board at its quarterly meetings regarding, among other things, fund performance and the various drivers of such performance. Accordingly, the Board directly and/or in conjunction with the Compliance Committee oversees matters relating to investment risks. Matters not addressed at the committee level are addressed directly by the full Board. The committee operates under a written charter adopted and approved by the Board. The members of the Compliance Committee are Jack B. Evans, William C. Hunter, William J. Schneider, Judith M. Stockdale, Chair, and Virginia L. Stringer. During the fiscal year ended October 31, 2011, the Compliance Committee met three times.
S-39
Prior January 1, 2011, the Funds had a different Audit Committee, Pricing Committee and Governance Committee. The following table presents the number of times each Committee met during the period from November 1, 2010 through December 31, 2010.
| | |
Committee | | Number of Committee
Meetings Held During NIF’s
Period from November 1, 2010
through December 31, 2010 |
Audit Committee | | 1 |
Pricing Committee | | 1 |
Governance Committee | | 0 |
Effective January 1, 2012, the Board approved the creation of the Open-End Funds Committee. The Open-End Funds Committee is responsible for assisting the Board in the oversight and monitoring of the Nuveen Funds that are registered as open-end management investment companies (“Open-End Funds”). The committee may review and evaluate matters related to the formation and the initial presentation to the Board of any new Open-End Fund and may review and evaluate any matters relating to any existing Open-End Fund. The committee operates under a written charter adopted and approved by the Board. The members of the Open-End Funds Committee are Robert P. Bremner, David J. Kundert, Judith M. Stockdale, Virginia L. Stringer and Terence J. Toth, Chair.
Board Diversification and Director Qualifications
In determining that a particular director was qualified to serve on the Board, the Board has considered each director’s background, skills, experience and other attributes in light of the composition of the Board with no particular factor controlling. The Board believes that directors need to have the ability to critically review, evaluate, question and discuss information provided to them, and to interact effectively with Fund management, service providers and counsel, in order to exercise effective business judgment in the performance of their duties, and the Board believes each director satisfies this standard. An effective director may achieve this ability through his or her educational background; business, professional training or practice; public service or academic positions; experience from service as a board member or executive of investment funds, public companies or significant private or not-for-profit entities or other organizations; and or/other life experiences. Accordingly, set forth below is a summary of the experiences, qualifications, attributes, and skills that led to the conclusion, as of the date of this document, that each director should continue to serve in that capacity. References to the experiences, qualifications, attributes and skills of directors are pursuant to requirements of the SEC, do not constitute holding out of the Board or any director as having any special expertise or experience and shall not impose any greater responsibility or liability on any such person or on the Board by reason thereof.
John P. Amboian
Mr. Amboian, an interested director of the Nuveen Funds, joined Nuveen Investments in June 1995 and became Chief Executive Officer in July 2007 and Chairman in November 2007. Prior to this, since 1999, he served as President with responsibility for the firm’s product, marketing, sales, operations and administrative activities. Mr. Amboian initially served Nuveen Investments as Executive Vice President and Chief Financial Officer. Prior to joining Nuveen Investments, Mr. Amboian held key management positions with two consumer product firms affiliated with the Phillip Morris Companies. He served as Senior Vice President of Finance, Strategy and Systems at Miller Brewing Company. Mr. Amboian began his career in corporate and international finance at Kraft Foods, Inc., where he eventually served as Treasurer. He received a Bachelor’s degree in economics and a Masters of Business Administration (“MBA”) from the University of Chicago. Mr. Amboian serves on the Board of Directors of Nuveen Investments and is a Board Member or Trustee of the Investment Company Institute Board of Governors, Boys and Girls Clubs of Chicago, Children’s Memorial Hospital and Foundation, the Council on the Graduate School of Business (University of Chicago), and the North Shore Country Day School Foundation. He is also a member of the Civic Committee of the Commercial Club of Chicago and the Economic Club of Chicago.
S-40
Robert P. Bremner
Mr. Bremner, the Nuveen Funds’ Independent Chairman, is a private investor and management consultant in Washington, D.C. His biography of William McChesney Martin, Jr., a former chairman of the Federal Reserve Board, was published by Yale University Press in November 2004. From 1994 to 1997, he was a Senior Vice President at Samuels International Associates, an international consulting firm specializing in governmental policies, where he served in a part-time capacity. Previously, Mr. Bremner was a partner in the LBK Investors Partnership and was chairman and majority stockholder with ITC Investors Inc., both private investment firms. He currently serves on the Board and as Treasurer of the Humanities Council of Washington D.C. and is a Board Member of the Independent Directors Council affiliated with the Investment Company Institute. From 1984 to 1996, Mr. Bremner was an independent Trustee of the Flagship Funds, a group of municipal open-end funds. He began his career at the World Bank in Washington D.C. He graduated with a Bachelor of Science degree from Yale University and received his MBA from Harvard University.
Jack B. Evans
President of the Hall-Perrine Foundation, a private philanthropic corporation, since 1996, Mr. Evans was formerly President and Chief Operating Officer of the SCI Financial Group, Inc., a regional financial services firm headquartered in Cedar Rapids, Iowa. Formerly, he was a member of the Board of the Federal Reserve Bank of Chicago as well as a Director of Alliant Energy. Mr. Evans is Chairman of the Board of United Fire Group, sits on the Board of Source Media Group, is a member of the Board of Regents for the State of Iowa University System, is a Life Trustee of Coe College and is a member of the Advisory Council of the Department of Finance in the Tippie College of Business, University of Iowa. He has a Bachelor of Arts degree from Coe College and an MBA from the University of Iowa.
William C. Hunter
Mr. Hunter was appointed Dean of the Henry B. Tippie College of Business at the University of Iowa effective July 1, 2006. He had been Dean and Distinguished Professor of Finance at the University of Connecticut School of Business since June 2003. From 1995 to 2003, he was the Senior Vice President and Director of Research at the Federal Reserve Bank of Chicago. While there he served as the Bank’s Chief Economist and was an Associate Economist on the Federal Reserve System’s Federal Open Market Committee (FOMC). In addition to serving as a Vice President in charge of financial markets and basic research at the Federal Reserve Bank in Atlanta, he held faculty positions at Emory University, Atlanta University, the University of Georgia and Northwestern University. A past Director of the Credit Research Center at Georgetown University, SS&C Technologies, Inc. (2005) and past President of the Financial Management Association International, he has consulted with numerous foreign central banks and official agencies in Western Europe, Central and Eastern Europe, Asia, Central America and South America. From 1990 to 1995, he was a U.S. Treasury Advisor to Central and Eastern Europe. He has been a Director of the Xerox Corporation since 2004 and Wellmark, Inc. since 2009. He is President-Elect of Beta Gamma Sigma, Inc., the International Business Honor Society.
David J. Kundert
Mr. Kundert retired in 2004 as Chairman of JPMorgan Fleming Asset Management, and as President and CEO of Banc One Investment Advisors Corporation, and as President of One Group Mutual Funds. Prior to the merger between Bank One Corporation and JPMorgan Chase and Co., he was Executive Vice President, Bank One Corporation and, since 1995, the Chairman and CEO, Banc One Investment Management Group. From 1988 to 1992, he was President and CEO of Bank One Wisconsin Trust Company. Currently, Mr. Kundert is a Director of the Northwestern Mutual Wealth Management Company. He started his career as an attorney for Northwestern Mutual Life Insurance Company. Mr. Kundert has served on the Board of Governors of the Investment Company Institute and he is currently a member of the Wisconsin Bar Association. He is on the Board of the Greater Milwaukee Foundation and chairs its Investment Committee. He received his Bachelor of Arts degree from Luther College, and his Juris Doctor from Valparaiso University.
S-41
William J. Schneider
Mr. Schneider is currently Chairman, formerly Senior Partner and Chief Operating Officer (retired, December 2004) of Miller-Valentine Partners Ltd., a real estate investment company. He was formerly a Director and Past Chair of the Dayton Development Coalition. He was formerly a member of the Community Advisory Board of the National City Bank in Dayton as well as a former member of the Business Advisory Council of the Cleveland Federal Reserve Bank. Mr. Schneider is a member of the Business Advisory Council for the University of Dayton College of Business. Mr. Schneider was an independent Trustee of the Flagship Funds, a group of municipal open-end funds. He also served as Chair of the Miami Valley Hospital and as Chair of the Finance Committee of its parent holding company. Mr. Schneider has a Bachelor of Science in Community Planning from the University of Cincinnati and a Masters of Public Administration from the University of Dayton.
Judith M. Stockdale
Ms. Stockdale is currently Executive Director of the Gaylord and Dorothy Donnelley Foundation, a private foundation working in land conservation and artistic vitality in the Chicago region and the Low country of South Carolina. Her previous positions include Executive Director of the Great Lakes Protection Fund, Executive Director of Openlands, and Senior Staff Associate at the Chicago Community Trust. She has served on the Boards of the Land Trust Alliance, the National Zoological Park, the Governor’s Science Advisory Council (Illinois), the Nancy Ryerson Ranney Leadership Grants Program, Friends of Ryerson Woods and the Donors Forum. Ms. Stockdale, a native of the United Kingdom, has a Bachelor of Science degree in geography from the University of Durham (UK) and a Master of Forest Science degree from Yale University.
Carole E. Stone
Ms. Stone retired from the New York State Division of the Budget in 2004, having served as its Director for nearly five years and as Deputy Director from 1995 through 1999. Ms. Stone is currently on the Board of Directors of the Chicago Board Options Exchange, CBOE Holdings, Inc. and C2 Options Exchange, Incorporated. She has also served as the Chair of the New York Racing Association Oversight Board, as a Commissioner on the New York State Commission on Public Authority Reform and as a member of the Boards of Directors of several New York State public authorities. Ms. Stone has a Bachelor of Arts from Skidmore College in Business Administration.
Virginia L. Stringer
Ms. Stringer served as the independent chair of the Board of the First American Fund Complex from 1997 to 2010, having joined such Board in 1987. Ms. Stringer serves on the Governing Board of the Investment Company Institute’s Independent Directors Council and on the board of the Mutual Fund Directors Forum. She is a recipient of the Outstanding Corporate Director award from Twin Cities Business Monthly and the Minnesota Chapter of the National Association of Corporate Directors. Ms. Stringer is the immediate past board chair of the Oak Leaf Trust, director and immediate past board chair of the Saint Paul Riverfront Corporation and is immediate past President of the Minneapolis Club’s Governing Board. She is a director and former board chair of the Minnesota Opera and a Life Trustee and former board of the Voyageur Outward Bound School. She also served as a trustee of Outward Bound USA. She was appointed by the Governor of Minnesota Board on Judicial Standards and recently served on a Minnesota Supreme Court Judicial Advisory Committee to reform the state’s judicial disciplinary process. She is a member of the International Women’s Forum and attended the London Business School as an International Business Fellow. Ms. Stringer also served as board chair of the Human Resource Planning Society, the Minnesota Women’s Campaign Fund and the Minnesota Women’s Economic Roundtable. Ms. Stringer is the retired founder of Strategic Management Resources, a consulting practice focused on corporate governance, strategy and leadership. She has twenty five years of corporate experience having held executive positions in general management, marketing and human resources with IBM and the Pillsbury Company.
Terence J. Toth
Mr. Toth is a Director, Legal & General Investment Management America, Inc. (since 2008) and a Managing Partner, Promus Capital (since 2008). From 2004 to 2007, he was Chief Executive Officer
S-42
and President of Northern Trust Global Investments, and Executive Vice President of Quantitative Management & Securities Lending from 2000 to 2004. He also formerly served on the Board of the Northern Trust Mutual Funds. He joined Northern Trust in 1994 after serving as Managing Director and Head of Global Securities Lending at Bankers Trust (1986 to 1994) and Head of Government Trading and Cash Collateral Investment at Northern Trust from 1982 to 1986. He currently serves on the Boards of the Goodman Theatre and Chicago Fellowship, and is Chairman of the Board of Catalyst Schools of Chicago. Mr. Toth graduated with a Bachelor of Science degree from the University of Illinois, and received his MBA from New York University. In 2005, he graduated from the CEO Perspectives Program at Northwestern University.
Board Compensation
The following table shows, for each independent director, (1) the aggregate compensation paid by the Funds for the fiscal year ended October 31, 2011, (2) the amount of total compensation paid by the Funds that has been deferred, and (3) the total compensation paid to each director by the Nuveen Funds during the fiscal year ended October 31, 2011.
| | | | | | | | | | | | |
Name of Director | | Aggregate
Compensation
From Funds | | | Amount of Total
Compensation that Has
Been Deferred | | | Total Compensation
From Nuveen Funds
Paid to Director3 | |
Robert P. Bremner 1 | | $ | 18,608 | | | $ | 1,605 | | | $ | 332,253 | |
Jack B. Evans 1 | | | 13,616 | | | | 1,945 | | | | 261,536 | |
William C. Hunter 1 | | | 13,141 | | | | 7,606 | | | | 227,114 | |
David J. Kundert 1 | | | 14,667 | | | | 8,285 | | | | 256,458 | |
William J. Schneider 1 | | | 14,486 | | | | — | | | | 259,244 | |
Judith M. Stockdale 1 | | | 13,656 | | | | 4,272 | | | | 251,468 | |
Carole E. Stone 1 | | | 14,083 | | | | — | | | | 245,650 | |
Virginia L. Stringer 2 | | | 12,844 | | | | — | | | | 175,000 | |
Terence J. Toth 1 | | | 14,255 | | | | — | | | | 264,280 | |
| 1 | | All directors, except for Ms. Stringer, were appointed to the Board of Directors effective January 1, 2011. |
| 2 | | Ms. Stringer was a member of the Board of Directors prior to January 1, 2011. |
| 3 | | Does not include compensation paid for the period of November 1, 2010 to December 31, 2010 from funds that are now Nuveen Funds, but were formerly advised by FAF Advisors, Inc. (“FAF”) |
Prior to January 1, 2012, independent directors received a $120,000 annual retainer plus (a) a fee of $4,500 per day for attendance in person or by telephone at regularly scheduled meetings of the Board; (b) a fee of $3,000 per meeting for attendance in person or by telephone at special, non-regularly scheduled Board meetings where in-person attendance was required and $2,000 per meeting for attendance by telephone or in person at such meetings where in-person attendance was not required; (c) a fee of $2,500 per meeting for attendance in person or by telephone at Audit Committee meetings where in-person attendance was required and $2,000 per meeting for attendance by telephone or in person at such meetings where in-person attendance was not required; (d) a fee of $2,500 per meeting for attendance in person or by telephone at Compliance, Risk Management and Regulatory Oversight Committee meetings where in-person attendance was required and $2,000 per meeting for attendance by telephone or in person at such meetings where in-person attendance was not required; (e) a fee of $1,000 per meeting for attendance in person or by telephone at Dividend Committee meetings; and (f) a fee of $500 per meeting for attendance in person or by telephone at all other committee meetings ($1,000 for shareholder meetings) where in-person attendance was required and $250 per meeting for attendance by telephone or in person at such committee meetings (excluding shareholder meetings) where in-person attendance was not required, and $100 per meeting when the Executive Committee acted as pricing committee for IPOs, plus, in each case, expenses incurred in attending such meetings, provided that no fees are received for meetings held on days on which regularly scheduled Board meetings were held. In addition to the payments described above, the Chairman of the Board received $75,000, the chairpersons of the Audit Committee, the Dividend Committee and the Compliance, Risk Management and Regulatory
S-43
Oversight Committee received $10,000 each and the chairperson of the Nominating and Governance Committee received $5,000 as additional retainers. Independent directors also received a fee of $3,000 per day for site visits to entities that provided services to the Nuveen Funds on days on which no Board meeting was held. When ad hoc committees were organized, the Nominating and Governance Committee at the time of formation determined compensation to be paid to the members of such committee; however, in general, such fees were $1,000 per meeting for attendance in person or by telephone at ad hoc committee meetings where in-person attendance was required and $500 per meeting for attendance by telephone or in person at such meetings where in-person attendance was not required. The annual retainer, fees and expenses were allocated among the Nuveen Funds on the basis of relative net assets, although management might have, in its discretion, established a minimum amount to be allocated to each fund.
Effective January 1, 2012, independent directors receive a $130,000 annual retainer plus (a) a fee of $4,500 per day for attendance in person or by telephone at regularly scheduled meetings of the Board; (b) a fee of $3,000 per meeting for attendance in person or by telephone at special, non-regularly scheduled Board meetings where in-person attendance is required and $2,000 per meeting for attendance by telephone or in person at such meetings where in-person attendance is not required; (c) a fee of $2,500 per meeting for attendance in person or by telephone at Audit Committee meetings where in-person attendance is required and $2,000 per meeting for attendance by telephone or in person at such meetings where in-person attendance is not required; (d) a fee of $2,500 per meeting for attendance in person or by telephone at Compliance, Risk Management and Regulatory Oversight Committee meetings where in-person attendance is required and $2,000 per meeting for attendance by telephone or in person at such meetings where in-person attendance is not required; (e) a fee of $1,000 per meeting for attendance in person or by telephone at Dividend Committee meetings; (f) a fee of $500 per meeting for attendance in person or by telephone at all other committee meetings ($1,000 for shareholder meetings) where in-person attendance is required and $250 per meeting for attendance by telephone or in person at such committee meetings (excluding shareholder meetings) where in-person attendance is not required, and $100 per meeting when the Executive Committee acts as pricing committee for IPOs, plus, in each case, expenses incurred in attending such meetings, provided that no fees are received for meetings held on days on which regularly scheduled Board meetings are held; and (g) a fee of $2,500 per meeting for attendance in person or by telephone at Open-End Funds Committee meetings where in-person attendance is required and $2,000 per meeting for attendance by telephone or in person at such meetings where in-person attendance is not required; provided that no fees are received for meetings held on days on which regularly scheduled Board meetings are held. In addition to the payments described above, the Chairman of the Board receives $75,000, the chairpersons of the Audit Committee, the Dividend Committee, the Compliance, Risk Management and Regulatory Oversight Committee and the Open-End Funds Committee receive $12,500 each and the chairperson of the Nominating and Governance Committee receives $5,000 as additional retainers. Independent trustees also receive a fee of $3,000 per day for site visits to entities that provide services to the Nuveen Funds on days on which no Board meeting is held. When ad hoc committees are organized, the Nominating and Governance Committee will at the time of formation determine compensation to be paid to the members of such committee; however, in general, such fees will be $1,000 per meeting for attendance in person or by telephone at ad hoc committee meetings where in-person attendance is required and $500 per meeting for attendance by telephone or in person at such meetings where in-person attendance is not required. The annual retainer, fees and expenses are allocated among the Nuveen Funds on the basis of relative net assets, although management may, in its discretion, establish a minimum amount to be allocated to each fund.
NIF does not have a retirement or pension plan. NIF has a deferred compensation plan (the “Deferred Compensation Plan”) that permits any independent director to elect to defer receipt of all or a portion of his or her compensation as an independent director. The deferred compensation of a participating director is credited to a book reserve account of NIF when the compensation would otherwise have been paid to the director. The value of the director’s deferral account at any time is equal to the value that the account would have had if contributions to the account had been invested and reinvested in shares of one or more of the eligible Nuveen Funds. At the time for commencing distributions from a director’s deferral account, the independent director may elect to receive distributions in a lump sum or over a period of five years. NIF will not be liable for any other fund’s obligations to make distributions under the Deferred Compensation Plan.
S-44
The Funds have no employees. The officers of NIF and the director of NIF who is not an independent director serve without any compensation from the Funds.
Share Ownership
The information in the table below discloses the dollar ranges of (i) each Director’s beneficial ownership in each Fund, and (ii) each Director’s aggregate beneficial ownership in all funds within the Nuveen Funds complex, including in each case the value of fund shares elected by Directors in the directors’ deferred compensation plan, based on the value of fund shares as of December 31, 2011.
| | | | | | | | | | | | | | | | | | | | | | | | | | | | | | | | | | | | | | | | |
Directors | |
| | | Bremner1 | | | Evans1 | | | Hunter1 | | | Kundert1 | | | Schneider1 | | | Stockdale1 | | | Stone1 | | | Stringer | | | Toth1 | | | Amboian1 | |
Aggregate Holdings – Fund Complex | |
| Over
$100,000 |
| |
| Over
$100,000 |
| |
| Over
$100,000 |
| |
| Over
$100,000 |
| |
| Over
$100,000 |
| |
| Over
$100,000 |
| |
| Over
$100,000 |
| |
| Over
$100,000 |
| |
| Over
$100,000 |
| |
| Over
$100,000 |
|
Nuveen Dividend Value Fund | | | — | | | | — | | | | — | | | | — | | | | — | | | | — | | | | — | | | | — | | | | — | | | | — | |
Nuveen Equity Index Fund | | | — | | | | — | | | | — | | | | — | | | | — | | | | — | | | | — | | | | — | | | | — | | | | — | |
Nuveen International Fund | | | — | | | | — | | | | — | | | | — | | | | — | | | | — | | | | — | | |
| $10,001-
$50,000 |
| | | — | | | | — | |
Nuveen International Select Fund | | | — | | | | — | | | | — | | | | — | | | | — | | | | — | | | | — | | |
| $50,001-
$100,000 |
| | | — | | | | — | |
Nuveen Large Cap Growth Opportunities Fund | | | — | | | | — | | | | — | | | | — | | | | — | | | | — | | | | — | | | | — | | | | — | | | | — | |
Nuveen Large Cap Select Fund | | | — | | | | — | | | | — | | | | — | | | | — | | | | — | | | | — | | | | — | | | | — | | | | — | |
Nuveen Large Cap Value Fund | | | — | | | | — | | | | — | | | | — | | | | — | | | | — | | | | — | | | | — | | | | — | | | | — | |
Nuveen Mid Cap Growth Opportunities Fund | | | — | | | | — | | | | — | | | | — | | | | — | | | | — | | | | — | | |
| $50,001-
$100,000 |
| | | — | | | | — | |
Nuveen Mid Cap Index Fund | | | — | | | | — | | | | — | | | | — | | | | — | | | | — | | | | — | | |
| $10,001-
$50,000 |
| | | — | | | | — | |
Nuveen Mid Cap Select Fund | | | — | | | | — | | | | — | | | | — | | | | — | | | | — | | | | — | | | | — | | | | — | | | | — | |
Nuveen Mid Cap Value Fund | | | — | | | | — | | | | — | | | | — | | | | — | | | | — | | | | — | | |
| $50,001-
$100,000 |
| | | — | | | | — | |
Nuveen Quantitative Enhanced Core Equity Fund | | | — | | | | — | | | | — | | | | — | | | | — | | | | — | | | | — | | | | — | | | | — | | | | — | |
Nuveen Small Cap Growth Opportunities Fund | | | — | | | | — | | | | — | | | | — | | | | — | | | | — | | | | — | | | | — | | | | — | | | | — | |
Nuveen Small Cap Index Fund | | | — | | | | — | | | | — | | | | — | | | | — | | | | — | | | | — | | |
| $10,001-
$50,000 |
| | | — | | | | — | |
Nuveen Small Cap Select Fund | | | — | | | | — | | | | — | | | | — | | | | — | | | | — | | | | — | | |
| $50,001-
$100,000 |
| | | — | | | | — | |
Nuveen Small Cap Value Fund | | | — | | | | — | | | | — | | | | — | | | | — | | | | — | | | | — | | |
| $10,001-
$50,000 |
| | | — | | | | — | |
Nuveen Tactical Market Opportunities Fund | | | — | | | | — | | | | — | | | | — | | | | — | | | | — | | |
| $10,001-
$50,000 |
| | | — | | | | — | | | | — | |
| 1 | | All directors, except for Ms. Stringer, were appointed to the Board of Directors effective January 1, 2011. |
S-45
As of February 2, 2012, the officers and directors of each Fund, in the aggregate, owned less than 1% of the shares of each of the Funds.
As of February 2, 2012, none of the independent directors or their immediate family members owned, beneficially, or of record, any securities in (i) an investment adviser or principal underwriter of the Funds or (ii) a person (other than a registered investment company) directly or indirectly controlling, controlled by, or under common control with an investment adviser or principal underwriter of the Funds.
Sales Loads
Directors of the Funds and certain other Fund affiliates may purchase the Funds’ Class I shares. See the Funds’ Prospectus for details.
SERVICE PROVIDERS
Investment Adviser
The investment adviser of the Funds is Nuveen Fund Advisors, Inc. The Adviser, located at 333 West Wacker Drive, Chicago, Illinois 60606, serves as the manager of each Fund, with responsibility for the overall management of each Fund. The Adviser is also responsible for managing each Fund’s business affairs and providing day-to-day administrative services to each Fund. For additional information regarding the management services performed by the Adviser, see “Who Manages the Funds” in the Prospectus.
The Adviser is an affiliate of the Distributor, which is located at 333 West Wacker Drive, Chicago, Illinois 60606. The Distributor is the principal underwriter for the Nuveen Mutual Funds, and has served as co-managing underwriter for the shares of the Nuveen Closed-End Funds. The Adviser and the Distributor are subsidiaries of Nuveen Investments.
On November 13, 2007, Nuveen Investments was acquired by investors led by Madison Dearborn Partners, LLC, which is a private equity investment firm based in Chicago, Illinois.
For the management services and facilities furnished by the Adviser, each of the Funds has agreed to pay an annual management fee at a rate set forth in the Prospectus under “Who Manages the Funds.” In addition, for certain funds the Adviser has agreed to waive all or a portion of its management fee or reimburse certain expenses of the Funds. The Prospectus includes current fee waivers and expense reimbursements for the Funds.
Each Fund’s management fee is divided into two components—a complex-level fee based on the aggregate amount of all eligible Nuveen Fund assets and a specific fund-level fee based only on the amount of assets within each individual Fund. This pricing structure enables Fund shareholders to benefit from growth in the assets within each individual Fund as well as from growth in the amount of complex-wide assets managed by the Adviser. Under no circumstances will this pricing structure result in a Fund paying management fees at a rate higher than would otherwise have been applicable had the complex-wide management fee structure not been implemented.
Each Fund has agreed to pay an annual fund-level management fee, payable monthly, based upon the average daily net assets of each Fund as set forth in the Prospectus.
Each Fund’s complex-level fee is payable monthly and is additive to the fund-level fee. It is determined by taking the current overall complex-level fee rate, which is based on the aggregate amount of the “eligible assets” of all Nuveen Funds, and making, as appropriate, an upward adjustment to that rate based upon the percentage of the particular Fund’s assets that are not “eligible assets.” The current overall complex-level fee schedule is as follows:
| | | | |
Complex-Level Asset Breakpoint Level* | | Effective Rate at
Breakpoint Level | |
$55 billion | | | 0.2000 | % |
$56 billion | | | 0.1996 | % |
$57 billion | | | 0.1989 | % |
$60 billion | | | 0.1961 | % |
$63 billion | | | 0.1931 | % |
S-46
| | | | |
Complex-Level Asset Breakpoint Level* | | Effective Rate at
Breakpoint Level | |
$66 billion | | | 0.1900 | % |
$71 billion | | | 0.1851 | % |
$76 billion | | | 0.1806 | % |
$80 billion | | | 0.1773 | % |
$91 billion | | | 0.1691 | % |
$125 billion | | | 0.1599 | % |
$200 billion | | | 0.1505 | % |
$250 billion | | | 0.1469 | % |
$300 billion | | | 0.1445 | % |
| * | | The complex-level fee is calculated based upon the aggregate daily “eligible assets” of all Nuveen Funds. Eligible assets do not include assets attributable to investments in other Nuveen Funds or assets in excess of $2 billion added to the Nuveen Fund complex in connection with Nuveen Fund Advisors’ assumption of the management of the former First American Funds effective January 1, 2011. Eligible assets include closed-end fund assets managed by the Adviser that are attributable to financial leverage. For these purposes, financial leverage includes the closed-end funds’ use of preferred stock and borrowings and certain investments in the residual interest certificates (also called inverse floating rate securities) in tender option bond (TOB) trusts, including the portion of assets held by a TOB trust that has been effectively financed by the trust’s issuance of floating rate securities, subject to an agreement by the Adviser as to certain funds to limit the amount of such assets for determining eligible assets in certain circumstances. |
A Fund’s complex-level fee rate will not exceed the maximum overall complex-level fee rate of 0.2000%. As of December 31, 2011, the Funds’ complex-level fees were:
| | | | |
Fund | | Complex-Level Fee Rate | |
Nuveen Dividend Value Fund | | | 0.1953 | % |
Nuveen Equity Index Fund | | | 0.2000 | % |
Nuveen International Fund | | | 0.2000 | % |
Nuveen International Select Fund | | | 0.2000 | % |
Nuveen Large Cap Growth Opportunities Fund | | | 0.1997 | % |
Nuveen Large Cap Select Fund | | | 0.2000 | % |
Nuveen Large Cap Value Fund | | | 0.2000 | % |
Nuveen Mid Cap Growth Opportunities Fund | | | 0.1993 | % |
Nuveen Mid Cap Index Fund | | | 0.1945 | % |
Nuveen Mid Cap Select Fund | | | 0.2000 | % |
Nuveen Mid Cap Value Fund | | | 0.2000 | % |
Nuveen Quantitative Enhanced Core Equity Fund | | | 0.2000 | % |
Nuveen Small Cap Growth Opportunities Fund | | | 0.2000 | % |
Nuveen Small Cap Index Fund | | | 0.1978 | % |
Nuveen Small Cap Select Fund | | | 0.2000 | % |
Nuveen Small Cap Value Fund | | | 0.2000 | % |
Nuveen Tactical Market Opportunities Fund | | | 0.1814 | % |
The following table sets forth total advisory fees paid to the Adviser (for the period of January 1, 2011 through October 31, 2011) before waivers and after waivers for the Funds:
| | | | | | | | |
| | | January 1, 2011 through
October 31, 2011 | |
Fund | | Advisory Fee
Before Waivers | | | Advisory Fee
After Waivers1 | |
Nuveen Dividend Value Fund | | $ | 6,548,266 | | | $ | 6,548,266 | |
Nuveen Equity Index Fund | | | 1,883,208 | | | | 1,502,803 | |
Nuveen International Fund | | | 5,458,891 | | | | 5,458,891 | |
S-47
| | | | | | | | |
| | | January 1, 2011 through
October 31, 2011 | |
Fund | | Advisory Fee
Before Waivers | | | Advisory Fee
After Waivers1 | |
Nuveen International Select Fund | | $ | 6,348,008 | | | $ | 6,348,008 | |
Nuveen Large Cap Growth Opportunities Fund | | | 3,820,427 | | | | 3,820,396 | |
Nuveen Large Cap Select Fund | | | 612,328 | | | | 612,328 | |
Nuveen Large Cap Value Fund | | | 1,145,252 | | | | 1,145,252 | |
Nuveen Mid Cap Growth Opportunities Fund | | | 8,045,762 | | | | 8,042,935 | |
Nuveen Mid Cap Index Fund | | | 840,754 | | | | 777,222 | |
Nuveen Mid Cap Select Fund | | | 273,681 | | | | 102,575 | |
Nuveen Mid Cap Value Fund | | | 2,175,250 | | | | 2,137,956 | |
Nuveen Quantitative Enhanced Core Equity Fund | | | 695,324 | | | | 454,695 | |
Nuveen Small Cap Growth Opportunities Fund | | | 1,080,747 | | | | 1,018,628 | |
Nuveen Small Cap Index Fund | | | 212,765 | | | | 47,392 | |
Nuveen Small Cap Select Fund | | | 4,915,739 | | | | 4,614,336 | |
Nuveen Small Cap Value Fund | | | 739,801 | | | | 736,439 | |
Nuveen Tactical Market Opportunities Fund | | | 215,606 | | | | 165,463 | |
| 1 | | Advisory and certain other fees for the period were waived by the Adviser to comply with total operating expense limitations that were agreed upon by the Funds and the Adviser. |
FAF served as the Fund’s investment adviser prior to January 1, 2011. The following table sets forth total advisory fees paid to FAF before waivers and after waivers for each of the Funds for the fiscal years ended October 31, 2009 and October 31, 2010 and the period from November 1, 2010 through December 31, 2010:
| | | | | | | | | | | | | | | | | | | | | | | | |
| | | Fiscal Year Ended
October 31, 2009 | | | Fiscal Year Ended
October 31, 2010 | | | November 1, 2010 through
December 31, 2010 | |
Fund | | Advisory
Fee Before
Waivers | | | Advisory
Fee After
Waivers | | | Advisory
Fee Before
Waivers | | | Advisory
Fee After
Waivers | | | Advisory
Fee Before
Waivers | | | Advisory
Fee After
Waivers | |
Nuveen Dividend Value Fund | | $ | 4,120,631 | | | $ | 4,112,815 | | | $ | 4,851,814 | | | $ | 4,846,342 | | | $ | 966,173 | | | $ | 962,850 | |
Nuveen Equity Index Fund | | | 2,338,543 | | | | 773,752 | | | | 2,330,070 | | | | 677,957 | | | | 380,248 | | | | 107,263 | |
Nuveen International Fund | | | 6,364,902 | | | | 5,723,184 | | | | 6,996,703 | | | | 6,279,110 | | | | 1,148,121 | | | | 1,027,230 | |
Nuveen International Select
Fund | | | 3,488,767 | | | | 2,552,898 | | | | 7,586,312 | | | | 6,587,447 | | | | 1,427,618 | | | | 1,267,564 | |
Nuveen Large Cap Growth Opportunities Fund | | | 3,120,820 | | | | 3,118,359 | | | | 3,747,940 | | | | 3,743,499 | | | | 656,734 | | | | 656,155 | |
Nuveen Large Cap Select Fund | | | 1,049,129 | | | | 1,048,341 | | | | 903,077 | | | | 901,701 | | | | 142,117 | | | | 142,097 | |
Nuveen Large Cap Value Fund | | | 2,558,590 | | | | 2,556,200 | | | | 2,434,008 | | | | 2,431,612 | | | | 309,546 | | | | 309,382 | |
Nuveen Mid Cap Growth Opportunities Fund | | | 6,911,119 | | | | 6,897,818 | | | | 8,862,176 | | | | 8,851,902 | | | | 1,524,870 | | | | 1,523,652 | |
Nuveen Mid Cap Index Fund | | | 415,760 | | | | 135,861 | | | | 595,528 | | | | 310,520 | | | | 117,671 | | | | 70,117 | |
Nuveen Mid Cap Select Fund | | | 329,185 | | | | 89,692 | | | | 285,133 | | | | 52,686 | | | | 47,500 | | | | 13,175 | |
Nuveen Mid Cap Value Fund | | | 3,827,879 | | | | 3,818,110 | | | | 4,162,864 | | | | 4,156,389 | | | | 614,017 | | | | 613,635 | |
Nuveen Quantitative Enhanced Core Equity Fund | | | 300,551 | | | | — | (a) | | | 519,035 | | | | 113,702 | | | | 100,131 | | | | 30,033 | |
S-48
| | | | | | | | | | | | | | | | | | | | | | | | |
| | | Fiscal Year Ended
October 31, 2009 | | | Fiscal Year Ended
October 31, 2010 | | | November 1, 2010
through December 31,
2010 | |
Fund | | Advisory
Fee Before
Waivers | | | Advisory
Fee After
Waivers | | | Advisory
Fee Before
Waivers | | | Advisory
Fee After
Waivers | | | Advisory
Fee Before
Waivers | | | Advisory
Fee After
Waivers | |
Nuveen Small Cap Growth Opportunities Fund | | $ | 1,076,198 | | | $ | 730,261 | | | $ | 1,704,781 | | | $ | 1,343,107 | | | $ | 304,473 | | | | 4244,906 | |
Nuveen Small Cap Index Fund | | | 194,340 | | | | — | (a) | | | 251,916 | | | | — | (a) | | | 47,310 | | | | — | (a) |
Nuveen Small Cap Select Fund | | | 3,716,654 | | | | 3,695,987 | | | | 5,145,089 | | | | 5,130,135 | | | | 933,763 | | | | 931,688 | |
Nuveen Small Cap Value Fund | | | 1,178,776 | | | | 1,166,864 | | | | 1,426,834 | | | | 1,424,720 | | | | 213,289 | | | | 212,646 | |
Nuveen Tactical Market Opportunities Fund 1 | | | * | | | | * | | | | 26,754 | | | | — | (a) | | | 30,562 | | | | 5,834 | |
| 1 | | Commenced operations on December 30, 2009. |
| * | | Fund was not in operation during this fiscal year. |
| (a) | | Advisory and certain other fees for the period were waived by FAF to comply with total operating expense limitations that were agreed upon by the Funds and FAF. |
In addition to the Adviser’s management fee, the Funds also pay a portion of NIF’s general administrative expenses allocated in proportion to the net assets of the Funds. All fees and expenses are accrued daily and deducted before payment of dividends to investors.
Sub-Advisers
The Adviser has selected its affiliate, Nuveen Asset Management, LLC, (“Nuveen Asset Management”), located at 333 West Wacker Drive, Chicago, Illinois 60606, to serve as sub-adviser to manage the investment portfolio of each of the Funds. In addition, one or more Sub-Advisers provide investment advisory services to Nuveen International Fund and Nuveen International Select Fund. Nuveen Asset Management is responsible for selecting the Funds’ investment strategies and, as it relates to Nuveen International Fund and Nuveen International Select Fund, for allocating and reallocating assets among the other Sub-Advisers consistent with each Fund’s investment objectives and strategies. Any Assets not allocated to another Sub-Adviser of Nuveen International Fund and Nuveen International Select Fund are managed by Nuveen Asset Management. The Adviser and Nuveen Asset Management are also responsible for implementing procedures to ensure that each Sub-Adviser complies with the respective Fund’s investment objective, policies and restrictions. The Adviser pays Nuveen Asset Management a portfolio management fee for each Fund equal to the percentage shown below of the advisory fee paid to the Adviser for its services to the Funds (net of any waivers, reimbursement payments, supermarket fees and alliance fees waived, reimbursed or paid by the Adviser in respect of the Funds). The fee shall accrue daily and shall be payable monthly.
| | | | |
Fund | | Percentage of Fee to be paid by the
Adviser to Nuveen Asset Management | |
Nuveen Dividend Value Fund | | | 50.0000 | % |
Nuveen Equity Index Fund | | | 33.3333 | % |
Nuveen International Fund | | | 30.0000 | % |
Nuveen International Select Fund | | | 30.0000 | % |
Nuveen Large Cap Growth Opportunities Fund | | | 47.0588 | % |
Nuveen Large Cap Select Fund | | | 53.3333 | % |
Nuveen Large Cap Value Fund | | | 53.3333 | % |
Nuveen Mid Cap Growth Opportunities Fund | | | 55.5556 | % |
Nuveen Mid Cap Index Fund | | | 28.5714 | % |
Nuveen Mid Cap Select Fund | | | 55.5556 | % |
Nuveen Mid Cap Value Fund | | | 55.5556 | % |
Nuveen Quantitative Enhanced Core Equity Fund | | | 50.0000 | % |
Nuveen Small Cap Growth Opportunities Fund | | | 50.0000 | % |
S-49
| | | | |
Fund | | Percentage of Fee to be paid by the
Adviser to Nuveen Asset Management | |
Nuveen Small Cap Index Fund | | | 42.8571 | % |
Nuveen Small Cap Select Fund | | | 55.5556 | % |
Nuveen Small Cap Value Fund | | | 55.5556 | % |
Nuveen Tactical Market Opportunities Fund | | | 50.0000 | % |
The following table sets forth the fees paid by the Adviser to Nuveen Asset Management for its services for the specified period:
| | | | |
| | | Amount Paid by the Adviser to
Nuveen Asset Management | |
Fund | | 1/01/11-10/31/11 | |
Nuveen Dividend Value Fund | | $ | 3,274,133 | |
Nuveen Equity Index Fund | | | 500,934 | |
Nuveen International Fund | | | 1,673,693 | |
Nuveen International Select Fund | | | 1,952,418 | |
Nuveen Large Cap Growth Opportunities Fund | | | 1,797,833 | |
Nuveen Large Cap Select Fund | | | 326,575 | |
Nuveen Large Cap Value Fund | | | 610,801 | |
Nuveen Mid Cap Growth Opportunities Fund | | | 4,468,301 | |
Nuveen Mid Cap Index Fund | | | 222,063 | |
Nuveen Mid Cap Select Fund | | | 72,227 | |
Nuveen Mid Cap Value Fund | | | 1,187,754 | |
Nuveen Quantitative Enhanced Core Equity Fund | | | 227,347 | |
Nuveen Small Cap Growth Opportunities Fund | | | 510,313 | |
Nuveen Small Cap Index Fund | | | 43,415 | |
Nuveen Small Cap Select Fund | | | 2,563,522 | |
Nuveen Small Cap Value Fund | | | 409,133 | |
Nuveen Tactical Market Opportunities Fund | | | 84,013 | |
The following tables set forth the percentages that are to be paid by the Adviser to the Sub-Advisers for Nuveen International Fund and Nuveen International Select Fund for their sub-advisory services. The fees are based on the aggregate average daily assets of Nuveen International Fund’s and Nuveen International Select Fund’s assets allocated to such Sub-Adviser. The fee is calculated daily and paid monthly.
| | | | | | | | |
Sub-Adviser | | Aggregate Assets of
Sub-Advisory Portfolio | | | Fee per annum to be paid from
the Adviser to Sub-Adviser | |
Altrinsic | | | First $150 Million | | | | 0.45 | % |
| | | Next $350 Million | | | | 0.37 | % |
| | | Over $500 Million | | | | 0.35 | % |
HGI | | | First $425 Million | | | | 0.40 | % |
| | | Over $425 Million | | | | 0.30 | % |
Lazard | | | First $112.5 Million | | | | 0.75 | % |
| | | Next $37.5 Million | | | | 0.70 | % |
| | | Next $37.5 Million | | | | 0.65 | % |
| | | Next $187.5 Million | | | | 0.60 | % |
Nuveen International Fund
The Fund employs two Sub-Advisers, each providing investment advisory services for a portion of the Fund’s assets:
| | • | | Altrinsic Global Advisors, LLC (“Altrinsic”) has been a Sub-Adviser to the Fund since November 3, 2008, currently pursuant to an agreement with the Adviser dated January 1, 2011. Altrinsic is an employee-controlled and majority-owned company founded in 2000. As of December 31, 2011, Altrinsic had assets under management of approximately $10.7 billion. |
S-50
| | • | | Hansberger Global Investors, Inc. (“HGI”) has been a Sub-Adviser to the Fund since November 3, 2008, currently pursuant to an agreement with the Adviser dated January 1, 2011. HGI is a wholly owned subsidiary of Hansberger Group, Inc. (“Hansberger”), itself an indirect subsidiary of Natixis Global Asset Management, L.P. (“NGAM”). The firm was founded in 1994. As of December 31, 2011, HGI had assets under management of approximately $6.5 billion. |
The following table sets forth the aggregate sub-advisory fees paid to Altrinsic and HGI for the fiscal years ended October 31, 2009, October 31, 2010, and October 31, 2011:
| | | | | | | | | | | | |
| | | Fiscal Year Ended
October 31, 2009 | | | Fiscal Year Ended
October 31, 2010 | | | Fiscal Year Ended
October 31, 2011 | |
Fund | | Amount Paid
by the Adviser
to the
Sub-Advisers | | | Amount Paid
by the Adviser
to the
Sub-Advisers | | | Amount Paid
by the Adviser
to the
Sub-Advisers | |
Nuveen International Fund | | $ | 2,158,310 | | | $ | 2,317,794 | | | $ | 2,135,657 | |
Nuveen International Select Fund
Altrinsic, HGI, and Lazard Asset Management LLC (“Lazard”) have served as Sub-Advisers to Nuveen International Select Fund since the Fund’s inception, currently pursuant to individual agreements with the Adviser dated January 1, 2011. Lazard is a wholly-owned subsidiary of Lazard Freres & Co., LLC. As of December 31, 2011, Lazard had assets under management of approximately $128.0 billion.
Each Sub-Adviser has discretion to select portfolio securities for its portion of the Fund (the “Sub-Advisory Portfolio”), but must select those securities according to the Fund’s investment objective and restrictions. Each Sub-Adviser is paid a fee by the Adviser each month for the services provided under their respective sub-advisory agreements.
The following table sets forth the aggregate sub-advisory fees paid to Altrinsic, HGI and Lazard for the fiscal years ended October 31, 2009, October 31, 2010, and October 31, 2011:
| | | | | | | | | | | | |
| | | Fiscal Year Ended
October 31, 2009 | | | Fiscal Year Ended
October 31, 2010 | | | Fiscal Year Ended
October 31, 2011 | |
Fund | | Amount Paid by
the Adviser to the
Sub-Advisers | | | Amount Paid by
the Adviser to the
Sub-Advisers | | | Amount Paid by
the Adviser to the
Sub-Advisers | |
Nuveen International Select Fund | | $ | 1,373,159 | | | $ | 2,914,141 | | | $ | 3,392,296 | |
Portfolio Managers
Nuveen Asset Management Compensation
Portfolio manager compensation consists primarily of base pay, an annual cash bonus and long-term incentive payments.
Base pay. Base pay is determined based upon an analysis of the portfolio manager’s general performance, experience, and market levels of base pay for such position.
Annual cash bonus. The Fund’s portfolio managers are eligible for an annual cash bonus based on investment performance, qualitative evaluation and financial performance of Nuveen Asset Management.
A portion of each portfolio manager’s annual cash bonus is based on the Fund’s investment performance, generally measured over the past one- and three or five-year periods unless the portfolio manager’s tenure is shorter. Investment performance for the Fund generally is determined by evaluating the Fund’s performance relative to its benchmark(s) and/or Lipper industry peer group.
A portion of the cash bonus is based on a qualitative evaluation made by each portfolio manager’s supervisor taking into consideration a number of factors, including the portfolio manager’s team collaboration, expense management, support of personnel responsible for asset growth, and his or her compliance with Nuveen Asset Management’s policies and procedures.
S-51
The final factor influencing a portfolio manager’s cash bonus is the financial performance of Nuveen Asset Management based on its operating earnings.
Long-term incentive compensation. Certain key employees of Nuveen Investments and its affiliates, including certain portfolio managers, have received equity interests in the parent company of Nuveen Investments. In addition, certain key employees of Nuveen Asset Management, including certain portfolio managers, have received profits interests in Nuveen Asset Management which entitle their holders to participate in the firm’s growth over time.
There are generally no differences between the methods used to determine compensation with respect to the Fund and the Other Accounts shown in the table below.
Altrinsic Compensation
Altrinsic manages all accounts on a team basis and all the portfolio managers are equity partners. The value of the equity and the associated cash flows are solely determined by the team’s long-term investment performance and client satisfaction. Portfolio managers receive a competitive salary, profit sharing and incentive compensation.
HGI Compensation
HGI’s compensation practices are designed to maintain a competitive compensation structure to attract, retain and motivate investment professionals of the highest caliber. HGI seeks to reward performance in a manner which aligns the interests of its investment professionals with those of the company and its clients. To accomplish these ends, portfolio managers are compensated by a combination of base salary and participation in HGI’s incentive bonus program. In addition to participation in HGI’s overall benefit packages, senior investment professionals receive a base salary and the opportunity to participate in different bonus programs. A portfolio manager’s base salary is a fixed amount that may change as a result of an annual review, assumption of new duties or based on a market adjustment.
HGI portfolio managers also have the opportunity to participate in a bonus pool linked to the direct profits of their respective investment teams. A portfolio manager’s allocation in the pool is determined through a subjective process that evaluates numerous qualitative and quantitative factors, including, but not limited to, pre-tax performance of the Fund and other accounts managed by the portfolio manager relative to the account’s benchmark, given the account’s objectives, investment policies and restrictions and market environment over the preceding calendar year. This performance factor is not based on the value of the assets held in any client portfolio. Additional factors include the portfolio manager’s contributions to the investment management functions within HGI, contributions to the development of other investment professionals and supporting staff, and overall contributions to client development and service and strategic planning for the firm. The target bonus is expressed as a percentage of the total bonus pool and that can vary (higher or lower) based on an evaluation of the above-mentioned factors.
Finally, many senior portfolio managers have an additional opportunity to participate in an annual bonus linked to the overall profitability of HGI. All or a portion of payments from this pool may be deferred for a specific period of time and invested in funds, including HGI-managed products. This plan is designed to retain qualified investment professionals and further align their interests with those of our clients and the firm. Participation in this bonus program is discretionary, and is determined annually by the Compensation Committee of the Board of Directors of HGI’s parent company.
Lazard Compensation
Lazard compensates portfolio managers by a competitive salary and bonus structure, which is determined both quantitatively and qualitatively. Salary and bonus are paid in cash, stock and restricted interests in funds managed by Lazard or its affiliates. Portfolio managers are compensated on the performance of the aggregate group of portfolios managed by them rather than for a specific fund or account. Various factors are considered in the determination of a portfolio manager’s compensation. All of the portfolios managed by a portfolio manager are comprehensively evaluated to determine his or her positive and consistent performance contribution over time. Further factors include the amount of assets in the portfolios as well as qualitative aspects that reinforce Lazard’s investment philosophy such as leadership, teamwork, and commitment.
S-52
Total compensation is not fixed, but rather is based on the following factors: (1) maintenance of current knowledge and opinions on companies owned in the portfolio; (2) generation and development of new investment ideas, including the quality of security analysis and identification of appreciation catalysts; (3) ability and willingness to develop and share ideas on a team basis; and (4) the performance results of the portfolios managed by the investment team.
Variable bonus is based on the portfolio manager’s quantitative performance as measured by the manager’s ability to make investment decisions that contribute to the pre-tax absolute and relative returns of the accounts managed by him or her, by comparison of each account to a predetermined benchmark, including, as appropriate for the relevant account’s investment strategy, the MSCI World Index, the FTSE All World Europe ex-UK Index, the MSCI European Index, and the MSCI EAFE Index, over the current year and the longer-term performance (3-, 5-, or 10-year, if applicable) of such account, as well as performance of the account relative to peers. In addition, the portfolio manager’s bonus can be influenced by subjective measurement of the manager’s ability to help others make investment decisions.
Other Accounts Managed
In addition to the Funds, as of October 31, 2011, the portfolio managers are also primarily responsible for the day-to-day portfolio management of the following accounts:
| | | | | | | | | | | | | | | | | | |
Portfolio Manager | | Type of Account Managed | | Number of
Accounts | | | Assets | | | Number of
Accounts
with
Performance
Based Fees | | | Assets of
Accounts
with
Performance
Based Fees | |
Derek B. Bloom | | Registered Investment Company Other Pooled Investment Vehicles Other Accounts | |
| 0
0 3 |
| |
| 0
0 $1.0 million |
| |
| 0
0 0 |
| |
| 0
0 0 |
|
Karen L. Bowie | | Registered Investment Company Other Pooled Investment Vehicles Other Accounts | |
| 0
0 0 |
| |
| 0
0 0 |
| |
| 0
0 0 |
| |
| 0
0 0 |
|
Gerald C. Bren | | Registered Investment Company Other Pooled Investment Vehicles Other Accounts | |
| 0
1 13 |
| |
| 0
$25.7 million
$273.4 million |
| |
| 0
0 0 |
| |
| 0
0 0 |
|
Anthony R. Burger | | Registered Investment Company Other Pooled Investment Vehicles Other Accounts | |
| 0
0 7 |
| |
| 0
0 $156.0 million |
| |
| 0
0 0 |
| |
| 0
0 0 |
|
David A. Chalupnik | | Registered Investment Company Other Pooled Investment Vehicles Other Accounts | |
| 0
0 7 |
| |
| 0
0 $156.0 million |
| |
| 0
0 0 |
| |
| 0
0 0 |
|
Rehan Chaudhri | | Registered Investment Company Other Pooled Investment Vehicles Other Accounts | |
| 1
28 38 |
| |
| $551.0 million
$3.2 billion
$7.1 billion |
| |
| 0
2 3 |
| |
| 0
$213.9 million $347.9 million |
|
David R. Cline | | Registered Investment Company Other Pooled Investment Vehicles Other Accounts | |
| 4
0 0 |
| |
| $668.2 million
0
0 |
| |
| 0
0 0 |
| |
| 0
0 0 |
|
John L. DeVita | | Registered Investment Company Other Pooled Investment Vehicles Other Accounts | |
| 1
28 38 |
| |
| $551.0 million
$3.2 billion
$7.1 billion |
| |
| 0
2 3 |
| |
| 0
$213.9 million $347.9 million |
|
James A. Diedrich | | Registered Investment Company Other Pooled Investment Vehicles Other Accounts | |
| 0
0 7 |
| |
| 0
0
$136.1 million |
| |
| 0
0 0 |
| |
| 0
0 0 |
|
James M. Donald | | Registered Investment Company Other Pooled Investment Vehicles Other Accounts | |
| 10
21
208 |
| |
| $18.0 billion
$6.2 billion
$11.1 billion |
| |
| 1
1 3 |
| |
| $1.8 billion
$3.7 million $1.2 billion |
|
Kevin V. Earley | | Registered Investment Company Other Pooled Investment Vehicles Other Accounts | |
| 1
0 6 |
| |
| $159.2 million
0 $75.0 million |
| |
| 0
0 0 |
| |
| 0
0 0 |
|
S-53
| | | | | | | | | | | | | | | | | | |
Portfolio Manager | | Type of Account Managed | | Number of
Accounts | | | Assets | | | Number of
Accounts
with
Performance
Based Fees | | | Assets of
Accounts
with
Performance
Based Fees | |
Walter A. French | | Registered Investment Company Other Pooled Investment Vehicles Other Accounts | |
| 1
0 27 |
| |
| $304.3 million
0 $768.7 million |
| |
| 0
0 0 |
| |
| 0
0 0 |
|
David A. Friar | | Registered Investment Company Other Pooled Investment Vehicles Other Accounts | |
| 5
0 31 |
| |
| $1.2 billion
0 $788.9 million |
| |
| 0
0 0 |
| |
| 0
0 0 |
|
Harold R. Goldstein | | Registered Investment Company Other Pooled Investment Vehicles Other Accounts | |
| 0
0
932 |
| |
| 0
0 $233.0 million |
| |
| 0
0 0 |
| |
| 0
0 0 |
|
Trevor Graham | | Registered Investment Company Other Pooled Investment Vehicles Other Accounts | |
| 4
6
35 |
| |
| $812.4 million
$1.6 billion $2.1 billion |
| |
| 0
0 1 |
| |
| 0
0 $286.9 million |
|
Keith B. Hembre | | Registered Investment Company Other Pooled Investment Vehicles Other Accounts | |
| 6
0 6 |
| |
| $1.5 billion
0 $81.4 million |
| |
| 0
0 0 |
| |
| 0
0 0 |
|
John Hock | | Registered Investment Company Other Pooled Investment Vehicles Other Accounts | |
| 1
28
38 |
| |
| $551.0 million
$3.2 billion $7.1 billion |
| |
| 0
2 3 |
| |
| 0
$213.9 million $347.9 million |
|
Cori B. Johnson | | Registered Investment Company Other Pooled Investment Vehicles Other Accounts | |
| 0
1 13 |
| |
| 0
$25.7 million $273.4 million |
| |
| 0
0 0 |
| |
| 0
0 0 |
|
Barry A. Lockhart | | Registered Investment Company Other Pooled Investment Vehicles Other Accounts | |
| 4
6
31 |
| |
| $812.4 million
$1.6 billion
$2.1 billion |
| |
| 0
0 1 |
| |
| 0
0 $286.9 million |
|
Jon A. Loth | | Registered Investment Company | | | 0 | | | | 0 | | | | 0 | | | | 0 | |
| | Other Pooled Investment Vehicles | | | 0 | | | | 0 | | | | 0 | | | | 0 | |
| | Other Accounts | | | 2 | | | | $51.6 million | | | | 0 | | | | 0 | |
Robert S. McDougall | | Registered Investment Company | | | 0 | | | | 0 | | | | 0 | | | | 0 | |
| | Other Pooled Investment Vehicles | | | 0 | | | | 0 | | | | 0 | | | | 0 | |
| | Other Accounts | | | 2 | | | | $51.6 million | | | | 0 | | | | 0 | |
Brent D. Mellum | | Registered Investment Company | | | 1 | | | | $159.2 million | | | | 0 | | | | 0 | |
| | Other Pooled Investment Vehicles | | | 0 | | | | 0 | | | | 0 | | | | 0 | |
| | Other Accounts | | | 6 | | | | $75.0 million | | | | 0 | | | | 0 | |
Scott M. Mullinix | | Registered Investment Company | | | 0 | | | | 0 | | | | 0 | | | | 0 | |
| | Other Pooled Investment Vehicles | | | 0 | | | | 0 | | | | 0 | | | | 0 | |
| | Other Accounts | | | 932 | | | | $233.0 million | | | | 0 | | | | 0 | |
John R. Reinsberg | | Registered Investment Company | | | 5 | | | | $1.4 billion | | | | 0 | | | | 0 | |
| | Other Pooled Investment Vehicles | | | 6 | | | | $154.9 million | | | | 4 | | | | $127.0 million | |
| | Other Accounts | | | 63 | | | | $5.3 billion | | | | 0 | | | | 0 | |
Derek M. Sadowsky* | | Registered Investment Company | | | 0 | | | | 0 | | | | 0 | | | | 0 | |
| | Other Pooled Investment Vehicles | | | 1 | | | | $25.7 million | | | | 0 | | | | 0 | |
| | Other Accounts | | | 13 | | | | $273.4 million | | | | 0 | | | | 0 | |
Allen D. Steinkopf | | Registered Investment Company | | | 0 | | | | 0 | | | | 0 | | | | 0 | |
| | Other Pooled Investment Vehicles | | | 0 | | | | 0 | | | | 0 | | | | 0 | |
| | Other Accounts | | | 4 | | | | $20.0 million | | | | 0 | | | | 0 | |
Patrick Tan | | Registered Investment Company | | | 4 | | | | $812.4 million | | | | 0 | | | | 0 | |
| | Other Pooled Investment Vehicles | | | 6 | | | | $1.6 billion | | | | 0 | | | | 0 | |
| | Other Accounts | | | 30 | | | | $2.1 billion | | | | 1 | | | | $286.9 million | |
Thomas R. H. Tibbles | | Registered Investment Company | | | 4 | | | | $812.4 million | | | | 0 | | | | 0 | |
| | Other Pooled Investment Vehicles | | | 6 | | | | $1.6 billion | | | | 0 | | | | 0 | |
| | Other Accounts | | | 34 | | | | $2.1 billion | | | | 1 | | | | $286.9 million | |
Scott M. Tonneson* | | Registered Investment Company | | | 0 | | | | 0 | | | | 0 | | | | 0 | |
| | Other Pooled Investment Vehicles | | | 0 | | | | 0 | | | | 0 | | | | 0 | |
| | Other Accounts | | | 0 | | | | 0 | | | | 0 | | | | 0 | |
Mark A. Traster | | Registered Investment Company | | | 0 | | | | 0 | | | | 0 | | | | 0 | |
| | Other Pooled Investment Vehicles | | | 0 | | | | 0 | | | | 0 | | | | 0 | |
| | Other Accounts | | | 3 | | | | $29.7 million | | | | 0 | | | | 0 | |
| * | | Information is as of February 15, 2012. |
S-54
Nuveen Asset Management Conflicts of Interest
Actual or apparent conflicts of interest may arise when a portfolio manager has day-to-day management responsibilities with respect to more than one account. More specifically, portfolio managers who manage multiple accounts are presented a number of potential conflicts, including, among others, those discussed below.
The management of multiple accounts may result in a portfolio manager devoting unequal time and attention to the management of each account. Nuveen Asset Management seeks to manage such competing interests for the time and attention of portfolio managers by having portfolio managers focus on a particular investment discipline. Most accounts managed by a portfolio manager in a particular investment strategy are managed using the same investment models.
If a portfolio manager identifies a limited investment opportunity which may be suitable for more than one account, an account may not be able to take full advantage of that opportunity due to an allocation of filled purchase or sale orders across all eligible accounts. To deal with these situations, Nuveen Asset Management has adopted procedures for allocating limited opportunities across multiple accounts.
With respect to many of its clients’ accounts, Nuveen Asset Management determines which broker to use to execute transaction orders, consistent with its duty to seek best execution of the transaction. However, with respect to certain other accounts, Nuveen Asset Management may be limited by the client with respect to the selection of brokers or may be instructed to direct trades through a particular broker. In these cases, Nuveen Asset Management may place separate, non-simultaneous, transactions for a Fund and other accounts which may temporarily affect the market price of the security or the execution of the transaction, or both, to the detriment of the Fund or the other accounts.
Some clients are subject to different regulations. As a consequence of this difference in regulatory requirements, some clients may not be permitted to engage in all the investment techniques or transactions or to engage in these transactions to the same extent as the other accounts managed by the portfolio manager. Finally, the appearance of a conflict of interest may arise where Nuveen Asset Management has an incentive, such as a performance-based management fee, which relates to the management of some accounts, with respect to which a portfolio manager has day-to-day management responsibilities.
Nuveen Asset Management has adopted certain compliance procedures which are designed to address these types of conflicts common among investment managers. However, there is no guarantee that such procedures will detect each and every situation in which a conflict arises.
Altrinsic Conflicts of Interest
Altrinsic adheres to the highest standard of care and diligence in conducting its business activities and is particularly sensitive to situations in which the interests of its advisory clients may be directly or indirectly in conflict with those of Altrinsic. Altrinsic manages other accounts in addition to Nuveen International Fund and Nuveen International Select Fund. Therefore, conflicts of interest may arise in connection with Altrinsic’s management of the Funds’ investments and the investments of other accounts. Altrinsic manages accounts that may have similar objectives as the Funds. Some of Altrinsic’s other accounts may make investments in the same type of instruments or securities as the Funds at the same time as the Funds. Certain of these accounts may pay higher advisory fees than the Funds, creating an incentive to favor the higher paying account. Altrinsic has adopted procedures to allocate such trades among its various clients and the Funds fairly and equitably. It is Altrinsic’s policy that no client for whom Altrinsic has investment-decision responsibility shall receive preferential treatment over any other client.
HGI Conflicts of Interest
Potential conflicts of interest may arise from a portfolio manager’s management of, or the firm’s management of, other clients. Such conflicts could arise based on differing fee arrangements with
S-55
other clients. Differing fee arrangements could cause an incentive to favor one client over another in the allocation of investment opportunities, particularly if one client has a performance fee that could be significantly higher (or lower) than a straight base fee. Also, conflicts could arise for a portfolio manager to favor one client over another depending how a portfolio manager is compensated. Finally, material conflicts could arise from the portfolio manager’s knowledge of the size, timing and possible market impact of Fund trades, whereby a portfolio manager could try to use this information to the advantage of other accounts or personally in his or her personal securities transaction.
HGI has implemented policies and procedures, including brokerage and trade allocation policies and procedures that it believes address the conflicts associated with managing accounts for multiple clients. HGI also monitors for compliance with account guidelines and allocation of IPOs. HGI also has implemented and monitors compliance with our Code of Ethics that is designed to prevent employees from trading to the detriment of our clients. Finally, HGI periodically monitors investment returns of client accounts within the same style or approach, including dispersion of client account returns, to ensure that material dispersions are based upon something other than preferential treatment being accorded to other accounts in the same style or approach (such as investment policies or restrictions or cash inflows or outflows).
Lazard Conflicts of Interest
Although the potential for conflicts of interest exists when an investment adviser and portfolio managers manage other accounts with similar investment objectives and strategies as Nuveen International Select Fund, Lazard has procedures in place that are designed to ensure that all accounts are treated fairly and that the Fund is not disadvantaged, including procedures regarding trade allocations and “conflicting trades” (e.g., long and short positions in the same security, as described below). In addition, the Fund, as a registered investment company, is subject to different regulations than certain of the Similar Accounts, and, consequently, may not be permitted to engage in all the investment techniques or transactions, or to engage in such techniques or transactions to the same degree, as the other accounts.
Potential conflicts of interest may arise because of Lazard’s management of the Fund and other accounts. For example, conflicts of interest may arise with both the aggregation and allocation of securities transactions and allocation of limited investment opportunities, as Lazard may be perceived as causing accounts it manages to participate in an offering to increase Lazard’s overall allocation of securities in that offering, or to increase Lazard’s ability to participate in future offerings by the same underwriter or issuer.
A potential conflict of interest may be perceived to arise if transactions in one account closely follow related transactions in a different account, such as when a purchase increases the value of securities previously purchased by the other account, or when a sale in one account lowers the sale price received in a sale by a second account. Lazard manages hedge funds that are subject to performance/incentive fees. Certain hedge funds managed by Lazard may also be permitted to sell securities short. When Lazard engages in short sales of securities of the type in which the Fund invests, Lazard could be seen as harming the performance of the Fund for the benefit of the account engaging in short sales if the short sales cause the market value of the securities to fall. As described above, Lazard has procedures in place to address these conflicts. Portfolio managers are generally not permitted to manage both hedge funds that engage in short sales and long-only accounts, including open-end and closed-end registered investment companies.
S-56
Beneficial Ownership of Securities
The following table indicates as of October 31, 2011 the value, within the indicated range, of shares beneficially owned by the portfolio managers in each Fund they manage. For purposes of this table, the following letters indicate the range listed next to each letter:
| | | | | | |
A | | | - | | | $0 |
B | | | - | | | $1 - $10,000 |
C | | | - | | | $10,001 - $50,000 |
D | | | - | | | $50,001 - $100,000 |
E | | | - | | | $100,001 - $500,000 |
F | | | - | | | $500,001 - $1,000,000 |
G | | | - | | | More than $1 million |
| | | | | | |
Portfolio Manager | | Fund | | Ownership in Fund | |
Derek B. Bloom | | Nuveen International Fund | | | A | |
| | Nuveen International Select Fund | | | A | |
| | Nuveen Tactical Market Opportunities Fund | | | B | |
Karen L. Bowie | | Nuveen Small Cap Value Fund | | | D | |
Gerald C. Bren | | Nuveen Dividend Value Fund | | | G | |
Anthony R. Burger | | Nuveen Large Cap Select Fund | | | A | |
| | Nuveen Mid Cap Select Fund | | | A | |
David A. Chalupnik | | Nuveen Large Cap Select Fund | | | A | |
Rehan Chaudhri | | Nuveen International Fund | | | A | |
| | Nuveen International Select Fund | | | A | |
David R. Cline | | Nuveen Quantitative Enhanced Core Equity Fund | | | A | |
| | Nuveen Tactical Market Opportunities Fund | | | B | |
John L. DeVita | | Nuveen International Fund | | | A | |
| | Nuveen International Select Fund | | | A | |
James A. Diedrich | | Nuveen Large Cap Growth Opportunities Fund | | | C | |
| | Nuveen Mid Cap Growth Opportunities Fund | | | C | |
James M. Donald | | Nuveen International Select Fund | | | A | |
Kevin V. Earley | | Nuveen Large Cap Value Fund | | | A | |
| | Nuveen Mid Cap Value Fund | | | D | |
Walter A. French | | Nuveen Equity Index Fund | | | A | |
| | Nuveen International Fund | | | A | |
| | Nuveen International Select Fund | | | A | |
| | Nuveen Mid Cap Index Fund | | | A | |
| | Nuveen Quantitative Enhanced Core Equity Fund | | | A | |
| | Nuveen Small Cap Index Fund | | | A | |
| | Nuveen Tactical Market Opportunities Fund | | | A | |
David A. Friar | | Nuveen Equity Index Fund | | | A | |
| | Nuveen International Fund | | | A | |
| | Nuveen International Select Fund | | | A | |
| | Nuveen Mid Cap Index Fund | | | A | |
| | Nuveen Quantitative Enhanced Core Equity Fund | | | A | |
| | Nuveen Small Cap Index Fund | | | A | |
| | Nuveen Tactical Market Opportunities Fund | | | A | |
Harold R. Goldstein | | Nuveen Large Cap Growth Opportunities Fund | | | B | |
| | Nuveen Mid Cap Growth Opportunities Fund | | | B | |
Trevor Graham | | Nuveen International Fund | | | A | |
| | Nuveen International Select Fund | | | A | |
S-57
| | | | | | |
Portfolio Manager | | Fund | | Ownership in Fund | |
Keith B. Hembre | | Nuveen International Fund | | | A | |
| | Nuveen International Select Fund | | | A | |
| | Nuveen Quantitative Enhanced Core Equity Fund | | | A | |
| | Nuveen Tactical Market Opportunities Fund | | | E | |
John Hock | | Nuveen International Fund | | | A | |
| | Nuveen International Select Fund | | | A | |
Cori B. Johnson | | Nuveen Dividend Value Fund | | | E | |
Barry A. Lockhart | | Nuveen International Fund | | | A | |
| | Nuveen International Select Fund | | | A | |
Jon A. Loth | | Nuveen Small Cap Growth Opportunities Fund | | | B | |
Robert S. McDougall | | Nuveen Small Cap Growth Opportunities Fund | | | B | |
Brent D. Mellum | | Nuveen Large Cap Value Fund | | | C | |
| | Nuveen Mid Cap Value Fund | | | C | |
Scott M. Mullinix | | Nuveen Large Cap Growth Opportunities Fund | | | E | |
| | Nuveen Mid Cap Growth Opportunities Fund | | | E | |
John R. Reinsberg | | Nuveen International Select Fund | | | A | |
Derek M. Sadowsky* | | Nuveen Dividend Value Fund | | | C | |
Allen D. Steinkopf | | Nuveen Small Cap Select Fund | | | D | |
Patrick Tan | | Nuveen International Fund | | | A | |
| | Nuveen International Select Fund | | | A | |
Thomas R. H. Tibbles | | Nuveen International Fund | | | A | |
| | Nuveen International Select Fund | | | A | |
Scott M. Tonneson* | | Nuveen Mid Cap Select Fund | | | A | |
Mark A. Traster | | Nuveen Small Cap Select Fund | | | D | |
| * | | Information is as of February 15, 2012. |
Administrator
Prior to January 1, 2011, FAF served as Administrator pursuant to an Administration Agreement between FAF and NIF, dated July 1, 2006 and U.S. Bancorp Fund Services, LLC (“USBFS”), 615 East Michigan Street, Milwaukee, WI 53202, served as sub-administrator pursuant to a Sub-Administration Agreement between FAF and USBFS dated July 1, 2005. USBFS is a subsidiary of U.S. Bancorp. As of December 31, 2010, the Funds no longer have an administrator or sub-administrator. The following table sets forth total administrative fees, after waivers, paid by each of the Funds listed below to FAF and USBFS for the fiscal years ended October 31, 2009, and October 31, 2010 and for the period from November 1, 2010 through December 31, 2010:
| | | | | | | | | | | | |
Fund | | Fiscal Year Ended
October 31, 2009 | | | Fiscal Year Ended
October 31, 2010 | | | November 1, 2010
through
December 31, 2010 | |
Nuveen Dividend Value Fund | | $ | 1,378,544 | | | $ | 1,664,988 | | | $ | 334,525 | |
Nuveen Equity Index Fund | | | 2,033,961 | | | | 2,077,605 | | | | 342,292 | |
Nuveen International Fund | | | 1,384,683 | | | | 1,559,670 | | | | 258,378 | |
Nuveen International Select Fund | | | 761,556 | | | | 1,694,350 | | | | 321,273 | |
Nuveen Large Cap Growth Opportunities Fund | | | 1,044,167 | | | | 1,285,900 | | | | 227,365 | |
Nuveen Large Cap Select Fund | | | 350,923 | | | | 310,414 | | | | 49,202 | |
Nuveen Large Cap Value Fund | | | 855,860 | | | | 834,686 | | | | 107,151 | |
Nuveen Mid Cap Growth Opportunities Fund | | | 2,147,476 | | | | 2,823,193 | | | | 490,214 | |
Nuveen Mid Cap Index Fund | | | 361,720 | | | | 531,433 | | | | 105,926 | |
Nuveen Mid Cap Select Fund | | | 102,243 | | | | 90,796 | | | | 15,271 | |
S-58
| | | | | | | | | | | | |
Fund | | Fiscal Year Ended
October 31, 2009 | | | Fiscal Year Ended
October 31, 2010 | | | November 1, 2010
through
December 31, 2010 | |
Nuveen Mid Cap Value Fund | | $ | 1,189,236 | | | $ | 1,325,904 | | | $ | 197,380 | |
Nuveen Quantitative Enhanced Core Equity Fund | | | 217,949 | | | | 386,115 | | | | 75,111 | |
Nuveen Small Cap Growth Opportunities Fund | | | 234,117 | | | | 380,362 | | | | 68,516 | |
Nuveen Small Cap Index Fund | | | 105,678 | | | | 140,471 | | | | 26,618 | |
Nuveen Small Cap Select Fund | | | 1,154,941 | | | | 1,639,213 | | | | 300,195 | |
Nuveen Small Cap Value Fund | | | 366,224 | | | | 454,674 | | | | 68,557 | |
Nuveen Tactical Market Opportunities Fund 1 | | | * | | | | 7,990 | | | | 9,169 | |
| 1 | | Commenced operations on December 30, 2009. |
| * | | Fund was not in operation during this fiscal year. |
Transfer Agent
USBFS (the “Transfer Agent”), 615 East Michigan Street, Milwaukee, WI 53202, serves as the Funds’ transfer agent pursuant to a Transfer Agent and Shareholder Servicing Agreement (the “Transfer Agent Agreement”) between the Transfer Agent and NIF dated September 19, 2006. As transfer agent, the Transfer Agent maintains records of shareholder accounts, processes purchases and redemptions of the Funds’ shares, acts as dividend and capital gain distribution disbursing agent, and performs other related transfer agent functions. The Funds pay transfer agent fees on a per shareholder account basis, at annual rates paid monthly, subject to a minimum annual fee per share class. These fees will be charged to each Fund based on the number of accounts within that Fund. The Funds will continue to reimburse the Transfer Agent for out-of-pocket expenses incurred in providing transfer agent services.
The following table sets forth transfer agent fees, excluding out-of-pocket expenses, paid by the Funds to the Transfer Agent for the fiscal years ended October 31, 2009, October 31, 2010 and October 31, 2011:
| | | | | | | | | | | | |
Fund | | Fiscal Year Ended
October 31,
2009 | | | Fiscal Year Ended
October 31,
2010 | | | Fiscal Year Ended
October 31,
2011 | |
Nuveen Dividend Value Fund | | $ | 243,565 | | | $ | 232,600 | | | $ | 288,711 | |
Nuveen Equity Index Fund | | | 290,110 | | | | 266,034 | | | | 252,592 | |
Nuveen International Fund | | | 178,213 | | | | 165,677 | | | | 127,109 | |
Nuveen International Select Fund | | | 102,050 | | | | 89,706 | | | | 26,955 | |
Nuveen Large Cap Growth Opportunities Fund | | | 236,423 | | | | 219,922 | | | | 213,331 | |
Nuveen Large Cap Select Fund | | | 102,081 | | | | 89,821 | | | | 23,449 | |
Nuveen Large Cap Value Fund | | | 189,915 | | | | 177,316 | | | | 136,421 | |
Nuveen Mid Cap Growth Opportunities Fund | | | 345,274 | | | | 315,206 | | | | 316,092 | |
Nuveen Mid Cap Index Fund | | | 102,268 | | | | 90,572 | | | | 58,159 | |
Nuveen Mid Cap Select Fund | | | 150,863 | | | | 134,960 | | | | 108,695 | |
Nuveen Mid Cap Value Fund | | | 206,691 | | | | 172,902 | | | | 146,362 | |
Nuveen Quantitative Enhanced Core Equity Fund | | | 81,003 | | | | 72,003 | | | | 13,094 | |
Nuveen Small Cap Growth Opportunities Fund | | | 154,500 | | | | 142,251 | | | | 104,626 | |
Nuveen Small Cap Index Fund | | | 102,170 | | | | 90,187 | | | | 34,289 | |
Nuveen Small Cap Select Fund | | | 250,068 | | | | 227,083 | | | | 217,887 | |
S-59
| | | | | | | | | | | | |
Fund | | Fiscal Year Ended
October 31,
2009 | | | Fiscal Year Ended
October 31,
2010 | | | Fiscal Year Ended
October 31,
2011 | |
Nuveen Small Cap Value Fund | | $ | 151,925 | | | $ | 137,594 | | | $ | 102,800 | |
Nuveen Tactical Market Opportunities Fund 1 | | | * | | | | 12,375 | | | | 3,279 | |
| 1 | | Commenced operations on December 30, 2009. |
| * | | Fund was not in operation during this fiscal year. |
Custodians
U.S. Bank National Association (“U.S. Bank”) and State Street Bank and Trust Company act as custodians for the Funds (the “Custodians”). U.S. Bank, 60 Livingston Avenue, St. Paul, MN 55101, acts as the custodian for each Fund (the “Custodian”) other than Nuveen International Fund and Nuveen International Select Fund. U.S. Bank is a subsidiary of U.S. Bancorp. State Street Bank and Trust Company, 2 Avenue de Lafayette, LCC/5 Boston, MA 02111, acts as the custodian for Nuveen International Fund and Nuveen International Select Fund.
The Custodians take no part in determining the investment policies of the Funds or in deciding which securities are purchased or sold by the Funds. All of the instruments representing the investments of the Funds and all cash are held by the Custodians. The Custodians deliver securities against payment upon sale and pays for securities against delivery upon purchase. The Custodians also remit Fund assets in payment of Fund expenses, pursuant to instructions of NIF’s officers or resolutions of the Board of Directors.
As compensation for its services as custodian, U.S. Bank is paid a monthly fee calculated on an annual basis equal to 0.005% of each Fund’s average daily net assets. State Street Bank and Trust Company is paid reasonable compensation as agreed upon from time to time. Sub-custodian fees with respect to the Funds are paid by State Street Bank and Trust Company out of its fees from the Funds. In addition, the Custodians are reimbursed for their out-of-pocket expenses incurred while providing services to the Funds. Each Custodian continues to serve so long as its appointment is approved at least annually by the Board of Directors including a majority of the directors who are not “interested persons” of NIF, as that term is defined in the 1940 Act.
Distributor
Nuveen Securities, LLC, 333 West Wacker Drive, Chicago, Illinois 60606, serves as the distributor for the Funds’ shares pursuant to a “best efforts” arrangement as provided by a Distribution Agreement dated January 1, 2011 (the “Distribution Agreement”). Pursuant to the Distribution Agreement, the Funds appointed the Distributor to be their agent for the distribution of the Funds’ shares on a continuous offering basis.
Independent Registered Public Accounting Firm
Ernst & Young LLP, 220 South Sixth Street, Suite 1400, Minneapolis, Minnesota 55402, serves as the Funds’ independent registered public accounting firm, providing audit services, including audits of the annual financial statements.
CODES OF ETHICS
The Funds, the other Nuveen Funds, the Adviser, Nuveen Asset Management, the Distributor and other related entities have adopted codes of ethics, which essentially prohibit all Nuveen Funds management personnel, including the Funds’ portfolio managers, from engaging in personal investments which compete or interfere with, or attempt to take advantage of, a Fund’s anticipated or actual portfolio transactions, and are designed to assure that the interests of shareholders are placed before the interests of Nuveen personnel in connection with personal investment transactions. Altrinsic Global Advisors, LLC, Hansberger Global Investors, Inc., and Lazard Asset Management LLC have each adopted a code of ethics pursuant to Rule 17j-1 of the 1940 Act. Each of these codes of ethics permits personnel to invest in securities for their own accounts, including securities that may be purchased or held by the Funds. These codes of ethics are on public file with, and are available from, the SEC.
S-60
PROXY VOTING POLICIES
The Adviser has been delegated the authority by the board of directors of NIF to vote proxies with respect to the investments held in the Funds. The Adviser has delegated the responsibility of voting proxies to the Sub-Adviser of each of the Funds, including each of the Sub-Advisers for Nuveen International Fund or Nuveen International Select Fund. Each Sub-Adviser is responsible for developing and enforcing proxy voting policies with regard to the Fund, or the portion of the Fund’s assets, managed by such Sub-Adviser. The Adviser will review these policies annually. The policies and procedures that the Adviser and the Sub-Advisers use to determine how to vote proxies relating to their portfolio securities are set forth in Appendix B. Each year the Funds file their proxy voting records with the SEC and make them available by August 31 for the 12-month period ending June 30 of that year. The records can be obtained without charge through www.nuveen.com and/or the SEC’s website at www.sec.gov.
PORTFOLIO TRANSACTIONS
Decisions with respect to which securities are to be bought or sold, the total amount of securities to be bought or sold, the broker-dealer with or through which the securities transactions are to be effected and the commission rates applicable to the trades are made by Nuveen Asset Management or, in the case of Nuveen International Fund or Nuveen International Select Fund, their Sub-Advisers.
In selecting a broker-dealer to execute securities transactions, the Sub-Advisers consider the full range and quality of a broker-dealer’s services including, among other things: the value, nature and quality of any brokerage and research products and services; execution capability; commission rate; financial responsibility (including willingness to commit capital); the likelihood of price improvement; the speed of execution and likelihood of execution for limit orders; the ability to minimize market impact; the maintenance of the confidentiality of orders; and responsiveness of the broker-dealer. The determinative factor is not the lowest possible commission cost but whether the transaction represents the best qualitative execution for the Funds. Subject to the satisfaction of its obligation to seek best execution, another factor considered by the Sub-Advisers in selecting a broker-dealer may include the broker-dealer’s access to initial public offerings.
For certain transactions, the Sub-Advisers may cause the Funds to pay a broker-dealer a commission higher than that which another broker-dealer might have charged for effecting the same transaction (a practice commonly referred to as “paying up”). The Sub-Advisers cause a Fund to pay up in recognition of the value of the brokerage and research products and services provided by the broker-dealer. The broker-dealer may directly provide such products or services to the Funds or purchase them from a third party for the Funds. In such cases, the Sub-Advisers are in effect paying for the brokerage and research products and services with client commissions – so-called “soft dollars.” The Sub-Advisers will only cause a Fund to pay up if the Sub-Advisers, subject to their overall duty to seek best execution, determine in good faith that the amount of such commission is reasonable in relation to the value of the brokerage and research products and services provided by such broker-dealer, viewed in terms of either that particular transaction or the overall responsibilities of the Sub-Advisers with respect to the managing of its accounts.
The types of research products and services the Sub-Advisers receive include economic analysis and forecasts, financial market analysis and forecasts, industry and company specific analysis, performance monitoring, interest rate forecasts, arbitrage relative valuation analysis of various debt securities, analysis of U.S. Treasury securities, research-dedicated computer software and related consulting services and other services that assist in the investment decision making process. Research products and services are received primarily in the form of written reports, computer-generated services, telephone contacts and personal meetings with security analysts. Research services may also be provided in the form of meetings arranged by broker-dealers with corporate management teams and spokespersons, as well as industry spokespersons.
The brokerage and research products and services the Sub-Advisers receive from broker-dealers supplement the Sub-Advisers’ own normal research activities. As a practical matter, the Sub-Advisers could not, on their own, generate all of the research that broker-dealers provide without materially
S-61
increasing expenses. The brokerage and research products and services the Sub-Advisers receive from broker-dealers may be put to a variety of uses and may be provided as part of a product that bundles research and brokerage products with other products into one package as further described below. The Sub-Advisers reduce their expenses through their use of soft dollars.
As a general matter, the brokerage and research products and services the Sub-Advisers receive from broker-dealers are used to service all of the Sub-Advisers’ accounts, including the Funds. However, any particular brokerage and research product or service may not be used to service each and every account, and may not benefit the particular accounts that generated the brokerage commissions. For example, equity commissions are used for brokerage and research products and services utilized in managing fixed income accounts.
The Sub-Advisers receive brokerage or research products or services that they also use for business purposes unrelated to brokerage or research. For example, certain brokerage services are provided as a part of a product that bundles many separate and distinct brokerage, execution, investment management, custodial and recordkeeping services into one package. Market data services are a specific example of mixed use services that the Sub-Advisers might acquire because certain employees of the Sub-Advisers may use such services for marketing or administrative purposes while others use them for research purposes. The acquisition of mixed use products and services causes a conflict of interest for the Sub-Advisers, in that, clients pay up for this type of brokerage or research product or service while the product or service also directly benefits the Sub-Advisers. For this reason, and in accordance with general SEC guidance, the Sub-Advisers make a good faith effort to determine what percentage of the product or service is used for non-brokerage or research purposes and pay cash (“hard dollars”) for such percentage of the total cost. To ensure that their practices are consistent with their fiduciary responsibilities to their clients and to address this conflict, the Sub-Advisers make all determinations with regard to whether mixed use items may be acquired and, if so, what the appropriate allocations are between soft dollar and hard dollar payments for such products and services. These determinations themselves represent a conflict of interest as the Sub-Advisers have a financial incentive to allocate a greater proportion of the cost of mixed use products to soft dollars.
Many of the Funds’ portfolio transactions involve payment of a brokerage commission by the applicable Fund. In some cases, transactions are with dealers or issuers who act as principal for their own accounts and not as brokers. Transactions effected on a principal basis, other than certain transactions effected on a so-called riskless principal basis, are made without the payment of brokerage commissions but at net prices which usually include a spread or markup. In effecting transactions in over-the-counter securities, the Funds typically deal with market makers unless it appears that better price and execution are available elsewhere.
It is expected that the Funds will purchase most foreign equity securities in the over-the-counter markets or stock exchanges located in the countries in which the respective principal offices of the issuers of the various securities are located if that is the best available market. The commission paid in connection with foreign stock transactions may be higher than negotiated commissions on U.S. transactions. There generally is less governmental supervision and regulation of foreign stock exchanges than in the United States. Foreign securities settlements may in some instances be subject to delays and related administrative uncertainties.
Foreign equity securities may be held in the form of depositary receipts or securities convertible into foreign equity securities. Depositary receipts may be listed on stock exchanges or traded in the over-the-counter markets in the United States or overseas. The foreign and domestic debt securities and money market instruments in which the Funds may invest are generally traded in the over-the-counter markets.
The Funds do not effect any brokerage transactions in their portfolio securities with any broker or dealer affiliated directly or indirectly with the Adviser, Sub-Advisers or Distributor unless such transactions, including the frequency thereof, the receipt of commission payable in connection therewith, and the selection of the affiliated broker or dealer effecting such transactions are not unfair or unreasonable to the shareholders of the Funds, as determined by the Board of Directors. Any transactions with an affiliated broker or dealer must be on terms that are both at least as favorable to
S-62
the Funds as the Funds can obtain elsewhere and at least as favorable as such affiliated broker or dealer normally gives to others. The Funds did not pay any commissions to affiliated brokers or dealers during the fiscal years ended October 31, 2009, 2010 and 2011.
When two or more clients of the Sub-Advisers are simultaneously engaged in the purchase or sale of the same security, the prices and amounts are allocated in a manner considered by the Sub-Advisers to be equitable to each client. In some cases, this system could have a detrimental effect on the price or volume of the security as far as each client is concerned. In other cases, however, the ability of the clients to participate in volume transactions may produce better executions for each client.
The following table sets forth the aggregate brokerage commissions paid by the Funds during the fiscal years ended October 31, 2009, October 31, 2010, and October 31, 2011:
| | | | | | | | | | | | |
| | | Aggregate Brokerage Commissions Paid by the Funds | |
Fund | | Fiscal Year
Ended
October 31, 2009 | | | Fiscal Year
Ended
October 31, 2010 | | | Fiscal Year
Ended
October 31, 2011 | |
Nuveen Dividend Value Fund | | $ | 1,008,276 | | | $ | 945,555 | | | $ | 1,062,374 | |
Nuveen Equity Index Fund | | | 53,686 | | | | 56,413 | | | | 22,781 | |
Nuveen International Fund | | | 1,675,772 | | | | 1,268,428 | | | | 1,663,040 | |
Nuveen International Select Fund | | | 832,848 | | | | 1,293,947 | | | | 1,765,524 | |
Nuveen Large Cap Growth Opportunities Fund | | | 1,279,480 | | | | 1,273,966 | | | | 719,095 | |
Nuveen Large Cap Select Fund | | | 945,900 | | | | 588,540 | | | | 350,507 | |
Nuveen Large Cap Value Fund | | | 848,377 | | | | 1,531,050 | | | | 618,430 | |
Nuveen Mid Cap Growth Opportunities Fund | | | 3,653,907 | | | | 3,863,391 | | | | 2,342,848 | |
Nuveen Mid Cap Index Fund | | | 35,475 | | | | 35,705 | | | | 29,030 | |
Nuveen Mid Cap Select Fund | | | 404,795 | | | | 276,353 | | | | 150,047 | |
Nuveen Mid Cap Value Fund | | | 2,103,056 | | | | 2,609,339 | | | | 1,214,648 | |
Nuveen Quantitative Enhanced Core Equity Fund | | | 186,962 | | | | 542,961 | | | | 460,111 | |
Nuveen Small Cap Growth Opportunities Fund | | | 916,557 | | | | 1,063,297 | | | | 600,748 | |
Nuveen Small Cap Index Fund | | | 16,712 | | | | 10,519 | | | | 10,921 | |
Nuveen Small Cap Select Fund | | | 2,671,097 | | | | 3,093,093 | | | | 2,166,839 | |
Nuveen Small Cap Value Fund | | | 625,694 | | | | 617,325 | | | | 211,305 | |
Nuveen Tactical Market Opportunities Fund 1 | | | * | | | | 10,962 | | | | 41,633 | |
| 1 | | Commenced operations on December 30, 2009. |
| * | | Fund was not in operation during this fiscal year. |
Brokerage commissions paid by a Fund may vary significantly from year to year as a result of changing asset levels throughout the year, portfolio turnover, varying market conditions, and other factors.
S-63
The following table sets forth the value of transactions executed with, and commissions paid to, broker-dealers selected by the Adviser in part because of research products or services provided during the fiscal years ended October 31, 2009, October 31, 2010, and October 31, 2011. The Nuveen Equity Index Fund, Nuveen Mid Cap Index Fund, and Nuveen Quantitative Enhanced Core Equity Fund did not have any transactions executed with, or commissions paid to, broker-dealers because of research products or services provided during the fiscal years ended October 31, 2009, October 31, 2010 and October 31, 2011.
| | | | | | | | | | | | | | | | | | | | | | | | |
| | | Fiscal Year Ended
October 31, 2009 | | | Fiscal Year Ended
October 31, 2010 | | | Fiscal Year Ended
October 31, 2011 | |
Fund | | Transactions1 | | | Related
Brokerage
Commissions1 | | | Transactions1 | | | Related
Brokerage
Commissions1 | | | Transactions1 | | | Related
Brokerage
Commissions1 | |
Nuveen Dividend Value Fund | | $ | 438,887,413 | | | $ | 897,923 | | | $ | 311,201,452 | | | $ | 547,994 | | | $ | 471,053,593 | | | $ | 738,844 | |
Nuveen International Fund | | | 174,152,519 | | | | 353,315 | | | | 246,601,759 | | | | 482,691 | | | | 254,143,056 | | | | 423,347 | |
Nuveen International Select Fund | | | 70,658,414 | | | | 150,182 | | | | 197,853,870 | | | | 373,939 | | | | 236,037,186 | | | | 373,206 | |
Nuveen Large Cap Growth Opportunities Fund | | | 751,819,466 | | | | 1,093,629 | | | | 774,344,844 | | | | 938,515 | | | | 695,134,662 | | | | 592,584 | |
Nuveen Large Cap Select Fund | | | 409,254,020 | | | | 788,903 | | | | 253,679,417 | | | | 397,260 | | | | 204,089,952 | | | | 271,516 | |
Nuveen Large Cap Value Fund | | | 383,748,864 | | | | 682,553 | | | | 753,182,599 | | | | 1,041,198 | | | | 383,173,448 | | | | 501,981 | |
Nuveen Mid Cap Growth Opportunities Fund | | | 1,748,862,539 | | | | 3,165,718 | | | | 1,796,389,587 | | | | 2,562,763 | | | | 1,670,512,642 | | | | 1,899,729 | |
Nuveen Mid Cap Select Fund | | | 129,384,359 | | | | 326,282 | | | | 82,714,837 | | | | 181,445 | | | | 62,160,317 | | | | 124,718 | |
Nuveen Mid Cap Value Fund | | | 825,805,300 | | | | 1,829,937 | | | | 1,003,790,708 | | | | 1,759,660 | | | | 636,191,503 | | | | 1,009,177 | |
Nuveen Small Cap Growth Opportunities Fund | | | 205,054,265 | | | | 697,354 | | | | 249,792,962 | | | | 755,402 | | | | 172,855,035 | | | | 432,461 | |
Nuveen Small Cap Index Fund | | | – | | | | – | | | | – | | | | – | | | | 720 | | | | 3 | |
Nuveen Small Cap Select Fund | | | 691,815,979 | | | | 2,113,087 | | | | 775,410,446 | | | | 2,201,310 | | | | 704,417,554 | | | | 1,743,610 | |
Nuveen Small Cap Value Fund | | | 158,043,647 | | | | 510,178 | | | | 138,810,219 | | | | 412,487 | | | | 71,094,220 | | | | 163,545 | |
Nuveen Tactical Market Opportunities Fund2 | | | * | | | | * | | | | – | | | | – | | | | 430,702 | | | | 450 | |
S-64
| 1 | | Amount includes commissions paid to and brokerage transactions placed with certain broker-dealers that provide brokerage and research products and services and unbundled full service execution services. |
| 2 | | Commenced operations on December 30, 2009. |
| * | | Fund was not in operation during this fiscal year. |
The Funds, excluding Nuveen Mid Cap Growth Opportunities Fund, Nuveen Mid Cap Index Fund, Nuveen Mid Cap Select Fund, Nuveen Mid Cap Value Fund, Nuveen Small Cap Growth Opportunities Fund, Nuveen Small Cap Index Fund, Nuveen Small Cap Value Fund and Nuveen Tactical Market Opportunities Fund, have acquired during the fiscal year ended October 31, 2011 the securities of their regular brokers or dealers as defined in Rule 10b-1 under the 1940 Act or of the parents of the brokers or dealers. The following table sets forth those brokers or dealers and states the value of the Funds’ aggregate holdings of the securities of each issuer as of close of the fiscal year ended October 31, 2011:
| | | | | | |
Fund | | Regular Broker or Dealer Issuing Securities | | Amount of Securities
Held by Fund (000) | | Type of Securities |
Nuveen Dividend Value Fund | | Goldman Sachs & Co | | $4,881,219 | | Equity Securities |
| | JPMorgan Chase | | 25,108,643 | | Equity Securities |
| | Citigroup Global Markets Inc. | | – | | |
Nuveen Equity Index
Fund | | Goldman Sachs & Co | | 3,364,062 | | Equity Securities |
| | Bank of New York | | 1,592,554 | | Equity Securities |
Nuveen International
Fund | | Credit Suisse | | – | | |
Nuveen International
Select | | Credit Suisse | | – | | |
Nuveen Large Cap Growth Opportunities Fund | | Goldman Sachs & Co | | – | | |
| | JPMorgan Chase | | – | | |
Nuveen Large Cap Select Fund | | Goldman Sachs & Co | | – | | |
| | JPMorgan Chase | | 1,793,999 | | Equity Securities |
Nuveen Large Cap Value Fund | | Goldman Sachs & Co | | – | | |
| | Citigroup Global Markets Inc. | | 3,352,110 | | Equity Securities |
Nuveen Quantitative
Enhanced Core Equity Fund | | Goldman Sachs & Co | | – | | |
| | Citigroup Global Markets Inc. | | 142,471 | | Equity Securities |
| | Morgan Stanley & Co. Inc. | | – | | |
| | Bank of New York | | 482,077 | | Equity Securities |
Nuveen Small Cap Select Fund | | Piper Jaffray & Co. | | – | | |
Under the 1940 Act, a Fund may not purchase portfolio securities from any underwriting syndicate of which the Distributor is a member except under certain limited conditions set forth in Rule 10f-3. The Rule sets forth requirements relating to, among other things, the terms of a security purchased by a Fund, the amount of securities that may be purchased in any one issue and the assets of a Fund that may be invested in a particular issue. In addition, purchases of securities made pursuant to the terms of the Rule must be approved at least quarterly by the Board of Directors, including a majority of the independent trustees.
Portfolio Trading and Turnover
The Funds will make changes in their investment portfolios from time to time in order to seek to take advantage of opportunities in the market and to limit exposure to market risk. The Funds may also engage to a limited extent in short-term trading consistent with their investment objectives. Changes in the Funds’ investments are known as “portfolio turnover.”
S-65
DISCLOSURE OF PORTFOLIO HOLDINGS
The Nuveen Mutual Funds have adopted a portfolio holdings disclosure policy which governs the dissemination of the Funds’ portfolio holdings. In accordance with this policy, the Funds may provide portfolio holdings information to third parties no earlier than the time a report is filed with the SEC that is required to contain such information or one day after the information is posted on the Funds’ publicly accessible website, www.nuveen.com. Currently, the Funds generally make available complete portfolio holdings information on the Funds’ website following the end of each month with an approximately one-month lag. Additionally, the Funds publish on the website a list of its top ten holdings as of the end of each month, approximately two to five business days after the end of the month for which the information is current. This information will remain available on the website at least until the Funds file with the SEC their Forms N-CSR or Forms N-Q for the period that includes the date as of which the website information is current.
Additionally, the Funds may disclose portfolio holdings information that has not been included in a filing with the SEC or posted on the Funds’ website (i.e., non-public portfolio holdings information) only if there is a legitimate business purpose for doing so and if the recipient is required, either by explicit agreement or by virtue of the recipient’s duties to the Funds as an agent or service provider, to maintain the confidentiality of the information and to not use the information in an improper manner (e.g., personal trading). In this connection, the Funds may disclose on an ongoing basis non-public portfolio holdings information in the normal course of their investment and administrative operations to various service providers, including the Adviser and/or sub-advisers, independent registered public accounting firm, custodian, financial printer (R.R. Donnelley Financial and Financial Graphic Services), proxy voting service(s) (including ISS, ADP Investor Communication Services, and Glass, Lewis & Co.), borrowers of their securities pursuant to securities lending transactions, and to the legal counsel for the Funds’ independent directors (Chapman and Cutler LLP). Also, the Adviser may transmit to Vestek Systems, Inc. daily non-public portfolio holdings information on a next-day basis to enable the Adviser to perform portfolio attribution analysis using Vestek’s systems and software programs. Vestek is also provided with non-public portfolio holdings information on a monthly basis approximately 2-3 business days after the end of each month so that Vestek may calculate and provide certain statistical information (but not the non-public holdings information itself) to its clients (including retirement plan sponsors or their consultants). The Adviser and/or Sub-Advisers may also provide certain portfolio holdings information to broker-dealers from time to time in connection with the purchase or sale of securities or requests for price quotations or bids on one or more securities. In providing this information, reasonable precautions are taken in an effort to avoid potential misuse of the disclosed information, including limitations on the scope of the portfolio holdings information disclosed, when appropriate.
Non-public portfolio holdings information may be provided to other persons if approved by the Funds’ Chief Administrative Officer or Secretary upon a determination that there is a legitimate business purpose for doing so, the disclosure is consistent with the interests of the Funds, and the recipient is obligated to maintain the confidentiality of the information and not misuse it.
Compliance officers of the Funds and the Adviser and Sub-Advisers periodically monitor overall compliance with the policy to ascertain whether portfolio holdings information is disclosed in a manner that is consistent with the Funds’ policy. Reports are made to the Funds’ Board of Directors on an annual basis.
There is no assurance that the Funds’ policies on portfolio holdings information will protect the Funds from the potential misuse of portfolio holdings information by individuals or firms in possession of such information.
S-66
The following parties currently receive non-public portfolio holdings information regarding one or more of the Nuveen Mutual Funds on an ongoing basis pursuant to the various arrangements described above:
| | | | |
ADP Investor Communications Services Altrinsic Global Advisors, LLC Barclays Capital, Inc. Barra Bloomberg BNP Paribas Prime Brokerage, Inc. BNP Paribas Securities Corp. Broadridge Systems Cantor Fitzgerald & Co. Chapman and Cutler LLP Commerz Markets LLC Credit Agricole Securities (USA) Inc. Credit Suisse Securities (USA), LLC Deutsche Bank Securities, Inc. Dresdner Kleinwort Securities, LLC Ernst & Young LLP FactSet Research Systems Financial Graphic Services First Clearing, LLC Forbes | | Glass, Lewis & Co. Goldman Sachs & Co. Hansberger Global Investors, LLC HSBC Securities (USA), Inc. ING Financial Markets, LLC The Investment Company Institute ISS Jefferies & Company, Inc. J.P. Morgan Clearing Corp. J.P. Morgan Securities, Inc. Lazard Asset Management, Inc. Lipper Inc. Merrill Lynch, Pierce, Fenner & Smith Moody’s Morgan Stanley & Co., Inc. Morningstar, Inc. MS Securities Services, Inc. Newedge USA, LLC Nuveen Asset Management, LLC Nuveen Fund Advisors, Inc. Pershing, LLC PricewaterhouseCoopers LLP Raymond James & Associates, Inc. | | RBC Capital Markets Corporation RBS Securities, Inc. R.R. Donnelley & Sons Company R.R. Donnelley Financial Scotia Capital (USA), Inc. SG Ameritas Securities, LLC Societe Generale, New York Branch Standard & Poor’s State Street Bank & Trust Co. Strategic Insight TD Ameritrade Clearing, Inc. ThomsonReuters LLC UBS Securities, LLC U.S. Bancorp Fund Services, LLC U.S. Bank N.A. Value Line Vestek Systems, Inc. Vickers Wells Fargo Securities, LLC |
| | |
NET ASSET VALUE
Each Fund’s net asset value is determined as set forth in the Prospectus under “General Information—Net Asset Value.”
On October 31, 2011, the net asset values per share for each class of shares of the Funds were calculated as follows.
| | | | | | | | | | | | |
Fund | | Net Assets | | | Shares
Outstanding | | | Net Asset Value
Per Share | |
Nuveen Dividend Value Fund | | | | | | | | | | | | |
Class A | | $ | 176,953,904 | | | | 13,554,712 | | | $ | 13.05 | |
Class B | | | 3,015,718 | | | | 233,161 | | | | 12.93 | |
Class C | | | 18,713,659 | | | | 1,448,788 | | | | 12.92 | |
Class R3 | | | 12,092,463 | | | | 927,968 | | | | 13.03 | |
Class I | | | 861,753,953 | | | | 65,506,989 | | | | 13.16 | |
Nuveen Equity Index Fund | | | | | | | | | | | | |
Class A | | | 119,172,065 | | | | 5,558,549 | | | | 21.44 | |
Class B | | | 4,227,251 | | | | 200,364 | | | | 21.10 | |
Class C | | | 8,261,004 | | | | 388,878 | | | | 21.24 | |
Class R3 | | | 14,217,529 | | | | 664,488 | | | | 21.40 | |
Class I | | | 597,030,452 | | | | 27,857,016 | | | | 21.43 | |
S-67
| | | | | | | | | | | | |
Fund | | Net Assets | | | Shares
Outstanding | | | Net Asset Value
Per Share | |
Nuveen International Fund | | | | | | | | | | | | |
Class A | | $ | 22,327,725 | | | | 2,008,487 | | | $ | 11.12 | |
Class C | | | 1,986,754 | | | | 189,040 | | | | 10.51 | |
Class R3 | | | 10,732 | | | | 966 | | | | 11.11 | |
Class I | | | 141,264,518 | | | | 12,556,824 | | | | 11.25 | |
Nuveen International Select Fund | | | | | | | | | | | | |
Class A | | | 4,387,740 | | | | 495,972 | | | | 8.85 | |
Class C | | | 716,487 | | | | 82,175 | | | | 8.72 | |
Class R3 | | | 13,166 | | | | 1,519 | | | | 8.67 | |
Class I | | | 578,597,296 | | | | 65,237,097 | | | | 8.87 | |
Nuveen Large Cap Growth Opportunities Fund | | | | | | | | | | | | |
Class A | | | 84,875,173 | | | | 2,578,565 | | | | 32.92 | |
Class B | | | 2,410,736 | | | | 80,616 | | | | 29.90 | |
Class C | | | 7,831,819 | | | | 256,153 | | | | 30.57 | |
Class R3 | | | 3,430,642 | | | | 105,929 | | | | 32.39 | |
Class I | | | 435,619,504 | | | | 12,742,885 | | | | 34.19 | |
Nuveen Large Cap Select Fund | | | | | | | | | | | | |
Class A | | | 2,938,147 | | | | 250,535 | | | | 11.73 | |
Class C | | | 183,479 | | | | 16,365 | | | | 11.21 | |
Class R3 | | | 111,926 | | | | 9,656 | | | | 11.59 | |
Class I | | | 58,313,398 | | | | 4,940,725 | | | | 11.80 | |
Nuveen Large Cap Value Fund | | | | | | | | | | | | |
Class A | | | 46,658,526 | | | | 3,236,181 | | | | 14.42 | |
Class C | | | 1,093,748 | | | | 77,647 | | | | 14.09 | |
Class R3 | | | 768,005 | | | | 53,625 | | | | 14.32 | |
Class I | | | 104,949,007 | | | | 7,233,553 | | | | 14.51 | |
Nuveen Mid Cap Growth Opportunities Fund | | | | | | | | | | | | |
Class A | | | 289,037,661 | | | | 6,987,591 | | | | 41.36 | |
Class B | | | 4,127,188 | | | | 114,853 | | | | 35.93 | |
Class C | | | 14,314,211 | | | | 379,709 | | | | 37.70 | |
Class R3 | | | 34,928,799 | | | | 862,407 | | | | 40.50 | |
Class I | | | 728,842,815 | | | | 16,335,725 | | | | 44.62 | |
Nuveen Mid Cap Index Fund | | | | | | | | | | | | |
Class A | | | 68,856,221 | | | | 5,349,991 | | | | 12.87 | |
Class C | | | 3,302,083 | | | | 263,968 | | | | 12.51 | |
Class R3 | | | 65,059,827 | | | | 5,112,512 | | | | 12.73 | |
Class I | | | 170,173,906 | | | | 13,167,570 | | | | 12.92 | |
Nuveen Mid Cap Select Fund | | | | | | | | | | | | |
Class A | | | 10,829,290 | | | | 1,142,695 | | | | 9.48 | |
Class C | | | 1,771,057 | | | | 203,540 | | | | 8.70 | |
Class I | | | 16,645,496 | | | | 1,679,671 | | | | 9.91 | |
Nuveen Mid Cap Value Fund | | | | | | | | | | | | |
Class A | | | 52,334,261 | | | | 2,396,972 | | | | 21.83 | |
Class B | | | 2,072,520 | | | | 101,013 | | | | 20.52 | |
Class C | | | 8,956,618 | | | | 426,776 | | | | 20.99 | |
Class R3 | | | 15,309,953 | | | | 705,606 | | | | 21.70 | |
Class I | | | 151,409,305 | | | | 6,886,476 | | | | 21.99 | |
S-68
| | | | | | | | | | | | |
Fund | | Net Assets | | | Shares
Outstanding | | | Net Asset Value
Per Share | |
Nuveen Quantitative Enhanced Core Equity Fund | | | | | | | | | | | | |
Class A | | $ | 164,204 | | | | 7,611 | | | $ | 21.57 | |
Class C | | | 108,491 | | | | 5,070 | | | | 21.40 | |
Class I | | | 107,733,362 | | | | 4,978,473 | | | | 21.64 | |
Nuveen Small Cap Growth Opportunities Fund | | | | | | | | | | | | |
Class A | | | 36,188,384 | | | | 1,773,001 | | | | 20.41 | |
Class B | | | 1,481,956 | | | | 83,619 | | | | 17.72 | |
Class C | | | 1,545,996 | | | | 83,212 | | | | 18.58 | |
Class R3 | | | 2,334,305 | | | | 116,472 | | | | 20.04 | |
Class I | | | 63,865,812 | | | | 2,897,996 | | | | 22.04 | |
Nuveen Small Cap Index Fund | | | | | | | | | | | | |
Class A | | | 19,406,189 | | | | 1,860,851 | | | | 10.43 | |
Class C | | | 1,329,721 | | | | 132,754 | | | | 10.02 | |
Class R3 | | | 11,824,551 | | | | 1,161,941 | | | | 10.18 | |
Class I | | | 40,134,618 | | | | 3,836,996 | | | | 10.46 | |
Nuveen Small Cap Select Fund | | | | | | | | | | | | |
Class A | | | 275,993,913 | | | | 22,192,797 | | | | 12.44 | |
Class B | | | 2,865,730 | | | | 293,335 | | | | 9.77 | |
Class C | | | 14,009,295 | | | | 1,249,081 | | | | 11.22 | |
Class R3 | | | 20,044,459 | | | | 1,652,588 | | | | 12.13 | |
Class I | | | 273,982,754 | | | | 20,233,528 | | | | 13.54 | |
Nuveen Small Cap Value Fund | | | | | | | | | | | | |
Class A | | | 31,813,908 | | | | 2,815,639 | | | | 11.30 | |
Class C | | | 1,497,771 | | | | 150,852 | | | | 9.93 | |
Class R3 | | | 2,245,650 | | | | 202,141 | | | | 11.11 | |
Class I | | | 48,596,239 | | | | 4,171,285 | | | | 11.65 | |
Nuveen Tactical Market Opportunities Fund | | | | | | | | | | | | |
Class A | | | 3,557,930 | | | | 317,089 | | | | 11.22 | |
Class C | | | 474,588 | | | | 42,498 | | | | 11.17 | |
Class I | | | 48,860,291 | | | | 4,342,021 | | | | 11.25 | |
The public offering price of the shares of a Fund generally equals the Fund’s net asset value plus any applicable sales charge. A summary of any applicable sales charge assessed on Fund share purchases is set forth in the Funds’ Prospectus. The public offering price of the Class A shares of the Funds as of October 31, 2011 was as set forth below. Please note that the public offering prices of Class B, Class C, Class I, and Class R3 shares are the same as net asset value since no sales charges are imposed on the purchase of such shares.
| | | | |
Fund | | Public Offering Price
Class A | |
Nuveen Dividend Value Fund | | | $13.85 | |
Nuveen Equity Index Fund | | | 21.44 | |
Nuveen International Fund | | | 11.80 | |
Nuveen International Select Fund | | | 9.39 | |
Nuveen Large Cap Growth Opportunities Fund | | | 34.93 | |
Nuveen Large Cap Select Fund | | | 12.45 | |
Nuveen Large Cap Value Fund | | | 15.30 | |
Nuveen Mid Cap Growth Opportunities Fund | | | 43.88 | |
Nuveen Mid Cap Index Fund | | | 12.87 | |
S-69
| | | | |
Fund | | Public Offering Price
Class A | |
Nuveen Mid Cap Select Fund | | | $10.06 | |
Nuveen Mid Cap Value Fund | | | 23.16 | |
Nuveen Quantitative Enhanced Core Equity Fund | | | 21.57 | |
Nuveen Small Cap Growth Opportunities Fund | | | 21.66 | |
Nuveen Small Cap Index Fund | | | 10.43 | |
Nuveen Small Cap Select Fund | | | 13.20 | |
Nuveen Small Cap Value Fund | | | 11.99 | |
Nuveen Tactical Market Opportunities Fund | | | 11.90 | |
CAPITAL STOCK
Each share of each Fund’s $0.0001 par value common stock is fully paid, nonassessable, and transferable. Shares may be issued as either full or fractional shares. Fractional shares have pro rata the same rights and privileges as full shares. Shares of the Funds have no preemptive or conversion rights.
Each share of a Fund has one vote. On some issues, such as the election of directors, all shares of all NIF funds vote together as one series. The shares do not have cumulative voting rights. On issues affecting only a particular Fund, the shares of that Fund will vote as a separate series. Examples of such issues would be proposals to alter a fundamental investment restriction pertaining to a Fund or to approve, disapprove or alter a distribution plan. The Bylaws of NIF provide that annual shareholders meetings are not required and that meetings of shareholders need only be held with such frequency as required under Maryland law and the 1940 Act.
The following table sets forth the percentage ownership of each person, who, as of February 2, 2012, owned of record, or is known by NIF to have owned of record or beneficially, 5% or more of any class of a Fund’s shares.
| | | | | | |
Name of Fund and Class | | Name and Address of Owner | | Percentage
of
Ownership | |
| | |
Nuveen Dividend Value Fund
Class A Shares | | UBS WM USA Omni Account M/F Attn Department Manager 1000 Harbor Blvd Fl 5 Weehawken NJ 07086-6761 | | | 6.46% | |
| | |
Nuveen Dividend Value Fund
Class B Shares | | None | | | | |
| | |
Nuveen Dividend Value Fund
Class C Shares | | First Clearing, LLC Special Custody Acct for the Exclusive Benefit of Customer 2801 Market St Saint Louis MO 63103-2523 | | | 14.52% | |
| | |
| | Merrill Lynch Pierce Fenner & Smith Attn Physical Team 4800 Deer Lake Dr E Jacksonville FL 32246-6484 | | | 8.07% | |
| | |
| | Citigroup Global Markets Inc House Account Attn Peter Booth 333 W 34th St Fl 7 New York NY 10001-2402 | | | 7.57% | |
S-70
| | | | | | |
Name of Fund and Class | | Name and Address of Owner | | Percentage
of
Ownership | |
| | |
| | UBS WM USA Omni Account M/F Attn Department Manager 1000 Harbor Blvd Fl 5 Weehawken NJ 07086-6761 | | | 6.76% | |
| | |
| | Pershing LLC 1 Pershing Plz Jersey City NJ 07399-0001 | | | 6.43% | |
| | |
Nuveen Dividend Value Fund
Class R3 Shares | | Wells Fargo Bank FBO Various Retirement Plans 91525 West Wt Harris Blvd Charlotte NC 28288-1076 | | | 60.21% | |
| | |
| | Orchard Trust Co TTEE Employee Benefits Clients 401k 8515 E Orchard Rd 2T2 Greenwood Village CO 80111-5002 | | | 5.34% | |
| | |
Nuveen Dividend Value Fund
Class I Shares | | Band & Co C/O US Bank PO Box 1787 Milwaukee WI 53201-1787 | | | 45.50% | |
| | |
| | Washington & Co PO Box 1787 Milwaukee WI 53201-1787 | | | 15.30% | |
| | |
| | Capinco C/O US Bank PO Box 1787 Milwaukee WI 53201-1787 | | | 11.07% | |
| | |
| | Charles Schwab & Co Inc Special Custody Account For Benefit of Customers Attn Mutual Funds 101 Montgomery St San Francisco CA 94104-4151 | | | 9.83% | |
| | |
Nuveen Equity Index Fund
Class A Shares | | Orchard Trust Co LLC Trustee/C FBO Retirement Plans 8515 E Orchard Rd 2T2 Greenwood Vlg CO 80111-5002 | | | 9.63% | |
| | |
| | Hartford Life Insurance Company Separate Account Attn UIT Operations PO Box 2999 Hartford CT 06104-2999 | | | 7.53% | |
| | |
Nuveen Equity Index Fund
Class B Shares | | First Clearing, LLC Special Custody Acct for the Exclusive Benefit of Customer 2801 Market St Saint Louis MO 63103-2523 | | | 5.14% | |
S-71
| | | | | | |
Name of Fund and Class | | Name and Address of Owner | | Percentage
of
Ownership | |
| | |
Nuveen Equity Index Fund
Class C Shares | | UBS WM USA Omni Account M/F Attn Department Manager 1000 Harbor Blvd Fl 5 Weehawken NJ 07086-6761 | | | 13.18% | |
| | |
| | First Clearing, LLC Special Custody Acct for the Exclusive Benefit of Customer 2801 Market St Saint Louis MO 63103-2523 | | | 11.17% | |
| | |
| | Merrill Lynch Pierce Fenner & Smith Attn Physical Team 4800 Deer Lake Dr E Jacksonville FL 32246-6484 | | | 10.47% | |
| | |
| | Orchard Trust Co LLC Trustee/C FBO Retirement Plans 8515 E Orchard Rd 2T2 Greenwood Vlg CO 80111-5002 | | | 7.80% | |
| | |
Nuveen Equity Index Fund
Class R3 Shares | | Hartford Life Insurance Company Separate Account Attn UIT Operations PO Box 2999 Hartford CT 06104-2999 | | | 32.86% | |
| | |
| | Frontier Trust Co FBO Martin Fox M D 401k PS PO Box 10758 Fargo ND 58106-0758 | | | 6.07% | |
| | |
| | NFS LLC Febo First Merchants Trust Co NA 200 E Jackson St PO Box 792 Muncie IN 47308-0792 | | | 5.13% | |
| | |
Nuveen Equity Index Fund
Class I Shares | | Orchard Trust Co LLC Trustee/C FBO Retirement Plans 8515 E Orchard Rd 2T2 Greenwood Vlg CO 80111-5002 | | | 34.04% | |
| | |
| | Band & Co C/O US Bank PO Box 1787 Milwaukee WI 53201-1787 | | | 26.71% | |
| | |
| | Capinco C/O US Bank PO Box 1787 Milwaukee WI 53201-1787 | | | 13.72% | |
| | |
| | Washington & Co C/O US Bank PO Box 1787 Milwaukee WI 53201-1787 | | | 9.58% | |
S-72
| | | | | | |
Name of Fund and Class | | Name and Address of Owner | | Percentage
of
Ownership | |
| | |
Nuveen International Fund
Class A Shares | | UBS WM USA Omni Account M/F Attn Department Manager 1000 Harbor Blvd Fl 5 Weehawken NJ 07086-6761 | | | 8.68% | |
| | |
Nuveen International Fund
Class C Shares | | UBS WM USA Omni Account M/F Attn Department Manager 1000 Harbor Blvd Fl 5 Weehawken NJ 07086-6761 | | | 23.02% | |
| | |
| | Pershing LLC 1 Pershing Plz Jersey City NJ 07399-0001 | | | 15.38% | |
| | |
Nuveen International Fund
Class R3 Shares | | Counsel Trust DBA MATC FBO Mercury Tool & Machine PS 401k Plan 1251 Waterfront Place Suite 525 Pittsburgh PA 15222-4228 | | | 77.76% | |
| | |
| | Ronnie D Bubar FBO Subaru of Grand Junction 401k 2496 Highway 6 and 50 Grand Jct CO 81505-1108 | | | 19.81% | |
| | |
Nuveen International Fund
Class I Shares | | Band & Co C/O US Bank PO Box 1787 Milwaukee WI 53201-1787 | | | 57.87% | |
| | |
| | Washington & Co C/O US Bank PO Box 1787 Milwaukee WI 53201-1787 | | | 23.24% | |
| | |
| | Capinco C/O US Bank PO Box 1787 Milwaukee WI 53201-1787 | | | 11.92% | |
| | |
Nuveen International Select Fund
Class A Shares | | State Street Bank 401k Plan FBO ADP Access 401(k) Product 1 Lincoln St Boston MA 02111-2901 | | | 17.90% | |
| | |
| | U S Bancorp Investments Inc 60 Livingston Ave Saint Paul MN 55107-2292 | | | 5.91% | |
| | |
Nuveen International Select Fund
Class C Shares | | UBS WM USA Omni Account M/F Attn Department Manager 1000 Harbor Blvd Fl 5 Weehawken NJ 07086-6761 | | | 36.75% | |
S-73
| | | | | | |
Name of Fund and Class | | Name and Address of Owner | | Percentage
of
Ownership | |
| | |
| | Morgan Stanley Smith Barney Harborside Financial Center Plaza 2 3rd Floor Jersey City NJ 07311 | | | 11.65% | |
| | |
| | Pershing LLC 1 Pershing Plz Jersey City NJ 07399-0001 | | | 10.03% | |
| | |
| | Stifel Nicolaus & Co Inc Philip Harrison 501 North Broadway St Louis MO 63102-2188 | | | 8.98% | |
| | |
Nuveen International Select Fund Class R3 Shares | | Pershing LLC 1 Pershing Plz Jersey City NJ 07399-0001 | | | 99.99% | |
| | |
Nuveen International Select Fund
Class I Shares | | Band & Co C/O US Bank PO Box 1787 Milwaukee WI 53201-1787 | | | 52.81% | |
| | |
| | Capinco C/O US Bank PO Box 1787 Milwaukee WI 53201-1787 | | | 24.93% | |
| | |
| | Washington & Co C/O US Bank PO Box 1787 Milwaukee WI 53201-1787 | | | 20.09% | |
| | |
Nuveen Large Cap Growth Opportunities Fund Class A Shares | | UBS WM USA Omni Account M/F Attn Department Manager 1000 Harbor Blvd Fl 5 Weehawken NJ 07086-6761 | | | 8.61% | |
| | |
| | Los Alamos County Pens Plan Hand Benefits & Trust Co TTEE 820 Gessner Rd Ste 1250 Houston TX 77024-4543 | | | 5.68% | |
| | |
Nuveen Large Cap Growth Opportunities Fund Class B Shares | | First Clearing, LLC Special Custody Acct for the Exclusive Benefit of Customer 2801 Market St Saint Louis MO 63103-2523 | | | 9.14% | |
| | |
Nuveen Large Cap Growth Opportunities Fund Class C Shares | | Merrill Lynch Pierce Fenner & Smith Attn Physical Team 4800 Deer Lake Dr E Jacksonville FL 32246-6484 | | | 31.97% | |
S-74
| | | | | | |
Name of Fund and Class | | Name and Address of Owner | | Percentage
of
Ownership | |
| | |
| | Pershing LLC 1 Pershing Plz Jersey City NJ 07399-0001 | | | 17.28% | |
| | |
| | UBS WM USA Omni Account M/F Attn Department Manager 1000 Harbor Blvd Fl 5 Weehawken NJ 07086-6761 | | | 6.67% | |
| | |
| | First Clearing, LLC Special Custody Acct for the Exclusive Benefit of Customer 2801 Market St Saint Louis MO 63103-2523 | | | 5.74% | |
| | |
| | Citigroup Global Markets Inc House Account Attn Peter Booth 333 W 34th St Fl 7 New York NY 10001-2402 | | | 5.35% | |
| | |
Nuveen Large Cap Growth Opportunities Fund Class R3 Shares | | TD Ameritrade Trust Co PO Box 17748 Denver CO 80217-0748 | | | 30.69% | |
| | |
| | Taynik & Co C/O Investors Bank & Trust Attn Mutual Fund Processing 200 Clarendon St FPG 90 Boston MA 02116-5097 | | | 11.60% | |
| | |
| | PIMS/Prudential Retirement as Nominee for the TTEE/Cust Pl 764 Fortney & Weygandt Inc 401 k 31269 Bradley Rd North Olmsted OH 44070-3875 | | | 9.42% | |
| | |
| | MG Trust Company Cust. FBO Delta Medix, P.C. 401k 700 17th Street Suite 300 Denver CO 80202-3531 | | | 9.19% | |
| | |
Nuveen Large Cap Growth Opportunities Fund Class I Shares | | Band & Co C/O US Bank PO Box 1787 Milwaukee WI 53201-1787 | | | 48.66% | |
| | |
| | Washington & Co C/O US Bank PO Box 1787 Milwaukee WI 53201-1787 | | | 17.86% | |
S-75
| | | | | | |
Name of Fund and Class | | Name and Address of Owner | | Percentage
of
Ownership | |
| | |
| | Capinco C/O US Bank PO Box 1787 Milwaukee WI 53201-1787 | | | 17.71% | |
| | |
Nuveen Large Cap Select Fund
Class A Shares | | None | | | | |
| | |
Nuveen Large Cap Select Fund
Class C Shares | | Pershing LLC 1 Pershing Plz Jersey City NJ 07399-0001 | | | 50.57% | |
| | |
| | Delbert B Hopkins & Sharon Hopkins Jt Caring Trust Delbert B Hopkins & Sharon Hopkins Tr U/A 07/11/2006 11311 N Cowboy Trl Prescott AZ 86305-5583 | | | 16.27% | |
| | |
| | Ameritrade Inc FBO PO Box 2226 Omaha NE 68103-2226 | | | 11.93% | |
| | |
| | US Bank NA Cust David M Vandenberg Sep IRA 108 S H St Lakeview OR 97630-1856 | | | 6.97% | |
| | |
Nuveen Large Cap Select Fund
Class R3 Shares | | A Evan Windhulz FBO Critter Control 401k Plan 805 S Wheatley St Ste 600 Ridgeland MS 39157-5005 | | | 65.30% | |
| | |
| | MG Trust Co Cust FBO Schlesinger & Associates 401k 700 17th St Ste 300 Denver CO 80202-3531 | | | 26.71% | |
| | |
| | Ronnie D Bubar FBO Subaru of Grand Junction 401k 2496 Highway 6 and 50 Grand Jct CO 81505-1108 | | | 7.99% | |
| | |
Nuveen Large Cap Select Fund
Class I Shares | | Band & Co C/O US Bank PO Box 1787 Milwaukee WI 53201-1787 | | | 44.11% | |
| | |
| | Capinco C/O US Bank PO Box 1787 Milwaukee WI 53201-1787 | | | 43.62% | |
| | |
| | Washington & Co C/O US Bank PO Box 1787 Milwaukee WI 53201-1787 | | | 9.58% | |
S-76
| | | | | | |
Name of Fund and Class | | Name and Address of Owner | | Percentage
of
Ownership | |
| | |
Nuveen Large Cap Value Fund
Class A Shares | | UBS WM USA Omni Account M/F Attn Department Manager 1000 Harbor Blvd Fl 5 Weehawken NJ 07086-6761 | | | 14.03% | |
| | |
Nuveen Large Cap Value Fund
Class C Shares | | UBS WM USA Omni Account M/F Attn Department Manager 1000 Harbor Blvd Fl 5 Weehawken NJ 07086-6761 | | | 13.28% | |
| | |
| | First Clearing, LLC Special Custody Acct for the Exclusive Benefit of Customer 2801 Market St Saint Louis MO 63103-2523 | | | 6.30% | |
| | |
Nuveen Large Cap Value Fund
Class R3 Shares | | State Street Bank 401k Plan FBO ADP Access 401(k) Product 1 Lincoln St Boston MA 02111-2901 | | | 66.52% | |
| | |
| | MG Trust Co Cust FBO Omaha Neon Sign Inc 700 17th St Ste 300 Denver CO 80202-3531 | | | 24.65% | |
| | |
Nuveen Large Cap Value Fund
Class I Shares | | Band & Co C/O US Bank PO Box 1787 Milwaukee WI 53201-1787 | | | 41.21% | |
| | |
| | Capinco C/O US Bank PO Box 1787 Milwaukee WI 53201-1787 | | | 41.16% | |
| | |
| | Orchard Trust Co LLC Trustee/C FBO Retirement Plans 8515 E Orchard Rd 2T2 Greenwood Vlg CO 80111-5002 | | | 8.90% | |
| | |
Nuveen Mid Cap Growth Opportunities Fund Class A Shares | | NFS LLC Febo State Street Bank Trust Co TTEE Various Retirement Plans 440 Mamaroneck Ave Harrison NY 10528-2418 | | | 17.83% | |
| | |
| | State Street Bank 401k Plan FBO ADP Access 401(k) Product 1 Lincoln St Boston MA 02111-2901 | | | 5.43% | |
S-77
| | | | | | |
Name of Fund and Class | | Name and Address of Owner | | Percentage
of
Ownership | |
| | |
Nuveen Mid Cap Growth Opportunities Fund Class B Shares | | Pershing LLC 1 Pershing Plz Jersey City NJ 07399-0001 | | | 9.45% | |
| | |
| | First Clearing, LLC Special Custody Acct for the Exclusive Benefit of Customer 2801 Market St Saint Louis MO 63103-2523 | | | 8.33% | |
| | |
Nuveen Mid Cap Growth Opportunities Fund Class C Shares | | Pershing LLC 1 Pershing Plz Jersey City NJ 07399-0001 | | | 17.66% | |
| | |
| | Merrill Lynch Pierce Fenner & Smith Attn Physical Team 4800 Deer Lake Dr E Jacksonville FL 32246-6484 | | | 12.34% | |
| | |
| | First Clearing, LLC Special Custody Acct for the Exclusive Benefit of Customer 2801 Market St Saint Louis MO 63103-2523 | | | 7.87% | |
| | |
| | UBS WM USA Omni Account M/F Attn Department Manager 1000 Harbor Blvd Fl 5 Weehawken NJ 07086-6761 | | | 6.72% | |
| | |
Nuveen Mid Cap Growth Opportunities Fund Class R3 Shares | | Hartford Life Insurance Company Separate Account Attn UIT Operations PO Box 2999 Hartford CT 06104-2999 | | | 12.66% | |
| | |
| | State Street Bank 401k Plan FBO ADP Access 401(k) Product 1 Lincoln St Boston MA 02111-2901 | | | 11.46% | |
| | |
| | Nabank & Co PO Box 2180 Tulsa OK 74101-2180 | | | 6.19% | |
| | |
Nuveen Mid Cap Growth Opportunities Fund Class I Shares | | Band & Co C/O US Bank PO Box 1787 Milwaukee WI 53201-1787 | | | 28.39% | |
S-78
| | | | | | |
Name of Fund and Class | | Name and Address of Owner | | Percentage
of
Ownership | |
| | |
| | Orchard Trust Co LLC Trustee/C FBO Retirement Plans 8515 E Orchard Rd 2T2 Greenwood Vlg CO 80111-5002 | | | 16.96% | |
| | |
| | Capinco C/O US Bank PO Box 1787 Milwaukee WI 53201-1787 | | | 10.27% | |
| | |
| | Washington & Co C/O US Bank PO Box 1787 Milwaukee WI 53201-1787 | | | 9.29% | |
| | |
| | NFS LLC Febo State Street Bank Trust Co TTEE Various Retirement Plans 440 Mamaroneck Ave Harrison NY 10528-2418 | | | 6.71% | |
| | |
| | NFS LLC Febo FIIOC Agent FBO Qualified Employee Plans 401k Finops-IC Funds 1000 Magellan Way KW1C Covington KY 41015-1987 | | | 5.29% | |
| | |
Nuveen Mid Cap Index Fund
Class A Shares | | Hartford Life Insurance Company Separate Account Attn UIT Operations PO Box 2999 Hartford CT 06104-2999 | | | 27.96% | |
| | |
| | C/O Fascore LLC Reliance Trust Co FBO Retirement Plans Serviced by Metlif 8515 E Orchard Rd 2T2 Greenwood Village CO 80111-5002 | | | 11.39% | |
| | |
Nuveen Mid Cap Index Fund
Class C Shares | | First Clearing, LLC Special Custody Acct for the Exclusive Benefit of Customer 2801 Market St Saint Louis MO 63103-2523 | | | 22.83% | |
| | |
| | Morgan Stanley Smith Barney Harborside Financial Center Plaza 2 3rd Floor Jersey City NJ 07311 | | | 11.85% | |
| | |
| | MG Trust Robco Corp 700 17th St Ste 300 Denver CO 80202-3531 | | | 5.95% | |
S-79
| | | | | | |
Name of Fund and Class | | Name and Address of Owner | | Percentage
of
Ownership | |
| | |
| | Merrill Lynch Pierce Fenner & Smith Attn Physical Team 4800 Deer Lake Dr E Jacksonville FL 32246-6484 | | | 5.91% | |
| | |
| | Pershing LLC 1 Pershing Plz Jersey City NJ 07399-0001 | | | 5.67% | |
| | |
Nuveen Mid Cap Index Fund
Class R3 Shares | | Hartford Life Insurance Company Separate Account Attn UIT Operations PO Box 2999 Hartford CT 06104-2999 | | | 45.22% | |
| | |
| | State Street Bank 401k Plan FBO ADP Access 401(k) Product 1 Lincoln St Boston MA 02111-2901 | | | 10.12% | |
| | |
Nuveen Mid Cap Index Fund
Class I Shares | | Band & Co C/O US Bank PO Box 1787 Milwaukee WI 53201-1787 | | | 43.08% | |
| | |
| | Capinco C/O US Bank PO Box 1787 Milwaukee WI 53201-1787 | | | 14.25% | |
| | |
| | Washington & Co C/O US Bank PO Box 1787 Milwaukee WI 53201-1787 | | | 12.67% | |
| | |
| | Orchard Trust Co LLC Trustee/C FBO Retirement Plans 8515 E Orchard Rd 2T2 Greenwood Vlg CO 80111-5002 | | | 10.50% | |
| | |
Nuveen Mid Cap Select Fund
Class A Shares | | UBS WM USA Omni Account M/F Attn Department Manager 1000 Harbor Blvd Fl 5 Weehawken NJ 07086-6761 | | | 7.89% | |
| | |
| | Pershing LLC 1 Pershing Plz Jersey City NJ 07399-0001 | | | 5.70% | |
| | |
Nuveen Mid Cap Select Fund
Class C Shares | | Pershing LLC 1 Pershing Plz Jersey City NJ 07399-0001 | | | 14.08% | |
| | |
| | UBS WM USA Omni Account M/F Attn Department Manager 1000 Harbor Blvd Fl 5 Weehawken NJ 07086-6761 | | | 11.58% | |
S-80
| | | | | | |
Name of Fund and Class | | Name and Address of Owner | | Percentage
of
Ownership | |
| | |
| | US Bank NA Cust Tom S Reed Sep IRA 19486 Elena Ln Jamul CA 91935-6835 | | | 8.16% | |
| | |
Nuveen Mid Cap Select Fund
Class I Shares | | Band & Co C/O US Bank PO Box 1787 Milwaukee WI 53201-1787 | | | 39.14% | |
| | |
| | Washington & Co C/O US Bank PO Box 1787 Milwaukee WI 53201-1787 | | | 36.28% | |
| | |
| | Orchard Trust Co LLC Trustee/C FBO Retirement Plans 8515 E Orchard Rd 2T2 Greenwood Vlg CO 80111-5002 | | | 10.19% | �� |
| | |
| | Capinco C/O US Bank PO Box 1787 Milwaukee WI 53201-1787 | | | 10.11% | |
| | |
Nuveen Mid Cap Value Fund
Class A Shares | | Pershing LLC 1 Pershing Plz Jersey City NJ 07399-0001 | | | 9.44% | |
| | |
| | Charles Schwab & Co Inc Special Custody Account For Benefit of Customers Attn Mutual Funds 101 Montgomery St San Francisco CA 94104-4151 | | | 7.59% | |
| | |
Nuveen Mid Cap Value Fund
Class B Shares | | Pershing LLC 1 Pershing Plz Jersey City NJ 07399-0001 | | | 13.61% | |
| | |
| | First Clearing, LLC Special Custody Acct for the Exclusive Benefit of Customer 2801 Market St Saint Louis MO 63103-2523 | | | 6.55% | |
| | |
Nuveen Mid Cap Value Fund
Class C Shares | | Morgan Stanley Smith Barney Harborside Financial Center Plaza 2 3rd Floor Jersey City NJ 07311 | | | 23.04% | |
| | |
| | Pershing LLC 1 Pershing Plz Jersey City NJ 07399-0001 | | | 13.83% | |
| | |
| | LPL Financial 9785 Towne Centre Dr San Diego CA 92121-1968 | | | 5.67% | |
S-81
| | | | | | |
Name of Fund and Class | | Name and Address of Owner | | Percentage
of
Ownership | |
| | |
Nuveen Mid Cap Value Fund
Class R3 Shares | | State Street Bank 401k Plan FBO ADP Access 401(k) Product 1 Lincoln St Boston MA 02111-2901 | | | 12.04% | |
| | |
| | NFS LLC Febo 1st Source Bank Trust Operations 2nd Floor PO Box 1602 South Bend IN 46634-1602 | | | 7.21% | |
| | |
| | Frontier Trust Co FBO Various Retirement Plans PO Box 10758 Fargo ND 58106-0758 | | | 5.46% | |
| | |
| | DCGT as TTEE and/or Cust FBO Principal Financial Group Qualified Prin Advtg Omnibus Attn NPIO Trade Desk 711 High St Des Moines IA 50392-0001 | | | 5.21% | |
| | |
Nuveen Mid Cap Value Fund
Class I Shares | | Band & Co C/O US Bank PO Box 1787 Milwaukee WI 53201-1787 | | | 37.40% | |
| | |
| | Capinco C/O US Bank PO Box 1787 Milwaukee WI 53201-1787 | | | 19.76% | |
| | |
| | Washington & Co C/O US Bank PO Box 1787 Milwaukee WI 53201-1787 | | | 17.16% | |
| | |
| | Orchard Trust Co LLC Trustee/C FBO Retirement Plans 8515 E Orchard Rd 2T2 Greenwood Vlg CO 80111-5002 | | | 7.09% | |
| | |
Nuveen Quantitative Enhanced Core Equity Fund
Class A Shares | | U S Bancorp Investments Inc 60 Livingston Ave Saint Paul MN 55107-2292 | | | 19.57% | |
| | |
| | U S Bancorp Investments Inc 60 Livingston Ave Saint Paul MN 55107-2292 | | | 16.09% | |
| | |
| | U S Bancorp Investments Inc 60 Livingston Ave Saint Paul MN 55107-2292 | | | 11.28% | |
| | |
| | U.S. Bancorp Investments Inc. 60 Livingston Ave St Paul MN 55107-2292 | | | 9.13% | |
S-82
| | | | | | |
Name of Fund and Class | | Name and Address of Owner | | Percentage
of
Ownership | |
| | |
| | U S Bancorp Investments Inc 60 Livingston Ave St Paul MN 55107-2292 | | | 8.74% | |
| | |
| | U.S. Bancorp Investments Inc. 60 Livingston Ave St Paul MN 55107-2292 | | | 5.09% | |
| | |
Nuveen Quantitative Enhanced Core Equity Fund Class C Shares | | Raymond James & Assoc Inc FBO Arlene Poulos PO Box 63630 Philadelphia PA 19147-7430 | | | 47.67% | |
| | |
| | Raymond James & Assoc Inc Csdn FBO Joyce Fogarty IRA 43 Everturn Ln Levittown PA 19054-2723 | | | 17.24% | |
| | |
| | Raymond James & Assoc Inc Csdn FBO Thomas J Rose IRA 825 N 29th St Apt 2A Philadelphia PA 19130-1147 | | | 16.98% | |
| | |
| | Raymond James & Assoc Inc Csdn FBO Joseph P Ianni Sep IRA 1526 Wolf St Philadelphia PA 19145-4441 | | | 9.47% | |
| | |
| | Raymond James & Assoc Inc Csdn FBO Arlene Poulos IRA PO Box 63630 Philadelphia PA 19147-7430 | | | 8.64% | |
| | |
Nuveen Quantitative Enhanced Core Equity Fund Class I Shares | | Band & Co C/O US Bank PO Box 1787 Milwaukee WI 53201-1787 | | | 55.14% | |
| | |
| | Capinco C/O US Bank PO Box 1787 Milwaukee WI 53201-1787 | | | 39.72% | |
| | |
Nuveen Small Cap Growth Opportunities Fund Class A Shares | | None | | | | |
| | |
Nuveen Small Cap Growth Opportunities Fund Class B Shares | | Pershing LLC 1 Pershing Plz Jersey City NJ 07399-0001 | | | 8.48% | |
| | |
| | NFS LLC Febo NFS/FMTC Rollover IRA FBO Karen B Knight 6917 Crow Wing Dr NE Cedar Rapids IA 52411-7712 | | | 6.13% | |
S-83
| | | | | | |
Name of Fund and Class | | Name and Address of Owner | | Percentage
of
Ownership | |
| | |
Nuveen Small Cap Growth Opportunities Fund Class C Shares | | First Clearing, LLC Special Custody Acct for the Exclusive Benefit of Customer 2801 Market St Saint Louis MO 63103-2523 | | | 22.68% | |
| | |
| | Pershing LLC 1 Pershing Plz Jersey City NJ 07399-0001 | | | 12.45% | |
| | |
| | Raymond James & Assoc Inc Csdn Terence R Maddy IRA 28496 243rd Ave Shevlin MN 56676-4264 | | | 6.11% | |
| | |
| | Citigroup Global Markets Inc House Account Attn Peter Booth 333 W 34th St Fl 7 New York NY 10001-2402 | | | 5.56% | |
| | |
Nuveen Small Cap Growth Opportunities Fund Class R3 Shares | | TD Ameritrade Trust Company PO Box 17748 Denver CO 80217-0748 | | | 39.13% | |
| | |
| | Frontier Trust Co FBO Ability Services Network Inc 401 PO Box 10758 Fargo ND 58106-0758 | | | 9.66% | |
| | |
| | Don P Hargroder FBO Abbeville/Lafayette Courtesy 401k 4750 Johnston St PO Box 61130 Lafayette LA 70596-1130 | | | 6.08% | |
| | |
Nuveen Small Cap Growth Opportunities Fund Class I Shares | | Band & Co C/O US Bank PO Box 1787 Milwaukee WI 53201-1787 | | | 65.77% | |
| | |
| | Capinco C/O US Bank PO Box 1787 Milwaukee WI 53201-1787 | | | 15.14% | |
| | |
| | Orchard Trust Co LLC Trustee/C FBO Retirement Plans 8515 E Orchard Rd 2T2 Greenwood Vlg CO 80111-5002 | | | 6.66% | |
| | |
| | Washington & Co C/O US Bank PO Box 1787 Milwaukee WI 53201-1787 | | | 5.62% | |
S-84
| | | | | | |
Name of Fund and Class | | Name and Address of Owner | | Percentage
of
Ownership | |
| | |
Nuveen Small Cap Index Fund
Class A Shares | | Hartford Life Insurance Company Separate Account Attn UIT Operations PO Box 2999 Hartford CT 06104-2999 | | | 27.40% | |
| | |
| | Orchard Trust Co LLC Trustee/C FBO Retirement Plans 8515 E Orchard Rd 2T2 Greenwood Vlg CO 80111-5002 | | | 9.91% | |
| | |
Nuveen Small Cap Index Fund
Class C Shares | | First Clearing, LLC Special Custody Acct for the Exclusive Benefit of Customer 2801 Market St Saint Louis MO 63103-2523 | | | 17.58% | |
| | |
| | Sterling Trust Company Cust FBO Calhoun Dental Ltd 401k 700 17th St Ste 300 Denver CO 80202-3531 | | | 9.58% | |
| | |
| | UBS WM USA Omni Account M/F Attn Department Manager 1000 Harbor Blvd Fl 5 Weehawken NJ 07086-6761 | | | 8.16% | |
| | |
| | US Bank NA Cust Catherine M Henderson IRA 4504 Village Crest Dr Flower Mound TX 75022-1029 | | | 7.47% | |
| | |
| | Pershing LLC 1 Pershing Plz Jersey City NJ 07399-0001 | | | 6.58% | |
| | |
Nuveen Small Cap Index Fund
Class R3 Shares | | Hartford Life Insurance Company Separate Account Attn UIT Operations PO Box 2999 Hartford CT 06104-2999 | | | 30.26% | |
| | |
| | Massachusetts Mutual Life Insurance Co 1295 State St MIP C255 Springfield MA 01111-0001 | | | 15.11% | |
| | |
| | AUL American Unit Trust Attn Separate Accts PO Box 368 Indianapolis IN 46206-0368 | | | 9.92% | |
| | |
Nuveen Small Cap Index Fund
Class I Shares | | Band & Co C/O US Bank PO Box 1787 Milwaukee WI 53201-1787 | | | 47.90% | |
S-85
| | | | | | |
Name of Fund and Class | | Name and Address of Owner | | Percentage
of
Ownership | |
| | |
| | Orchard Trust Co LLC Trustee/C FBO Retirement Plans 8515 E Orchard Rd 2T2 Greenwood Vlg CO 80111-5002 | | | 26.02% | |
| | |
| | Capinco C/O US Bank PO Box 1787 Milwaukee WI 53201-1787 | | | 8.84% | |
| | |
| | Washington & Co C/O US Bank PO Box 1787 Milwaukee WI 53201-1787 | | | 5.78% | |
| | |
Nuveen Small Cap Select Fund
Class A Shares | | Charles Schwab & Co Inc Special Custody Account For Benefit of Customers Attn Mutual Funds 101 Montgomery St San Francisco CA 94104-4151 | | | 47.03% | |
| | |
| | Great West Life & Annuity GWLA-FFII-First Amer Sm Cap Sel A 8515 East Orchard Rd 2T2 Greenwood Vlg CO 80111-5002 | | | 9.31% | |
| | |
Nuveen Small Cap Select Fund
Class B Shares | | First Clearing, LLC Special Custody Acct for the Exclusive Benefit of Customer 2801 Market St Saint Louis MO 63103-2523 | | | 15.70% | |
| | |
| | Pershing LLC 1 Pershing Plz Jersey City NJ 07399-0001 | | | 8.33% | |
| | |
Nuveen Small Cap Select Fund
Class C Shares | | Pershing LLC 1 Pershing Plz Jersey City NJ 07399-0001 | | | 11.92% | |
| | |
| | UBS WM USA Omni Account M/F Attn Department Manager 1000 Harbor Blvd Fl 5 Weehawken NJ 07086-6761 | | | 5.46% | |
| | |
Nuveen Small Cap Select Fund
Class R3 Shares | | NFS LLC Febo State Street Bank Trust Co TTEE Various Retirement Plans 440 Mamaroneck Ave Harrison NY 10528-2418 | | | 13.51% | |
| | |
| | Hartford Life Insurance Company Separate Account Attn UIT Operations PO Box 2999 Hartford CT 06104-2999 | | | 9.69% | |
S-86
| | | | | | |
Name of Fund and Class | | Name and Address of Owner | | Percentage
of
Ownership | |
| | |
| | DCGT as TTEE and/or Cust FBO Principal Financial Group Qualified Fia Omnibus Attn NPIO Trade Desk 711 High St Des Moines IA 50392-0001 | | | 9.49% | |
| | |
| | Taynik & Co C/O Investors Bank & Trust Attn Mutual Fund Processing 200 Clarendon St FPG 90 Boston MA 02116-5097 | | | 9.20% | |
| | |
| | Massachusetts Mutual Life Insurance Co 1295 State St MIP C255 Springfield MA 01111-0001 | | | 6.04% | |
| | |
| | State Street Bank 401k Plan FBO ADP Access 401(k) Product 1 Lincoln St Boston MA 02111-2901 | | | 5.19% | |
| | |
Nuveen Small Cap Select Fund
Class I Shares | | Orchard Trust Co LLC Trustee/C FBO Retirement Plans 8515 E Orchard Rd 2T2 Greenwood Vlg CO 80111-5002 | | | 19.30% | |
| | |
| | Band & Co C/O US Bank PO Box 1787 Milwaukee WI 53201-1787 | | | 18.07% | |
| | |
| | Washington & Co C/O US Bank PO Box 1787 Milwaukee WI 53201-1787 | | | 8.49% | |
| | |
| | Standard Insurance Company 1100 SW 6th Ave Ste P11A Portland OR 97204-1015 | | | 8.02% | |
| | |
| | DWS Trust Co TTEE ADP Enterprise Product PO Box 1757 Salem NJ 03079-1143 | | | 6.86% | |
| | |
| | NFS LLC Febo Transamerica Life Ins Co 1150 S Olive St Ste 2700 Los Angeles CA 90015-2211 | | | 6.29% | |
| | |
| | Capinco C/O US Bank PO Box 1787 Milwaukee WI 53201-1787 | | | 6.01% | |
S-87
| | | | | | |
Name of Fund and Class | | Name and Address of Owner | | Percentage
of
Ownership | |
| | |
| | Taynik & Co C/O Investors Bank & Trust Attn Mutual Fund Processing 200 Clarendon St FPG 90 Boston MA 02116-5097 | | | 5.60% | |
| | |
Nuveen Small Cap Value Fund
Class A Shares | | UBS WM USA Omni Account M/F Attn Department Manager 1000 Harbor Blvd Fl 5 Weehawken NJ 07086-6761 | | | 5.09% | |
| | |
Nuveen Small Cap Value Fund
Class C Shares | | Pershing LLC 1 Pershing Plz Jersey City NJ 07399-0001 | | | 11.64% | |
| | |
| | UBS WM USA Omni Account M/F Attn Department Manager 1000 Harbor Blvd Fl 5 Weehawken NJ 07086-6761 | | | 6.59% | |
| | |
| | Merrill Lynch Pierce Fenner & Smith Attn Physical Team 4800 Deer Lake Dr E Jacksonville FL 32246-6484 | | | 5.24% | |
| | |
Nuveen Small Cap Value Fund
Class R3 Shares | | NFS LLC Febo State Street Bank Trust Co TTEE Various Retirement Plans 440 Mamaroneck Ave Harrison NY 10528-2418 | | | 22.73% | |
| | |
| | Frontier Trust Co FBO Various Retirement Plans PO Box 10758 Fargo ND 58106-0758 | | | 11.15% | |
| | |
| | Frontier Trust Co FBO Integrated Design Inc 401k Plan PO Box 10758 Fargo ND 58106-0758 | | | 7.76% | |
| | |
| | Counsel Trust DBA MATC FBO Westminster International Comp 401 k Profit Sharing Plan & Trust 1251 Waterfront Pl Ste 525 Pittsburgh PA 15222-4228 | | | 6.29% | |
| | |
| | AUL Group Retirement Account Attn Separate Accts PO Box 368 Indianapolis IN 46206-0368 | | | 6.28% | |
S-88
| | | | | | |
Name of Fund and Class | | Name and Address of Owner | | Percentage
of
Ownership | |
| | |
| | DCGT as TTEE and/or Cust FBO Principal Financial Group Qualified Prin Advtg Omnibus Attn NPIO Trade Desk 711 High St Des Moines IA 50392-0001 | | | 5.49% | |
| | |
Nuveen Small Cap Value Fund
Class I Shares | | Orchard Trust Co LLC Trustee/C FBO Retirement Plans 8515 E Orchard Rd 2T2 Greenwood Vlg CO 80111-5002 | | | 41.12% | |
| | |
| | Band & Co C/O US Bank PO Box 1787 Milwaukee WI 53201-1787 | | | 25.07% | |
| | |
| | Capinco C/O US Bank PO Box 1787 Milwaukee WI 53201-1787 | | | 10.79% | |
| | |
| | Trust Co of America PO Box 6503 Englewood CO 80155-6503 | | | 7.26% | |
| | |
| | Washington & Co PO Box 1787 Milwaukee WI 53201-1787 | | | 7.06% | |
| | |
| | NFS LLC Febo Transamerica Life Ins Co 1150 S Olive St Ste 2700 Los Angeles CA 90015-2211 | | | 5.43% | |
| | |
Nuveen Tactical Market Opportunities Fund
Class A Shares | | LPL Financial FBO Customer Accounts Attn Mutual Fund Operations PO Box 509046 San Diego CA 92150-9046 | | | 12.83% | |
| | |
| | Pershing LLC 1 Pershing Plz Jersey City NJ 07399-0001 | | | 12.18% | |
| | |
| | UBS WM USA Omni Account M/F Attn Department Manager 1000 Harbor Blvd Fl 5 Weehawken NJ 07086-6761 | | | 7.35% | |
| | |
| | Charles Schwab & Co Inc Special Custody Account For Benefit of Customers Attn Mutual Funds 101 Montgomery St San Francisco CA 94104-4151 | | | 5.44% | |
S-89
| | | | | | |
Name of Fund and Class | | Name and Address of Owner | | Percentage
of
Ownership | |
| | |
Nuveen Tactical Market Opportunities Fund Class C Shares | | Pershing LLC 1 Pershing Plz Jersey City NJ 07399-0001 | | | 5.31% | |
| | |
Nuveen Tactical Market Opportunities Fund Class I Shares | | Capinco C/O US Bank PO Box 1787 Milwaukee WI 53201-1787 | | | 62.71% | |
| | |
| | LPL Financial FBO Customer Accounts Attn Mutual Fund Operations PO Box 509046 San Diego CA 92150-9046 | | | 7.57% | |
TAX MATTERS
Federal Income Tax Matters
This section summarizes some of the main U.S. federal income tax consequences of owning shares of a Fund. This section is current as of the date of this Statement of Additional Information. Tax laws and interpretations change frequently, and this summary does not describe all of the tax consequences to all taxpayers. For example, this summary generally does not describe your situation if you are a corporation, a non-U.S. person, a broker-dealer or other investor with special circumstances. In addition, this section does not describe your state, local or non-U.S. tax consequences. This federal income tax summary is based in part on the advice of counsel to the Funds. The Internal Revenue Service could disagree with any conclusions set forth in this section. In addition, Funds’ counsel was not asked to review, and has not reached a conclusion with respect to the federal income tax treatment of the assets to be deposited in the Funds. Consequently, this summary may not be sufficient for you to use for the purpose of avoiding penalties under federal tax law. As with any investment, you should seek advice based on your individual circumstances from your own tax professional.
Fund Status
Each Fund intends to qualify as a “regulated investment company” under the federal tax laws. If a Fund qualifies as a regulated investment company and distributes its income as required by the tax law, the Fund generally will not pay federal income taxes.
Qualification as a Regulated Investment Company
As a regulated investment company, a Fund will not be subject to federal income tax on the portion of its investment company taxable income, as that term is defined in the Code, without regard to the deduction for dividends paid and net capital gain (i.e., the excess of net long-term capital gain over net short-term capital loss) that it distributes to shareholders, provided that it distributes at least 90% of its investment company taxable income and 90% of its net tax-exempt interest income for the year (the “Distribution Requirement”) and satisfies certain other requirements of the Code that are described below. Each Fund also intends to make such distributions as are necessary to avoid the otherwise applicable 4% non-deductible excise tax on certain undistributed earnings.
In addition to satisfying the Distribution Requirement, each Fund must derive at least 90% of its gross income from (1) dividends, interest, certain payments with respect to loans of stock and
S-90
securities, gains from the sale or disposition of stock, securities or non-U.S. currencies and other income (including but not limited to gains from options, futures or forward contracts) derived with respect to its business of investing in such stock, securities or currencies, and (2) net income derived from an interest in “qualified publicly traded partnerships” (as such term is defined in the Code). Each Fund must also satisfy an asset diversification test in order to qualify as a regulated investment company. Under this test, at the close of each quarter of a Fund’s taxable year, (1) 50% or more of the value of the Fund’s assets must be represented by cash, United States government securities, securities of other regulated investment companies, and other securities, with such other securities limited, in respect of any one issuer, to an amount not greater than 5% of the value of the Fund’s assets and 10% of the outstanding voting securities of such issuer and (2) not more than 25% of the value of the Fund’s assets may be invested in securities of (a) any one issuer (other than U.S. government securities or securities of other regulated investment companies), or of two or more issuers which the Fund controls and which are engaged in the same, similar or related trades or businesses or (b) in the securities of one or more “qualified publicly traded partnerships” (as such term is defined in the Code). There are certain exceptions for failure to qualify if the failure is for reasonable cause or is de minimis, and certain corrective action is taken and certain tax payments are made by the Fund.
Distributions
Fund distributions are generally taxable. After the end of each year, you will receive a tax statement that separates your Fund’s distributions into two categories, ordinary income distributions and capital gains dividends. Ordinary income distributions are generally taxed at your ordinary tax rate, however, as further discussed below, certain ordinary income distributions received from the Fund may be taxed at the capital gains tax rates. Generally, you will treat all capital gains dividends as long-term capital gains regardless of how long you have owned your shares. To determine your actual tax liability for your capital gains dividends, you must calculate your total net capital gain or loss for the tax year after considering all of your other taxable transactions, as described below. In addition, a Fund may make distributions that represent a return of capital for tax purposes and thus will generally not be taxable to you. The tax status of your distributions from your Fund is not affected by whether you reinvest your distributions in additional shares or receive them in cash. The income from your Fund that you must take into account for federal income tax purposes is not reduced by amounts used to pay a deferred sales fee, if any. The tax laws may require you to treat distributions made to you in January as if you had received them on December 31 of the previous year. Under the “Health Care and Education Reconciliation Act of 2010,” income from the Fund may also be subject to a new 3.8 percent “medicare tax” imposed for taxable years beginning after 2012. This tax will generally apply to your net investment income if your adjusted gross income exceeds certain threshold amounts, which are $250,000 in the case of married couples filing joint returns and $200,000 in the case of single individuals.
Dividends Received Deduction
A corporation that owns shares generally will not be entitled to the dividends received deduction with respect to many dividends received from the Funds, because the dividends received deduction is generally not available for distributions from regulated investment companies. However, certain ordinary income dividends on shares that are attributable to qualifying dividends received by a Fund from certain corporations may be reported by the Fund as being eligible for the dividends received deduction.
If You Sell or Redeem Shares
If you sell or redeem your shares, you will generally recognize a taxable gain or loss. To determine the amount of this gain or loss, you must subtract your tax basis in your shares from the amount you receive in the transaction. Your tax basis in your shares is generally equal to the cost of your shares, generally including sales charges. In some cases, however, you may have to adjust your tax basis after you purchase your shares.
S-91
Taxation of Capital Gains and Losses
If you are an individual, the maximum marginal federal tax rate for net capital gain is generally 15% (generally 0% for certain taxpayers in the 10% and 15% tax brackets). These capital gains rates are generally effective for taxable years beginning before January 1, 2013. For later periods, if you are an individual, the maximum marginal federal tax rate for net capital gain is generally 20% (10% for certain taxpayers in the 10% and 15% tax brackets). The 20% rate is reduced to 18% for net capital gains from most property acquired after December 31, 2000, with a holding period of more than five years, and the 10% rate is reduced to 8% for net capital gains from most property (regardless of when acquired) with a holding period of more than five years. Net capital gain equals net long-term capital gain minus net short-term capital loss for the taxable year. Capital gain or loss is long-term if the holding period for the asset is more than one year and is short-term if the holding period for the asset is one year or less. You must exclude the date you purchase your shares to determine your holding period. However, if you receive a capital gain dividend from your Fund and sell your share at a loss after holding it for six months or less, the loss will be recharacterized as long-term capital loss to the extent of the capital gain dividend received. The tax rates for capital gains realized from assets held for one year or less are generally the same as for ordinary income. The Code treats certain capital gains as ordinary income in special situations.
Taxation of Certain Ordinary Income Dividends
Ordinary income dividends received by an individual shareholder from a regulated investment company such as the Fund are generally taxed at the same rates that apply to net capital gain (as discussed above), provided certain holding period requirements are satisfied and provided the dividends are attributable to qualifying dividends received by the Fund itself. These special rules relating to the taxation of ordinary income dividends from regulated investment companies generally apply to taxable years beginning before January 1, 2013. The Fund will provide notice to its shareholders of the amount of any distribution which may be taken into account as a dividend which is eligible for the capital gains tax rates.
In-Kind Distributions
Under certain circumstances, as described in the Prospectus, you may receive an in-kind distribution of Fund securities when you redeem shares or when your Fund terminates. This distribution will be treated as a sale for federal income tax purposes and you will generally recognize gain or loss, generally based on the value at that time of the securities and the amount of cash received. The Internal Revenue Service could, however, assert that a loss may not be currently deducted.
Exchanges
If you exchange shares of a Fund for shares of another Nuveen Mutual Fund, the exchange would generally be considered a sale for federal income tax purposes.
Deductibility of Fund Expenses
Expenses incurred and deducted by your Fund will generally not be treated as income taxable to you. In some cases, however, you may be required to treat your portion of these Fund expenses as income. In these cases you may be able to take a deduction for these expenses. However, certain miscellaneous itemized deductions, such as investment expenses, may be deducted by individuals only to the extent that all of these deductions exceed 2% of the individual’s adjusted gross income.
Non-U.S. Tax Credit
If your Fund invests in any non-U.S. securities, the tax statement that you receive may include an item showing non-U.S. taxes your Fund paid to other countries. In this case, dividends taxed to you
S-92
will include your share of the taxes your Fund paid to other countries. You may be able to deduct or receive a tax credit for your share of these taxes.
Investments in Certain Non-U.S. Corporations
If your Fund holds an equity interest in any “passive foreign investment companies” (“PFICs”), which are generally certain foreign corporations that receive at least 75% of their annual gross income from passive sources (such as interest, dividends, certain rents and royalties or capital gains) or that hold at least 50% of their assets in investments producing such passive income, your Fund could be subject to U.S. federal income tax and additional interest charges on gains and certain distributions with respect to those equity interests, even if all the income or gain is timely distributed to its shareholders. Your Fund will not be able to pass through to its shareholders any credit or deduction for such taxes. Your Fund may be able to make an election that could ameliorate these adverse tax consequences. In this case, your Fund would recognize as ordinary income any increase in the value of such PFIC shares, and as ordinary loss any decrease in such value to the extent it did not exceed prior increases included in income. Under this election, your Fund might be required to recognize in a year income in excess of its distributions from PFICs and its proceeds from dispositions of PFIC stock during that year, and such income would nevertheless be subject to the distribution requirement and would be taken into account for purposes of the 4% excise tax. Dividends paid by PFICs will not be treated as qualified dividend income.
Non-U.S. Investors
If you are a non-U.S. investor (i.e., an investor other than a U.S. citizen or resident or a U.S. corporation, partnership, estate or trust), you should be aware that, generally, subject to applicable tax treaties, distributions from a Fund will be characterized as dividends for federal income tax purposes (other than dividends which a Fund properly reports as capital gain dividends) and will be subject to U.S. income taxes, including withholding taxes, subject to certain exceptions described below. However, distributions received by a non-U.S. investor from a Fund that are properly reported by a Fund as capital gain dividends may not be subject to U.S. federal income taxes, including withholding taxes, provided that a Fund makes certain elections and certain other conditions are met. Distributions in respect of interests in the Fund after December 31, 2013 may be subject to a U.S. withholding tax of 30% in the case of distributions to (i) certain non-U.S. financial institutions that have not entered into an agreement with the U.S. Treasury to collect and disclose certain information and (ii) certain other non-U.S. entities that do not provide certain certifications and information about the entity’s U.S. owners. Dispositions of interests in the Fund by such persons may be subject to such withholding after December 31, 2014.
When a Fund has a capital loss carry-forward, it does not make capital gains distributions until the loss has been offset or expired. As of October 31, 2011, the following Funds had capital loss carry-forwards available for federal income tax purposes, expiring in the year indicated.
| | | | | | |
Fund | | Expiration Year | | Capital Loss Carry-Forwards (000’s omitted) |
Nuveen Dividend Value Fund | | 2017 | | $1,441 |
| | | | |
Nuveen Large Cap Select Fund | | 2016 | | 21,601 |
| | 2017 | | 54,315 |
| | | | |
Nuveen Large Cap Value Fund | | 2016 | | 9,778 |
| | 2017 | | 80,887 |
| | | | |
Nuveen Mid Cap Select Fund | | 2016 | | 7,820 |
| | 2017 | | 15,708 |
| | | | | | |
Nuveen Mid Cap Value Fund | | 2017 | | 64,991 |
S-93
| | | | | | |
Fund | | Expiration Year | | Capital Loss Carry-Forwards (000’s omitted) |
Nuveen Small Cap Index Fund | | 2017 | | 611 |
| | | | |
Nuveen Small Cap Value Fund | | 2016 | | 3,445 |
| | 2017 | | 37,113 |
When a Fund lends portfolio securities to a borrower as described above in “Investment Policies and Techniques—Lending of Portfolio Securities,” payments in lieu of dividends made by the borrower to the Fund will not constitute “qualified dividends” taxable at the same rate as long-term capital gains, even if the actual dividends would have constituted qualified dividends had the Fund held the securities. Such payments in lieu of dividends are taxable as ordinary income.
The foregoing relates only to federal income taxation and is a general summary of the federal tax law in effect as of the date of this SAI.
PURCHASE AND REDEMPTION OF FUND SHARES
As described in the Prospectus, the Funds provide you with alternative ways of purchasing Fund shares based upon your individual investment needs and preferences.
Each class of shares of a Fund represents an interest in the same portfolio of investments. Each class of shares is identical in all respects except that each class bears its own class expenses, including distribution and administration expenses, and each class has exclusive voting rights with respect to any distribution or service plan applicable to its shares. As a result of the differences in the expenses borne by each class of shares, net income per share, dividends per share and net asset value per share will vary among a Fund’s classes of shares. There are no conversion, preemptive or other subscription rights, except that Class B shares automatically convert into Class A shares as described below.
Shareholders of each class will share expenses proportionately for services that are received equally by all shareholders. A particular class of shares will bear only those expenses that are directly attributable to that class, where the type or amount of services received by a class varies from one class to another. For example, class-specific expenses generally will include distribution and service fees for those classes that pay such fees.
The expenses to be borne by specific classes of shares may include (i) transfer agency fees attributable to a specific class of shares, (ii) printing and postage expenses related to preparing and distributing materials such as shareholder reports, prospectuses and proxy statements to current shareholders of a specific class of shares, (iii) SEC and state securities registration fees incurred by a specific class of shares, (iv) the expense of administrative personnel and services required to support the shareholders of a specific class of shares, (v) litigation or other legal expenses relating to a specific class of shares, (vi) directors’ fees or expenses incurred as a result of issues relating to a specific class of shares, (vii) accounting expenses relating to a specific class of shares and (viii) any additional incremental expenses subsequently identified and determined to be properly allocated to one or more classes of shares.
Class A Shares
Class A shares may be purchased at a public offering price equal to the applicable net asset value per share plus an up-front sales charge imposed at the time of purchase as set forth in the Prospectus. Shareholders may qualify for a reduced sales charge, or the sales charge may be waived in its entirety, as described below. Nuveen Mutual Funds currently utilize two transfer agents and the ability to use the methods described below to reduce your sales charge is limited to aggregating values or purchases of funds that have the same transfer agent. All Nuveen Mutual Funds will begin using the same transfer agent in mid-2012, at which point you will be able to aggregate the values or purchases across all Nuveen Mutual Funds. Class A shares are also subject to an annual service fee of 0.25%. See “Distribution and Service Plan.”
S-94
Reduction or Elimination of Up-Front Sales Charge on Class A Shares
Rights of Accumulation. You may qualify for a reduced sales charge on a purchase of Class A shares of a Fund if the amount of your purchase, when added to the value that day of all of your shares of any Nuveen Mutual Fund, falls within the amounts stated in the Class A Sales Charges and Commissions table in “How You Can Buy and Sell Shares” in the Prospectus. You or your financial advisor must notify the Distributor or the Fund’s transfer agent of any cumulative discount whenever you plan to purchase Class A shares of a Fund that you wish to qualify for a reduced sales charge.
Letter of Intent. You may qualify for a reduced sales charge on a purchase of Class A shares of a Fund if you plan to purchase Class A shares of Nuveen Mutual Funds over the next 13 months and the total amount of your purchases would, if purchased at one time, qualify you for one of the reduced sales charges shown in the Class A Sales Charges and Commissions table in “How You Can Buy and Sell Shares” in the Prospectus. In order to take advantage of this option, you must complete the applicable section of the Application Form or sign and deliver to your financial advisor or other financial intermediary or to the Fund’s transfer agent a written Letter of Intent in a form acceptable to the Distributor. A Letter of Intent states that you intend, but are not obligated, to purchase over the next 13 months a stated total amount of Class A shares that would qualify you for a reduced sales charge shown above. You may count shares of all Nuveen Mutual Funds that you already own and any Class I and Class C shares of a Nuveen Mutual Fund that you purchase over the next 13 months towards completion of your investment program, but you will receive a reduced sales charge only on new Class A shares you purchase with a sales charge over the 13 months. You cannot count towards completion of your investment program Class A shares that you purchase without a sales charge through investment of distributions from a Nuveen Mutual Fund or otherwise.
By establishing a Letter of Intent, you agree that your first purchase of Class A shares of a Fund following execution of the Letter of Intent will be at least 5% of the total amount of your intended purchases. You further agree that shares representing 5% of the total amount of your intended purchases will be held in escrow pending completion of these purchases. All dividends and capital gains distributions on Class A shares held in escrow will be credited to your account. If total purchases, less redemptions, prior to the expiration of the 13 month period equal or exceed the amount specified in your Letter of Intent, the Class A shares held in escrow will be transferred to your account. If the total purchases, less redemptions, are less than the amount specified, you must pay the Distributor an amount equal to the difference between the amounts paid for these purchases and the amounts which would have been paid if the higher sales charge had been applied. If you do not pay the additional amount within 20 days after written request by the Distributor or your financial advisor, the Distributor will redeem an appropriate number of your escrowed Class A shares to meet the required payment. By establishing a Letter of Intent, you irrevocably appoint the Distributor as attorney to give instructions to redeem any or all of your escrowed shares, with full power of substitution in the premises.
You or your financial advisor must notify the Distributor or the Funds’ transfer agent whenever you make a purchase of Fund shares that you wish to be covered under the Letter of Intent option.
For purposes of determining whether you qualify for a reduced sales charge as described under Rights of Accumulation and Letter of Intent, you may include together with your own purchases those made by your spouse or domestic partner and your children under the age of 21 years, whether these purchases are made through a taxable or non-taxable account. You may also include purchases made by a corporation, partnership or sole proprietorship which is 100% owned, either alone or in combination, by any of the foregoing. In addition, a trustee or other fiduciary can count all shares purchased for a single trust, estate or other single fiduciary account that has multiple accounts (including one or more employee benefit plans of the same employer).
Elimination of Sales Charge on Class A Shares. Class A shares of a Fund may be purchased at net asset value without a sales charge by the following categories of investors:
| | • | | investors purchasing $1,000,000 or more; |
| | • | | current and former trustees/directors of the Nuveen Funds; |
S-95
| | • | | full-time and retired employees of Nuveen Investments, and subsidiaries thereof, or their immediate family members (immediate family members are defined as their spouses or domestic partners, parents, children, grandparents, grandchildren, parents-in-law, sons-in-law and daughters-in-law, siblings, a sibling’s spouse and a spouse’s siblings); |
| | • | | any person who, for at least the last 90 days, has been an officer, director or employee of any financial intermediary, or their immediate family members; |
| | • | | bank or broker-affiliated trust departments investing funds over which they exercise exclusive discretionary investment authority and that are held in a fiduciary, agency, advisory, custodial or similar capacity; |
| | • | | investors purchasing on a periodic fee, asset-based fee or no transaction fee basis through a broker-dealer sponsored mutual fund purchase program; |
| | • | | clients of investment advisers, financial planners or other financial intermediaries that charge periodic or asset-based fees for their services; and |
| | • | | employer-sponsored retirement plans except SEPs, SAR-SEPs, SIMPLE IRAs and KEOGH plans. |
Any Class A shares purchased pursuant to a special sales charge waiver must be acquired for investment purposes and on the condition that they will not be transferred or resold except through redemption by the Funds. You or your financial advisor must notify the Distributor or your Fund’s transfer agent whenever you make a purchase of Class A shares of any Fund that you wish to be covered under these special sales charge waivers.
Class A shares of any Fund may be issued at net asset value without a sales charge in connection with the acquisition by a Fund of another investment company. All purchases under the special sales charge waivers will be subject to minimum purchase requirements as established by the Funds.
The reduced sales charge programs may be modified or discontinued by the Funds at any time. For more information about the purchase of Class A shares or the reduced sales charge program, or to obtain the required application forms, call Nuveen Investor Services toll-free at (800) 257-8787.
Class B Shares
The applicable Funds will only issue Class B shares (i) upon the exchange of Class B shares from another Nuveen Mutual Fund and (ii) for purposes of dividend reinvestment. Class B shares are not available for new accounts or for additional investment into existing accounts.
You may be subject to a Contingent Deferred Sales Charge (“CDSC”) if you redeem your Class B shares prior to the end of the sixth year after purchase. See “Reduction or Elimination of Contingent Deferred Sales Charge” below.
Class B shares acquired through the reinvestment of dividends are not subject to a CDSC. Any CDSC will be imposed on the lower of the redeemed shares’ cost or net asset value at the time of redemption.
Class B shares will automatically convert to Class A shares eight years after purchase. The purpose of the conversion is to limit the distribution fees you pay over the life of your investment. All conversions will be done at net asset value without the imposition of any sales load, fee, or other charge, so that the value of each shareholder’s account immediately before conversion will be the same as the value of the account immediately after conversion. Class B shares acquired through reinvestment of distributions will convert into Class A shares based on the date of the initial purchase to which such shares relate. For this purpose, Class B shares acquired through reinvestment of distributions will be attributed to particular purchases of Class B shares in accordance with such procedures as the Board of Trustees may determine from time to time. Class B shares that are converted to Class A shares will remain subject to an annual service fee that is identical in amount for both Class B shares and Class A shares. Since net asset value per share of the Class B shares and the Class A shares may differ at the time of conversion, a shareholder may receive more or fewer Class A shares than the number of Class B shares converted. Any conversion of Class B shares into Class A shares will be subject to the continuing availability of an opinion of counsel or a private letter ruling
S-96
from the Internal Revenue Service to the effect that the conversion of shares would not constitute a taxable event under federal income tax law. Conversion of Class B shares into Class A shares might be suspended if such an opinion or ruling were no longer available.
Class C Shares
You may purchase Class C shares at a public offering price equal to the applicable net asset value per share without any up-front sales charge. Class C shares are subject to an annual distribution fee of 0.75% to compensate the Distributor for paying your financial advisor or other financial intermediary an ongoing sales commission. Class C shares are also subject to an annual service fee of 0.25% to compensate financial intermediaries for providing you with ongoing financial advice and other account services. The Distributor compensates financial intermediaries for sales of Class C shares at the time of the sale at a rate of 1% of the amount of Class C shares purchased, which represents an advance of the first year’s distribution fee of 0.75% plus an advance on the first year’s annual service fee of 0.25%. See “Distribution and Service Plan.”
Class C share purchase orders equaling or exceeding $1,000,000 will not be accepted. In addition, purchase orders for a single purchaser that, when added to the value that day of all of such purchaser’s shares of any class of any Nuveen Mutual Fund, cause the purchaser’s cumulative total of shares in Nuveen Mutual Funds to equal or exceed the aforementioned limit will not be accepted. Purchase orders for a single purchaser equal to or exceeding the foregoing limit should be placed only for Class A shares, unless such purchase has been reviewed and approved as suitable for the client by the appropriate compliance personnel of the financial intermediary, and the Fund receives written confirmation of such approval. Class C shares do not convert.
Redemption of Class C shares within 12 months of purchase may be subject to a CDSC of 1% of the lower of the purchase price or redemption proceeds. Because Class C shares do not convert to Class A shares and continue to pay an annual distribution fee indefinitely, Class C shares should normally not be purchased by an investor who expects to hold shares for significantly longer than eight years.
Reduction or Elimination of Contingent Deferred Sales Charge
Class A shares are normally redeemed at net asset value, without any CDSC. However, in the case of Class A shares purchased at net asset value without a sales charge because the purchase amount exceeded $1 million, a CDSC is imposed on any redemption within 12 months of purchase. In the case of Class B shares redeemed within six years of purchase, a CDSC is imposed, beginning at 5% for redemptions within the first two years, and declining by 1% each year thereafter until disappearing after the sixth year. Class C shares are redeemed at net asset value, without any CDSC, except that a CDSC of 1% is imposed upon any redemption within 12 months of purchase (except in cases where the shareholder’s financial advisor agreed to waive the right to receive an advance of the first year’s distribution and service fee).
In determining whether a CDSC is payable, each Fund will first redeem shares not subject to any charge and then will redeem shares held for the longest period, unless the shareholder specifies another order. No CDSC is charged on shares purchased as a result of automatic reinvestment of dividends or capital gains paid. In addition, no CDSC will be charged on exchanges of shares into another Nuveen Mutual Fund. The holding period is calculated on a monthly basis and begins on the first day of the month in which the purchase was made. The CDSC is assessed on an amount equal to the lower of the then current market value or the cost of the shares being redeemed. Accordingly, no sales charge is imposed on increases of net asset value above the initial purchase price. The Distributor receives the amount of any CDSC shareholders pay.
The CDSC may be waived or reduced under the following circumstances: (i) in the event of total disability (as evidenced by a determination by the federal Social Security Administration) of the shareholder (including a registered joint owner) occurring after the purchase of the shares being redeemed; (ii) in the event of the death of the shareholder (including a registered joint owner); (iii) for redemptions made pursuant to a systematic withdrawal plan, up to 1% monthly, 3% quarterly, 6% semiannually or 12% annually of an account’s net asset value depending on the frequency of the plan as designated by the shareholder; (iv) involuntary redemptions caused by operation of law; (v) redemptions in connection with a payment of account or plan fees; (vi) redemptions in connection
S-97
with the exercise of a reinstatement privilege whereby the proceeds of a redemption of a Fund’s shares subject to a sales charge are reinvested in shares of certain Funds within a specified number of days; (vii) redemptions in connection with the exercise of a Fund’s right to redeem all shares in an account that does not maintain a certain minimum balance or that the Board of Directors has determined may have material adverse consequences to the shareholders of a Fund; (viii) in whole or in part for redemptions of shares by shareholders with accounts in excess of specified breakpoints that correspond to the breakpoints under which the up-front sales charge on Class A shares is reduced pursuant to Rule 22d-1 under the Act; (ix) redemptions of shares purchased under circumstances or by a category of investors for which Class A shares could be purchased at net asset value without a sales charge; (x) redemptions of Class A, Class B or Class C shares if the proceeds are transferred to an account managed by the Adviser and the Adviser refunds the advanced service and distribution fees to the Distributor; (xi) redemptions of Class C shares in cases where the Distributor did not advance the first year’s service and distribution fees when such shares were purchased; and (xii) redemptions of Class A shares where the Distributor did not pay a sales commission when such shares were purchased. If a Fund waives or reduces the CDSC, such waiver or reduction would be uniformly applied to all Fund shares in the particular category. In waiving or reducing a CDSC, the Funds will comply with the requirements of Rule 22d-1 under the 1940 Act.
In addition, the CDSC will be waived in connection with the following redemptions of shares held by an employer-sponsored qualified defined contribution retirement plan: (i) partial or complete redemptions in connection with a distribution without penalty under Section 72(t) of the Code from a retirement plan: (a) upon attaining age 59 1/2, (b) as part of a series of substantially equal periodic payments, or (c) upon separation from service and attaining age 55; (ii) partial or complete redemptions in connection with a qualifying loan or hardship withdrawal; (iii) complete redemptions in connection with termination of employment, plan termination or transfer to another employer’s plan or IRA; and (iv) redemptions resulting from the return of an excess contribution. The CDSC will also be waived in connection with the following redemptions of shares held in an IRA account: (i) for redemptions made pursuant to an IRA systematic withdrawal based on the shareholder’s life expectancy including, but not limited to, substantially equal periodic payments described in Code Section 72(t)(A)(iv) prior to age 59 1/2; and (ii) for redemptions to satisfy required minimum distributions after age 70 1/2 from an IRA account (with the maximum amount subject to this waiver being based only upon the shareholder’s Nuveen IRA accounts).
Class R3 Shares
Class R3 shares are available for purchase at the offering price, which is the net asset value per share without any up-front sales charge, from the applicable Funds. Class R3 shares are subject to annual distribution and service fees of 0.50% of the Funds’ average daily net assets. The annual 0.25% service fee compensates your financial advisor or other financial intermediary for providing ongoing service to you. The annual 0.25% distribution fee compensates the Distributor for paying your financial advisor or other financial intermediary an ongoing sales commission.
Class R3 shares are only available for purchase by eligible retirement plans. Eligible retirement plans include, but are not limited to, 401(k) plans, 457 plans, employer-sponsored 403(b) plans, profit sharing and money purchase pension plans, defined benefit plans, non-qualified deferred compensation plans and health care benefit funding plans. In addition, Class R3 shares are available only to retirement plans where Class R3 shares are held on the books of the Funds through omnibus accounts (either at the retirement plan level or at the level of the retirement plan’s financial intermediary). Class R3 shares are not available to traditional and Roth IRAs, Coverdell Education Savings Accounts, SEPs, SAR-SEPs, SIMPLE IRAs or individual 403(b) plans.
The administrator of a retirement plan or employee benefits office can provide plan participants with detailed information on how to participate in the retirement plan and how to elect a Fund as an investment option. Retirement plan participants may be permitted to elect different investment options, alter the amounts contributed to the retirement plan, or change how contributions are allocated among investment options in accordance with the retirement plan’s specific provisions. The retirement plan administrator or employee benefits office should be consulted for details. For questions about their accounts, participants should contact their employee benefits office, the retirement plan administrator, or the organization that provides recordkeeping services for the retirement plan.
S-98
Eligible retirement plans may open an account and purchase Class R3 shares directly from the Funds or by contacting any financial intermediary authorized to sell Class R3 shares of the Funds. Financial intermediaries may provide or arrange for the provision of some or all of the shareholder servicing and account maintenance services required by retirement plan accounts and their retirement plan participants, including, without limitation, transfers of registration and dividend payee changes.
Financial intermediaries may also perform other functions, including generating confirmation statements, and may arrange with retirement plan administrators for other investment or administrative services. Financial intermediaries may independently establish and charge retirement plans and retirement plan participants transaction fees and/or other additional amounts for such services, which may change over time. Similarly, retirement plans may charge retirement plan participants for certain expenses. These fees and additional amounts could reduce investment returns in Class R3 shares of the Funds.
Financial intermediaries and retirement plans may have omnibus accounts and similar arrangements with a Fund and may be paid for providing shareholder servicing and other services. A financial intermediary or retirement plan may be paid for its services directly or indirectly by the Funds or the Distributor. The Distributor may pay a financial intermediary an additional amount for sub-transfer agency or other administrative services. Such sub-transfer agency or other administrative services may include, but are not limited to, the following: processing and mailing trade confirmations, monthly statements, prospectuses, annual reports, semiannual reports and shareholder notices and other required communications; capturing and processing tax data; issuing and mailing dividend checks to shareholders who have selected cash distributions; preparing record date shareholder lists for proxy solicitations; collecting and posting distributions to shareholder accounts; and establishing and maintaining systematic withdrawals, automated investment plans and shareholder account registrations. Your retirement plan may establish various minimum investment requirements for Class R3 shares of the Funds and may also establish certain privileges with respect to purchases, redemptions and exchanges of Class R3 shares or the reinvestment of dividends. Retirement plan participants should contact their retirement plan administrator with respect to these issues. This Statement of Additional Information should be read in conjunction with the retirement plan’s and/or the financial intermediary’s materials regarding their fees and services.
Class I Shares
Class I shares are available for purchase by clients of financial intermediaries who charge such clients an ongoing fee for advisory, investment, consulting or related services. Such clients may include individuals, corporations, endowments and foundations. The minimum initial investment for such clients is $100,000, but this minimum will be lowered to $250 for clients of financial intermediaries that have accounts holding Class I shares with an aggregate value of at least $100,000. The Distributor may also lower the minimum to $250 for clients of financial intermediaries anticipated to reach this Class I share holdings level.
Class I shares are also available for purchase by family offices and their clients. A family office is a company that provides certain financial and other services to a high net worth family or families. The minimum initial investment for family offices and their clients is $100,000, but this minimum will be lowered to $250 for clients of family offices that have accounts holding Class I shares with an aggregate value of at least $100,000. The Distributor may also lower the minimum to $250 for clients of family offices anticipated to reach this Class I share holdings level.
Class I shares also are available for purchase, with no minimum initial investment, by the following categories of investors:
| | • | | employer-sponsored retirement plans, except SEPs, SAR-SEPs, SIMPLE IRAs and KEOGH plans; |
| | • | | bank or broker-affiliated trust departments investing funds over which they exercise exclusive discretionary investment authority and that are held in a fiduciary, agency, advisory, custodial or similar capacity; |
| | • | | advisory accounts of Nuveen Fund Advisors and its affiliates, including other Nuveen Mutual Funds whose investment policies permit investments in other investment companies; |
S-99
| | • | | current and former trustees/directors of any Nuveen Fund, and their immediate family members (“immediate family members” are defined as spouses or domestic partners, parents, children, grandparents, grandchildren, parents-in-law, sons-in-law and daughters-in-law, siblings, a sibling’s spouse and a spouse’s siblings); |
| | • | | officers, directors and former directors of Nuveen Investments and its affiliates, and their immediate family members; |
| | • | | full-time and retired employees of Nuveen Investments and its affiliates, and their immediate family members; and |
| | • | | any person who, for at least the last 90 days, has been an officer, director or employee of any financial intermediary, and their immediate family members. |
Any shares purchased by investors falling within any of the last four categories listed above must be acquired for investment purposes and on the condition that they will not be transferred or resold except through redemption by a Fund.
Holders of Class I shares may purchase additional Class I shares using dividends and capital gains distributions on their shares.
If you are eligible to purchase either Class I shares or Class A shares without a sales charge at net asset value, you should be aware of the differences between these two classes of shares. Class A shares are subject to an annual service fee to compensate financial intermediaries for providing you with ongoing account services. Class I shares are not subject to a distribution or service fee and, consequently, holders of Class I shares may not receive the same types or levels of services from financial intermediaries. In choosing between Class A shares and Class I shares, you should weigh the benefits of the services to be provided by financial intermediaries against the annual service fee imposed upon the Class A shares.
Shareholder Programs
Exchange Privilege
Nuveen Mutual Funds currently utilize two transfer agents. You may exchange fund shares into an identically registered account for the same class of another Nuveen Mutual Fund available in your state provided that the funds have the same transfer agent. Exchanges between funds with different transfer agents are not allowed. All Nuveen Mutual Funds will begin using the same transfer agent, and therefore have the same exchange options, in mid-2012. Your exchange must meet the minimum purchase requirements of the fund into which you are exchanging. You may also, under certain limited circumstances, exchange between certain classes of shares of the same Fund. An exchange between classes of shares of the same Fund may not be considered a taxable event; please consult your own tax advisor for further information.
If you hold your shares directly with a Fund, you may exchange your shares by either sending a written request to the applicable Fund, c/o Nuveen Investor Services, P.O. Box 701, Milwaukee, Wisconsin 53201-0701 or by calling Nuveen Investor Services toll free at (800) 257-8787.
If you exchange shares between different Nuveen Mutual Funds and your shares are subject to a CDSC, no CDSC will be charged at the time of the exchange. However, if you subsequently redeem the shares acquired through the exchange, the redemption may be subject to a CDSC, depending on when you purchased your original shares and the CDSC schedule of the fund from which you exchanged your shares. If you exchange between classes of shares of the same Fund and your original shares are subject to a CDSC, the CDSC will be assessed at the time of the exchange.
For federal income tax purposes, an exchange between different Nuveen Mutual Funds constitutes a sale and purchase of shares and may result in capital gain or loss. Before making any exchange, you should obtain the Prospectus for the Nuveen Mutual Fund you are purchasing and read it carefully. If the registration of the account for the Fund you are purchasing is not exactly the same as that of the fund account from which the exchange is made, written instructions from all holders of the account from which the exchange is being made must be received, with signatures guaranteed by a member of an approved Medallion Guarantee Program or in such other manner as
S-100
may be acceptable to the Fund. You may also exchange shares by telephone if you authorize telephone exchanges by checking the applicable box on the Application Form or by calling Nuveen Investor Services toll-free at (800) 257-8787 to obtain an authorization form. Each Fund reserves the right to revise or suspend the exchange privilege, limit the amount or number of exchanges, or reject any exchange. Shareholders will be provided with at least 60 days’ notice of any material revision to or termination of the exchange privilege.
The exchange privilege is not intended to permit a Fund to be used as a vehicle for short-term trading. Excessive exchange activity may interfere with portfolio management, raise expenses and otherwise have an adverse effect on all shareholders. In order to limit excessive exchange activity and in other circumstances where Fund management believes doing so would be in the best interest of the Fund, each Fund reserves the right to revise or terminate the exchange privilege, or limit the amount or number of exchanges or reject any exchange. Shareholders would be notified of any such action to the extent required by law. See “Frequent Trading Policy” below.
Reinstatement Privilege
If you redeemed Class A or Class C shares of a Fund or any other Nuveen Mutual Fund that were subject to a sales charge or a CDSC, you have up to one year to reinvest all or part of the full amount of the redemption in the same class of shares of the Fund at net asset value. The reinstatement privilege for Class B shares is no longer available. Nuveen Mutual Funds currently utilize two transfer agents. The reinstatement privilege is limited to reinvestment in a fund which has the same transfer agent as the fund from which you redeemed. All Nuveen Mutual Funds will begin using the same transfer agent in mid-2012, at which point you will be able to utilize the reinstatement privilege for reinvestment in any Nuveen Mutual Fund. This reinstatement privilege can be exercised only once for any redemption, and reinvestment will be made at the net asset value next calculated after reinstatement of the appropriate class of Fund shares. If you reinstate shares that were subject to a CDSC, your holding period as of the redemption date also will be reinstated for purposes of calculating a CDSC and the CDSC paid at redemption will be refunded. The federal income tax consequences of any capital gain realized on a redemption will not be affected by reinstatement, but a capital loss may be disallowed in whole or in part depending on the timing, the amount of the reinvestment and the fund from which the redemption occurred.
Suspension of Right of Redemption
Each Fund may suspend the right of redemption of Fund shares or delay payment more than seven days (a) during any period when the New York Stock Exchange (the “NYSE”) is closed (other than customary weekend and holiday closings), (b) when trading in the markets the Fund normally utilizes is restricted or an emergency exists as determined by the SEC so that trading of the Fund’s investments or determination of its net asset value is not reasonably practicable, or (c) for any other periods that the SEC by order may permit for protection of Fund shareholders.
Redemption In-Kind
The Funds have reserved the right to redeem in-kind (that is, to pay redemption requests in cash and portfolio securities, or wholly in portfolio securities) although the Funds have no present intention to redeem in-kind. The Funds voluntarily have committed to pay in cash all requests for redemption by any shareholder, limited as to each shareholder during any 90-day period to the lesser of $250,000 or 1% of the net asset value of a Fund at the beginning of the 90-day period.
Frequent Trading Policy
The Funds’ Frequent Trading Policy is as follows:
Nuveen Mutual Funds are intended as long-term investments and not as short-term trading vehicles. At the same time, the Funds recognize the need of investors to periodically make purchases and redemptions of Fund shares when rebalancing their portfolios and as their financial needs or circumstances change. Nuveen Mutual Funds have adopted the following Frequent Trading Policy that seeks to balance these needs against the potential for higher operating costs, portfolio management disruption and other inefficiencies that can be caused by excessive trading of Fund shares.
S-101
1. Definition of Round Trip
A Round Trip trade is the purchase and subsequent redemption of Fund shares, including by exchange. Each side of a Round Trip trade may be comprised of either a single transaction or a series of closely-spaced transactions.
2. Round Trip Trade Limitations
Nuveen Mutual Funds limit the frequency of Round Trip trades that may be placed in a Fund. Subject to certain exceptions noted below, the Funds limit an investor to four Round Trips per trailing 12-month period and may also restrict the trading privileges of an investor who makes a Round Trip within a 30-day period if the purchase and redemption are of substantially similar dollar amounts and represent at least 25% of the value of the investor’s account.
3. Enforcement
Trades placed in violation of the foregoing policies are subject to rejection or cancellation by Nuveen Mutual Funds. Nuveen Mutual Funds may also bar an investor (and/or the investor’s financial advisor) who has violated these policies from opening new accounts with the Funds and may restrict the investor’s existing account(s) to redemptions only. Nuveen Mutual Funds reserve the right, in their sole discretion, to (a) interpret the terms and application of these policies, (b) waive unintentional or minor violations (including transactions below certain dollar thresholds) if Nuveen Mutual Funds determine that doing so does not harm the interests of Fund shareholders, and (c) exclude certain classes of redemptions from the application of the trading restrictions set forth above.
Nuveen Mutual Funds reserve the right to impose restrictions on purchases or exchanges that are more restrictive than those stated above if they determine, in their sole discretion, that a proposed transaction or series of transactions involve market timing or excessive trading that is likely to be detrimental to the Funds. The Funds may also modify or suspend the Frequent Trading Policy without notice during periods of market stress or other unusual circumstances.
The ability of Nuveen Mutual Funds to implement the Frequent Trading Policy for omnibus accounts at certain financial intermediaries may be dependent on receiving from those intermediaries sufficient shareholder information to permit monitoring of trade activity and enforcement of the Funds’ Frequent Trading Policy. In addition, the Funds may rely on a financial intermediary’s policy to restrict market timing and excessive trading if the Funds believe that the policy is reasonably designed to prevent market timing that is detrimental to the Funds. Such policy may be more or less restrictive than the Funds’ Policy. The Funds cannot ensure that these financial intermediaries will in all cases apply the Funds’ policy or their own policies, as the case may be, to accounts under their control.
Exclusions from the Frequent Trading Policy
As stated above, certain redemptions are eligible for exclusion from the Frequent Trading Policy, including: (i) redemptions or exchanges by shareholders investing through the fee-based platforms of certain financial intermediaries (where the intermediary charges an asset-based or comprehensive “wrap” fee for its services) that are effected by the financial intermediaries in connection with systematic portfolio rebalancing; (ii) when there is a verified trade error correction, which occurs when a dealer firm sends a trade to correct an earlier trade made in error and then the firm sends an explanation to the Nuveen Mutual Funds confirming that the trade is actually an error correction; (iii) in the event of total disability (as evidenced by a determination by the federal Social Security Administration) of the shareholder (including a registered joint owner) occurring after the purchase of the shares being redeemed; (iv) in the event of the death of the shareholder (including a registered joint owner); (v) redemptions made pursuant to a systematic withdrawal plan, up to 1% monthly, 3% quarterly, 6% semiannually or 12% annually of an account’s net asset value depending on the frequency of the plan as designated by the shareholder; (vi) redemptions of shares that were purchased through a systematic investment program; (vii) involuntary redemptions caused by operation of law; (viii) redemptions in connection with a payment of account or plan fees; (ix) redemptions or exchanges by any “fund of funds” advised by the Adviser; and (x) redemptions in connection with the exercise of a Fund’s right to redeem all shares in an account that does not maintain a certain minimum balance or that the applicable board has determined may have material adverse consequences to the shareholders of a Fund.
S-102
In addition, the following redemptions of shares by an employer-sponsored qualified defined contribution retirement plan are excluded from the Frequent Trading Policy: (i) partial or complete redemptions in connection with a distribution without penalty under Section 72(t) of the Code from a retirement plan: (a) upon attaining age 59 1/2; (b) as part of a series of substantially equal periodic payments; or (c) upon separation from service and attaining age 55; (ii) partial or complete redemptions in connection with a qualifying loan or hardship withdrawal; (iii) complete redemptions in connection with termination of employment, plan termination, transfer to another employer’s plan or IRA or changes in a plan’s recordkeeper; and (iv) redemptions resulting from the return of an excess contribution. Also, the following redemptions of shares held in an IRA account are excluded from the application of the Frequent Trading Policy: (i) redemptions made pursuant to an IRA systematic withdrawal based on the shareholder’s life expectancy including, but not limited to, substantially equal periodic payments described in Code Section 72(t)(A)(iv) prior to age 59 1/2; and (ii) redemptions to satisfy required minimum distributions after age 70 1/2 from an IRA account.
Distribution and Service Plan
NIF has adopted a Distribution and Service Plan with respect to the Class A, Class B, Class C and Class R3 shares of the Funds pursuant to Rule 12b-1 under the 1940 Act (the “Plan”). Rule 12b-1 provides in substance that a mutual fund may not engage directly or indirectly in financing any activity which is primarily intended to result in the sale of shares, except pursuant to a plan adopted under the Rule. The Plan authorizes the Funds to pay the Distributor distribution and/or shareholder servicing fees on the Funds’ Class A, Class B, Class C and Class R3 shares as described below. The distribution fees under the Plan are used for primary purpose of compensating participating intermediaries for their sales of the Funds. The shareholder servicing fees are used primarily for the purpose of providing compensation for the ongoing servicing and/or maintenance of shareholder accounts.
The Class A shares pay to the Distributor a shareholder servicing fee at an annual rate of 0.25% of the average daily net assets of the Class A shares. The fee may be used by the Distributor to provide compensation for shareholder servicing activities with respect to the Class A shares. The shareholder servicing fee is intended to compensate the Distributor for ongoing servicing and/or maintenance of shareholder accounts and may be used by the Distributor to provide compensation to participating intermediaries through whom shareholders hold their shares for ongoing servicing and/or maintenance of shareholder accounts. This fee is calculated and paid each month based on average daily net assets of Class A shares of each Fund for that month.
The Class B shares pay to the Distributor a shareholder servicing fee at the annual rate of 0.25% of the average daily net assets of the Class B shares. The fee may be used by the Distributor to provide compensation for shareholder servicing activities with respect to the Class B shares beginning one year after purchase. The Class B shares also pay to the Distributor a distribution fee at the annual rate of 0.75% of the average daily net assets of the Class B shares. The distribution fee is intended to compensate the Distributor for advancing a commission to participating intermediaries purchasing Class B shares.
The Class C shares pay to the Distributor a shareholder servicing fee at the annual rate of 0.25% of the average daily net assets of the Class C shares. The fee may be used by the Distributor to provide compensation for shareholder servicing activities with respect to the Class C shares. This fee is calculated and paid each month based on average daily net assets of the Class C shares. The Class C shares pay to the Distributor a distribution fee at the annual rate of 0.75% of the average daily net assets of the Class C shares. The Distributor may use the distribution fee to provide compensation to participating intermediaries through which shareholders hold their shares beginning one year after purchase.
The Class R3 shares pay to the Distributor a shareholder servicing fee at the annual rate of 0.25% of the average daily net assets of the Class R3 shares. The fee may be used by the Distributor to provide compensation for shareholder servicing activities with respect to the Class R3 shares. This fee is calculated and paid each month based on average daily net assets of the Class R3 shares. The Class R3 shares also pay to the Distributor a distribution fee at the annual rate of 0.25% of the average daily net assets of Class R3 shares. The fee may be used by the Distributor to provide initial and ongoing sales compensation to its investment executives and to participating intermediaries in connection with sales of Class R3 shares and to pay for advertising and other promotional expenses in
S-103
connection with the distribution of Class R3 shares. This fee is calculated and paid each month based on average daily net assets of the Class R3 shares.
The Distributor receives no compensation for distribution of the Class I shares.
The Plan is a “compensation-type” plan under which the Distributor is entitled to receive the distribution and shareholder servicing fees regardless of whether its actual distribution and shareholder servicing expenses are more or less than the amount of the fees. It is therefore possible that the Distributor may realize a profit in a particular year as a result of these payments. The Plan recognizes that the Distributor and the Adviser, in their discretion, may from time to time use their own assets to pay for certain additional costs of distributing Class A, Class B, Class C and Class R3 shares. Any such arrangements to pay such additional costs may be commenced or discontinued by the Distributor or the Adviser at any time. With the exception of the Distributor and its affiliates, no “interested person” of NIF, as that term is defined in the 1940 Act, and no Director of NIF has a direct or indirect financial interest in the operation of the Plan or any related agreement.
Under the Plan, the Funds’ Treasurer reports the amounts expended under the Plan and the purposes for which such expenditures were made to the Board of Directors for their review on a quarterly basis. The Plan provides that it will continue in effect for a period of more than one year from the date of its execution only so long as such continuance is specifically approved at least annually by the vote of a majority of the Board members of NIF and by the vote of the majority of those Board members of NIF who are not “interested persons” (as that term is defined in the 1940 Act) of NIF and who have no direct or indirect financial interest in the operation of the Plan or in any agreement related to such plan. The Funds paid the following 12b-1 fees to Quasar for the period from November 1, 2010 through December 31, 2010 with respect to the Class A shares, Class B shares, Class C shares and Class R3 shares of the Funds. The table also describes the activities for which such payments were used. As noted above, no 12b-1 fees are paid with respect to Class I shares.
| | | | | | | | | | | | |
| | | Total 12b-1
Fees Paid
to Quasar | | | Amount
Retained by
Quasar1 | | | Compensation Paid
to Participating
Intermediaries | |
| | | |
Nuveen Dividend Value Fund | | | | | | | | | | | | |
Class A | | | $57,213 | | | | $ 2,490 | | | | $54,723 | |
Class B | | | 8,302 | | | | 80 | | | | 8,222 | |
Class C | | | 19,644 | | | | 12,638 | | | | 7,006 | |
Class R3* | | | 1,200 | | | | - | | | | 1,200 | |
| | | |
Nuveen Equity Index Fund | | | | | | | | | | | | |
Class A | | | 51,274 | | | | 2,859 | | | | 48,415 | |
Class B | | | 12,195 | | | | 259 | | | | 11,936 | |
Class C | | | 14,608 | | | | 1,499 | | | | 13,109 | |
Class R3* | | | 12,320 | | | | 153 | | | | 12,167 | |
| | | |
Nuveen International Fund | | | | | | | | | | | | |
Class A | | | 11,281 | | | | 593 | | | | 10,688 | |
Class C | | | 4,312 | | | | 480 | | | | 3,832 | |
Class R3* | | | 5 | | | | - | | | | 5 | |
| | | |
Nuveen International Select Fund | | | | | | | | | | | | |
Class A | | | 2,310 | | | | 72 | | | | 2,238 | |
Class C | | | 1,408 | | | | 607 | | | | 801 | |
Class R3* | | | 5 | | | | 2 | | | | 3 | |
| | | |
Nuveen Large Cap Growth Opportunities Fund | | | | | | | | | | | | |
Class A | | | 29,204 | | | | 1,145 | | | | 28,059 | |
Class B | | | 5,872 | | | | 81 | | | | 5,791 | |
Class C | | | 7,296 | | | | 590 | | | | 6,706 | |
Class R3* | | | 652 | | | | 122 | | | | 530 | |
S-104
| | | | | | | | | | | | |
| | | Total 12b-1
Fees Paid to
Quasar | | | Amount
Retained by
Quasar1 | | | Compensation Paid
to Participating
Intermediaries | |
| | | |
Nuveen Large Cap Select Fund | | | | | | | | | | | | |
Class A | | | $ 1,535 | | | | $ 47 | | | | $ 1,488 | |
Class C | | | 304 | | | | 15 | | | | 289 | |
Class R3* | | | 103 | | | | 56 | | | | 47 | |
| | | |
Nuveen Large Cap Value Fund | | | | | | | | | | | | |
Class A | | | 22,522 | | | | 1,015 | | | | 21,507 | |
Class C | | | 2,176 | | | | 224 | | | | 1,952 | |
Class R3* | | | 668 | | | | 54 | | | | 614 | |
| | | |
Nuveen Mid Cap Growth Opportunities Fund | | | | | | | | | | | | |
Class A | | | 121,958 | | | | 6,248 | | | | 115,710 | |
Class B | | | 9,358 | | | | 50 | | | | 9,308 | |
Class C | | | 23,728 | | | | 2,248 | | | | 21,480 | |
Class R3* | | | 30,133 | | | | 79 | | | | 30,054 | |
| | | |
Nuveen Mid Cap Index Fund | | | | | | | | | | | | |
Class A | | | 16,758 | | | | 169 | | | | 16,589 | |
Class C | | | 5,439 | | | | 851 | | | | 4,588 | |
Class R3* | | | 24,276 | | | | 21 | | | | 24,255 | |
| | | |
Nuveen Mid Cap Select Fund | | | | | | | | | | | | |
Class A | | | 5,412 | | | | 593 | | | | 4,819 | |
Class C | | | 3,984 | | | | 389 | | | | 3,595 | |
| | | |
Nuveen Mid Cap Value Fund | | | | | | | | | | | | |
Class A | | | 32,098 | | | | 778 | | | | 31,320 | |
Class B | | | 4,820 | | | | 79 | | | | 4,741 | |
Class C | | | 19,838 | | | | 1,227 | | | | 18,611 | |
Class R3* | | | 16,312 | | | | 502 | | | | 15,810 | |
| | | |
Nuveen Quantitative Enhanced Core Equity Fund | | | | | | | | | | | | |
Class A | | | 80 | | | | 25 | | | | 55 | |
Class C | | | 69 | | | | 69 | | | | - | |
| | | |
Nuveen Small Cap Growth Opportunities Fund | | | | | | | | | | | | |
Class A | | | 17,728 | | | | 1,671 | | | | 16,057 | |
Class B | | | 3,673 | | | | 11 | | | | 3,662 | |
Class C | | | 2,806 | | | | 717 | | | | 2,089 | |
Class R3* | | | 1,989 | | | | - | | | | 1,989 | |
| | | |
Nuveen Small Cap Index Fund | | | | | | | | | | | | |
Class A | | | 5,734 | | | | 306 | | | | 5,428 | |
Class C | | | 2,865 | | | | 267 | | | | 2,598 | |
Class R3* | | | 4,389 | | | | 108 | | | | 4,281 | |
| | | |
Nuveen Small Cap Select Fund | | | | | | | | | | | | |
Class A | | | 153,279 | | | | 2,546 | | | | 150,733 | |
Class B | | | 6,704 | | | | 51 | | | | 6,653 | |
Class C | | | 30,646 | | | | 1,520 | | | | 29,126 | |
Class R3* | | | 16,312 | | | | 14 | | | | 16,298 | |
S-105
| | | | | | | | | | | | |
| | | Total 12b-1
Fees Paid
to Quasar | | | Amount
Retained by
Quasar1 | | | Compensation Paid
to Participating
Intermediaries | |
| | | |
Nuveen Small Cap Value Fund | | | | | | | | | | | | |
Class A | | | $14,277 | | | | $670 | | | | $13,607 | |
Class C | | | 2,972 | | | | 290 | | | | 2,682 | |
Class R3* | | | 1,875 | | | | 69 | | | | 1,806 | |
| | | |
Nuveen Tactical Market Opportunities Fund | | | | | | | | | | | | |
Class A | | | - | | | | - | | | | - | |
Class C | | | - | | | | - | | | | - | |
| 1 | | The amounts retained by Quasar were used to pay for various distribution and shareholder servicing expenses, including advertising, marketing, wholesaler support, and printing prospectuses. |
| * | | Effective January 18, 2011 Class R shares were renamed Class R3 shares. |
The Funds paid the following 12b-1 fees to the Distributor for the period from January 1, 2011 through October 31, 2011 with respect to the Class A shares, Class B shares, Class C shares and Class R3 shares of the Funds. The table also describes the activities for which such payments were used. As noted above, no 12b-1 fees are paid with respect to Class I shares.
| | | | | | | | | | | | |
Fund | | Total 12b-1
Fees Paid to
Distributor | | | Amount
Retained
by Distributor1 | | | Compensation Paid
to Participating
Intermediaries | |
Nuveen Dividend Value Fund | | | | | | | | | | | | |
Class A | | $ | 353,398 | | | $ | 353,398 | | | $ | - | |
Class B | | | 33,146 | | | | 33,146 | | | | - | |
Class C | | | 133,559 | | | | 133,559 | | | | - | |
Class R3* | | | 20,397 | | | | 20,397 | | | | - | |
Nuveen Equity Index Fund | | | | | | | | | | | | |
Class A | | | 259,129 | | | | 259,129 | | | | - | |
Class B | | | 46,098 | | | | 46,098 | | | | - | |
Class C | | | 74,188 | | | | 74,188 | | | | - | |
Class R3* | | | 62,520 | | | | 62,520 | | | | - | |
Nuveen International Fund | | | | | | | | | | | | |
Class A | | | 53,254 | | | | 53,254 | | | | - | |
Class C | | | 20,089 | | | | 20,089 | | | | - | |
Class R3* | | | 31 | | | | 31 | | | | - | |
Nuveen International Select Fund | | | | | | | | | | | | |
Class A | | | 10,734 | | | | 10,734 | | | | - | |
Class C | | | 6,422 | | | | 6,422 | | | | - | |
Class R3* | | | 44 | | | | 44 | | | | - | |
Nuveen Large Cap Growth Opportunities Fund | | | | | | | | | | | | |
Class A | | | 169,333 | | | | 169,333 | | | | - | |
Class B | | | 24,583 | | | | 24,583 | | | | - | |
Class C | | | 49,015 | | | | 49,015 | | | | - | |
Class R3* | | | 9,059 | | | | 9,059 | | | | - | |
Nuveen Large Cap Select Fund | | | | | | | | | | | | |
Class A | | | 7,220 | | | | 7,220 | | | | - | |
Class C | | | 1,602 | | | | 1,602 | | | | - | |
Class R3* | | | 507 | | | | 507 | | | | - | |
S-106
| | | | | | | | | | | | |
Fund | | Total 12b-1
Fees Paid to
Distributor | | | Amount
Retained
by Distributor1 | | | Compensation Paid
to Participating
Intermediaries | |
Nuveen Large Cap Value Fund | | | | | | | | | | | | |
Class A | | $ | 107,646 | | | $ | 107,646 | | | $ | - | |
Class C | | | 10,189 | | | | 10,189 | | | | - | |
Class R3* | | | 3,356 | | | | 3,356 | | | | - | |
Nuveen Mid Cap Growth Opportunities Fund | | | | | | | | | | | | |
Class A | | | 608,741 | | | | 608,741 | | | | - | |
Class B | | | 42,522 | | | | 42,522 | | | | - | |
Class C | | | 122,383 | | | | 122,383 | | | | - | |
Class R3* | | | 139,684 | | | | 139,684 | | | | - | |
Nuveen Mid Cap Index Fund | | | | | | | | | | | | |
Class A | | | 125,741 | | | | 125,741 | | | | - | |
Class C | | | 29,264 | | | | 29,264 | | | | - | |
Class R3* | | | 214,451 | | | | 214,451 | | | | - | |
Nuveen Mid Cap Select Fund | | | | | | | | | | | | |
Class A | | | 25,651 | | | | 25,651 | | | | - | |
Class C | | | 17,910 | | | | 17,910 | | | | - | |
Nuveen Mid Cap Value Fund | | | | | | | | | | | | |
Class A | | | 141,769 | | | | 141,769 | | | | - | |
Class B | | | 21,158 | | | | 21,158 | | | | - | |
Class C | | | 89,549 | | | | 89,549 | | | | - | |
Class R3* | | | 74,628 | | | | 74,628 | | | | - | |
Nuveen Quantitative Enhanced Core Equity Fund | | | | | | | | | | | | |
Class A | | | 368 | | | | 368 | | | | - | |
Class C | | | 914 | | | | 914 | | | | - | |
Nuveen Small Cap Growth Opportunities Fund | | | | | | | | | | | | |
Class A | | | 85,627 | | | | 85,627 | | | | - | |
Class B | | | 16,064 | | | | 16,064 | | | | - | |
Class C | | | 14,015 | | | | 14,015 | | | | - | |
Class R3* | | | 10,547 | | | | 10,547 | | | | - | |
Nuveen Small Cap Index Fund | | | | | | | | | | | | |
Class A | | | 35,478 | | | | 35,478 | | | | - | |
Class C | | | 13,829 | | | | 13,829 | | | | - | |
Class R3* | | | 35,847 | | | | 35,847 | | | | - | |
Nuveen Small Cap Select Fund | | | | | | | | | | | | |
Class A | | | 658,120 | | | | 658,120 | | | | - | |
Class B | | | 29,233 | | | | 29,233 | | | | - | |
Class C | | | 144,521 | | | | 144,521 | | | | - | |
Class R3* | | | 87,130 | | | | 87,130 | | | | - | |
Nuveen Small Cap Value Fund | | | | | | | | | | | | |
Class A | | | 73,310 | | | | 73,310 | | | | - | |
Class C | | | 13,709 | | | | 13,709 | | | | - | |
Class R3* | | | 9,857 | | | | 9,857 | | | | - | |
Nuveen Tactical Market Opportunities Fund | | | | | | | | | | | | |
Class A** | | | 899 | | | | 899 | | | | - | |
Class C** | | | 868 | | | | 868 | | | | - | |
| 1 | | The amounts retained by the Distributor were used to pay for various distribution and shareholder servicing expenses, including advertising, marketing, wholesaler support, and printing prospectuses. |
S-107
| * | | Effective January 18, 2011 Class R shares were renamed Class R3 shares. |
| ** | | For the period February 24, 2011 (commencement of operations) through October 31, 2011. |
If a Fund closes to new investors, it may continue to make payments under the Plan. Such payments would be made for the various services provided to existing shareholders by the Participating Intermediaries receiving such payments.
General Matters
The Funds have authorized one or more brokers to accept on their behalf purchase and redemption orders. Such brokers are authorized to designate other intermediaries to accept purchase and redemption orders on the Funds’ behalf. The Funds will be deemed to have received a purchase or redemption order when an authorized broker or, if applicable, a broker’s authorized designee accepts the order. Customer orders received by such broker (or their designee) will be priced at the applicable Fund’s net asset value next computed after they are accepted by an authorized broker (or their designee). Orders accepted by an authorized broker (or their designee) before the close of regular trading on the NYSE will receive that day’s share price; orders accepted after the close of trading will receive the next business day’s share price.
If you choose to invest in a Fund, an account will be opened and maintained for you by USBFS, the Funds’ shareholder services agent. Shares will be registered in the name of the investor or the investor’s financial advisor. A change in registration or transfer of shares held in the name of a financial advisor may only be made by an order in good standing form from the financial advisor acting on the investor’s behalf. Each Fund reserves the right to reject any purchase order and to waive or increase minimum investment requirements.
The Funds do not issue share certificates. For certificated shares previously issued, a fee of 1% of the current market value will be charged if the certificate is lost, stolen or destroyed. The fee is paid to Seaboard Surety Company for insurance of the lost, stolen or destroyed certificate.
Distribution Arrangements
The Distributor serves as the principal underwriter of the shares of the Funds pursuant to a “best efforts” arrangement as provided by a distribution agreement with the Trust (the “Distribution Agreement”). Pursuant to the Distribution Agreement, the Trust appointed the Distributor to be its agent for the distribution of the Funds’ shares on a continuous offering basis. The Distributor sells shares to or through brokers, dealers, banks or other qualified financial intermediaries (collectively referred to as “Dealers”), or others, in a manner consistent with the then effective registration statement of the Trust. Pursuant to the Distribution Agreement, the Distributor, at its own expense, finances certain activities incident to the sale and distribution of the Funds’ shares, including printing and distributing of prospectuses and statements of additional information to other than existing shareholders, the printing and distributing of sales literature, advertising and payment of compensation and giving of concessions to Dealers.
The Distributor receives for its services the excess, if any, of the sales price of a Fund’s shares less the net asset value of those shares, and reallows a majority or all of such amounts to the Dealers who sold the shares, the Distributor may also act as a Dealer. The Distributor also receives distribution fees pursuant to a distribution plan adopted by the Trust pursuant to Rule 12b-1 and described herein under “Distribution and Service Plans.” The Distributor also receives any CDSCs imposed on redemptions of shares, but any amounts as to which a reinstatement privilege is not exercised are set off against and reduce amounts otherwise payable to the Distributor pursuant to the distribution plan.
S-108
The following table sets forth the amount of underwriting commissions paid by the Funds, the amount of such commissions retained by the Distributor, and the amount of compensation on redemptions and repurchases for the period from January 1, 2011 through October 31, 2011:
| | | | | | | | | | | | |
| | | Total Underwriting
Commissions | | | Underwriting Commissions
Retained by Distributor | | | Compensation on
Redemptions and
Repurchases | |
Fund | | January 1, 2011 through
October 31, 2011 | | | January 1, 2011 through
October 31, 2011 | | | January 1, 2011 through
October 31, 2011 | |
Nuveen Dividend Value Fund | | $ | 263,178 | | | $ | 27,081 | | | $ | 7,857 | |
Nuveen Equity Index Fund | | | 2,327 | | | | 207 | | | | 5,314 | |
Nuveen International Fund | | | 9,426 | | | | 1,186 | | | | 1,785 | |
Nuveen International Select Fund | | | 4,245 | | | | 468 | | | | 800 | |
Nuveen Large Cap Growth Opportunities Fund | | | 104,580 | | | | 11,739 | | | | 2,571 | |
Nuveen Large Cap Select Fund | | | 3,488 | | | | 392 | | | | — | |
Nuveen Large Cap Value Fund | | | 11,154 | | | | 1,430 | | | | 382 | |
Nuveen Mid Cap Growth Opportunities Fund | | | 139,136 | | | | 14,775 | | | | 7,619 | |
Nuveen Mid Cap Index Fund | | | 3,746 | | | | 365 | | | | 913 | |
Nuveen Mid Cap Select Fund | | | 12,218 | | | | 1,536 | | | | 1,002 | |
Nuveen Mid Cap Value Fund | | | 26,857 | | | | 3,440 | | | | 4,689 | |
Nuveen Quantitative Enhanced Core Equity Fund | | | — | | | | — | | | | 45 | |
Nuveen Small Cap Growth Opportunities Fund | | | 21,969 | | | | 3,005 | | | | 461 | |
Nuveen Small Cap Index Fund | | | 135 | | | | 11 | | | | 75 | |
Nuveen Small Cap Select Fund | | | 69,811 | | | | 8,448 | | | | 3,421 | |
Nuveen Small Cap Value Fund | | | 12,003 | | | | 1,534 | | | | 557 | |
Nuveen Tactical Market Opportunities Fund | | | 6,683 | | | | 829 | | | | — | |
S-109
Prior to January 1, 2011, Quasar Distributors, LLC (“Quasar”) 615 East Michigan Street, Milwaukee, WI 53202, served as the distributor for the Funds’ shares pursuant to a Distribution Agreement dated July 1, 2007 (the “Quasar Distribution Agreement”). Quasar is a wholly owned subsidiary of U.S. Bancorp.
The following tables set forth the amount of underwriting commissions paid by the Funds and the amount of such commissions retained by Quasar, during the fiscal years ended October 31, 2009 and October 31, 2010 and for the period from November 1, 2010 through December 31, 2010:
| | | | | | | | | | | | |
| | | Total Underwriting Commissions | |
Fund | | Fiscal Year Ended
October 31, 2009 | | | Fiscal Year Ended
October 31, 2010 | | | November 1, 2010
through
December 31, 2010 | |
Nuveen Dividend Value Fund | | $ | 88,701 | | | $ | 272,650 | | | $ | 35,234 | |
Nuveen Equity Index Fund | | | 92,139 | | | | 74,903 | | | | 13,485 | |
Nuveen International Fund | | | 16,592 | | | | 15,999 | | | | 1,485 | |
Nuveen International Select Fund | | | 5,467 | | | | 30,613 | | | | 1,811 | |
Nuveen Large Cap Growth Opportunities Fund | | | 37,586 | | | | 41,641 | | | | 13,043 | |
Nuveen Large Cap Select Fund | | | 5,602 | | | | 10,545 | | | | 2,741 | |
Nuveen Large Cap Value Fund | | | 26,680 | | | | 15,973 | | | | 7,914 | |
Nuveen Mid Cap Growth Opportunities Fund | | | 88,154 | | | | 79,356 | | | | 34,013 | |
Nuveen Mid Cap Index Fund | | | 31,785 | | | | 57,832 | | | | 7,179 | |
Nuveen Mid Cap Select Fund | | | 22,548 | | | | 11,733 | | | | 1,539 | |
Nuveen Mid Cap Value Fund | | | 30,111 | | | | 20,512 | | | | 2,333 | |
Nuveen Quantitative Enhanced Core Equity Fund | | | 165 | | | | — | | | | — | |
Nuveen Small Cap Growth Opportunities Fund | | | 23,228 | | | | 45,684 | | | | 2,836 | |
Nuveen Small Cap Index Fund | | | 6,093 | | | | 8,327 | | | | 1,458 | |
Nuveen Small Cap Select Fund | | | 54,503 | | | | 69,953 | | | | 5,764 | |
Nuveen Small Cap Value Fund | | | 17,791 | | | | 9,098 | | | | 3,104 | |
Nuveen Tactical Market Opportunities Fund 1 | | | * | | | | — | | | | — | |
| 1 | | Commenced operations on December 30, 2009. |
| * | | Fund was not in operation during this fiscal year. |
| | | | | | | | | | | | |
| | | Underwriting Commissions Retained by Quasar | |
Fund | | Fiscal Year Ended
October 31, 2009 | | | Fiscal Year Ended
October 31, 2010 | | | November 1, 2010
through
December 31, 2010 | |
Nuveen Dividend Value Fund | | $ | 9,045 | | | $ | 27,122 | | | $ | 3,199 | |
Nuveen Equity Index Fund | | | 10,280 | | | | 9,703 | | | | 1,143 | |
Nuveen International Fund | | | 2,176 | | | | 2,174 | | | | 135 | |
Nuveen International Select Fund | | | 599 | | | | 3,005 | | | | 154 | |
Nuveen Large Cap Growth Opportunities Fund | | | 5,313 | | | | 5,463 | | | | 1,183 | |
Nuveen Large Cap Select Fund | | | 1,059 | | | | 1,164 | | | | 256 | |
Nuveen Large Cap Value Fund | | | 2,607 | | | | 1,684 | | | | 609 | |
Nuveen Mid Cap Growth Opportunities Fund | | | 9,908 | | | | 11,462 | | | | 3,152 | |
Nuveen Mid Cap Index Fund | | | 2,931 | | | | 5,504 | | | | 681 | |
Nuveen Mid Cap Select Fund | | | 2,800 | | | | 1,897 | | | | 133 | |
S-110
| | | | | | | | | | | | |
| | | Underwriting Commissions Retained by Quasar | |
Fund | | Fiscal Year Ended
October 31, 2009 | | | Fiscal Year Ended
October 31, 2010 | | | November 1, 2010
through
December 31, 2010 | |
Nuveen Mid Cap Value Fund | | $ | 3,011 | | | $ | 2,326 | | | $ | 234 | |
Nuveen Quantitative Enhanced Core Equity Fund | | | 18 | | | | — | | | | — | |
Nuveen Small Cap Growth Opportunities Fund | | | 2,471 | | | | 4,983 | | | | 269 | |
Nuveen Small Cap Index Fund | | | 575 | | | | 889 | | | | 126 | |
Nuveen Small Cap Select Fund | | | 5,016 | | | | 7,825 | | | | 519 | |
Nuveen Small Cap Value Fund | | | 1,726 | | | | 1,128 | | | | 290 | |
Nuveen Tactical Market Opportunities Fund 1 | | | * | | | | — | | | | — | |
| 1 | | Commenced operations on December 30, 2009. |
| * | | Fund was not in operation during this fiscal year. |
| | | | | | | | | | | | |
| | | Compensation on Redemptions and Repurchases | |
Fund | | Fiscal Year
Ended
October 31, 2009 | | | Fiscal Year
Ended
October 31, 2010 | | | November 1, 2010
through
December 31, 2010 | |
Nuveen Dividend Value Fund | | $ | 13,476 | | | $ | 10,779 | | | $ | 1,141 | |
Nuveen Equity Index Fund | | | 16,663 | | | | 7,229 | | | | 581 | |
Nuveen International Fund | | | 2,441 | | | | 1,878 | | | | 229 | |
Nuveen International Select Fund | | | 436 | | | | 23 | | | | — | |
Nuveen Large Cap Growth Opportunities Fund | | | 4,077 | | | | 3,964 | | | | 335 | |
Nuveen Large Cap Select Fund | | | 679 | | | | — | | | | 22 | |
Nuveen Large Cap Value Fund | | | 2,244 | | | | 1,568 | | | | 76 | |
Nuveen Mid Cap Growth Opportunities Fund | | | 12,969 | | | | 14,598 | | | | 1,244 | |
Nuveen Mid Cap Index Fund | | | 980 | | | | 950 | | | | 31 | |
Nuveen Mid Cap Select Fund | | | 2,820 | | | | 1,736 | | | | 866 | |
Nuveen Mid Cap Value Fund | | | 8,854 | | | | 5,570 | | | | 636 | |
Nuveen Quantitative Enhanced Core Equity Fund | | | — | | | | — | | | | — | |
Nuveen Small Cap Growth Opportunities Fund | | | 2,798 | | | | 1,128 | | | | — | |
Nuveen Small Cap Index Fund | | | 580 | | | | 28 | | | | 8 | |
Nuveen Small Cap Select Fund | | | 7,349 | | | | 8,127 | | | | 999 | |
Nuveen Small Cap Value Fund | | | 1,233 | | | | 1,369 | | | | 281 | |
Nuveen Tactical Market Opportunities Fund 1 | | | | * | | | 1,736 | | | | — | |
| 1 | | Commenced operations on December 30, 2009. |
| * | | Fund was not in operation during this fiscal year. |
To help financial advisors and investors better understand and more efficiently use the Funds to reach their investment goals, the Distributor may advertise and create specific investment programs and systems. For example, this may include information on how to use the Funds to accumulate assets for future education needs or periodic payments such as insurance premiums. The Distributor may produce software, electronic information sites or additional sales literature to promote the advantages of using the Funds to meet these and other specific investor needs. In addition, wholesale representatives of the Distributor may visit financial advisors on a regular basis to educate them about
S-111
the Funds and to encourage the sale of Fund shares to their clients. The costs and expenses associated with these efforts may include travel, lodging, sponsorship at educational seminars and conferences, entertainment and meals to the extent permitted by law. Nuveen wholesalers may receive additional compensation if they meet certain targets for sales of one or more Nuveen Mutual Funds.
Additional Payments to Financial Intermediaries
In addition to the sales charge payments and the distribution, service and transfer agency fees described in the Prospectus and elsewhere in this SAI, the Adviser and/or the Distributor may make additional payments out of its own assets to selected intermediaries that sell shares of the Nuveen Mutual Funds (such as brokers, dealers, banks, registered investment advisers, retirement plan administrators and other intermediaries; hereinafter, individually, “Intermediary,” and collectively, “Intermediaries”) under the categories described below for the purposes of promoting the sale of Fund shares, maintaining share balances and/or for sub-accounting, administrative or shareholder processing services.
The amounts of these payments could be significant and may create an incentive for an Intermediary or its representatives to recommend or offer shares of the Nuveen Mutual Funds to its customers. The Intermediary may elevate the prominence or profile of the Funds within the Intermediary’s organization by, for example, placing the Funds on a list of preferred or recommended funds and/or granting the Adviser and/or the Distributor preferential or enhanced opportunities to promote the Funds in various ways within the Intermediary’s organization.
These payments are made pursuant to negotiated agreements with Intermediaries. The payments do not change the price paid by investors for the purchase of a share or the amount a Fund will receive as proceeds from such sales. Furthermore, these payments are not reflected in the fees and expenses listed in the fee table section of the Funds’ Prospectus and described above because they are not paid by the Funds.
The categories of payments described below are not mutually exclusive, and a single Intermediary may receive payments under all categories.
Marketing Support Payments and Program Servicing Payments
The Adviser and/or the Distributor may make payments for marketing support and/or program servicing to selected Intermediaries that are registered as holders or dealers of record for accounts invested in one or more of the Nuveen Mutual Funds or that make Nuveen Mutual Fund shares available through employee benefit plans or fee-based advisory programs to compensate them for the variety of services they provide.
Marketing Support Payments. Services for which an Intermediary receives marketing support payments may include business planning assistance, advertising, educating the Intermediary’s personnel about the Nuveen Mutual Funds in connection with shareholder financial planning needs, placement on the Intermediary’s preferred or recommended fund company list, and access to sales meetings, sales representatives and management representatives of the Intermediary. In addition, Intermediaries may be compensated for enabling Nuveen representatives to participate in and/or present at conferences or seminars, sales or training programs for invited registered representatives and other employees, client and investor events and other events sponsored by the Intermediary.
The Adviser and/or the Distributor compensate Intermediaries differently depending upon, among other factors, the number or value of Nuveen Mutual Funds shares that the Intermediary sells or may sell, the value of the assets invested in the Nuveen Mutual Funds by the Intermediary’s customers, redemption rates, ability to attract and retain assets, reputation in the industry and the level and/or type of marketing assistance and educational activities provided by the Intermediary. Such payments are generally asset-based but also may include the payment of a lump sum.
Program Servicing Payments. Services for which an Intermediary receives program servicing payments typically include recordkeeping, reporting, or transaction processing, but may also include services rendered in connection with fund/investment selection and monitoring, employee enrollment and education, plan balance rollover or separation, or other similar services. An Intermediary may perform program services itself or may arrange with a third party to perform program services.
S-112
Program servicing payments typically apply to employee benefit plans, such as retirement plans, or fee-based advisory programs but may apply to retail sales and assets in certain situations. The payments are based on such factors as the type and nature of services or support furnished by the Intermediary and are generally asset-based.
Marketing Support and Program Servicing Payment Guidelines. In the case of any one Intermediary, marketing support and program servicing payments are not expected, with certain limited exceptions, to exceed, in the aggregate, 0.35% of the average net assets of Fund shares attributable to that Intermediary on an annual basis. In connection with the sale of a business by U.S. Bank N.A. (which was the parent company of a firm a portion of whose business has since been acquired by the Adviser) to Great-West Life & Annuity Insurance Company (“Great-West”), the Adviser has a services agreement with GWFS Equities, Inc., an affiliate of Great-West, which provides for payments of up to 0.60% of the average net assets of Fund shares attributable to GWFS Equities, Inc. on an annual basis.
Other Payments
From time to time, the Adviser and/or the Distributor, at their expense, may provide other compensation to Intermediaries that sell or arrange for the sale of shares of the Funds, which may be in addition to marketing support and program servicing payments described above. For example, the Adviser and/or the Distributor may: (i) compensate Intermediaries for National Securities Clearing Corporation networking system services (e.g., shareholder communication, account statements, trade confirmations, and tax reporting) on an asset-based or per account basis; (ii) compensate Intermediaries for providing Fund shareholder trading information; (iii) make one-time or periodic payments to reimburse selected Intermediaries for items such as ticket charges (i.e., fees that an Intermediary charges its representatives for effecting transactions in Fund shares) of up to $25 per purchase or exchange order, operational charges (e.g., fees that an Intermediary charges for establishing a Fund on its trading system), and literature printing and/or distribution costs; and (iv) at the direction of a retirement plan’s sponsor, reimburse or pay direct expenses of an employee benefit plan that would otherwise be payable by the plan.
When not provided for in a marketing support or program servicing agreement, the Adviser and/or the Distributor may pay Intermediaries for enabling the Adviser and/or the Distributor to participate in and/or present at conferences or seminars, sales or training programs for invited registered representatives and other Intermediary employees, client and investor events and other Intermediary-sponsored events, and for travel expenses, including lodging incurred by registered representatives and other employees in connection with prospecting, asset retention and due diligence trips. These payments may vary depending upon the nature of the event. The Adviser and/or the Distributor make payments for such events as they deem appropriate, subject to their internal guidelines and applicable law. Wholesale representatives of the Distributor may receive additional compensation if they meet certain targets for sales of one or more Nuveen Mutual Funds.
The Adviser and/or the Distributor occasionally sponsors due diligence meetings for registered representatives during which they receive updates on various Nuveen Mutual Funds and are afforded the opportunity to speak with portfolio managers. Although invitations to these meetings are not conditioned on selling a specific number of shares, those who have shown an interest in Nuveen Mutual Funds are more likely to be considered. To the extent permitted by their firm’s policies and procedures, all or a portion of registered representatives’ expenses in attending these meetings may be covered by the Adviser and/or the Distributor.
Certain third parties, affiliates of the Adviser and employees of the Adviser or its affiliates may receive cash compensation from the Adviser and/or the Distributor in connection with establishing new client relationships with the Nuveen Mutual Funds. Such compensation may vary by product and by Intermediary. Total compensation of employees of the Adviser and its affiliates with marketing and/or sales responsibilities is based in part on their generation of new client relationships, including new client relationships with the Nuveen Mutual Funds, and such employees may receive additional compensation if they meet certain targets for sales of one or more Nuveen Mutual Funds.
Other compensation may be offered to the extent not prohibited by state laws or any self-regulatory agency, such as FINRA. Investors can ask their Intermediary for information about any payments it receives from the Adviser and/or the Distributor and the services it provides for those payments.
S-113
Investors may wish to take Intermediary payment arrangements into account when considering and evaluating any recommendations relating to Fund shares.
Intermediaries Receiving Additional Payments
The following is a list of Intermediaries receiving one or more of the types of payments discussed above as of February 20, 2012:
ADP Broker-Dealer, Inc.
American Enterprise Investment Services, Inc.
American United Life Insurance Company
Ameriprise Financial Services, Inc.
Ascensus (formerly BISYS Retirement Services, Inc.)
Banc of America Investment Services, Inc.
Benefit Plans Administrative Services, Inc.
Benefit Trust Company
Charles Schwab & Co., Inc.
Citigroup Global Markets Inc./Morgan Stanley Smith Barney LLC
Commonwealth Equity Services, LLP, DBA Commonwealth Financial Network
Country Trust Bank
CPI Qualified Plan Consultants, Inc.
Digital Retirement Solutions, Inc.
Dyatech, LLC
ExpertPlan, Inc.
Fidelity Brokerage Services LLC/National Financial Services LLC
Fidelity Investments Institutional Operations Company, Inc.
Genesis Employee Benefits, Inc. DBA America’s VEBA Solution
GWFS Equities, Inc.
Hartford Life Insurance Company
Hartford Securities Distribution Company, Inc.
Hewitt Associates LLC
ICMA Retirement Corporation
ING Institutional Plan Services, LLC/ING Investment Advisors, LLC (formerly CitiStreet
LLC/CitiStreet Advisors LLC)
ING Life Insurance and Annuity Company/ING Institutional Plan Services LLC
J.P. Morgan Retirement Plan Services, LLC
Janney Montgomery Scott LLC
Leggette Actuaries, Inc.
Lincoln Retirement Services Company LLC/AMG Service Corp.
Linsco/Private Ledger Corp.
Marshall & Ilsley Trust Company, N.A.
Massachusetts Mutual Life Insurance Company
Mercer HR Outsourcing LLC
Merrill Lynch, Pierce, Fenner & Smith Inc.
MetLife Securities, Inc.
Mid Atlantic Capital Corporation
Morgan Stanley & Co., Incorporated/Morgan Stanley Smith Barney LLC
MSCS Financial Services, LLC
Nationwide Financial Services, Inc.
Newport Retirement Services, Inc.
NYLife Distributors LLC
Pershing LLC
Princeton Retirement Group/GPC Securities, Inc.
Principal Life Insurance Company
Prudential Insurance Company of America (The)
Prudential Investment Management Services, LLC/Prudential Investments LLC
Raymond James & Associates/Raymond James Financial Services, Inc.
RBC Dain Rauscher, Inc.
S-114
Reliance Trust Company
Retirement Plan Company, LLC (The)
Robert W. Baird & Co., Inc.
Stifel, Nicolaus & Co., Inc.
T. Rowe Price Investment Services, Inc./T. Rowe Price Retirement Plan Services, Inc.
TD Ameritrade, Inc.
TD Ameritrade Trust Company (formerly Fiserv Trust Company/International
Clearing Trust Company)
TIAA-CREF Individual & Institutional Services, LLC
U.S. Bancorp Investments, Inc.
U.S. Bank N.A.
UBS Financial Services, Inc.
Unified Trust Company, N.A.
VALIC Retirement Services Company (formerly AIG Retirement Services Company)
Vanguard Group, Inc.
Wachovia Bank, N.A.
Wachovia Securities, LLC
Wells Fargo Advisors, LLC
Wells Fargo Bank, N.A.
Wilmington Trust Company
Wilmington Trust Retirement and Institutional Services Company (formerly AST Capital Trust Company)
Any additions, modifications or deletions to the list of Intermediaries identified above that have occurred since February 20, 2012 are not reflected in the list.
FINANCIAL STATEMENTS
The audited financial statements for each Fund’s most recent fiscal year appear in each Fund’s Annual Report, dated October 31, 2011. Each Fund’s Annual Report is incorporated by reference into this Statement of Additional Information and is available without charge by calling (800) 257-8787.
S-115
APPENDIX A
RATINGS OF INVESTMENTS
A rating of a rating service represents that service’s opinion as to the credit quality of the rated security. However, such ratings are general and cannot be considered absolute standards of quality or guarantees as to the creditworthiness of an issuer. A rating is not a recommendation to purchase, sell or hold a security, because it does not take into account market value or suitability for a particular investor. Market values of debt securities may change as a result of a variety of factors unrelated to credit quality, including changes in market interest rates.
When a security has been rated by more than one service, the ratings may not coincide, and each rating should be evaluated independently. Ratings are based on current information furnished by the issuer or obtained by the rating services from other sources which they consider reliable. Ratings may be changed, suspended or withdrawn as a result of changes in or unavailability of such information, or for other reasons. In general, the Funds are not required to dispose of a security if its rating declines after it is purchased, although they may consider doing so.
Ratings of Long-Term Corporate Debt Obligations
Standard & Poor’s
| AAA: | An obligation rated AAA has the highest rating assigned by Standard & Poor’s. The obligor’s capacity to meet its financial commitment on the obligation is extremely strong. |
| AA: | An obligation rated AA differs from the highest rated obligations only in small degree. The obligor’s capacity to meet its financial commitment on the obligation is very strong. |
| A: | An obligation rated A is somewhat more susceptible to the adverse effects of changes in circumstances and economic conditions than bonds in higher rated categories. However, the obligor’s capacity to meet its financial commitment on the obligation is still strong. |
| BBB: | An obligation rated BBB exhibits adequate protection parameters. However, adverse economic conditions or changing circumstances are more likely to lead to a weakened capacity of the obligor to meet its financial commitment on the obligation. |
Obligations rated BB, B, CCC, CC, and C are regarded as having significant speculative characteristics. BB indicates the least degree of speculation and C the highest. While such obligations will likely have some quality and protective characteristics, these may be outweighed by large uncertainties or major exposures to adverse conditions.
| BB: | An obligation rated BB is less vulnerable to nonpayment than other speculative issues. However, it faces major ongoing uncertainties or exposure to adverse business, financial or economic conditions which could lead to the obligor’s inadequate capacity to meet its financial commitment on the obligation. |
| B: | An obligation rated B is more vulnerable to nonpayment than obligations rated BB, but the obligor currently has the capacity to meet its financial commitment on the obligation. Adverse business, financial, or economic conditions will likely impair the obligor’s capacity or willingness to meet its financial commitment on the obligation. |
| CCC: | An obligation rated CCC is currently vulnerable to nonpayment, and is dependent upon favorable business, financial, and economic conditions for the obligor to meet its financial commitment on the obligation. In the event of adverse business, financial, or economic conditions, the obligor is not likely to have the capacity to meet its financial commitment on the obligation. |
| CC: | An obligation rated CC is currently highly vulnerable to nonpayment. |
A-1
| C: | A subordinated debt or preferred stock obligation rated C is currently highly vulnerable to nonpayment. The C rating may be used to cover a situation where a bankruptcy petition has been filed or similar action taken, but payments on this obligation are being continued. A C also will be assigned to a preferred stock issue in arrears on dividends or sinking fund payments, but that is currently paying. |
| D: | An obligation rated D is in payment default. The D rating category is used when payments on an obligation are not made on the date due even if the applicable grace period has not expired, unless Standard & Poor’s believes that such payments will be made during such grace period. The D rating also will be used upon the filing of a bankruptcy petition or the taking of a similar action if payments on an obligation are jeopardized. |
The ratings from AA to CCC may be modified by the addition of a plus (+) or minus (-) sign to show relative standing within the major rating categories.
Moody’s
| Aaa: | Bonds and preferred stock that are rated Aaa are judged to be of the best quality. They carry the smallest degree of investment risk and are generally referred to as “gilt edge.” Interest payments are protected by a large or exceptionally stable margin and principal is secure. While the various protective elements are likely to change, such changes as can be visualized are most unlikely to impair the fundamentally strong position of such issues. |
| Aa: | Bonds and preferred stock that are rated Aa are judged to be of high quality by all standards. Together with the Aaa group, they comprise what are generally known as high-grade bonds. They are rated lower than the best bonds because margins of protection may not be as large as in Aaa securities, or fluctuation of protective elements may be of greater amplitude, or there may be other elements present which make the long-term risks appear somewhat greater than in Aaa securities. |
| A: | Bonds and preferred stock that are rated A possess many favorable investment attributes and are to be considered as upper-medium-grade obligations. Factors giving security to principal and interest are considered adequate, but elements may be present which suggest a susceptibility to impairment sometime in the future. |
| Baa: | Bonds and preferred stock that are rated Baa are considered as medium-grade obligations (i.e., they are neither highly protected nor poorly secured). Interest payments and principal security appear adequate for the present, but certain protective elements may be lacking or may be characteristically unreliable over any great length of time. Such securities lack outstanding investment characteristics, and in fact have speculative characteristics as well. |
| Ba: | Bonds and preferred stock that are rated Ba are judged to have speculative elements; their future cannot be considered as well assured. Often the protection of interest and principal payments may be very moderate, and thereby not well safeguarded during both good and bad times over the future. Uncertainty of position characterizes issues in this class. |
| B: | Bonds and preferred stock that are rated B generally lack characteristics of the desirable investment. Assurance of interest and principal payments or of maintenance of other terms of the contract over any long period of time may be small. |
| Caa: | Bonds and preferred stock that are rated Caa are of poor standing. Such issues may be in default or there may be present elements of danger with respect to principal or interest. |
| Ca: | Bonds and preferred stock that are rated Ca represent obligations that are speculative in a high degree. Such issues are often in default or have other marked shortcomings. |
| C: | Bonds and preferred stock that are rated C are the lowest rated class of bonds, and issues so rated can be regarded as having extremely poor prospects of ever attaining any real investment standing. |
A-2
Moody’s applies numerical modifiers 1, 2, and 3 in each generic rating classification from Aa through Caa. The modifier 1 indicates that the obligation ranks in the higher end of its generic rating category; the modifier 2 indicates a mid-range ranking; and the modifier 3 indicates a ranking in the lower end of that generic rating category.
Fitch
| AAA: | Securities considered to be investment grade and of the highest credit quality. These ratings denote the lowest expectation of credit risk and are assigned only in case of exceptionally strong capacity for timely payment of financial commitments. This capacity is highly unlikely to be adversely affected by foreseeable events. |
| AA: | Securities considered to be investment grade and of very high credit quality. These ratings denote a very low expectation of credit risk and indicate very strong capacity for timely payment of financial commitments. This capacity is not significantly vulnerable to foreseeable events. |
| A: | Securities considered to be investment grade and of high credit quality. These ratings denote a low expectation of credit risk and indicate strong capacity for timely payment of financial commitments. This capacity may, nevertheless, be more vulnerable to changes in circumstances or in economic conditions than is the case for higher ratings. |
| BBB: | Securities considered to be investment grade and of good credit quality. These ratings denote that there is currently a low expectation of credit risk. The capacity for timely payment of financial commitments is considered adequate, but adverse changes in circumstances and in economic conditions are more likely to impair this capacity. This is the lowest investment grade category. |
| BB: | Securities considered to be speculative. These ratings indicate that there is a possibility of credit risk developing, particularly as the result of adverse economic change over time; however, business or financial alternatives may be available to allow financial commitments to be met. Securities rated in this category are not investment grade. |
| B: | Securities are considered highly speculative. These ratings indicate that significant credit risk is present, but a limited margin of safety remains. Financial commitments are currently being met; however, capacity for continued payment is contingent upon a sustained, favorable business and economic environment. |
| CCC, CC and C: | Securities have high default risk. Default is a real possibility, and capacity for meeting financial commitments is solely reliant upon sustained, favorable business or economic developments. CC ratings indicate that default of some kind appears probable, and C ratings signal imminent default. |
| DDD, DD and D: | Securities are in default. The ratings of obligations in this category are based on their prospects for achieving partial or full recovery in a reorganization or liquidation of the obligor. While expected recovery values are highly speculative and cannot be estimated with any precision, the following serve as general guidelines. DDD obligations have the highest potential for recovery, around 90%-100% of outstanding amounts and accrued interest. DD indicates potential recoveries in the range of 50%-90%, and D the lowest recovery potential, i.e., below 50%. |
Entities rated in this category have defaulted on some or all of their obligations. Entities rated DDD have the highest prospect for resumption of performance or continued operation with or without a formal reorganization process. Entities rated DD and D are generally undergoing a formal reorganization or liquidation process; those rated DD are likely to satisfy a higher portion of their outstanding obligations, while entities rated D have a poor prospect for repaying all obligations.
The ratings from AA to CCC may be modified by the addition of a plus (+) or minus (-) sign to show the relative standing within the major rating categories.
A-3
Ratings of Commercial Paper
Standard & Poor’s
Commercial paper ratings are graded into four categories, ranging from A for the highest quality obligations to D for the lowest. None of the Funds will purchase commercial paper rated A-3 or lower.
| A-1: | A short-term obligation rated A-1 is rated in the highest category by Standard & Poor’s. The obligor’s capacity to meet its financial commitment on the obligation is strong. Within this category, certain obligations are designated with a plus sign (+). This indicates that the obligor’s capacity to meet its financial commitment on these obligations is extremely strong. |
| A-2: | A short-term obligation rated A-2 is somewhat more susceptible to the adverse effects of changes in circumstances and economic conditions than obligations in higher rating categories. However, the obligor’s capacity to meet its financial commitment on the obligation is satisfactory. |
| A-3: | A short-term obligation rated A-3 exhibits adequate protection parameters. However, adverse economic conditions or changing circumstances are more likely to lead to a weakened capacity of the obligor to meet its financial commitment on the obligation. |
Moody’s
Moody’s employs the following three designations, all judged to be investment grade, to indicate the relative repayment capacity of rated issuers. None of the Funds will purchase Prime-3 commercial paper.
| Prime-1: | Issuers rated Prime-1 (or supporting institutions) have a superior ability for repayment of senior short-term debt obligations. Prime-1 repayment ability will often be evidenced by many of the following characteristics: |
| | • | | Leading market positions in well-established industries. |
| | • | | High rates of return on funds employed. |
| | • | | Conservative capitalization structure with moderate reliance on debt and ample asset protection. |
| | • | | Broad margins in earnings coverage of fixed financial charges and high internal cash generation. |
| | • | | Well-established access to a range of financial markets and assured sources of alternate liquidity. |
| Prime-2: | Issuers rated Prime-2 (or supporting institutions) have a strong ability for repayment of senior short-term debt obligations. This will normally be evidenced by many of the characteristics cited above but to a lesser degree. Earnings trends and coverage ratios, while sound, may be more subject to variation. Capitalization characteristics, while still appropriate, may be more affected by external conditions. Ample alternate liquidity is maintained. |
| Prime-3: | Issuers (or supporting institutions) rated Prime-3 have an acceptable ability for repayment of senior short-term obligations. The effect of industry characteristics and market compositions may be more pronounced. Variability in earnings and profitability may result in changes in the level of debt-protection measurements and may require relatively high financial leverage. Adequate alternate liquidity is maintained. |
A-4
Fitch
Fitch employs the following three designations, all judged to be investment grade, to indicate the relative repayment capacity of rated issuers. None of the Funds will purchase F3 commercial paper.
| F1: | Securities possess the highest credit quality. This designation indicates the strongest capacity for timely payment of financial commitments and may have an added “+” to denote any exceptionally strong credit feature. |
| F2: | Securities possess good credit quality. This designation indicates a satisfactory capacity for timely payment of financial commitments, but the margin of safety is not as great as in the case of the higher ratings. |
| F3: | Securities possess fair credit quality. This designation indicates that the capacity for timely payments of financial commitments is adequate; however, near-term adverse changes could result in a reduction to non-investment grade. |
A-5
APPENDIX B
Nuveen Fund Advisors, Inc.
Proxy Voting Policies and Procedures
Effective Date: January 1, 2011
I. INTRODUCTION
Nuveen Fund Advisors, Inc. (“Adviser”) is an investment adviser for the Nuveen Funds (the “Funds”) and for other accounts (collectively, with the Funds, “Accounts”). As such, Accounts may confer upon Adviser complete discretion to vote proxies. It is Adviser’s duty to vote proxies in the best interests of its clients (which may involve affirmatively deciding that voting the proxies may not be in the best interests of certain clients on certain matters). In voting proxies, Adviser also seeks to enhance total investment return for its clients.
When Adviser contracts with another investment adviser to act as a sub-adviser for its Accounts, Adviser delegates proxy voting responsibility to the sub-adviser (each a “Sub-Adviser”). Where Adviser has delegated proxy voting responsibility, the Sub-Adviser will be responsible for developing and adhering to its own proxy voting policies, subject to oversight by Adviser.
II. POLICIESAND PROCEDURES
Consistent with its oversight responsibilities, Adviser has adopted the following Sub-Adviser oversight policies and procedures:
1. Prior to approval of any sub-advisory contract by Adviser or the Board of Directors of the Funds, as applicable, Adviser’s Compliance reviews the Sub-Adviser’s proxy voting policy (each a “Sub-Adviser Policy”) to ensure that such Sub-Adviser Policy is designed in the best interests of Adviser’s clients. Thereafter, at least annually, Adviser’s Compliance reviews and approves material changes to each Sub-Adviser Policy.
2. On a quarterly basis, Adviser’s Investment Operations will request and review reports from each Sub-Adviser reflecting any overrides of its Sub-Adviser Policy or conflicts of interest addressed during the previous quarter, and other matters Adviser’s Investment Operations deems appropriate. Any material issues arising from such review will be reported to Adviser’s management and if appropriate, the Board of Directors of the Funds.
III. POLICY OWNER
Chief Compliance Officer
IV. RESPONSIBLE PARTIES
Compliance
Investment Operations
B-1
Nuveen Asset Management, LLC
Proxy Voting Policies and Procedures
Effective Date: January 1, 2011
I. General Principles
A. Nuveen Asset Management, LLC (“Adviser”) is an investment sub-adviser for certain of the Nuveen Funds (the “Funds”) and investment adviser for institutional and other separately managed accounts (collectively, with the Funds, “Accounts”). As such, Accounts may confer upon Adviser complete discretion to vote proxies. It is Adviser’s duty to vote proxies in the best interests of its clients (which may involve affirmatively deciding that voting the proxies may not be in the best interests of certain clients on certain matters1). In voting proxies, Adviser also seeks to enhance total investment return for its clients.
B. If Adviser contracts with another investment adviser to act as a sub-adviser for an Account, Adviser may delegate proxy voting responsibility to the sub-adviser. Where Adviser has delegated proxy voting responsibility, the sub-adviser will be responsible for developing and adhering to its own proxy voting policies, subject to oversight by Adviser.
C. Adviser’s Investment Policy Committee (“IPC”), comprised of the firm’s most senior investment professionals, is charged with oversight of the proxy voting policies and procedures. The IPC is responsible for (1) approving the proxy voting policies and procedures, and (2) oversight of the activities of Adviser’s Proxy Voting Committee (“PVC”). The PVC is responsible for providing an administrative framework to facilitate and monitor Adviser’s exercise of its fiduciary duty to vote client proxies and fulfill the obligations of reporting and recordkeeping under the federal securities laws.
II. Policies
The IPC, after reviewing and concluding that such policies are reasonably designed to vote proxies in the best interests of clients, has approved and adopted the proxy voting policies of Institutional Shareholder Services, Inc. (“ISS”), a leading national provider of proxy voting administrative and research services. As a result, such policies set forth Adviser’s positions on recurring proxy issues and criteria for addressing non-recurring issues. These policies are reviewed periodically by ISS, and therefore are subject to change. Even though it has adopted ISS policies, Adviser maintains the fiduciary responsibility for all proxy voting decisions.
III. Procedures
A. Supervision of Proxy Voting Service. The PVC shall supervise the relationship with Adviser’s proxy voting service, ISS. ISS apprises Adviser of shareholder meeting dates, provides research on proxy proposals and voting recommendations, and casts the actual proxy votes. ISS also serves as Adviser’s proxy voting record keeper and generates reports on how proxies were voted.
B. Conflicts of Interest.
1. The following relationships or circumstances may give rise to conflicts of interest:2
| | a. | The issuer or proxy proponent (e.g., a special interest group) is Madison Dearborn Partners, a private equity firm and affiliate of Adviser (“MDP”), or a company that controls, is controlled by or is under common control with MDP. |
| 1 | Adviser may not vote proxies associated with the securities of any issuer if as a result of voting, subsequent purchases or sales of such securities would be blocked. However, Adviser may decide, on an individual security basis that it is in the best interests of its clients to vote the proxy associated with such a security, taking into account the loss of liquidity. In addition, Adviser may not to vote proxies where the voting would in Adviser’s judgment result in some other financial, legal, regulatory disability or burden to the client (such as imputing control with respect to the issuer) or subject to resolution of any conflict of interest as provided herein, to Adviser. |
| 2 | A conflict of interest shall not be considered material for the purposes of these Policies and Procedures in respect of a specific vote or circumstance if the matter to be voted on relates to a restructuring of the terms of existing securities or the issuance of new securities or a similar matter arising out of the holding of securities, other than common equity, in the context of a bankruptcy or threatened bankruptcy of the issuer, even if a conflict described in III.B.1a.-d is present. |
B-2
| | b. | The issuer is an entity in which an executive officer of Adviser or a spouse or domestic partner of any such executive officer is or was (within the past three years of the proxy vote) an executive officer or director. |
| | c. | The issuer is a registered or unregistered fund for which Adviser or another Nuveen adviser serves as investment adviser or sub-adviser. |
| | d. | Any other circumstances that Adviser is aware of where Adviser’s duty to serve its clients’ interests, typically referred to as its “duty of loyalty,” could be materially compromised. |
2. Adviser will vote proxies in the best interest of its clients regardless of such real or perceived conflicts of interest. By adopting ISS policies, Adviser believes the risk related to conflicts will be minimized.
3. To further minimize this risk, the IPC will review ISS’ conflict avoidance policy at least annually to ensure that it adequately addresses both the actual and perceived conflicts of interest the proxy voting service may face.
4. In the event that ISS faces a material conflict of interest with respect to a specific vote, the PVC shall direct ISS how to vote. The PVC shall receive voting direction from the Head of Research, who will seek voting direction from appropriate investment personnel. Before doing so, however, the PVC will confirm that Adviser faces no material conflicts of its own with respect to the specific proxy vote.
5. If the PVC concludes that a material conflict does exist, it will recommend to the IPC a course of action designed to address the conflict. Such actions could include, but are not limited to:
| | a. | Obtaining instructions from the affected client(s) on how to vote the proxy; |
| | b. | Disclosing the conflict to the affected client(s) and seeking their consent to permit Adviser to vote the proxy; |
| | c. | Voting in proportion to the other shareholders; |
| | d. | Recusing an IPC member from all discussion or consideration of the matter, if the material conflict is due to such person’s actual or potential conflict of interest; or |
| | e. | Following the recommendation of a different independent third party. |
6. In addition to all of the above-mentioned and other conflicts, members of the IPC and the PVC must notify Adviser’s Chief Compliance Officer of any direct, indirect or perceived improper influence exerted by any employee, officer or director within the MDP affiliate or Fund complex with regard to how Adviser should vote proxies. The Chief Compliance Officer will investigate the allegations and will report the findings to Adviser’s President and the General Counsel. If it is determined that improper influence was attempted, appropriate action shall be taken. Such appropriate action may include disciplinary action, notification of the appropriate senior managers within the MDP affiliate, or notification of the appropriate regulatory authorities. In all cases, the IPC shall not consider any improper influence in determining how to vote proxies, and will vote in the best interests of clients.
C. Proxy Vote Override. From time to time, a portfolio manager of an Account (a “Portfolio Manager”) may initiate action to override the ISS recommendation for a particular vote. Any such override by a NAM Portfolio Manager (but not a sub-adviser Portfolio Manager) shall be reviewed by Adviser’s Legal Department for material conflicts. If the Legal Department determines that no material conflicts exist, the approval of one investment professional on the IPC or the Head of Equity Research shall authorize the override. If a material conflict exists the conflict and, ultimately, the override recommendation will be addressed pursuant to the procedures described above under “Conflicts of Interest.”
D. Securities Lending.
1. In order to generate incremental revenue, some clients may participate in a securities lending program. If a client has elected to participate in the lending program then it will not have the right to vote the proxies of any securities that are on loan as of the shareholder meeting record date. A client, or a Portfolio Manager, may place restrictions on loaning securities and/or recall a security on loan at any time. Such actions must be affected prior to the record date for a meeting if the purpose for the restriction or recall is to secure the vote.
B-3
2. Portfolio Managers and/or analysts who become aware of upcoming proxy issues relating to any securities in portfolios they manage, or issuers they follow, will consider the desirability of recalling the affected securities that are on loan or restricting the affected securities prior to the record date for the matter. If the proxy issue is determined to be material, and the determination is made prior to the shareholder meeting record date the Portfolio Manager(s) will contact the Securities Lending Agent to recall securities on loan or restrict the loaning of any security held in any portfolio they manage, if they determine that it is in the best interest of shareholders to do so. Training regarding the process to recall securities on loan or restrict the loaning of securities is given to all Portfolio Managers and analysts.
E. Proxy Voting for ERISA Clients. If a proxy voting issue arises for an ERISA client, Adviser is prohibited from voting shares with respect to any issue advanced by a party in interest of the ERISA client.
F. Proxy Voting Records. As required by Rule 204-2 of the Investment Advisers Act of 1940, Adviser shall make and retain five types of records relating to proxy voting; (a) proxy voting policies and procedures; (b) proxy statements received for client and fund securities; (c) records of votes cast on behalf of clients and funds; (d) records of written requests for proxy voting information and written responses from the Adviser to either a written or oral request; and (e) any documents prepared by the adviser that were material to making a proxy voting decision or that memorialized the basis for the decision. Adviser may rely on ISS to make and retain on Adviser’s behalf records pertaining to the rule.
G. Fund of Funds Provision. In instances where Adviser provides investment advice to a fund of funds that acquires shares of affiliated funds or three percent or more of the outstanding voting securities of an unaffiliated fund, the acquiring fund shall vote the shares in the same proportion as the vote of all other shareholders of the acquired fund. If compliance with this policy results in a vote of any shares in a manner different than the ISS recommendation, such vote will not require compliance with the Proxy Vote Override procedures set forth above.
H. Legacy Securities. To the extent that Adviser receives proxies for securities that are transferred into an Account’s portfolio that were not recommended or selected by Adviser and are sold or expected to be sold promptly in an orderly manner (“legacy securities”), Adviser will generally instruct ISS to refrain from voting such proxies. In such circumstances, since legacy securities are expected to be sold promptly, voting proxies on such securities would not further Adviser’s interest in maximizing the value of client investments. Adviser may agree to an institutional Account’s special request to vote a legacy security proxy, and would instruct ISS to vote such proxy in accordance with its guidelines.
I. Review and Reports.
1. The PVC shall maintain a review schedule. The schedule shall include reviews for the proxy voting policy (including the policies of any sub-adviser), the proxy voting record, account maintenance, and other reviews as deemed appropriate by the PVC. The PVC shall review the schedule at least annually.
2. The PVC will report to the IPC with respect to all identified conflicts and how they were addressed. These reports will include all Accounts, including those that are sub-advised. With respect to the review of votes cast on behalf of investments by the Funds, such review will also be reported to the Board of Directors of the Funds at each of their regularly scheduled meetings. Adviser also shall provide the Funds that it sub-advises with information necessary for preparing Form N-PX.
K. Vote Disclosure to Clients. Adviser’s institutional and separately managed account clients can contact their relationship manager for more information on Adviser’s policies and the proxy voting record for their account. The information available includes name of issuer, ticker/CUSIP, shareholder meeting date, description of item and Adviser’s vote.
B-4
IV. Policy Owner
IPC
V. Responsible Parties
IPC
PVC
ADV Review Team
RiskMetrics Group’s U.S. Proxy Voting Guidelines Concise Summary
(Digest of Selected Key Guidelines)
January 22, 2010
1. Routine/Miscellaneous:
Auditor Ratification
Vote FOR proposals to ratify auditors, unless any of the following apply:
| | ¡ | | An auditor has a financial interest in or association with the company, and is therefore not independent; |
| | ¡ | | There is reason to believe that the independent auditor has rendered an opinion which is neither accurate nor indicative of the company’s financial position; |
| | ¡ | | Poor accounting practices are identified that rise to a serious level of concern, such as: fraud; misapplication of GAAP; and material weaknesses identified in Section 404 disclosures; or |
| | ¡ | | Fees for non-audit services (“Other” fees) are excessive. |
Non-audit fees are excessive if:
| | ¡ | | Non-audit (“other”) fees exceed audit fees + audit-related fees + tax compliance/preparation fees |
Vote CASE-BY-CASE on shareholder proposals asking companies to prohibit or limit their auditors from engaging in non-audit services.
| | ¡ | | Vote CASE-BY-CASE on shareholder proposals asking for audit firm rotation, taking into account: |
| | ¡ | | The tenure of the audit firm; |
| | ¡ | | The length of rotation specified in the proposal; |
| | ¡ | | Any significant audit-related issues at the company; |
| | ¡ | | The number of Audit Committee meetings held each year; |
| | ¡ | | The number of financial experts serving on the committee; and |
| | ¡ | | Whether the company has a periodic renewal process where the auditor is evaluated for both audit quality and competitive price. |
2. Board of Directors:
Votes on director nominees should be determined on a CASE-BY-CASE basis.
Four fundamental principles apply when determining votes on director nominees:
Board Accountability
Board Responsiveness
Director Independence
Director Competence
B-5
Board Accountability
Problematic Takeover Defenses
VOTE WITHHOLD/AGAINST3 the entire board of directors (except new nominees4, who should be considered on a CASE-by-CASE basis), if:
| | ¡ | | The board is classified, and a continuing director responsible for a problematic governance issue at the board/committee level that would warrant a withhold/against vote recommendation is not up for election—any or all appropriate nominees (except new) may be held accountable; |
| | ¡ | | The company’s poison pill has a “dead-hand” or “modified dead-hand” feature. Vote withhold/against every year until this feature is removed; |
| | ¡ | | The board adopts a poison pill with a term of more than 12 months (“long-term pill”), or renews any existing pill, including any “short-term” pill (12 months or less), without shareholder approval. A commitment or policy that puts a newly-adopted pill to a binding shareholder vote may potentially offset an adverse vote recommendation. Review such companies with classified boards every year, and such companies with annually-elected boards at least once every three years, and vote AGAINST or WITHHOLD votes from all nominees if the company still maintains a non-shareholder-approved poison pill. This policy applies to all companies adopting or renewing pills after the announcement of this policy (Nov 19, 2009); |
| | ¡ | | The board makes a material adverse change to an existing poison pill without shareholder approval. |
Vote CASE-By-CASE on all nominees if the board adopts a poison pill with a term of 12 months or less (“short-term pill”) without shareholder approval, taking into account the following factors:
| | ¡ | | The date of the pill’s adoption relative to the date of the next meeting of shareholders- i.e. whether the company had time to put the pill on ballot for shareholder ratification given the circumstances; |
| | ¡ | | The issuer’s rationale; |
| | ¡ | | The issuer’s governance structure and practices; and |
| | ¡ | | The issuer’s track record of accountability to shareholders. |
Problematic Audit-Related Practices
Generally, vote AGAINST or WITHHOLD from the members of the Audit Committee if:
| | ¡ | | The non-audit fees paid to the auditor are excessive (see discussion under “Auditor Ratification”); |
| | ¡ | | The company receives an adverse opinion on the company’s financial statements from its auditor; or |
| | ¡ | | There is persuasive evidence that the audit committee entered into an inappropriate indemnification agreement with its auditor that limits the ability of the company, or its shareholders, to pursue legitimate legal recourse against the audit firm. |
| 3 | In general, companies with a plurality vote standard use “Withhold” as the valid contrary vote option in director elections; companies with a majority vote standard use “Against”. However, it will vary by company and the proxy must be checked to determine the valid contrary vote option for the particular company. |
| 4 | A “new nominee” is any current nominee who has not already been elected by shareholders and who joined the board after the problematic action in question transpired. If RMG cannot determine whether the nominee joined the board before or after the problematic action transpired, the nominee will be considered a “new nominee” if he or she joined the board within the 12 months prior to the upcoming shareholder meeting. |
B-6
Vote CASE-by-CASE on members of the Audit Committee and/or the full board if:
| | ¡ | | Poor accounting practices are identified that rise to a level of serious concern, such as: fraud; misapplication of GAAP; and material weaknesses identified in Section 404 disclosures. Examine the severity, breadth, chronological sequence and duration, as well as the company’s efforts at remediation or corrective actions, in determining whether WITHHOLD/AGAINST votes are warranted. |
Problematic Compensation Practices
VOTE WITHHOLD/AGAINST the members of the Compensation Committee and potentially the full board if:
| | ¡ | | There is a negative correlation between chief executive pay and company performance (see Pay for Performance Policy); |
| | ¡ | | The company reprices underwater options for stock, cash, or other consideration without prior shareholder approval, even if allowed in the firm’s equity plan; |
| | ¡ | | The company fails to submit one-time transfers of stock options to a shareholder vote; |
| | ¡ | | The company fails to fulfill the terms of a burn rate commitment made to shareholders; |
| | ¡ | | The company has problematic pay practices. Problematic pay practices may warrant withholding votes from the CEO and potentially the entire board as well. |
Other Problematic Governance Practices
VOTE WITHHOLD/AGAINST the entire board of directors (except new nominees, who should be considered on a CASE-by-CASE basis), if:
| | ¡ | | The company’s proxy indicates that not all directors attended 75 percent of the aggregate board and committee meetings, but fails to provide the required disclosure of the names of the director(s) involved. If this information cannot be obtained, withhold from all incumbent directors; |
| | ¡ | | The board lacks accountability and oversight, coupled with sustained poor performance relative to peers. Sustained poor performance is measured by one- and three-year total shareholder returns in the bottom half of a company’s four-digit GICS industry group (Russell 3000 companies only). Take into consideration the company’s five-year total shareholder return and five-year operational metrics. Problematic provisions include but are not limited to: |
| | – | | A classified board structure; |
| | – | | A supermajority vote requirement; |
| | – | | Majority vote standard for director elections with no carve out for contested elections; |
| | – | | The inability for shareholders to call special meetings; |
| | – | | The inability for shareholders to act by written consent; |
| | – | | A dual-class structure; and/or |
| | – | | A non-shareholder approved poison pill. |
Under extraordinary circumstances, vote AGAINST or WITHHOLD from directors individually, committee members, or the entire board, due to:
| | ¡ | | Material failures of governance, stewardship, or fiduciary responsibilities at the company; |
| | ¡ | | Failure to replace management as appropriate; or |
| | ¡ | | Egregious actions related to the director(s)’ service on other boards that raise substantial doubt about his or her ability to effectively oversee management and serve the best interests of shareholders at any company. |
B-7
Board Responsiveness
Vote WITHHOLD/AGAINST the entire board of directors (except new nominees, who should be considered on a CASE-by-CASE basis), if:
| | ¡ | | The board failed to act on a shareholder proposal that received approval by a majority of the shares outstanding the previous year (a management proposal with other than a FOR recommendation by management will not be considered as sufficient action taken); |
| | ¡ | | The board failed to act on a shareholder proposal that received approval of the majority of shares cast for the previous two consecutive years (a management proposal with other than a FOR recommendation by management will not be considered as sufficient action taken); |
| | ¡ | | The board failed to act on takeover offers where the majority of the shareholders tendered their shares; or |
| | ¡ | | At the previous board election, any director received more than 50 percent withhold/against votes of the shares cast and the company has failed to address the issue(s) that caused the high withhold/against vote. |
Director Independence
Vote WITHHOLD/AGAINST Inside Directors and Affiliated Outside Directors (per the Categorization of Directors in the Summary Guidelines) when:
| | ¡ | | The inside or affiliated outside director serves on any of the three key committees: audit, compensation, or nominating; |
| | ¡ | | The company lacks an audit, compensation, or nominating committee so that the full board functions as that committee; |
| | ¡ | | The company lacks a formal nominating committee, even if the board attests that the independent directors fulfill the functions of such a committee; or |
| | ¡ | | The full board is less than majority independent. |
Director Competence
Vote AGAINST or WITHHOLD from individual directors who:
| | ¡ | | Attend less than 75 percent of the board and committee meetings without a valid excuse, such as illness, service to the nation, work on behalf of the company, or funeral obligations. If the company provides meaningful public or private disclosure explaining the director’s absences, evaluate the information on a CASE-BY-CASE basis taking into account the following factors: |
| | – | | Degree to which absences were due to an unavoidable conflict; |
| | – | | Pattern of absenteeism; and |
| | – | | Other extraordinary circumstances underlying the director’s absence; |
| | ¡ | | Sit on more than six public company boards; |
| | ¡ | | Are CEOs of public companies who sit on the boards of more than two public companies besides their own—withhold only at their outside boards. |
Voting for Director Nominees in Contested Elections
Vote CASE-BY-CASE on the election of directors in contested elections, considering the following factors:
| | ¡ | | Long-term financial performance of the target company relative to its industry; |
| | ¡ | | Management’s track record; |
| | ¡ | | Background to the proxy contest; |
| | ¡ | | Qualifications of director nominees (both slates); |
| | ¡ | | Strategic plan of dissident slate and quality of critique against management; |
| | ¡ | | Likelihood that the proposed goals and objectives can be achieved (both slates); |
| | ¡ | | Stock ownership positions. |
B-8
Independent Chair (Separate Chair/CEO)
Generally vote FOR shareholder proposals requiring that the chairman’s position be filled by an independent director, unless the company satisfies all of the following criteria:
The company maintains the following counterbalancing features:
| | ¡ | | Designated lead director, elected by and from the independent board members with clearly delineated and comprehensive duties. (The role may alternatively reside with a presiding director, vice chairman, or rotating lead director; however the director must serve a minimum of one year in order to qualify as a lead director.) The duties should include, but are not limited to, the following: |
| | – | | presides at all meetings of the board at which the chairman is not present, including executive sessions of the independent directors; |
| | – | | serves as liaison between the chairman and the independent directors; |
| | – | | approves information sent to the board; |
| | – | | approves meeting agendas for the board; |
| | – | | approves meeting schedules to assure that there is sufficient time for discussion of all agenda items; |
| | – | | has the authority to call meetings of the independent directors; |
| | – | | if requested by major shareholders, ensures that he is available for consultation and direct communication; |
| | ¡ | | Two-thirds independent board; |
| | ¡ | | All independent key committees; |
| | ¡ | | Established governance guidelines; |
| | ¡ | | A company in the Russell 3000 universe must not have exhibited sustained poor total shareholder return (TSR) performance, defined as one- and three-year TSR in the bottom half of the company’s four-digit GICS industry group within the Russell 3000 only), unless there has been a change in the Chairman/CEO position within that time; |
| | ¡ | | The company does not have any problematic governance or management issues, examples of which include, but are not limited to: |
| | – | | Egregious compensation practices; |
| | – | | Multiple related-party transactions or other issues putting director independence at risk; |
| | – | | Corporate and/or management scandals; |
| | – | | Excessive problematic corporate governance provisions; or |
| | – | | Flagrant board or management actions with potential or realized negative impact on shareholders. |
3. Shareholder Rights & Defenses:
Net Operating Loss (NOL) Protective Amendments
For management proposals to adopt a protective amendment for the stated purpose of protecting a company’s net operating losses (“NOLs”), the following factors should be considered on a CASE-BY-CASE basis:
| | ¡ | | The ownership threshold (NOL protective amendments generally prohibit stock ownership transfers that would result in a new 5-percent holder or increase the stock ownership percentage of an existing five-percent holder); |
| | ¡ | | Shareholder protection mechanisms (sunset provision or commitment to cause expiration of the protective amendment upon exhaustion or expiration of the NOL); |
B-9
| | ¡ | | The company’s existing governance structure including: board independence, existing takeover defenses, track record of responsiveness to shareholders, and any other problematic governance concerns; and |
| | ¡ | | Any other factors that may be applicable. |
Poison Pills- Shareholder Proposals to put Pill to a Vote and/or Adopt a Pill Policy
Vote FOR shareholder proposals requesting that the company submit its poison pill to a shareholder vote or redeem it UNLESS the company has: (1) A shareholder approved poison pill in place; or (2) The company has adopted a policy concerning the adoption of a pill in the future specifying that the board will only adopt a shareholder rights plan if either:
| | ¡ | | Shareholders have approved the adoption of the plan; or |
| | ¡ | | The board, in its exercise of its fiduciary responsibilities, determines that it is in the best interest of shareholders under the circumstances to adopt a pill without the delay in adoption that would result from seeking stockholder approval (i.e., the “fiduciary out” provision). A poison pill adopted under this fiduciary out will be put to a shareholder ratification vote within 12 months of adoption or expire. If the pill is not approved by a majority of the votes cast on this issue, the plan will immediately terminate. |
If the shareholder proposal calls for a time period of less than 12 months for shareholder ratification after adoption, vote FOR the proposal, but add the caveat that a vote within 12 months would be considered sufficient implementation.
Poison Pills- Management Proposals to Ratify Poison Pill
Vote CASE-by-CASE on management proposals on poison pill ratification, focusing on the features of the shareholder rights plan. Rights plans should contain the following attributes:
| | ¡ | | No lower than a 20% trigger, flip-in or flip-over; |
| | ¡ | | A term of no more than three years; |
| | ¡ | | No dead-hand, slow-hand, no-hand or similar feature that limits the ability of a future board to redeem the pill; |
| | ¡ | | Shareholder redemption feature (qualifying offer clause); if the board refuses to redeem the pill 90 days after a qualifying offer is announced, 10 percent of the shares may call a special meeting or seek a written consent to vote on rescinding the pill. |
In addition, the rationale for adopting the pill should be thoroughly explained by the company. In examining the request for the pill, take into consideration the company’s existing governance structure, including: board independence, existing takeover defenses, and any problematic governance concerns.
Poison Pills- Management Proposals to ratify a Pill to preserve Net Operating Losses (NOLs)
Vote CASE-BY-CASE on management proposals for poison pill ratification. For management proposals to adopt a poison pill for the stated purpose of preserving a company’s net operating losses (“NOLs”), the following factors are considered on a CASE-BY-CASE basis:
| | ¡ | | The ownership threshold to transfer (NOL pills generally have a trigger slightly below 5%); |
| | ¡ | | Shareholder protection mechanisms (sunset provision, or commitment to cause expiration of the pill upon exhaustion or expiration of NOLs); |
| | ¡ | | The company’s existing governance structure including: board independence, existing takeover defenses, track record of responsiveness to shareholders, and any other problematic governance concerns; and |
| | ¡ | | Any other factors that may be applicable. |
B-10
Shareholder Ability to Call Special Meetings
Vote AGAINST management or shareholder proposals to restrict or prohibit shareholders’ ability to call special meetings.
Generally vote FOR management or shareholder proposals that provide shareholders with the ability to call special meetings taking into account the following factors:
| | ¡ | | Shareholders’ current right to call special meetings; |
| | ¡ | | Minimum ownership threshold necessary to call special meetings (10% preferred); |
| | ¡ | | The inclusion of exclusionary or prohibitive language; |
| | ¡ | | Investor ownership structure; and |
| | ¡ | | Shareholder support of and management’s response to previous shareholder proposals. |
Supermajority Vote Requirements
Vote AGAINST proposals to require a supermajority shareholder vote.
Vote FOR management or shareholder proposals to reduce supermajority vote requirements. However, for companies with shareholder(s) who have significant ownership levels, vote CASE-BY-CASE, taking into account:
| | ¡ | | Quorum requirements; and |
| | ¡ | | Supermajority vote requirements. |
4. Capital Restructuring:
Common Stock Authorization
Vote CASE-BY-CASE on proposals to increase the number of shares of common stock authorized for issuance. Take into account company-specific factors which include, at a minimum, the following:
| | ¡ | | Past Board Performance: |
| | – | | The company’s use of authorized shares during the last three years; |
| | – | | One- and three-year total shareholder return; and |
| | – | | The board’s governance structure and practices; |
| | – | | Disclosure in the proxy statement of the specific reasons for the proposed increase; |
| | – | | The dilutive impact of the request as determined through an allowable cap generated by RiskMetrics’ quantitative model, which examines the company’s need for shares and its three-year total shareholder return; and |
| | – | | Risks to shareholders of not approving the request. |
Vote AGAINST proposals at companies with more than one class of common stock to increase the number of authorized shares of the class that has superior voting rights.
Preferred Stock
Vote CASE-BY-CASE on proposals to increase the number of shares of preferred stock authorized for issuance. Take into account company-specific factors that include, at a minimum, the following:
| | ¡ | | Past Board Performance: |
| | – | | The company’s use of authorized preferred shares during the last three years; |
| | – | | One- and three-year total shareholder return; and |
| | – | | The board’s governance structure and practices; |
B-11
| | – | | Disclosure in the proxy statement of specific reasons for the proposed increase; |
| | – | | In cases where the company has existing authorized preferred stock, the dilutive impact of the request as determined through an allowable cap generated by RiskMetrics’ quantitative model, which examines the company’s need for shares and three-year total shareholder return; and |
| | – | | Whether the shares requested are blank check preferred shares, and whether they are declawed. |
Vote AGAINST proposals at companies with more than one class or series of preferred stock to increase the number of authorized shares of the class or series that has superior voting rights.
Mergers and Acquisitions
Vote CASE–BY–CASE on mergers and acquisitions. Review and evaluate the merits and drawbacks of the proposed transaction, balancing various and sometimes countervailing factors including:
| | ¡ | | Valuation - Is the value to be received by the target shareholders (or paid by the acquirer) reasonable? While the fairness opinion may provide an initial starting point for assessing valuation reasonableness, emphasis is placed on the offer premium, market reaction and strategic rationale. |
| | ¡ | | Market reaction - How has the market responded to the proposed deal? A negative market reaction should cause closer scrutiny of a deal. |
| | ¡ | | Strategic rationale - Does the deal make sense strategically? From where is the value derived? Cost and revenue synergies should not be overly aggressive or optimistic, but reasonably achievable. Management should also have a favorable track record of successful integration of historical acquisitions. |
| | ¡ | | Negotiations and process - Were the terms of the transaction negotiated at arm’s-length? Was the process fair and equitable? A fair process helps to ensure the best price for shareholders. Significant negotiation “wins” can also signify the deal makers’ competency. The comprehensiveness of the sales process (e.g., full auction, partial auction, no auction) can also affect shareholder value. |
| | ¡ | | Conflicts of interest - Are insiders benefiting from the transaction disproportionately and inappropriately as compared to non-insider shareholders? As the result of potential conflicts, the directors and officers of the company may be more likely to vote to approve a merger than if they did not hold these interests. Consider whether these interests may have influenced these directors and officers to support or recommend the merger. The change-in-control figure presented in the “RMG Transaction Summary” section of this report is an aggregate figure that can in certain cases be a misleading indicator of the true value transfer from shareholders to insiders. Where such figure appears to be excessive, analyze the underlying assumptions to determine whether a potential conflict exists. |
| | ¡ | | Governance - Will the combined company have a better or worse governance profile than the current governance profiles of the respective parties to the transaction? If the governance profile is to change for the worse, the burden is on the company to prove that other issues (such as valuation) outweigh any deterioration in governance. |
5. Compensation:
Executive Pay Evaluation
Underlying all evaluations are five global principles that most investors expect corporations to adhere to in designing and administering executive and director compensation programs:
1. Maintain appropriate pay-for-performance alignment, with emphasis on long-term shareholder value: This principle encompasses overall executive pay practices, which must be designed to attract, retain, and appropriately motivate the key employees who drive shareholder value creation over the long term. It will take into consideration, among other factors, the link between pay and performance; the mix between fixed and variable pay; performance goals; and equity-based plan costs;
B-12
2. Avoid arrangements that risk “pay for failure”: This principle addresses the appropriateness of long or indefinite contracts, excessive severance packages, and guaranteed compensation;
3. Maintain an independent and effective compensation committee: This principle promotes oversight of executive pay programs by directors with appropriate skills, knowledge, experience, and a sound process for compensation decision-making (e.g., including access to independent expertise and advice when needed);
4. Provide shareholders with clear, comprehensive compensation disclosures: This principle underscores the importance of informative and timely disclosures that enable shareholders to evaluate executive pay practices fully and fairly;
5. Avoid inappropriate pay to non-executive directors: This principle recognizes the interests of shareholders in ensuring that compensation to outside directors does not compromise their independence and ability to make appropriate judgments in overseeing managers‘ pay and performance. At the market level, it may incorporate a variety of generally accepted best practices.
Equity Compensation Plans
Vote CASE-BY-CASE on equity-based compensation plans. Vote AGAINST the equity plan if any of the following factors apply:
| | ¡ | | The total cost of the company’s equity plans is unreasonable; |
| | ¡ | | The plan expressly permits the repricing of stock options/stock appreciate rights (SARs) without prior shareholder approval; |
| | ¡ | | The CEO is a participant in the proposed equity-based compensation plan and there is a disconnect between CEO pay and the company’s performance where over 50 percent of the year-over-year increase is attributed to equity awards (see Pay-for-Performance); |
| | ¡ | | The company’s three year burn rate exceeds the greater of 2% or the mean plus one standard deviation of its industry group; |
| | ¡ | | Liberal Change of Control Definition: The plan provides for the acceleration of vesting of equity awards even though an actual change in control may not occur (e.g., upon shareholder approval of a transaction or the announcement of a tender offer); or |
| | ¡ | | The plan is a vehicle for problematic pay practices. |
Other Compensation Proposals and Policies
Advisory Votes on Executive Compensation- Management Proposals (Management Say-on-Pay)
In general, the management say on pay (MSOP) ballot item is the primary focus of voting on executive pay practices- dissatisfaction with compensation practices can be expressed by voting against the MSOP rather than withholding or voting against the compensation committee. However, if there is no MSOP on which to express the dissatisfaction, then the secondary target will be members of the compensation committee. In addition, in egregious cases, or if the board fails to respond to concerns raised by a prior MSOP proposal; then vote withhold or against compensation committee member (or, if the full board is deemed accountable, to all directors). If the negative factors impact equity-based plans, then vote AGAINST an equity-based plan proposal presented for shareholder approval.
Evaluate executive pay and practices, as well as certain aspects of outside director compensation, on a CASE-BY-CASE basis.
Vote AGAINST management say on pay (MSOP) proposals, AGAINST/WITHHOLD on compensation committee members (or, in rare cases where the full board is deemed responsible, all directors including the CEO), and/or AGAINST an equity-based incentive plan proposal if:
| | ¡ | | There is a misalignment between CEO pay and company performance (pay for performance); |
| | ¡ | | The company maintains problematic pay practices; |
| | ¡ | | The board exhibits poor communication and responsiveness to shareholders. |
B-13
Additional CASE-BY-CASE considerations for the management say on pay (MSOP) proposals:
| | ¡ | | Evaluation of performance metrics in short-term and long-term plans, as discussed and explained in the Compensation Discussion & Analysis (CD&A). Consider the measures, goals, and target awards reported by the company for executives’ short- and long-term incentive awards: disclosure, explanation of their alignment with the company’s business strategy, and whether goals appear to be sufficiently challenging in relation to resulting payouts; |
| | ¡ | | Evaluation of peer group benchmarking used to set target pay or award opportunities. Consider the rationale stated by the company for constituents in its pay benchmarking peer group, as well as the benchmark targets it uses to set or validate executives’ pay (e.g., median, 75th percentile, etc.,) to ascertain whether the benchmarking process is sound or may result in pay “ratcheting” due to inappropriate peer group constituents (e.g., much larger companies) or targeting (e.g., above median); and |
| | ¡ | | Balance of performance-based versus non-performance-based pay. Consider the ratio of performance-based (not including plain vanilla stock options) vs. non-performance-based pay elements reported for the CEO’s latest reported fiscal year compensation, especially in conjunction with concerns about other factors such as performance metrics/goals, benchmarking practices, and pay-for-performance disconnects. |
Pay for Performance
Evaluate the alignment of the CEO’s pay with performance over time, focusing particularly on companies that have underperformed their peers over a sustained period. From a shareholders‘ perspective, performance is predominantly gauged by the company’s stock performance over time. Even when financial or operational measures are utilized in incentive awards, the achievement related to these measures should ultimately translate into superior shareholder returns in the long-term.
Focus on companies with sustained underperformance relative to peers, considering the following key factors:
| | ¡ | | Whether a company’s one-year and three-year total shareholder returns (“TSR”) are in the bottom half of its industry group (i.e., four-digit GICS – Global Industry Classification Group); and |
| | ¡ | | Whether the total compensation of a CEO who has served at least two consecutive fiscal years is aligned with the company’s total shareholder return over time, including both recent and long-term periods. |
If a company falls in the bottom half of its four-digit GICS, further analysis of the CD&A is required to better understand the various pay elements and whether they create or reinforce shareholder alignment. Also assess the CEO’s pay relative to the company’s TSR over a time horizon of at least five years. The most recent year-over-year increase or decrease in pay remains a key consideration, but there will be additional emphasis on the long term trend of CEO total compensation relative to shareholder return. Also consider the mix of performance-based compensation relative to total compensation. In general, standard stock options or time-vested restricted stock are not considered to be performance-based. If a company provides performance-based incentives to its executives, the company is highly encouraged to provide the complete disclosure of the performance measure and goals (hurdle rate) so that shareholders can assess the rigor of the performance program. The use of non-GAAP financial metrics also makes it very challenging for shareholders to ascertain the rigor of the program as shareholders often cannot tell the type of adjustments being made and if the adjustments were made consistently. Complete and transparent disclosure helps shareholders to better understand the company’s pay for performance linkage.
Problematic Pay Practices
The focus is on executive compensation practices that contravene the global pay principles, including:
| | ¡ | | Problematic practices related to non-performance-based compensation elements; |
| | ¡ | | Incentives that may motivate excessive risk-taking; and |
B-14
Non-Performance based Compensation Elements
Companies adopt a variety of pay arrangements that may be acceptable in their particular industries, or unique for a particular situation, and all companies are reviewed on a case-by-case basis. However, there are certain adverse practices that are particularly contrary to a performance-based pay philosophy, including guaranteed pay and excessive or inappropriate non-performance-based pay elements.
While not exhaustive, this is the list of practices that carry greatest weight in this consideration and may result in negative vote recommendations on a stand-alone basis. For more details, please refer to RMG’s Compensation FAQ document: http://www.riskmetrics.com/policy/2010_compensation_FAQ:
| | ¡ | | Multi-year guarantees for salary increases, non-performance based bonuses, and equity compensation; |
| | ¡ | | Including additional years of unworked service that result in significant additional benefits, without sufficient justification, or including long-term equity awards in the pension calculation; |
| | ¡ | | Perquisites for former and/or retired executives, and extraordinary relocation benefits (including home buyouts) for current executives; |
| | ¡ | | Change-in-control payments exceeding 3 times base salary and target bonus; change-in-control payments without job loss or substantial diminution of duties (“Single Triggers”); new or materially amended agreements that provide for “modified single triggers” (under which an executive may voluntarily leave for any reason and still receive the change-in-control severance package); new or materially amended agreements that provide for an excise tax gross-up (including “modified gross-ups”); |
| | ¡ | | Tax Reimbursements related to executive perquisites or other payments such as personal use of corporate aircraft, executive life insurance, bonus, etc.; (see also excise tax gross-ups above) |
| | ¡ | | Dividends or dividend equivalents paid on unvested performance shares or units; |
| | ¡ | | Executives using company stock in hedging activities, such as “cashless” collars, forward sales, equity swaps or other similar arrangements; or |
| | ¡ | | Repricing or replacing of underwater stock options/stock appreciation rights without prior shareholder approval (including cash buyouts and voluntary surrender/subsequent regrant of underwater options). |
Incentives that may Motivate Excessive Risk-Taking
Assess company policies and disclosure related to compensation that could incentivize excessive risk-taking, for example:
| | ¡ | | A single performance metric used for short- and long-term plans; |
| | ¡ | | Lucrative severance packages; |
| | ¡ | | High pay opportunities relative to industry peers; |
| | ¡ | | Disproportionate supplemental pensions; or |
| | ¡ | | Mega annual equity grants that provide unlimited upside with no downside risk. |
Factors that potentially mitigate the impact of risky incentives include rigorous claw-back provisions and robust stock ownership/holding guidelines.
B-15
Options Backdating
Vote CASE-by-CASE on options backdating issues. Generally, when a company has recently practiced options backdating, WITHHOLD from or vote AGAINST the compensation committee, depending on the severity of the practices and the subsequent corrective actions on the part of the board. When deciding on votes on compensation committee members who oversaw questionable options grant practices or current compensation committee members who fail to respond to the issue proactively, consider several factors, including, but not limited to, the following:
| | ¡ | | Reason and motive for the options backdating issue, such as inadvertent vs. deliberate grant date changes; |
| | ¡ | | Duration of options backdating; |
| | ¡ | | Size of restatement due to options backdating; |
| | ¡ | | Corrective actions taken by the board or compensation committee, such as canceling or re-pricing backdated options, the recouping of option gains on backdated grants; and |
| | ¡ | | Adoption of a grant policy that prohibits backdating, and creates a fixed grant schedule or window period for equity grants in the future. |
A CASE-by-CASE analysis approach allows distinctions to be made between companies that had “sloppy” plan administration versus those that acted deliberately and/or committed fraud, as well as those companies that subsequently took corrective action. Cases where companies have committed fraud are considered most egregious.
Board Communications and Responsiveness
Consider the following factors on a CASE-BY-CASE basis when evaluating ballot items related to executive pay:
| | ¡ | | Poor disclosure practices, including: |
| | – | | Unclear explanation of how the CEO is involved in the pay setting process; |
| | – | | Retrospective performance targets and methodology not discussed; |
| | – | | Methodology for benchmarking practices and/or peer group not disclosed and explained. |
| | ¡ | | Board’s responsiveness to investor input and engagement on compensation issues, for example: |
| | – | | Failure to respond to majority-supported shareholder proposals on executive pay topics; or |
| | – | | Failure to respond to concerns raised in connection with significant opposition to MSOP proposals. |
Option Exchange Programs/Repricing Options
Vote CASE-by-CASE on management proposals seeking approval to exchange/reprice options, taking into consideration:
| | ¡ | | Historic trading patterns—the stock price should not be so volatile that the options are likely to be back “in-the-money” over the near term; |
| | ¡ | | Rationale for the re-pricing—was the stock price decline beyond management’s control? |
| | ¡ | | Is this a value-for-value exchange? |
| | ¡ | | Are surrendered stock options added back to the plan reserve? |
| | ¡ | | Option vesting—does the new option vest immediately or is there a black-out period? |
| | ¡ | | Term of the option—the term should remain the same as that of the replaced option; |
| | ¡ | | Exercise price—should be set at fair market or a premium to market; |
| | ¡ | | Participants—executive officers and directors should be excluded. |
B-16
If the surrendered options are added back to the equity plans for re-issuance, then also take into consideration the company’s total cost of equity plans and its three-year average burn rate.
In addition to the above considerations, evaluate the intent, rationale, and timing of the repricing proposal. The proposal should clearly articulate why the board is choosing to conduct an exchange program at this point in time. Repricing underwater options after a recent precipitous drop in the company’s stock price demonstrates poor timing. Repricing after a recent decline in stock price triggers additional scrutiny and a potential AGAINST vote on the proposal. At a minimum, the decline should not have happened within the past year. Also, consider the terms of the surrendered options, such as the grant date, exercise price and vesting schedule. Grant dates of surrendered options should be far enough back (two to three years) so as not to suggest that repricings are being done to take advantage of short-term downward price movements. Similarly, the exercise price of surrendered options should be above the 52-week high for the stock price.
Vote FOR shareholder proposals to put option repricings to a shareholder vote.
Shareholder Proposals on Compensation
Advisory Vote on Executive Compensation (Say-on-Pay)
Generally, vote FOR shareholder proposals that call for non-binding shareholder ratification of the compensation of the Named Executive Officers and the accompanying narrative disclosure of material factors provided to understand the Summary Compensation Table.
Golden Coffins/Executive Death Benefits
Generally vote FOR proposals calling companies to adopt a policy of obtaining shareholder approval for any future agreements and corporate policies that could oblige the company to make payments or awards following the death of a senior executive in the form of unearned salary or bonuses, accelerated vesting or the continuation in force of unvested equity grants, perquisites and other payments or awards made in lieu of compensation. This would not apply to any benefit programs or equity plan proposals that the broad-based employee population is eligible.
Recoup Bonuses
Vote on a CASE-BY-CASE on proposals to recoup unearned incentive bonuses or other incentive payments made to senior executives if it is later determined that the figures upon which incentive compensation is earned later turn out to have been in error. This is line with the clawback provision in the Trouble Asset Relief Program. Many companies have adopted policies that permit recoupment in cases where fraud, misconduct, or negligence significantly contributed to a restatement of financial results that led to the awarding of unearned incentive compensation. RMG will take into consideration:
| | ¡ | | If the company has adopted a formal recoupment bonus policy; |
| | ¡ | | If the company has chronic restatement history or material financial problems; or |
| | ¡ | | If the company’s policy substantially addresses the concerns raised by the proponent. |
Stock Ownership or Holding Period Guidelines
Generally vote AGAINST shareholder proposals that mandate a minimum amount of stock that directors must own in order to qualify as a director or to remain on the board. While RMG favors stock ownership on the part of directors, the company should determine the appropriate ownership requirement.
Vote on a CASE-BY-CASE on shareholder proposals asking companies to adopt policies requiring Named Executive Officers to retain 75% of the shares acquired through compensation plans while employed and/or for two years following the termination of their employment, and to report to shareholders regarding this policy. The following factors will be taken into account:
| | ¡ | | Whether the company has any holding period, retention ratio, or officer ownership requirements in place. These should consist of: |
| | – | | Rigorous stock ownership guidelines, or |
B-17
| | – | | A holding period requirement coupled with a significant long-term ownership requirement, or |
| | – | | A meaningful retention ratio, |
| | ¡ | | Actual officer stock ownership and the degree to which it meets or exceeds the proponent’s suggested holding period/retention ratio or the company’s own stock ownership or retention requirements. |
| | ¡ | | Problematic pay practices, current and past, which may promote a short-term versus a long-term focus. |
A rigorous stock ownership guideline should be at least 10x base salary for the CEO, with the multiple declining for other executives. A meaningful retention ratio should constitute at least 50 percent of the stock received from equity awards (on a net proceeds basis) held on a long-term basis, such as the executive’s tenure with the company or even a few years past the executive’s termination with the company.
6. Social/Environmental Issues:
Overall Approach
When evaluating social and environmental shareholder proposals, RMG considers the following factors:
| | ¡ | | Whether adoption of the proposal is likely to enhance or protect shareholder value; |
| | ¡ | | Whether the information requested concerns business issues that relate to a meaningful percentage of the company’s business as measured by sales, assets, and earnings; |
| | ¡ | | The degree to which the company’s stated position on the issues raised in the proposal could affect its reputation or sales, or leave it vulnerable to a boycott or selective purchasing; |
| | ¡ | | Whether the issues presented are more appropriately/effectively dealt with through governmental or company-specific action; |
| | ¡ | | Whether the company has already responded in some appropriate manner to the request embodied in the proposal; |
| | ¡ | | Whether the company’s analysis and voting recommendation to shareholders are persuasive; |
| | ¡ | | What other companies have done in response to the issue addressed in the proposal; |
| | ¡ | | Whether the proposal itself is well framed and the cost of preparing the report is reasonable; |
| | ¡ | | Whether implementation of the proposal’s request would achieve the proposal’s objectives; |
| | ¡ | | Whether the subject of the proposal is best left to the discretion of the board; |
| | ¡ | | Whether the requested information is available to shareholders either from the company or from a publicly available source; and |
| | ¡ | | Whether providing this information would reveal proprietary or confidential information that would place the company at a competitive disadvantage. |
Board Diversity
Generally vote FOR requests for reports on the company’s efforts to diversify the board, unless:
| | ¡ | | The gender and racial minority representation of the company’s board is reasonably inclusive in relation to companies of similar size and business; and |
| | ¡ | | The board already reports on its nominating procedures and gender and racial minority initiatives on the board and within the company. |
Vote CASE-BY-CASE on proposals asking the company to increase the gender and racial minority representation on its board, taking into account:
| | ¡ | | The degree of existing gender and racial minority diversity on the company’s board and among its executive officers; |
B-18
| | ¡ | | The level of gender and racial minority representation that exists at the company’s industry peers; |
| | ¡ | | The company’s established process for addressing gender and racial minority board representation; |
| | ¡ | | Whether the proposal includes an overly prescriptive request to amend nominating committee charter language; |
| | ¡ | | The independence of the company’s nominating committee; |
| | ¡ | | The company uses an outside search firm to identify potential director nominees; and |
| | ¡ | | Whether the company has had recent controversies, fines, or litigation regarding equal employment practices. |
Gender Identity, Sexual Orientation, and Domestic Partner Benefits
Generally vote FOR proposals seeking to amend a company’s EEO statement or diversity policies to prohibit discrimination based on sexual orientation and/or gender identity, unless the change would result in excessive costs for the company.
Generally vote AGAINST proposals to extend company benefits to, or eliminate benefits from domestic partners. Decisions regarding benefits should be left to the discretion of the company.
Greenhouse Gas (GHG) Emissions
Generally vote FOR proposals requesting a report on greenhouse gas (GHG) emissions from company operations and/or products and operations, unless:
| | ¡ | | The company already provides current, publicly-available information on the impacts that GHG emissions may have on the company as well as associated company policies and procedures to address related risks and/or opportunities; |
| | ¡ | | The company’s level of disclosure is comparable to that of industry peers; and |
| | ¡ | | There are no significant, controversies, fines, penalties, or litigation associated with the company’s GHG emissions. |
Vote CASE-BY-CASE on proposals that call for the adoption of GHG reduction goals from products and operations, taking into account:
| | ¡ | | Overly prescriptive requests for the reduction in GHG emissions by specific amounts or within a specific time frame; |
| | ¡ | | Whether company disclosure lags behind industry peers; |
| | ¡ | | Whether the company has been the subject of recent, significant violations, fines, litigation, or controversy related to GHG emissions; |
| | ¡ | | The feasibility of reduction of GHGs given the company’s product line and current technology and; |
| | ¡ | | Whether the company already provides meaningful disclosure on GHG emissions from its products and operations. |
Political Contributions and Trade Association Spending
Generally vote AGAINST proposals asking the company to affirm political nonpartisanship in the workplace so long as:
| | ¡ | | There are no recent, significant controversies, fines or litigation regarding the company’s political contributions or trade association spending; and |
| | ¡ | | The company has procedures in place to ensure that employee contributions to company-sponsored political action committees (PACs) are strictly voluntary and prohibits coercion. |
Vote AGAINST proposals to publish in newspapers and public media the company’s political contributions. Such publications could present significant cost to the company without providing commensurate value to shareholders.
B-19
Vote CASE-BY-CASE on proposals to improve the disclosure of a company’s political contributions and trade association spending, considering:
| | ¡ | | Recent significant controversy or litigation related to the company’s political contributions or governmental affairs; and |
| | ¡ | | The public availability of a company policy on political contributions and trade association spending including information on the types of organizations supported, the business rationale for supporting these organizations, and the oversight and compliance procedures related to such expenditures of corporate assets. |
Vote AGAINST proposals barring the company from making political contributions. Businesses are affected by legislation at the federal, state, and local level and barring political contributions can put the company at a competitive disadvantage.
Vote AGAINST proposals asking for a list of company executives, directors, consultants, legal counsels, lobbyists, or investment bankers that have prior government service and whether such service had a bearing on the business of the company. Such a list would be burdensome to prepare without providing any meaningful information to shareholders.
Labor and Human Rights Standards
Generally vote FOR proposals requesting a report on company or company supplier labor and/or human rights standards and policies unless such information is already publicly disclosed.
Vote CASE-BY-CASE on proposals to implement company or company supplier labor and/or human rights standards and policies, considering:
| | ¡ | | The degree to which existing relevant policies and practices are disclosed; |
| | ¡ | | Whether or not existing relevant policies are consistent with internationally recognized standards; |
| | ¡ | | Whether company facilities and those of its suppliers are monitored and how; |
| | ¡ | | Company participation in fair labor organizations or other internationally recognized human rights initiatives; |
| | ¡ | | Scope and nature of business conducted in markets known to have higher risk of workplace labor/human rights abuse; |
| | ¡ | | Recent, significant company controversies, fines, or litigation regarding human rights at the company or its suppliers; |
| | ¡ | | The scope of the request; and |
| | ¡ | | Deviation from industry sector peer company standards and practices. |
Sustainability Reporting
Generally vote FOR proposals requesting the company to report on its policies, initiatives, and oversight mechanisms related to social, economic, and environmental sustainability, unless:
| | ¡ | | The company already discloses similar information through existing reports or policies such as an Environment, Health, and Safety (EHS) report; a comprehensive Code of Corporate Conduct; and/or a Diversity Report; or |
| | ¡ | | The company has formally committed to the implementation of a reporting program based on Global Reporting Initiative (GRI) guidelines or a similar standard within a specified time frame. |
B-20
RiskMetrics Group’s International Proxy Voting Guidelines Summary
(Digest of Selected Key Guidelines)
December 31, 2009
1. Operational Items:
Financial Results/Director and Auditor Reports
Vote FOR approval of financial statements and director and auditor reports, unless:
| | ¡ | | There are concerns about the accounts presented or audit procedures used; or |
| | ¡ | | The company is not responsive to shareholder questions about specific items that should be publicly disclosed. |
Appointment of Auditors and Auditor Fees
Vote FOR the reelection of auditors and proposals authorizing the board to fix auditor fees, unless:
| | ¡ | | There are serious concerns about the accounts presented or the audit procedures used; |
| | ¡ | | The auditors are being changed without explanation; or |
| | ¡ | | Non-audit-related fees are substantial or are routinely in excess of standard annual audit-related fees. |
Vote AGAINST the appointment of external auditors if they have previously served the company in an executive capacity or can otherwise be considered affiliated with the company.
Appointment of Internal Statutory Auditors
Vote FOR the appointment or reelection of statutory auditors, unless:
| | ¡ | | There are serious concerns about the statutory reports presented or the audit procedures used; |
| | ¡ | | Questions exist concerning any of the statutory auditors being appointed; or |
| | ¡ | | The auditors have previously served the company in an executive capacity or can otherwise be considered affiliated with the company. |
Allocation of Income
Vote FOR approval of the allocation of income, unless:
| | ¡ | | The dividend payout ratio has been consistently below 30 percent without adequate explanation; or |
| | ¡ | | The payout is excessive given the company’s financial position. |
Stock (Scrip) Dividend Alternative
Vote FOR most stock (scrip) dividend proposals.
Vote AGAINST proposals that do not allow for a cash option unless management demonstrates that the cash option is harmful to shareholder value.
Amendments to Articles of Association
Vote amendments to the articles of association on a CASE-BY-CASE basis.
Change in Company Fiscal Term
Vote FOR resolutions to change a company’s fiscal term unless a company’s motivation for the change is to postpone its AGM.
Lower Disclosure Threshold for Stock Ownership
Vote AGAINST resolutions to lower the stock ownership disclosure threshold below 5 percent unless specific reasons exist to implement a lower threshold.
B-21
Amend Quorum Requirements
Vote proposals to amend quorum requirements for shareholder meetings on a CASE-BY-CASE basis.
Transact Other Business
Vote AGAINST other business when it appears as a voting item.
2. Board of Directors:
Director Elections
Vote FOR management nominees in the election of directors, unless:
| | ¡ | | Adequate disclosure has not been provided in a timely manner; |
| | ¡ | | There are clear concerns over questionable finances or restatements; |
| | ¡ | | There have been questionable transactions with conflicts of interest; |
| | ¡ | | There are any records of abuses against minority shareholder interests; or |
| | ¡ | | The board fails to meet minimum corporate governance standards. |
Vote FOR individual nominees unless there are specific concerns about the individual, such as criminal wrongdoing or breach of fiduciary responsibilities.
Vote AGAINST individual directors if repeated absences at board meetings have not been explained (in countries where this information is disclosed).
Vote on a CASE-BY-CASE basis for contested elections of directors, e.g. the election of shareholder nominees or the dismissal of incumbent directors, determining which directors are best suited to add value for shareholders.
Vote FOR employee and/or labor representatives if they sit on either the audit or compensation committee and are required by law to be on those committees. Vote AGAINST employee and/or labor representatives if they sit on either the audit or compensation committee, if they are not required to be on those committees.
Under extraordinary circumstances, vote AGAINST or WITHHOLD from directors individually, on a committee, or the entire board, due to:
| | ¡ | | Material failures of governance, stewardship, or fiduciary responsibilities at the company; or |
| | ¡ | | Failure to replace management as appropriate; or |
| | ¡ | | Egregious actions related to the director(s)’ service on other boards that raise substantial doubt about his or her ability to effectively oversee management and serve the best interests of shareholders at any company. |
Discharge of Directors
Generally vote FOR the discharge of directors, including members of the management board and/or supervisory board, unless there is reliable information about significant and compelling controversies that the board is not fulfilling its fiduciary duties warranted by:
| | ¡ | | A lack of oversight or actions by board members which invoke shareholder distrust related to malfeasance or poor supervision, such as operating in private or company interest rather than in shareholder interest; or |
| | ¡ | | Any legal issues (e.g. civil/criminal) aiming to hold the board responsible for breach of trust in the past or related to currently alleged actions yet to be confirmed (and not only the fiscal year in question), such as price fixing, insider trading, bribery, fraud, and other illegal actions; or |
| | ¡ | | Other egregious governance issues where shareholders will bring legal action against the company or its directors. |
For markets which do not routinely request discharge resolutions (e.g. common law countries or markets where discharge is not mandatory), analysts may voice concern in other appropriate agenda items, such as approval of the annual accounts or other relevant resolutions, to enable shareholders to express discontent with the board.
B-22
Director Compensation
Vote FOR proposals to award cash fees to non-executive directors unless the amounts are excessive relative to other companies in the country or industry.
Vote non-executive director compensation proposals that include both cash and share-based components on a CASE-BY-CASE basis.
Vote proposals that bundle compensation for both non-executive and executive directors into a single resolution on a CASE-BY-CASE basis.
Vote AGAINST proposals to introduce retirement benefits for non-executive directors.
Director, Officer, and Auditor Indemnification and Liability Provisions
Vote proposals seeking indemnification and liability protection for directors and officers on a CASE-BY-CASE basis.
Vote AGAINST proposals to indemnify auditors.
Board Structure
Vote FOR proposals to fix board size.
Vote AGAINST the introduction of classified boards and mandatory retirement ages for directors.
Vote AGAINST proposals to alter board structure or size in the context of a fight for control of the company or the board.
3. Capital Structure:
Share Issuance Requests
General Issuances:
Vote FOR issuance requests with preemptive rights to a maximum of 100 percent over currently issued capital.
Vote FOR issuance requests without preemptive rights to a maximum of 20 percent of currently issued capital.
Specific Issuances:
Vote on a CASE-BY-CASE basis on all requests, with or without preemptive rights.
Increases in Authorized Capital
Vote FOR non-specific proposals to increase authorized capital up to 100 percent over the current authorization unless the increase would leave the company with less than 30 percent of its new authorization outstanding.
Vote FOR specific proposals to increase authorized capital to any amount, unless:
| | ¡ | | The specific purpose of the increase (such as a share-based acquisition or merger) does not meet RMG guidelines for the purpose being proposed; or |
| | ¡ | | The increase would leave the company with less than 30 percent of its new authorization outstanding after adjusting for all proposed issuances. |
Vote AGAINST proposals to adopt unlimited capital authorizations.
Reduction of Capital
Vote FOR proposals to reduce capital for routine accounting purposes unless the terms are unfavorable to shareholders.
Vote proposals to reduce capital in connection with corporate restructuring on a CASE-BY-CASE basis.
B-23
Capital Structures
Vote FOR resolutions that seek to maintain or convert to a one-share, one-vote capital structure.
Vote AGAINST requests for the creation or continuation of dual-class capital structures or the creation of new or additional supervoting shares.
Preferred Stock
Vote FOR the creation of a new class of preferred stock or for issuances of preferred stock up to 50 percent of issued capital unless the terms of the preferred stock would adversely affect the rights of existing shareholders.
Vote FOR the creation/issuance of convertible preferred stock as long as the maximum number of common shares that could be issued upon conversion meets RMG guidelines on equity issuance requests.
Vote AGAINST the creation of a new class of preference shares that would carry superior voting rights to the common shares.
Vote AGAINST the creation of blank check preferred stock unless the board clearly states that the authorization will not be used to thwart a takeover bid.
Vote proposals to increase blank check preferred authorizations on a CASE-BY-CASE basis.
Debt Issuance Requests
Vote non-convertible debt issuance requests on a CASE-BY-CASE basis, with or without preemptive rights.
Vote FOR the creation/issuance of convertible debt instruments as long as the maximum number of common shares that could be issued upon conversion meets RMG guidelines on equity issuance requests.
Vote FOR proposals to restructure existing debt arrangements unless the terms of the restructuring would adversely affect the rights of shareholders.
Pledging of Assets for Debt
Vote proposals to approve the pledging of assets for debt on a CASE-BY-CASE basis.
Increase in Borrowing Powers
Vote proposals to approve increases in a company’s borrowing powers on a CASE-BY-CASE basis.
Share Repurchase Plans
Generally vote FOR share repurchase programs/market repurchase authorities, provided that the proposal meets the following parameters:
| | ¡ | | Maximum volume: 10 percent for market repurchase within any single authority and 10 percent of outstanding shares to be kept in treasury (“on the shelf”); |
| | ¡ | | Duration does not exceed 18 months. |
For markets that either generally do not specify the maximum duration of the authority or seek a duration beyond 18 months that is allowable under market specific legislation, RMG will assess the company’s historic practice. If there is evidence that a company has sought shareholder approval for the authority to repurchase shares on an annual basis, RMG will support the proposed authority.
In addition, vote AGAINST any proposal where:
| | ¡ | | The repurchase can be used for takeover defenses; |
| | ¡ | | There is clear evidence of abuse; |
| | ¡ | | There is no safeguard against selective buybacks; |
| | ¡ | | Pricing provisions and safeguards are deemed to be unreasonable in light of market practice. |
B-24
RMG may support share repurchase plans in excess of 10 percent volume under exceptional circumstances, such as one-off company specific events (e.g. capital re-structuring). Such proposals will be assessed case-by-case based on merits, which should be clearly disclosed in the annual report, provided that following conditions are met:
| | ¡ | | The overall balance of the proposed plan seems to be clearly in shareholders’ interests; |
| | ¡ | | The plan still respects the 10 percent maximum of shares to be kept in treasury. |
Reissuance of Repurchased Shares
Vote FOR requests to reissue any repurchased shares unless there is clear evidence of abuse of this authority in the past.
Capitalization of Reserves for Bonus Issues/Increase in Par Value
Vote FOR requests to capitalize reserves for bonus issues of shares or to increase par value.
4. Other Items:
Reorganizations/Restructurings
Vote reorganizations and restructurings on a CASE-BY-CASE basis.
Mergers and Acquisitions
Vote CASE-BY-CASE on mergers and acquisitions taking into account the following:
For every M&A analysis, RMG reviews publicly available information as of the date of the report and evaluates the merits and drawbacks of the proposed transaction, balancing various and sometimes countervailing factors including:
| | ¡ | | Valuation—Is the value to be received by the target shareholders (or paid by the acquirer) reasonable? While the fairness opinion may provide an initial starting point for assessing valuation reasonableness, RMG places emphasis on the offer premium, market reaction, and strategic rationale. |
| | ¡ | | Market reaction—How has the market responded to the proposed deal? A negative market reaction will cause RMG to scrutinize a deal more closely. |
| | ¡ | | Strategic rationale—Does the deal make sense strategically? From where is the value derived? Cost and revenue synergies should not be overly aggressive or optimistic, but reasonably achievable. Management should also have a favorable track record of successful integration of historical acquisitions. |
| | ¡ | | Conflicts of interest—Are insiders benefiting from the transaction disproportionately and inappropriately as compared to non-insider shareholders? RMG will consider whether any special interests may have influenced these directors and officers to support or recommend the merger. |
| | ¡ | | Governance—Will the combined company have a better or worse governance profile than the current governance profiles of the respective parties to the transaction? If the governance profile is to change for the worse, the burden is on the company to prove that other issues (such as valuation) outweigh any deterioration in governance. |
Vote AGAINST if the companies do not provide sufficient information upon request to make an informed voting decision.
Mandatory Takeover Bid Waivers
Vote proposals to waive mandatory takeover bid requirements on a CASE-BY-CASE basis.
Reincorporation Proposals
Vote reincorporation proposals on a CASE-BY-CASE basis.
B-25
Expansion of Business Activities
Vote FOR resolutions to expand business activities unless the new business takes the company into risky areas.
Related-Party Transactions
Vote related-party transactions on a CASE-BY-CASE basis.
In evaluating resolutions that seek shareholder approval on related party transactions (RPTs), vote on a case-by-case basis, considering factors including, but not limited to, the following:
| | ¡ | | the parties on either side of the transaction; |
| | ¡ | | the nature of the asset to be transferred/service to be provided; |
| | ¡ | | the pricing of the transaction (and any associated professional valuation); |
| | ¡ | | the views of independent directors (where provided); |
| | ¡ | | the views of an independent financial adviser (where appointed); |
| | ¡ | | whether any entities party to the transaction (including advisers) is conflicted; and |
| | ¡ | | the stated rationale for the transaction, including discussions of timing. |
If there is a transaction that RMG deemed problematic and that was not put to a shareholder vote, RMG may recommend against the election of the director involved in the related-party transaction or the full board.
Compensation Plans
Vote compensation plans on a CASE-BY-CASE basis.
Antitakeover Mechanisms
Generally vote AGAINST all antitakeover proposals, unless they are structured in such a way that they give shareholders the ultimate decision on any proposal or offer.
Shareholder Proposals
Vote all shareholder proposals on a CASE-BY-CASE basis.
Vote FOR proposals that would improve the company’s corporate governance or business profile at a reasonable cost.
Vote AGAINST proposals that limit the company's business activities or capabilities or result in significant costs being incurred with little or no benefit.
B-26

PROXY VOTING POLICY AND PROCEDURES
I. STATEMENT OF POLICY
Proxy voting is an important right of shareholders and reasonable care and diligence must be undertaken to ensure that such rights are properly and timely exercised. When Altrinsic has discretion to vote the proxies of its clients, it will vote those proxies in the best interest of its clients and in accordance with these policies. Certain clients may retain proxy voting authority and in those circumstances Altrinsic has no proxy responsibilities,
II. PROXY VOTING PROCEDURES
All proxies received by Altrinsic will be forwarded to a Portfolio Manager or his designee with a list of accounts that hold the security, together with the number of votes each account controls (reconciling any duplications), and the date by which Altrinsic must vote the proxy in order to allow enough time for the completed proxy to be returned to the issuer prior to the vote taking place. The Compliance Officer will keep a record or able to readily access a report from the electronic filing of each proxy received;
Absent material conflicts (see Section IV below), a Portfolio Manager or his designee, will determine how Altrinsic should vote the proxy. The Portfolio Manager or his designee will send its decision on how Altrinsic will vote a proxy to the Compliance Officer. The Compliance Officer, or designee, is responsible for voting the proxy either by mail or electronically in a timely and appropriate manner.
Altrinsic or its clients may retain a third party to assist it in coordinating and voting proxies with respect to client securities. If so, the Compliance Officer, or designee, will monitor the third party to assure that all proxies are being properly voted and appropriate records are being retained.
Currently, Altrinsic does not directly engage with any third party proxy voting companies for research or other services.
III. VOTING GUIDELINES
In the absence of specific voting guidelines from the client, Altrinsic will vote proxies in the best interests of its clients. Each proposal will be evaluated separately.
Altrinsic believes that voting proxies in accordance with the following guidelines is in the best interests of its clients.
| | • | | Generally, Altrinsic will vote in favor of routine corporate housekeeping proposals, including election of directors (where no corporate governance issues are implicated) and selection of auditors. |
| | • | | Generally, Altrinsic will vote against proposals that make it more difficult to replace members of the issuer’s board of directors, including proposals to stagger the board, cause management to be overrepresented on the board, introduce cumulative voting, introduce unequal voting rights, and create supermajority voting. |
For other proposals, Altrinsic shall determine on a case-by-case basis, whether a proposal is in the best interests of its clients and may take into account the following factors, among others:
| | • | | whether the proposal was recommended by management and Altrinsic’s opinion of management; |
| | • | | the effect on shareholder value; |
| | • | | the issuer’s business practices; |
| | • | | stock dilution and equity based compensation; |
| | • | | whether the proposal acts to entrench existing management; and |
| | • | | whether the proposal fairly compensates management for past and future performance. |
B-27
IV. CONFLICTS OF INTEREST
The Compliance Officer will identify any conflicts that exist between the interests of Altrinsic and its clients. This examination will include a review of the relationship of Altrinsic and its affiliates with the issuer of each security and any of the issuer’s affiliates to determine if the issuer is a client of Altrinsic or an affiliate of Altrinsic or has some other relationship with Altrinsic or a client of Altrinsic.
If a potential or actual conflict exists, Altrinsic will determine whether voting in accordance with the voting guidelines and factors described above is in the best interests of the client including clients that are subject to ERISA. If Altrinsic determines that a material conflict exists and that voting in accordance with the voting guidelines and factors described above is not in the best interests of the client, Altrinsic will make the appropriate disclosures to clients and either request that the client vote the proxy(s) or abstain from voting.
V. DISCLOSURE
Altrinsic will disclose in its Form ADV Part 2 that clients may contact the Compliance Officer in order to obtain information on how Altrinsic voted such client’s proxies, and to request a copy of these policies and procedures. If a client requests this information, the Compliance Officer will prepare a written response to the client that lists, with respect to each voted proxy about which the client has inquired (a) the name of the issuer; (b) the proposal voted upon, and (c) how Altrinsic voted the client’s proxy.
A concise summary of this Proxy Voting Policy and Procedures will be included in Altrinsic’s Form ADV Part 2, and will be updated whenever these policies and procedures are updated. The Compliance Officer will offer a copy of this summary to be sent to all existing clients either as a separate mailing or along with a periodic account statement or other correspondence sent to clients.
VI. RECORDKEEPING
The Compliance Officer will maintain files relating to Altrinsic’s proxy voting policy, procedures and voting decisions in an easily accessible place. Records will be maintained and preserved for five years from the end of the fiscal year during which the last entry was made on a record, with records for the first two years kept in the offices of Altrinsic. Records of the following will be included in the files:
| | • | | Copies of this proxy voting policy and procedures, and any amendments thereto. |
| | • | | A copy of each proxy statement that Altrinsic receives, provided however that Altrinsic may rely on obtaining a copy of proxy statements from the SEC’s EDGAR system for those proxy statements that are so available.1 |
| | • | | A record of each vote that Altrinsic casts.2 |
| | • | | A copy of any document Altrinsic created that was material to making a decision how to vote proxies, or that memorializes that decision |
| | • | | A copy of Altrinsic’s review and resolution of any proxy voting conflicts |
| | • | | A copy of each written client request for information on how Altrinsic voted such client’s proxies, and a copy of any written response to any (written or oral) client request for information on how Altrinsic voted its proxies. |
Current through December 31, 2012
| 1 | Altrinsic may choose instead to have a third party retain a copy of proxy statements (provided that third party undertakes to provide a copy of the proxy statements promptly upon request). |
| 2 | Altrinsic may also rely on a third party to retain a copy of the votes cast (provided that the third party undertakes to provide a copy of the record promptly upon request). |
B-28
Hansberger Global Investors, Inc.
Proxy Voting Policy and Procedures
Revised as of January 1, 2011
Reviewed as December 3, 2010
Proxy Voting Policy
A. Objective
When Hansberger Global Investors, Inc. (“HGI”) is responsible for voting proxies, we take reasonable steps under the circumstances to ensure that proxies are voted in the best interest of our clients, which means voting proxies with a view to enhancing the financial value of the securities held in client accounts. The financial interest of our clients is the primary consideration in determining how proxies should be voted. In the case of social and political responsibility issues that, in our view, do not primarily involve financial considerations, it is not possible to represent fairly the diverse views of our clients. Thus, HGI generally votes in accordance with the recommendations of its proxy voting service on such issues, although, on occasion HGI could abstain from voting.
When making proxy-voting decisions, HGI generally adheres to its Proxy Voting Guidelines (the “Guidelines”), as revised from time to time by HGI, that detail HGI’s positions on recurring issues and criteria for addressing non-recurring issues.
B. Accounts for Which HGI Has Proxy Voting Responsibility
HGI generally will vote proxies for client accounts only if it has been expressly delegated such power in writing. To eliminate ambiguity and to ensure clients who want us to vote proxies understand our policies and procedures, HGI ensures that proxy voting is expressly addressed in our investment management agreements with new clients or revised agreements with existing clients. We generally interpret silence in the agreement as not delegating HGI the right to vote, except for agreements with U.S. employee benefit plans subject to ERISA. For ERISA accounts, HGI assumes that it has voting power unless a written document expressly prohibits HGI from voting proxies, or assigns voting power to another fiduciary.
C. Voting and Non-Voting of Proxies
HGI generally endeavors to vote proxies it is eligible to vote and timely receives. We generally will not vote proxies under the following circumstances:
| | • | | We will not vote proxies for securities not selected by us or for securities over which we have no discretionary authority held in a client account. |
| | • | | We will not vote proxies that we do not receive in time to submit a timely vote. The timeliness of notification, distribution of proxy materials, book closure and the actual meeting date will vary by jurisdiction and market practice. |
| | • | | We ordinarily will not vote on proposals if a security is on loan at the time of the vote under a client’s securities lending arrangement. Absent extraordinary circumstances, we believe that the administrative burden and loss of revenue associated with recalling securities will outweigh the anticipated benefit, particularly since there is no guarantee that loaned securities can be retrieved in time to submit a timely vote. We may ask that a security be recalled to vote under extraordinary circumstances. This decision will be made only when, in our sole judgment, the matter to be voted on has critical significance to the potential value of a long-term holding, and the relative cost and/or administrative inconvenience of retrieving the securities does not outweigh the perceived benefit. |
| | • | | We may not vote on a particular proposal or proxy if the costs or burdens of voting outweigh the expected benefit to clients. These decisions are generally made on a case-by-case basis and will be dependent on numerous factors, including the nature of the proposal, the nature of the holding, the direct cost of voting, and whether voting will hinder our ability to sell a security. |
B-29
Voting proxies for securities of companies located outside of the United States raises the same issues as voting proxies related to U.S. companies but could involve significantly greater effort or cost that could result in us deciding not to vote. Additional burdens include, but are not limited to:
| | • | | Differing rules and practices regarding shareholder notification and voting in different jurisdictions could result in greater instances of HGI being unable to submit a timely vote. |
| | • | | Some jurisdictions require that shares to be voted be “blocked” by the custodian or depository (or bearer shares deposited with a specified financial institution) for a specified number of days (usually five or fewer but sometimes longer) before or after the shareholder meeting. |
| | • | | Offering materials may not be available in English at a reasonable cost or received timely to permit informed voting. |
| | • | | Some jurisdictions may require that securities be registered in a particular way that differs from ordinary practice (e.g., registered in the company’s share registry or taken out of nominee name). |
D. Conflicts
From time to time, proxy voting proposals may raise conflicts between the interests of HGI’s clients and the interests of HGI and/or its employees. Under these circumstances, HGI will take additional steps that are designed to ensure that the proxies are voted based on our clients’ best interests. Conflicts of interest may arise when:
| | • | | Proxy votes regarding non-routine matters are solicited by an issuer that has an institutional separate account relationship with HGI;1 |
| | • | | A proponent of a proxy proposal has a business relationship with HGI or an HGI employee; |
| | ��� | | HGI or an HGI employee has a business relationship with a participant in a proxy contests, or a director election. |
HGI’s Proxy Voting Committee is responsible for overseeing the proxy voting process, including monitoring and resolving possible material conflicts of interest. Any portfolio manager or research analyst with knowledge of a personal conflict of interest relating to a particular matter shall disclose that conflict to the Chief Compliance Officer or another member of the Proxy Voting Committee, and may be required to recuse him or herself from the proxy voting process. Issues raising possible conflicts of interest are referred to the Proxy Voting Committee for evaluation and resolution. Conflicts of interest may be resolved in different ways by the Proxy Voting Committee. Possible ways that conflicts of interest may be resolved include strict application of our Guidelines, recusal of conflicted personnel, consultation with other unconflicted investment personnel, or voting in accordance with an objective third party recommendation.
E. Arrangement with Proxy Voting Service
We use an unaffiliated third party proxy administrator to assist in voting proxies. The proxy voting service’s functions may include notifying us of shareholder meeting dates, translating proxy materials received from companies, providing associated research and recommendations for voting on particular proxy proposals, recordkeeping and physically transmitting votes. Although we may consider the recommendations of the proxy voting service and other parties if appropriate, we make the ultimate decision on how to vote client proxies.
F. Reports
HGI will provide clients with periodic reports on our proxy voting decisions and actions for securities in their accounts, in such forms or intervals as the clients reasonably request. Clients may contact HGI for such information.
| 1 | For this purpose, HGI generally will consider as “non-routine” any matter listed in New York Stock Exchange Rule 452.11, relating to when a member firm may not vote a proxy without instructions from its customer (for example, contested matters are deemed non-routine). |
B-30
Hansberger Global Investors, Inc.
Proxy Voting Guidelines
Revised as of January 1, 2011
Reviewed as December 3, 2010
General Guidelines
The proxy voting guidelines below summarize HGI’s position on various issues of concern to investors and give a general indication of how portfolio securities held in client accounts will be voted. The guidelines are not exhaustive and do not include all potential voting issues. In addition, because proxy voting issues and circumstances of individual companies are so varied, there may be instances when HGI may not vote in strict adherence to these guidelines as outlined below. The following guidelines are grouped according to the types of proposals generally presented to shareholders.
(i) Board of Directors Issues
HGI will generally vote for all Board of Directors nominees unless certain actions by the Directors warrant votes to be withheld. These instances include Directors who:
| | • | | Attend less than 75% of the board and committee meetings; and |
| | • | | Are also the CEO of a company where a serious restatement has occurred after the CEO certified the pre-restatement financial statements. |
HGI also feels that the following conflicts of interest may hinder a director’s performance and will therefore typically withhold votes from a candidate who is a:
| | • | | CFO who presently sits on the board; |
| | • | | Director who presently sits on an excessive number of boards; |
| | • | | Director, or a director whose immediate family member, provides material professional services to the company at any time during the past five years; |
| | • | | Director, or a director whose immediate family member, engages in airplane, real estate or other similar deals with the company, including perquisite type grants from the company; and |
| | • | | Director with an interlocking directorship. |
(ii) Auditors
HGI will generally vote for proposals to ratify auditors. However, HGI will generally vote against ratification of the auditor and/or authorizing the board to set auditor fees for the following reasons:
| | • | | When audit fees added to audit-related fees total less than one-third of the total fees paid to the auditor by a company; When there have been any recent restatements or late filings by the company where the auditor bears some responsibility for the restatement or late filing (e.g., a restatement due to a reporting error); |
| | • | | When the company has aggressive accounting policies; |
| | • | | When the company has poor disclosure or lack of transparency in financial statements; |
| | • | | When there are other relationships or issues of concern with the auditor that might suggest a conflict between the interest of the auditor and the interests of shareholders; or |
| | • | | When the company is changing auditors as a result of a disagreement between the company and the auditor on a matter of accounting principles or practices, financial statement disclosure or auditing scope or procedures. |
(iii) Executive and Director Compensation
HGI will generally support executive compensation plans that motivate participants to focus on long-term shareholder value and returns, encourage employee stock ownership, and more closely align employee interests with those of shareholders. HGI will also support resolutions regarding director’s fees.
B-31
In order to allow for meaningful shareholder review, we believe that incentive programs should generally include: (i) specific and appropriate performance goals; (ii) a maximum award pool; and (iii) a maximum award amount per employee. In addition, the payments made should be reasonable relative to the performance of the business, and total compensation to those covered by the plan should be in line with compensation paid by the Company’s peers.
In general, HGI will determine votes for the following on a case-by-case basis:
| | • | | Stock-based incentive plans; |
| | • | | Performance-based stock option proposals; |
| | • | | Stock plans in lieu of cash; |
| | • | | Proposals to ratify or cancel executive severance agreements; and |
| | • | | Management proposals seeking approval to re-price options. |
HGI will generally vote against:
| | • | | Retirement plans for non-employee directors; |
| | • | | Shareholder proposals seeking to set absolute levels on compensation or otherwise dictate the amount or forms of compensation; and |
| | • | | Shareholder proposals requiring director fees to be paid in stock only. |
(iv) Takeover/Tender Offer Defenses
Anti-takeover proposals are analyzed on a case-by-case basis. However, since investors customarily, in our view, suffer a diminution of power as a result of the adoption of such proposals, they are generally opposed by HGI unless structured in such a way that they give shareholders the ultimate decision on any proposal or offer. Specifically, HGI will under normal circumstances oppose:
| | • | | Dual class exchange offers and dual class recapitalizations (unequal voting rights); |
| | • | | Proposals to require a supermajority shareholder vote to approve charter and by-law amendments; |
| | • | | Proposals to require a supermajority shareholder vote to approve mergers and other significant business combinations; and |
| | • | | Fair price provisions with shareholder vote requirements greater than a majority of disinterested shares. |
(v) Capital Structure and Shareholder Rights
This category consists of broad issues concerning capital structure and shareholder rights. These types of issues generally call for revisions to the corporate by-laws, which will impact shareholder ownership rights. All items are reviewed and voted on a case-by-case basis; however, HGI endeavors to balance the ownership rights of shareholders and their best interests with providing management of each corporation the greatest operational latitude.
(vi) Social and Political Responsibility Issues
In the case of social and political responsibility issues that in HGI’s view do not primarily involve financial considerations, it is not possible to represent fairly the diverse views of HGI’s clients. HGI generally votes in accordance with the recommendations of its proxy voting service on these social and political issues, although HGI sometimes may abstain from voting on these issues.
B-32
PROXY VOTING POLICY OF
LAZARD ASSET MANAGEMENT LLC
AND
LAZARD ASSET MANAGEMENT (CANADA), INC.
A. Introduction
Lazard Asset Management LLC and Lazard Asset Management (Canada), Inc. (together, “Lazard”) provide investment management services for client accounts, including proxy voting services. As a fiduciary, Lazard is obligated to vote proxies in the best interests of its clients. Lazard has developed a structure that is designed to ensure that proxy voting is conducted in an appropriate manner, consistent with clients’ best interests, and within the framework of this Proxy Voting Policy (the “Policy”). Lazard has adopted this Policy in order to satisfy its fiduciary obligation and the requirements of Rule 206(4)-6 under the Investment Advisers Act of 1940, as amended.
Lazard manages assets for a variety of clients, including individuals, Taft-Hartley plans, governmental plans, foundations and endowments, corporations, and investment companies and other collective investment vehicles. To the extent that proxy voting authority is delegated to Lazard, Lazard’s general policy is to vote proxies on a given issue the same for all of its clients. This Policy is based on the view that Lazard, in its role as investment adviser, must vote proxies based on what it believes will maximize shareholder value as a long-term investor, and the votes that it casts on behalf of all its clients are intended to accomplish that objective. This Policy recognizes that there may be times when meeting agendas or proposals may create the appearance of a material conflict of interest for Lazard. When such a conflict may appear, Lazard will seek to alleviate the potential conflict by voting consistent with pre-approved guidelines or, in situations where the pre-approved guideline is to vote case-by-case, with the recommendation of an independent source. More information on how Lazard handles conflicts is provided in Section F of this Policy.
B. Responsibility to Vote Proxies
Generally, Lazard is willing to accept delegation from its clients to vote proxies. Lazard does not delegate that authority to any other person or entity, but retains complete authority for voting all proxies on behalf of its clients. Not all clients delegate proxy-voting authority to Lazard, however, and Lazard will not vote proxies, or provide advice to clients on how to vote proxies, in the absence of a specific delegation of authority or an obligation under applicable law. For example, securities that are held in an investment advisory account for which Lazard exercises no investment discretion, are not voted by Lazard, nor are shares that a client has authorized their custodian bank to use in a stock loan program which passes voting rights to the party with possession of the shares.
As discussed more fully in Section G of this Policy, there may be times when Lazard determines that it would be in the best interests of its clients to abstain from voting proxies.
C. General Administration
1. Overview
Lazard’s proxy voting process is administered by its Proxy Operations Department (“ProxyOps”), which reports to Lazard’s Chief Operations Officer. Oversight of the process is provided by Lazard’s Legal / Compliance Department and by a Proxy Committee currently consisting of Managing Directors, LAM’s General Counsel and Chief Compliance Officer, portfolio managers and other investment personnel of Lazard. The Proxy Committee meets at least semi-annually to review this Policy and consider changes to it, as well as specific proxy voting guidelines (the “Approved Guidelines”), which are discussed below. Meetings may be convened more frequently (for example, to discuss a specific proxy agenda or proposal) as requested by the Manager of ProxyOps, any member of the Proxy Committee, or Lazard’s General Counsel or Chief Compliance Officer. A representative of Lazard’s Legal / Compliance Department must be present at all Proxy Committee meetings.
2. Role of Third Parties
To assist it in its proxy-voting responsibilities, Lazard currently subscribes to several research and other proxy-related services offered by Institutional Shareholder Services, Inc. (“ISS”), one of the
B-33
world’s largest providers of proxy-voting services. ISS provides Lazard with its independent analysis and recommendation regarding virtually every proxy proposal that Lazard votes on behalf of its clients, with respect to both U.S. and non-U.S. securities.
ISS provides other proxy-related administrative services to Lazard. ISS receives on Lazard’s behalf all proxy information sent by custodians that hold securities of Lazard’s clients. ISS posts all relevant information regarding the proxy on its password-protected website for Lazard to review, including meeting dates, all agendas and ISS’ analysis. ProxyOps reviews this information on a daily basis and regularly communicates with representatives of ISS to ensure that all agendas are considered and proxies are voted on a timely basis. ISS also provides Lazard with vote execution, recordkeeping and reporting support services.
3. Voting Process
Lazard’s Proxy Committee has approved specific proxy voting guidelines regarding various common proxy proposals (the “Approved Guidelines”). As discussed more fully below in Section D of this Policy, depending on the proposal, an Approved Guideline may provide that Lazard should vote for or against the proposal, or that the proposal should be considered on a case-by-case basis.
Where the Approved Guideline for a particular type of proxy proposal is to vote on a case-by case basis, Lazard believes that input from a portfolio manager or research analysts with knowledge of the issuer and its securities (collectively, “Portfolio Management”) is essential. Portfolio Management is, in Lazard’s view, best able to evaluate the impact that the outcome on a particular proposal will have on the value of the issuer’s shares. Consequently, the Manager of ProxyOps seeks Portfolio Management’s recommendation on how to vote all such proposals. Similarly, with respect to certain Lazard strategies, as discussed more fully in Sections F and G below, the Manager of ProxyOps will consult with Portfolio Management to determine when it would be appropriate to abstain from voting.
In seeking Portfolio Management’s recommendation, the Manager of ProxyOps provides ISS’ recommendation and analysis. Portfolio Management provides the Manager of ProxyOps with its recommendation and the reasons behind it. ProxyOps will generally vote as recommended by Portfolio Management, subject to certain strategy-specific situations or situations where there may appear to be a material conflict of interest, in which case an alternative approach may be followed. (See Sections F and G below.) Depending on the facts surrounding a particular case-by-case proposal, or Portfolio Management’s recommendation on a case-by-case proposal, the Manager of ProxyOps may consult with Lazard’s Chief Compliance Officer or General Counsel, and may seek the final approval of the Proxy Committee regarding Portfolio Management’s recommendation. If necessary, and in cases where there is a possibility of a split vote among Portfolio Management teams as described in Section G.1. below, a meeting of the Proxy Committee will be convened to discuss the proposal and reach a final decision on Lazard’s vote.
Subject to certain strategy-specific situations, ProxyOps generally votes all routine proposals (described below) according to the Approved Guidelines. For non-routine proposals where the Approved Guideline is to vote for or against, ProxyOps will provide Portfolio Management with both the Approved Guideline, as well as ISS’ recommendation and analysis. Unless Portfolio Management disagrees with the Approved Guideline for the specific proposal, ProxyOps will generally vote the proposal according to the Approved Guideline. If Portfolio Management disagrees, however, it will provide its reason for doing so. All the relevant information will be provided to the Proxy Committee members for a final determination of such non-routine items. It is expected that the final vote will be cast according to the Approved Guideline, absent a compelling reason for not doing so, and subject to situations where there may be the appearance of a material conflict of interest or certain strategy-specific situations, in which case an alternative approach may be followed. (See Sections F and G, below.)
D. Specific Proxy Items
Shareholders receive proxies involving many different proposals. Many proposals are routine in nature, such as a non-controversial election of Directors or a change in a company’s name. Others are more complicated, such as items regarding corporate governance and shareholder rights, changes to capital structure, stock option plans and other executive compensation issues, mergers and other
B-34
significant transactions and social or political issues. Following are the Approved Guidelines for a significant proportion of the proxy proposals on which Lazard regularly votes. Of course, other proposals may be presented from time to time. Those proposals will be discussed with the Proxy Committee to determine how they should be voted and, if it is anticipated that they may re-occur, to adopt an Approved Guideline.
Certain strategy-specific considerations may result in Lazard voting proxies other than according to Approved Guidelines, not voting shares at all, issuing standing instructions to ISS on how to vote certain proxy matters or other differences from how Lazard votes or handles its proxy voting. These considerations are discussed in more detail in Section G, below.
1. Routine Items
Lazard generally votes routine items as recommended by the issuer’s management and board of directors, and against any shareholder proposals regarding those routine matters, based on the view that management is in a better position to evaluate the need for them. Lazard considers routine items to be those that do not change the structure, charter, bylaws, or operations of an issuer in any way that is material to shareholder value. Routine items generally include:
| | • | | routine election or re-election of directors; |
| | • | | appointment or election of auditors, in the absence of any controversy or conflict regarding the auditors; |
| | • | | issues relating to the timing or conduct of annual meetings; and |
2. Corporate Governance and Shareholder Rights Matters
Many proposals address issues related to corporate governance and shareholder rights. These items often relate to a board of directors and its committees, anti-takeover measures, and the conduct of the company’s shareholder meetings.
a. Board of Directors and Its Committees
Lazard votes in favor of provisions that it believes will increase the effectiveness of an issuer’s board of directors. Lazard believes that in most instances, a board and the issuer’s management are in the best position to make the determination how to best increase a board’s effectiveness. Lazard does not believe that establishing burdensome requirements regarding a board will achieve this objective. Lazard has Approved Guidelines to vote:
| | • | | For the establishment of an independent nominating committee, audit committee or compensation committee of a board of directors; |
| | • | | For a requirement that a substantial majority (e.g. 2/3) of a US or UK company’s directors be independent; |
| | • | | On a case-by-case basis regarding the election of directors where the board does not have independent “key committees” or sufficient independence; |
| | • | | For proposals that a board’s committees be comprised solely of independent directors or consist of a majority of independent directors; |
| | • | | For proposals to limit directors’ liability; broaden indemnification of directors; and approve indemnification agreements for officers and directors, unless doing so would affect shareholder interests in a specific pending or threatened litigation; or for indemnification due to negligence in these cases voting is on a case-by-case basis; |
| | • | | For proposals seeking to de-classify a board and Against proposals seeking to classify a board; |
| | • | | On a case-by-case basis on all proposals relating to cumulative voting; |
| | • | | Against shareholder proposals, absent a demonstrable need, proposing the establishment of additional committees; and on a case-by-case basis regarding the establishment of shareholder advisory committees. |
| | • | | Against shareholder proposals seeking union or special-interest representation on the board; |
B-35
| | • | | Against shareholder proposals seeking to establish term limits or age limits for directors; |
| | • | | On a case-by-case basis on shareholder proposals seeking to require that the issuer’s chairman and chief executive officer be different individuals; |
| | • | | Against shareholder proposals seeking to establish director stock-ownership requirements; and |
| | • | | Against shareholder proposals seeking to change the size of a board, requiring women or minorities to serve on a board, or requiring two candidates for each board seat. |
b. Anti-takeover Measures
Certain proposals are intended to deter outside parties from taking control of a company. Such proposals could entrench management and adversely affect shareholder rights and the value of the company’s shares. Consequently, Lazard has adopted Approved Guidelines to vote:
| | • | | Against proposals to adopt supermajority vote requirements, or increase vote requirements, for mergers or for the removal of directors; |
| | • | | On a case-by-case basis regarding shareholder rights plans (also known as “poison pill plans”) and For proposals seeking to require all poison pill plans be submitted to shareholder vote; |
| | • | | Against proposals seeking to adopt fair price provisions and For proposals seeking to rescind them; |
| | • | | Against “blank check” preferred stock; and |
| | • | | On a case-by-case basis regarding other provisions seeking to amend a company’s by-laws or charter regarding anti-takeover provisions. |
c. Conduct of Shareholder Meetings
Lazard generally opposes any effort by management to restrict or limit shareholder participation in shareholder meetings, and is in favor of efforts to enhance shareholder participation. Lazard has therefore adopted Approved Guidelines to vote:
| | • | | Against proposals to adjourn meetings; |
| | • | | Against proposals seeking to eliminate or restrict shareholders’ right to call a special meeting; |
| | • | | For proposals providing for confidential voting; |
| | • | | Against efforts to eliminate or restrict right of shareholders to act by written consent; |
| | • | | Against proposals to adopt supermajority vote requirements, or increase vote requirements, and |
| | • | | On a case-by-case basis on changes to quorum requirements. |
3. Changes to Capital Structure
Lazard receives many proxies that include proposals relating to a company’s capital structure. These proposals vary greatly, as each one is unique to the circumstances of the company involved, as well as the general economic and market conditions existing at the time of the proposal. A board and management may have many legitimate business reasons in seeking to effect changes to the issuer’s capital structure, including raising additional capital for appropriate business reasons, cash flow and market conditions. Lazard generally believes that these decisions are best left to management, absent apparent reasons why they should not be. Consequently, Lazard has adopted Approved Guidelines to vote:
| | • | | For management proposals to increase or decrease authorized common or preferred stock (unless it is believed that doing so is intended to serve as an anti-takeover measure); |
| | • | | For stock splits and reverse stock splits; |
| | • | | On a case-by-case basis on matters affecting shareholder rights, such as amending votes-per-share; |
| | • | | On a case-by-case basis on management proposals to issue a new class of common or preferred shares; |
B-36
| | • | | For management proposals to adopt or amend dividend reinvestment plans; |
| | • | | Against changes in capital structure designed to be used in poison pill plans; and |
| | • | | On a case-by-case basis on proposals seeking to approve or amend stock ownership limitations or transfer restrictions. |
4. Stock Option Plans and Other Executive Compensation Issues
Lazard supports efforts by companies to adopt compensation and incentive programs to attract and retain the highest caliber management possible, and to align the interests of a board, management and employees with those of shareholders. Lazard favors programs intended to reward management and employees for positive, long-term performance. However, Lazard will evaluate whether it believes, under the circumstances, that the level of compensation is appropriate or excessive. Lazard has Approved Guidelines to vote:
| | • | | On a case-by-case basis regarding all stock option plans; |
| | • | | Against restricted stock plans that do not involve any performance criteria; |
| | • | | For employee stock purchase plans; |
| | • | | On a case-by-case basis for stock appreciation rights plans; |
| | • | | For deferred compensation plans; |
| | • | | Against proposals to approve executive loans to exercise options; |
| | • | | Against proposals to re-price underwater options; |
| | • | | On a case-by-case basis regarding shareholder proposals to eliminate or restrict severance agreements, and For proposals to submit severance agreements to shareholders for approval; and Against proposals to limit executive compensation or to require executive compensation to be submitted for shareholder approval, unless, with respect to the latter submitting compensation plans for shareholder approval is required by local law or practice. |
5. Mergers and Other Significant Transactions
Shareholders are asked to consider a number of different types of significant transactions, including mergers, acquisitions, sales of all or substantially all of a company’s assets, reorganizations involving business combinations and liquidations. Each of these transactions is unique. Therefore, Lazard’s Approved Guideline is to vote on each of these transactions on a case-by-case basis.
6. Social and Political Issues
Proposals involving social and political issues take many forms and cover a wide array of issues. Some examples are: adoption of principles to limit or eliminate certain business activities, or limit or eliminate business activities in certain countries; adoption of certain conservation efforts; reporting of charitable contributions or political contributions or activities; or the adoption of certain principles regarding employment practices or discrimination policies. These items are often presented by shareholders and are often opposed by the company’s management and its board of directors.
Lazard generally supports the notion that corporations should be expected to act as good citizens, but, as noted above, is obligated to vote on social and political proposals in a way that it believes will most increase shareholder value. As a result, Lazard has adopted Approved Guidelines to vote on a case-by-case basis for most social and political issue proposals. Lazard will generally vote for the approval of anti-discrimination policies.
E. Voting Non-U.S. Securities
Lazard invests in non-U.S. securities on behalf of many clients. Laws and regulations regarding shareholder rights and voting procedures differ dramatically across the world. In certain countries, the requirements or restrictions imposed before proxies may be voted may outweigh any benefit that could be realized by voting the proxies involved. For example, certain countries restrict a shareholder’s ability to sell shares for a certain period of time if the shareholder votes proxies at a meeting (a practice known as “share blocking”). In other instances, the costs of voting a proxy (i.e., by being required to send a representative to the meeting) may simply outweigh any benefit to the client
B-37
if the proxy is voted. Generally, the Manager of ProxyOps will consult with Portfolio Management to determine whether they believe it is in the interest of the clients to vote the proxies. In these instances, the Proxy Committee will have the authority to decide that it is in the best interest of its clients not to vote the proxies.
There may be other instances where Portfolio Management may wish to refrain from voting proxies (See Section G.1. below). Due to the nature of the strategy, a decision to refrain from voting proxies for securities held by the Korea Corporate Governance strategy managed by Lazard (“KCG”), certain Japanese securities or emerging market securities will generally be determined by Portfolio Management. (See Section G.1. below.)
F. Conflicts of Interest
1. Overview
Lazard is required to vote proxies in the best interests of its clients. It is essential, therefore, that material conflicts of interest or the appearance of a material conflict be avoided.
Potential conflicts of interest are inherent in Lazard’s organizational structure and in the nature of its business. Following are examples of situations that could present a conflict of interest or the appearance of a conflict of interest:
| | • | | Lazard Frères & Co. LLC (“LF&Co.”), Lazard’s parent and a registered broker-dealer, or an investment banking affiliate has a relationship with a company the shares of which are held in accounts of Lazard clients, and has provided services to the company with respect to an upcoming significant proxy proposal (i.e., a merger or other significant transaction); |
| | • | | Lazard serves as an investment adviser for a company the management of which supports a particular proposal, and shares of the company are held in accounts of Lazard clients; |
| | • | | Lazard serves as an investment adviser for the pension plan of an organization that sponsors a proposal; or |
| | • | | A Lazard employee who would otherwise be involved in the decision-making process regarding a particular proposal has a material relationship with the issuer or owns shares of the issuer. |
2. General Policy and Consequences of Violations
All proxies must be voted in the best interest of each Lazard client, without any consideration of the interests of any other Lazard client (unrelated to the economic effect of the proposal being voted on share price), Lazard, LF&Co. or any of their Managing Directors, officers, employees or affiliates. ProxyOps is responsible for all proxy voting in accordance with this Policy after consulting with the appropriate member or members of Portfolio Management, the Proxy Committee and/or the Legal / Compliance Department. No other officers or employees of Lazard, LF&Co. or their affiliates may influence or attempt to influence the vote on any proposal. Doing so will be a violation of this Policy. Any communication between an officer or employee of LF&Co. and an officer or employee of Lazard trying to influence how a proposal should be voted is prohibited, and is a violation of this Policy. Violations of this Policy could result in disciplinary action, including letter of censure, fine or suspension, or termination of employment. Any such conduct may also violate state and Federal securities and other laws, as well as Lazard’s client agreements, which could result in severe civil and criminal penalties being imposed, including the violator being prohibited from ever working for any organization engaged in a securities business. Every officer and employee of Lazard who participates in any way in the decision-making process regarding proxy voting is responsible for considering whether they have a conflicting interest or the appearance of a conflicting interest on any proposal. A conflict could arise, for example, if an officer or employee has a family member who is an officer of the issuer or owns securities of the issuer. If an officer or employee believes such a conflict exists or may appear to exist, he or she should notify the Chief Compliance Officer immediately and, unless determined otherwise, should not continue to participate in the decision-making process.
3. Monitoring for Conflicts and Voting When a Material Conflict Exists
ProxyOps monitors for potential conflicts of interest that could be viewed as influencing the outcome of Lazard’s voting decision. Consequently, the steps that Lazard takes to monitor conflicts,
B-38
and voting proposals when the appearance of a material conflict exists, differ depending on whether the Approved Guideline for the specific item is clearly defined to vote for or against, or is to vote on a case-by-case basis. Any questions regarding application of these conflict procedures, including whether a conflict exists, should be addressed to LAM’s Chief Compliance Officer or General Counsel.
a. Where Approved Guideline Is For or Against
Lazard has an Approved Guideline to vote for or against regarding most proxy agenda/proposals. Generally, unless Portfolio Management disagrees with the Approved Guideline for a specific proposal, ProxyOps votes according to the Approved Guideline. It is therefore necessary to consider whether an apparent conflict of interest exists when Portfolio Management disagrees with the Approved Guideline. ProxyOps will use its best efforts to determine whether a conflict of interest or potential conflict of interest exists. If there is no material conflict, the proxy will be voted as outlined in this Policy. If conflict appears to exist, then the proposal will be voted according to the Approved Guideline.
b. Where Approved Guideline Is Case-by-Case
In situations where the Approved Guideline is to vote case-by-case and a material conflict of interest appears to exist, Lazard’s policy is to vote the proxy item according to the recommendation of an independent source, currently ISS. The Manager of ProxyOps will use his best efforts to determine whether a conflict of interest or a potential conflict of interest may exist. If a conflict exists, and Lazard policy is to vote “case-by-case”, then ProxyOps will vote in accordance with the concurring recommendations of the two services offered by ISS, the Proxy Advisor Service and the Proxy Voter Service. If the two ISS services’ recommendations are contrary to each other, ProxyOps will obtain a recommendation from a third independent source that provides voting advisory services, and will defer to the majority recommendation. If a recommendation from the Proxy Committee approved third independent source is not available, Lazard will follow the recommendation of ISS’ Proxy Advisor service. In addition, in the event of a conflict that arises in connection with a proposal for a Lazard mutual fund, Lazard will vote shares for or against the proposal in proportion to shares voted by other shareholders.
G. Other Matters
1. Issues Relating to Management of Specific Lazard Strategies
Due to the nature of certain strategies managed by Lazard, specifically its emerging markets and KCG strategies, there may be times when Lazard believes that it may not be in the best interests of its clients to vote in accordance with the Approved Guidelines, or to vote proxies at all. In certain markets, the fact that Lazard is voting proxies may become public information, and, given the nature of those markets, may impact the price of the securities involved. With respect to the KCG strategy, Lazard may simply require more time to fully understand and address a situation prior to determining what would be in the best interests of shareholders. In these cases ProxyOps will look to Portfolio Management to provide guidance on proxy voting rather than vote in accordance with the Approved Guidelines.
Additionally, particularly with respect to certain Japanese securities, Lazard may not receive notice of a shareholder meeting in time to vote proxies for, or may simply be prevented from voting proxies in connection with, a particular meeting. Due to the compressed time frame for notification of shareholder meetings and Lazard’s obligation to vote proxies on behalf of its clients, Lazard may issue standing instructions to ISS on how to vote on certain matters.
Different strategies managed by Lazard may hold the same securities. However, due to the differences between the strategies and their related investment objectives (e.g., the KCG strategy and an emerging-markets strategy), one Portfolio Management team may desire to vote differently than the other, or one team may desire to abstain from voting proxies while the other may desire to vote proxies. In this event, Lazard would generally defer to the recommendation of the KCG team to determine what action would be in the best interests of its clients. However, under unusual circumstances, the votes may be split between the two teams. In such event, a meeting of the Proxy Committee will be held to determine whether it would be appropriate to split the votes.
B-39
2. Stock Lending
As noted in Section B above, Lazard does not generally vote proxies for securities that a client has authorized their custodian bank to use in a stock loan program, which passes voting rights to the party with possession of the shares. Under certain circumstances, Lazard may determine to recall loaned stocks in order to vote the proxies associated with those securities. For example, if Lazard determines that the entity in possession of the stock has borrowed the stock solely to be able to obtain control over the issuer of the stock by voting proxies, or if the client should specifically request Lazard to vote the shares on loan, Lazard may determine to recall the stock and vote the proxies itself. However, it is expected that this will be done only in exceptional circumstances. In such event, Portfolio Management will make this determination and ProxyOps will vote the proxies in accordance with the Approved Guidelines.
H. Review of Policy
The Proxy Committee will review this Policy at least semi-annually to consider whether any changes should be made to it or to any of the Approved Guidelines. Questions or concerns regarding the Policy should be raised with Lazard’s General Counsel or Chief Compliance Officer.
B-40
MAI-FSTK-0212D
Mutual Funds
Nuveen Equity Funds
For investors seeking long-term capital appreciation potential.
Annual Report
October 31, 2011
| | | | | | | | | | |
| | | Share Class / Ticker Symbol |
| | | | | |
| Fund Name | | Class A | | Class B | | Class C | | Class R3 | | Class I |
Nuveen Equity Income Fund | | FFEIX | | FAEBX | | FFECX | | FEISX | | FAQIX |
Nuveen Large Cap Value Fund | | FASKX | | FATBX | | FALVX | | FAVSX | | FSKIX |
Nuveen Mid Cap Value Fund | | FASEX | | FAESX | | FACSX | | FMVSX | | FSEIX |
Nuveen Small Cap Value Fund | | FSCAX | | — | | FSCVX | | FSVSX | | FSCCX |
LIFE IS COMPLEX.
Nuveen makes things e-simple.
It only takes a minute to sign up for e-Reports. Once enrolled, you’ll receive an e-mail as soon as your Nuveen Fund information is ready. No more waiting for delivery by regular mail. Just click on the link within the e-mail to see the report and save it on your computer if you wish.
Free e-Reports right to your e-mail!
www.investordelivery.com
If you receive your Nuveen Fund dividends and statements from your financial advisor or brokerage account.
OR
www.nuveen.com/accountaccess
If you receive your Nuveen Fund dividends and statements directly from Nuveen.
| | | | | | |
| Must be preceded by or accompanied by a prospectus. | | NOT FDIC INSURED | | MAY LOSE VALUE | | NO BANK GUARANTEE |
Table of Contents
Chairman’s
Letter to Shareholders

Dear Shareholders,
These are perplexing times for investors. The global economy continues to struggle. The solutions being implemented in the eurozone to deal with the debt crises of many of its member countries are not yet seen as sufficient by the financial markets. The political paralysis in the U.S. has prevented the compromises necessary to deal with the fiscal imbalance and government spending priorities. The efforts by individual consumers, governments and financial institutions to reduce their debts are increasing savings but reducing demand for the goods and services that drive employment. These developments are undermining the rebuilding of confidence by consumers, corporations and investors that is so essential to a resumption of economic growth.
Although it is painfully slow, progress is being made. In Europe, the turnover of a number of national governments reflects the realization by politicians and voters alike that leaders who practiced business as usual had to be replaced by leaders willing to face problems and accept the hard choices needed to resolve them. The recent coordinated efforts by central banks in the U.S. and Europe to provide liquidity to the largest European banks indicates that these monetary authorities are committed to facilitating a recovery in the European banking sector.
In the U.S., the failure of the congressionally appointed Debt Reduction Committee was a blow to those who hoped for a bipartisan effort to finally begin addressing the looming fiscal crisis. Nevertheless, Congress and the administration cannot ignore the issue for long. The Bush era tax cuts are scheduled to expire on December 31, 2012, and six months later the $1.2 trillion of mandatory across-the-board spending cuts under the Budget Control Act of 2011 begin to go into effect. Any legislative modification would require bipartisan support and the prospects for a bipartisan solution are unclear. The impact of these two developments would be a mixed blessing: a meaningful reduction in the annual budget deficit at the cost of slowing the economic recovery.
It is in these particularly volatile markets that professional investment management is most important. Skillful investment teams who have experienced challenging markets and remain committed to their investment disciplines are critical to the success of an investor’s long-term objectives. In fact, many long-term investment track records are built during challenging markets when managers are able to protect investors against these economic crosscurrents. Experienced investment teams know that volatile markets put a premium on companies and investment ideas that will weather the short-term volatility and that compelling values and opportunities are opened up when markets overreact to negative developments. By maintaining appropriate time horizons, diversification and relying on practiced investment teams, we believe that investors can achieve their long-term investment objectives.
As always, I encourage you to contact your financial consultant if you have any questions about your investment in a Nuveen Fund. On behalf of the other members of your Fund Board, we look forward to continuing to earn your trust in the months and years ahead.
Sincerely,

Robert P. Bremner
Chairman of the Board
December 21, 2011
Portfolio Managers’ Comments
Certain statements in this report are forward-looking statements. Discussions of specific investments are for illustration only and are not intended as recommendations of individual investments. The forward-looking statements and other views expressed herein are those of the portfolio managers as of the date of this report. Actual future results or occurrences may differ significantly from those anticipated in any forward-looking statements and the views expressed herein are subject to change at any time, due to numerous market and other factors. The Funds disclaim any obligation to update publicly or revise any forward-looking statements or views expressed herein.
These Funds feature portfolio management by Nuveen Asset Management, LLC, an affiliate of Nuveen Investments.
Cori Johnson, CFA, and Gerald Bren, CFA, are the portfolio managers for the Nuveen Equity Income Fund (formerly known as First American Equity Income Fund). Cori, who has 30 years of investment experience, assumed portfolio management responsibilities in 1996. Gerald, with 39 years of experience, has been a manager on the Fund since 1994.
Brent Mellum, CFA, and Kevin Earley, CFA, are the portfolio managers for the Nuveen Large Cap Value and Nuveen Mid Cap Value Funds (formerly known as First American Large Cap Value Fund and First American Mid Cap Value Fund, respectively). Brent, who has more than 18 years of financial industry experience, assumed portfolio management responsibilities for the Nuveen Large Cap Value Fund in 2004. Kevin, with 24 years of experience, joined the management team for that Fund in 2000. For the Mid Cap Value Fund, Brent and Kevin both assumed portfolio management responsibilities in 1999.
Karen Bowie, CFA, the portfolio manager for the Nuveen Small Cap Value Fund (formerly known as First American Small Cap Value Fund), has 27 years of financial industry experience. She assumed portfolio management responsibilities in 2006.
On the following pages, the portfolio management teams for the Funds examine economic and equity market conditions, key investment strategies and the Funds’ performance for the twelve-month period ended October 31, 2011.
What factors affected the U.S. economic and equity market environments during the twelve-month reporting period ended October 31, 2011?
During this period, the U.S. economy’s recovery from recession remained slow. The Federal Reserve (Fed) maintained its efforts to improve the overall economic environment by continuing to hold the benchmark fed funds rate at the record low level of zero to 0.25% that it had established in December 2008. At its November 2011 meeting (shortly after the end of this reporting period), the central bank reaffirmed its opinion that economic conditions would likely warrant keeping this rate at “exceptionally low levels” at least through mid-2013. The Fed also said that it would continue its program to extend the average maturity of its U.S. Treasury holdings by purchasing $400 billion of these securities with maturities of six to thirty years and selling an equal amount of U.S. Treasury securities with maturities of three years or less. The goals of this program, which the Fed expects to complete by the end of June 2012, are to lower longer-term interest rates, support a stronger economic recovery, and help ensure that inflation remains at levels consistent with the Fed’s mandates of maximum employment and price stability.
In the third quarter of 2011, the U.S. economy, as measured by the U.S. gross domestic product (GDP), grew at an annualized rate of 2.0%, the best growth number since the December quarter of 2010 and the ninth consecutive quarter of positive growth. The Consumer Price Index (CPI) rose 3.5% year-over-year as of October 2011, while the core CPI (which excludes food and energy) increased 2.1%, edging just above the Fed’s unofficial objective of 2.0% or lower for this inflation measure. Unemployment numbers remained high, as October 2011 marked the seventh straight month with a national jobless number of 9.0% or higher. However, after the reporting period came to a close, the U.S. unemployment rate fell to 8.6% in November 2011. While the dip was a step in the right direction, it was partly due to a number of individuals dropping out of the hunt for work. The housing market also continued to be a major weak spot. For the twelve months ended September 2011 (the most recent data available at the time this report was prepared), the average home price in the Standard & Poor’s/Case-Shiller Index lost 3.6%, with 18 of the 20 major metropolitan areas reporting losses. In addition, the U.S. economic picture continued to be clouded by concerns about the European debt crisis and efforts to reduce the federal deficit.
The ongoing economic uncertainty and the continual resurfacing of the European debt
issue caused a high degree of volatility in the equity markets. The first half of the period
saw dramatic gains for stocks and other risk assets fueled by signs of an improving
economy. However, as the summer progressed, markets fell back sharply. For much of
August and September, stocks traded lower before staging a comeback in the final month
of the period. Over the course of the full reporting period, larger U.S. companies generally had stronger returns than their smaller sized and overseas counterparts.
Nuveen Equity Income Fund
How did the Fund perform during the twelve-month period ended October 31, 2011?
The table in the Fund Performance and Expense Ratios section of this report provides Class A Share total returns for the Fund for the one-year, five-year and, ten-year periods ended October 31, 2011. The Fund’s Class A Shares at net asset value (NAV) underperformed the S&P 500 Index and a custom benchmark of only dividend-paying S&P 500 Index stocks over the twelve-month period, but it outperformed the Lipper classification average.
What strategies were used to manage the Fund during the reporting period? How did these strategies influence performance?
Over the twelve-month period, we continued to implement the Fund’s disciplined investment strategy. We seek to achieve consistent, long-term outperformance with lower volatility by building and managing a portfolio diversified between core and opportunistic holdings with a focus on what we believe are attractively valued companies with above-average current income or dividend growth. We use an integrated, multi-perspective research and analysis approach that involves a team of portfolio managers, fundamental research analysts and quantitative analysts. The Fund’s holdings exhibit attractive valuations and identifiable catalysts that we believe will drive future stock appreciation.
The Fund is also actively managed in an effort to minimize distributed capital gains and maximize after-tax returns using a typical investment horizon of at least two to three years. We adhere to portfolio guardrails to manage volatility and maintain diversification, generally selling a security if it no longer is expected to meet our dividend growth or price appreciation expectations or if we find a better alternative in the marketplace.
During the Fund’s fiscal year, stock selection in the technology sector was the largest positive contributor to performance. Our favorable results were led by a position in MasterCard, which continued to see strong revenue and income growth with the worldwide proliferation of electronic payment solutions. MasterCard is also gaining market share globally. In addition, the Fund experienced strong performance from owning QUALCOMM, which benefited from the increasing popularity of the next generation of hand-held mobile devices. QUALCOMM is a major provider of the chips that go into smart phones. Finally in technology, the Fund’s results were aided by not owning Hewlett-Packard, a significant position in the benchmark and also the worst performer in the group. We avoided this company because we were concerned about its fundamental business trends and the turmoil in its management structure.
Performance was also enhanced by our stock selection in utilities, where we had emphasized some of the higher yielding, undervalued companies in the sector. For example, the Fund experienced strong results from CenterPoint Energy. Investors revalued the company higher in recognition of growing future revenue and profit prospects from its distribution assets in areas with expanding shale gas development. We also experienced a strong positive contribution from PNM Resources, one of the best values in the group. We bought it based on our expectations for an improved regulatory environment, which developed during the year causing the stock’s valuation to increase.
Health care was another area where the Fund benefited from good stock selection. In order to provide current income to the portfolio, we were positioned in some of the large pharmaceutical companies with above-average dividend yields. Standout performers in this group included both GlaxoSmithKline and Pfizer. In the case of GlaxoSmithKline, investors began to look beyond its near-term expiration of patents toward the products in its pipeline that will increasingly provide profits over the longer term. Pfizer continued to restructure its organization to better reflect the prospect for lower future revenues from the expiration of the patent on its largest drug, Lipitor. Investors revalued the stock upward based on these restructuring efforts and expectations that free cash flow could continue to be strong and used to repurchase shares and increase the dividend. Elsewhere in the health care sector, the Fund was rewarded for its position in Covidien, a diversified distributor of medical devices and hospital supplies. Investors bid up the stock in recognition of its improving earnings and revenue growth during the period.
In the consumer staples sector, the Fund experienced good results from owning Unilever, a leading food and personal care products provider. The company benefited from its diversified global presence and increased worldwide demand for its products.
These areas of strength were offset by unfavorable stock selection in the financial sector, particularly in diversified financials and banks. These stocks were uniformly negative in reaction to a shift from expectations of a robust earnings recovery to expectations for lower earnings in a continued flat yield curve environment. The ongoing low-yield
environment limits the ability of banks to earn interest income. This shift — combined with ongoing uncertainties about regulatory oversight, capital requirements, changes to fee structures and potential bad loans on their balance sheets — created greater concerns about future profitability potential and weighed on the stocks.
In consumer discretionary, the Fund’s few positive performers were balanced out by the negatives. On the positive side, turnaround story Footlocker advanced as investors recognized its improving same-store sales and profit margins. However, these results were more than offset by some of the housing market-related stocks the Fund owned. For example, home builder company M.D.C. Holdings sold off due to the lack of visibility on the return of its revenues and earnings as prospects for recovery in the housing market disappointed investor expectations.
In the industrials sector, Fund performance suffered from a lack of exposure to some of the large machinery manufacturing companies like Caterpillar. Also, one of our larger holdings, Emerson, a leading diversified global manufacturing and engineering solutions company, underperformed because of near-term investor concern about slowing earnings growth in an expected slower global growth environment.
As of the end of the fiscal year, we had reduced the cyclical exposure of the Fund’s holdings in response to our outlook for a slowing global growth environment. Europe and the United States are expected to face further macro headwinds as budget deficit issues and sovereign debt levels are addressed. As a result, China and other emerging markets are likely to slow as their end markets stagnate. Therefore, the Fund’s portfolio is more diversified with tempered sector bets compared to a year ago. For example, we have reduced the Fund’s position in the consumer discretionary sector to benchmark weight. We have increased our weights in the energy and financial sectors, where we are finding more compelling valuations and better current yields. The energy sector is now neutral versus the benchmark while the financial sector is slightly overweighted. Within financials, we are selective, emphasizing life and specialty insurance companies and banks that are focused on investment services, while underweighting the large banks. We have also brought up the Fund’s consumer staples position so it is less of an underweight. We have moved to an underweight position in utilities because current valuations in the sector are expensive versus their history.
As always, we remain focused on owning primarily large, U.S.-based companies that we believe have growing global franchises and dividend policies supporting above-average current yields or dividend growth. Investors are increasingly focused on dividend payout patterns from U.S. corporations as they continue to keep large amounts of cash on the sidelines. We believe this may prove beneficial to this segment of the equity markets going forward.
Nuveen Large Cap Value Fund
How did the Fund perform during the twelve-month period ended October 31, 2011?
The table in the Fund Performance and Expense Ratios section of this report provides Class A Share total returns for the Fund for the one-year, five-year and ten-year periods ended October 31, 2011. The Fund’s Class A Shares at net asset value (NAV) underperformed the Russell 1000 Value Index and the Lipper classification average over the twelve-month period.
What strategies were used to manage the Fund during the reporting period? How did these strategies influence performance?
The Fund pursues a long-term capital appreciation strategy by investing primarily in the common stocks of companies that have market capitalizations of $5 billion or greater at the time of purchase. During this period, we continued to implement the Fund’s investment process of selecting large-cap companies that we believe are undervalued relative to other companies in the same industry or market, that demonstrate improving fundamentals and that exhibit a near-term catalyst that could close the gap between market value and our perception of fair value. Generally, we sold a holding if the stock hit its price target, the company’s fundamentals or competitive position significantly deteriorated or if a better alternative existed in the marketplace.
While the Fund underperformed over this period, it did benefit from favorable security selection in the energy, consumer discretionary and materials sectors. Within energy, exploration and production companies Anadarko Petroleum, Concho Resources and Pioneer Natural Resources posted strong advances due to accelerating production profiles and favorable energy prices. Oil service related firms National Oilwell Varco, Schlumberger and Cameron International also benefited from attractive industry conditions. El Paso rose after it agreed to be purchased by Kinder Morgan.
Retail stock selection, within consumer discretionary, was favorable due to positive returns from Macy’s and Bed Bath & Beyond as both companies experienced accelerating same-store sales and higher profit margins. Hotel and timeshare operator Wyndham Worldwide also advanced because of strong results and robust share repurchase activity. Chemical companies PPG Industries and LyondellBasell Industries benefited from emerging market demand which allowed pricing to outpace higher costs. Other stocks that had a positive impact on the Fund’s performance included CBS, related to robust advertising spending conditions and the network’s high viewership ratings, and MasterCard, following clarity on the fees retailers would have to pay to accept debit cards. Additionally, the Fund’s underweight positions in consumer staples and financials, and its overweights in both the energy and consumer discretionary sectors, aided performance.
The Fund’s performance was negatively impacted by unfavorable stock selection in the industrial, consumer staple, financial and technology sectors. Machinery holdings SPX Corp and Terex, within the industrial sector, experienced sharp corrections later in the period due to concerns of a global economic slowdown caused by uncertainty in Europe and China. Delta Air Lines declined because of higher fuel prices and an uncertain European demand environment. Milk processor Dean Foods, within consumer staples, fell as a result of limited ability to pass on higher milk costs. Drug store operator Walgreens declined due to its disagreement with a large pharmacy benefits manager. Safeway, a food retailer, declined because of volume declines caused by higher food prices.
Within financials, the Fund’s allocation to banks hurt overall returns as the group underperformed due to challenged loan growth and interest income pressures caused by historically low interest rates. Insurance companies Prudential Financial and Lincoln National underperformed due to low interest rates which may pressure future earnings. Technology stocks that had a negative impact included semiconductor manufacturer Marvell Technology due to a lower computer hard drive outlook, ON Semiconductor
following the Japanese earthquake because of the company’s manufacturing exposure to that market and Xerox because of moderating growth following a cyclical rebound. The Fund’s overweight position in technology also detracted from performance as the group lagged.
We continued to focus on companies that we believed would benefit from improving fundamentals not fully recognized by the market. The Fund established a number of new positions across a variety of industries during the twelve-month period, including: hotel and timeshare company Wyndham Worldwide; cable television operator Comcast; drug store retailer Walgreens; energy companies El Paso and McDermott International; credit card provider Capital One Financial; industrial conglomerate General Electric; semiconductor manufacturer Intel; software developer Oracle; tobacco producer Philip Morris International; retailers Bed Bath & Beyond and Macy’s; industrial conglomerate Tyco International; containerboard company MeadWestvaco; telecom provider Verizon Communications; and utility companies ONEOK, Pinnacle West Capital and Calpine.
We eliminated several positions from the Fund, including: toy manufacturer Mattel; battery maker Energizer Holdings; energy companies Apache, Concho Resources, Schlumberger,
ConocoPhillips and Newfield Exploration; thrift Hudson City Bancorp; insurance companies PartnerRe and Aflac; diversified financial Bank of America; online trading company TD Ameritrade Holding; life science tools and testing companies Thermo Fisher Scientific and Life Technologies; pharmaceutical manufacturers Valeant Pharmaceuticals and Endo Pharmaceutical; industrial companies Parker-Hannifin and Cummins; semiconductor manufacturers QUALCOMM, Marvell Technology and ON Semiconductor; computer services provider Xerox; connector company Amphenol; software developer Check Point Software; materials companies Freeport-McMoRan Copper & Gold, Mosaic and Albemarle; industrial conglomerate Textron; airline Delta Air Lines; staffing provider Manpower; telecommunication companies Qwest Communications and AT&T; and utility companies Public Service Enterprise, PG&E and CenterPoint Energy.
Nuveen Mid Cap Value Fund
How did the Fund perform during the twelve-month period ended October 31, 2011?
The table in the Fund Performance and Expense Ratios section of this report provides Class A Share total returns for the Fund for the one-year, five-year and ten-year periods ended October 31, 2011. The Fund’s Class A Shares at net asset value (NAV) underperformed the Russell Midcap Value Index and the Lipper classification average over the twelve-month period.
What strategies were used to manage the Fund during the reporting period? How did these strategies influence performance?
The Fund seeks to provide long-term capital appreciation by investing primarily in the common stocks of companies with market capitalizations at the time of purchase between approximately $350 million and $14 billion. During the period, we continued to implement the Fund’s investment process of selecting mid-cap companies that we believed were undervalued relative to other companies in the same industry or market, that demonstrated improving fundamentals, and that exhibited a near-term catalyst that
could close the gap between market value and our perception of fair value. Generally, we sold a holding if the stock hit its price target, the company’s fundamentals or competitive position significantly deteriorated or if a better alternative existed in the marketplace.
While the Fund underperformed over this period, it did benefit from favorable security selection in the energy and materials sectors. Within energy, exploration and production companies Concho Resources and Pioneer Natural Resources posted strong advances due to accelerating production profiles and favorable energy prices. Integrated energy provider Williams Companies outperformed after announcing plans to separate its exploration business from its legacy pipeline business, while El Paso outperformed after being acquired by a larger competitor. Within the materials sector, chemical producers Celanese, Albemarle and PPG Industries benefited from improving market demand which allowed pricing to outpace higher feedstock costs.
Other stocks that had a positive impact on the Fund’s performance included aerospace supplies provider Goodrich, which agreed to be acquired by a larger competitor, and media company CBS, which benefited from robust advertising spending conditions and the network’s high viewership ratings. Also, specialty pharmaceutical producer Valeant Pharmaceuticals outperformed due to investor enthusiasm related to announced acquisitions. Specialty retailer Foot Locker benefited from an improvement in sales performance and profit margins. Finally, diversified energy operator ONEOK benefited from favorable conditions in commodity transportation and processing.
The Fund’s performance was negatively impacted by unfavorable stock selection in the technology, health care, consumer staples and financial sectors. An underweight allocation toward utilities also adversely impacted results. In technology, semiconductor manufacturer Marvell Technology underperformed due to market share losses in several key end markets. ON Semiconductor declined following the Japanese earthquake because of the company’s large exposure to that market. Xerox fell as a result of moderating growth as its end markets stabilized following a cyclical rebound. Online staffing provider Monster Worldwide declined following earnings results that were below expectations.
Within health care, service providers DaVita and Universal Health underperformed due to uncertainty related to government reimbursement for services, while capital equipment manufacturer Hill-Rom underperformed after highlighting softness in hospital capital equipment spending, especially in Europe. In the consumer staples sector, milk processor Dean Foods fell because of its limited ability to pass on higher raw milk costs. In the financial sector, asset manager Lazard underperformed as a result of declining asset levels, while life insurance carriers Lincoln National and Hartford Financial underperformed due to investor concern about the impact of capital market volatility on their investment portfolios.
We continued to look for companies that we believed would benefit from improving fundamentals not fully recognized by the market. The Fund established a number of new positions across a variety of industries during the twelve-month period, including: hotel and timeshare company Wyndham Worldwide; consumer products manufacturer Jarden; theatre operator Cinemark; auto and truck parts supplier Dana Holding; retailers Ascena Retail, Foot Locker and GameStop; food processors Corn Products International and Dean Foods; energy companies Oil States International, SM Energy and Bill Barrett
Group; financial firms SLM Corporation, Marsh & McLennan, Ace Limited and EastWest Bancorp; health care companies Humana, CareFusion, Hill-Rom and Impax Laboratories; industrial companies Agco Corporation, Werner Enterprises, Ingersoll-Rand, Parker-Hannifin and Fluor; materials producers MeadWestvaco and Packaging Corporation of America; technology companies Electronic Arts, Arrow Electronics, Amdocs Limited and Sandisk; and utility companies Pinnacle West, NV Energy, OGE Energy and American Water Works.
We eliminated several positions from the Fund during the period, including: advertising agency Interpublic Group; food processor Bunge Limited; soft drink producer Dr. Pepper Snapple; exploration companies Whiting Petroleum and Newfield Exploration; financial companies SunTrust Banks, Discover Financial and PartnerRe; industrial manufacturers Cummins, Eaton and Stanley Black & Decker; materials producers Albemarle, PPG Industries and CF Industries; technology producers Avnet, Marvell Technology and Xerox; telecommunications service provider Qwest Communications; and utilities Spectra Energy, Centerpoint Energy, Wisconsin Energy, Sempra Energy and CMS Energy.
Nuveen Small Cap Value Fund
How did the Fund perform during the twelve-month period ended October 31, 2011?
The table in the Fund Performance and Expense Ratios section of this report provides Class A Share total returns for the Fund for the one-year, five-year and ten-year periods ended October 31, 2011. The Fund’s Class A Shares at net asset value (NAV) outperformed the Russell 2000 Value Index and the Lipper classification average over the twelve-month period.
What strategies were used to manage the Fund during the reporting period? How did these strategies influence performance?
The Fund seeks to provide long-term capital appreciation by investing primarily in the common stocks of companies with market capitalizations of less than $3 billion at the time of purchase. During the twelve-month period, we continued to focus on building a well-diversified portfolio of small-cap stocks from companies that we believed had strengthening balance sheets and free cash flow characteristics. We also continued to target companies with what we thought were sound business models and strong competitive advantages that might gain market share opportunistically in the current environment. We remained committed to our approach of investing in quality companies that are trading at what we believe is a discount to both intrinsic and relative value metrics.
The Fund’s outperformance was primarily driven by bottom-up stock selection across nine of the ten sectors in which it invested during the fiscal year. From a top-down perspective, the Fund’s overweight position relative to the benchmark in the energy and materials sectors, in conjunction with its underweight stance in financials, also was beneficial. However, the Fund’s underweight position in both the utilities and consumer staples sectors was a detractor. Our solid stock selection was sufficient to override the Fund’s pro-cyclical tilt during a difficult market environment in 2011.
The top contributors to the Fund’s performance were well distributed across a number of sectors. For example, professional staffing company SFN Group outperformed after it was acquired by an international private firm looking to broaden its geographic footprint. Also, Sally Beauty Holdings, the leading distributor of brand-name beauty products to salon professionals, continued to benefit from solid organic sales growth. Buckeye Technologies, a specialty wood and cotton-based materials manufacturer, gained due to solid execution on cost and debt reduction combined with industry dynamics that allowed for a double-digit price increase. Triumph Group, a manufacturer and distributor of aircraft components and systems, outperformed based on solid execution, increased order rates for commercial aircraft and a strategic acquisition that broadened its product portfolio. Additionally, leading restaurant franchiser Domino’s Pizza continued to deliver steady sales growth from its domestic network. Meanwhile, the company’s international stores continued to grow on a same-store basis.
The primary drag on performance was the Fund’s cash exposure (approximately 1.9% at period end) in a strongly advancing market environment. Other individual detractors included MGIC Investment, a leading domestic mortgage insurer, which continued to struggle through the lackluster domestic housing market. Also, international air cargo service provider Atlas Air Worldwide stumbled due to the slowing global growth climate and the delay of new cargo plane deliveries. Office supply retailer OfficeMax had its sales and margins negatively impacted by a difficult environment for small businesses. Competitive pressures and strategic uncertainty caused us to exit the Fund’s position in OfficeMax. In addition, Cooper Tire & Rubber, a leading manufacturer of automobile tires, was caught in the crossfire of slowing demand due to economic uncertainty and greater input costs. Finally, Brandywine Realty Trust, a well-positioned, East Coast office and industrial Real Estate Investment Trust (REIT), was negatively impacted by the overall threat of a double-dip recession as the company continued to deliver solid leasing activity in a difficult market.
From a sector positioning standpoint, we continued to favor a pro-cyclical tilt. Therefore, the Fund was overweight relative to the benchmark in sectors where performance is closely linked to the business cycle, such as information technology, consumer discretionary, industrials and commodity-related sectors. We continue to believe that the economic environment will stabilize and expand at a moderate pace. As the year progressed, opportunities arose to alter the composition of the Fund’s pro-cyclical tilt to a greater relative emphasis in the energy and materials sectors, funded by a decrease in consumer discretionary and technology. This relative repositioning was a function of our bottom-up investment process. We continued to underweight the financials, consumer staples and utilities sectors in the Fund relative to its benchmark.
Risk Considerations
Mutual fund investing involves risk; principal loss is possible. Equity investments are subject to market risk; dividends are not guaranteed. Investments in small- and mid-cap companies are subject to greater volatility. Foreign investments involve additional risks, including currency fluctuation, political and economic instability, lack of liquidity and differing legal and accounting standards. These risks are magnified in emerging markets. Debt or fixed income securities are subject to credit risk and interest rate risk.
[THIS PAGE INTENTIONALLY LEFT BLANK]
Fund Performance and Expense Ratios (Unaudited)
The Fund Performance and Expense Ratios for each Fund are shown on the following eight pages.
Returns quoted represent past performance, which is no guarantee of future results. Current performance may be higher or lower than the performance shown. Investment returns and principal value will fluctuate so that when shares are redeemed, they may be worth more or less than their original cost. Returns without sales charges would be lower if the sales charge were included. Returns do not reflect the deduction of taxes that a shareholder would pay on Fund distributions or the redemption of Fund shares.
Returns may reflect a contractual agreement between certain Funds and the investment adviser to waive certain fees and expenses; see Notes to Financial Statements, Footnote 7 — Management Fees and Other Transactions with Affiliates for more information. In addition, returns may reflect a voluntary expense limitation by the Funds’ investment adviser that may be modified or discontinued at any time without notice. For the most recent month-end performance visit www.nuveen.com or call (800) 257-8787.
Returns reflect differences in sales charges and expenses, which are primarily differences in distribution and service fees. Fund returns assume reinvestment of dividends and capital gains.
Comparative index and Lipper return information is provided for the Funds’ Class A Shares at net asset value (NAV) only.
Effective January 18, 2011, Class R Shares and Class Y Shares, previously offered by FAF Advisors, Inc., were renamed Class R3 Shares and Class I Shares, respectively.
The expense ratios shown reflect the Funds’ total operating expenses (before fee waivers or expense reimbursements, if any) as shown in the Funds’ most recent prospectus. The expense ratios include management fees and other fees and expenses.
Fund Performance and Expense Ratios (Unaudited) (continued)
Nuveen Equity Income Fund
Refer to the first page of this Fund Performance and Expense Ratios section for further explanation of the information included within this page.
Fund Performance
Average Annual Total Returns as of October 31, 2011
| | | | | | | | | | | | |
| |
| | | Average Annual | |
| | | |
| | | 1-Year | | | 5-Year | | | 10-Year | |
Class A Shares at NAV | | | 7.28% | | | | 1.75% | | | | 4.60% | |
Class A Shares at maximum Offering Price | | | 1.09% | | | | 0.55% | | | | 3.98% | |
S&P 500 Index* | | | 8.09% | | | | 0.25% | | | | 3.69% | |
S&P 500 Dividend Only Stocks Index* | | | 8.78% | | | | -0.27% | | | | 2.58% | |
Lipper Equity Income Funds Classification Average* | | | 7.13% | | | | 0.80% | | | | 4.95% | |
| | | |
Class B Shares w/o CDSC** | | | 6.45% | | | | 0.99% | | | | 3.82% | |
Class B Shares w/CDSC** | | | 1.45% | | | | 0.83% | | | | 3.82% | |
Class C Shares | | | 6.42% | | | | 0.98% | | | | 3.81% | |
Class R3 Shares | | | 6.93% | | | | 1.47% | | | | 4.38% | |
Class I Shares | | | 7.56% | | | | 2.01% | | | | 4.86% | |
Latest Calendar Quarter – Average Annual Total Returns as of September 30, 2011
| | | | | | | | | | | | |
| |
| | | Average Annual | |
| | | |
| | | 1-Year | | | 5-Year | | | 10-Year | |
Class A Shares at NAV | | | -0.19% | | | | 0.24% | | | | 3.49% | |
Class A Shares at maximum Offering Price | | | -5.90% | | | | -0.94% | | | | 2.88% | |
Class B Shares w/o CDSC** | | | -0.92% | | | | -0.50% | | | | 2.72% | |
Class B Shares w/CDSC** | | | -5.84% | | | | -0.66% | | | | 2.72% | |
Class C Shares | | | -0.88% | | | | -0.50% | | | | 2.73% | |
Class R3 Shares | | | -0.44% | | | | -0.02% | | | | 3.30% | |
Class I Shares | | | 0.13% | | | | 0.50% | | | | 3.75% | |
Class A Shares have a maximum 5.75% sales charge (Offering Price). Class A Share purchases of $1 million or more are sold at net asset value without an up-front sales charge but may be subject to a contingent deferred sales charge (CDSC), also known as a back-end sales charge, if redeemed within twelve months of purchase. Class B Shares have a CDSC that begins at 5% for redemptions during the first year and declines periodically until after six years when the charge becomes 0%. Class B Shares automatically convert to Class A Shares eight years after purchase. Class C Shares have a 1% CDSC for redemptions within less than twelve months, which is not reflected in the one-year total return. Class R3 Shares have no sales charge and are available to only certain retirement plans. Class I Shares have no sales charge and may be purchased under limited circumstances or by specified classes of investors.
Expense Ratios as of Most Recent Prospectus
| | | | |
| |
| | | Expense
Ratios | |
Class A Shares | | | 1.15% | |
Class B Shares | | | 1.90% | |
Class C Shares | | | 1.90% | |
Class R3 Shares | | | 1.40% | |
Class I Shares | | | 0.90% | |
| * | Refer to the Glossary of Terms Used in this Report for definitions. |
| ** | Class B Shares are available only upon the exchange of Class B Shares from another Nuveen mutual fund for which U.S. Bancorp Fund Services, LLC serves as transfer agent or for purposes of dividend reinvestment, but Class B Shares are not available for new accounts or for additional investment into existing accounts. |
Growth of an Assumed $10,000 Investment as of October 31, 2011 – Class A Shares
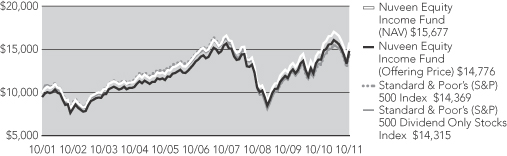
The graph does not reflect the deduction of taxes that a shareholder may pay on Fund distributions or the redemption of Fund shares.
Fund Performance and Expense Ratios (Unaudited) (continued)
Nuveen Large Cap Value Fund
Refer to the first page of this Fund Performance and Expense Ratios section for further explanation of the information included within this page.
Fund Performance
Average Annual Total Returns as of October 31, 2011
| | | | | | | | | | | | |
| |
| | | Average Annual | |
| | | |
| | | 1-Year | | | 5-Year | | | 10-Year | |
Class A Shares at NAV | | | 1.98% | | | | -3.07% | | | | 2.45% | |
Class A Shares at maximum Offering Price | | | -3.86% | | | | -4.21% | | | | 1.85% | |
Russell 1000 Value Index* | | | 6.16% | | | | -2.05% | | | | 4.57% | |
Lipper Large-Cap Value Funds Classification Average* | | | 4.15% | | | | -2.05% | | | | 3.60% | |
| | | |
Class B Shares w/o CDSC** | | | 1.22% | | | | -3.79% | | | | 1.69% | |
Class B Shares w/CDSC** | | | -3.78% | | | | -3.94% | | | | 1.69% | |
Class C Shares | | | 1.28% | | | | -3.79% | | | | 1.68% | |
Class R3 Shares | | | 1.74% | | | | -3.32% | | | | 2.25% | |
Class I Shares | | | 2.22% | | | | -2.83% | | | | 2.70% | |
Latest Calendar Quarter – Average Annual Total Returns as of September 30, 2011
| | | | | | | | | | | | |
| |
| | | Average Annual | |
| | | |
| | | 1-Year | | | 5-Year | | | 10-Year | |
Class A Shares at NAV | | | -6.91% | | | | -4.90% | | | | 1.27% | |
Class A Shares at maximum Offering Price | | | -12.24% | | | | 6.02% | | | | 0.68% | |
Class B Shares w/o CDSC** | | | -7.65% | | | | -5.62% | | | | 0.52% | |
Class B Shares w/CDSC** | | | -12.25% | | | | -5.77% | | | | 0.52% | |
Class C Shares | | | -7.59% | | | | -5.60% | | | | 0.51% | |
Class R3 Shares | | | -7.12% | | | | -5.13% | | | | 1.09% | |
Class I Shares | | | -6.71% | | | | -4.67% | | | | 1.53% | |
Class A Shares have a maximum 5.75% sales charge (Offering Price). Class A Share purchases of $1 million or more are sold at net asset value without an up-front sales charge but may be subject to a contingent deferred sales charge (CDSC), also known as a back-end sales charge, if redeemed within twelve months of purchase. Class B Shares have a CDSC that begins at 5% for redemptions during the first year and declines periodically until after six years when the charge becomes 0%. Class B Shares automatically convert to Class A Shares eight years after purchase. Class C Shares have a 1% CDSC for redemptions within less than twelve months, which is not reflected in the one-year total return. Class R3 Shares have no sales charge and are available to only certain retirement plans. Class I Shares have no sales charge and may be purchased under limited circumstances or by specified classes of investors.
Expense Ratios as of Most Recent Prospectus
| | | | |
| |
| | | Expense
Ratios | |
Class A Shares | | | 1.21% | |
Class B Shares | | | 1.96% | |
Class C Shares | | | 1.96% | |
Class R3 Shares | | | 1.46% | |
Class I Shares | | | 0.96% | |
| * | Refer to the Glossary of Terms Used in this Report for definitions. |
| ** | Class B Shares are available only upon the exchange of Class B Shares from another Nuveen mutual fund for which U.S. Bancorp Fund Services, LLC serves as transfer agent or for purposes of dividend reinvestment, but Class B Shares are not available for new accounts or for additional investment into existing accounts. |
Growth of an Assumed $10,000 Investment as of October 31, 2011 – Class A Shares
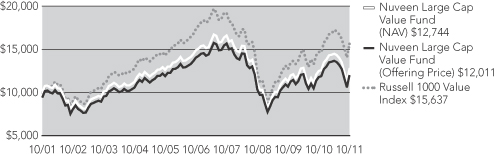
The graph does not reflect the deduction of taxes that a shareholder may pay on Fund distributions or the redemption of Fund shares.
Fund Performance and Expense Ratios (Unaudited) (continued)
Nuveen Mid Cap Value Fund
Refer to the first page of this Fund Performance and Expense Ratios section for further explanation of the information included within this page.
Fund Performance
Average Annual Total Returns as of October 31, 2011
| | | | | | | | | | | | |
| |
| | | Average Annual | |
| | | |
| | | 1-Year | | | 5-Year | | | 10-Year | |
Class A Shares at NAV | | | -0.64% | | | | -0.60% | | | | 7.27% | |
Class A Shares at maximum Offering Price | | | -6.33% | | | | -1.77% | | | | 6.64% | |
Russell Midcap Value Index* | | | 5.83% | | | | 0.73% | | | | 8.76% | |
Lipper Mid-Cap Value Funds Classification Average* | | | 4.19% | | | | 0.39% | | | | 7.63% | |
| | | |
Class B Shares w/o CDSC** | | | -1.35% | | | | -1.33% | | | | 6.49% | |
Class B Shares w/CDSC** | | | -6.27% | | | | -1.50% | | | | 6.49% | |
Class C Shares | | | -1.35% | | | | -1.34% | | | | 6.47% | |
Class R3 Shares | | | -0.87% | | | | -0.84% | | | | 7.09% | |
Class I Shares | | | -0.42% | | | | -0.35% | | | | 7.54% | |
Latest Calendar Quarter – Average Annual Total Returns as of September 30, 2011
| | | | | | | | | | | | |
| |
| | | Average Annual | |
| | | |
| | | 1-Year | | | 5-Year | | | 10-Year | |
Class A Shares at NAV | | | -8.68% | | | | -2.45% | | | | 6.12% | |
Class A Shares at maximum Offering Price | | | -13.94% | | | | -3.60% | | | | 5.49% | |
Class B Shares w/o CDSC** | | | -9.29% | | | | -3.17% | | | | 5.34% | |
Class B Shares w/CDSC** | | | -13.81% | | | | -3.34% | | | | 5.34% | |
Class C Shares | | | -9.36% | | | | -3.18% | | | | 5.33% | |
Class R3 Shares | | | -8.84% | | | | -2.69% | | | | 5.94% | |
Class I Shares | | | -8.43% | | | | -2.21% | | | | 6.39% | |
Class A Shares have a maximum 5.75% sales charge (Offering Price). Class A Share purchases of $1 million or more are sold at net asset value without an up-front sales charge but may be subject to a contingent deferred sales charge (CDSC), also known as a back-end sales charge, if redeemed within twelve months of purchase. Class B Shares have a CDSC that begins at 5% for redemptions during the first year and declines periodically until after six years when the charge becomes 0%. Class B Shares automatically convert to Class A Shares eight years after purchase. Class C Shares have a 1% CDSC for redemptions within less than twelve months, which is not reflected in the one-year total return. Class R3 Shares have no sales charge and are available to only certain retirement plans. Class I Shares have no sales charge and may be purchased under limited circumstances or by specified classes of investors.
| | | | | | | | |
| Expense Ratios as of Most Recent Prospectus | |
| | |
| | | Gross
Expense
Ratios | | | Net
Expense
Ratios | |
Class A Shares | | | 1.39% | | | | 1.34% | |
Class B Shares | | | 2.14% | | | | 2.09% | |
Class C Shares | | | 2.14% | | | | 2.09% | |
Class R3 Shares | | | 1.64% | | | | 1.59% | |
Class I Shares | | | 1.14% | | | | 1.09% | |
The Fund’s adviser has contractually agreed to waive fees and reimburse expenses through February 29, 2012, so that total annual Fund operating expenses, after waivers and excluding any acquired Fund fees and expenses, do not exceed 1.34%, 2.09%, 2.09%, 1.59% and 1.09%, respectively, for Class A, Class B, Class C, Class R3 and Class I Shares. Fee waivers and expense reimbursements will not be terminated prior to that time without with approval of the Fund’s Board of Directors.
| * | Refer to the Glossary of Terms Used in this Report for definitions. |
| ** | Class B Shares are available only upon the exchange of Class B Shares from another Nuveen mutual fund for which U.S. Bancorp Fund Services, LLC serves as transfer agent or for purposes of dividend reinvestment, but Class B Shares are not available for new accounts or for additional investment into existing accounts. |
Growth of an Assumed $10,000 Investment as of October 31, 2011 – Class A Shares
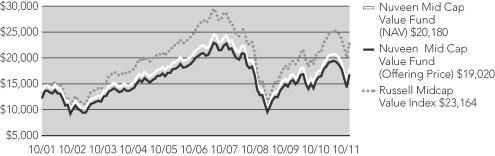
The graph does not reflect the deduction of taxes that a shareholder may pay on Fund distributions or the redemption of Fund shares.
Fund Performance and Expense Ratios (Unaudited) (continued)
Nuveen Small Cap Value Fund
Refer to the first page of this Fund Performance and Expense Ratios section for further explanation of the information included within this page.
Fund Performance
Average Annual Total Returns as of October 31, 2011
| | | | | | | | | | | | |
| |
| | | Average Annual | |
| | | |
| | | 1-Year | | | 5-Year | | | 10-Year | |
Class A Shares at NAV | | | 10.14% | | | | 0.07% | | | | 7.39% | |
Class A Shares at maximum Offering Price | | | 3.76% | | | | -1.11% | | | | 6.76% | |
Russell 2000 Value Index* | | | 3.54% | | | | -1.42% | | | | 7.63% | |
Lipper Small-Cap Value Funds Classification Average* | | | 4.25% | | | | 0.36% | | | | 8.01% | |
| | | |
Class C Shares | | | 9.36% | | | | -0.67% | | | | 6.60% | |
Class R3 Shares | | | 9.89% | | | | -0.16% | | | | 7.21% | |
Class I Shares | | | 10.43% | | | | 0.32% | | | | 7.66% | |
Latest Calendar Quarter – Average Annual Total Returns as of September 30, 2011
| | | | | | | | | | | | |
| |
| | | Average Annual | |
| | | |
| | | 1-Year | | | 5-Year | | | 10-Year | |
Class A Shares at NAV | | | -0.10% | | | | -2.19% | | | | 5.99% | |
Class A Shares at maximum Offering Price | | | -5.87% | | | | -3.34% | | | | 5.36% | |
Class C Shares | | | -0.94% | | | | -2.92% | | | | 5.19% | |
Class R3 Shares | | | -0.42% | | | | -2.42% | | | | 5.81% | |
Class I Shares | | | 0.00% | | | | -1.97% | | | | 6.24% | |
Class A Shares have a maximum 5.75% sales charge (Offering Price). Class A Share purchases of $1 million or more are sold at net asset value without an up-front sales charge but may be subject to a contingent deferred sales charge (CDSC), also known as a back-end sales charge, if redeemed within twelve months of purchase. Class C Shares have a 1% CDSC for redemptions within less than twelve months, which is not reflected in the one-year total return. Class R3 Shares have no sales charge and are available to only certain retirement plans. Class I Shares have no sales charge and may be purchased under limited circumstances or by specified classes of investors.
Expense Ratios as of Most Recent Prospectus
| | | | | | | | |
| | |
| | | Gross
Expense
Ratios | | | Net
Expense
Ratios | |
Class A Shares | | | 1.84% | | | | 1.61% | |
Class C Shares | | | 2.59% | | | | 2.36% | |
Class R3 Shares | | | 2.09% | | | | 1.86% | |
Class I Shares | | | 1.59% | | | | 1.36% | |
The Fund’s adviser has contractually agreed to waive fees and reimburse expenses through February 29, 2012, so that total annual Fund operating expenses, after waivers and excluding any acquired Fund fees and expenses, do not exceed 1.50%, 2.25%, 1.75% and 1.25%, respectively, for Class A, Class C, Class R3 and Class I Shares. Fee waivers and expense reimbursements will not be terminated prior to that time without with approval of the Fund’s Board of Directors.
| * | Refer to the Glossary of Terms Used in this Report for definitions. |
Growth of an Assumed $10,000 Investment as of October 31, 2011 – Class A Shares
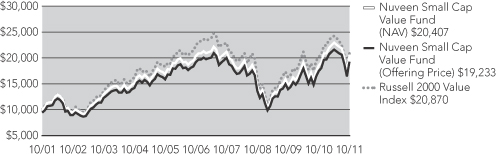
The graph does not reflect the deduction of taxes that a shareholder may pay on Fund distributions or the redemption of Fund shares.
Holding Summaries (Unaudited) as of October 31, 2011
This data relates to the securities held in each Fund’s portfolio of investments. It should not be construed as a measure of performance for the Fund itself.
Nuveen Equity Income Fund
Portfolio Allocation1

Nuveen Large Cap Value Fund
Portfolio Allocation1

Nuveen Mid Cap Value Fund
Portfolio Allocation1
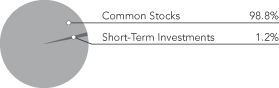
Nuveen Small Cap Value Fund
Portfolio Allocation1
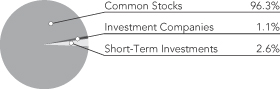
| | | | |
Portfolio Composition1 | |
| Financials | | | 15.7% | |
| Information Technology | | | 14.7% | |
| Energy | | | 14.1% | |
| Industrials | | | 10.6% | |
| Consumer Discretionary | | | 10.1% | |
| Health Care | | | 9.8% | |
| Consumer Staples | | | 8.2% | |
| Materials | | | 6.1% | |
| Telecommunication Services | | | 5.9% | |
| Short-Term Investments | | | 1.8% | |
| Other | | | 3.0% | |
| | | | |
| Portfolio Composition1 | |
| Financials | | | 22.3% | |
| Health Care | | | 14.5% | |
| Energy | | | 13.0% | |
| Consumer Discretionary | | | 11.2% | |
| Information Technology | | | 8.4% | |
| Industrials | | | 7.7% | |
| Consumer Staples | | | 7.0% | |
| Utilities | | | 6.6% | |
| Telecommunication Services | | | 5.2% | |
| Short-Term Investments | | | 0.8% | |
| Other | | | 3.3% | |
| | | | |
| Portfolio Composition1 | |
| Financials | | | 26.0% | |
| Consumer Discretionary | | | 16.3% | |
| Utilities | | | 11.9% | |
| Industrials | | | 9.3% | |
| Energy | | | 8.5% | |
| Health Care | | | 7.3% | |
| Information Technology | | | 6.8% | |
| Materials | | | 5.6% | |
| Consumer Staples | | | 5.5% | |
| Short-Term Investment | | | 1.2% | |
| Other | | | 1.6% | |
| | | | |
| Portfolio Composition1 | |
| Financials | | | 27.0% | |
| Industrials | | | 16.7% | |
| Information Technology | | | 15.3% | |
| Consumer Discretionary | | | 11.9% | |
| Materials | | | 6.5% | |
| Energy | | | 6.2% | |
| Health Care | | | 5.6% | |
| Investment Companies | | | 1.1% | |
| Short-Term Investment | | | 2.6% | |
| Other | | | 7.1% | |
| | | | |
| Top Five Common Stock Holdings2 | |
| Chevron | | | 3.3% | |
| Verizon Communications | | | 3.1% | |
| Exxon Mobil | | | 2.9% | |
| Pfizer | | | 2.7% | |
| Royal Dutch Petroleum, ADR | | | 2.4% | |
| | | | |
| Top Five Common Stock Holdings2 | |
| JPMorgan Chase | | | 3.6% | |
| Pfizer | | | 3.6% | |
| Verizon Communications | | | 3.3% | |
| Johnson & Johnson | | | 2.7% | |
| ACE | | | 2.6% | |
| | | | |
| Top Five Common Stock Holdings2 | |
| Pinnacle West Capital | | | 2.0% | |
| Macy’s | | | 2.0% | |
| NV Energy | | | 2.0% | |
| Ameriprise Financial | | | 2.0% | |
| Unum Group | | | 1.9% | |
| | | | |
| Top Five Common Stock Holdings2 | |
| Triumph Group | | | 2.4% | |
| Sally Beauty Holdings | | | 1.9% | |
| Affiliated Managers Group | | | 1.7% | |
| Home Properties – REIT | | | 1.7% | |
| Group 1 Automotive | | | 1.7% | |
| 1 | As a percentage of total investments (excluding investments purchased with collateral from securities lending) as of October 31, 2011. Holdings are subject to change. |
| 2 | As a percentage of total common stocks as of October 31, 2011. Holdings are subject to change. |
Expense Examples (Unaudited)
As a shareholder of one or more of the Funds, you incur two types of costs: (1) transaction costs, including up-front and back-end sales charges (loads) or redemption fees, where applicable; and (2) ongoing costs, including management fees; distribution and service (12b-1) fees, where applicable; and other Fund expenses. The Examples below are intended to help you understand your ongoing costs (in dollars) of investing in the Funds and to compare these costs with the ongoing costs of investing in other mutual funds.
The Examples below are based on an investment of $1,000 invested at the beginning of the period and held for the period.
The information under “Actual Performance,” together with the amount you invested, allows you to estimate actual expenses incurred over the reporting period. Simply divide your account value by $1,000 (for example, an $8,600 account value divided by $1,000 = 8.60) and multiply the result by the cost shown for your share class, in the row entitled “Expenses Incurred During Period” to estimate the expenses incurred on your account during this period.
The information under “Hypothetical Performance,” provides information about hypothetical account values and hypothetical expenses based on the respective Fund’s actual expense ratio and an assumed rate of return of 5% per year before expenses, which is not the Fund’s actual return. The hypothetical account values and expenses may not be used to estimate the actual ending account balance or expense you incurred for the period. You may use this information to compare the ongoing costs of investing in the Fund and other funds. To do so, compare this 5% hypothetical example with the 5% hypothetical examples that appear in the shareholder reports of the other funds.
Please note that the expenses shown in the table are meant to highlight your ongoing costs only and do not reflect any transaction costs. Therefore, the hypothetical information is useful in comparing ongoing costs only, and will not help you determine the relative total costs of owning different funds or share classes. In addition, if these transaction costs were included, your costs would have been higher.
Nuveen Equity Income Fund
| | | | | | | | | | | | | | | | | | | | | | | | | | | | | | | | | | | | | | | | | | |
| | | Actual Performance | | | | | Hypothetical Performance | |
| | | A Shares | | | B Shares | | | C Shares | | | R3 Shares | | | I Shares | | | | | A Shares | | | B Shares | | | C Shares | | | R3 Shares | | | I Shares | |
| Beginning Account Value (5/1/11) | | $ | 1,000.00 | | | $ | 1,000.00 | | | $ | 1,000.00 | | | $ | 1,000.00 | | | $ | 1,000.00 | | | | | $ | 1,000.00 | | | $ | 1,000.00 | | | $ | 1,000.00 | | | $ | 1,000.00 | | | $ | 1,000.00 | |
| Ending Account Value (10/31/11) | | $ | 922.20 | | | $ | 918.50 | | | $ | 918.40 | | | $ | 920.10 | | | $ | 923.30 | | | | | $ | 1,019.41 | | | $ | 1,015.63 | | | $ | 1,015.63 | | | $ | 1,018.15 | | | $ | 1,020.67 | |
| Expenses Incurred During Period | | $ | 5.57 | | | $ | 9.19 | | | $ | 9.19 | | | $ | 6.78 | | | $ | 4.36 | | | | | $ | 5.85 | | | $ | 9.65 | | | $ | 9.65 | | | $ | 7.12 | | | $ | 4.58 | |
For each class of the Fund, expenses are equal to the Fund’s annualized net expense ratio of 1.15%, 1.90%, 1.90%, 1.40% and ..90% for Classes A, B, C, R3 and I, respectively, multiplied by the average account value over the period, multiplied by 184/365 (to reflect the one-half year period).
Nuveen Large Cap Value Fund
| | | | | | | | | | | | | | | | | | | | | | | | | | | | | | | | | | | | | | | | | | |
| | | Actual Performance | | | | | Hypothetical Performance | |
| | | A Shares | | | B Shares | | | C Shares | | | R3 Shares | | | I Shares | | | | | A Shares | | | B Shares | | | C Shares | | | R3 Shares | | | I Shares | |
| Beginning Account Value (5/1/11) | | $ | 1,000.00 | | | $ | 1,000.00 | | | $ | 1,000.00 | | | $ | 1,000.00 | | | $ | 1,000.00 | | | | | $ | 1,000.00 | | | $ | 1,000.00 | | | $ | 1,000.00 | | | $ | 1,000.00 | | | $ | 1,000.00 | |
| Ending Account Value (10/31/11) | | $ | 878.20 | | | $ | 875.00 | | | $ | 875.20 | | | $ | 876.90 | | | $ | 879.40 | | | | | $ | 1,018.80 | | | $ | 1,015.02 | | | $ | 1,015.02 | | | $ | 1,017.54 | | | $ | 1,020.06 | |
| Expenses Incurred During Period | | $ | 6.01 | | | $ | 9.55 | | | $ | 9.55 | | | $ | 7.14 | | | $ | 4.83 | | | | | $ | 6.46 | | | $ | 10.26 | | | $ | 10.26 | | | $ | 7.73 | | | $ | 5.19 | |
For each class of the Fund, expenses are equal to the Fund’s annualized net expense ratio of 1.27%, 2.02%, 2.02%, 1.52% and 1.02% for Classes A, B, C, R3 and I, respectively, multiplied by the average account value over the period, multiplied by 184/365 (to reflect the one-half year period).
Nuveen Mid Cap Value Fund
| | | | | | | | | | | | | | | | | | | | | | | | | | | | | | | | | | | | | | | | | | |
| | | Actual Performance | | | | | Hypothetical Performance | |
| | | A Shares | | | B Shares | | | C Shares | | | R3 Shares | | | I Shares | | | | | A Shares | | | B Shares | | | C Shares | | | R3 Shares | | | I Shares | |
| Beginning Account Value (5/1/11) | | $ | 1,000.00 | | | $ | 1,000.00 | | | $ | 1,000.00 | | | $ | 1,000.00 | | | $ | 1,000.00 | | | | | $ | 1,000.00 | | | $ | 1,000.00 | | | $ | 1,000.00 | | | $ | 1,000.00 | | | $ | 1,000.00 | |
| Ending Account Value (10/31/11) | | $ | 855.10 | | | $ | 852.20 | | | $ | 852.20 | | | $ | 854.30 | | | $ | 856.30 | | | | | $ | 1,018.45 | | | $ | 1,014.68 | | | $ | 1,014.73 | | | $ | 1,017.24 | | | $ | 1,019.51 | |
| Expenses Incurred During Period | | $ | 6.27 | | | $ | 9.76 | | | $ | 9.76 | | | $ | 7.43 | | | $ | 5.10 | | | | | $ | 6.75 | | | $ | 10.53 | | | $ | 10.48 | | | $ | 7.96 | | | $ | 5.69 | |
For each class of the Fund, expenses are equal to the Fund’s annualized net expense ratio of 1.34%, 2.09%, 2.09%, 1.59% and 1.09% for Classes A, B, C, R3 and I, respectively, multiplied by the average account value over the period, multiplied by 184/365 (to reflect the one-half year period).
Expense Examples (Unaudited) (continued)
Nuveen Small Cap Value Fund
| | | | | | | | | | | | | | | | | | | | | | | | | | | | | | | | | | |
| | | Actual Performance | | | | | Hypothetical Performance | |
| | | A Shares | | | C Shares | | | R3 Shares | | | I Shares | | | | | A Shares | | | C Shares | | | R3 Shares | | | I Shares | |
| Beginning Account Value (5/1/11) | | $ | 1,000.00 | | | $ | 1,000.00 | | | $ | 1,000.00 | | | $ | 1,000.00 | | | | | $ | 1,000.00 | | | $ | 1,000.00 | | | $ | 1,000.00 | | | $ | 1,000.00 | |
| Ending Account Value (10/31/11) | | $ | 889.80 | | | $ | 886.60 | | | $ | 888.80 | | | $ | 890.70 | | | | | $ | 1,017.64 | | | $ | 1,013.86 | | | $ | 1,016.38 | | | $ | 1,018.90 | |
| Expenses Incurred During Period | | $ | 7.14 | | | $ | 10.70 | | | $ | 8.33 | | | $ | 5.96 | | | | | $ | 7.53 | | | $ | 11.42 | | | $ | 8.89 | | | $ | 6.36 | |
For each class of the Fund, expenses are equal to the Fund’s annualized net expense ratio of 1.50%, 2.25%, 1.75% and 1.25% for Classes A, C, R3 and I, respectively, multiplied by the average account value over the period, multiplied by 184/365 (to reflect the one-half year period).
Report of
Independent Registered Public Accounting Firm
The Board of Directors and Shareholders
Nuveen Equity Income Fund (formerly First American Equity Income Fund)
Nuveen Large Cap Value Fund (formerly First American Large Cap Value Fund)
Nuveen Mid Cap Value Fund (formerly First American Mid Cap Value Fund)
Nuveen Small Cap Value Fund (formerly First American Small Cap Value Fund)
We have audited the accompanying statements of assets and liabilities, including the portfolios of investments of Nuveen Equity Income Fund (formerly First American Equity Income Fund), Nuveen Large Cap Value Fund (formerly First American Large Cap Value Fund), Nuveen Mid Cap Value Fund (formerly First American Mid Cap Value Fund), and Nuveen Small Cap Value Fund (formerly First American Small Cap Value Fund) (series of Nuveen Investment Funds, Inc., formerly First American Investment Funds, Inc.) (collectively, the ”Funds”) as of October 31, 2011, and the related statements of operations for the year then ended, the statements of changes in net assets for each of the two years in the period then ended, and the financial highlights for each of the periods indicated therein. These financial statements and financial highlights are the responsibility of the Funds’ management. Our responsibility is to express an opinion on these financial statements and financial highlights based on our audits.
We conducted our audits in accordance with the standards of the Public Company Accounting Oversight Board (United States). Those standards require that we plan and perform the audit to obtain reasonable assurance about whether the financial statements and financial highlights are free of material misstatement. We were not engaged to perform an audit of the Funds’ internal control over financial reporting. Our audits included consideration of internal control over financial reporting as a basis for designing audit procedures that are appropriate in the circumstances, but not for the purpose of expressing an opinion on the effectiveness of the Funds’ internal control over financial reporting. Accordingly, we express no such opinion. An audit also includes examining, on a test basis, evidence supporting the amounts and disclosures in the financial statements and financial highlights, assessing the accounting principles used and significant estimates made by management, and evaluating the overall financial statement presentation. Our procedures included confirmation of securities owned as of October 31, 2011, by correspondence with the custodian and brokers or by other appropriate auditing procedures where replies from brokers were not received. We believe that our audits provide a reasonable basis for our opinion.
In our opinion, the financial statements and financial highlights referred to above present fairly, in all material respects, the financial position of Nuveen Equity Income Fund (formerly First American Equity Income Fund), Nuveen Large Cap Value Fund (formerly First American Large Cap Value Fund), Nuveen Mid Cap Value Fund (formerly First American Mid Cap Value Fund), and Nuveen Small Cap Value Fund (formerly First American Small Cap Value Fund) at October 31, 2011, the results of their operations for the year then ended, the changes in their net assets for each of the two years in the period then ended, and the financial highlights for each of the periods indicated therein in conformity with U.S. generally accepted accounting principles.

Chicago, Illinois
December 28, 2011
Portfolio of Investments
Nuveen Equity Income Fund
(formerly known as First American Equity Income Fund)
October 31, 2011
| | | | | | | | | | | | | | |
| Shares | | | Description p | | | | | | | | Value | |
| | | | | | | | | | | | | | |
| | | | COMMON STOCKS – 99.0% | | | | | | | | | | |
| | | | | |
| | | | Consumer Discretionary – 10.2% | | | | | | | | | | |
| | | | | |
| | 381,702 | | | Brunswick q | | | | | | | | $ | 6,740,857 | |
| | | | | |
| | 577,062 | | | Cinemark Holdings q | | | | | | | | | 11,927,871 | |
| | | | | |
| | 581,344 | | | Foot Locker q | | | | | | | | | 12,708,180 | |
| | | | | |
| | 244,915 | | | Hasbro | | | | | | | | | 9,321,465 | |
| | | | | |
| | 329,956 | | | Home Depot q | | | | | | | | | 11,812,425 | |
| | | | | |
| | 342,240 | | | Mattel | | | | | | | | | 9,664,858 | |
| | | | | |
| | 191,750 | | | McDonald’s | | | | | | | | | 17,803,988 | |
| | | | | |
| | 335,384 | | | Starbucks | | | | | | | | | 14,200,159 | |
| | | | | |
| | 280,002 | | | Yum! Brands | | | | | | | | | 14,999,707 | |
| | | | Total Consumer Discretionary | | | | | | | | | 109,179,510 | |
| | | | Consumer Staples – 8.3% | | | | | | | | | | |
| | | | | |
| | 396,790 | | | Altria Group q | | | | | | | | | 10,931,565 | |
| | | | | |
| | 288,982 | | | ConAgra Foods | | | | | | | | | 7,319,914 | |
| | | | | |
| | 174,828 | | | Kimberly-Clark | | | | | | | | | 12,187,260 | |
| | | | | |
| | 456,766 | | | Kraft Foods, Class A | | | | | | | | | 16,069,028 | |
| | | | | |
| | 235,216 | | | Philip Morris International | | | | | | | | | 16,434,542 | |
| | | | | |
| | 404,054 | | | Sysco | | | | | | | | | 11,200,377 | |
| | | | | |
| | 432,837 | | | Unilever q | | | | | | | | | 14,945,862 | |
| | | | Total Consumer Staples | | | | | | | | | 89,088,548 | |
| | | | Energy – 14.2% | | | | | | | | | | |
| | | | | |
| | 174,181 | | | Anadarko Petroleum | | | | | | | | | 13,673,209 | |
| | | | | |
| | 338,018 | | | Chevron q | | | | | | | | | 35,508,791 | |
| | | | | |
| | 159,078 | | | ConocoPhillips | | | | | | | | | 11,079,783 | |
| | | | | |
| | 339,723 | | | Enbridge Energy Partners q | | | | | | | | | 10,341,168 | |
| | | | | |
| | 358,245 | | | Exterran Partners q | | | | | | | | | 8,812,827 | |
| | | | | |
| | 393,579 | | | Exxon Mobil | | | | | | | | | 30,734,584 | |
| | | | | |
| | 94,205 | | | Occidental Petroleum | | | | | | | | | 8,755,413 | |
| | | | | |
| | 356,187 | | | Royal Dutch Petroleum, ADR q | | | | | | | | | 25,257,220 | |
| | | | | |
| | 117,082 | | | Schlumberger | | | | | | | | | 8,602,014 | |
| | | | Total Energy | | | | | | | | | 152,765,009 | |
| | | | Financials – 15.9% | | | | | | | | | | |
| | | | | |
| | 408,127 | | | Aflac q | | | | | | | | | 18,402,446 | |
| | | | | |
| | 644,406 | | | Annaly Capital Management – REIT q | | | | | | | | | 10,858,241 | |
| | | | | |
| | 465,594 | | | BankUnited q | | | | | | | | | 10,145,293 | |
| | | | | |
| | 286,495 | | | Capital One Financial q | | | | | | | | | 13,081,362 | |
| | | | | |
| | 214,259 | | | Community Bank System q | | | | | | | | | 5,476,460 | |
| | | | | |
| | 542,685 | | | Fifth Third Bancorp | | | | | | | | | 6,517,647 | |
| | | | | |
| | 44,557 | | | Goldman Sachs Group | | | | | | | | | 4,881,219 | |
| | | | | |
| | 722,343 | | | JPMorgan Chase | | | | | | | | | 25,108,643 | |
| | | | | |
| | 164,409 | | | Liberty Property Trust – REIT q | | | | | | | | | 5,261,088 | |
| | | | | |
| | 110,343 | | | Mid-America Apartment Communities – REIT q | | | | | | | | | 6,885,403 | |
| | | | | |
| | 197,780 | | | National Retail Properties – REIT | | | | | | | | | 5,389,505 | |
| | | | | |
| | 772,938 | | | Old Republic International q | | | | | | | | | 6,832,772 | |
| | | | | |
| | 350,431 | | | Prudential Financial q | | | | | | | | | 18,993,360 | |
| | | | | |
| | 730,400 | | | Redwood Trust – REIT q | | | | | | | | | 8,487,248 | |
| | | | | |
| | 451,778 | | | State Street q | | | | | | | | | 18,247,313 | |
| | | | | |
| | 100,215 | | | Ventas – REIT q | | | | | | | | | 5,572,956 | |
| | | | Total Financials | | | | | | | | | 170,140,956 | |
| | | | | | | | | | | | | | |
| Shares | | | Description p | | | | | | | | Value | |
| | | | | | | | | | | | | | |
| | | | Health Care – 9.8% | | | | | | | | | | |
| | | | | |
| | 337,083 | | | Abbott Laboritories | | | | | | | | $ | 18,158,661 | |
| | | | | |
| | 386,050 | | | Bristol-Myers Squibb q | | | | | | | | | 12,195,320 | |
| | | | | |
| | 279,723 | | | GlaxoSmithKline, ADR | | | | | | | | | 12,528,793 | |
| | | | | |
| | 109,265 | | | Humana | | | | | | | | | 9,275,506 | |
| | | | | |
| | 280,556 | | | Johnson & Johnson q | | | | | | | | | 18,065,001 | |
| | | | | |
| | 1,493,236 | | | Pfizer | | | | | | | | | 28,759,725 | |
| | | | | |
| | 132,740 | | | UnitedHealth Group | | | | | | | | | 6,370,193 | |
| | | | Total Health Care | | | | | | | | | 105,353,199 | |
| | | | Industrials – 10.7% | | | | | | | | | | |
| | | | | |
| | 195,404 | | | 3M q | | | | | | | | | 15,440,824 | |
| | | | | |
| | 128,284 | | | Boeing | | | | | | | | | 8,439,804 | |
| | | | | |
| | 379,252 | | | Emerson Electric q | | | | | | | | | 18,249,606 | |
| | | | | |
| | 123,615 | | | General Dynamics | | | | | | | | | 7,934,847 | |
| | | | | |
| | 1,312,530 | | | General Electric | | | | | | | | | 21,932,376 | |
| | | | | |
| | 80,906 | | | Hubbell, Class B | | | | | | | | | 4,837,370 | |
| | | | | |
| | 391,672 | | | Republic Services | | | | | | | | | 11,146,985 | |
| | | | | |
| | 145,030 | | | United Parcel Service, Class B q | | | | | | | | | 10,186,907 | |
| | | | | |
| | 210,641 | | | United Technologies q | | | | | | | | | 16,425,785 | |
| | | | Total Industrials | | | | | | | | | 114,594,504 | |
| | | | Information Technology – 14.8% | | | | | | | | | | |
| | | | | |
| | 223,784 | | | Automatic Data Processing q | | | | | | | | | 11,710,617 | |
| | | | | |
| | 814,206 | | | Cisco Systems | | | | | | | | | 15,087,237 | |
| | | | | |
| | 781,205 | | | Intel | | | | | | | | | 19,170,771 | |
| | | | | |
| | 43,971 | | | MasterCard, Class A | | | | | | | | | 15,268,490 | |
| | | | | |
| | 499,776 | | | Maxim Integrated Products q | | | | | | | | | 13,074,140 | |
| | | | | |
| | 767,965 | | | Microsoft | | | | | | | | | 20,450,908 | |
| | | | | |
| | 445,413 | | | Molex, Class A | | | | | | | | | 9,086,425 | |
| | | | | |
| | 385,405 | | | Oracle | | | | | | | | | 12,629,722 | |
| | | | | |
| | 239,220 | | | QUALCOMM | | | | | | | | | 12,343,752 | |
| | | | | |
| | 862,382 | | | Seagate Technology PLC | | | | | | | | | 13,927,469 | |
| | | | | |
| | 303,715 | | | Texas Instruments | | | | | | | | | 9,333,162 | |
| | | | | |
| | 75,245 | | | Visa, Class A q | | | | | | | | | 7,017,349 | |
| | | | Total Information Technology | | | | | | | | | 159,100,042 | |
| | | | Materials – 6.1% | | | | | | | | | | |
| | | | | |
| | 392,016 | | | Dow Chemical | | | | | | | | | 10,929,406 | |
| | | | | |
| | 250,967 | | | E.I. Du Pont de Nemours q | | | | | | | | | 12,063,984 | |
| | | | | |
| | 254,734 | | | Freeport-McMoRan Copper & Gold | | | | | | | | | 10,255,591 | |
| | | | | |
| | 723,602 | | | Huntsman | | | | | | | | | 8,495,087 | |
| | | | | |
| | 140,993 | | | PPG Industries | | | | | | | | | 12,183,205 | |
| | | | | |
| | 115,396 | | | Praxair | | | | | | | | | 11,732,311 | |
| | | | Total Materials | | | | | | | | | 65,659,584 | |
| | | | Telecommunication Services – 6.0% | | | | | | | | | | |
| | | | | |
| | 416,302 | | | CenturyTel | | | | | | | | | 14,678,809 | |
| | | | | |
| | 902,685 | | | Verizon Communications q | | | | | | | | | 33,381,291 | |
| | | | | |
| | 1,302,639 | | | Windstream q | | | | | | | | | 15,853,117 | |
| | | | Total Telecommunication Services | | | | | | | | | 63,913,217 | |
Portfolio of Investments
Nuveen Equity Income Fund (continued)
October 31, 2011
| | | | | | | | | | | | | | |
| Shares | | | Description p | | | | | | | | Value | |
| | | | | | | | | | | | | | |
| | | | Utilities – 3.0% | | | | | | | | | | |
| | | | | |
| | 555,660 | | | CenterPoint Energy | | | | | | | | $ | 11,579,954 | |
| | | | | |
| | 311,045 | | | PPL q | | | | | | | | | 9,135,392 | |
| | | | | |
| | 402,239 | | | Westar Energy q | | | | | | | | | 10,965,035 | |
| | | | Total Utilities | | | | | | | | | 31,680,381 | |
| | | | Total Common Stocks (Cost $833,777,322) | | | | | | | | | 1,061,474,950 | |
| | | | | |
| Shares | | | Description p | | | | | | | | Value | |
| | | | | | | | | | | | | | |
| | | | INVESTMENT PURCHASED WITH PROCEEDS FROM SECURITIES LENDING | | | | | | | | | | |
| | | | | |
| | | | Money Market Funds – 30.0% | | | | | | | | | | |
| | | | | |
| | 321,455,317 | | | Mount Vernon Securities Lending Prime Portfolio, 0.200% W † | | | | | | | | $ | 321,455,317 | |
| | | | Total Investments Purchased With Proceeds From Securities Lending (Cost $321,455,317) | | | | | | | | | 321,455,317 | |
| | | | | |
| Shares | | | Description p | | | | | | | | Value | |
| | | | SHORT-TERM INVESTMENTS – 1.8% | | | | | | | | | | |
| | | | | |
| $ | 19,972,582 | | | First American Treasury Obligations Fund, Class Z, 0.000% W | | | | | | | | $ | 19,972,582 | |
| | | | Total Short-Term Investments (Cost $19,972,582) | | | | | | | | | 19,972,582 | |
| | | | Total Investments (Cost $1,175,205,221) – 130.8% | | | | | | | | | 1,402,902,849 | |
| | | | Other Assets Less Liabilities - (30.8)% | | | | | | | | | (330,373,152 | ) |
| | | | Net Assets – 100.0% | | | | | | | | $ | 1,072,529,697 | |
| | | | For Fund portfolio compliance purposes, the Fund’s industry classifications refer to any one or more of the industry sub-classifications used by one or more widely recognized market indexes or ratings group indexes, and/or as defined by the Fund management. This definition may not apply for purposes of this report which may combine industry sub-classifications into sectors for reporting ease. |
| | p | | All percentages shown in the Portfolio of Investments are based on net assets. |
| | q | | Investment, or a portion of investment, is out on loan for securities lending. |
| | W | | The rate shown is the annualized seven-day effective yield as of October 31, 2011. |
| | † | | The Fund may loan securities representing up to one third of the fair value of its total assets (which includes collateral for securities on loan) to broker dealers, banks, or other institutional borrowers of securities. The Fund maintains collateral equal to at least 102% of the fair value of the securities loaned. The adequacy of the collateral is monitored on a daily basis. The cash collateral received by the Fund is invested in this money market fund. |
| | ADR | | American Depositary Receipt |
| | REIT | | Real Estate Investment Trust |
Portfolio of Investments
Nuveen Large Cap Value Fund
(formerly known as First American Large Cap Value Fund)
October 31, 2011
| | | | | | | | | | | | | | | | |
| Shares | | | Description p | | | | | | | | | Value | |
| | | | | | | | | | | | | | | | |
| | | | COMMON STOCKS – 99.1% | | | | | | | | | | | | |
| | | | | |
| | | | Consumer Discretionary – 11.2% | | | | | | | | | | | | |
| | | | | |
| | 26,275 | | | Bed Bath & Beyond q — | | | | | | $ | | | | | 1,624,846 | |
| | | | | |
| | 130,579 | | | CBS, Class B | | | | | | | | | | | 3,370,244 | |
| | | | | |
| | 151,735 | | | Comcast, Class A q | | | | | | | | | | | 3,558,186 | |
| | | | | |
| | 78,451 | | | Foot Locker q | | | | | | | | | | | 1,714,939 | |
| | | | | |
| | 122,812 | | | Macy’s | | | | | �� | | | | | | 3,749,450 | |
| | | | | |
| | 95,405 | | | Wyndham Worldwide q | | | | | | | | | | | 3,212,286 | |
| | | | Total Consumer Discretionary | | | | | | | | | | | 17,229,951 | |
| | | | Consumer Staples – 7.0% | | | | | | | | | | | | |
| | | | | |
| | 42,677 | | | Coca-Cola | | | | | | | | | | | 2,915,693 | |
| | | | | |
| | 38,962 | | | Corn Products International | | | | | | | | | | | 1,889,657 | |
| | | | | |
| | 114,570 | | | Dean Foods — | | | | | | | | | | | 1,113,620 | |
| | | | | |
| | 47,631 | | | Philip Morris International | | | | | | | | | | | 3,327,978 | |
| | | | | |
| | 48,286 | | | Walgreen | | | | | | | | | | | 1,603,095 | |
| | | | Total Consumer Staples | | | | | | | | | | | 10,850,043 | |
| | | | Energy – 13.0% | | | | | | | | | | | | |
| | | | | |
| | 44,244 | | | Anadarko Petroleum | | | | | | | | | | | 3,473,154 | |
| | | | | |
| | 37,471 | | | Chevron q | | | | | | | | | | | 3,936,329 | |
| | | | | |
| | 50,857 | | | Halliburton | | | | | | | | | | | 1,900,017 | |
| | | | | |
| | 33,123 | | | National Oilwell Varco q | | | | | | | | | | | 2,362,664 | |
| | | | | |
| | 16,783 | | | Noble Energy | | | | | | | | | | | 1,499,393 | |
| | | | | |
| | 21,713 | | | Occidental Petroleum | | | | | | | | | | | 2,018,006 | |
| | | | | |
| | 20,317 | | | Pioneer Natural Resources q | | | | | | | | | | | 1,704,596 | |
| | | | | |
| | 103,452 | | | The Williams Companies | | | | | | | | | | | 3,114,940 | |
| | | | Total Energy | | | | | | | | | | | 20,009,099 | |
| | | | Financials – 22.3% | | | | | | | | | | | | |
| | | | | |
| | 55,980 | | | ACE | | | | | | | | | | | 4,038,957 | |
| | | | | |
| | 52,380 | | | Ameriprise Financial | | | | | | | | | | | 2,445,098 | |
| | | | | |
| | 52,738 | | | Capital One Financial q | | | | | | | | | | | 2,408,017 | |
| | | | | |
| | 106,113 | | | Citigroup | | | | | | | | | | | 3,352,110 | |
| | | | | |
| | 159,395 | | | JPMorgan Chase | | | | | | | | | | | 5,540,570 | |
| | | | | |
| | 85,632 | | | Lincoln National q | | | | | | | | | | | 1,631,290 | |
| | | | | |
| | 69,475 | | | Marsh & McLennan | | | | | | | | | | | 2,127,325 | |
| | | | | |
| | 62,683 | | | PNC Financial Services Group | | | | | | | | | | | 3,366,704 | |
| | | | | |
| | 60,656 | | | Prudential Financial q | | | | | | | | | | | 3,287,555 | |
| | | | | |
| | 76,351 | | | State Street q | | | | | | | | | | | 3,083,817 | |
| | | | | |
| | 118,577 | | | Wells Fargo | | | | | | | | | | | 3,072,330 | |
| | | | Total Financials | | | | | | | | | | | 34,353,773 | |
| | | | Health Care – 14.5% | | | | | | | | | | | | |
| | | | | |
| | 51,921 | | | CIGNA | | | | | | | | | | | 2,302,177 | |
| | | | | |
| | 47,533 | | | Covidien q | | | | | | | | | | | 2,235,952 | |
| | | | | |
| | 85,770 | | | Gilead Sciences — | | | | | | | | | | | 3,573,178 | |
| | | | | |
| | 63,647 | | | Johnson & Johnson q | | | | | | | | | | | 4,098,231 | |
| | | | | |
| | 282,735 | | | Pfizer | | | | | | | | | | | 5,445,476 | |
| | | | | |
| | 28,227 | | | St. Jude Medical | | | | | | | | | | | 1,100,853 | |
| | | | | |
| | 74,757 | | | UnitedHealth Group | | | | | | | | | | | 3,587,589 | |
| | | | Total Health Care | | | | | | | | | | | 22,343,456 | |
Portfolio of Investments
Nuveen Large Cap Value Fund (continued)
October 31, 2011
| | | | | | | | | | | | | | |
| Shares | | | Description p | | | | | | | | Value | |
| | | | | | | | | | | | | | |
| | | | Industrials – 7.7% | | | | | | | | | | |
| | | | | |
| | 123,386 | | | CSX | | | | | | | | $ | 2,740,403 | |
| | | | | |
| | 27,955 | | | Fluor | | | | | | | | | 1,589,242 | |
| | | | | |
| | 126,082 | | | General Electric | | | | | | | | | 2,106,830 | |
| | | | | |
| | 114,744 | | | Republic Services | | | | | | | | | 3,265,614 | |
| | | | | |
| | 48,353 | | | Tyco International | | | | | | | | | 2,202,479 | |
| | | | Total Industrials | | | | | | | | | 11,904,568 | |
| | | | Information Technology – 8.3% | | | | | | | | | | |
| | | | | |
| | 60,473 | | | Arrow Electronics q — | | | | | | | | | 2,180,052 | |
| | | | | |
| | 77,858 | | | Electronic Arts — | | | | | | | | | 1,817,984 | |
| | | | | |
| | 149,044 | | | Intel q | | | | | | | | | 3,657,540 | |
| | | | | |
| | 6,743 | | | MasterCard, Class A | | | | | | | | | 2,341,439 | |
| | | | | |
| | 87,122 | | | Oracle | | | | | | | | | 2,854,988 | |
| | | | Total Information Technology | | | | | | | | | 12,852,003 | |
| | | | Materials – 3.3% | | | | | | | | | | |
| | | | | |
| | 26,647 | | | LyondellBasell Industries | | | | | | | | | 875,620 | |
| | | | | |
| | 85,713 | | | MeadWestvaco | | | | | | | | | 2,392,250 | |
| | | | | |
| | 21,658 | | | PPG Industries | | | | | | | | | 1,871,468 | |
| | | | Total Materials | | | | | | | | | 5,139,338 | |
| | | | Telecommunication Services – 5.2% | | | | | | | | | | |
| | | | | |
| | 84,549 | | | CenturyLink q | | | | | | | | | 2,981,198 | |
| | | | | |
| | 138,257 | | | Verizon Communications q | | | | | | | | | 5,112,744 | |
| | | | Total Telecommunication Services | | | | | | | | | 8,093,942 | |
| | | | Utilities – 6.6% | | | | | | | | | | |
| | | | | |
| | 86,871 | | | American Water Works | | | | | | | | | 2,652,172 | |
| | | | | |
| | 100,284 | | | Calpine q — | | | | | | | | | 1,521,308 | |
| | | | | |
| | 48,426 | | | Exelon q | | | | | | | | | 2,149,630 | |
| | | | | |
| | 17,397 | | | ONEOK q | | | | | | | | | 1,323,042 | |
| | | | | |
| | 57,318 | | | Pinnacle West Capital | | | | | | | | | 2,612,554 | |
| | | | Total Utilities | | | | | | | | | 10,258,706 | |
| | | | Total Common Stocks (Cost $154,305,571) | | | | | | | | | 153,034,879 | |
| | | | | |
| Shares | | | Description p | | | | | | | | Value | |
| | | | INVESTMENTS PURCHASED WITH PROCEEDS FROM SECURITIES LENDING | | | | | | | | | | |
| | | | | |
| | | | Money Market Funds – 27.6% | | | | | | | | | | |
| | | | | |
| | 42,625,398 | | | Mount Vernon Securities Lending Prime Portfolio, 0.200% W † | | | | | | | | $ | 42,625,398 | |
| | | | Total Investments Purchased With Proceeds From Securities Lending (Cost $42,625,398) | | | | | | | | | 42,625,398 | |
| | | | | |
| Shares | | | Description p | | | | | | | | Value | |
| | | | SHORT-TERM INVESTMENTS – 0.9% | | | | | | | | | | |
| | | | | |
| $ | 1,306,013 | | | First American Treasury Obligations Fund, Class Z, 0.000% W | | | | | | | | $ | 1,306,013 | |
| | | | Total Short-Term Investments (Cost $1,306,013) | | | | | | | | | 1,306,013 | |
| | | | Total Investments (Cost $198,236,982) – 127.6% | | | | | | | | | 196,966,290 | |
| | | | Other Assets Less Liabilities – (27.6)% | | | | | | | | | (42,589,713 | ) |
| | | | Net Assets – 100.0% | | | | | | | | $ | 154,376,577 | |
| | | | For Fund portfolio compliance purposes, the Fund’s industry classifications refer to any one or more of the industry sub-classifications used by one or more widely recognized market indexes or ratings group indexes, and/or as defined by Fund management. This definition may not apply for purposes of this report which may combine industry sub-classifications into sectors for reporting ease. |
| | p | | All percentages shown in the Portfolio of Investments are based on net assets. |
| | q | | Investment, or a portion of investment, is out on loan for securities lending. |
| | — | | Non-income producing; issuer has not declared a dividend within the past twelve months. |
| | W | | The rate shown is the annualized seven-day effective yield as of October 31, 2011. |
| | † | | The Fund may loan securities representing up to one third of the fair value of its total assets (which includes collateral for securities on loan) to broker dealers, banks, or other institutional borrowers of securities. The Fund maintains collateral equal to at least 102% of the fair value of the securities loaned. The adequacy of the collateral is monitored on a daily basis. The cash collateral received by the Fund is invested in this money market fund. |
Portfolio of Investments
Nuveen Mid Cap Value Fund
(formerly known as First American Mid Cap Value Fund)
October 31, 2011
| | | | | | | | | | | | | | |
| Shares | | | Description p | | | | | | | | Value | |
| | | | | | | | | | | | | | |
| | | | COMMON STOCKS – 99.3% | | | | | | | | | | |
| | | | | |
| | | | Consumer Discretionary – 16.4% | | | | | | | | | | |
| | | | | |
| | 82,762 | | | Ascena Retail Group — q | | | | | | | | $ | 2,391,822 | |
| | | | | |
| | 101,893 | | | CBS, Class B | | | | | | | | | 2,629,858 | |
| | | | | |
| | 161,085 | | | Cinemark Holdings q | | | | | | | | | 3,329,627 | |
| | | | | |
| | 150,959 | | | D.R. Horton | | | | | | | | | 1,680,174 | |
| | | | | |
| | 206,175 | | | Dana Holding — q | | | | | | | | | 2,915,315 | |
| | | | | |
| | 172,157 | | | Foot Locker q | | | | | | | | | 3,763,352 | |
| | | | | |
| | 95,195 | | | GameStop, Class A — q | | | | | | | | | 2,434,136 | |
| | | | | |
| | 125,505 | | | Jarden q | | | | | | | | | 4,019,925 | |
| | | | | |
| | 150,880 | | | Macy’s | | | | | | | | | 4,606,366 | |
| | | | | |
| | 102,187 | | | Mattel q | | | | | | | | | 2,885,761 | |
| | | | | |
| | 49,293 | | | Tupperware Brands | | | | | | | | | 2,787,026 | |
| | | | | |
| | 128,921 | | | Wyndham Worldwide | | | | | | | | | 4,340,770 | |
| | | | Total Consumer Discretionary | | | | | | | | | 37,784,132 | |
| | | | Consumer Staples – 5.5% | | | | | | | | | | |
| | | | | |
| | 71,714 | | | Corn Products International | | | | | | | | | 3,478,129 | |
| | | | | |
| | 176,119 | | | Dean Foods — | | | | | | | | | 1,711,877 | |
| | | | | |
| | 56,519 | | | JM Smucker | | | | | | | | | 4,353,093 | |
| | | | | |
| | 29,235 | | | Lorillard | | | | | | | | | 3,235,145 | |
| | | | Total Consumer Staples | | | | | | | | | 12,778,244 | |
| | | | Energy – 8.5% | | | | | | | | | | |
| | | | | |
| | 36,594 | | | Bill Barrett — q | | | | | | | | | 1,522,310 | |
| | | | | |
| | 33,401 | | | Cameron International — | | | | | | | | | 1,641,325 | |
| | | | | |
| | 41,450 | | | Concho Resources — q | | | | | | | | | 3,926,144 | |
| | | | | |
| | 52,620 | | | HollyFrontier | | | | | | | | | 1,614,908 | |
| | | | | |
| | 27,255 | | | Noble Energy | | | | | | | | | 2,434,962 | |
| | | | | |
| | 42,802 | | | Oil States International — q | | | | | | | | | 2,979,447 | |
| | | | | |
| | 29,792 | | | Pioneer Natural Resources q | | | | | | | | | 2,499,549 | |
| | | | | |
| | 20,900 | | | SM Energy | | | | | | | | | 1,732,819 | |
| | | | | |
| | 51,669 | | | Valero Energy | | | | | | | | | 1,271,057 | |
| | | | Total Energy | | | | | | | | | 19,622,521 | |
| | | | Financials – 26.2% | | | | | | | | | | |
| | | | | |
| | 47,207 | | | ACE | | | | | | | | | 3,405,985 | |
| | | | | |
| | 20,409 | | | Affiliated Managers Group — | | | | | | | | | 1,890,078 | |
| | | | | |
| | 97,363 | | | Ameriprise Financial | | | | | | | | | 4,544,905 | |
| | | | | |
| | 109,486 | | | Arch Capital Group — q | | | | | | | | | 3,938,211 | |
| | | | | |
| | 26,422 | | | AvalonBay Communities – REIT q | | | | | | | | | 3,532,357 | |
| | | | | |
| | 80,923 | | | BankUnited q | | | | | | | | | 1,763,312 | |
| | | | | |
| | 50,616 | | | BOK Financial q | | | | | | | | | 2,643,168 | |
| | | | | |
| | 34,384 | | | Boston Properties – REIT q | | | | | | | | | 3,403,672 | |
| | | | | |
| | 160,001 | | | East West Bancorp | | | | | | | | | 3,115,219 | |
| | | | | |
| | 47,406 | | | Endurance Specialty Holdings | | | | | | | | | 1,763,503 | |
| | | | | |
| | 33,028 | | | Federal Realty Investment Trust – REIT q | | | | | | | | | 2,931,565 | |
| | | | | |
| | 287,424 | | | Fifth Third Bancorp | | | | | | | | | 3,451,962 | |
| | | | | |
| | 125,035 | | | Invesco | | | | | | | | | 2,509,452 | |
| | | | | |
| | 95,178 | | | Lazard, Class A q | | | | | | | | | 2,602,167 | |
| | | | | |
| | 157,218 | | | Lincoln National q | | | | | | | | | 2,995,003 | |
| | | | | |
| | 124,509 | | | Marsh & McLennan | | | | | | | | | 3,812,466 | |
| | | | | |
| | 319,075 | | | SLM | | | | | | | | | 4,361,755 | |
| | | | | |
| | 183,221 | | | Unum Group q | | | | | | | | | 4,367,989 | |
| | | | | |
| | 56,510 | | | Ventas – REIT q | | | | | | | | | 3,142,521 | |
| | | | Total Financials | | | | | | | | | 60,175,290 | |
| | | | | | | | | | | | | | |
| Shares | | | Description p | | | | | | | | Value | |
| | | | | | | | | | | | | | |
| | | | Health Care – 7.4% | | | | | | | | | | |
| | | | | |
| | 61,560 | | | AmerisourceBergen q | | | | | | | | $ | 2,511,648 | |
| | | | | |
| | 109,735 | | | CareFusion — | | | | | | | | | 2,809,216 | |
| | | | | |
| | 77,056 | | | CIGNA | | | | | | | | | 3,416,663 | |
| | | | | |
| | 76,593 | | | Hill-Rom Holdings q | | | | | | | | | 2,578,886 | |
| | | | | |
| | 39,688 | | | Humana | | | | | | | | | 3,369,115 | |
| | | | | |
| | 121,446 | | | Impax Laboratories — q | | | | | | | | | 2,296,544 | |
| | | | Total Health Care | | | | | | | | | 16,982,072 | |
| | | | Industrials – 9.3% | | | | | | | | | | |
| | | | | |
| | 76,095 | | | AGCO — | | | | | | | | | 3,335,244 | |
| | | | | |
| | 43,028 | | | Dover q | | | | | | | | | 2,389,345 | |
| | | | | |
| | 41,780 | | | Fluor | | | | | | | | | 2,375,193 | |
| | | | | |
| | 9,105 | | | Goodrich | | | �� | | | | | | 1,116,546 | |
| | | | | |
| | 84,917 | | | Ingersoll-Rand q | | | | | | | | | 2,643,466 | |
| | | | | |
| | 28,816 | | | Parker Hannifin | | | | | | | | | 2,349,945 | |
| | | | | |
| | 140,919 | | | Republic Services | | | | | | | | | 4,010,555 | |
| | | | | |
| | 134,410 | | | Werner Enterprises q | | | | | | | | | 3,185,517 | |
| | | | Total Industrials | | | | | | | | | 21,405,811 | |
| | | | Information Technology – 6.8% | | | | | | | | | | |
| | | | | |
| | 112,104 | | | Amdocs — | | | | | | | | | 3,365,362 | |
| | | | | |
| | 93,755 | | | Arrow Electronics — | | | | | | | | | 3,379,868 | |
| | | | | |
| | 70,495 | | | Avago Technologies | | | | | | | | | 2,380,616 | |
| | | | | |
| | 147,067 | | | Electronic Arts — | | | | | | | | | 3,434,014 | |
| | | | | |
| | 61,222 | | | SanDisk — q | | | | | | | | | 3,102,119 | |
| | | | Total Information Technology | | | | | | | | | 15,661,979 | |
| | | | Materials – 5.6% | | | | | | | | | | |
| | | | | |
| | 52,301 | | | Celanese, Class A q | | | | | | | | | 2,277,709 | |
| | | | | |
| | 80,117 | | | Crown Holdings — | | | | | | | | | 2,707,153 | |
| | | | | |
| | 109,322 | | | MeadWestvaco | | | | | | | | | 3,051,177 | |
| | | | | |
| | 108,592 | | | Packaging Corporation of America | | | | | | | | | 2,832,079 | |
| | | | | |
| | 25,398 | | | Walter Energy | | | | | | | | | 1,921,359 | |
| | | | Total Materials | | | | | | | | | 12,789,477 | |
| | | | Telecommunication Services – 1.6% | | | | | | | | | | |
| | | | | |
| | 124,603 | | | MetroPCS Communications — | | | | | | | | | 1,059,126 | |
| | | | | |
| | 219,465 | | | Windstream q | | | | | | | | | 2,670,889 | |
| | | | Total Telecommunication Services | | | | | | | | | 3,730,015 | |
| | | | Utilities – 12.0% | | | | | | | | | | |
| | | | | |
| | 128,397 | | | American Water Works | | | | | | | | | 3,919,961 | |
| | | | | |
| | 282,028 | | | Calpine — | | | | | | | | | 4,278,365 | |
| | | | | |
| | 283,743 | | | NV Energy | | | | | | | | | 4,551,238 | |
| | | | | |
| | 83,541 | | | OGE Energy | | | | | | | | | 4,322,411 | |
| | | | | |
| | 38,131 | | | ONEOK q | | | | | | | | | 2,899,863 | |
| | | | | |
| | 101,985 | | | Pinnacle West Capital | | | | | | | | | 4,648,476 | |
| | | | | |
| | 86,302 | | | Public Service Enterprise Group q | | | | | | | | | 2,908,377 | |
| | | | Total Utilities | | | | | | | | | 27,528,691 | |
| | | | Total Common Stocks (Cost $225,986,086) | | | | | | | | | 228,458,232 | |
Portfolio of Investments
Nuveen Mid Cap Value Fund (continued)
October 31, 2011
| | | | | | | | | | | | | | |
| Shares | | | Description p | | | | | | | | Value | |
| | | | | | | | | | | | | | |
| | | | INVESTMENTS PURCHASED WITH PROCEEDS FROM SECURITIES LENDING | | | | | | | | | | |
| | | | | |
| | | | Money Market Funds – 33.1% | | | | | | | | | | |
| | | | | |
| | 76,049,862 | | | Mount Vernon Securities Lending Prime Portfolio, 0.200% W † | | | | | | | | $ | 76,049,862 | |
| | | | Total Investments Purchased With Proceeds From Securities Lending (Cost $76,049,862) | | | | | | | | | 76,049,862 | |
| | | | | |
| Shares | | | Description p | | | | | | | | Value | |
| | | | | | | | | | | | | | |
| | | | SHORT-TERM INVESTMENT – 1.2% | | | | | | | | | | |
| | | | | |
| $ | 2,807,180 | | | First American Treasury Obligations Fund, Class Z, 0.000% W | | | | | | | | $ | 2,807,180 | |
| | | | Total Short-Term Investment (Cost $2,807,180) | | | | | | | | | 2,807,180 | |
| | | | Total Investments (Cost $304,843,128) – 133.6% | | | | | | | | | 307,315,274 | |
| | | | Other Assets Less Liabilities – (33.6)% | | | | | | | | | (77,232,617 | ) |
| | | | Net Assets – 100.0% | | | | | | | | $ | 230,082,657 | |
| | | | For Fund portfolio compliance purposes, the Fund’s industry classifications refer to any one or more of the industry sub-classifications used by one or more widely recognized market indexes or ratings group indexes, and/or as defined by the Fund management. This definition may not apply for purposes of this report which may combine industry sub-classifications into sectors for reporting ease. |
| | p | | All percentages shown in the Portfolio of Investments are based on net assets. |
| | — | | Non-income producing; issuer has not declared a dividend within the past twelve months. |
| | q | | Investment, or a portion of investment, is out on loan for securities lending. |
| | W | | The rate shown is the annualized seven-day effective yield as of October 31, 2011. |
| | † | | The Fund may loan securities representing up to one third of the fair value of its total assets (which includes collateral for securities on loan) to broker dealers, banks, or other institutional borrowers of securities. The Fund maintains collateral equal to at least 102% of the fair value of the securities loaned. The adequacy of the collateral is monitored on a daily basis. The cash collateral received by the Fund is invested in this money market fund. |
| | REIT | | Real Estate Investment Trust |
Portfolio of Investments
Nuveen Small Cap Value Fund
(formerly known as First American Small Cap Value Fund)
October 31, 2011
| | | | | | | | | | | | | | | | |
| Shares | | | Description p | | | | | | | | | Value | |
| | | | | | | | | | | | | | | | |
| | | | COMMON STOCKS – 96.3% | | | | | | | | | | | | |
| | | | | |
| | | | Consumer Discretionary – 11.9% | | | | | | | | | | | | |
| | | | | |
| | 21,099 | | | Ascena Retail Group q — | | | | | | $ | | | | | 609,761 | |
| | | | | |
| | 41,627 | | | Cinemark Holdings q | | | | | | | | | | | 860,430 | |
| | | | | |
| | 26,759 | | | Coinstar q — | | | | | | | | | | | 1,277,475 | |
| | | | | |
| | 60,411 | | | Cooper Tire & Rubber | | | | | | | | | | | 865,690 | |
| | | | | |
| | 21,824 | | | Domino’s Pizza q — | | | | | | | | | | | 699,023 | |
| | | | | |
| | 8,759 | | | DSW — | | | | | | | | | | | 458,446 | |
| | | | | |
| | 30,186 | | | Group 1 Automotive q | | | | | | | | | | | 1,375,274 | |
| | | | | |
| | 44,233 | | | La-Z-Boy | | | | | | | | | | | 449,407 | |
| | | | | |
| | 18,372 | | | Men’s Wearhouse | | | | | | | | | | | 567,327 | |
| | | | | |
| | 21,989 | | | P.F. Chang’s China Bistro q | | | | | | | | | | | 683,858 | |
| | | | | |
| | 10,354 | | | Polaris Industries | | | | | | | | | | | 655,822 | |
| | | | | |
| | 80,173 | | | Sally Beauty Holdings — | | | | | | | | | | | 1,538,520 | |
| | | | Total Consumer Discretionary | | | | | | | | | | | 10,041,033 | |
| | | | Consumer Staples – 1.2% | | | | | | | | | | | | |
| | | | | |
| | 59,880 | | | Spartan Stores | | | | | | | | | | | 1,025,146 | |
| | | | Energy – 6.2% | | | | | | | | | | | | |
| | | | | |
| | 19,270 | | | Berry Petroleum, Class A q | | | | | | | | | | | 665,779 | |
| | | | | |
| | 25,095 | | | Complete Production Services — | | | | | | | | | | | 823,116 | |
| | | | | |
| | 31,666 | | | Matrix Service — | | | | | | | | | | | 336,293 | |
| | | | | |
| | 63,536 | | | Newpark Resources q — | | | | | | | | | | | 567,376 | |
| | | | | |
| | 11,346 | | | Oil States International q — | | | | | | | | | | | 789,795 | |
| | | | | |
| | 37,503 | | | Stone Energy q — | | | | | | | | | | | 910,948 | |
| | | | | |
| | 37,308 | | | Swift Energy q — | | | | | | | | | | | 1,142,371 | |
| | | | Total Energy | | | | | | | | | | | 5,235,678 | |
| | | | Financials – 27.0% | | | | | | | | | | | | |
| | | | | |
| | 14,985 | | | Affiliated Managers Group — | | | | | | | | | | | 1,387,761 | |
| | | | | |
| | 52,672 | | | Associated Estates Realty – REIT | | | | | | | | | | | 894,371 | |
| | | | | |
| | 47,449 | | | Bank of the Ozarks q | | | | | | | | | | | 1,180,057 | |
| | | | | |
| | 105,381 | | | Brandywine Realty Trust – REIT | | | | | | | | | | | 960,021 | |
| | | | | |
| | 188,957 | | | CNO Financial Group q — | | | | | | | | | | | 1,180,981 | |
| | | | | |
| | 45,938 | | | Community Bank System q | | | | | | | | | | | 1,174,175 | |
| | | | | |
| | 122,718 | | | CubeSmart – REIT q | | | | | | | | | | | 1,203,864 | |
| | | | | |
| | 31,227 | | | Delphi Financial Group, Class A q | | | | | | | | | | | 826,891 | |
| | | | | |
| | 132,729 | | | DiamondRock Hospitality – REIT q | | | | | | | | | | | 1,201,197 | |
| | | | | |
| | 59,014 | | | East West Bancorp | | | | | | | | | | | 1,149,003 | |
| | | | | |
| | 26,612 | | | EZCORP, Class A — | | | | | | | | | | | 739,281 | |
| | | | | |
| | 62,625 | | | FirstMerit q | | | | | | | | | | | 877,376 | |
| | | | | |
| | 71,004 | | | Flushing Financial q | | | | | | | | | | | 870,509 | |
| | | | | |
| | 60,596 | | | Heartland Financial USA q | | | | | | | | | | | 947,115 | |
| | | | | |
| | 23,418 | | | Home Properties – REIT q | | | | | | | | | | | 1,379,320 | |
| | | | | |
| | 63,086 | | | Horace Mann Educators | | | | | | | | | | | 848,507 | |
| | | | | |
| | 13,662 | | | IBERIABANK q | | | | | | | | | | | 706,599 | |
| | | | | |
| | 111,662 | | | JMP Group | | | | | | | | | | | 828,532 | |
| | | | | |
| | 162,344 | | | MGIC Investment q — | | | | | | | | | | | 431,835 | |
| | | | | |
| | 14,404 | | | SVB Financial Group q — | | | | | | | | | | | 661,720 | |
| | | | | |
| | 39,184 | | | Texas Capital Bancshares q — | | | | | | | | | | | 1,097,152 | |
| | | | | |
| | 62,852 | | | Webster Financial q | | | | | | | | | | | 1,234,413 | |
| | | | | |
| | 23,021 | | | WSFS Financial | | | | | | | | | | | 915,085 | |
| | | | Total Financials | | | | | | | | | | | 22,695,765 | |
Portfolio of Investments
Nuveen Small Cap Value Fund (continued)
October 31, 2011
| | | | | | | | | | | | | | |
| Shares | | | Description p | | | | | | | | Value | |
| | | | | | | | | | | | | | |
| | | | Health Care – 5.6% | | | | | | | | | | |
| | | | | |
| | 10,411 | | | AMERIGROUP — | | | | | | | | $ | 579,164 | |
| | | | | |
| | 98,276 | | | BioScrip — | | | | | | | | | 638,794 | |
| | | | | |
| | 43,784 | | | Hanger Orthopedic Group — | | | | | | | | | 760,528 | |
| | | | | |
| | 26,581 | | | ICU Medical — | | | | | | | | | 1,044,899 | |
| | | | | |
| | 34,647 | | | Impax Laboratories q — | | | | | | | | | 655,175 | |
| | | | | |
| | 15,280 | | | MEDNAX — | | | | | | | | | 1,005,424 | |
| | | | Total Health Care | | | | | | | | | 4,683,984 | |
| | | | Industrials – 16.8% | | | | | | | | | | |
| | | | | |
| | 47,175 | | | Actuant, Class A q | | | | | | | | | 1,061,437 | |
| | | | | |
| | 79,421 | | | Altra Holdings q — | | | | | | | | | 1,167,489 | |
| | | | | |
| | 29,477 | | | Atlas Air Worldwide Holdings q — | | | | | | | | | 1,135,454 | |
| | | | | |
| | 41,546 | | | Douglas Dynamics | | | | | | | | | 624,021 | |
| | | | | |
| | 41,991 | | | EMCOR Group | | | | | | | | | 1,052,714 | |
| | | | | |
| | 27,401 | | | Ennis | | | | | | | | | 400,877 | |
| | | | | |
| | 36,422 | | | G&K Services, Class A | | | | | | | | | 1,105,772 | |
| | | | | |
| | 31,850 | | | General Cable q — | | | | | | | | | 893,074 | |
| | | | | |
| | 43,343 | | | GrafTech International — | | | | | | | | | 680,918 | |
| | | | | |
| | 59,024 | | | MasTec q — | | | | | | | | | 1,276,099 | |
| | | | | |
| | 24,385 | | | Old Dominion Freight Line q — | | | | | | | | | 891,759 | |
| | | | | |
| | 57,077 | | | PHH — | | | | | | | | | 1,053,071 | |
| | | | | |
| | 15,923 | | | Regal-Beloit q | | | | | | | | | 845,989 | |
| | | | | |
| | 32,787 | | | Triumph Group q | | | | | | | | | 1,904,925 | |
| | | | Total Industrials | | | | | | | | | 14,093,599 | |
| | | | Information Technology – 15.3% | | | | | | | | | | |
| | | | | |
| | 51,348 | | | Bankrate q — | | | | | | | | | 999,746 | |
| | | | | |
| | 47,243 | | | Bottomline Technologies — | | | | | | | | | 1,147,532 | |
| | | | | |
| | 17,561 | | | CACI International, Class A q — | | | | | | | | | 963,923 | |
| | | | | |
| | 34,795 | | | International Rectifier — | | | | | | | | | 845,171 | |
| | | | | |
| | 25,974 | | | Kenexa — | | | | | | | | | 594,025 | |
| | | | | |
| | 48,313 | | | MKS Instruments | | | | | | | | | 1,287,059 | |
| | | | | |
| | 105,938 | | | Perficient — | | | | | | | | | 1,009,589 | |
| | | | | |
| | 21,069 | | | Plantronics q | | | | | | | | | 703,915 | |
| | | | | |
| | 132,787 | | | PMC-Sierra — | | | | | | | | | 841,870 | |
| | | | | |
| | 47,407 | | | Polycom q — | | | | | | | | | 783,638 | |
| | | | | |
| | 21,018 | | | Progress Software — | | | | | | | | | 442,639 | |
| | | | | |
| | 152,374 | | | RF Micro Devices q — | | | | | | | | | 1,118,425 | |
| | | | | |
| | 14,640 | | | Rogers — | | | | | | | | | 632,009 | |
| | | | | |
| | 64,862 | | | TTM Technologies q — | | | | | | | | | 724,509 | |
| | | | | |
| | 45,691 | | | Virtusa — | | | | | | | | | 744,306 | |
| | | | Total Information Technology | | | | | | | | | 12,838,356 | |
| | | | Materials – 6.5% | | | | | | | | | | |
| | | | | |
| | 42,680 | | | Buckeye Technologies q | | | | | | | | | 1,290,643 | |
| | | | | |
| | 37,162 | | | Commercial Metals q | | | | | | | | | 461,924 | |
| | | | | |
| | 28,300 | | | Kraton Performance Polymers — | | | | | | | | | 556,944 | |
| | | | | |
| | 17,222 | | | Minerals Technologies | | | | | | | | | 944,454 | |
| | | | | |
| | 39,639 | | | Packaging Corp of America | | | | | | | | | 1,033,785 | |
| | | | | |
| | 9,454 | | | Rockwood Holdings — | | | | | | | | | 435,262 | |
| | | | | |
| | 16,446 | | | Schnitzer Steel Industries, Class A q | | | | | | | | | 769,673 | |
| | | | Total Materials | | | | | | | | | 5,492,685 | |
| | | | | | | | | | | | | | |
| Shares | | | Description p | | | | | | | | Value | |
| | | | | | | | | | | | | | |
| | | | Telecommunication Services – 0.9% | | | | | | | | | | |
| | | | | |
| | 41,457 | | | NTELOS Holdings | | | | | | | | $ | 788,512 | |
| | | | Utilities – 4.9% | | | | | | | | | | |
| | | | | |
| | 37,039 | | | Atmos Energy | | | | | | | | | 1,271,178 | |
| | | | | |
| | 34,490 | | | El Paso Electric — | | | | | | | | | 1,104,715 | |
| | | | | |
| | 20,633 | | | Southwest Gas | | | | | | | | | 814,591 | |
| | | | | |
| | 27,809 | | | UIL Holdings q | | | | | | | | | 947,731 | |
| | | | Total Utilities | | | | | | | | | 4,138,215 | |
| | | | Total Common Stocks (Cost $74,386,526) | | | | | | | | | 81,032,973 | |
| | | | | |
| Shares | | | Description p | | | | | | | | Value | |
| | | | INVESTMENT COMPANIES – 1.1% | | | | | | | | | | |
| | | | | |
| | | | Financials – 1.1% | | | | | | | | | | |
| | | | | |
| | 15,585 | | | iShares Dow Jones U.S. Real Estate Index Fund q | | | | | | | | $ | 892,085 | |
| | | | Total Investment Companies (Cost $809,244) | | | | | | | | | 892,085 | |
| | | | | |
| Shares | | | Description p | | | | | | | | Value | |
| | | | INVESTMENTS PURCHASED WITH PROCEEDS FROM SECURITIES LENDING | | | | | | | | | | |
| | | | | |
| | | | Money Market Funds – 40.0% | | | | | | | | | | |
| | | | | |
| | 33,680,834 | | | Mount Vernon Securities Lending Prime Portfolio, 0.200% W † | | | | | | | | $ | 33,680,834 | |
| | | | Total Investments Purchased With Proceeds From Securities Lending (Cost $33,680,834) | | | | | | | | | 33,680,834 | |
| | | | | |
| Shares | | | Description p | | | | | | | | Value | |
| | | | SHORT-TERM INVESTMENT – 2.6% | | | | | | | | | | |
| | | | | |
| $ | 2,221,801 | | | First American Treasury Obligations, Class Z, 0.000% W | | | | | | | | $ | 2,221,801 | |
| | | | Total Short-Term Investment (Cost $2,221,801) | | | | | | | | | 2,221,801 | |
| | | | Total Investments (Cost $111,098,405) – 140.0% | | | | | | | | | 117,827,693 | |
| | | | Other Assets Less Liabilities – (40.0)% | | | | | | | | | (33,674,125 | ) |
| | | | Net Assets – 100.0% | | | | | | | | $ | 84,153,568 | |
| | | | For Fund portfolio compliance purposes, the Fund’s industry classifications refer to any one or more of the industry sub-classifications used by one or more widely recognized market indexes or ratings group indexes, and/or as defined by the Fund management. This definition may not apply for purposes of this report which may combine industry sub-classifications into sectors for reporting ease. |
| | p | | All percentages shown in the Portfolio of Investments are based on net assets. |
| | q | | Investment, or a portion of investment, is out on loan for securities lending. |
| | — | | Non-income producing; issuer has not declared a dividend within the past twelve months. |
| | W | | The rate shown is the annualized seven-day effective yield as of October 31, 2011. |
| | † | | The Fund may loan securities representing up to one third of the fair value of its total assets (which includes collateral for securities on loan) to broker dealers, banks, or other institutional borrowers of securities. The Fund maintains collateral equal to at least 102% of the fair value of the securities loaned. The adequacy of the collateral is monitored on a daily basis. The cash collateral received by the Fund is invested in this money market fund. |
| | REIT | | Real Estate Investment Trust |
Statement of Assets & Liabilities
October 31, 2011 (all dollars and shares are rounded to thousands (000), except for per share data)
| | | | | | | | | | | | | | | | |
| | | Equity
Income | | | Large Cap
Value | | | Mid Cap
Value | | | Small Cap
Value | |
Assets | | | | | | | | | | | | | | | | |
Investments, at value (cost $853,750, $155,612, $228,793 and $77,417, respectively) | | $ | 1,081,448 | | | $ | 154,341 | | | $ | 231,265 | | | $ | 84,147 | |
Investments purchased with collateral from securities lending
(at cost, which approximates value) | | | 321,455 | | | | 42,625 | | | | 76,050 | | | | 33,681 | |
Receivables: | | | | | | | | | | | | | | | | |
Dividends | | | 1,326 | | | | 172 | | | | 110 | | | | 18 | |
Due from broker | | | 20 | | | | 4 | | | | 6 | | | | 4 | |
Investments sold | | | — | | | | 3,574 | | | | 5,768 | | | | 2,437 | |
Shares sold | | | 2,337 | | | | 247 | | | | 76 | | | | 40 | |
Other assets | | | 53 | | | | 52 | | | | 65 | | | | 49 | |
Total assets | | | 1,406,639 | | | | 201,015 | | | | 313,340 | | | | 120,376 | |
Liabilities | | | | | | | | | | | | | | | | |
Payables: | | | | | | | | | | | | | | | | |
Collateral from securities lending program | | | 321,455 | | | | 42,625 | | | | 76,050 | | | | 33,681 | |
Investments purchased | | | 10,676 | | | | 3,632 | | | | 5,832 | | | | 2,119 | |
Shares redeemed | | | 838 | | | | 111 | | | | 811 | | | | 133 | |
Accrued expenses: | | | | | | | | | | | | | | | | |
Management fees | | | 662 | | | | 95 | | | | 306 | | | | 142 | |
12b-1 distribution and service fees | | | 58 | | | | 11 | | | | 26 | | | | 8 | |
Other | | | 420 | | | | 164 | | | | 232 | | | | 139 | |
Total liabilities | | | 334,109 | | | | 46,638 | | | | 83,257 | | | | 36,222 | |
Net assets | | $ | 1,072,530 | | | $ | 154,377 | | | $ | 230,083 | | | $ | 84,154 | |
Class A Shares | | | | | | | | | | | | | | | | |
Net assets | | $ | 176,954 | | | $ | 46,659 | | | $ | 52,334 | | | $ | 31,814 | |
Shares outstanding | | | 13,555 | | | | 3,236 | | | | 2,397 | | | | 2,816 | |
Net asset value per share | | $ | 13.05 | | | $ | 14.42 | | | $ | 21.83 | | | $ | 11.30 | |
Offering price per share (net asset value per share plus maximum sales charge of 5.75% of offering price) | | $ | 13.85 | | | $ | 15.30 | | | $ | 23.16 | | | $ | 11.99 | |
Class B Shares | | | | | | | | | | | | | | | | |
Net assets | | $ | 3,016 | | | $ | 907 | | | $ | 2,073 | | | | N/A | |
Shares outstanding | | | 233 | | | | 65 | | | | 101 | | | | N/A | |
Net asset value and offering price per share | | $ | 12.93 | | | $ | 13.86 | | | $ | 20.52 | | | | N/A | |
Class C Shares | | | | | | | | | | | | | | | | |
Net assets | | $ | 18,714 | | | $ | 1,094 | | | $ | 8,957 | | | $ | 1,498 | |
Shares outstanding | | | 1,449 | | | | 78 | | | | 427 | | | | 151 | |
Net asset value and offering price per share | | $ | 12.92 | | | $ | 14.09 | | | $ | 20.99 | | | $ | 9.93 | |
Class R3 Shares(1) | | | | | | | | | | | | | | | | |
Net assets | | $ | 12,092 | | | $ | 768 | | | $ | 15,310 | | | $ | 2,246 | |
Shares outstanding | | | 928 | | | | 54 | | | | 706 | | | | 202 | |
Net asset value and offering price per share | | $ | 13.03 | | | $ | 14.32 | | | $ | 21.70 | | | $ | 11.11 | |
Class I Shares(1) | | | | | | | | | | | | | | | | |
Net assets | | $ | 861,754 | | | $ | 104,949 | | | $ | 151,409 | | | $ | 48,596 | |
Shares outstanding | | | 65,507 | | | | 7,234 | | | | 6,886 | | | | 4,171 | |
Net asset value and offering price per share | | $ | 13.16 | | | $ | 14.51 | | | $ | 21.99 | | | $ | 11.65 | |
Net assets consist of: | | | | | | | | | | | | | | | | |
Capital paid-in | | $ | 844,619 | | | $ | 245,468 | | | $ | 291,098 | | | $ | 118,022 | |
Undistributed (Over-distribution of) net investment income | | | 1,991 | | | | 868 | | | | 1,501 | | | | (11 | ) |
Accumulated net realized gain (loss) | | | (1,778 | ) | | | (90,688 | ) | | | (64,988 | ) | | | (40,586 | ) |
Net unrealized appreciation (depreciation) | | | 227,698 | | | | (1,271 | ) | | | 2,472 | | | | 6,729 | |
Net assets | | $ | 1,072,530 | | | $ | 154,377 | | | $ | 230,083 | | | $ | 84,154 | |
Authorized shares | | | 2 billion | | | | 2 billion | | | | 2 billion | | | | 2 billion | |
Par value per share | | $ | 0.0001 | | | $ | 0.0001 | | | $ | 0.0001 | | | $ | 0.0001 | |
| N/A - | Small Cap Value does not offer Class B Shares. |
| (1) - | Effective January 18, 2011, Class R Shares and Class Y Shares previously offered by FAF Advisors, Inc. were renamed Class R3 Shares and Class I Shares, respectively. |
See accompanying notes to financial statements.
Statement of Operations (all dollars are rounded to thousands (000))
Year Ended October 31, 2011
| | | | | | | | | | | | | | | | |
| | | Equity
Income | | | Large Cap
Value | | | Mid Cap
Value | | | Small Cap
Value | |
Dividend and Interest income from unaffiliated investments (net of foreign tax withheld of $371, $22, $33 and $ –, respectively) | | $ | 31,772 | | | $ | 3,797 | | | $ | 5,522 | | | $ | 1,148 | |
Interest income from affiliated investments(1) | | | 3 | | | | — | | | | — | | | | 1 | |
Securities lending income | | | 160 | | | | 47 | | | | 73 | | | | 41 | |
Total investment income | | $ | 31,935 | | | $ | 3,844 | | | $ | 5,595 | | | $ | 1,190 | |
Expenses | | | | | | | | | | | | | | | | |
Management fees | | | 7,514 | | | | 1,455 | | | | 2,789 | | | | 953 | |
12b-1 service fees – Class A | | | 411 | | | | 130 | | | | 174 | | | | 87 | |
12b-1 distribution and service fees – Class B | | | 41 | | | | 12 | | | | 26 | | | | N/A | |
12b-1 distribution and service fees – Class C | | | 153 | | | | 12 | | | | 109 | | | | 17 | |
12b-1 distribution and service fees – Class R3(2) | | | 22 | | | | 4 | | | | 91 | | | | 12 | |
Administration fees(1) | | | 336 | | | | 109 | | | | 199 | | | | 71 | |
Shareholders’ servicing agent fees and expenses | | | 585 | | | | 205 | | | | 299 | | | | 172 | |
Custodian’s fees and expenses | | | 151 | | | | 39 | | | | 59 | | | | 27 | |
Directors’ fees and expenses | | | 27 | | | | 8 | | | | 11 | | | | 7 | |
Professional fees | | | 31 | | | | 31 | | | | 31 | | | | 30 | |
Shareholders’ reports – printing and mailing expenses | | | 133 | | | | 48 | | | | 65 | | | | 32 | |
Federal and state registration fees | | | 109 | | | | 83 | | | | 96 | | | | 66 | |
Other expenses | | | 21 | | | | 14 | | | | 17 | | | | 10 | |
Total expenses before expense reimbursement | | | 9,534 | | | | 2,150 | | | | 3,966 | | | | 1,484 | |
Expense reimbursement | | | (3 | ) | | | — | | | | (38 | ) | | | (4 | ) |
Net expenses | | | 9,531 | | | | 2,150 | | | | 3,928 | | | | 1,480 | |
Net investment income (loss) | | | 22,404 | | | | 1,694 | | | | 1,667 | | | | (290 | ) |
Realized and Unrealized Gain (Loss) | | | | | | | | | | | | | | | | |
Net realized gain (loss) from: | | | | | | | | | | | | | | | | |
Investments | | | 5,604 | | | | 19,196 | | | | 42,263 | | | | 10,390 | |
Redemptions in-kind | | | – | | | | 15,436 | | | | 51,352 | | | | 27,495 | |
Change in net unrealized appreciation (depreciation) of investments | | | 38,786 | | | | (24,277 | ) | | | (76,035 | ) | | | (17,603 | ) |
Net realized and unrealized gain (loss) | | | 44,390 | | | | 10,355 | | | | 17,580 | | | | 20,282 | |
Net increase (decrease) in net assets from operations | | $ | 66,794 | | | $ | 12,049 | | | $ | 19,247 | | | $ | 19,992 | |
| N/A | – Small Cap Value does not offer Class B Shares. |
| (1) | – For the period November 1, 2010 through December 31, 2010. |
| (2) | – Effective January 18, 2011, Class R Shares previously offered by FAF Advisors, Inc. were renamed Class R3 Shares. |
See accompanying notes to financial statements.
Statement of Changes in Net Assets (all dollars are rounded to thousands (000))
| | | | | | | | | | | | | | | | |
| | | Equity Income | | | Large Cap Value | |
| | | Year Ended
10/31/11 | | | Year Ended
10/31/10 | | | Year Ended
10/31/11 | | | Year Ended
10/31/10 | |
Operations | | | | | | | | | | | | | | | | |
Net investment income (loss) | | $ | 22,404 | | | $ | 22,884 | | | $ | 1,694 | | | $ | 3,153 | |
Net realized gain (loss) from: | | | | | | | | | | | | | | | | |
Investments | | | 5,604 | | | | 20,110 | | | | 19,196 | | | | 26,403 | |
Redemptions in-kind | | | — | | | | — | | | | 15,436 | | | | — | |
Change in net unrealized appreciation (depreciation) of investments | | | 38,786 | | | | 85,170 | | | | (24,277 | ) | | | 8,454 | |
Net increase (decrease) in net assets from operations | | | 66,794 | | | | 128,164 | | | | 12,049 | | | | 38,010 | |
Distributions to Shareholders | | | | | | | | | | | | | | | | |
From net investment income: | | | | | | | | | | | | | | | | |
Class A | | | (3,311 | ) | | | (2,941 | ) | | | (697 | ) | | | (728 | ) |
Class B | | | (30 | ) | | | (112 | ) | | | (6 | ) | | | (10 | ) |
Class C | | | (155 | ) | | | (143 | ) | | | (5 | ) | | | (7 | ) |
Class R3(1) | | | (75 | ) | | | (12 | ) | | | (9 | ) | | | (4 | ) |
Class I(1) | | | (19,550 | ) | | | (17,684 | ) | | | (2,375 | ) | | | (5,078 | ) |
Decrease in net assets from distributions to shareholders | | | (23,121 | ) | �� | | (20,892 | ) | | | (3,092 | ) | | | (5,827 | ) |
Fund Share Transactions | | | | | | | | | | | | | | | | |
Proceeds from sale of shares | | | 441,407 | | | | 180,094 | | | | 8,440 | | | | 17,475 | |
Proceeds from shares issued to shareholders due to reinvestment of distributions | | | 9,485 | | | | 6,986 | | | | 1,789 | | | | 4,029 | |
| | | 450,892 | | | | 187,080 | | | | 10,229 | | | | 21,504 | |
Cost of shares redeemed | | | (249,151 | ) | | | (150,265 | ) | | | (74,896 | ) | | | (106,527 | ) |
Cost of redemptions in-kind | | | — | | | | — | | | | (132,685 | ) | | | — | |
Net increase (decrease) in net assets from Fund share transactions | | | 201,741 | | | | 36,815 | | | | (197,352 | ) | | | (85,023 | ) |
Net increase (decrease) in net assets | | | 245,414 | | | | 144,087 | | | | (188,395 | ) | | | (52,840 | ) |
Net assets at beginning of period | | | 827,116 | | | | 683,029 | | | | 342,772 | | | | 395,612 | |
Net assets at end of period | | $ | 1,072,530 | | | $ | 827,116 | | | $ | 154,377 | | | $ | 342,772 | |
Undistributed (Over-distribution of) net investment income at end of period | | $ | 1,991 | | | $ | 3,972 | | | $ | 868 | | | $ | 2,310 | |
| (1) – | Effective January 18, 2011, Class R Shares and Class Y Shares previously offered by FAF Advisors, Inc. were renamed Class R3 Shares and Class I Shares, respectively. |
See accompanying notes to financial statements.
| | | | | | | | | | | | | | | | |
| | | Mid Cap Value | | | Small Cap Value | |
| | | Year Ended
10/31/11 | | | Year Ended
10/31/10 | | | Year Ended
10/31/11 | | | Year Ended
10/31/10 | |
Operations | | | | | | | | | | | | | | | | |
Net investment income (loss) | | $ | 1,667 | | | $ | 4,209 | | | $ | (290 | ) | | $ | 173 | |
Net realized gain (loss) from: | | | | | | | | | | | | | | | | |
Investments | | | 42,263 | | | | 83,856 | | | | 10,390 | | | | 13,113 | |
Redemptions in-kind | | | 51,352 | | | | — | | | | 27,495 | | | | — | |
Change in net unrealized appreciation (depreciation) of investments | | | (76,035 | ) | | | 34,723 | | | | (17,603 | ) | | | 31,588 | |
Net increase (decrease) in net assets from operations | | | 19,247 | | | | 122,788 | | | | 19,992 | | | | 44,874 | |
Distributions to Shareholders | | | | | | | | | | | | | | | | |
From net investment income: | | | | | | | | | | | | | | | | |
Class A | | | (805 | ) | | | (1,055 | ) | | | — | | | | (84 | ) |
Class B | | | (10 | ) | | | (15 | ) | | | N/A | | | | N/A | |
Class C | | | (47 | ) | | | (46 | ) | | | — | | | | — | |
Class R3(1) | | | (141 | ) | | | (180 | ) | | | — | | | | (1 | ) |
Class I(1) | | | (2,981 | ) | | | (6,065 | ) | | | — | | | | (751 | ) |
Decrease in net assets from distributions to shareholders | | | (3,984 | ) | | | (7,361 | ) | | | — | | | | (836 | ) |
Fund Share Transactions | | | | | | | | | | | | | | | | |
Proceeds from sale of shares | | | 38,985 | | | | 79,022 | | | | 19,212 | | | | 23,609 | |
Proceeds from shares issued to shareholders due to reinvestment of distributions | | | 2,082 | | | | 5,412 | | | | — | | | | 717 | |
| | | 41,067 | | | | 84,434 | | | | 19,212 | | | | 24,326 | |
Cost of shares redeemed | | | (145,840 | ) | | | (230,729 | ) | | | (44,281 | ) | | | (34,151 | ) |
Cost of redemptions in-kind | | | (261,914 | ) | | | — | | | | (127,930 | ) | | | — | |
Net increase (decrease) in net assets from Fund share transactions | | | (366,687 | ) | | | (146,295 | ) | | | (152,999 | ) | | | (9,825 | ) |
Net increase (decrease) in net assets | | | (351,424 | ) | | | (30,868 | ) | | | (133,007 | ) | | | 34,213 | |
Net assets at beginning of period | | | 581,507 | | | | 612,375 | | | | 217,161 | | | | 182,948 | |
Net assets at end of period | | $ | 230,083 | | | $ | 581,507 | | | $ | 84,154 | | | $ | 217,161 | |
Undistributed (Over-distribution of) net investment income at end of period | | $ | 1,501 | | | $ | 3,971 | | | $ | (11 | ) | | $ | (11 | ) |
| N/A - | Small Cap Value does not offer Class B Shares. |
| (1) - | Effective January 18, 2011, Class R Shares and Class Y Shares previously offered by FAF Advisors, Inc. were renamed Class R3 Shares and Class I Shares, respectively. |
See accompanying notes to financial statements.
Financial Highlights
| | | | | | | | | | | | | | | | | | | | | | | | | | | | | | | | |
| Selected data for a share outstanding throughout each period: | | | | | | | | | | | | | | | | |
| | | | | | | |
| Class (Commencement Date) | | | | | | | | | | | | | | | | | | | | | | |
| | | | | | Investment Operations | | | Less Distributions | | | | |
| | | | | | | |
| EQUITY INCOME | | | | | | | | | | | | | | | | | | | | | | |
Year Ended
October 31, | | Beginning
Net
Asset
Value | | | Net
Invest-
ment
Income
(Loss)(a) | | | Net
Realized/
Unrealized
Gain
(Loss) | | | Total | | | Net
Invest-
ment
Income | | | Capital
Gains(b) | | | Total | | | Ending Net Asset Value | |
Class A (12/92) | | | | | | | | | | | | | | | | | | | | | | | | | | | | | |
2011 | | $ | 12.42 | | | $ | .27 | | | $ | .63 | | | $ | .90 | | | $ | (.27 | ) | | $ | — | | | $ | (.27 | ) | | $ | 13.05 | |
2010 | | | 10.76 | | | | .34 | | | | 1.63 | | | | 1.97 | | | | (.31 | ) | | | — | | | | (.31 | ) | | | 12.42 | |
2009 | | | 10.09 | | | | .29 | | | | .71 | | | | 1.00 | | | | (.33 | ) | | | — | | | | (.33 | ) | | | 10.76 | |
2008 | | | 16.43 | | | | .33 | | | | (5.28 | ) | | | (4.95 | ) | | | (.29 | ) | | | (1.10 | ) | | | (1.39 | ) | | | 10.09 | |
2007 | | | 15.90 | | | | .29 | | | | 1.96 | | | | 2.25 | | | | (.29 | ) | | | (1.43 | ) | | | (1.72 | ) | | | 16.43 | |
Class B (8/94) | | | | | | | | | | | | | | | | | | | | | | | | | | | | | |
2011 | | | 12.25 | | | | .17 | | | | .61 | | | | .78 | | | | (.10 | ) | | | — | | | | (.10 | ) | | | 12.93 | |
2010 | | | 10.61 | | | | .24 | | | | 1.61 | | | | 1.85 | | | | (.21 | ) | | | — | | | | (.21 | ) | | | 12.25 | |
2009 | | | 9.96 | | | | .22 | | | | .68 | | | | .90 | | | | (.25 | ) | | | — | | | | (.25 | ) | | | 10.61 | |
2008 | | | 16.23 | | | | .22 | | | | (5.19 | ) | | | (4.97 | ) | | | (.20 | ) | | | (1.10 | ) | | | (1.30 | ) | | | 9.96 | |
2007 | | | 15.75 | | | | .17 | | | | 1.94 | | | | 2.11 | | | | (.20 | ) | | | (1.43 | ) | | | (1.63 | ) | | | 16.23 | |
Class C (2/99) | | | | | | | | | | | | | | | | | | | | | | | | | | | | | |
2011 | | | 12.26 | | | | .17 | | | | .62 | | | | .79 | | | | (.13 | ) | | | — | | | | (.13 | ) | | | 12.92 | |
2010 | | | 10.63 | | | | .26 | | | | 1.60 | | | | 1.86 | | | | (.23 | ) | | | — | | | | (.23 | ) | | | 12.26 | |
2009 | | | 9.98 | | | | .21 | | | | .69 | | | | .90 | | | | (.25 | ) | | | — | | | | (.25 | ) | | | 10.63 | |
2008 | | | 16.26 | | | | .22 | | | | (5.20 | ) | | | (4.98 | ) | | | (.20 | ) | | | (1.10 | ) | | | (1.30 | ) | | | 9.98 | |
2007 | | | 15.78 | | | | .17 | | | | 1.94 | | | | 2.11 | | | | (.20 | ) | | | (1.43 | ) | | | (1.63 | ) | | | 16.26 | |
Class R3 (9/01)(e) | | | | | | | | | | | | | | | | | | | | | | | | | | | | | |
2011 | | | 12.41 | | | | .23 | | | | .63 | | | | .86 | | | | (.24 | ) | | | — | | | | (.24 | ) | | | 13.03 | |
2010 | | | 10.76 | | | | .30 | | | | 1.64 | | | | 1.94 | | | | (.29 | ) | | | — | | | | (.29 | ) | | | 12.41 | |
2009 | | | 10.08 | | | | .28 | | | | .68 | | | | .96 | | | | (.28 | ) | | | — | | | | (.28 | ) | | | 10.76 | |
2008 | | | 16.41 | | | | .29 | | | | (5.26 | ) | | | (4.97 | ) | | | (.26 | ) | | | (1.10 | ) | | | (1.36 | ) | | | 10.08 | |
2007 | | | 15.88 | | | | .23 | | | | 1.98 | | | | 2.21 | | | | (.25 | ) | | | (1.43 | ) | | | (1.68 | ) | | | 16.41 | |
Class I (8/94)(e) | | | | | | | | | | | | | | | | | | | | | | | | | | | | | |
2011 | | | 12.53 | | | | .31 | | | | .64 | | | | .95 | | | | (.32 | ) | | | — | | | | (.32 | ) | | | 13.16 | |
2010 | | | 10.85 | | | | .37 | | | | 1.65 | | | | 2.02 | | | | (.34 | ) | | | — | | | | (.34 | ) | | | 12.53 | |
2009 | | | 10.18 | | | | .32 | | | | .70 | | | | 1.02 | | | | (.35 | ) | | | — | | | | (.35 | ) | | | 10.85 | |
2008 | | | 16.55 | | | | .36 | | | | (5.30 | ) | | | (4.94 | ) | | | (.33 | ) | | | (1.10 | ) | | | (1.43 | ) | | | 10.18 | |
2007 | | | 16.00 | | | | .33 | | | | 1.98 | | | | 2.31 | | | | (.33 | ) | | | (1.43 | ) | | | (1.76 | ) | | | 16.55 | |
| | | | | | | | | | | | | | | | | | | | | | | | | | |
| | | | | | | | | | | | | | | | | | | | |
| | | | | | |
| | | | | | | | | | | | | | | | | | | | |
| | | | Ratios/Supplemental Data | |
| | | | | | | Ratios to Average
Net Assets Before
Reimbursement | | | Ratios to Average
Net Assets After
Reimbursement(d) | | | | |
Total
Return(c) | | | Ending
Net
Assets
(000) | | | Expenses | | | Net
Invest-
ment
Income
(Loss) | | | Expenses | | | Net
Invest-
ment
Income
(Loss) | | | Portfolio
Turnover
Rate | |
| | | | | | | | | | | | | | | | | | | | | | | | | | |
| | 7.28 | % | | $ | 176,954 | | | | 1.14 | % | | | 2.05 | % | | | 1.14 | % | | | 2.05 | % | | | 33 | % |
| | 18.46 | | | | 125,226 | | | | 1.19 | | | | 2.87 | | | | 1.17 | | | | 2.89 | | | | 29 | |
| | 10.32 | | | | 100,059 | | | | 1.19 | | | | 3.00 | | | | 1.19 | | | | 3.00 | | | | 48 | |
| | (32.51 | ) | | | 100,824 | | | | 1.17 | | | | 2.45 | | | | 1.17 | | | | 2.45 | | | | 32 | |
| | 15.24 | | | | 179,379 | | | | 1.16 | | | | 1.83 | | | | 1.16 | | | | 1.83 | | | | 20 | |
| | | | | | | | | | | | | | | | | | | | | | | | | | |
| | 6.45 | | | | 3,016 | | | | 1.89 | | | | 1.32 | | | | 1.89 | | | | 1.32 | | | | 33 | |
| | 17.59 | | | | 5,039 | | | | 1.94 | | | | 2.05 | | | | 1.92 | | | | 2.07 | | | | 29 | |
| | 9.41 | | | | 7,237 | | | | 1.94 | | | | 2.28 | | | | 1.94 | | | | 2.28 | | | | 48 | |
| | (32.95 | ) | | | 9,113 | | | | 1.92 | | | | 1.69 | | | | 1.92 | | | | 1.69 | | | | 32 | |
| | 14.40 | | | | 16,893 | | | | 1.91 | | | | 1.09 | | | | 1.91 | | | | 1.09 | | | | 20 | |
| | | | | | | | | | | | | | | | | | | | | | | | | | |
| | 6.42 | | | | 18,714 | | | | 1.89 | | | | 1.31 | | | | 1.89 | | | | 1.31 | | | | 33 | |
| | 17.60 | | | | 11,107 | | | | 1.94 | | | | 2.20 | | | | 1.92 | | | | 2.22 | | | | 29 | |
| | 9.41 | | | | 4,921 | | | | 1.94 | | | | 2.23 | | | | 1.94 | | | | 2.23 | | | | 48 | |
| | (32.95 | ) | | | 4,625 | | | | 1.92 | | | | 1.69 | | | | 1.92 | | | | 1.69 | | | | 32 | |
| | 14.37 | | | | 9,241 | | | | 1.91 | | | | 1.09 | | | | 1.91 | | | | 1.09 | | | | 20 | |
| | | | | | | | | | | | | | | | | | | | | | | | | | |
| | 6.93 | | | | 12,092 | | | | 1.41 | | | | 1.75 | | | | 1.41 | | | | 1.75 | | | | 33 | |
| | 18.16 | | | | 1,204 | | | | 1.41 | | | | 2.48 | | | | 1.39 | | | | 2.50 | | | | 29 | |
| | 9.92 | | | | 122 | | | | 1.45 | | | | 2.94 | | | | 1.45 | | | | 2.94 | | | | 48 | |
| | (32.64 | ) | | | 535 | | | | 1.42 | | | | 2.20 | | | | 1.42 | | | | 2.20 | | | | 32 | |
| | 14.98 | | | | 940 | | | | 1.41 | | | | 1.48 | | | | 1.41 | | | | 1.48 | | | | 20 | |
| | | | | | | | | | | | | | | | | | | | | | | | | | |
| | 7.56 | | | | 861,754 | | | | .89 | | | | 2.30 | | | | .89 | | | | 2.31 | | | | 33 | |
| | 18.78 | | | | 684,540 | | | | .94 | | | | 3.12 | | | | .92 | | | | 3.10 | | | | 29 | |
| | 10.51 | | | | 570,690 | | | | .94 | | | | 3.25 | | | | .94 | | | | 3.25 | | | | 48 | |
| | (32.29 | ) | | | 574,162 | | | | .92 | | | | 2.70 | | | | .92 | | | | 2.70 | | | | 32 | |
| | 15.54 | | | | 1,061,433 | | | | .91 | | | | 2.09 | | | | .91 | | | | 2.09 | | | | 20 | |
| (a) | Per share Net Investment Income (Loss) is calculated using the average daily shares method. |
| (b) | Distributions from Capital Gains include short-term capital gains, if any. |
| (c) | Total return is the combination of changes in net asset value without any sales charge, reinvested dividend income at net asset value and reinvested capital gains distributions at net asset value, if any. Total returns are not annualized. |
| (d) | After expense reimbursement from the Adviser, where applicable. Ratios do not reflect the effect of custodian fee credits earned on the Fund’s net cash on deposit with the custodian bank, where applicable. |
| (e) | Effective January 18, 2011, Class R Shares and Class Y Shares previously offered by FAF Advisors, Inc. were renamed Class R3 Shares and Class I Shares, respectively. |
See accompanying notes to financial statements.
Financial Highlights (continued)
| | | | | | | | | | | | | | | | | | | | | | | | | | | | | | | | |
| Selected data for a share outstanding throughout each period: | | | | | | | | | | | | | | | | |
| | | | | | |
| Class (Commencement Date) | | | | | | | | | | | | | | | | | | | |
| | | | | | Investment Operations | | | Less Distributions | | | | |
| | | | | |
| LARGE CAP VALUE | | | | | | | | | | | | | | | | |
Year Ended
October 31, | | Beginning
Net
Asset
Value | | | Net
Invest-
ment
Income
(Loss)(a) | | | Net
Realized/
Unrealized
Gain
(Loss) | | | Total | | | Net
Invest-
ment
Income | | | Capital
Gains(b) | | | Total | | | Ending
Net
Asset
Value | |
Class A (12/87) | | | | | | | | | | | | | | | | | | | | | | | | | | | | | |
2011 | | $ | 14.32 | | | $ | .08 | | | $ | .21 | | | $ | .29 | | | $ | (.19 | ) | | $ | — | | | $ | (.19 | ) | | $ | 14.42 | |
2010 | | | 13.14 | | | | .09 | | | | 1.27 | | | | 1.36 | | | | (.18 | ) | | | — | | | | (.18 | ) | | | 14.32 | |
2009 | | | 12.88 | | | | .18 | | | | .22 | | | | .40 | | | | (.14 | ) | | | — | | | | (.14 | ) | | | 13.14 | |
2008 | | | 22.61 | | | | .25 | | | | (7.02 | ) | | | (6.77 | ) | | | (.16 | ) | | | (2.80 | ) | | | (2.96 | ) | | | 12.88 | |
2007 | | | 22.12 | | | | .23 | | | | 2.19 | | | | 2.42 | | | | (.24 | ) | | | (1.69 | ) | | | (1.93 | ) | | | 22.61 | |
Class B (8/94) | | | | | | | | | | | | | | | | | | | | | | | | | | | | | |
2011 | | | 13.75 | | | | (.03 | ) | | | .20 | | | | .17 | | | | (.06 | ) | | | — | | | | (.06 | ) | | | 13.86 | |
2010 | | | 12.61 | | | | (.01 | ) | | | 1.21 | | | | 1.20 | | | | (.06 | ) | | | — | | | | (.06 | ) | | | 13.75 | |
2009 | | | 12.39 | | | | .09 | | | | .21 | | | | .30 | | | | (.08 | ) | | | — | | | | (.08 | ) | | | 12.61 | |
2008 | | | 21.92 | | | | .11 | | | | (6.77 | ) | | | (6.66 | ) | | | (.07 | ) | | | (2.80 | ) | | | (2.87 | ) | | | 12.39 | |
2007 | | | 21.54 | | | | .07 | | | | 2.12 | | | | 2.19 | | | | (.12 | ) | | | (1.69 | ) | | | (1.81 | ) | | | 21.92 | |
Class C (2/99) | | | | | | | | | | | | | | | | | | | | | | | | | | | | | |
2011 | | | 13.97 | | | | (.03 | ) | | | .21 | | | | .18 | | | | (.06 | ) | | | — | | | | (.06 | ) | | | 14.09 | |
2010 | | | 12.81 | | | | (.01 | ) | | | 1.22 | | | | 1.21 | | | | (.05 | ) | | | — | | | | (.05 | ) | | | 13.97 | |
2009 | | | 12.59 | | | | .09 | | | | .21 | | | | .30 | | | | (.08 | ) | | | — | | | | (.08 | ) | | | 12.81 | |
2008 | | | 22.21 | | | | .11 | | | | (6.86 | ) | | | (6.75 | ) | | | (.07 | ) | | | (2.80 | ) | | | (2.87 | ) | | | 12.59 | |
2007 | | | 21.81 | | | | .07 | | | | 2.14 | | | | 2.21 | | | | (.12 | ) | | | (1.69 | ) | | | (1.81 | ) | | | 22.21 | |
Class R3 (9/01)(e) | | | | | | | | | | | | | | | | | | | | | | | | | | | | | |
2011 | | | 14.24 | | | | .05 | | | | .21 | | | | .26 | | | | (.18 | ) | | | — | | | | (.18 | ) | | | 14.32 | |
2010 | | | 13.09 | | | | .05 | | | | 1.26 | | | | 1.31 | | | | (.16 | ) | | | — | | | | (.16 | ) | | | 14.24 | |
2009 | | | 12.85 | | | | .13 | | | | .23 | | | | .36 | | | | (.12 | ) | | | — | | | | (.12 | ) | | | 13.09 | |
2008 | | | 22.57 | | | | .20 | | | | (6.99 | ) | | | (6.79 | ) | | | (.13 | ) | | | (2.80 | ) | | | (2.93 | ) | | | 12.85 | |
2007 | | | 22.10 | | | | .17 | | | | 2.17 | | | | 2.34 | | | | (.18 | ) | | | (1.69 | ) | | | (1.87 | ) | | | 22.57 | |
Class I (2/94)(e) | | | | | | | | | | | | | | | | | | | | | | | | | | | | | |
2011 | | | 14.41 | | | | .15 | | | | .18 | | | | .33 | | | | (.23 | ) | | | — | | | | (.23 | ) | | | 14.51 | |
2010 | | | 13.23 | | | | .12 | | | | 1.27 | | | | 1.39 | | | | (.21 | ) | | | — | | | | (.21 | ) | | | 14.41 | |
2009 | | | 12.95 | | | | .21 | | | | .23 | | | | .44 | | | | (.16 | ) | | | — | | | | (.16 | ) | | | 13.23 | |
2008 | | | 22.69 | | | | .29 | | | | (7.04 | ) | | | (6.75 | ) | | | (.19 | ) | | | (2.80 | ) | | | (2.99 | ) | | | 12.95 | |
2007 | | | 22.19 | | | | .29 | | | | 2.18 | | | | 2.47 | | | | (.28 | ) | | | (1.69 | ) | | | (1.97 | ) | | | 22.69 | |
| | | | | | | | | | | | | | | | | | | | | | | | | | |
| | | | | | |
| | | | | | | | | | | | | | | | | | | | |
| | | | Ratios/Supplemental Data | |
| | | | | | | Ratios to Average
Net Assets Before
Reimbursement | | | Ratios to Average
Net Assets After
Reimbursement(d) | | | | |
Total
Return(c) | | | Ending
Net
Assets
(000) | | | Expenses | | | Net
Invest-
ment
Income
(Loss) | | | Expenses | | | Net
Invest-
ment
Income
(Loss) | | | Portfolio
Turnover
Rate | |
| | | | | | | | | | | | | | | | | | | | | | | | | | |
| | 1.98 | % | | $ | 46,659 | | | | 1.24 | % | | | .56 | % | | | 1.24 | % | | | .56 | % | | | 114 | % |
| | 10.36 | | | | 52,567 | | | | 1.23 | | | | .63 | | | | 1.23 | | | | .63 | | | | 135 | |
| | 3.24 | | | | 55,401 | | | �� | 1.22 | | | | 1.49 | | | | 1.22 | | | | 1.49 | | | | 68 | |
| | (34.00 | ) | | | 60,870 | | | | 1.19 | | | | 1.41 | | | | 1.19 | | | | 1.41 | | | | 90 | |
| | 11.60 | | | | 113,223 | | | | 1.17 | | | | 1.05 | | | | 1.17 | | | | 1.05 | | | | 81 | |
| | | | | | | | | | | | | | | | | | | | | | | | | | |
| | 1.22 | | | | 907 | | | | 1.99 | | | | (.20 | ) | | | 1.99 | | | | (.20 | ) | | | 114 | |
| | 9.54 | | | | 1,338 | | | | 1.98 | | | | (.10 | ) | | | 1.98 | | | | (.10 | ) | | | 135 | |
| | 2.48 | | | | 2,266 | | | | 1.97 | | | | .83 | | | | 1.97 | | | | .83 | | | | 68 | |
| | (34.51 | ) | | | 3,750 | | | | 1.94 | | | | .65 | | | | 1.94 | | | | .65 | | | | 90 | |
| | 10.76 | | | | 7,973 | | | | 1.92 | | | | .31 | | | | 1.92 | | | | .31 | | | | 81 | |
| | | | | | | | | | | | | | | | | | | | | | | | | | |
| | 1.28 | | | | 1,094 | | | | 1.99 | | | | (.19 | ) | | | 1.99 | | | | (.19 | ) | | | 114 | |
| | 9.45 | | | | 1,337 | | | | 1.98 | | | | (.10 | ) | | | 1.98 | | | | (.10 | ) | | | 135 | |
| | 2.47 | | | | 2,016 | | | | 1.97 | | | | .76 | | | | 1.97 | | | | .76 | | | | 68 | |
| | (34.46 | ) | | | 2,643 | | | | 1.94 | | | | .66 | | | | 1.94 | | | | .66 | | | | 90 | |
| | 10.71 | | | | 4,587 | | | | 1.92 | | | | .31 | | | | 1.92 | | | | .31 | | | | 81 | |
| | | | | | | | | | | | | | | | | | | | | | | | | | |
| | 1.74 | | | | 768 | | | | 1.49 | | | | .33 | | | | 1.49 | | | | .33 | | | | 114 | |
| | 10.04 | | | | 794 | | | | 1.49 | | | | .35 | | | | 1.49 | | | | .35 | | | | 135 | |
| | 2.96 | | | | 340 | | | | 1.47 | | | | 1.06 | | | | 1.47 | | | | 1.06 | | | | 68 | |
| | (34.13 | ) | | | 174 | | | | 1.44 | | | | 1.18 | | | | 1.44 | | | | 1.18 | | | | 90 | |
| | 11.25 | | | | 188 | | | | 1.42 | | | | .78 | | | | 1.42 | | | | .78 | | | | 81 | |
| | | | | | | | | | | | | | | | | | | | | | | | | | |
| | 2.22 | | | | 104,949 | | | | .99 | | | | .96 | | | | .99 | | | | .96 | | | | 114 | |
| | 10.54 | | | | 286,736 | | | | .98 | | | | .89 | | | | .98 | | | | .89 | | | | 135 | |
| | 3.54 | | | | 335,589 | | | | .97 | | | | 1.76 | | | | .97 | | | | 1.76 | | | | 68 | |
| | (33.80 | ) | | | 401,006 | | | | .94 | | | | 1.66 | | | | .94 | | | | 1.66 | | | | 90 | |
| | 11.83 | | | | 726,512 | | | | .92 | | | | 1.30 | | | | .92 | | | | 1.30 | | | | 81 | |
| (a) | Per share Net Investment Income (Loss) is calculated using the average daily shares method. |
| (b) | Distributions from Capital Gains include short-term capital gains, if any. |
| (c) | Total return is the combination of changes in net asset value without any sales charge, reinvested dividend income at net asset value and reinvested capital gains distributions at net asset value, if any. Total returns are not annualized. |
| (d) | After expense reimbursement from the Adviser, where applicable. Ratios do not reflect the effect of custodian fee credits earned on the Fund’s net cash on deposit with the custodian bank, where applicable. |
| (e) | Effective January 18, 2011, Class R Shares and Class Y Shares previously offered by FAF Advisors Inc. were renamed Class R3 Shares and Class I Shares, respectively. |
See accompanying notes to financial statements.
Financial Highlights (continued)
| | | | | | | | | | | | | | | | | | | | | | | | | | | | | | | | |
| Selected data for a share outstanding throughout each period: | | | | |
| | | | | | |
| Class (Commencement Date) | | | | | | | | | | | | | | | | | | | |
| | | | | | Investment Operations | | | Less Distributions | | | | |
| | | | | |
| MID CAP VALUE | | | | | | | | | | | | | | | | |
Year Ended
October 31, | | Beginning
Net
Asset
Value | | | Net
Invest-
ment
Income
(Loss)(a) | | | Net
Realized/
Unrealized
Gain
(Loss) | | | Total | | | Net
Invest-
ment
Income | | | Capital
Gains(b) | | | Total | | | Ending
Net
Asset
Value | |
Class A (12/87) | | | | | | | | | | | | | | | | | | | | | | | | | | | | | |
2011 | | $ | 22.20 | | | $ | .07 | | | $ | (.19 | ) | | $ | (.12 | ) | | $ | (.25 | ) | | $ | — | | | $ | (.25 | ) | | $ | 21.83 | |
2010 | | | 18.28 | | | | .12 | | | | 4.00 | | | | 4.12 | | | | (.20 | ) | | | — | | | | (.20 | ) | | | 22.20 | |
2009 | | | 16.13 | | | | .24 | | | | 1.99 | | | | 2.23 | | | | (.08 | ) | | | — | | | | (.08 | ) | | | 18.28 | |
2008 | | | 27.83 | | | | .21 | | | | (9.92 | ) | | | (9.71 | ) | | | (.16 | ) | | | (1.83 | ) | | | (1.99 | ) | | | 16.13 | |
2007 | | | 26.65 | | | | .14 | | | | 2.78 | | | | 2.92 | | | | (.16 | ) | | | (1.58 | ) | | | (1.74 | ) | | | 27.83 | |
Class B (8/94) | | | | | | | | | | | | | | | | | | | | | | | | | | | | | |
2011 | | | 20.87 | | | | (.10 | ) | | | (.18 | ) | | | (.28 | ) | | | (.07 | ) | | | — | | | | (.07 | ) | | | 20.52 | |
2010 | | | 17.21 | | | | (.04 | ) | | | 3.78 | | | | 3.74 | | | | (.08 | ) | | | — | | | | (.08 | ) | | | 20.87 | |
2009 | | | 15.22 | | | | .13 | | | | 1.87 | | | | 2.00 | | | | (.01 | ) | | | — | | | | (.01 | ) | | | 17.21 | |
2008 | | | 26.48 | | | | .03 | | | | (9.39 | ) | | | (9.36 | ) | | | (.07 | ) | | | (1.83 | ) | | | (1.90 | ) | | | 15.22 | |
2007 | | | 25.50 | | | | (.05 | ) | | | 2.65 | | | | 2.60 | | | | (.04 | ) | | | (1.58 | ) | | | (1.62 | ) | | | 26.48 | |
Class C (2/99) | | | | | | | | | | | | | | | | | | | | | | | | | | | | | |
2011 | | | 21.36 | | | | (.10 | ) | | | (.18 | ) | | | (.28 | ) | | | (.09 | ) | | | — | | | | (.09 | ) | | | 20.99 | |
2010 | | | 17.61 | | | | (.04 | ) | | | 3.86 | | | | 3.82 | | | | (.07 | ) | | | — | | | | (.07 | ) | | | 21.36 | |
2009 | | | 15.58 | | | | .12 | | | | 1.92 | | | | 2.04 | | | | (.01 | ) | | | — | | | | (.01 | ) | | | 17.61 | |
2008 | | | 27.05 | | | | .03 | | | | (9.60 | ) | | | (9.57 | ) | | | (.07 | ) | | | (1.83 | ) | | | (1.90 | ) | | | 15.58 | |
2007 | | | 26.02 | | | | (.06 | ) | | | 2.72 | | | | 2.66 | | | | (.05 | ) | | | (1.58 | ) | | | (1.63 | ) | | | 27.05 | |
Class R3 (9/01)(e) | | | | | | | | | | | | | | | | | | | | | | | | | | | | | |
2011 | | | 22.05 | | | | .01 | | | | (.19 | ) | | | (.18 | ) | | | (.17 | ) | | | — | | | | (.17 | ) | | | 21.70 | |
2010 | | | 18.15 | | | | .06 | | | | 3.99 | | | | 4.05 | | | | (.15 | ) | | | — | | | | (.15 | ) | | | 22.05 | |
2009 | | | 16.04 | | | | .19 | | | | 1.98 | | | | 2.17 | | | | (.06 | ) | | | — | | | | (.06 | ) | | | 18.15 | |
2008 | | | 27.72 | | | | .15 | | | | (9.87 | ) | | | (9.72 | ) | | | (.13 | ) | | | (1.83 | ) | | | (1.96 | ) | | | 16.04 | |
2007 | | | 26.56 | | | | .06 | | | | 2.78 | | | | 2.84 | | | | (.10 | ) | | | (1.58 | ) | | | (1.68 | ) | | | 27.72 | |
Class I (2/94)(e) | | | | | | | | | | | | | | | | | | | | | | | | | | | | | |
2011 | | | 22.37 | | | | .15 | | | | (.22 | ) | | | (.07 | ) | | | (.31 | ) | | | — | | | | (.31 | ) | | | 21.99 | |
2010 | | | 18.42 | | | | .16 | | | | 4.05 | | | | 4.21 | | | | (.26 | ) | | | — | | | | (.26 | ) | | | 22.37 | |
2009 | | | 16.24 | | | | .28 | | | | 2.01 | | | | 2.29 | | | | (.11 | ) | | | — | | | | (.11 | ) | | | 18.42 | |
2008 | | | 27.98 | | | | .27 | | | | (9.99 | ) | | | (9.72 | ) | | | (.19 | ) | | | (1.83 | ) | | | (2.02 | ) | | | 16.24 | |
2007 | | | 26.77 | | | | .22 | | | | 2.80 | | | | 3.02 | | | | (.23 | ) | | | (1.58 | ) | | | (1.81 | ) | | | 27.98 | |
| | | | | | | | | | | | | | | | | | | | | | | | | | |
| | | | | | |
| | | | | | | | | | | | | | | | | | | | |
| | | | Ratios/Supplemental Data | |
| | | | | | | Ratios to Average
Net Assets Before
Reimbursement | | | Ratios to Average
Net Assets After
Reimbursement(d) | | | | |
Total
Return(c) | | | Ending
Net
Assets
(000) | | | Expenses | | | Net
Invest-
ment
Income
(Loss) | | | Expenses | | | Net
Invest-
ment
Income
(Loss) | | | Portfolio
Turnover
Rate | |
| | | | | | | | | | | | | | | | | | | | | | | | | | |
| | (.64 | )% | | $ | 52,334 | | | | 1.33 | % | | | .27 | % | | | 1.31 | % | | | .30 | % | | | 123 | % |
| | 22.65 | | | | 76,667 | | | | 1.25 | | | | .58 | | | | 1.25 | | | | .58 | | | | 123 | |
| | 13.95 | | | | 130,222 | | | | 1.25 | | | | 1.52 | | | | 1.25 | | | | 1.52 | | | | 106 | |
| | (37.32 | ) | | | 124,275 | | | | 1.23 | | | | .90 | | | | 1.23 | | | | .90 | | | | 93 | |
| | 11.47 | | | | 254,342 | | | | 1.22 | | | | .58 | | | | 1.22 | | | | .58 | | | | 95 | |
| | | | | | | | | | | | | | | | | | | | | | | | | | |
| | (1.35 | ) | | | 2,073 | | | | 2.08 | | | | (.48 | ) | | | 2.06 | | | | (.45 | ) | | | 123 | |
| | 21.77 | | | | 2,815 | | | | 2.00 | | | | (.20 | ) | | | 2.00 | | | | (.20 | ) | | | 123 | |
| | 13.13 | | | | 3,481 | | | | 1.98 | | | | .85 | | | | 1.98 | | | | .85 | | | | 106 | |
| | (37.82 | ) | | | 4,133 | | | | 1.98 | | | | .14 | | | | 1.98 | | | | .14 | | | | 93 | |
| | 10.67 | | | | 8,360 | | | | 1.97 | | | | (.13 | ) | | | 1.97 | | | | (.13 | ) | | | 95 | |
| | | | | | | | | | | | | | | | | | | | | | | | | | |
| | (1.35 | ) | | | 8,957 | | | | 2.08 | | | | (.48 | ) | | | 2.06 | | | | (.45 | ) | | | 123 | |
| | 21.74 | | | | 11,564 | | | | 2.00 | | | | (.21 | ) | | | 2.00 | | | | (.21 | ) | | | 123 | |
| | 13.10 | | | | 12,040 | | | | 2.00 | | | | .80 | | | | 2.00 | | | | .80 | | | | 106 | |
| | (37.80 | ) | | | 13,154 | | | | 1.98 | | | | .14 | | | | 1.98 | | | | .14 | | | | 93 | |
| | 10.66 | | | | 26,141 | | | | 1.97 | | | | (.18 | ) | | | 1.97 | | | | (.18 | ) | | | 95 | |
| | | | | | | | | | | | | | | | | | | | | | | | | | |
| | (.87 | ) | | | 15,310 | | | | 1.58 | | | | .03 | | | | 1.56 | | | | .06 | | | | 123 | |
| | 22.40 | | | | 20,195 | | | | 1.50 | | | | .30 | | | | 1.50 | | | | .30 | | | | 123 | |
| | 13.63 | | | | 25,664 | | | | 1.50 | | | | 1.21 | | | | 1.50 | | | | 1.21 | | | | 106 | |
| | (37.47 | ) | | | 23,423 | | | | 1.49 | | | | .64 | | | | 1.49 | | | | .64 | | | | 93 | |
| | 11.18 | | | | 29,752 | | | | 1.47 | | | | .29 | | | | 1.47 | | | | .29 | | | | 95 | |
| | | | | | | | | | | | | | | | | | | | | | | | | | |
| | (.42 | ) | | | 151,409 | | | | 1.07 | | | | .65 | | | | 1.06 | | | | .65 | | | | 123 | |
| | 22.98 | | | | 470,266 | | | | 1.00 | | | | .78 | | | | 1.00 | | | | .78 | | | | 123 | |
| | 14.24 | | | | 440,968 | | | | 1.00 | | | | 1.76 | | | | 1.00 | | | | 1.76 | | | | 106 | |
| | (37.17 | ) | | | 415,486 | | | | .99 | | | | 1.14 | | | | .99 | | | | 1.14 | | | | 93 | |
| | 11.79 | | | | 772,178 | | | | .97 | | | | .86 | | | | .97 | | | | .86 | | | | 95 | |
| (a) | Per share Net Investment Income (Loss) is calculated using the average daily shares method. |
| (b) | Distributions from Capital Gains include short-term capital gains, if any. |
| (c) | Total return is the combination of changes in net asset value without any sales charge, reinvested dividend income at net asset value and reinvested capital gains distributions at net asset value, if any. Total returns are not annualized. |
| (d) | After expense reimbursement from the Adviser, where applicable. Ratios do not reflect the effect of custodian fee credits earned on the Fund’s net cash on deposit with the custodian bank, where applicable. |
| (e) | Effective January 18, 2011, Class R Shares and Class Y Shares previously offered by FAF Advisors Inc. were renamed Class R3 Shares and Class I Shares, respectively. |
See accompanying notes to financial statements.
Financial Highlights (continued)
| | | | | | | | | | | | | | | | | | | | | | | | | | | | | | | | |
| Selected data for a share outstanding throughout each period: | | | | |
| | | | | | |
| Class (Commencement Date) | | | | | | | | | | | | | | | | | | | |
| | | | | | Investment Operations | | | Less Distributions | | | | |
| | | | | |
SMALL CAP VALUE | | | | | | | | | | | | | | | | |
| | | | | | | | |
Year Ended
October 31, | | Beginning
Net
Asset
Value | | | Net
Invest-
ment
Income
(Loss)(a) | | | Net
Realized/
Unrealized
Gain
(Loss) | | | Total | | | Net
Invest-
ment
Income | | | Capital
Gains(b) | | | Total | | | Ending
Net
Asset
Value | |
Class A (8/94) | | | | | | | | | | | | | | | | | | | | | | | | | | | | | |
2011 | | $ | 10.26 | | | $ | (.05 | ) | | $ | 1.09 | | | $ | 1.04 | | | $ | — | | | $ | — | | | $ | — | | | $ | 11.30 | |
2010 | | | 8.22 | | | | (.01 | ) | | | 2.07 | | | | 2.06 | | | | (.02 | ) | | | — | | | | (.02 | ) | | | 10.26 | |
2009 | | | 8.12 | | | | .03 | | | | .15 | | | | .18 | | | | (.08 | ) | | | — | | | | (.08 | ) | | | 8.22 | |
2008 | | | 13.52 | | | | .08 | | | | (3.97 | ) | | | (3.89 | ) | | | (.14 | ) | | | (1.37 | ) | | | (1.51 | ) | | | 8.12 | |
2007 | | | 15.38 | | | | .12 | | | | .48 | | | | .60 | | | | (.02 | ) | | | (2.44 | ) | | | (2.46 | ) | | | 13.52 | |
Class C (2/99) | | | | | | | | | | | | | | | | | | | | | | | | | | | | | |
2011 | | | 9.08 | | | | (.12 | ) | | | .97 | | | | .85 | | | | — | | | | — | | | | — | | | | 9.93 | |
2010 | | | 7.31 | | | | (.07 | ) | | | 1.84 | | | | 1.77 | | | | — | | | | — | | | | — | | | | 9.08 | |
2009 | | | 7.22 | | | | (.02 | ) | | | .13 | | | | .11 | | | | (.02 | ) | | | — | | | | (.02 | ) | | | 7.31 | |
2008 | | | 12.19 | | | | — | * | | | (3.54 | ) | | | (3.54 | ) | | | (.06 | ) | | | (1.37 | ) | | | (1.43 | ) | | | 7.22 | |
2007 | | | 14.17 | | | | .02 | | | | .44 | | | | .46 | | | | — | | | | (2.44 | ) | | | (2.44 | ) | | | 12.19 | |
Class R3 (9/01)(e) | | | | | | | | | | | | | | | | | | | | | | | | | | | | | |
2011 | | | 10.11 | | | | (.07 | ) | | | 1.07 | | | | 1.00 | | | | — | | | | — | | | | — | | | | 11.11 | |
2010 | | | 8.10 | | | | (.03 | ) | | | 2.04 | | | | 2.01 | | | | — | | | | — | | | | — | | | | 10.11 | |
2009 | | | 8.00 | | | | .01 | | | | .15 | | | | .16 | | | | (.06 | ) | | | — | | | | (.06 | ) | | | 8.10 | |
2008 | | | 13.35 | | | | .05 | | | | (3.91 | ) | | | (3.86 | ) | | | (.12 | ) | | | (1.37 | ) | | | (1.49 | ) | | | 8.00 | |
2007 | | | 15.24 | | | | .10 | | | | .47 | | | | .57 | | | | (.02 | ) | | | (2.44 | ) | | | (2.46 | ) | | | 13.35 | |
Class I (8/94)(e) | | | | | | | | | | | | | | | | | | | | | | | | | | | | | |
2011 | | | 10.55 | | | | (.02 | ) | | | 1.12 | | | | 1.10 | | | | — | | | | — | | | | — | | | | 11.65 | |
2010 | | | 8.45 | | | | .01 | | | | 2.13 | | | | 2.14 | | | | (.04 | ) | | | — | | | | (.04 | ) | | | 10.55 | |
2009 | | | 8.36 | | | | .05 | | | | .15 | | | | .20 | | | | (.11 | ) | | | — | | | | (.11 | ) | | | 8.45 | |
2008 | | | 13.87 | | | | .11 | | | | (4.08 | ) | | | (3.97 | ) | | | (.17 | ) | | | (1.37 | ) | | | (1.54 | ) | | | 8.36 | |
2007 | | | 15.71 | | | | .16 | | | | .49 | | | | .65 | | | | (.05 | ) | | | (2.44 | ) | | | (2.49 | ) | | | 13.87 | |
| | | | | | | | | | | | | | | | | | | | | | | | | | |
| | | | | | | | | | | | | | | | | | | | |
| | | | |
| | | | | | | | | | | | | | |
| | | | Ratios/Supplemental Data | |
| | | | | | | Ratios to Average
Net Assets Before
Reimbursement | | | Ratios to Average
Net Assets After
Reimbursement(d) | | | | |
Total
Return(c) | | | Ending
Net
Assets
(000) | | | Expenses | | | Net
Invest-
ment
Income
(Loss) | | | Expenses | | | Net
Invest-
ment
Income
(Loss) | | | Portfolio
Turnover
Rate | |
| | | | | | | | | | | | | | | | | | | | | | | | | | |
| | 10.14 | % | | $ | 31,814 | | | | 1.48 | % | | | (.41 | )% | | | 1.46 | % | | | (.40 | )% | | | 41 | % |
| | 25.15 | | | | 32,332 | | | | 1.34 | | | | (.11 | ) | | | 1.34 | | | | (.11 | ) | | | 58 | |
| | 2.40 | | | | 29,026 | | | | 1.37 | | | | .46 | | | | 1.37 | | | | .46 | | | | 73 | |
| | (31.75 | ) | | | 28,344 | | | | 1.31 | | | | .75 | | | | 1.31 | | | | .75 | | | | 49 | |
| | 4.18 | | | | 53,498 | | | | 1.26 | | | | .90 | | | | 1.26 | | | | .90 | | | | 63 | |
| | | | | | | | | | | | | | | | | | | | | | | | | | |
| | 9.36 | | | | 1,498 | | | | 2.23 | | | | (1.18 | ) | | | 2.21 | | | | (1.18 | ) | | | 41 | |
| | 24.21 | | | | 1,843 | | | | 2.09 | | | | (.86 | ) | | | 2.09 | | | | (.86 | ) | | | 58 | |
| | 1.56 | | | | 2,080 | | | | 2.12 | | | | (.27 | ) | | | 2.12 | | | | (.27 | ) | | | 73 | |
| | (32.23 | ) | | | 2,373 | | | | 2.06 | | | | — | ** | | | 2.06 | | | | — | ** | | | 49 | |
| | 3.42 | | | | 4,006 | | | | 2.01 | | | | .14 | | | | 2.01 | | | | .14 | | | | 63 | |
| | | | | | | | | | | | | | | | | | | | | | | | | | |
| | 9.89 | | | | 2,246 | | | | 1.73 | | | | (.66 | ) | | | 1.71 | | | | (.65 | ) | | | 41 | |
| | 24.85 | | | | 2,111 | | | | 1.59 | | | | (.35 | ) | | | 1.59 | | | | (.35 | ) | | | 58 | |
| | 2.14 | | | | 2,327 | | | | 1.62 | | | | .19 | | | | 1.62 | | | | .19 | | | | 73 | |
| | (31.90 | ) | | | 2,159 | | | | 1.56 | | | | .50 | | | | 1.56 | | | | .50 | | | | 49 | |
| | 3.96 | | | | 3,263 | | | | 1.51 | | | | .72 | | | | 1.51 | | | | .72 | | | | 63 | |
| | | | | | | | | | | | | | | | | | | | | | | | | | |
| | 10.43 | | | | 48,596 | | | | 1.21 | | | | (.16 | ) | | | 1.21 | | | | (.16 | ) | | | 41 | |
| | 25.43 | | | | 180,875 | | | | 1.09 | | | | .14 | | | | 1.09 | | | | .14 | | | | 58 | |
| | 2.59 | | | | 149,515 | | | | 1.12 | | | | .72 | | | | 1.12 | | | | .72 | | | | 73 | |
| | (31.56 | ) | | | 158,112 | | | | 1.06 | | | | 1.00 | | | | 1.06 | | | | 1.00 | | | | 49 | |
| | 4.45 | | | | 302,683 | | | | 1.01 | | | | 1.15 | | | | 1.01 | | | | 1.15 | | | | 63 | |
| (a) | Per share Net Investment Income (Loss) is calculated using the average daily shares method. |
| (b) | Distributions from Capital Gains include short-term capital gains, if any. |
| (c) | Total return is the combination of changes in net asset value without any sales charge, reinvested dividend income at net asset value and reinvested capital gains distributions at net asset value, if any. Total returns are not annualized. |
| (d) | After expense reimbursement from the Adviser, where applicable. Ratios do not reflect the effect of custodian fee credits earned on the Fund’s net cash on deposit with the custodian bank, where applicable. |
| (e) | Effective January 18, 2011, Class R Shares and Class Y Shares previously offered by FAF Advisors Inc. were renamed Class R3 Shares and Class I Shares, respectively. |
| * | Rounds to less than $.01 per share. |
| ** | Rounds to less than .01%. |
See accompanying notes to financial statements.
Notes to Financial Statements (all dollars and shares are rounded to thousands (000))
1. General Information and Significant Accounting Policies
General Information
On July 28, 2010, U.S. Bancorp, the indirect parent company of FAF Advisors, Inc. (“FAF Advisors”) known as U.S. Bancorp Asset Management, Inc. (“USBAM”) effective January 1, 2011, entered into an agreement to sell a portion of FAF Advisors’ asset management business to Nuveen Investments, Inc. (“Nuveen”). Included in the sale was the part of FAF Advisors’ asset management business that advises the funds included in this report. The sale closed on December 31, 2010 (the “Sale”).
In connection with the Sale, the funds’ Board of Directors was asked to consider and approve new investment advisory agreements for the funds with Nuveen Asset Management, a wholly-owned subsidiary of Nuveen. The new investment advisory agreements for each fund were submitted to the funds’ shareholders for approval and took effect on January 1, 2011. Effective January 1, 2011, the funds’ adviser, Nuveen Asset Management, changed its name to Nuveen Fund Advisors, Inc. (“Nuveen Fund Advisors” or the “Adviser”). Concurrently, the Adviser formed a wholly-owned subsidiary, Nuveen Asset Management, LLC (the “Sub-Adviser”), to house its portfolio management capabilities and to serve as the funds’ sub-adviser, and the funds’ portfolio managers have become employees of the Sub-Adviser. This allocation of responsibilities between the Adviser and the Sub-Adviser affects each of the funds. The Adviser will compensate the Sub-Adviser for the portfolio management services it provides to the funds from each fund’s management fee.
There was no change in the funds’ investment objectives or policies as a result of the Sale. The Sale did result in a change to each fund’s name effective January 1, 2011.
Effective January 18, 2011, Class R Shares and Class Y Shares previously offered by FAF Advisors Inc. were renamed Class R3 and Class I Shares, respectively.
The funds’ Board of Directors also approved new distribution agreements with Nuveen Investments, LLC, a wholly-owned subsidiary of Nuveen. Effective April 30, 2011, Nuveen Investments, LLC changed its name to Nuveen Securities, LLC.
First American Investment Funds, Inc., known as Nuveen Investment Funds, Inc. effective April 4, 2011 (the “Trust”), is an open-end investment company registered under the Investment Company Act of 1940, as amended. The Trust is comprised of Nuveen Equity Income Fund (“Equity Income”) formerly known as First American Equity Income Fund, Nuveen Large Cap Value Fund (“Large Cap Value”) formerly known as First American Large Cap Value Fund, Nuveen Mid Cap Value Fund (“Mid Cap Value”) formerly known as First American Mid Cap Value Fund and Nuveen Small Cap Value Fund (“Small Cap Value”) formerly known as First American Small Cap Value Fund (each a “Fund” and collectively, the “Funds”), among others. The Trust was incorporated in the State of Maryland on August 20, 1987.
Equity Income’s investment objective is long-term growth of capital and income. Under normal market conditions, the Fund invests primarily (at least 80% of its net assets, plus the amount of any borrowings for investment purposes) in equity securities of companies the Sub-Adviser believes are characterized by the ability to pay above average dividends, ability to finance expected growth and strong management. The Fund also invests in convertible debt securities in pursuit of both long-term growth of capital and income. The Fund may invest up to 15% of its total assets in non-dollar denominated equity securities of foreign issuers. The Fund may invest up to 25% of its assets, collectively, in non-dollar denominated equity securities of foreign issuers and in dollar-denominated equity securities of foreign issuers that are either listed on a U.S. stock exchange or represented by depositary receipts that may or may not be sponsored by a domestic bank. Up to 15% of the Fund’s total assets may be invested in equity securities of emerging market issuers.
Large Cap Value’s investment objective is capital appreciation, with current income as the Fund’s secondary objective. Under normal market conditions, the Fund invests primarily (at least 80% of its net assets, plus the amount of any borrowings for investment purposes) in common stocks of large-capitalization companies. The Fund may invest up to 15% of its total assets in non-dollar denominated equity securities of foreign issuers. The Fund may invest up to 25% of its assets, collectively, in non-dollar denominated equity securities of foreign issuers and in dollar-denominated equity securities of foreign issuers that are either listed on a U.S. stock exchange or represented by depositary receipts that may or may not be sponsored by a domestic bank. Up to 15% of the Fund’s total assets may be invested in equity securities of emerging market issuers.
Mid Cap Value’s investment objective is capital appreciation. Under normal market conditions, the Fund invests primarily (at least 80% of its net assets, plus the amount of any borrowings for investment purposes) in common stocks of mid-capitalization companies within the same market capitalization range as the Russell MidCap ® Index. The Fund may invest up to 15% of its total assets in non-dollar denominated equity securities of foreign issuers. The Fund may invest up to 25% of its assets, collectively, in non-dollar denominated equity securities of foreign issuers and in dollar-denominated equity securities of foreign issuers that are either listed on a U.S. stock exchange or represented by depositary receipts that may or may not be sponsored by a domestic bank. Up to 15% of the Fund’s total assets may be invested in equity securities of emerging market issuers.
Small Cap Value’s investment objective is capital appreciation. Under normal market conditions, the Fund invests primarily (at least 80% of its net assets, plus the amount of any borrowings for investment purposes) in common stocks of small-capitalization companies. The Fund may invest up to 15% of its total assets in non-dollar denominated equity securities of foreign issuers. The Fund
may invest up to 25% of its assets, collectively, in non-dollar denominated equity securities of foreign issuers and in dollar-denominated equity securities of foreign issuers that are either listed on a U.S. stock exchange or represented by depositary receipts that may or may not be sponsored by a domestic bank. Up to 15% of the Fund’s total assets may be invested in equity securities of emerging market issuers.
Each Fund may also invest in options, futures contracts, options on futures contracts and forward foreign currency exchanges contracts (“derivatives”) to manage market or business risk, enhance its return or hedge against adverse movements in currency exchange rates.
Each Fund’s most recent prospectus provides further descriptions of each Fund’s investment objective, principal investment strategies and principal risks.
Significant Accounting Policies
The following is a summary of significant accounting policies followed by the Funds in the preparation of their financial statements in accordance with U.S. generally accepted accounting principles (“U.S. GAAP”).
Investment Valuation
Common stocks and other equity-type securities are valued at the last sales price on the securities exchange on which such securities are primarily traded and are generally classified as Level 1 for fair value measurement purposes. Securities primarily traded on the NASDAQ National Market (“NASDAQ”) are valued, except as indicated below, at the NASDAQ Official Closing Price and are generally classified as Level 1. However, securities traded on a securities exchange or NASDAQ for which there were no transactions on a given day or securities not listed on a securities exchange or NASDAQ are valued at the quoted bid price and are generally classified as Level 2. Prices of certain American Depositary Receipts (“ADR”) held by the Funds that trade in only limited volume in the United States are valued based on the last traded price, official closing price, or the most recent bid price of the underlying non-U.S.-traded stock, adjusted as appropriate for the underlying-to-ADR conversion ratio and foreign exchange rate, and from time-to-time may also be adjusted further to take into account material events that may take place after the close of the local non-U.S. market but before the close of the New York Stock Exchange, which generally represents a transfer from a Level 1 to a Level 2 security. Investments in investment companies are valued at their respective net asset values on the valuation date. These investment vehicles are generally classified as Level 1.
The ETFs in which the Funds invests are valued at the last sales price on the securities exchange on which such securities are primarily traded and are generally classified as Level 1.
Certain securities may not be able to be priced by the pre-established pricing methods as described above. Such securities may be valued by the Funds’ Board of Directors or its designee at fair value. These securities generally include, but are not limited to, restricted securities (securities which may not be publicly sold without registration under the Securities Act of 1933, as amended) for which a pricing service is unable to provide a market price; securities whose trading has been formally suspended; debt securities that have gone into default and for which there is no current market quotation; a security whose market price is not available from a pre-established pricing source; a security with respect to which an event has occurred that is likely to materially affect the value of the security after the market has closed but before the calculation of a Fund’s net asset value (as may be the case in non-U.S. markets on which the security is primarily traded) or make it difficult or impossible to obtain a reliable market quotation; and a security whose price, as provided by the pricing service, is not deemed to reflect the security’s fair value. As a general principle, the fair value of a security would appear to be the amount that the owner might reasonably expect to receive for it in a current sale. A variety of factors may be considered in determining the fair value of such securities, which may include consideration of the following: yields or prices of investments of comparable quality, type of issue, coupon, maturity and rating, market quotes or indications of value from security dealers, evaluations of anticipated cash flows or collateral, general market conditions and other information and analysis, including the obligor’s credit characteristics considered relevant. These securities are classified as Level 2 or Level 3 depending on the priority of the significant inputs. Regardless of the method employed to value a particular security, all valuations are subject to review by the Funds’ Board of Directors or its designee.
Refer to Footnote 2 – Fair Value Measurements for further details on the leveling of securities held by the Funds as of the end of the reporting period.
Investment Transactions
Investment transactions are recorded on a trade date basis. Realized gains and losses from investment transactions are determined on the specific identification method, which is the same basis used for federal income tax purposes.
Investment Income
Dividend income is recorded on the ex-dividend date or, for foreign securities, when information is available. Interest income, which reflects the amortization of premiums and includes accretion of discounts for financial reporting purposes is recorded on an accrual basis. Securities lending income is comprised of fees earned from borrowers and income earned on cash collateral investments, net of lending agent fees.
Notes to Financial Statements (all dollars and shares are rounded to thousands (000)) (continued)
Income Taxes
Each Fund is a separate taxpayer for federal income tax purposes. Each Fund intends to distribute substantially all of its net investment income and net capital gains to shareholders and to otherwise comply with the requirements of Subchapter M of the Internal Revenue Code applicable to regulated investment companies. Therefore, no federal income tax provision is required.
For all open tax years and all major taxing jurisdictions, management of the Funds has concluded that there are no significant uncertain tax positions that would require recognition in the financial statements. Open tax years are those that are open for examination by taxing authorities (i.e., generally the last four tax year ends and the interim tax period since then). Furthermore, management of the Funds is also not aware of any tax positions for which it is reasonably possible that the total amounts of unrecognized tax benefits will significantly change in the next twelve months.
Dividends and Distributions to Shareholders
Dividends from net investment income are declared and distributed to shareholders annually for each Fund with the exception of Equity Income, which declares and distributes dividends from net investment income to shareholders quarterly. Dividends from net realized capital gains from investment transactions, if any, are declared and distributed to shareholders at least annually. Furthermore, capital gains are distributed only to the extent they exceed available capital loss carryforwards.
Distributions to shareholders are recorded on the ex-dividend date. The amount and timing of distributions are determined in accordance with federal income tax regulations, which may differ from U.S. GAAP.
Small Cap Value receives substantial distributions from holdings in Real Estate Investment Trusts (“REITs”). Distributions from REITs may be characterized as ordinary income, net capital gain, or a return of capital to the REIT shareholder. The proper characterization of REIT distributions is generally not known until after the end of each calendar year. As such, Real Estate Securities must use estimates in reporting the character of their income and distributions for financial statement purposes. The actual character of distributions to fund shareholders will be reflected on the Form 1099 received by shareholders after the end of the calendar year. Due to the nature of REIT investments, a portion of the distributions received by the Fund shareholder may represent a return of capital.
Derivative Financial Instruments
Each Fund is authorized to invest in certain derivative instruments, including foreign currency forwards, futures, options and swap contracts. Although the Funds are authorized to invest in such financial instruments, and may do so in the future, they did not make any such investments during the fiscal year ended October 31, 2011.
Market and Counterparty Credit Risk
In the normal course of business each Fund may invest in financial instruments and enter into financial transactions where risk of potential loss exists due to changes in the market (market risk) or failure of the other party to the transaction to perform (counterparty credit risk). The potential loss could exceed the value of the financial assets recorded on the financial statements. Financial assets, which potentially expose each Fund to counterparty credit risk, consist principally of cash due from counterparties on forward, option and swap transactions, when applicable. The extent of each Fund’s exposure to counterparty credit risk in respect to these financial assets approximates their carrying value as recorded on the Statement of Assets and Liabilities. Futures contracts, when applicable, expose a Fund to minimal counterparty credit risk as they are exchange traded and the exchange’s clearinghouse, which is counterparty to all exchange traded futures, guarantees the futures contracts against default.
Each Fund helps manage counterparty credit risk by entering into agreements only with counterparties the Adviser believes have the financial resources to honor their obligations and by having the Adviser monitor the financial stability of the counterparties. Additionally, counterparties may be required to pledge collateral daily (based on the daily valuation of the financial asset) on behalf of each Fund with a value approximately equal to the amount of any unrealized gain above a pre-determined threshold. Reciprocally, when each Fund has an unrealized loss, the Funds have instructed the custodian to pledge assets of the Funds as collateral with a value approximately equal to the amount of the unrealized loss above a pre-determined threshold. Collateral pledges are monitored and subsequently adjusted if and when the valuations fluctuate, either up or down, by at least the pre-determined threshold amount.
Multiclass Operations and Allocations
Income and expenses of the Funds that are not directly attributable to a specific class of shares are prorated among the classes based on the relative net assets of each class. Expenses directly attributable to a class of shares, which presently only include distribution fees and shareholder service fees, are recorded to the specific class.
Income, realized and unrealized capital gains and losses of the Funds are prorated among the classes based on the relative net assets of each class.
Interfund Lending Program
During the period November 1, 2010 through December 31, 2010, pursuant to an exemptive order issued by the Securities and Exchange Commission (“SEC”), the Funds, along with other registered investment companies in the First American Funds family, were allowed to participate in an interfund lending program. This program provided an alternative credit facility allowing the Funds to borrow from, or lend money to, other participating funds. The Funds did not have any interfund lending transactions during the period November 1, 2010 through December 31, 2010. The exemptive order terminated with respect to the Funds on December 31, 2010, in connection with the Sale.
Securities Lending
In order to generate additional income, each Fund may lend securities representing up to one-third of the value of its total assets (which includes collateral for securities on loan) to broker-dealers, banks, or other institutional borrowers of securities. Each Fund’s policy is to receive collateral from the borrower in the form of cash, U.S. government securities, or other high-grade debt obligations equal to at least 102% of the value of securities loaned. If the value of the securities on loan increases [such that the level of collateralization falls below 102%], additional collateral is received from the borrower, which is recognized as “Due from broker” on the Statement of Assets and Liabilities. As with other extensions of credit, there may be risks of delay in recovery of the securities or even loss of rights in the collateral should the borrower of the security fail financially.
U.S. Bank National Association (“U.S. Bank”) serves as the securities lending agent for the Funds in transactions involving the lending of portfolio securities on behalf of the Funds. U.S. Bank acts as the securities lending agent pursuant to, and subject to compliance with conditions contained in, an exemptive order issued by the SEC.
During the fiscal year ended October 31, 2011, U.S. Bank, as the securities lending agent, received fees that equaled up to 25% of each Fund’s net income from securities lending transactions through December 31, 2010, and 20% of such net income thereafter. U.S. Bank paid half of such fees to USBAM for certain securities lending services provided by USBAM. Collateral for securities on loan was invested in a money market fund administered by USBAM, which is recognized as “Investments purchased with collateral from securities lending” on the Statement of Assets and Liabilities. USBAM also received an administration fee equal to .02% of each Fund’s average daily net assets invested in the money market fund.
Income from securities lending, net of fees paid to U.S. Bank, is recognized on the Statement of Operations as “Securities lending income.” Securities lending fees paid to U.S. Bank by each Fund during the fiscal year ended October 31, 2011, were as follows:
| | | | | | | | | | | | | | | | |
| | | Equity
Income | | | Large Cap
Value | | | Mid Cap
Value | | | Small Cap
Value | |
Securities lending fees paid | | $ | 40 | | | $ | 13 | | | $ | 19 | | | $ | 10 | |
Indemnifications
Under the Trust’s organizational documents, its officers and directors are indemnified against certain liabilities arising out of the performance of their duties to the Trust. In addition, in the normal course of business, the Trust enters into contracts that provide general indemnifications to other parties. The Trust’s maximum exposure under these arrangements is unknown as this would involve future claims that may be made against the Trust that have not yet occurred. However, the Trust has not had prior claims or losses pursuant to these contracts and expects the risk of loss to be remote.
Use of Estimates
The preparation of financial statements in conformity with U.S. GAAP requires management to make estimates and assumptions that affect the reported amounts of assets and liabilities at the date of the financial statements and the reported amounts of increases and decreases in net assets from operations during the reporting period. Actual results may differ from those estimates.
2. Fair Value Measurements
Fair value is defined as the price that the Funds would receive upon selling an investment or transferring a liability in an orderly transaction to an independent buyer in the principal or most advantageous market for the investment. A three-tier hierarchy is used to maximize the use of observable market data and minimize the use of unobservable inputs and to establish classification of fair value measurements for disclosure purposes. Observable inputs reflect the assumptions market participants would use in pricing the asset or liability. Observable inputs are based on market data obtained from sources independent of the reporting entity. Unobservable inputs reflect the reporting entity’s own assumptions about the assumptions market participants would use in pricing the asset or liability. Unobservable inputs are based on the best information available in the circumstances. The three-tier hierarchy of inputs is summarized in the three broad levels listed below:
| | |
| Level 1 – | | Quoted prices in active markets for identical securities. |
| Level 2 – | | Other significant observable inputs, (including quoted prices for similar securities, interest rates, prepayment speeds, credit risk, etc.). |
| Level 3 – | | Significant unobservable inputs (including management’s assumptions in determining the fair value of investments). |
The inputs or methodologies used for valuing securities are not an indication of the risk associated with investing in those securities. The following is a summary of each Fund’s fair value measurements as of October 31, 2011:
| | | | | | | | | | | | | | | | |
| Equity Income | | Level 1 | | | Level 2 | | | Level 3 | | | Total | |
Investments: | | | | | | | | | | | | | | | | |
Common Stocks | | $ | 1,061,475 | | | $ | — | | | $ | — | | | $ | 1,061,475 | |
Money Market Funds* | | | 321,455 | | | | — | | | | — | | | | 321,455 | |
Short-Term Investments | | | 19,973 | | | | — | | | | — | | | | 19,973 | |
Total | | $ | 1,402,903 | | | $ | — | | | $ | — | | | $ | 1,402,903 | |
| * | Represents the Fund’s investments purchased with collateral from securities lending. |
Notes to Financial Statements (all dollars and shares are rounded to thousands (000)) (continued)
| | | | | | | | | | | | | | | | |
| | | | |
| Large Cap Value | | Level 1 | | | Level 2 | | | Level 3 | | | Total | |
Investments: | | | | | | | | | | | | | | | | |
Common Stocks | | $ | 153,035 | | | $ | — | | | $ | — | | | $ | 153,035 | |
Money Market Funds* | | | 42,625 | | | | — | | | | — | | | | 42,625 | |
Short-Term Investments | | | 1,306 | | | | — | | | | — | | | | 1,306 | |
Total | | $ | 196,966 | | | $ | — | | | $ | — | | | $ | 196,966 | |
| | | | | | | | | | | | | | | | |
| | | | |
| Mid Cap Value | | Level 1 | | | Level 2 | | | Level 3 | | | Total | |
Investments: | | | | | | | | | | | | | | | | |
Common Stocks | | $ | 228,458 | | | $ | — | | | $ | — | | | $ | 228,458 | |
Money Market Funds* | | | 76,050 | | | | — | | | | — | | | | 76,050 | |
Short-Term Investments | | | 2,807 | | | | — | | | | — | | | | 2,807 | |
Total | | $ | 307,315 | | | $ | — | | | $ | — | | | $ | 307,315 | |
| | | | |
| Small Cap Value | | Level 1 | | | Level 2 | | | Level 3 | | | Total | |
Investments: | | | | | | | | | | | | | | | | |
Common Stocks | | $ | 81,033 | | | $ | — | | | $ | — | | | $ | 81,033 | |
Investment Companies | | | 892 | | | | — | | | | — | | | | 892 | |
Money Market Funds* | | | 33,681 | | �� | | — | | | | — | | | | 33,681 | |
Short-Term Investments | | | 2,222 | | | | — | | | | — | | | | 2,222 | |
Total | | $ | 117,828 | | | $ | — | | | $ | — | | | $ | 117,828 | |
| * | Represents the Fund’s investments purchased with collateral from securities lending. |
During the fiscal year ended October 31, 2011, the Funds recognized no significant transfers to or from Level 1, Level 2 or Level 3.
3. Derivative Instruments and Hedging Activities
The Funds record derivative instruments at fair value, with changes in fair value recognized on the Statement of Operations, when applicable. Even though the Funds’ investments in derivatives may represent economic hedges, they are not considered to be hedge transactions for financial reporting purposes. The Funds did not invest in derivative instruments during the fiscal year ended October 31, 2011.
4. Fund Shares
Transactions in Fund shares were as follows:
| | | | | | | | | | | | | | | | |
| | | Equity Income | |
| | | Year Ended
10/31/11 | | | Year Ended
10/31/10 | |
| | | Shares | | | Amount | | | Shares | | | Amount | |
Shares sold: | | | | | | | | | | | | | | | | |
Class A | | | 6,608 | | | $ | 87,418 | | | | 2,350 | | | $ | 27,882 | |
Class B | | | 3 | | | | 47 | | | | 7 | | | | 84 | |
Class C | | | 709 | | | | 9,350 | | | | 587 | | | | 6,915 | |
Class R3(1) | | | 1,002 | | | | 12,619 | | | | 93 | | | | 1,089 | |
Class I(1) | | | 25,219 | | | | 331,973 | | | | 12,184 | | | | 144,124 | |
Shares issued to shareholders due to reinvestment of distributions: | | | | | | | | | | | | | | | | |
Class A | | | 232 | | | | 3,044 | | | | 226 | | | | 2,661 | |
Class B | | | 2 | | | | 29 | | | | 10 | | | | 107 | |
Class C | | | 10 | | | | 131 | | | | 11 | | | | 128 | |
Class R3(1) | | | 6 | | | | 75 | | | | 1 | | | | 11 | |
Class I(1) | | | 467 | | | | 6,206 | | | | 343 | | | | 4,079 | |
| | | | 34,258 | | | | 450,892 | | | | 15,812 | | | | 187,080 | |
Shares redeemed: | | | | | | | | | | | | | | | | |
Class A | | | (3,368 | ) | | | (44,368 | ) | | | (1,792 | ) | | | (20,975 | ) |
Class B | | | (184 | ) | | | (2,429 | ) | | | (287 | ) | | | (3,330 | ) |
Class C | | | (177 | ) | | | (2,328 | ) | | | (155 | ) | | | (1,799 | ) |
Class R3(1) | | | (177 | ) | | | (2,358 | ) | | | (8 | ) | | | (99 | ) |
Class I(1) | | | (14,801 | ) | | | (197,668 | ) | | | (10,482 | ) | | | (124,062 | ) |
| | | | (18,707 | ) | | | (249,151 | ) | | | (12,724 | ) | | | (150,265 | ) |
Net increase (decrease) | | | 15,551 | | | $ | 201,741 | | | | 3,088 | | | $ | 36,815 | |
| (1) | Effective January 18, 2011, Class R Shares and Class Y Shares previously offered by FAF Advisors, Inc. were renamed Class R3 Shares and Class I Shares, respectively. |
| | | | | | | | | | | | | | | | |
| |
| | | Large Cap Value | |
| | | Year Ended
10/31/11 | | | Year Ended
10/31/10 | |
| | | Shares | | | Amount | | | Shares | | | Amount | |
Shares sold: | | | | | | | | | | | | | | | | |
Class A | | | 130 | | | $ | 1,984 | | | | 140 | | | $ | 1,946 | |
Class B | | | — | | | | 6 | | | | — | | | | — | |
Class C | | | 6 | | | | 96 | | | | 6 | | | | 74 | |
Class R3(1) | | | 19 | | | | 283 | | | | 36 | | | | 486 | |
Class I(1) | | | 408 | | | | 6,071 | | | | 1,074 | | | | 14,969 | |
Shares issued to shareholders due to reinvestment of distributions: | | | | | | | | | | | | | | | | |
Class A | | | 42 | | | | 643 | | | | 48 | | | | 671 | |
Class B | | | — | | | | 6 | | | | — | | | | 10 | |
Class C | | | — | | | | 5 | | | | — | | | | 6 | |
Class R3(1) | | | 1 | | | | 9 | | | | — | | | | 4 | |
Class I(1) | | | 74 | | | | 1,126 | | | | 237 | | | | 3,338 | |
| | | | 680 | | | | 10,229 | | | | 1,541 | | | | 21,504 | |
Shares redeemed: | | | | | | | | | | | | | | | | |
Class A | | | (607 | ) | | | (9,237 | ) | | | (731 | ) | | | (10,076 | ) |
Class B | | | (33 | ) | | | (483 | ) | | | (83 | ) | | | (1,124 | ) |
Class C | | | (25 | ) | | | (371 | ) | | | (68 | ) | | | (910 | ) |
Class R3(1) | | | (21 | ) | | | (322 | ) | | | (6 | ) | | | (81 | ) |
Class I(1) | | | (4,021 | ) | | | (64,483 | ) | | | (6,787 | ) | | | (94,336 | ) |
Class I(1) – In-kind | | | (9,126 | ) | | | (132,685 | ) | | | — | | | | — | |
| | | | (13,833 | ) | | | (207,581 | ) | | | (7,675 | ) | | | (106,527 | ) |
Net increase (decrease) | | | (13,153 | ) | | $ | (197,352 | ) | | | (6,134 | ) | | $ | (85,023 | ) |
| |
| | | Mid Cap Value | |
| | | Year Ended
10/31/11 | | | Year Ended
10/31/10 | |
| | | Shares | | | Amount | | | Shares | | | Amount | |
Shares sold: | | | | | | | | | | | | | | | | |
Class A | | | 541 | | | $ | 12,713 | | | | 826 | | | $ | 16,925 | |
Class B | | | — | | | | 7 | | | | — | | | | 1 | |
Class C | | | 21 | | | | 482 | | | | 34 | | | | 685 | |
Class R3(1) | | | 239 | | | | 5,505 | | | | 508 | | | | 10,515 | |
Class I(1) | | | 864 | | | | 20,279 | | | | 2,458 | | | | 50,896 | |
Shares issued to shareholders due to reinvestment of distributions: | | | | | | | | | | | | | | | | |
Class A | | | 32 | | | | 764 | | | | 51 | | | | 1,027 | |
Class B | | | — | | | | 9 | | | | 1 | | | | 14 | |
Class C | | | 2 | | | | 42 | | | | 2 | | | | 41 | |
Class R3(1) | | | 6 | | | | 141 | | | | 9 | | | | 180 | |
Class I(1) | | | 47 | | | | 1,125 | | | | 205 | | | | 4,150 | |
| | | | 1,752 | | | | 41,067 | | | | 4,094 | | | | 84,434 | |
Shares redeemed: | | | | | | | | | | | | | | | | |
Class A | | | (1,629 | ) | | | (37,492 | ) | | | (4,548 | ) | | | (89,871 | ) |
Class B | | | (34 | ) | | | (775 | ) | | | (68 | ) | | | (1,328 | ) |
Class C | | | (137 | ) | | | (3,111 | ) | | | (179 | ) | | | (3,517 | ) |
Class R3(1) | | | (455 | ) | | | (10,396 | ) | | | (1,015 | ) | | | (20,572 | ) |
Class I(1) | | | (3,914 | ) | | | (94,066 | ) | | | (5,579 | ) | | | (115,441 | ) |
Class I(1) – In-kind | | | (11,138 | ) | | | (261,914 | ) | | | — | | | | — | |
| | | | (17,307 | ) | | | (407,754 | ) | | | (11,389 | ) | | | (230,729 | ) |
Net increase (decrease) | | | (15,555 | ) | | $ | (366,687 | ) | | | (7,295 | ) | | $ | (146,295 | ) |
| (1) | Effective January 18, 2011, Class R Shares and Class Y Shares previously offered by FAF Advisors, Inc. were renamed Class R3 Shares and Class I Shares, respectively. |
Notes to Financial Statements (all dollars and shares are rounded to thousands (000)) (continued)
| | | | | | | | | | | | | | | | |
| |
| | | Small Cap Value | |
| | | Year Ended
10/31/11 | | | Year Ended
10/31/10 | |
| | | Shares | | | Amount | | | Shares | | | Amount | |
Shares sold: | | | | | | | | | | | | | | | | |
Class A | | | 411 | | | $ | 4,808 | | | | 171 | | | $ | 1,626 | |
Class C | | | 25 | | | | 264 | | | | 28 | | | | 242 | |
Class R3 (1) | | | 60 | | | | 690 | | | | 149 | | | | 1,416 | |
Class I (1) | | | 1,125 | | | | 13,450 | | | | 2,082 | | | | 20,325 | |
Shares issued to shareholders due to reinvestment of distributions: | | | | | | | | | | | | | | | | |
Class A | | | — | | | | — | | | | 9 | | | | 81 | |
Class C | | | — | | | | — | | | | — | | | | — | |
Class R3 (1) | | | — | | | | — | | | | — | | | | 1 | |
Class I (1) | | | — | | | | — | | | | 68 | | | | 635 | |
| | | | 1,621 | | | | 19,212 | | | | 2,507 | | | | 24,326 | |
Shares redeemed: | | | | | | | | | | | | | | | | |
Class A | | | (748 | ) | | | (8,800 | ) | | | (560 | ) | | | (5,270 | ) |
Class C | | | (77 | ) | | | (778 | ) | | | (110 | ) | | | (894 | ) |
Class R3 (1) | | | (67 | ) | | | (777 | ) | | | (227 | ) | | | (2,197 | ) |
Class I (1) | | | (2,666 | ) | | | (33,926 | ) | | | (2,702 | ) | | | (25,790 | ) |
Class I(1) – In-kind | | | (11,425 | ) | | | (127,930 | ) | | | — | | | | — | |
| | | | (14,983 | ) | | | (172,211 | ) | | | (3,599 | ) | | | (34,151 | ) |
Net increase (decrease) | | | (13,362 | ) | | $ | (152,999) | | | | (1,092 | ) | | $ | (9,825 | ) |
| (1) | Effective January 18, 2011, Class R Shares and Class Y Shares previously offered by FAF Advisors, Inc. were renamed Class R3 Shares and Class I Shares, respectively. |
Class B Shares that converted to Class A Shares (reflected above as a component of Class A Shares sold and Class B Shares redeemed) during the fiscal years ended October 31, 2011 and October 31, 2010, were as follows:
| | | | | | | | |
| Fund | | Year Ended
10/31/11 | | | Year Ended
10/31/10 | |
Equity Income | | | 112 | | | | 197 | |
Large Cap Value | | | 23 | | | | 60 | |
Mid Cap Value | | | 18 | | | | 39 | |
5. Investment Transactions
Purchases and sales (excluding investments purchased with collateral from securities lending and short-term investments, where applicable) during the fiscal year ended October 31, 2011, were as follows:
| | | | | | | | | | | | | | | | |
| | | Equity
Income | | | Large Cap
Value | | | Mid Cap
Value | | | Small Cap
Value | |
Purchases | | $ | 536,089 | | | $ | 236,343 | | | $ | 413,989 | | | $ | 47,538 | |
Sales and maturities | | | 328,909 | | | | 434,892 | | | | 780,913 | | | | 198,292 | |
6. Income Tax Information
The following information is presented on an income tax basis. Differences between amounts for financial statement and federal income tax purposes are primarily due to timing differences in recognizing certain gains and losses on investment transactions. To the extent that differences arise that are permanent in nature, such amounts are reclassified within the capital accounts as detailed below. Temporary differences do not require reclassification. Temporary and permanent differences do not impact the net asset values of the Funds.
At October 31, 2011, the cost and unrealized appreciation (depreciation) of investments, as determined on a federal income tax basis, were as follows:
| | | | | | | | | | | | | | | | |
| | | Equity
Income | | | Large Cap
Value | | | Mid Cap
Value | | | Small Cap
Value | |
Cost of investments | | $ | 1,175,196 | | | $ | 198,260 | | | $ | 305,022 | | | $ | 111,127 | |
Gross unrealized: | | | | | | | | | | | | | | | | |
Appreciation | | $ | 235,448 | | | $ | 11,015 | | | $ | 15,735 | | | $ | 12,362 | |
Depreciation | | | (7,741 | ) | | | (12,309 | ) | | | (13,442 | ) | | | (5,661 | ) |
Net unrealized appreciation (depreciation) of investments | | $ | 227,707 | | | $ | (1,294 | ) | | $ | 2,293 | | | $ | 6,701 | |
Permanent differences, primarily due to the redemption-in-kind, net operating losses, tax equalization, REIT adjustments, and investments in partnerships, resulted in reclassifications among the Funds’ components of net assets at October 31, 2011, the Funds’ tax year end, as follows:
| | | | | | | | | | | | | | | | |
| | | Equity
Income | | | Large Cap
Value | | | Mid Cap
Value | | | Small Cap
Value | |
Capital paid-in | | $ | 346 | | | $ | 15,382 | | | $ | 50,922 | | | $ | 27,174 | |
Undistributed (Over-distribution) of net investment income | | | (1,263 | ) | | | (44 | ) | | | (154 | ) | | | 291 | |
Accumulated net realized gain (loss) | | | 917 | | | | (15,338 | ) | | | (50,768 | ) | | | (27,465 | ) |
The tax components of undistributed net ordinary income and net long-term capital gains at October 31, 2011, the Funds’ tax year end, were as follows:
| | | | | | | | | | | | | | | | |
| | | Equity
Income | | | Large Cap
Value | | | Mid Cap
Value | | | Small Cap
Value | |
Undistributed net ordinary income* | | $ | 2,009 | | | $ | 881 | | | $ | 1,514 | | | $ | — | |
Undistributed net long-term capital gains | | | — | | | | — | | | | — | | | | — | |
| * | Net ordinary income consists of net taxable income derived from dividends, interest and net short-term capital gains, if any. |
The tax character of distributions paid during the Funds’ tax years ended October 31, 2011 and October 31, 2010, was designated for purposes of the dividends paid deduction as follows:
| | | | | | | | | | | | | | | | |
| 2011 | | Equity
Income | | | Large Cap
Value | | | Mid Cap
Value | | | Small Cap
Value | |
Distributions from net ordinary income* | | $ | 23,121 | | | $ | 3,092 | | | $ | 3,984 | | | $ | — | |
Distributions from net long-term capital gains | | | — | | | | — | | | | — | | | | — | |
| | | | |
| 2010 | | Equity
Income | | | Large Cap
Value | | | Mid Cap
Value | | | Small Cap
Value | |
Distributions from net ordinary income* | | $ | 20,892 | | | $ | 5,827 | | | $ | 7,361 | | | $ | 836 | |
Distributions from net long-term capital gains | | | — | | | | — | | | | — | | | | — | |
| * | Net ordinary income consists of net taxable income derived from dividends, interest, net short-term capital gains and current year earnings and profits attributable to realized gains, if any. |
At October 31, 2011, the Funds’ tax year end, the Funds had unused capital loss carryforwards available for federal income tax purposes to be applied against future capital gains, if any. If not applied, the carryforwards will expire as follows:
| | | | | | | | | | | | | | | | |
| | | Equity
Income | | | Large Cap
Value | | | Mid Cap
Value | | | Small Cap
Value | |
Expiration: | | | | | | | | | | | | | | | | |
October 31, 2016 | | $ | — | | | $ | 9,778 | | | $ | — | | | $ | 3,445 | |
October 31, 2017 | | | 1,441 | | | | 80,887 | | | | 64,991 | | | | 37,113 | |
Total | | $ | 1,441 | | | $ | 90,665 | | | $ | 64,991 | | | $ | 40,558 | |
During the Funds’ tax year ended October 31, 2011, the Funds utilized their capital loss carryforwards as follows:
| | | | | | | | | | | | | | | | |
| | | Equity
Income | | | Large Cap
Value | | | Mid Cap
Value | | | Small Cap
Value | |
Utilized capital loss carryforwards | | $ | 6,857 | | | $ | 19,153 | | | $ | 42,620 | | | $ | 10,362 | |
7. Management Fees and Other Transactions with Affiliates
Investment Advisory Fees
During the period November 1, 2010 through December 31, 2010, pursuant to an investment advisory agreement (the “Agreement”), FAF Advisors managed each Fund’s assets and furnished related office facilities, equipment, research, and personnel. The Agreement required each Fund to pay FAF Advisors a monthly advisory fee, on an annual basis, equal to each Fund’s average daily net assets as follows:
| | | | |
| Fund | | Advisory Fee Rate | |
Equity Income* | | | .65 | % |
Large Cap Value* | | | .65 | |
Mid Cap Value | | | .70 | |
Small Cap Value | | | .70 | |
| * | The advisory fees for Equity Income and Large Cap Value were equal to an annual rate of .65% of the average daily net assets up to $3 billion, .625% of the average daily net assets on the next $2 billion and .60% of the average daily net assets in excess of $5 billion. |
Notes to Financial Statements (all dollars and shares are rounded to thousands (000)) (continued)
Effective January 1, 2011, pursuant to a new investment advisory agreement (the “New Agreement”), the Funds’ new investment adviser is Nuveen Fund Advisors. Under the New Agreement, each Fund’s management fee consists of two components – a fund-level fee, based only on the amount of assets within each individual Fund, and a complex-level fee, based on the aggregate amount of all eligible fund assets managed by Nuveen Fund Advisors. This pricing structure enables each Fund’s shareholders to benefit from growth in the assets within their respective Fund as well as from growth in the amount of complex-wide assets managed by Nuveen Fund Advisors.
The annual fund-level fee for each Fund, payable monthly, is calculated according to the following schedule:
| | | | | | | | | | | | | | | | |
| Average Daily Net Assets | | Equity
Income Fund-Level
Fee Rate | | | Large
Cap Value Fund-Level
Fee Rate | | | Mid Cap
Value Fund-Level
Fee Rate | | | Small
Cap Value Fund-Level
Fee Rate | |
For the first $125 million | | | .6000 | % | | | .5500 | % | | | .7000 | % | | | .7000 | % |
For the next $125 million | | | .5875 | | | | .5375 | | | | .6875 | | | | .6875 | |
For the next $250 million | | | .5750 | | | | .5250 | | | | .6750 | | | | .6750 | |
For the next $500 million | | | .5625 | | | | .5125 | | | | .6625 | | | | .6625 | |
For the next $1 billion | | | .5500 | | | | .5000 | | | | .6500 | | | | .6500 | |
For net assets over $2 billion | | | .5250 | | | | .4750 | | | | .6250 | | | | .6250 | |
The annual complex-level fee for each Fund, payable monthly, is determined by taking the complex-level fee rate, which is based on the aggregate amount of “eligible assets” of all Nuveen funds as set forth in the schedule below, and making, as appropriate, an upward adjustment to that rate based upon the percentage of the particular fund’s assets that are not “eligible assets.” The complex-level fee schedule for each Fund as follows:
| | | | |
| Complex-Level Asset Breakpoint Level* | | Effective Rate at Breakpoint Level | |
$55 billion | | | .2000 | % |
$56 billion | | | .1996 | |
$57 billion | | | .1989 | |
$60 billion | | | .1961 | |
$63 billion | | | .1931 | |
$66 billion | | | .1900 | |
$71 billion | | | .1851 | |
$76 billion | | | .1806 | |
$80 billion | | | .1773 | |
$91 billion | | | .1691 | |
$125 billion | | | .1599 | |
$200 billion | | | .1505 | |
$250 billion | | | .1469 | |
$300 billion | | | .1445 | |
| * | The complex-level fee is calculated based upon the aggregate daily “eligible assets” of all Nuveen Funds. Eligible assets do not include assets attributable to investments in other Nuveen Funds or assets in excess of $2 billion added to the Nuveen Fund complex in connection with Nuveen Fund Advisors’ assumption of the management of the former First American Funds effective January 1, 2011. Eligible assets include closed-end fund assets managed by Nuveen Fund Advisors that are attributable to financial leverage. For these purposes, financial leverage includes the closed-end funds’ use of preferred stock and borrowings and investments in the residual interest certificates (also called inverse floating rate securities) in tender option bond (TOB) trusts, including the portion of assets held by the TOB trust that has been effectively financed by the trust’s issuance of floating rate securities, subject to an agreement by Nuveen Fund Advisors as to certain funds to limit the amount of such assets for determining eligible assets in certain circumstances. As of October 31, 2011, the complex-level fee rate for each Fund was as follows: |
| | | | |
| Fund | | Complex-Level Fee Rate | |
Equity Income | | | .1945 | % |
Large Cap Value | | | .2000 | |
Mid Cap Value | | | .2000 | |
Small Cap Value | | | .2000 | |
The management fee compensates Nuveen Fund Advisors for the overall investment advisory and administrative services and general office facilities it provides for the Funds. Nuveen Fund Advisors is responsible for each Fund’s overall strategy and asset allocation decisions. Effective January 1, 2011, Nuveen Fund Advisors has entered into a sub-advisory agreement with the Sub-Adviser, under which the Sub-Adviser manages the investment portfolios of the Funds. The Sub-Adviser will be compensated for its services to the Funds from the management fees paid to Nuveen Fund Advisors.
During the period November 1, 2010 through December 31, 2010, the Funds may have invested in related money market funds that were a series of First American Funds, Inc., subject to certain limitations. In order to avoid the payment of duplicative investment advisory fees to FAF Advisors, which acted as the investment advisor to both the investing Funds and the related money market funds, FAF Advisors reimbursed each investing Fund an amount equal to that portion of FAF Advisors’ investment advisory fee received from
the related money market funds that was attributable to the assets of the investing Funds. This reimbursement, if any, is recognized as a component of “Expense reimbursement” on the Statement of Operations, and terminated with respect to the Funds on December 31, 2010, in connection with the Sale.
Effective January 1, 2011, Nuveen Fund Advisors agreed to waive fees and reimburse other Fund expenses of Mid Cap Value and Small Cap Value so that total annual Fund operating expenses, after waivers and excluding any acquired Fund fees and expenses, do not exceed the average daily net assets of any class of Fund shares in the amounts and for the time periods stated in the following table:
| | | | | | | | |
| | | Mid Cap
Value | | | Small Cap
Value | |
Class A Shares | | | 1.3400 | % | | | 1.500 | % |
Class B Shares | | | 2.0900 | | | | N/A | |
Class C Shares | | | 2.0900 | | | | 2.2500 | |
Class R3 Shares(1) | | | 1.5900 | | | | 1.7500 | |
Class I Shares(1) | | | 1.0900 | | | | 1.2500 | |
Expiration Date | | | February 29, 2012 | | | | February 29, 2012 | |
| N/A | Fund does not offer Class B Shares. |
| (1) | Effective January 18, 2011, Class R Shares and Class Y Shares previously offered by FAF Advisors, Inc. were renamed Class R3 Shares and Class I Shares, respectively. |
During the period November 1, 2010 through December 31, 2010, independent directors of the Funds may have participated and elected to defer receipt of part or all of their annual compensation under a deferred compensation plan (the “Plan”). Deferred amounts were treated as though equivalent dollar amounts had been invested in shares of selected open-end funds as designated by each director. All amounts in the Plan were 100% vested and accounts under the Plan were obligations of the Funds. Deferred amounts remain in the Funds until distributed in accordance with the Plan.
Effective January 1, 2011, independent directors may elect to defer receipt of all or a portion of the annual compensation they are entitled to receive from certain Funds advised by Nuveen Fund Advisors. Under the plan, deferred amounts are treated as though equal dollar amounts had been invested in shares of select Funds advised by Nuveen Fund Advisors.
Administration Fees
During the period November 1, 2010 through December 31, 2010, FAF Advisors served as the Funds’ administrator pursuant to an administration agreement between FAF Advisors and the Funds. U.S. Bancorp Fund Services, LLC (“USBFS”) served as sub-administrator pursuant to a sub-administration agreement between USBFS and FAF Advisors. FAF Advisors is a subsidiary of U.S. Bank. Both U.S. Bank and USBFS are direct subsidiaries of U.S. Bancorp. Under the administration agreement, FAF Advisors was compensated to provide, or compensated other entities to provide, services to the Funds. These services included various legal, oversight, and administrative and accounting services. The Funds paid FAF Advisors administration fees, which were calculated daily and paid monthly, equal to each Fund’s pro rata share of an amount equal, on an annual basis, to .25% of the aggregate average daily net assets of all open-end funds in the First American Funds family up to $8 billion, .235% on the next $17 billion of the aggregate average daily net assets, .22% on the next $25 billion of the aggregate average daily net assets, and .20% of the aggregate average daily net assets in excess of $50 billion. All fees paid to the sub-administrator were paid from the administration fee. In addition to these fees, the Funds may have reimbursed FAF Advisors and the sub-administrator for any out-of-pocket expenses incurred in providing administration services. Effective January 1, 2011, FAF Advisors and USBFS no longer serve as the Funds’ administrator and sub-administrator, respectively, and the Funds have not entered into any new administration or sub-administration agreements.
Transfer Agent Fees
USBFS serves as the Funds’ transfer agent pursuant to a transfer agent agreement with the Trust. The Funds are charged transfer agent fees on a per shareholder account basis, subject to a minimum fee per share class. These fees are charged to each Fund based upon the number of accounts within each Fund. In addition to these fees, the Funds may reimburse USBFS for out-of-pocket expenses incurred in providing transfer agent services.
Custodian Fees
U.S. Bank serves as the custodian for each Fund pursuant to a custodian agreement with the Trust. The custodian fee charged for each Fund is equal to an annual rate of 0.005% of average daily net assets. All fees are computed daily and paid monthly.
Interest earned on un-invested cash balances is used to reduce a portion of each Fund’s custodian expenses. These credits, if any, are recognized as “Custodian fee credit” on the Statement of Operations. Conversely, the custodian charges a fee for any cash overdrafts incurred, which increases the Funds’ custodian expenses.
Distribution and Shareholder Servicing (12b-1) Fees
During the period November 1, 2010 through December 31, 2010, Quasar Distributors, LLC (“Quasar”), a subsidiary of U.S. Bancorp, served as the distributor of the Funds pursuant to a distribution agreement with the Trust. Under the distribution agreement, and pursuant to a plan adopted by each Fund under Rule 12b-1 of the Investment Company Act, each Fund paid Quasar a monthly distribution and/or shareholder servicing fee equal to an annual rate of .25%, 1.00%, 1.00% and .50% of each Fund’s average daily net assets of Class A, Class B, Class C and Class R Shares (renamed Class R3 Shares), respectively. No distribution or shareholder servicing
Notes to Financial Statements (all dollars and shares are rounded to thousands (000)) (continued)
fees were paid by Class Y Shares (renamed Class I Shares). These fees may have been used by Quasar to provide compensation for sales support, distribution activities, and/or shareholder servicing activities. During the period November 1, 2010 through December 31, 2010, there were no distribution and shareholder servicing fees waived by Quasar.
Effective January 1, 2011, the Funds have entered into a distribution agreement with Nuveen Securities LLC, who now serves as the Funds’ distributor. Class A Shares continue to incur a .25% annual 12b-1 service fee. Class B Shares and Class C Shares continue to incur a .75% annual 12b-1 distribution fee and a .25% annual 12b-1 service fee. Class R3 Shares continue to incur a .25% annual 12b-1 distribution fee and a .25% annual 12b-1 service fee. Class I Shares continue to not be subject to any sales charge or 12b-1 distribution or service fees. Annual distribution and service fees are based on average daily net assets.
During the fiscal year ended October 31, 2011, Quasar and/or Nuveen Securities, LLC collected sales charges on purchases of Class A Shares, the majority of which were paid out as concessions to financial intermediaries as follows:
| | | | | | | | | | | | | | | | |
| | | Equity
Income | | | Large Cap
Value | | | Mid Cap
Value | | | Small Cap
Value | |
Sales charges collected (Unaudited) | | $ | 298 | | | $ | 19 | | | $ | 29 | | | $ | 15 | |
Paid to financial intermediaries (Unaudited) | | | 268 | | | | 17 | | | | 26 | | | | 13 | |
Quasar and/or Nuveen Securities, LLC also received 12b-1 service fees in Class A Shares, substantially all of which were paid to compensate financial intermediaries for providing services to shareholders relating to their investments.
During the fiscal year ended October 31, 2011, Quasar and/or Nuveen Securities, LLC compensated financial intermediaries directly with commission advances at the time of purchase as follows:
| | | | | | | | | | | | | | | | |
| | | Equity
Income | | | Large Cap
Value | | | Mid Cap
Value | | | Small Cap
Value | |
Commission advances (Unaudited) | | $ | 122 | | | $ | — | | | $ | 4 | | | $ | 2 | |
All 12b-1 service and distribution fees collected on Class B and C Shares during the first year following a purchase were retained by Quasar and/or the Nuveen Securities, LLC to compensate for commissions advanced to financial intermediaries. During the fiscal year ended October 31, 2011, Quasar and/or the Nuveen Securities, LLC retained such 12b-1 fees as follows:
| | | | | | | | | | | | | | | | |
| | | Equity
Income | | | Large Cap
Value | | | Mid Cap
Value | | | Small Cap
Value | |
12b-1 fees retained (Unaudited) | | $ | 112 | | | $ | 9 | | | $ | 24 | | | $ | 3 | |
The remaining 12b-1 fees charged to the Funds were paid to compensate financial intermediaries for providing services to shareholders relating to their investments.
Other Fees and Expenses
In addition to the investment advisory fees, administration fees, transfer agent fees, custodian fees, and distribution and shareholder servicing fees, each Fund is responsible for paying other operating expenses, including: legal, auditing, registration fees, postage and printing of shareholder reports, fees and expenses of independent directors, insurance, and other miscellaneous expenses. During the period November 1, 2010 through December 31, 2010, legal fees and expenses of $4 were paid to a law firm of which an Assistant Secretary of the Funds was a partner.
Contingent Deferred Sales Charges
During the period November 1, 2010 through January 17, 2011, Class A Shares of the Funds were sold with an up-front sales charge of 5.50%. Class B Shares were subject to a contingent deferred sales charge (“CDSC”) of up to 5% depending upon the length of time the shares were held by the investor (CDSC is reduced to 0% at the end of six years). Class B Shares automatically converted to Class A Shares eight years after purchase. Class C Shares were subject to a CDSC of 1% for twelve months. Class R Shares (renamed Class R3 Shares) and Class Y Shares (renamed Class I Shares) had no sales charge and were offered only to certain qualifying accounts and qualifying institutional investors, respectively.
Effective January 18, 2011, Class A Shares of the Funds are sold with an up-front sales charge of 5.75%. Class A Share purchases of the Funds continue to be subject to a CDSC of 1% if redeemed within twelve months of purchase. Class B Shares continue to be subject to a CDSC of up to 5% depending upon the length of time the shares are held by the investor (CDSC continues to be reduced to 0% at the end of six years). Class B Shares continue to automatically convert to Class A Shares eight years after purchase. Class C Shares continue to be subject to a CDSC of 1% if redeemed within twelve months of purchase. Class R3 Shares and Class I Shares continue to have no sales charge and are offered only to certain qualifying accounts and qualifying institutional investors, respectively.
Quasar and/or Nuveen Securities, LLC also collected and retained CDSC on share redemptions during the fiscal year ended October 31, 2011, as follows:
| | | | | | | | | | | | | | | | |
| | | Equity
Income | | | Large Cap
Value | | | Mid Cap
Value | | | Small Cap
Value | |
CDSC retained (Unaudited) | | $ | 8 | | | $ | — | | | $ | 5 | | | $ | 1 | |
Affiliated 401(k) Plan and Redemptions In-Kind
An affiliated 401(k) plan of FAF Advisors, (the “plan”) previously offered certain funds as investment options to plan participants. As a result of a decision to no longer offer such funds as investment options, certain fund shares held in the plan were redeemed in-kind on December 1, 2010, in the amounts as follows:
| | | | |
Large Cap Value | | $ | 132,685 | |
Mid Cap Value | | | 91,633 | |
Small Cap Value | | | 79,419 | |
An affiliated pension plan (the “plan”) also previously offered certain funds as investment options to plan participants. As a result of a decision to no longer offer such funds as investment options, certain fund shares held in the plan were redeemed in-kind on December 20, 2010, in the amounts as follows:
| | | | |
Mid Cap Value | | $ | 170,281 | |
Small Cap Value | | | 48,511 | |
In these transactions, the Funds paid redemption proceeds by distributing a proportionate amount of securities in their respective portfolios. Remaining shareholders in the Funds did not recognize any capital gains from the transactions.
8. New Accounting Pronouncements
Fair Value Measurements and Disclosures
On May 12, 2011, the Financial Accounting Standards Board (“FASB”) issued Accounting Standards Update (“ASU”) No. 2011-04 (“ASU No. 2011-04”) modifying Topic 820, Fair Value Measurements and Disclosures. At the same time, the International Accounting Standards Board (“IASB”) issued International Financial Reporting Standard (“IFRS”) 13, Fair Value Measurement. The objective of the FASB and IASB is convergence of their guidance on fair value measurements and disclosures. Specifically, ASU No. 2011-04 requires reporting entities to disclose i) the amounts of any transfers between Level 1 and Level 2 and the reasons for the transfers and, ii) for Level 3 fair value measurements, a) quantitative information about significant unobservable inputs used, b) a description of the valuation processes used by the reporting entity and c) a narrative description of the sensitivity of the fair value measurement to changes in unobservable inputs if a change in those inputs might result in a significantly higher or lower fair value measurement. The effective date of ASU No. 2011-04 is for interim and annual periods beginning after December 15, 2011. At this time, management is evaluating the implications of this guidance and the impact it will have on the financial statement amounts and footnote disclosures, if any.
Trustees and Officers (Unaudited)
The management of the Funds, including general supervision of the duties performed for the Funds by the Adviser, is the responsibility of the Board of Trustees of the Funds. The number of trustees of the Funds is currently set at ten. None of the trustees who are not “interested” persons of the Funds (referred to herein as “independent trustees”) has ever been a director or employee of, or consultant to, Nuveen or its affiliates. The names and business addresses of the trustees and officers of the Funds, their principal occupations and other affiliations during the past five years, the number of portfolios each oversees and other directorships they hold are set forth below.
The Funds’ Statement of Additional Information (“SAI”) includes more information about the trustees. To request a free copy, call Nuveen Investments at (800) 257-8787 or visit the Funds’ website at www.nuveen.com.
| | | | | | | | |
Name, Birthdate and Address | | Position(s) Held with the Funds | | Year First Elected or Appointed (1) | | Principal Occupation(s) Including other Directorships During Past 5 Years | | Number of Portfolios in Fund Complex Overseen by Trustee |
| | |
| Independent Trustees: | | | | |
Robert P. Bremner (2) 8/22/40 333 W. Wacker Drive Chicago, IL 60606 | | Chairman of the Board and Trustee | | 1996 | | Private Investor and Management Consultant; Treasurer and Director, Humanities Council of Washington, D.C.; Board Member, Independent Directors Council affiliated with the Investment Company Institute. | | 241 |
Jack B. Evans 10/22/48 333 W. Wacker Drive Chicago, IL 60606 | | Trustee | | 1999 | | President, The Hall-Perrine Foundation, a private philanthropic corporation (since 1996); Director and Chairman, United Fire Group, a publicly held company; member of the Board of Regents for the State of Iowa University System; Director, Source Media Group; Life Trustee of Coe College and the Iowa College Foundation; formerly, Director, Alliant Energy; formerly, Director, Federal Reserve Bank of Chicago; formerly, President and Chief Operating Officer, SCI Financial Group, Inc., a regional financial services firm. | | 241 |
William C. Hunter 3/6/48 333 W. Wacker Drive Chicago, IL 60606 | | Trustee | | 2004 | | Dean, Tippie College of Business, University of Iowa (since 2006); Director (since 2004) of Xerox Corporation; Director (since 2005), Beta Gamma Sigma International Honor Society; Director of Wellmark, Inc. (since 2009); formerly, Dean and Distinguished Professor of Finance, School of Business at the University of Connecticut (2003-2006); previously, Senior Vice President and Director of Research at the Federal Reserve Bank of Chicago (1995-2003); formerly, Director (1997-2007), Credit Research Center at Georgetown University. | | 241 |
David J. Kundert (2) 10/28/42 333 W. Wacker Drive Chicago, IL 60606 | | Trustee | | 2005 | | Director, Northwestern Mutual Wealth Management Company; retired (since 2004) as Chairman, JPMorgan Fleming Asset Management, President and CEO, Banc One Investment Advisors Corporation, and President, One Group Mutual Funds; prior thereto, Executive Vice President, Banc One Corporation and Chairman and CEO, Banc One Investment Management Group; Member, Board of Regents, Luther College; member of the Wisconsin Bar Association; member of Board of Directors, Friends of Boerner Botanical Gardens; member of Board of Directors and Chair of Investment Committee, Greater Milwaukee Foundation. | | 241 |
William J. Schneider (2) 9/24/44 333 W. Wacker Drive Chicago, IL 60606 | | Trustee | | 1996 | | Chairman of Miller-Valentine Partners Ltd., a real estate investment company; formerly, Senior Partner and Chief Operating Officer (retired 2004) of Miller-Valentine Group; member, University of Dayton Business School Advisory Council; member, Mid-America Health System Board; formerly, member and chair, Dayton Philharmonic Orchestra Association; formerly, member, Business Advisory Council, Cleveland Federal Reserve Bank. | | 241 |
Judith M. Stockdale 12/29/47 333 W. Wacker Drive Chicago, IL 60606 | | Trustee | | 1997 | | Executive Director, Gaylord and Dorothy Donnelley Foundation (since 1994); prior thereto, Executive Director, Great Lakes Protection Fund (1990-1994). | | 241 |
Carole E. Stone (2) 6/28/47 333 W. Wacker Drive Chicago, IL 60606 | | Trustee | | 2007 | | Director, Chicago Board Options Exchange (since 2006); Director, C2 Options Exchange, Incorporated (since 2009); formerly, Commissioner, New York State Commission on Public Authority Reform (2005-2010); formerly, Chair, New York Racing Association Oversight Board (2005-2007). | | 241 |
| | | | | | | | |
Name, Birthdate and Address | | Position(s) Held with the Funds | | Year First Elected or Appointed (1) | | Principal Occupation(s) During Past Five Years | | Number of Portfolios in Fund Complex Overseen by Trustee |
Virginia L. Stringer 8/16/44 333 W. Wacker Drive Chicago, IL 60606 | | Trustee | | 2011 | | Board Member, Mutual Fund Directors Forum; Member, Governing Board, Investment Company Institute’s Independent Directors Council; governance consultant and non-profit board member; former Owner and President, Strategic Management Resources, Inc. a management consulting firm; previously, held several executive positions in general management, marketing and human resources at IBM and The Pillsbury Company; Independent Director, First American Fund Complex (1987-2010) and Chair (1997-2010). | | 241 |
Terence J. Toth (2) 9/29/59 333 W. Wacker Drive Chicago, IL 60606 | | Trustee | | 2008 | | Director, Legal & General Investment Management America, Inc. (since 2008); Managing Partner, Promus Capital (since 2008); formerly, CEO and President, Northern Trust Global Investments (2004-2007); Executive Vice President, Quantitative Management & Securities Lending (2000-2004); prior thereto, various positions with Northern Trust Company (since 1994); member: Goodman Theatre Board (since 2004), Chicago Fellowship Board (since 2005) and Catalyst Schools of Chicago Board (since 2008); formerly, member: Northern Trust Mutual Funds Board (2005-2007), Northern Trust Global Investments Board (2004-2007), Northern Trust Japan Board (2004-2007), Northern Trust Securities Inc. Board (2003-2007) and Northern Trust Hong Kong Board (1997-2004). | | 241 |
| | |
| Interested Trustee: | | | | |
John P. Amboian (3) 6/14/61 333 W. Wacker Drive Chicago, IL 60606 | | Trustee | | 2008 | | Chief Executive Officer and Chairman (since 2007), and Director (since 1999) of Nuveen Investments, Inc., formerly, President (1999-2007); Chief Executive Officer (since 2007) of Nuveen Investments Advisers Inc.; Director (since 1998) formerly, Chief Executive Officer (2007-2010) of Nuveen Fund Advisors, Inc. | | 241 |
Name, Birthdate and Address | | Position(s) Held with the Funds | | Year First Elected or Appointed (4) | | Principal Occupation(s) During Past 5 Years | | Number of Portfolios in Fund Complex Overseen by Officer |
| | |
| Officers of the Funds: | | | | |
Gifford R. Zimmerman 9/9/56 333 W. Wacker Drive Chicago, IL 60606 | | Chief Administrative Officer | | 1988 | | Managing Director (since 2002), Assistant Secretary and Associate General Counsel of Nuveen Securities, LLC; Managing Director (since 2004) and Assistant Secretary (since 1994) of Nuveen Investments, Inc.; Managing Director (since 2002), Assistant Secretary (since 1997) and Co-General Counsel (since 2011) of Nuveen Fund Advisors, Inc.; Managing Director, Assistant Secretary and Associate General Counsel of Nuveen Asset Management, LLC (since 2011); Managing Director, Associate General Counsel and Assistant Secretary of Symphony Asset Management LLC (since 2003); Vice President and Assistant Secretary of NWQ Investment Management Company, LLC (since 2002), Nuveen Investments Advisers Inc. (since 2002), Tradewinds Global Investors LLC, and Santa Barbara Asset Management, LLC (since 2006), Nuveen HydePark Group LLC and Nuveen Investment Solutions, Inc. (since 2007) and of Winslow Capital Management Inc. (since 2010); Chief Administrative Officer and Chief Compliance Officer (since 2006) of Nuveen Commodities Asset Management, LLC; Chartered Financial Analyst. | | 241 |
Margo L. Cook 4/11/64 333 W. Wacker Drive Chicago, IL 60606 | | Vice President | | 2009 | | Executive Vice President (since 2008) of Nuveen Investments, Inc. and of Nuveen Fund Advisors, Inc. (since 2011); Managing Director – Investment Services of Nuveen Commodities Asset Management, LLC (since August 2011); previously, Head of Institutional Asset Management (2007-2008) of Bear Stearns Asset Management; Head of Institutional Asset Management (1986-2007) of Bank of NY Mellon; Chartered Financial Analyst. | | 241 |
Trustees and Officers (Unaudited) (continued)
| | | | | | | | |
Name, Birthdate and Address | | Position(s) Held with the Funds | | Year First Elected or Appointed (4) | | Principal Occupation(s) During Past 5 Years | | Number of Portfolios in Fund Complex Overseen by Officer |
Lorna C. Ferguson 10/24/45 333 W. Wacker Drive Chicago, IL 60606 | | Vice President | | 1998 | | Managing Director (since 2005) of Nuveen Fund Advisors, Inc. and Nuveen Securities, LLC (since 2004). | | 241 |
Stephen D. Foy 5/31/54 333 W. Wacker Drive Chicago, IL 60606 | | Vice President and Controller | | 1998 | | Senior Vice President (since 2010), formerly, Vice President (2005-2010) and Funds Controller of Nuveen Securities, LLC; Vice President of Nuveen Fund Advisors, Inc.; Chief Financial Officer of Nuveen Commodities Asset Management, LLC (since 2010); Certified Public Accountant. | | 241 |
Scott S. Grace 8/20/70 333 W. Wacker Drive Chicago, IL 60606 | | Vice President and Treasurer | | 2009 | | Managing Director, Corporate Finance & Development, Treasurer (since 2009) of Nuveen Securities, LLC; Managing Director and Treasurer (since 2009) of Nuveen Fund Advisors, Inc., Nuveen Investment Solutions, Inc., Nuveen Investments Advisers, Inc., Nuveen Investments Holdings Inc. and (since (2011) Nuveen Asset Management, LLC; Vice President and Treasurer of NWQ Investment Management Company, LLC, Tradewinds Global Investors, LLC, Symphony Asset Management LLC and Winslow Capital Management, Inc.; Vice President of Santa Barbara Asset Management, LLC; formerly, Treasurer (2006-2009), Senior Vice President (2008-2009), previously, Vice President (2006-2008) of Janus Capital Group, Inc.; formerly, Senior Associate in Morgan Stanley’s Global Financial Services Group (2000-2003); Chartered Accountant Designation. | | 241 |
Walter M. Kelly 2/24/70 333 W. Wacker Drive Chicago, IL 60606 | | Chief Compliance Officer and Vice President | | 2003 | | Senior Vice President (since 2008) and Assistant Secretary (since 2003) of Nuveen Fund Advisors, Inc. | | 241 |
Tina M. Lazar 8/27/61 333 W. Wacker Drive Chicago, IL 60606 | | Vice President | | 2002 | | Senior Vice President (since 2010), formerly, Vice President (2005-2010) of Nuveen Fund Advisors, Inc. | | 241 |
Larry W. Martin 7/27/51 333 W. Wacker Drive Chicago, IL 60606 | | Vice President and Assistant Secretary | | 1997 | | Senior Vice President (since 2010), formerly, Vice President (1993-2010), Assistant Secretary and Assistant General Counsel of Nuveen Securities, LLC; Senior Vice President (since 2011) of Nuveen Asset Management, LLC: Senior Vice President (since 2010), formerly, Vice President (2005-2010), and Assistant Secretary of Nuveen Investments, Inc.; Senior Vice President (since 2010), formerly Vice President (2005-2010), and Assistant Secretary (since 1997) of Nuveen Fund Advisors, Inc.; Vice President and Assistant Secretary of Nuveen Investments Advisers, Inc. (since 2002), NWQ Investment Management Company, LLC, Symphony Asset Management LLC (since 2003), Tradewinds Global Investors, LLC, Santa Barbara Asset Management, LLC (since 2006), Nuveen HydePark Group, LLC and Nuveen Investment Solutions, Inc. (since 2007), and of Winslow Capital Management, Inc. (since 2010); Vice President and Assistant Secretary of Nuveen Commodities Asset Management, LLC (since 2010). | | 241 |
| | | | | | | | |
Name, Birthdate and Address | | Position(s) Held with the Funds | | Year First Elected or Appointed (4) | | Principal Occupation(s) Including other Directorships During Past 5 Years | | Number of Portfolios in Fund Complex Overseen by Officer |
Kevin J. McCarthy 3/26/66 333 W. Wacker Drive Chicago, IL 60606 | | Vice President and Secretary | | 2007 | | Managing Director (since 2008), formerly, Vice President (2007-2008), Nuveen Securities, LLC; Managing Director (since 2008), Assistant Secretary (since 2007) and Co-General Counsel (since 2011) of Nuveen Fund Advisors, Inc.; Managing Director, Assistant Secretary and Associate General Counsel (since 2011) of Nuveen Asset Management, LLC; Managing Director (since 2008), and Assistant Secretary, Nuveen Investment Holdings, Inc.; Vice President (since 2007) and Assistant Secretary of Nuveen Investments Advisers Inc., NWQ Investment Management Company, LLC, Tradewinds Global Investors LLC, NWQ Holdings, LLC, Symphony Asset Management LLC, Santa Barbara Asset Management, LLC, Nuveen HydePark Group, LLC, Nuveen Investment Solutions, Inc. (since 2007) and of Winslow Capital Management, Inc. (since 2010); Vice President and Secretary (since 2010) of Nuveen Commodities Asset Management, LLC; prior thereto, Partner, Bell, Boyd & Lloyd LLP (1997-2007). | | 241 |
Kathleen L. Prudhomme 3/30/53 901 Marquette Avenue Minneapolis, MN 55402 | | Vice President and Assistant Secretary | | 2011 | | Managing Director, Assistant Secretary and Co-General Counsel (since 2011) of Nuveen Fund Advisors, Inc.; Managing Director, Assistant Secretary and Associate General Counsel (since 2011) of Nuveen Asset Management, LLC; Managing Director and Assistant Secretary (since 2011) of Nuveen Securities, LLC; formerly, Deputy General Counsel, FAF Advisors, Inc. (2004-2010). | | 241 |
Jeffery M. Wilson 3/13/56 333 W. Wacker Drive Chicago, IL 60606 | | Vice President | | 2011 | | Senior Vice President of Nuveen Securities, LLC (since 2011), formerly, Senior Vice President of FAF Advisors, Inc. (2000-2010). | | 107 |
| (1) | Trustees serve an indefinite term until his/her successor is elected or appointed. The year first elected or appointed represents the year in which the trustee was first elected or appointed to any fund in the Nuveen Fund Complex. |
| (2) | Also serves as a trustee of the Nuveen Diversified Commodity Fund, an exchange-traded commodity pool managed by Nuveen Commodities Asset Management, LLC, an affiliate of the Adviser. |
| (3) | Mr. Amboian is an interested trustee because of his position with Nuveen Investments, Inc. and certain of its subsidiaries, which are affiliates of the Nuveen Funds. |
| (4) | Officers serve one year terms through August of each year. The year first elected or appointed represents the year in which the officer was first elected or appointed to any fund in the Nuveen Fund Complex. |
Annual Investment Management Agreement Approval Process
(Unaudited)
A. Background
Prior to January 1, 2011, FAF Advisors, Inc. (“FAF”), a wholly-owned subsidiary of U.S. Bank National Association (“U.S. Bank”), served as investment adviser to each Fund pursuant to an investment advisory agreement between First American Investment Funds, Inc. (the “Company”) and FAF (the “Prior Advisory Agreement”), and as administrator to each Fund pursuant to an administrative agreement between the Company and FAF (the “Prior Administrative Agreement”). On July 29, 2010, U.S. Bank and FAF entered into a definitive agreement with Nuveen Investments, Inc. (“Nuveen”), Nuveen Asset Management (“NAM”) and certain Nuveen affiliates, whereby NAM would acquire a portion of the asset management business of FAF (the “Transaction”). The acquired business included the assets of FAF used in providing investment advisory services, research, sales and distribution in connection with equity, fixed income, real estate, global infrastructure and asset allocation investment products (other than the money market business and closed-end funds advised by FAF), including the Funds. In connection with the Transaction, the Board of Directors (the “Prior Board”) serving the Funds as directors at that time (each a “Prior Director” and, collectively, the “Prior Directors”) considered a number of proposals designed to integrate the Funds into the Nuveen family of funds, including the appointment of NAM as investment adviser and Nuveen Investments, LLC as distributor to the Funds. The Prior Board also considered a proposal in connection with an internal restructuring of NAM (the “Restructuring”), for Nuveen Asset Management, LLC (“NAM LLC”), a wholly-owned subsidiary of NAM formed in anticipation of the Restructuring, to serve as sub-advisor for each Fund.
The Prior Board approved a new investment advisory agreement (the “New Advisory Agreement”) for each Fund with NAM and an investment sub-advisory agreement between NAM and NAM LLC (the “NAM Sub-Advisory Agreement”). At a meeting of the Funds’ stockholders held on December 17, 2010, stockholders of the Funds approved the New Advisory Agreement and the NAM Sub-Advisory Agreement. In addition, stockholders of the Company’s funds (including the Funds) elected ten directors, including one Prior Director, to the board of directors of the Company (the “New Board”).
On December 31, 2010, the Transaction closed and the New Board (which replaced the Prior Board) took effect. On January 1, 2011, the New Advisory Agreement and the NAM Sub-Advisory Agreement became effective. In addition, in connection with the Restructuring, NAM has changed its name to Nuveen Fund Advisors, Inc. (“NFA”). The following is a summary of the considerations of the Prior Board, which were set forth in a proxy statement dated November 10, 2010 (the “Proxy Statement”), in approving the New Advisory Agreement and the NAM Sub-Advisory Agreement for the Funds.
B. Prior Board Considerations
The New Advisory Agreement for each Fund was approved by the Prior Board after consideration of all factors determined to be relevant to its deliberations, including those discussed below. The Prior Board authorized the submission of the New Advisory Agreement for consideration by each Fund’s stockholders.
At meetings held in May and June of 2010, the Prior Board was apprised of the general terms of the Transaction and, as a result, began the process of considering the transition of services from FAF to NFA. In preparation for its September 21-23, 2010 meeting, the Prior Board received, in response to a written due diligence request prepared by the Prior Board and its independent legal counsel and provided to NFA and FAF, a significant amount of information covering a range of issues in advance of the meeting. To assist the Prior Board in its consideration of the New Advisory Agreement for each Fund, NFA provided materials and information about, among other things: (1) NFA and its affiliates, including their history and organizational structure, product lines, experience in providing investment advisory, administrative and other services, and financial condition, (2) the nature, extent and quality of services to be provided under the New Advisory Agreement, (3) proposed Fund fees and expenses and comparative information relating thereto, and (4) NFA’s compliance and risk management capabilities and processes. In addition, the Prior Board was provided with a memorandum from independent legal counsel outlining the legal duties of the Prior Board under the Investment Company Act of 1940, as amended (the “1940 Act”). In response to further requests from the Prior Board and its independent legal counsel, NFA and FAF provided additional information to the Prior Board following its September 21-23 meeting.
An additional in-person meeting of the Prior Board to consider the New Advisory Agreement was held on October 7, 2010, at which the members of the Prior Board in attendance, all of whom were not considered to be “interested persons” of the Company as defined in the 1940 Act (the “Independent Prior Directors”), approved the New Advisory Agreement with NFA for each Fund.
In considering the New Advisory Agreement for each Fund, the Prior Board, advised by independent legal counsel, reviewed and analyzed the factors it deemed relevant, including: (1) the nature, quality, and extent of services to be rendered to the Funds by NFA, (2) the cost of services to be provided, including Fund expense information, and (3) whether economies of scale may be realized as the Funds grow and whether fee levels are adjusted to enable Fund investors to share in these potential economies of scale.
In considering the New Advisory Agreement, the Prior Board did not identify any particular information that was all-important or controlling, and each Prior Director may have attributed different weights to the various factors discussed below. Where appropriate, the Prior Directors evaluated all information available to them regarding the Company’s funds on a fund-by-fund basis, and their determinations were made separately with respect to each such fund (including each of the Funds). The Prior Directors, all of whom were Independent Prior Directors, concluded that the terms of the New Advisory Agreement and the fee rates to be paid in light of the services to be provided to each Fund are in the best interests of each Fund, and that the New Advisory Agreement should be approved and recommended to stockholders for approval. In voting to approve the New Advisory Agreement with respect to each Fund, the Prior Board considered in particular the following factors:
Nature, Extent and Quality of Services. In considering approval of the New Advisory Agreement, the Prior Board considered the nature, extent and quality of services to be provided by NFA, including advisory services and administrative services. The Prior Board reviewed materials outlining, among other things, NFA’s organizational structure and business; the types of services that NFA or its affiliates are expected to provide to the Funds; the performance record of the applicable Fund (as described in further detail below); and fund product lines offered by NFA. The Prior Board considered that affiliation with a larger fund complex and well-recognized sponsor may result in a broader distribution network, potential economies of scale with respect to other services or fees and broader shareholder services including exchange options.
With respect to personnel, the Prior Board considered information regarding retention plans for current FAF employees who would be offered employment by NFA, and the background and experience of NFA employees who would become portfolio managers as of the closing of the Transaction. The Prior Board also reviewed information regarding portfolio manager compensation arrangements to evaluate NFA’s ability to attract and retain high quality investment personnel.
In evaluating the services of NFA, the Prior Board also considered NFA’s ability to supervise the Funds’ other service providers and, given the importance of compliance, NFA’s compliance program. Among other things, the Prior Board considered the report of NFA’s chief compliance officer regarding NFA’s compliance policies and procedures.
In addition to advisory services, the Prior Board considered the quality of administrative services expected to be provided by NFA and its affiliates including product management, fund administration, oversight of service providers, shareholder services, administration of Board relations, regulatory and portfolio compliance and legal support.
The Prior Board considered that, based on representations from FAF and NFA, the Transaction would allow stockholders to continue their investment in each of the Company’s funds with the same investment objective and principal strategies and, in most cases, the same portfolio management team. In light of the continuity of investment personnel in most cases (with respect to the Company’s funds in the aggregate), the Prior Board considered the historical investment performance of each of the Company’s funds (including each Fund) previously provided during the annual contract renewal process.
Cost of Services Provided by NFA. In evaluating the costs of the services to be provided by NFA under the New Advisory Agreement, the Prior Board received a comparison of each Fund’s annual operating expenses as of June 30, 2010 under the Prior Advisory Agreement and under the New Advisory Agreement, in each case adjusted to reflect a decrease in net assets for certain of the Company’s funds from redemptions by the U.S. Bank 401(k) Plan expected to occur prior to the closing of the Transaction. The Prior Board considered, among other things, that the advisory fee rates and other expenses would change as a result of NFA serving as investment adviser to each Fund. The Prior Board noted that the services provided by NFA under the New Advisory Agreement would include certain administrative services, which services (along with other services) were provided pursuant to the Prior Administrative Agreement and were charged separately from the advisory fee. Accordingly, the Prior Board considered that the fee rates paid under the New Advisory Agreement include bundled investment advisory and administrative fees and thus are higher than the fee rates paid under the Prior Advisory Agreement for most of the Company’s funds, but lower than the combined fee rates paid under the Prior Advisory Agreement and the Prior Administrative Agreement. The Prior Board also noted that certain administrative services provided under the Prior Administrative Agreement would not be provided under the New Advisory Agreement and will be delegated to other service providers. Similarly, certain fees paid by FAF under the Prior Administrative Agreement will not be paid by NFA under the New Advisory Agreement and will be paid directly by the Funds. However, immediately following the closing of the Transaction, the net expense ratio of each Fund was expected to be the same or lower than the Fund’s net expense ratio as of June 30, 2010, adjusted (where applicable) to reflect a decrease in net assets resulting from redemptions by the U.S. Bank 401(k) Plan expected to occur prior to the closing of the Transaction, assuming the Fund’s net assets at the time of the closing of the Transaction were no lower than their adjusted June 30 level. In addition, the Prior Board noted that NFA has committed to certain undertakings to maintain current fee caps and/or to waive fees or reimburse expenses to maintain net management fees at certain levels and Nuveen has represented to the Prior Board that Nuveen and its affiliates will not take any action that imposes an “unfair burden” on any Fund as a result of the Transaction. The Prior Board also considered that fees payable under the New Advisory Agreement include both a fund-level fee and a complex-level fee, and that schedules for the fund-level and complex-level fees contain breakpoints that are based, respectively, on Fund assets and Nuveen complex-wide assets. The Prior Board considered that breakpoints in the fund-level fee allow for the possibility that this portion of the advisory fee could decline in the future if Fund assets were to increase or increase in the future if Fund assets were to decline. The Prior Board also considered that breakpoints in the complex-level fee allow for the possibility that this portion of the advisory fee could decline in the future if complex-wide assets were to increase or increase in the future if complex-wide assets were to decline, regardless, in each case, of whether assets of the particular Fund had increased or decreased.
In considering the compensation to be paid to NFA, the Prior Board also reviewed fee information regarding NFA-sponsored funds, to the extent such funds had similar investment objectives and strategies to the Funds. The Prior Board reviewed information provided by NFA regarding similar funds managed by NFA and noted that the fee rates payable by these funds were generally comparable to the fee rates proposed for the Company’s funds. The Prior Board also compared proposed fee and expense information to the median fees and expenses of comparable funds, using information provided by an independent data service.
Annual Investment Management Agreement Approval Process
(Unaudited) (continued)
In evaluating the compensation, the Prior Board also considered other amounts expected to be paid to NFA by the Funds as well as any indirect benefits (such as soft dollar arrangements, if any) NFA and its affiliates are expected to receive, that are directly attributable to the management of the Funds.
The Prior Board also considered that the Funds would not bear any of the costs relating to the Transaction, including the costs of preparing, printing and mailing the Proxy Statement.
Economies of Scale. The Prior Board reviewed information regarding potential economies of scale or other efficiencies that might result from the Funds’ potential association with Nuveen. The Prior Board noted that the New Advisory Agreement provides for breakpoints in the Funds’ fund-level and complex-level management fee rates as the assets of the Funds and the assets held by the various registered investment companies sponsored by Nuveen increase, respectively. The Prior Board concluded that the structure of the investment management fee rates, with the breakpoints for the Funds under the New Advisory Agreement, reflected sharing of potential economies of scale with the Funds’ stockholders.
Conclusion. After deliberating in executive session, the members of the Prior Board in attendance, all of whom were Independent Prior Directors, approved the New Advisory Agreement with respect to each Fund, concluding that the New Advisory Agreement was in the best interests of each Fund.
NAM Sub-Advisory Agreement. The Prior Board also approved the NAM Sub-Advisory Agreement between NFA and NAM LLC as a result of the Restructuring expected to occur with NFA. The Prior Board considered that the services to be provided by NAM LLC under the NAM Sub-Advisory Agreement would not result in any material change in the nature or level of investment advisory services or administrative services provided to the Funds. In addition, the portfolio managers will continue to manage the Funds in their capacity as employees of NAM LLC. The Prior Board considered that NFA will pay a portion of the advisory fee it receives from each Fund to NAM LLC for its services as sub-advisor. The Prior Board concluded, based upon the conclusions that the Prior Board reached in connection with the approval of the New Advisory Agreement and after determining that it need not reconsider all of the factors that it had considered in connection with the approval of the New Advisory Agreement, to approve the NAM Sub-Advisory Agreement.
Notes
Notes
Notes
Glossary of Terms Used in this Report
Average Annual Total Return: This is a commonly used method to express an investment’s performance over a particular, usually multi-year time period. It expresses the return that would have been necessary each year to equal the investment’s actual cumulative performance (including change in NAV or offer price and reinvested dividends and capital gains distributions, if any) over the time period being considered.
Lipper Equity Income Funds Classification Average: Represents the average annualized total return for all reporting funds in the Lipper Equity Income Funds Classification. The Lipper Equity Income Funds Classification Average contained 286, 203 and 106 funds for the 1-year, 5-year and 10-year periods, respectively, ended October 31, 2011. Lipper returns account for the effects of management fees and assume reinvestment of dividends but do not reflect any applicable sales charges. The Lipper average is not available for direct investment.
Lipper Large-Cap Value Funds Classification Average: Represents the average annualized total return for all reporting funds in the Lipper Large-Cap Value Funds Classification. The Lipper Large-Cap Value Funds Classification Average contained 515, 405 and 240 for the 1-year, 5-year and 10-year periods, respectively, ended October 31, 2011. Lipper returns account for the effects of management fees and assume reinvestment of dividends but do not reflect any applicable sales charges. The Lipper average is not available for direct investment.
Lipper Mid-Cap Value Funds Classification Average: Represents the average annualized total return for all reporting funds in the Lipper Mid-Cap Value Funds Classification. The Lipper Mid-Cap Value Funds Classification Average contained 248, 172 and 87 funds for the 1- year, 5-year and 10-year periods, respectively, ended October 31, 2011. Lipper returns account for the effects of management fees and assume reinvestment of dividends but do not reflect any applicable sales charges. The Lipper average is not available for direct investment.
Lipper Small-Cap Value Funds Classification Average: Represents the average annualized total return for all reporting funds in the Lipper Small-Cap Value Funds Classification. The Lipper Small-Cap Value Funds Classification Average contained 290, 222 and 112 funds for the 1- year, 5-year and 10-year periods, respectively, ended October 31, 2011. Lipper returns account for the effects of management fees and assume reinvestment of dividends but do not reflect any applicable sales charges. The Lipper average is not available for direct investment
Net Asset Value (NAV): The net market value of all securities held in a portfolio.
Net Asset Value (NAV) Per Share: The market value of one share of a mutual fund or closed-end fund. For a Fund, the NAV is calculated daily by taking the Fund’s total assets (securities, cash, and accrued earnings), subtracting the Fund’s liabilities, and dividing by the number of shares outstanding.
Russell 1000 Value Index: An index that measures the performance of those Russell 1000 companies with lower price-to-book ratios and lower forecasted growth values. The index returns assume reinvestment of dividends, but do not reflect any applicable sales charges. It is not possible to invest directly in an index.
Russell 2000 Value Index: An index that measures the performance of those Russell 2000 companies with lower price-to-book ratios and lower forecasted growth values. The index returns assume reinvestment of dividends, but do not reflect any applicable sales charges. It is not possible to invest directly in an index.
Russell Midcap Value Index: An index that measures the performance of the mid-cap value segment of the U.S. equity universe. It includes those Russell Midcap Index companies with lower price-to-book ratios and lower forecasted growth values. The index returns assume reinvestment of dividends, but do not reflect any applicable sales charges. It is not possible to invest directly in an index.
S&P 500 Index: An unmanaged index generally considered representative of the U.S. stock market. The index returns assume reinvestment of dividends, but do not reflect any applicable sales charges. It is not possible to invest directly in an index.
S&P 500 Dividend Only Stocks Index: An unmanaged index that includes only the S&P 500 Index stocks that pay dividends. The S&P 500 Index is generally considered representative of the U.S. stock market. The index returns assume reinvestment of dividends, but do not reflect any applicable sales charges. It is not possible to invest directly in an index.
Tax Equalization: The practice of treating a portion of the distribution made to a redeeming shareholder, which represents his proportionate part of undistributed net investment income and capital gain as a distribution for tax purposes. Such amounts are referred to as the equalization debits (or payments) and will be considered a distribution to the shareholder of net investment income and capital gain for calculation of the Fund’s dividends paid deduction.
Fund Information
Fund Manager
Nuveen Fund Advisors, Inc.
333 West Wacker Drive
Chicago, IL 60606
Sub-Adviser
Nuveen Asset Management, LLC
333 West Wacker Drive
Chicago, IL 60606
Legal Counsel
Chapman and Cutler LLP
Chicago, IL
Independent Registered Public Accounting Firm
Ernst & Young LLP
Chicago, IL
Custodian
U.S. Bank National Association
St. Paul, MN
Transfer Agent and Shareholder Services
U.S. Bancorp Fund Services, LLC
615 East Michigan Street
Milwaukee, WI 53202
Distribution Information: The following Funds hereby designate their percentages of dividends paid from net ordinary income as dividends qualifying for the 70% dividends received deduction (“DRD”) for corporations and their percentages as qualified dividend income (“QDI”) for individuals under Section 1 (h)(11) of the Internal Revenue Code as shown in the accompanying table. The actual qualified dividend income distributions will be reported to shareholders on Form 1099-DIV which will be sent to shareholders shortly after calendar year end.
| | | | | | | | |
| Fund | | % of DRD | | | % of QDI | |
Nuveen Equity Income | | | 100% | | | | 100% | |
Nuveen Large Cap Value | | | 100% | | | | 100% | |
Nuveen Mid Cap Value | | | 100% | | | | 100% | |
Quarterly Portfolio of Investments and Proxy Voting information: You may obtain (i) each Fund’s quarterly portfolio of investments, (ii) information regarding how the Funds voted proxies relating to portfolio securities held during the most recent twelve-month period ended June 30, and (iii) a description of the policies and procedures that the Funds used to determine how to vote proxies relating to portfolio securities without charge, upon request, by calling Nuveen Investments at (800) 257-8787 or on Nuveen’s website at www.nuveen.com.
You may also obtain this and other Fund information directly from the Securities and Exchange Commission (SEC). The SEC may charge a copying fee for this information. Visit the SEC on-line at http://www.sec.gov or in person at the SEC’s Public Reference Room in Washington, D.C. Call the SEC at (202) 942-8090 for room hours and operation. You may also request Fund information by sending an e-mail request to publicinfo@sec.gov or by writing to the SEC’s Public Reference Section at 100 F Street NE, Washington, D.C. 20549.
The Financial Industry Regulatory Authority (FINRA) provides a Public Disclosure Program which supplies certain information regarding the disciplinary history of FINRA members and their associated persons in response to either telephone inquiries at (800) 289-9999 or written inquiries at www.finra.org. FINRA also provides an investor brochure that includes information describing the Public Disclosure Program.
Nuveen Investments:
Serving Investors for Generations
Since 1898, financial advisors and their clients have relied on Nuveen Investments to provide dependable investment solutions through continued adherence to proven, long-term investing principles. Today, we offer a range of high quality equity and fixed-income solutions designed to be integral components of a well-diversified core portfolio.
Focused on meeting investor needs.
Nuveen Investments is a global investment management firm that seeks to help secure the long-term goals of institutions and high net worth investors as well as the consultants and financial advisors who serve them. We market our growing range of specialized investment solutions under the high-quality brands of NWQ, Nuveen Asset Management, Santa Barbara, Symphony, Tradewinds and Winslow Capital. In total, Nuveen Investments managed approximately $207 billion of assets as of October 31, 2011.
Find out how we can help you.
To learn more about how the products and services of Nuveen Investments may be able to help you meet your financial goals, talk to your financial advisor, or call us at (800) 257-8787. Please read the information provided carefully before you invest. Investors should consider the investment objective and policies, risk considerations, charges and expenses of any investment carefully. Where applicable, be sure to obtain a prospectus, which contains this and other relevant information. To obtain a prospectus, please contact your securities representative or Nuveen Investments, 333 W. Wacker Dr., Chicago, IL 60606. Please read the prospectus carefully before you invest or send money.
Learn more about Nuveen Funds at: www.nuveen.com/mf
| | |
Distributed by Nuveen Securities, LLC 333 West Wacker Drive Chicago, IL 60606 www.nuveen.com | | |
MAN-FSTK-1011P

Mutual Funds
Nuveen Equity Funds
For investors seeking the potential for long-term capital appreciation.
Semi-Annual Report
April 30, 2012
| | | | | | | | | | |
| | | Share Class / Ticker Symbol |
| | | | | |
| Fund Name | | Class A | | Class B | | Class C | | Class R3 | | Class I |
Nuveen Dividend Value Fund (formerly Nuveen Equity Income Fund) | | FFEIX | | FAEBX | | FFECX | | FEISX | | FAQIX |
Nuveen Large Cap Value Fund | | FASKX | | FATBX | | FALVX | | FAVSX | | FSKIX |
Nuveen Mid Cap Value Fund | | FASEX | | FAESX | | FACSX | | FMVSX | | FSEIX |
Nuveen Small Cap Value Fund | | FSCAX | | — | | FSCVX | | FSVSX | | FSCCX |
LIFE IS COMPLEX.
Nuveen makes things e-simple.
It only takes a minute to sign up for e-Reports. Once enrolled, you’ll receive an e-mail as soon as your Nuveen Fund information is ready. No more waiting for delivery by regular mail. Just click on the link within the e-mail to see the report and save it on your computer if you wish.
Free e-Reports right to your e-mail!
www.investordelivery.com
If you receive your Nuveen Fund distributions and statements from your financial advisor or brokerage account.
OR
www.nuveen.com/accountaccess
If you receive your Nuveen Fund distributions and statements directly from Nuveen.
| | | | | | |
| Must be preceded by or accompanied by a prospectus. | | NOT FDIC INSURED | | MAY LOSE VALUE | | NO BANK GUARANTEE |
Table of Contents
Chairman’s
Letter to Shareholders
Dear Shareholders,
Investors have many reasons to remain cautious. The challenges in the Euro area are casting a shadow over global economies and financial markets. The political support for addressing fiscal issues is eroding as the economic and social impacts become more visible. At the same time, member nations appear unwilling to provide adequate financial support or to surrender sufficient sovereignty to strengthen the banks or unify the Euro area financial system. The gains made in reducing deficits, and the hard-won progress on winning popular acceptance of the need for economic austerity, are at risk. To their credit, European political leaders press on to find compromise solutions, but there is increasing concern that time will begin to run out.
In the U.S., strong corporate earnings have enabled the equity markets to withstand much of the downward pressures coming from weakening job creation, slower economic growth and political uncertainty. The Fed remains committed to low interest rates but has refrained from predicting another program of quantitative easing unless economic growth were to weaken significantly or the threat of recession appears on the horizon. Pre-election maneuvering has added to the already highly partisan atmosphere in the Congress. The end of the Bush-era tax cuts and implementation of the spending restrictions of the Budget Control Act of 2011, both scheduled to take place at year-end, loom closer.
During the last year, U.S. based investors have experienced a sharp decline and a strong recovery in the equity markets. The experienced investment teams at Nuveen keep their eye on a longer time horizon and use their practiced investment disciplines to negotiate through market peaks and valleys to achieve long-term goals for investors. Experienced professionals pursue investments that will weather short-term volatility and at the same time, seek opportunities that are created by markets that overreact to negative developments. Monitoring this process is an important consideration for the Fund Board as it oversees your Nuveen funds on your behalf.
As always, I encourage you to contact your financial consultant if you have any questions about your investment in a Nuveen Fund. On behalf of the other members of your Fund Board, we look forward to continuing to earn your trust in the months and years ahead.
Sincerely,
Robert P. Bremner
Chairman of the Board
June 20, 2012
Portfolio Managers’ Comments
Certain statements in this report are forward-looking statements. Discussions of specific investments are for illustration only and are not intended as recommendations of individual investments. The forward-looking statements and other views expressed herein are those of the portfolio managers as of the date of this report. Actual future results or occurrences may differ significantly from those anticipated in any forward-looking statements and the views expressed herein are subject to change at any time, due to numerous market and other factors. The Funds disclaim any obligation to update publicly or revise any forward-looking statements or views expressed herein.
These Funds feature portfolio management by Nuveen Asset Management, LLC, an affiliate of Nuveen Investments.
Effective February 29, 2012, the Nuveen Equity Income Fund’s name changed to the Nuveen Dividend Value Fund. There have been no changes in the Fund’s investment objectives or policies. Cori Johnson, CFA, Gerald Bren, CFA, and Derek Sadowsky are the portfolio managers for the Fund. Cori, who has 31 years of investment experience, assumed portfolio management responsibilities in 1996. Gerald, with 40 years of investment experience, has been a manager on this Fund since 1994. Derek, who has 14 years of investment experience, became a co-manager on the Dividend Value Fund management team in February of 2012.
Effective April 10, 2012, Cori, Gerald, and Derek were named co-portfolio managers of the Nuveen Large Cap Value Fund. Brent Mellum, CFA, and Kevin Earley, CFA, are no longer portfolio managers of the Fund. There have been no changes in the Fund’s investment objectives or policies. The Board of Directors has approved the reorganization of the Nuveen Large Cap Value Fund into the Nuveen Dividend Value Fund. In order for the reorganization to occur, it must be approved by the shareholders of Nuveen Large Cap Value Fund. A special meeting of Nuveen Large Cap Value Fund’s shareholders for the purpose of voting on the reorganization is expected to be held in early October 2012. Further information regarding the proposed reorganization will be contained in proxy materials that are expected to be sent to Nuveen Large Cap Value Fund’s shareholders in late August 2012. Shareholders are urged to read the proxy materials carefully. Free copies of the proxy materials will be available on the SEC’s web site at www.sec.gov.
Also effective April 10, 2012, Karen Bowie, CFA, and David Chalupnik, CFA, were named co-portfolio managers of the Nuveen Mid Cap Value Fund. Karen and David each have 28 years of investment experience. Brent Mellum, CFA, and Kevin Earley, CFA, are no longer portfolio managers of the Fund. There have been no changes in the Nuveen Mid Cap Value Fund’s investment objectives or policies.
Karen Bowie is also the portfolio manager for the Nuveen Small Cap Value Fund. She assumed portfolio management responsibilities for the Fund in 2006.
On the following pages, the portfolio management teams for the Funds examine key investment strategies and the Funds’ performance for the six-month period ended April 30, 2012.
Nuveen Dividend Value Fund (formerly Nuveen Equity Income Fund)
How did the Fund perform during the six-month period ended April 30, 2012?
The tables in the Fund Performance and Expense Ratios section of this report provide Class A Share total returns for the Fund for the six-month, one-year, five-year and ten-year periods ended April 30, 2012. The Fund’s Class A Shares at net asset value (NAV) outperformed the Russell 1000® Value Index and its Lipper classification average, but underperformed the S&P 500® Index over the six-month period.
What strategies were used to manage the Fund during the reporting period? How did these strategies influence performance?
Over the six-month period, we continued to implement the Fund’s disciplined investment strategy. We seek to achieve consistent, long-term outperformance with lower volatility by building and managing a portfolio diversified between core and opportunistic holdings with a focus on what we believe are attractively valued companies with above average current income or dividend growth. We use an integrated, multi-perspective research and analysis approach that involves a team of portfolio managers, fundamental research analysts and quantitative analysts. The Fund’s holdings exhibit attractive valuations and identifiable catalysts that we believe will drive future stock appreciation. The Fund is also actively managed in an effort to minimize distributed capital gains and maximize after-tax returns using a typical investment horizon of at least two to three years. We adhere to portfolio guidelines to manage volatility and maintain diversification, generally selling a security if it no longer is expected to meet our dividend growth or price appreciation expectations or if we find a better alternative in the marketplace.
The Fund outperformed its Russell benchmark and Lipper average over this period, primarily as a result of favorable security selection in the information technology and consumer discretionary sectors. In information technology, the Fund’s position in Seagate Technology was a particularly strong performer. The company, a leading producer of hard drives, benefited from higher margins when floods in Thailand curtailed the production of its competitors. Consolidation in the market has since produced optimism that pricing will remain stronger and justify higher stock valuations. In addition, Microsoft showed strong gains as initial reports on its new Windows 8, which is expected by year end, showed promise as the operating system will be similar across all platforms from PCs to smart phones. Microsoft���s smart phone offerings have been laggards to date so Windows 8 success could lead to significant share gains. In consumer discretionary, Yum! Brands and Starbucks both experienced strong gains as consumer confidence improved their prospects both domestically and in Asia. Yum! Brands continued to show strong sales in China as it enhanced its position as a leading restaurant chain in the country. Starbucks rose in value as its introduction of single serve products for the Keurig coffeemakers achieved initial success, while at the same time the company announced further product ventures. Furthermore, Starbucks continued to have strong sales as new locations opened in China. Europe remained an area of weakness; however, declining raw coffee bean costs and continued gains in Asian market sales helped to offset the economic slowdown in Europe.
The Fund’s performance was negatively impacted by its underweight in the financials sector as well as unfavorable stock selection in the health care and telecommunication services sectors. The financials sector carries a large weight in the benchmark, and it showed stronger performance as fears related to European financial conditions subsided somewhat during the reporting period. While Greece and Spain have fallen into recession, major financial institutions for the most part have been supported by various European Central Bank programs. Fears about failures in the financial institutions spread to U.S. based financials as well in mid 2011; however, financial stocks experienced a significant rally in their values beginning in late 2011, leading to strong performance across the sector for the six-month period. Therefore, our underweight position in this strongly performing sector reduced the Fund’s overall return. In health care, the Fund did not hold Amgen, a relatively large index position that had strong gains. This accounted for most of the Fund’s shortfall in this sector. Finally, Windstream, a regional wireline-based telecommunications company, experienced weak results during the reporting period. Investors were concerned about its acquisition of Paetec Holding Corporation, a provider of data center, business data and cloud applications, would lead to some initial dilution before merger cost savings could be realized. The Fund did not sell its position in Windstream as we believed its longer term prospects will likely be enhanced by the merger.
Nuveen Large Cap Value Fund
How did the Fund perform during the six-month period ended April 30, 2012?
The tables in the Fund Performance and Expense Ratios section of this report provide Class A Share total returns for the Fund for the six-month, one-year, five-year and ten-year periods ended April 30, 2012. The Fund’s Class A Shares at net asset value (NAV) outperformed both the Russell 1000® Value Index and the Lipper classification average over the six-month period.
What strategies were used to manage the Fund during the reporting period? How did these strategies influence performance?
The Fund pursues a long-term capital appreciation strategy by investing primarily in the common stocks of companies that have market capitalizations of $5 billion or greater at the time of purchase. During this period, we continued to implement the Fund’s investment process of selecting large-cap companies that we believe are undervalued relative to other companies in the same industry or market that demonstrate improving fundamentals and that exhibit a near term catalyst that could close the gap between market value and our perception of fair value. Generally, we sold a holding if the stock price reached its target, the company’s fundamentals or competitive position significantly deteriorated or if a better alternative existed in the marketplace.
The Fund outperformed its Russell benchmark and Lipper average over this period, primarily as a result of strong issue selection in the consumer discretionary and consumer staples sectors. Within consumer discretionary, positions in Wyndham Worldwide, Comcast and CBS all contributed significantly. Wyndham, a hotel and resort company, is
sensitive to economic conditions. The stock market rally which began in mid-fall 2011 was aided by a perception that consumer spending would be sustained in 2012. Comcast and CBS are both media and entertainment companies and, like Wyndham, are sensitive to consumer spending trends. These stocks bottomed in early fall 2011 and experienced a strong recovery during the market’s relief rally. Positive results in consumer staples were largely driven by strong gains in Dean Foods and Philip Morris International. Dean Foods is the largest U.S. producer of dairy products and is structured with relatively high leverage. Difficult competitive conditions improved in late 2011, leading to a strong recovery in the company’s operating income. Philip Morris is a historically profitable company with large cash flows. Because the stock pays a relatively high dividend, it was rewarded as investors searched out securities that have yields competitive with bonds. Additionally, the company’s international sales benefited from the fiscal pressures faced by various countries. Because cigarette taxes are a major revenue source for many countries, the company has been pressured to raise prices, leading to new highs for its gross margins.
The Fund’s performance was negatively impacted by unfavorable stock selection in the industrials and materials sectors. For example Fluor, an engineering and construction firm, was a relative laggard. While the company’s revenue and earnings trends were favorable, Fluor is heavily dependent on continued orders for mine developments as well as oil and gas downstream developments. As such, its stock is sensitive to growth trends in Asia, which remain at risk after an extended period of extraordinary strength. Similarly, positions in Potash Corporation of Saskatchewan and Dow Chemical lagged, again as a result of concerns that weaker growth from Asia would lead to lower commodity prices.
Nuveen Mid Cap Value Fund
How did the Fund perform during the six-month period ended April 30, 2012?
The tables in the Fund Performance and Expense Ratios section of this report provide Class A Share total returns for the Fund for the six-month, one-year, five-year and ten-year periods ended April 30, 2012. The Fund’s Class A Shares at net asset value (NAV) underperformed both the Russell Mid Cap® Value Index and the Lipper classification average over the six-month period.
What strategies were used to manage the Fund during the reporting period? How did these strategies influence performance?
The Fund seeks to provide long-term capital appreciation by investing primarily in the common stocks of companies with market capitalizations at the time of purchase between approximately $350 million and $14 billion. During the period, we continued to implement the Fund’s investment process of selecting mid-cap companies that we believed were undervalued relative to other companies in the same industry or market, that demonstrated improving fundamentals, and that exhibited a near-term catalyst that could close the gap between market value and our perception of fair value. We look for companies that generate strong free cash flow, which allows them to pay down debt, increase dividends, repurchase shares or engage in merger and acquisition activities. At
the same time, we identify a short- or long-term catalyst we can track and monitor over time that could potentially propel each stock to realize its value. Generally, we sold a holding if the stock price reached its target, the company’s fundamentals or competitive position significantly deteriorated or if a better alternative existed in the marketplace.
The Fund performed well in absolute terms during the period’s strongly advancing market, but still fell short of the Russell benchmark and Lipper average returns. We did experience several bright spots in terms of sector weights and stock selection. For example, the Fund’s underweight position in the utilities sector benefited relative performance. Utilities trailed in the strong market environment that was fueled by improving economic conditions in the U.S. We also experienced solid stock selection in the consumer discretionary sector. For example, we continued to see outperformance in retail from turnaround story Foot Locker, a leading athletic footwear and apparel retailer, and Macy’s, the large department store chain. Both retailers benefited from good execution as they continued to beat their competition and gain market share. In the housing industry, the Fund benefited from purchasing home builder D.R. Horton upon signs of stabilization in the housing industry. Other consumer discretionary companies that had a significant positive impact on the portfolio included hotel chain Wyndham Worldwide, toy company Mattel and recreational equipment maker Jarden. These stocks were inexpensive when we bought them based on recommendations by our fundamental analysts. As the economy began to improve, the market was willing to pay more for these fundamentally strong, attractively valued companies that were demonstrating strong execution.
The Fund’s performance was negatively impacted by our underweight position in the financial sector as well as poor stock selection in financials, technology and health care during the period. Because of improving economic conditions in the U.S., financials did outperform the overall Russell Micap® Value Index. Therefore, the Fund’s underweight stance proved detrimental. Also, some of the more aggressive, lower quality financial companies in the benchmark outperformed some of the higher credit quality financials with stronger capital and balance sheet positions that the Fund held. In technology, Polycom was the primary source of underperformance. Shares of Polycom, a telecommunications equipment company, took a hit after the company fell short of earnings expectations for several quarters in a row. The market began to fear the company was losing market share to its largest competitor, Cisco Systems. We continued to own this stock because we believed it would perform better going forward. Not only has Polycom’s stock been attractively valued, but our fundamental work shows the company has been holding its market share and we believe it may likely experience better execution over the next six months. In health care, our position in Humana underperformed over the six-month period. As economic and employment numbers improved, concerns grew over higher levels of utilization for health care services. During the financial crisis, fewer people used health care services, leading to favorable cost trends for HMOs like Humana. With the economy improving, people are returning to doctors, putting pressure on future HMO profitability.
Nuveen Small Cap Value Fund
How did the Fund perform during the six-month period ended April 30, 2012?
The tables in the Fund Performance and Expense Ratios section of this report provide Class A Share total returns for the Fund for the six-month, one-year, five-year and ten-year periods ended April 30, 2012. The Fund’s Class A Shares at net asset value (NAV) outperformed both the Russell 2000® Value Index and the Lipper classification average over the six-month period.
What strategies were used to manage the Fund during the reporting period? How did these strategies influence performance?
The Fund seeks to provide long-term capital appreciation by investing primarily in the common stocks of companies with market capitalizations of less than $3 billion at the time of purchase. During the six-month period, we continued to focus on building a well-diversified portfolio of small-cap stocks from companies that we believed had strengthening balance sheets and free cash flow characteristics. We also continued to target companies with what we thought were sound business models and strong competitive advantages that might gain market share opportunistically in the current environment. We remained committed to our approach of investing in quality companies that are trading at what we believe is a discount to both intrinsic and relative value metrics.
The Fund’s outperformance during the period was primarily driven by favorable stock selection across several sectors including overweight positions in consumer discretionary and health care and underweight positions in utilities and consumer staples. The top contributors to the Fund’s performance were well distributed across a number of sectors. Within the consumer discretionary sector our strongest performers were Sally Beauty Holdings and Group 1 Automotive. Sally Beauty, the leading distributor of brand name beauty products to salon professionals, continued to benefit from solid organic sales growth, accretive acquisitions and improved liquidity. Group 1 Automotive, a leading national auto dealer franchise, benefited from the recovery of domestic auto sales. Within health care, ICU Medical, a medical technologies firm focused on vascular systems, continued to execute on its revenue goals while moving forward with an attractive new product pipeline. In the financial sector, Delphi Financial Group, a firm focused on employee benefit insurance, was acquired. This acquisition aided the Fund’s results. Additionally, Texas Capital Bancshares, a commercial lending focused regional bank, continued to demonstrate strong lending growth and credit improvement trends that surpassed many of its peers.
The Fund’s overweight positions in both the energy and technology sectors were slight detractors from our results. Another reason for underperformance was the Fund’s cash exposure of approximately 1.9% of net assets in a strongly advancing market environment. Other individual detractors included RF MicroDevices, a semiconductor firm, which experienced weaker sales from China during the period. In energy, Newpark Resources, a supplier of fluid and engineering products to the oil and gas industry, was negatively impacted by disorder in a key input cost, barite. The limited supply of barite
negatively impacted the firm’s margins. PHH Mortgage, a mortgage lending servicer, was a detractor in the industrials sector. There were concerns regarding liquidity shortfalls during late 2011 as mortgage defaults coupled with upcoming debt maturities clouded the outlook for this firm.
Risk Considerations
Mutual fund investing involves risk; principal loss is possible.
Nuveen Dividend Value Fund
Equity investments such as those held by the Fund, are subject to market risk and derivatives risk; dividends are not guaranteed. Foreign investments involve additional risks, including currency fluctuation, political and economic instability, lack of liquidity and differing legal and accounting standards. These risks are magnified in emerging markets. In addition, the Fund invests in debt or fixed income securities that are subject to credit risk and interest rate risk. Below investment grade or high yield debt securities are subject to heightened credit risk, liquidity risk and potential for default.
Nuveen Large Cap Value Fund
Equity investments such as those held by the Fund, are subject to market risk, derivatives risk, value stock risk, and common stock risk. Foreign investments involve additional risks, including currency fluctuation, political and economic instability, lack of liquidity and differing legal and accounting standards. These risks are magnified in emerging markets.
Nuveen Mid Cap Value Fund
Equity investments such as those held by the Fund, are subject to market risk, derivatives risk, value stock risk, and common stock risk. Investments in mid-cap companies are subject to greater volatility. Foreign investments involve additional risks, including currency fluctuation, political and economic instability, lack of liquidity and differing legal and accounting standards. These risks are magnified in emerging markets.
Nuveen Small Cap Value Fund
Equity investments such as those held by the Fund, are subject to market risk, derivatives risk, value stock risk, and common stock risk. Investments in small-cap companies are subject to greater volatility. Foreign investments involve additional risks, including currency fluctuation, political and economic instability, lack of liquidity and differing legal and accounting standards. These risks are magnified in emerging markets.
Fund Performance and Expense Ratios
The Fund Performance and Expense Ratios for each Fund are shown on the following four pages.
Returns quoted represent past performance, which is no guarantee of future results. Current performance may be higher or lower than the performance shown. Investment returns and principal value will fluctuate so that when shares are redeemed, they may be worth more or less than their original cost. Returns without sales charges would be lower if the sales charge were included. Returns do not reflect the deduction of taxes that a shareholder would pay on Fund distributions or the redemption of Fund shares.
Returns may reflect a contractual agreement between certain Funds and the investment adviser to waive certain fees and expenses; see Notes to Financial Statements, Footnote 7 — Management Fees and Other Transactions with Affiliates for more information. In addition, returns may reflect a voluntary expense limitation by the Funds’ investment adviser that may be modified or discontinued at any time without notice. For the most recent month-end performance visit www.nuveen.com or call (800) 257-8787.
Returns reflect differences in sales charges and expenses, which are primarily differences in distribution and service fees. Fund returns assume reinvestment of dividends and capital gains.
Comparative index and Lipper return information is provided for the Funds’ Class A Shares at net asset value (NAV) only.
The expense ratios shown reflect the Funds’ total operating expenses (before fee waivers or expense reimbursements, if any) as shown in the Funds’ most recent prospectus. The expense ratios include management fees and other fees and expenses.
Nuveen Dividend Value Fund
Refer to the first page of this Fund Performance and Expense Ratios section for further explanation of the information included within this page.
Fund Performance
Average Annual Total Returns as of April 30, 2012*
| | | | | | | | | | | | | | | | | | |
| | | |
| | | Cumulative | | | | | Average Annual | |
| | | | | |
| | | 6-Month | | | | | 1-Year | | | 5-Year | | | 10-Year | |
Class A Shares at NAV | | | 12.56% | | | | | | 3.79% | | | | 2.61% | | | | 5.30% | |
Class A Shares at maximum Offering Price | | | 6.06% | | | | | | -2.16% | | | | 1.40% | | | | 4.68% | |
S&P 500® Index** | | | 12.77% | | | | | | 4.76% | | | | 1.01% | | | | 4.71% | |
Russell 1000® Value Index** | | | 11.62% | | | | | | 1.03% | | | | -1.73% | | | | 4.83% | |
Lipper Equity Income Funds Classification Average** | | | 10.34% | | | | | | 2.51% | | | | 0.96% | | | | 5.28% | |
| | | | | |
Class B Shares w/o CDSC*** | | | 12.10% | | | | | | 2.96% | | | | 1.83% | | | | 4.51% | |
Class B Shares w/CDSC*** | | | 7.10% | | | | | | -2.04% | | | | 1.65% | | | | 4.51% | |
Class C Shares | | | 12.19% | | | | | | 3.04% | | | | 1.84% | | | | 4.51% | |
Class R3 Shares | | | 12.52% | | | | | | 3.54% | | | | 2.34% | | | | 5.08% | |
Class I Shares | | | 12.68% | | | | | | 4.04% | | | | 2.85% | | | | 5.56% | |
Average Annual Total Returns as of March 31, 2012 (Most Recent Calendar Quarter)*
| | | | | | | | | | | | | | | | | | |
| | | |
| | | Cumulative | | | | | Average Annual | |
| | | | | |
| | | 6-Month | | | | | 1-Year | | | 5-Year | | | 10-Year | |
Class A Shares at NAV | | | 25.26% | | | | | | 7.16% | | | | 3.43% | | | | 4.93% | |
Class A Shares at maximum Offering Price | | | 18.03% | | | | | | 0.97% | | | | 2.22% | | | | 4.31% | |
Class B Shares w/o CDSC*** | | | 24.75% | | | | | | 6.33% | | | | 2.65% | | | | 4.14% | |
Class B Shares w/CDSC*** | | | 19.75% | | | | | | 1.33% | | | | 2.48% | | | | 4.14% | |
Class C Shares | | | 24.68% | | | | | | 6.33% | | | | 2.65% | | | | 4.13% | |
Class R3 Shares | | | 25.15% | | | | | | 6.90% | | | | 3.16% | | | | 4.71% | |
Class I Shares | | | 25.40% | | | | | | 7.39% | | | | 3.69% | | | | 5.19% | |
Class A Shares have a maximum 5.75% sales charge (Offering Price). Class A Share purchases of $1 million or more are sold at net asset value without an up-front sales charge but may be subject to a contingent deferred sales charge (CDSC), also known as a back-end sales charge, if redeemed within twelve months of purchase. Class B Shares have a CDSC that begins at 5% for redemptions during the first year and declines periodically until after six years when the charge becomes 0%. Class B Shares automatically convert to Class A Shares eight years after purchase. Class C Shares have a 1% CDSC for redemptions within less than twelve months, which is not reflected in the one-year total return. Class R3 Shares have no sales charge and are available to only certain retirement plans. Class I Shares have no sales charge and may be purchased under limited circumstances or by specified classes of investors.
Expense Ratios as of Most Recent Prospectus
| | | | |
| |
| | | Expense
Ratios | |
Class A Shares | | | 1.14% | |
Class B Shares | | | 1.89% | |
Class C Shares | | | 1.89% | |
Class R3 Shares | | | 1.39% | |
Class I Shares | | | 0.89% | |
| * | Six-month returns are cumulative; all other returns are annualized. |
| ** | Refer to the Glossary of Terms Used in this Report for definitions. Indexes and Lipper averages are not available for direct Investment. |
| *** | Class B Shares are available only upon the exchange of Class B Shares from another Nuveen mutual fund or for purposes of dividend reinvestment, but Class B Shares are not available for new accounts or for additional investment into existing accounts. |
Fund Performance and Expense Ratios (continued)
Nuveen Large Cap Value Fund
Refer to the first page of this Fund Performance and Expense Ratios section for further explanation of the information included within this page.
Fund Performance
Average Annual Total Returns as of April 30, 2012*
| | | | | | | | | | | | | | | | | | |
| | | |
| | | Cumulative | | | | | Average Annual | |
| | | | | |
| | | 6-Month | | | | | 1-Year | | | 5-Year | | | 10-Year | |
Class A Shares at NAV | | | 12.88% | | | | | | -0.87% | | | | -2.12% | | | | 3.21% | |
Class A Shares at maximum Offering Price | | | 6.39% | | | | | | -6.56% | | | | -3.27% | | | | 2.60% | |
Russell 1000® Value Index** | | | 11.62% | | | | | | 1.03% | | | | -1.73% | | | | 4.83% | |
Lipper Large-Cap Value Funds Classification Average** | | | 11.18% | | | | | | -0.48% | | | | -1.70% | | | | 3.97% | |
| | | | | |
Class C Shares | | | 12.42% | | | | | | -1.61% | | | | -2.85% | | | | 2.43% | |
Class R3 Shares | | | 12.75% | | | | | | -1.13% | | | | -2.37% | | | | 2.99% | |
Class I Shares | | | 13.02% | | | | | | -0.61% | | | | -1.87% | | | | 3.46% | |
Average Annual Total Returns as of March 31, 2012 (Most Recent Calendar Quarter)*
| | | | | | | | | | | | | | | | | | |
| | | |
| | | Cumulative | | | | | Average Annual | |
| | | | | |
| | | 6-Month | | | | | 1-Year | | | 5-Year | | | 10-Year | |
Class A Shares at NAV | | | 28.57% | | | | | | 0.54% | | | | -1.09% | | | | 2.86% | |
Class A Shares at maximum Offering Price | | | 21.15% | | | | | | -5.23% | | | | -2.25% | | | | 2.25% | |
Class C Shares | | | 28.03% | | | | | | -0.19% | | | | -1.84% | | | | 2.09% | |
Class R3 Shares | | | 28.42% | | | | | | 0.34% | | | | -1.34% | | | | 2.66% | |
Class I Shares | | | 28.73% | | | | | | 0.79% | | | | -0.85% | | | | 3.12% | |
Class A Shares have a maximum 5.75% sales charge (Offering Price). Class A Share purchases of $1 million or more are sold at net asset value without an up-front sales charge but may be subject to a contingent deferred sales charge (CDSC), also known as a back-end sales charge, if redeemed within twelve months of purchase. Class C Shares have a 1% CDSC for redemptions within less than twelve months, which is not reflected in the one-year total return. Class R3 Shares have no sales charge and are available to only certain retirement plans. Class I Shares have no sales charge and may be purchased under limited circumstances or by specified classes of investors.
Expense Ratios as of Most Recent Prospectus
| | | | |
| |
| | | Expense
Ratios | |
Class A Shares | | | 1.19% | |
Class C Shares | | | 1.94% | |
Class R3 Shares | | | 1.44% | |
Class I Shares | | | 0.94% | |
| * | Six-month returns are cumulative; all other returns are annualized. |
| ** | Refer to the Glossary of Terms Used in this Report for definitions. Indexes and Lipper averages are not available for direct investment. |
Nuveen Mid Cap Value Fund
Refer to the first page of this Fund Performance and Expense Ratios section for further explanation of the information included within this page.
Fund Performance
Average Annual Total Returns as of April 30, 2012*
| | | | | | | | | | | | | | | | | | |
| | | |
| | | Cumulative | | | | | Average Annual | |
| | | | | |
| | | 6-Month | | | | | 1-Year | | | 5-Year | | | 10-Year | |
Class A Shares at NAV | | | 10.08% | | | | | | -5.88% | | | | -0.65% | | | | 6.31% | |
Class A Shares at maximum Offering Price | | | 3.76% | | | | | | -11.30% | | | | -1.82% | | | | 5.68% | |
Russell Midcap® Value Index** | | | 11.48% | | | | | | -0.81% | | | | 0.50% | | | | 7.95% | |
Lipper Mid-Cap Value Funds Classification Average** | | | 11.26% | | | | | | -3.07% | | | | 0.00% | | | | 6.33% | |
| | | | | |
Class B Shares w/o CDSC*** | | | 9.65% | | | | | | -6.56% | | | | -1.39% | | | | 5.53% | |
Class B Shares w/CDSC*** | | | 4.65% | | | | | | -11.23% | | | | -1.57% | | | | 5.53% | |
Class C Shares | | | 9.62% | | | | | | -6.58% | | | | -1.40% | | | | 5.52% | |
Class R3 Shares | | | 9.89% | | | | | | -6.12% | | | | -0.91% | | | | 6.11% | |
Class I Shares | | | 10.16% | | | | | | -5.67% | | | | -0.42% | | | | 6.57% | |
Average Annual Total Returns as of March 31, 2012 (Most Recent Calendar Quarter)*
| | | | | | | | | | | | | | | | | | |
| | | |
| | | Cumulative | | | | | Average Annual | |
| | | | | |
| | | 6-Month | | | | | 1-Year | | | 5-Year | | | 10-Year | |
Class A Shares at NAV | | | 25.69% | | | | | | -3.02% | | | | 0.41% | | | | 6.43% | |
Class A Shares at maximum Offering Price | | | 18.47% | | | | | | -8.60% | | | | -0.78% | | | | 5.80% | |
Class B Shares w/o CDSC*** | | | 25.16% | | | | | | -3.76% | | | | -0.33% | | | | 5.64% | |
Class B Shares w/CDSC*** | | | 20.16% | | | | | | -8.57% | | | | -0.52% | | | | 5.64% | |
Class C Shares | | | 25.26% | | | | | | -3.72% | | | | -0.34% | | | | 5.64% | |
Class R3 Shares | | | 25.51% | | | | | | -3.25% | | | | 0.17% | | | | 6.23% | |
Class I Shares | | | 25.79% | | | | | | -2.79% | | | | 0.65% | | | | 6.69% | |
Class A Shares have a maximum 5.75% sales charge (Offering Price). Class A Share purchases of $1 million or more are sold at net asset value without an up-front sales charge but may be subject to a contingent deferred sales charge (CDSC), also known as a back-end sales charge, if redeemed within twelve months of purchase. Class B Shares have a CDSC that begins at 5% for redemptions during the first year and declines periodically until after six years when the charge becomes 0%. Class B Shares automatically convert to Class A Shares eight years after purchase. Class C Shares have a 1% CDSC for redemptions within less than twelve months, which is not reflected in the one-year total return. Class R3 Shares have no sales charge and are available to only certain retirement plans. Class I Shares have no sales charge and may be purchased under limited circumstances or by specified classes of investors.
| | | | |
| Expense Ratios as of Most Recent Prospectus | |
| |
| | | Expense
Ratios | |
Class A Shares | | | 1.32% | |
Class B Shares | | | 2.07% | |
Class C Shares | | | 2.07% | |
Class R3 Shares | | | 1.57% | |
Class I Shares | | | 1.07% | |
| * | Six-month returns are cumulative; all other returns are annualized. |
| ** | Refer to the Glossary of Terms Used in this Report for definitions. Indexes and Lipper averages are not available for direct investment. |
| *** | Class B Shares are available only upon the exchange of Class B Shares from another Nuveen mutual fund or for purposes of dividend reinvestment, but Class B Shares are not available for new accounts or for additional investment into existing accounts. |
Fund Performance and Expense Ratios (continued)
Nuveen Small Cap Value Fund
Refer to the first page of this Fund Performance and Expense Ratios section for further explanation of the information included within this page.
Fund Performance
Average Annual Total Returns as of April 30, 2012*
| | | | | | | | | | | | | | | | | | |
| | | |
| | | Cumulative | | | | | Average Annual | |
| | | | | |
| | | 6-Month | | | | | 1-Year | | | 5-Year | | | 10-Year | |
Class A Shares at NAV | | | 12.83% | | | | | | 0.39% | | | | 1.59% | | | | 5.97% | |
Class A Shares at maximum Offering Price | | | 6.34% | | | | | | -5.35% | | | | 0.39% | | | | 5.35% | |
Russell 2000® Value Index** | | | 11.47% | | | | | | -4.06% | | | | -0.49% | | | | 6.07% | |
Lipper Small-Cap Value Funds Classification Average** | | | 11.35% | | | | | | -3.78% | | | | 0.87% | | | | 6.75% | |
| | | | | |
Class C Shares | | | 12.39% | | | | | | -0.36% | | | | 0.83% | | | | 5.19% | |
Class R3 Shares | | | 12.69% | | | | | | 0.16% | | | | 1.34% | | | | 5.79% | |
Class I Shares | | | 12.96% | | | | | | 0.61% | | | | 1.83% | | | | 6.24% | |
Average Annual Total Returns as of March 31, 2012 (Most Recent Calendar Quarter)*
| | | | | | | | | | | | | | | | | | |
| | | |
| | | Cumulative | | | | | Average Annual | |
| | | | | |
| | | 6-Month | | | | | 1-Year | | | 5-Year | | | 10-Year | |
Class A Shares at NAV | | | 33.96% | | | | | | 3.86% | | | | 1.98% | | | | 6.45% | |
Class A Shares at maximum Offering Price | | | 26.22% | | | | | | -2.12% | | | | 0.78% | | | | 5.82% | |
Class C Shares | | | 33.57% | | | | | | 3.10% | | | | 1.23% | | | | 5.66% | |
Class R3 Shares | | | 33.79% | | | | | | 3.60% | | | | 1.74% | | | | 6.26% | |
Class I Shares | | | 34.17% | | | | | | 4.07% | | | | 2.22% | | | | 6.71% | |
Class A Shares have a maximum 5.75% sales charge (Offering Price). Class A Share purchases of $1 million or more are sold at net asset value without an up-front sales charge but may be subject to a contingent deferred sales charge (CDSC), also known as a back-end sales charge, if redeemed within twelve months of purchase. Class C Shares have a 1% CDSC for redemptions within less than twelve months, which is not reflected in the one-year total return. Class R3 Shares have no sales charge and are available to only certain retirement plans. Class I Shares have no sales charge and may be purchased under limited circumstances or by specified classes of investors.
Expense Ratios as of Most Recent Prospectus
| | | | |
| |
| | | Expense
Ratios | |
Class A Shares | | | 1.54% | |
Class C Shares | | | 2.29% | |
Class R3 Shares | | | 1.79% | |
Class I Shares | | | 1.29% | |
| * | Six-month returns are cumulative; all other returns are annualized. |
| ** | Refer to the Glossary of Terms Used in this Report for definitions. Indexes and Lipper averages are not available for direct investment. |
Holding Summaries as of April 30, 2012
This data relates to the securities held in each Fund’s portfolio of investments. It should not be construed as a measure of performance for the Fund itself.
Nuveen Dividend Value Fund
Portfolio Allocation1
Nuveen Large Cap Value Fund
Portfolio Allocation1
Nuveen Mid Cap Value Fund
Portfolio Allocation1
Nuveen Small Cap Value Fund
Portfolio Allocation1
| | | | |
Portfolio Composition1 | |
| Financials | | | 18.2% | |
| Energy | | | 13.3% | |
| Health Care | | | 13.1% | |
| Information Technology | | | 12.6% | |
| Consumer Discretionary | | | 10.8% | |
| Industrials | | | 10.4% | |
| Consumer Staples | | | 7.3% | |
| Telecommunication Services | | | 5.6% | |
| Materials | | | 5.4% | |
| Short-Term Investments | | | 0.4% | |
| Other | | | 2.9% | |
| | | | |
| Portfolio Composition1 | |
| Financials | | | 25.7% | |
| Energy | | | 13.4% | |
| Health Care | | | 12.8% | |
| Consumer Discretionary | | | 10.5% | |
| Information Technology | | | 8.7% | |
| Consumer Staples | | | 7.4% | |
| Industrials | | | 7.2% | |
| Utilities | | | 5.8% | |
| Short-Term Investments | | | 0.6% | |
| Other | | | 7.9% | |
| | | | |
| Portfolio Composition1 | |
| Financials | | | 26.6% | |
| Consumer Discretionary | | | 15.6% | |
| Information Technology | | | 11.9% | |
| Industrials | | | 10.0% | |
| Health Care | | | 9.6% | |
| Utilities | | | 8.7% | |
| Energy | | | 8.2% | |
| Materials | | | 6.5% | |
| Short-Term Investments | | | 0.1% | |
| Other | | | 2.8% | |
| | | | |
| Portfolio Composition1 | |
| Financials | | | 28.9% | |
| Industrials | | | 16.4% | |
| Consumer Discretionary | | | 13.5% | |
| Information Technology | | | 13.3% | |
| Energy | | | 6.1% | |
| Materials | | | 6.0% | |
| Utilities | | | 5.9% | |
| Health Care | | | 5.8% | |
| Short-Term Investments | | | 0.7% | |
| Other | | | 3.4% | |
| | | | |
| Top Five Common Stock Holdings2 | |
| JP Morgan Chase & Co. | | | 3.6% | |
| Verizon Communications Inc. | | | 3.0% | |
| Chevron Corporation | | | 3.0% | |
| Pfizer Inc. | | | 2.9% | |
| Exxon Mobil Corporation | | | 2.8% | |
| | | | |
| Top Five Common Stock Holdings2 | |
| JP Morgan Chase & Co. | | | 4.3% | |
| Pfizer Inc. | | | 4.1% | |
| Wells Fargo & Company | | | 3.3% | |
| Intel Corporation | | | 2.2% | |
| Comcast Corporation | | | 2.2% | |
| | | | |
| Top Five Common Stock Holdings2 | |
| Invesco LTD | | | 2.3% | |
| Staples, Inc. | | | 2.2% | |
| American Water Works Company | | | 2.1% | |
| CMS Energy Corporation | | | 2.0% | |
| Macy’s, Inc. | | | 2.0% | |
| | | | |
| Top Five Common Stock Holdings2 | |
| Triumph Group Inc. | | | 2.4% | |
| Group 1 Automotive Inc. | | | 2.0% | |
| Atmos Energy Corporation | | | 2.0% | |
| Texas Capital BancShares, Inc. | | | 1.7% | |
| Webster Financial Corporation | | | 1.7% | |
| 1 | As a percentage of total investments (excluding investments purchased with collateral from securities lending) as of April 30, 2012. Holdings are subject to change. |
| 2 | As a percentage of total common stocks as of April 30, 2012. Holdings are subject to change. |
Expense Examples
As a shareholder of one or more of the Funds, you incur two types of costs: (1) transaction costs, including up-front and back-end sales charges (loads) or redemption fees, where applicable; and (2) ongoing costs, including management fees; distribution and service (12b-1) fees, where applicable; and other Fund expenses. The Examples below are intended to help you understand your ongoing costs (in dollars) of investing in the Funds and to compare these costs with the ongoing costs of investing in other mutual funds.
The Examples below are based on an investment of $1,000 invested at the beginning of the period and held for the period.
The information under “Actual Performance,” together with the amount you invested, allows you to estimate actual expenses incurred over the reporting period. Simply divide your account value by $1,000 (for example, an $8,600 account value divided by $1,000 = 8.60) and multiply the result by the cost shown for your share class, in the row entitled “Expenses Incurred During Period” to estimate the expenses incurred on your account during this period.
The information under “Hypothetical Performance,” provides information about hypothetical account values and hypothetical expenses based on the respective Fund’s actual expense ratio and an assumed rate of return of 5% per year before expenses, which is not the Fund’s actual return. The hypothetical account values and expenses may not be used to estimate the actual ending account balance or expense you incurred for the period. You may use this information to compare the ongoing costs of investing in the Fund and other funds. To do so, compare this 5% hypothetical example with the 5% hypothetical examples that appear in the shareholder reports of the other funds.
Please note that the expenses shown in the table are meant to highlight your ongoing costs only and do not reflect any transaction costs. Therefore, the hypothetical information is useful in comparing ongoing costs only, and will not help you determine the relative total costs of owning different funds or share classes. In addition, if these transaction costs were included, your costs would have been higher.
Nuveen Dividend Value Fund
| | | | | | | | | | | | | | | | | | | | | | | | | | | | | | | | | | | | | | | | | | |
| | | | | | | | | | | | | | | | | | Hypothetical Performance | |
| | | Actual Performance | | | | | (5% annualized return before expenses) | |
| | | A Shares | | | B Shares | | | C Shares | | | R3 Shares | | | I Shares | | | | | A Shares | | | B Shares | | | C Shares | | | R3 Shares | | | I Shares | |
| Beginning Account Value (11/01/11) | | $ | 1,000.00 | | | $ | 1,000.00 | | | $ | 1,000.00 | | | $ | 1,000.00 | | | $ | 1,000.00 | | | | | $ | 1,000.00 | | | $ | 1,000.00 | | | $ | 1,000.00 | | | $ | 1,000.00 | | | $ | 1,000.00 | |
| Ending Account Value (4/30/12) | | $ | 1,125.60 | | | $ | 1,121.00 | | | $ | 1,121.90 | | | $ | 1,125.20 | | | $ | 1,126.80 | | | | | $ | 1,019.05 | | | $ | 1,015.32 | | | $ | 1,015.32 | | | $ | 1,017.80 | | | $ | 1,020.29 | |
| Expenses Incurred During Period | | $ | 6.18 | | | $ | 10.13 | | | $ | 10.13 | | | $ | 7.50 | | | $ | 4.86 | | | | | $ | 5.87 | | | $ | 9.62 | | | $ | 9.62 | | | $ | 7.12 | | | $ | 4.62 | |
For each class of the Fund, expenses are equal to the Fund’s annualized net expense ratio of 1.17%, 1.92%, 1.92%, 1.42% and ..92% for Classes A, B, C, R3 and I, respectively, multiplied by the average account value over the period, multiplied by 182/366 (to reflect the one-half year period).
Nuveen Large Cap Value Fund
| | | | | | | | | | | | | | | | | | | | | | | | | | | | | | | | | | |
| | | | | | | | | | | | | | | Hypothetical Performance | |
| | | Actual Performance | | | | | (5% annualized return before expenses) | |
| | | A Shares | | | C Shares | | | R3 Shares | | | I Shares | | | | | A Shares | | | C Shares | | | R3 Shares | | | I Shares | |
| Beginning Account Value (11/01/11) | | $ | 1,000.00 | | | $ | 1,000.00 | | | $ | 1,000.00 | | | $ | 1,000.00 | | | | | $ | 1,000.00 | | | $ | 1,000.00 | | | $ | 1,000.00 | | | $ | 1,000.00 | |
| Ending Account Value (4/30/12) | | $ | 1,128.80 | | | $ | 1,124.20 | | | $ | 1,127.50 | | | $ | 1,130.20 | | | | | $ | 1,018.35 | | | $ | 1,014.72 | | | $ | 1,017.21 | | | $ | 1,019.69 | |
| Expenses Incurred During Period | | $ | 6.93 | | | $ | 10.77 | | | $ | 8.15 | | | $ | 5.51 | | | | | $ | 6.57 | | | $ | 10.22 | | | $ | 7.72 | | | $ | 5.22 | |
For each class of the Fund, expenses are equal to the Fund’s annualized net expense ratio of 1.31%, 2.04%, 1.54% and 1.04% for Classes A, C, R3 and I, respectively, multiplied by the average account value over the period, multiplied by 182/366 (to reflect the one-half year period).
Nuveen Mid Cap Value Fund
| | | | | | | | | | | | | | | | | | | | | | | | | | | | | | | | | | | | | | | | | | |
| | | | | | | | | | | | | | | | | | Hypothetical Performance | |
| | | Actual Performance | | | | | (5% annualized return before expenses) | |
| | | A Shares | | | B Shares | | | C Shares | | | R3 Shares | | | I Shares | | | | | A Shares | | | B Shares | | | C Shares | | | R3 Shares | | | I Shares | |
| Beginning Account Value (11/01/11) | | $ | 1,000.00 | | | $ | 1,000.00 | | | $ | 1,000.00 | | | $ | 1,000.00 | | | $ | 1,000.00 | | | | | $ | 1,000.00 | | | $ | 1,000.00 | | | $ | 1,000.00 | | | $ | 1,000.00 | | | $ | 1,000.00 | |
| Ending Account Value (4/30/12) | | $ | 1,100.80 | | | $ | 1,096.50 | | | $ | 1,096.20 | | | $ | 1,098.90 | | | $ | 1,101.60 | | | | | $ | 1,018.50 | | | $ | 1,014.77 | | | $ | 1,014.77 | | | $ | 1,017.26 | | | $ | 1,019.74 | |
| Expenses Incurred During Period | | $ | 6.69 | | | $ | 10.58 | | | $ | 10.58 | | | $ | 7.98 | | | $ | 5.38 | | | | | $ | 6.42 | | | $ | 10.17 | | | $ | 10.17 | | | $ | 7.67 | | | $ | 5.17 | |
For each class of the Fund, expenses are equal to the Fund’s annualized net expense ratio of 1.28%, 2.03%, 2.03%, 1.53% and 1.03% for Classes A, B, C, R3 and I, respectively, multiplied by the average account value over the period, multiplied by 182/366 (to reflect the one-half year period).
Expense Examples (continued)
Nuveen Small Cap Value Fund
| | | | | | | | | | | | | | | | | | | | | | | | | | | | | | | | | | |
| | | | | | | | | | | | | | | | | Hypothetical Performance | |
| | | Actual Performance | | | | | (5% annualized return before expenses) | |
| | | A Shares | | | C Shares | | | R3 Shares | | | I Shares | | | | | A Shares | | | C Shares | | | R3 Shares | | | I Shares | |
| Beginning Account Value (11/01/11) | | $ | 1,000.00 | | | $ | 1,000.00 | | | $ | 1,000.00 | | | $ | 1,000.00 | | | | | $ | 1,000.00 | | | $ | 1,000.00 | | | $ | 1,000.00 | | | $ | 1,000.00 | |
| Ending Account Value (4/30/12) | | $ | 1,128.30 | | | $ | 1,123.90 | | | $ | 1,126.90 | | | $ | 1,129.60 | | | | | $ | 1,017.60 | | | $ | 1,013.87 | | | $ | 1,016.36 | | | $ | 1,018.85 | |
| Expenses Incurred During Period | | $ | 7.73 | | | $ | 11.67 | | | $ | 9.04 | | | $ | 6.41 | | | | | $ | 7.32 | | | $ | 11.07 | | | $ | 8.57 | | | $ | 6.07 | |
For each class of the Fund, expenses are equal to the Fund’s annualized net expense ratio of 1.46%, 2.21%, 1.71% and 1.21% for Classes A, C, R3 and I, respectively, multiplied by the average account value over the period, multiplied by 182/366 (to reflect the one-half year period).
Portfolio of Investments (Unaudited)
Nuveen Dividend Value Fund
April 30, 2012
| | | | | | | | | | | | | | |
| Shares | | | Description (1) | | | | | | | | Value | |
| | | | | | | | | | | | | | |
| | | | COMMON STOCKS – 99.7% | | | | | | | | | | |
| | | | | |
| | | | Consumer Discretionary – 10.8% | | | | | | | | | | |
| | | | | |
| | 495,357 | | | Carnival Corporation, ADR, (2) | | | | | | | | $ | 16,094,149 | |
| | | | | |
| | 752,606 | | | Cinemark Holdings Inc., (2) | | | | | | | | | 17,279,834 | |
| | | | | |
| | 346,439 | | | Hasbro, Inc. | | | | | | | | | 12,728,169 | |
| | | | | |
| | 333,410 | | | Home Depot, Inc. | | | | | | | | | 17,267,304 | |
| | | | | |
| | 193,757 | | | McDonald’s Corporation | | | | | | | | | 18,881,620 | |
| | | | | |
| | 338,895 | | | Starbucks Corporation | | | | | | | | | 19,445,795 | |
| | | | | |
| | 149,027 | | | Whirlpool Corporation, (2) | | | | | | | | | 9,540,709 | |
| | | | | |
| | 282,933 | | | YUM! Brands, Inc. | | | | | | | | | 20,577,717 | |
| | | | Total Consumer Discretionary | | | | | | | | | 131,815,297 | |
| | | | Consumer Staples – 7.3% | | | | | | | | | | |
| | | | | |
| | 400,947 | | | Altria Group, Inc. | | | | | | | | | 12,914,503 | |
| | | | | |
| | 292,010 | | | ConAgra Foods, Inc. | | | | | | | | | 7,539,698 | |
| | | | | |
| | 176,658 | | | Kimberly-Clark Corporation | | | | | | | | | 13,862,353 | |
| | | | | |
| | 461,548 | | | Kraft Foods Inc. | | | | | | | | | 18,401,919 | |
| | | | | |
| | 237,678 | | | Philip Morris International | | | | | | | | | 21,274,558 | |
| | | | | |
| | 437,369 | | | Unilever PLC, ADR | | | | | | | | | 15,023,625 | |
| | | | Total Consumer Staples | | | | | | | | | 89,016,656 | |
| | | | Energy – 13.4% | | | | | | | | | | |
| | | | | |
| | 176,004 | | | Anadarko Petroleum Corporation | | | | | | | | | 12,885,253 | |
| | | | | |
| | 341,557 | | | Chevron Corporation | | | | | | | | | 36,396,314 | |
| | | | | |
| | 160,743 | | | ConocoPhillips | | | | | | | | | 11,514,021 | |
| | | | | |
| | 343,280 | | | Enbridge Energy Partners LP, (2) | | | | | | | | | 10,607,352 | |
| | | | | |
| | 377,892 | | | Exterran Partners, L.P, (2) | | | | | | | | | 8,442,107 | |
| | | | | |
| | 397,700 | | | Exxon Mobil Corporation | | | | | | | | | 34,337,418 | |
| | | | | |
| | 95,191 | | | Occidental Petroleum Corporation | | | | | | | | | 8,683,323 | |
| | | | | |
| | 359,916 | | | Royal Dutch Shell PLC, Class A | | | | | | | | | 25,748,391 | |
| | | | | |
| | 187,685 | | | Schlumberger Limited | | | | | | | | | 13,914,966 | |
| | | | Total Energy | | | | | | | | | 162,529,145 | |
| | | | Financials – 18.2% | | | | | | | | | | |
| | | | | |
| | 412,400 | | | AFLAC Incorporated | | | | | | | | | 18,574,496 | |
| | | | | |
| | 651,157 | | | Annaly Capital Management Inc., (2) | | | | | | | | | 10,626,882 | |
| | | | | |
| | 283,743 | | | BankUnited Inc. | | | | | | | | | 6,980,078 | |
| | | | | |
| | 332,392 | | | Capital One Financial Corporation | | | | | | | | | 18,441,108 | |
| | | | | |
| | 625,468 | | | Citigroup Inc. | | | | | | | | | 20,665,463 | |
| | | | | |
| | 216,504 | | | Community Bank System Inc., (2) | | | | | | | | | 6,088,092 | |
| | | | | |
| | 548,370 | | | Fifth Third Bancorp. | | | | | | | | | 7,803,305 | |
| | | | | |
| | 45,024 | | | Goldman Sachs Group, Inc. | | | | | | | | | 5,184,514 | |
| | | | | |
| | 1,013,445 | | | JP Morgan Chase & Co. | | | | | | | | | 43,557,866 | |
| | | | | |
| | 166,130 | | | Liberty Property Trust, (2) | | | | | | | | | 6,055,439 | |
| | | | | |
| | 111,498 | | | Mid-America Apartment Communities, (2) | | | | | | | | | 7,589,669 | |
| | | | | |
| | 199,852 | | | National Retail Properties, Inc. | | | | | | | | | 5,471,948 | |
| | | | | |
| | 781,037 | | | Old Republic International Corporation | | | | | | | | | 7,771,318 | |
| | | | | |
| | 354,100 | | | Prudential Financial, Inc. | | | | | | | | | 21,437,214 | |
| | | | | |
| | 738,051 | | | Redwood Trust Inc., (2) | | | | | | | | | 8,620,436 | |
| | | | | |
| | 456,508 | | | State Street Corporation | | | | | | | | | 21,099,800 | |
| | | | | |
| | 101,264 | | | Ventas Inc., (2) | | | | | | | | | 5,953,311 | |
| | | | Total Financials | | | | | | | | | 221,920,939 | |
| | | | | | | | | | | | | | |
| Shares | | | Description (1) | | | | | | | | Value | |
| | | | | | | | | | | | | | |
| | | | Health Care – 13.2% | | | | | | | | | | |
| | | | | |
| | 340,612 | | | Abbott Laboratories, (2) | | | | | | | | $ | 21,138,381 | |
| | | | | |
| | 390,092 | | | Bristol-Myers Squibb Company | | | | | | | | | 13,017,370 | |
| | | | | |
| | 280,799 | | | Covidien PLC | | | | | | | | | 15,508,529 | |
| | | | | |
| | 282,652 | | | GlaxoSmithKline PLC | | | | | | | | | 13,067,002 | |
| | | | | |
| | 110,409 | | | Humana Inc. | | | | | | | | | 8,907,798 | |
| | | | | |
| | 283,493 | | | Johnson & Johnson | | | | | | | | | 18,452,559 | |
| | | | | |
| | 504,228 | | | Merck & Company Inc. | | | | | | | | | 19,785,907 | |
| | | | | |
| | 1,508,878 | | | Pfizer Inc. | | | | | | | | | 34,598,573 | |
| | | | | |
| | 275,586 | | | UnitedHealth Group Incorporated | | | | | | | | | 15,474,154 | |
| | | | Total Health Care | | | | | | | | | 159,950,273 | |
| | | | Industrials – 10.4% | | | | | | | | | | |
| | | | | |
| | 132,011 | | | 3M Co. | | | | | | | | | 11,796,503 | |
| | | | | |
| | 129,627 | | | Boeing Company | | | | | | | | | 9,955,354 | |
| | | | | |
| | 383,223 | | | Emerson Electric Company, (2) | | | | | | | | | 20,134,536 | |
| | | | | |
| | 124,909 | | | General Dynamics Corporation | | | | | | | | | 8,431,358 | |
| | | | | |
| | 1,326,279 | | | General Electric Company | | | | | | | | | 25,968,543 | |
| | | | | |
| | 240,752 | | | Ingersoll Rand Company Limited, Class A | | | | | | | | | 10,236,775 | |
| | | | | |
| | 395,773 | | | Republic Services, Inc. | | | | | | | | | 10,832,307 | |
| | | | | |
| | 146,548 | | | United Parcel Service, Inc., Class B | | | | | | | | | 11,451,261 | |
| | | | | |
| | 212,846 | | | United Technologies Corporation | | | | | | | | | 17,376,747 | |
| | | | Total Industrials | | | | | | | | | 126,183,384 | |
| | | | Information Technology – 12.6% | | | | | | | | | | |
| | | | | |
| | 85,906 | | | Automatic Data Processing, Inc. | | | | | | | | | 4,778,092 | |
| | | | | |
| | 789,389 | | | Intel Corporation | | | | | | | | | 22,418,648 | |
| | | | | |
| | 14,665 | | | MasterCard, Inc. | | | | | | | | | 6,632,540 | |
| | | | | |
| | 505,012 | | | Maxim Integrated Products, Inc. | | | | | | | | | 14,938,255 | |
| | | | | |
| | 776,006 | | | Microsoft Corporation | | | | | | | | | 24,847,712 | |
| | | | | |
| | 450,079 | | | Molex Inc. | | | | | | | | | 10,306,809 | |
| | | | | |
| | 389,440 | | | Oracle Corporation | | | | | | | | | 11,445,642 | |
| | | | | |
| | 241,724 | | | QUALCOMM, Inc. | | | | | | | | | 15,431,660 | |
| | | | | |
| | 871,416 | | | Seagate Technology | | | | | | | | | 26,804,756 | |
| | | | | |
| | 306,895 | | | Texas Instruments Incorporated | | | | | | | | | 9,802,226 | |
| | | | | |
| | 50,407 | | | Visa Inc., (2) | | | | | | | | | 6,199,053 | |
| | | | Total Information Technology | | | | | | | | | 153,605,393 | |
| | | | Materials – 5.4% | | | | | | | | | | |
| | | | | |
| | 396,120 | | | Dow Chemical Company, (2) | | | | | | | | | 13,420,546 | |
| | | | | |
| | 253,594 | | | E.I. Du Pont de Nemours and Company, (2) | | | | | | | | | 13,557,135 | |
| | | | | |
| | 287,926 | | | Potash Corporation of Saskatchewan, (2) | | | | | | | | | 12,231,096 | |
| | | | | |
| | 140,993 | | | PPG Industries, Inc. | | | | | | | | | 14,838,103 | |
| | | | | |
| | 103,445 | | | Praxair, Inc. | | | | | | | | | 11,968,587 | |
| | | | Total Materials | | | | | | | | | 66,015,467 | |
| | | | Telecommunication Services – 5.6% | | | | | | | | | | |
| | | | | |
| | 420,661 | | | CenturyLink Inc., (2) | | | | | | | | | 16,220,688 | |
| | | | | |
| | 912,137 | | | Verizon Communications Inc. | | | | | | | | | 36,832,092 | |
| | | | | |
| | 1,316,285 | | | Windstream Corporation, (2) | | | | | | | | | 14,795,043 | |
| | | | Total Telecommunication Services | | | | | | | | | 67,847,823 | |
Portfolio of Investments (Unaudited)
Nuveen Dividend Value Fund (continued)
April 30, 2012
| | | | | | | | | | | | | | |
| Shares | | | Description (1) | | | | | | | | Value | |
| | | | | | | | | | | | | | |
| | | | Utilities – 2.8% | | | | | | | | | | |
| | | | | |
| | 561,481 | | | CenterPoint Energy, Inc. | | | | | | | | $ | 11,347,531 | |
| | | | | |
| | 417,450 | | | PPL Corporation, (2) | | | | | | | | | 11,417,255 | |
| | | | | |
| | 406,450 | | | Westar Energy Inc., (2) | | | | | | | | | 11,661,048 | |
| | | | Total Utilities | | | | | | | | | 34,425,834 | |
| | | | Total Common Stocks (cost $890,183,271) | | | | | | | | | 1,213,310,211 | |
| | | | | |
| Shares | | | Description (1) | | | | | | | | Value | |
| | | | INVESTMENT PURCHASED WITH COLLATERAL FROM SECURITIES LENDING | | | | | | | | | | |
| | | | | |
| | | | Money Market Funds – 12.8% | | | | | | | | | | |
| | | | | |
| | 156,050,266 | | | Mount Vernon Securities Lending Prime Portfolio, Class Z, 0.276%, (3), (4) | | | | | | | | $ | 156,050,266 | |
| | | | Total Investments Purchased with Collateral from Securities Lending (cost $156,050,266) | | | | | | | | | 156,050,266 | |
| | | | | |
| Shares | | | Description (1) | | | | | | | | Value | |
| | | | SHORT-TERM INVESTMENTS – 0.4% | | | | | | | | | | |
| | | | | |
| | 5,474,249 | | | First American Treasury Obligations Fund, Class Z, 0.000%, (3) | | | | | | | | $ | 5,474,249 | |
| | | | Total Short-Term Investments (cost $5,474,249) | | | | | | | | | 5,474,249 | |
| | | | Total Investments (cost $1,051,707,786) – 112.9% | | | | | | | | | 1,374,834,726 | |
| | | | Other Assets Less Liabilities – (12.9)% | | | | | | | | | (157,226,266) | |
| | | | Net Assets – 100% | | | | | | | | $ | 1,217,608,460 | |
| | | | For Fund portfolio compliance purposes, the Fund’s industry classifications refer to any one or more of the industry sub-classifications used by one or more widely recognized market indexes or ratings group indexes, and/or as defined by Fund management. This definition may not apply for purposes of this report, which may combine industry sub-classifications into sectors for reporting ease. |
| | (1) | | All percentages shown in the Portfolio of Investments are based on net assets. |
| | (2) | | Investment, or a portion of investment, is out on loan for securities lending. |
| | (3) | | The rate shown is the annualized seven-day effective yield as of April 30, 2012. |
| | (4) | | The Fund may loan securities representing up to one third of the fair value of its total assets (which includes collateral for securities on loan) to broker dealers, banks, or other institutions. The Fund maintains collateral equal to at least 102% of the fair value of the securities loaned. The cash collateral received by the Fund is invested in this money market fund. See Notes to Financial Statements, Footnote 1 – General Information and Significant Accounting Policies, Securities Lending for more information. |
| | ADR | | American Depositary Receipt. |
See accompanying notes to financial statements.
Portfolio of Investments (Unaudited)
Nuveen Large Cap Value Fund
April 30, 2012
| | | | | | | | | | | | | | |
| Shares | | | Description (1) | | | | | | | | Value | |
| | | | | | | | | | | | | | |
| | | | COMMON STOCKS – 99.5% | | | | | | | | | | |
| | | | | |
| | | | Consumer Discretionary – 10.5% | | | | | | | | | | |
| | | | | |
| | 61,877 | | | Carnival Corporation, ADR | | | | | | | | $ | 2,010,384 | |
| | | | | |
| | 89,595 | | | CBS Corporation, Class B | | | | | | | | | 2,987,993 | |
| | | | | |
| | 107,775 | | | Comcast Corporation, Class A, (3) | | | | | | | | | 3,268,816 | |
| | | | | |
| | 42,897 | | | Hasbro, Inc. | | | | | | | | | 1,576,036 | |
| | | | | |
| | 148,530 | | | Interpublic Group Companies, Inc., (3) | | | | | | | | | 1,754,139 | |
| | | | | |
| | 70,859 | | | Macy’s, Inc., (3) | | | | | | | | | 2,906,636 | |
| | | | | |
| | 97,592 | | | Staples, Inc., (3) | | | | | | | | | 1,502,917 | |
| | | | Total Consumer Discretionary | | | | | | | | | 16,006,921 | |
| | | | Consumer Staples – 7.4% | | | | | | | | | | |
| | | | | |
| | 22,054 | | | Coca-Cola Company | | | | | | | | | 1,683,161 | |
| | | | | |
| | 39,893 | | | Corn Products International, Inc. | | | | | | | | | 2,276,295 | |
| | | | | |
| | 66,067 | | | CVS Caremark Corporation | | | | | | | | | 2,947,910 | |
| | | | | |
| | 129,782 | | | Dean Foods Company, (2) | | | | | | | | | 1,593,723 | |
| | | | | |
| | 30,609 | | | Philip Morris International | | | | | | | | | 2,739,812 | |
| | | | Total Consumer Staples | | | | | | | | | 11,240,901 | |
| | | | Energy – 13.4% | | | | | | | | | | |
| | | | | |
| | 27,211 | | | Anadarko Petroleum Corporation | | | | | | | | | 1,992,117 | |
| | | | | |
| | 21,600 | | | Chevron Corporation, (3) | | | | | | | | | 2,301,696 | |
| | | | | |
| | 20,674 | | | Devon Energy Corporation | | | | | | | | | 1,444,079 | |
| | | | | |
| | 40,977 | | | Ensco PLC | | | | | | | | | 2,239,393 | |
| | | | | |
| | 66,344 | | | Marathon Oil Corporation | | | | | | | | | 1,946,533 | |
| | | | | |
| | 34,440 | | | National-Oilwell Varco Inc. | | | | | | | | | 2,609,174 | |
| | | | | |
| | 16,055 | | | Occidental Petroleum Corporation | | | | | | | | | 1,464,537 | |
| | | | | |
| | 27,574 | | | Pioneer Natural Resources Company, (3) | | | | | | | | | 3,193,621 | |
| | | | | |
| | 93,785 | | | Williams Companies, Inc. | | | | | | | | | 3,191,504 | |
| | | | Total Energy | | | | | | | | | 20,382,654 | |
| | | | Financials – 25.8% | | | | | | | | | | |
| | | | | |
| | 42,657 | | | Ace Limited | | | | | | | | | 3,240,652 | |
| | | | | |
| | 49,675 | | | Ameriprise Financial, Inc. | | | | | | | | | 2,692,882 | |
| | | | | |
| | 73,503 | | | Citigroup Inc. | | | | | | | | | 2,428,539 | |
| | | | | |
| | 83,375 | | | Fifth Third Bancorp. | | | | | | | | | 1,186,426 | |
| | | | | |
| | 27,829 | | | Goldman Sachs Group, Inc. | | | | | | | | | 3,204,509 | |
| | | | | |
| | 153,272 | | | JP Morgan Chase & Co. | | | | | | | | | 6,587,631 | |
| | | | | |
| | 137,731 | | | KeyCorp. | | | | | | | | | 1,107,357 | |
| | | | | |
| | 70,856 | | | Lincoln National Corporation, (3) | | | | | | | | | 1,755,103 | |
| | | | | |
| | 65,886 | | | Marsh & McLennan Companies, Inc. | | | | | | | | | 2,203,887 | |
| | | | | |
| | 43,895 | | | PNC Financial Services Group, Inc. | | | | | | | | | 2,911,116 | |
| | | | | |
| | 52,213 | | | Prudential Financial, Inc. | | | | | | | | | 3,160,975 | |
| | | | | |
| | 54,211 | | | State Street Corporation | | | | | | | | | 2,505,632 | |
| | | | | |
| | 52,593 | | | SunTrust Banks, Inc. | | | | | | | | | 1,276,958 | |
| | | | | |
| | 149,265 | | | Wells Fargo & Company | | | | | | | | | 4,989,929 | |
| | | | Total Financials | | | | | | | | | 39,251,596 | |
| | | | Health Care – 12.8% | | | | | | | | | | |
| | | | | |
| | 40,842 | | | Agilent Technologies, Inc., (2), (3) | | | | | | | | | 1,722,716 | |
| | | | | |
| | 54,984 | | | Covidien PLC | | | | | | | | | 3,036,766 | |
Portfolio of Investments (Unaudited)
Nuveen Large Cap Value Fund (continued)
April 30, 2012
| | | | | | | | | | | | | | |
| Shares | | | Description (1) | | | | | | | | Value | |
| | | | | | | | | | | | | | |
| | | | Health Care (continued) | | | | | | | | | | |
| | | | | |
| | 17,246 | | | Humana Inc. | | | | | | | | $ | 1,391,407 | |
| | | | | |
| | 31,657 | | | McKesson HBOC Inc. | | | | | | | | | 2,893,766 | |
| | | | | |
| | 47,220 | | | Merck & Company Inc. | | | | | | | | | 1,852,913 | |
| | | | | |
| | 268,134 | | | Pfizer Inc. | | | | | | | | | 6,148,313 | |
| | | | | |
| | 44,587 | | | UnitedHealth Group Incorporated | | | | | | | | | 2,503,560 | |
| | | | Total Health Care | | | | | | | | | 19,549,441 | |
| | | | Industrials – 7.3% | | | | | | | | | | |
| | | | | |
| | 15,540 | | | Boeing Company | | | | | | | | | 1,193,472 | |
| | | | | |
| | 48,036 | | | Emerson Electric Company, (3) | | | | | | | | | 2,523,811 | |
| | | | | |
| | 132,254 | | | General Electric Company, (3) | | | | | | | | | 2,589,533 | |
| | | | | |
| | 65,193 | | | Ingersoll Rand Company Limited, Class A | | | | | | | | | 2,772,006 | |
| | | | | |
| | 24,528 | | | Republic Services, Inc. | | | | | | | | | 671,331 | |
| | | | | |
| | 23,224 | | | Tyco International Ltd. | | | | | | | | | 1,303,563 | |
| | | | Total Industrials | | | | | | | | | 11,053,716 | |
| | | | Information Technology – 8.6% | | | | | | | | | | |
| | | | | |
| | 116,842 | | | Intel Corporation | | | | | | | | | 3,318,313 | |
| | | | | |
| | 64,073 | | | Maxim Integrated Products, Inc. | | | | | | | | | 1,895,279 | |
| | | | | |
| | 66,761 | | | Molex Inc. | | | | | | | | | 1,528,827 | |
| | | | | |
| | 90,870 | | | Oracle Corporation | | | | | | | | | 2,670,669 | |
| | | | | |
| | 30,341 | | | QUALCOMM, Inc. | | | | | | | | | 1,936,969 | |
| | | | | |
| | 63,723 | | | Seagate Technology | | | | | | | | | 1,960,119 | |
| | | | Total Information Technology | | | | | | | | | 13,310,176 | |
| | | | Materials – 3.7% | | | | | | | | | | |
| | | | | |
| | 49,557 | | | Dow Chemical Company, (3) | | | | | | | | | 1,678,991 | |
| | | | | |
| | 49,910 | | | Potash Corporation of Saskatchewan, (3) | | | | | | | | | 2,120,177 | |
| | | | | |
| | 29,360 | | | Rock-Tenn Company | | | | | | | | | 1,830,009 | |
| | | | Total Materials | | | | | | | | | 5,629,177 | |
| | | | Telecommunication Services – 4.2% | | | | | | | | | | |
| | | | | |
| | 80,181 | | | CenturyLink Inc., (3) | | | | | | | | | 3,091,779 | |
| | | | | |
| | 80,320 | | | Verizon Communications Inc., (3) | | | | | | | | | 3,243,322 | |
| | | | Total Telecommunication Services | | | | | | | | | 6,335,101 | |
| | | | Utilities – 5.8% | | | | | | | | | | |
| | | | | |
| | 82,383 | | | American Water Works Company | | | | | | | | | 2,820,794 | |
| | | | | |
| | 86,845 | | | CMS Energy Corporation, (3) | | | | | | | | | 1,996,567 | |
| | | | | |
| | 16,500 | | | ONEOK, Inc. | | | | | | | | | 1,417,185 | |
| | | | | |
| | 54,357 | | | Pinnacle West Capital Corporation | | | | | | | | | 2,628,163 | |
| | | | Total Utilities | | | | | | | | | 8,862,709 | |
| | | | Total Common Stocks (cost $141,887,189) | | | | | | | | | 151,622,392 | |
| | | | | |
| Shares | | | Description (1) | | | | | | | | Value | |
| | | | INVESTMENT PURCHASED WITH COLLATERAL FROM SECURITIES LENDING | | | | | | | | | | |
| | | | | |
| | | | Money Market Funds – 22.2% | | | | | | | | | | |
| | | | | |
| | 33,810,534 | | | Mount Vernon Securities Lending Prime Portfolio, Class Z, 0.276%, (4), (5) | | | | | | | | $ | 33,810,534 | |
| | | | Total Investments Purchased with Collateral from Securities Lending (cost $33,810,534) | | | | | | | | | 33,810,534 | |
| | | | | | | | | | | | | | |
| Shares | | | Description (1) | | | | | | | | Value | |
| | | | | | | | | | | | | | |
| | | | SHORT-TERM INVESTMENTS – 0.6% | | | | | | | | | | |
| | | | | |
| | 873,511 | | | First American Treasury Obligations Fund, Class Z, 0.000%, (4) | | | | | | | | $ | 873,511 | |
| | | | Total Short-Term Investments (cost $873,511) | | | | | | | | | 873,511 | |
| | | | Total Investments (cost $176,571,234) – 122.3% | | | | | | | | | 186,306,437 | |
| | | | Other Assets Less Liabilities – (22.3)% | | | | | | | | | (34,000,434) | |
| | | | Net Assets – 100% | | | | | | | | $ | 152,306,003 | |
| | | | For Fund portfolio compliance purposes, the Fund’s industry classifications refer to any one or more of the industry sub-classifications used by one or more widely recognized market indexes or ratings group indexes, and/or as defined by Fund management. This definition may not apply for purposes of this report, which may combine industry sub-classifications into sectors for reporting ease. |
| | (1) | | All percentages shown in the Portfolio of Investments are based on net assets. |
| | (2) | | Non-income producing; issuer has not declared a dividend within the past twelve months. |
| | (3) | | Investment, or a portion of investment, is out on loan for securities lending. |
| | (4) | | The rate shown is the annualized seven-day effective yield as of April 30, 2012. |
| | (5) | | The Fund may loan securities representing up to one third of the fair value of its total assets (which includes collateral for securities on loan) to broker dealers, banks, or other institutions. The Fund maintains collateral equal to at least 102% of the fair value of the securities loaned. The cash collateral received by the Fund is invested in this money market fund. See Notes to Financial Statements, Footnote 1 – General Information and Significant Accounting Policies, Securities Lending for more information. |
| | ADR | | American Depositary Receipt. |
See accompanying notes to financial statements.
Portfolio of Investments (Unaudited)
Nuveen Mid Cap Value Fund
April 30, 2012
| | | | | | | | | | | | | | |
| Shares | | | Description (1) | | | | | | | | Value | |
| | | | | | | | | | | | | | |
| | | | COMMON STOCKS – 98.7% | | | | | | | | | | |
| | | | | |
| | | | Consumer Discretionary – 15.4% | | | | | | | | | | |
| | | | | |
| | 82,224 | | | Brunswick Corporation, (3) | | | | | | | | $ | 2,161,669 | |
| | | | | |
| | 126,181 | | | Cinemark Holdings Inc., (3) | | | | | | | | | 2,897,116 | |
| | | | | |
| | 162,628 | | | D.R. Horton, Inc., (3) | | | | | | | | | 2,658,968 | |
| | | | | |
| | 104,776 | | | Dana Holding Corporation, (2), (3) | | | | | | | | | 1,531,825 | |
| | | | | |
| | 105,185 | | | Foot Locker, Inc. | | | | | | | | | 3,217,609 | |
| | | | | |
| | 231,883 | | | Interpublic Group Companies, Inc., (3) | | | | | | | | | 2,738,538 | |
| | | | | |
| | 70,531 | | | Jarden Corporation | | | | | | | | | 2,957,365 | |
| | | | | |
| | 97,240 | | �� | Macy’s, Inc., (3) | | | | | | | | | 3,988,785 | |
| | | | | |
| | 86,334 | | | Mattel, Inc. | | | | | | | | | 2,900,822 | |
| | | | | |
| | 286,332 | | | Staples, Inc., (3) | | | | | | | | | 4,409,513 | |
| | | | | |
| | 29,769 | | | Whirlpool Corporation | | | | | | | | | 1,905,811 | |
| | | | Total Consumer Discretionary | | | | | | | | | 31,368,021 | |
| | | | Consumer Staples – 2.9% | | | | | | | | | | |
| | | | | |
| | 99,764 | | | Constellation Brands, Inc., Class A, (2), (3) | | | | | | | | | 2,154,902 | |
| | | | | |
| | 26,839 | | | Lorillard Inc. | | | | | | | | | 3,631,048 | |
| | | | Total Consumer Staples | | | | | | | | | 5,785,950 | |
| | | | Energy – 8.1% | | | | | | | | | | |
| | | | | |
| | 21,008 | | | Concho Resources Inc., (2) | | | | | | | | | 2,251,637 | |
| | | | | |
| | 50,772 | | | Ensco PLC | | | | | | | | | 2,774,690 | |
| | | | | |
| | 21,317 | | | Noble Energy, Inc. | | | | | | | | | 2,117,204 | |
| | | | | |
| | 41,193 | | | Oil States International Inc., (2), (3) | | | | | | | | | 3,278,139 | |
| | | | | |
| | 26,365 | | | Pioneer Natural Resources Company, (3) | | | | | | | | | 3,053,594 | |
| | | | | |
| | 87,251 | | | Williams Companies, Inc. | | | | | | | | | 2,969,152 | |
| | | | Total Energy | | | | | | | | | 16,444,416 | |
| | | | Financials – 26.3% | | | | | | | | | | |
| | | | | |
| | 64,707 | | | Ameriprise Financial, Inc. | | | | | | | | | 3,507,766 | |
| | | | | |
| | 66,444 | | | Comerica Incorporated, (3) | | | | | | | | | 2,127,537 | |
| | | | | |
| | 143,409 | | | Developers Diversified Realty Corporation, (3) | | | | | | | | | 2,122,453 | |
| | | | | |
| | 63,726 | | | Discover Financial Services | | | | | | | | | 2,160,311 | |
| | | | | |
| | 97,813 | | | East West Bancorp Inc., (3) | | | | | | | | | 2,227,202 | |
| | | | | |
| | 268,565 | | | Fifth Third Bancorp. | | | | | | | | | 3,821,680 | |
| | | | | |
| | 166,999 | | | Host Hotels & Resorts Inc., (3) | | | | | | | | | 2,778,863 | |
| | | | | |
| | 182,970 | | | Invesco LTD | | | | | | | | | 4,544,975 | |
| | | | | |
| | 389,425 | | | KeyCorp. | | | | | | | | | 3,130,977 | |
| | | | | |
| | 108,415 | | | Kimco Realty Corporation, (3) | | | | | | | | | 2,104,335 | |
| | | | | |
| | 135,566 | | | Lincoln National Corporation | | | | | | | | | 3,357,970 | |
| | | | | |
| | 61,556 | | | Mack-Cali Realty Corporation | | | | | | | | | 1,767,888 | |
| | | | | |
| | 103,626 | | | Marsh & McLennan Companies, Inc. | | | | | | | | | 3,466,290 | |
| | | | | |
| | 25,741 | | | SL Green Realty Corporation, (3) | | | | | | | | | 2,122,088 | |
| | | | | |
| | 263,813 | | | SLM Corporation | | | | | | | | | 3,912,347 | |
| | | | | |
| | 117,774 | | | SunTrust Banks, Inc. | | | | | | | | | 2,859,553 | |
| | | | | |
| | 114,374 | | | Unum Group | | | | | | | | | 2,715,239 | |
| | | | | |
| | 43,969 | | | Ventas Inc., (3) | | | | | | | | | 2,584,938 | |
| | | | | |
| | 94,745 | | | Webster Financial Corporation, (3) | | | | | | | | | 2,153,554 | |
| | | | Total Financials | | | | | | | | | 53,465,966 | |
| | | | | | | | | | | | | | |
| Shares | | | Description (1) | | | | | | | | Value | |
| | | | | | | | | | | | | | |
| | | | Health Care – 9.5% | | | | | | | | | | |
| | | | | |
| | 54,999 | | | Aetna Inc. | | | | | | | | $ | 2,422,156 | |
| | | | | |
| | 62,580 | | | Agilent Technologies, Inc., (2), (3) | | | | | | | | | 2,639,624 | |
| | | | | |
| | 72,784 | | | AmerisourceBergen Corporation, (3) | | | | | | | | | 2,708,293 | |
| | | | | |
| | 119,285 | | | CareFusion Corporation, (2) | | | | | | | | | 3,090,674 | |
| | | | | |
| | 76,720 | | | Endo Pharmaceuticals Holdings Inc., (2) | | | | | | | | | 2,695,941 | |
| | | | | |
| | 48,375 | | | Humana Inc. | | | | | | | | | 3,902,895 | |
| | | | | |
| | 74,456 | | | Impax Laboratories Inc., (2), (3) | | | | | | | | | 1,833,851 | |
| | | | Total Health Care | | | | | | | | | 19,293,434 | |
| | | | Industrials – 9.8% | | | | | | | | | | |
| | | | | |
| | 58,416 | | | Chicago Bridge & Iron Company N.V. | | | | | | | | | 2,594,839 | |
| | | | | |
| | 74,991 | | | Crane Company | | | | | | | | | 3,309,353 | |
| | | | | |
| | 51,695 | | | Dover Corporation | | | | | | | | | 3,239,209 | |
| | | | | |
| | 47,694 | | | Fluor Corporation | | | | | | | | | 2,754,329 | |
| | | | | |
| | 81,354 | | | Ingersoll Rand Company Limited, Class A | | | | | | | | | 3,459,172 | |
| | | | | |
| | 89,925 | | | Oshkosh Truck Corporation | | | | | | | | | 2,052,988 | |
| | | | | |
| | 104,227 | | | Spirit AeroSystems Holdings Inc. | | | | | | | | | 2,605,675 | |
| | | | Total Industrials | | | | | | | | | 20,015,565 | |
| | | | Information Techology – 11.7% | | | | | | | | | | |
| | | | | |
| | 53,916 | | | Arrow Electronics, Inc., (2), (3) | | | | | | | | | 2,267,168 | |
| | | | | |
| | 59,665 | | | Autodesk, Inc., (2) | | | | | | | | | 2,349,011 | |
| | | | | |
| | 82,690 | | | Fidelity National Information Services, (3) | | | | | | | | | 2,784,172 | |
| | | | | |
| | 103,104 | | | International Rectifier Corporation, (2), (3) | | | | | | | | | 2,250,760 | |
| | | | | |
| | 89,083 | | | Molex Inc., (3) | | | | | | | | | 2,457,800 | |
| | | | | |
| | 54,482 | | | Plantronics Inc. | | | | | | | | | 2,087,750 | |
| | | | | |
| | 207,290 | | | Polycom Inc., (2), (3) | | | | | | | | | 2,750,738 | |
| | | | | |
| | 166,358 | | | Teradyne Inc., (2), (3) | | | | | | | | | 2,863,021 | |
| | | | | |
| | 42,132 | | | VeriFone Holdings Inc., (2), (3) | | | | | | | | | 2,007,168 | |
| | | | | |
| | 52,380 | | | Western Digital Corporation, (2) | | | | | | | | | 2,032,868 | |
| | | | Total Information Technology | | | | | | | | | 23,850,456 | |
| | | | Materials – 6.4% | | | | | | | | | | |
| | | | | |
| | 14,076 | | | CF Industries Holdings, Inc. | | | | | | | | | 2,717,513 | |
| | | | | |
| | 43,898 | | | Cytec Industries, Inc. | | | | | | | | | 2,790,596 | |
| | | | | |
| | 103,633 | | | International Paper Company | | | | | | | | | 3,452,015 | |
| | | | | |
| | 71,573 | | | Packaging Corp. of America | | | | | | | | | 2,089,216 | |
| | | | | |
| | 32,084 | | | Rock-Tenn Company | | | | | | | | | 1,999,796 | |
| | | | Total Materials | | | | | | | | | 13,049,136 | |
| | | | Utilities – 8.6% | | | | | | | | | | |
| | | | | |
| | 123,578 | | | American Water Works Company | | | | | | | | | 4,231,311 | |
| | | | | |
| | 112,570 | | | Calpine Corporation, (3) | | | | | | | | | 2,110,688 | |
| | | | | |
| | 174,750 | | | CMS Energy Corporation | | | | | | | | | 4,017,503 | |
| | | | | |
| | 74,999 | | | Edison International | | | | | | | | | 3,300,706 | |
| | | | | |
| | 229,438 | | | NV Energy Inc., (3) | | | | | | | | | 3,820,142 | |
| | | | Total Utilities | | | | | | | | | 17,480,350 | |
| | | | Total Common Stocks (cost $188,150,863) | | | | | | | | | 200,753,294 | |
Portfolio of Investments (Unaudited)
Nuveen Mid Cap Value Fund (continued)
April 30, 2012
| | | | | | | | | | | | | | |
| Shares | | | Description (1) | | | | | | | | Value | |
| | | | | | | | | | | | | | |
| | | | INVESTMENT PURCHASED WITH COLLATERAL FROM SECURITIES LENDING | | | | | | | | | | |
| | | | | |
| | | | Money Market Funds – 29.3% | | | | | | | | | | |
| | | | | |
| | 59,694,980 | | | Mount Vernon Securities Lending Prime Portfolio, Class Z, 0.276%, (4), (5) | | | | | | | | $ | 59,694,980 | |
| | | | Total Investments Purchased with Collateral from Securities Lending (cost $59,694,980) | | | | | | | | | 59,694,980 | |
| | | | | |
| Shares | | | Description (1) | | | | | | | | Value | |
| | | | SHORT-TERM INVESTMENTS – 0.1% | | | | | | | | | | |
| | | | | |
| | 111,055 | | | First American Treasury Obligations Fund, Class Z, 0.000%, (4) | | | | | | | | $ | 111,055 | |
| | | | Total Short-Term Investments (cost $111,055) | | | | | | | | | 111,055 | |
| | | | Total Investments (cost $247,956,898) – 128.1% | | | | | | | | | 260,559,329 | |
| | | | Other Assets Less Liabilities – (28.1)% | | | | | | | | | (57,113,462) | |
| | | | Net Assets – 100% | | | | | | | | $ | 203,445,867 | |
| | | | For Fund portfolio compliance purposes, the Fund’s industry classifications refer to any one or more of the industry sub-classifications used by one or more widely recognized market indexes or ratings group indexes, and/or as defined by Fund management. This definition may not apply for purposes of this report, which may combine industry sub-classifications into sectors for reporting ease. |
| | (1) | | All percentages shown in the Portfolio of Investments are based on net assets. |
| | (2) | | Non-income producing; issuer has not declared a dividend within the past twelve months. |
| | (3) | | Investment, or a portion of investment, is out on loan for securities lending. |
| | (4) | | The rate shown is the annualized seven-day effective yield as of April 30, 2012. |
| | (5) | | The Fund may loan securities representing up to one third of the fair value of its total assets (which includes collateral for securities on loan) to broker dealers, banks, or other institutions. The Fund maintains collateral equal to at least 102% of the fair value of the securities loaned. The cash collateral received by the Fund is invested in this money market fund. See Notes to Financial Statements, Footnote 1 – General Information and Significant Accounting Policies, Securities Lending for more information. |
See accompanying notes to financial statements.
Portfolio of Investments (Unaudited)
Nuveen Small Cap Value Fund
April 30, 2012
| | | | | | | | | | | | | | |
| Shares | | | Description (1) | | | | | | | | Value | |
| | | | | | | | | | | | | | |
| | | | COMMON STOCKS – 99.6% | | | | | | | | | | |
| | | | | |
| | | | Consumer Discretionary – 13.6% | | | | | | | | | | |
| | | | | |
| | 42,198 | | | Ascena Retail Group Inc., (2), (3) | | | | | | | | $ | 864,215 | |
| | | | | |
| | 127,284 | | | Belo Corp. | | | | | | | | | 857,894 | |
| | | | | |
| | 41,627 | | | Cinemark Holdings Inc., (3) | | | | | | | | | 955,756 | |
| | | | | |
| | 60,411 | | | Cooper Tire & Rubber | | | | | | | | | 903,144 | |
| | | | | |
| | 61,684 | | | Dana Holding Corporation, (2), (3) | | | | | | | | | 901,820 | |
| | | | | |
| | 21,824 | | | Dominos Pizza Inc., (2) | | | | | | | | | 825,165 | |
| | | | | |
| | 30,186 | | | Group 1 Automotive Inc., (3) | | | | | | | | | 1,747,166 | |
| | | | | |
| | 52,910 | | | La Z Boy Inc. | | | | | | | | | 797,354 | |
| | | | | |
| | 21,372 | | | Mens Wearhouse Inc., (3) | | | | | | | | | 791,619 | |
| | | | | |
| | 27,989 | | | P.F. Changs China Bistro, Inc. | | | | | | | | | 1,110,883 | |
| | | | | |
| | 50,809 | | | Sally Beauty Holdings Inc., (2) | | | | | | | | | 1,351,519 | |
| | | | | |
| | 54,188 | | | West Marine, Inc., (3) | | | | | | | | | 634,541 | |
| | | | Total Consumer Discretionary | | | | | | | | | 11,741,076 | |
| | | | Consumer Staples – 2.1% | | | | | | | | | | |
| | | | | |
| | 44,265 | | | Inter Parfums, Inc. | | | | | | | | | 697,174 | |
| | | | | |
| | 59,880 | | | Spartan Stores, Inc. | | | | | | | | | 1,091,612 | |
| | | | Total Consumer Staples | | | | | | | | | 1,788,786 | |
| | | | Energy – 6.1% | | | | | | | | | | |
| | | | | |
| | 39,500 | | | Basic Energy Services, Inc., (2) | | | | | | | | | 568,800 | |
| | | | | |
| | 33,000 | | | Delek US Holdings Inc., (3) | | | | | | | | | 537,900 | |
| | | | | |
| | 46,166 | | | Matrix Service Company | | | | | | | | | 630,166 | |
| | | | | |
| | 49,120 | | | Midstates Petroleum Co Inc. | | | | | | | | | 801,638 | |
| | | | | |
| | 79,090 | | | Newpark Resources Inc., (3) | | | | | | | | | 503,012 | |
| | | | | |
| | 41,193 | | | Stone Energy Corporation, (2), (3) | | | | | | | | | 1,155,464 | |
| | | | | |
| | 37,308 | | | Swift Energy Company, (3) | | | | | | | | | 1,128,567 | |
| | | | Total Energy | | | | | | | | | 5,325,547 | |
| | | | Financials – 29.0% | | | | | | | | | | |
| | | | | |
| | 8,429 | | | Affiliated Managers Group Inc., (2) | | | | | | | | | 957,703 | |
| | | | | |
| | 75,518 | | | Associated Estates Realty Corp. | | | | | | | | | 1,278,520 | |
| | | | | |
| | 19,998 | | | Bank of the Ozarks, Inc., (3) | | | | | | | | | 617,938 | |
| | | | | |
| | 105,381 | | | Brandywine Realty Trust, (3) | | | | | | | | | 1,249,819 | |
| | | | | |
| | 188,957 | | | CNO Financial Group Inc., (2), (3) | | | | | | | | | 1,373,717 | |
| | | | | |
| | 45,938 | | | Community Bank System Inc., (3) | | | | | | | | | 1,291,777 | |
| | | | | |
| | 73,104 | | | CubeSmart | | | | | | | | | 918,186 | |
| | | | | |
| | 132,729 | | | DiamondRock Hospitality Company, (3) | | | | | | | | | 1,410,909 | |
| | | | | |
| | 59,014 | | | East West Bancorp Inc., (3) | | | | | | | | | 1,343,749 | |
| | | | | |
| | 26,612 | | | EZCORP, Inc., (3) | | | | | | | | | 712,935 | |
| | | | | |
| | 62,625 | | | FirstMerit Corporation, (3) | | | | | | | | | 1,052,100 | |
| | | | | |
| | 71,004 | | | Flushing Financial Corporation, (3) | | | | | | | | | 925,182 | |
| | | | | |
| | 60,596 | | | Heartland Financial USA, Inc. | | | | | | | | | 1,122,238 | |
| | | | | |
| | 63,086 | | | Horace Mann Educators Corporation | | | | | | | | | 1,107,159 | |
| | | | | |
| | 13,662 | | | IberiaBank Corporation, (3) | | | | | | | | | 697,718 | |
| | | | | |
| | 111,662 | | | JMP Group Inc. | | | | | | | | | 827,415 | |
| | | | | |
| | 31,508 | | | Knight Trading Group Inc., (3) | | | | | | | | | 414,015 | |
| | | | | |
| | 183,977 | | | MFA Mortgage Investments, Inc. | | | | | | | | | 1,357,750 | |
Portfolio of Investments (Unaudited)
Nuveen Small Cap Value Fund (continued)
April 30, 2012
| | | | | | | | | | | | | | |
| Shares | | | Description (1) | | | | | | | | Value | |
| | | | | | | | | | | | | | |
| | | | Financials (continued) | | | | | | | | | | |
| | | | | |
| | 162,344 | | | MGIC Investment Corporation, (2), (3) | | | | | | | | $ | 561,710 | |
| | | | | |
| | 77,598 | | | National Financial Partners Corp., (2), (3) | | | | | | | | | 1,144,571 | |
| | | | | |
| | 14,404 | | | SVB Financial Group, (2), (3) | | | | | | | | | 923,152 | |
| | | | | |
| | 39,184 | | | Texas Capital BancShares, Inc., (2), (3) | | | | | | | | | 1,477,629 | |
| | | | | |
| | 62,852 | | | Webster Financial Corporation, (3) | | | | | | | | | 1,428,626 | |
| | | | | |
| | 23,021 | | | WSFS Financial Corporation | | | | | | | | | 918,768 | |
| | | | Total Financials | | | | | | | | | 25,113,286 | |
| | | | Health Care – 5.8% | | | | | | | | | | |
| | | | | |
| | 10,411 | | | AmericGroup Corporation, (2), (3) | | | | | | | | | 642,983 | |
| | | | | |
| | 98,276 | | | Bioscrip, Inc., (2) | | | | | | | | | 728,225 | |
| | | | | |
| | 43,784 | | | Hanger Orthopedic Group Inc., (2) | | | | | | | | | 1,031,113 | |
| | | | | |
| | 17,374 | | | ICU Medical, Inc., (2), (3) | | | | | | | | | 911,961 | |
| | | | | |
| | 26,776 | | | Impax Laboratories Inc., (2), (3) | | | | | | | | | 659,493 | |
| | | | | |
| | 15,280 | | | Mednax Inc., (2), (3) | | | | | | | | | 1,073,267 | |
| | | | Total Health Care | | | | | | | | | 5,047,042 | |
| | | | Industrials – 16.4% | | | | | | | | | | |
| | | | | |
| | 32,230 | | | Actuant Corporation, (3) | | | | | | | | | 878,912 | |
| | | | | |
| | 68,176 | | | Altra Industrial Motion, Inc., (2), (3) | | | | | | | | | 1,246,257 | |
| | | | | |
| | 21,660 | | | Atlas Air Worldwide Holdings Inc., (2), (3) | | | | | | | | | 997,443 | |
| | | | | |
| | 41,991 | | | Emcor Group Inc. | | | | | | | | | 1,231,176 | |
| | | | | |
| | 56,320 | | | Ennis Inc., (3) | | | | | | | | | 887,603 | |
| | | | | |
| | 41,512 | | | G&K Services, Inc. | | | | | | | | | 1,364,084 | |
| | | | | |
| | 37,876 | | | General Cable Corporation, (3) | | | | | | | | | 1,115,069 | |
| | | | | |
| | 43,343 | | | GrafTech International Ltd. | | | | | | | | | 508,847 | |
| | | | | |
| | 59,024 | | | MasTec Inc., (2), (3) | | | | | | | | | 1,026,427 | |
| | | | | |
| | 12,232 | | | Regal-Beloit Corporation | | | | | | | | | 827,372 | |
| | | | | |
| | 25,000 | | | Tetra Tech, Inc., (2), (3) | | | | | | | | | 667,500 | |
| | | | | |
| | 40,000 | | | TriMas Corporation, (2) | | | | | | | | | 880,400 | |
| | | | | |
| | 32,787 | | | Triumph Group Inc., (3) | | | | | | | | | 2,059,679 | |
| | | | | |
| | 31,713 | | | TrueBlue Inc., (2), (3) | | | | | | | | | 547,366 | |
| | | | Total Industrials | | | | | | | | | 14,238,135 | |
| | | | Information Technology – 13.3% | | | | | | | | | | |
| | | | | |
| | 30,000 | | | ADTRAN, Inc., (3) | | | | | | | | | 915,600 | |
| | | | | |
| | 21,209 | | | CACI International Inc., (3) | | | | | | | | | 1,296,506 | |
| | | | | |
| | 60,000 | | | Cray, Inc., (3) | | | | | | | | | 669,000 | |
| | | | | |
| | 56,000 | | | Dice Holdings Inc. | | | | | | | | | 603,680 | |
| | | | | |
| | 50,645 | | | International Rectifier Corporation, (2), (3) | | | | | | | | | 1,105,580 | |
| | | | | |
| | 45,926 | | | MKS Instruments Inc., (3) | | | | | | | | | 1,269,854 | |
| | | | | |
| | 105,938 | | | Perficient, Inc., (2), (3) | | | | | | | | | 1,272,315 | |
| | | | | |
| | 28,240 | | | Plantronics Inc., (3) | | | | | | | | | 1,082,157 | |
| | | | | |
| | 60,975 | | | PMC-Sierra, Inc., (2), (3) | | | | | | | | | 431,093 | |
| | | | | |
| | 47,407 | | | Polycom Inc., (2), (3) | | | | | | | | | 629,091 | |
| | | | | |
| | 18,872 | | | Rogers Corporation | | | | | | | | | 722,609 | |
| | | | | |
| | 22,886 | | | SYNNEX Corporation, (2) | | | | | | | | | 871,728 | |
| | | | | |
| | 64,862 | | | TTM Technologies, Inc., (2), (3) | | | | | | | | | 670,024 | |
| | | | Total Information Technology | | | | | | | | | 11,539,237 | |
| | | | | | | | | | | | | | |
| Shares | | | Description (1) | | | | | | | | Value | |
| | | | | | | | | | | | | | |
| | | | Materials – 6.0% | | | | | | | | | | |
| | | | | |
| | 31,067 | | | Buckeye Technologies Inc., (3) | | | | | | | | $ | 1,006,881 | |
| | | | | |
| | 28,300 | | | Kraton Performance Polymers Inc., (2), (3) | | | | | | | | | 735,800 | |
| | | | | |
| | 17,222 | | | Minerals Technologies Inc., (3) | | | | | | | | | 1,155,596 | |
| | | | | |
| | 39,639 | | | Packaging Corp. of America | | | | | | | | | 1,157,062 | |
| | | | | |
| | 9,454 | | | Rockwood Holdings Inc. | | | | | | | | | 523,184 | |
| | | | | |
| | 16,446 | | | Schnitzer Steel Industries, Inc., (3) | | | | | | | | | 655,702 | |
| | | | Total Materials | | | | | | | | | 5,234,225 | |
| | | | Telecommunication Services – 1.3% | | | | | | | | | | |
| | | | | |
| | 55,283 | | | NTELOS Holdings Corp | | | | | | | | | 1,117,826 | |
| | | | Utilities – 6.0% | | | | | | | | | | |
| | | | | |
| | 52,243 | | | Atmos Energy Corporation | | | | | | | | | 1,702,077 | |
| | | | | |
| | 46,515 | | | El Paso Electric Company, (3) | | | | | | | | | 1,425,220 | |
| | | | | |
| | 23,133 | | | Southwest Gas Corporation, (3) | | | | | | | | | 972,052 | |
| | | | | |
| | 31,109 | | | UIL Holdings Corporation, (3) | | | | | | | | | 1,069,219 | |
| | | | Total Utilities | | | | | | | | | 5,168,568 | |
| | | | Total Common Stocks (cost $75,955,378) | | | | | | | | | 86,313,728 | |
| | | | | |
| Shares | | | Description (1) | | | | | | | | Value | |
| | | | INVESTMENT PURCHASED WITH COLLATERAL FROM SECURITIES LENDING | | | | | | | | | | |
| | | | | |
| | | | Money Market Funds – 48.8% | | | | | | | | | | |
| | | | | |
| | 42,370,035 | | | Mount Vernon Securities Lending Prime Portfolio, Class Z, 0.276%, (4), (5) | | | | | | | | $ | 42,370,035 | |
| | | | Total Investments Purchased with Collateral from Securities Lending (cost $42,370,035) | | | | | | | | | 42,370,035 | |
| | | | | |
| Shares | | | Description (1) | | | | | | | | Value | |
| | | | SHORT-TERM INVESTMENTS – 0.7% | | | | | | | | | | |
| | | | | |
| | 627,525 | | | First American Treasury Obligations Fund, Class Z, 0.000%, (4) | | | | | | | | $ | 627,525 | |
| | | | Total Short-Term Investments (cost $627,525) | | | | | | | | | 627,525 | |
| | | | Total Investments (cost $118,952,938) – 149.1% | | | | | | | | | 129,311,288 | |
| | | | Other Assets Less Liabilities – (49.1)% | | | | | | | | | (42,563,396) | |
| | | | Net Assets – 100% | | | | | | | | $ | 86,747,892 | |
| | | | For Fund portfolio compliance purposes, the Fund’s industry classifications refer to any one or more of the industry sub-classifications used by one or more widely recognized market indexes or ratings group indexes, and/or as defined by Fund management. This definition may not apply for purposes of this report, which may combine industry sub-classifications into sectors for reporting ease. |
| | (1) | | All percentages shown in the Portfolio of Investments are based on net assets. |
| | (2) | | Non-income producing; issuer has not declared a dividend within the past twelve months. |
| | (3) | | Investment, or a portion of investment, is out on loan for securities lending. |
| | (4) | | The rate shown is the annualized seven-day effective yield as of April 30, 2012. |
| | (5) | | The Fund may loan securities representing up to one third of the fair value of its total assets (which includes collateral for securities on loan) to broker dealers, banks, or other institutions. The Fund maintains collateral equal to at least 102% of the fair value of the securities loaned. The cash collateral received by the Fund is invested in this money market fund. See Notes to Financial Statements, Footnote 1 – General Information and Significant Accounting Policies, Securities Lending for more information. |
See accompanying notes to financial statements.
Statement of Assets & Liabilities (Unaudited)
April 30, 2012
| | | | | | | | | | | | | | | | |
| | | Dividend
Value | | | Large Cap
Value | | | Mid Cap
Value | | | Small Cap
Value | |
Assets | | | | | | | | | | | | | | | | |
Investments, at value (cost $895,657,520, $142,760,700, $188,261,918 and $76,582,903, respectively) | | $ | 1,218,784,460 | | | $ | 152,495,903 | | | $ | 200,864,349 | | | $ | 86,941,253 | |
Investments purchased with collateral from securities lending
(at cost, which approximates value) | | | 156,050,266 | | | | 33,810,534 | | | | 59,694,980 | | | | 42,370,035 | |
Receivables: | | | | | | | | | | | | | | | | |
Dividends | | | 1,510,550 | | | | 208,936 | | | | 73,094 | | | | 22,838 | |
Due from broker | | | 21,317 | | | | 4,659 | | | | 6,823 | | | | 5,309 | |
Investments sold | | | 7,770,411 | | | | 2,938,384 | | | | 3,880,097 | | | | — | |
Shares sold | | | 1,506,965 | | | | 5,290 | | | | 52,900 | | | | 12,510 | |
Other assets | | | 10,408 | | | | 320 | | | | 2,550 | | | | 178 | |
Total assets | | | 1,385,654,377 | | | | 189,464,026 | | | | 264,574,793 | | | | 129,352,123 | |
Liabilities | | | | | | | | | | | | | | | | |
Payables: | | | | | | | | | | | | | | | | |
Collateral from securities lending program | | | 156,050,266 | | | | 33,810,534 | | | | 59,694,980 | | | | 42,370,035 | |
Investments purchased | | | 7,738,413 | | | | 2,919,209 | | | | 790,710 | | | | — | |
Shares redeemed | | | 3,009,389 | | | | 230,423 | | | | 361,742 | | | | 82,726 | |
Accrued expenses: | | | | | | | | | | | | | | | | |
Management fees | | | 759,887 | | | | 92,181 | | | | 113,201 | | | | 68,039 | |
12b-1 distribution and service fees | | | 70,588 | | | | 11,274 | | | | 22,668 | | | | 9,307 | |
Other | | | 417,374 | | | | 94,402 | | | | 145,625 | | | | 74,124 | |
Total liabilities | | | 168,045,917 | | | | 37,158,023 | | | | 61,128,926 | | | | 42,604,231 | |
Net assets | | $ | 1,217,608,460 | | | $ | 152,306,003 | | | $ | 203,445,867 | | | $ | 86,747,892 | |
Class A Shares | | | | | | | | | | | | | | | | |
Net assets | | $ | 210,162,755 | | | $ | 49,346,442 | | | $ | 42,200,631 | | | $ | 33,975,343 | |
Shares outstanding | | | 14,471,331 | | | | 3,045,019 | | | | 1,766,453 | | | | 2,664,996 | |
Net asset value per share | | $ | 14.52 | | | $ | 16.21 | | | $ | 23.89 | | | $ | 12.75 | |
Offering price per share (net asset value per share plus maximum sales charge of 5.75% of offering price) | | $ | 15.41 | | | $ | 17.20 | | | $ | 25.35 | | | $ | 13.53 | |
Class B Shares | | | | | | | | | | | | | | | | |
Net assets | | $ | 2,037,261 | | | | N/A | | | $ | 1,824,450 | | | | N/A | |
Shares outstanding | | | 141,629 | | | | N/A | | | | 81,096 | | | | N/A | |
Net asset value and offering price per share | | $ | 14.38 | | | | N/A | | | $ | 22.50 | | | | N/A | |
Class C Shares | | | | | | | | | | | | | | | | |
Net assets | | $ | 24,466,191 | | | $ | 1,228,687 | | | $ | 9,024,522 | | | $ | 1,631,942 | |
Shares outstanding | | | 1,702,864 | | | | 77,575 | | | | 392,165 | | | | 146,219 | |
Net asset value and offering price per share | | $ | 14.37 | | | $ | 15.84 | | | $ | 23.01 | | | $ | 11.16 | |
Class R3 Shares | | | | | | | | | | | | | | | | |
Net assets | | $ | 17,311,780 | | | $ | 485,666 | | | $ | 12,370,802 | | | $ | 2,493,668 | |
Shares outstanding | | | 1,194,228 | | | | 30,136 | | | | 520,349 | | | | 199,180 | |
Net asset value and offering price per share | | $ | 14.50 | | | $ | 16.12 | | | $ | 23.77 | | | $ | 12.52 | |
Class I Shares | | | | | | | | | | | | | | | | |
Net assets | | $ | 963,630,473 | | | $ | 101,245,208 | | | $ | 138,025,462 | | | $ | 48,646,939 | |
Shares outstanding | | | 65,844,971 | | | | 6,216,659 | | | | 5,745,167 | | | | 3,696,419 | |
Net asset value and offering price per share | | $ | 14.63 | | | $ | 16.29 | | | $ | 24.02 | | | $ | 13.16 | |
Net assets consist of: | | | | | | | | | | | | | | | | |
Capital paid-in | | $ | 866,397,424 | | | $ | 225,652,622 | | | $ | 245,511,159 | | | $ | 109,924,106 | |
Undistributed (Over-distribution of) net investment income | | | 83,734 | | | | 1,102,923 | | | | 707,149 | | | | 306,450 | |
Accumulated net realized gain (loss) | | | 28,000,362 | | | | (84,184,745 | ) | | | (55,374,872 | ) | | | (33,841,014 | ) |
Net unrealized appreciation (depreciation) | | | 323,126,940 | | | | 9,735,203 | | | | 12,602,431 | | | | 10,358,350 | |
Net assets | | $ | 1,217,608,460 | | | $ | 152,306,003 | | | $ | 203,445,867 | | | $ | 86,747,892 | |
Authorized shares | | | 2 billion | | | | 2 billion | | | | 2 billion | | | | 2 billion | |
Par value per share | | $ | 0.0001 | | | $ | 0.0001 | | | $ | 0.0001 | | | $ | 0.0001 | |
| N/A – | Small Cap Value does not offer Class B Shares. Class B Shares of Large Cap Value converted to Class A Shares at the close of business on February 15, 2012 and are no longer available for divided reinvestment or through an exchange from other Nuveen mutual funds. |
See accompanying notes to financial statements.
Statement of Operations (Unaudited)
Six Months Ended April 30, 2012
| | | | | | | | | | | | | | | | |
| | | Dividend Value | | | Large Cap
Value | | | Mid Cap
Value | | | Small Cap
Value | |
Investment Income | | | | | | | | | | | | | | | | |
Dividend and Interest income from unaffiliated investments (net of foreign tax withheld of $135,631, $21,015, $517 and $ –, respectively) | | $ | 18,761,021 | | | $ | 1,942,345 | | | $ | 1,923,548 | | | $ | 861,959 | |
Securities lending income | | | 148,708 | | | | 29,388 | | | | 45,979 | | | | 41,199 | |
Total investment income | | | 18,909,729 | | | | 1,971,733 | | | | 1,969,527 | | | | 903,158 | |
Expenses | | | | | | | | | | | | | | | | |
Management fees | | | 4,361,933 | | | | 569,195 | | | | 954,589 | | | | 394,564 | |
12b-1 service fees – Class A | | | 240,044 | | | | 61,605 | | | | 56,977 | | | | 41,182 | |
12b-1 distribution and service fees – Class B | | | 12,898 | | | | N/A | | | | 9,770 | | | | N/A | |
12b-1 distribution and service fees – Class C | | | 107,215 | | | | 5,516 | | | | 44,527 | | | | 7,677 | |
12b-1 distribution and service fees – Class R3 | | | 35,489 | | | | 1,679 | | | | 34,731 | | | | 6,152 | |
Shareholders’ servicing agent fees and expenses | | | 635,049 | | | | 153,116 | | | | 318,329 | | | | 162,009 | |
Custodian’s fees and expenses | | | 86,878 | | | | 18,771 | | | | 26,150 | | | | 12,976 | |
Directors’ fees and expenses | | | 16,443 | | | | 2,298 | | | | 3,115 | | | | 1,409 | |
Professional fees | | | 35,497 | | | | 357 | | | | 9,531 | | | | 3,651 | |
Shareholders’ reports – printing and mailing expenses | | | 53,048 | | | | 11,995 | | | | 14,171 | | | | 10,274 | |
Federal and state registration fees | | | 38,547 | | | | 28,704 | | | | 30,282 | | | | 27,311 | |
Other expenses | | | 17,685 | | | | 9,442 | | | | 12,767 | | | | 10,489 | |
Total expenses before expense reimbursement | | | 5,640,726 | | | | 862,678 | | | | 1,514,939 | | | | 677,694 | |
Expense reimbursement | | | — | | | | (2,178 | ) | | | (274,566 | ) | | | (91,943 | ) |
Net expenses | | | 5,640,726 | | | | 860,500 | | | | 1,240,373 | | | | 585,751 | |
Net investment income (loss) | | | 13,269,003 | | | | 1,111,233 | | | | 729,154 | | | | 317,407 | |
Realized and Unrealized Gain (Loss) | | | | | | | | | | | | | | | | |
Net realized gain (loss) from investments | | | 29,778,587 | | | | 6,503,135 | | | | 9,613,308 | | | | 6,745,063 | |
Change in net unrealized appreciation (depreciation) of investments | | | 95,429,312 | | | | 11,005,895 | | | | 10,130,285 | | | | 3,629,062 | |
Net realized and unrealized gain (loss) | | | 125,207,899 | | | | 17,509,030 | | | | 19,743,593 | | | | 10,374,125 | |
Net increase (decrease) in net assets from operations | | $ | 138,476,902 | | | $ | 18,620,263 | | | $ | 20,472,747 | | | $ | 10,691,532 | |
| N/A – | Small Cap Value does not offer Class B Shares. Class B Shares of Large Cap Value converted to Class A Shares at the close of business on February 15, 2012 and are no longer available for divided reinvestment or through an exchange from other Nuveen mutual funds. |
See accompanying notes to financial statements.
Statement of Changes in Net Assets (Unaudited)
| | | | | | | | | | | | | | | | |
| | | Dividend Value | | | Large Cap Value | |
| | | Six Months Ended
4/30/12 | | | Year Ended
10/31/11 | | | Six Months Ended
4/30/12 | | | Year Ended
10/31/11 | |
Operations | | | | | | | | | | | | | | | | |
Net investment income (loss) | | $ | 13,269,003 | | | $ | 22,403,547 | | | $ | 1,111,233 | | | $ | 1,694,307 | |
Net realized gain (loss) from: | | | | | | | | | | | | | | | | |
Investments | | | 29,778,587 | | | | 5,603,569 | | | | 6,503,135 | | | | 19,195,878 | |
Redemptions in-kind | | | — | | | | — | | | | — | | | | 15,436,123 | |
Change in net unrealized appreciation (depreciation) of investments | | | 95,429,312 | | | | 38,786,442 | | | | 11,005,895 | | | | (24,277,216 | ) |
Net increase (decrease) in net assets from operations | | | 138,476,902 | | | | 66,793,558 | | | | 18,620,263 | | | | 12,049,092 | |
Distributions to Shareholders | | | | | | | | | | | | | | | | |
From net investment income: | | | | | | | | | | | | | | | | |
Class A | | | (2,359,586 | ) | | | (3,311,206 | ) | | | (189,275 | ) | | | (696,738 | ) |
Class B | | | (22,980 | ) | | | (30,068 | ) | | | N/A | | | | (5,760 | ) |
Class C | | | (186,243 | ) | | | (155,136 | ) | | | — | | | | (5,506 | ) |
Class R3(1) | | | (158,565 | ) | | | (74,593 | ) | | | (1,206 | ) | | | (8,973 | ) |
Class I(1) | | | (12,449,183 | ) | | | (19,550,217 | ) | | | (686,230 | ) | | | (2,375,027 | ) |
Decrease in net assets from distributions to shareholders | | | (15,176,557 | ) | | | (23,121,220 | ) | | | (876,711 | ) | | | (3,092,004 | ) |
Fund Share Transactions | | | | | | | | | | | | | | | | |
Proceeds from sale of shares | | | 170,770,693 | | | | 441,406,794 | | | | 6,388,916 | | | | 8,440,042 | |
Proceeds from shares issued to shareholders due to reinvestment of distributions | | | 6,932,320 | | | | 9,484,764 | | | | 522,996 | | | | 1,788,847 | |
| | | 177,703,013 | | | | 450,891,558 | | | | 6,911,912 | | | | 10,228,889 | |
Cost of shares redeemed | | | (155,924,595 | ) | | | (249,150,489 | ) | | | (26,726,038 | ) | | | (74,896,322 | ) |
Cost of redemptions in-kind | | | — | | | | — | | | | — | | | | (132,685,046 | ) |
Net increase (decrease) in net assets from Fund share transactions | | | 21,778,418 | | | | 201,741,069 | | | | (19,814,126 | ) | | | (197,352,479 | ) |
Net increase (decrease) in net assets | | | 145,078,763 | | | | 245,413,407 | | | | (2,070,574 | ) | | | (188,395,391 | ) |
Net assets at the beginning of period | | | 1,072,529,697 | | | | 827,116,290 | | | | 154,376,577 | | | | 342,771,968 | |
Net assets at the end of period | | $ | 1,217,608,460 | | | $ | 1,072,529,697 | | | $ | 152,306,003 | | | $ | 154,376,577 | |
Undistributed (Over-distribution of) net investment income at the end of period | | $ | 83,734 | | | $ | 1,991,288 | | | $ | 1,102,923 | | | $ | 868,401 | |
| N/A – | Class B Shares of Large Cap Value converted to Class A Shares at the close of business on February 15, 2012 and are no longer available for dividend reinvestment or through an exchange from other Nuveen mutual funds. |
| (1) | Effective January 18, 2011, Class R Shares and Class Y Shares previously offered by FAF Advisors, Inc. were renamed Class R3 Shares and Class I Shares, respectively. |
See accompanying notes to financial statements.
| | | | | | | | | | | | | | | | |
| | | Mid Cap Value | | | Small Cap Value | |
| | | Six Months Ended
4/30/12 | | | Year Ended
10/31/11 | | | Six Months Ended
4/30/12 | | | Year Ended
10/31/11 | |
Operations | | | | | | | | | | | | | | | | |
Net investment income (loss) | | $ | 729,154 | | | $ | 1,667,039 | | | $ | 317,407 | | | $ | (290,831 | ) |
Net realized gain (loss) from: | | | | | | | | | | | | | | | | |
Investments | | | 9,613,308 | | | | 42,262,542 | | | | 6,745,063 | | | | 10,390,805 | |
Redemptions in-kind | | | — | | | | 51,352,202 | | | | — | | | | 27,495,098 | |
Change in net unrealized appreciation (depreciation) of investments | | | 10,130,285 | | | | (76,035,365 | ) | | | 3,629,062 | | | | (17,603,366 | ) |
Net increase (decrease) in net assets from operations | | | 20,472,747 | | | | 19,246,418 | | | | 10,691,532 | | | | 19,991,706 | |
Distributions to Shareholders | | | | | | | | | | | | | | | | |
From net investment income: | | | | | | | | | | | | | | | | |
Class A | | | (256,451 | ) | | | (804,678 | ) | | | — | | | | — | |
Class B | | | — | | | | (9,710 | ) | | | N/A | | | | N/A | |
Class C | | | — | | | | (46,605 | ) | | | — | | | | — | |
Class R3(1) | | | (47,224 | ) | | | (141,534 | ) | | | — | | | | — | |
Class I(1) | | | (1,219,636 | ) | | | (2,981,023 | ) | | | — | | | | — | |
Decrease in net assets from distributions to shareholders | | | (1,523,311 | ) | | | (3,983,550 | ) | | | — | | | | — | |
Fund Share Transactions | | | | | | | | | | | | | | | | |
Proceeds from sale of shares | | | 16,220,374 | | | | 38,984,469 | | | | 12,124,973 | | | | 19,212,422 | |
Proceeds from shares issued to shareholders due to reinvestment of distributions | | | 817,190 | | | | 2,082,155 | | | | — | | | | — | |
| | | 17,037,564 | | | | 41,066,624 | | | | 12,124,973 | | | | 19,212,422 | |
Cost of shares redeemed | | | (62,623,790 | ) | | | (145,839,650 | ) | | | (20,222,181 | ) | | | (44,281,152 | ) |
Cost of redemptions in-kind | | | — | | | | (261,914,439 | ) | | | — | | | | (127,930,138 | ) |
Net increase (decrease) in net assets from Fund share transactions | | | (45,586,226 | ) | | | (366,687,465 | ) | | | (8,097,208 | ) | | | (152,998,868 | ) |
Net increase (decrease) in net assets | | | (26,636,790 | ) | | | (351,424,597 | ) | | | 2,594,324 | | | | (133,007,162 | ) |
Net assets at the beginning of period | | | 230,082,657 | | | | 581,507,254 | | | | 84,153,568 | | | | 217,160,730 | |
Net assets at the end of period | | $ | 203,445,867 | | | $ | 230,082,657 | | | $ | 86,747,892 | | | $ | 84,153,568 | |
Undistributed (Over-distribution of) net investment income at the end of period | | $ | 707,149 | | | $ | 1,501,306 | | | $ | 306,450 | | | $ | (10,957 | ) |
| N/A – | Small Cap Value does not offer Class B Shares. |
| (1) | Effective January 18, 2011, Class R Shares and Class Y Shares previously offered by FAF Advisors, Inc. were renamed Class R3 Shares and Class I Shares, respectively. |
See accompanying notes to financial statements.
Financial Highlights (Unaudited)
| | | | | | | | | | | | | | | | | | | | | | | | | | | | | | | | |
| Selected data for a share outstanding throughout each period: | | | | | | | | | | | | | | | | |
| | | | | | | |
| Class (Commencement Date) | | | | | | | | | | | | | | | | | | | | | | |
| | | | | | Investment Operations | | | Less Distributions | | | | |
| | | | | | | |
| DIVIDEND VALUE | | | | | | | | | | | | | | | | | | | | | | |
Year Ended
October 31, | | Beginning
Net
Asset
Value | | | Net
Invest-
ment
Income
(Loss)(a) | | | Net
Realized/
Unrealized
Gain
(Loss) | | | Total | | | Net
Invest-
ment
Income | | | Capital
Gains(b) | | | Total | | | Ending Net Asset Value | |
Class A (12/92) | | | | | | | | | | | | | | | | | | | | | | | | | | | | | |
2012(f) | | $ | 13.05 | | | $ | .15 | | | $ | 1.49 | | | $ | 1.64 | | | $ | (.17 | ) | | $ | — | | | $ | (.17 | ) | | $ | 14.52 | |
2011 | | | 12.42 | | | | .27 | | | | .63 | | | | .90 | | | | (.27 | ) | | | — | | | | (.27 | ) | | | 13.05 | |
2010 | | | 10.76 | | | | .34 | | | | 1.63 | | | | 1.97 | | | | (.31 | ) | | | — | | | | (.31 | ) | | | 12.42 | |
2009 | | | 10.09 | | | | .29 | | | | .71 | | | | 1.00 | | | | (.33 | ) | | | — | | | | (.33 | ) | | | 10.76 | |
2008 | | | 16.43 | | | | .33 | | | | (5.28 | ) | | | (4.95 | ) | | | (.29 | ) | | | (1.10 | ) | | | (1.39 | ) | | | 10.09 | |
2007 | | | 15.90 | | | | .29 | | | | 1.96 | | | | 2.25 | | | | (.29 | ) | | | (1.43 | ) | | | (1.72 | ) | | | 16.43 | |
Class B (8/94) | | | | | | | | | | | | | | | | | | | | | | | | | | | | | |
2012(f) | | | 12.93 | | | | .10 | | | | 1.47 | | | | 1.57 | | | | (.12 | ) | | | — | | | | (.12 | ) | | | 14.38 | |
2011 | | | 12.25 | | | | .17 | | | | .61 | | | | .78 | | | | (.10 | ) | | | — | | | | (.10 | ) | | | 12.93 | |
2010 | | | 10.61 | | | | .24 | | | | 1.61 | | | | 1.85 | | | | (.21 | ) | | | — | | | | (.21 | ) | | | 12.25 | |
2009 | | | 9.96 | | | | .22 | | | | .68 | | | | .90 | | | | (.25 | ) | | | — | | | | (.25 | ) | | | 10.61 | |
2008 | | | 16.23 | | | | .22 | | | | (5.19 | ) | | | (4.97 | ) | | | (.20 | ) | | | (1.10 | ) | | | (1.30 | ) | | | 9.96 | |
2007 | | | 15.75 | | | | .17 | | | | 1.94 | | | | 2.11 | | | | (.20 | ) | | | (1.43 | ) | | | (1.63 | ) | | | 16.23 | |
Class C (2/99) | | | | | | | | | | | | | | | | | | | | | | | | | | | | | |
2012(f) | | | 12.92 | | | | .09 | | | | 1.48 | | | | 1.57 | | | | (.12 | ) | | | — | | | | (.12 | ) | | | 14.37 | |
2011 | | | 12.26 | | | | .17 | | | | .62 | | | | .79 | | | | (.13 | ) | | | — | | | | (.13 | ) | | | 12.92 | |
2010 | | | 10.63 | | | | .26 | | | | 1.60 | | | | 1.86 | | | | (.23 | ) | | | — | | | | (.23 | ) | | | 12.26 | |
2009 | | | 9.98 | | | | .21 | | | | .69 | | | | .90 | | | | (.25 | ) | | | — | | | | (.25 | ) | | | 10.63 | |
2008 | | | 16.26 | | | | .22 | | | | (5.20 | ) | | | (4.98 | ) | | | (.20 | ) | | | (1.10 | ) | | | (1.30 | ) | | | 9.98 | |
2007 | | | 15.78 | | | | .17 | | | | 1.94 | | | | 2.11 | | | | (.20 | ) | | | (1.43 | ) | | | (1.63 | ) | | | 16.26 | |
Class R3 (9/01)(e) | | | | | | | | | | | | | | | | | | | | | | | | | | | | | |
2012(f) | | | 13.03 | | | | .13 | | | | 1.49 | | | | 1.62 | | | | (.15 | ) | | | — | | | | (.15 | ) | | | 14.50 | |
2011 | | | 12.41 | | | | .23 | | | | .63 | | | | .86 | | | | (.24 | ) | | | — | | | | (.24 | ) | | | 13.03 | |
2010 | | | 10.76 | | | | .30 | | | | 1.64 | | | | 1.94 | | | | (.29 | ) | | | — | | | | (.29 | ) | | | 12.41 | |
2009 | | | 10.08 | | | | .28 | | | | .68 | | | | .96 | | | | (.28 | ) | | | — | | | | (.28 | ) | | | 10.76 | |
2008 | | | 16.41 | | | | .29 | | | | (5.26 | ) | | | (4.97 | ) | | | (.26 | ) | | | (1.10 | ) | | | (1.36 | ) | | | 10.08 | |
2007 | | | 15.88 | | | | .23 | | | | 1.98 | | | | 2.21 | | | | (.25 | ) | | | (1.43 | ) | | | (1.68 | ) | | | 16.41 | |
Class I (8/94)(e) | | | | | | | | | | | | | | | | | | | | | | | | | | | | | |
2012(f) | | | 13.16 | | | | .17 | | | | 1.49 | | | | 1.66 | | | | (.19 | ) | | | — | | | | (.19 | ) | | | 14.63 | |
2011 | | | 12.53 | | | | .31 | | | | .64 | | | | .95 | | | | (.32 | ) | | | — | | | | (.32 | ) | | | 13.16 | |
2010 | | | 10.85 | | | | .37 | | | | 1.65 | | | | 2.02 | | | | (.34 | ) | | | — | | | | (.34 | ) | | | 12.53 | |
2009 | | | 10.18 | | | | .32 | | | | .70 | | | | 1.02 | | | | (.35 | ) | | | — | | | | (.35 | ) | | | 10.85 | |
2008 | | | 16.55 | | | | .36 | | | | (5.30 | ) | | | (4.94 | ) | | | (.33 | ) | | | (1.10 | ) | | | (1.43 | ) | | | 10.18 | |
2007 | | | 16.00 | | | | .33 | | | | 1.98 | | | | 2.31 | | | | (.33 | ) | | | (1.43 | ) | | | (1.76 | ) | | | 16.55 | |
| | | | | | | | | | | | | | | | | | | | | | | | | | |
| | | | | | | | | | | | | | | | | | | | |
| | | | | | |
| | | | | | | | | | | | | | | | | | | | |
| | | | Ratios/Supplemental Data | |
| | | | | | | Ratios to Average
Net Assets Before
Reimbursement | | | Ratios to Average
Net Assets After
Reimbursement(d) | | | | |
Total
Return(c) | | | Ending
Net
Assets
(000) | | | Expenses | | | Net
Invest-
ment
Income
(Loss) | | | Expenses | | | Net
Invest-
ment
Income
(Loss) | | | Portfolio
Turnover
Rate | |
| | | | | | | | | | | | | | | | | | | | | | | | | | |
| | 12.56 | % | | $ | 210,163 | | | | 1.17 | %* | | | 2.14 | %* | | | 1.17 | %* | | | 2.14 | %* | | | 11 | % |
| | 7.28 | | | | 176,954 | | | | 1.14 | | | | 2.05 | | | | 1.14 | | | | 2.05 | | | | 33 | |
| | 18.46 | | | | 125,226 | | | | 1.19 | | | | 2.87 | | | | 1.17 | | | | 2.89 | | | | 29 | |
| | 10.32 | | | | 100,059 | | | | 1.19 | | | | 3.00 | | | | 1.19 | | | | 3.00 | | | | 48 | |
| | (32.51 | ) | | | 100,824 | | | | 1.17 | | | | 2.45 | | | | 1.17 | | | | 2.45 | | | | 32 | |
| | 15.24 | | | | 179,379 | | | | 1.16 | | | | 1.83 | | | | 1.16 | | | | 1.83 | | | | 20 | |
| | | | | | | | | | | | | | | | | | | | | | | | | | |
| | 12.10 | | | | 2,037 | | | | 1.92 | * | | | 1.49 | * | | | 1.92 | * | | | 1.49 | * | | | 11 | |
| | 6.45 | | | | 3,016 | | | | 1.89 | | | | 1.32 | | | | 1.89 | | | | 1.32 | | | | 33 | |
| | 17.59 | | | | 5,039 | | | | 1.94 | | | | 2.05 | | | | 1.92 | | | | 2.07 | | | | 29 | |
| | 9.41 | | | | 7,237 | | | | 1.94 | | | | 2.28 | | | | 1.94 | | | | 2.28 | | | | 48 | |
| | (32.95 | ) | | | 9,113 | | | | 1.92 | | | | 1.69 | | | | 1.92 | | | | 1.69 | | | | 32 | |
| | 14.40 | | | | 16,893 | | | | 1.91 | | | | 1.09 | | | | 1.91 | | | | 1.09 | | | | 20 | |
| | | | | | | | | | | | | | | | | | | | | | | | | | |
| | 12.19 | | | | 24,466 | | | | 1.92 | * | | | 1.37 | * | | | 1.92 | * | | | 1.37 | * | | | 11 | |
| | 6.42 | | | | 18,714 | | | | 1.89 | | | | 1.31 | | | | 1.89 | | | | 1.31 | | | | 33 | |
| | 17.60 | | | | 11,107 | | | | 1.94 | | | | 2.20 | | | | 1.92 | | | | 2.22 | | | | 29 | |
| | 9.41 | | | | 4,921 | | | | 1.94 | | | | 2.23 | | | | 1.94 | | | | 2.23 | | | | 48 | |
| | (32.95 | ) | | | 4,625 | | | | 1.92 | | | | 1.69 | | | | 1.92 | | | | 1.69 | | | | 32 | |
| | 14.37 | | | | 9,241 | | | | 1.91 | | | | 1.09 | | | | 1.91 | | | | 1.09 | | | | 20 | |
| | | | | | | | | | | | | | | | | | | | | | | | | | |
| | 12.52 | | | | 17,312 | | | | 1.42 | * | | | 1.86 | * | | | 1.42 | * | | | 1.86 | * | | | 11 | |
| | 6.93 | | | | 12,092 | | | | 1.41 | | | | 1.75 | | | | 1.41 | | | | 1.75 | | | | 33 | |
| | 18.16 | | | | 1,204 | | | | 1.41 | | | | 2.48 | | | | 1.39 | | | | 2.50 | | | | 29 | |
| | 9.92 | | | | 122 | | | | 1.45 | | | | 2.94 | | | | 1.45 | | | | 2.94 | | | | 48 | |
| | (32.64 | ) | | | 535 | | | | 1.42 | | | | 2.20 | | | | 1.42 | | | | 2.20 | | | | 32 | |
| | 14.98 | | | | 940 | | | | 1.41 | | | | 1.48 | | | | 1.41 | | | | 1.48 | | | | 20 | |
| | | | | | | | | | | | | | | | | | | | | | | | | | |
| | 12.68 | | | | 963,630 | | | | .92 | * | | | 2.40 | * | | | .92 | * | | | 2.40 | * | | | 11 | |
| | 7.56 | | | | 861,754 | | | | .89 | | | | 2.30 | | | | .89 | | | | 2.31 | | | | 33 | |
| | 18.78 | | | | 684,540 | | | | .94 | | | | 3.12 | | | | .92 | | | | 3.10 | | | | 29 | |
| | 10.51 | | | | 570,690 | | | | .94 | | | | 3.25 | | | | .94 | | | | 3.25 | | | | 48 | |
| | (32.29 | ) | | | 574,162 | | | | .92 | | | | 2.70 | | | | .92 | | | | 2.70 | | | | 32 | |
| | 15.54 | | | | 1,061,433 | | | | .91 | | | | 2.09 | | | | .91 | | | | 2.09 | | | | 20 | |
| (a) | Per share Net Investment Income (Loss) is calculated using the average daily shares method. |
| (b) | Distributions from Capital Gains include short-term capital gains, if any. |
| (c) | Total return is the combination of changes in net asset value without any sales charge, reinvested dividend income at net asset value and reinvested capital gains distributions at net asset value, if any. Total returns are not annualized. |
| (d) | After expense reimbursement from the Adviser, where applicable. |
| (e) | Effective January 18, 2011, Class R Shares and Class Y Shares previously offered by FAF Advisors, Inc. were renamed Class R3 Shares and Class I Shares, respectively. |
| (f) | For the six months ended April 30, 2012. |
See accompanying notes to financial statements.
Financial Highlights (Unaudited) (continued)
| | | | | | | | | | | | | | | | | | | | | | | | | | | | | | | | |
| Selected data for a share outstanding throughout each period: | | | | | | | | | | | | | | | | |
| | | | | | |
| Class (Commencement Date) | | | | | | | | | | | | | | | | | | | |
| | | | | | Investment Operations | | | Less Distributions | | | | |
| | | | | |
| LARGE CAP VALUE | | | | | | | | | | | | | | | | |
Year Ended
October 31, | | Beginning
Net
Asset
Value | | | Net
Invest-
ment
Income
(Loss)(a) | | | Net
Realized/
Unrealized
Gain
(Loss) | | | Total | | | Net
Invest-
ment
Income | | | Capital
Gains(b) | | | Total | | | Ending
Net
Asset
Value | |
Class A (12/87) | | | | | | | | | | | | | | | | | | | | | | | | | | | | | |
2012(f) | | $ | 14.42 | | | $ | .10 | | | $ | 1.75 | | | $ | 1.85 | | | $ | (.06 | ) | | $ | — | | | $ | (.06 | ) | | $ | 16.21 | |
2011 | | | 14.32 | | | | .08 | | | | .21 | | | | .29 | | | | (.19 | ) | | | — | | | | (.19 | ) | | | 14.42 | |
2010 | | | 13.14 | | | | .09 | | | | 1.27 | | | | 1.36 | | | | (.18 | ) | | | — | | | | (.18 | ) | | | 14.32 | |
2009 | | | 12.88 | | | | .18 | | | | .22 | | | | .40 | | | | (.14 | ) | | | — | | | | (.14 | ) | | | 13.14 | |
2008 | | | 22.61 | | | | .25 | | | | (7.02 | ) | | | (6.77 | ) | | | (.16 | ) | | | (2.80 | ) | | | (2.96 | ) | | | 12.88 | |
2007 | | | 22.12 | | | | .23 | | | | 2.19 | | | | 2.42 | | | | (.24 | ) | | | (1.69 | ) | | | (1.93 | ) | | | 22.61 | |
Class C (2/99) | | | | | | | | | | | | | | | | | | | | | | | | | | | | | |
2012(f) | | | 14.09 | | | | .04 | | | | 1.71 | | | | 1.75 | | | | — | | | | — | | | | — | | | | 15.84 | |
2011 | | | 13.97 | | | | (.03 | ) | | | .21 | | | | .18 | | | | (.06 | ) | | | — | | | | (.06 | ) | | | 14.09 | |
2010 | | | 12.81 | | | | (.01 | ) | | | 1.22 | | | | 1.21 | | | | (.05 | ) | | | — | | | | (.05 | ) | | | 13.97 | |
2009 | | | 12.59 | | | | .09 | | | | .21 | | | | .30 | | | | (.08 | ) | | | — | | | | (.08 | ) | | | 12.81 | |
2008 | | | 22.21 | | | | .11 | | | | (6.86 | ) | | | (6.75 | ) | | | (.07 | ) | | | (2.80 | ) | | | (2.87 | ) | | | 12.59 | |
2007 | | | 21.81 | | | | .07 | | | | 2.14 | | | | 2.21 | | | | (.12 | ) | | | (1.69 | ) | | | (1.81 | ) | | | 22.21 | |
Class R3 (9/01)(e) | | | | | | | | | | | | | | | | | | | | | | | | | | | | | |
2012(f) | | | 14.32 | | | | .08 | | | | 1.74 | | | | 1.82 | | | | (.02 | ) | | | — | | | | (.02 | ) | | | 16.12 | |
2011 | | | 14.24 | | | | .05 | | | | .21 | | | | .26 | | | | (.18 | ) | | | — | | | | (.18 | ) | | | 14.32 | |
2010 | | | 13.09 | | | | .05 | | | | 1.26 | | | | 1.31 | | | | (.16 | ) | | | — | | | | (.16 | ) | | | 14.24 | |
2009 | | | 12.85 | | | | .13 | | | | .23 | | | | .36 | | | | (.12 | ) | | | — | | | | (.12 | ) | | | 13.09 | |
2008 | | | 22.57 | | | | .20 | | | | (6.99 | ) | | | (6.79 | ) | | | (.13 | ) | | | (2.80 | ) | | | (2.93 | ) | | | 12.85 | |
2007 | | | 22.10 | | | | .17 | | | | 2.17 | | | | 2.34 | | | | (.18 | ) | | | (1.69 | ) | | | (1.87 | ) | | | 22.57 | |
Class I (2/94)(e) | | | | | | | | | | | | | | | | | | | | | | | | | | | | | |
2012(f) | | | 14.51 | | | | .12 | | | | 1.76 | | | | 1.88 | | | | (.10 | ) | | | — | | | | (.10 | ) | | | 16.29 | |
2011 | | | 14.41 | | | | .15 | | | | .18 | | | | .33 | | | | (.23 | ) | | | — | | | | (.23 | ) | | | 14.51 | |
2010 | | | 13.23 | | | | .12 | | | | 1.27 | | | | 1.39 | | | | (.21 | ) | | | — | | | | (.21 | ) | | | 14.41 | |
2009 | | | 12.95 | | | | .21 | | | | .23 | | | | .44 | | | | (.16 | ) | | | — | | | | (.16 | ) | | | 13.23 | |
2008 | | | 22.69 | | | | .29 | | | | (7.04 | ) | | | (6.75 | ) | | | (.19 | ) | | | (2.80 | ) | | | (2.99 | ) | | | 12.95 | |
2007 | | | 22.19 | | | | .29 | | | | 2.18 | | | | 2.47 | | | | (.28 | ) | | | (1.69 | ) | | | (1.97 | ) | | | 22.69 | |
| | | | | | | | | | | | | | | | | | | | | | | | | | |
| | | | | | |
| | | | | | | | | | | | | | | | | | | | |
| | | | Ratios/Supplemental Data | |
| | | | | | | Ratios to Average
Net Assets Before
Reimbursement | | | Ratios to Average
Net Assets After
Reimbursement(d) | | | | |
Total
Return(c) | | | Ending
Net
Assets
(000) | | | Expenses | | | Net
Invest-
ment
Income
(Loss) | | | Expenses | | | Net
Invest-
ment
Income
(Loss) | | | Portfolio
Turnover
Rate | |
| | | | | | | | | | | | | | | | | | | | | | | | | | |
| | 12.88 | % | | $ | 49,346 | | | | 1.32 | %* | | | 1.30 | %* | | | 1.31 | %* | | | 1.30 | %* | | | 47 | % |
| | 1.98 | | | | 46,659 | | | | 1.24 | | | | .56 | | | | 1.24 | | | | .56 | | | | 114 | |
| | 10.36 | | | | 52,567 | | | | 1.23 | | | | .63 | | | | 1.23 | | | | .63 | | | | 135 | |
| | 3.24 | | | | 55,401 | | | | 1.22 | | | | 1.49 | | | | 1.22 | | | | 1.49 | | | | 68 | |
| | (34.00 | ) | | | 60,870 | | | | 1.19 | | | | 1.41 | | | | 1.19 | | | | 1.41 | | | | 90 | |
| | 11.60 | | | | 113,223 | | | | 1.17 | | | | 1.05 | | | | 1.17 | | | | 1.05 | | | | 81 | |
| | | | | | | | | | | | | | | | | | | | | | | | | | |
| | 12.42 | | | | 1,229 | | | | 2.04 | * | | | .54 | * | | | 2.04 | * | | | .54 | * | | | 47 | |
| | 1.28 | | | | 1,094 | | | | 1.99 | | | | (.19 | ) | | | 1.99 | | | | (.19 | ) | | | 114 | |
| | 9.45 | | | | 1,337 | | | | 1.98 | | | | (.10 | ) | | | 1.98 | | | | (.10 | ) | | | 135 | |
| | 2.47 | | | | 2,016 | | | | 1.97 | | | | .76 | | | | 1.97 | | | | .76 | | | | 68 | |
| | (34.46 | ) | | | 2,643 | | | | 1.94 | | | | .66 | | | | 1.94 | | | | .66 | | | | 90 | |
| | 10.71 | | | | 4,587 | | | | 1.92 | | | | .31 | | | | 1.92 | | | | .31 | | | | 81 | |
| | | | | | | | | | | | | | | | | | | | | | | | | | |
| | 12.75 | | | | 486 | | | | 1.54 | * | | | 1.08 | * | | | 1.54 | * | | | 1.08 | * | | | 47 | |
| | 1.74 | | | | 768 | | | | 1.49 | | | | .33 | | | | 1.49 | | | | .33 | | | | 114 | |
| | 10.04 | | | | 794 | | | | 1.49 | | | | .35 | | | | 1.49 | | | | .35 | | | | 135 | |
| | 2.96 | | | | 340 | | | | 1.47 | | | | 1.06 | | | | 1.47 | | | | 1.06 | | | | 68 | |
| | (34.13 | ) | | | 174 | | | | 1.44 | | | | 1.18 | | | | 1.44 | | | | 1.18 | | | | 90 | |
| | 11.25 | | | | 188 | | | | 1.42 | | | | .78 | | | | 1.42 | | | | .78 | | | | 81 | |
| | | | | | | | | | | | | | | | | | | | | | | | | | |
| | 13.02 | | | | 101,245 | | | | 1.04 | * | | | 1.55 | * | | | 1.04 | * | | | 1.55 | * | | | 47 | |
| | 2.22 | | | | 104,949 | | | | .99 | | | | .96 | | | | .99 | | | | .96 | | | | 114 | |
| | 10.54 | | | | 286,736 | | | | .98 | | | | .89 | | | | .98 | | | | .89 | | | | 135 | |
| | 3.54 | | | | 335,589 | | | | .97 | | | | 1.76 | | | | .97 | | | | 1.76 | | | | 68 | |
| | (33.80 | ) | | | 401,006 | | | | .94 | | | | 1.66 | | | | .94 | | | | 1.66 | | | | 90 | |
| | 11.83 | | | | 726,512 | | | | .92 | | | | 1.30 | | | | .92 | | | | 1.30 | | | | 81 | |
| (a) | Per share Net Investment Income (Loss) is calculated using the average daily shares method. |
| (b) | Distributions from Capital Gains include short-term capital gains, if any. |
| (c) | Total return is the combination of changes in net asset value without any sales charge, reinvested dividend income at net asset value and reinvested capital gains distributions at net asset value, if any. Total returns are not annualized. |
| (d) | After expense reimbursement from the Adviser, where applicable. |
| (e) | Effective January 18, 2011, Class R Shares and Class Y Shares previously offered by FAF Advisors Inc. were renamed Class R3 Shares and Class I Shares, respectively. |
| (f) | For the six months ended April 30, 2012. |
See accompanying notes to financial statements.
Financial Highlights (Unaudited) (continued)
| | | | | | | | | | | | | | | | | | | | | | | | | | | | | | | | |
| Selected data for a share outstanding throughout each period: | | | | |
| | | | | | |
| Class (Commencement Date) | | | | | | | | | | | | | | | | | | | |
| | | | | | Investment Operations | | | Less Distributions | | | | |
| | | | | |
| MID CAP VALUE | | | | | | | | | | | | | | | | |
Year Ended
October 31, | | Beginning
Net
Asset
Value | | | Net
Invest-
ment
Income
(Loss)(a) | | | Net
Realized/
Unrealized
Gain
(Loss) | | | Total | | | Net
Invest-
ment
Income | | | Capital
Gains(b) | | | Total | | | Ending
Net
Asset
Value | |
Class A (12/87) | | | | | | | | | | | | | | | | | | | | | | | | | | | | | |
2012(f) | | $ | 21.83 | | | $ | .07 | | | $ | 2.12 | | | $ | 2.19 | | | $ | (.13 | ) | | $ | — | | | $ | (.13 | ) | | $ | 23.89 | |
2011 | | | 22.20 | | | | .07 | | | | (.19 | ) | | | (.12 | ) | | | (.25 | ) | | | — | | | | (.25 | ) | | | 21.83 | |
2010 | | | 18.28 | | | | .12 | | | | 4.00 | | | | 4.12 | | | | (.20 | ) | | | — | | | | (.20 | ) | | | 22.20 | |
2009 | | | 16.13 | | | | .24 | | | | 1.99 | | | | 2.23 | | | | (.08 | ) | | | — | | | | (.08 | ) | | | 18.28 | |
2008 | | | 27.83 | | | | .21 | | | | (9.92 | ) | | | (9.71 | ) | | | (.16 | ) | | | (1.83 | ) | | | (1.99 | ) | | | 16.13 | |
2007 | | | 26.65 | | | | .14 | | | | 2.78 | | | | 2.92 | | | | (.16 | ) | | | (1.58 | ) | | | (1.74 | ) | | | 27.83 | |
Class B (8/94) | | | | | | | | | | | | | | | | | | | | | | | | | | | | | |
2012(f) | | | 20.52 | | | | (.02 | ) | | | 2.00 | | | | 1.98 | | | | — | | | | — | | | | — | | | | 22.50 | |
2011 | | | 20.87 | | | | (.10 | ) | | | (.18 | ) | | | (.28 | ) | | | (.07 | ) | | | — | | | | (.07 | ) | | | 20.52 | |
2010 | | | 17.21 | | | | (.04 | ) | | | 3.78 | | | | 3.74 | | | | (.08 | ) | | | — | | | | (.08 | ) | | | 20.87 | |
2009 | | | 15.22 | | | | .13 | | | | 1.87 | | | | 2.00 | | | | (.01 | ) | | | — | | | | (.01 | ) | | | 17.21 | |
2008 | | | 26.48 | | | | .03 | | | | (9.39 | ) | | | (9.36 | ) | | | (.07 | ) | | | (1.83 | ) | | | (1.90 | ) | | | 15.22 | |
2007 | | | 25.50 | | | | (.05 | ) | | | 2.65 | | | | 2.60 | | | | (.04 | ) | | | (1.58 | ) | | | (1.62 | ) | | | 26.48 | |
Class C (2/99) | | | | | | | | | | | | | | | | | | | | | | | | | | | | | |
2012(f) | | | 20.99 | | | | (.02 | ) | | | 2.04 | | | | 2.02 | | | | — | | | | — | | | | — | | | | 23.01 | |
2011 | | | 21.36 | | | | (.10 | ) | | | (.18 | ) | | | (.28 | ) | | | (.09 | ) | | | — | | | | (.09 | ) | | | 20.99 | |
2010 | | | 17.61 | | | | (.04 | ) | | | 3.86 | | | | 3.82 | | | | (.07 | ) | | | — | | | | (.07 | ) | | | 21.36 | |
2009 | | | 15.58 | | | | .12 | | | | 1.92 | | | | 2.04 | | | | (.01 | ) | | | — | | | | (.01 | ) | | | 17.61 | |
2008 | | | 27.05 | | | | .03 | | | | (9.60 | ) | | | (9.57 | ) | | | (.07 | ) | | | (1.83 | ) | | | (1.90 | ) | | | 15.58 | |
2007 | | | 26.02 | | | | (.06 | ) | | | 2.72 | | | | 2.66 | | | | (.05 | ) | | | (1.58 | ) | | | (1.63 | ) | | | 27.05 | |
Class R3 (9/01)(e) | | | | | | | | | | | | | | | | | | | | | | | | | | | | | |
2012(f) | | | 21.70 | | | | .04 | | | | 2.10 | | | | 2.14 | | | | (.07 | ) | | | — | | | | (.07 | ) | | | 23.77 | |
2011 | | | 22.05 | | | | .01 | | | | (.19 | ) | | | (.18 | ) | | | (.17 | ) | | | — | | | | (.17 | ) | | | 21.70 | |
2010 | | | 18.15 | | | | .06 | | | | 3.99 | | | | 4.05 | | | | (.15 | ) | | | — | | | | (.15 | ) | | | 22.05 | |
2009 | | | 16.04 | | | | .19 | | | | 1.98 | | | | 2.17 | | | | (.06 | ) | | | — | | | | (.06 | ) | | | 18.15 | |
2008 | | | 27.72 | | | | .15 | | | | (9.87 | ) | | | (9.72 | ) | | | (.13 | ) | | | (1.83 | ) | | | (1.96 | ) | | | 16.04 | |
2007 | | | 26.56 | | | | .06 | | | | 2.78 | | | | 2.84 | | | | (.10 | ) | | | (1.58 | ) | | | (1.68 | ) | | | 27.72 | |
Class I (2/94)(e) | | | | | | | | | | | | | | | | | | | | | | | | | | | | | |
2012(f) | | | 21.99 | | | | .09 | | | | 2.13 | | | | 2.22 | | | | (.19 | ) | | | — | | | | (.19 | ) | | | 24.02 | |
2011 | | | 22.37 | | | | .15 | | | | (.22 | ) | | | (.07 | ) | | | (.31 | ) | | | — | | | | (.31 | ) | | | 21.99 | |
2010 | | | 18.42 | | | | .16 | | | | 4.05 | | | | 4.21 | | | | (.26 | ) | | | — | | | | (.26 | ) | | | 22.37 | |
2009 | | | 16.24 | | | | .28 | | | | 2.01 | | | | 2.29 | | | | (.11 | ) | | | — | | | | (.11 | ) | | | 18.42 | |
2008 | | | 27.98 | | | | .27 | | | | (9.99 | ) | | | (9.72 | ) | | | (.19 | ) | | | (1.83 | ) | | | (2.02 | ) | | | 16.24 | |
2007 | | | 26.77 | | | | .22 | | | | 2.80 | | | | 3.02 | | | | (.23 | ) | | | (1.58 | ) | | | (1.81 | ) | | | 27.98 | |
| | | | | | | | | | | | | | | | | | | | | | | | | | |
| | | | | | |
| | | | | | | | | | | | | | | | | | | | |
| | | | Ratios/Supplemental Data | |
| | | | | | | Ratios to Average
Net Assets Before
Reimbursement | | | Ratios to Average
Net Assets After
Reimbursement(d) | | | | |
Total
Return(c) | | | Ending
Net
Assets
(000) | | | Expenses | | | Net
Invest-
ment
Income
(Loss) | | | Expenses | | | Net
Invest-
ment
Income
(Loss) | | | Portfolio
Turnover
Rate | |
| | | | | | | | | | | | | | | | | | | | | | | | | | |
| | 10.08 | % | | $ | 42,201 | | | | 1.53 | %* | | | .33 | %* | | | 1.28 | %* | | | .58 | %* | | | 78 | % |
| | (.64 | ) | | | 52,334 | | | | 1.33 | | | | .27 | | | | 1.31 | | | | .30 | | | | 123 | |
| | 22.65 | | | | 76,667 | | | | 1.25 | | | | .58 | | | | 1.25 | | | | .58 | | | | 123 | |
| | 13.95 | | | | 130,222 | | | | 1.25 | | | | 1.52 | | | | 1.25 | | | | 1.52 | | | | 106 | |
| | (37.32 | ) | | | 124,275 | | | | 1.23 | | | | .90 | | | | 1.23 | | | | .90 | | | | 93 | |
| | 11.47 | | | | 254,342 | | | | 1.22 | | | | .58 | | | | 1.22 | | | | .58 | | | | 95 | |
| | | | | | | | | | | | | | | | | | | | | | | | | | |
| | 9.65 | | | | 1,824 | | | | 2.28 | * | | | (.44 | )* | | | 2.03 | * | | | (.18 | )* | | | 78 | |
| | (1.35 | ) | | | 2,073 | | | | 2.08 | | | | (.48 | ) | | | 2.06 | | | | (.45 | ) | | | 123 | |
| | 21.77 | | | | 2,815 | | | | 2.00 | | | | (.20 | ) | | | 2.00 | | | | (.20 | ) | | | 123 | |
| | 13.13 | | | | 3,481 | | | | 1.98 | | | | .85 | | | | 1.98 | | | | .85 | | | | 106 | |
| | (37.82 | ) | | | 4,133 | | | | 1.98 | | | | .14 | | | | 1.98 | | | | .14 | | | | 93 | |
| | 10.67 | | | | 8,360 | | | | 1.97 | | | | (.13 | ) | | | 1.97 | | | | (.13 | ) | | | 95 | |
| | | | | | | | | | | | | | | | | | | | | | | | | | |
| | 9.62 | | | | 9,025 | | | | 2.29 | * | | | (.45 | )* | | | 2.03 | * | | | (.19 | )* | | | 78 | |
| | (1.35 | ) | | | 8,957 | | | | 2.08 | | | | (.48 | ) | | | 2.06 | | | | (.45 | ) | | | 123 | |
| | 21.74 | | | | 11,564 | | | | 2.00 | | | | (.21 | ) | | | 2.00 | | | | (.21 | ) | | | 123 | |
| | 13.10 | | | | 12,040 | | | | 2.00 | | | | .80 | | | | 2.00 | | | | .80 | | | | 106 | |
| | (37.80 | ) | | | 13,154 | | | | 1.98 | | | | .14 | | | | 1.98 | | | | .14 | | | | 93 | |
| | 10.66 | | | | 26,141 | | | | 1.97 | | | | (.18 | ) | | | 1.97 | | | | (.18 | ) | | | 95 | |
| | | | | | | | | | | | | | | | | | | | | | | | | | |
| | 9.89 | | | | 12,371 | | | | 1.77 | * | | | .08 | * | | | 1.53 | * | | | .33 | * | | | 78 | |
| | (.87 | ) | | | 15,310 | | | | 1.58 | | | | .03 | | | | 1.56 | | | | .06 | | | | 123 | |
| | 22.40 | | | | 20,195 | | | | 1.50 | | | | .30 | | | | 1.50 | | | | .30 | | | | 123 | |
| | 13.63 | | | | 25,664 | | | | 1.50 | | | | 1.21 | | | | 1.50 | | | | 1.21 | | | | 106 | |
| | (37.47 | ) | | | 23,423 | | | | 1.49 | | | | .64 | | | | 1.49 | | | | .64 | | | | 93 | |
| | 11.18 | | | | 29,752 | | | | 1.47 | | | | .29 | | | | 1.47 | | | | .29 | | | | 95 | |
| | | | | | | | | | | | | | | | | | | | | | | | | | |
| | 10.16 | | | | 138,025 | | | | 1.29 | * | | | .56 | * | | | 1.03 | * | | | .82 | * | | | 78 | |
| | (.42 | ) | | | 151,409 | | | | 1.07 | | | | .65 | | | | 1.06 | | | | .65 | | | | 123 | |
| | 22.98 | | | | 470,266 | | | | 1.00 | | | | .78 | | | | 1.00 | | | | .78 | | | | 123 | |
| | 14.24 | | | | 440,968 | | | | 1.00 | | | | 1.76 | | | | 1.00 | | | | 1.76 | | | | 106 | |
| | (37.17 | ) | | | 415,486 | | | | .99 | | | | 1.14 | | | | .99 | | | | 1.14 | | | | 93 | |
| | 11.79 | | | | 772,178 | | | | .97 | | | | .86 | | | | .97 | | | | .86 | | | | 95 | |
| (a) | Per share Net Investment Income (Loss) is calculated using the average daily shares method. |
| (b) | Distributions from Capital Gains include short-term capital gains, if any. |
| (c) | Total return is the combination of changes in net asset value without any sales charge, reinvested dividend income at net asset value and reinvested capital gains distributions at net asset value, if any. Total returns are not annualized. |
| (d) | After expense reimbursement from the Adviser, where applicable. |
| (e) | Effective January 18, 2011, Class R Shares and Class Y Shares previously offered by FAF Advisors Inc. were renamed Class R3 Shares and Class I Shares, respectively. |
| (f) | For the six months ended April 30, 2012. |
See accompanying notes to financial statements.
Financial Highlights (Unaudited) (continued)
| | | | | | | | | | | | | | | | | | | | | | | | | | | | | | | | |
| Selected data for a share outstanding throughout each period: | | | | | | | | | | | | | | | | |
| | | | | | | |
| Class (Commencement Date) | | | | | | | | | | | | | | | | | | | | | | |
| | | | | | Investment Operations | | | Less Distributions | | | | |
| | | | | |
SMALL CAP VALUE | | | | | | | | | | | | | | | | |
| | | | | | | | |
Year Ended
October 31, | | Beginning
Net
Asset
Value | | | Net
Invest-
ment
Income
(Loss)(a) | | | Net
Realized/
Unrealized
Gain
(Loss) | | | Total | | | Net
Invest-
ment
Income | | | Capital
Gains(b) | | | Total | | | Ending
Net
Asset
Value | |
Class A (8/94) | | | | | | | | | | | | | | | | | | | | | | | | | | | | | |
2012(f) | | $ | 11.30 | | | $ | .04 | | | $ | 1.41 | | | $ | 1.45 | | | $ | — | | | $ | — | | | $ | — | | | $ | 12.75 | |
2011 | | | 10.26 | | | | (.05 | ) | | | 1.09 | | | | 1.04 | | | | — | | | | — | | | | — | | | | 11.30 | |
2010 | | | 8.22 | | | | (.01 | ) | | | 2.07 | | | | 2.06 | | | | (.02 | ) | | | — | | | | (.02 | ) | | | 10.26 | |
2009 | | | 8.12 | | | | .03 | | | | .15 | | | | .18 | | | | (.08 | ) | | | — | | | | (.08 | ) | | | 8.22 | |
2008 | | | 13.52 | | | | .08 | | | | (3.97 | ) | | | (3.89 | ) | | | (.14 | ) | | | (1.37 | ) | | | (1.51 | ) | | | 8.12 | |
2007 | | | 15.38 | | | | .12 | | | | .48 | | | | .60 | | | | (.02 | ) | | | (2.44 | ) | | | (2.46 | ) | | | 13.52 | |
Class C (2/99) | | | | | | | | | | | | | | | | | | | | | | | | | | | | | |
2012(f) | | | 9.93 | | | | (.01 | ) | | | 1.24 | | | | 1.23 | | | | — | | | | — | | | | — | | | | 11.16 | |
2011 | | | 9.08 | | | | (.12 | ) | | | .97 | | | | .85 | | | | — | | | | — | | | | — | | | | 9.93 | |
2010 | | | 7.31 | | | | (.07 | ) | | | 1.84 | | | | 1.77 | | | | — | | | | — | | | | — | | | | 9.08 | |
2009 | | | 7.22 | | | | (.02 | ) | | | .13 | | | | .11 | | | | (.02 | ) | | | — | | | | (.02 | ) | | | 7.31 | |
2008 | | | 12.19 | | | | — | * | | | (3.54 | ) | | | (3.54 | ) | | | (.06 | ) | | | (1.37 | ) | | | (1.43 | ) | | | 7.22 | |
2007 | | | 14.17 | | | | .02 | | | | .44 | | | | .46 | | | | — | | | | (2.44 | ) | | | (2.44 | ) | | | 12.19 | |
Class R3 (9/01)(e) | | | | | | | | | | | | | | | | | | | | | | | | | | | | | |
2012(f) | | | 11.11 | | | | .02 | | | | 1.39 | | | | 1.41 | | | | — | | | | — | | | | — | | | | 12.52 | |
2011 | | | 10.11 | | | | (.07 | ) | | | 1.07 | | | | 1.00 | | | | — | | | | — | | | | — | | | | 11.11 | |
2010 | | | 8.10 | | | | (.03 | ) | | | 2.04 | | | | 2.01 | | | | — | | | | — | | | | — | | | | 10.11 | |
2009 | | | 8.00 | | | | .01 | | | | .15 | | | | .16 | | | | (.06 | ) | | | — | | | | (.06 | ) | | | 8.10 | |
2008 | | | 13.35 | | | | .05 | | | | (3.91 | ) | | | (3.86 | ) | | | (.12 | ) | | | (1.37 | ) | | | (1.49 | ) | | | 8.00 | |
2007 | | | 15.24 | | | | .10 | | | | .47 | | | | .57 | | | | (.02 | ) | | | (2.44 | ) | | | (2.46 | ) | | | 13.35 | |
Class I (8/94)(e) | | | | | | | | | | | | | | | | | | | | | | | | | | | | | |
2012(f) | | | 11.65 | | | | .05 | | | | 1.46 | | | | 1.51 | | | | — | | | | — | | | | — | | | | 13.16 | |
2011 | | | 10.55 | | | | (.02 | ) | | | 1.12 | | | | 1.10 | | | | — | | | | — | | | | — | | | | 11.65 | |
2010 | | | 8.45 | | | | .01 | | | | 2.13 | | | | 2.14 | | | | (.04 | ) | | | — | | | | (.04 | ) | | | 10.55 | |
2009 | | | 8.36 | | | | .05 | | | | .15 | | | | .20 | | | | (.11 | ) | | | — | | | | (.11 | ) | | | 8.45 | |
2008 | | | 13.87 | | | | .11 | | | | (4.08 | ) | | | (3.97 | ) | | | (.17 | ) | | | (1.37 | ) | | | (1.54 | ) | | | 8.36 | |
2007 | | | 15.71 | | | | .16 | | | | .49 | | | | .65 | | | | (.05 | ) | | | (2.44 | ) | | | (2.49 | ) | | | 13.87 | |
| | | | | | | | | | | | | | | | | | | | | | | | | | |
| | | | | | | | | | | | | | | | | | | | |
| | | | |
| | | | | | | | | | | | | | |
| | | | Ratios/Supplemental Data | |
| | | | | | | Ratios to Average
Net Assets Before
Reimbursement | | | Ratios to Average
Net Assets After
Reimbursement(d) | | | | |
Total
Return(c) | | | Ending
Net
Assets
(000) | | | Expenses | | | Net
Invest-
ment
Income
(Loss) | | | Expenses | | | Net
Invest-
ment
Income
(Loss) | | | Portfolio
Turnover
Rate | |
| | | | | | | | | | | | | | | | | | | | | | | | | | |
| | 12.83 | % | | $ | 33,975 | | | | 1.67 | %*** | | | .38 | %*** | | | 1.46 | %*** | | | .59 | %*** | | | 23 | % |
| | 10.14 | | | | 31,814 | | | | 1.48 | | | | (.41 | ) | | | 1.46 | | | | (.40 | ) | | | 41 | |
| | 25.15 | | | | 32,332 | | | | 1.34 | | | | (.11 | ) | | | 1.34 | | | | (.11 | ) | | | 58 | |
| | 2.40 | | | | 29,026 | | | | 1.37 | | | | .46 | | | | 1.37 | | | | .46 | | | | 73 | |
| | (31.75 | ) | | | 28,344 | | | | 1.31 | | | | .75 | | | | 1.31 | | | | .75 | | | | 49 | |
| | 4.18 | | | | 53,498 | | | | 1.26 | | | | .90 | | | | 1.26 | | | | .90 | | | | 63 | |
| | | | | | | | | | | | | | | | | | | | | | | | | | |
| | 12.39 | | | | 1,632 | | | | 2.42 | *** | | | (.35 | )*** | | | 2.21 | *** | | | (.14 | )*** | | | 23 | |
| | 9.36 | | | | 1,498 | | | | 2.23 | | | | (1.18 | ) | | | 2.21 | | | | (1.18 | ) | | | 41 | |
| | 24.21 | | | | 1,843 | | | | 2.09 | | | | (.86 | ) | | | 2.09 | | | | (.86 | ) | | | 58 | |
| | 1.56 | | | | 2,080 | | | | 2.12 | | | | (.27 | ) | | | 2.12 | | | | (.27 | ) | | | 73 | |
| | (32.23 | ) | | | 2,373 | | | | 2.06 | | | | — | ** | | | 2.06 | | | | — | ** | | | 49 | |
| | 3.42 | | | | 4,006 | | | | 2.01 | | | | .14 | | | | 2.01 | | | | .14 | | | | 63 | |
| | | | | | | | | | | | | | | | | | | | | | | | | | |
| | 12.69 | | | | 2,494 | | | | 1.92 | *** | | | .14 | *** | | | 1.71 | *** | | | .35 | *** | | | 23 | |
| | 9.89 | �� | | | 2,246 | | | | 1.73 | | | | (.66 | ) | | | 1.71 | | | | (.65 | ) | | | 41 | |
| | 24.85 | | | | 2,111 | | | | 1.59 | | | | (.35 | ) | | | 1.59 | | | | (.35 | ) | | | 58 | |
| | 2.14 | | | | 2,327 | | | | 1.62 | | | | .19 | | | | 1.62 | | | | .19 | | | | 73 | |
| | (31.90 | ) | | | 2,159 | | | | 1.56 | | | | .50 | | | | 1.56 | | | | .50 | | | | 49 | |
| | 3.96 | | | | 3,263 | | | | 1.51 | | | | .72 | | | | 1.51 | | | | .72 | | | | 63 | |
| | | | | | | | | | | | | | | | | | | | | | | | | | |
| | 12.96 | | | | 48,647 | | | | 1.42 | *** | | | .65 | *** | | | 1.21 | *** | | | .86 | *** | | | 23 | |
| | 10.43 | | | | 48,596 | | | | 1.21 | | | | (.16 | ) | | | 1.21 | | | | (.16 | ) | | | 41 | |
| | 25.43 | | | | 180,875 | | | | 1.09 | | | | .14 | | | | 1.09 | | | | .14 | | | | 58 | |
| | 2.59 | | | | 149,515 | | | | 1.12 | | | | .72 | | | | 1.12 | | | | .72 | | | | 73 | |
| | (31.56 | ) | | | 158,112 | | | | 1.06 | | | | 1.00 | | | | 1.06 | | | | 1.00 | | | | 49 | |
| | 4.45 | | | | 302,683 | | | | 1.01 | | | | 1.15 | | | | 1.01 | | | | 1.15 | | | | 63 | |
| (a) | Per share Net Investment Income (Loss) is calculated using the average daily shares method. |
| (b) | Distributions from Capital Gains include short-term capital gains, if any. |
| (c) | Total return is the combination of changes in net asset value without any sales charge, reinvested dividend income at net asset value and reinvested capital gains distributions at net asset value, if any. Total returns are not annualized. |
| (d) | After expense reimbursement from the Adviser, where applicable. |
| (e) | Effective January 18, 2011, Class R Shares and Class Y Shares previously offered by FAF Advisors Inc. were renamed Class R3 Shares and Class I Shares, respectively. |
| (f) | For the six months ended April 30, 2012. |
| * | Rounds to less than $.01 per share. |
| ** | Rounds to less than .01%. |
See accompanying notes to financial statements.
Notes to Financial Statements (Unaudited)
1. General Information and Significant Accounting Policies
General Information
Nuveen Investment Funds, Inc. (the “Trust”), is an open-end investment company registered under the Investment Company Act of 1940, as amended. The Trust is comprised of Nuveen Dividend Value Fund (“Dividend Value”) formerly known as Nuveen Equity Income Fund, Nuveen Large Cap Value Fund (“Large Cap Value”), Nuveen Mid Cap Value Fund (“Mid Cap Value”) and Nuveen Small Cap Value Fund (“Small Cap Value”) (each a “Fund” and collectively, the “Funds”), among others. The Trust was incorporated in the State of Maryland on August 20, 1987.
Dividend Value’s investment objective is long-term growth of capital and income. Under normal market conditions, the Fund invests at least 80% of net assets, plus the amount of any borrowings for investment purposes, in equity securities of companies Nuveen Asset Management, LLC (the “Sub-Adviser”), a wholly-owned subsidiary of Nuveen Fund Advisors, Inc. (the “Adviser”), a wholly-owned subsidiary of Nuveen Investments, Inc. (“Nuveen”), believes have the ability to pay above average dividends and finance expected growth have strong management and are trading at attractive valuations. The Fund also invests in convertible debt securities in pursuit of both long-term growth of capital and income.
Large Cap Value’s investment objective is capital appreciation, with current income as the Fund’s secondary objective. Under normal market conditions, the Fund invests at least 80% of net assets, plus the amount of any borrowings for investment purposes, in common stocks of large-capitalization companies, defined as companies that have market capitalizations of $5 billion or greater at the time of purchase.
Mid Cap Value’s investment objective is capital appreciation. Under normal market conditions, the Fund invests at least 80% of net assets, plus the amount of any borrowings for investment purposes, in common stocks of mid-capitalization companies, defined as companies that have market capitalizations at the time of purchase within the market capitalization range of the companies in the Russell MidCap ® Index immediately after its most recent reconstitution prior to such purchase. It is expected that reconstitution of the index will occur each year at the end of June. Immediately after the most recent reconstitution, the range was $520 million to $17.9 billion.
Small Cap Value’s investment objective is capital appreciation. Under normal market conditions, the Fund invests at least 80% of its net assets, plus the amount of any borrowings for investment purposes, in common stocks of small-capitalization companies, defined as companies that have market capitalizations of less than $3 billion at the time of purchase.
Each Fund may invest up to 15% of its total assets in non-dollar denominated equity securities of foreign issuers. Each Fund may invest up to 25% of its assets, collectively, in non-dollar denominated equity securities of non-U.S. issuers and in dollar denominated equity securities of non-U.S. issuers that are either listed on a U.S. stock exchange or represented by depositary receipts that may or may not be sponsored by a domestic bank. Up to 15% of the Fund’s total assets may be invested in equity securities of emerging market issuers. Each Fund may also invest in options, futures contracts, options on futures contracts and forward foreign currency exchanges contracts (“derivatives”) to manage market or business risk, enhance its return or hedge against adverse movements in currency exchange rates.
Each Fund’s most recent prospectus provides further descriptions of each Fund’s investment objective, principal investment strategies and principal risks.
Effective at the close of business on February 15, 2012, Class B Shares of Large Cap Value were converted to Class A Shares and are no longer available for dividend reinvestment or through an exchange from other Nuveen mutual funds.
Significant Accounting Policies
The following is a summary of significant accounting policies followed by the Funds in the preparation of their financial statements in accordance with accounting principles generally accepted in the United States (“U.S. GAAP”).
Investment Valuation
Common stocks and other equity-type securities are valued at the last sales price on the securities exchange on which such securities are primarily traded and are generally classified as Level 1 for fair value measurement purposes. Securities primarily traded on the NASDAQ National Market (“NASDAQ”) are valued, except as indicated below, at the NASDAQ Official Closing Price and are generally classified as Level 1. However, securities traded on a securities exchange or NASDAQ for which there were no transactions on a given day or securities not listed on a securities exchange or NASDAQ are valued at the quoted bid price and are generally classified as Level 2. Prices of certain American Depositary Receipts (“ADR”) held by the Funds that trade in the United States are valued based on the last traded price, official closing price, or the most recent bid price of the underlying non-U.S.-traded stock, adjusted as appropriate for the underlying-to-ADR conversion ratio and foreign exchange rate, and from time-to-time may also be adjusted further to take into account material events that may take place after the close of the local non-U.S. market but before the close of the New York Stock Exchange (“NYSE”). These securities generally represent a transfer from a Level 1 to a Level 2 security. Investments in investment companies are valued at their respective net asset values on the valuation date. These investment vehicles are generally classified as Level 1.
Certain securities may not be able to be priced by the pre-established pricing methods as described above. Such securities may be valued by the Funds’ Board of Directors or its designee at fair value. These securities generally include, but are not limited to, restricted securities (securities which may not be publicly sold without registration under the Securities Act of 1933, as amended) for which a pricing service is unable to provide a market price; securities whose trading has been formally suspended; debt securities that have gone into default and for which there is no current market quotation; a security whose market price is not available from a pre-established pricing source; a security with respect to which an event has occurred that is likely to materially affect the value of the security after the market has closed but before the calculation of a Fund’s net asset value (as may be the case in non-U.S. markets on which the security is primarily traded) or make it difficult or impossible to obtain a reliable market quotation; and a security whose price, as provided by the pricing service, is not deemed to reflect the security’s fair value. As a general principle, the fair value of a security would appear to be the amount that the owner might reasonably expect to receive for it in a current sale. A variety of factors may be considered in determining the fair value of such securities, which may include consideration of the following: yields or prices of investments of comparable quality, type of issue, coupon, maturity and rating, market quotes or indications of value from security dealers, evaluations of anticipated cash flows or collateral, general market conditions and other information and analysis, including the obligor’s credit characteristics considered relevant. These securities are generally classified as Level 2 or Level 3 depending on the priority of the significant inputs. Regardless of the method employed to value a particular security, all valuations are subject to review by the Funds’ Board of Directors or its designee.
Refer to Footnote 2 – Fair Value Measurements for further details on the leveling of securities held by the Funds as of the end of the reporting period.
Investment Transactions
Investment transactions are recorded on a trade date basis. Realized gains and losses from investment transactions are determined on the specific identification method, which is the same basis used for federal income tax purposes.
Investment Income
Dividend income is recorded on the ex-dividend date or, for foreign securities, when information is available. Interest income is recorded on an accrual basis. Securities lending income is comprised of fees earned from borrowers and income earned on cash collateral investments, net of lending agent fees.
Income Taxes
Each Fund is a separate taxpayer for federal income tax purposes. Each Fund intends to distribute substantially all of its net investment income and net capital gains to shareholders and to otherwise comply with the requirements of Subchapter M of the Internal Revenue Code applicable to regulated investment companies (“RIC’s”). Therefore, no federal income tax provision is required.
For all open tax years and all major taxing jurisdictions, management of the Funds has concluded that there are no significant uncertain tax positions that would require recognition in the financial statements. Open tax years are those that are open for examination by taxing authorities (i.e., generally the last four tax year ends and the interim tax period since then). Furthermore, management of the Funds is also not aware of any tax positions for which it is reasonably possible that the total amounts of unrecognized tax benefits will significantly change in the next twelve months.
Dividends and Distributions to Shareholders
Dividends from net investment income are declared and distributed to shareholders at least annually for each Fund with the exception of Dividend Value, which declares and distributes dividends from net investment income to shareholders quarterly. Dividends from net realized capital gains from investment transactions, if any, are declared and distributed to shareholders at least annually. Furthermore, capital gains are distributed only to the extent they exceed available capital loss carryforwards.
Distributions to shareholders are recorded on the ex-dividend date. The amount and timing of distributions are determined in accordance with federal income tax regulations, which may differ from U.S. GAAP.
Small Cap Value receives substantial distributions from holdings in Real Estate Investment Trusts (“REITs”). Distributions from REITs may be characterized as ordinary income, net capital gain, or a return of capital to the REIT shareholder. The proper characterization of REIT distributions is generally not known until after the end of each calendar year. As such, Small Cap Value must use estimates in reporting the character of their income and distributions for financial reporting purposes. The actual character of distributions to Fund shareholders will be reflected on the Form 1099 received by shareholders after the end of the calendar year. Due to the nature of REIT investments, a portion of the distributions received by the Fund shareholder may represent a return of capital.
Flexible Sales Charge Program
Class A Shares are generally sold with an up-front sales charge and incur a .25% annual 12b-1 service fee. Class A Share purchases of $1 million or more are sold at net asset value without an up-front sales charge but may be subject to a contingent deferred sales charge (“CDSC”) if redeemed within twelve months of purchase. Class B Shares were sold without an up-front sales charge but incur a .75% annual 12b-1 distribution fee and a .25% annual 12b-1 service fee. Class B Shares are subject to a CDSC of up to 5% depending upon the length of time the shares are held by the investor (CDSC is reduced to 0% at the end of six years). Class B Shares automatically convert to Class A Shares eight years after purchase. Class C Shares are sold without an up-front sales charge but incur a
Notes to Financial Statements (Unaudited) (continued)
..75% annual 12b-1 distribution fee and a .25% annual 12b-1 service fee. Class C Shares are subject to a CDSC of 1% if redeemed within twelve months of purchase. Class R3 Shares are sold without an up-front sales charge but incur a .25% annual 12b-1 distribution and a .25% annual service fee. Class I Shares are not subject to any sales charge or 12b-1 distribution or service fees.
Derivative Financial Instruments
Each Fund is authorized to invest in certain derivative instruments, including foreign currency exchange contracts, futures, options and swap contracts. Although the Funds are authorized to invest in such financial instruments, and may do so in the future, they did not make any such investments during the six months ended April 30, 2012.
Market and Counterparty Credit Risk
In the normal course of business each Fund may invest in financial instruments and enter into financial transactions where risk of potential loss exists due to changes in the market (market risk) or failure of the other party to the transaction to perform (counterparty credit risk). The potential loss could exceed the value of the financial assets recorded on the financial statements. Financial assets, which potentially expose each Fund to counterparty credit risk, consist principally of cash due from counterparties on forward, option and swap transactions, when applicable. The extent of each Fund’s exposure to counterparty credit risk in respect to these financial assets approximates their carrying value as recorded on the Statement of Assets and Liabilities. Futures contracts, when applicable, expose a Fund to minimal counterparty credit risk as they are exchange traded and the exchange’s clearinghouse, which is counterparty to all exchange traded futures, guarantees the futures contracts against default.
Each Fund helps manage counterparty credit risk by entering into agreements only with counterparties the Adviser believes have the financial resources to honor their obligations and by having the Adviser monitor the financial stability of the counterparties. Additionally, counterparties may be required to pledge collateral daily (based on the daily valuation of the financial asset) on behalf of each Fund with a value approximately equal to the amount of any unrealized gain above a pre-determined threshold. Reciprocally, when each Fund has an unrealized loss, the Funds have instructed the custodian to pledge assets of the Funds as collateral with a value approximately equal to the amount of the unrealized loss above a pre-determined threshold. Collateral pledges are monitored and subsequently adjusted if and when the valuations fluctuate, either up or down, by at least the pre-determined threshold amount.
Multiclass Operations and Allocations
Income and expenses of the Funds that are not directly attributable to a specific class of shares are prorated among the classes based on the relative net assets of each class. Expenses directly attributable to a class of shares, which presently only include 12b-1 distribution fees and shareholder service fees, are recorded to the specific class.
Realized and unrealized capital gains and losses of the Funds are prorated among the classes based on the relative net assets of each class.
Securities Lending
In order to generate additional income, each Fund may lend securities representing up to one-third of the value of its total assets (which includes collateral for securities on loan) to broker-dealers, banks, or other institutions. Each Fund’s policy is to receive cash collateral equal to at least 102% of the value of securities loaned, which is recognized as “Collateral from securities lending program” on the Statement of Assets and Liabilities. The adequacy of the collateral is monitored on a daily basis. If the value of the securities on loan increases, such that the level of collateralization falls below 102%, additional collateral is received from the borrower, which is recognized as “Due from broker” on the Statement of Assets and Liabilities, when applicable. As with other extensions of credit, there may be risks of delay in recovery of the securities or even loss of rights in the collateral should the borrower of the security fail financially.
The Funds’ custodian serves as the securities lending agent for the Funds in transactions involving the lending of portfolio securities on behalf of the Funds. Each Fund pays the custodian a fee based on the Fund’s proportional share of the custodian’s expense of operating its securities lending program. Collateral for securities on loan is invested in a money market fund, which is recognized as “Investments purchased with collateral from securities lending” on the Statement of Assets and Liabilities.
Income from securities lending, net of fees paid, is recognized on the Statement of Operations as “Securities lending income.” Securities lending fees paid by each Fund during the six months ended April 30, 2012, were as follows:
| | | | | | | | | | | | | | | | |
| | | Dividend
Value | | | Large Cap
Value | | | Mid Cap
Value | | | Small Cap
Value | |
Securities lending fees paid | | $ | 22,398 | | | $ | 4,575 | | | $ | 6,922 | | | $ | 5,867 | |
Indemnifications
Under the Trust’s organizational documents, its officers and directors are indemnified against certain liabilities arising out of the performance of their duties to the Trust. In addition, in the normal course of business, the Trust enters into contracts that provide general indemnifications to other parties. The Trust’s maximum exposure under these arrangements is unknown as this would involve future claims that may be made against the Trust that have not yet occurred. However, the Trust has not had prior claims or losses pursuant to these contracts and expects the risk of loss to be remote.
Use of Estimates
The preparation of financial statements in conformity with U.S. GAAP requires management to make estimates and assumptions that affect the reported amounts of assets and liabilities at the date of the financial statements and the reported amounts of increases and decreases in net assets from operations during the reporting period. Actual results may differ from those estimates.
2. Fair Value Measurements
Fair value is defined as the price that the Funds would receive upon selling an investment or transferring a liability in an orderly transaction to an independent buyer in the principal or most advantageous market for the investment. A three-tier hierarchy is used to maximize the use of observable market data and minimize the use of unobservable inputs and to establish classification of fair value measurements for disclosure purposes. Observable inputs reflect the assumptions market participants would use in pricing the asset or liability. Observable inputs are based on market data obtained from sources independent of the reporting entity. Unobservable inputs reflect the reporting entity’s own assumptions about the assumptions market participants would use in pricing the asset or liability. Unobservable inputs are based on the best information available in the circumstances. The three-tier hierarchy of inputs is summarized in the three broad levels listed below:
| | |
| Level 1 – | | Quoted prices in active markets for identical securities. |
| Level 2 – | | Other significant observable inputs, (including quoted prices for similar securities, interest rates, prepayment speeds, credit risk, etc.). |
| Level 3 – | | Significant unobservable inputs (including management’s assumptions in determining the fair value of investments). |
The inputs or methodologies used for valuing securities are not an indication of the risk associated with investing in those securities. The following is a summary of each Fund’s fair value measurements as of April 30, 2012:
| | | | | | | | | | | | | | | | |
| Dividend Value | | Level 1 | | | Level 2 | | | Level 3 | | | Total | |
Long-Term Investments: | | | | | | | | | | | | | | | | |
Common Stocks | | $ | 1,213,310,211 | | | $ | — | | | $ | — | | | $ | 1,213,310,211 | |
Investments Purchased with Collateral from Securities Lending | | | 156,050,266 | | | | — | | | | — | | | | 156,050,266 | |
Short-Term Investments: | | | | | | | | | | | | | | | — | |
Money Market Funds | | | 5,474,249 | | | | — | | | | — | | | | 5,474,249 | |
Total | | $ | 1,374,834,726 | | | $ | — | | | $ | — | | | $ | 1,374,834,726 | |
| | | | | | | | | | | | | | | | |
| | | | |
| Large Cap Value | | Level 1 | | | Level 2 | | | Level 3 | | | Total | |
Long-Term Investments: | | | | | | | | | | | | | | | | |
Common Stocks | | $ | 151,622,392 | | | $ | — | | | $ | — | | | $ | 151,622,392 | |
Investments Purchased with Collateral from Securities Lending | | | 33,810,534 | | | | — | | | | — | | | | 33,810,534 | |
Short-Term Investments: | | | | | | | | | | | | | | | | |
Money Market Funds | | | 873,511 | | | | — | | | | — | | | | 873,511 | |
Total | | $ | 186,306,437 | | | $ | — | | | $ | — | | | $ | 186,306,437 | |
| | | | |
| Mid Cap Value | | Level 1 | | | Level 2 | | | Level 3 | | | Total | |
Long-Term Investments: | | | | | | | | | | | | | | | | |
Common Stocks | | $ | 200,753,294 | | | $ | — | | | $ | — | | | $ | 200,753,294 | |
Investments Purchased with Collateral from Securities Lending | | | 59,694,980 | | | | — | | | | — | | | | 59,694,980 | |
Short-Term Investments: | | | | | | | | | | | | | | | | |
Money Market Funds | | | 111,055 | | | | — | | | | — | | | | 111,055 | |
Total | | $ | 260,559,329 | | | $ | — | | | $ | — | | | $ | 260,559,329 | |
| | | | |
| Small Cap Value | | Level 1 | | | Level 2 | | | Level 3 | | | Total | |
Long-Term Investments: | | | | | | | | | | | | | | | | |
Common Stocks | | $ | 86,313,728 | | | $ | — | | | $ | — | | | $ | 86,313,728 | |
Investments Purchased with Collateral from Securities Lending | | | 42,370,035 | | | | — | | | | — | | | | 42,370,035 | |
Short-Term Investments: | | | | | | | | | | | | | | | | |
Money Market Funds | | | 627,525 | | | | — | | | | — | | | | 627,525 | |
Total | | $ | 129,311,288 | | | $ | — | | | $ | — | | | $ | 129,311,288 | |
During the six months ended April 30, 2012, the Funds recognized no significant transfers to or from Level 1, Level 2 or Level 3.
3. Derivative Instruments and Hedging Activities
The Funds record derivative instruments at fair value, with changes in fair value recognized on the Statement of Operations, when applicable. Even though the Funds’ investments in derivatives may represent economic hedges, they are not considered to be hedge transactions for financial reporting purposes. The Funds did not invest in derivative instruments during the six months ended April 30, 2012.
Notes to Financial Statements (Unaudited) (continued)
4. Fund Shares
Transactions in Fund shares were as follows:
| | | | | | | | | | | | | | | | |
| | | Dividend Value | |
| | | Six Months Ended
4/30/12 | | | Year Ended
10/31/11 | |
| | | Shares | | | Amount | | | Shares | | | Amount | |
Shares sold: | | | | | | | | | | | | | | | | |
Class A | | | 2,783,368 | | | $ | 38,475,112 | | | | 6,608,005 | | | $ | 87,417,806 | |
Class B | | | 3,096 | | | | 41,018 | | | | 3,490 | | | | 47,078 | |
Class C | | | 369,614 | | | | 5,000,249 | | | | 709,239 | | | | 9,350,202 | |
Class R3(1) | | | 343,180 | | | | 4,756,093 | | | | 1,001,768 | | | | 12,618,814 | |
Class I(1) | | | 8,910,983 | | | | 122,498,221 | | | | 25,218,507 | | | | 331,972,894 | |
Shares issued to shareholders due to reinvestment of distributions: | | | | | | | | | | | | | |
Class A | | | 159,456 | | | | 2,194,735 | | | | 232,425 | | | | 3,044,340 | |
Class B | | | 1,622 | | | | 21,911 | | | | 2,171 | | | | 28,844 | |
Class C | | | 11,985 | | | | 162,795 | | | | 10,006 | | | | 131,048 | |
Class R3(1) | | | 11,512 | | | | 158,565 | | | | 5,904 | | | | 74,585 | |
Class I(1) | | | 316,149 | | | | 4,394,314 | | | | 466,773 | | | | 6,205,947 | |
| | | | 12,910,965 | | | | 177,703,013 | | | | 34,258,288 | | | | 450,891,558 | |
Shares redeemed: | | | | | | | | | | | | | | | | |
Class A | | | (2,026,205 | ) | | | (28,304,599 | ) | | | (3,368,560 | ) | | | (44,368,177 | ) |
Class B | | | (96,250 | ) | | | (1,327,724 | ) | | | (183,928 | ) | | | (2,428,779 | ) |
Class C | | | (127,523 | ) | | | (1,727,181 | ) | | | (176,678 | ) | | | (2,327,271 | ) |
Class R3(1) | | | (88,432 | ) | | | (1,204,395 | ) | | | (176,764 | ) | | | (2,358,157 | ) |
Class I(1) | | | (8,889,150 | ) | | | (123,360,696 | ) | | | (14,801,249 | ) | | | (197,668,105 | ) |
| | | | (11,227,560 | ) | | | (155,924,595 | ) | | | (18,707,179 | ) | | | (249,150,489 | ) |
Net increase (decrease) | | | 1,683,405 | | | $ | 21,778,418 | | | | 15,551,109 | | | $ | 201,741,069 | |
| |
| | | Large Cap Value | |
| | | Six Months Ended
4/30/12 | | | Year Ended
10/31/11 | |
| | | Shares | | | Amount | | | Shares | | | Amount | |
Shares sold: | | | | | | | | | | | | | | | | |
Class A | | | 93,447 | | | $ | 1,440,101 | | | | 129,555 | | | $ | 1,983,849 | |
Class B | | | — | | | | — | | | | 434 | | | | 6,096 | |
Class C | | | 12,835 | | | | 197,332 | | | | 6,312 | | | | 96,550 | |
Class R3(1) | | | 4,145 | | | | 61,864 | | | | 18,521 | | | | 282,596 | |
Class I(1) | | | 318,955 | | | | 4,689,619 | | | | 408,149 | | | | 6,070,951 | |
Shares issued to shareholders due to reinvestment of distributions: | | | | | | | | | | | | | |
Class A | | | 12,126 | | | | 178,131 | | | | 42,189 | | | | 643,379 | |
Class B | | | — | | | | — | | | | 387 | | | | 5,704 | |
Class C | | | — | | | | — | | | | 342 | | | | 5,125 | |
Class R3(1) | | | 83 | | | | 1,206 | | | | 591 | | | | 8,973 | |
Class I(1) | | | 23,299 | | | | 343,659 | | | | 73,525 | | | | 1,125,666 | |
| | | | 464,890 | | | | 6,911,912 | | | | 680,005 | | | | 10,228,889 | |
Shares redeemed: | | | | | | | | | | | | | | | | |
Class A | | | (296,735 | ) | | | (4,486,247 | ) | | | (607,199 | ) | | | (9,237,406 | ) |
Class B | | | (65,477 | ) | | | (977,960 | ) | | | (32,714 | ) | | | (482,834 | ) |
Class C | | | (12,907 | ) | | | (190,804 | ) | | | (24,700 | ) | | | (370,567 | ) |
Class R3(1) | | | (27,717 | ) | | | (425,673 | ) | | | (21,216 | ) | | | (322,006 | ) |
Class I(1) | | | (1,359,148 | ) | | | (20,645,354 | ) | | | (4,021,522 | ) | | | (64,483,509 | ) |
Class I(1)-In-kind | | | — | | | | — | | | | (9,125,519 | ) | | | (132,685,046 | ) |
| | | | (1,761,984 | ) | | | (26,726,038 | ) | | | (13,832,870 | ) | | | (207,581,368 | ) |
Net increase (decrease) | | | (1,297,094 | ) | | $ | (19,814,126 | ) | | | (13,152,865 | ) | | $ | (197,352,479 | ) |
| (1) | Effective January 18, 2011, Class R Shares and Class Y Shares previously offered by FAF Advisors, Inc. were renamed Class R3 Shares and Class I Shares, respectively. |
| | | | | | | | | | | | | | | | |
| | | Mid Cap Value | |
| | | Six Months Ended
4/30/12 | | | Year Ended
10/31/11 | |
| | | Shares | | | Amount | | | Shares | | | Amount | |
Shares sold: | | | | | | | | | | | | | | | | |
Class A | | | 119,321 | | | $ | 2,686,954 | | | | 540,631 | | | $ | 12,712,823 | |
Class B | | | — | | | | — | | | | 309 | | | | 6,599 | |
Class C | | | 7,226 | | | | 161,540 | | | | 20,707 | | | | 482,019 | |
Class R3(1) | | | 84,074 | | | | 1,901,929 | | | | 238,587 | | | | 5,504,530 | |
Class I(1) | | | 511,169 | | | | 11,469,951 | | | | 864,453 | | | | 20,278,498 | |
Shares issued to shareholders due to reinvestment of distributions: | | | | | | | | | | | | | | | | |
Class A | | | 11,313 | | | | 248,544 | | | | 32,132 | | | | 764,424 | |
Class B | | | — | | | | — | | | | 406 | | | | 9,131 | |
Class C | | | — | | | | — | | | | 1,838 | | | | 42,309 | |
Class R3(1) | | | 2,157 | | | | 47,196 | | | | 5,967 | | | | 141,365 | |
Class I(1) | | | 23,627 | | | | 521,450 | | | | 47,049 | | | | 1,124,926 | |
| | | | 758,887 | | | | 17,037,564 | | | | 1,752,079 | | | | 41,066,624 | |
Shares redeemed: | | | | | | | | | | | | | | | | |
Class A | | | (761,153 | ) | | | (16,968,927 | ) | | | (1,628,870 | ) | | | (37,492,081 | ) |
Class B | | | (19,917 | ) | | | (435,589 | ) | | | (34,585 | ) | | | (774,881 | ) |
Class C | | | (41,837 | ) | | | (918,900 | ) | | | (137,168 | ) | | | (3,110,928 | ) |
Class R3(1) | | | (271,488 | ) | | | (6,192,305 | ) | | | (454,863 | ) | | | (10,396,502 | ) |
Class I(1) | | | (1,676,105 | ) | | | (38,108,069 | ) | | | (3,913,945 | ) | | | (94,065,258 | ) |
Class I(1) -In-Kind | | | — | | | | — | | | | (11,137,781 | ) | | | (261,914,439 | ) |
| | | | (2,770,500 | ) | | | (62,623,790 | ) | | | (17,307,212 | ) | | | (407,754,089 | ) |
Net increase (decrease) | | | (2,011,613 | ) | | $ | (45,586,226 | ) | | | (15,555,133 | ) | | $ | (366,687,465 | ) |
| |
| | | Small Cap Value | |
| | | Six Months Ended
4/30/12 | | | Year Ended
10/31/11 | |
| | | Shares | | | Amount | | | Shares | | | Amount | |
Shares sold: | | | | | | | | | | | | | | | | |
Class A | | | 132,819 | | | $ | 1,593,036 | | | | 410,931 | | | $ | 4,808,143 | |
Class C | | | 12,892 | | | | 139,481 | | | | 25,221 | | | | 264,358 | |
Class R3(1) | | | 27,627 | | | | 330,080 | | | | 60,254 | | | | 689,608 | |
Class I(1) | | | 807,824 | | | | 10,062,376 | | | | 1,124,872 | | | | 13,450,313 | |
Shares issued to shareholders due to reinvestment of distributions: | | | | | | | | | | | | | | | | |
Class A | | | — | | | | — | | | | — | | | | — | |
Class C | | | — | | | | — | | | | — | | | | — | |
Class R3(1) | | | — | | | | — | | | | — | | | | — | |
Class I(1) | | | — | | | | — | | | | — | | | | — | |
| | | | 981,162 | | | | 12,124,973 | | | | 1,621,278 | | | | 19,212,422 | |
Shares redeemed: | | | | | | | | | | | | | | | | |
Class A | | | (283,462 | ) | | | (3,430,357 | ) | | | (747,673 | ) | | | (8,799,625 | ) |
Class C | | | (17,525 | ) | | | (183,983 | ) | | | (77,338 | ) | | | (778,138 | ) |
Class R3(1) | | | (30,588 | ) | | | (375,412 | ) | | | (66,911 | ) | | | (777,156 | ) |
Class I(1) | | | (1,282,690 | ) | | | (16,232,429 | ) | | | (2,666,164 | ) | | | (33,926,233 | ) |
Class I(1)-In-Kind | | | — | | | | — | | | | (11,425,320 | ) | | | (127,930,138 | ) |
| | | | (1,614,265 | ) | | | (20,222,181 | ) | | | (14,983,406 | ) | | | (172,211,290 | ) |
Net increase (decrease) | | | (633,103 | ) | | $ | (8,097,208) | | | | (13,362,128 | ) | | $ | (152,998,868 | ) |
| (1) | Effective January 18, 2011, Class R Shares and Class Y Shares previously offered by FAF Advisors, Inc. were renamed Class R3 Shares and Class I Shares, respectively. |
Notes to Financial Statements (Unaudited) (continued)
Class B Shares that converted to Class A Shares (recognized as a component of Class A Shares sold and Class B Shares redeemed) during the six months ended April 30, 2012, and fiscal year ended October 31, 2011, were as follows:
| | | | | | | | |
| Fund | | Six Months Ended
4/30/12 | | | Year Ended
10/31/11 | |
Dividend Value | | | 89,478 | | | | 111,573 | |
Large Cap Value | | | 6,077 | | | | 23,298 | |
Mid Cap Value | | | 11,224 | | | | 18,251 | |
5. Investment Transactions
Purchases and sales (including maturities but excluding investments purchased with collateral from securities lending and short-term investments, where applicable) during the six months ended April 30, 2012, were as follows:
| | | | | | | | | | | | | | | | |
| | | Dividend
Value | | | Large Cap
Value | | | Mid Cap
Value | | | Small Cap
Value | |
Purchases | | $ | 147,342,690 | | | $ | 71,438,028 | | | $ | 166,988,372 | | | $ | 19,521,703 | |
Sales and maturities | | | 119,558,529 | | | | 90,359,545 | | | | 214,031,922 | | | | 25,439,417 | |
6. Income Tax Information
The following information is presented on an income tax basis. Differences between amounts for financial statement and federal income tax purposes are primarily due to timing differences in recognizing certain gains and losses on investment transactions. To the extent that differences arise that are permanent in nature, such amounts are reclassified within the capital accounts as detailed below. Temporary differences do not require reclassification. Temporary and permanent differences do not impact the net asset values of the Funds.
At April 30, 2012, the cost and unrealized appreciation (depreciation) of investments, as determined on a federal income tax basis, were as follows:
| | | | | | | | | | | | | | | | |
| | | Dividend
Value | | | Large Cap
Value | | | Mid Cap
Value | | | Small Cap
Value | |
Cost of investments | | $ | 1,052,045,057 | | | $ | 176,594,259 | | | $ | 247,954,373 | | | $ | 118,981,163 | |
Gross unrealized: | | | | | | | | | | | | | | | | |
Appreciation | | $ | 329,112,181 | | | $ | 14,396,573 | | | $ | 15,938,178 | | | $ | 14,297,660 | |
Depreciation | | | (6,322,512 | ) | | | (4,684,395 | ) | | | (3,333,222 | ) | | | (3,967,535 | ) |
Net unrealized appreciation (depreciation) of investments | | $ | 322,789,669 | | | $ | 9,712,178 | | | $ | 12,604,956 | | | $ | 10,330,125 | |
Permanent differences, primarily due to the redemption-in-kind, net operating losses, tax equalization, REIT adjustments, and investments in partnerships, resulted in reclassifications among the Funds’ components of net assets at October 31, 2011, the Funds’ last tax year end, as follows:
| | | | | | | | | | | | | | | | |
| | | Dividend
Value | | | Large Cap
Value | | | Mid Cap
Value | | | Small Cap
Value | |
Capital paid-in | | $ | 346,283 | | | $ | 15,381,988 | | | $ | 50,922,036 | | | $ | 27,173,948 | |
Undistributed (Over-distribution) of net investment income | | | (1,263,505 | ) | | | (43,799 | ) | | | (153,738 | ) | | | 290,800 | |
Accumulated net realized gain (loss) | | | 917,222 | | | | 15,338,189 | | | | (50,768,298 | ) | | | (27,464,748 | ) |
The tax components of undistributed net ordinary income and net long-term capital gains at October 31, 2011, the Funds’ last tax year end, were as follows:
| | | | | | | | | | | | | | | | |
| | | Dividend
Value | | | Large Cap
Value | | | Mid Cap
Value | | | Small Cap
Value | |
Undistributed net ordinary income* | | $ | 2,008,681 | | | $ | 880,660 | | | $ | 1,514,285 | | | $ | — | |
Undistributed net long-term capital gains | | | — | | | | — | | | | — | | | | — | |
| * | Net ordinary income consists of net taxable income derived from dividends, interest and net short-term capital gains, if any. |
The tax character of distributions paid during the Funds’ last tax year ended October 31, 2011, was designated for purposes of the dividends paid deduction as follows:
| | | | | | | | | | | | | | | | |
| | | Dividend
Value | | | Large Cap
Value | | | Mid Cap
Value | | | Small Cap
Value | |
Distributions from net ordinary income* | | $ | 23,121,220 | | | $ | 3,092,004 | | | $ | 3,983,550 | | | $ | — | |
Distributions from net long-term capital gains | | | — | | | | — | | | | — | | | | — | |
| * | Net ordinary income consists of net taxable income derived from dividends, interest, net short-term capital gains and current year earnings and profits attributable to realized gains, if any. |
At October 31, 2011, the Funds’ last tax year end, the Funds had unused capital loss carryforwards available for federal income tax purposes to be applied against future capital gains, if any. If not applied, the carryforwards will expire as follows:
| | | | | | | | | | | | | | | | |
| | | Dividend
Value | | | Large Cap
Value | | | Mid Cap
Value | | | Small Cap
Value | |
Expiration: | | | | | | | | | | | | | | | | |
October 31, 2016 | | $ | — | | | $ | 9,777,738 | | | $ | — | | | $ | 3,444,834 | |
October 31, 2017 | | | 1,440,955 | | | | 80,887,118 | | | | 64,990,706 | | | | 37,113,109 | |
Total | | $ | 1,440,955 | | | $ | 90,664,856 | | | $ | 64,990,706 | | | $ | 40,557,853 | |
During the Funds’ last tax year ended October 31, 2011, the Funds utilized their capital loss carryforwards as follows:
| | | | | | | | | | | | | | | | |
| | | Dividend
Value | | | Large Cap
Value | | | Mid Cap
Value | | | Small Cap
Value | |
Utilized capital loss carryforwards | | $ | 6,857,017 | | | $ | 19,152,964 | | | $ | 42,620,369 | | | $ | 10,362,493 | |
7. Management Fees and Other Transactions with Affiliates
Each Fund’s management fee consists of two components – a fund-level fee, based only on the amount of assets within each individual Fund, and a complex-level fee, based on the aggregate amount of all eligible fund assets managed by the Adviser. This pricing structure enables each Fund’s shareholders to benefit from growth in the assets within their respective Fund as well as from growth in the amount of complex-wide assets managed by the Adviser.
The annual fund-level fee for each Fund, payable monthly, is calculated according to the following schedule:
| | | | | | | | | | | | | | | | |
| Average Daily Net Assets | | Dividend
Value Fund-Level
Fee Rate | | | Large
Cap Value Fund-Level
Fee Rate | | | Mid Cap
Value Fund-Level
Fee Rate | | | Small
Cap Value Fund-Level
Fee Rate | |
For the first $125 million | | | .6000 | % | | | .5500 | % | | | .7000 | % | | | .7000 | % |
For the next $125 million | | | .5875 | | | | .5375 | | | | .6875 | | | | .6875 | |
For the next $250 million | | | .5750 | | | | .5250 | | | | .6750 | | | | .6750 | |
For the next $500 million | | | .5625 | | | | .5125 | | | | .6625 | | | | .6625 | |
For the next $1 billion | | | .5500 | | | | .5000 | | | | .6500 | | | | .6500 | |
For net assets over $2 billion | | | .5250 | | | | .4750 | | | | .6250 | | | | .6250 | |
The annual complex-level fee for each Fund, payable monthly, is determined by taking the complex-level free rate, which is based on the aggregate amount of “eligible assets” of all Nuveen funds as set forth in the schedule below, and making, as appropriate, an upward adjustment to that rate based upon the percentage of the particular fund’s assets that are not “eligible assets”. The complex-level fee schedule for each Fund is as follows:
| | | | |
| Complex-Level Asset Breakpoint Level* | | Effective Rate at Breakpoint Level | |
$55 billion | | | .2000 | % |
$56 billion | | | .1996 | |
$57 billion | | | .1989 | |
$60 billion | | | .1961 | |
$63 billion | | | .1931 | |
$66 billion | | | .1900 | |
$71 billion | | | .1851 | |
$76 billion | | | .1806 | |
$80 billion | | | .1773 | |
$91 billion | | | .1691 | |
$125 billion | | | .1599 | |
$200 billion | | | .1505 | |
$250 billion | | | .1469 | |
$300 billion | | | .1445 | |
| * | The complex-level fee is calculated based upon the aggregate daily “eligible assets” of all Nuveen Funds. Eligible assets do not include assets attributable to investments in other Nuveen Funds or assets in excess of $2 billion added to the Nuveen Fund complex in connection with the Adviser’s assumption of the management of the former First American Funds effective January 1, 2011. Eligible assets include closed-end fund assets managed by the Adviser that are attributable to financial leverage. For these purposes, financial leverage includes the closed-end funds’ use of preferred stock and borrowings and investments in the residual interest certificates (also called inverse floating rate securities) in tender option bond (TOB) trusts, including the portion of assets held by a TOB trust that has been effectively financed by the trust’s issuance of floating rate securities, subject to an agreement by the Adviser as to certain funds to limit the amount of such assets for determining eligible assets in certain circumstances. As of April 30, 2012, the complex-level fee rate for each of these Funds was as follows: |
| | | | |
| Fund | | Complex-Level Fee Rate | |
Dividend Value | | | .1922 | % |
Large Cap Value | | | .1998 | |
Mid Cap Value | | | .1998 | |
Small Cap Value | | | .1998 | |
Notes to Financial Statements (Unaudited) (continued)
The management fee compensates the Adviser for overall investment advisory and administrative services and general office facilities. The Adviser is responsible for each Fund’s overall strategy and asset allocation decisions. The Adviser has entered into sub-advisory agreements with the Sub-Adviser, under which the Sub-Adviser manages the investment portfolios of the Funds. The Sub-Adviser is compensated for its services to the Funds from the management fees paid to the Adviser.
The Adviser has agreed to waive fees and/or reimburse expenses of Mid Cap Value and Small Cap Value so that total annual Fund operating expenses, after fee waivers and/or expense reimbursements and excluding acquired Fund fees and expenses, do not exceed the percentages of the average daily net assets of any class of Fund shares in the amounts and for the time periods stated in the following table:
| | | | | | | | |
| | | Mid Cap
Value | | | Small Cap
Value | |
Class A Shares | | | 1.34 | % | | | 1.50 | % |
Class B Shares | | | 2.09 | | | | N/A | |
Class C Shares | | | 2.09 | | | | 2.25 | |
Class R3 Shares | | | 1.59 | | | | 1.75 | |
Class I Shares | | | 1.09 | | | | 1.25 | |
Expiration Date | | | February 28, 2013 | | | | February 28, 2013 | |
| N/A | Small Cap Value does not offer Class B Shares. |
The Adviser has agreed to reimburse management fees across all share classes of Dividend Value and Large Cap Value through December 31, 2012, to the extent necessary to maintain Class I Share total annual operating expenses, not including any acquired fund fees and expenses, at the applicable percentage of daily net assets listed in the Maximum Expense Level row of the following table, provided that in no event will the Adviser be required to make any reimbursements that would result in an annualized net management fee of less than the applicable percentage of daily net assets listed in the Minimum Management Fee row of the following table.
| | | | | | | | |
| | | Dividend
Value | | | Large Cap
Value | |
Maximum Expense Level | | | .95 | % | | | .78 | % |
Minimum Management Fee | | | 1.06 | | | | .74 | |
The Adviser may also voluntarily reimburse expenses from time to time in any of the Funds. Voluntary reimbursements may be terminated at any time at the Adviser’s discretion.
The Trust pays no compensation directly to those of its directors who are affiliated with the Adviser or to its officers, all of whom receive remuneration for their services to the Trust from the Adviser or its affiliates. The Board of Directors has adopted a deferred compensation plan for independent directors that enable directors to elect to defer receipt of all or a portion of the annual compensation they are entitled to receive from certain Nuveen-advised funds. Under the plan, deferred amounts are treated as though equal dollar amounts had been invested in shares of select Nuveen-advised funds.
During the six months ended April 30, 2012, Nuveen Securities, LLC (the “Distributor”), a wholly-owned subsidiary of Nuveen, collected sales charges on purchases of Class A Shares, the majority of which were paid out as concessions to financial intermediaries as follows:
| | | | | | | | | | | | | | | | |
| | | Dividend
Value | | | Large Cap
Value | | | Mid Cap
Value | | | Small Cap
Value | |
Sales charges collected | | $ | 180,806 | | | $ | 9,033 | | | $ | 9,286 | | | $ | 7,736 | |
Paid to financial intermediaries | | | 157,961 | | | | 7,875 | | | | 8,253 | | | | 6,735 | |
The Distributor also received 12b-1 service fees in Class A Shares, substantially all of which were paid to compensate financial intermediaries for providing services to shareholders relating to their investments.
During the six months ended April 30, 2012, the Distributor compensated financial intermediaries directly with commission advances at the time of purchase as follows:
| | | | | | | | | | | | | | | | |
| | | Dividend
Value | | | Large Cap
Value | | | Mid Cap
Value | | | Small Cap
Value | |
Commission advances | | $ | 51,647 | | | $ | 839 | | | $ | 1,400 | | | $ | 806 | |
To compensate for commissions advanced to financial intermediaries, all 12b-1 service and distribution fees collected on Class B Shares and C Shares during the first year following a purchase were retained by the Distributor. During the six months ended April 30, 2012, the Distributor retained such 12b-1 fees as follows:
| | | | | | | | | | | | | | | | |
| | | Dividend
Value | | | Large Cap
Value | | | Mid Cap
Value | | | Small Cap
Value | |
12b-1 fees retained | | $ | 37,396 | | | $ | 2,367 | | | $ | 8,729 | | | $ | 748 | |
The remaining 12b-1 fees charged to the Funds were paid to compensate financial intermediaries for providing services to shareholders relating to their investments.
The Distributor also collected and retained CDSC on share redemptions during the six months ended April 30, 2012, as follows:
| | | | | | | | | | | | | | | | |
| | | Dividend
Value | | | Large Cap
Value | | | Mid Cap
Value | | | Small Cap
Value | |
CDSC retained | | $ | 4,432 | | | $ | 171 | | | $ | 890 | | | $ | 93 | |
8. New Accounting Pronouncements
Fair Value Measurements and Disclosures
On May 12, 2011, the Financial Accounting Standards Board (“FASB”) issued Accounting Standards Update (“ASU”) No. 2011-04 (“ASU No. 2011-04”) modifying Topic 820, Fair Value Measurements and Disclosures. At the same time, the International Accounting Standards Board (“IASB”) issued International Financial Reporting Standard (“IFRS”) 13, Fair Value Measurement. The objective of the FASB and IASB is convergence of their guidance on fair value measurements and disclosures. Specifically, ASU No. 2011-04 requires reporting entities to disclose i) the amounts of any transfers between Level 1 and Level 2 and the reasons for the transfers and ii) for Level 3 fair value measurements, a) quantitative information about significant unobservable inputs used, b) a description of the valuation processes used by the reporting entity and c) a narrative description of the sensitivity of the fair value measurement to changes in unobservable inputs if a change in those inputs might result in a significantly higher or lower fair value measurement. The effective date of ASU No. 2011-04 is for interim and annual periods beginning after December 15, 2011. At this time, management is evaluating the implications of this guidance and the impact it will have to the financial statement amounts and footnote disclosures, if any.
9. Subsequent Events
Fund Reorganizations
The Board of Directors has approved the reorganization of Large Cap Value (the “Acquired Fund”) into Dividend Value (the “Acquiring Fund”). In order for the reorganization to occur, it must be approved by the shareholders of the Acquired Fund. A special meeting of the Acquired Fund’s shareholders for the purpose of voting on the reorganization is expected to be held in early October 2012. For the reorganizations, upon shareholder approval, the Acquired Fund will transfer all of its assets and liabilities to the Acquiring Fund in exchange for Acquiring Fund shares of equal value. These Acquiring Fund shares will then be distributed to the shareholders of the Acquired Fund and the Acquired Fund will be terminated. As a result of the reorganization, shareholders of the Acquired Fund will become shareholders of the Acquiring Fund. The shareholders of the Acquired Fund will receive Acquiring Fund shares with a total value equal to the total value of their Acquired Fund shares immediately prior to the closing of the reorganization. A special meeting of the Acquired Fund’s shareholders for the purpose of voting on the reorganization is expected to be held in early October 2012. If the required shareholder approvals are obtained on the meeting date, it is anticipated that the reorganization will be consummated shortly after its special shareholder meeting. Further information regarding the proposed reorganization of Large Cap Value will be contained in proxy materials that are expected to be sent to Large Cap Value’s shareholders in late August 2012.
Glossary of Terms Used in this Report
Average Annual Total Return: This is a commonly used method to express an investment’s performance over a particular, usually multi-year time period. It expresses the return that would have been necessary each year to equal the investment’s actual cumulative performance (including change in NAV or offer price and reinvested distributions and capital gains, if any) over the time period being considered.
Lipper Equity Income Funds Classification Average: Represents the average annualized total return for all reporting funds in the Lipper Equity Income Funds Classification. Lipper returns account for the effects of management fees and assume reinvestment of distributions but do not reflect any applicable sales charges.
Lipper Large-Cap Value Funds Classification Average: Represents the average annualized total return for all reporting funds in the Lipper Large-Cap Value Funds Classification. Lipper returns account for the effects of management fees and assume reinvestment of distributions but do not reflect any applicable sales charges.
Lipper Mid-Cap Value Funds Classification Average: Represents the average annualized total return for all reporting funds in the Lipper Mid-Cap Value Funds Classification. Lipper returns account for the effects of management fees and assume reinvestment of distributions but do not reflect any applicable sales charges.
Lipper Small-Cap Value Funds Classification Average: Represents the average annualized total return for all reporting funds in the Lipper Small-Cap Value Funds Classification. Lipper returns account for the effects of management fees and assume reinvestment of distributions but do not reflect any applicable sales charges.
Net Asset Value (NAV): The net market value of all securities held in a portfolio.
Net Asset Value (NAV) Per Share: The market value of one share of a mutual fund or closed-end fund. For a Fund, the NAV is calculated daily by taking the Fund’s total assets (securities, cash, and accrued earnings), subtracting the Fund’s liabilities, and dividing by the number of shares outstanding.
Russell 1000® Value Index: An index that measures the performance of those Russell 1000 companies with lower price-to-book ratios and lower forecasted growth values. The index returns assume reinvestment of distributions, but do not reflect any applicable sales charges or management fees.
Russell 2000® Value Index: An index that measures the performance of those Russell 2000 companies with lower price-to-book ratios and lower forecasted growth values. The index returns assume reinvestment of distributions, but do not reflect any applicable sales charges or management fees.
Russell Midcap® Value Index: An index that measures the performance of the mid-cap value segment of the U.S. equity universe. It includes those Russell Midcap Index companies with lower price-to-book ratios and lower forecasted growth values. The index returns assume reinvestment of distributions, but do not reflect any applicable sales charges or management fees.
S&P 500® Index: An unmanaged index generally considered representative of the U.S. stock market. The index returns assume reinvestment of distributions, but do not reflect any applicable sales charges or management fees.
Tax Equalization: The practice of treating a portion of the distribution made to a redeeming shareholder, which represents his proportionate part of undistributed net investment income and capital gain as a distribution for tax purposes. Such amounts are referred to as the equalization debits (or payments) and will be considered a distribution to the shareholder of net investment income and capital gain for calculation of the Fund’s dividends paid deduction.
Additional Fund Information
Fund Manager
Nuveen Fund Advisors, Inc.
333 West Wacker Drive
Chicago, IL 60606
Sub-Adviser
Nuveen Asset Management, LLC
333 West Wacker Drive
Chicago, IL 60606
Legal Counsel
Chapman and Cutler LLP
Chicago, IL
Independent Registered Public Accounting Firm*
PricewaterhouseCoopers LLP
Chicago, IL
Custodian
U.S. Bank National Association
St. Paul, MN
Transfer Agent and Shareholder Services
Boston Financial
Data Services, Inc.
Nuveen Investor Services
P.O. Box 8530
Boston, MA 02266-8530
(800) 257-8787
| * | | The Board of Directors of the Funds, upon recommendation of the Audit Committee, engaged PricewaterhouseCoopers LLP as the Funds’ independent registered public accounting firm as of March 1, 2011. On December 30, 2011, Ernst & Young, LLP (“Ernst & Young”) completed its work on the October 31, 2011 audits and resigned as the independent registered public accounting firm of the Funds. |
Ernst & Young’s report on the Funds’ financial statements for the most recent fiscal year contained no adverse opinion or disclaimer of opinion, and were not qualified or modified as to uncertainty, audit scope or accounting principles. For the most recent fiscal year and through March 1, 2011, there were no disagreements with Ernst & Young on any matter of accounting principles, financial statement disclosure or auditing scope or procedures, which disagreements, if not resolved to the satisfaction of Ernst & Young, would have caused it to make reference to the subject matter of the disagreements in connection with its reports on the Funds’ financial statements.
Quarterly Portfolio of Investments and Proxy Voting information: You may obtain (i) each Fund’s quarterly portfolio of investments, (ii) information regarding how each Fund voted proxies relating to portfolio securities held during the most recent twelve-month period ended June 30, and (iii) a description of the policies and procedures that each Fund used to determine how to vote proxies relating to portfolio securities without charge, upon request, by calling Nuveen Investments at (800) 257-8787 or on Nuveen’s website at www.nuveen.com.
You may also obtain this and other Fund information directly from the Securities and Exchange Commission (SEC). The SEC may charge a copying fee for this information. Visit the SEC on-line at http://www.sec.gov or in person at the SEC’s Public Reference Room in Washington, D.C. Call the SEC at (202) 942-8090 for room hours and operation. You may also request Fund information by sending an e-mail request to publicinfo@sec.gov or by writing to the SEC’s Public Reference Section at 100 F Street NE, Washington, D.C. 20549.
The Financial Industry Regulatory Authority (FINRA) provides a Public Disclosure Program which supplies certain information regarding the disciplinary history of FINRA members and their associated persons in response to either telephone inquiries at (800) 289-9999 or written inquiries at www.finra.org. FINRA also provides an investor brochure that includes information describing the Public Disclosure Program.
Nuveen Investments:
Serving Investors for Generations
Since 1898, financial advisors and their clients have relied on Nuveen Investments to provide dependable investment solutions through continued adherence to proven, long-term investing principles. Today, we offer a range of high quality equity and fixed-income solutions designed to be integral components of a well-diversified core portfolio.
Focused on meeting investor needs.
Nuveen Investments provides high-quality investment services designed to help secure the longterm goals of institutional and individual investors as well as the consultants and financial advisors who serve them. Nuveen Investments markets a wide range of specialized investment solutions which provide investors access to capabilities of its high-quality boutique investment affiliates-Nuveen Asset Management, Symphony Asset Management, NWQ Investment Management Company, Santa Barbara Asset Management, Tradewinds Global Investors, Winslow Capital Management, and Gresham Investment Management. In total, Nuveen Investments managed approximately $227 billion as of March 31, 2012.
Find out how we can help you.
To learn more about how the products and services of Nuveen Investments may be able to help you meet your financial goals, talk to your financial advisor, or call us at (800) 257-8787. Please read the information provided carefully before you invest. Investors should consider the investment objective and policies, risk considerations, charges and expenses of any investment carefully. Where applicable, be sure to obtain a prospectus, which contains this and other relevant information. To obtain a prospectus, please contact your securities representative or Nuveen Investments, 333 W. Wacker Dr., Chicago, IL 60606. Please read the prospectus carefully before you invest or send money.
Learn more about Nuveen Funds at: www.nuveen.com/mf
| | |
Distributed by Nuveen Securities, LLC 333 West Wacker Drive Chicago, IL 60606 www.nuveen.com | | |
MSA-FSTK-0412P
PART C
OTHER INFORMATION
Item 15. Indemnification.
The Registrant’s Amended and Restated Articles of Incorporation provide that each present or former director, officer, agent and employee of the Registrant or any predecessor or constituent corporation, and each person who, at the request of the Registrant, serves or served another business enterprise in any such capacity, and the heirs and personal representatives of each of the foregoing shall be indemnified by the Registrant to the fullest extent permitted by law against all expenses, including without limitation amounts of judgments, fines, amounts paid in settlement, attorneys’ and accountants’ fees, and costs of litigation, which shall necessarily or reasonably be incurred by him or her in connection with any action, suit or proceeding to which he or she was, is or shall be a party, or with which he or she may be threatened, by reason of his or her being or having been a director, officer, agent or employee of the Registrant or such predecessor or constituent corporation or such business enterprise, whether or not he or she continues to be such at the time of incurring such expenses. Such indemnification may include without limitation the purchase of insurance and advancement of any expenses, and the Registrant shall be empowered to enter into agreements to limit the liability of directors and officers of the Registrant. No indemnification shall be made in violation of the General Corporation Law of the State of Maryland or the Investment Company Act of 1940 (the “1940 Act”). The Registrant’s Amended and Restated Articles of Incorporation further provide that no director or officer of the Registrant shall be liable to the Registrant or its stockholders for money damages, except (i) to the extent that it is proved that such director or officer actually received an improper benefit or profit in money, property or services, for the amount of the benefit or profit in money, property or services actually received, or (ii) to the extent that a judgment or other final adjudication adverse to such director or officer is entered in a proceeding based on a finding in the proceeding that such director’s or officer’s action, or failure to act, was the result of active and deliberate dishonesty and was material to the cause of action adjudicated in the proceeding. The foregoing shall not be construed to protect or purport to protect any director or officer of the Registrant against any liability to the Registrant or its stockholders to which such director or officer would otherwise be subject by reason of willful misfeasance, bad faith, gross negligence or reckless disregard of the duties involved in the conduct of such office. The Registrant undertakes that no indemnification or advance will be made unless it is consistent with Sections 17(h) or 17(i) of the Investment Company Act of 1940, as now enacted or hereafter amended, and Securities and Exchange Commission rules, regulations, and releases (including, without limitation, Investment Company Act of 1940 Release No. 11330, September 2, 1980).
The trustees and officers of the Registrant are covered by Investment Trust Errors and Omission policies in the aggregate amount of $70,000,000 (with a $2,500,000 deductible for operational failures (after the deductible is satisfied, the insurer would cover 80% of any operational failure claims and the Fund would be liable for 20% of any such claims) and $1,000,000 for all other claims) against liability and expenses of claims of wrongful acts arising out of their position with the Registrant, except for matters which involved willful acts, bad faith, gross negligence and willful disregard of duty (i.e., where the insured did not act in good faith for a purpose he or she reasonably believed to be in the best interest of Registrant or where he or she shall have had reasonable cause to believe this conduct was unlawful).
Insofar as the indemnification for liabilities arising under the Securities Act of 1933, as amended, (the “1933 Act”) may be permitted to the officers, directors or controlling persons of the
C-1
Registrant pursuant to the foregoing provisions, or otherwise, the Registrant has been advised that in the opinion of the Securities and Exchange Commission such indemnification is against public policy as expressed in the 1933 Act and is, therefore, unenforceable. In the event that a claim for indemnification against such liabilities (other than the payment by the Registrant of expenses incurred or paid by an officer or director or controlling person of the Registrant in the successful defense of any action, suit or proceeding) is asserted by such officer, director or controlling person in connection with the securities being registered, the Registrant will, unless in the opinion of its counsel the matter has been settled by controlling precedent, submit to a court of appropriate jurisdiction the question of whether such indemnification by it is against public policy as expressed in the 1933 Act and will be governed by the final adjudication of such issue.
Item 16. Exhibits
| | |
| |
| (1)(a) | | Registrant’s Amended and Restated Articles of Incorporation. (1) |
| |
| (1)(b) | | Registrant’s Articles Supplementary, designating new series and new share classes. (2) |
| |
| (1)(c) | | Registrant’s Articles Supplementary, designating new series and new share classes. (3) |
| |
| (1)(d) | | Registrant’s Articles Supplementary designating new series. (4) |
| |
| (1)(e) | | Registrant’s Articles Supplementary designating new series. (5) |
| |
| (1)(f) | | Registrant’s Articles Supplementary designating new series. (6) |
| |
| (1)(g) | | Registrant’s Articles Supplementary decreasing authorizations of specified classes and series and decreasing total authorized shares. (7) |
| |
| (1)(h) | | Registrant’s Articles Supplementary designating new series. (8) |
| |
| (1)(i) | | Registrant’s Articles Supplementary designating new series. (10) |
| |
| (1)(j) | | Registrant’s Articles Supplementary designating new series. (11) |
| |
| (1)(k) | | Registrant’s Articles Supplementary designating new series. (12) |
| |
| (1)(l) | | Registrant’s Articles Supplementary designating new share classes. (13) |
| |
| (1)(m) | | Registrant’s Articles of Amendment, filed January 9, 2009. (14) |
| |
| (1)(n) | | Registrant’s Articles of Amendment, filed June 4, 2009. (15) |
| |
| (1)(o) | | Registrant’s Articles Supplementary designating new series and new share classes, filed June 23, 2009. (15) |
| |
| (1)(p) | | Registrant’s Articles Supplementary designating new series and new share class, filed September 17, 2009. (16) |
| |
| (1)(q) | | Registrant’s Articles of Amendment, filed January 22, 2010. (17) |
| |
| (1)(r) | | Registrant’s Articles Supplementary providing name changes and names of new classes and series, filed October 27, 2010. (19) |
C-2
| | |
| |
| (1)(s) | | Registrant’s Articles of Amendment providing name change, filed March 29, 2011. (22) |
| |
| (1)(t) | | Registrant’s Articles Supplementary designating new series, filed July 14, 2011. (23) |
| |
| (2) | | Registrant’s By-laws, as amended. (25) |
| |
| (3) | | Not Applicable. |
| |
| (4) | | Form of Agreement and Plan of Reorganization is filed herewith as Appendix I to Part A of this Registration Statement. |
| |
| (5) | | Not Applicable. |
| |
| (6)(a) | | Management Agreement between the Registrant and Nuveen Fund Advisors, Inc., dated January 1, 2011. (21) |
| |
| (6)(b) | | Amended Schedules A and B of Management Agreement between Registrant and Nuveen Fund Advisors, Inc., dated September 8, 2011. (24) |
| |
| (6)(c) | | Investment Sub-Advisory Agreement by and between Nuveen Fund Advisors, Inc. and Nuveen Asset Management, LLC. (21) |
| |
| (6)(d) | | Amended Schedule A of Investment Sub-Advisory Agreement by and between Nuveen Fund Advisors, Inc. and Nuveen Asset Management, LLC. (24) |
| |
| (7) | | Distribution Agreement between Registrant and Nuveen Asset Management, LLC, dated January 1, 2011. (21) |
| |
| (8) | | Not Applicable. |
| |
| (9)(a) | | Custody Agreement between Registrant and U.S. Bank National Association, dated January 1, 2006. (9) |
| |
| (9)(b) | | Amendment to Custody Agreement between Registrant and U.S. Bank National Association, dated July 1, 2007. (11) |
| |
| (9)(c) | | Exhibit C effective September 16, 2009, to Custody Agreement, dated July 1, 2006. (16) |
| |
| (9)(d) | | Exhibit D effective December 5, 2007, to Custody Agreement, dated July 1, 2006. (12) |
| |
| (9)(e) | | Amendment to Custodian Agreement between Registrant and State Street Bank and Trust Company with respect to compensation, dated June 19, 2008. (14) |
| |
| (10)(a) | | Amended and Restated Distribution and Service Plan, effective January 17, 2011. (21) |
| |
| (10)(b) | | Amended and Restated Multiple Class Plan Pursuant to Rule 18f-3, effective July 1, 2010. (18) |
C-3
| | |
| |
| (11) | | Opinion and Consent of Dorsey & Whitney LLP is filed herewith. |
| |
| (12) | | Form of Opinion and Consent of Vedder Price P.C. supporting the tax matters and consequences to shareholders discussed in the Proxy Statement/Prospectus is filed herewith. |
| |
| (13)(a) | | Transfer Agent and Shareholder Servicing Agreement among Registrant, U.S. Bancorp Fund Services, LLC, and FAF Advisors, Inc., dated September 19, 2006. (11) |
| |
| (13)(b) | | Exhibit A to Transfer Agent and Shareholder Servicing Agreement, effective July 1, 2010. (18) |
| |
| (13)(c) | | Amendment to Transfer Agent and Shareholding Servicing Agreement, dated January 1, 2011. (21) |
| |
| (13)(d) | | Amended and Restated Securities Lending Agreement between Registrant and U.S. Bank National Association, dated December 30, 2010. (20) |
| |
| (13)(e) | | Fund Accounting Servicing Agreement between Registrant and U.S. Bancorp Fund Services, LLC, dated January 1, 2011. (21) |
| |
| (14) | | Consent of Independent Auditor is filed herewith. |
| |
| (15) | | Not Applicable. |
| |
| (16) | | Powers of Attorney are filed herewith. |
| |
| (17) | | Form of Proxy is filed herein and appears following the Proxy Statement/Prospectus included in this registration Statement. |
| (1) | Incorporated by reference to the post-effective amendment no. 21 filed on Form N-1A for Registrant. |
| (2) | Incorporated by reference to the post-effective amendment no. 36 filed on Form N-1A for Registrant. |
| (3) | Incorporated by reference to the post-effective amendment no. 54 filed on Form N-1A for Registrant. |
| (4) | Incorporated by reference to the post-effective amendment no. 61 filed on Form N-1A for Registrant. |
| (5) | Incorporated by reference to the post-effective amendment no. 65 filed on Form N-1A for Registrant. |
| (6) | Incorporated by reference to the post-effective amendment no. 66 filed on Form N-1A for Registrant. |
| (7) | Incorporated by reference to the post-effective amendment no. 70 filed on Form N-1A for Registrant. |
| (8) | Incorporated by reference to the post-effective amendment no. 72 filed on Form N-1A for Registrant. |
| (9) | Incorporated by reference to the post-effective amendment no. 80 filed on Form N-1A for Registrant. |
| (10) | Incorporated by reference to the post-effective amendment no. 84 filed on Form N-1A for Registrant. |
| (11) | Incorporated by reference to the post-effective amendment no. 87 filed on Form N-1A for Registrant. |
| (12) | Incorporated by reference to the post-effective amendment no. 90 filed on Form N-1A for Registrant. |
| (13) | Incorporated by reference to the post-effective amendment no. 93 filed on Form N-1A for Registrant. |
| (14) | Incorporated by reference to the post-effective amendment no. 95 filed on Form N-1A for Registrant. |
| (15) | Incorporated by reference to the post-effective amendment no. 98 filed on Form N-1A for Registrant. |
| (16) | Incorporated by reference to the post-effective amendment no. 101 filed on Form N-1A for Registrant. |
| (17) | Incorporated by reference to the post-effective amendment no. 102 filed on Form N-1A for Registrant. |
| (18) | Incorporated by reference to the post-effective amendment no. 103 filed on Form N-1A for Registrant. |
| (19) | Incorporated by reference to the post-effective amendment no. 105 filed on Form N-1A for Registrant. |
C-4
| (20) | Incorporated by reference to the post-effective amendment no. 107 filed on Form N-1A for Registrant. |
| (21) | Incorporated by reference to the post-effective amendment no. 109 filed on Form N-1A for Registrant. |
| (22) | Incorporated by reference to the post-effective amendment no. 113 filed on Form N-1A for Registrant. |
| (23) | Incorporated by reference to the post-effective amendment no. 118 filed on Form N-1A for Registrant. |
| (24) | Incorporated by reference to the post-effective amendment no. 119 filed on Form N-1A for Registrant. |
| (25) | Incorporated by reference to the post-effective amendment no. 126 filed on Form N-1A for Registrant. |
Item 17. Undertakings.
(1) The undersigned Registrant agrees that prior to any public reoffering of the securities registered through the use of a prospectus which is a part of this registration statement by any person or party who is deemed to be an underwriter within the meaning of Rule 145(c) of the 1933 Act, the reoffering prospectus will contain the information called for by the applicable registration form for reofferings by persons who may be deemed underwriters, in addition to the information called for by the other items of the applicable form.
(2) The undersigned Registrant agrees that every prospectus that is filed under paragraph (1) above will be filed as a part of an amendment to the registration statement and will not be used until the amendment is effective, and that, in determining any liability under the 1933 Act, each post-effective amendment shall be deemed to be a new registration statement for the securities offered therein, and the offering of the securities at that time shall be deemed to be the initial bona fide offering of them.
C-5
SIGNATURES
As required by the Securities Act of 1933, this registration statement has been signed on behalf of the registrant, in the City of Chicago, the State of Illinois, on the 23rd day of July, 2012.
| | |
| | NUVEEN INVESTMENT FUNDS, INC. |
| |
| By: | | /s/ Kathleen L. Prudhomme |
| | Kathleen L. Prudhomme |
| | Vice President and Assistant Secretary |
As required by the Securities Act of 1933, this registration statement has been signed by the following persons in the capacities and on the dates indicated:
| | | | | | |
Signature | | Capacity | | | | Date |
| | | |
/s/ Stephen D. Foy Stephen D. Foy | | Vice President and Controller
(principal financial and accounting) | | | | July 23, 2012 |
| | | |
/s/ Gifford R. Zimmerman Gifford R. Zimmerman | | Chief Administrative Officer
(principal executive officer) | | | | July 23, 2012 |
| | | |
/s/ John P. Amboian John P. Amboian | | Director | | | | July 23, 2012 |
Robert P. Bremner* | | Chairman of the Board and Director | | ) ) | | |
| | | | ) | | |
| | | | ) | | |
Jack B. Evans* | | Director | | ) ) | | |
| | | | ) | | |
William C. Hunter* | | Director | | ) ) | | By: /s/ Kathleen L. Prudhomme Kathleen L. Prudhomme
Attorney-in-Fact
July 23, 2012 |
| | | | ) | |
David J. Kundert* | | Director | | ) ) | |
| | | | ) | | |
William J. Schneider* | | Director | | ) ) | | |
| | | | ) | | |
Judith M. Stockdale* | | Director | | ) ) | | |
| | | | ) | | |
Carole E. Stone* | | Director | | ) ) | | |
| | | | ) | | |
| | | | | | |
Signature | | Capacity | | | | Date |
Virginia L. Stringer* | | Director | | ) ) | | |
| | | | ) | | |
Terence J. Toth* | | Director | | ) ) | | |
| * | An original power of attorney authorizing, among others, Kevin J. McCarthy, Kathleen L. Prudhomme, and Gifford R. Zimmerman, to execute this registration statement, and amendments thereto, for each of the directors of the Registrant on whose behalf this registration statement is filed, has been executed and is filed herewith as exhibit 16. |
EXHIBIT INDEX
| | |
Exhibit No. | | Name of Exhibit |
| |
| (11) | | Opinion and Consent of Counsel |
| |
| (12) | | Form of Opinion and Consent of Tax Counsel Supporting Tax Matters |
| |
| (14) | | Consent of Independent Auditor |
| |
| (16) | | Powers of Attorney |