UNITED STATES
SECURITIES AND EXCHANGE COMMISSION
Washington, D.C. 20549
FORM N-CSR
CERTIFIED SHAREHOLDER REPORT OF REGISTERED MANAGEMENT
INVESTMENT COMPANIES
Investment Company Act file number 811-05309
Nuveen Investment Funds, Inc.
(Exact name of registrant as specified in charter)
Nuveen Investments
333 West Wacker Drive, Chicago, IL 60606
(Address of principal executive offices) (Zip code)
Kevin J. McCarthy
Nuveen Investments
333 West Wacker Drive, Chicago, IL 60606
(Name and address of agent for service)
Registrant’s telephone number, including area code: (312) 917-7700
Date of fiscal year end: May 31
Date of reporting period: November 30, 2012
Form N-CSR is to be used by management investment companies to file reports with the Commission not later than 10 days after the transmission to stockholders of any report that is required to be transmitted to stockholders under Rule 30e-1 under the Investment Company Act of 1940 (17 CFR 270.30e-1). The Commission may use the information provided on Form N-CSR in its regulatory, disclosure review, inspection, and policy making roles.
A registrant is required to disclose the information specified by Form N-CSR, and the Commission will make this information public. A registrant is not required to respond to the collection of information contained in Form N-CSR unless the Form displays a currently valid Office of Management and Budget (“OMB”) control number. Please direct comments concerning the accuracy of the information collection burden estimate and any suggestions for reducing the burden to Secretary, Securities and Exchange Commission, 450 Fifth Street, NW, Washington, DC 20549-0609. The OMB has reviewed this collection of information under the clearance requirements of 44 U.S.C. ss.3507.
Item 1. Reports to Stockholders.

Mutual Funds
Nuveen Municipal Bond Funds
Dependable, tax-free income because it’s not what you earn, it’s what you keep.®
Semi-Annual Report
November 30, 2012
| Share Class / Ticker Symbol | ||||||||
| Fund Name | Class A | Class C | Class C1 | Class I | ||||
Nuveen Minnesota Intermediate Municipal Bond Fund | FAMAX | NIBMX | FACMX | FAMTX | ||||
Nuveen Minnesota Municipal Bond Fund | FJMNX | NMBCX | FCMNX | FYMNX | ||||
Nuveen Nebraska Municipal Bond Fund | FNTAX | NCNBX | FNTCX | FNTYX | ||||
Nuveen Oregon Intermediate Municipal Bond Fund | FOTAX | NIMOX | — | FORCX | ||||
LIFE IS COMPLEX.
Nuveen makes things e-simple.
It only takes a minute to sign up for e-Reports. Once enrolled, you’ll receive an e-mail as soon as your Nuveen Fund information is ready. No more waiting for delivery by regular mail. Just click on the link within the e-mail to see the report and save it on your computer if you wish.
Free e-Reports right to your e-mail!
www.investordelivery.com
If you receive your Nuveen Fund distributions and statements from your financial advisor or brokerage account.
OR
www.nuveen.com/accountaccess
If you receive your Nuveen Fund distributions and statements directly from Nuveen.
| Must be preceded by or accompanied by a prospectus. | NOT FDIC INSURED | MAY LOSE VALUE | NO BANK GUARANTEE |
| 4 | ||||
| 5 | ||||
| 11 | ||||
| 16 | ||||
| 17 | ||||
| 19 | ||||
| 21 | ||||
| 52 | ||||
| 53 | ||||
| 54 | ||||
| 56 | ||||
| 64 | ||||
| 74 | ||||
| 75 | ||||
Letter to Shareholders

Dear Shareholders,
Despite the global economy’s ability to muddle through the many economic headwinds of 2012, investors continue to have good reasons to remain cautious. The European Central Bank’s decisions to extend intermediate term financing to major European banks and to support sovereign debt markets have begun to show signs of a stabilized euro area financial market. The larger member states of the European Union (EU) are working diligently to strengthen the framework for a tighter financial and banking union and meaningful progress has been made by agreeing to centralize large bank regulation under the European Central Bank. However, economic conditions in the southern tier members are not improving and the pressures on their political leadership remain intense. The jury is out on whether the respective populations will support the continuing austerity measures that are needed to meet the EU fiscal targets.
In the U.S., the Fed remains committed to low interest rates into 2015 through its third program of Quantitative Easing (QE3). Inflation remains low but a growing number of economists are expressing concern about the economic distortions resulting from negative real interest rates. The highly partisan atmosphere in Congress led to a disappointingly modest solution for dealing with the end-of-year tax and spending issues. Early indications for the new Congressional term have not given much encouragement that the atmosphere for dealing with the sequestration legislation and the debt ceiling issues, let alone a more encompassing “grand bargain,” will be any better than the last Congress. Over the longer term, there are some encouraging trends for the U.S. economy: house prices are beginning to recover, banks and corporations continue to strengthen their financial positions and incentives for capital investment in the U.S. by domestic and foreign corporations are increasing due to more competitive energy and labor costs.
During 2012 U.S. investors have benefited from strong returns in the domestic equity markets and solid returns in most fixed income markets. However, many of the macroeconomic risks of 2012 remain unresolved, including negotiating through the many U.S. fiscal issues, managing the risks of another year of abnormally low U.S. interest rates, sustaining the progress being made in the euro area and reducing the potential economic impact of geopolitical issues, particularly in the Middle East. In the face of these uncertainties, the experienced investment professionals at Nuveen Investments seek out investments that are enjoying positive economic conditions. At the same time they are always on the alert for risks in markets subject to excessive optimism or for opportunities in markets experiencing undue pessimism. Monitoring this process is a critical function for the Fund Board as it oversees your Nuveen Fund on your behalf.
As always, I encourage you to communicate with your financial consultant if you have any questions about your investment in a Nuveen Fund. On behalf of the other members of your Fund Board, we look forward to continuing to earn your trust in the months and years ahead.
Sincerely,

Robert P. Bremner
Chairman of the Board
January 22, 2013
| 4 | Nuveen Investments |
Certain statements in this report are forward-looking statements. Discussions of specific investments are for illustration only and are not intended as recommendations of individual investments. The forward-looking statements and other views expressed herein are those of the portfolio managers as of the date of this report. Actual future results or occurrences may differ significantly from those anticipated in any forward-looking statements, and the views expressed herein are subject to change at any time, due to numerous market and other factors. The Funds disclaim any obligation to update publicly or revise any forward-looking statements or views expressed herein.
Ratings shown are the highest rating given by one of the following national rating agencies: Standard & Poor’s Group, Moody’s Investors Service, Inc. or Fitch, Inc. Credit ratings are subject to change. AAA, AA, A, and BBB are investment grade ratings; BB, B, CCC, CC, C and D are below-investment grade ratings. Certain bonds backed by U.S. Government or agency securities are regarded as having an implied rating equal to the rating of such securities. Holdings designated N/R are not rated by these national rating agencies.
Portfolio managers Christopher Drahn, CFA, Michael Hamilton and Douglas White, CFA, review key investment strategies and the Funds’ performance during the six months ending November 30, 2012. Chris has managed the Nuveen Minnesota Intermediate Municipal Bond Fund since 1994, Doug has managed the Nuveen Minnesota Municipal Bond Fund since 1988 and the Nuveen Nebraska Municipal Bond Fund since 2011 and Michael has managed the Nuveen Oregon Intermediate Municipal Bond Fund since 1997.
How did the Funds perform during the six-month period ending November 30, 2012?
The tables in the Fund Performance and Expense Ratios section of this report provide Class A Share total returns for the Funds for the six-month, one-year, five-year and ten-year periods ending November 30, 2012. The tables also compare these returns to each Fund’s benchmark index and its appropriate Lipper classification average.
During the past six months, the Class A Shares at net asset value (NAV) of the Nuveen Minnesota Intermediate Municipal Bond Fund lagged the S&P Municipal Bond Intermediate Index and performed in line with the Barclays 1–15 Year Blend Municipal Bond Index, while outperforming the Lipper Other States Intermediate Municipal Debt Funds Classification Average. The Class A Shares at NAV of the Nuveen Oregon Intermediate Municipal Bond Fund trailed all three of these performance measures. Please note that both Funds’ primary index was changed. Previously, the Funds used the Barclays 1-15 Year Blend Municipal Bond Index as their primary benchmark. The Funds are now compared to the S&P Municipal Bond Intermediate Index because it more closely reflects the Funds’ investment universe. There have been no changes to the way the Funds are managed.
Meanwhile, both the Nuveen Minnesota Municipal Bond Fund and Nuveen Nebraska Municipal Bond Fund outperformed S&P Municipal Bond Index, the Barclays Municipal Bond Index, as well as their respective Lipper classification averages, the Lipper Minnesota Municipal Debt Funds Classification Average and the Lipper Other States Municipal Debt Funds Classification Average. Please note that both Funds’ primary index have also changed. Previously, the Funds used the Barclays Municipal Bond Index as their national benchmark. The Funds are now compared to the S&P Municipal Bond Index because it more closely reflects the Funds’ investment universe. There have been no changes to the way the Funds are managed.
What strategies were used to manage the Funds during the reporting period? How did these strategies influence performance?
All of the Funds continued to employ the same fundamental investment strategies and tactics long relied upon by Nuveen Asset Management. Our municipal bond portfolios
| Nuveen Investments | 5 |
are managed with a value oriented approach and close input from Nuveen Asset Management’s research team. Below we highlight the specific factors influencing each Fund’s investment strategy, as well as how we managed each portfolio in light of recent market conditions.
Nuveen Minnesota Intermediate Municipal Bond Fund
During the reporting period, the Nuveen Minnesota Intermediate Municipal Bond Fund underperformed the S&P Municipal Bond Intermediate Index. The pursuit of yield in this historically low interest rate environment prompted many investors to take on the credit risk of lower quality bonds in exchange for their higher rates of income, which in turn lifted lower rated bonds’ prices relative to higher-grade. The portfolio’s underweighting in the market’s highest quality bonds, consisting of issues with credit ratings of AAA and AA, along with its slight overweight in A-rated, BBB-rated and non-rated bonds, added to the Fund’s performance. This preference worked against the market sectors that typically feature many high quality securities and thus had a somewhat positive impact on performance since the Fund was overweight in lower investment grade holdings.
For example, the Fund was overweight in two sectors that tend to offer a high volume of lower investment-grade rated, higher yielding issuance, health care and higher education, which made a small contribution. Conversely, the Fund was hampered by being underweight in corporate-backed industrial development revenue bonds, another category featuring many lower rated securities. The portfolio was also hindered by its allocation to pre-refunded bonds, which trailed the overall bond market owing to the securities’ very short maturities and high credit quality.
One positive factor contributing to the Fund’s results was the beneficial duration positioning, meaning the Fund was more sensitive than the benchmark to the helpful effects of falling interest rates. Relative to the Index, the Fund had slightly more exposure to bonds with longer intermediate maturities, as well as a modestly smaller allocation to the shorter intermediate part of the curve. Both stances were advantageous, as longer bonds generally outperformed shorter issues during the period. Tempering the Fund’s duration related outperformance, however, was a small overweighting in the shortest dated securities with maturities of two years and less, whose performance was especially subdued.
To finance our purchases for the Fund during the six-month reporting period, we primarily used the proceeds of bond calls and maturities, as well as new investment inflows from shareholders, and so there was very little need to sell securities. Our purchases generally took place in the primary (new-issue) municipal bond market, while the secondary market afforded opportunities to make smaller purchases, often adding to our positions of bonds already owned in the portfolio.
A number of our new purchases were general obligation (GO) bonds. Because of some unique characteristics of the Minnesota tax-exempt bond market, it is relatively straightforward to issue GO debt in this state, sometimes resulting in a healthy supply of these types of securities. In fact, we found a number of GO bonds offering what we saw as good value, especially in the intermediate portion of the yield curve. One notable series of GO purchases involved securities issued by Moorhead, Minnesota, with maturity
| 6 | Nuveen Investments |
dates ranging from 2021 to 2025 and a Moody’s credit rating of Aa3. In addition, we bought a variety of AA-rated school-district GO bonds.
Other bond purchases during the period included issues that fund senior housing, higher education and electric utility projects, as well as a Minneapolis/St. Paul Metropolitan Airport bond deal. Notwithstanding the above, demand was very strong for Minnesota tax-exempt debt throughout the period, making investment at consistently advantageous prices difficult. Of final note, it became clear in November that a large Minnesota tobacco-securitization bond deal issued in 2011 would be called on December 1, 2012, the day after the close of the reporting period. The bonds were strong performers for the Fund over the life of the issue.
Nuveen Minnesota Municipal Bond Fund
Favorable duration positioning helped the Nuveen Minnesota Municipal Bond Fund outperform the S&P Municipal Bond Index. The Fund’s longer duration increased its sensitivity to interest rate changes, which had a positive influence on relative performance as interest rates fell during the period. With rates on longer bonds falling to a greater extent than rates on shorter bonds, the Fund was well situated, with longer dated securities being overweight. At the same time, the Fund’s more limited exposure to shorter maturity debt also contributed to good results on a relative basis.
To a lesser degree, advantageous credit quality positioning added to the Fund’s performance compared to the index. Due to investors’ desire for income in an environment of low yields, lower rated, higher income producing bonds tended to outperform their higher rated, lower coupon counterparts. Accordingly, the Fund’s elevated exposure to A-rated, BBB-rated and non-rated issues was helpful for results, as was our continued underweighting in the market’s highest rated securities — those with credit ratings of AAA and AA.
The Fund benefited from its greater exposure to several sectors that did well during the six-month period. Specifically, health care was overweight in the Fund and many of the portfolio’s individual positions generated especially good results. Also, the Fund was helped by its sole position in the tobacco sector, a sizeable allocation to Minnesota tobacco bond issues that we purchased in 2011. Because of the securities’ relatively short call date, they featured a very attractive call price to compensate investors for the risk that the bonds could be called. In fact, the issuer recently announced the bonds would be called on December 1, 2012 and, as a result, these securities were significant contributors to the Fund’s performance during the period.
In addition, the Fund was helped by being underweight in two groups that lagged the market as a result of their generally higher credit quality, state and local GO bonds and pre-refunded bonds, the latter of which tend to be among the market’s highest quality and shortest duration securities. Having these characteristics weighed on their results, as market conditions tended to favor bonds displaying the opposite qualities. On the other hand, one area of the market that had a negative impact on relative performance was being overweight in public power bonds, a sector that trailed the index.
Amid improved supply in the tax-exempt Minnesota bond market, we had relatively more choices of new bonds to add to the portfolio, given the healthy amount of new shareholder cash coming into the Fund that required investment. These inflows, along with the proceeds of bond calls and maturities, financed our purchases throughout the period.
| Nuveen Investments | 7 |
Because the Fund was already overweight in the sectors that we found most attractive, we were able to diversify new portfolio additions across multiple sectors and maturity ranges. The vast majority of our new bond purchases for the Fund had maturities ranging from eight to thirty years and took place across a wide variety of revenue bond sectors, including education, corporate backed, life care and airports. We also added to the Fund’s GO debt allocation. As a result of these purchases, the Fund’s allocation to BBB-rated debt rose modestly, as did the portfolio’s AAA-rated bond exposure, while the percentage of the Fund’s AA-rated bond positions rose somewhat more and A-rated bond positions slightly declined.
Nuveen Nebraska Municipal Bond Fund
The Nuveen Nebraska Municipal Bond Fund outperformed the S&P Municipal Bond Index, in part because of helpful duration and yield curve positioning. Specifically, the portfolio’s increased allocation to bonds on the long end of the curve proved beneficial, given that longer bonds gained from declining interest rates more notably than shorter bonds. The Fund began the period with a longer duration than the benchmark, but that gap narrowed as the period progressed, although the Fund still finished the six-month time frame with more interest rate sensitivity than the index.
To a lesser degree, the Fund’s credit quality breakdown was another positive performance factor. In relation to the index, the Fund benefited from having more exposure to bonds rated A, the top performing credit quality segment of the investment-grade bond universe during the period and having a lower relative allocation to AAA-rated bonds, which did not appreciate as much as lower rated issues did.
Meanwhile, the Fund’s sector positioning had a mixed impact on performance. The Fund benefited by being overweight in the education and health care sectors, while good performance from the individual bonds we chose within those groups further added to results. Favorable security selection within the electric utility category also contributed positively. Among the Fund’s holdings in GO bonds, a relative underweighting to state GO issues proved effective, but our underweighting in local GO bonds had a negative impact, as many of these securities had lower credit ratings and therefore gained from investors’ desire to take on more credit risk in exchange for higher income. The Fund was overweight in the housing bond sector which proved a detriment to performance. Housing bonds often underperform during falling interest rate environments because lower rates increase the risk of mortgage prepayments.
We saw a substantial level of new shareholder cash coming into the portfolio, which meant that one of our primary tasks during the reporting period was to keep the Fund fully invested. We did not need to sell securities to accomplish our purchasing objectives, instead utilizing these shareholder inflows, as well as proceeds from bond calls and maturities.
Although we were successful in adding new bonds, the Nebraska municipal bond market is relatively small, so our purchases tended to reflect what securities were available at those times. During the period, our purchases increased the Fund’s exposure to the public power, higher education and hospital bond sectors, all of which were overweight in the Fund to various degrees at the end of the period. As a result of our purchases, the
| 8 | Nuveen Investments |
Fund’s allocation to A-rated and AA-rated bonds rose modestly, while its AAA weighting decreased modestly and its BBB and non-rated exposure remained essentially unchanged.
Nuveen Oregon Intermediate Municipal Bond Fund
During the six-month reporting period, the Nuveen Oregon Intermediate Municipal Bond Fund lagged the S&P Municipal Bond Intermediate Index. Sector positioning was a key factor behind the Fund’s underperformance. Specifically, the Fund was overweight in local GO bonds, which trailed the index because many of these issues had relatively high credit ratings and were unattractive to investors seeking lower rated, higher yielding investments. While overweight Oregon health care bonds, a sector that performed well throughout the period, the health care credits held in the Fund did not participate fully in the price appreciation, hampering results from this sector. Many of the health care credits held in the Fund had shorter calls, thus, a shorter duration. An overweighting in higher education bonds added to performance on a relative basis. Among utilities, the Fund was hurt by a position in Puerto Rico Electric Power Authority revenue bonds, which underperformed when evidence of weakness in Puerto Rico’s financial condition emerged, causing the bonds to lose some of their value.
On the positive side, the Fund slightly benefited from its duration positioning, meaning its sensitivity to movements in interest rates. As the yield curve flattened, indicating that rates on longer bonds dropped to a greater extent than rates on shorter bonds, it was helpful to have more exposure to securities with longer durations within the intermediate universe we focus on in this portfolio. As a result, the Fund’s increased allocation to bonds with durations of eight years and longer provided a small but effective impact on relative performance. At the same time, however, the Fund was overweight in the market’s shortest maturity bonds, those with durations of two years and less and this was an offsetting negative. As mentioned earlier, lower rated bonds outperformed higher rated bonds during the period as investors sought the higher income; thus an underweighting to bonds rated AA was beneficial to the portfolio. While slightly underweight A-rated securities, the duration of the bonds held was longer than the index, thus, the Fund benefited.
Throughout the period, as new cash came into the portfolio from the proceeds of bond calls, bond maturities and new shareholder investments, we focused on purchasing bonds that we believed provided good value for our investors while supporting our management objectives. Bond supply in Oregon was relatively limited, so new purchases reflected the best available opportunities when we had funds to invest. We targeted bonds with credit ratings of A and maturities of 8 to 12 years, representing the portion of the yield curve where we believed the risk/reward trade-off was most favorable. During the period, a number of our new purchases were from the health care sector, where we bought some lower investment-grade rated health care and non-rated continuing care retirement center bonds. In addition, to keep the Fund invested amid modest supply, we added a few bonds with relatively short call dates and also bonds of U.S. territories, which are generally fully tax-exempt for residents of all 50 states. Territorial bond purchases during the period included some U.S. Virgin Islands gross receipts tax bonds, which provided what we believed was an attractive yield, as well as a small position in Puerto Rico higher education issues.
| Nuveen Investments | 9 |
Risk Considerations
Mutual fund investing involves risk; principal loss is possible. Debt or fixed income securities such as those held by the fund, are subject to market risk, credit risk, interest rate risk, call risk, state concentration risk, tax risk and income risk. As interest rates rise, bond prices fall. Credit risk refers to an issuers ability to make interest and principal payments when due. Below investment grade or high yield debt securities are subject to liquidity risk and heightened credit risk. The fund’s use of inverse floaters creates effective leverage. Leverage involves the risk that the fund could lose more than its original investment and also increases the fund’s exposure to volatility and interest rate risk.
Dividend Information
All share classes of the Nuveen Minnesota Intermediate Municipal Bond Fund and the Nuveen Nebraska Municipal Bond Fund experienced one monthly dividend reduction, as well as the Class A, B and I Shares of the Nuveen Minnesota Municipal Bond Fund. The Class I Shares of the Nuveen Minnesota Municipal Bond Fund experienced one monthly dividend increase. While all share classes of the Nuveen Oregon Intermediate Municipal Bond Fund and the Class C1 Shares of the Minnesota Municipal Bond Fund experienced two monthly dividend reductions.
Each Fund seeks to pay dividends at a rate that reflects the past and projected performance of the Fund. To permit a Fund to maintain a more stable monthly dividend, the Fund may pay dividends at a rate that may be more or less than the amount of net investment income actually earned by the Fund during the period. If the Fund has cumulatively earned more than it has paid in dividends, it will hold the excess in reserve as undistributed net investment income (UNII) as part of the Fund’s net asset value. Conversely, if the Fund has cumulatively paid in dividends more than it has earned, the excess will constitute a negative UNII that will likewise be reflected in the Fund’s net asset value. Each Fund will, over time, pay all its net investment income as dividends to shareholders. As of November 30, 2012, all four Funds had positive UNII balance, based upon our best estimate, for tax purposes. The Minnesota Intermediate and Minnesota Municipal Bond Funds had positive UNII balances and the Nebraska and Oregon Intermediate Municipal Bond Funds had negative UNII balances for financial reporting purposes.
| 10 | Nuveen Investments |
Fund Performance and Expense Ratios
The Fund Performance and Expense Ratios for each Fund are shown on the following four pages.
Returns quoted represent past performance, which is no guarantee of future results. Current performance may be higher or lower than the performance shown. Investment returns and principal value will fluctuate so that when shares are redeemed, they may be worth more or less than their original cost. Returns without sales charges would be lower if the sales charge were included. Returns do not reflect the deduction of taxes that a shareholder would pay on Fund distributions or the redemption of Fund shares. Income is generally exempt from regular federal income taxes. Some income may be subject to state and local income taxes and to the federal alternative minimum tax. Capital gains, if any, are subject to tax.
Returns may reflect a contractual agreement between certain Funds and the investment adviser to waive certain fees and expenses; see Notes to Financial Statements, Footnote 7 — Management Fees and Other Transactions with Affiliates for more information. In addition, returns may reflect a voluntary expense limitation by the Funds’ investment adviser that may be modified or discontinued at any time without notice. For the most recent month-end performance visit www.nuveen.com or call (800) 257-8787.
Returns reflect differences in sales charges and expenses, which are primarily differences in distribution and service fees. Fund returns assume reinvestment of dividends and capital gains.
Comparative index and Lipper return information is provided for the Funds’ Class A Shares at net asset value (NAV) only.
The expense ratios shown reflect the Funds’ total operating expenses (before fee waivers and/or expense reimbursements, if any) as shown in the Funds’ most recent prospectus. The expense ratios include management fees and other fees and expenses.
| Nuveen Investments | 11 |
Fund Performance and Expense Ratios (continued)
Nuveen Minnesota Intermediate Municipal Bond Fund
Refer to the first page of this Fund Performance and Expense Ratios section for further explanation of the information included within this page.
Fund Performance
Average Annual Total Returns as of November 30, 2012*
| Cumulative | Average Annual | |||||||||||||||
| 6-Month | 1-Year | 5-Year | 10-Year | |||||||||||||
Class A Shares at NAV | 3.17% | 7.96% | 5.71% | 4.63% | ||||||||||||
Class A Shares at maximum Offering Price | 0.07% | 4.73% | 5.06% | 4.31% | ||||||||||||
S&P Municipal Bond Intermediate Index** | 3.63% | 8.72% | 6.45% | 5.52% | ||||||||||||
Barclays 1-15 Year Blend Municipal Bond Index** | 3.15% | 7.55% | 5.83% | 4.98% | ||||||||||||
Lipper Other States Intermediate Municipal Debt Funds Classification Average** | 2.96% | 7.12% | 4.84% | 4.03% | ||||||||||||
Class I Shares | 3.26% | 8.26% | 5.80% | 4.75% | ||||||||||||
| Cumulative | Average Annual | |||||||||||
| 6-Month | 1-Year | Since Inception*** | ||||||||||
Class C Shares | 2.77% | 7.34% | 8.37% | |||||||||
Class C1 Shares | 2.93% | 7.57% | 5.96% | |||||||||
Average Annual Total Returns as of December 31, 2012 (Most Recent Calendar Quarter)*
| Cumulative | Average Annual | |||||||||||||||
| 6-Month | 1-Year | 5-Year | 10-Year | |||||||||||||
Class A Shares at NAV | 2.11% | 4.90% | 5.44% | 4.29% | ||||||||||||
Class A Shares at maximum Offering Price | -0.97% | 1.71% | 4.81% | 3.97% | ||||||||||||
Class I Shares | 2.20% | 5.08% | 5.54% | 4.42% | ||||||||||||
| Cumulative | Average Annual | |||||||||||
| 6-Month | 1-Year | Since Inception*** | ||||||||||
Class C Shares | 1.90% | 4.38% | 7.39% | |||||||||
Class C1 Shares | 1.97% | 4.52% | 5.44% | |||||||||
Class A Shares have a maximum 3.00% sales charge (Offering Price). Class A Share purchases of $1 million or more are sold at net asset value without an up-front sales charge but may be subject to a contingent deferred sales charge (CDSC), also known as a back-end sales charge, if redeemed within eighteen months of purchase. Class C Shares and Class C1 Shares have a 1% CDSC for redemptions within less than twelve months, which is not reflected in the one-year total return. Class I Shares have no sales charge and may be purchased under limited circumstances or by specified classes of investors.
Expense Ratios as of Most Recent Prospectus
| Expense Ratios | ||||
Class A Shares | 0.84% | |||
Class C Shares | 1.40% | |||
Class C1 Shares | 1.29% | |||
Class I Shares | 0.64% | |||
| * | Six-month returns are cumulative; all other returns are annualized. |
| ** | Refer to the Glossary of Terms Used in this Report for definitions. Indexes and Lipper averages are not available for direct investment. |
| *** | Since inception returns for Class C and Class C1 Shares are from 1/18/11 and 10/28/09, respectively. |
| 12 | Nuveen Investments |
Nuveen Minnesota Municipal Bond Fund
Refer to the first page of this Fund Performance and Expense Ratios section for further explanation of the information included within this page.
Fund Performance
Average Annual Total Returns as of November 30, 2012*
| Cumulative | Average Annual | |||||||||||||||
| 6-Month | 1-Year | 5-Year | 10-Year | |||||||||||||
Class A Shares at NAV | 5.19% | 13.45% | 6.90% | 5.49% | ||||||||||||
Class A Shares at maximum Offering Price | 0.78% | 8.71% | 5.99% | 5.04% | ||||||||||||
S&P Municipal Bond Index** | 4.52% | 10.94% | 6.09% | 5.57% | ||||||||||||
Barclays Municipal Bond Index** | 4.18% | 10.17% | 6.23% | 5.45% | ||||||||||||
Lipper Minnesota Municipal Debt Funds Classification Average** | 3.94% | 10.22% | 5.42% | 4.78% | ||||||||||||
Class C1 Shares | 4.96% | 12.98% | 6.38% | 5.02% | ||||||||||||
Class I Shares | 5.27% | 13.74% | 7.07% | 5.71% | ||||||||||||
| Cumulative | Average Annual | |||||||||||
| 6-Month | 1-Year | Since Inception*** | ||||||||||
Class C Shares | 4.82% | 12.73% | 13.80% | |||||||||
Average Annual Total Returns as of December 31, 2012 (Most Recent Calendar Quarter)*
| Cumulative | Average Annual | |||||||||||||||
| 6-Month | 1-Year | 5-Year | 10-Year | |||||||||||||
Class A Shares at NAV | 3.72% | 9.57% | 6.70% | 5.11% | ||||||||||||
Class A Shares at maximum Offering Price | -0.64% | 4.98% | 5.78% | 4.66% | ||||||||||||
Class C1 Shares | 3.49% | 9.09% | 6.20% | 4.65% | ||||||||||||
Class I Shares | 3.89% | 9.84% | 6.89% | 5.32% | ||||||||||||
| Cumulative | Average Annual | |||||||||||
| 6-Month | 1-Year | Since Inception*** | ||||||||||
Class C Shares | 3.44% | 8.87% | 12.36% | |||||||||
Class A Shares have a maximum 4.20% sales charge (Offering Price). Class A Share purchases of $1 million or more are sold at net asset value without an up-front sales charge but may be subject to a contingent deferred sales charge (CDSC), also known as a back-end sales charge, if redeemed within eighteen months of purchase. Class C Shares and Class C1 Shares have a 1% CDSC for redemptions within less than twelve months, which is not reflected in the one-year total return. Class I Shares have no sales charge and may be purchased under limited circumstances or by specified classes of investors.
Expense Ratios as of Most Recent Prospectus
| Expense Ratios | ||||
Class A Shares | 0.89% | |||
Class C Shares | 1.46% | |||
Class C1 Shares | 1.34% | |||
Class I Shares | 0.70% | |||
| * | Six-month returns are cumulative; all other returns are annualized. |
| ** | Refer to the Glossary of Terms Used in this Report for definitions. Indexes and Lipper averages are not available for direct investment. |
| *** | Since inception returns for Class C Shares are from 1/18/11. |
| Nuveen Investments | 13 |
Fund Performance and Expense Ratios (continued)
Nuveen Nebraska Municipal Bond Fund
Refer to the first page of this Fund Performance and Expense Ratios section for further explanation of the information included within this page.
Fund Performance
Average Annual Total Returns as of November 30, 2012*
| Cumulative | Average Annual | |||||||||||||||
| 6-Month | 1-Year | 5-Year | 10-Year | |||||||||||||
Class A Shares at NAV | 4.82% | 12.35% | 6.28% | 5.17% | ||||||||||||
Class A Shares at maximum Offering Price | 0.44% | 7.63% | 5.38% | 4.72% | ||||||||||||
S&P Municipal Bond Index** | 4.52% | 10.94% | 6.09% | 5.57% | ||||||||||||
Barclays Municipal Bond Index** | 4.18% | 10.17% | 6.23% | 5.45% | ||||||||||||
Lipper Other States Municipal Debt Funds Classification Average** | 4.15% | 10.37% | 5.12% | 4.61% | ||||||||||||
Class C1 Shares | 4.61% | 12.02% | 5.84% | 4.76% | ||||||||||||
Class I Shares | 5.00% | 12.74% | 6.54% | 5.43% | ||||||||||||
| Cumulative | Average Annual | |||||||||||
| 6-Month | 1-Year | Since Inception*** | ||||||||||
Class C Shares | 4.54% | 11.84% | 11.55% | |||||||||
Average Annual Total Returns as of December 31, 2012 (Most Recent Calendar Quarter)*
| Cumulative | Average Annual | |||||||||||||||
| 6-Month | 1-Year | 5-Year | 10-Year | |||||||||||||
Class A Shares at NAV | 2.77% | 7.85% | 5.80% | 4.66% | ||||||||||||
Class A Shares at maximum Offering Price | -1.55% | 3.29% | 4.89% | 4.22% | ||||||||||||
Class C1 Shares | 2.54% | 7.40% | 5.36% | 4.25% | ||||||||||||
Class I Shares | 2.94% | 8.13% | 6.06% | 4.93% | ||||||||||||
| Cumulative | Average Annual | |||||||||||
| 6-Month | 1-Year | Since Inception*** | ||||||||||
Class C Shares | 2.49% | 7.26% | 9.69% | |||||||||
Class A Shares have a maximum 4.20% sales charge (Offering Price). Class A Share purchases of $1 million or more are sold at net asset value without an up-front sales charge but may be subject to a contingent deferred sales charge (CDSC), also known as a back-end sales charge, if redeemed within eighteen months of purchase. Class C Shares and Class C1 Shares have a 1% CDSC for redemptions within less than twelve months, which is not reflected in the one-year total return. Class I Shares have no sales charge and may be purchased under limited circumstances or by specified classes of investors.
Expense Ratios as of Most Recent Prospectus
| Gross Expense Ratios | Net Expense Ratios | |||||||
Class A Shares | 0.94% | 0.89% | ||||||
Class C Shares | 1.48% | 1.44% | ||||||
Class C1 Shares | 1.40% | 1.34% | ||||||
Class I Shares | 0.75% | 0.69% | ||||||
The Fund’s investment adviser has contractually agreed to waive fees and/or reimburse other Fund expenses through March 31, 2014 so that total annual Fund operating expenses, after fee waivers and/or expense reimbursements and excluding acquired fund fees and expenses, do not exceed 0.90%, 1.45%, 1.35% and 0.70% for Class A, Class C, Class C1 and Class I Shares, respectively. Fee waivers and/or expense reimbursements will not be terminated prior to that time without the approval of the Fund’s Board of Directors.
| * | Six-month returns are cumulative; all other returns are annualized. |
| ** | Refer to the Glossary of Terms Used in this Report for definitions. Indexes and Lipper averages are not available for direct investment. |
| *** | Since inception returns for Class C Shares are from 1/18/11. |
| 14 | Nuveen Investments |
Nuveen Oregon Intermediate Municipal Bond Fund
Refer to the first page of this Fund Performance and Expense Ratios section for further explanation of the information included within this page.
Fund Performance
Average Annual Total Returns as of November 30, 2012*
| Cumulative | Average Annual | |||||||||||||||
| 6-Month | 1-Year | 5-Year | 10-Year | |||||||||||||
Class A Shares at NAV | 2.96% | 7.47% | 5.29% | 4.33% | ||||||||||||
Class A Shares at maximum Offering Price | -0.14% | 4.24% | 4.66% | 4.01% | ||||||||||||
S&P Municipal Bond Intermediate Index** | 3.63% | 8.72% | 6.45% | 5.52% | ||||||||||||
Barclays 1-15 Year Blend Municipal Bond Index** | 3.15% | 7.55% | 5.83% | 4.98% | ||||||||||||
Lipper Other States Intermediate Municipal Debt Funds Classification Average** | 2.96% | 7.12% | 4.84% | 4.03% | ||||||||||||
Class I Shares | 3.05% | 7.65% | 5.46% | 4.49% | ||||||||||||
| Cumulative | Average Annual | |||||||||||
6-Month | 1-Year | Since Inception*** | ||||||||||
Class C Shares | 2.69% | 6.68% | 7.97% | |||||||||
Average Annual Total Returns as of December 31, 2012 (Most Recent Calendar Quarter)*
| Cumulative | Average Annual | |||||||||||||||
| 6-Month | 1-Year | 5-Year | 10-Year | |||||||||||||
Class A Shares at NAV | 1.69% | 4.24% | 4.99% | 3.96% | ||||||||||||
Class A Shares at maximum Offering Price | -1.39% | 1.15% | 4.36% | 3.64% | ||||||||||||
Class I Shares | 1.88% | 4.51% | 5.16% | 4.13% | ||||||||||||
| Cumulative | Average Annual | |||||||||||
| 6-Month | 1-Year | Since Inception*** | ||||||||||
Class C Shares | 1.51% | 3.56% | 6.89% | |||||||||
Class A Shares have a maximum 3.00% sales charge (Offering Price). Class A Share purchases of $1 million or more are sold at net asset value without an up-front sales charge but may be subject to a contingent deferred sales charge (CDSC), also known as a back-end sales charge, if redeemed within eighteen months of purchase. Class C Shares have a 1% CDSC for redemptions within less than twelve months, which is not reflected in the one-year total return. Class I Shares have no sales charge and may be purchased under limited circumstances or by specified classes of investors.
Expense Ratios as of Most Recent Prospectus
| Expense Ratios | ||||
Class A Shares | 0.84% | |||
Class C Shares | 1.39% | |||
Class I Shares | 0.64% | |||
| * | Six-month returns are cumulative; all other returns are annualized. |
| ** | Refer to the Glossary of Terms Used in this Report for definitions. Indexes and Lipper averages are not available for direct investment. |
| *** | Since inception returns for Class C Shares are from 1/18/11. |
| Nuveen Investments | 15 |
Yields as of November 30, 2012
Dividend Yield is the most recent dividend per share (annualized) divided by the offering price per share.
The SEC 30-Day Yield is a standardized measure of a Fund’s yield that accounts for the future amortization of premiums or discounts of bonds held in the Fund’s portfolio. The SEC 30-Day Yield is computed under an SEC standardized formula and is based on the maximum offer price per share. Dividend Yield may differ from the SEC 30-Day Yield because the Fund may be paying out more or less than it is earning and it may not include the effect of amortization of bond premium.
The Taxable-Equivalent Yield represents the yield that must be earned on a fully taxable investment in order to equal the yield of the Fund on an after-tax basis at a specified tax rate. With respect to investments that generate qualified dividend income that is taxable at a maximum rate of 15%, the Taxable-Equivalent Yield is lower.
Nuveen Minnesota Intermediate Municipal Bond Fund
| Dividend Yield | SEC 30-Day Yield | Taxable- Equivalent Yield1 | ||||||||||
Class A Shares4 | 2.96% | 1.15% | 1.73% | |||||||||
Class C Shares | 2.45% | 0.63% | 0.95% | |||||||||
Class C1 Shares | 2.60% | 0.75% | 1.13% | |||||||||
Class I Shares | 3.23% | 1.38% | 2.08% | |||||||||
Nuveen Minnesota Municipal Bond Fund
| Dividend Yield | SEC 30-Day Yield | Taxable- Equivalent Yield1 | ||||||||||
Class A Shares4 | 3.52% | 2.30% | 3.47% | |||||||||
Class C Shares | 3.09% | 1.85% | 2.79% | |||||||||
Class C1 Shares | 3.20% | 1.96% | 2.96% | |||||||||
Class I Shares | 3.82% | 2.60% | 3.92% | |||||||||
Nuveen Nebraska Municipal Bond Fund
| Dividend Yield | SEC 30-Day Yield | Taxable- Equivalent Yield2 | ||||||||||
Class A Shares4 | 3.09% | 1.94% | 2.89% | |||||||||
Class C Shares | 2.70% | 1.47% | 2.19% | |||||||||
Class C1 Shares | 2.77% | 1.58% | 2.35% | |||||||||
Class I Shares | 3.38% | 2.22% | 3.31% | |||||||||
Nuveen Oregon Intermediate Municipal Bond Fund
| Dividend Yield | SEC 30-Day Yield | Taxable- Equivalent Yield3 | ||||||||||
Class A Shares4 | 2.71% | 0.81% | 1.25% | |||||||||
Class C Shares | 2.24% | 0.29% | 0.45% | |||||||||
Class I Shares | 2.96% | 1.03% | 1.59% | |||||||||
| 1 | The Taxable-Equivalent Yield is based on the Fund’s SEC 30-Day Yield on the indicated date and a combined federal and state income tax rate of 33.7%. |
| 2 | The Taxable-Equivalent Yield is based on the Fund’s SEC 30-Day Yield on the indicated date and a combined federal and state income tax rate of 32.9%. |
| 3 | The Taxable-Equivalent Yield is based on the Fund’s SEC 30-Day Yield on the indicated date and a combined federal and state income tax rate of 35.1%. |
| 4 | The SEC Yield for Class A Shares quoted in the table reflects the maximum sales load. Investors paying a reduced load because of volume discounts, investors paying no load because they qualify for one of the several exclusions from the load, and existing shareholders who previously paid a load but would like to know the SEC Yield applicable to their shares on a going-forward basis, should understand that the SEC Yield effectively applicable to them would be higher than the figure quoted in the table. |
| 16 | Nuveen Investments |
Holding Summaries as of November 30, 2012
This data relates to the securities held in each Fund’s portfolio of investments. It should not be construed as a measure of performance for the Fund itself.
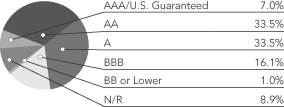
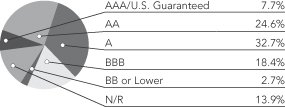
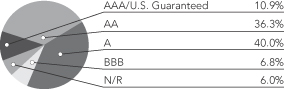
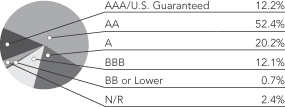
Ratings shown are the highest rating given by one of the following national rating agencies: Standard & Poor’s Group, Moody’s Investors Service, Inc. or Fitch, Inc. Credit ratings are subject to change. AAA, AA, A and BBB are investment grade ratings; BB, B, CCC, CC, C and D are below investment grade ratings. Certain bonds backed by U.S. Government or agency securities are regarded as having an implied rating equal to the rating of such securities. Holdings designated N/R are not rated by these national rating agencies.
Nuveen Minnesota Intermediate Municipal Bond Fund
Bond Credit Quality1
Nuveen Minnesota Municipal Bond Fund
Bond Credit Quality1
Nuveen Nebraska Municipal Bond Fund
Bond Credit Quality1
| Portfolio Composition2 | ||||
| Education and Civic Organizations | 21.9% | |||
| Health Care | 20.4% | |||
| Tax Obligation/General | 20.1% | |||
| Utilities | 11.0% | |||
| Tax Obligation/Limited | 7.6% | |||
| Transportation | 5.1% | |||
| Short-Term Investments3 | 0.0% | |||
| Other | 13.9% | |||
| Portfolio Composition2 | ||||
| Health Care | 20.1% | |||
| Education and Civic Organizations | 15.8% | |||
| Utilities | 14.1% | |||
| Tax Obligation/General | 13.1% | |||
| Long-Term Care | 8.0% | |||
| Transportation | 6.0% | |||
| Tax Obligation/Limited | 5.0% | |||
| Consumer Staples | 4.3% | |||
| Other | 13.6% | |||
| Portfolio Composition2 | ||||
| Utilities | 26.2% | |||
| Education and Civic Organizations | 19.8% | |||
| Tax Obligation/Limited | 12.6% | |||
| Health Care | 10.8% | |||
| Tax Obligation/General | 8.9% | |||
| Long-Term Care | 8.0% | |||
| Water and Sewer | 5.0% | |||
| Short-Term Investments | 0.8% | |||
| Other | 7.9% | |||
| 1 | As a percentage of total investments (excluding short-term investments, where applicable). Holdings are subject to change. |
| 2 | As a percentage of total investments. Holdings are subject to change. |
| 3 | Rounds to less than 0.1%. |
| Nuveen Investments | 17 |
Holding Summaries (continued) as of November 30, 2012
Nuveen Oregon Intermediate Municipal Bond Fund
Bond Credit Quality1
| Portfolio Composition2 | ||||
| Tax Obligation/General | 37.8% | |||
| Tax Obligation/Limited | 14.2% | |||
| Health Care | 13.1% | |||
| Water and Sewer | 8.3% | |||
| Education and Civic Organizations | 7.9% | |||
| U.S. Guaranteed | 5.0% | |||
| Short-Term Investments | 2.6% | |||
| Other | 11.1% | |||
| 1 | As a percentage of total investments (excluding short-term investments, where applicable). Holdings are subject to change. |
| 2 | As a percentage of total investments. Holdings are subject to change. |
| 18 | Nuveen Investments |
As a shareholder of one or more of the Funds, you incur two types of costs: (1) transaction costs, including up-front and back-end sales charges (loads) or redemption fees, where applicable; and (2) ongoing costs, including management fees; distribution and service (12b-1) fees, where applicable; and other Fund expenses. The Examples below are intended to help you understand your ongoing costs (in dollars) of investing in the Funds and to compare these costs with the ongoing costs of investing in other mutual funds.
The Examples below are based on an investment of $1,000 invested at the beginning of the period and held through the period.
The information under “Actual Performance,” together with the amount you invested, allows you to estimate actual expenses incurred over the reporting period. Simply divide your account value by $1,000 (for example, an $8,600 account value divided by $1,000 = 8.60) and multiply the result by the cost shown for your share class, in the row entitled “Expenses Incurred During Period” to estimate the expenses incurred on your account during this period.
The information under “Hypothetical Performance,” provides information about hypothetical account values and hypothetical expenses based on the respective Fund’s actual expense ratio and an assumed rate of return of 5% per year before expenses, which is not the Fund’s actual return. The hypothetical account values and expenses may not be used to estimate the actual ending account balance or expense you incurred for the period. You may use this information to compare the ongoing costs of investing in the Fund and other Funds. To do so, compare this 5% hypothetical example with the 5% hypothetical examples that appear in the shareholder reports of the other funds.
Please note that the expenses shown in the tables are meant to highlight your ongoing costs only and do not reflect any transaction costs. Therefore, the hypothetical information is useful in comparing ongoing costs only, and will not help you determine the relative total costs of owning different funds or share classes. In addition, if these transaction costs were included, your costs would have been higher.
Nuveen Minnesota Intermediate Municipal Bond Fund
| Hypothetical Performance | ||||||||||||||||||||||||||||||||||
| Actual Performance | (5% annualized return before expenses) | |||||||||||||||||||||||||||||||||
| A Shares | C Shares | C1 Shares | I Shares | A Shares | C Shares | C1 Shares | I Shares | |||||||||||||||||||||||||||
| Beginning Account Value (6/01/12) | $ | 1,000.00 | $ | 1,000.00 | $ | 1,000.00 | $ | 1,000.00 | $ | 1,000.00 | $ | 1,000.00 | $ | 1,000.00 | $ | 1,000.00 | ||||||||||||||||||
| Ending Account Value (11/30/12) | $ | 1,031.70 | $ | 1,027.70 | $ | 1,029.30 | $ | 1,032.60 | $ | 1,020.96 | $ | 1,018.20 | $ | 1,018.65 | $ | 1,021.91 | ||||||||||||||||||
| Expenses Incurred During Period | $ | 4.18 | $ | 6.96 | $ | 6.51 | $ | 3.21 | $ | 4.15 | $ | 6.93 | $ | 6.48 | $ | 3.19 | ||||||||||||||||||
For each class of the Fund, expenses are equal to the Fund’s annualized net expense ratio of .82%, 1.37%, 1.28% and .63% for Classes A, C, C1 and I, respectively, multiplied by the average account value over the period, multiplied by 183/365 (to reflect the one-half year period).
Nuveen Minnesota Municipal Bond Fund
| Hypothetical Performance | ||||||||||||||||||||||||||||||||||
| Actual Performance | (5% annualized return before expenses) | |||||||||||||||||||||||||||||||||
| A Shares | C Shares | C1 Shares | I Shares | A Shares | C Shares | C1 Shares | I Shares | |||||||||||||||||||||||||||
| Beginning Account Value (6/01/12) | $ | 1,000.00 | $ | 1,000.00 | $ | 1,000.00 | $ | 1,000.00 | $ | 1,000.00 | $ | 1,000.00 | $ | 1,000.00 | $ | 1,000.00 | ||||||||||||||||||
| Ending Account Value (11/30/12) | $ | 1,051.90 | $ | 1,048.20 | $ | 1,049.60 | $ | 1,052.70 | $ | 1,020.81 | $ | 1,018.05 | $ | 1,018.50 | $ | 1,021.76 | ||||||||||||||||||
| Expenses Incurred During Period | $ | 4.37 | $ | 7.19 | $ | 6.73 | $ | 3.40 | $ | 4.31 | $ | 7.08 | $ | 6.63 | $ | 3.35 | ||||||||||||||||||
For each class of the Fund, expenses are equal to the Fund’s annualized net expense ratio of .85%, 1.40%, 1.31% and .66% for Classes A, C, C1 and I, respectively, multiplied by the average account value over the period, multiplied by 183/365 (to reflect the one-half year period).
Nuveen Nebraska Municipal Bond Fund
| Hypothetical Performance | ||||||||||||||||||||||||||||||||||
| Actual Performance | (5% annualized return before expenses) | |||||||||||||||||||||||||||||||||
| A Shares | C Shares | C1 Shares | I Shares | A Shares | C Shares | C1 Shares | I Shares | |||||||||||||||||||||||||||
| Beginning Account Value (6/01/12) | $ | 1,000.00 | $ | 1,000.00 | $ | 1,000.00 | $ | 1,000.00 | $ | 1,000.00 | $ | 1,000.00 | $ | 1,000.00 | $ | 1,000.00 | ||||||||||||||||||
| Ending Account Value (11/30/12) | $ | 1,048.20 | $ | 1,045.40 | $ | 1,046.10 | $ | 1,050.00 | $ | 1,020.61 | $ | 1,017.85 | $ | 1,018.30 | $ | 1,021.61 | ||||||||||||||||||
| Expenses Incurred During Period | $ | 4.57 | $ | 7.38 | $ | 6.87 | $ | 3.55 | $ | 4.51 | $ | 7.28 | $ | 6.78 | $ | 3.50 | ||||||||||||||||||
For each class of the Fund, expenses are equal to the Fund’s annualized net expense ratio of .89%, 1.44%, 1.34% and .69% for Classes A, C, C1 and I, respectively, multiplied by the average account value over the period, mulitplied by 183/365 (to reflect the one-half year period).
| Nuveen Investments | 19 |
Expense Examples (continued)
Nuveen Oregon Intermediate Municipal Bond Fund
| Hypothetical Performance | ||||||||||||||||||||||||||
| Actual Performance | (5% annualized return before expenses) | |||||||||||||||||||||||||
| A Shares | C Shares | I Shares | A Shares | C Shares | I Shares | |||||||||||||||||||||
| Beginning Account Value (6/01/12) | $ | 1,000.00 | $ | 1,000.00 | $ | 1,000.00 | $ | 1,000.00 | $ | 1,000.00 | $ | 1,000.00 | ||||||||||||||
| Ending Account Value (11/30/12) | $ | 1,029.60 | $ | 1,026.90 | $ | 1,030.50 | $ | 1,020.91 | $ | 1,018.15 | $ | 1,021.91 | ||||||||||||||
| Expenses Incurred During Period | $ | 4.22 | $ | 7.01 | $ | 3.21 | $ | 4.20 | $ | 6.98 | $ | 3.19 | ||||||||||||||
For each class of the Fund, expenses are equal to the Fund’s annualized net expense ratio of .83%, 1.38% and .63% for Classes A, C and I, respectively, multiplied by the average account value over the period, mulitplied by 183/365 (to reflect the one-half year period).
| 20 | Nuveen Investments |
Portfolio of Investments (Unaudited)
Nuveen Minnesota Intermediate Municipal Bond Fund
November 30, 2012
| Principal Amount (000) | Description (1) | Optional Call Provisions (2) | Ratings (3) | Value | ||||||||||||||
MUNICIPAL BONDS – 100.1% | ||||||||||||||||||
Consumer Staples – 2.5% | ||||||||||||||||||
Tobacco Securitization Authority, Minnesota, Tobacco Settlement Revenue Bonds, Tax-Exempt Series 2011B: | ||||||||||||||||||
| $ | 2,085 | 5.000%, 3/01/18 | No Opt. Call | A | $ | 2,410,948 | ||||||||||||
| 540 | 4.000%, 3/01/21 | No Opt. Call | A | 593,681 | ||||||||||||||
| 1,075 | 5.250%, 3/01/25 | 3/22 at 100.00 | A– | 1,239,948 | ||||||||||||||
| 2,370 | 5.250%, 3/01/31 | 3/22 at 100.00 | A– | 2,668,644 | ||||||||||||||
| 6,070 | Total Consumer Staples | 6,913,221 | ||||||||||||||||
Education and Civic Organizations – 21.9% | ||||||||||||||||||
| 330 | Anoka County, Minnesota, Charter School Lease Revenue Bonds, Spectrum Building Company, Series 2012A, 5.000%, 6/01/32 (WI/DD, Settling 12/11/12) | 6/22 at 100.00 | BBB– | 347,549 | ||||||||||||||
| 210 | City of Woodbury, Minnesota, Charter School Lease Revenue Bonds, Math and Science Academy Building Company, Series 2012A, 5.000%, 12/01/27 (WI/DD, Settling 12/03/12) | 12/22 at 100.00 | BBB– | 225,899 | ||||||||||||||
Itasca County, Minnesota, Revenue Bonds, Charles K. Blandin Foundation, Series 2010: | ||||||||||||||||||
| 635 | 4.000%, 5/01/18 | No Opt. Call | A3 | 690,778 | ||||||||||||||
| 255 | 4.000%, 5/01/19 | No Opt. Call | A3 | 281,724 | ||||||||||||||
Minneapolis, Minnesota, Revenue Bonds, Blake School Project, Refundinjg Series 2010: | ||||||||||||||||||
| 550 | 4.000%, 9/01/19 | No Opt. Call | A2 | 639,056 | ||||||||||||||
| 315 | 4.000%, 9/01/21 | 9/20 at 100.00 | A2 | 366,216 | ||||||||||||||
| 3,075 | Minneapolis, Minnesota, Revenue Bonds, National Marrow Donor Program Project, Series 2010, 4.250%, 8/01/20 | 8/18 at 100.00 | BBB | 3,275,078 | ||||||||||||||
| 815 | Minnesota Higher Education Facilities Authority, Revenue Bonds, Augsburg College, Refunding Series 2010-7-G, 4.000%, 10/01/21 | 10/18 at 100.00 | Baa3 | 874,242 | ||||||||||||||
| 1,075 | Minnesota Higher Education Facilities Authority, Revenue Bonds, Augsburg College, Series 2005-6-C, 4.750%, 5/01/18 | 5/14 at 100.00 | Baa3 | 1,110,669 | ||||||||||||||
Minnesota Higher Education Facilities Authority, Revenue Bonds, Augsburg College, Series 2006-J-1: | ||||||||||||||||||
| 320 | 5.000%, 5/01/13 | No Opt. Call | Baa3 | 324,608 | ||||||||||||||
| 375 | 5.000%, 5/01/16 | 5/15 at 100.00 | Baa3 | 400,958 | ||||||||||||||
| 1,295 | 5.000%, 5/01/20 | 5/15 at 100.00 | Baa3 | 1,368,180 | ||||||||||||||
Minnesota Higher Education Facilities Authority, Revenue Bonds, Bethel University, Refunding Series 2007-6-R: | ||||||||||||||||||
| 1,125 | 5.500%, 5/01/18 | 5/17 at 100.00 | N/R | 1,217,318 | ||||||||||||||
| 1,185 | 5.500%, 5/01/19 | 5/17 at 100.00 | N/R | 1,282,739 | ||||||||||||||
| 1,050 | 5.500%, 5/01/24 | 5/17 at 100.00 | N/R | 1,122,839 | ||||||||||||||
| 1,585 | Minnesota Higher Education Facilities Authority, Revenue Bonds, College of St. Benedict, Series 2008-V, 4.500%, 3/01/17 | No Opt. Call | Baa1 | 1,749,618 | ||||||||||||||
| 300 | Minnesota Higher Education Facilities Authority, Revenue Bonds, College of St. Benedict, Series 2011-7M, 5.000%, 3/01/31 | 3/20 at 100.00 | Baa1 | 326,685 | ||||||||||||||
| 150 | Minnesota Higher Education Facilities Authority, Revenue Bonds, College of St. Scholastica, Inc., Series 2011-7J, 6.000%, 12/01/28 | 12/19 at 100.00 | Baa2 | 174,884 | ||||||||||||||
Minnesota Higher Education Facilities Authority, Revenue Bonds, College of St. Scholastica, Inc., Series 2012-7R: | ||||||||||||||||||
| 195 | 4.000%, 12/01/18 | No Opt. Call | Baa2 | 216,746 | ||||||||||||||
| 200 | 4.000%, 12/01/20 | No Opt. Call | Baa2 | 222,358 | ||||||||||||||
| 310 | 3.375%, 12/01/22 | No Opt. Call | Baa2 | 326,954 | ||||||||||||||
Minnesota Higher Education Facilities Authority, Revenue Bonds, College of St. Scholastica, Series 2007-6S: | ||||||||||||||||||
| 360 | 4.375%, 12/01/16 | No Opt. Call | Baa2 | 399,470 | ||||||||||||||
| 380 | 4.500%, 12/01/17 | No Opt. Call | Baa2 | 430,434 | ||||||||||||||
| 750 | Minnesota Higher Education Facilities Authority, Revenue Bonds, College of St. Scholastica, Series 20107H, 5.125%, 12/01/30 | 12/19 at 100.00 | Baa2 | 840,683 | ||||||||||||||
| Nuveen Investments | 21 |
Portfolio of Investments (Unaudited)
Nuveen Minnesota Intermediate Municipal Bond Fund (continued)
November 30, 2012
| Principal Amount (000) | Description (1) | Optional Call Provisions (2) | Ratings (3) | Value | ||||||||||||||
Education and Civic Organizations (continued) | ||||||||||||||||||
Minnesota Higher Education Facilities Authority, Revenue Bonds, Gustavus Adolfus College, Series 2010-7-B: | ||||||||||||||||||
| $ | 2,025 | 5.000%, 10/01/18 | No Opt. Call | A3 | $ | 2,432,126 | ||||||||||||
| 1,040 | 5.000%, 10/01/23 | 10/19 at 100.00 | A3 | 1,229,426 | ||||||||||||||
| 150 | 4.250%, 10/01/24 | 10/19 at 100.00 | A3 | 168,351 | ||||||||||||||
Minnesota Higher Education Facilities Authority, Revenue Bonds, Hamline University of Minnesota, Refunding Series 2010E: | ||||||||||||||||||
| 1,000 | 4.125%, 10/01/18 | No Opt. Call | Baa2 | 1,099,970 | ||||||||||||||
| 1,370 | 4.375%, 10/01/20 | No Opt. Call | Baa2 | 1,551,731 | ||||||||||||||
| 500 | 4.500%, 10/01/21 | 10/20 at 100.00 | Baa2 | 565,165 | ||||||||||||||
| 250 | 5.000%, 10/01/29 | 10/20 at 100.00 | Baa2 | 281,793 | ||||||||||||||
Minnesota Higher Education Facilities Authority, Revenue Bonds, Hamline University, Series 2011-7K1: | ||||||||||||||||||
| 1,000 | 4.250%, 10/01/18 | No Opt. Call | Baa2 | 1,098,730 | ||||||||||||||
| 625 | 6.000%, 10/01/32 | 10/21 at 100.00 | Baa2 | 755,256 | ||||||||||||||
| 1,750 | Minnesota Higher Education Facilities Authority, Revenue Bonds, Macalester College, Series 2012-7S, 3.000%, 5/01/32 (WI/DD, Settling 12/12/12) | 5/21 at 100.00 | Aa3 | 1,753,203 | ||||||||||||||
Minnesota Higher Education Facilities Authority, Revenue Bonds, Minneapolis College of Art and Design, Refunding Series 2006-6-K: | ||||||||||||||||||
| 310 | 5.000%, 5/01/13 | No Opt. Call | Baa2 | 314,464 | ||||||||||||||
| 320 | 5.000%, 5/01/14 | No Opt. Call | Baa2 | 334,845 | ||||||||||||||
| 340 | 5.000%, 5/01/15 | No Opt. Call | Baa2 | 366,187 | ||||||||||||||
| 355 | 5.000%, 5/01/16 | 5/15 at 100.00 | Baa2 | 381,405 | ||||||||||||||
| 370 | 5.000%, 5/01/17 | 5/15 at 100.00 | Baa2 | 396,074 | ||||||||||||||
| 305 | Minnesota Higher Education Facilities Authority, Revenue Bonds, Minneapolis College of Art and Design, Series 2012-7N., 3.000%, 5/01/17 | No Opt. Call | Baa2 | 315,297 | ||||||||||||||
Minnesota Higher Education Facilities Authority, Revenue Bonds, Saint Catherine University, Series 2012-7Q: | ||||||||||||||||||
| 400 | 5.000%, 10/01/18 | No Opt. Call | Baa1 | 466,908 | ||||||||||||||
| 740 | 5.000%, 10/01/23 | 10/22 at 100.00 | Baa1 | 885,787 | ||||||||||||||
| 490 | 5.000%, 10/01/24 | 10/22 at 100.00 | Baa1 | 581,875 | ||||||||||||||
| 500 | Minnesota Higher Education Facilities Authority, Revenue Bonds, Saint Olaf College, Refunding Series 2007-6O, 5.000%, 10/01/16 | No Opt. Call | A1 | 576,200 | ||||||||||||||
Minnesota Higher Education Facilities Authority, Revenue Bonds, University of Saint Thomas, Series 2009-6X: | ||||||||||||||||||
| 500 | 4.500%, 4/01/21 | 4/17 at 100.00 | A2 | 564,150 | ||||||||||||||
| 1,250 | 5.000%, 4/01/24 | 4/17 at 100.00 | A2 | 1,444,538 | ||||||||||||||
Minnesota Higher Education Facilities Authority, Revenue Bonds, University of Saint Thomas, Series 2009-7A: | ||||||||||||||||||
| 1,000 | 4.000%, 10/01/17 | No Opt. Call | A2 | 1,138,230 | ||||||||||||||
| 1,000 | 4.500%, 10/01/18 | No Opt. Call | A2 | 1,185,450 | ||||||||||||||
| 1,975 | 4.500%, 10/01/19 | No Opt. Call | A2 | 2,384,931 | ||||||||||||||
| 1,045 | Minnesota Higher Education Facilities Authority, Revenue Bonds, University of St. Thomas, Series 2006-6I, 4.000%, 4/01/14 | No Opt. Call | A2 | 1,091,105 | ||||||||||||||
Minnesota Higher Education Facilities Authority, Saint John’s University Revenue Bonds, Series 2008-6U: | ||||||||||||||||||
| 290 | 4.200%, 10/01/19 | 10/18 at 100.00 | A2 | 336,673 | ||||||||||||||
| 385 | 4.300%, 10/01/20 | 10/18 at 100.00 | A2 | 444,875 | ||||||||||||||
| 145 | 4.500%, 10/01/22 | 10/18 at 100.00 | A2 | 167,761 | ||||||||||||||
Minnesota State Colleges and University, General Fund Revenue Bonds, Series 2009A: | ||||||||||||||||||
| 985 | 4.000%, 10/01/22 | 10/19 at 100.00 | Aa2 | 1,132,671 | ||||||||||||||
| 1,755 | 4.000%, 10/01/23 | 10/19 at 100.00 | Aa2 | 2,000,209 | ||||||||||||||
Minnesota State Colleges and University, General Fund Revenue Bonds, Series 2011A: | ||||||||||||||||||
| 1,515 | 4.250%, 10/01/24 | 10/21 at 100.00 | Aa2 | 1,800,184 | ||||||||||||||
| 750 | 4.375%, 10/01/25 | 10/21 at 100.00 | Aa2 | 893,730 | ||||||||||||||
| 890 | 4.500%, 10/01/26 | 10/21 at 100.00 | Aa2 | 1,066,024 | ||||||||||||||
| 22 | Nuveen Investments |
| Principal Amount (000) | Description (1) | Optional Call Provisions (2) | Ratings (3) | Value | ||||||||||||||
Education and Civic Organizations (continued) | ||||||||||||||||||
Moorhead, Minnesota, Educational Facilities Revenue Bonds, The Concordia College Corporation Project, Series 2005A: | ||||||||||||||||||
| $ | 500 | 4.100%, 12/15/14 | No Opt. Call | A3 | $ | 524,675 | ||||||||||||
| 880 | 4.200%, 12/15/15 | No Opt. Call | A3 | 944,671 | ||||||||||||||
| 925 | 4.300%, 12/15/16 | 12/15 at 100.00 | A3 | 993,117 | ||||||||||||||
| 1,005 | 5.000%, 12/15/18 | 12/15 at 100.00 | A3 | 1,094,686 | ||||||||||||||
| 1,060 | 5.000%, 12/15/19 | 12/15 at 100.00 | A3 | 1,150,079 | ||||||||||||||
| 1,000 | Saint Paul Housing & Redevelopment Authority, Minnesota, Charter School Lease Revenue Bonds, Nova Classical Academy, Series 2011A, 5.700%, 9/01/21 | No Opt. Call | BBB– | 1,098,090 | ||||||||||||||
| 2,395 | Saint Paul Housing and Redevelopment Authority, Minnesota, Revenue Bonds, Minnesota Public Radio Project, Refunding Series 2010, 5.000%, 12/01/25 | 12/20 at 100.00 | A2 | 2,790,007 | ||||||||||||||
| 1,020 | University of Minnesota, General Revenue Bonds, Series 2009C, 5.000%, 12/01/19 | 6/19 at 100.00 | Aa1 | 1,278,223 | ||||||||||||||
| 1,895 | University of Minnesota, Special Purpose Revenue Bonds, State Supported Biomedical Science Research Facilities Funding Program, Series 2011B, 5.000%, 8/01/23 | 8/21 at 100.00 | AA | 2,378,642 | ||||||||||||||
| 54,845 | Total Education and Civic Organizations | 61,673,199 | ||||||||||||||||
Health Care – 20.4% | ||||||||||||||||||
| 735 | Aitkin, Minnesota Health Care Revenue Bonds, Riverwood Healthcare Center, Series 2006, 5.250%, 2/01/15 | No Opt. Call | N/R | 774,764 | ||||||||||||||
| 1,340 | Cuyuna Range Hospital District, Minnesota, Health Care Facilities Gross Revenue Bonds, Refunding Series 2007, 5.000%, 6/01/17 | No Opt. Call | N/R | 1,467,461 | ||||||||||||||
Cuyuna Range Hospital District, Minnesota, Health Care Facilities Gross Revenue Bonds, Series 2005: | ||||||||||||||||||
| 425 | 5.000%, 6/01/16 | 6/13 at 101.00 | N/R | 434,150 | ||||||||||||||
| 1,320 | 5.000%, 6/01/19 | 6/13 at 101.00 | N/R | 1,345,740 | ||||||||||||||
| 400 | Fergus Falls, Minnesota, Health Care Facilities Revenue Bonds, Lake Region Healthcare Corporation Project, Series 2010, 4.750%, 8/01/25 | 8/17 at 100.00 | BBB | 424,804 | ||||||||||||||
Glencoe, Minnesota, Health Care Facilities Revenue Bonds, Glencoe Regional Health Services Project, Series 2005: | ||||||||||||||||||
| 500 | 5.000%, 4/01/13 | No Opt. Call | BBB | 505,595 | ||||||||||||||
| 800 | 5.000%, 4/01/14 | 4/13 at 101.00 | BBB | 815,544 | ||||||||||||||
| 845 | 5.000%, 4/01/15 | 4/13 at 101.00 | BBB | 861,478 | ||||||||||||||
| 1,815 | 5.000%, 4/01/17 | 4/13 at 101.00 | BBB | 1,847,724 | ||||||||||||||
Maple Grove, Minnesota, Health Care Facilities Revenue Bonds, Maple Grove Hospital Corporation, Series 2007: | ||||||||||||||||||
| 1,000 | 5.000%, 5/01/17 | No Opt. Call | Baa1 | 1,123,970 | ||||||||||||||
| 585 | 4.500%, 5/01/23 | 5/17 at 100.00 | Baa1 | 615,087 | ||||||||||||||
| 1,730 | Maple Grove, Minnesota, Health Care Facility Revenue Bonds, North Memorial Health Care, Series 2005, 4.500%, 9/01/17 | 9/15 at 100.00 | Baa1 | 1,841,499 | ||||||||||||||
| 1,000 | Meeker County, Minnesota, Gross Revenue Hospital Facilities Bonds, Meeker County Memorial Hospital Project, Series 2007, 5.625%, 11/01/22 | 11/17 at 100.00 | N/R | 1,102,840 | ||||||||||||||
| 4,130 | Minneapolis Health Care System, Minnesota, Revenue Bonds, Fairview Hospital and Healthcare Services, Series 2008A, 6.375%, 11/15/23 | 11/18 at 100.00 | A | 5,051,981 | ||||||||||||||
| 1,000 | Minneapolis-Saint Paul Housing and Redevelopment Authority, Minnesota, Health Care Revenue Bonds, Children’s Health Care, Series 2010A, 5.250%, 8/15/25 | 8/20 at 100.00 | A+ | 1,191,600 | ||||||||||||||
Minnesota Agricultural and Economic Development Board, Health Care Facilities Revenue Bonds, Essentia Health Obligated Group, Series 2008C-1: | ||||||||||||||||||
| 540 | 5.000%, 2/15/16 – AGC Insured | No Opt. Call | AA– | 605,167 | ||||||||||||||
| 1,000 | 5.500%, 2/15/25 – AGC Insured | 2/20 at 100.00 | AA– | 1,204,850 | ||||||||||||||
| Nuveen Investments | 23 |
Portfolio of Investments (Unaudited)
Nuveen Minnesota Intermediate Municipal Bond Fund (continued)
November 30, 2012
| Principal Amount (000) | Description (1) | Optional Call Provisions (2) | Ratings (3) | Value | ||||||||||||||
Health Care (continued) | ||||||||||||||||||
Minnesota Agricultural and Economic Development Board, Healthcare System Revenue Bonds, Fairview Hospital and Healthcare Services, Series 1997A: | ||||||||||||||||||
| $ | 305 | 5.500%, 11/15/17 – NPFG Insured | 5/13 at 100.00 | A | $ | 306,132 | ||||||||||||
| 10 | 5.750%, 11/15/26 – NPFG Insured | 5/13 at 100.00 | A | 10,021 | ||||||||||||||
| 2,320 | Monticello-Big Lake Community Hospital District, Minnesota, Gross Revenue Health Care Facilities Bonds, Series 2003C, 5.750%, 12/01/15 | 12/12 at 100.00 | N/R | 2,325,661 | ||||||||||||||
Northfield, Minnesota, Hospital Revenue Bonds, Refunding Series 2006: | ||||||||||||||||||
| 920 | 5.000%, 11/01/14 | No Opt. Call | BBB– | 967,923 | ||||||||||||||
| 1,080 | 5.500%, 11/01/17 | 11/16 at 100.00 | BBB– | 1,200,139 | ||||||||||||||
| 1,015 | Redwood Falls, Minnesota, Gross Revenue Hospital Facilities Bonds, Redwood Area Hospital Project, Series 2006, 5.000%, 12/01/21 | 12/16 at 100.00 | N/R | 1,074,520 | ||||||||||||||
| 1,290 | Rochester, Minnesota, Health Care Facilities Revenue Bonds, Mayo Clinic, Series 2011C, 4.500%, 11/15/38 (Mandatory put 11/15/21) | No Opt. Call | AA | 1,593,537 | ||||||||||||||
| 1,000 | Rochester, Minnesota, Health Care Facilities Revenue Bonds, Mayo Clinic, Series 2012, 4.000%, 11/15/41 | 5/22 at 100.00 | AA | 1,082,240 | ||||||||||||||
| 1,000 | Rochester, Minnesota, Health Care Facilities Revenue Bonds, Olmsted Medical Center Project, Series 2010, 5.125%, 7/01/20 | No Opt. Call | BBB+ | 1,118,360 | ||||||||||||||
| 1,000 | Saint Cloud, Minnesota, Health Care Revenue Bonds, CentraCare Health System Project, Series 2008D, 5.375%, 5/01/31 – AGC Insured | 5/19 at 100.00 | Aa3 | 1,143,050 | ||||||||||||||
| 1,000 | Saint Cloud, Minnesota, Health Care Revenue Bonds, CentraCare Health System Project, Series 2010A, 4.250%, 5/01/21 | 5/20 at 100.00 | A1 | 1,145,430 | ||||||||||||||
| 2,500 | Saint Louis Park, Minnesota, Health Care Facilities Revenue Refunding Bonds, Park Nicollet Health Services, Series 2008C, 5.625%, 7/01/26 | 7/18 at 100.00 | A | 2,858,625 | ||||||||||||||
| 1,325 | Saint Louis Park, Minnesota, Health Care Facilities Revenue Refunding Bonds, Park Nicollet Health Services, Series 2009, 5.500%, 7/01/29 | 7/19 at 100.00 | A | 1,518,609 | ||||||||||||||
Saint Paul Housing and Redevelopment Authority, Minnesota, Health Care Facility Revenue Bonds, HealthPartners Obligated Group, Series 2006: | ||||||||||||||||||
| 250 | 5.000%, 5/15/15 | No Opt. Call | A– | 270,000 | ||||||||||||||
| 1,350 | 5.250%, 5/15/19 | 11/16 at 100.00 | A– | 1,493,748 | ||||||||||||||
Saint Paul Housing and Redevelopment Authority, Minnesota, Health Care Revenue Bonds, Allina Health System, Series 2007A: | ||||||||||||||||||
| 885 | 5.000%, 11/15/15 – NPFG Insured | No Opt. Call | AA– | 992,156 | ||||||||||||||
| 155 | 5.000%, 11/15/17 – NPFG Insured | No Opt. Call | AA– | 183,607 | ||||||||||||||
| 1,200 | 5.000%, 11/15/19 – NPFG Insured | 11/17 at 100.00 | AA– | 1,401,720 | ||||||||||||||
| 3,010 | Saint Paul Housing and Redevelopment Authority, Minnesota, Health Care Revenue Bonds, Allina Health System, Series 2009A-1, 5.000%, 11/15/24 | 11/19 at 100.00 | AA– | 3,430,076 | ||||||||||||||
| 1,000 | Saint Paul Housing and Redevelopment Authority, Minnesota, Health Care Revenue Bonds, Gillette Children’s Specialty Healthcare Project, Series 2009, 5.000%, 2/01/19 | No Opt. Call | A– | 1,149,600 | ||||||||||||||
Saint Paul Housing and Redevelopment Authority, Minnesota, Health Care Revenue Bonds, Gillette Children’s Specialty Healthcare Project, Series 2010: | ||||||||||||||||||
| 1,560 | 5.000%, 2/01/19 | 2/14 at 100.00 | A– | 1,631,386 | ||||||||||||||
| 500 | 5.000%, 2/01/20 | 2/14 at 100.00 | A– | 522,270 | ||||||||||||||
| 1,785 | Shakopee, Minnesota, Health Care Facilities Revenue Bonds, Saint Francis Regional Medical Center, Series 2004, 5.000%, 9/01/17 | 9/14 at 100.00 | A– | 1,874,893 | ||||||||||||||
| 1,840 | St. Paul Housing and Redevelopment Authority, Minnesota, Revenue Bonds, Healtheast Inc., Series 2005, 5.150%, 11/15/20 | 11/15 at 100.00 | BBB– | 1,946,886 | ||||||||||||||
St. Paul Port Authority, Minnesota, Lease Revenue Bonds, HealthEast Midway Campus, Series 2005A: | ||||||||||||||||||
| 790 | 5.250%, 5/01/15 | No Opt. Call | BB+ | 839,723 | ||||||||||||||
| 2,000 | 5.750%, 5/01/25 | 5/15 at 100.00 | BB+ | 2,096,820 | ||||||||||||||
| 1,000 | Winona Health Care Facilities Revenue Refunding Bonds, Minnesota, Winona Health Obligated Group, Series 2007, 5.000%, 7/01/20 | 7/17 at 100.00 | BBB– | 1,125,450 | ||||||||||||||
| 24 | Nuveen Investments |
| Principal Amount (000) | Description (1) | Optional Call Provisions (2) | Ratings (3) | Value | ||||||||||||||
Health Care (continued) | ||||||||||||||||||
Winona, Minnesota, Health Care Facilities Revenue Bonds, Winona Health Obligated Group, Refunding Series 2012: | ||||||||||||||||||
| $ | 485 | 4.500%, 7/01/24 | 7/21 at 100.00 | BBB– | $ | 528,005 | ||||||||||||
| 250 | 5.000%, 7/01/34 | 7/21 at 100.00 | BBB– | 269,043 | ||||||||||||||
| 51,990 | Total Health Care | 57,313,884 | ||||||||||||||||
Housing/Multifamily – 0.2% | ||||||||||||||||||
| 500 | Anoka Housing and Redevelopment Authority, Minnesota, Multifamily Housing Revenue Bonds, Woodland Park Apartments Project, Series 2011A, 5.000%, 4/01/27 | 4/19 at 100.00 | Aaa | 556,380 | ||||||||||||||
Housing/Single Family – 1.1% | ||||||||||||||||||
| 925 | Dakota County Community Development Agency, Minnesota, Single Family Mortgage Revenue Bonds, Mortgage Backed Securities Program, Series 2011A, 4.400%, 12/01/26 | 12/20 at 100.00 | AA+ | 1,041,754 | ||||||||||||||
| 940 | Minnesota Housing Finance Agency, Homeownership Finance Bonds, Mortgage-Backed Securities Program, Series 2011D, 4.375%, 7/01/26 | 7/21 at 100.00 | Aaa | 1,069,964 | ||||||||||||||
| 625 | Minnesota Housing Finance Agency, Residential Housing Finance Bonds, Series 2012A, 3.750%, 7/01/22 (Alternative Minimum Tax) | 1/22 at 100.00 | AA+ | 672,594 | ||||||||||||||
| 210 | Minnesota Housing Finance Agency, Residential Housing Finance Bonds, Series 2012C, 3.750%, 1/01/22 (Alternative Minimum Tax) | No Opt. Call | AA+ | 229,517 | ||||||||||||||
| 2,700 | Total Housing/Single Family | 3,013,829 | ||||||||||||||||
Long-Term Care – 4.6% | ||||||||||||||||||
| 565 | Center City, Minnesota, Health Care Facilities Revenue Bonds, Hazelden Foundation Project, Series 2011, 4.550%, 11/01/26 | 11/19 at 100.00 | A3 | 621,008 | ||||||||||||||
Minneapolis, Minnesota, Revenue Bonds, Walker Minneapolis Campus Project, Refunding Series 2012: | ||||||||||||||||||
| 1,400 | 5.000%, 11/15/24 | 11/22 at 100.00 | N/R | 1,496,236 | ||||||||||||||
| 1,650 | 4.750%, 11/15/28 | 11/22 at 100.00 | N/R | 1,710,951 | ||||||||||||||
| 2,000 | Moorhead, Minnesota, Senior Housing Facility Revenue Bonds, Sheyenne Crossings Project, Series 2006, 5.600%, 4/01/25 | 4/14 at 101.00 | N/R | 2,047,920 | ||||||||||||||
| 1,000 | Saint Paul Housing and Redevelopment Authority, Minnesota, Senior Housing and Health Care Revenue Refunding Bonds, Episcopal Homes Project, Series 2012A, 4.000%, 11/01/22 | No Opt. Call | N/R | 1,004,020 | ||||||||||||||
| 2,000 | Saint Paul Port Authority, Minnesota, Revenue Bonds, Amherst H. Wilder Foundation Project, Series 2010-3, 5.000%, 12/01/24 | 12/20 at 100.00 | A1 | 2,316,620 | ||||||||||||||
| 1,000 | Sartell, Minnesota, Health Care and Housing Facilities Revenue Bonds, Country Manor Campus LLC Project, Series 2012A, 5.250%, 9/01/27 | 9/22 at 100.00 | N/R | 1,060,230 | ||||||||||||||
Wayzata, Minnesota, Senior Housing Revenue Bonds, Folkestone Senior Living Community, Series 2012A: | ||||||||||||||||||
| 625 | 5.100%, 5/01/24 – AGM Insured | 5/19 at 102.00 | N/R | 665,069 | ||||||||||||||
| 310 | 5.300%, 5/01/27 | 5/19 at 102.00 | N/R | 328,904 | ||||||||||||||
| 500 | 5.300%, 11/01/27 | 5/19 at 102.00 | N/R | 530,490 | ||||||||||||||
| 515 | 5.500%, 11/01/32 | 5/19 at 102.00 | N/R | 544,453 | ||||||||||||||
| 705 | Worthington, Minnesota, Housing Revenue Refunding Bonds, Meadows of Worthington Project, Series 2007A, 5.000%, 11/01/17 | 11/14 at 101.00 | N/R | 728,378 | ||||||||||||||
| 12,270 | Total Long-Term Care | 13,054,279 | ||||||||||||||||
Materials – 0.8% | ||||||||||||||||||
| 2,100 | Seaway Port Authority of Duluth, Minnesota, Industrial Development Dock and Wharf Revenue Refunding Bonds, Cargill, Inc Project, Series 2004, 4.200%, 5/01/13 | No Opt. Call | A | 2,128,140 | ||||||||||||||
Tax Obligation/General – 20.1% | ||||||||||||||||||
| 610 | Anoka County, Minnesota, General Obligation Bonds, Capital Improvement, Series 2007A, 4.100%, 2/01/18 | 2/15 at 100.00 | Aa1 | 654,859 | ||||||||||||||
| 500 | Anoka County, Minnesota, General Obligation Bonds, Capital Improvement, Series 2007D, 5.000%, 2/01/24 | 2/17 at 100.00 | Aa1 | 579,425 | ||||||||||||||
| Nuveen Investments | 25 |
Portfolio of Investments (Unaudited)
Nuveen Minnesota Intermediate Municipal Bond Fund (continued)
November 30, 2012
| Principal Amount (000) | Description (1) | Optional Call Provisions (2) | Ratings (3) | Value | ||||||||||||||
Tax Obligation/General (continued) | ||||||||||||||||||
| $ | 1,000 | Anoka County, Minnesota, General Obligation Bonds, Capital Improvement, Series 2008A, 5.000%, 2/01/20 | 2/18 at 100.00 | Aa1 | $ | 1,193,780 | ||||||||||||
Anoka County, Minnesota, General Obligation Bonds, Capital Improvement, Series 2008C: | ||||||||||||||||||
| 285 | 4.100%, 2/01/18 | No Opt. Call | Aa1 | 333,399 | ||||||||||||||
| 595 | 4.200%, 2/01/19 | 2/18 at 100.00 | Aa1 | 694,377 | ||||||||||||||
Bemidji, Minnesota, General Obligation Bonds, Refunding Sales Tax Series 2011: | ||||||||||||||||||
| 635 | 5.500%, 2/01/23 | 2/21 at 100.00 | Aa3 | 814,908 | ||||||||||||||
| 750 | 5.500%, 2/01/24 | 2/21 at 100.00 | Aa3 | 959,333 | ||||||||||||||
| 875 | 5.500%, 2/01/25 | 2/21 at 100.00 | Aa3 | 1,113,201 | ||||||||||||||
| 1,010 | 5.500%, 2/01/26 | 2/21 at 100.00 | Aa3 | 1,281,629 | ||||||||||||||
| 1,150 | 5.500%, 2/01/27 | 2/21 at 100.00 | Aa3 | 1,453,324 | ||||||||||||||
| 2,835 | Buffalo-Hanover-Montrose Independent School District 877, Minnesota, General Obligation Bonds, Refunding Series 2012A, 4.000%, 2/01/23 | 2/22 at 100.00 | Aa2 | 3,380,823 | ||||||||||||||
| 350 | Burnsville Independent School District 191, Dakota and Scott Counties, Minnesota, General Obligation Bonds, Series 2007A, 4.200%, 2/01/25 – AGM Insured | 2/17 at 100.00 | Aa2 | 380,678 | ||||||||||||||
| 1,200 | Burnsville Independent School District 191, Dakota and Scott Counties, Minnesota, General Obligation Bonds, Series 2008A, 4.250%, 2/01/20 | 2/18 at 100.00 | Aa2 | 1,384,404 | ||||||||||||||
| 1,000 | Chaska Independent School District 112, Carver County, Minnesota, General Obligation Bonds, Series 2007A, 4.250%, 2/01/19 – NPFG Insured | 2/17 at 100.00 | Aa2 | 1,132,950 | ||||||||||||||
| 450 | Chatfield Independent School District 227, Olmstead County, Minnesota, General Obligation Bonds, Series 2007A, 4.000%, 2/01/18 – AGM Insured | No Opt. Call | AA+ | 521,910 | ||||||||||||||
Dakota County Community Agency, Minnesota, Governmental Housing Development General Obligation Bonds, Senior Housing Facilities, Series 2007A: | ||||||||||||||||||
| 510 | 4.375%, 1/01/19 | 7/17 at 100.00 | AAA | 580,207 | ||||||||||||||
| 215 | 4.500%, 1/01/20 | 7/17 at 100.00 | AAA | 245,141 | ||||||||||||||
| 1,160 | Duluth Independent School District 709, Saint Louis County, Minnesota, General Obligation Bonds, Series 2008A, 4.250%, 2/01/22 – AGM Insured | 2/18 at 100.00 | Aa2 | 1,311,044 | ||||||||||||||
Duluth, Minnesota, General Obligation Bonds, DECC Improvement Series 2008A: | ||||||||||||||||||
| 1,160 | 4.500%, 2/01/21 | 2/18 at 100.00 | Aa2 | 1,335,578 | ||||||||||||||
| 465 | 4.500%, 2/01/22 | 2/18 at 100.00 | Aa2 | 535,382 | ||||||||||||||
| 1,100 | 4.625%, 2/01/24 | 2/18 at 100.00 | Aa2 | 1,262,668 | ||||||||||||||
Fridley Independent School District 14, Anoka County, Minnesota, General Obligation Bonds, Series 2012B: | ||||||||||||||||||
| 1,000 | 3.000%, 2/01/23 | No Opt. Call | Aa2 | 1,086,730 | ||||||||||||||
| 1,025 | 3.000%, 2/01/26 | No Opt. Call | Aa2 | 1,078,454 | ||||||||||||||
| 455 | Greenway Independent School District 316, Itasca County, Minnesota, General Obligation Bonds, Alternate Facilities, Series 2011C, 4.250%, 2/01/25 | 2/19 at 100.00 | AA+ | 512,780 | ||||||||||||||
Independent School Distirct 621, Mounds View, Minnesota, General Obligation Bonds, Crossover Refunding Series 2009A: | ||||||||||||||||||
| 625 | 3.250%, 2/01/17 | No Opt. Call | Aa2 | 693,125 | ||||||||||||||
| 750 | 4.000%, 2/01/22 | 2/19 at 100.00 | Aa2 | 874,365 | ||||||||||||||
| 1,000 | Independent School District 284, Wayzata, Hennepin County, Minnesota, General Obligation Bonds, Alternative Facilities Series 2012A, 3.000%, 2/01/23 | 2/21 at 100.00 | AAA | 1,102,690 | ||||||||||||||
| 2,000 | Independent School District 833, South Washington County, Minnesota, General Obligation Bonds, Crossover Refunding School Building Series 2010A, 4.000%, 2/01/22 | 2/19 at 100.00 | AA+ | 2,305,780 | ||||||||||||||
Mankato, Minnesota, General Obligation Bonds, Improvement Series 2009A: | ||||||||||||||||||
| 765 | 3.500%, 2/01/18 | No Opt. Call | AA | 866,523 | ||||||||||||||
| 775 | 3.500%, 2/01/19 | 2/18 at 100.00 | AA | 875,254 | ||||||||||||||
| 26 | Nuveen Investments |
| Principal Amount (000) | Description (1) | Optional Call Provisions (2) | Ratings (3) | Value | ||||||||||||||
Tax Obligation/General (continued) | ||||||||||||||||||
| $ | 1,135 | Minneapolis Special School District 1, Hennepin County, Minnesota, General Obligation Bonds, Series 2007, 4.000%, 2/01/18 | 2/15 at 100.00 | AA+ | $ | 1,214,598 | ||||||||||||
| 1,000 | Minneapolis, Minnesota, Limited Tax Supported Development Revenue Bonds, Common Bond Fund Series 2007-2A, 5.125%, 6/01/22 (Alternative Minimum Tax) | 6/17 at 100.00 | A+ | 1,083,180 | ||||||||||||||
| 1,690 | Minnesota State, General Obligation Bonds, Refunding Series 2008C, 5.000%, 8/01/19 | No Opt. Call | AA+ | 2,145,421 | ||||||||||||||
Moorhead, Minnesota, General Obligation Bonds, Flood Mitigation Series 2012A: | ||||||||||||||||||
| 625 | 3.000%, 2/01/23 – AMBAC Insured | 2/22 at 100.00 | Aa3 | 668,344 | ||||||||||||||
| 715 | 3.000%, 2/01/26 – AMBAC Insured | 2/22 at 100.00 | Aa3 | 743,643 | ||||||||||||||
Moorhead, Minnesota, General Obligation Bonds, Improvement Refunding Series 2012C: | ||||||||||||||||||
| 600 | 3.000%, 2/01/20 – AMBAC Insured | No Opt. Call | Aa3 | 663,144 | ||||||||||||||
| 425 | 3.000%, 2/01/23 | 2/22 at 100.00 | Aa3 | 454,474 | ||||||||||||||
| 805 | 3.000%, 2/01/24 – AMBAC Insured | 2/22 at 100.00 | Aa3 | 854,073 | ||||||||||||||
Moorhead, Minnesota, General Obligation Bonds, Improvement Refunding Series 2012D: | ||||||||||||||||||
| 535 | 4.000%, 2/01/21 | No Opt. Call | Aa3 | 633,087 | ||||||||||||||
| 800 | 3.000%, 2/01/23 – AGM Insured | 2/22 at 100.00 | Aa3 | 871,536 | ||||||||||||||
| 1,180 | Osseo Independent School District 279 Hennepin County, Minnesota, General Obligation Bonds, Series 2010A, 4.000%, 2/01/21 | 8/18 at 100.00 | AA+ | 1,352,386 | ||||||||||||||
| 620 | OtterTail County, Minnesota, General Obligation Bonds, Disposal System – Prairie Lakes Municipal Authority, Series 2011, 4.750%, 5/01/27 (Alternative Minimum Tax) | 5/21 at 100.00 | AA+ | 715,387 | ||||||||||||||
| 1,605 | Puerto Rico, General Obligation and Public Improvement Bonds, Series 1998, 6.000%, 7/01/14 – NPFG Insured | No Opt. Call | Baa1 | 1,704,735 | ||||||||||||||
| 1,000 | Puerto Rico, General Obligation and Public Improvement Bonds, Series 2002A, 5.500%, 7/01/17 – SYNCORA GTY Insured | No Opt. Call | Baa1 | 1,100,940 | ||||||||||||||
| 1,000 | Puerto Rico, General Obligation Bonds, Public Improvement Refunding Series 2007A, 5.500%, 7/01/18 | No Opt. Call | Baa1 | 1,115,690 | ||||||||||||||
| 575 | Puerto Rico, General Obligation Bonds, Public Improvement Series 2008A, 5.500%, 7/01/18 | No Opt. Call | Baa1 | 641,522 | ||||||||||||||
| 520 | Ramsey County, Minnesota, General Obligation Bonds, Capital Improvement, Refunding Series 2010A, 4.000%, 2/01/18 | No Opt. Call | AAA | 606,996 | ||||||||||||||
| 1,040 | Ramsey, Minnesota, General Obligation Bonds, Capital Improvement Plan Series 2012A, 3.000%, 12/15/26 | 12/21 at 100.00 | AA+ | 1,096,160 | ||||||||||||||
| 500 | Robbinsdale Independent School District 281, Hennepin County, Minnesota, General Obligation Bonds, Series 2008B, 4.500%, 2/01/21 | 2/18 at 100.00 | Aa2 | 578,190 | ||||||||||||||
| 1,140 | Rochester, Minnesota, General Obligation Waste Water Bonds, Series 2007A, 4.000%, 12/01/18 | 6/17 at 100.00 | AAA | 1,302,929 | ||||||||||||||
| 1,135 | Roseville, Minnesota, General Obligation Bonds, Series 2012A, 3.000%, 3/01/27 | 3/23 at 100.00 | Aaa | 1,213,928 | ||||||||||||||
| 1,000 | Saint Cloud, Minnesota, General Obligation Bonds, Library Sales Tax Series 2006B, 4.000%, 2/01/18 – AGM Insured | 2/16 at 100.00 | AA+ | 1,100,110 | ||||||||||||||
Saint Peter, Minnesota, General Obligation Bonds, Hospital Crossover, Refunding Series 2010A: | ||||||||||||||||||
| 550 | 3.000%, 9/01/18 – AGM Insured | No Opt. Call | AA– | 595,551 | ||||||||||||||
| 515 | 3.150%, 9/01/19 – AGM Insured | No Opt. Call | AA– | 566,866 | ||||||||||||||
| 585 | 3.300%, 9/01/20 – AGM Insured | 9/19 at 100.00 | AA– | 644,383 | ||||||||||||||
| 400 | Todd, Morrison, Cass and Wadena Counties United Hospital District, Minnesota, General Obligation Bonds, Lakewood Health System, Series 2004, 4.000%, 12/01/13 | No Opt. Call | A2 | 414,280 | ||||||||||||||
| Nuveen Investments | 27 |
Portfolio of Investments (Unaudited)
Nuveen Minnesota Intermediate Municipal Bond Fund (continued)
November 30, 2012
| Principal Amount (000) | Description (1) | Optional Call Provisions (2) | Ratings (3) | Value | ||||||||||||||
Tax Obligation/General (continued) | ||||||||||||||||||
Wadena-Deer Creek Independent School District 2155, Wadena, Otter Tail, and Todd Counties, Minnesota, General Obligation Bonds, Series 2010,: | ||||||||||||||||||
| $ | 430 | 4.000%, 2/01/18 | 2/17 at 100.00 | AA+ | $ | 486,141 | ||||||||||||
| 410 | 4.000%, 2/01/19 | 2/17 at 100.00 | AA+ | 462,414 | ||||||||||||||
| 640 | Wright County, Minnesota, General Obligation Bonds, Jail Series 2007A, 4.500%, 12/01/20 | 12/17 at 100.00 | AA+ | 742,829 | ||||||||||||||
| 200 | Zumbrota-Mazeppa Independent School District 2805, Wabasha County, Minnesota, General Obligation Bonds, Alternate Facilities Series 2008A, 4.000%, 2/01/19 | 2/18 at 100.00 | AA+ | 230,294 | ||||||||||||||
| 49,625 | Total Tax Obligation/General | 56,547,952 | ||||||||||||||||
Tax Obligation/Limited – 7.6% | ||||||||||||||||||
| 1,910 | Duluth Independent School District 709, Minnesota, Certificates of Participation, Series 2008B, 4.000%, 2/01/19 | No Opt. Call | AA+ | 2,248,605 | ||||||||||||||
| 780 | Government of Guam, Business Privilege Tax Bonds, Series 2011A, 5.000%, 1/01/31 | 1/22 at 100.00 | A | 900,892 | ||||||||||||||
Hennepin County, Minnesota, Sales Tax Revenue Bonds, Ballpark Project, Second Lien Series 2008B: | ||||||||||||||||||
| 665 | 4.375%, 12/15/22 | 12/17 at 100.00 | AA+ | 763,985 | ||||||||||||||
| 1,000 | 5.000%, 12/15/29 | 12/17 at 100.00 | AA+ | 1,161,780 | ||||||||||||||
Minneapolis, Minnesota, Limited Tax Supported Development Revenue Bonds, Common Bond Fund Series 2006-1A: | ||||||||||||||||||
| 480 | 4.550%, 12/01/13 (Alternative Minimum Tax) | No Opt. Call | A+ | 493,963 | ||||||||||||||
| 505 | 4.625%, 12/01/14 (Alternative Minimum Tax) | No Opt. Call | A+ | 532,704 | ||||||||||||||
| 2,000 | Minneapolis, Minnesota, Limited Tax Supported Development Revenue Bonds, Common Bond Fund Series 2010-2A, 4.625%, 12/01/20 | No Opt. Call | A+ | 2,318,640 | ||||||||||||||
| 1,000 | Minneapolis, Minnesota, Tax Increment Revenue Bonds, Grant Park Project, Series 2006, 5.200%, 2/01/22 | 2/14 at 100.00 | N/R | 985,470 | ||||||||||||||
| 1,040 | Minneapolis, Minnesota, Tax Increment Revenue Bonds, Village at St. Anthony Falls Project, Refunding Series 2004, 5.000%, 2/01/17 | 2/13 at 101.00 | N/R | 1,055,163 | ||||||||||||||
| 570 | Minneapolis, Minnesota, Tax Increment Revenue Bonds, Village at St. Anthony Falls Project, Refunding Series 2005, 5.300%, 2/01/21 | 2/14 at 100.00 | N/R | 574,646 | ||||||||||||||
| 1,185 | Minnesota Housing Finance Agency, Nonprofit Housing Bonds, State Appropriation Series 2011, 5.250%, 8/01/27 | 8/21 at 100.00 | AA | 1,422,711 | ||||||||||||||
| 1,150 | Minnesota State, General Fund Appropriation Refunding Bonds, Series 2012B, 5.000%, 3/01/29 | No Opt. Call | AA | 1,428,542 | ||||||||||||||
| 1,000 | Northeast Metropolitan Intermediate School District 916, White Bear Lake, Minnesota, Certificates of Particpation, Series 2004, 4.250%, 1/01/15 | 1/14 at 100.00 | Aa2 | 1,034,630 | ||||||||||||||
Pine County Housing and Redevelopment Authority, Minnesota, Public Project Revenue Bonds, Series 2005A: | ||||||||||||||||||
| 465 | 4.500%, 2/01/16 | No Opt. Call | BBB+ | 522,004 | ||||||||||||||
| 385 | 4.500%, 2/01/17 | 2/16 at 100.00 | BBB+ | 432,197 | ||||||||||||||
Saint Paul Housing and Redevelopment Authority, Minnesota, Recreational Faility Lease Revenue Bonds, Jimmy Lee Recreational Center, Series 2008: | ||||||||||||||||||
| 180 | 4.500%, 12/01/19 | 12/17 at 100.00 | AA+ | 207,020 | ||||||||||||||
| 290 | 4.500%, 12/01/20 | 12/17 at 100.00 | AA+ | 330,684 | ||||||||||||||
| 2,415 | St. Paul Port Authority, Minnesota, Lease Revenue Bonds, Building at Cedar Street, Series 2002, 5.000%, 12/01/19 | 12/12 at 100.00 | AA | 2,424,298 | ||||||||||||||
Stevens County Housing and Redevelopment Authority, Minnesota, Public Project Revenue Bonds, Series 2009A: | ||||||||||||||||||
| 315 | 4.000%, 2/01/18 | No Opt. Call | A+ | 350,737 | ||||||||||||||
| 325 | 4.000%, 2/01/19 | No Opt. Call | A+ | 367,357 | ||||||||||||||
| 340 | 4.100%, 2/01/20 | No Opt. Call | A+ | 390,572 | ||||||||||||||
| 28 | Nuveen Investments |
| Principal Amount (000) | Description (1) | Optional Call Provisions (2) | Ratings (3) | Value | ||||||||||||||
Tax Obligation/Limited (continued) | ||||||||||||||||||
Virgin Islands Public Finance Authority, Matching Fund Loan Notes Revenue Bonds, Senior Lien Series 2010A: | ||||||||||||||||||
| $ | 310 | 5.000%, 10/01/20 | No Opt. Call | BBB+ | $ | 361,472 | ||||||||||||
| 975 | 5.000%, 10/01/29 | 10/20 at 100.00 | BBB+ | 1,083,956 | ||||||||||||||
| 19,285 | Total Tax Obligation/Limited | 21,392,028 | ||||||||||||||||
Transportation – 5.1% | ||||||||||||||||||
Minneapolis-St. Paul Metropolitan Airports Commission, Minnesota, Airport Revenue Bonds, Refunding Senior Lien Series 2009A: | ||||||||||||||||||
| 1,000 | 4.000%, 1/01/19 | No Opt. Call | AA– | 1,155,270 | ||||||||||||||
| 1,000 | 5.000%, 1/01/20 | 1/19 at 100.00 | AA– | 1,214,190 | ||||||||||||||
| 500 | 5.000%, 1/01/21 | 1/19 at 100.00 | AA– | 601,260 | ||||||||||||||
| 2,145 | Minneapolis-St. Paul Metropolitan Airports Commission, Minnesota, Airport Revenue Bonds, Subordinate Lien Series 2005B, 5.000%, 1/01/20 – AMBAC Insured (Alternative Minimum Tax) | 1/15 at 100.00 | A | 2,308,492 | ||||||||||||||
| 2,330 | Minneapolis-St. Paul Metropolitan Airports Commission, Minnesota, Airport Revenue Bonds, Subordinate Lien, Refunding Series 2011A, 5.000%, 1/01/25 | 1/21 at 100.00 | A | 2,779,410 | ||||||||||||||
Minneapolis-St. Paul Metropolitan Airports Commission, Minnesota, Airport Revenue Bonds, Subordinate Lien, Refunding Series 2012B: | ||||||||||||||||||
| 1,200 | 5.000%, 1/01/29 | 1/22 at 100.00 | A | 1,433,316 | ||||||||||||||
| 1,000 | 5.000%, 1/01/30 | 1/22 at 100.00 | A | 1,188,190 | ||||||||||||||
St Paul Housing and Redevelopment Authority, Minnesota, Parking Revenue Bonds, Parking Facilities Project, Refunding Series 2010A: | ||||||||||||||||||
| 805 | 4.000%, 8/01/21 | 8/18 at 102.00 | A+ | 904,651 | ||||||||||||||
| 895 | 4.125%, 8/01/23 | 8/18 at 102.00 | A+ | 998,936 | ||||||||||||||
| 935 | 4.250%, 8/01/24 | 8/18 at 102.00 | A+ | 1,049,182 | ||||||||||||||
| 575 | 4.250%, 8/01/25 | 8/18 at 102.00 | A+ | 635,111 | ||||||||||||||
| 12,385 | Total Transportation | 14,268,008 | ||||||||||||||||
U.S. Guaranteed – 4.5% (4) | ||||||||||||||||||
Andover Economic Development Authority, Minnesota, Public Facility Lease Revenue Bonds, Andover Community Center, Series 2004: | ||||||||||||||||||
| 730 | 5.000%, 2/01/19 (Pre-refunded 2/01/14) | 2/14 at 100.00 | AA (4) | 764,135 | ||||||||||||||
| 495 | 5.000%, 2/01/19 (Pre-refunded 2/01/14) | 2/14 at 100.00 | AA (4) | 518,146 | ||||||||||||||
Bemidji, Minnesota, Health Care Facilities First Mortgage Revenue Bonds, North Country Health Services, Refunding Series 2006: | ||||||||||||||||||
| 500 | 5.000%, 9/01/17 (Pre-refunded 9/01/16) | 9/16 at 100.00 | N/R (4) | 578,240 | ||||||||||||||
| 1,050 | 5.000%, 9/01/18 (Pre-refunded 9/01/16) | 9/16 at 100.00 | N/R (4) | 1,214,304 | ||||||||||||||
| 1,110 | 5.000%, 9/01/19 (Pre-refunded 9/01/16) | 9/16 at 100.00 | N/R (4) | 1,283,693 | ||||||||||||||
Duluth Economic Development Authority, Minnesota, Healthcare Facilities Revenue Bonds, Benedictine Health System – St. Mary’s Duluth Clinic, Series 2004: | ||||||||||||||||||
| 2,045 | 5.375%, 2/15/22 (Pre-refunded 2/15/14) | 2/14 at 100.00 | N/R (4) | 2,166,800 | ||||||||||||||
| 85 | 5.250%, 2/15/28 (Pre-refunded 2/15/14) | 2/14 at 100.00 | N/R (4) | 89,935 | ||||||||||||||
| 1,260 | Lakeville Independent School District 194, Dakota County, Minnesota, General Obligation Bonds, Series 2002A, 5.000%, 2/01/22 (Pre-refunded 2/01/13) – FGIC Insured | 2/13 at 100.00 | Aa2 (4) | 1,268,996 | ||||||||||||||
| 345 | Marshall, Minnesota, Revenue Bonds, Avera Marshall Regional Medical Center, Series 2006, 4.500%, 11/01/13 (ETM) | No Opt. Call | N/R (4) | 356,920 | ||||||||||||||
| 1,155 | Marshall, Minnesota, Revenue Bonds, Avera Marshall Regional Medical Center, Series 2006, 4.750%, 11/01/20 (Pre-refunded 11/01/15) | 11/15 at 100.00 | BBB+ (4) | 1,278,423 | ||||||||||||||
| 2,200 | Minneapolis-St. Paul Metropolitan Airports Commission, Minnesota, Airport Revenue Bonds, Series 2003A, 5.000%, 1/01/20 (Pre-refunded 1/01/13) – NPFG Insured | 1/13 at 100.00 | A (4) | 2,209,108 | ||||||||||||||
| 515 | Moorhead, Minnesota, General Obligation Bonds, Improvement Refunding Series 2012C, 3.000%, 2/01/25 – AGM Insured (ETM) | 2/22 at 100.00 | Aa3 (4) | 542,068 | ||||||||||||||
| Nuveen Investments | 29 |
Portfolio of Investments (Unaudited)
Nuveen Minnesota Intermediate Municipal Bond Fund (continued)
November 30, 2012
| Principal Amount (000) | Description (1) | Optional Call Provisions (2) | Ratings (3) | Value | ||||||||||||||
U.S. Guaranteed (4) (continued) | ||||||||||||||||||
| $ | 495 | Puerto Rico, Highway Revenue Bonds, Highway and Transportation Authority, Series 1993X, 5.500%, 7/01/13 – NPFG Insured (ETM) | No Opt. Call | Baa2 (4) | $ | 510,286 | ||||||||||||
| 11,985 | Total U.S. Guaranteed | 12,781,054 | ||||||||||||||||
Utilities – 11.0% | ||||||||||||||||||
| 775 | Central Minnesota Municipal Power Agency, Revenue Bonds, Brookings – Southeast Twin Cities Transmission Project, Series 2012, 5.000%, 1/01/20 | 1/15 at 100.00 | A– | 943,028 | ||||||||||||||
| 1,010 | Chaska, Minnesota, Electric Revenue Bonds, Generating Facility Project, Refunding Series 2005A, 4.200%, 10/01/15 | No Opt. Call | A3 | 1,098,809 | ||||||||||||||
| 2,230 | Cohasset, Minnesota, Pollution Control Revenue Bonds, Allete Inc., Series 2004, 4.950%, 7/01/22 – RAAI Insured | 7/14 at 100.00 | A2 | 2,315,810 | ||||||||||||||
Guam Power Authority, Revenue Bonds, Series 2012A: | ||||||||||||||||||
| 1,140 | 5.000%, 10/01/25 – AGM Insured | 10/22 at 100.00 | AA– | 1,340,674 | ||||||||||||||
| 580 | 5.000%, 10/01/26 – AGM Insured | 10/22 at 100.00 | AA– | 676,808 | ||||||||||||||
Hutchinson, Minnesota, Public Utility Revenue Bonds, Refunding Series 2012A: | ||||||||||||||||||
| 750 | 4.000%, 12/01/20 | No Opt. Call | A1 | 878,378 | ||||||||||||||
| 500 | 5.000%, 12/01/25 | 12/22 at 100.00 | A1 | 621,380 | ||||||||||||||
| 670 | 5.000%, 12/01/26 | 12/22 at 100.00 | A1 | 826,579 | ||||||||||||||
| 500 | Litchfield, Minnesota, Electric Utility Revenue Bonds, Series 2009C, 5.000%, 2/01/29 – AGC Insured | 2/18 at 100.00 | AA– | 562,445 | ||||||||||||||
Marshall, Minnesota, Public Utility Revenue Bonds, Series 2009A: | ||||||||||||||||||
| 315 | 3.500%, 7/01/16 – AGC Insured | No Opt. Call | AA– | 340,528 | ||||||||||||||
| 275 | 3.500%, 7/01/17 – AGC Insured | No Opt. Call | AA– | 301,978 | ||||||||||||||
| 340 | 3.750%, 7/01/18 – AGC Insured | No Opt. Call | AA– | 383,078 | ||||||||||||||
Minnesota Municipal Power Agency, Electric Revenue Bonds, Refunding Series 2007: | ||||||||||||||||||
| 420 | 4.125%, 10/01/17 | No Opt. Call | A3 | 473,962 | ||||||||||||||
| 1,000 | 5.250%, 10/01/22 | 10/17 at 100.00 | A3 | 1,186,610 | ||||||||||||||
| 300 | Minnesota Municipal Power Agency, Electric Revenue Bonds, Refunding Series 2010A, 5.000%, 10/01/14 | No Opt. Call | A3 | 322,962 | ||||||||||||||
Northern Municipal Power Agency, Minnesota, Electric System Revenue Bonds, Refunding Series 2007A: | ||||||||||||||||||
| 380 | 5.000%, 1/01/13 – AMBAC Insured | No Opt. Call | A2 | 381,482 | ||||||||||||||
| 460 | 5.000%, 1/01/17 – AMBAC Insured | No Opt. Call | A2 | 533,186 | ||||||||||||||
| 1,050 | 5.000%, 1/01/19 – AGC Insured | 1/18 at 100.00 | AA– | 1,248,282 | ||||||||||||||
| 2,095 | Northern Municipal Power Agency, Minnesota, Electric System Revenue Bonds, Refunding Series 2008A, 5.000%, 1/01/21 – AGC Insured | 1/18 at 100.00 | AA– | 2,467,931 | ||||||||||||||
| 2,840 | Northern Municipal Power Agency, Minnesota, Electric System Revenue Bonds, Series 2010A-1, 5.000%, 1/01/20 | No Opt. Call | A2 | 3,511,206 | ||||||||||||||
| 295 | Shakopee Public Utilities Commission, Minnesota, Public Utilities Crossover Refunding Revenue Bonds, Series 2006A, 4.250%, 2/01/18 – AGM Insured | 2/15 at 100.00 | Aa3 | 316,057 | ||||||||||||||
Southern Minnesota Municipal Power Agency, Power Supply System Revenue Bonds, Series 1994A: | ||||||||||||||||||
| 3,500 | 0.000%, 1/01/20 – NPFG Insured | No Opt. Call | A+ | 3,002,580 | ||||||||||||||
| 5,000 | 0.000%, 1/01/21 – NPFG Insured | No Opt. Call | A+ | 4,114,550 | ||||||||||||||
| 2,120 | Southern Minnesota Municipal Power Agency, Power Supply System Revenue Bonds, Series 2002A, 5.250%, 1/01/14 – AMBAC Insured | No Opt. Call | A+ | 2,232,869 | ||||||||||||||
| 725 | Western Minnesota Municipal Power Agency, Power Supply Revenue Bonds, Refunding Series 2012A, 3.000%, 1/01/28 | 1/23 at 100.00 | Aa3 | 755,160 | ||||||||||||||
| 29,270 | Total Utilities | 30,836,332 | ||||||||||||||||
Water and Sewer – 0.3% | ||||||||||||||||||
| 500 | Puerto Rico Aqueduct and Sewerage Authority, Revenue Bonds, Senior Lien Series 2008A, 5.000%, 7/01/16 – AGC Insured | No Opt. Call | AA– | 553,755 | ||||||||||||||
| 30 | Nuveen Investments |
| Principal Amount (000) | Description (1) | Optional Call Provisions (2) | Ratings (3) | Value | ||||||||||||||
Water and Sewer (continued) | ||||||||||||||||||
| $ | 275 | Saint Paul, Minnesota, Sewer Revenue Bonds, Series 2012C, 3.000%, 12/01/23 | 6/20 at 100.00 | AAA | $ | 293,477 | ||||||||||||
| 775 | Total Water and Sewer | 847,232 | ||||||||||||||||
| $ | 253,800 | Total Municipal Bonds (cost $256,045,918) | 281,325,538 | |||||||||||||||
| Shares | Description (1) | Value | ||||||||||||||||
SHORT-TERM INVESTMENTS – 0.0% | ||||||||||||||||||
Money Market Funds – 0.0% | ||||||||||||||||||
| 66,864 | Federated Minnesota Municipal Cash Trust, 0.010% (5) | $ | 66,864 | |||||||||||||||
Total Short-Term Investments (cost $66,864) | 66,864 | |||||||||||||||||
Total Investments (cost $256,112,782) – 100.1% | 281,392,402 | |||||||||||||||||
Other Assets Less Liabilities – (0.1)% | (381,520) | |||||||||||||||||
Net Assets – 100% | $ | 281,010,882 | ||||||||||||||||
| (1) | All percentages shown in the Portfolio of Investments are based on net assets. |
| (2) | Optional Call Provisions: Dates (month and year) and prices of the earliest optional call or redemption. There may be other call provisions at varying prices at later dates. Certain mortgage-backed securities may be subject to periodic principal paydowns. |
| (3) | Ratings: Using the highest of Standard & Poor’s Group (“Standard & Poor’s”), Moody’s Investors Service, Inc. (“Moody’s”) or Fitch, Inc. (“Fitch”) rating. Ratings below BBB by Standard & Poor’s, Baa by Moody’s or BBB by Fitch are considered to be below investment grade. Holdings designated N/R are not rated by any of these national rating agencies. |
| (4) | Backed by an escrow or trust containing sufficient U.S. Government or U.S. Government agency securities, which ensure the timely payment of principal and interest. Certain bonds backed by U.S. Government or agency securities are regarded as having an implied rating equal to the rating of such securities. |
| (5) | The rate shown is the annualized seven-day effective yield as of November 30, 2012. |
| N/R | Not rated. |
| WI/DD | Investment, or portion of investment, purchased on a when-issued or delayed delivery basis. |
| (ETM) | Escrowed to maturity. |
See accompanying notes to financial statements.
| Nuveen Investments | 31 |
Portfolio of Investments (Unaudited)
Nuveen Minnesota Municipal Bond Fund
November 30, 2012
| Principal Amount (000) | Description (1) | Optional Call Provisions (2) | Ratings (3) | Value | ||||||||||||||
Consumer Staples – 4.3% | ||||||||||||||||||
| $ | 1,800 | Moorhead, Minnesota, Recovery Zone Facility Revenue Bonds, American Crystal Sugar Company Project, Series 2010, 5.650%, 6/01/27 | 7/20 at 100.00 | BBB+ | $ | 2,048,328 | ||||||||||||
| 7,025 | Tobacco Securitization Authority, Minnesota, Tobacco Settlement Revenue Bonds, Tax-Exempt Series 2011B, 5.250%, 3/01/31 | 3/22 at 100.00 | A– | 7,910,219 | ||||||||||||||
| 8,825 | Total Consumer Staples | 9,958,547 | ||||||||||||||||
Education and Civic Organizations – 16.0% | ||||||||||||||||||
| 660 | Anoka County, Minnesota, Charter School Lease Revenue Bonds, Spectrum Building Company, Series 2012A, 5.000%, 6/01/43 (WI/DD, Settling 12/11/12) | 6/22 at 100.00 | BBB– | 677,068 | ||||||||||||||
| 1,500 | Baytown Township, Minnesota, Lease Revenue Bonds, Saint Croix Preparatory Academy Project, Series 2008A, 7.000%, 8/01/38 | 8/16 at 102.00 | BB | 1,612,800 | ||||||||||||||
| 1,000 | Baytown Township, Minnesota, Lease Revenue Bonds, Saint Croix Preparatory Academy Project, Series 2008, 5.750%, 8/01/42 | 8/16 at 102.00 | BB | 1,016,810 | ||||||||||||||
| 800 | Chaska, Minnesota, Lease Revenue Bonds, World Learner School Project, Series, 8.000%, 12/01/43 | 12/21 at 100.00 | BB+ | 938,656 | ||||||||||||||
City of Woodbury, Minnesota, Charter School Lease Revenue Bonds, Math and Science Academy Building Company, Series 2012A: | ||||||||||||||||||
| 220 | 5.000%, 12/01/32 (WI/DD, Settling 12/03/12) | 12/22 at 100.00 | BBB– | 232,027 | ||||||||||||||
| 785 | 5.000%, 12/01/43 (WI/DD, Settling 12/03/12) | 12/22 at 100.00 | BBB– | 805,512 | ||||||||||||||
| 1,750 | Duluth Housing & Redevelopment Authority, Minnesota, Lease Revenue Bonds, Duluth Public Schools Academy, Series 2010A, 5.600%, 11/01/30 | 11/18 at 102.00 | BBB– | 1,842,435 | ||||||||||||||
Minneapolis, Minnesota, Revenue Bonds, National Marrow Donor Program Project, Series 2010: | ||||||||||||||||||
| 125 | 4.250%, 8/01/20 | 8/18 at 100.00 | BBB | 133,134 | ||||||||||||||
| 4,100 | 4.875%, 8/01/25 | 8/18 at 100.00 | BBB | 4,326,771 | ||||||||||||||
Minnesota Higher Education Facilities Authority, Revenue Bonds, Bethel University, Refunding Series 2007-6-R: | ||||||||||||||||||
| 1,725 | 5.500%, 5/01/26 | 5/17 at 100.00 | N/R | 1,841,041 | ||||||||||||||
| 820 | 5.500%, 5/01/27 | 5/17 at 100.00 | N/R | 873,448 | ||||||||||||||
| 1,500 | 5.500%, 5/01/37 | 5/17 at 100.00 | N/R | 1,582,185 | ||||||||||||||
| 275 | Minnesota Higher Education Facilities Authority, Revenue Bonds, College of St. Benedict, Series 2011-7M, 5.125%, 3/01/36 | 3/20 at 100.00 | Baa1 | 298,166 | ||||||||||||||
| 1,835 | Minnesota Higher Education Facilities Authority, Revenue Bonds, College of St. Scholastica, Inc., Series 2011-7J, 6.300%, 12/01/40 | 12/19 at 100.00 | Baa2 | 2,148,546 | ||||||||||||||
Minnesota Higher Education Facilities Authority, Revenue Bonds, College of St. Scholastica, Inc., Series 2012-7R: | ||||||||||||||||||
| 500 | 4.250%, 12/01/27 | 12/22 at 100.00 | Baa2 | 545,845 | ||||||||||||||
| 500 | 4.000%, 12/01/32 | 12/22 at 100.00 | Baa2 | 527,645 | ||||||||||||||
| 1,000 | Minnesota Higher Education Facilities Authority, Revenue Bonds, Gustavus Adolfus College, Series 2010-7-B, 5.000%, 10/01/31 | 10/19 at 100.00 | A3 | 1,166,080 | ||||||||||||||
Minnesota Higher Education Facilities Authority, Revenue Bonds, Hamline University, Series 2011-7K1: | ||||||||||||||||||
| 625 | 6.000%, 10/01/32 | 10/21 at 100.00 | Baa2 | 755,256 | ||||||||||||||
| 2,000 | 6.000%, 10/01/40 | 10/21 at 100.00 | Baa2 | 2,369,580 | ||||||||||||||
| 30 | Minnesota Higher Education Facilities Authority, Revenue Bonds, Minneapolis College of Art and Design, Refunding Series 2006-6-K, 5.000%, 5/01/26 | 5/15 at 100.00 | Baa2 | 31,312 | ||||||||||||||
Minnesota Higher Education Facilities Authority, Revenue Bonds, Saint Catherine University, Series 2012-7Q: | ||||||||||||||||||
| 325 | 5.000%, 10/01/25 | 10/22 at 100.00 | Baa1 | 384,709 | ||||||||||||||
| 280 | 5.000%, 10/01/26 | 10/22 at 100.00 | Baa1 | 330,652 | ||||||||||||||
| 210 | 5.000%, 10/01/27 | 10/22 at 100.00 | Baa1 | 246,710 | ||||||||||||||
| 115 | Minnesota Higher Education Facilities Authority, Revenue Bonds, University of Saint Thomas, Series 2009-7A, 5.000%, 10/01/39 | 10/19 at 100.00 | A2 | 131,445 | ||||||||||||||
| 32 | Nuveen Investments |
| Principal Amount (000) | Description (1) | Optional Call Provisions (2) | Ratings (3) | Value | ||||||||||||||
Education and Civic Organizations (continued) | ||||||||||||||||||
| $ | 80 | Minnesota Higher Education Facilities Authority, Revenue Bonds, Vermillion Community College, Series 1993-3-T, 6.000%, 1/01/13 | No Opt. Call | N/R | $ | 80,185 | ||||||||||||
| 1,760 | Moorhead, Minnesota, Golf Course Revneue Refunding Bonds, Series 1998B, 5.875%, 12/01/21 | 12/12 at 100.00 | N/R | 1,761,390 | ||||||||||||||
| 1,695 | Saint Paul Housing & Redevelopment Authority , Minnesota, Charter School Lease Revenue Bonds, Hmong Education Reform Company, Series 2012A, 5.500%, 9/01/43 | 9/20 at 101.00 | BB+ | 1,726,866 | ||||||||||||||
| 1,500 | Saint Paul Housing & Redevelopment Authority, Minnesota, Charter School Lease Revenue Bonds, Nova Classical Academy, Series 2011A, 6.625%, 9/01/42 | 9/21 at 100.00 | BBB– | 1,663,305 | ||||||||||||||
| 2,000 | Saint Paul Housing and Redevelopment Authority, Minnesota, Educational Facility Revenue Refunding Bonds, Saint Paul Academy and Summit School Project, Series 2007, 5.000%, 10/01/24 | 10/17 at 100.00 | A3 | 2,231,680 | ||||||||||||||
| 2,550 | Saint Paul Housing and Redevelopment Authority, Minnesota, Lease Revenue Bonds, Community of Peace Academy Project, Series 2006A, 5.000%, 12/01/36 | 12/15 at 100.00 | BBB– | 2,546,456 | ||||||||||||||
| 1,540 | University of Minnesota, General Revenue Bonds, Series 2011A, 5.250%, 12/01/29 | 12/20 at 100.00 | Aa1 | 1,925,878 | ||||||||||||||
| 33,805 | Total Education and Civic Organizations | 36,753,593 | ||||||||||||||||
Health Care – 20.3% | ||||||||||||||||||
| 2,470 | Chippewa County, Minnesota, Gross Revenue Hospital Bonds, Montevideo Hospital Project, Series 2007, 5.500%, 3/01/37 | 3/17 at 100.00 | N/R | 2,602,540 | ||||||||||||||
| 2,000 | Glencoe, Minnesota, Health Care Facilities Revenue Bonds, Glencoe Regional Health Services Project, Series 2005, 5.000%, 4/01/31 | 4/14 at 100.00 | BBB | 2,026,920 | ||||||||||||||
| 2,500 | Hawaii Department of Budget and Finance, Special Purpose Revenue Bonds, Hawaii Pacific Health Obligated Group, Series 2010B, 5.750%, 7/01/40 | 7/20 at 100.00 | A– | 2,878,125 | ||||||||||||||
Maple Grove, Minnesota, Health Care Facilities Revenue Bonds, Maple Grove Hospital Corporation, Series 2007: | ||||||||||||||||||
| 25 | 5.000%, 5/01/20 | 5/17 at 100.00 | Baa1 | 27,448 | ||||||||||||||
| 1,800 | 4.500%, 5/01/23 | 5/17 at 100.00 | Baa1 | 1,892,574 | ||||||||||||||
| 1,000 | 5.250%, 5/01/25 | 5/17 at 100.00 | Baa1 | 1,076,650 | ||||||||||||||
| 135 | 5.250%, 5/01/37 | 5/17 at 100.00 | Baa1 | 143,201 | ||||||||||||||
| 250 | Maple Grove, Minnesota, Health Care Facility Revenue Bonds, North Memorial Health Care, Series 2005, 5.000%, 9/01/29 | 9/15 at 100.00 | Baa1 | 258,603 | ||||||||||||||
Minneapolis Health Care System, Minnesota, Revenue Bonds, Fairview Hospital and Healthcare Services, Series 2008A: | ||||||||||||||||||
| 70 | 6.000%, 11/15/18 | No Opt. Call | A | 80,375 | ||||||||||||||
| 3,010 | 6.625%, 11/15/28 | 11/18 at 100.00 | A | 3,681,200 | ||||||||||||||
| 75 | 6.750%, 11/15/32 | 11/18 at 100.00 | A | 91,637 | ||||||||||||||
| 475 | Minneapolis, Minnesota, Health Care System Revenue Bonds, Fairview Health Services, Series 2008B, 6.500%, 11/15/38 – AGC Insured | 11/18 at 100.00 | AA– | 597,992 | ||||||||||||||
| 2,425 | Minneapolis-Saint Paul Housing and Redevelopment Authority, Minnesota, Health Care Revenue Bonds, Children’s Health Care, Series 2010A, 5.250%, 8/15/35 | 8/20 at 100.00 | A+ | 2,831,503 | ||||||||||||||
| 1,005 | Minnesota Agricultural and Economic Development Board, Health Care Facilities Revenue Bonds, Essentia Health Obligated Group, Series 2008C-1, 5.000%, 2/15/30 – AGC Insured | 2/20 at 100.00 | AA– | 1,138,906 | ||||||||||||||
| 10 | Minnesota Agricultural and Economic Development Board, Health Care Facilities Revenue Bonds, Essentia Health Obligated Group, Series 2008E, 5.000%, 2/15/37 – AGC Insured | 2/18 at 100.00 | AA– | 10,965 | ||||||||||||||
| 125 | Minnesota Agricultural and Economic Development Board, Healthcare System Revenue Bonds, Fairview Hospital and Healthcare Services, Series 2000A, 6.375%, 11/15/29 | 5/13 at 100.00 | A | 125,313 | ||||||||||||||
| Nuveen Investments | 33 |
Portfolio of Investments (Unaudited)
Nuveen Minnesota Municipal Bond Fund (continued)
November 30, 2012
| Principal Amount (000) | Description (1) | Optional Call Provisions (2) | Ratings (3) | Value | ||||||||||||||
Health Care (continued) | ||||||||||||||||||
| $ | 1,000 | Monticello-Big Lake Community Hospital District, Minnesota, Gross Revenue Health Care Facilities Bonds, Series 2003C, 6.200%, 12/01/22 | 12/12 at 100.00 | N/R | $ | 1,002,060 | ||||||||||||
| 1,700 | Rochester, Minnesota, Health Care Facilities Revenue Bonds, Olmsted Medical Center Project, Series 2010, 5.875%, 7/01/30 | 7/20 at 100.00 | BBB+ | 1,913,248 | ||||||||||||||
Saint Cloud, Minnesota, Health Care Revenue Bonds, CentraCare Health System Project, Series 2008D: | ||||||||||||||||||
| 25 | 5.375%, 5/01/31 – AGC Insured | 5/19 at 100.00 | Aa3 | 28,576 | ||||||||||||||
| 55 | 5.500%, 5/01/39 – AGC Insured | 5/19 at 100.00 | Aa3 | 62,465 | ||||||||||||||
| 1,035 | Saint Cloud, Minnesota, Health Care Revenue Bonds, CentraCare Health System Project, Series 2010A, 5.125%, 5/01/30 | 5/20 at 100.00 | A1 | 1,176,246 | ||||||||||||||
| 1,235 | Saint Louis Park, Minnesota, Health Care Facilities Revenue Refunding Bonds, Park Nicollet Health Services, Series 2008C, 5.750%, 7/01/30 | 7/18 at 100.00 | A | 1,418,373 | ||||||||||||||
Saint Louis Park, Minnesota, Health Care Facilities Revenue Refunding Bonds, Park Nicollet Health Services, Series 2009: | ||||||||||||||||||
| 15 | 5.500%, 7/01/29 | 7/19 at 100.00 | A | 17,192 | ||||||||||||||
| 2,495 | 5.750%, 7/01/39 | 7/19 at 100.00 | A | 2,875,637 | ||||||||||||||
| 2,060 | Saint Paul Housing and Redevelopment Authority, Minnesota, Health Care Facility Revenue Bonds, HealthPartners Obligated Group, Series 2006, 5.250%, 5/15/36 | 11/16 at 100.00 | A– | 2,184,712 | ||||||||||||||
| 3,050 | Saint Paul Housing and Redevelopment Authority, Minnesota, Health Care Revenue Bonds, Allina Health System, Series 2009A-1, 5.250%, 11/15/29 | 11/19 at 100.00 | AA– | 3,501,156 | ||||||||||||||
| 300 | Saint Paul Housing and Redevelopment Authority, Minnesota, Health Care Revenue Bonds, Allina Health System, Series 2009A-2, 5.500%, 11/15/24 | No Opt. Call | AA– | 351,204 | ||||||||||||||
| 2,060 | Saint Paul Housing and Redevelopment Authority, Minnesota, Health Care Revenue Bonds, Gillette Children’s Specialty Healthcare Project, Series 2009, 5.000%, 2/01/29 | 2/19 at 100.00 | A– | 2,249,973 | ||||||||||||||
| 1,375 | Saint Paul Port Authority, Minnesota, Lease Revenue Bonds, Regions Hospital Parking Ramp Project, Series 2007-1, 5.000%, 8/01/36 | 8/16 at 100.00 | N/R | 1,413,143 | ||||||||||||||
| 2,000 | Shakopee, Minnesota, Health Care Facilities Revenue Bonds, Saint Francis Regional Medical Center, Series 2004, 5.250%, 9/01/34 | 9/14 at 100.00 | A– | 2,048,780 | ||||||||||||||
| 500 | St. Paul Housing and Redevelopment Authority, Minnesota, Healthcare Revenue Bonds, Regions Hospital, Series 1998, 5.250%, 5/15/18 | 5/13 at 100.00 | A– | 501,255 | ||||||||||||||
St. Paul Housing and Redevelopment Authority, Minnesota, Revenue Bonds, Healtheast Inc., Series 2005: | ||||||||||||||||||
| 70 | 6.000%, 11/15/25 | 11/15 at 100.00 | BBB– | 74,694 | ||||||||||||||
| 800 | 6.000%, 11/15/30 | 11/15 at 100.00 | BBB– | 850,176 | ||||||||||||||
| 900 | St. Paul Port Authority, Minnesota, Lease Revenue Bonds, HealthEast Midway Campus, Series 2005A, 5.875%, 5/01/30 | 5/15 at 100.00 | BB+ | 938,304 | ||||||||||||||
| 1,800 | St. Paul Port Authority, Minnesota, Lease Revenue Bonds, HealthEast Midway Campus, Series 2005B, 6.000%, 5/01/30 | 5/15 at 100.00 | N/R | 1,883,016 | ||||||||||||||
Winona, Minnesota, Health Care Facilities Revenue Bonds, Winona Health Obligated Group, Refunding Series 2012: | ||||||||||||||||||
| 500 | 3.750%, 7/01/21 | No Opt. Call | BBB– | 538,000 | ||||||||||||||
| 350 | 4.000%, 7/01/22 | 7/21 at 100.00 | BBB– | 375,491 | ||||||||||||||
| 1,270 | 4.500%, 7/01/24 | 7/21 at 100.00 | BBB– | 1,382,611 | ||||||||||||||
| 500 | 5.000%, 7/01/34 | 7/21 at 100.00 | BBB– | 538,085 | ||||||||||||||
| 42,470 | Total Health Care | 46,788,349 | ||||||||||||||||
Housing/Multifamily – 3.9% | ||||||||||||||||||
| 1,945 | Dakota County Community Development Agency, Minnesota, GNMA Collateralized Mortgage Loan Multifamily Housing Revenue Bonds, Ebenezer Project, Series 2000, 5.900%, 4/20/42 | 4/13 at 100.00 | Aaa | 1,963,730 | ||||||||||||||
| 2,000 | Maplewood, Minnesota, Mutifamily Housing Revenue Refunding Bonds, Carefree Cottages of Maplewood III Project, Series 2004, 4.800%, 4/15/34 (Mandatory put 4/15/19) (Alternative Minimum Tax) | 4/14 at 100.00 | Aaa | 2,066,660 | ||||||||||||||
| 34 | Nuveen Investments |
| Principal Amount (000) | Description (1) | Optional Call Provisions (2) | Ratings (3) | Value | ||||||||||||||
Housing/Multifamily (continued) | ||||||||||||||||||
| $ | 855 | Minneapolis, Minnesota, GNMA Collateralized Multifamily Housing Revenue Bonds, Vantage Flats Project, Series 2007, 5.200%, 10/20/48 (Alternative Minimum Tax) | 10/15 at 100.00 | Aaa | $ | 886,857 | ||||||||||||
| 1,350 | Minneapolis, Minnesota, Multifamily Housing Revenue Bonds, Keeler Apartments, Series 2007A, 5.000%, 10/01/37 | 10/15 at 102.00 | N/R | 1,356,237 | ||||||||||||||
| 2,500 | Rochester, Minnesota, Multifamily Housing Revenue Bonds, Essex Place Apartments Project, Series 2012A, 3.750%, 6/01/29 | 6/22 at 100.00 | Aaa | 2,681,850 | ||||||||||||||
| 8,650 | Total Housing/Multifamily | 8,955,334 | ||||||||||||||||
Housing/Single Family – 3.3% | ||||||||||||||||||
| 195 | Minneapolis-Saint Paul Housing Finance Board, Minnesota, Single Family Mortgage Revenue Bonds, City Living Home Program, Market Series 2011B, 4.100%, 12/01/29 | 6/21 at 100.00 | AA+ | 215,617 | ||||||||||||||
| 332 | Minneapolis-Saint Paul Housing Finance Board, Minnesota, Single Family Mortgage Revenue Bonds, City Living Series 2006A-4, 5.000%, 11/01/38 (Alternative Minimum Tax) | 7/16 at 100.00 | AA+ | 342,969 | ||||||||||||||
| 1,045 | Minneapolis-Saint Paul Housing Finance Board, Minnesota, Single Family Mortgage Revenue Bonds, City Living Series 2007A-2, 5.520%, 3/01/41 (Alternative Minimum Tax) | 5/17 at 102.00 | AA+ | 1,122,685 | ||||||||||||||
Minnesota Housing Finance Agency, Homeownership Finance Bonds, Mortgage-Backed Securities Program, Series 2011B: | ||||||||||||||||||
| 90 | 4.000%, 7/01/21 | No Opt. Call | Aaa | 102,008 | ||||||||||||||
| 5 | 5.000%, 1/01/31 | 7/21 at 100.00 | Aaa | 5,635 | ||||||||||||||
Minnesota Housing Finance Agency, Homeownership Finance Bonds, Mortgage-Backed Securities Program, Series 2011D: | ||||||||||||||||||
| 45 | 4.375%, 7/01/26 | 7/21 at 100.00 | Aaa | 51,222 | ||||||||||||||
| 710 | 4.700%, 1/01/31 | 7/21 at 100.00 | Aaa | 809,982 | ||||||||||||||
| 25 | Minnesota Housing Finance Agency, Homeownership Finance Bonds, Mortgage-Backed Securities Program, Series 2011E, 4.000%, 7/01/26 | 7/21 at 100.00 | Aaa | 27,800 | ||||||||||||||
| 45 | Minnesota Housing Finance Agency, Residential Housing Finance Bonds, Series 2006Q, 5.250%, 7/01/33 (Alternative Minimum Tax) | 7/17 at 100.00 | AA+ | 47,945 | ||||||||||||||
| 3,165 | Minnesota Housing Finance Agency, Residential Housing Finance Bonds, Series 2007D, 4.700%, 7/01/27 (Alternative Minimum Tax) | 7/16 at 100.00 | AA+ | 3,307,615 | ||||||||||||||
| 55 | Minnesota Housing Finance Agency, Residential Housing Finance Bonds, Series 2007-I, 4.850%, 7/01/38 (Alternative Minimum Tax) | 7/16 at 100.00 | AA+ | 56,871 | ||||||||||||||
| 5 | Minnesota Housing Finance Agency, Residential Housing Finance Bonds, Series 2007L, 5.100%, 7/01/38 (Alternative Minimum Tax) | 1/17 at 100.00 | AA+ | 5,237 | ||||||||||||||
| 5 | Minnesota Housing Finance Agency, Residential Housing Finance Bonds, Series 2008B, 5.650%, 7/01/33 (Alternative Minimum Tax) | 1/18 at 100.00 | AA+ | 5,269 | ||||||||||||||
| 1,440 | Minnesota Housing Finance Agency, Residential Housing Finance Bonds, Series 2012C, 3.850%, 1/01/29 | 1/22 at 100.00 | AA+ | 1,567,526 | ||||||||||||||
| 7,162 | Total Housing/Single Family | 7,668,381 | ||||||||||||||||
Industrials – 2.1% | ||||||||||||||||||
| 170 | Little Canada, Minnesota, Commercial Development Revenue Refunding Bonds, RLF Minnesota Project, Series 1993, 7.100%, 4/01/13 | No Opt. Call | N/R | 171,030 | ||||||||||||||
| 4,500 | Saint Paul Port Authority, Minnesota, Solid Waste Disposal Revenue Bonds, Gerdau Saint Paul Steel Mill Project, Series 2012-7, 4.500%, 10/01/37 (WI/DD, Settling 12/03/12) (Alternative Minimum Tax) | 10/22 at 100.00 | BBB– | 4,614,930 | ||||||||||||||
| 4,670 | Total Industrials | 4,785,960 | ||||||||||||||||
Long-Term Care – 8.1% | ||||||||||||||||||
| 1,500 | Anoka County Housing and Redevelopment Authority, Minnesota, Health Care Facility Care Center Project, Series 2010D, 6.750%, 11/01/36 | 11/15 at 102.00 | N/R | 1,601,880 | ||||||||||||||
| Nuveen Investments | 35 |
Portfolio of Investments (Unaudited)
Nuveen Minnesota Municipal Bond Fund (continued)
November 30, 2012
| Principal Amount (000) | Description (1) | Optional Call Provisions (2) | Ratings (3) | Value | ||||||||||||||
Long-Term Care (continued) | ||||||||||||||||||
Center City, Minnesota, Health Care Facilities Revenue Bonds, Hazelden Foundation Project, Series 2011: | ||||||||||||||||||
| $ | 500 | 4.750%, 11/01/31 | 11/19 at 100.00 | A3 | $ | 543,385 | ||||||||||||
| 1,600 | 5.000%, 11/01/41 | 11/19 at 100.00 | A3 | 1,770,656 | ||||||||||||||
| 845 | Cottage Grove, Minnesota, Senior Housing Revenue Bonds, PHS/Cottage Grove, Inc., Project, Series 2006A, 5.000%, 12/01/31 | 12/14 at 100.00 | N/R | 856,230 | ||||||||||||||
| 2,000 | Minneapolis, Minnesota, Revenue Bonds, Walker Minneapolis Campus Project, Refunding Series 2012, 4.750%, 11/15/28 | 11/22 at 100.00 | N/R | 2,073,880 | ||||||||||||||
| 1,620 | Moorhead, Minnesota, Senior Housing Facility Revenue Bonds, Sheyenne Crossings Project, Series 2006, 5.650%, 4/01/41 | 4/14 at 101.00 | N/R | 1,647,977 | ||||||||||||||
| 1,600 | New Hope, Minnesota, Housing and Health Care Facilities Revenue Bonds, Minnesota Masonic Home North Ridge Project, Series 1999, 5.750%, 3/01/15 | 3/13 at 100.00 | N/R | 1,602,864 | ||||||||||||||
| 1,100 | Saint Paul Housing & Redevelopment Authority, Minnesota, Revenue Bonds, Rossy & Richard Shaller Family Sholom East Campus, Series 2007A, 5.250%, 10/01/42 | 10/17 at 100.00 | N/R | 1,115,378 | ||||||||||||||
| 2,114 | Saint Paul Housing and Redevelopment Authority, Minnesota, Nursing Home Revneue Bonds, Episcopal Homes of Minnesota, Series 2006, 5.630%, 10/01/33 | 4/17 at 100.00 | N/R | 2,200,134 | ||||||||||||||
| 1,000 | Saint Paul Housing and Redevelopment Authority, Minnesota, Senior Housing and Health Care Revenue Refunding Bonds, Episcopal Homes Project, Series 2012A, 5.150%, 11/01/42 | No Opt. Call | N/R | 1,019,430 | ||||||||||||||
| 700 | Sartell, Minnesota, Health Care and Housing Facilities Revenue Bonds, Country Manor Campus LLC Project, Series 2012A, 5.250%, 9/01/30 | 9/22 at 100.00 | N/R | 729,512 | ||||||||||||||
Wayzata, Minnesota, Senior Housing Revenue Bonds, Folkestone Senior Living Community, Series 2012A: | ||||||||||||||||||
| 260 | 5.000%, 5/01/23 | 5/19 at 102.00 | N/R | 276,320 | ||||||||||||||
| 680 | 5.000%, 11/01/23 | 5/19 at 102.00 | N/R | 722,684 | ||||||||||||||
| 700 | 5.500%, 11/01/32 | 5/19 at 102.00 | N/R | 740,033 | ||||||||||||||
| 330 | 6.000%, 5/01/47 | 5/19 at 102.00 | N/R | 355,367 | ||||||||||||||
| 1,200 | West St. Paul, Minnesota, Health Care Facilities Revenue Bonds, Walker Thompson Hill LLC Project, Series 2011A, 7.000%, 9/01/46 | 9/19 at 100.00 | N/R | 1,322,988 | ||||||||||||||
| 17,749 | Total Long-Term Care | 18,578,718 | ||||||||||||||||
Materials – 0.5% | ||||||||||||||||||
| 1,130 | Seaway Port Authority of Duluth, Minnesota, Industrial Development Dock and Wharf Revenue Refunding Bonds, Cargill, Inc Project, Series 2004, 4.200%, 5/01/13 | No Opt. Call | A | 1,145,142 | ||||||||||||||
Tax Obligation/General – 13.3% | ||||||||||||||||||
| 10,000 | Bemidji, Minnesota, General Obligation Bonds, Refunding Sales Tax Series 2011, 6.000%, 2/01/41 | 2/21 at 100.00 | Aa3 | 12,831,200 | ||||||||||||||
| 1,000 | Buffalo-Hanover-Montrose Independent School District 877, Minnesota, General Obligation Bonds, Refunding Series 2012A, 4.000%, 2/01/23 | 2/22 at 100.00 | Aa2 | 1,192,530 | ||||||||||||||
| 1,430 | Burnsville Independent School District 191, Dakota and Scott Counties, Minnesota, General Obligation Bonds, Series 2008A, 4.500%, 2/01/22 | 2/18 at 100.00 | Aa2 | 1,641,826 | ||||||||||||||
| 100 | Fertile Economic Development Authority, Minnesota, General Obligation of the City, Housing Development Reveue Bonds, Series 2012A, 4.000%, 12/01/35 | 12/22 at 100.00 | A | 108,902 | ||||||||||||||
| 380 | Independent School District 625, St. Paul, Minnesota, General Obligation Bonds, School Building Series 2011A, 4.000%, 2/01/32 | 2/21 at 100.00 | AA+ | 427,701 | ||||||||||||||
| 2,000 | Lakeville Independent School District 194, Dakota County, Minnesota, General Obligation Bonds, Refunding Series 2012D, 5.000%, 2/01/20 | No Opt. Call | Aa2 | 2,533,600 | ||||||||||||||
| 2,000 | Minneapolis-Saint Paul Metropolitan Council, Minnesota, General Obligation Wastewater Revenue Bonds, Refunding Series 2012I, 3.000%, 3/01/26 | No Opt. Call | AAA | 2,158,140 | ||||||||||||||
| 36 | Nuveen Investments |
| Principal Amount (000) | Description (1) | Optional Call Provisions (2) | Ratings (3) | Value | ||||||||||||||
Tax Obligation/General (continued) | ||||||||||||||||||
| $ | 2,000 | Minnesota State, General Obligation Bonds, State Trunk Highway Series 2012B, 5.000%, 8/01/21 | No Opt. Call | AA+ | $ | 2,623,760 | ||||||||||||
| 1,500 | Minnesota State, General Obligation Bonds, Various Purpose Series 2012A, 3.000%, 8/01/31 | 8/22 at 100.00 | AA+ | 1,519,500 | ||||||||||||||
| 310 | Moorhead, Minnesota, General Obligation Bonds, Improvement Series 2012F, 3.000%, 2/01/29 | 2/22 at 100.00 | Aa3 | 322,496 | ||||||||||||||
| 250 | Sherburn Economic Development Authority, Minnesota, General Obligation Bonds, Housing Development Series 2012C, 4.500%, 2/01/38 | 2/18 at 100.00 | A+ | 262,865 | ||||||||||||||
Thief River Falls Independent School District 564, Minnesota, General Obligation Bonds, Series 2012A: | ||||||||||||||||||
| 2,110 | 4.000%, 2/01/31 | 2/22 at 100.00 | Aa2 | 2,417,174 | ||||||||||||||
| 1,000 | 4.000%, 2/01/33 | 2/22 at 100.00 | Aa2 | 1,134,040 | ||||||||||||||
| 1,250 | Willmar, Minnesota, General Obligation Revenue Refunding Bonds, Rice Memorial Hospital Project, Series 2012A, 3.000%, 2/01/29 | 2/21 at 100.00 | Aa2 | 1,293,650 | ||||||||||||||
| 25,330 | Total Tax Obligation/General | 30,467,384 | ||||||||||||||||
Tax Obligation/Limited – 5.0% | ||||||||||||||||||
Duluth Independent School District 709, Minnesota, Certificates of Participation, Capital Appreciation Series 2012A: | ||||||||||||||||||
| 2,000 | 0.000%, 2/01/27 – AGM Insured | 2/22 at 81.23 | Aa2 | 1,214,240 | ||||||||||||||
| 2,840 | 0.000%, 2/01/28 – AGM Insured | 2/22 at 77.70 | Aa2 | 1,639,447 | ||||||||||||||
| 2,000 | Duluth Independent School District 709, Minnesota, Certificates of Participation, Series 2008B, 4.000%, 2/01/19 | No Opt. Call | AA+ | 2,354,560 | ||||||||||||||
| 585 | Lakeville Housing and Redevelopment Authority, Minnesota, Lease Revenue Bonds, Ice Arena Project, Series 2006, 4.625%, 2/01/32 | 2/17 at 100.00 | Aa3 | 629,729 | ||||||||||||||
| 400 | Minneapolis, Minnesota, Tax Increment Revenue Bonds, Village at St. Anthony Falls Project, Refunding Series 2005, 5.650%, 2/01/27 | 2/14 at 100.00 | N/R | 402,708 | ||||||||||||||
| 2,850 | Minnesota State, General Fund Appropriation Refunding Bonds, Series 2012B, 5.000%, 3/01/29 | No Opt. Call | AA | 3,540,299 | ||||||||||||||
| 100 | Mountain Lake, Minnesota, General Obligation Tax Increment Bonds, Series 2012B, 4.200%, 2/01/29 | 2/18 at 100.00 | A | 103,774 | ||||||||||||||
| 1,000 | Pine County Housing and Redevelopment Authority, Minnesota, Public Project Revenue Bonds, Series 2005A, 5.000%, 2/01/28 | 2/16 at 100.00 | BBB+ | 1,138,260 | ||||||||||||||
| 500 | Saint Paul Housing and Redevelopment Authority, Minnesota, Recreational Faility Lease Revenue Bonds, Jimmy Lee Recreational Center, Series 2008, 4.750%, 12/01/26 | 12/17 at 100.00 | AA+ | 556,950 | ||||||||||||||
| 25 | Virgin Islands Public Finance Authority, Matching Fund Loan Notes Revenue Bonds, Series 2009B, 5.000%, 10/01/25 | 10/19 at 100.00 | BBB+ | 27,734 | ||||||||||||||
| 12,300 | Total Tax Obligation/Limited | 11,607,701 | ||||||||||||||||
Transportation – 6.0% | ||||||||||||||||||
| 1,000 | Minneapolis, Minnesota, Recovery Zone Facility Revenue Bonds, Mozaic Parking, LLC Project, Series 2010A, 8.500%, 1/01/41 | 1/21 at 100.00 | N/R | 1,095,920 | ||||||||||||||
| 4,000 | Minneapolis-St. Paul Metropolitan Airports Commission, Minnesota, Airport Revenue Bonds, Refunding Senior Lien Series 2009B, 5.000%, 1/01/20 (Alternative Minimum Tax) | 1/19 at 100.00 | AA– | 4,781,800 | ||||||||||||||
| 3,110 | Minneapolis-St. Paul Metropolitan Airports Commission, Minnesota, Airport Revenue Bonds, Series 2007B, 4.500%, 1/01/32 – NPFG Insured | 1/17 at 100.00 | A | 3,375,718 | ||||||||||||||
| 110 | Minneapolis-St. Paul Metropolitan Airports Commission, Minnesota, Airport Revenue Bonds, Subordinate Lien Series 2010D, 4.000%, 1/01/23 (Alternative Minimum Tax) | 1/20 at 100.00 | A | 118,759 | ||||||||||||||
| 50 | Minneapolis-St. Paul Metropolitan Airports Commission, Minnesota, Airport Revenue Bonds, Subordinate Lien, Refunding Series 2011A, 3.500%, 1/01/24 | 1/21 at 100.00 | A | 54,446 | ||||||||||||||
| 1,250 | Minneapolis-St. Paul Metropolitan Airports Commission, Minnesota, Airport Revenue Bonds, Subordinate Lien, Refunding Series 2012B, 5.000%, 1/01/31 | 1/22 at 100.00 | A | 1,480,800 | ||||||||||||||
| Nuveen Investments | 37 |
Portfolio of Investments (Unaudited)
Nuveen Minnesota Municipal Bond Fund (continued)
November 30, 2012
| Principal Amount (000) | Description (1) | Optional Call Provisions (2) | Ratings (3) | Value | ||||||||||||||
Transportation (continued) | ||||||||||||||||||
St. Paul Housing and Redevelopment Authority, Minnesota, Parking Revenue Bonds, Parking Facilities Project, Refunding Series 2010A: | ||||||||||||||||||
| $ | 1,070 | 5.000%, 8/01/30 | 8/18 at 102.00 | A+ | $ | 1,241,692 | ||||||||||||
| 1,500 | 5.000%, 8/01/35 | 8/18 at 102.00 | A+ | 1,704,930 | ||||||||||||||
| 12,090 | Total Transportation | 13,854,065 | ||||||||||||||||
U.S. Guaranteed – 3.1% (4) | ||||||||||||||||||
Andover Economic Development Authority, Minnesota, Public Facility Lease Revenue Bonds, Andover Community Center, Series 2004: | ||||||||||||||||||
| 5 | 5.125%, 2/01/24 (Pre-refunded 2/01/14) | 2/14 at 100.00 | AA (4) | 5,241 | ||||||||||||||
| 5 | 5.125%, 2/01/24 (Pre-refunded 2/01/14) | 2/14 at 100.00 | AA (4) | 5,241 | ||||||||||||||
| 1,065 | Duluth Economic Development Authority, Minnesota, Healthcare Facilities Revenue Bonds, Benedictine Health System – St. Mary’s Duluth Clinic, Series 2004, 5.250%, 2/15/28 (Pre-refunded 2/15/14) | 2/14 at 100.00 | N/R (4) | 1,126,834 | ||||||||||||||
Marshall, Minnesota, Revenue Bonds, Weiner Memorial Medical Center, Series 2003A: | ||||||||||||||||||
| 305 | 5.250%, 11/01/16 (Pre-refunded 11/01/13) | 11/13 at 100.00 | N/R (4) | 317,401 | ||||||||||||||
| 875 | 5.850%, 11/01/23 (Pre-refunded 11/01/13) | 11/13 at 100.00 | N/R (4) | 915,373 | ||||||||||||||
| 1,890 | Pine County Housing and Redevelopment Authority, Minnesota, Public Project Revenue Bonds, Series 2005A, 5.000%, 2/01/31 (Pre-refunded 2/01/16) | 2/16 at 100.00 | BBB+ (4) | 2,151,311 | ||||||||||||||
| 2,000 | St. Louis Park, Minnesota, Revenue Bonds, Park Nicollet Health Services, Series 2003B, 5.500%, 7/01/25 (Pre-refunded 7/01/14) | 7/14 at 100.00 | N/R (4) | 2,161,600 | ||||||||||||||
| 410 | Western Minnesota Municipal Power Agency, Power Supply Revenue Bonds, Series 1983A, 9.750%, 1/01/16 – NPFG Insured (ETM) | No Opt. Call | Aaa | 504,292 | ||||||||||||||
| 6,555 | Total U.S. Guaranteed | 7,187,293 | ||||||||||||||||
Utilities – 14.3% | ||||||||||||||||||
| 1,110 | Central Minnesota Municipal Power Agency, Revenue Bonds, Brookings – Southeast Twin Cities Transmission Project, Series 2012, 5.000%, 1/01/42 | 1/22 at 100.00 | A– | 1,281,084 | ||||||||||||||
| 45 | Chaska, Minnesota, Electric Revenue Bonds, Generating Facility Project, Series 2000A, 6.100%, 10/01/30 | 4/13 at 100.00 | A3 | 45,185 | ||||||||||||||
| 235 | Guam Power Authority, Revenue Bonds, Series 2012A, 5.000%, 10/01/34 | 10/22 at 100.00 | BBB | 268,504 | ||||||||||||||
| 985 | Hutchinson, Minnesota, Public Utility Revenue Bonds, Refunding Series 2012A, 3.000%, 12/01/23 | 12/22 at 100.00 | A1 | 1,040,150 | ||||||||||||||
| 5,000 | Minnesota Municipal Power Agency, Electric Revenue Bonds, Refunding Series 2010A, 5.000%, 10/01/30 | 10/20 at 100.00 | A3 | 5,789,900 | ||||||||||||||
| 2,000 | Northern Municipal Power Agency, Minnesota, Electric System Revenue Bonds, Refunding Series 2007A, 5.000%, 1/01/26 – AMBAC Insured | 1/18 at 100.00 | A2 | 2,336,720 | ||||||||||||||
| 15 | Northern Municipal Power Agency, Minnesota, Electric System Revenue Bonds, Refunding Series 2008A, 5.000%, 1/01/18 – AGC Insured | No Opt. Call | AA– | 17,931 | ||||||||||||||
| 2,000 | Puerto Rico Electric Power Authority, Power Revenue Bonds, Series 2005SS, 5.000%, 7/01/24 – NPFG Insured | 7/15 at 100.00 | BBB+ | 2,111,280 | ||||||||||||||
Southern Minnesota Municipal Power Agency, Power Supply System Revenue Bonds, Series 1994A: | ||||||||||||||||||
| 1,450 | 0.000%, 1/01/19 – NPFG Insured | No Opt. Call | A+ | 1,284,990 | ||||||||||||||
| 1,765 | 0.000%, 1/01/21 – NPFG Insured | No Opt. Call | A+ | 1,452,436 | ||||||||||||||
| 3,000 | 0.000%, 1/01/23 – NPFG Insured | No Opt. Call | A+ | 2,265,210 | ||||||||||||||
| 10,500 | 0.000%, 1/01/24 – NPFG Insured | No Opt. Call | A+ | 7,576,800 | ||||||||||||||
| 4,770 | 0.000%, 1/01/25 – NPFG Insured | No Opt. Call | A+ | 3,306,564 | ||||||||||||||
| 6,100 | 0.000%, 1/01/26 – NPFG Insured | No Opt. Call | A+ | 4,054,914 | ||||||||||||||
| 38,975 | Total Utilities | 32,831,668 | ||||||||||||||||
| 38 | Nuveen Investments |
| Principal Amount (000) | Description (1) | Optional Call Provisions (2) | Ratings (3) | Value | ||||||||||||||
Water and Sewer – 0.7% | ||||||||||||||||||
| $ | 1,500 | Puerto Rico Aqueduct and Sewerage Authority, Revenue Bonds, Senior Lien Series 2008A, 6.000%, 7/01/38 | 7/18 at 100.00 | Baa2 | $ | 1,590,600 | ||||||||||||
| $ | 221,211 | Total Investments (cost $208,589,388) – 100.9% | 232,172,735 | |||||||||||||||
Other Assets Less Liabilities – (0.9)% | (2,176,261) | |||||||||||||||||
Net Assets – 100% | $ | 229,996,474 | ||||||||||||||||
| (1) | All percentages shown in the Portfolio of Investments are based on net assets. |
| (2) | Optional Call Provisions: Dates (month and year) and prices of the earliest optional call or redemption. There may be other call provisions at varying prices at later dates. Certain mortgage-backed securities may be subject to periodic principal paydowns. |
| (3) | Ratings: Using the highest of Standard & Poor’s Group (“Standard & Poor’s”), Moody’s Investors Service, Inc. (“Moody’s”) or Fitch, Inc. (“Fitch”) rating. Ratings below BBB by Standard & Poor’s, Baa by Moody’s or BBB by Fitch are considered to be below investment grade. Holdings designated N/R are not rated by any of these national rating agencies. |
| (4) | Backed by an escrow or trust containing sufficient U.S. Government or U.S. Government agency securities, which ensure the timely payment of principal and interest. Certain bonds backed by U.S. Government or agency securities are regarded as having an implied rating equal to the rating of such securities. |
| N/R | Not rated. |
| WI/DD | Investment, or portion of investment, purchased on a when-issued or delayed delivery basis. |
| (ETM) | Escrowed to maturity. |
See accompanying notes to financial statements.
| Nuveen Investments | 39 |
Portfolio of Investments (Unaudited)
Nuveen Nebraska Municipal Bond Fund
November 30, 2012
| Principal Amount (000) | Description (1) | Optional Call Provisions (2) | Ratings (3) | Value | ||||||||||||||
MUNICIPAL BONDS – 97.9% | ||||||||||||||||||
Education and Civic Organizations – 19.5% | ||||||||||||||||||
| $ | 990 | Colorado Educational and Cultural Facilities Authority, Charter School Revenue Bonds, Academy of Charter Schools Project, Series 2008, 5.625%, 5/01/40 | 5/18 at 100.00 | A | $ | 1,106,731 | ||||||||||||
| 1,000 | Douglas County Hospital Authority 2, Nebraska, Healthcare Revenue Bonds, Boys Town Project, Series 2008, 4.750%, 9/01/28 | 9/18 at 100.00 | AA+ | 1,114,440 | ||||||||||||||
Douglas County, Nebraska, Educational Facilities Revenue Bonds, Creighton University Projects, Refunding Series 2010A: | ||||||||||||||||||
| 1,000 | 5.600%, 7/01/25 | 7/20 at 100.00 | A3 | 1,187,520 | ||||||||||||||
| 1,000 | 5.500%, 7/01/30 | 7/20 at 100.00 | A3 | 1,165,150 | ||||||||||||||
| 665 | Douglas County, Nebraska, Zoo Facilities Revenue Bonds, O’Maha’s Henry Doory Zoo Project, Refunding Series 2005, 4.750%, 9/01/24 | 4/15 at 100.00 | A– | 697,239 | ||||||||||||||
Lincoln, Nebraska, Educational Facilities Revenue and Refunding Bonds, Nebraska Wesleyan University Project, Series 2012: | ||||||||||||||||||
| 685 | 3.300%, 4/01/25 | 4/22 at 100.00 | A– | 721,826 | ||||||||||||||
| 410 | 4.000%, 4/01/32 | 4/22 at 100.00 | A– | 440,217 | ||||||||||||||
| 500 | Missouri Health and Educational Facilities Authority, Revenue Bonds, Washington University, Seres 2008A, 5.375%, 3/15/39 | 3/18 at 100.00 | AAA | 590,795 | ||||||||||||||
| 525 | Nebraska Educational Finance Authority, Revenue Bonds, Clarkson College Project, Refunding Series 2011, 5.450%, 9/01/35 | 5/21 at 100.00 | Aa3 | 616,975 | ||||||||||||||
| 2,690 | Nebraska Educational Finance Authority, Revenue Bonds, Concordia University Project, Refunding Series 2007, 5.000%, 10/01/37 | 10/15 at 100.00 | N/R | 2,724,567 | ||||||||||||||
University of Nebraska, Revenue Bonds, Lincoln Student Fees and Facilities Refunding Series 2011: | ||||||||||||||||||
| 50 | 4.000%, 7/01/32 | 1/22 at 100.00 | Aa1 | 56,300 | ||||||||||||||
| 1,125 | 5.000%, 7/01/42 | 1/22 at 100.00 | Aa1 | 1,333,721 | ||||||||||||||
| 1,170 | University of Nebraska, Revenue Bonds, Lincoln Student Fees and Facilities, Refunding Series 2012, 4.000%, 7/01/33 | 7/22 at 100.00 | Aa1 | 1,301,344 | ||||||||||||||
| 1,000 | University of Nebraska, Revenue Bonds, Omaha Health & Recreation Project, Series 2008, 5.000%, 5/15/33 | 5/18 at 100.00 | Aa1 | 1,151,880 | ||||||||||||||
| 350 | University of Nebraska, Revenue Bonds, Omaha Student Facilities Project, Series 2007, 5.000%, 5/15/32 | 5/17 at 100.00 | Aa1 | 403,732 | ||||||||||||||
| 500 | University of Nebraska, Revenue Bonds, Omaha Student Housing Project, Series 2003, 5.000%, 5/15/23 | 11/13 at 100.00 | Aa1 | 522,450 | ||||||||||||||
| 13,660 | Total Education and Civic Organizations | 15,134,887 | ||||||||||||||||
Health Care – 10.6% | ||||||||||||||||||
| 1,000 | Douglas County Hospital Authority 2, Nebraska, Health Facilities Revenue Refunding Bonds, Children’s Hospital Obligated Group, Series 2008B, 6.000%, 8/15/28 | 8/17 at 100.00 | A2 | 1,138,530 | ||||||||||||||
Douglas County Hospital Authority 3, Nebraska, Health Facilities Refunding and Revenue Bonds, Nebraska Methodist Health System, Series 2008: | ||||||||||||||||||
| 275 | 5.750%, 11/01/28 | 11/18 at 100.00 | BBB+ | 311,823 | ||||||||||||||
| 1,110 | 5.500%, 11/01/38 | 11/18 at 100.00 | BBB+ | 1,214,995 | ||||||||||||||
| 610 | Halifax Hospital Medical Center, Florida, Revenue Bonds, Series 2006, 5.000%, 6/01/38 | 6/16 at 100.00 | A– | 644,557 | ||||||||||||||
| 600 | Indiana Health Facility Financing Authority, Hospital Revenue Bonds, Jackson County, Schneck Memorial Hospital, Series 2006A, 5.250%, 2/15/30 | 2/16 at 100.00 | A | 630,732 | ||||||||||||||
Lincoln County Hospital Authority 1, Nebraska, Hospital Revenue and Refunding Bonds, Great Plains Regional Medical Center Project, Series 2012: | ||||||||||||||||||
| 3,000 | 4.000%, 11/01/37 | No Opt. Call | A– | 3,041,550 | ||||||||||||||
| 1,155 | 5.000%, 11/01/42 | No Opt. Call | A– | 1,274,150 | ||||||||||||||
| 7,750 | Total Health Care | 8,256,337 | ||||||||||||||||
| 40 | Nuveen Investments |
| Principal Amount (000) | Description (1) | Optional Call Provisions (2) | Ratings (3) | Value | ||||||||||||||
Housing/Multifamily – 0.6% | ||||||||||||||||||
| $ | 465 | Omaha Housing Authority, Nebraska, Multifamily Housing Revenue Bonds, GNMA Mortgage Backed Securities Program – Timbercreek Apartments Project, Series 2001, 5.150%, 11/20/22 | 4/13 at 100.00 | N/R | $ | 466,000 | ||||||||||||
Housing/Single Family – 2.9% | ||||||||||||||||||
| 2,000 | Nebraska Investment Finance Authority, Single Family Housing Revenue Bonds, Series 2010A, 5.700%, 9/01/31 | 9/20 at 100.00 | AA+ | 2,221,780 | ||||||||||||||
Industrials – 2.1% | ||||||||||||||||||
| 1,630 | Washington County, Nebraska, Wastewater and Solid Waste Disposal Facilities Revenue Bonds, Cargill Inc. Project, Variable Rate Demand Series 2012, 1.375%, 9/01/30 (Mandatory put 9/01/15) (Alternative Minimum Tax) | No Opt. Call | A | 1,633,635 | ||||||||||||||
Long-Term Care – 7.9% | ||||||||||||||||||
| 100 | Colorado Health Facilities Authority, Colorado, Revenue Bonds, Christian Living Communities Project, Series 2006A, 5.750%, 1/01/26 | 1/17 at 100.00 | N/R | 105,281 | ||||||||||||||
| 250 | Colorado Health Facilities Authority, Colorado, Revenue Bonds, Evangelical Lutheran Good Samaritan, Series 2009B, 5.000%, 6/01/39 (Mandatory put 12/01/14) | No Opt. Call | A– | 267,575 | ||||||||||||||
| 900 | Douglas County Hospital Authority 2, Nebraska, Health Facilities Revenue Bonds, Immanuel Obligated Group, Refunding Series 2010, 5.625%, 1/01/40 | 1/20 at 100.00 | A– | 1,032,759 | ||||||||||||||
| 200 | Illinois Finance Authority, Revenue Bonds, Three Crowns Park Plaza, Series 2006A, 5.875%, 2/15/26 | 2/16 at 100.00 | N/R | 209,466 | ||||||||||||||
| 3,385 | Lancaster County Hospital Authority 1, Nebraska, Health Facilities Revenue Bonds, Immanuel Obligated Group, Refunding Series 2010, 5.625%, 1/01/40 | 1/20 at 100.00 | A– | 3,884,321 | ||||||||||||||
| 600 | South Dakota Health and Educational Facilities Authority, Revenue Bonds, Westhills Village Retirement Community Project, Series 2006, 5.000%, 9/01/25 | 9/14 at 100.00 | A | 613,986 | ||||||||||||||
| 5,435 | Total Long-Term Care | 6,113,388 | ||||||||||||||||
Tax Obligation/General – 8.8% | ||||||||||||||||||
| 350 | Douglas County School District 059, Nebraska, General Obligation Bonds, School Building Series 2011B, 4.700%, 12/15/32 | 5/16 at 100.00 | Aa2 | 387,604 | ||||||||||||||
| 1,150 | Douglas County School District 1, Nebraska, General Obligation Bonds, Refunding School Building Series 2012, 5.000%, 6/15/24 | No Opt. Call | AAA | 1,526,602 | ||||||||||||||
Douglas County School District 10 Elkhorn, Nebraska, General Obligation Bonds, Public Schools Series 2012: | ||||||||||||||||||
| 1,000 | 4.250%, 6/15/29 | 6/22 at 100.00 | AA– | 1,154,620 | ||||||||||||||
| 1,010 | 3.500%, 1/15/33 | 1/22 at 100.00 | AA– | 1,074,014 | ||||||||||||||
| 50 | Omaha, Nebraska, General Obligation Bonds, Convention Center Project, Series 2004, 5.250%, 4/01/24 | No Opt. Call | AAA | 67,941 | ||||||||||||||
| 450 | Omaha, Nebraska, General Obligation Bonds, Refunding Series 2008, 5.750%, 10/15/28 | 10/18 at 100.00 | AAA | 547,124 | ||||||||||||||
| 1,000 | Puerto Rico, General Obligation Bonds, Public Improvement, Series 2011A, 5.750%, 7/01/41 | 7/21 at 100.00 | Baa1 | 1,073,800 | ||||||||||||||
| 375 | Puerto Rico, General Obligation Bonds, Public Improvment Refunding Series 2008A, 5.250%, 7/01/26 | 7/18 at 100.00 | Baa1 | 392,794 | ||||||||||||||
| 250 | Puerto Rico, General Obligation Bonds, Refunding Series 2003C-7, 6.000%, 7/01/27 – NPFG Insured | 7/18 at 100.00 | Baa1 | 273,555 | ||||||||||||||
| 300 | Sarpy County School District 037, Nebraska, General Obligation Bonds, Gretna Public Schools, Series 2012B, 3.250%, 12/15/34 | 8/17 at 100.00 | A+ | 305,418 | ||||||||||||||
| 5,935 | Total Tax Obligation/General | 6,803,472 | ||||||||||||||||
Tax Obligation/Limited – 12.5% | ||||||||||||||||||
| 265 | Government of Guam, Business Privilege Tax Bonds, Series 2011A, 5.125%, 1/01/42 | 1/22 at 100.00 | A | 303,028 | ||||||||||||||
| Nuveen Investments | 41 |
Portfolio of Investments (Unaudited)
Nuveen Nebraska Municipal Bond Fund (continued)
November 30, 2012
| Principal Amount (000) | Description (1) | Optional Call Provisions (2) | Ratings (3) | Value | ||||||||||||||
Tax Obligation/Limited (continued) | ||||||||||||||||||
| $ | 1,600 | Government of Guam, Business Privilege Tax Bonds, Series 2012B-1, 5.000%, 1/01/37 | 1/22 at 100.00 | A | $ | 1,816,688 | ||||||||||||
| 2,500 | Lincoln-West Haymarket Joint Public Agency, Nebraska, General Obligation Facility Bonds, Series 2011, 5.000%, 12/15/42 | 12/21 at 100.00 | AAA | 2,990,675 | ||||||||||||||
| 750 | Lincoln-Lancaster County, Nebraska, Public Building Commission Tax Supported Lease Rental Revenue Building Bonds, Refunding Series 2005, 4.500%, 10/15/26 | 4/15 at 100.00 | Aaa | 798,218 | ||||||||||||||
| 915 | Omaha, Nebraska, Special Obligation Bonds, Riverfront Redevelopment Project, Refunding Series 2012, 3.500%, 2/01/32 | 2/22 at 100.00 | AA+ | 958,371 | ||||||||||||||
| 650 | Omaha, Nebraska, Special Tax Redevelopment Bonds, Redevelopment 2008, 5.250%, 10/15/28 | 10/18 at 100.00 | AA+ | 771,882 | ||||||||||||||
| 790 | Omaha, Nebraska, Special Tax Redevelopment Bonds, Refunding Series 2012, 4.000%, 2/01/28 | 2/22 at 100.00 | AA+ | 895,892 | ||||||||||||||
| 1,000 | Puerto Rico Sales Tax Financing Corporation, Sales Tax Revenue Bonds, First Subordinate Series 2011A-1, 5.250%, 8/01/40 | 8/21 at 100.00 | AA– | 1,127,050 | ||||||||||||||
| 8,470 | Total Tax Obligation/Limited | 9,661,804 | ||||||||||||||||
U.S. Guaranteed – 2.3% (4) | ||||||||||||||||||
| 195 | Buffalo County, Nebraska, General Obligation Bonds, Series 2008, 6.000%, 12/15/28 (Pre-refunded 11/20/13) – AGC Insured | 11/13 at 102.00 | AA– (4) | 209,779 | ||||||||||||||
| 500 | Douglas County School District 10 Elkhorn, Nebraska, General Obligation Bonds, Public Schools Series 2009, 6.000%, 6/15/28 (Pre-refunded 1/12/14) | 1/14 at 100.00 | AA– (4) | 531,770 | ||||||||||||||
| 250 | Lincoln, Nebraska, Electric System Revenue Bonds, Refunding Series 2003, 5.000%, 9/01/26 (Pre-refunded 9/01/13) | 9/13 at 100.00 | AA (4) | 258,900 | ||||||||||||||
| 750 | University of Nebraska, Revenue Bonds, Lincoln Student Fees and Facilities, Series 2003, 5.000%, 7/01/22 (Pre-refunded 1/01/13) | 1/13 at 100.00 | Aa1 (4) | 753,105 | ||||||||||||||
| 1,695 | Total U.S. Guaranteed | 1,753,554 | ||||||||||||||||
Utilities – 25.8% | ||||||||||||||||||
Central Plains Energy Project, Nebraska, Gas Project 1 Revenue Bonds, Series 2007A: | ||||||||||||||||||
| 10 | 5.250%, 12/01/19 | No Opt. Call | A | 11,027 | ||||||||||||||
| 800 | 5.250%, 12/01/21 | No Opt. Call | A | 895,280 | ||||||||||||||
| 3,000 | Central Plains Energy Project, Nebraska, Gas Project 3 Revenue Bonds, Series 2012, 5.000%, 9/01/42 | 9/22 at 100.00 | A | 3,338,874 | ||||||||||||||
| 585 | Forsyth, Rosebud County, Montana, Pollution Control Revenue Refunding Bonds, Northwestern Corporation Colstrip Project, Series 2006, 4.650%, 8/01/23 – AMBAC Insured | 8/16 at 100.00 | A2 | 643,845 | ||||||||||||||
| 235 | Guam Power Authority, Revenue Bonds, Series 2012A, 5.000%, 10/01/34 | 10/22 at 100.00 | BBB | 268,504 | ||||||||||||||
Lincoln, Nebraska, Electric System Revenue Bonds, Refunding Series 2012: | ||||||||||||||||||
| 1,300 | 5.000%, 9/01/23 | 9/22 at 100.00 | AA | 1,679,691 | ||||||||||||||
| 500 | 3.125%, 9/01/29 | 9/22 at 100.00 | AA | 522,340 | ||||||||||||||
| 210 | Municipal Energy Agency of Nebraska, Power Supply System Revenue and Refunding Bonds, Series 2009A, 5.375%, 4/01/39 – BHAC Insured | 4/19 at 100.00 | AA+ | 252,460 | ||||||||||||||
| 50 | Municipal Energy Agency of Nebraska, Power Supply System Revenue Bonds, Refunding Series 2012A, 5.000%, 4/01/31 | 4/22 at 100.00 | A | 59,958 | ||||||||||||||
| 500 | Nebraska Public Power District, General Revenue Bonds, Series 2008B, 5.000%, 1/01/33 | 1/18 at 100.00 | A1 | 570,240 | ||||||||||||||
| 2,380 | Nebraska Public Power District, General Revenue Bonds, Series 2012A, 5.000%, 1/01/34 | 1/22 at 100.00 | A1 | 2,844,862 | ||||||||||||||
| 100 | Nebraska Public Power District, Power Supply System Revenue Bonds, Series 2006A, 5.000%, 1/01/41 – FGIC Insured | 1/16 at 100.00 | A1 | 109,547 | ||||||||||||||
| 500 | Nebraska Utility Corporation, Facilities Revenue Refunding Bonds, Series 2010, 5.000%, 1/01/22 | 1/21 at 100.00 | Aa1 | 630,400 | ||||||||||||||
| 42 | Nuveen Investments |
| Principal Amount (000) | Description (1) | Optional Call Provisions (2) | Ratings (3) | Value | ||||||||||||||
Utilities (continued) | ||||||||||||||||||
Omaha Public Power District, Nebraska, Electric System Revenue Bonds, Series 2008A: | ||||||||||||||||||
| $ | 1,000 | 5.500%, 2/01/33 | 2/18 at 100.00 | Aa1 | $ | 1,177,240 | ||||||||||||
| 1,200 | 5.500%, 2/01/35 | 2/18 at 100.00 | Aa1 | 1,412,688 | ||||||||||||||
| 515 | Omaha Public Power District, Nebraska, Electric System Revenue Bonds, Series 2011A, 4.000%, 2/01/18 | No Opt. Call | Aa1 | 598,713 | ||||||||||||||
| 920 | Omaha Public Power District, Nebraska, Electric System Revenue Bonds, Series 2012B, 4.000%, 2/01/27 | 2/22 at 100.00 | Aa1 | 1,057,135 | ||||||||||||||
| 10 | Omaha Public Power District, Nebraska, Electric System Revenue Bonds, Subordinate Lien Series 2005, 4.250%, 2/01/35 – BHAC Insured | 8/15 at 100.00 | AA+ | 10,416 | ||||||||||||||
| 1,000 | Puerto Rico Electric Power Authority, Power Revenue Bonds, Series WW, 5.250%, 7/01/25 | 7/18 at 100.00 | BBB+ | 1,074,670 | ||||||||||||||
| 1,500 | Southern Nebraska Public Power District, Electric System Revenue Bonds, Series 2008, 5.250%, 12/15/28 | 12/18 at 100.00 | AA– | 1,813,605 | ||||||||||||||
| 1,000 | Twin Valleys Public Power District, Nebraska, Electric System Revenue Bonds, Series 2011, 5.000%, 9/15/35 | 6/16 at 100.00 | N/R | 1,071,840 | ||||||||||||||
| 17,315 | Total Utilities | 20,043,335 | ||||||||||||||||
Water and Sewer – 4.9% | ||||||||||||||||||
| 1,000 | Lincoln, Nebraska, Sanitary Sewer Revenue Bonds, Refunding Series 2012, 4.000%, 6/15/28 | 6/22 at 100.00 | AA+ | 1,155,550 | ||||||||||||||
| 1,395 | Omaha, Nebraska, Sanitary Sewage System Revenue Bonds, Series 2011, 4.250%, 11/15/41 | 11/21 at 100.00 | AA | 1,551,352 | ||||||||||||||
Puerto Rico Aqueduct and Sewerage Authority, Revenue Bonds, Senior Lien Series 2008A: | ||||||||||||||||||
| 500 | 5.000%, 7/01/25 – AGC Insured | 7/18 at 100.00 | AA– | 557,325 | ||||||||||||||
| 500 | 6.000%, 7/01/38 | 7/18 at 100.00 | Baa2 | 530,200 | ||||||||||||||
| 3,395 | Total Water and Sewer | 3,794,427 | ||||||||||||||||
| $ | 67,750 | Total Municipal Bonds (cost $69,113,553) | 75,882,619 | |||||||||||||||
| Shares | Description (1) | Value | ||||||||||||||||
SHORT-TERM INVESTMENTS – 0.8% | ||||||||||||||||||
Money Market Funds – 0.8% | ||||||||||||||||||
| 588,895 | First American Tax Free Obligations Fund, Class Z, 0.000% (5) | $ | 588,895 | |||||||||||||||
Total Short-Term Investments (cost $588,895) | 588,895 | |||||||||||||||||
Total Investments (cost $69,702,448) – 98.7% | 76,471,514 | |||||||||||||||||
Other Assets Less Liabilities – 1.3% | 1,042,626 | |||||||||||||||||
Net Assets – 100% | $ | 77,514,140 | ||||||||||||||||
| (1) | All percentages shown in the Portfolio of Investments are based on net assets. |
| (2) | Optional Call Provisions: Dates (month and year) and prices of the earliest optional call or redemption. There may be other call provisions at varying prices at later dates. Certain mortgage-backed securities may be subject to periodic principal paydowns. |
| (3) | Ratings: Using the highest of Standard & Poor’s Group (“Standard & Poor’s”), Moody’s Investors Service, Inc. (“Moody’s”) or Fitch, Inc. (“Fitch”) rating. Ratings below BBB by Standard & Poor’s, Baa by Moody’s or BBB by Fitch are considered to be below investment grade. Holdings designated N/R are not rated by any of these national rating agencies. |
| (4) | Backed by an escrow or trust containing sufficient U.S. Government or U.S. Government agency securities, which ensure the timely payment of principal and interest. Certain bonds backed by U.S. Government or agency securities are regarded as having an implied rating equal to the rating of such securities. |
| (5) | The rate shown is the annualized seven-day effective yield as of November 30, 2012. |
| N/R | Not rated. |
See accompanying notes to financial statements.
| Nuveen Investments | 43 |
Portfolio of Investments (Unaudited)
Nuveen Oregon Intermediate Municipal Bond Fund
November 30, 2012
| Principal Amount (000) | Description (1) | Optional Call Provisions (2) | Ratings (3) | Value | ||||||||||||||
MUNICIPAL BONDS – 97.8% | ||||||||||||||||||
Education and Civic Organizations – 7.9% | ||||||||||||||||||
| $ | 2,350 | Forest Grove, Oregon, Campus Improvement Revenue Bonds, Pacific University Project, Refunding Series 2005A, 5.000%, 5/01/22 – RAAI Insured | 5/15 at 100.00 | BBB | $ | 2,451,567 | ||||||||||||
| 250 | Forest Grove, Oregon, Campus Improvement Revenue Bonds, Pacific University Project, Series 2009, 5.750%, 5/01/24 | 5/14 at 100.00 | BBB | 258,895 | ||||||||||||||
| 1,140 | Oregon State Facilities Authority, Revenue Bonds, Concordia University Project, Series 2010A, 6.125%, 9/01/30 | 9/20 at 100.00 | BB+ | 1,256,884 | ||||||||||||||
Oregon State Facilities Authority, Revenue Bonds, Lewis & Clark College Project, Refunding Series 2011A: | ||||||||||||||||||
| 625 | 4.000%, 10/01/17 | No Opt. Call | A– | 693,206 | ||||||||||||||
| 500 | 5.250%, 10/01/24 | 10/21 at 100.00 | A– | 609,940 | ||||||||||||||
| 1,000 | Oregon State Facilities Authority, Revenue Bonds, Linfield College, Refunding Series 2005A, 5.000%, 10/01/25 | 10/15 at 100.00 | Baa1 | 1,062,500 | ||||||||||||||
| 500 | Oregon State Facilities Authority, Revenue Bonds, Linfield College, Series 2010A, 4.750%, 10/01/28 | 10/20 at 100.00 | Baa1 | 567,970 | ||||||||||||||
| 1,000 | Oregon State Facilities Authority, Revenue Bonds, Reed College, Refunding Series 2011A, 5.000%, 7/01/29 | 7/20 at 100.00 | Aa2 | 1,206,650 | ||||||||||||||
Oregon State Facilities Authority, Revenue Bonds, University of Portland Projects, Series 2007A: | ||||||||||||||||||
| 1,000 | 4.250%, 4/01/14 | No Opt. Call | BBB+ | 1,035,550 | ||||||||||||||
| 250 | 5.000%, 4/01/17 | No Opt. Call | BBB+ | 283,365 | ||||||||||||||
| 2,000 | 4.500%, 4/01/21 | 4/18 at 100.00 | BBB+ | 2,213,140 | ||||||||||||||
| 210 | Oregon State Facilities Authority, Revenue Bonds, Willamette University, Refunding Series 2010A, 4.000%, 10/01/24 | 4/20 at 100.00 | A | 234,194 | ||||||||||||||
| 1,085 | Oregon State Facilities Authority, Revenue Bonds, Willamette University, Series 2007A, 4.300%, 10/01/21 | 10/17 at 100.00 | A | 1,185,417 | ||||||||||||||
Puerto Rico Industrial, Tourist, Educational, Medical and Environmental Control Facilities Fin Authority, Higher Education Revenue and Revenue Refunding Bonds, University of the Sacred Heart Project, Series 2012: | ||||||||||||||||||
| 400 | 5.000%, 10/01/22 (WI/DD, Settling 12/18/12) | No Opt. Call | BBB | 443,504 | ||||||||||||||
| 500 | 4.000%, 10/01/23 (WI/DD, Settling 12/18/12) | 10/22 at 100.00 | BBB | 507,505 | ||||||||||||||
| 350 | Puerto Rico Industrial, Tourist, Educational, Medical and Environmental Control Facilities Financing Authority, Higher Education Revenue Bonds, Inter-American University of Puerto Rico Project, Refunding Series 2012, 5.000%, 10/01/21 | No Opt. Call | A– | 404,996 | ||||||||||||||
| 13,160 | Total Education and Civic Organizations | 14,415,283 | ||||||||||||||||
Health Care – 13.1% | ||||||||||||||||||
| 1,035 | Astoria Hospital Facilities Authority, Oregon, Hospital Revenue and Refunding Bonds, Columbia Memorial Hospital, Series 2012, 5.000%, 8/01/23 | 8/22 at 100.00 | BBB– | 1,170,999 | ||||||||||||||
| 1,000 | Clackamas County Hospital Facility Authority, Oregon, Revenue Bonds, Legacy Health System, Series 2009A, 5.000%, 7/15/21 | 7/19 at 100.00 | A+ | 1,133,320 | ||||||||||||||
| 250 | Deschutes County Hospital Facility Authority, Oregon, Hospital Revenue Bonds, Cascade Healthcare Community, Inc., Series 2005B, 5.000%, 1/01/16 – AMBAC Insured | No Opt. Call | A3 | 269,645 | ||||||||||||||
| 1,500 | Deschutes County Hospital Facility Authority, Oregon, Hospital Revenue Refunding Bonds, Cascade Healthcare Community, Inc., Series 2008, 7.375%, 1/01/23 | 1/19 at 100.00 | A3 | 1,902,180 | ||||||||||||||
| 810 | Klamath Falls Intercommunity Hospital Authority, Oregon, Revenue Bonds, Merle West Medical Center Project, Series 2006, 4.750%, 9/01/20 – AGC Insured | 9/16 at 100.00 | AA– | 882,916 | ||||||||||||||
Klamath Falls Intercommunity Hospital Authority, Oregon, Revenue Bonds, Sky Lakes Medical Center Project, Series 2012: | ||||||||||||||||||
| 855 | 4.000%, 9/01/24 | No Opt. Call | BBB+ | 911,738 | ||||||||||||||
| 500 | 3.500%, 9/01/27 | No Opt. Call | BBB+ | 502,245 | ||||||||||||||
| 44 | Nuveen Investments |
| Principal Amount (000) | Description (1) | Optional Call Provisions (2) | Ratings (3) | Value | ||||||||||||||
Health Care (continued) | ||||||||||||||||||
| $ | 1,900 | Medford Hospital Facilities Authority, Oregon, Hospital Revenue Bonds, Asante Health System, Refunding Series 2010, 5.500%, 8/15/28 – AGM Insured | 8/20 at 100.00 | AA– | $ | 2,283,287 | ||||||||||||
Multnomah County Hospital Facilities Authority, Oregon, Revenue Bonds, Adventist Health System/West, Series 2009A: | ||||||||||||||||||
| 1,875 | 5.000%, 9/01/21 | 9/19 at 100.00 | A | 2,196,544 | ||||||||||||||
| 450 | 4.500%, 9/01/21 | 9/19 at 100.00 | A | 513,149 | ||||||||||||||
| 1,000 | Multnomah County Hospital Facilities Authority, Oregon, Revenue Bonds, Sisters of Providence Health System, Series 2004, 5.250%, 10/01/22 | 10/14 at 100.00 | AA | 1,085,200 | ||||||||||||||
Oregon Health and Science University, Revenue Bonds, Series 2012A: | ||||||||||||||||||
| 1,225 | 5.000%, 7/01/25 | 7/22 at 100.00 | A+ | 1,511,626 | ||||||||||||||
| 135 | 5.000%, 7/01/26 | 7/22 at 100.00 | A+ | 165,414 | ||||||||||||||
| 1,000 | Oregon State Facilities Authority, Auction Rate Revenue Bonds, Peacehealth System, Refunding Series 2009A, 5.000%, 11/01/20 | 11/19 at 100.00 | AA– | 1,212,590 | ||||||||||||||
Oregon State Facilities Authority, Oregon, Revenue Bonds, Samaritan Health Services, Refunding Series 2010A: | ||||||||||||||||||
| 1,250 | 5.000%, 10/01/19 | No Opt. Call | A– | 1,478,375 | ||||||||||||||
| 500 | 5.000%, 10/01/24 | 10/20 at 100.00 | A– | 577,850 | ||||||||||||||
Oregon State Facilities Authority, Revenue Bonds, Legacy Health System, Refunding Series 2010A: | ||||||||||||||||||
| 2,000 | 4.250%, 3/15/17 | No Opt. Call | A+ | 2,231,180 | ||||||||||||||
| 1,020 | 4.750%, 3/15/24 | 3/20 at 100.00 | A+ | 1,160,923 | ||||||||||||||
| 375 | Oregon State Facilities Authority, Revenue Bonds, Providence Health & Services, Series 2011C, 5.000%, 10/01/20 | No Opt. Call | AA | 465,019 | ||||||||||||||
| 450 | Salem Hospital Facility Authority, Oregon, Revenue Bonds, Salem Hospital Project, Series 2006A, 5.000%, 8/15/27 | 8/16 at 100.00 | A | 485,199 | ||||||||||||||
| 1,510 | Salem Hospital Facility Authority, Oregon, Revenue Bonds, Salem Hospital Project, Series 2008A, 5.750%, 8/15/23 | 8/18 at 100.00 | A | 1,783,944 | ||||||||||||||
| 20,640 | Total Health Care | 23,923,343 | ||||||||||||||||
Housing/Multifamily – 4.0% | ||||||||||||||||||
Oregon Housing and Community Services Department, Multifamily Housing Revenue Bonds, Refunding Series 2010A: | ||||||||||||||||||
| 750 | 4.000%, 7/01/19 (Alternative Minimum Tax) | No Opt. Call | Aaa | 814,118 | ||||||||||||||
| 500 | 4.250%, 7/01/21 (Alternative Minimum Tax) | 1/20 at 100.00 | Aaa | 544,785 | ||||||||||||||
Oregon State Facilities Authority, Revenue Bonds, CHF Ashland Southern Oregon University Project Series 2012: | ||||||||||||||||||
| 1,500 | 4.350%, 7/01/27 | 7/22 at 100.00 | AA– | 1,660,605 | ||||||||||||||
| 725 | 4.700%, 7/01/33 | 7/22 at 100.00 | AA– | 802,343 | ||||||||||||||
| 705 | Portland Housing Authority, Oregon, Housing Revenue Refundign Bonds, Yards at Union Station Project, Series 2007, 4.750%, 5/01/22 (Alternative Minimum Tax) | 5/17 at 100.00 | Aa2 | 754,336 | ||||||||||||||
Portland, Oregon, Economic Development Revenue Refunding Bonds, Broadway Project, Series 2008A: | ||||||||||||||||||
| 880 | 5.125%, 4/01/16 | No Opt. Call | A+ | 998,334 | ||||||||||||||
| 1,355 | 6.250%, 4/01/23 | 4/18 at 100.00 | A+ | 1,690,308 | ||||||||||||||
| 6,415 | Total Housing/Multifamily | 7,264,829 | ||||||||||||||||
Housing/Single Family – 0.6% | ||||||||||||||||||
| 195 | Oregon Housing and Community Services Department, Single Family Mortgage Revenue Bonds, Series 2004A, 4.050%, 1/01/18 | 7/13 at 100.00 | Aa2 | 197,613 | ||||||||||||||
| 910 | Oregon Housing and Community Services Department, Single Family Mortgage Revenue Bonds, Series 2008D, 4.750%, 7/01/22 | 1/18 at 100.00 | Aa2 | 1,008,580 | ||||||||||||||
| 1,105 | Total Housing/Single Family | 1,206,193 | ||||||||||||||||
| Nuveen Investments | 45 |
Portfolio of Investments (Unaudited)
Nuveen Oregon Intermediate Municipal Bond Fund (continued)
November 30, 2012
| Principal Amount (000) | Description (1) | Optional Call Provisions (2) | Ratings (3) | Value | ||||||||||||||
Long-Term Care – 2.2% | ||||||||||||||||||
| $ | 1,000 | Clackamas County Hospital Facility Authority, Oregon, Revenue Refunding Bonds, Robison Jewish Home, DBA Cedar Sinia Park, Series 2005, 5.125%, 10/01/24 | 10/15 at 100.00 | N/R | $ | 1,015,740 | ||||||||||||
| 1,000 | Multnomah County Hospital Facilities Authority, Oregon, Revenue Bonds, Terwilliger Plaza Project, Series 2009, 5.250%, 12/01/26 | 12/16 at 100.00 | BBB | 1,051,480 | ||||||||||||||
| 660 | Multnomah County Hospital Facilities Authority, Oregon, Revenue Refunding Bond, Terwilliger Plaza, Inc., Series 2012, 5.000%, 12/01/29 | 12/22 at 100.00 | BBB | 731,366 | ||||||||||||||
Salem Hospital Facility Authority, Oregon, Revenue Bonds, Capital Manor, Inc., Refunding Series 2012: | ||||||||||||||||||
| 550 | 5.000%, 5/15/22 | No Opt. Call | N/R | 600,193 | ||||||||||||||
| 550 | 5.750%, 5/15/27 | 5/22 at 100.00 | N/R | 614,829 | ||||||||||||||
| 3,760 | Total Long-Term Care | 4,013,608 | ||||||||||||||||
Tax Obligation/General – 38.0% | ||||||||||||||||||
| 2,000 | Beaverton School District 48J, Washington and Multnomah Counties, Oregon, General Obligation Refunding Bonds, Series 2012B, 4.000%, 6/15/24 (WI/DD, Settling 12/11/12) | 6/22 at 100.00 | AA+ | 2,350,060 | ||||||||||||||
Beaverton School District 48J, Washington County, Oregon, General Obligation Bonds, Series 2004A: | ||||||||||||||||||
| 1,600 | 5.000%, 6/01/14 – AGM Insured | No Opt. Call | Aa2 | 1,711,712 | ||||||||||||||
| 1,500 | 5.000%, 6/01/16 – AGM Insured | 12/14 at 100.00 | Aa2 | 1,639,425 | ||||||||||||||
Blue Mountain Hospital District, Grant County, Oregon, General Obligation Bonds, Refunding Series 2010: | ||||||||||||||||||
| 605 | 4.250%, 2/01/19 | No Opt. Call | Baa1 | 687,728 | ||||||||||||||
| 655 | 4.500%, 2/01/20 | No Opt. Call | Baa1 | 762,754 | ||||||||||||||
| 280 | 5.000%, 2/01/21 | No Opt. Call | Baa1 | 336,837 | ||||||||||||||
Central Oregon Community College District, Crook, Jefferson, Deschutes, Klamath, Lake, and Wasco Counties, Oregon, General Obligation Bonds, Series 2010: | ||||||||||||||||||
| 1,000 | 4.000%, 6/15/19 | No Opt. Call | AA+ | 1,196,650 | ||||||||||||||
| 810 | 4.500%, 6/15/20 | No Opt. Call | AA+ | 1,009,916 | ||||||||||||||
| 1,000 | Chemeketa Community College District, Oregon, General Obligation Bonds, Series 2008, 5.500%, 6/15/24 | 6/18 at 100.00 | AA+ | 1,226,260 | ||||||||||||||
City of The Dalles, Wasco County, Oregon, General Obligation Bonds, Series 2008: | ||||||||||||||||||
| 130 | 4.000%, 6/01/17 | No Opt. Call | A+ | 146,231 | ||||||||||||||
| 140 | 4.000%, 6/01/18 | No Opt. Call | A+ | 160,765 | ||||||||||||||
| 75 | 4.000%, 6/01/19 | 6/18 at 100.00 | A+ | 85,789 | ||||||||||||||
| 1,145 | Clackamas Community College District, Oregon, General Obligation Bonds, Series 2006, 5.000%, 5/01/19 – NPFG Insured | 5/16 at 100.00 | AA | 1,306,468 | ||||||||||||||
| 1,975 | Clackamas County School District 115, Oregon, General Obligation Bond, Series 2006B, 4.500%, 6/15/21 – NPFG Insured | 6/16 at 100.00 | AA+ | 2,203,962 | ||||||||||||||
Clackamas County School District 12, North Clackamas, Oregon, General Obligation Bonds, Series 2007B: | ||||||||||||||||||
| 685 | 5.000%, 6/15/19 – AGM Insured | 6/17 at 100.00 | AA+ | 811,211 | ||||||||||||||
| 3,665 | 5.000%, 6/15/21 – AGM Insured | 6/17 at 100.00 | AA+ | 4,322,348 | ||||||||||||||
| 3,135 | 5.000%, 6/15/22 – AGM Insured | 6/17 at 100.00 | AA+ | 3,689,644 | ||||||||||||||
| 1,000 | Clackamas County School District 46 Oregon Trail, Oregon, General Obligation Bonds, Series 2009A, 5.000%, 6/15/24 | 6/19 at 100.00 | AA+ | 1,245,150 | ||||||||||||||
| 525 | Clackamas County School District 86, Oregon, General Obligation Bonds, Refunding Series 2012A, 5.000%, 6/15/25 | 6/22 at 100.00 | AA+ | 664,892 | ||||||||||||||
| 1,000 | David Douglas School District 40, Multnomah County, Oregon, General Obligation Bonds, Series 2012B, 0.000%, 6/15/25 | No Opt. Call | AA+ | 727,120 | ||||||||||||||
| 1,755 | Deschutes County, Oregon, General Obligation Bonds, Series 2002, 5.000%, 12/01/14 – AGM Insured | 12/12 at 100.00 | Aa2 | 1,762,108 | ||||||||||||||
| 46 | Nuveen Investments |
| Principal Amount (000) | Description (1) | Optional Call Provisions (2) | Ratings (3) | Value | ||||||||||||||
Tax Obligation/General (continued) | ||||||||||||||||||
| $ | 3,030 | Deschutes and Jefferson Counties School District 2J Redmond, Oregon, General Obligation Bonds, Defered Interest Series 2008, 0.000%, 6/15/22 | No Opt. Call | Aa1 | $ | 2,495,357 | ||||||||||||
| 965 | Forest Grove School District 15, Washington County, Oregon, General Obligation Bonds, Series 2012B, 0.000%, 6/15/25 | No Opt. Call | AA+ | 705,068 | ||||||||||||||
| 1,000 | Hillsboro School District 1J, Washington, Multnomah and Yamhill Counties, Oregon, General Obligation Refunding Bonds, Series 1998, 5.000%, 11/01/14 | No Opt. Call | Aa2 | 1,088,230 | ||||||||||||||
| 1,000 | Josephine County Unit School District Three Rivers, Oregon, General Obligation Bonds, Refunding Series 2005, 5.000%, 12/15/19 – NPFG Insured | No Opt. Call | Aa1 | 1,268,210 | ||||||||||||||
| 870 | Keizer, Oregon, General Obligation Assessment Bonds, Keizer Station Area A Local Improvement District, Series 2008, 5.200%, 6/01/31 | 6/18 at 100.00 | A1 | 969,180 | ||||||||||||||
| 200 | Lake Oswego School District 7J, Clackamas County, Oregon, General Obligation Bonds, Refunding Series 2005, 5.250%, 6/01/25 – AGM Insured | No Opt. Call | Aa1 | 269,666 | ||||||||||||||
| 1,500 | Lane Community College, Oregon, General Obligation Bonds, Series 2012, 4.000%, 6/15/20 | No Opt. Call | AA+ | 1,790,160 | ||||||||||||||
| 1,305 | Marion-Clackamas Counties School District 4J, Oregon, General Obligation Bonds, Series 2007, 4.500%, 6/15/22 – NPFG Insured | 6/16 at 100.00 | Aa1 | 1,452,922 | ||||||||||||||
| 1,000 | McMinnville School District 40, Yamhill County, Oregon, General Obligation Bonds, Series 2001, 5.500%, 6/15/13 – AGM Insured | No Opt. Call | Aa3 | 1,028,610 | ||||||||||||||
| 1,635 | Metro, Oregon, General Obligation Bonds, Series 2007, 5.000%, 6/01/20 | 6/17 at 100.00 | AAA | 1,922,171 | ||||||||||||||
| 1,015 | Multnomah-Clackamas Counties, Oregon, School District 10JT, General Obligation Bonds, Series 2005, 5.250%, 6/15/17 – AGM Insured | No Opt. Call | AA+ | 1,221,847 | ||||||||||||||
| 125 | North Lincoln Fire and Rescue District 1, Oregon, General Obligation Bonds, Series 2007, 4.250%, 2/01/18 – AGM Insured | 2/17 at 100.00 | AA– | 141,061 | ||||||||||||||
| 1,500 | Oregon Department of Administrative Services, General Obligation Bonds, Oregon Opportunity, Refunding Series 2010F, 5.000%, 12/01/20 | 6/20 at 100.00 | AA+ | 1,907,430 | ||||||||||||||
Oregon State, General Obligation Bonds, Alterrnative Energy Series 2011B: | ||||||||||||||||||
| 540 | 5.000%, 1/01/20 (Alternative Minimum Tax) | No Opt. Call | AA+ | 657,882 | ||||||||||||||
| 560 | 5.000%, 1/01/21 (Alternative Minimum Tax) | No Opt. Call | AA+ | 690,726 | ||||||||||||||
| 100 | 5.000%, 1/01/23 (Alternative Minimum Tax) | 1/21 at 100.00 | AA+ | 120,677 | ||||||||||||||
| 455 | Pacific City Joint Water-Sanitary Authority, Tilamook County, Oregon, General Obligation Bonds, Series 2007, 4.650%, 7/01/22 | 7/17 at 100.00 | N/R | 493,370 | ||||||||||||||
| 1,000 | Puerto Rico Government Development Bank, Senior Note Revenue Bonds, Senior Lien, Series 2006B, 5.000%, 12/01/14 | No Opt. Call | Baa1 | 1,056,830 | ||||||||||||||
| 1,250 | Redmond School District 2J, Deschutes and Jefferson Counties, Oregon, General Obligation Bonds, Series 2004A, 5.000%, 6/15/13 – NPFG Insured | No Opt. Call | Aa1 | 1,282,375 | ||||||||||||||
Redmond, Oregon, Full Faith and Credit Obligations, Terminal Expansion Project, Series 2009: | ||||||||||||||||||
| 240 | 4.000%, 6/01/21 | 6/19 at 100.00 | A1 | 273,038 | ||||||||||||||
| 200 | 4.250%, 6/01/23 | 6/19 at 100.00 | A1 | 225,466 | ||||||||||||||
| 500 | 4.625%, 6/01/29 | 6/19 at 100.00 | A1 | 555,475 | ||||||||||||||
| 340 | Redmond, Oregon, Full Faith and Credit Refunding Obligations, Series 2012A, 4.000%, 6/01/25 | 6/22 at 100.00 | A1 | 386,379 | ||||||||||||||
| 635 | Salem-Keizer School District 24J, Marion and Polk Counties, Oregon, General Obligation Bonds, Series 2009B, 0.000%, 6/15/22 | No Opt. Call | AA+ | 522,954 | ||||||||||||||
Sandy, Clackamas County, Oregon, General Obligation Bonds, Series 2010: | ||||||||||||||||||
| 190 | 4.000%, 6/01/15 | 6/14 at 100.00 | AA | 199,114 | ||||||||||||||
| 150 | 4.000%, 6/01/16 | 6/14 at 100.00 | AA | 157,128 | ||||||||||||||
| Nuveen Investments | 47 |
Portfolio of Investments (Unaudited)
Nuveen Oregon Intermediate Municipal Bond Fund (continued)
November 30, 2012
| Principal Amount (000) | Description (1) | Optional Call Provisions (2) | Ratings (3) | Value | ||||||||||||||
Tax Obligation/General (continued) | ||||||||||||||||||
| $ | 210 | 4.000%, 6/01/17 | 6/14 at 100.00 | AA | $ | 219,769 | ||||||||||||
| 240 | 4.000%, 6/01/18 | 6/14 at 100.00 | AA | 250,874 | ||||||||||||||
| 100 | 4.000%, 6/01/19 | 6/14 at 100.00 | AA | 104,442 | ||||||||||||||
| 1,030 | Tigard-Tualatin School District 23J, Washington and Clackamas Counties, Oregon, General Obligation Bonds, Series 2000, 0.000%, 6/15/14 | No Opt. Call | Aa3 | 1,011,141 | ||||||||||||||
| 1,000 | Tigard-Tualatin School District 23J, Washington and Clackamas Counties, Oregon, General Obligation Refunding Bonds, Series 2001, 5.500%, 6/01/13 -FGIC Insured | No Opt. Call | Aa2 | 1,026,710 | ||||||||||||||
| 960 | Tualatin Hills Park and Recreation District, Oregon, General Obligation Bonds, Series 1998, 5.750%, 3/01/13 – NPFG Insured | No Opt. Call | Aa1 | 973,469 | ||||||||||||||
| 1,540 | Umatilla County School District 016R Pendleton, Oregon, General Obligation Bonds, Series 1998, 5.250%, 7/01/14 – NPFG Insured | No Opt. Call | Aa3 | 1,649,556 | ||||||||||||||
| 1,080 | Wasco County School District 012, Oregon, General Obligation Bonds, Series 2001 Refunding, 5.500%, 6/15/14 – AGM Insured | No Opt. Call | AA– | 1,165,601 | ||||||||||||||
| 1,525 | Washington County, Oregon, General Obligation Bonds, Series 2006, 5.000%, 6/01/22 | 6/16 at 102.00 | Aa1 | 1,770,998 | ||||||||||||||
| 2,490 | Washington Multnomah & Yamhill Counties School District 1J Hillsboro, Oregon, General Obligation Bonds, Series 2006, 5.000%, 6/15/19 – NPFG Insured | 6/17 at 100.00 | Aa2 | 2,978,887 | ||||||||||||||
| 1,200 | Washington Multnomah & Yamhill Counties School District 1J Hillsboro, Oregon, General Obligation Bonds, Series 2012, 4.000%, 6/15/23 | No Opt. Call | Aa1 | 1,430,844 | ||||||||||||||
West Valley Fire District, Oregon, General Obligation Bonds, Series 2010: | ||||||||||||||||||
| 120 | 3.000%, 2/01/13 | No Opt. Call | N/R | 120,340 | ||||||||||||||
| 125 | 3.000%, 2/01/14 | No Opt. Call | N/R | 126,993 | ||||||||||||||
| 125 | 3.000%, 2/01/15 | No Opt. Call | N/R | 128,534 | ||||||||||||||
| 130 | 3.500%, 2/01/16 | No Opt. Call | N/R | 136,785 | ||||||||||||||
| 135 | 4.000%, 2/01/17 | No Opt. Call | N/R | 146,264 | ||||||||||||||
| 140 | 4.000%, 2/01/18 | No Opt. Call | N/R | 153,481 | ||||||||||||||
| 145 | 4.000%, 2/01/19 | No Opt. Call | N/R | 160,940 | ||||||||||||||
Yamhill County School District 29J Newberg, Oregon, General Obligation Bonds, Refunding Series 2005: | ||||||||||||||||||
| 1,260 | 5.250%, 6/15/15 – FGIC Insured | No Opt. Call | Aa1 | 1,407,798 | ||||||||||||||
| 1,835 | 5.250%, 6/15/16 – FGIC Insured | No Opt. Call | Aa1 | 2,127,738 | ||||||||||||||
| 1,030 | Yamhill County School District 40, McMinnville, Oregon, General Obligation Bonds, Series 2007, 5.000%, 6/15/23 – AGM Insured | 6/17 at 100.00 | Aa1 | 1,196,798 | ||||||||||||||
| 62,405 | Total Tax Obligation/General | 69,216,318 | ||||||||||||||||
Tax Obligation/Limited – 14.3% | ||||||||||||||||||
| 1,060 | Oregon Department of Administrative Services, Certificates of Participation, Series 2006A, 5.000%, 11/01/18 – NPFG Insured | 11/16 at 100.00 | AA | 1,226,590 | ||||||||||||||
| 1,500 | Oregon Department of Administrative Services, Certificates of Participation, Series 2009A, 4.700%, 5/01/25 | 5/19 at 100.00 | AA | 1,731,585 | ||||||||||||||
| 1,055 | Oregon Department of Administrative Services, Certificates of Participation, Series 2009C, 5.000%, 11/01/25 | 11/19 at 100.00 | AA | 1,253,308 | ||||||||||||||
| 2,500 | Oregon State Department of Transportation, Highway User Tax Revenue Bonds, Series 2006A, 5.000%, 11/15/30 | 11/16 at 100.00 | AAA | 2,873,375 | ||||||||||||||
| 1,005 | Oregon State Department of Transportation, Highway User Tax Revenue Bonds, Series 2009A, 5.000%, 11/15/21 | 5/19 at 100.00 | AAA | 1,232,602 | ||||||||||||||
| 2,655 | Portland, Oregon, Renewal and Redevelopment Revenue Bonds, North Macadam Series 2010B, 5.000%, 6/15/24 | 6/20 at 100.00 | A1 | 3,113,996 | ||||||||||||||
| 1,000 | Portland, Oregon, River District Urban Renewal and Redevelopment Bonds, Series 2012B, 5.000%, 6/15/23 | 6/22 at 100.00 | A1 | 1,227,620 | ||||||||||||||
| 2,030 | Portland, Oregon, South Park Blocks Urban Renewal and Redevelopment Bonds, Series 2008B, 5.000%, 6/15/21 | 6/18 at 101.00 | Aa3 | 2,438,355 | ||||||||||||||
| 48 | Nuveen Investments |
| Principal Amount (000) | Description (1) | Optional Call Provisions (2) | Ratings (3) | Value | ||||||||||||||
Tax Obligation/Limited (continued) | ||||||||||||||||||
| $ | 280 | Seaside Urban Renewal Agency, Clatsop County, Oregon, Greater Seaside Urban Renewal Area Revenue Bonds, Series 2006, 4.750%, 6/01/15 | No Opt. Call | N/R | $ | 295,100 | ||||||||||||
Tri-County Metropolitan Transportation District, Oregon, Capital Grant Receipt Revenue Bonds, Series 2011A: | ||||||||||||||||||
| 1,000 | 5.000%, 10/01/25 | 10/21 at 100.00 | A | 1,238,380 | ||||||||||||||
| 1,585 | 5.000%, 10/01/26 | 10/21 at 100.00 | A | 1,949,867 | ||||||||||||||
| 2,305 | Tri-County Metropolitan Transportation District, Oregon, Revenue Bonds, Senior Lien Payroll Tax, Series 2012A, 5.000%, 9/01/24 | 9/22 at 100.00 | AAA | 2,967,227 | ||||||||||||||
| 3,085 | Virgin Islands Public Finance Authority, Gross Receipts Taxes Loan Note, Refunding Series 2012A, 4.000%, 10/01/22 | No Opt. Call | BBB+ | 3,290,153 | ||||||||||||||
Virgin Islands Public Finance Authority, Matching Fund Loan Notes Revenue Bonds, Senior Lien Series 2010A: | ||||||||||||||||||
| 1,015 | 5.000%, 10/01/20 | No Opt. Call | BBB+ | 1,183,531 | ||||||||||||||
| 30 | 5.000%, 10/01/29 | 10/20 at 100.00 | BBB+ | 33,353 | ||||||||||||||
| 22,105 | Total Tax Obligation/Limited | 26,055,042 | ||||||||||||||||
Transportation – 3.1% | ||||||||||||||||||
| 1,000 | Port of Portland, Oregon, International Airport Revenue Bonds, Series 2010-20C, 5.000%, 7/01/17 (Alternative Minimum Tax) | No Opt. Call | AA– | 1,156,230 | ||||||||||||||
| 250 | Port of Portland, Oregon, International Airport Revenue Bonds, Series 2011-21, 5.000%, 7/01/17 (Alternative Minimum Tax) | No Opt. Call | AA– | 295,685 | ||||||||||||||
| 1,030 | Port of Portland, Oregon, International Airport Revenue Bonds, Series 2011, 5.000%, 7/01/23 (Alternative Minimum Tax) | 7/21 at 100.00 | AA– | �� | 1,234,888 | |||||||||||||
Port of Portland, Oregon, Portland International Airport Passenger Facility Charge Revenue Bonds, Series 2011A: | ||||||||||||||||||
| 865 | 4.000%, 7/01/17 | No Opt. Call | A | 969,258 | ||||||||||||||
| 1,500 | 5.000%, 7/01/26 | 7/21 at 100.00 | A | 1,777,305 | ||||||||||||||
| 215 | Redmond, Oregon, Airport Revenue Bonds, Series 2009, 5.500%, 6/01/24 | 6/19 at 100.00 | Baa3 | 242,077 | ||||||||||||||
| 4,860 | Total Transportation | 5,675,443 | ||||||||||||||||
U.S. Guaranteed – 5.0% (4) | ||||||||||||||||||
| 2,170 | Chemeketa Community College District, Oregon, General Obligation Bonds, Refunding Series 1998, 5.500%, 6/01/13 – FGIC Insured (ETM) | No Opt. Call | N/R (4) | 2,227,787 | ||||||||||||||
Clackamas County School District 86, Oregon, General Obligation Bonds, Series 2005: | ||||||||||||||||||
| 1,000 | 5.000%, 6/15/18 (Pre-refunded 6/15/15) – AGM Insured | 6/15 at 100.00 | AA+ (4) | 1,116,130 | ||||||||||||||
| 1,305 | 5.000%, 6/15/21 (Pre-refunded 6/15/15) – AGM Insured | 6/15 at 100.00 | AA+ (4) | 1,456,550 | ||||||||||||||
| 1,000 | Linn County Community School District 9, Lebanon, Oregon, General Obligation Bonds, Series 2001, 5.550%, 6/15/21 (Pre-refunded 6/15/13) – FGIC Insured | 6/13 at 100.00 | AA+ (4) | 1,029,000 | ||||||||||||||
| 1,010 | Medford Urban Renewal Agency, Jackson County, Oregon, Tax Revenue Bonds, Urban Redevelopment Refunding Series 2002, 4.500%, 6/01/13 (ETM) | 1/13 at 101.00 | A– (4) | 1,023,766 | ||||||||||||||
| 1,010 | Oregon Health and Science University, Revenue Bonds, Series 2002A, 5.250%, 7/01/22 (Pre-refunded 1/01/13) – NPFG Insured | 1/13 at 100.00 | A+ (4) | 1,014,323 | ||||||||||||||
| 700 | Oregon State Department of Transportation, Highway User Tax Revenue Bonds, Series 2005A, 5.000%, 11/15/24 (Pre-refunded 11/15/14) | 11/14 at 100.00 | AAA | 763,686 | ||||||||||||||
| 440 | Puerto Rico Sales Tax Financing Corporation, Sales Tax Revenue Bonds, First Subordinate Series 2010A, 4.375%, 8/01/20 (ETM) | 2/20 at 100.00 | A+ (4) | 495,585 | ||||||||||||||
| 8,635 | Total U.S. Guaranteed | 9,126,827 | ||||||||||||||||
Utilities – 1.2% | ||||||||||||||||||
| 150 | Guam Power Authority, Revenue Bonds, Series 2012A, 5.000%, 10/01/21 – AGM Insured | No Opt. Call | AA– | 180,881 | ||||||||||||||
| Nuveen Investments | 49 |
Portfolio of Investments (Unaudited)
Nuveen Oregon Intermediate Municipal Bond Fund (continued)
November 30, 2012
| Principal Amount (000) | Description (1) | Optional Call Provisions (2) | Ratings (3) | Value | ||||||||||||||
Utilities (continued) | ||||||||||||||||||
| $ | 885 | Northern Wasco County Peoples Utility District, Wasco County, Oregon, McNary Dam Fishway Hydroelectric Project Revenue Bonds, Refunding Series 2012, 5.000%, 12/01/23 | No Opt. Call | AA– | $ | 1,139,181 | ||||||||||||
| 800 | Puerto Rico Electric Power Authority, Power Revenue Bonds, Series WW, 5.375%, 7/01/23 | 7/18 at 100.00 | BBB+ | 873,152 | ||||||||||||||
| 1,835 | Total Utilities | 2,193,214 | ||||||||||||||||
Water and Sewer – 8.4% | ||||||||||||||||||
| 820 | Lane County Metropolitan Wastewater Management Commission, Oregon, Wastewater Revenue Bonds, Series 2006, 5.000%, 11/01/21 – NPFG Insured | 11/16 at 100.00 | AA | 948,871 | ||||||||||||||
| 1,500 | Lane County Metropolitan Wastewater Management Commission, Oregon, Wastewater Revenue Bonds, Series 2008, 5.000%, 11/01/22 | 11/18 at 100.00 | AA | 1,821,780 | ||||||||||||||
Lebanon, Oregon, Wastewater Revenue Bonds, Refunding Series 2010: | ||||||||||||||||||
| 165 | 4.000%, 3/01/17 – AGM Insured | No Opt. Call | AA– | 184,899 | ||||||||||||||
| 435 | 4.000%, 3/01/18 – AGM Insured | No Opt. Call | AA– | 498,179 | ||||||||||||||
| 1,000 | Portland, Oregon, Sewer System Revenue Bonds, Refunding First Lien Series 2008A, 4.750%, 6/15/24 | 6/18 at 100.00 | AA | 1,172,780 | ||||||||||||||
| 1,175 | Portland, Oregon, Sewer System Revenue Bonds, Series 2006B, 5.000%, 6/15/23 – NPFG Insured | 6/16 at 100.00 | AA | 1,343,436 | ||||||||||||||
| 2,000 | Portland, Oregon, Water System Revenue Bonds, Refunding Series 2010A, 5.000%, 5/01/15 | No Opt. Call | Aaa | 2,223,960 | ||||||||||||||
| 500 | Portland, Oregon, Water System Revenue Bonds, Second Lien Series 2006A, 4.375%, 10/01/24 – NPFG Insured | 10/16 at 100.00 | Aa1 | 545,120 | ||||||||||||||
| 1,500 | Puerto Rico Aqueduct and Sewerage Authority, Revenue Bonds, Senior Lien Series 2008A, 5.000%, 7/01/25 – AGC Insured | 7/18 at 100.00 | AA– | 1,671,975 | ||||||||||||||
Redmond, Oregon, Water Revenue Bonds, Series 2010: | ||||||||||||||||||
| 450 | 4.500%, 6/01/25 | 6/20 at 100.00 | A1 | 524,709 | ||||||||||||||
| 5 | 4.500%, 6/01/30 | 6/20 at 100.00 | A1 | 5,767 | ||||||||||||||
| 325 | The Dalles, Oregon, Water Revenue Bonds, Series 200, 4.250%, 6/01/20 – AMBAC Insured | 6/17 at 100.00 | N/R | 352,586 | ||||||||||||||
| 1,435 | Tigard, Washington County, Oregon, Water System Revenue Bonds, Series 2012, 5.000%, 8/01/26 | 8/22 at 100.00 | AA– | 1,805,718 | ||||||||||||||
| 1,000 | Washington County, Oregon, Clean Water Services Sewer Revenue Bonds, Senior Lien Series 2004, 5.000%, 10/01/14 – NPFG Insured | No Opt. Call | AA | 1,084,540 | ||||||||||||||
| 900 | Woodburn, Marion County, Oregon, Wastewater Revenue Bonds, Refunding Series 2011A, 5.000%, 3/01/20 | No Opt. Call | A2 | 1,102,518 | ||||||||||||||
| 13,210 | Total Water and Sewer | 15,286,838 | ||||||||||||||||
| $ | 158,130 | Total Municipal Bonds (cost $162,386,344) | 178,376,938 | |||||||||||||||
| Shares | Description (1) | Value | ||||||||||||||||
SHORT-TERM INVESTMENTS – 2.6% | ||||||||||||||||||
Money Market Funds – 2.6% | ||||||||||||||||||
| 4,676,914 | First American Tax Free Obligations Fund, Class Z, 0.000% (5) | $ | 4,676,914 | |||||||||||||||
Total Short-Term Investments (cost $4,676,914) | 4,676,914 | |||||||||||||||||
Total Investments (cost $167,063,258) – 100.4% | 183,053,852 | |||||||||||||||||
Other Assets Less Liabilities – (0.4)% | (814,327) | |||||||||||||||||
Net Assets – 100% | $ | 182,239,525 | ||||||||||||||||
| 50 | Nuveen Investments |
| (1) | All percentages shown in the Portfolio of Investments are based on net assets. |
| (2) | Optional Call Provisions: Dates (month and year) and prices of the earliest optional call or redemption. There may be other call provisions at varying prices at later dates. Certain mortgage-backed securities may be subject to periodic principal paydowns. |
| (3) | Ratings: Using the highest of Standard & Poor’s Group (“Standard & Poor’s”), Moody’s Investors Service, Inc. (“Moody’s”) or Fitch, Inc. (“Fitch”) rating. Ratings below BBB by Standard & Poor’s, Baa by Moody’s or BBB by Fitch are considered to be below investment grade. Holdings designated N/R are not rated by any of these national rating agencies. |
| (4) | Backed by an escrow or trust containing sufficient U.S. Government or U.S. Government agency securities, which ensure the timely payment of principal and interest. Certain bonds backed by U.S. Government or agency securities are regarded as having an implied rating equal to the rating of such securities. |
| (5) | The rate shown is the annualized seven-day effective yield as of November 30, 2012. |
| N/R | Not rated. |
| WI/DD | Investment, or portion of investment, purchased on a when-issued or delayed delivery basis. |
| (ETM) | Escrowed to maturity. |
See accompanying notes to financial statements.
| Nuveen Investments | 51 |
Statement of Assets & Liabilities (Unaudited)
November 30, 2012
| Minnesota Intermediate | Minnesota | Nebraska | Oregon Intermediate | |||||||||||||
Assets | ||||||||||||||||
Investments, at value (cost $256,112,782, $208,589,388, $69,702,448 and $167,063,258, respectively) | $ | 281,392,402 | $ | 232,172,735 | $ | 76,471,514 | $ | 183,053,852 | ||||||||
Cash | — | — | — | 23,783 | ||||||||||||
Receivables: | ||||||||||||||||
Interest | 3,213,558 | 2,587,134 | 1,012,738 | 2,399,799 | ||||||||||||
Investments sold | — | — | 1,082,800 | — | ||||||||||||
Shares sold | 877,746 | 895,924 | 413,004 | 490,668 | ||||||||||||
Other assets | 746 | 551 | 223 | 476 | ||||||||||||
Total assets | 285,484,452 | 235,656,344 | 78,980,279 | 185,968,578 | ||||||||||||
Liabilities | ||||||||||||||||
Cash overdraft | — | 1,631,700 | — | — | ||||||||||||
Payables: | ||||||||||||||||
Dividends | 544,301 | 259,837 | 82,064 | 286,770 | ||||||||||||
Investments purchased | 3,572,320 | 3,307,366 | 1,080,230 | 3,281,889 | ||||||||||||
Shares redeemed | 154,301 | 239,306 | 240,651 | 27,705 | ||||||||||||
Accrued expenses: | ||||||||||||||||
Management fees | 122,384 | 99,937 | 35,091 | 82,121 | ||||||||||||
Directors fees | 986 | 768 | 260 | 628 | ||||||||||||
12b-1 distribution and service fees | 16,010 | 36,647 | 10,329 | 15,686 | ||||||||||||
Other | 63,268 | 84,309 | 17,514 | 34,254 | ||||||||||||
Total liabilities | 4,473,570 | 5,659,870 | 1,466,139 | 3,729,053 | ||||||||||||
Net assets | $ | 281,010,882 | $ | 229,996,474 | $ | 77,514,140 | $ | 182,239,525 | ||||||||
Class A Shares | ||||||||||||||||
Net assets | $ | 59,120,239 | $ | 120,114,260 | $ | 26,334,136 | $ | 51,126,816 | ||||||||
Shares outstanding | 5,460,209 | 9,802,989 | 2,321,990 | 4,756,793 | ||||||||||||
Net asset value per share | $ | 10.83 | $ | 12.25 | $ | 11.34 | $ | 10.75 | ||||||||
Offering price per share (net asset value per share plus maximum sales charge of 3.00%, 4.20%, 4.20% and 3.00%, respectively, of offering price) | $ | 11.16 | $ | 12.79 | $ | 11.84 | $ | 11.08 | ||||||||
Class C Shares | ||||||||||||||||
Net assets | $ | 6,601,934 | $ | 10,852,315 | $ | 6,798,458 | $ | 12,725,796 | ||||||||
Shares outstanding | 612,770 | 886,788 | 598,910 | 1,188,208 | ||||||||||||
Net asset value and offering price per share | $ | 10.77 | $ | 12.24 | $ | 11.35 | $ | 10.71 | ||||||||
Class C1 Shares | ||||||||||||||||
Net assets | $ | 4,327,042 | $ | 21,003,530 | $ | 4,166,373 | N/A | |||||||||
Shares outstanding | 398,702 | 1,721,793 | 370,268 | N/A | ||||||||||||
Net asset value and offering price per share | $ | 10.85 | $ | 12.20 | $ | 11.25 | N/A | |||||||||
Class I Shares | ||||||||||||||||
Net assets | $ | 210,961,667 | $ | 78,026,369 | $ | 40,215,173 | $ | 118,386,913 | ||||||||
Shares outstanding | 19,594,438 | 6,375,324 | 3,544,122 | 11,011,339 | ||||||||||||
Net asset value and offering price per share | $ | 10.77 | $ | 12.24 | $ | 11.35 | $ | 10.75 | ||||||||
Net assets consist of: | ||||||||||||||||
Capital paid-in | $ | 255,227,555 | $ | 205,470,531 | $ | 71,361,375 | $ | 166,748,141 | ||||||||
Undistributed (Over-distribution of) net investment income | 219,682 | 728,729 | (53,760 | ) | (59,841 | ) | ||||||||||
Accumulated net realized gain (loss) | 284,025 | 213,867 | (562,541 | ) | (439,369 | ) | ||||||||||
Net unrealized appreciation (depreciation) | 25,279,620 | 23,583,347 | 6,769,066 | 15,990,594 | ||||||||||||
Net assets | $ | 281,010,882 | $ | 229,996,474 | $ | 77,514,140 | $ | 182,239,525 | ||||||||
Authorized shares – per class | 2 billion | 2 billion | 2 billion | 2 billion | ||||||||||||
Par value per share | $ | 0.0001 | $ | 0.0001 | $ | 0.0001 | $ | 0.0001 | ||||||||
| N/A | – Oregon Intermediate does not offer Class C1 Shares. |
See accompanying notes to financial statements.
| 52 | Nuveen Investments |
Statement of Operations (Unaudited)
Six Months Ended November 30, 2012
| Minnesota Intermediate | Minnesota | Nebraska | Oregon Intermediate | |||||||||||||
Investment Income | $ | 5,304,701 | $ | 4,777,545 | $ | 1,500,384 | $ | 3,163,698 | ||||||||
Expenses | ||||||||||||||||
Management fees | 719,581 | 557,289 | 185,974 | 459,003 | ||||||||||||
12b-1 service fees – Class A | 55,537 | 108,182 | 22,076 | 45,870 | ||||||||||||
12b-1 distribution and service fees – Class C | 19,358 | 27,633 | 17,354 | 39,014 | ||||||||||||
12b-1 distribution and service fees – Class C1 | 15,584 | 68,970 | 13,395 | N/A | ||||||||||||
Shareholder servicing agent fees and expenses | 35,875 | 43,113 | 12,384 | 18,509 | ||||||||||||
Custodian’s fees and expenses | 35,921 | 26,038 | 12,407 | 23,308 | ||||||||||||
Directors fees and expenses | 3,655 | 2,817 | 943 | 2,305 | ||||||||||||
Professional fees | 17,228 | 14,329 | 9,082 | 13,142 | ||||||||||||
Shareholder reporting expenses | 14,765 | 27,029 | 9,088 | 11,621 | ||||||||||||
Federal and state registration fees | 9,083 | 8,836 | 9,031 | 4,542 | ||||||||||||
Other expenses | 4,705 | 2,926 | 1,941 | 3,119 | ||||||||||||
Total expenses | 931,292 | 887,162 | 293,675 | 620,433 | ||||||||||||
Net investment income (loss) | 4,373,409 | 3,890,383 | 1,206,709 | 2,543,265 | ||||||||||||
Realized and Unrealized Gain (Loss) | ||||||||||||||||
Net realized gain (loss) from investments | 111,265 | (5,262 | ) | (30,109 | ) | 1,488 | ||||||||||
Change in net unrealized appreciation (depreciation) of investments | 4,051,839 | 6,869,690 | 2,248,314 | 2,586,168 | ||||||||||||
Net realized and unrealized gain (loss) | 4,163,104 | 6,864,428 | 2,218,205 | 2,587,656 | ||||||||||||
Net increase (decrease) in net assets from operations | $ | 8,536,513 | $ | 10,754,811 | $ | 3,424,914 | $ | 5,130,921 | ||||||||
| N/A | – Oregon Intermediate does not offer Class C1 Shares. |
See accompanying notes to financial statements.
| Nuveen Investments | 53 |
Statement of Changes in Net Assets (Unaudited)
| Minnesota Intermediate | Minnesota | |||||||||||||||
| Six Months Ended 11/30/12 | Year Ended 5/31/12 | Six Months Ended 11/30/12 | Year Ended 5/31/12 | |||||||||||||
Operations | ||||||||||||||||
Net investment income (loss) | $ | 4,373,409 | $ | 8,549,147 | $ | 3,890,383 | $ | 6,937,485 | ||||||||
Net realized gain (loss) from investments | 111,265 | 333,701 | (5,262 | ) | 1,170,450 | |||||||||||
Change in net unrealized appreciation (depreciation) of investments | 4,051,839 | 10,866,921 | 6,869,690 | 14,081,248 | ||||||||||||
Net increase (decrease) in net assets from operations | 8,536,513 | 19,749,769 | 10,754,811 | 22,189,183 | ||||||||||||
Distributions to Shareholders | ||||||||||||||||
From net investment income: | ||||||||||||||||
Class A | (904,181 | ) | (1,421,044 | ) | (2,065,147 | ) | (3,570,488 | ) | ||||||||
Class C | (67,909 | ) | (54,947 | ) | (118,749 | ) | (73,284 | ) | ||||||||
Class C1 | (67,625 | ) | (175,525 | ) | (357,019 | ) | (762,021 | ) | ||||||||
Class I | (3,491,818 | ) | (6,770,838 | ) | (1,423,816 | ) | (2,313,144 | ) | ||||||||
From accumulated net realized gains: | ||||||||||||||||
Class A | — | (42,285 | ) | — | — | |||||||||||
Class C | — | (2,118 | ) | — | — | |||||||||||
Class C1 | — | (6,395 | ) | — | — | |||||||||||
Class I | — | (202,389 | ) | — | — | |||||||||||
Decrease in net assets from distributions to shareholders | (4,531,533 | ) | (8,675,541 | ) | (3,964,731 | ) | (6,718,937 | ) | ||||||||
Fund Share Transactions | ||||||||||||||||
Proceeds from sale of shares | 33,315,234 | 52,659,065 | 39,776,044 | 38,182,780 | ||||||||||||
Proceeds from shares issued to shareholders due to reinvestment of distributions | 1,169,591 | 1,743,603 | 2,437,402 | 3,529,303 | ||||||||||||
| 34,484,825 | 54,402,668 | 42,213,446 | 41,712,083 | |||||||||||||
Cost of shares redeemed | (15,301,876 | ) | (43,209,577 | ) | (11,587,681 | ) | (23,708,233 | ) | ||||||||
Net increase (decrease) in net assets from Fund share transactions | 19,182,949 | 11,193,091 | 30,625,765 | 18,003,850 | ||||||||||||
Net increase (decrease) in net assets | 23,187,929 | 22,267,319 | 37,415,845 | 33,474,096 | ||||||||||||
Net assets at the beginning of period | 257,822,953 | 235,555,634 | 192,580,629 | 159,106,533 | ||||||||||||
Net assets at the end of period | $ | 281,010,882 | $ | 257,822,953 | $ | 229,996,474 | $ | 192,580,629 | ||||||||
Undistributed (Over-distribution of) net investment income at the end of period | $ | 219,682 | $ | 377,806 | $ | 728,729 | $ | 803,077 | ||||||||
See accompanying notes to financial statements.
| 54 | Nuveen Investments |
| Nebraska | Oregon Intermediate | |||||||||||||||
| Six Months Ended 11/30/12 | Year Ended 5/31/12 | Six Months Ended 11/30/12 | Year Ended 5/31/12 | |||||||||||||
Operations | ||||||||||||||||
Net investment income (loss) | $ | 1,206,709 | $ | 2,032,055 | $ | 2,543,265 | $ | 5,037,869 | ||||||||
Net realized gain (loss) from investments | (30,109 | ) | 71,303 | 1,488 | (106,713 | ) | ||||||||||
Change in net unrealized appreciation (depreciation) of investments | 2,248,314 | 3,427,173 | 2,586,168 | 6,475,464 | ||||||||||||
Net increase (decrease) in net assets from operations | 3,424,914 | 5,530,531 | 5,130,921 | 11,406,620 | ||||||||||||
Distributions to Shareholders | ||||||||||||||||
From net investment income: | ||||||||||||||||
Class A | (385,708 | ) | (460,396 | ) | (693,201 | ) | (1,157,394 | ) | ||||||||
Class C | (67,395 | ) | (34,015 | ) | (127,736 | ) | (67,271 | ) | ||||||||
Class C1 | (63,017 | ) | (144,342 | ) | N/A | N/A | ||||||||||
Class I | (709,335 | ) | (1,403,358 | ) | (1,817,608 | ) | (3,908,936 | ) | ||||||||
From accumulated net realized gains: | ||||||||||||||||
Class A | — | — | — | (5,511 | ) | |||||||||||
Class C | — | — | — | (287 | ) | |||||||||||
Class C1 | — | — | N/A | N/A | ||||||||||||
Class I | — | — | — | (18,394 | ) | |||||||||||
Decrease in net assets from distributions to shareholders | (1,225,455 | ) | (2,042,111 | ) | (2,638,545 | ) | (5,157,793 | ) | ||||||||
Fund Share Transactions | ||||||||||||||||
Proceeds from sale of shares | 15,756,572 | 18,232,833 | 30,126,026 | 37,599,507 | ||||||||||||
Proceeds from shares issued to shareholders due to reinvestment of distributions | 683,276 | 745,293 | 818,747 | 1,205,284 | ||||||||||||
| 16,439,848 | 18,978,126 | 30,944,773 | 38,804,791 | |||||||||||||
Cost of shares redeemed | (3,482,700 | ) | (3,199,518 | ) | (12,069,643 | ) | (30,039,440 | ) | ||||||||
Net increase (decrease) in net assets from Fund share transactions | 12,957,148 | 15,778,608 | 18,875,130 | 8,765,351 | ||||||||||||
Net increase (decrease) in net assets | 15,156,607 | 19,267,028 | 21,367,506 | 15,014,178 | ||||||||||||
Net assets at the beginning of period | 62,357,533 | 43,090,505 | 160,872,019 | 145,857,841 | ||||||||||||
Net assets at the end of period | $ | 77,514,140 | $ | 62,357,533 | $ | 182,239,525 | $ | 160,872,019 | ||||||||
Undistributed (Over-distribution of) net investment income at the end of period | $ | (53,760 | ) | $ | (35,014 | ) | $ | (59,841 | ) | $ | 35,439 | |||||
| N/A | – Oregon Intermediate does not offer Class C1 Shares. |
See accompanying notes to financial statements.
| Nuveen Investments | 55 |
Financial Highlights (Unaudited)
| Selected data for a share outstanding throughout each period: | ||||||||||||||||||||||||||||||||||||
| Class (Commencement Date) | ||||||||||||||||||||||||||||||||||||
| Investment Operations | Less Distributions | |||||||||||||||||||||||||||||||||||
| MINNESOTA INTERMEDIATE | ||||||||||||||||||||||||||||||||||||
| Beginning Net Asset Value | Net Invest- ment Income (Loss)(a) | Net Realized/ Unrealized Gain (Loss) | Total | Net Invest- ment Income | Capital Gains(b) | Total | Ending Net Asset Value | Total Return(c) | ||||||||||||||||||||||||||||
Class A (2/94) | ||||||||||||||||||||||||||||||||||||
2013(h) | $ | 10.67 | $ | .17 | $ | .17 | $ | .34 | $ | (.18 | ) | $ | — | $ | (.18 | ) | $ | 10.83 | 3.17 | % | ||||||||||||||||
2012 | 10.20 | .36 | .47 | .83 | (.35 | ) | (.01 | ) | (.36 | ) | 10.67 | 8.32 | ||||||||||||||||||||||||
2011(e) | 10.12 | .33 | .07 | .40 | (.32 | ) | — | (.32 | ) | 10.20 | 4.00 | |||||||||||||||||||||||||
Year Ended 6/30 | ||||||||||||||||||||||||||||||||||||
2010 | 9.67 | .36 | .46 | .82 | (.36 | ) | (.01 | ) | (.37 | ) | 10.12 | 8.51 | ||||||||||||||||||||||||
2009 | 9.75 | .38 | (.05 | ) | .33 | (.38 | ) | (.03 | ) | (.41 | ) | 9.67 | 3.53 | |||||||||||||||||||||||
2008 | 9.83 | .39 | (.05 | ) | .34 | (.39 | ) | (.03 | ) | (.42 | ) | 9.75 | 3.53 | |||||||||||||||||||||||
2007 | 9.88 | .39 | (.01 | ) | .38 | (.38 | ) | (.05 | ) | (.43 | ) | 9.83 | 3.87 | |||||||||||||||||||||||
Class C (1/11) | ||||||||||||||||||||||||||||||||||||
2013(h) | 10.62 | .13 | .16 | .29 | (.14 | ) | — | (.14 | ) | 10.77 | 2.77 | |||||||||||||||||||||||||
2012 | 10.14 | .29 | .49 | .78 | (.29 | ) | (.01 | ) | (.30 | ) | 10.62 | 7.79 | ||||||||||||||||||||||||
2011(f) | 9.77 | .11 | .36 | .47 | (.10 | ) | — | (.10 | ) | 10.14 | 4.88 | |||||||||||||||||||||||||
Class C1 (10/09) | ||||||||||||||||||||||||||||||||||||
2013(h) | 10.69 | .14 | .17 | .31 | (.15 | ) | — | (.15 | ) | 10.85 | 2.93 | |||||||||||||||||||||||||
2012 | 10.22 | .31 | .48 | .79 | (.31 | ) | (.01 | ) | (.32 | ) | 10.69 | 7.81 | ||||||||||||||||||||||||
2011(e) | 10.14 | .28 | .07 | .35 | (.27 | ) | — | (.27 | ) | 10.22 | 3.46 | |||||||||||||||||||||||||
Year Ended 6/30 | ||||||||||||||||||||||||||||||||||||
2010(g) | 9.94 | .21 | .20 | .41 | (.20 | ) | (.01 | ) | (.21 | ) | 10.14 | 4.15 | ||||||||||||||||||||||||
Class I (2/94) | ||||||||||||||||||||||||||||||||||||
2013(h) | 10.61 | .18 | .16 | .34 | (.18 | ) | — | (.18 | ) | 10.77 | 3.26 | |||||||||||||||||||||||||
2012 | 10.13 | .37 | .49 | .86 | (.37 | ) | (.01 | ) | (.38 | ) | 10.61 | 8.60 | ||||||||||||||||||||||||
2011(e) | 10.06 | .34 | .06 | .40 | (.33 | ) | — | (.33 | ) | 10.13 | 4.00 | |||||||||||||||||||||||||
Year Ended 6/30 | ||||||||||||||||||||||||||||||||||||
2010 | 9.62 | .36 | .45 | .81 | (.36 | ) | (.01 | ) | (.37 | ) | 10.06 | 8.50 | ||||||||||||||||||||||||
2009 | 9.69 | .39 | (.04 | ) | .35 | (.39 | ) | (.03 | ) | (.42 | ) | 9.62 | 3.71 | |||||||||||||||||||||||
2008 | 9.78 | .39 | (.05 | ) | .34 | (.40 | ) | (.03 | ) | (.43 | ) | 9.69 | 3.51 | |||||||||||||||||||||||
2007 | 9.83 | .40 | — | .40 | (.40 | ) | (.05 | ) | (.45 | ) | 9.78 | 4.05 | ||||||||||||||||||||||||
| 56 | Nuveen Investments |
| Ratios/Supplemental Data | ||||||||||||||||||||||
| Ratios to Average Net Assets Before Reimbursement | Ratios to Average Net Assets After Reimbursement(d) | |||||||||||||||||||||
| Ending Net Assets (000) | Expenses | Net Invest- ment Income (Loss) | Expenses | Net Invest- ment Income (Loss) | Portfolio Turnover Rate | |||||||||||||||||
| $ | 59,120 | .82 | %* | 3.11 | %* | .82 | %* | 3.11 | %* | 3 | % | |||||||||||
| 52,039 | .80 | 3.41 | .76 | 3.44 | 9 | |||||||||||||||||
| 37,175 | .92 | * | 3.40 | * | .74 | * | 3.60 | * | 12 | |||||||||||||
| 34,957 | 1.08 | 3.28 | .75 | 3.61 | 9 | |||||||||||||||||
| 23,019 | 1.07 | 3.68 | .75 | 4.00 | 18 | |||||||||||||||||
| 22,059 | 1.07 | 3.65 | .77 | 3.95 | 15 | |||||||||||||||||
| 21,153 | 1.07 | 3.64 | .85 | 3.86 | 18 | |||||||||||||||||
| | 6,602 | | 1.37 | * | 2.54 | * | 1.37 | * | 2.54 | * | 3 | |||||||||||
| 3,768 | 1.40 | 2.74 | 1.40 | 2.74 | 9 | |||||||||||||||||
| 623 | 1.41 | * | 3.10 | * | 1.37 | * | 3.14 | * | 12 | |||||||||||||
| | 4,327 | | 1.28 | * | 2.69 | * | 1.28 | * | 2.69 | * | 3 | |||||||||||
| 5,448 | 1.29 | 2.94 | 1.29 | 2.94 | 9 | |||||||||||||||||
| 6,242 | 1.37 | * | 2.99 | * | 1.31 | * | 3.05 | * | 12 | |||||||||||||
| 3,965 | 1.48 | * | 2.87 | * | 1.35 | * | 3.00 | * | 9 | |||||||||||||
| | 210,962 | | .63 | * | 3.32 | * | .63 | * | 3.32 | * | 3 | |||||||||||
| 196,568 | .64 | 3.58 | .64 | 3.58 | 9 | |||||||||||||||||
| 191,516 | .72 | * | 3.60 | * | .66 | * | 3.67 | * | 12 | |||||||||||||
| 193,443 | .83 | 3.53 | .70 | 3.66 | 9 | |||||||||||||||||
| 172,440 | .82 | 3.92 | .70 | 4.04 | 18 | |||||||||||||||||
| 175,681 | .82 | 3.90 | .70 | 4.02 | 15 | |||||||||||||||||
| 168,920 | .82 | 3.89 | .70 | 4.01 | 18 | |||||||||||||||||
| (a) | Per share Net Investment Income (Loss) is calculated using the average daily shares method. |
| (b) | Distributions from Capital Gains include short-term capital gains, if any. |
| (c) | Total return is the combination of changes in net asset value without any sales charge, reinvested dividend income at net asset value and reinvested capital gains distributions at net asset value, if any. Total returns are not annualized. |
| (d) | After expense reimbursement from the Adviser, where applicable. |
| (e) | For the eleven months ended May 31, 2011. |
| (f) | For the period January 18, 2011 (commencement of operations) through May 31, 2011. |
| (g) | For the period October 28, 2009 (commencement of operations) through June 30, 2010. |
| (h) | For the six months ended November 30, 2012. |
| * | Annualized. |
See accompanying notes to financial statements.
| Nuveen Investments | 57 |
Financial Highlights (Unaudited) (continued)
| Selected data for a share outstanding throughout each period: | ||||||||||||||||||||||||||||||||||||
| Class (Commencement Date) | ||||||||||||||||||||||||||||||||||||
| Investment Operations | Less Distributions | |||||||||||||||||||||||||||||||||||
| MINNESOTA MUNICIPAL | ||||||||||||||||||||||||||||||||||||
| Beginning Net Asset Value | Net Invest- ment Income (Loss)(a) | Net Realized/ Unrealized Gain (Loss) | Total | Net Invest- ment Income | Capital Gains(b) | Total | Ending Net Asset Value | Total Return(c) | ||||||||||||||||||||||||||||
Class A (7/88) |
| |||||||||||||||||||||||||||||||||||
Year Ended 5/31 | ||||||||||||||||||||||||||||||||||||
2013(g) | $ | 11.87 | $ | .22 | $ | .39 | $ | .61 | $ | (.23 | ) | $ | — | $ | (.23 | ) | $ | 12.25 | 5.19 | % | ||||||||||||||||
2012 | 10.83 | .47 | 1.02 | 1.49 | (.45 | ) | — | (.45 | ) | 11.87 | 14.03 | |||||||||||||||||||||||||
2011(e) | 10.87 | .39 | (.08 | ) | .31 | (.35 | ) | — | (.35 | ) | 10.83 | 2.94 | ||||||||||||||||||||||||
Year Ended 6/30 | ||||||||||||||||||||||||||||||||||||
2010 | 9.98 | .41 | .89 | 1.30 | (.41 | ) | — | (.41 | ) | 10.87 | 13.19 | |||||||||||||||||||||||||
2009 | 10.48 | .43 | (.44 | ) | (.01 | ) | (.43 | ) | (.06 | ) | (.49 | ) | 9.98 | .07 | ||||||||||||||||||||||
2008 | 10.93 | .44 | (.38 | ) | .06 | (.45 | ) | (.06 | ) | (.51 | ) | 10.48 | .54 | |||||||||||||||||||||||
2007 | 10.97 | .46 | (.02 | ) | .44 | (.45 | ) | (.03 | ) | (.48 | ) | 10.93 | 4.05 | |||||||||||||||||||||||
Class C (1/11) |
| |||||||||||||||||||||||||||||||||||
Year Ended 5/31 | ||||||||||||||||||||||||||||||||||||
2013(g) | 11.87 | .19 | .38 | .57 | (.20 | ) | — | (.20 | ) | 12.24 | 4.82 | |||||||||||||||||||||||||
2012 | 10.82 | .39 | 1.05 | 1.44 | (.39 | ) | — | (.39 | ) | 11.87 | 13.48 | |||||||||||||||||||||||||
2011(f) | 10.23 | .15 | .56 | .71 | (.12 | ) | — | (.12 | ) | 10.82 | 6.99 | |||||||||||||||||||||||||
Class C1 (2/99) |
| |||||||||||||||||||||||||||||||||||
Year Ended 5/31 | ||||||||||||||||||||||||||||||||||||
2013(g) | 11.82 | .20 | .38 | .58 | (.20 | ) | — | (.20 | ) | 12.20 | 4.96 | |||||||||||||||||||||||||
2012 | 10.78 | .41 | 1.03 | 1.44 | (.40 | ) | — | (.40 | ) | 11.82 | 13.56 | |||||||||||||||||||||||||
2011(e) | 10.82 | .34 | (.08 | ) | .26 | (.30 | ) | — | (.30 | ) | 10.78 | 2.48 | ||||||||||||||||||||||||
Year Ended 6/30 | ||||||||||||||||||||||||||||||||||||
2010 | 9.94 | .36 | .88 | 1.24 | (.36 | ) | — | (.36 | ) | 10.82 | 12.58 | |||||||||||||||||||||||||
2009 | 10.44 | .38 | (.44 | ) | (.06 | ) | (.38 | ) | (.06 | ) | (.44 | ) | 9.94 | (.42 | ) | |||||||||||||||||||||
2008 | 10.89 | .40 | (.39 | ) | .01 | (.40 | ) | (.06 | ) | (.46 | ) | 10.44 | .06 | |||||||||||||||||||||||
2007 | 10.93 | .42 | (.02 | ) | .40 | (.41 | ) | (.03 | ) | (.44 | ) | 10.89 | 3.65 | |||||||||||||||||||||||
Class I (8/97) |
| |||||||||||||||||||||||||||||||||||
Year Ended 5/31 | ||||||||||||||||||||||||||||||||||||
2013(g) | 11.86 | .24 | .38 | .62 | (.24 | ) | — | (.24 | ) | 12.24 | 5.27 | |||||||||||||||||||||||||
2012 | 10.82 | .49 | 1.02 | 1.51 | (.47 | ) | — | (.47 | ) | 11.86 | 14.23 | |||||||||||||||||||||||||
2011(e) | 10.86 | .41 | (.08 | ) | .33 | (.37 | ) | — | (.37 | ) | 10.82 | 3.09 | ||||||||||||||||||||||||
Year Ended 6/30 | ||||||||||||||||||||||||||||||||||||
2010 | 9.97 | .42 | .90 | 1.32 | (.43 | ) | — | (.43 | ) | 10.86 | 13.37 | |||||||||||||||||||||||||
2009 | 10.47 | .44 | (.44 | ) | — | (.44 | ) | (.06 | ) | (.50 | ) | 9.97 | .23 | |||||||||||||||||||||||
2008 | 10.92 | .46 | (.38 | ) | .08 | (.47 | ) | (.06 | ) | (.53 | ) | 10.47 | .71 | |||||||||||||||||||||||
2007 | 10.96 | .48 | (.01 | ) | .47 | (.48 | ) | (.03 | ) | (.51 | ) | 10.92 | 4.31 | |||||||||||||||||||||||
| 58 | Nuveen Investments |
| Ratios/Supplemental Data | ||||||||||||||||||||||
| Ratios to Average Net Assets Before Reimbursement | Ratios to Average Net Assets After Reimbursement(d) | |||||||||||||||||||||
| Ending Net Assets (000) | Expenses | Net Invest ment Income (Loss) | Expenses | Net Invest ment Income (Loss) | Portfolio Turnover Rate | |||||||||||||||||
| $ | 120,114 | .85 | %* | 3.73 | %* | .85 | %* | 3.73 | %* | 2 | % | |||||||||||
| 100,185 | .90 | 4.06 | .86 | 4.11 | 17 | |||||||||||||||||
| 85,183 | 1.00 | * | 3.77 | * | .85 | * | 3.94 | * | 25 | |||||||||||||
| 91,922 | 1.11 | 3.60 | .85 | 3.86 | 34 | |||||||||||||||||
| 87,218 | 1.11 | 4.06 | .85 | 4.32 | 28 | |||||||||||||||||
| 102,089 | 1.10 | 3.91 | .87 | 4.14 | 37 | |||||||||||||||||
| 106,732 | 1.10 | 3.95 | .95 | 4.10 | 20 | |||||||||||||||||
| 10,852 | 1.40 | * | 3.13 | * | 1.40 | * | 3.13 | * | 2 | |||||||||||||
| 4,927 | 1.47 | 3.37 | 1.45 | 3.39 | 17 | |||||||||||||||||
| 618 | 1.50 | * | 3.91 | * | 1.43 | * | 3.98 | *�� | 25 | |||||||||||||
| 21,004 | 1.31 | * | 3.30 | * | 1.31 | * | 3.30 | * | 2 | |||||||||||||
| 21,453 | 1.35 | 3.63 | 1.35 | 3.64 | 17 | |||||||||||||||||
| 22,190 | 1.43 | * | 3.33 | * | 1.33 | * | 3.43 | * | 25 | |||||||||||||
| 26,772 | 1.51 | 3.19 | 1.35 | 3.35 | 34 | |||||||||||||||||
| 20,489 | 1.51 | 3.66 | 1.35 | 3.82 | 28 | |||||||||||||||||
| 20,061 | 1.50 | 3.48 | 1.35 | 3.63 | 37 | |||||||||||||||||
| 14,221 | 1.58 | 3.46 | 1.35 | 3.69 | 20 | |||||||||||||||||
| 78,026 | .66 | * | 3.94 | * | .66 | * | 3.94 | * | 2 | |||||||||||||
| 66,016 | .71 | 4.26 | .70 | 4.27 | 17 | |||||||||||||||||
| 51,116 | .77 | * | 4.01 | * | .68 | * | 4.11 | * | 25 | |||||||||||||
| 52,639 | .86 | 3.84 | .70 | 4.00 | 34 | |||||||||||||||||
| 42,093 | .86 | 4.31 | .70 | 4.47 | 28 | |||||||||||||||||
| 44,993 | .85 | 4.17 | .70 | 4.32 | 37 | |||||||||||||||||
| 56,181 | .85 | 4.20 | .70 | 4.35 | 20 | |||||||||||||||||
| (a) | Per share Net Investment Income (Loss) is calculated using the average daily shares method. |
| (b) | Distributions from Capital Gains include short-term capital gains, if any. |
| (c) | Total return is the combination of changes in net asset value without any sales charge, reinvested dividend income at net asset value and reinvested capital gains distributions at net asset value, if any. Total returns are not annualized. |
| (d) | After expense reimbursement from the Adviser, where applicable. |
| (e) | For the eleven months ended May 31, 2011. |
| (f) | For the period January 18, 2011 (commencement of operations) through May 31, 2011. |
| (g) | For the six months ended November 30, 2012. |
| * | Annualized. |
See accompanying notes to financial statements.
| Nuveen Investments | 59 |
Financial Highlights (Unaudited) (continued)
| Selected data for a share outstanding throughout each period: | ||||||||||||||||||||||||||||||||||||
| Class (Commencement Date) | ||||||||||||||||||||||||||||||||||||
| Investment Operations | Less Distributions | |||||||||||||||||||||||||||||||||||
| NEBRASKA | ||||||||||||||||||||||||||||||||||||
| Beginning Net Asset Value | Net Invest- ment Income (Loss)(a) | Net Realized/ Unrealized Gain (Loss) | Total | Net Invest- ment Income | Capital Gains(b) | Total | Ending Net Asset Value | Total Return(c) | ||||||||||||||||||||||||||||
CLASS A (2/01) | ||||||||||||||||||||||||||||||||||||
Year Ended 5/31 | ||||||||||||||||||||||||||||||||||||
2013(g) | $ | 11.01 | $ | .19 | $ | .34 | $ | .53 | $ | (.20 | ) | $ | — | $ | (.20 | ) | $ | 11.34 | 4.82 | % | ||||||||||||||||
2012 | 10.28 | .41 | .75 | 1.16 | (.43 | ) | — | (.43 | ) | 11.01 | 11.51 | |||||||||||||||||||||||||
2011(e) | 10.34 | .39 | (.06 | ) | .33 | (.39 | ) | — | (.39 | ) | 10.28 | 3.28 | ||||||||||||||||||||||||
Year Ended 6/30 | ||||||||||||||||||||||||||||||||||||
2010 | 9.84 | .41 | .49 | .90 | (.40 | ) | — | (.40 | ) | 10.34 | 9.26 | |||||||||||||||||||||||||
2009 | 10.06 | .43 | (.21 | ) | .22 | (.44 | ) | — | (.44 | ) | 9.84 | 2.33 | ||||||||||||||||||||||||
2008 | 10.30 | .42 | (.20 | ) | .22 | (.41 | ) | (.05 | ) | (.46 | ) | 10.06 | 2.19 | |||||||||||||||||||||||
2007 | 10.33 | .42 | .02 | .44 | (.42 | ) | (.05 | ) | (.47 | ) | 10.30 | 4.24 | ||||||||||||||||||||||||
CLASS C (1/11) | ||||||||||||||||||||||||||||||||||||
Year Ended 5/31 | ||||||||||||||||||||||||||||||||||||
2013(g) | 11.02 | .16 | .34 | .50 | (.17 | ) | — | (.17 | ) | 11.35 | 4.54 | |||||||||||||||||||||||||
2012 | 10.28 | .34 | .77 | 1.11 | (.37 | ) | — | (.37 | ) | 11.02 | 10.98 | |||||||||||||||||||||||||
2011(f) | 9.86 | .14 | .42 | .56 | (.14 | ) | — | (.14 | ) | 10.28 | 5.70 | |||||||||||||||||||||||||
CLASS C1 (2/01) | ||||||||||||||||||||||||||||||||||||
Year Ended 5/31 | ||||||||||||||||||||||||||||||||||||
2013(g) | 10.92 | .17 | .33 | .50 | (.17 | ) | — | (.17 | ) | 11.25 | 4.61 | |||||||||||||||||||||||||
2012 | 10.19 | .38 | .73 | 1.11 | (.38 | ) | — | (.38 | ) | 10.92 | 11.08 | |||||||||||||||||||||||||
2011(e) | 10.26 | .34 | (.06 | ) | .28 | (.35 | ) | — | (.35 | ) | 10.19 | 2.80 | ||||||||||||||||||||||||
Year Ended 6/30 | ||||||||||||||||||||||||||||||||||||
2010 | 9.76 | .38 | .48 | .86 | (.36 | ) | — | (.36 | ) | 10.26 | 8.91 | |||||||||||||||||||||||||
2009 | 9.99 | .39 | (.22 | ) | .17 | (.40 | ) | — | (.40 | ) | 9.76 | 1.84 | ||||||||||||||||||||||||
2008 | 10.23 | .38 | (.20 | ) | .18 | (.37 | ) | (.05 | ) | (.42 | ) | 9.99 | 1.81 | |||||||||||||||||||||||
2007 | 10.26 | .37 | .02 | .39 | (.37 | ) | (.05 | ) | (.42 | ) | 10.23 | 3.86 | ||||||||||||||||||||||||
CLASS I (2/01) | ||||||||||||||||||||||||||||||||||||
Year Ended 5/31 | ||||||||||||||||||||||||||||||||||||
2013(g) | 11.01 | .20 | .34 | .54 | (.20 | ) | — | (.20 | ) | 11.35 | 5.00 | |||||||||||||||||||||||||
2012 | 10.27 | .45 | .74 | 1.19 | (.45 | ) | — | (.45 | ) | 11.01 | 11.80 | |||||||||||||||||||||||||
2011(e) | 10.34 | .41 | (.07 | ) | .34 | (.41 | ) | — | (.41 | ) | 10.27 | 3.39 | ||||||||||||||||||||||||
Year Ended 6/30 | ||||||||||||||||||||||||||||||||||||
2010 | 9.83 | .44 | .50 | .94 | (.43 | ) | — | (.43 | ) | 10.34 | 9.65 | |||||||||||||||||||||||||
2009 | 10.06 | .45 | (.22 | ) | .23 | (.46 | ) | — | (.46 | ) | 9.83 | 2.48 | ||||||||||||||||||||||||
2008 | 10.30 | .44 | (.19 | ) | .25 | (.44 | ) | (.05 | ) | (.49 | ) | 10.06 | 2.45 | |||||||||||||||||||||||
2007 | 10.33 | .44 | .02 | .46 | (.44 | ) | (.05 | ) | (.49 | ) | 10.30 | 4.51 | ||||||||||||||||||||||||
| 60 | Nuveen Investments |
| Ratios/Supplemental Data | ||||||||||||||||||||||
| Ratios to Average Net Assets Before Reimbursement | Ratios to Average Net Assets After Reimbursement(d) | |||||||||||||||||||||
| Ending Net Assets (000) | Expenses | Net Invest- ment Income (Loss) | Expenses | Net Invest- ment Income (Loss) | Portfolio Turnover Rate | |||||||||||||||||
| $ | 26,334 | .89 | %* | 3.42 | %* | .89 | %* | 3.42 | %* | 7 | % | |||||||||||
| 19,021 | .97 | 3.79 | .88 | 3.88 | 25 | |||||||||||||||||
| 7,099 | 1.21 | * | 3.62 | * | .72 | * | 4.11 | * | 21 | |||||||||||||
| 6,333 | 1.46 | 3.30 | .75 | 4.01 | 18 | |||||||||||||||||
| 5,847 | 1.50 | 3.66 | .75 | 4.41 | 34 | |||||||||||||||||
| 5,689 | 1.47 | 3.34 | .75 | 4.06 | 22 | |||||||||||||||||
| 7,091 | 1.44 | 3.28 | .75 | 3.97 | 39 | |||||||||||||||||
| 6,798 | 1.44 | * | 2.81 | * | 1.44 | * | 2.81 | * | 7 | |||||||||||||
| 2,800 | 1.51 | 3.10 | 1.43 | 3.19 | 25 | |||||||||||||||||
| 321 | 1.60 | * | 3.37 | * | 1.24 | * | 3.73 | * | 21 | |||||||||||||
| 4,166 | 1.34 | * | 3.00 | * | 1.34 | * | 3.00 | * | 7 | |||||||||||||
| 4,132 | 1.43 | 3.49 | 1.33 | 3.59 | 25 | |||||||||||||||||
| 4,201 | 1.64 | * | 3.19 | * | 1.14 | * | 3.69 | * | 21 | |||||||||||||
| 4,181 | 1.86 | 2.91 | 1.15 | 3.62 | 18 | |||||||||||||||||
| 2,585 | 1.90 | 3.27 | 1.15 | 4.02 | 34 | |||||||||||||||||
| 1,798 | 1.87 | 2.93 | 1.15 | 3.65 | 22 | |||||||||||||||||
| 1,559 | 1.92 | 2.79 | 1.15 | 3.56 | 39 | |||||||||||||||||
| 40,215 | .69 | * | 3.64 | * | .69 | * | 3.64 | * | 7 | |||||||||||||
| 36,406 | .78 | 4.13 | .68 | 4.23 | 25 | |||||||||||||||||
| 31,470 | .99 | * | 3.83 | * | .49 | * | 4.34 | * | 21 | |||||||||||||
| 31,757 | 1.21 | 3.55 | .50 | 4.26 | 18 | |||||||||||||||||
| 30,689 | 1.25 | 3.92 | .50 | 4.67 | 34 | |||||||||||||||||
| 29,533 | 1.22 | 3.59 | .50 | 4.31 | 22 | |||||||||||||||||
| 32,502 | 1.19 | 3.53 | .50 | 4.22 | 39 | |||||||||||||||||
| (a) | Per share Net Investment Income (Loss) is calculated using the average daily shares method. |
| (b) | Distributions from Capital Gains include short-term capital gains, if any. |
| (c) | Total return is the combination of changes in net asset value without any sales charge, reinvested dividend income at net asset value and reinvested capital gains distributions at net asset value, if any. Total returns are not annualized. |
| (d) | After expense reimbursement from the Adviser, where applicable. |
| (e) | For the eleven months ended May 31, 2011. |
| (f) | For the period January 18, 2011 (commencement of operations) through May 31, 2011. |
| (g) | For the six months ended November 30, 2012. |
| * | Annualized. |
See accompanying notes to financial statements.
| Nuveen Investments | 61 |
Financial Highlights (Unaudited) (continued)
| Selected data for a share outstanding throughout each period: | ||||||||||||||||||||||||||||||||||||
| Class (Commencement Date) | ||||||||||||||||||||||||||||||||||||
| Investment Operations | Less Distributions | |||||||||||||||||||||||||||||||||||
| OREGON INTERMEDIATE | ||||||||||||||||||||||||||||||||||||
| Beginning Net Asset Value | Net Invest- ment Income (Loss)(a) | Net Realized/ Unrealized Gain (Loss) | Total | Net Invest- ment Income | Capital Gains(b) | Total | Ending Net Asset Value | Total Return(c) | ||||||||||||||||||||||||||||
Class A (2/99) | ||||||||||||||||||||||||||||||||||||
Year Ended 5/31 | ||||||||||||||||||||||||||||||||||||
2013(g) | $ | 10.60 | $ | .15 | $ | .16 | $ | .31 | $ | (.16 | ) | $ | — | $ | (.16 | ) | $ | 10.75 | 2.96 | % | ||||||||||||||||
2012 | 10.17 | .33 | .44 | .77 | (.34 | ) | — | ** | (.34 | ) | 10.60 | 7.71 | ||||||||||||||||||||||||
2011(e) | 10.11 | .29 | .05 | .34 | (.28 | ) | — | (.28 | ) | 10.17 | 3.46 | |||||||||||||||||||||||||
Year Ended 6/30 | ||||||||||||||||||||||||||||||||||||
2010 | 9.77 | .35 | .33 | .68 | (.34 | ) | — | (.34 | ) | 10.11 | 7.05 | |||||||||||||||||||||||||
2009 | 9.68 | .36 | .09 | .45 | (.36 | ) | — | (.36 | ) | 9.77 | 4.77 | |||||||||||||||||||||||||
2008 | 9.72 | .35 | (.02 | ) | .33 | (.36 | ) | (.01 | ) | (.37 | ) | 9.68 | 3.39 | |||||||||||||||||||||||
2007 | 9.78 | .37 | (.02 | ) | .35 | (.37 | ) | (.04 | ) | (.41 | ) | 9.72 | 3.54 | |||||||||||||||||||||||
Class C (1/11) | ||||||||||||||||||||||||||||||||||||
Year Ended 5/31 | ||||||||||||||||||||||||||||||||||||
2013(g) | 10.56 | .12 | .16 | .28 | (.13 | ) | — | (.13 | ) | 10.71 | 2.69 | |||||||||||||||||||||||||
2012 | 10.15 | .27 | .43 | .70 | (.29 | ) | — | ** | (.29 | ) | 10.56 | 6.98 | ||||||||||||||||||||||||
2011(f) | 9.78 | .09 | .40 | .49 | (.12 | ) | — | (.12 | ) | 10.15 | 5.04 | |||||||||||||||||||||||||
Class I (8/97) | ||||||||||||||||||||||||||||||||||||
Year Ended 5/31 | ||||||||||||||||||||||||||||||||||||
2013(g) | 10.60 | .16 | .16 | .32 | (.17 | ) | — | (.17 | ) | 10.75 | 3.05 | |||||||||||||||||||||||||
2012 | 10.17 | .35 | .44 | .79 | (.36 | ) | — | ** | (.36 | ) | 10.60 | 7.90 | ||||||||||||||||||||||||
2011(e) | 10.11 | .31 | .05 | .36 | (.30 | ) | — | (.30 | ) | 10.17 | 3.62 | |||||||||||||||||||||||||
Year Ended 6/30 | ||||||||||||||||||||||||||||||||||||
2010 | 9.77 | .35 | .35 | .70 | (.36 | ) | — | (.36 | ) | 10.11 | 7.21 | |||||||||||||||||||||||||
2009 | 9.68 | .37 | .10 | .47 | (.38 | ) | — | (.38 | ) | 9.77 | 4.92 | |||||||||||||||||||||||||
2008 | 9.72 | .37 | (.03 | ) | .34 | (.37 | ) | (.01 | ) | (.38 | ) | 9.68 | 3.54 | |||||||||||||||||||||||
2007 | 9.78 | .38 | (.02 | ) | .36 | (.38 | ) | (.04 | ) | (.42 | ) | 9.72 | 3.70 | |||||||||||||||||||||||
| 62 | Nuveen Investments |
| Ratios/Supplemental Data | ||||||||||||||||||||||
| Ratios to Average Net Assets Before Reimbursement | Ratios to Average Net Assets After Reimbursement(d) | |||||||||||||||||||||
Ending Net Assets (000) | Expenses | Net Invest- ment Income (Loss) | Expenses | Net Invest- ment Income (Loss) | Portfolio Turnover Rate | |||||||||||||||||
| $ | 51,127 | .83 | %* | 2.89 | %* | .83 | %* | 2.89 | %* | 2 | % | |||||||||||
| 42,819 | .85 | 3.18 | .85 | 3.18 | 9 | |||||||||||||||||
| 31,399 | .97 | * | 3.04 | * | .82 | * | 3.18 | * | 12 | |||||||||||||
| 31,043 | 1.10 | 3.12 | .85 | 3.37 | 19 | |||||||||||||||||
| 10,963 | 1.12 | 3.43 | .85 | 3.70 | 19 | |||||||||||||||||
| 5,967 | 1.12 | 3.37 | .85 | 3.64 | 15 | |||||||||||||||||
| 7,895 | 1.12 | 3.44 | .85 | 3.71 | 43 | |||||||||||||||||
| 12,726 | 1.38 | * | 2.32 | * | 1.38 | * | 2.32 | * | 2 | |||||||||||||
| 7,345 | 1.40 | 2.58 | 1.40 | 2.58 | 9 | |||||||||||||||||
| 632 | 1.40 | * | 2.50 | * | 1.36 | * | 2.53 | * | 12 | |||||||||||||
| 118,387 | .63 | * | 3.10 | * | .63 | * | 3.10 | * | 2 | |||||||||||||
| 110,708 | .65 | 3.40 | .65 | 3.40 | 9 | |||||||||||||||||
| 113,827 | .74 | * | 3.26 | * | .65 | * | 3.35 | * | 12 | |||||||||||||
| 133,816 | .85 | 3.37 | .70 | 3.52 | 19 | |||||||||||||||||
| 119,959 | .87 | 3.67 | .70 | 3.84 | 19 | |||||||||||||||||
| 120,800 | .87 | 3.61 | .70 | 3.78 | 15 | |||||||||||||||||
| 109,357 | .87 | 3.69 | .70 | 3.86 | 43 | |||||||||||||||||
| (a) | Per share Net Investment Income (Loss) is calculated using the average daily shares method. |
| (b) | Distributions from Capital Gains include short-term capital gains, if any. |
| (c) | Total return is the combination of changes in net asset value without any sales charge, reinvested dividend income at net asset value and reinvested capital gains distributions at net asset value, if any. Total returns are not annualized. |
| (d) | After expense reimbursement from the Adviser, where applicable. |
| (e) | For the eleven months ended May 31, 2011. |
| (f) | For the period January 18, 2011 (commencement of operations) through May 31, 2011. |
| (g) | For the six months ended November 30, 2012. |
| * | Annualized. |
| ** | Rounds to less than $.01 per share. |
See accompanying notes to financial statements.
| Nuveen Investments | 63 |
Notes to Financial Statements (Unaudited)
1. General Information and Significant Accounting Policies
General Information
Nuveen Investment Funds, Inc. (the “Trust”), is an open-end investment company registered under the Investment Company Act of 1940, as amended. The Trust is comprised of the Nuveen Minnesota Intermediate Municipal Bond Fund (“Minnesota Intermediate”), Nuveen Minnesota Municipal Bond Fund (“Minnesota”), Nuveen Nebraska Municipal Bond Fund (“Nebraska”) and Nuveen Oregon Intermediate Municipal Bond Fund (“Oregon Intermediate”), (each a “Fund” and collectively, the “Funds”), as non-diversified funds (diversified for Nebraska), among others. The Trust was incorporated in the State of Maryland on August 20, 1987.
On December 31, 2012, the Funds’ investment adviser converted from a Delaware corporation to a Delaware limited liability company. As a result, Nuveen Fund Advisers, Inc., a wholly-owned subsidiary of Nuveen Investments, Inc. (“Nuveen”), changed its name to Nuveen Fund Advisers, LLC (the “Adviser”). There were no changes to the identities or roles of any personnel as a result of the change.
The investment objective of each Fund is to provide maximum current income that is exempt from both federal income tax and its respective state income tax to the extent consistent with prudent investment risk.
Under normal market conditions, as a fundamental policy, each Fund invests at least 80% of its net assets (plus the amount of any borrowings for investment purposes) in municipal securities that pay interest that is exempt from federal and its respective state income tax, including the federal and state alternative minimum tax. Each Fund normally may invest up to 20% of its net assets in taxable obligations, including obligations the interest on which is subject to the federal and state, where applicable, alternative minimum tax. Each Fund invests mainly in securities that, at the time of purchase, are either rated investment grade or are unrated and determined to be of comparable quality by the Funds’ sub-adviser, Nuveen Asset Management, LLC (the “Sub-Adviser”), a wholly-owned subsidiary of the Adviser. However, each Fund may invest up to 20% of its total assets in securities that, at the time of purchase, are rated lower than investment grade or are unrated and of comparable quality (securities commonly referred to as “high yield” securities or “junk bonds”). Each Fund may invest up to 15% of its net assets in municipal securities whose interest payments vary inversely with changes in short-term tax-exempt interest rates (“inverse floaters”).
The Funds’ most recent prospectus provides further descriptions of each Fund’s investment objective, principal investment strategies and principal risks.
Significant Accounting Policies
The following is a summary of significant accounting policies followed by the Funds in the preparation of their financial statements in accordance with U.S. generally accepted accounting principles (“U.S. GAAP”).
Investment Valuation
Prices of municipal bonds are provided by a pricing service approved by the Funds’ Board of Directors. These securities are generally classified as Level 2 for fair measurement purposes. The pricing service establishes a security’s fair value using methods that may include consideration of the following: yields or prices of investments of comparable quality, type of issue, coupon, maturity and rating, market quotes or indications of value from security dealers, evaluations of anticipated cash flows or collateral, general market conditions and other information and analysis, including the obligor’s credit characteristics considered relevant. In pricing certain securities, particularly less liquid and lower quality securities, the pricing service may consider information about a security, its issuer, or market activity provided by the Adviser. These securities are generally classified as Level 2 or Level 3 depending on the priority of the significant inputs.
Investments in open-end funds are valued at their respective net asset values on the valuation date. These investment vehicles are generally classified as Level 1.
Certain securities may not be able to be priced by the pre-established pricing methods as described above. Such securities may be valued by the Funds’ Board of Directors or its designee at fair value. These securities generally include, but are not limited to, restricted securities (securities which may not be publicly sold without registration under the Securities Act of 1933, as amended) for which a pricing service is unable to provide a market price; securities whose trading has been formally suspended; debt securities that have gone into default and for which there is no current market quotation; a security whose market price is not available from a pre-established pricing source; a security with respect to which an event has occurred that is likely to materially affect the value of the security after the market has closed but before the calculation of a Fund’s net asset value (as may be the case in non-U.S. markets on which the security is primarily traded) or make it difficult or impossible to obtain a reliable market quotation; and a security whose price, as provided by the pricing service, is not deemed to reflect the security’s fair value. As a general principle, the fair value of a security would appear to be the amount that the owner might reasonably expect to receive for it in a current sale. A variety of factors may be considered in determining the fair value of such securities, which may include consideration of the following: yields or prices of investments of comparable quality, type of issue, coupon, maturity and rating, market quotes or indications of value from security dealers, evaluations of anticipated cash flows or collateral, general market conditions and other information and analysis, including the obligor’s credit characteristics considered relevant. These securities are generally classified as Level 2 or Level 3 depending on the priority of the significant inputs. Regardless of the method employed to value a particular security, all valuations are subject to review by the Funds’ Board of Directors or its designee.
Refer to Footnote 2 – Fair Value Measurements for further details on the leveling of securities held by the Funds as of the end of the reporting period.
| 64 | Nuveen Investments |
Investment Transactions
Investment transactions are recorded on a trade date basis. Realized gains and losses from transactions are determined on the specific identification method, which is the same basis used for federal income tax purposes. Investments purchased on a when-issued/delayed delivery basis may have extended settlement periods. Any investments so purchased are subject to market fluctuation during this period. The Funds have instructed the custodian to earmark securities in the Funds’ portfolios with a current value at least equal to the amount of the when-issued/delayed delivery purchase commitments. At November 30, 2012, Minnesota Intermediate, Minnesota and Oregon Intermediate had outstanding when-issued/delayed delivery purchase commitments of $2,303,278, $2,938,691 and $3,281,889, respectively. Nebraska had no such outstanding purchase commitments.
Investment Income
Dividend income is recorded on the ex-dividend date. Interest income, which reflects the amortization of premiums and includes accretion of discounts for financial reporting purposes, is recorded on an accrual basis. Interest income also reflects paydowns gains and losses, if any.
Professional Fees
Professional fees presented on the Statement of Operations consist of legal fees incurred in the normal course of operations, audit fees, tax consulting fees and, in some cases, workout expenditures. Workout expenditures are incurred in an attempt to protect or enhance an investment, or to pursue other claims or legal actions on behalf of Fund shareholders. Legal fee refund presented on the Statement of Operations reflects a refund of workout expenditures paid in a prior reporting period, when applicable.
Income Taxes
Each Fund is a separate taxpayer for federal income tax purposes. Each Fund intends to distribute substantially all of its net investment income and net capital gains to shareholders and to otherwise comply with the requirements of Subchapter M of the Internal Revenue Code applicable to regulated investment companies. Therefore, no federal income tax provision is required. Furthermore, each Fund intends to satisfy conditions that will enable interest from municipal securities, which is exempt from regular federal and designated state income taxes, to retain such tax-exempt status when distributed to shareholders of the Funds. Net realized capital gains and ordinary income distributions paid by the Funds are subject to federal taxation.
For all open tax years and all major taxing jurisdictions, management of the Funds has concluded that there are no significant uncertain tax positions that would require recognition in the financial statements. Open tax years are those that are open for examination by taxing authorities (i.e., generally the last four tax year ends and the interim tax period since then). Furthermore, management of the Funds is also not aware of any tax positions for which it is reasonably possible that the total amounts of unrecognized tax benefits will significantly change in the next twelve months.
Dividends and Distributions to Shareholders
The Funds declare dividends from their net investment income daily and pay shareholders monthly. Fund shares begin to accrue dividends on the business day after the day when the monies used to purchase Fund shares are collected by the Funds’ transfer agent.
Net realized capital gains and/or market discount from investment transactions, if any, are declared and distributed to shareholders at least annually. Furthermore, capital gains are distributed only to the extent they exceed available capital loss carryforwards.
Distributions to shareholders of net investment income, net realized capital gains and/or market discount, if any, are recorded on the ex-dividend date. The amount and timing of distributions are determined in accordance with federal income tax regulations, which may differ from U.S. GAAP.
Flexible Sales Charge Program
Class A Shares are generally sold with an up-front sales charge and incur a .20% annual 12b-1 service fee. Class A Share purchases of $1 million or more are sold at net asset value without an up-front sales charge but may be subject to a contingent deferred sales charge (“CDSC”) if redeemed within eighteen months of purchase. Class C Shares are sold without an up-front sales charge but incur a .55% annual 12b-1 distribution fee and a .20% annual 12b-1 service fee. Class C1 Shares of the Funds (except for Oregon Intermediate, which does not offer Class C1 Shares) are not available for new accounts or for additional investment into existing accounts, but Class C1 Shares can be issued for purposes of dividend reinvestment. Class C1 Shares were sold without an up-front sales charge but incur a .40% annual 12b-1 distribution fee and a .25% annual 12b-1 service fee. Class C Shares and Class C1 Shares are subject to a CDSC of 1% if redeemed within twelve months of purchase. Class I Shares are not subject to any sales charge or 12b-1 distribution or service fees.
Inverse Floating Rate Securities
Each Fund is authorized to invest in inverse floating rate securities. An inverse floating rate security is created by depositing a municipal bond, typically with a fixed interest rate, into a special purpose trust created by a broker-dealer. In turn, this trust (a) issues floating rate certificates, in face amounts equal to some fraction of the deposited bond’s par amount or market value, that typically pay short-term tax-exempt interest rates to third parties, and (b) issues to a long-term investor (such as one of the Funds) an inverse floating rate certificate (sometimes referred to as an “inverse floater”) that represents all remaining or residual interest in the trust. The income received by the inverse floater holder varies inversely with the short-term rate paid to the floating rate certificates’ holders, and in most circumstances the inverse floater holder bears substantially all of the underlying bond’s downside investment risk and also benefits disproportionately from any potential appreciation of the underlying bond’s value. The price of an inverse floating rate
| Nuveen Investments | 65 |
Notes to Financial Statements (Unaudited) (continued)
security will be more volatile than that of the underlying bond because the interest rate is dependent on not only the fixed coupon rate of the underlying bond but also on the short-term interest paid on the floating rate certificates, and because the inverse floating rate security essentially bears the risk of loss of the greater face value of the underlying bond.
A Fund may purchase an inverse floating rate security in a secondary market transaction without first owning the underlying bond (referred to as an “externally-deposited inverse floater”), or instead by first selling a fixed-rate bond to a broker-dealer for deposit into the special purpose trust and receiving in turn the residual interest in the trust (referred to as a “self-deposited inverse floater”). The inverse floater held by a Fund gives the Fund the right (a) to cause the holders of the floating rate certificates to tender their notes at par, and (b) to have the broker transfer the fixed-rate bond held by the trust to the Fund, thereby collapsing the trust. An investment in an externally-deposited inverse floater is identified in the Portfolio of Investments as “(IF) – Inverse floating rate investment.” An investment in a self-deposited inverse floater is accounted for as a financing transaction. In such instances, a fixed-rate bond deposited into a special purpose trust is identified in the Portfolio of Investments as “(UB) – Underlying bond of an inverse floating rate trust reflected as a financing transaction,” with the Fund accounting for the short-term floating rate certificates issued by the trust as “Floating rate obligations” on the Statement of Assets and Liabilities. In addition, the Fund reflects in “Investment Income” the entire earnings of the underlying bond and recognizes the related interest paid to the holders of the short-term floating rate certificates as “Interest expense” on the Statement of Operations.
During the six months ended November 30, 2012, the Funds did not invest in externally-deposited inverse floaters or self-deposited inverse floaters.
Derivative Financial Instruments
Each Fund is authorized to invest in certain derivative instruments, including foreign currency exchange contracts, futures, options and swap contracts. Although the Funds are authorized to invest in such derivative instruments, and may do so in the future, they did not make any such investments during the six months ended November 30, 2012.
Market and Counterparty Credit Risk
In the normal course of business each Fund may invest in financial instruments and enter into financial transactions where risk of potential loss exists due to changes in the market (market risk) or failure of the other party to the transaction to perform (counterparty credit risk). The potential loss could exceed the value of the financial assets recorded on the financial statements. Financial assets, which potentially expose each Fund to counterparty credit risk, consist principally of cash due from counterparties on forward, option and swap transactions, when applicable. The extent of each Fund’s exposure to counterparty credit risk in respect to these financial assets approximates their carrying value as recorded on the Statement of Assets and Liabilities. Futures contracts, when applicable, expose a Fund to minimal counterparty credit risk as they are exchange traded and the exchange’s clearinghouse, which is counterparty to all exchange traded futures, guarantees the futures contracts against default.
Each Fund helps manage counterparty credit risk by entering into agreements only with counterparties the Adviser believes have the financial resources to honor their obligations and by having the Adviser monitor the financial stability of the counterparties. Additionally, counterparties may be required to pledge collateral daily (based on the daily valuation of the financial asset) on behalf of each Fund with a value approximately equal to the amount of any unrealized gain above a pre-determined threshold. Reciprocally, when each Fund has an unrealized loss, the Funds have instructed the custodian to pledge assets of the Funds as collateral with a value approximately equal to the amount of the unrealized loss above a pre-determined threshold. Collateral pledges are monitored and subsequently adjusted if and when the valuations fluctuate, either up or down, by at least the pre-determined threshold amount.
Zero Coupon Securities
Each Fund is authorized to invest in zero coupon securities. A zero coupon security does not pay a regular interest coupon to its holders during the life of the security. Income to the holder of the security comes from accretion of the difference between the original purchase price of the security at issuance and the par value of the security at maturity and is effectively paid at maturity. The market prices of zero coupon securities generally are more volatile than the market prices of securities that pay interest periodically.
Multiclass Operations and Allocations
Income and expenses of the Funds that are not directly attributable to a specific class of shares are prorated among the classes based on the relative settled shares of each class. Expenses directly attributable to a class of shares, which presently only include 12b-1 distribution fees and service fees, are recorded to the specific class.
Realized and unrealized capital gains and losses of the Funds are prorated among the classes based on the relative net assets of each class.
Indemnifications
Under the Trust’s organizational documents, its officers and directors are indemnified against certain liabilities arising out of the performance of their duties to the Trust. In addition, in the normal course of business, the Trust enters into contracts that provide general indemnifications to other parties. The Trust’s maximum exposure under these arrangements is unknown as this would involve future claims that may be made against the Trust that have not yet occurred. However, the Trust has not had prior claims or losses pursuant to these contracts and expects the risk of loss to be remote.
| 66 | Nuveen Investments |
Use of Estimates
The preparation of financial statements in conformity with U.S. GAAP requires management to make estimates and assumptions that affect the reported amounts of assets and liabilities at the date of the financial statements and the reported amounts of increases and decreases in net assets from operations during the reporting period. Actual results may differ from those estimates.
2. Fair Value Measurements
Fair value is defined as the price that the Funds would receive upon selling an investment or transferring a liability in an orderly transaction to an independent buyer in the principal or most advantageous market for the investment. A three-tier hierarchy is used to maximize the use of observable market data and minimize the use of unobservable inputs and to establish classification of fair value measurements for disclosure purposes. Observable inputs reflect the assumptions market participants would use in pricing the asset or liability. Observable inputs are based on market data obtained from sources independent of the reporting entity. Unobservable inputs reflect the reporting entity’s own assumptions about the assumptions market participants would use in pricing the asset or liability. Unobservable inputs are based on the best information available in the circumstances. The following is a summary of the three-tiered hierarchy of valuation input levels.
| Level 1 – | Inputs are unadjusted and prices are determined using quoted prices in active markets for identical securities. | |
| Level 2 – | Prices are determined using other significant observable inputs (including quoted prices for similar securities, interest rates, prepayment speeds, credit risk, etc.). | |
| Level 3 – | Prices are determined using significant unobservable inputs (including management’s assumptions in determining the fair value of investments). |
The inputs or methodologies used for valuing securities are not an indication of the risks associated with investing in those securities. The following is a summary of each Fund’s fair value measurements as of the end of the reporting period:
| Minnesota Intermediate | Level 1 | Level 2 | Level 3 | Total | ||||||||||||
Long-Term Investments*: | ||||||||||||||||
Municipal Bonds | $ | — | $ | 281,325,538 | $ | — | $ | 281,325,538 | ||||||||
Short-Term Investments: | ||||||||||||||||
Money Market Funds | 66,864 | — | — | 66,864 | ||||||||||||
Total | $ | 66,864 | $ | 281,325,538 | $ | — | $ | 281,392,402 | ||||||||
| Minnesota | Level 1 | Level 2 | Level 3 | Total | ||||||||||||
Long-Term Investments*: | ||||||||||||||||
Municipal Bonds | $ | — | $ | 232,172,735 | $ | — | $ | 232,172,735 | ||||||||
| Nebraska | Level 1 | Level 2 | Level 3 | Total | ||||||||||||
Long-Term Investments*: | ||||||||||||||||
Municipal Bonds | $ | — | $ | 75,882,619 | $ | — | $ | 75,882,619 | ||||||||
Short-Term Investments: | ||||||||||||||||
Money Market Funds | 588,895 | — | — | 588,895 | ||||||||||||
Total | $ | 588,895 | $ | 75,882,619 | $ | — | $ | 76,471,514 | ||||||||
| Oregon Intermediate | Level 1 | Level 2 | Level 3 | Total | ||||||||||||
Long-Term Investments*: | ||||||||||||||||
Municipal Bonds | $ | — | $ | 178,376,938 | $ | — | $ | 178,376,938 | ||||||||
Short-Term Investments: | ||||||||||||||||
Money Market Funds | 4,676,914 | — | — | 4,676,914 | ||||||||||||
Total | $ | 4,676,914 | $ | 178,376,938 | $ | — | $ | 183,053,852 | ||||||||
| * | Refer to the Fund’s Portfolio of Investments for industry classifications. |
The Nuveen funds’ Board of Directors/Trustees is responsible for the valuation process and has delegated the oversight of the daily valuation process to the Adviser’s Valuation Committee. The Valuation Committee, pursuant to the valuation policies and procedures adopted by the Board of Directors/Trustees, is responsible for making fair value determinations, evaluating the effectiveness of the funds’ pricing policies, and reporting to the Board of Directors/Trustees. The Valuation Committee is aided in its efforts by the Adviser’s dedicated Securities Valuation Team, which is responsible for administering the daily valuation process and applying fair value methodologies as approved by the Valuation Committee. When determining the reliability of independent pricing services for investments owned by the funds, the Valuation Committee, among other things, conducts due diligence reviews of the pricing services and monitors the quality of security prices received through various testing reports conducted by the Securities Valuation Team.
The Valuation Committee will consider pricing methodologies it deems relevant and appropriate when making fair value determinations. Examples of possible methodologies include, but are not limited to, multiple of earnings; discount from market of a
| Nuveen Investments | 67 |
Notes to Financial Statements (Unaudited) (continued)
similar freely traded security; discounted cash-flow analysis; book value or a multiple thereof; risk premium/yield analysis; yield to maturity; and/or fundamental investment analysis. The Valuation Committee will also consider factors it deems relevant and appropriate in light of the facts and circumstances. Examples of possible factors include, but are not limited to, the type of security; the issuer’s financial statements; the purchase price of the security; the discount from market value of unrestricted securities of the same class at the time of purchase; analysts’ research and observations from financial institutions; information regarding any transactions or offers with respect to the security; the existence of merger proposals or tender offers affecting the security; the price and extent of public trading in similar securities of the issuer or comparable companies; and the existence of a shelf registration for restricted securities.
For each portfolio security that has been fair valued pursuant to the policies adopted by the Board of Directors/Trustees, the fair value price is compared against the last available and next available market quotations. The Valuation Committee reviews the results of such testing and fair valuation occurrences are reported to the Board of Directors/Trustees.
3. Derivative Instruments and Hedging Activities
The Funds record derivative instruments at fair value, with changes in fair value recognized on the Statement of Operations, when applicable. Even though the Funds’ investments in derivatives may represent economic hedges, they are not considered to be hedge transactions for financial reporting purposes. The Funds did not invest in derivative instruments during the six months ended November 30, 2012.
4. Fund Shares
Transactions in Fund shares were as follows:
| Minnesota Intermediate | ||||||||||||||||
| Six Months Ended 11/30/12 | Year Ended 5/31/12 | |||||||||||||||
| Shares | Amount | Shares | Amount | |||||||||||||
Shares sold: | ||||||||||||||||
Class A | 786,046 | $ | 8,400,164 | 1,762,984 | $ | 18,520,988 | ||||||||||
Class C | 289,660 | 3,082,820 | 320,741 | 3,341,075 | ||||||||||||
Class C1 | — | — | 481 | 5,036 | ||||||||||||
Class I | 2,051,087 | 21,832,250 | 2,951,840 | 30,791,966 | ||||||||||||
Shares issued to shareholders due to reinvestment of distributions: | ||||||||||||||||
Class A | 73,993 | 793,019 | 115,025 | 1,204,654 | ||||||||||||
Class C | 5,745 | 61,295 | 4,910 | 51,413 | ||||||||||||
Class C1 | 5,174 | 55,557 | 13,217 | 138,387 | ||||||||||||
Class I | 24,369 | 259,720 | 33,512 | 349,149 | ||||||||||||
| 3,236,074 | 34,484,825 | 5,202,710 | 54,402,668 | |||||||||||||
Shares redeemed: | ||||||||||||||||
Class A | (275,353 | ) | (2,947,845 | ) | (648,644 | ) | (6,789,668 | ) | ||||||||
Class C | (37,571 | ) | (399,311 | ) | (32,148 | ) | (337,359 | ) | ||||||||
Class C1 | (115,880 | ) | (1,242,499 | ) | (115,360 | ) | (1,213,113 | ) | ||||||||
Class I | (1,006,256 | ) | (10,712,221 | ) | (3,362,625 | ) | (34,869,437 | ) | ||||||||
| (1,435,060 | ) | (15,301,876 | ) | (4,158,777 | ) | (43,209,577 | ) | |||||||||
Net increase (decrease) | 1,801,014 | $ | 19,182,949 | 1,043,933 | $ | 11,193,091 | ||||||||||
| 68 | Nuveen Investments |
| Minnesota | ||||||||||||||||
| Six Months Ended 11/30/12 | Year Ended 5/31/12 | |||||||||||||||
| Shares | Amount | Shares | Amount | |||||||||||||
Shares sold: | ||||||||||||||||
Class A | 1,570,498 | $ | 18,846,508 | 1,290,772 | $ | 14,873,424 | ||||||||||
Class C | 492,674 | 5,914,626 | 379,744 | 4,380,042 | ||||||||||||
Class C1 | — | — | 4,691 | 53,117 | ||||||||||||
Class I | 1,252,618 | 15,014,910 | 1,641,557 | 18,876,197 | ||||||||||||
Shares issued to shareholders due to reinvestment of distributions: | ||||||||||||||||
Class A | 153,520 | 1,846,964 | 238,211 | 2,726,168 | ||||||||||||
Class C | 8,644 | 104,046 | 4,914 | 56,828 | ||||||||||||
Class C1 | 28,275 | 338,388 | 54,910 | 623,840 | ||||||||||||
Class I | 12,305 | 148,004 | 10,682 | 122,467 | ||||||||||||
| 3,518,534 | 42,213,446 | 3,625,481 | 41,712,083 | |||||||||||||
Shares redeemed: | ||||||||||||||||
Class A | (358,007 | ) | (4,307,052 | ) | (955,770 | ) | (10,817,559 | ) | ||||||||
Class C | (29,716 | ) | (357,582 | ) | (26,575 | ) | (310,556 | ) | ||||||||
Class C1 | (121,541 | ) | (1,450,709 | ) | (302,359 | ) | (3,401,378 | ) | ||||||||
Class I | (456,877 | ) | (5,472,338 | ) | (810,815 | ) | (9,178,740 | ) | ||||||||
| (966,141 | ) | (11,587,681 | ) | (2,095,519 | ) | (23,708,233 | ) | |||||||||
Net increase (decrease) | 2,552,393 | $ | 30,625,765 | 1,529,962 | $ | 18,003,850 | ||||||||||
| Nebraska | ||||||||||||||||
| Six Months Ended 11/30/12 | Year Ended 5/31/12 | |||||||||||||||
| Shares | Amount | Shares | Amount | |||||||||||||
Shares sold: | ||||||||||||||||
Class A | 633,643 | $ | 7,033,813 | 1,052,841 | $ | 11,246,926 | ||||||||||
Class C | 362,005 | 4,023,976 | 228,712 | 2,465,910 | ||||||||||||
Class C1 | — | — | 1,672 | 17,925 | ||||||||||||
Class I | 422,857 | 4,698,783 | 420,217 | 4,502,072 | ||||||||||||
Shares issued to shareholders due to reinvestment of distributions: | ||||||||||||||||
Class A | 32,617 | 363,123 | 29,951 | 322,453 | ||||||||||||
Class C | 5,715 | 63,780 | 2,057 | 22,187 | ||||||||||||
Class C1 | 5,196 | 57,329 | 11,568 | 122,256 | ||||||||||||
Class I | 17,871 | 199,044 | 26,107 | 278,397 | ||||||||||||
| 1,479,904 | 16,439,848 | 1,773,125 | 18,978,126 | |||||||||||||
Shares redeemed: | ||||||||||||||||
Class A | (72,365 | ) | (805,679 | ) | (45,380 | ) | (481,975 | ) | ||||||||
Class C | (22,918 | ) | (256,847 | ) | (7,879 | ) | (84,950 | ) | ||||||||
Class C1 | (13,390 | ) | (146,584 | ) | (46,994 | ) | (485,064 | ) | ||||||||
Class I | (204,211 | ) | (2,273,590 | ) | (202,940 | ) | (2,147,529 | ) | ||||||||
| (312,884 | ) | (3,482,700 | ) | (303,193 | ) | (3,199,518 | ) | |||||||||
Net increase (decrease) | 1,167,020 | $ | 12,957,148 | 1,469,932 | $ | 15,778,608 | ||||||||||
| Nuveen Investments | 69 |
Notes to Financial Statements (Unaudited) (continued)
| Oregon Intermediate | ||||||||||||||||
| Six Months Ended 11/30/12 | Year Ended 5/31/12 | |||||||||||||||
| Shares | Amount | Shares | Amount | |||||||||||||
Shares sold: | ||||||||||||||||
Class A | 875,815 | $ | 9,320,057 | 1,247,098 | $ | 13,048,451 | ||||||||||
Class C | 533,838 | 5,642,218 | 653,076 | 6,838,752 | ||||||||||||
Class I | 1,427,507 | 15,163,751 | 1,704,340 | 17,712,304 | ||||||||||||
Shares issued to shareholders due to reinvestment of distributions: | ||||||||||||||||
Class A | 53,200 | 566,141 | 85,272 | 889,463 | ||||||||||||
Class C | 10,735 | 113,860 | 5,512 | 57,649 | ||||||||||||
Class I | 13,033 | 138,746 | 24,797 | 258,172 | ||||||||||||
| 2,914,128 | 30,944,773 | 3,720,095 | 38,804,791 | |||||||||||||
Shares redeemed: | ||||||||||||||||
Class A | (211,906 | ) | (2,253,917 | ) | (379,765 | ) | (3,928,739 | ) | ||||||||
Class C | (51,712 | ) | (547,005 | ) | (25,478 | ) | (265,350 | ) | ||||||||
Class I | (872,250 | ) | (9,268,721 | ) | (2,480,921 | ) | (25,845,351 | ) | ||||||||
| (1,135,868 | ) | (12,069,643 | ) | (2,886,164 | ) | (30,039,440 | ) | |||||||||
Net increase (decrease) | 1,778,260 | $ | 18,875,130 | 833,931 | $ | 8,765,351 | ||||||||||
5. Investment Transactions
Purchases and sales (including maturities but excluding short-term investments, where applicable) during the six months ended November 30, 2012, were as follows:
| Minnesota Intermediate | Minnesota | Nebraska | Oregon Intermediate | |||||||||||||
Purchases | $ | 33,656,802 | $ | 44,003,950 | $ | 15,847,845 | $ | 23,830,158 | ||||||||
Sales and maturities | 8,613,702 | 3,796,401 | 4,760,450 | 4,085,000 | ||||||||||||
6. Income Tax Information
The following information is presented on an income tax basis. Differences between amounts for financial statement and federal income tax purposes are primarily due to timing differences in recognizing certain gains and losses on investment transactions. To the extent that differences arise that are permanent in nature, such amounts are reclassified within the capital accounts as detailed below. Temporary differences do not require reclassification. Temporary and permanent differences do not impact the net asset values of the Funds.
At November 30, 2012, the cost and unrealized appreciation (depreciation) of investments, as determined on a federal income tax basis, were as follows:
| Minnesota Intermediate | Minnesota | Nebraska | Oregon Intermediate | |||||||||||||
Cost of investments | $ | 256,112,782 | $ | 208,589,388 | $ | 69,702,448 | $ | 167,063,258 | ||||||||
Gross unrealized: | ||||||||||||||||
Appreciation | $ | 25,294,150 | $ | 23,599,901 | $ | 6,769,066 | $ | 15,990,594 | ||||||||
Depreciation | (14,530 | ) | (16,554 | ) | — | — | ||||||||||
Net unrealized appreciation (depreciation) of investments | $ | 25,279,620 | $ | 23,583,347 | $ | 6,769,066 | $ | 15,990,594 | ||||||||
Permanent differences, primarily due to federal taxes paid and distribution character reclassifications, resulted in reclassifications among the Funds’ components of net assets at May 31, 2012, the Funds’ last tax year end, as follows:
| Minnesota Intermediate | Minnesota | Nebraska | Oregon Intermediate | |||||||||||||
Capital paid-in | $ | (76 | ) | $ | — | $ | 24,349 | $ | — | |||||||
Undistributed (Over-distribution of) net investment income | 698 | — | (24,349 | ) | — | |||||||||||
Accumulated net realized gain (loss) | (622 | ) | — | — | — | |||||||||||
| 70 | Nuveen Investments |
The tax components of undistributed net tax-exempt income, net ordinary income and net long-term capital gains at May 31, 2012, the Funds’ last tax year end, were as follows:
| Minnesota Intermediate | Minnesota | Nebraska | Oregon Intermediate | |||||||||||||
Undistributed net tax-exempt income* | $ | 1,065,705 | $ | 1,197,045 | $ | 49,763 | $ | 361,772 | ||||||||
Undistributed net ordinary income** | 9,197 | — | — | 13,617 | ||||||||||||
Undistributed net long-term capital gains | 162,183 | 384,230 | — | 648 | ||||||||||||
| * | Undistributed net tax exempt income (on a tax basis) has not been reduced for the dividends declared during the period May 1, 2012 through May 31, 2012 and paid on June 1, 2012. |
| ** | Net ordinary income consists of net taxable income derived from dividends, interest and net short-term capital gains, if any. |
The tax character of distributions paid during the Funds’ last tax year ended May 31, 2012, was designated for purposes of the dividends paid deduction as follows:
| Minnesota Intermediate | Minnesota | Nebraska | Oregon Intermediate | |||||||||||||
Distributions from net tax-exempt income | $ | 8,364,048 | $ | 6,539,683 | $ | 2,002,803 | $ | 5,002,123 | ||||||||
Distributions from net ordinary income** | 29,652 | 71,205 | — | 97,463 | ||||||||||||
Distributions from net long-term capital gains | 253,187 | — | — | 24,192 | ||||||||||||
| ** | Net ordinary income consists of net taxable income derived from dividends, interest and net short-term capital gains, if any. |
At May 31, 2012, the Funds’ last tax year end, the following Fund had unused capital loss carryforwards available for federal income tax purposes to be applied against future capital gains, if any. If not applied, the carryforwards will expire as follows:
| Nebraska | ||||
Expiration: | ||||
May 31, 2017 | $ | 199,025 | ||
May 31, 2018 | 36,230 | |||
Total | $ | 235,255 | ||
During the Funds’ last tax year ended May 31, 2012, the following Funds utilized their capital loss carryforwards as follows:
| Minnesota | Nebraska | |||||||
Utilized capital loss carryforwards | $ | 123,599 | $ | 128,711 | ||||
Under the Regulated Investment Company Modernization Act of 2010, capital losses incurred by the Funds after December 31, 2010, will not be subject to expiration. During the Funds’ last tax year ended May 31, 2012, there were no post-enactment capital losses generated.
The Funds have elected to defer losses incurred from November 1, 2011 through May 31, 2012, the Funds’ last tax year end, in accordance with federal income tax rules. These losses are treated as having arisen on the first day of the current fiscal year. The following Funds have elected to defer losses as follows:
| Nebraska | Oregon Intermediate | |||||||
Post-October capital losses | $ | 60,100 | $ | 129,536 | ||||
Late-year ordinary losses | — | — | ||||||
7. Management Fees and Other Transactions with Affiliates
Each Fund’s management fee consists of two components – a fund-level fee, based only on the amount of assets within each individual Fund, and a complex-level fee, based on the aggregate amount of all eligible fund assets managed by the Adviser. This pricing structure enables each Fund’s shareholders to benefit from growth in the assets within their respective Fund as well as from growth in the amount of complex-wide assets managed by the Adviser.
The annual fund-level fee for each Fund, payable monthly, is calculated according to the following schedule:
| Average Daily Net Assets | Fund-Level Fee Rate | |||
For the first $125 million | .3500 | % | ||
For the next $125 million | .3375 | |||
For the next $250 million | .3250 | |||
For the next $500 million | .3125 | |||
For the next $1 billion | .3000 | |||
For net assets over $2 billion | .2750 | |||
| Nuveen Investments | 71 |
Notes to Financial Statements (Unaudited) (continued)
The annual complex-level fee for each Fund, payable monthly, is calculated according to the following schedule:
| Complex-Level Asset Breakpoint Level* | Effective Rate at Breakpoint Level | |||
$55 billion | .2000 | % | ||
$56 billion | .1996 | |||
$57 billion | .1989 | |||
$60 billion | .1961 | |||
$63 billion | .1931 | |||
$66 billion | .1900 | |||
$71 billion | .1851 | |||
$76 billion | .1806 | |||
$80 billion | .1773 | |||
$91 billion | .1691 | |||
$125 billion | .1599 | |||
$200 billion | .1505 | |||
$250 billion | .1469 | |||
$300 billion | .1445 | |||
| * | The complex-level fee is calculated based upon the aggregate daily “eligible assets” of all Nuveen Funds. Eligible assets do not include assets attributable to investments in other Nuveen Funds or assets in excess of $2 billion added to the Nuveen Fund complex in connection with the Adviser’s assumption of the management of the former First American Funds effective January 1, 2011. Eligible assets include closed-end fund assets managed by the Adviser that are attributable to financial leverage. For these purposes, financial leverage includes the closed-end funds’ use of preferred stock and borrowings and certain investments in the residual interest certificates (also called inverse floating rate securities) in tender option bond (TOB) trusts, including the portion of assets held by the TOB trust that has been effectively financed by the trust’s issuance of floating rate securities, subject to an agreement by the Adviser as to certain funds to limit the amount of such assets for determining eligible assets in certain circumstances. As of November 30, 2012, the complex-level fee rate for each Fund was as follows: |
| Fund | Complex-Level Fee Rate | |||
Minnesota Intermediate | .1918 | % | ||
Minnesota | .1878 | |||
Nebraska | .1834 | |||
Oregon Intermediate | .1922 | |||
The management fee compensates the Adviser for overall investment advisory and administrative services and general office facilities. The Adviser is responsible for each Fund’s overall investment strategy and asset allocation decisions. The Adviser has entered into sub-advisory agreements with the Sub-Adviser, under which the Sub-Adviser manages the investment portfolios of the Funds. The Sub-Adviser is compensated for its services to the Funds from the management fees paid to the Adviser.
The Adviser has agreed to waive fees and/or reimburse expenses of each Fund so that total annual Fund operating expenses (excluding acquired Fund fees and expenses), do not exceed the average daily net assets of any class of Fund shares in the amounts and for the time periods stated in the following table.
| Minnesota Intermediate | Minnesota | Nebraska | Oregon Intermediate | |||||||||||||
Class A Shares | .90 | % | .90 | % | .90 | % | .90 | % | ||||||||
Class C Shares | 1.45 | 1.45 | 1.45 | 1.45 | ||||||||||||
Class C1 Shares | 1.35 | 1.35 | 1.35 | N/A | ||||||||||||
Class I Shares | .70 | .70 | .70 | .70 | ||||||||||||
Expiration date | March 31, 2013 | March 31, 2013 | March 31, 2014 | March 31, 2013 | ||||||||||||
| N/A | - Oregon Intermediate does not offer Class C1 Shares. |
The Adviser may also voluntarily reimburse expenses from time to time in any of the Funds. Voluntary reimbursements may be terminated at any time at the Adviser’s discretion.
The Trust pays no compensation directly to those of its directors who are affiliated with the Adviser or to its officers, all of whom receive remuneration for their services to the Trust from the Adviser or its affiliates. The Board of Directors has adopted a deferred compensation plan for independent directors that enable directors to elect to defer receipt of all or a portion of the annual compensation they are entitled to receive from certain Nuveen-advised funds. Under the plan, deferred amounts are treated as though equal dollar amounts had been invested in shares of select Nuveen-advised funds.
During the six months ended November 30, 2012, Nuveen Securities, LLC, (the “Distributor”), a wholly-owned subsidiary of Nuveen, collected sales charges on purchases of Class A Shares, the majority of which were paid out as concessions to financial intermediaries as follows:
| Minnesota Intermediate | Minnesota | Nebraska | Oregon Intermediate | |||||||||||||||
Sales charges collected | $ | 34,418 | $ | 310,469 | $ | 214,630 | $ | 45,881 | ||||||||||
Paid to financial intermediaries | 29,302 | 269,043 | 185,319 | 36,647 | ||||||||||||||
| 72 | Nuveen Investments |
The Distributor also received 12b-1 service fees on Class A Shares, substantially all of which were paid to compensate financial intermediaries for providing services to shareholders relating to their investments.
During the six months ended November 30, 2012, the Distributor compensated financial intermediaries directly with commission advances at the time of purchase as follows:
| Minnesota Intermediate | Minnesota | Nebraska | Oregon Intermediate | |||||||||||||||
Commission advances | $ | 35,088 | $ | 95,473 | $ | 44,760 | $ | 58,193 | ||||||||||
To compensate for commissions advanced to financial intermediaries, all 12b-1 service and distribution fees collected on Class C Shares and Class C1 Shares during the first year following a purchase are retained by the Distributor. During the six months ended November 30, 2012, the Distributor retained such 12b-1 fees as follows:
| Minnesota Intermediate | Minnesota | Nebraska | Oregon Intermediate | |||||||||||||||
12b-1 fees retained | $ | 16,326 | $ | 24,765 | $ | 15,640 | $ | 34,199 | ||||||||||
The remaining 12b-1 fees charged to the Funds were paid to compensate financial intermediaries for providing services to shareholders relating to their investments.
The Distributor also collected and retained CDSC on share redemptions during the six months ended November 30, 2012, as follows:
| Minnesota Intermediate | Minnesota | Nebraska | Oregon Intermediate | |||||||||||||||
CDSC retained | $ | 517 | $ | 1,275 | $ | 2,665 | $ | 687 | ||||||||||
8. New Accounting Pronouncements
Financial Accounting Standards Board (“FASB”) Balance Sheet (Topic 210): Disclosures about Offsetting Assets and Liabilities
In December 2011, the FASB issued Accounting Standards Update (“ASU”) No. 2011-11 (“ASU No. 2011-11”) to enhance disclosures about financial instruments and derivative instruments that are subject to offsetting (“netting”) on the Statement of Assets and Liabilities. This information will enable users of the entity’s financial statements to evaluate the effect or potential effect of netting arrangements on the entity’s financial position. ASU No. 2011-11 is effective prospectively during interim or annual periods beginning on or after January 1, 2013. At this time, management is evaluating the implications of this guidance and the impact it will have to the financial statements amounts and footnote disclosures, if any.
| Nuveen Investments | 73 |
Glossary of Terms Used in this Report
Average Annual Total Return: This is a commonly used method to express an investment’s performance over a particular, usually multi-year time period. It expresses the return that would have been necessary each year to equal the investment’s actual cumulative performance (including change in NAV or offer price and reinvested dividends and capital gains distributions, if any) over the time period being considered.
Average Maturity: For a bond fund or defined portfolio, the average of the stated maturity dates of the fixed-income securities held. In general, the longer the average maturity, the greater the fund’s or defined portfolio’s sensitivity to interest-rate changes, which means greater price fluctuation. A shorter average maturity usually means a less sensitive, and consequently, less volatile, portfolio.
Barclays Municipal Bond Index: An unmanaged index comprised of fixed-rate, investment-grade tax-exempt bonds with remaining maturities of one year or more. Index returns assume reinvestment of distributions, but do not reflect any applicable sales charges or management fees.
Barclays 1-15 Year Blend Municipal Bond Index: An unmanaged index comprised of fixed-rate, investment-grade tax-exempt bonds with remaining maturities between 1 and 17 years. Index returns assume reinvestment of distributions, but do not reflect any applicable sales charges or management fees.
Duration: A measure of the price sensitivity of a fixed-income security or portfolio to changes in interest rates. Duration is stated in years. For example, if a bond has a duration of four years, the price of the bond is expected to change by approximately 4% for every one percentage point change in interest rates. The shorter the duration the less price variability expected in the security’s price due to changes in interest rates.
Gross Domestic Product (GDP): The total market value of all final goods and services produced in a country/region in a given year, equal to total consumer, investment and government spending, plus the value of exports, minus the value of imports.
Inverse Floating Rate Securities: Inverse floating rate securities, also known as inverse floaters or tender option bonds (TOBs), are created by depositing a municipal bond, typically with a fixed interest rate, into a special purpose trust created by a broker-dealer. This trust, in turn, (a) issues floating rate certificates typically paying short-term tax-exempt interest rates to third parties in amounts equal to some fraction of the deposited bond’s par amount or market value, and (b) issues an inverse floating rate certificate (sometimes referred to as an “inverse floater”) to an investor (such as a Fund) interested in gaining investment exposure to a long-term municipal bond. The income received by the holder of the inverse floater varies inversely with the short-term rate paid to the floating rate certificates’ holders, and in most circumstances the holder of the inverse floater bears substantially all of the underlying bond’s downside investment risk. The holder of the inverse floater typically also benefits disproportionately from any potential appreciation of the underlying bond’s value. Hence, an inverse floater essentially represents an investment in the underlying bond on a leveraged basis.
Leverage: Leverage is created whenever a fund has investment exposure (both reward and/or risk) equivalent to more than 100% of the investment capital.
Lipper Minnesota Municipal Debt Funds Classification Average: Represents the average annualized total return for all reporting funds in the Lipper Minnesota Municipal Debt Funds Classification. Lipper returns account for the effects of management fees and assume reinvestment of distributions, but do not reflect any applicable sales charge.
Lipper Other States Intermediate Municipal Debt Funds Classification Average: Represents the average annualized total return for all reporting funds in the Lipper Other States Intermediate Municipal Debt Funds Classification. Shareholders should note that the performance of the Lipper Other States Intermediate Municipal Debt Funds Classification Average represents the overall average of returns for funds from ten different states with a wide variety of municipal market conditions, making direct comparisons less meaningful. Lipper returns account for the effects of management fees and assume reinvestment of distributions, but do not reflect any applicable sales charge.
Lipper Other States Municipal Debt Funds Classification Average: Represents the average annualized total return for all reporting funds in the Lipper Other States Municipal Debt Funds Classification. Shareholders should note that the performance of the Lipper Other States Municipal Debt Funds Classification Average represents the overall average of returns for funds from ten different states with a wide variety of municipal market conditions, making direct comparisons less meaningful. Lipper returns account for the effects of management fees and assume reinvestment of distributions, but do not reflect any applicable sales charge.
Net Asset Value (NAV): The net market value of all securities held in a portfolio.
Net Asset Value (NAV) Per Share: The market value of one share of a mutual fund or closed-end fund. For a Fund, the NAV is calculated daily by taking the Fund’s total assets (securities, cash, and accrued earnings), subtracting the Funds’s liabilities, and dividing by the number of shares outstanding.
Pre-Refundings: Pre-Refundings, also known as advance refundings or refinancings, occur when an issuer sells new bonds and uses the proceeds to fund principal and interest payments of older existing bonds. This process often results in lower borrowing costs for bond issuers.
S&P Municipal Bond Intermediate Index: Contains all bonds in the S&P Municipal Bond Index that mature between 3 and 14.999 years. Index returns assume reinvestment of dividends but do not reflect any applicable sales charges or management fees.
S&P Municipal Bond Index: An unleveraged, market value-weighted index designed to measure the performance of the tax exempt, investment-grade U.S. municipal bond market. Index returns assume reinvestment of distributions, but do not reflect any applicable sales charges or management fees.
Zero Coupon Bond: A zero coupon bond does not pay a regular interest coupon to its holders during the life of the bond. Tax-exempt income to the holder of the bond comes from accretion of the difference between the original purchase price of the bond at issuance and the par value of the bond at maturity and is effectively paid at maturity. The market prices of zero coupon bonds generally are more volatile than the market prices of bonds that pay interest periodically.
| 74 | Nuveen Investments |
Fund Manager
Nuveen Fund Advisors, LLC
333 West Wacker Drive
Chicago, IL 60606
Sub-Adviser
Nuveen Asset Management, LLC
333 West Wacker Drive
Chicago, IL 60606
Legal Counsel
Chapman and Cutler LLP
Chicago, IL
Independent Registered Public Accounting Firm
PricewaterhouseCoopers LLP
Chicago, IL
Custodian
U.S. Bank National Association
St. Paul, MN
Transfer Agent and Shareholder Services
Boston Financial
Data Services, Inc.
Nuveen Investor Services
P.O. Box 8530
Boston, MA 02266-8530
(800) 257-8787
Quarterly Portfolio of Investments and Proxy Voting information: You may obtain (i) each Fund’s quarterly portfolio of investments, (ii) information regarding how the Funds voted proxies relating to portfolio securities held during the most recent twelve-month period ended June 30, and (iii) a description of the policies and procedures that the Funds used to determine how to vote proxies relating to portfolio securities without charge, upon request, by calling Nuveen Investments at (800) 257-8787 or on Nuveen’s website at www.nuveen.com.
You may also obtain this and other Fund information directly from the Securities and Exchange Commission (SEC). The SEC may charge a copying fee for this information. Visit the SEC on-line at http://www.sec.gov or in person at the SEC’s Public Reference Room in Washington, D.C. Call the SEC at (202) 942-8090 for room hours and operation. You may also request Fund information by sending an e-mail request to publicinfo@sec.gov or by writing to the SEC’s Public Reference Section at 100 F Street NE, Washington, D.C. 20549.
The Financial Industry Regulatory Authority (FINRA) provides a Public Disclosure Program which supplies certain information regarding the disciplinary history of FINRA members and their associated persons in response to either telephone inquiries at (800) 289-9999 or written inquiries at www.finra.org. FINRA also provides an investor brochure that includes information describing the Public Disclosure Program.
| Nuveen Investments | 75 |
Nuveen Investments:
Serving Investors for Generations
Since 1898, financial advisors and their clients have relied on Nuveen Investments to provide dependable investment solutions through continued adherence to proven, long-term investing principles. Today, we offer a range of high quality equity and fixed-income solutions designed to be integral components of a well-diversified core portfolio.
Focused on meeting investor needs.
Nuveen Investments provides high-quality investment services designed to help secure the longterm goals of institutional and individual investors as well as the consultants and financial advisors who serve them. Nuveen Investments markets a wide range of specialized investment solutions which provide investors access to capabilities of its high-quality boutique investment affiliates-Nuveen Asset Management, Symphony Asset Management, NWQ Investment Management Company, Santa Barbara Asset Management, Tradewinds Global Investors, Winslow Capital Management, and Gresham Investment Management. In total, Nuveen Investments managed approximately $220 billion as of September 30, 2012.
Find out how we can help you.
To learn more about how the products and services of Nuveen Investments may be able to help you meet your financial goals, talk to your financial advisor, or call us at (800) 257-8787. Please read the information provided carefully before you invest. Investors should consider the investment objective and policies, risk considerations, charges and expenses of any investment carefully. Where applicable, be sure to obtain a prospectus, which contains this and other relevant information. To obtain a prospectus, please contact your securities representative or Nuveen Investments, 333 W. Wacker Dr., Chicago, IL 60606. Please read the prospectus carefully before you invest or send money.
Learn more about Nuveen Funds at: www.nuveen.com/mf
Distributed by Nuveen Securities, LLC 333 West Wacker Drive Chicago, IL 60606 www.nuveen.com |
MSA-FTFI-1112P
Item 2. Code of Ethics.
Not applicable to this filing.
Item 3. Audit Committee Financial Expert.
Not applicable to this filing.
Item 4. Principal Accountant Fees and Services.
Not applicable to this filing.
Item 5. Audit Committee of Listed Registrants.
Not applicable to this registrant.
Item 6. Schedule of Investments.
(a) See Portfolio of Investments in Item 1.
(b) Not applicable.
Item 7. Disclosure of Proxy Voting Policies and Procedures for Closed-End Management Investment Companies.
Not applicable to this registrant.
Item 8. Portfolio Managers of Closed-End Management Investment Companies.
Not applicable to this registrant.
Item 9. Purchases of Equity Securities by Closed-End Management Investment Company and Affiliated Purchasers.
Not applicable to this registrant.
Item 10. Submission of Matters to a Vote of Security Holders.
There have been no material changes to the procedures by which shareholders may recommend nominees to the registrant’s Board implemented after the registrant last provided disclosure in response to this Item.
Item 11. Controls and Procedures.
| (a) | The registrant’s principal executive and principal financial officers, or persons performing similar functions, have concluded that the registrant’s disclosure controls and procedures (as defined in Rule 30a-3(c) under the Investment Company Act of 1940, as amended (the “1940 Act”) (17 CFR 270.30a-3(c))) are effective, as of a date within 90 days of the filing date of this report that includes the disclosure required by this paragraph, based on their evaluation of the controls and procedures required by Rule 30a-3(b) under the 1940 Act (17 CFR 270.30a-3(b)) and Rules 13a-15(b) or 15d-15(b) under the Securities Exchange Act of 1934, as amended (the “Exchange Act”) (17 CFR 240.13a-15(b) or 240.15d-15(b)). |
| (b) | There were no changes in the registrant’s internal control over financial reporting (as defined in Rule 30a-3(d) under the 1940 Act (17 CFR 270.30a-3(d)) that occurred during the second fiscal quarter of the period covered by this report that has materially affected, or is reasonably likely to materially affect, the registrant’s internal control over financial reporting. |
Item 12. Exhibits.
File the exhibits listed below as part of this Form.
(a)(1) Any code of ethics, or amendment thereto, that is the subject of the disclosure required by Item 2, to the extent that the registrant intends to satisfy the Item 2 requirements through filing of an exhibit: Not applicable to this filing.
(a)(2) A separate certification for each principal executive officer and principal financial officer of the registrant as required by Rule 30a-2(a) under the 1940 Act (17 CFR 270.30a-2(a)) in the exact form set forth below: See EX-99.CERT attached hereto.
(a)(3) Any written solicitation to purchase securities under Rule 23c-1 under the 1940 Act (17 CFR 270.23c-1) sent or given during the period covered by the report by or on behalf of the registrant to 10 or more persons: Not applicable to this registrant.
(b) If the report is filed under Section 13(a) or 15(d) of the Exchange Act, provide the certifications required by Rule 30a-2(b) under the 1940 Act (17 CFR 270.30a-2(b)), Rule 13a-14(b) or Rule 15d-14(b) under the Exchange Act (17 CFR 240.13a-14(b) or 240.15d-14(b)), and Section 1350 of Chapter 63 of Title 18 of the United States Code (18 U.S.C. 1350) as an Exhibit. A certification furnished pursuant to this paragraph will not be deemed “filed” for purposes of Section 18 of the Exchange Act (15 U.S.C. 78r), or otherwise subject to the liability of that section. Such certification will not be deemed to be incorporated by reference into any filing under the Securities Act of 1933 or the Exchange Act, except to the extent that the registration specifically incorporates it by reference: See EX-99.906 CERT attached hereto.
SIGNATURES
Pursuant to the requirements of the Securities Exchange Act of 1934 and the Investment Company Act of 1940, the registrant has duly caused this report to be signed on its behalf by the undersigned, thereunto duly authorized.
(Registrant) Nuveen Investment Funds, Inc.
| By | (Signature and Title) | /s/ Kevin J. McCarthy | ||||
Kevin J. McCarthy Vice President and Secretary |
Date: February 7, 2013
Pursuant to the requirements of the Securities Exchange Act of 1934 and the Investment Company Act of 1940, this report has been signed below by the following persons on behalf of the registrant and in the capacities and on the dates indicated.
| By | (Signature and Title) | /s/ Gifford R. Zimmerman | ||||
Gifford R. Zimmerman Chief Administrative Officer (principal executive officer) |
Date: February 7, 2013
| By | (Signature and Title) | /s/ Stephen D. Foy | ||||
Stephen D. Foy Vice President and Controller (principal financial officer) |
Date: February 7, 2013