UNITED STATES
SECURITIES AND EXCHANGE COMMISSION
Washington, D.C. 20549
FORM N‑CSR
CERTIFIED SHAREHOLDER REPORT OF REGISTERED
MANAGEMENT INVESTMENT COMPANIES
Investment Company Act file number 811-05309
Nuveen Investment Funds, Inc.
(Exact name of registrant as specified in charter)
Nuveen Investments
333 West Wacker Drive
Chicago, Illinois 60606
(Address of principal executive offices) (Zip code)
Mark J. Czarniecki
Vice President and Secretary
901 Marquette Avenue
Minneapolis, Minnesota 55402
(Name and address of agent for service)
Registrant’s telephone number, including area code: (312) 917‑7700
Date of fiscal year end: May 31
Date of reporting period: November 30, 2024
Item 1. Reports to Stockholders.
| | |
 | |
Semi-Annual Shareholder Report
November 30, 2024 |
Nuveen Minnesota Intermediate Municipal Bond Fund
Class A Shares/FAMAX
Semi-Annual Report
This semi-annual shareholder report contains important information about the Class A Shares of the Nuveen Minnesota Intermediate Municipal Bond Fund for the period of June 1, 2024 to November 30, 2024. You can find additional information at https://www.nuveen.com/en‑us/mutual‑funds/prospectuses. You can also request this information by contacting us at (800) 257‑8787.
What were the Fund costs for the last six months? (based on a hypothetical $10,000 investment)
| | | | |
| | |
| | | Cost of a $10,000 investment | | Costs paid as a percentage of
$10,000 investment* |
| | | |
| Class A Shares | | $41 | | 0.81% |
* Annualized for period less than one year.
Fund Statistics (as of November 30, 2024)
| | | | |
| |
| Fund net assets | | | $325,389,877 | |
| |
| Total number of portfolio holdings | | | 275 | |
| |
| Portfolio turnover (%) | | | 5% | |
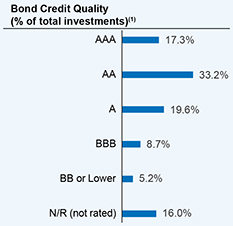
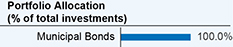
What did the Fund invest in? (as of November 30, 2024)
| | (1) | The ratings disclosed are the highest rating given by one of the following national rating agencies: Standard & Poor’s (S&P), Moody’s Investors Service, Inc. (Moody’s) or Fitch, Inc (Fitch). This treatment of split-rated securities may differ from that used for other purposes, such as for Fund investment policies. Credit ratings are subject to change. AAA, AA, A, and BBB are investment grade ratings; BB, B, CCC, CC, C and D are below-investment grade ratings. Holdings designated N/R are not rated by these national ratings agencies. |
Availability of additional information about the Fund
You can find additional information about the Fund at https://www.nuveen.com/en‑us/mutual‑funds/prospectuses, including its:
| | • | | prospectus • financial statements and other information • fund holdings • proxy voting information |
You can also request this information at (800) 257‑8787.
| | |
670678713_SAR_1124 4082619-0126 | |  |
| | |
| |
Semi-Annual Shareholder Report
November 30, 2024 |
Nuveen Minnesota Intermediate Municipal Bond Fund
Class C Shares/NIBCX
Semi-Annual Report
This semi-annual shareholder report contains important information about the Class C Shares of the Nuveen Minnesota Intermediate Municipal Bond Fund for the period of June 1, 2024 to November 30, 2024. You can find additional information at https://www.nuveen.com/en‑us/mutual‑funds/prospectuses. You can also request this information by contacting us at (800) 257‑8787.
What were the Fund costs for the last six months? (based on a hypothetical $10,000 investment)
| | | | |
| | |
| | | Cost of a $10,000 investment | | Costs paid as a percentage of
$10,000 investment* |
| | | |
| Class C Shares | | $82 | | 1.61% |
* Annualized for period less than one year.
Fund Statistics (as of November 30, 2024)
| | | | |
| |
| Fund net assets | | | $325,389,877 | |
| |
| Total number of portfolio holdings | | | 275 | |
| |
| Portfolio turnover (%) | | | 5% | |
What did the Fund invest in? (as of November 30, 2024)
| | (1) | The ratings disclosed are the highest rating given by one of the following national rating agencies: Standard & Poor’s (S&P), Moody’s Investors Service, Inc. (Moody’s) or Fitch, Inc (Fitch). This treatment of split-rated securities may differ from that used for other purposes, such as for Fund investment policies. Credit ratings are subject to change. AAA, AA, A, and BBB are investment grade ratings; BB, B, CCC, CC, C and D are below-investment grade ratings. Holdings designated N/R are not rated by these national ratings agencies. |
Availability of additional information about the Fund
You can find additional information about the Fund at https://www.nuveen.com/en‑us/mutual‑funds/prospectuses, including its:
| | • | | prospectus • financial statements and other information • fund holdings • proxy voting information |
You can also request this information at (800) 257‑8787.
| | |
670693100_SAR_1124 4082619-0126 | | |
| | |
| |
Semi-Annual Shareholder Report
November 30, 2024 |
Nuveen Minnesota Intermediate Municipal Bond Fund
Class I Shares/FAMTX
Semi-Annual Report
This semi-annual shareholder report contains important information about the Class I Shares of the Nuveen Minnesota Intermediate Municipal Bond Fund for the period of June 1, 2024 to November 30, 2024. You can find additional information at https://www.nuveen.com/en‑us/mutual‑funds/prospectuses. You can also request this information by contacting us at (800) 257‑8787.
What were the Fund costs for the last six months? (based on a hypothetical $10,000 investment)
| | | | |
| | |
| | | Cost of a $10,000 investment | | Costs paid as a percentage of
$10,000 investment* |
| | | |
| Class I Shares | | $31 | | 0.61% |
* Annualized for period less than one year.
Fund Statistics (as of November 30, 2024)
| | | | |
| |
| Fund net assets | | | $325,389,877 | |
| |
| Total number of portfolio holdings | | | 275 | |
| |
| Portfolio turnover (%) | | | 5% | |
What did the Fund invest in? (as of November 30, 2024)
| | (1) | The ratings disclosed are the highest rating given by one of the following national rating agencies: Standard & Poor’s (S&P), Moody’s Investors Service, Inc. (Moody’s) or Fitch, Inc (Fitch). This treatment of split-rated securities may differ from that used for other purposes, such as for Fund investment policies. Credit ratings are subject to change. AAA, AA, A, and BBB are investment grade ratings; BB, B, CCC, CC, C and D are below-investment grade ratings. Holdings designated N/R are not rated by these national ratings agencies. |
Availability of additional information about the Fund
You can find additional information about the Fund at https://www.nuveen.com/en‑us/mutual‑funds/prospectuses, including its:
| | • | | prospectus • financial statements and other information • fund holdings • proxy voting information |
You can also request this information at (800) 257‑8787.
| | |
670678689_SAR_1124 4082619-0126 | | |
| | |
| |
Semi-Annual Shareholder Report
November 30, 2024 |
Nuveen Minnesota Municipal Bond Fund
Class A Shares/FJMNX
Semi-Annual Report
This semi-annual shareholder report contains important information about the Class A Shares of the Nuveen Minnesota Municipal Bond Fund for the period of June 1, 2024 to November 30, 2024. You can find additional information at https://www.nuveen.com/en‑us/mutual‑funds/prospectuses. You can also request this information by contacting us at (800) 257‑8787.
What were the Fund costs for the last six months? (based on a hypothetical $10,000 investment)
| | | | |
| | |
| | | Cost of a $10,000 investment | | Costs paid as a percentage of
$10,000 investment* |
| | | |
| Class A Shares | | $40 | | 0.78% |
* Annualized for period less than one year.
Fund Statistics (as of November 30, 2024)
| | | | |
| |
| Fund net assets | | | $669,334,351 | |
| |
| Total number of portfolio holdings | | | 390 | |
| |
| Portfolio turnover (%) | | | 1% | |
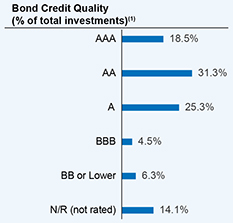
What did the Fund invest in? (as of November 30, 2024)
| | (1) | The ratings disclosed are the highest rating given by one of the following national rating agencies: Standard & Poor’s (S&P), Moody’s Investors Service, Inc. (Moody’s) or Fitch, Inc (Fitch). This treatment of split-rated securities may differ from that used for other purposes, such as for Fund investment policies. Credit ratings are subject to change. AAA, AA, A, and BBB are investment grade ratings; BB, B, CCC, CC, C and D are below-investment grade ratings. Holdings designated N/R are not rated by these national ratings agencies. |
Availability of additional information about the Fund
You can find additional information about the Fund at https://www.nuveen.com/en‑us/mutual‑funds/prospectuses, including its:
| | • | | prospectus • financial statements and other information • fund holdings • proxy voting information |
You can also request this information at (800) 257‑8787.
| | |
670678184_SAR_1124 4082630-0126 | | |
| | |
| |
Semi-Annual Shareholder Report
November 30, 2024 |
Nuveen Minnesota Municipal Bond Fund
Class C Shares/NTCCX
Semi-Annual Report
This semi-annual shareholder report contains important information about the Class C Shares of the Nuveen Minnesota Municipal Bond Fund for the period of June 1, 2024 to November 30, 2024. You can find additional information at https://www.nuveen.com/en‑us/mutual‑funds/prospectuses. You can also request this information by contacting us at (800) 257‑8787.
What were the Fund costs for the last six months? (based on a hypothetical $10,000 investment)
| | | | |
| | |
| | | Cost of a $10,000 investment | | Costs paid as a percentage of
$10,000 investment* |
| | | |
| Class C Shares | | $80 | | 1.57% |
* Annualized for period less than one year.
Fund Statistics (as of November 30, 2024)
| | | | |
| |
| Fund net assets | | | $669,334,351 | |
| |
| Total number of portfolio holdings | | | 390 | |
| |
| Portfolio turnover (%) | | | 1% | |
What did the Fund invest in? (as of November 30, 2024)
| | (1) | The ratings disclosed are the highest rating given by one of the following national rating agencies: Standard & Poor’s (S&P), Moody’s Investors Service, Inc. (Moody’s) or Fitch, Inc (Fitch). This treatment of split-rated securities may differ from that used for other purposes, such as for Fund investment policies. Credit ratings are subject to change. AAA, AA, A, and BBB are investment grade ratings; BB, B, CCC, CC, C and D are below-investment grade ratings. Holdings designated N/R are not rated by these national ratings agencies. |
Availability of additional information about the Fund
You can find additional information about the Fund at https://www.nuveen.com/en‑us/mutual‑funds/prospectuses, including its:
| | • | | prospectus • financial statements and other information • fund holdings • proxy voting information |
You can also request this information at (800) 257‑8787.
| | |
670693209_SAR_1124 4082630-0126 | | |
| | |
| |
Semi-Annual Shareholder Report
November 30, 2024 |
Nuveen Minnesota Municipal Bond Fund
Class I Shares/FYMNX
Semi-Annual Report
This semi-annual shareholder report contains important information about the Class I Shares of the Nuveen Minnesota Municipal Bond Fund for the period of June 1, 2024 to November 30, 2024. You can find additional information at https://www.nuveen.com/en‑us/mutual‑funds/prospectuses. You can also request this information by contacting us at (800) 257‑8787.
What were the Fund costs for the last six months? (based on a hypothetical $10,000 investment)
| | | | |
| | |
| | | Cost of a $10,000 investment | | Costs paid as a percentage of
$10,000 investment* |
| | | |
| Class I Shares | | $30 | | 0.58% |
* Annualized for period less than one year.
Fund Statistics (as of November 30, 2024)
| | | | |
| |
| Fund net assets | | | $669,334,351 | |
| |
| Total number of portfolio holdings | | | 390 | |
| |
| Portfolio turnover (%) | | | 1% | |
What did the Fund invest in? (as of November 30, 2024)
| | (1) | The ratings disclosed are the highest rating given by one of the following national rating agencies: Standard & Poor’s (S&P), Moody’s Investors Service, Inc. (Moody’s) or Fitch, Inc (Fitch). This treatment of split-rated securities may differ from that used for other purposes, such as for Fund investment policies. Credit ratings are subject to change. AAA, AA, A, and BBB are investment grade ratings; BB, B, CCC, CC, C and D are below-investment grade ratings. Holdings designated N/R are not rated by these national ratings agencies. |
Availability of additional information about the Fund
You can find additional information about the Fund at https://www.nuveen.com/en‑us/mutual‑funds/prospectuses, including its:
| | • | | prospectus • financial statements and other information • fund holdings • proxy voting information |
You can also request this information at (800) 257‑8787.
| | |
670678192_SAR_1124 4082630-0126 | | |
| | |
| |
Semi-Annual Shareholder Report
November 30, 2024 |
Nuveen Nebraska Municipal Bond Fund
Class A Shares/FNTAX
Semi-Annual Report
This semi-annual shareholder report contains important information about the Class A Shares of the Nuveen Nebraska Municipal Bond Fund for the period of June 1, 2024 to November 30, 2024. You can find additional information at https://www.nuveen.com/en‑us/mutual‑funds/prospectuses. You can also request this information by contacting us at (800) 257‑8787.
What were the Fund costs for the last six months? (based on a hypothetical $10,000 investment)
| | | | |
| | |
| | | Cost of a $10,000 investment | | Costs paid as a percentage of
$10,000 investment* |
| | | |
| Class A Shares | | $43 | | 0.85% |
* Annualized for period less than one year.
Fund Statistics (as of November 30, 2024)
| | | | |
| |
| Fund net assets | | | $74,641,937 | |
| |
| Total number of portfolio holdings | | | 92 | |
| |
| Portfolio turnover (%) | | | 10% | |
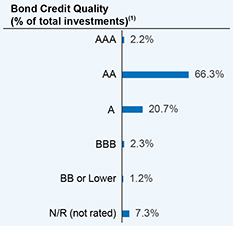
What did the Fund invest in? (as of November 30, 2024)
| | (1) | The ratings disclosed are the highest rating given by one of the following national rating agencies: Standard & Poor’s (S&P), Moody’s Investors Service, Inc. (Moody’s) or Fitch, Inc (Fitch). This treatment of split-rated securities may differ from that used for other purposes, such as for Fund investment policies. Credit ratings are subject to change. AAA, AA, A, and BBB are investment grade ratings; BB, B, CCC, CC, C and D are below-investment grade ratings. Holdings designated N/R are not rated by these national ratings agencies. |
Availability of additional information about the Fund
You can find additional information about the Fund at https://www.nuveen.com/en‑us/mutual‑funds/prospectuses, including its:
| | • | | prospectus • financial statements and other information • fund holdings • proxy voting information |
You can also request this information at (800) 257‑8787.
| | |
670678499_SAR_1124 4082642-0126 | | |
| | |
| |
Semi-Annual Shareholder Report
November 30, 2024 |
Nuveen Nebraska Municipal Bond Fund
Class C Shares/NAAFX
Semi-Annual Report
This semi-annual shareholder report contains important information about the Class C Shares of the Nuveen Nebraska Municipal Bond Fund for the period of June 1, 2024 to November 30, 2024. You can find additional information at https://www.nuveen.com/en‑us/mutual‑funds/prospectuses. You can also request this information by contacting us at (800) 257‑8787.
What were the Fund costs for the last six months? (based on a hypothetical $10,000 investment)
| | | | |
| | |
| | | Cost of a $10,000 investment | | Costs paid as a percentage of
$10,000 investment* |
| | | |
| Class C Shares | | $84 | | 1.65% |
* Annualized for period less than one year.
Fund Statistics (as of November 30, 2024)
| | | | |
| |
| Fund net assets | | | $74,641,937 | |
| |
| Total number of portfolio holdings | | | 92 | |
| |
| Portfolio turnover (%) | | | 10% | |
What did the Fund invest in? (as of November 30, 2024)
| | (1) | The ratings disclosed are the highest rating given by one of the following national rating agencies: Standard & Poor’s (S&P), Moody’s Investors Service, Inc. (Moody’s) or Fitch, Inc (Fitch). This treatment of split-rated securities may differ from that used for other purposes, such as for Fund investment policies. Credit ratings are subject to change. AAA, AA, A, and BBB are investment grade ratings; BB, B, CCC, CC, C and D are below-investment grade ratings. Holdings designated N/R are not rated by these national ratings agencies. |
Availability of additional information about the Fund
You can find additional information about the Fund at https://www.nuveen.com/en‑us/mutual‑funds/prospectuses, including its:
| | • | | prospectus • financial statements and other information • fund holdings • proxy voting information |
You can also request this information at (800) 257‑8787.
| | |
670693308_SAR_1124 4082642-0126 | | |
| | |
| |
Semi-Annual Shareholder Report
November 30, 2024 |
Nuveen Nebraska Municipal Bond Fund
Class I Shares/FNTYX
Semi-Annual Report
This semi-annual shareholder report contains important information about the Class I Shares of the Nuveen Nebraska Municipal Bond Fund for the period of June 1, 2024 to November 30, 2024. You can find additional information at https://www.nuveen.com/en‑us/mutual‑funds/prospectuses. You can also request this information by contacting us at (800) 257‑8787.
What were the Fund costs for the last six months? (based on a hypothetical $10,000 investment)
| | | | |
| | |
| | | Cost of a $10,000 investment | | Costs paid as a percentage of
$10,000 investment* |
| | | |
| Class I Shares | | $34 | | 0.66% |
* Annualized for period less than one year.
Fund Statistics (as of November 30, 2024)
| | | | |
| |
| Fund net assets | | | $74,641,937 | |
| |
| Total number of portfolio holdings | | | 92 | |
| |
| Portfolio turnover (%) | | | 10% | |
What did the Fund invest in? (as of November 30, 2024)
| | (1) | The ratings disclosed are the highest rating given by one of the following national rating agencies: Standard & Poor’s (S&P), Moody’s Investors Service, Inc. (Moody’s) or Fitch, Inc (Fitch). This treatment of split-rated securities may differ from that used for other purposes, such as for Fund investment policies. Credit ratings are subject to change. AAA, AA, A, and BBB are investment grade ratings; BB, B, CCC, CC, C and D are below-investment grade ratings. Holdings designated N/R are not rated by these national ratings agencies. |
Availability of additional information about the Fund
You can find additional information about the Fund at https://www.nuveen.com/en‑us/mutual‑funds/prospectuses, including its:
| | • | | prospectus • financial statements and other information • fund holdings • proxy voting information |
You can also request this information at (800) 257‑8787.
| | |
670678523_SAR_1124 4082642-0126 | | |
| | |
| |
Semi-Annual Shareholder Report
November 30, 2024 |
Nuveen Oregon Intermediate Municipal Bond Fund
Class A Shares/FOTAX
Semi-Annual Report
This semi-annual shareholder report contains important information about the Class A Shares of the Nuveen Oregon Intermediate Municipal Bond Fund for the period of June 1, 2024 to November 30, 2024. You can find additional information at https://www.nuveen.com/en‑us/mutual‑funds/prospectuses. You can also request this information by contacting us at (800) 257‑8787.
What were the Fund costs for the last six months? (based on a hypothetical $10,000 investment)
| | | | |
| | |
| | | Cost of a $10,000 investment | | Costs paid as a percentage of
$10,000 investment* |
| | | |
| Class A Shares | | $43 | | 0.84% |
* Annualized for period less than one year.
Fund Statistics (as of November 30, 2024)
| | | | |
| |
| Fund net assets | | | $194,912,002 | |
| |
| Total number of portfolio holdings | | | 164 | |
| |
| Portfolio turnover (%) | | | 6% | |
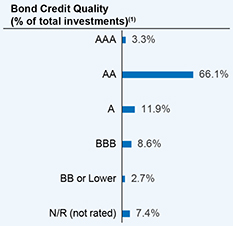
What did the Fund invest in? (as of November 30, 2024)
| | (1) | The ratings disclosed are the highest rating given by one of the following national rating agencies: Standard & Poor’s (S&P), Moody’s Investors Service, Inc. (Moody’s) or Fitch, Inc (Fitch). This treatment of split-rated securities may differ from that used for other purposes, such as for Fund investment policies. Credit ratings are subject to change. AAA, AA, A, and BBB are investment grade ratings; BB, B, CCC, CC, C and D are below-investment grade ratings. Holdings designated N/R are not rated by these national ratings agencies. |
Availability of additional information about the Fund
You can find additional information about the Fund at https://www.nuveen.com/en‑us/mutual‑funds/prospectuses, including its:
| | • | | prospectus • financial statements and other information • fund holdings • proxy voting information |
You can also request this information at (800) 257‑8787.
| | |
670678242_SAR_1124 4082654-0126 | | |
| | |
| |
Semi-Annual Shareholder Report
November 30, 2024 |
Nuveen Oregon Intermediate Municipal Bond Fund
Class C Shares/NAFOX
Semi-Annual Report
This semi-annual shareholder report contains important information about the Class C Shares of the Nuveen Oregon Intermediate Municipal Bond Fund for the period of June 1, 2024 to November 30, 2024. You can find additional information at https://www.nuveen.com/en‑us/mutual‑funds/prospectuses. You can also request this information by contacting us at (800) 257‑8787.
What were the Fund costs for the last six months? (based on a hypothetical $10,000 investment)
| | | | |
| | |
| | | Cost of a $10,000 investment | | Costs paid as a percentage of
$10,000 investment* |
| | | |
| Class C Shares | | $83 | | 1.64% |
* Annualized for period less than one year.
Fund Statistics (as of November 30, 2024)
| | | | |
| |
| Fund net assets | | | $194,912,002 | |
| |
| Total number of portfolio holdings | | | 164 | |
| |
| Portfolio turnover (%) | | | 6% | |
What did the Fund invest in? (as of November 30, 2024)
| | (1) | The ratings disclosed are the highest rating given by one of the following national rating agencies: Standard & Poor’s (S&P), Moody’s Investors Service, Inc. (Moody’s) or Fitch, Inc (Fitch). This treatment of split-rated securities may differ from that used for other purposes, such as for Fund investment policies. Credit ratings are subject to change. AAA, AA, A, and BBB are investment grade ratings; BB, B, CCC, CC, C and D are below-investment grade ratings. Holdings designated N/R are not rated by these national ratings agencies. |
Availability of additional information about the Fund
You can find additional information about the Fund at https://www.nuveen.com/en‑us/mutual‑funds/prospectuses, including its:
| | • | | prospectus • financial statements and other information • fund holdings • proxy voting information |
You can also request this information at (800) 257‑8787.
| | |
670693407_SAR_1124 4082654-0126 | | |
| | |
| |
Semi-Annual Shareholder Report
November 30, 2024 |
Nuveen Oregon Intermediate Municipal Bond Fund
Class I Shares/FORCX
Semi-Annual Report
This semi-annual shareholder report contains important information about the Class I Shares of the Nuveen Oregon Intermediate Municipal Bond Fund for the period of June 1, 2024 to November 30, 2024. You can find additional information at https://www.nuveen.com/en‑us/mutual‑funds/prospectuses. You can also request this information by contacting us at (800) 257‑8787.
What were the Fund costs for the last six months? (based on a hypothetical $10,000 investment)
| | | | |
| | |
| | | Cost of a $10,000 investment | | Costs paid as a percentage of
$10,000 investment* |
| | | |
| Class I Shares | | $33 | | 0.64% |
* Annualized for period less than one year.
Fund Statistics (as of November 30, 2024)
| | | | |
| |
| Fund net assets | | | $194,912,002 | |
| |
| Total number of portfolio holdings | | | 164 | |
| |
| Portfolio turnover (%) | | | 6% | |
What did the Fund invest in? (as of November 30, 2024)
| | (1) | The ratings disclosed are the highest rating given by one of the following national rating agencies: Standard & Poor’s (S&P), Moody’s Investors Service, Inc. (Moody’s) or Fitch, Inc (Fitch). This treatment of split-rated securities may differ from that used for other purposes, such as for Fund investment policies. Credit ratings are subject to change. AAA, AA, A, and BBB are investment grade ratings; BB, B, CCC, CC, C and D are below-investment grade ratings. Holdings designated N/R are not rated by these national ratings agencies. |
Availability of additional information about the Fund
You can find additional information about the Fund at https://www.nuveen.com/en‑us/mutual‑funds/prospectuses, including its:
| | • | | prospectus • financial statements and other information • fund holdings • proxy voting information |
You can also request this information at (800) 257‑8787.
| | |
670678408_SAR_1124 4082654-0126 | | |
Not applicable to this filing.
| Item 3. | Audit Committee Financial Expert. |
Not applicable to this filing.
| Item 4. | Principal Accountant Fees and Services. |
Not applicable to this filing.
| Item 5. | Audit Committee of Listed Registrants. |
Not applicable to this registrant.
| (a) | Schedule of Investments is included as part of the financial statements filed under Item 7 of this Form N-CSR. |
| Item 7. | Financial Statements and Financial Highlights for Open-End Management Investment Companies. |
Item
7.
Financial
Statements
and
Financial
Highlights
for
Open-End
Management
Investment
Companies
Portfolio
of
Investments
November
30,
2024
Minnesota
Intermediate
Municipal
Bond
(Unaudited)
PRINCIPAL
DESCRIPTION
RATE
MATURITY
VALUE
LONG-TERM
INVESTMENTS
-
98.6%
X
320,827,928
MUNICIPAL
BONDS
-
98.6%
X
–
EDUCATION
AND
CIVIC
ORGANIZATIONS
-
17.3%
$
720,000
Baytown
Township,
Minnesota
Charter
School
Lease
Revenue
Bonds,
Saint
Croix
Preparatory
Academy,
Refunding
Series
2016A
3
.500
%
08/01/25
$
716,845
130,000
Baytown
Township,
Minnesota
Charter
School
Lease
Revenue
Bonds,
Saint
Croix
Preparatory
Academy,
Refunding
Series
2016A
4
.000
08/01/28
129,731
1,160,000
Brooklyn
Center,
Minnesota,
Charter
School
Lease
Revenue
Bonds,
Tesfa
International
dba
Twin
Lakes
STEM
Academy
Project,
Series
2021A
5
.000
06/15/37
965,877
100,000
City
of
Ham
Lake,
Minnesota,
Charter
School
Lease
Revenue
Bonds,
DaVinci
Academy
Project,Series
2016A
5
.000
07/01/31
100,342
1,000,000
City
of
Ham
Lake,
Minnesota,
Charter
School
Lease
Revenue
Bonds,
DaVinci
Academy
Project,Series
2016A
5
.000
07/01/36
989,141
190,000
Deephaven,
Minnesota,
Charter
School
Lease
Revenue
Bonds,
Eagle
Ridge
Academy
Project,
Series
2015A
5
.000
07/01/30
191,226
710,000
Deephaven,
Minnesota,
Charter
School
Lease
Revenue
Bonds,
Eagle
Ridge
Academy
Project,
Series
2015A
5
.250
07/01/37
714,652
135,000
Deephaven,
Minnesota,
Charter
School
Lease
Revenue
Bonds,
Eagle
Ridge
Academy
Project,
Series
2016A
4
.000
07/01/25
134,942
195,000
Deephaven,
Minnesota,
Charter
School
Lease
Revenue
Bonds,
Eagle
Ridge
Academy
Project,
Series
2016A
4
.000
07/01/26
194,906
300,000
Deephaven,
Minnesota,
Charter
School
Lease
Revenue
Bonds,
Eagle
Ridge
Academy
Project,
Series
2016A
4
.000
07/01/27
300,214
370,000
Deephaven,
Minnesota,
Charter
School
Lease
Revenue
Bonds,
Eagle
Ridge
Academy
Project,
Series
2016A
4
.000
07/01/28
370,201
645,000
Forest
Lake,
Minnesota,
Charter
School
Lease
Revenue
Bonds,
Lakes
International
Language
Academy,
Series
2014A
5
.500
08/01/36
645,586
450,000
Greenwood,
Minnesota,
Charter
School
Lease
Revenue
Bonds,
Main
Street
School
of
Performing
Arts
Project,
Series
2016A
4
.500
07/01/26
445,597
40,000
Greenwood,
Minnesota,
Charter
School
Lease
Revenue
Bonds,
Main
Street
School
of
Performing
Arts
Project,
Series
2016A
5
.000
07/01/36
38,567
770,000
Ham
Lake,
Minnesota
Charter
School
Lease
Revenue
Bonds,
Parnassus
Preparatory
School
Project,
Series
2016A
4
.000
11/01/26
765,636
975,000
Hugo,
Minnesota,
Charter
School
Lease
Revenue
Bonds,
Noble
Academy
Project,
Series
2014A
5
.000
07/01/44
975,047
1,000,000
Independence,
Minnesota,
Charter
School
Lease
Revenue
Bonds,
Beacon
Academy
Project,
Series
2016A
4
.750
07/01/31
980,601
500,000
Independence,
Minnesota,
Charter
School
Lease
Revenue
Bonds,
Beacon
Academy
Project,
Series
2016A
5
.000
07/01/36
491,786
1,405,000
(a)
Minneapolis,
Minnesota,
Charter
School
Lease
Revenue
Bonds,
Twin
Cities
International
Schools
Project,
Series
2017A
5
.000
12/01/32
1,421,742
1,275,000
Minneapolis,
Minnesota,
Charter
School
Lease
Revenue
Bonds,
Yinghua
Academy
Project,
Series
2013A
6
.000
07/01/33
1,276,471
1,040,000
Minneapolis,
Minnesota,
Revenue
Bonds,
University
Gateway
Project,
Refunding
Series
2015
4
.000
12/01/28
1,040,960
1,260,000
Minnesota
Department
of
Iron
Range
Resource
and
Rehabilitation,
Educational
Facilities
Revenue
Bonds,
Series
2023A
5
.000
10/01/41
1,412,131
2,800,000
Minnesota
Higher
Education
Facilities
Authority,
Revenue
Bonds,
Bethel
University,
Refunding
Series
2017
5
.000
05/01/32
2,816,228
655,000
Minnesota
Higher
Education
Facilities
Authority,
Revenue
Bonds,
Bethel
University,
Refunding
Series
2017
5
.000
05/01/37
652,135
1,600,000
Minnesota
Higher
Education
Facilities
Authority,
Revenue
Bonds,
Carleton
College,
Refunding
Series
2017
4
.000
03/01/33
1,622,202
2,380,000
Minnesota
Higher
Education
Facilities
Authority,
Revenue
Bonds,
Carleton
College,
Series
2023
5
.000
03/01/41
2,642,284
815,000
Minnesota
Higher
Education
Facilities
Authority,
Revenue
Bonds,
Gustavus
Adolfus
College,
Series
2013-7W
4
.250
10/01/28
815,402
160,000
Minnesota
Higher
Education
Facilities
Authority,
Revenue
Bonds,
Macalester
College,
Refunidng
Series
2021
4
.000
03/01/31
168,912
PRINCIPAL
DESCRIPTION
RATE
MATURITY
VALUE
EDUCATION
AND
CIVIC
ORGANIZATIONS
(continued)
$
1,250,000
Minnesota
Higher
Education
Facilities
Authority,
Revenue
Bonds,
Macalester
College,
Series
201528J
3
.250
%
03/01/29
$
1,250,835
1,235,000
Minnesota
Higher
Education
Facilities
Authority,
Revenue
Bonds,
Saint
Catherine
University,
Refunding
Series
2018A
5
.000
10/01/31
1,277,826
200,000
Minnesota
Higher
Education
Facilities
Authority,
Revenue
Bonds,
Saint
John's
University,
Refunding
Series
2021
4
.000
10/01/34
205,185
700,000
Minnesota
Higher
Education
Facilities
Authority,
Revenue
Bonds,
Saint
John's
University,
Series
2015-8I
3
.375
10/01/30
694,812
1,000,000
Minnesota
Higher
Education
Facilities
Authority,
Revenue
Bonds,
Saint
Olaf
College,
Series
2015-8-G
5
.000
12/01/28
1,019,135
1,000,000
Minnesota
Higher
Education
Facilities
Authority,
Revenue
Bonds,
Saint
Olaf
College,
Series
2021
3
.000
10/01/38
914,337
825,000
Minnesota
Higher
Education
Facilities
Authority,
Revenue
Bonds,
University
of
Saint
Thomas,
Green
Series
2022A
4
.000
10/01/38
839,267
775,000
Minnesota
Higher
Education
Facilities
Authority,
Revenue
Bonds,
University
of
Saint
Thomas,
Series
2013-7U
4
.000
04/01/26
775,316
300,000
Minnesota
Higher
Education
Facilities
Authority,
Revenue
Bonds,
University
of
Saint
Thomas,
Series
2013-7U
4
.000
04/01/27
300,152
750,000
Minnesota
Higher
Education
Facilities
Authority,
Revenue
Bonds,
University
of
Saint
Thomas,
Series
2017A
4
.000
10/01/34
759,546
850,000
Minnesota
Higher
Education
Facilities
Authority,
Revenue
Bonds,
University
of
Saint
Thomas,
Series
2017A
4
.000
10/01/36
858,980
1,250,000
Minnesota
Higher
Education
Facilities
Authority,
Revenue
Bonds,
University
of
Saint
Thomas,
Series
2019
5
.000
10/01/40
1,327,813
1,000,000
Minnesota
Higher
Education
Facilities
Authority,
Revenue
Bonds,
University
of
Saint
Thomas,
Series
2022B
4
.125
10/01/41
1,013,934
1,000,000
Minnesota
Higher
Education
Facilities
Authority,
Revenue
Bonds,
University
of
Saint
Thomas,
Series
2022B
5
.000
10/01/47
1,055,902
705,000
Minnesota
Office
of
Higher
Education,
Supplemental
Student
Loan
Program
Revenue
Bonds,
Senior
Series
2018,
(AMT)
5
.000
11/01/26
721,525
980,000
Moorhead,
Minnesota,
Educational
Facilities
Revenue
Bonds,
The
Concordia
College
Corporation
Project,
Series
2016
4
.000
12/01/30
980,927
1,060,000
Moorhead,
Minnesota,
Educational
Facilities
Revenue
Bonds,
The
Concordia
College
Corporation
Project,
Series
2016
4
.000
12/01/32
1,055,984
935,000
Otsego,
Minnesota,
Charter
School
Lease
Revenue
Bonds,
Kaleidoscope
Charter
School
Project,
Series
2014A
5
.000
09/01/34
932,075
70,000
Saint
Cloud,
Minnesota,
Charter
School
Lease
Revenue
Bonds,
Stride
Academy
Project,
Series
2016A
5
.000
04/01/36
66,057
710,000
(a)
Saint
Paul
Housing
&
Redevelopment
Authority,
Minnesota,
Charter
School
Lease
Revenue
Bonds,
Great
River
School
Project,
Series
2017A
5
.500
07/01/38
723,968
3,005,000
Saint
Paul
Housing
&
Redevelopment
Authority,
Minnesota,
Charter
School
Lease
Revenue
Bonds,
Hmong
College
Prep
Academy
Project,
Series
2016A
5
.250
09/01/31
3,071,160
200,000
(a)
Saint
Paul
Housing
&
Redevelopment
Authority,
Minnesota,
Charter
School
Lease
Revenue
Bonds,
Metro
Deaf
School
Project,
Series
2018A
5
.000
06/15/38
200,216
325,000
Saint
Paul
Housing
&
Redevelopment
Authority,
Minnesota,
Charter
School
Lease
Revenue
Bonds,
Nova
Classical
Academy,
Series
2016A
4
.000
09/01/31
325,256
885,000
Saint
Paul
Housing
&
Redevelopment
Authority,
Minnesota,
Charter
School
Lease
Revenue
Bonds,
Twin
Cities
Academy
Project,
Series
2015A
5
.000
07/01/35
887,022
650,000
Saint
Paul
Housing
&
Redevelopment
Authority,
Minnesota,
Charter
School
Lease
Revenue
Bonds,
Twin
Cities
German
Immersion
School,
Series
2013A
5
.000
07/01/33
650,286
210,000
Saint
Paul
Housing
and
Redevelopment
Authority,
Minnesota,
Lease
Revenue
Bonds,
Saint
Paul
Conservatory
for
Performing
Artists
Charter
School
Project,
Series
2013A
4
.000
03/01/28
205,176
2,770,000
Savage,
Minnesota
Charter
School
Lease
Revenue
Bonds,
Aspen
Academy
Project,
Series
2016A
5
.000
10/01/36
2,767,358
500,000
St.
Paul
Housing
and
Redevelopment
Authority,
Minnesota,
Charter
School
Revenue
Bonds,
Higher
Ground
Academy
Charter
School,
Series
2018
5
.000
12/01/43
504,864
Portfolio
of
Investments
November
30,
2024
(continued)
Minnesota
Intermediate
Municipal
Bond
PRINCIPAL
DESCRIPTION
RATE
MATURITY
VALUE
EDUCATION
AND
CIVIC
ORGANIZATIONS
(continued)
$
700,000
University
of
Minnesota,
General
Obligation
Bonds,
Refunding
Series
2024A
5
.000
%
01/01/39
$
800,984
5,460,000
University
of
Minnesota,
General
Obligation
Bonds,
Series
2019A
5
.000
04/01/44
5,800,352
60,000
Winona
Port
Authority,
Minnesota,
Charter
School
Lease
Revenue
Bonds,
Bluffview
Montessori
School
Project,
Refunding
Series
2016
3
.750
06/01/26
58,922
10,000
Winona
Port
Authority,
Minnesota,
Charter
School
Lease
Revenue
Bonds,
Bluffview
Montessori
School
Project,
Refunding
Series
2016
4
.500
06/01/36
9,237
170,000
Woodbury,
Minnesota,
Charter
School
Lease
Revenue
Bonds,
Math
and
Science
Academy
Building
Company,
Refunding
Series
2020A
3
.000
12/01/30
156,052
1,015,000
Woodbury,
Minnesota,
Charter
School
Lease
Revenue
Bonds,
Woodbury
Leadership
Academy,
Series
2021A
4
.000
07/01/31
969,611
TOTAL
EDUCATION
AND
CIVIC
ORGANIZATIONS
56,199,436
HEALTH
CARE
-
17.2%
3,370,000
Chippewa
County,
Minnesota,
Gross
Revenue
Hospital
Bonds,
Montevideo
Hospital
Project,
Refunding
Series
2016
4
.000
03/01/29
3,383,350
1,140,000
City
of
Plato,
Minnesota,
Health
Care
Facilities
Revenue
Bonds,
Glencoe
Regional
Health
Services
Project,
Series
2017
4
.000
04/01/29
1,136,807
1,040,000
City
of
Plato,
Minnesota,
Health
Care
Facilities
Revenue
Bonds,
Glencoe
Regional
Health
Services
Project,
Series
2017
4
.000
04/01/32
1,034,995
1,150,000
Crookston,
Minnesota,
Health
Care
Facilities
Revenue
Bonds,
RiverView
Health
Project,
Refunding
Series
2017A
4
.000
05/01/32
843,849
1,045,000
Duluth
Economic
Development
Authority,
Minnesota,
Health
Care
Facilities
Revenue
Bonds,
Essentia
Health
Obligated
Group,
Series
2018A
5
.000
02/15/33
1,092,600
675,000
Duluth
Economic
Development
Authority,
Minnesota,
Health
Care
Facilities
Revenue
Bonds,
Saint
Luke's
Hospital
of
Duluth
Obligated
Group,
Series
2021A
4
.000
06/15/37
696,000
240,000
Duluth
Economic
Development
Authority,
Minnesota,
Health
Care
Facilities
Revenue
Bonds,
Saint
Luke's
Hospital
of
Duluth
Obligated
Group,
Series
2022A, Forward
Delivery
4
.000
06/15/35
249,851
1,400,000
Duluth
Economic
Development
Authority,
Minnesota,
Health
Care
Facilities
Revenue
Bonds,
Saint
Luke's
Hospital
of
Duluth
Obligated
Group,
Series
2022B
5
.250
06/15/42
1,558,210
660,000
Glencoe,
Minnesota,
Health
Care
Facilities
Revenue
Bonds,
Glencoe
Regional
Health
Services
Project,
Series
2013
4
.000
04/01/25
658,499
400,000
Glencoe,
Minnesota,
Health
Care
Facilities
Revenue
Bonds,
Glencoe
Regional
Health
Services
Project,
Series
2013
4
.000
04/01/26
398,728
2,000,000
Maple
Grove,
Minnesota,
Health
Care
Facilities
Revenue
Refunding
Bonds,
North
Memorial
Health
Care,
Series
2015
5
.000
09/01/28
2,017,995
495,000
Maple
Grove,
Minnesota,
Health
Care
Facility
Revenue
Bonds,
North
Memorial
Health
Care,
Series
2017
5
.000
05/01/31
507,957
405,000
Maple
Grove,
Minnesota,
Health
Care
Facility
Revenue
Bonds,
North
Memorial
Health
Care,
Series
2017
5
.000
05/01/32
414,689
470,000
Minneapolis,
Minnesota,
Health
Care
System
Revenue
Bonds,
Allina
Health
System,
Series
2021
4
.000
11/15/37
477,510
1,500,000
Minneapolis,
Minnesota,
Health
Care
System
Revenue
Bonds,
Allina
Health
System,
Series
2021
4
.000
11/15/38
1,521,295
3,000,000
Minneapolis,
Minnesota,
Health
Care
System
Revenue
Bonds,
Allina
Health
System,
Series
2021
4
.000
11/15/39
3,035,005
595,000
Minneapolis,
Minnesota,
Health
Care
System
Revenue
Bonds,
Allina
Health
System,
Series
2023A,
(Mandatory
Put
11/15/28)
5
.000
11/15/52
634,624
1,100,000
Minneapolis,
Minnesota,
Health
Care
System
Revenue
Bonds,
Fairview
Health
Services,
Series
2015A
5
.000
11/15/29
1,111,883
1,000,000
Minneapolis,
Minnesota,
Health
Care
System
Revenue
Bonds,
Fairview
Health
Services,
Series
2015A
5
.000
11/15/30
1,010,535
2,200,000
Minneapolis,
Minnesota,
Health
Care
System
Revenue
Bonds,
Fairview
Health
Services,
Series
2015A
5
.000
11/15/33
2,219,549
2,390,000
Minneapolis,
Minnesota,
Health
Care
System
Revenue
Bonds,
Fairview
Health
Services,
Series
2018A
5
.000
11/15/35
2,491,234
2,850,000
Minneapolis,
Minnesota,
Health
Care
System
Revenue
Bonds,
Fairview
Health
Services,
Series
2018A
5
.000
11/15/36
2,965,703
PRINCIPAL
DESCRIPTION
RATE
MATURITY
VALUE
HEALTH
CARE
(continued)
$
2,060,000
Rochester,
Minnesota,
Health
Care
Facilities
Revenue
Bonds,
Mayo
Clinic,
Refunding
Series
2016B
5
.000
%
11/15/29
$
2,274,991
1,000,000
Rochester,
Minnesota,
Health
Care
Facilities
Revenue
Bonds,
Mayo
Clinic,
Refunding
Series
2016B
5
.000
11/15/33
1,162,161
1,000,000
Saint
Cloud,
Minnesota,
Health
Care
Revenue
Bonds,
CentraCare
Health
System,
Series
2016A
5
.000
05/01/46
1,015,294
1,575,000
Saint
Cloud,
Minnesota,
Health
Care
Revenue
Bonds,
CentraCare
Health
System,
Series
2019
5
.000
05/01/48
1,646,050
1,000,000
Saint
Cloud,
Minnesota,
Health
Care
Revenue
Bonds,
CentraCare
Health
System,
Series
2024
5
.000
05/01/39
1,124,516
3,225,000
Saint
Paul
Housing
and
Redevelopment
Authority,
Minnesota,
Health
Care
Facility
Revenue
Bonds,
HealthPartners
Obligated
Group,
Refunding
Series
2015A
5
.000
07/01/28
3,250,309
6,200,000
Saint
Paul
Housing
and
Redevelopment
Authority,
Minnesota,
Health
Care
Facility
Revenue
Bonds,
HealthPartners
Obligated
Group,
Refunding
Series
2015A
5
.000
07/01/29
6,248,164
1,000,000
Saint
Paul
Housing
and
Redevelopment
Authority,
Minnesota,
Health
Care
Facility
Revenue
Bonds,
HealthPartners
Obligated
Group,
Refunding
Series
2015A
5
.000
07/01/32
1,006,881
1,000,000
Saint
Paul
Housing
and
Redevelopment
Authority,
Minnesota,
Health
Care
Facility
Revenue
Bonds,
HealthPartners
Obligated
Group,
Refunding
Series
2015A
4
.000
07/01/35
1,000,646
1,560,000
Saint
Paul
Housing
and
Redevelopment
Authority,
Minnesota,
Health
Care
Revenue
Bonds,
Fairview
Health
Services,
Series
2017A
5
.000
11/15/26
1,606,428
1,000,000
Saint
Paul
Housing
and
Redevelopment
Authority,
Minnesota,
Health
Care
Revenue
Bonds,
Fairview
Health
Services,
Series
2017A
5
.000
11/15/34
1,030,920
1,745,000
Saint
Paul
Housing
and
Redevelopment
Authority,
Minnesota,
Health
Care
Revenue
Bonds,
Fairview
Health
Services,
Series
2017A
4
.000
11/15/35
1,732,071
1,000,000
Saint
Paul
Housing
and
Redevelopment
Authority,
Minnesota,
Health
Care
Revenue
Bonds,
Fairview
Health
Services,
Series
2017A
4
.000
11/15/37
981,433
1,200,000
Shakopee,
Minnesota,
Health
Care
Facilities
Revenue
Bonds,
Saint
Francis
Regional
Medical
Center,
Refunding
Series
2014
5
.000
09/01/27
1,200,888
1,140,000
Shakopee,
Minnesota,
Health
Care
Facilities
Revenue
Bonds,
Saint
Francis
Regional
Medical
Center,
Refunding
Series
2014
5
.000
09/01/29
1,140,694
TOTAL
HEALTH
CARE
55,882,314
HOUSING/MULTIFAMILY
-
0.2%
500,000
Mounds
View,
Minnesota,
Multifamily
Housing
Revenue
Bonds,
Sherman
Forbes
Project
Series
2023B,
(Mandatory
Put
5/01/25)
5
.375
05/01/27
500,068
TOTAL
HOUSING/MULTIFAMILY
500,068
HOUSING/SINGLE
FAMILY
-
0.4%
75,000
Dakota
County
Community
Development
Agency,
Minnesota,
Single
Family
Mortgage
Revenue
Bonds,
Mortgage
Backed
Securities
Program,
Series
2011A
4
.400
12/01/26
75,013
120,000
Minnesota
Housing
Finance
Agency,
Residential
Housing
Finance
Bonds,
Series
2014C
3
.100
07/01/26
119,095
670,000
Minnesota
Housing
Finance
Agency,
Residential
Housing
Finance
Bonds,
Series
2020E
1
.850
01/01/29
614,051
400,000
Minnesota
Housing
Finance
Agency,
Residential
Housing
Finance
Bonds,
Series
2020E
1
.900
07/01/29
364,058
TOTAL
HOUSING/SINGLE
FAMILY
1,172,217
INDUSTRIALS
-
0.2%
815,000
Minneapolis,
Minnesota,
Limited
Tax
Supported
Development
Revenue
Bonds, Common
Bond
Fund
Series
2013-1
4
.000
06/01/28
813,794
TOTAL
INDUSTRIALS
813,794
Portfolio
of
Investments
November
30,
2024
(continued)
Minnesota
Intermediate
Municipal
Bond
PRINCIPAL
DESCRIPTION
RATE
MATURITY
VALUE
LONG-TERM
CARE
-
9.0%
$
250,000
Anoka,
Minnesota,
Housing
Revenue
Bonds,
The
Homestead
at
Anoka,
Inc.
Project,
Refunding
Series
2017
5
.000
%
11/01/46
$
231,782
1,000,000
Apple
Valley,
Minnesota,
Senior
Housing
Revenue
Bonds,
PHS
Apple
Valley
Senior
Housing,
Inc.
Orchard
Path
Project,
Refunding
Series
2018
4
.250
09/01/38
993,768
750,000
Bethel,
Minnesota,
Housing
and
Health
Care
Facilities
Revenue
Bonds,
Ecumen
Obligated
Group
Series
2024A
5
.250
03/01/34
776,656
1,000,000
Center
City,
Minnesota,
Health
Care
Facilities
Revenue
Bonds,
Hazelden
Betty
Ford
Foundation
Project,
Series
2014
5
.000
11/01/25
1,000,876
100,000
Chatfield,
Minnesota,
Healthcare
and
Housing
Facilities
Revenue
Bonds,
Chosen
Valley
Care
Center
Project,
Refunding
Series
2019
4
.000
09/01/29
95,732
100,000
Chatfield,
Minnesota,
Healthcare
and
Housing
Facilities
Revenue
Bonds,
Chosen
Valley
Care
Center
Project,
Refunding
Series
2019
4
.000
09/01/30
95,100
100,000
Chatfield,
Minnesota,
Healthcare
and
Housing
Facilities
Revenue
Bonds,
Chosen
Valley
Care
Center
Project,
Refunding
Series
2019
4
.000
09/01/31
94,436
100,000
Chatfield,
Minnesota,
Healthcare
and
Housing
Facilities
Revenue
Bonds,
Chosen
Valley
Care
Center
Project,
Refunding
Series
2019
4
.000
09/01/32
93,758
155,000
Chatfield,
Minnesota,
Healthcare
and
Housing
Facilities
Revenue
Bonds,
Chosen
Valley
Care
Center
Project,
Refunding
Series
2019
4
.000
09/01/33
144,220
100,000
Chatfield,
Minnesota,
Healthcare
and
Housing
Facilities
Revenue
Bonds,
Chosen
Valley
Care
Center
Project,
Refunding
Series
2019
4
.000
09/01/34
92,353
815,000
Chisago
City,
Minnesota,
Housing
and
Health
Care
Revenue
Bonds,
CDL
Homes,
LLC
Project,
Series
2013B
6
.000
08/01/33
815,519
325,000
City
of
Vergas,
Minnesota,
Housing
and
Health
Care
Revenue
Bonds,
CDL
Homes,
LLC
Project,
Refunding
Series
2016
4
.000
08/01/31
299,797
235,000
Cold
Spring,
Minnesota,
Health
Care
Facilities
Revenue
Bonds,
Assumption
Home,
Inc.,
Refunding
Series
2017
4
.450
03/01/31
224,838
200,000
Cold
Spring,
Minnesota,
Health
Care
Facilities
Revenue
Bonds,
Assumption
Home,
Inc.,
Refunding
Series
2018
4
.500
09/01/33
188,232
1,000,000
Columbus,
Minnesota,
Senior
Housing
Revenue
Bonds,
Richfield
Senior
Housing,
Inc.,
Refunding
Series
2015
4
.600
01/01/27
971,055
500,000
Columbus,
Minnesota,
Senior
Housing
Revenue
Bonds,
Richfield
Senior
Housing,
Inc.,
Refunding
Series
2015
5
.000
01/01/34
452,326
1,000,000
Cuyuna
Range
Hospital
District,
Minnesota,
Health
Care
Facilities
Revenue
Bonds,
Crosby
Senior
Service
Care
Center,
Series
2023
5
.500
05/01/43
1,050,589
2,385,000
(a)
Dakota
County
Community
Development
Agency,
Minnesota,
Senior
Housing
Revenue
Bonds,
Walker
Highview
Hills
LLC
Project,
Refunding
Series
2016A
3
.875
08/01/29
2,364,322
1,100,000
(a)
Dakota
County
Community
Development
Agency,
Minnesota,
Senior
Housing
Revenue
Bonds,
Walker
Highview
Hills
LLC
Project,
Refunding
Series
2016A
5
.000
08/01/36
1,100,467
500,000
Dennison,
Minnesota,
Senior
Housing
Revenue
Bonds,
Villages
of
Lonsdale,
LLC
Project,
Series
2019
4
.200
05/01/35
438,094
200,000
Maple
Plain,
Minnesota
Senior
Housing
and
Healthcare
Revenue
Bonds,
Haven
Homes,
Inc.
Project,
Series
2019
4
.000
07/01/32
194,885
100,000
Mapleton,
Minnesota,
Healthcare
Facility
Revenue
Bonds,
Mapleton
Community
Home,
Refunding
Series
2019
3
.750
05/01/34
91,265
425,000
Minneapolis,
Minnesota,
Senior
Housing
and
Healthcare
Revenue
Bonds,
Ecumen
Abiitan
Mill
City
Project, Series
2015
4
.750
11/01/28
418,877
750,000
Minneapolis,
Minnesota,
Senior
Housing
and
Healthcare
Revenue
Bonds,
Ecumen
Abiitan
Mill
City
Project, Series
2015
5
.250
11/01/45
717,854
100,000
Morris,
Minnesota,
Health
Care
Facilities
Revenue
Bonds,
Farmington
Health
Services
Project,
Refunding
Series
2019
3
.100
08/01/25
98,853
775,000
Rochester,
Minnesota,
Health
Care
and
Housing
Revenue
Bonds,
Samaritan
Bethany,
Inc.
Project,
Refunding
Series
2017A
3
.875
08/01/26
762,293
805,000
Rochester,
Minnesota,
Health
Care
and
Housing
Revenue
Bonds,
Samaritan
Bethany,
Inc.
Project,
Refunding
Series
2017A
4
.000
08/01/27
785,892
2,000,000
Rochester,
Minnesota,
Health
Care
and
Housing
Revenue
Bonds,
Samaritan
Bethany,
Inc.
Project,
Refunding
Series
2017A
4
.000
08/01/30
1,891,895
PRINCIPAL
DESCRIPTION
RATE
MATURITY
VALUE
LONG-TERM
CARE
(continued)
$
405,000
Saint
Joseph,
Minnesota,
Senior
Housing
and
Healthcare
Revenue
Bonds,
Woodcrest
of
Country
Manor
Project,
Series
2019
A
4
.000
%
07/01/33
$
389,031
1,000,000
Saint
Louis
Park,
Minnesota,
Health
Care
Facilities
Revenue
Bonds,
Mount
Olivet
Careview
Home
Project,
Series
2016B
4
.350
06/01/36
962,301
2,415,000
Saint
Paul
Housing
and
Redevelopment
Authority
Minnesota,
Senior
Housing
and
Health
Care
Revenue
Bonds,
Episcopal
Homes
Project,
Series
2013
5
.000
05/01/33
2,375,858
500,000
Saint
Paul
Housing
and
Redevelopment
Authority,
Minnesota,
Revenue
Bonds,
Amherst
H.
Wilder
Foundation
Project,
Refunding
Series
2020A
5
.000
12/01/25
505,915
1,015,000
Saint
Paul
Housing
and
Redevelopment
Authority,
Minnesota,
Revenue
Bonds,
Amherst
H.
Wilder
Foundation
Project,
Refunding
Series
2020A
5
.000
12/01/26
1,043,332
160,000
(a)
Saint
Paul
Housing
and
Redevelopment
Authority,
Minnesota,
Senior
Housing
and
Health
Care
Revenue
Bonds,
Episcopal
Church
Homes
Project,
Refunding
Senior
Series
2021A
3
.100
11/01/31
146,798
625,000
(a)
Saint
Paul
Housing
and
Redevelopment
Authority,
Minnesota,
Senior
Housing
and
Health
Care
Revenue
Bonds,
Episcopal
Church
Homes
Project,
Refunding
Senior
Series
2021A
3
.150
11/01/32
567,315
500,000
Saint
Paul
Park,
Minnesota,
Senior
Housing
and
Health
Care
Revenue
Bonds,
Presbyterian
Homes
Bloomington
Project,
Refunding
Series
2017
3
.250
09/01/26
493,795
550,000
Saint
Paul
Park,
Minnesota,
Senior
Housing
and
Health
Care
Revenue
Bonds,
Presbyterian
Homes
Bloomington
Project,
Refunding
Series
2017
3
.700
09/01/28
543,344
350,000
Saint
Paul
Park,
Minnesota,
Senior
Housing
and
Health
Care
Revenue
Bonds,
Presbyterian
Homes
Bloomington
Project,
Refunding
Series
2017
3
.800
09/01/29
346,090
565,000
Saint
Paul
Park,
Minnesota,
Senior
Housing
and
Health
Care
Revenue
Bonds,
Presbyterian
Homes
Bloomington
Project,
Refunding
Series
2017
3
.900
09/01/30
560,094
320,000
Saint
Paul
Park,
Minnesota,
Senior
Housing
and
Health
Care
Revenue
Bonds,
Presbyterian
Homes
Bloomington
Project,
Refunding
Series
2017
4
.125
09/01/34
318,839
1,000,000
Sartell,
Minnesota,
Health
Care
Facilities
Revenue
Bonds,
Country
Manor
Campus
LLC
Project,
Refunding
Series
2017
5
.000
09/01/27
1,012,975
2,395,000
Sauk
Rapids,
Minnesota,
Health
Care
and
Housing
Facilities
Revenue
Bonds,
Good
Shepherd
Luthran
Home,
Refunding
Series
2013
5
.125
01/01/39
2,170,017
120,000
Scanlon,
Minnesota,
Health
Care
Facilities
Revenue
Bonds,
Duluth
Health
Services
Project,
Refunding
Series
2020
2
.700
03/01/26
115,027
335,000
Scanlon,
Minnesota,
Health
Care
Facilities
Revenue
Bonds,
Duluth
Health
Services
Project,
Refunding
Series
2020
2
.950
03/01/28
309,965
175,000
Wayzata,
Minnesota
Senior
Housing
Revenue
Bonds,
Folkestone
Senior
Living
Community,
Refunding
Series
2019
3
.000
08/01/27
171,653
300,000
Wayzata,
Minnesota
Senior
Housing
Revenue
Bonds,
Folkestone
Senior
Living
Community,
Refunding
Series
2019
3
.125
08/01/28
293,728
300,000
Wayzata,
Minnesota
Senior
Housing
Revenue
Bonds,
Folkestone
Senior
Living
Community,
Refunding
Series
2019
3
.250
08/01/29
293,878
225,000
Wayzata,
Minnesota
Senior
Housing
Revenue
Bonds,
Folkestone
Senior
Living
Community,
Refunding
Series
2019
3
.375
08/01/30
220,497
TOTAL
LONG-TERM
CARE
29,326,186
TAX
OBLIGATION/GENERAL
-
30.2%
355,000
Alexandria,
Minnesota,
General
Obligation
Bonds,
Tax
Abatement
Series
2024A
5
.000
02/01/40
399,256
530,000
Alexandria,
Minnesota,
General
Obligation
Bonds,
Tax
Abatement
Series
2024A
5
.000
02/01/41
590,753
280,000
Alexandria,
Minnesota,
General
Obligation
Bonds,
Tax
Abatement
Series
2024A
5
.000
02/01/42
309,270
1,355,000
Anoka-Hennepin
Independent
School
District
11,
Coon
Rapids,
Minnesota,
General
Obligation
Bonds,
School
Building
Series
2020A
3
.000
02/01/34
1,303,281
1,405,000
Benson
Independent
School
District
777,
Minnesota,
General
Olibation
Bonds,
School
Building
Series
2018A
4
.000
02/01/32
1,444,684
Portfolio
of
Investments
November
30,
2024
(continued)
Minnesota
Intermediate
Municipal
Bond
PRINCIPAL
DESCRIPTION
RATE
MATURITY
VALUE
TAX
OBLIGATION/GENERAL
(continued)
$
3,280,000
Brainerd
Independent
School
District
181,
Crow
Wing
County,
Minnesota,
General
Obligation
Bonds,
School
Building
Series
2018A
4
.000
%
02/01/30
$
3,363,490
1,000,000
Brainerd
Independent
School
District
181,
Crow
Wing
County,
Minnesota,
General
Obligation
Bonds,
School
Building
Series
2018A
4
.000
02/01/33
1,025,491
2,145,000
Brooklyn
Center
Independent
School
District
286,
Minnesota,
General
Obligation
Bonds,
Series
2018A
4
.000
02/01/35
2,188,941
1,720,000
Brooklyn
Center
Independent
School
District
286,
Minnesota,
General
Obligation
Bonds,
Series
2018A
4
.000
02/01/37
1,752,231
2,000,000
Buffalo,
Minnesota,
Water
and
Sewer
Revenue
Bonds,
Refunding
Series
2014A
-
BAM
Insured
4
.000
11/01/28
2,000,049
2,380,000
City
of
Rosemount,
Minnesota,
General
Obligation
Bonds,
Street
Reconstruction
and
Capital
Improvement
Plan
Series
2023A
4
.000
02/01/45
2,405,879
1,000,000
Cloquet
Independent
School
District
94,
Carlton
and
Sant
Louis
Counties,
Minnesota,
General
Obligation
Bonds,
School
Building
Series
2015B
4
.000
02/01/36
1,001,174
1,250,000
Detroit
Lakes
Independent
School
District
22,
Becker
and
Otter
Tail
Counties,
Minnesota,
General
Obligation
Bonds,
School
Building
Series
2019A
4
.000
02/01/30
1,287,932
1,515,000
Dover-Eyota
Independent
School
District
533,
Minnesota,
General
Obligation
Bonds,
School
Building
Facilities
Maintenance
Series
2023A
4
.000
02/01/42
1,536,130
1,450,000
Dover-Eyota
Independent
School
District
533,
Minnesota,
General
Obligation
Bonds,
School
Building
Facilities
Maintenance
Series
2023A
4
.000
02/01/45
1,461,154
1,270,000
Duluth
Independent
School
District
709,
Saint
Louis
County,
Minnesota,
General
Obligation
Bonds,
Capital
Appreciation
Series
2021C
0
.000
02/01/30
1,017,039
2,590,000
Edgerton
Independent
School
District
581,
Minnesota,
General
Obligation
Bonds,
School
Building
Series
2024A
5
.000
02/01/38
2,909,606
3,150,000
Elk
River
Independent
School
District
728,
Minnesota,
General
Obligation
Bonds,
Facilities
Maintenance
Series
2019A
4
.000
02/01/31
3,244,991
2,460,000
Forest
Lake,
Washington
County,
Minnesota,
General
Obligation
Bonds,
Series
2019A
4
.000
02/01/32
2,572,867
1,725,000
GFW
Independent
School
District
No.
2365,
Sibley,
Renville,
McLeod
and
Nicollet
Counties,
Minnesota,
General
Obligation
School
Building
Bonds,
Series
2023A
5
.000
02/01/43
1,870,626
1,485,000
Goodhue
Independent
School
District
253,
Minnesota,
General
Obligation
Bonds,
School
Building
Series
2019A
4
.000
02/01/30
1,541,210
1,345,000
Greenway
Independent
School
District
316,
Itasca
County,
Minnesota,
General
Obligation
Bonds,
Facilities
Maintenance
Series
2019F
0
.000
02/01/28
1,206,640
2,000,000
Hennepin
County
Regional
Railroad
Authority,
Minnesota,
General
Obligation
Bonds,
Limited
Tax
Series
2019A
5
.000
12/01/37
2,142,661
5,295,000
Hennepin
County,
Minnesota,
General
Obligation
Bonds,
Series
2021A
5
.000
12/01/33
6,030,896
2,500,000
Hennepin
County,
Minnesota,
General
Obligation
Bonds,
Series
2024A
5
.000
12/01/42
2,878,464
1,500,000
Hennepin
County,
Minnesota,
General
Obligation
Bonds,
Series
2024A
5
.000
12/01/43
1,719,774
1,555,000
Independent
School
District
No.
2397
(Le
Sueur-Henderson),
Minnesota,
General
Obligation
School
Building
Bonds,
Series
2022A
5
.000
02/01/35
1,739,591
1,200,000
Jordan
Independent
School
District
717,
Scott
County,
Minnesota,
General
Obligation
Bonds,
School
Building
Series
2023A
5
.000
02/01/37
1,325,359
1,000,000
Jordan
Independent
School
District
717,
Scott
County,
Minnesota,
General
Obligation
Bonds,
School
Building
Series
2023A
5
.000
02/01/39
1,088,902
210,000
Medicine
Lake,
Minnesota,
General
Obligation
Bonds,
Series
2024A
5
.000
02/01/35
222,264
330,000
Medicine
Lake,
Minnesota,
General
Obligation
Bonds,
Series
2024A
5
.000
02/01/39
344,982
PRINCIPAL
DESCRIPTION
RATE
MATURITY
VALUE
TAX
OBLIGATION/GENERAL
(continued)
$
2,595,000
Minneapolis
Special
School
District
1,
Hennepin
County,
Minnesota,
General
Obligation
Bonds,
Long-Term
Facilities
Maintenance
Series
2017B
4
.000
%
02/01/32
$
2,659,775
1,480,000
Minneapolis,
Minnesota,
General
Obligation
Bonds,
Improvement
&
Various
Purpose
Series
2018
4
.000
12/01/33
1,512,840
500,000
Minneapolis,
Minnesota,
General
Obligation
Bonds,
Improvement
&
Various
Purpose
Series
2018
4
.000
12/01/35
509,460
5,100,000
Minnesota
State,
General
Obligation
Bonds,
Various
Purpose
Series
2021A
4
.000
09/01/38
5,316,883
210,000
Minnetonka
Independent
School
District
276,
Hennepin
County,
Minnesota,
General
Obligation
Bonds,
Facilities
Maintenance
Series
2023B
5
.000
02/01/38
234,223
500,000
Minnetonka
Independent
School
District
276,
Hennepin
County,
Minnesota,
General
Obligation
Bonds,
Facilities
Maintenance
Series
2023B
5
.000
02/01/44
543,272
1,475,000
Moose
Lake
Independent
School
District
97,
Carlton
and
Pine
Counties,
Minnesota,
General
Obligation
Bonds,
School
Buidling
Series
2015A
4
.000
02/01/30
1,478,070
2,050,000
North
Branch
Independent
School
District
138,
Chisago
County,
Minnesota,
General
Obligation
Bonds,
School
Building
Series
2017A
4
.000
02/01/30
2,109,151
850,000
North
Saint
Paul-Maplewood-Oakdale
Independent
School
District
622,
Ramsey
County,
Minnesota,
General
Obligation
Bonds,
Facilities
Maintenance
Series
2018A
3
.375
02/01/35
851,527
1,185,000
Northland
Independent
School
District
118,
Minnesota,
General
Obligation
Bonds,
Series
2016A
3
.000
02/01/29
1,171,051
1,500,000
Osseo
Independent
School
District
279
Hennepin
County,
Minnesota,
General
Obligation
Bonds,
Facilities
Maintenance
Series
2018B
4
.000
02/01/34
1,533,059
1,035,000
Perham
Dent
Independent
School
District
549,
Minnesota,
General
Obligation
Bonds,
School
Building
Series
2016A
3
.000
02/01/30
1,019,674
880,000
Plainview-Elgin-Millville
Independent
School
District
2899,
Minnesota,
General
Obligation
Bonds,
School
Building
Series
2019A
4
.000
02/01/32
914,076
2,665,000
Ramsey
County,
Minnesota,
General
Obligation
Bonds,
Capital
Improvement
Plan,
Series
2023B
4
.000
02/01/41
2,756,422
1,250,000
Robbinsdale
Independent
School
District
281,
Hennepin
County,
Minnesota,
General
Obligation
Bonds,
Facilities
Maintenance
Series
2018A
3
.000
02/01/30
1,254,076
4,535,000
Roseville
Independent
School
District
623,
Ramsey
County,
Minnesota,
General
Obligation
Bonds,
School
Building
Series
2018A
4
.000
02/01/34
4,647,417
1,070,000
Round
Lake-Brewster
Independent
School
District
2907,
Minnesota,
General
Obligation
Bonds,
School
Building
Series
2023A
5
.000
02/01/40
1,172,231
1,100,000
Saint
Cloud
Independent
School
District
742,
Stearns
County,
Minnesota,
General
Obligation
Bonds,
Series
2015A
4
.000
02/01/30
1,101,706
1,075,000
Saint
Louis
Park
Independent
School
District
283,
Hennepin
County,
Minnesota,
General
Obligation
Bonds,
School
Building
Series
2022A
5
.000
02/01/37
1,186,667
1,225,000
Saint
Michael
Independent
School
District
885,
Wright
County,
Minnesota,
General
Obligation
Bonds,
School
Building
Series
2017A
3
.200
02/01/32
1,229,096
1,700,000
Sartell,
Minnesota,
General
Obligation
Bonds,
Series
2022A
4
.000
02/01/39
1,741,205
1,330,000
South
Washington
County
Independent
School
District
833,
Minnesota,
General
Obligation
Bonds,
Facilities
Maintenance
Series
2018A
4
.000
02/01/31
1,357,979
2,000,000
South
Washington
County
Independent
School
District
833,
Minnesota,
General
Obligation
Bonds,
Facilities
Maintenance
Series
2022A
4
.000
02/01/35
2,067,329
2,000,000
South
Washington
County
Independent
School
District
833,
Minnesota,
General
Obligation
Bonds,
School
Building
Series
2016A
4
.000
02/01/29
2,023,358
915,000
Southland
Independent
School
District
500,
Minnesota,
General
Obligation
Bonds,
School
Building
Series
2019A
4
.000
02/01/31
936,922
Portfolio
of
Investments
November
30,
2024
(continued)
Minnesota
Intermediate
Municipal
Bond
PRINCIPAL
DESCRIPTION
RATE
MATURITY
VALUE
TAX
OBLIGATION/GENERAL
(continued)
$
975,000
Todd
Morrison
and
Stern
Counties,
Minnesota,
Independent
School
District,
General
Obligation
Bonds,
Facilities
Maintenance
and
Refunding
Series
2024A
5
.000
%
02/01/35
$
1,094,484
2,415,000
Watertown-Mayer
Independent
School
District
111,
Carver,
Hennepin
and
Wright
Counties,
Minnesota,
General
Obligation
Bonds,
School
Building
Series
2020A
0
.000
02/01/31
1,892,992
TOTAL
TAX
OBLIGATION/GENERAL
98,240,532
TAX
OBLIGATION/LIMITED
-
11.6%
55,000
Elbow
Lake
Economic
Development
Authority,
Minnesota,
Lease
Revenue
Bonds,
Grant
County
Public
Project,
Series
2017A
4
.000
12/15/37
53,796
2,570,000
Marshall,
Minnesota,
Education
Services
Facility,
Lease
Revenue
Bonds,
Southwest
West
Central
Service
Cooperatives,
Series
2024A
5
.000
02/01/37
2,661,382
1,475,000
Minneapolis
Special
School
District
1,
Hennepin
County,
Minnesota,
Certificates
of
Participation,
Full
Term
Series
2015D
3
.000
02/01/29
1,471,140
1,000,000
Minneapolis
Special
School
District
1,
Hennepin
County,
Minnesota,
Certificates
of
Participation,
Full
Term
Series
2017C
4
.000
02/01/30
1,029,577
360,000
Minneapolis,
Minnesota,
Tax
Incriment
Revenue
Bonds,
Ivy
Tower
Project,
Series
2015
4
.000
03/01/25
359,684
500,000
Minneapolis,
Minnesota,
Tax
Incriment
Revenue
Bonds,
Ivy
Tower
Project,
Series
2015
5
.000
03/01/29
500,175
1,170,000
Minnesota
Housing
Finance
Agency,
Housing
Infrastructure
State
Appropriation
Bonds,
Series
2015C
4
.000
08/01/27
1,170,163
960,000
Minnesota
Housing
Finance
Agency,
Housing
Infrastructure
State
Appropriation
Bonds,
Series
2018D
4
.000
08/01/34
983,370
3,105,000
Minnesota
Housing
Finance
Agency,
Housing
Infrastructure
State
Appropriation
Bonds,
Series
2020B
4
.000
08/01/32
3,240,643
205,000
Minnesota
Housing
Finance
Agency,
Housing
Infrastructure
State
Appropriation
Bonds,
Series
2021B
3
.000
08/01/37
192,208
3,295,000
Minnesota
Housing
Finance
Agency,
Housing
Infrastructure
State
Appropriation
Bonds,
Series
2021C
4
.000
08/01/39
3,346,342
2,385,000
Minnesota
Housing
Finance
Agency,
Housing
Infrastructure
State
Appropriation
Bonds,
Series
2021C
4
.000
08/01/40
2,413,226
2,000,000
Minnesota
Housing
Finance
Agency,
Housing
Infrastructure
State
Appropriation
Bonds,
Series
2022C
5
.000
08/01/42
2,196,282
1,375,000
Minnesota
Housing
Finance
Agency,
Housing
Infrastructure
State
Appropriation
Bonds,
Series
2023A
5
.000
08/01/43
1,504,267
1,185,000
Minnesota
Housing
Finance
Agency,
Nonprofit
Housing
Bonds,
State
Appropriation
Series
2011
5
.250
08/01/27
1,191,075
445,000
New
London
Economic
Development
Authority,
Minnesota,
Lease
Revenue
Bonds,
SWWC
Service
Cooperative
Lease
With
Option
to
Purchase
Project,
Public
Series
2023
5
.000
02/01/27
458,586
470,000
New
London
Economic
Development
Authority,
Minnesota,
Lease
Revenue
Bonds,
SWWC
Service
Cooperative
Lease
With
Option
to
Purchase
Project,
Public
Series
2023
5
.000
02/01/28
489,202
605,000
Northeast
Metropolitan
Intermediate
School
District
916,
White
Bear
Lake,
Minnesota,
Certificates
of
Particpation,
Series
2015B
3
.125
02/01/29
605,044
350,000
Northeast
Metropolitan
Intermediate
School
District
916,
White
Bear
Lake,
Minnesota,
Certificates
of
Particpation,
Series
2015B
3
.250
02/01/30
349,997
1,215,000
Roseville
Independent
School
District
623,
Ramsey
County,
Minnesota,
Certificates
of
Participation,
Series
2021A
5
.000
04/01/30
1,291,755
630,000
Saint
Cloud
Independent
School
District
742,
Stearns
County,
Minnesota,
Certificates
of
Participation,
Saint
Cloud
Area
Public
Schools,
Series
2017A
5
.000
02/01/30
631,911
725,000
Saint
Cloud
Independent
School
District
742,
Stearns
County,
Minnesota,
Certificates
of
Participation,
Saint
Cloud
Area
Public
Schools,
Series
2017A
4
.000
02/01/38
725,260
1,685,000
Saint
Paul
Independent
School
District
625,
Ramsey
County,
Minnesota,
Certificates
of
Participation,
Series
2018B
3
.250
02/01/33
1,687,289
290,000
Saint
Paul
Independent
School
District
625,
Ramsey
County,
Minnesota,
Certificates
of
Participation,
Series
2020C
3
.000
02/01/36
280,599
1,000,000
Saint
Paul
Independent
School
District
625,
Ramsey
County,
Minnesota,
Certificates
of
Participation,
Series
2024A
5
.000
02/01/37
1,149,407
PRINCIPAL
DESCRIPTION
RATE
MATURITY
VALUE
TAX
OBLIGATION/LIMITED
(continued)
$
500,000
Saint
Paul
Independent
School
District
625,
Ramsey
County,
Minnesota,
Certificates
of
Participation,
Series
2024A
5
.000
%
02/01/38
$
572,362
1,000,000
Saint
Paul
Independent
School
District
625,
Ramsey
County,
Minnesota,
Certificates
of
Participation,
Series
2024A
5
.000
02/01/39
1,136,862
1,810,000
Saint
Paul,
Minnesota,
Sales
Tax
Revenue
Bonds,
Neighborhood
and
Economic
Development
Projects,
Refunding
Series
2024C
5
.000
11/01/41
2,026,907
3,500,000
Virginia
Housing
and
Redevelopment
Authority,
Minnesota,
Health
Care
Facility
Lease
Revenue
Bonds,
Refunding
Series
2018A
4
.000
10/01/29
3,483,147
280,000
Zumbro
Education
District
6012,
Minnesota,
Certificates
of
Participation
Series
2021A
4
.000
02/01/32
275,900
250,000
Zumbro
Education
District
6012,
Minnesota,
Certificates
of
Participation
Series
2021A
4
.000
02/01/34
244,055
175,000
Zumbro
Education
District
6012,
Minnesota,
Certificates
of
Participation
Series
2021A
4
.000
02/01/38
165,912
TOTAL
TAX
OBLIGATION/LIMITED
37,887,525
TRANSPORTATION
-
7.8%
1,000,000
Minneapolis-St.
Paul
Metropolitan
Airports
Commission,
Minnesota,
Airport
Revenue
Bonds,
Refunding
Subordinate
Lien
Series
2019A
5
.000
01/01/33
1,083,253
1,250,000
Minneapolis-St.
Paul
Metropolitan
Airports
Commission,
Minnesota,
Airport
Revenue
Bonds,
Refunding
Subordinate
Lien
Series
2019B,
(AMT)
5
.000
01/01/28
1,308,016
1,735,000
Minneapolis-St.
Paul
Metropolitan
Airports
Commission,
Minnesota,
Airport
Revenue
Bonds,
Refunding
Subordinate
Lien
Series
2019B,
(AMT)
5
.000
01/01/30
1,841,527
1,000,000
Minneapolis-St.
Paul
Metropolitan
Airports
Commission,
Minnesota,
Airport
Revenue
Bonds,
Refunding
Subordinate
Lien
Series
2019B,
(AMT)
5
.000
01/01/32
1,055,811
1,000,000
Minneapolis-St.
Paul
Metropolitan
Airports
Commission,
Minnesota,
Airport
Revenue
Bonds,
Refunding
Subordinate
Lien
Series
2019B,
(AMT)
5
.000
01/01/44
1,030,424
3,580,000
Minneapolis-St.
Paul
Metropolitan
Airports
Commission,
Minnesota,
Airport
Revenue
Bonds,
Refunding
Subordinate
Lien
Series
2019B,
(AMT)
5
.000
01/01/49
3,692,857
1,050,000
Minneapolis-St.
Paul
Metropolitan
Airports
Commission,
Minnesota,
Airport
Revenue
Bonds,
Senior
Lien
Series
2016C
5
.000
01/01/34
1,090,244
1,130,000
Minneapolis-St.
Paul
Metropolitan
Airports
Commission,
Minnesota,
Airport
Revenue
Bonds,
Senior
Lien
Series
2016C
5
.000
01/01/41
1,163,586
2,980,000
Minneapolis-St.
Paul
Metropolitan
Airports
Commission,
Minnesota,
Airport
Revenue
Bonds,
Subordinate
Lien
Series
2022B,
(AMT)
5
.000
01/01/29
3,157,228
1,000,000
Minneapolis-St.
Paul
Metropolitan
Airports
Commission,
Minnesota,
Airport
Revenue
Bonds,
Subordinate
Lien
Series
2022B,
(AMT)
5
.000
01/01/32
1,085,837
2,325,000
Minneapolis-St.
Paul
Metropolitan
Airports
Commission,
Minnesota,
Airport
Revenue
Bonds,
Subordinate
Lien
Series
2022B,
(AMT)
5
.000
01/01/33
2,520,932
855,000
Minneapolis-St.
Paul
Metropolitan
Airports
Commission,
Minnesota,
Airport
Revenue
Bonds,
Subordinate
Lien
Series
2022B,
(AMT)
5
.000
01/01/35
922,706
2,000,000
Minneapolis-St.
Paul
Metropolitan
Airports
Commission,
Minnesota,
Airport
Revenue
Bonds,
Subordinate
Lien
Series
2022B,
(AMT)
5
.250
01/01/47
2,139,625
3,000,000
Minneapolis-St.
Paul
Metropolitan
Airports
Commission,
Minnesota,
Airport
Revenue
Bonds,
Subordinate
Series
2024A,
(AMT)
5
.000
01/01/43
3,195,869
TOTAL
TRANSPORTATION
25,287,915
U.S.
GUARANTEED
-
0.3%
(b)
1,100,000
St.
Paul
Housing
and
Redevelopment
Authority,
Minnesota,
Hospital
Revenue
Bonds,
HealthEast
Inc.,
Series
2015A,
(Pre-
refunded
11/15/25)
5
.000
11/15/29
1,120,407
TOTAL
U.S.
GUARANTEED
1,120,407
Portfolio
of
Investments
November
30,
2024
(continued)
Minnesota
Intermediate
Municipal
Bond
PRINCIPAL
DESCRIPTION
RATE
MATURITY
VALUE
UTILITIES
-
4.4%
$
475,000
Brainerd,
Minnesota,
Electric
Utility
Revenue
Bonds,
Series
2014A
4
.000
%
12/01/28
$
475,468
495,000
Brainerd,
Minnesota,
Electric
Utility
Revenue
Bonds,
Series
2014A
4
.000
12/01/29
495,473
580,000
Hutchinson,
Minnesota,
Public
Utility
Revenue
Bonds,
Refunding
Series
2012A
5
.000
12/01/25
580,831
670,000
Hutchinson,
Minnesota,
Public
Utility
Revenue
Bonds,
Refunding
Series
2012A
5
.000
12/01/26
670,931
100,000
Luverne,
Minnesota,
Electric
Revenue
Bonds,
Series
2018A
4
.000
12/01/33
102,793
500,000
Minnesota
Municipal
Power
Agency,
Electric
Revenue
Bonds,
Refunding
Series
2014
5
.000
10/01/29
501,635
500,000
Minnesota
Municipal
Power
Agency,
Electric
Revenue
Bonds,
Refunding
Series
2014
5
.000
10/01/30
501,634
1,000,000
Minnesota
Municipal
Power
Agency,
Electric
Revenue
Bonds,
Refunding
Series
2014A
3
.500
10/01/28
1,000,149
750,000
Rochester,
Minnesota,
Electric
Utility
Revenue
Bonds,
Refunding
Series
2015E
3
.000
12/01/29
751,512
1,000,000
Rochester,
Minnesota,
Electric
Utility
Revenue
Bonds,
Refunding
Series
2017A
5
.000
12/01/33
1,040,185
1,070,000
Saint
Paul
Port
Authority,
Minnesota,
District
Energy
Revenue
Bonds,
Series
2017-4,
(AMT)
4
.000
10/01/40
991,159
100,000
Saint
Paul
Port
Authority,
Minnesota,
District
Energy
Revenue
Bonds,
Series
2021-1.
501
C3
3
.000
10/01/27
98,014
1,620,000
Saint
Paul
Port
Authority,
Minnesota,
District
Energy
Revenue
Bonds,
Series
2024-1
5
.000
10/01/42
1,754,848
500,000
Sauk
Centre
Public
Utilities
Commission,
Minnesota,
Electric
Revenue
Bonds,
Series
2024A
-
AGM
Insured
4
.000
12/01/37
517,115
2,500,000
Southern
Minnesota
Municipal
Power
Agency
Power
Supply
System
Revenue
Bonds,
Series
2015A
4
.000
01/01/30
2,531,884
1,335,000
Western
Minnesota
Municipal
Power
Agency,
Minnesota,
Power
Supply
Revenue
Bonds,
Refunding
Series
2015A
5
.000
01/01/31
1,363,695
1,000,000
Western
Minnesota
Municipal
Power
Agency,
Minnesota,
Power
Supply
Revenue
Bonds,
Refunding
Series
2015A
5
.000
01/01/33
1,020,208
TOTAL
UTILITIES
14,397,534
TOTAL
MUNICIPAL
BONDS
(Cost
$320,846,765)
320,827,928
TOTAL
LONG-TERM
INVESTMENTS
(Cost
$320,846,765)
320,827,928
OTHER
ASSETS
&
LIABILITIES,
NET
-
1.4%
4,561,949
NET
ASSETS
-
100%
$
325,389,877
(a)
Security
is
exempt
from
registration
under
Rule
144A
of
the
Securities
Act
of
1933,
as
amended.
These
securities
are
deemed
liquid
and
may
be
resold
in
transactions
exempt
from
registration,
which
are
normally
those
transactions
with
qualified
institutional
buyers.
As
of
the
end
of
the
reporting
period,
the
aggregate
value
of
these
securities
is
$6,524,828
or
2.0%
of
Total
Investments.
(b)
Backed
by
an
escrow
or
trust
containing
sufficient
U.S.
Government
or
U.S.
Government
agency
securities,
which
ensure
the
timely
payment
of
principal
and
interest.
AMT
Alternative
Minimum
Tax
See
Notes
to
Financial
Statements.
Portfolio
of
Investments
November
30,
2024
Minnesota
Municipal
Bond
a
(Unaudited)
PRINCIPAL
DESCRIPTION
RATE
MATURITY
VALUE
LONG-TERM
INVESTMENTS
-
97.2%
X
650,576,905
MUNICIPAL
BONDS
-
97.2%
X
–
EDUCATION
AND
CIVIC
ORGANIZATIONS
-
17.9%
$
130,000
Baytown
Township,
Minnesota
Charter
School
Lease
Revenue
Bonds,
Saint
Croix
Preparatory
Academy,
Refunding
Series
2016A
4
.250
%
08/01/46
$
118,628
290,000
Bethel,
Minnesota,
Charter
School
Lease
Revenue
Bonds,
Spectrum
High
School
Project,
Series
2024
5
.000
07/01/59
291,788
3,500,000
Brooklyn
Center,
Minnesota,
Charter
School
Lease
Revenue
Bonds,
Tesfa
International
dba
Twin
Lakes
STEM
Academy
Project,
Series
2021A
5
.250
06/15/56
2,605,917
100,000
City
of
Ham
Lake,
Minnesota,
Charter
School
Lease
Revenue
Bonds,
DaVinci
Academy
Project,Series
2016A
5
.000
07/01/36
98,914
2,000,000
City
of
Ham
Lake,
Minnesota,
Charter
School
Lease
Revenue
Bonds,
DaVinci
Academy
Project,Series
2016A
5
.000
07/01/47
1,842,384
675,000
Deephaven,
Minnesota,
Charter
School
Lease
Revenue
Bonds,
Eagle
Ridge
Academy
Project,
Series
2015A
5
.250
07/01/37
679,423
250,000
Deephaven,
Minnesota,
Charter
School
Lease
Revenue
Bonds,
Eagle
Ridge
Academy
Project,
Series
2015A
5
.250
07/01/40
251,281
500,000
Deephaven,
Minnesota,
Charter
School
Lease
Revenue
Bonds,
Eagle
Ridge
Academy
Project,
Series
2015A
5
.500
07/01/50
502,015
3,000,000
(a)
Deephaven,
Minnesota,
Charter
School
Lease
Revenue
Bonds,
Seven
Hills
Preparatory
Academy
Project,
Series
2024A
6
.125
06/15/61
3,061,757
1,025,000
Forest
Lake,
Minnesota,
Charter
School
Lease
Revenue
Bonds,
Lakes
International
Language
Academy,
Series
2014A
5
.750
08/01/44
1,025,703
1,000,000
Forest
Lake,
Minnesota,
Charter
School
Lease
Revenue
Bonds,
Lakes
International
Language
Academy,
Series
2019A
5
.375
08/01/50
1,018,686
100,000
Greenwood,
Minnesota,
Charter
School
Lease
Revenue
Bonds,
Main
Street
School
of
Performing
Arts
Project,
Series
2016A
5
.000
07/01/36
96,418
5,350,000
Ham
Lake,
Minnesota
Charter
School
Lease
Revenue
Bonds,
Parnassus
Preparatory
School
Project,
Series
2016A
5
.000
11/01/47
5,366,996
600,000
Hugo,
Minnesota,
Charter
School
Lease
Revenue
Bonds,
Noble
Academy
Project,
Series
2014A
5
.000
07/01/29
600,303
1,000,000
Hugo,
Minnesota,
Charter
School
Lease
Revenue
Bonds,
Noble
Academy
Project,
Series
2014A
5
.000
07/01/34
1,000,491
525,000
Hugo,
Minnesota,
Charter
School
Lease
Revenue
Bonds,
Noble
Academy
Project,
Series
2014A
5
.000
07/01/44
525,026
4,150,000
Independence,
Minnesota,
Charter
School
Lease
Revenue
Bonds,
Beacon
Academy
Project,
Series
2016A
5
.000
07/01/46
3,806,147
1,415,000
Independence,
Minnesota,
Charter
School
Lease
Revenue
Bonds,
Paladin
Career
&
Technical
High
School
Project,
Series
2021A
4
.000
06/01/51
1,092,964
1,450,000
Minneapolis,
Minnesota,
Charter
School
Lease
Revenue
Bonds,
Hiawatha
Academies
Project,
Series
2022A
5
.375
07/01/42
1,459,346
410,000
Minneapolis,
Minnesota,
Charter
School
Lease
Revenue
Bonds,
Northeast
College
Prep
Project,
Series
2020A
5
.000
07/01/40
369,618
100,000
Minneapolis,
Minnesota,
Charter
School
Lease
Revenue
Bonds,
Northeast
College
Prep
Project,
Series
2020A
5
.000
07/01/55
82,554
460,000
Minneapolis,
Minnesota,
Charter
School
Lease
Revenue
Bonds,
Yinghua
Academy
Project,
Series
2013A
6
.000
07/01/33
460,531
3,815,000
Minneapolis,
Minnesota,
Charter
School
Lease
Revenue
Bonds,
Yinghua
Academy
Project,
Series
2013A
6
.000
07/01/43
3,817,915
1,260,000
Minneapolis,
Minnesota,
Charter
School
Lease
Revenue
Bonds,
Yinghua
Academy
Project,
Series
2013A
6
.125
07/01/48
1,261,042
1,970,000
Minnesota
Department
of
Iron
Range
Resource
and
Rehabilitation,
Educational
Facilities
Revenue
Bonds,
Series
2023A
5
.000
10/01/40
2,220,732
2,740,000
Minnesota
Department
of
Iron
Range
Resource
and
Rehabilitation,
Educational
Facilities
Revenue
Bonds,
Series
2023A
5
.000
10/01/42
3,050,400
2,880,000
Minnesota
Department
of
Iron
Range
Resource
and
Rehabilitation,
Educational
Facilities
Revenue
Bonds,
Series
2023A
5
.000
10/01/43
3,191,748
Portfolio
of
Investments
November
30,
2024
(continued)
Minnesota
Municipal
Bond
PRINCIPAL
DESCRIPTION
RATE
MATURITY
VALUE
EDUCATION
AND
CIVIC
ORGANIZATIONS
(continued)
$
2,345,000
Minnesota
Higher
Education
Facilities
Authority,
Revenue
Bonds,
Bethel
University,
Refunding
Series
2017
5
.000
%
05/01/37
$
2,334,741
3,300,000
Minnesota
Higher
Education
Facilities
Authority,
Revenue
Bonds,
Bethel
University,
Refunding
Series
2017
5
.000
05/01/47
3,096,834
1,000,000
Minnesota
Higher
Education
Facilities
Authority,
Revenue
Bonds,
Carleton
College,
Refunding
Series
2017
4
.000
03/01/37
1,010,344
5,135,000
Minnesota
Higher
Education
Facilities
Authority,
Revenue
Bonds,
Carleton
College,
Series
2023
5
.000
03/01/48
5,585,760
3,000,000
Minnesota
Higher
Education
Facilities
Authority,
Revenue
Bonds,
Carleton
College,
Series
2023
5
.000
03/01/53
3,247,572
500,000
Minnesota
Higher
Education
Facilities
Authority,
Revenue
Bonds,
College
of
Saint
Scholastica,
Inc.,
Refunding
Series
2019
4
.000
12/01/40
455,458
125,000
Minnesota
Higher
Education
Facilities
Authority,
Revenue
Bonds,
Macalester
College,
Refunidng
Series
2021
4
.000
03/01/35
130,301
155,000
Minnesota
Higher
Education
Facilities
Authority,
Revenue
Bonds,
Macalester
College,
Refunidng
Series
2021
4
.000
03/01/36
161,198
100,000
Minnesota
Higher
Education
Facilities
Authority,
Revenue
Bonds,
Macalester
College,
Refunidng
Series
2021
4
.000
03/01/37
103,375
1,000,000
Minnesota
Higher
Education
Facilities
Authority,
Revenue
Bonds,
Macalester
College,
Series
201528J
3
.250
03/01/30
1,000,520
675,000
Minnesota
Higher
Education
Facilities
Authority,
Revenue
Bonds,
Saint
Catherine
University,
Refunding
Series
2018A
5
.000
10/01/45
677,738
500,000
Minnesota
Higher
Education
Facilities
Authority,
Revenue
Bonds,
Saint
John's
University,
Refunding
Series
2021
4
.000
10/01/32
515,406
350,000
Minnesota
Higher
Education
Facilities
Authority,
Revenue
Bonds,
Saint
John's
University,
Series
2015-8I
5
.000
10/01/33
354,704
385,000
Minnesota
Higher
Education
Facilities
Authority,
Revenue
Bonds,
Saint
John's
University,
Series
2015-8I
5
.000
10/01/34
390,289
2,300,000
Minnesota
Higher
Education
Facilities
Authority,
Revenue
Bonds,
Saint
Olaf
College,
Series
2016-8-N
4
.000
10/01/34
2,320,989
975,000
Minnesota
Higher
Education
Facilities
Authority,
Revenue
Bonds,
Saint
Olaf
College,
Series
2016-8-N
4
.000
10/01/35
982,795
1,000,000
Minnesota
Higher
Education
Facilities
Authority,
Revenue
Bonds,
Saint
Olaf
College,
Series
2021
3
.000
10/01/38
914,337
2,820,000
Minnesota
Higher
Education
Facilities
Authority,
Revenue
Bonds,
Saint
Olaf
College,
Series
2021
4
.000
10/01/50
2,770,136
1,000,000
Minnesota
Higher
Education
Facilities
Authority,
Revenue
Bonds,
University
of
Saint
Thomas,
Green
Series
2022A
4
.000
10/01/38
1,017,293
575,000
Minnesota
Higher
Education
Facilities
Authority,
Revenue
Bonds,
University
of
Saint
Thomas,
Green
Series
2022A
4
.125
10/01/41
583,012
2,000,000
Minnesota
Higher
Education
Facilities
Authority,
Revenue
Bonds,
University
of
Saint
Thomas,
Green
Series
2022A
5
.000
10/01/47
2,111,804
1,000,000
Minnesota
Higher
Education
Facilities
Authority,
Revenue
Bonds,
University
of
Saint
Thomas,
Series
2016-8L
5
.000
04/01/27
1,025,030
100,000
Minnesota
Higher
Education
Facilities
Authority,
Revenue
Bonds,
University
of
Saint
Thomas,
Series
2017A
4
.000
10/01/36
101,057
1,000,000
Minnesota
Higher
Education
Facilities
Authority,
Revenue
Bonds,
University
of
Saint
Thomas,
Series
2019
4
.000
10/01/31
1,024,927
2,000,000
Minnesota
Higher
Education
Facilities
Authority,
Revenue
Bonds,
University
of
Saint
Thomas,
Series
2019
5
.000
10/01/40
2,124,501
2,125,000
Minnesota
Higher
Education
Facilities
Authority,
Revenue
Bonds,
University
of
Saint
Thomas,
Series
2022B
5
.000
10/01/39
2,289,207
500,000
Minnesota
Higher
Education
Facilities
Authority,
Revenue
Bonds,
University
of
Saint
Thomas,
Series
2022B
4
.000
10/01/40
506,630
500,000
Minnesota
Higher
Education
Facilities
Authority,
Revenue
Bonds,
University
of
Saint
Thomas,
Series
2022B
4
.125
10/01/42
506,005
1,490,000
Minnesota
Higher
Education
Facilities
Authority,
Revenue
Bonds,
University
of
Saint
Thomas,
Series
2022B
4
.125
10/01/42
1,507,895
4,170,000
Minnesota
Higher
Education
Facilities
Authority,
Revenue
Bonds,
University
of
Saint
Thomas,
Series
2024A
5
.000
10/01/49
4,476,211
645,000
Minnesota
Office
of
Higher
Education,
Supplemental
Student
Loan
Program
Revenue
Bonds,
2020
Senior
Series,
(AMT)
2
.650
11/01/38
585,436
1,130,000
Otsego,
Minnesota,
Charter
School
Lease
Revenue
Bonds,
Kaleidoscope
Charter
School
Project,
Series
2014A
5
.000
09/01/44
1,052,064
PRINCIPAL
DESCRIPTION
RATE
MATURITY
VALUE
EDUCATION
AND
CIVIC
ORGANIZATIONS
(continued)
$
155,000
Saint
Cloud,
Minnesota,
Charter
School
Lease
Revenue
Bonds,
Stride
Academy
Project,
Series
2016A
5
.000
%
04/01/46
$
133,471
1,000,000
Saint
Paul
Housing
&
Redevelopment
Authority,
Minnesota,
Charter
School
Lease
Revenue
Bonds,
Community
of
Peace
Academy
Project,
Refunding
Series
2015A
5
.000
12/01/46
1,000,048
1,600,000
Saint
Paul
Housing
&
Redevelopment
Authority,
Minnesota,
Charter
School
Lease
Revenue
Bonds,
Community
of
Peace
Academy
Project,
Series
2019
4
.000
12/01/49
1,399,017
240,000
(a)
Saint
Paul
Housing
&
Redevelopment
Authority,
Minnesota,
Charter
School
Lease
Revenue
Bonds,
Great
River
School
Project,
Series
2017A
5
.500
07/01/38
244,722
685,000
(a)
Saint
Paul
Housing
&
Redevelopment
Authority,
Minnesota,
Charter
School
Lease
Revenue
Bonds,
Great
River
School
Project,
Series
2017A
5
.500
07/01/52
692,009
2,500,000
Saint
Paul
Housing
&
Redevelopment
Authority,
Minnesota,
Charter
School
Lease
Revenue
Bonds,
Hmong
College
Prep
Academy
Project,
Refunding
Series
2020A
5
.000
09/01/55
2,503,518
1,000,000
Saint
Paul
Housing
&
Redevelopment
Authority,
Minnesota,
Charter
School
Lease
Revenue
Bonds,
Hmong
College
Prep
Academy
Project,
Series
2016A
5
.750
09/01/46
1,016,159
500,000
Saint
Paul
Housing
&
Redevelopment
Authority,
Minnesota,
Charter
School
Lease
Revenue
Bonds,
Hmong
College
Prep
Academy
Project,
Series
2016A
6
.000
09/01/51
509,058
4,000,000
Saint
Paul
Housing
&
Redevelopment
Authority,
Minnesota,
Charter
School
Lease
Revenue
Bonds,
Hope
Community
Academy
Project,
Series
2020A
5
.000
12/01/55
2,914,204
1,000,000
(a)
Saint
Paul
Housing
&
Redevelopment
Authority,
Minnesota,
Charter
School
Lease
Revenue
Bonds,
Metro
Deaf
School
Project,
Series
2018A
5
.000
06/15/48
991,779
1,615,000
(a)
Saint
Paul
Housing
&
Redevelopment
Authority,
Minnesota,
Charter
School
Lease
Revenue
Bonds,
Metro
Deaf
School
Project,
Series
2018A
5
.000
06/15/53
1,586,058
730,000
Saint
Paul
Housing
&
Redevelopment
Authority,
Minnesota,
Charter
School
Lease
Revenue
Bonds,
Nova
Classical
Academy,
Refunding
Series
2021A
4
.000
09/01/31
727,827
2,000,000
Saint
Paul
Housing
&
Redevelopment
Authority,
Minnesota,
Charter
School
Lease
Revenue
Bonds,
Nova
Classical
Academy,
Series
2016A
4
.125
09/01/47
1,824,581
625,000
Saint
Paul
Housing
&
Redevelopment
Authority,
Minnesota,
Charter
School
Lease
Revenue
Bonds,
Twin
Cities
Academy
Project,
Series
2015A
5
.300
07/01/45
626,387
1,030,000
Saint
Paul
Housing
&
Redevelopment
Authority,
Minnesota,
Charter
School
Lease
Revenue
Bonds,
Twin
Cities
Academy
Project,
Series
2015A
5
.375
07/01/50
1,032,312
1,230,000
Saint
Paul
Housing
&
Redevelopment
Authority,
Minnesota,
Charter
School
Lease
Revenue
Bonds,
Twin
Cities
German
Immersion
School
Project,
Series
2019
5
.000
07/01/49
1,182,836
2,620,000
Saint
Paul
Housing
&
Redevelopment
Authority,
Minnesota,
Charter
School
Lease
Revenue
Bonds,
Twin
Cities
German
Immersion
School
Project,
Series
2019
5
.000
07/01/55
2,463,853
460,000
Saint
Paul
Housing
&
Redevelopment
Authority,
Minnesota,
Charter
School
Lease
Revenue
Bonds,
Twin
Cities
German
Immersion
School,
Series
2013A
5
.000
07/01/33
460,203
1,450,000
Saint
Paul
Housing
&
Redevelopment
Authority,
Minnesota,
Charter
School
Lease
Revenue
Bonds,
Twin
Cities
German
Immersion
School,
Series
2013A
5
.000
07/01/44
1,416,318
2,135,000
Savage,
Minnesota
Charter
School
Lease
Revenue
Bonds,
Aspen
Academy
Project,
Series
2016A
5
.000
10/01/41
2,066,409
380,000
Savage,
Minnesota
Charter
School
Lease
Revenue
Bonds,
Aspen
Academy
Project,
Series
2016A
5
.125
10/01/48
364,091
1,595,000
Spring
Lake
Park,
Minnesota,
Charter
School
Lease
Revenue
Bonds,
Excell
Academy
for
Higher
Learning
Inc.,
Series
2019A
5
.000
06/15/54
1,554,133
500,000
St.
Paul
Housing
and
Redevelopment
Authority,
Minnesota,
Charter
School
Revenue
Bonds,
Higher
Ground
Academy
Charter
School,
Series
2018
5
.000
12/01/43
504,864
Portfolio
of
Investments
November
30,
2024
(continued)
Minnesota
Municipal
Bond
PRINCIPAL
DESCRIPTION
RATE
MATURITY
VALUE
EDUCATION
AND
CIVIC
ORGANIZATIONS
(continued)
$
500,000
St.
Paul
Housing
and
Redevelopment
Authority,
Minnesota,
Charter
School
Revenue
Bonds,
Higher
Ground
Academy
Charter
School,
Series
2018
5
.125
%
12/01/49
$
504,219
1,750,000
University
of
Minnesota,
General
Obligation
Bonds,
Refunding
Series
2024A
5
.000
01/01/43
1,968,588
3,505,000
University
of
Minnesota,
General
Obligation
Bonds,
Series
2019A
5
.000
04/01/44
3,723,486
20,000
Winona
Port
Authority,
Minnesota,
Charter
School
Lease
Revenue
Bonds,
Bluffview
Montessori
School
Project,
Refunding
Series
2016
4
.750
06/01/46
17,595
390,000
Woodbury,
Minnesota,
Charter
School
Lease
Revenue
Bonds,
Math
and
Science
Academy
Building
Company,
Refunding
Series
2020A
4
.000
12/01/40
352,192
450,000
Woodbury,
Minnesota,
Charter
School
Lease
Revenue
Bonds,
Math
and
Science
Academy
Building
Company,
Refunding
Series
2020A
4
.000
12/01/50
378,578
340,000
Woodbury,
Minnesota,
Charter
School
Lease
Revenue
Bonds,
Woodbury
Leadership
Academy,
Series
2021A
4
.000
07/01/31
324,796
660,000
Woodbury,
Minnesota,
Charter
School
Lease
Revenue
Bonds,
Woodbury
Leadership
Academy,
Series
2021A
4
.000
07/01/51
511,817
TOTAL
EDUCATION
AND
CIVIC
ORGANIZATIONS
119,857,424
HEALTH
CARE
-
17.2%
500,000
Chippewa
County,
Minnesota,
Gross
Revenue
Hospital
Bonds,
Montevideo
Hospital
Project,
Refunding
Series
2016
4
.000
03/01/32
497,731
2,000,000
Chippewa
County,
Minnesota,
Gross
Revenue
Hospital
Bonds,
Montevideo
Hospital
Project,
Refunding
Series
2016
4
.000
03/01/37
1,943,681
550,000
City
of
Plato,
Minnesota,
Health
Care
Facilities
Revenue
Bonds,
Glencoe
Regional
Health
Services
Project,
Series
2017
3
.000
04/01/26
538,125
485,000
City
of
Plato,
Minnesota,
Health
Care
Facilities
Revenue
Bonds,
Glencoe
Regional
Health
Services
Project,
Series
2017
5
.000
04/01/41
490,656
500,000
Duluth
Economic
Development
Authority,
Minnesota,
Health
Care
Facilities
Revenue
Bonds,
Essentia
Health
Obligated
Group,
Series
2018A
5
.000
02/15/37
520,119
580,000
Duluth
Economic
Development
Authority,
Minnesota,
Health
Care
Facilities
Revenue
Bonds,
Essentia
Health
Obligated
Group,
Series
2018A
4
.250
02/15/43
581,484
13,115,000
Duluth
Economic
Development
Authority,
Minnesota,
Health
Care
Facilities
Revenue
Bonds,
Essentia
Health
Obligated
Group,
Series
2018A
5
.000
02/15/48
13,417,482
3,000,000
Duluth
Economic
Development
Authority,
Minnesota,
Health
Care
Facilities
Revenue
Bonds,
Essentia
Health
Obligated
Group,
Series
2018A
5
.000
02/15/53
3,065,418
1,000,000
Duluth
Economic
Development
Authority,
Minnesota,
Health
Care
Facilities
Revenue
Bonds,
Essentia
Health
Obligated
Group,
Series
2018A
5
.250
02/15/53
1,029,214
2,590,000
Duluth
Economic
Development
Authority,
Minnesota,
Health
Care
Facilities
Revenue
Bonds,
Essentia
Health
Obligated
Group,
Series
2018A
5
.250
02/15/58
2,663,506
400,000
Duluth
Economic
Development
Authority,
Minnesota,
Health
Care
Facilities
Revenue
Bonds,
Saint
Luke's
Hospital
of
Duluth
Obligated
Group,
Series
2021A
4
.000
06/15/34
416,035
175,000
Duluth
Economic
Development
Authority,
Minnesota,
Health
Care
Facilities
Revenue
Bonds,
Saint
Luke's
Hospital
of
Duluth
Obligated
Group,
Series
2021A
4
.000
06/15/38
179,906
175,000
Duluth
Economic
Development
Authority,
Minnesota,
Health
Care
Facilities
Revenue
Bonds,
Saint
Luke's
Hospital
of
Duluth
Obligated
Group,
Series
2021A
4
.000
06/15/39
179,148
570,000
Duluth
Economic
Development
Authority,
Minnesota,
Health
Care
Facilities
Revenue
Bonds,
Saint
Luke's
Hospital
of
Duluth
Obligated
Group,
Series
2021A
3
.000
06/15/44
488,972
450,000
Duluth
Economic
Development
Authority,
Minnesota,
Health
Care
Facilities
Revenue
Bonds,
Saint
Luke's
Hospital
of
Duluth
Obligated
Group,
Series
2022A, Forward
Delivery
4
.000
06/15/38
463,075
1,250,000
Duluth
Economic
Development
Authority,
Minnesota,
Health
Care
Facilities
Revenue
Bonds,
Saint
Luke's
Hospital
of
Duluth
Obligated
Group,
Series
2022B
5
.250
06/15/47
1,371,078
PRINCIPAL
DESCRIPTION
RATE
MATURITY
VALUE
HEALTH
CARE
(continued)
$
500,000
Glencoe,
Minnesota,
Health
Care
Facilities
Revenue
Bonds,
Glencoe
Regional
Health
Services
Project,
Series
2013
4
.000
%
04/01/27
$
499,044
760,000
Glencoe,
Minnesota,
Health
Care
Facilities
Revenue
Bonds,
Glencoe
Regional
Health
Services
Project,
Series
2013
4
.000
04/01/31
754,574
1,000,000
Maple
Grove,
Minnesota,
Health
Care
Facilities
Revenue
Refunding
Bonds,
North
Memorial
Health
Care,
Series
2015
4
.000
09/01/35
980,828
425,000
Maple
Grove,
Minnesota,
Health
Care
Facility
Revenue
Bonds,
North
Memorial
Health
Care,
Series
2017
5
.000
05/01/31
436,125
430,000
Maple
Grove,
Minnesota,
Health
Care
Facility
Revenue
Bonds,
North
Memorial
Health
Care,
Series
2017
5
.000
05/01/32
440,287
2,725,000
Minneapolis,
Minnesota,
Health
Care
System
Revenue
Bonds,
Allina
Health
System,
Series
2021
4
.000
11/15/37
2,768,540
10,360,000
Minneapolis,
Minnesota,
Health
Care
System
Revenue
Bonds,
Allina
Health
System,
Series
2021
4
.000
11/15/39
10,480,886
1,000,000
Minneapolis,
Minnesota,
Health
Care
System
Revenue
Bonds,
Allina
Health
System,
Series
2021
4
.000
11/15/40
1,009,544
525,000
Minneapolis,
Minnesota,
Health
Care
System
Revenue
Bonds,
Fairview
Health
Services,
Series
2015A
5
.000
11/15/26
531,762
485,000
Minneapolis,
Minnesota,
Health
Care
System
Revenue
Bonds,
Fairview
Health
Services,
Series
2015A
4
.000
11/15/40
462,687
1,000,000
Minneapolis,
Minnesota,
Health
Care
System
Revenue
Bonds,
Fairview
Health
Services,
Series
2018A
5
.000
11/15/35
1,042,358
3,465,000
Minneapolis,
Minnesota,
Health
Care
System
Revenue
Bonds,
Fairview
Health
Services,
Series
2018A
4
.000
11/15/48
3,185,555
3,365,000
Minnesota
Agricultural
and
Economic
Development
Board,
Health
Care
Facilities
Revenue
Bonds,
Essentia
Health
Obligated
Group,
Series
2024A
5
.250
01/01/54
3,695,939
2,000,000
Minnesota
Agricultural
and
Economic
Development
Board,
Health
Care
Facilities
Revenue
Bonds,
HealthPartners
Obligated
Group,
Series
2024
5
.000
01/01/44
2,196,713
2,600,000
Rochester,
Minnesota,
Health
Care
Facilities
Revenue
Bonds,
Mayo
Clinic,
Refunding
Series
2016B
5
.000
11/15/36
3,089,772
2,500,000
Rochester,
Minnesota,
Health
Care
Facilities
Revenue
Bonds,
Mayo
Clinic,
Series
2022
5
.000
11/15/57
2,691,774
4,895,000
Saint
Cloud,
Minnesota,
Health
Care
Revenue
Bonds,
CentraCare
Health
System,
Series
2016A
5
.000
05/01/46
4,969,866
9,410,000
Saint
Cloud,
Minnesota,
Health
Care
Revenue
Bonds,
CentraCare
Health
System,
Series
2019
5
.000
05/01/48
9,834,498
2,500,000
Saint
Cloud,
Minnesota,
Health
Care
Revenue
Bonds,
CentraCare
Health
System,
Series
2024
4
.000
05/01/50
2,502,237
3,450,000
Saint
Cloud,
Minnesota,
Health
Care
Revenue
Bonds,
CentraCare
Health
System,
Series
2024
5
.000
05/01/54
3,710,643
8,660,000
Saint
Paul
Housing
and
Redevelopment
Authority,
Minnesota,
Health
Care
Facility
Revenue
Bonds,
HealthPartners
Obligated
Group,
Refunding
Series
2015A
5
.000
07/01/30
8,725,819
3,825,000
Saint
Paul
Housing
and
Redevelopment
Authority,
Minnesota,
Health
Care
Facility
Revenue
Bonds,
HealthPartners
Obligated
Group,
Refunding
Series
2015A
5
.000
07/01/31
3,852,214
4,075,000
Saint
Paul
Housing
and
Redevelopment
Authority,
Minnesota,
Health
Care
Facility
Revenue
Bonds,
HealthPartners
Obligated
Group,
Refunding
Series
2015A
4
.000
07/01/35
4,077,632
2,135,000
Saint
Paul
Housing
and
Redevelopment
Authority,
Minnesota,
Health
Care
Revenue
Bonds,
Fairview
Health
Services,
Series
2017A
5
.000
11/15/27
2,230,151
600,000
Saint
Paul
Housing
and
Redevelopment
Authority,
Minnesota,
Health
Care
Revenue
Bonds,
Fairview
Health
Services,
Series
2017A
4
.000
11/15/36
595,392
640,000
Saint
Paul
Housing
and
Redevelopment
Authority,
Minnesota,
Health
Care
Revenue
Bonds,
Fairview
Health
Services,
Series
2017A
4
.000
11/15/37
628,117
2,830,000
Saint
Paul
Housing
and
Redevelopment
Authority,
Minnesota,
Health
Care
Revenue
Bonds,
Fairview
Health
Services,
Series
2017A
4
.000
11/15/43
2,626,878
Portfolio
of
Investments
November
30,
2024
(continued)
Minnesota
Municipal
Bond
PRINCIPAL
DESCRIPTION
RATE
MATURITY
VALUE
HEALTH
CARE
(continued)
$
2,500,000
Saint
Paul
Housing
and
Redevelopment
Authority,
Minnesota,
Health
Care
Revenue
Bonds,
Fairview
Health
Services,
Series
2017A
5
.000
%
11/15/47
$
2,535,989
1,175,000
Saint
Paul
Port
Authority,
Minnesota,
Lease
Revenue
Bonds,
Regions
Hospital
Parking
Ramp
Project,
Series
2007-1
5
.000
08/01/36
1,175,771
1,980,000
Shakopee,
Minnesota,
Health
Care
Facilities
Revenue
Bonds,
Saint
Francis
Regional
Medical
Center,
Refunding
Series
2014
4
.000
09/01/31
1,979,898
1,410,000
Shakopee,
Minnesota,
Health
Care
Facilities
Revenue
Bonds,
Saint
Francis
Regional
Medical
Center,
Refunding
Series
2014
5
.000
09/01/34
1,410,586
1,900,000
Wadena,
Minnesota,
Revenue
Bonds,
Wadena
Cancer
Center
Project,
Series
2024A
5
.000
12/01/45
2,059,720
TOTAL
HEALTH
CARE
115,027,429
HOUSING/MULTIFAMILY
-
0.5%
1,000,000
Mounds
View,
Minnesota,
Multifamily
Housing
Revenue
Bonds,
Sherman
Forbes
Project
Series
2023B,
(Mandatory
Put
5/01/25)
5
.375
05/01/27
1,000,135
2,360,000
Rochester,
Minnesota,
Multifamily
Housing
Revenue
Bonds,
Essex
Place
Apartments
Project,
Series
2012A
3
.750
06/01/29
2,360,288
TOTAL
HOUSING/MULTIFAMILY
3,360,423
HOUSING/SINGLE
FAMILY
-
0.7%
35,000
Minneapolis-Saint
Paul
Housing
Finance
Board,
Minnesota,
Single
Family
Mortgage
Revenue
Bonds,
City
Living
Series
2007A-2,
(AMT)
5
.520
03/01/41
34,907
365,000
Minnesota
Housing
Finance
Agency,
Residential
Housing
Finance
Bonds,
Series
2016A,
(AMT)
3
.200
01/01/33
338,230
460,000
Minnesota
Housing
Finance
Agency,
Residential
Housing
Finance
Bonds,
Series
2020A,
(AMT)
1
.550
07/01/25
452,657
370,000
Minnesota
Housing
Finance
Agency,
Residential
Housing
Finance
Bonds,
Series
2020A,
(AMT)
1
.700
07/01/26
355,323
220,000
Minnesota
Housing
Finance
Agency,
Residential
Housing
Finance
Bonds,
Series
2020D,
(AMT)
1
.625
01/01/26
213,696
205,000
Minnesota
Housing
Finance
Agency,
Residential
Housing
Finance
Bonds,
Series
2020D,
(AMT)
1
.650
07/01/26
196,635
460,000
Minnesota
Housing
Finance
Agency,
Residential
Housing
Finance
Bonds,
Series
2020H,
(AMT)
1
.100
07/01/26
437,786
460,000
Minnesota
Housing
Finance
Agency,
Residential
Housing
Finance
Bonds,
Series
2020H,
(AMT)
1
.350
07/01/27
424,894
380,000
Minnesota
Housing
Finance
Agency,
Residential
Housing
Finance
Bonds,
Series
2021A,
(AMT)
1
.550
01/01/28
349,478
390,000
Minnesota
Housing
Finance
Agency,
Residential
Housing
Finance
Bonds,
Series
2021A,
(AMT)
1
.600
07/01/28
358,349
485,000
Minnesota
Housing
Finance
Agency,
Residential
Housing
Finance
Bonds,
Series
2021A,
(AMT)
1
.750
01/01/29
431,437
485,000
Minnesota
Housing
Finance
Agency,
Residential
Housing
Finance
Bonds,
Series
2021A,
(AMT)
1
.800
07/01/29
426,024
245,000
Minnesota
Housing
Finance
Agency,
Residential
Housing
Finance
Bonds,
Series
2021A,
(AMT)
1
.900
01/01/30
212,374
240,000
Minnesota
Housing
Finance
Agency,
Residential
Housing
Finance
Bonds,
Series
2021A,
(AMT)
1
.950
07/01/30
205,959
100,000
Minnesota
Housing
Finance
Agency,
Residential
Housing
Finance
Bonds,
Social
Series
2024L
4
.150
07/01/38
102,234
TOTAL
HOUSING/SINGLE
FAMILY
4,539,983
INDUSTRIALS
-
0.3%
2,250,000
(a)
Saint
Paul
Port
Authority,
Minnesota,
Solid
Waste
Disposal
Revenue
Bonds,
Gerdau
Saint
Paul
Steel
Mill
Project,
Series
2012-
7,
(AMT)
4
.500
10/01/37
2,213,262
TOTAL
INDUSTRIALS
2,213,262
PRINCIPAL
DESCRIPTION
RATE
MATURITY
VALUE
LONG-TERM
CARE
-
6.9%
$
2,090,000
Anoka,
Minnesota,
Health
Care
and
Housing
Facility
Revenue
Bonds,
The
Homestead
at
Anoka,
Inc.
Project,
Series
2014
5
.125
%
11/01/49
$
1,944,153
225,000
Apple
Valley,
Minnesota
Senior
Housing
Revenue
Bonds,
PHS
Apple
Valley
Senior
Housing,
Inc.
Orchard
Path
Phase
II
Project,
Series
2021
4
.000
09/01/26
225,404
240,000
Apple
Valley,
Minnesota
Senior
Housing
Revenue
Bonds,
PHS
Apple
Valley
Senior
Housing,
Inc.
Orchard
Path
Phase
II
Project,
Series
2021
4
.000
09/01/28
241,400
270,000
Apple
Valley,
Minnesota
Senior
Housing
Revenue
Bonds,
PHS
Apple
Valley
Senior
Housing,
Inc.
Orchard
Path
Phase
II
Project,
Series
2021
4
.000
09/01/31
270,537
1,000,000
Apple
Valley,
Minnesota,
Senior
Housing
Revenue
Bonds,
PHS
Apple
Valley
Senior
Housing,
Inc.
Orchard
Path
Project,
Refunding
Series
2018
5
.000
09/01/43
1,002,616
1,000,000
Bethel,
Minnesota,
Housing
and
Health
Care
Facilities
Revenue
Bonds,
Ecumen
Obligated
Group
Series
2024A
6
.125
03/01/49
1,022,900
375,000
Center
City,
Minnesota,
Health
Care
Facilities
Revenue
Bonds,
Hazelden
Betty
Ford
Foundation
Project,
Series
2014
4
.000
11/01/39
363,501
500,000
Center
City,
Minnesota,
Health
Care
Facilities
Revenue
Bonds,
Hazelden
Betty
Ford
Foundation
Project,
Series
2014
5
.000
11/01/44
500,205
500,000
Chatfield,
Minnesota,
Healthcare
and
Housing
Facilities
Revenue
Bonds,
Chosen
Valley
Care
Center
Project,
Refunding
Series
2019
5
.000
09/01/44
463,259
1,500,000
Chatfield,
Minnesota,
Healthcare
and
Housing
Facilities
Revenue
Bonds,
Chosen
Valley
Care
Center
Project,
Refunding
Series
2019
5
.000
09/01/52
1,320,337
1,500,000
Chisago
City,
Minnesota,
Housing
and
Health
Care
Revenue
Bonds,
CDL
Homes,
LLC
Project,
Series
2013B
6
.000
08/01/43
1,500,598
1,500,000
City
of
West
Saint
Paul,
Minnesota
Housing
and
Health
Care
Facilities
Revenue
Refunding
Bonds,
Walker
Westwood
Ridge
Campus
Project,
Series
2017
5
.000
11/01/49
1,460,339
250,000
Cloquet,
Minnesota,
Housing
Facilities
Revenue
Bonds,
HADC
Cloquet
LLC
Project,
Refunding
Series
2021
3
.400
08/01/36
208,475
700,000
Cloquet,
Minnesota,
Housing
Facilities
Revenue
Bonds,
HADC
Cloquet
LLC
Project,
Refunding
Series
2021
4
.000
08/01/41
571,053
200,000
Cloquet,
Minnesota,
Housing
Facilities
Revenue
Bonds,
HADC
Cloquet
LLC
Project,
Refunding
Series
2021
4
.000
08/01/48
150,808
1,180,000
Cold
Spring,
Minnesota,
Health
Care
Facilities
Revenue
Bonds,
Assumption
Home,
Inc.,
Refunding
Series
2013
5
.200
03/01/43
1,104,608
575,000
Columbus,
Minnesota,
Senior
Housing
Revenue
Bonds,
Richfield
Senior
Housing,
Inc.,
Refunding
Series
2015
5
.250
01/01/40
502,524
1,175,000
Columbus,
Minnesota,
Senior
Housing
Revenue
Bonds,
Richfield
Senior
Housing,
Inc.,
Refunding
Series
2015
5
.250
01/01/46
980,550
1,250,000
Cuyuna
Range
Hospital
District,
Minnesota,
Health
Care
Facilities
Revenue
Bonds,
Crosby
Senior
Service
Care
Center,
Series
2023
5
.500
05/01/48
1,299,857
1,195,000
(a)
Dakota
County
Community
Development
Agency,
Minnesota,
Senior
Housing
Revenue
Bonds,
Walker
Highview
Hills
LLC
Project,
Refunding
Series
2016A
5
.000
08/01/46
1,194,968
500,000
Dennison,
Minnesota,
Senior
Housing
Revenue
Bonds,
Villages
of
Lonsdale,
LLC
Project,
Series
2019
4
.600
05/01/44
403,599
400,000
Maple
Plain,
Minnesota
Senior
Housing
and
Healthcare
Revenue
Bonds,
Haven
Homes,
Inc.
Project,
Series
2019
4
.100
07/01/34
388,252
1,250,000
Maple
Plain,
Minnesota
Senior
Housing
and
Healthcare
Revenue
Bonds,
Haven
Homes,
Inc.
Project,
Series
2019
5
.000
07/01/54
1,196,044
200,000
Mapleton,
Minnesota,
Healthcare
Facility
Revenue
Bonds,
Mapleton
Community
Home,
Refunding
Series
2019
4
.000
05/01/39
176,233
1,500,000
Minneapolis,
Minnesota,
Senior
Housing
and
Healthcare
Revenue
Bonds,
Ecumen
Abiitan
Mill
City
Project, Series
2015
5
.250
11/01/45
1,435,707
300,000
Morris,
Minnesota,
Health
Care
Facilities
Revenue
Bonds,
Farmington
Health
Services
Project,
Refunding
Series
2019
3
.400
08/01/28
286,416
2,000,000
North
Oaks,
Minnesota,
Senior
Housing
Revenue
Bonds,
Waverly
Gardens
Project,
Refunding
Series
2016
5
.000
10/01/47
2,014,114
1,285,000
Saint
Joseph,
Minnesota,
Senior
Housing
and
Healthcare
Revenue
Bonds,
Woodcrest
of
Country
Manor
Project,
Series
2019
A
5
.000
07/01/55
1,219,454
Portfolio
of
Investments
November
30,
2024
(continued)
Minnesota
Municipal
Bond
PRINCIPAL
DESCRIPTION
RATE
MATURITY
VALUE
LONG-TERM
CARE
(continued)
$
2,000,000
Saint
Louis
Park,
Minnesota,
Health
Care
Facilities
Revenue
Bonds,
Mount
Olivet
Careview
Home
Project,
Series
2016B
4
.900
%
06/01/49
$
1,883,123
25,000
Saint
Louis
Park,
Minnesota,
Health
Care
Facilities
Revenue
Bonds,
Mount
Olivet
Careview
Home
Project,
Series
2016C
3
.150
06/01/28
24,021
1,000,000
Saint
Paul
Housing
&
Redevelopment
Authority,
Minnesota,
Revenue
Bonds,
Rossy
&
Richard
Shaller
Family
Sholom
East
Campus,
Series
2018
5
.000
10/01/43
889,034
4,000,000
Saint
Paul
Housing
and
Redevelopment
Authority,
Minnesota
Senior
Housing
and
Health
Care
Revenue
Bonds,
Carondelet
Village
Project,
Series
2016A
5
.000
12/01/41
4,043,119
1,175,000
Saint
Paul
Housing
and
Redevelopment
Authority,
Minnesota,
Revenue
Bonds,
Amherst
H.
Wilder
Foundation
Project,
Refunding
Series
2020A
5
.000
12/01/29
1,255,718
300,000
Saint
Paul
Housing
and
Redevelopment
Authority,
Minnesota,
Revenue
Bonds,
Amherst
H.
Wilder
Foundation
Project,
Refunding
Series
2020A
5
.000
12/01/30
322,474
1,750,000
Saint
Paul
Housing
and
Redevelopment
Authority,
Minnesota,
Revenue
Bonds,
Amherst
H.
Wilder
Foundation
Project,
Refunding
Series
2020A
5
.000
12/01/36
1,852,057
450,000
(a)
Saint
Paul
Housing
and
Redevelopment
Authority,
Minnesota,
Senior
Housing
and
Health
Care
Revenue
Bonds,
Episcopal
Church
Homes
Project,
Refunding
Senior
Series
2021A
4
.000
11/01/34
427,306
1,015,000
(a)
Saint
Paul
Housing
and
Redevelopment
Authority,
Minnesota,
Senior
Housing
and
Health
Care
Revenue
Bonds,
Episcopal
Church
Homes
Project,
Refunding
Senior
Series
2021A
4
.000
11/01/42
890,293
400,000
Saint
Paul
Park,
Minnesota,
Senior
Housing
and
Health
Care
Revenue
Bonds,
Presbyterian
Homes
Bloomington
Project,
Refunding
Series
2017
4
.000
09/01/32
397,610
500,000
Saint
Paul
Park,
Minnesota,
Senior
Housing
and
Health
Care
Revenue
Bonds,
Presbyterian
Homes
Bloomington
Project,
Refunding
Series
2017
4
.100
09/01/33
499,610
315,000
Saint
Paul
Park,
Minnesota,
Senior
Housing
and
Health
Care
Revenue
Bonds,
Presbyterian
Homes
Bloomington
Project,
Refunding
Series
2017
4
.200
09/01/36
311,528
300,000
Saint
Paul
Park,
Minnesota,
Senior
Housing
and
Health
Care
Revenue
Bonds,
Presbyterian
Homes
Bloomington
Project,
Refunding
Series
2017
4
.250
09/01/37
295,916
1,000,000
Saint
Paul
Park,
Minnesota,
Senior
Housing
and
Health
Care
Revenue
Bonds,
Presbyterian
Homes
Bloomington
Project,
Refunding
Series
2017
5
.000
09/01/42
1,000,219
600,000
Sartell,
Minnesota,
Health
Care
and
Housing
Facilities
Revenue
Bonds,
Country
Manor
Campus
LLC
Project,
Series
2022A
5
.000
09/01/35
601,938
2,390,000
Sauk
Rapids,
Minnesota,
Health
Care
and
Housing
Facilities
Revenue
Bonds,
Good
Shepherd
Luthran
Home,
Refunding
Series
2013
5
.125
01/01/39
2,165,486
650,000
Wayzata,
Minnesota
Senior
Housing
Revenue
Bonds,
Folkestone
Senior
Living
Community,
Refunding
Series
2019
5
.000
08/01/49
655,426
5,000,000
Wayzata,
Minnesota
Senior
Housing
Revenue
Bonds,
Folkestone
Senior
Living
Community,
Refunding
Series
2019
5
.000
08/01/54
5,033,762
TOTAL
LONG-TERM
CARE
45,996,551
TAX
OBLIGATION/GENERAL
-
25.5%
1,355,000
Anoka-Hennepin
Independent
School
District
11,
Coon
Rapids,
Minnesota,
General
Obligation
Bonds,
School
Building
Series
2020A
3
.000
02/01/43
1,186,030
2,105,000
Bemidji,
Minnesota,
General
Obligation
Bonds,
Refunding
Sales
Tax
Series
2017A
-
AGM
Insured
4
.000
02/01/29
2,175,083
5,000,000
Bird
Island-Olivia-Lake
Lillian
Independent
School
District
2534,
Minnesota,
General
Obligation
Bonds,
School
Building
Series
2024A
5
.000
02/01/49
5,442,320
5,630,000
Bird
Island-Olivia-Lake
Lillian
Independent
School
District
2534,
Minnesota,
General
Obligation
Bonds,
School
Building
Series
2024A
5
.000
02/01/54
6,085,079
200,000
Brainerd
Independent
School
District
181,
Crow
Wing
County,
Minnesota,
General
Obligation
Bonds,
School
Building
Series
2018A
4
.000
02/01/42
200,758
PRINCIPAL
DESCRIPTION
RATE
MATURITY
VALUE
TAX
OBLIGATION/GENERAL
(continued)
$
3,600,000
Brainerd
Independent
School
District
181,
Crow
Wing
County,
Minnesota,
General
Obligation
Bonds,
School
Building
Series
2018A
4
.000
%
02/01/43
$
3,613,595
1,090,000
Brooklyn
Center
Independent
School
District
286,
Minnesota,
General
Obligation
Bonds,
Series
2018A
4
.000
02/01/36
1,111,348
1,880,000
Brooklyn
Center
Independent
School
District
286,
Minnesota,
General
Obligation
Bonds,
Series
2018A
4
.000
02/01/38
1,907,556
2,715,000
Brooklyn
Center
Independent
School
District
286,
Minnesota,
General
Obligation
Bonds,
Series
2018A
4
.000
02/01/41
2,742,117
2,260,000
Brooklyn
Center
Independent
School
District
286,
Minnesota,
General
Obligation
Bonds,
Series
2018A
4
.000
02/01/42
2,279,800
3,000,000
Carlton
County,
Minnesota,
General
Obligation
Bonds,
Minnesota
State
Credit
Enhancement
Program
Series
2022A
4
.000
02/01/47
3,001,653
1,160,000
Chisago
Lakes,
Minnesota,
Independent
School
District
2144,
General
Obligation
Bonds,
School
Building
Series
2017A
3
.000
02/01/32
1,163,555
1,000,000
Cloquet
Independent
School
District
94,
Carlton
and
Sant
Louis
Counties,
Minnesota,
General
Obligation
Bonds,
School
Building
Series
2015B
5
.000
02/01/27
1,003,266
1,000,000
Cloquet
Independent
School
District
94,
Carlton
and
Sant
Louis
Counties,
Minnesota,
General
Obligation
Bonds,
School
Building
Series
2015B
4
.000
02/01/36
1,001,174
1,050,000
Cold
Spring,
Minnesota,
General
Obligation
Bonds,
Capital
Improvement
Plan
Series
2024A
-
BAM
Insured
4
.000
02/01/54
1,044,852
625,000
Corcoran,
Minnesota,
General
Obligation
Bonds,
Series
2023A
-
BAM
Insured
4
.000
02/01/40
638,536
3,605,000
Corcoran,
Minnesota,
General
Obligation
Bonds,
Series
2023A
-
BAM
Insured
4
.000
02/01/48
3,613,195
1,145,000
Dawson-Boyd
Independent
School
District
378,
Yellow
Medicine
County,
Minnesota,
General
Obligation
Bonds,
School
Building
Series
2019A
4
.000
02/01/31
1,182,934
1,145,000
Dawson-Boyd
Independent
School
District
378,
Yellow
Medicine
County,
Minnesota,
General
Obligation
Bonds,
School
Building
Series
2019A
4
.000
02/01/32
1,179,854
1,225,000
Dover-Eyota
Independent
School
District
533,
Minnesota,
General
Obligation
Bonds,
School
Building
Facilities
Maintenance
Series
2023A
4
.000
02/01/44
1,237,711
500,000
Dover-Eyota
Independent
School
District
533,
Minnesota,
General
Obligation
Bonds,
School
Building
Facilities
Maintenance
Series
2023A
4
.000
02/01/45
503,846
1,325,000
Duluth
Independent
School
District
709,
Saint
Louis
County,
Minnesota,
General
Obligation
Bonds,
Capital
Appreciation
Series
2021C
0
.000
02/01/31
1,011,374
1,480,000
Duluth
Independent
School
District
709,
Saint
Louis
County,
Minnesota,
General
Obligation
Bonds,
Capital
Appreciation
Series
2021C
0
.000
02/01/32
1,073,853
535,000
Duluth
Independent
School
District
709,
Saint
Louis
County,
Minnesota,
General
Obligation
Bonds,
Capital
Appreciation
Series
2021C
0
.000
02/01/33
368,437
1,115,000
Edgerton
Independent
School
District
581,
Minnesota,
General
Obligation
Bonds,
School
Building
Series
2024A
4
.000
02/01/43
1,131,187
3,000,000
Farmington
Independent
School
District
192,
Dakota
County,
Minnesota,
General
Obligation
Bonds,
Refunding
School
Building
Series
2023A
5
.000
02/01/25
3,009,067
480,000
Fridley,
Minnesota,
General
Obligation
Bonds,
Capital
Improvement
Plan,
Series
2017
3
.250
02/01/34
476,105
1,090,000
GFW
Independent
School
District
No.
2365,
Sibley,
Renville,
McLeod
and
Nicollet
Counties,
Minnesota,
General
Obligation
School
Building
Bonds,
Series
2023A
5
.000
02/01/41
1,190,441
2,450,000
GFW
Independent
School
District
No.
2365,
Sibley,
Renville,
McLeod
and
Nicollet
Counties,
Minnesota,
General
Obligation
School
Building
Bonds,
Series
2023A
5
.000
02/01/48
2,640,928
700,000
Greenway
Independent
School
District
316,
Itasca
County,
Minnesota,
General
Obligation
Bonds,
Facilities
Maintenance
Series
2019F
0
.000
02/01/30
582,270
Portfolio
of
Investments
November
30,
2024
(continued)
Minnesota
Municipal
Bond
PRINCIPAL
DESCRIPTION
RATE
MATURITY
VALUE
TAX
OBLIGATION/GENERAL
(continued)
$
705,000
Hawley
Independent
School
District
150,
Clay
County,
Minnesota,
General
Obligation
Bonds,
School
Building
Series
2023A
5
.000
%
02/01/39
$
761,198
2,000,000
Hennepin
County,
Minnesota,
General
Obligation
Bonds,
Refunding
Series
2022B
5
.000
12/01/39
2,276,425
3,000,000
Hennepin
County,
Minnesota,
General
Obligation
Bonds,
Sales
Tax
Series
2020C
5
.000
12/15/38
3,285,668
1,000,000
Hennepin
County,
Minnesota,
General
Obligation
Bonds,
Series
2020A
5
.000
12/01/36
1,116,374
9,755,000
Hennepin
County,
Minnesota,
General
Obligation
Bonds,
Series
2024A
5
.000
12/01/43
11,184,267
1,250,000
Independent
School
District
621,
Mounds
View,
Minnesota,
General
Obligation
Bonds,
School
Building
Series
2018A
4
.000
02/01/42
1,257,323
1,935,000
Independent
School
District
No.
115,
Cass
Lake-Bena
Public
Schools,
Minnesota,
Cass
Beltrami
and
Hubbard
Counties,
General
Obligation
School
Building
Bonds,
Series
2023A
5
.000
02/01/37
2,148,598
1,145,000
Independent
School
District
No.
2397
(Le
Sueur-Henderson),
Minnesota,
General
Obligation
School
Building
Bonds,
Series
2022A
5
.000
02/01/36
1,277,426
600,000
Jordan
Independent
School
District
717,
Scott
County,
Minnesota,
General
Obligation
Bonds,
School
Building
Series
2023A
5
.000
02/01/38
657,583
1,585,000
Kerkoven,
Murdock,
and
Sunburg
Independent
School
District
775,
Swift
County,
Minnesota,
General
Obligation
Bonds,
School
Building
Series
2024A
5
.000
02/01/41
1,769,315
500,000
La
Crescent-Hokah
Independent
School
District
300,
Houston
and
Winona
Counties,
Minnesota,
General
Obligation
Bonds,
School
Building
&
Maintenance
Series
2019A
4
.000
02/01/30
515,280
660,000
Madison,
Minnesota,
General
Obligation
Bonds,
Refunding
Series
2015A
-
AGM
Insured
3
.600
01/01/35
658,482
500,000
Madison,
Minnesota,
General
Obligation
Bonds,
Refunding
Series
2015A
-
AGM
Insured
4
.000
01/01/45
500,103
1,315,000
Maple
River
Independent
School
District
2135,
Minnesota,
General
Obligation
Bonds,
School
Building
Series
2020A
4
.000
02/01/38
1,350,607
3,500,000
Maple
River
Independent
School
District
2135,
Minnesota,
General
Obligation
Bonds,
School
Building
Series
2020A
4
.000
02/01/50
3,474,493
1,590,000
Medicine
Lake,
Minnesota,
General
Obligation
Bonds,
Series
2024A
5
.000
02/01/54
1,609,759
1,430,000
Minneapolis
Special
School
District
1,
Hennepin
County,
Minnesota,
General
Obligation
Bonds,
Building
Series
2023A
5
.000
02/01/43
1,581,112
2,645,000
Minneapolis
Special
School
District
1,
Hennepin
County,
Minnesota,
General
Obligation
Bonds,
Long
Term
Facilities
Maintenance
Series
2023B
5
.000
02/01/43
2,924,504
2,780,000
Minneapolis
Special
School
District
1,
Hennepin
County,
Minnesota,
General
Obligation
Bonds,
Long
Term
Facilities
Maintenance
Series
2023B
5
.000
02/01/44
3,065,263
1,430,000
Minneapolis
Special
School
District
1,
Hennepin
County,
Minnesota,
General
Obligation
Bonds,
School
Building
Series
2022A
5
.000
02/01/43
1,566,117
2,195,000
Minneapolis,
Minnesota,
General
Obligation
Bonds,
Improvement
&
Various
Purpose
Series
2018
4
.000
12/01/35
2,236,531
2,000,000
Minneapolis,
Minnesota,
General
Obligation
Bonds,
Series
2023
5
.000
12/01/39
2,236,041
5,000,000
Minnesota
State,
General
Obligation
Bonds,
State
Trunk
Highway
Series
2024B
5
.000
08/01/26
5,190,336
2,975,000
Minnesota
State,
General
Obligation
Bonds,
Various
Purpose
Series
2018A
5
.000
08/01/35
3,198,938
4,705,000
Minnesota
State,
General
Obligation
Bonds,
Various
Purpose
Series
2021A
5
.000
09/01/30
5,302,703
2,000,000
Minnesota
State,
General
Obligation
Bonds,
Various
Purpose
Series
2023A
5
.000
08/01/41
2,272,908
7,500,000
Minnesota
State,
General
Obligation
Bonds,
Various
Purpose
Series
2024A
5
.000
08/01/43
8,514,115
325,000
Minnetonka
Independent
School
District
276,
Hennepin
County,
Minnesota,
General
Obligation
Bonds,
Facilities
Maintenance
Series
2023B
5
.000
02/01/40
358,652
PRINCIPAL
DESCRIPTION
RATE
MATURITY
VALUE
TAX
OBLIGATION/GENERAL
(continued)
$
500,000
Minnetonka
Independent
School
District
276,
Hennepin
County,
Minnesota,
General
Obligation
Bonds,
Facilities
Maintenance
Series
2023B
5
.000
%
02/01/42
$
547,344
1,000,000
Minnetonka
Independent
School
District
276,
Hennepin
County,
Minnesota,
General
Obligation
Bonds,
Refunding
Alternative
Facilities
Series
2018E
5
.000
02/01/35
1,003,039
250,000
Montgomery
Independent
School
District
2905,
Minnesota,
General
Obligation
Bonds,
School
Building
Series
2018A
4
.000
02/01/32
250,146
500,000
Montgomery
Independent
School
District
2905,
Minnesota,
General
Obligation
Bonds,
School
Building
Series
2018A
4
.000
02/01/36
500,291
1,290,000
Moorhead
Independent
School
District
152,
Clay
County,
Minnesota,
General
Obligation
Bonds,
School
Building
Series
2020A
3
.000
02/01/43
1,148,218
1,100,000
Moorhead
Independent
School
District
152,
Clay
County,
Minnesota,
General
Obligation
Bonds,
School
Building
Series
2020A
3
.000
02/01/44
968,723
2,000,000
North
Saint
Paul-Maplewood-Oakdale
Independent
School
District
622,
Ramsey
County,
Minnesota,
General
Obligation
Bonds,
Facilities
Maintenance
Series
2018A
3
.375
02/01/35
2,003,593
530,000
Pillager
Independent
School
District
116,
Cass
and
Morrison
Counties,
Minnesota,
General
Obligation
Bonds,
School
Building
Series
2019A
3
.000
02/01/33
526,383
1,245,000
Ramsey
County,
Minnesota,
General
Obligation
Bonds,
Capital
Improvement
Plan,
Series
2023B
4
.000
02/01/40
1,296,577
1,795,000
Red
Lake
County,
Minnesota,
General
Obligation
School
Building
Bonds,
Independent
School
District
No.
2906,
Series
2022A
4
.000
02/01/38
1,870,803
4,000,000
Richfield
Independent
School
District
280,
Hennepin
County,
Minnesota,
General
Obligation
Bonds,
School
Buildings
Series
2018A
4
.000
02/01/40
4,032,651
1,250,000
Robbinsdale
Independent
School
District
281,
Hennepin
County,
Minnesota,
General
Obligation
Bonds,
Facilities
Maintenance
Series
2018A
3
.000
02/01/30
1,254,076
4,000,000
Roseville
Independent
School
District
623,
Ramsey
County,
Minnesota,
General
Obligation
Bonds,
School
Building
Series
2018A
4
.000
02/01/34
4,099,155
1,020,000
Round
Lake-Brewster
Independent
School
District
2907,
Minnesota,
General
Obligation
Bonds,
School
Building
Series
2023A
5
.000
02/01/39
1,125,190
1,285,000
Round
Lake-Brewster
Independent
School
District
2907,
Minnesota,
General
Obligation
Bonds,
School
Building
Series
2023A
4
.000
02/01/42
1,302,240
1,700,000
Russell-Tyler-Ruthton
Public
Schools
Independent
School
District
2902,
Minnesota,
General
Obligation
Bonds,
Series
2019A
4
.000
02/01/31
1,786,742
800,000
Saint
Cloud
Independent
School
District
742,
Stearns
County,
Minnesota,
General
Obligation
Bonds,
Facilities
Maintenance
Series
2022B
4
.000
02/01/43
806,734
1,000,000
Saint
James
Independent
School
District
840,
Minnesota,
General
Obligation
Bonds,
School
Building
Series
2015B
4
.000
02/01/45
1,002,239
1,340,000
Saint
Michael
Independent
School
District
885,
Wright
County,
Minnesota,
General
Obligation
Bonds,
School
Building
Series
2017A
4
.000
02/01/28
1,359,928
1,400,000
Saint
Michael
Independent
School
District
885,
Wright
County,
Minnesota,
General
Obligation
Bonds,
School
Building
Series
2017A
4
.000
02/01/30
1,420,379
1,885,000
Saint
Michael
Independent
School
District
885,
Wright
County,
Minnesota,
General
Obligation
Bonds,
School
Building
Series
2017A
3
.200
02/01/32
1,891,302
1,840,000
Sartell,
Minnesota,
General
Obligation
Bonds,
Series
2022A
4
.000
02/01/41
1,863,221
1,180,000
Sartell,
Minnesota,
General
Obligation
Bonds,
Series
2022A
4
.000
02/01/43
1,191,588
250,000
Shakopee
Independent
School
District
720,
Scott
County,
Minnesota,
General
Obligation
Bonds,
Capital
Facilities
Series
2020A
4
.000
02/01/33
256,488
425,000
Shakopee
Independent
School
District
720,
Scott
County,
Minnesota,
General
Obligation
Bonds,
Capital
Facilities
Series
2020A
4
.000
02/01/34
435,986
Portfolio
of
Investments
November
30,
2024
(continued)
Minnesota
Municipal
Bond
PRINCIPAL
DESCRIPTION
RATE
MATURITY
VALUE
TAX
OBLIGATION/GENERAL
(continued)
$
2,500,000
Sibley
East
Independent
School
District
2310,
Sibley,
Minnesota,
General
Obligation
Bonds,
School
Building
Series
2015A
4
.000
%
02/01/40
$
2,501,835
1,330,000
South
Washington
County
Independent
School
District
833,
Minnesota,
General
Obligation
Bonds,
Facilities
Maintenance
Series
2018A
4
.000
02/01/31
1,357,978
670,000
South
Washington
County
Independent
School
District
833,
Minnesota,
General
Obligation
Bonds,
Facilities
Maintenance
Series
2018A
4
.000
02/01/33
682,717
1,000,000
South
Washington
County
Independent
School
District
833,
Minnesota,
General
Obligation
Bonds,
Facilities
Maintenance
Series
2022A
4
.000
02/01/34
1,032,399
2,030,000
South
Washington
County
Independent
School
District
833,
Minnesota,
General
Obligation
Bonds,
Facilities
Maintenance
Series
2022A
4
.000
02/01/35
2,098,339
1,000,000
South
Washington
County
Independent
School
District
833,
Minnesota,
General
Obligation
Bonds,
School
Building
Series
2016A
4
.000
02/01/29
1,011,679
825,000
Waconia
Independent
School
District,
Minnesota,
General
Obligation
Bonds,
School
Building
Series
2015B
3
.000
02/01/28
820,721
1,315,000
Waseca
Independent
School
District
829,
Steele,
Rice,
and
Waseca
Counties,
Minnesota,
General
Obligation
Bonds,
School
Buidling
Series
2015A
4
.000
02/01/27
1,333,142
TOTAL
TAX
OBLIGATION/GENERAL
170,869,891
TAX
OBLIGATION/LIMITED
-
10.8%
750,000
Duluth
Independent
School
District
709,
Minnesota,
Certificates
of
Participation,
Refunding
Full
Term
Series
2019B
5
.000
02/01/25
752,142
325,000
Elbow
Lake
Economic
Development
Authority,
Minnesota,
Lease
Revenue
Bonds,
Grant
County
Public
Project,
Series
2017A
4
.200
12/15/43
309,417
1,000,000
Elbow
Lake
Economic
Development
Authority,
Minnesota,
Lease
Revenue
Bonds,
Grant
County
Public
Project,
Series
2023A
4
.875
12/15/42
1,027,104
500,000
Elbow
Lake
Economic
Development
Authority,
Minnesota,
Lease
Revenue
Bonds,
Grant
County
Public
Project,
Series
2023A
5
.000
12/15/44
516,955
1,000,000
Hennepin
County,
Minnesota,
Sales
Tax
Revenue
Bonds,
Ballpark
Project,
Refunding
First
Lien
Series
2017A
5
.000
12/15/30
1,041,727
675,000
Marshall,
Minnesota,
Education
Services
Facility,
Lease
Revenue
Bonds,
Southwest
West
Central
Service
Cooperatives,
Series
2024A
5
.125
02/01/41
694,106
725,000
Marshall,
Minnesota,
Education
Services
Facility,
Lease
Revenue
Bonds,
Southwest
West
Central
Service
Cooperatives,
Series
2024A
5
.375
02/01/45
746,523
425,000
Minneapolis,
Minnesota,
Tax
Increment
Revenue
Bonds,
Village
at
St.
Anthony
Falls
Project,
Refunding
Series
2015
4
.000
03/01/27
425,019
1,090,000
Minnesota
Housing
Finance
Agency,
Housing
Infrastructure
State
Appropriation
Bonds,
Series
2015C
3
.250
08/01/30
1,090,009
200,000
Minnesota
Housing
Finance
Agency,
Housing
Infrastructure
State
Appropriation
Bonds,
Series
2017A
4
.000
08/01/30
202,704
475,000
Minnesota
Housing
Finance
Agency,
Housing
Infrastructure
State
Appropriation
Bonds,
Series
2017A
4
.000
08/01/34
480,511
325,000
Minnesota
Housing
Finance
Agency,
Housing
Infrastructure
State
Appropriation
Bonds,
Series
2017A
4
.000
08/01/35
329,565
1,125,000
Minnesota
Housing
Finance
Agency,
Housing
Infrastructure
State
Appropriation
Bonds,
Series
2018D
4
.000
08/01/38
1,141,345
500,000
Minnesota
Housing
Finance
Agency,
Housing
Infrastructure
State
Appropriation
Bonds,
Series
2021B
3
.000
08/01/38
463,180
500,000
Minnesota
Housing
Finance
Agency,
Housing
Infrastructure
State
Appropriation
Bonds,
Series
2021B
3
.000
08/01/39
457,399
500,000
Minnesota
Housing
Finance
Agency,
Housing
Infrastructure
State
Appropriation
Bonds,
Series
2021B
3
.000
08/01/40
450,328
2,810,000
Minnesota
Housing
Finance
Agency,
Housing
Infrastructure
State
Appropriation
Bonds,
Series
2021C
4
.000
08/01/35
2,918,376
2,925,000
Minnesota
Housing
Finance
Agency,
Housing
Infrastructure
State
Appropriation
Bonds,
Series
2021C
4
.000
08/01/36
3,020,273
3,045,000
Minnesota
Housing
Finance
Agency,
Housing
Infrastructure
State
Appropriation
Bonds,
Series
2021C
4
.000
08/01/37
3,119,937
PRINCIPAL
DESCRIPTION
RATE
MATURITY
VALUE
TAX
OBLIGATION/LIMITED
(continued)
$
3,165,000
Minnesota
Housing
Finance
Agency,
Housing
Infrastructure
State
Appropriation
Bonds,
Series
2021C
4
.000
%
08/01/38
$
3,230,714
1,000,000
Minnesota
Housing
Finance
Agency,
Housing
Infrastructure
State
Appropriation
Bonds,
Series
2021C
4
.000
08/01/43
1,000,963
1,780,000
Minnesota
Housing
Finance
Agency,
Housing
Infrastructure
State
Appropriation
Bonds,
Series
2022A
5
.000
08/01/40
1,963,933
2,000,000
Minnesota
Housing
Finance
Agency,
Housing
Infrastructure
State
Appropriation
Bonds,
Series
2022C
5
.000
08/01/42
2,196,282
1,280,000
Minnesota
Housing
Finance
Agency,
Housing
Infrastructure
State
Appropriation
Bonds,
Series
2023A
5
.000
08/01/42
1,405,593
1,200,000
Minnesota
Housing
Finance
Agency,
Housing
Infrastructure
State
Appropriation
Bonds,
Series
2023A
5
.000
08/01/44
1,309,009
5,800,000
Minnesota
State,
Certificates
of
Participation,
State
Office
Building
Project,
Series
2023
5
.000
11/01/43
6,447,019
1,480,000
New
London
Economic
Development
Authority,
Minnesota,
Lease
Revenue
Bonds,
SWWC
Service
Cooperative
Lease
With
Option
to
Purchase
Project,
Public
Series
2023
5
.000
02/01/38
1,507,186
2,790,000
New
London
Economic
Development
Authority,
Minnesota,
Lease
Revenue
Bonds,
SWWC
Service
Cooperative
Lease
With
Option
to
Purchase
Project,
Public
Series
2023
5
.125
02/01/43
2,839,070
1,470,000
Northeast
Metropolitan
Intermediate
School
District
916,
White
Bear
Lake,
Minnesota,
Certificates
of
Particpation,
Series
2015A
3
.625
02/01/34
1,470,161
580,000
Northeast
Metropolitan
Intermediate
School
District
916,
White
Bear
Lake,
Minnesota,
Certificates
of
Particpation,
Series
2015A
3
.750
02/01/36
580,184
4,600,000
Northeast
Metropolitan
Intermediate
School
District
916,
White
Bear
Lake,
Minnesota,
Certificates
of
Particpation,
Series
2015B
4
.000
02/01/42
4,599,671
1,000,000
Plymouth
Intermediate
District
287,
Minnesota,
Certificates
of
Participation,
Refunding
Series
2017A
4
.000
02/01/36
1,009,959
175,000
Plymouth
Intermediate
District
287,
Minnesota,
Facilities
Maintence
Bonds,
Series
2017B
4
.000
05/01/29
179,124
200,000
Plymouth
Intermediate
District
287,
Minnesota,
Facilities
Maintence
Bonds,
Series
2017B
4
.000
05/01/32
204,468
100,000
Plymouth
Intermediate
District
287,
Minnesota,
Facilities
Maintence
Bonds,
Series
2017B
4
.000
05/01/33
102,140
4,500,000
Puerto
Rico
Sales
Tax
Financing
Corporation,
Sales
Tax
Revenue
Bonds,
Restructured
2018A-1
4
.500
07/01/34
4,514,696
6,077,000
Puerto
Rico
Sales
Tax
Financing
Corporation,
Sales
Tax
Revenue
Bonds,
Restructured
2018A-1
5
.000
07/01/58
6,104,431
1,155,000
Roseville
Independent
School
District
623,
Ramsey
County,
Minnesota,
Certificates
of
Participation,
Series
2021A
5
.000
04/01/29
1,216,404
355,000
Saint
Cloud
Independent
School
District
742,
Stearns
County,
Minnesota,
Certificates
of
Participation,
Saint
Cloud
Area
Public
Schools,
Series
2017A
5
.000
02/01/32
356,059
520,000
Saint
Cloud
Independent
School
District
742,
Stearns
County,
Minnesota,
Certificates
of
Participation,
Saint
Cloud
Area
Public
Schools,
Series
2017A
5
.000
02/01/34
521,542
30,000
Saint
Paul
Housing
and
Redevelopment
Authority,
Minnesota,
Multifamily
Housing
Revenue
Bonds,
2700
University
at
Westgate
Station,
Series
2015B
4
.250
04/01/25
29,964
430,000
Saint
Paul
Housing
and
Redevelopment
Authority,
Minnesota,
Multifamily
Housing
Revenue
Bonds,
2700
University
at
Westgate
Station,
Series
2015B
4
.875
04/01/30
430,121
1,405,000
Saint
Paul
Housing
and
Redevelopment
Authority,
Minnesota,
Multifamily
Housing
Revenue
Bonds,
2700
University
at
Westgate
Station,
Series
2015B
5
.250
04/01/43
1,404,985
2,670,000
Saint
Paul
Independent
School
District
625,
Ramsey
County,
Minnesota,
Certificates
of
Participation,
Series
2018B
3
.375
02/01/35
2,676,001
5,000
Saint
Paul
Independent
School
District
625,
Ramsey
County,
Minnesota,
Certificates
of
Participation,
Series
2019B
4
.000
02/01/36
5,161
1,000,000
Saint
Paul
Independent
School
District
625,
Ramsey
County,
Minnesota,
Certificates
of
Participation,
Series
2019B
4
.000
02/01/37
1,035,670
500,000
Saint
Paul
Independent
School
District
625,
Ramsey
County,
Minnesota,
Certificates
of
Participation,
Series
2024A
5
.000
02/01/43
558,757
2,500,000
Saint
Paul,
Minnesota,
Sales
Tax
Revenue
Bonds,
Neighborhood
and
Economic
Development
Projects,
Refunding
Series
2024C
5
.000
11/01/42
2,792,424
Portfolio
of
Investments
November
30,
2024
(continued)
Minnesota
Municipal
Bond
PRINCIPAL
DESCRIPTION
RATE
MATURITY
VALUE
TAX
OBLIGATION/LIMITED
(continued)
$
375,000
Zumbro
Education
District
6012,
Minnesota,
Certificates
of
Participation
Series
2021A
4
.000
%
02/01/26
$
374,281
320,000
Zumbro
Education
District
6012,
Minnesota,
Certificates
of
Participation
Series
2021A
4
.000
02/01/28
319,697
330,000
Zumbro
Education
District
6012,
Minnesota,
Certificates
of
Participation
Series
2021A
4
.000
02/01/30
328,190
435,000
Zumbro
Education
District
6012,
Minnesota,
Certificates
of
Participation
Series
2021A
4
.000
02/01/41
398,234
TOTAL
TAX
OBLIGATION/LIMITED
72,298,713
TRANSPORTATION
-
7.7%
1,000,000
Minneapolis-St.
Paul
Metropolitan
Airports
Commission,
Minnesota,
Airport
Revenue
Bonds,
Refunding
Subordinate
Lien
Series
2019A
5
.000
01/01/33
1,083,253
1,560,000
Minneapolis-St.
Paul
Metropolitan
Airports
Commission,
Minnesota,
Airport
Revenue
Bonds,
Refunding
Subordinate
Lien
Series
2019A
5
.000
01/01/49
1,628,983
1,540,000
Minneapolis-St.
Paul
Metropolitan
Airports
Commission,
Minnesota,
Airport
Revenue
Bonds,
Refunding
Subordinate
Lien
Series
2019B,
(AMT)
5
.000
01/01/31
1,632,500
1,500,000
Minneapolis-St.
Paul
Metropolitan
Airports
Commission,
Minnesota,
Airport
Revenue
Bonds,
Refunding
Subordinate
Lien
Series
2019B,
(AMT)
5
.000
01/01/32
1,583,717
1,000,000
Minneapolis-St.
Paul
Metropolitan
Airports
Commission,
Minnesota,
Airport
Revenue
Bonds,
Refunding
Subordinate
Lien
Series
2019B,
(AMT)
5
.000
01/01/35
1,050,533
1,235,000
Minneapolis-St.
Paul
Metropolitan
Airports
Commission,
Minnesota,
Airport
Revenue
Bonds,
Refunding
Subordinate
Lien
Series
2019B,
(AMT)
5
.000
01/01/39
1,284,100
5,600,000
Minneapolis-St.
Paul
Metropolitan
Airports
Commission,
Minnesota,
Airport
Revenue
Bonds,
Refunding
Subordinate
Lien
Series
2019B,
(AMT)
5
.000
01/01/44
5,770,377
7,370,000
Minneapolis-St.
Paul
Metropolitan
Airports
Commission,
Minnesota,
Airport
Revenue
Bonds,
Refunding
Subordinate
Lien
Series
2019B,
(AMT)
5
.000
01/01/49
7,602,334
8,145,000
Minneapolis-St.
Paul
Metropolitan
Airports
Commission,
Minnesota,
Airport
Revenue
Bonds,
Senior
Lien
Series
2016C
5
.000
01/01/46
8,340,860
475,000
Minneapolis-St.
Paul
Metropolitan
Airports
Commission,
Minnesota,
Airport
Revenue
Bonds,
Subordinate
Lien
Series
2016D,
(AMT)
5
.000
01/01/34
486,833
2,000,000
Minneapolis-St.
Paul
Metropolitan
Airports
Commission,
Minnesota,
Airport
Revenue
Bonds,
Subordinate
Lien
Series
2022A
5
.000
01/01/52
2,123,741
2,510,000
Minneapolis-St.
Paul
Metropolitan
Airports
Commission,
Minnesota,
Airport
Revenue
Bonds,
Subordinate
Lien
Series
2022B,
(AMT)
5
.000
01/01/40
2,664,263
11,300,000
Minneapolis-St.
Paul
Metropolitan
Airports
Commission,
Minnesota,
Airport
Revenue
Bonds,
Subordinate
Lien
Series
2022B,
(AMT)
5
.000
01/01/47
11,775,762
4,000,000
Minneapolis-St.
Paul
Metropolitan
Airports
Commission,
Minnesota,
Airport
Revenue
Bonds,
Subordinate
Series
2024A,
(AMT)
5
.250
01/01/49
4,328,431
TOTAL
TRANSPORTATION
51,355,687
U.S.
GUARANTEED
-
0.5%
(b)
1,600,000
St.
Paul
Housing
and
Redevelopment
Authority,
Minnesota,
Hospital
Revenue
Bonds,
HealthEast
Inc.,
Series
2015A,
(Pre-
refunded
11/15/25)
5
.000
11/15/40
1,629,683
1,530,000
Worthington
Independent
School
District
518,
Nobles
County,
Minnesota,
Certificates
of
Participation,
Series
2017A,
(Pre-
refunded
2/01/26)
4
.000
02/01/42
1,546,334
TOTAL
U.S.
GUARANTEED
3,176,017
PRINCIPAL
DESCRIPTION
RATE
MATURITY
VALUE
UTILITIES
-
9.2%
$
1,240,000
Guam
Government
Waterworks
Authority,
Water
and
Wastewater
System
Revenue
Bonds,
Series
2016
5
.000
%
01/01/46
$
1,257,143
135,000
Guam
Government
Waterworks
Authority,
Water
and
Wastewater
System
Revenue
Bonds,
Series
2020A
5
.000
01/01/50
140,504
2,275,000
Minnesota
Municipal
Gas
Agency,
Commodity
Supply
Revenue
Bonds,
Series
2022A,
(Mandatory
Put
12/01/27)
4
.000
12/01/52
2,308,533
5,000,000
(c)
Minnesota
Municipal
Gas
Agency,
Commodity
Supply
Revenue
Bonds,
Series
2022B,
(Mandatory
Put
12/01/27)
(SOFR*0.67%+
1.000%)
4
.062
12/01/52
5,009,588
1,000,000
Minnesota
Municipal
Power
Agency,
Electric
Revenue
Bonds,
Refunding
Series
2014A
4
.000
10/01/31
1,000,597
1,000,000
Minnesota
Municipal
Power
Agency,
Electric
Revenue
Bonds,
Refunding
Series
2014A
4
.000
10/01/32
1,000,538
4,650,000
Minnesota
Municipal
Power
Agency,
Electric
Revenue
Bonds,
Series
2016
5
.000
10/01/47
4,730,761
5,555,000
Rochester,
Minnesota,
Electric
Utility
Revenue
Bonds,
Refunding
Series
2017A
5
.000
12/01/47
5,679,450
390,000
Saint
Paul
Housing
and
Redevelopment
Authority,
Minnesota,
District
Energy
Revenue
Bonds,
Refunding
Series
2017A
4
.000
10/01/28
399,364
1,610,000
Saint
Paul
Housing
and
Redevelopment
Authority,
Minnesota,
District
Energy
Revenue
Bonds,
Refunding
Series
2017A
4
.000
10/01/33
1,632,884
355,000
Saint
Paul
Housing
and
Redevelopment
Authority,
Minnesota,
District
Energy
Revenue
Bonds,
Refunding
Series
2017B
4
.000
10/01/28
363,523
270,000
Saint
Paul
Housing
and
Redevelopment
Authority,
Minnesota,
District
Energy
Revenue
Bonds,
Refunding
Series
2017B
4
.000
10/01/29
276,712
2,500,000
Saint
Paul
Port
Authority,
Minnesota,
District
Energy
Revenue
Bonds,
Series
2017-3
4
.000
10/01/42
2,422,209
1,180,000
Saint
Paul
Port
Authority,
Minnesota,
District
Energy
Revenue
Bonds,
Series
2017-4,
(AMT)
4
.000
10/01/40
1,093,054
300,000
Saint
Paul
Port
Authority,
Minnesota,
District
Energy
Revenue
Bonds,
Series
2021-1.
501
C3
3
.000
10/01/34
277,965
1,100,000
Saint
Paul
Port
Authority,
Minnesota,
District
Energy
Revenue
Bonds,
Series
2021-2,
(AMT)
4
.000
10/01/40
1,018,949
1,250,000
Saint
Paul
Port
Authority,
Minnesota,
District
Energy
Revenue
Bonds,
Series
2023-3,
(AMT)
5
.250
10/01/42
1,321,619
1,325,000
Saint
Paul
Port
Authority,
Minnesota,
District
Energy
Revenue
Bonds,
Series
2024-1
5
.000
10/01/45
1,420,904
1,250,000
Saint
Paul
Port
Authority,
Minnesota,
District
Energy
Revenue
Bonds,
Series
2024-1
5
.000
10/01/46
1,340,082
4,905,000
Saint
Paul,
Minnesota,
Water
Revenue
Bonds,
Series
2023A
4
.000
12/01/47
5,028,806
1,175,000
Sauk
Centre
Public
Utilities
Commission,
Minnesota,
Electric
Revenue
Bonds,
Series
2024A
-
AGM
Insured
4
.375
12/01/49
1,195,994
4,770,000
Southern
Minnesota
Municipal
Power
Agency,
Power
Supply
System
Revenue
Bonds,
Series
1994A
-
NPFG
Insured
0
.000
01/01/25
4,755,236
6,230,000
Southern
Minnesota
Municipal
Power
Agency,
Power
Supply
System
Revenue
Bonds,
Series
1994A
-
NPFG
Insured
0
.000
01/01/26
5,990,453
230,000
Thief
River
Falls,
Minnesota,
Electric
Revenue
Bonds,
Series
2018A
-
AGM
Insured
4
.000
02/01/35
233,599
260,000
Thief
River
Falls,
Minnesota,
Electric
Revenue
Bonds,
Series
2018A
-
AGM
Insured
4
.000
02/01/38
262,168
11,265,000
Western
Minnesota
Municipal
Power
Agency,
Minnesota,
Power
Supply
Revenue
Bonds,
Series
2018A
5
.000
01/01/49
11,720,890
TOTAL
UTILITIES
61,881,525
TOTAL
MUNICIPAL
BONDS
(Cost
$650,836,789)
650,576,905
TOTAL
LONG-TERM
INVESTMENTS
(Cost
$650,836,789)
650,576,905
Portfolio
of
Investments
November
30,
2024
(continued)
Minnesota
Municipal
Bond
PRINCIPAL
DESCRIPTION
RATE
MATURITY
VALUE
SHORT-TERM
INVESTMENTS
-
1.5%
X
10,045,000
MUNICIPAL
BONDS
-
1.5%
X
–
EDUCATION
AND
CIVIC
ORGANIZATIONS
-
0.2%
$
1,350,000
(d)
Minneapolis,
Minnesota,
Revenue
Bonds,
University
Gateway
Project,
Refunding
Series
2009
2
.850
%
12/01/40
$
1,350,000
TOTAL
EDUCATION
AND
CIVIC
ORGANIZATIONS
1,350,000
HEALTH
CARE
-
0.4%
2,895,000
(d)
Minneapolis,
Minnesota,
Health
Care
System
Revenue
Bonds,
Fairview
Health
Services,
Series
2018A
3
.250
11/15/48
2,895,000
TOTAL
HEALTH
CARE
2,895,000
TAX
OBLIGATION/GENERAL
-
0.9%
5,800,000
(d)
Hennepin
County,
Minnesota,
General
Obligation
Bonds,
Variable
Rate
Series
2018B
2
.800
12/01/38
5,800,000
TOTAL
TAX
OBLIGATION/GENERAL
5,800,000
TOTAL
MUNICIPAL
BONDS
(Cost
$10,045,000)
10,045,000
TOTAL
SHORT-TERM
INVESTMENTS
(Cost
$10,045,000)
10,045,000
TOTAL
INVESTMENTS
-
98.7%
(Cost
$660,881,789)
660,621,905
OTHER
ASSETS
&
LIABILITIES,
NET
-
1.3%
8,712,446
NET
ASSETS
-
100%
$
669,334,351
(a)
Security
is
exempt
from
registration
under
Rule
144A
of
the
Securities
Act
of
1933,
as
amended.
These
securities
are
deemed
liquid
and
may
be
resold
in
transactions
exempt
from
registration,
which
are
normally
those
transactions
with
qualified
institutional
buyers.
As
of
the
end
of
the
reporting
period,
the
aggregate
value
of
these
securities
is
$11,302,154
or
1.7%
of
Total
Investments.
(b)
Backed
by
an
escrow
or
trust
containing
sufficient
U.S.
Government
or
U.S.
Government
agency
securities,
which
ensure
the
timely
payment
of
principal
and
interest.
(c)
Variable
rate
security.
The
rate
shown
is
the
coupon
as
of
the
end
of
the
reporting
period.
(d)
Investment
has
a
maturity
of
greater
than
one
year,
but
has
variable
rate
and/or
demand
features
which
qualify
it
as
a
short-term
investment.
The
rate
disclosed,
as
well
as
the
reference
rate
and
spread,
where
applicable,
is
that
in
effect
as
of
the
end
of
the
reporting
period.
This
rate
changes
periodically
based
on
market
conditions
or
a
specified
market
index.
AMT
Alternative
Minimum
Tax
SOFR
Secured
Overnight
Financing
Rate
See
Notes
to
Financial
Statements.
Portfolio
of
Investments
November
30,
2024
Nebraska
Municipal
Bond
(Unaudited)
PRINCIPAL
DESCRIPTION
RATE
MATURITY
VALUE
LONG-TERM
INVESTMENTS
-
99.4%
X
74,181,667
MUNICIPAL
BONDS
-
99.4%
X
–
EDUCATION
AND
CIVIC
ORGANIZATIONS
-
10.7%
$
1,250,000
Douglas
County,
Nebraska,
Educational
Facilities
Revenue
Bonds,
Creighton
University
Projects,
Refunding
Series
2017
5
.000
%
07/01/47
$
1,279,462
1,195,000
Nebraska
State
Colleges
Facilities
Corporation,
Nebraska,
Revenue
Bonds,
Facilities
Program
Series
2022B
-
AGM
Insured
5
.000
07/15/37
1,309,045
1,000,000
Nebraska
State
Colleges,
Student
Fees
and
Facilities
Revenue
Bonds,
Board
of
Trustees,
Wayne
State
College
Series
2023
-
AGM
Insured
5
.000
07/01/48
1,074,510
360,000
Saline
County,
Nebraska,
Educational
Facilities
Revenue
Bonds,
Doane
College
Project,
Refunding
Series
2020A
3
.000
02/15/34
341,532
445,000
Saline
County,
Nebraska,
Educational
Facilities
Revenue
Bonds,
Doane
College
Project,
Refunding
Series
2020A
3
.000
02/15/35
419,142
500,000
Southeast
Community
College
Area,
Nebraska,
Facilities
Revenue
Bonds,
Series
2020
-
AGM
Insured
3
.000
03/15/45
404,937
1,000,000
University
of
Nebraska
Facilities
Corporation,
Nebraska,
Facilities
Bonds,
Refunding
Series
2017B
4
.000
05/15/37
1,012,972
2,000,000
University
of
Nebraska
Facilities
Corporation,
Nebraska,
Facilities
Program
Bonds,
Green
Series
2021B
5
.000
07/15/51
2,136,314
TOTAL
EDUCATION
AND
CIVIC
ORGANIZATIONS
7,977,914
HEALTH
CARE
-
9.3%
575,000
Douglas
County
Hospital
Authority
2,
Nebraska,
Health
Facilities
Revenue
Bonds,
Children's
Hospital
Obligated
Group,
Refunding
Series
2020A
4
.000
11/15/40
577,958
300,000
Douglas
County
Hospital
Authority
2,
Nebraska,
Health
Facilities
Revenue
Bonds,
Children's
Hospital
Obligated
Group,
Refunding
Series
2020A
4
.000
11/15/41
300,271
180,000
Douglas
County
Hospital
Authority
2,
Nebraska,
Health
Facilities
Revenue
Bonds,
Children's
Hospital
Obligated
Group,
Series
2017
5
.000
11/15/37
186,475
500,000
Douglas
County
Hospital
Authority
2,
Nebraska,
Health
Facilities
Revenue
Bonds,
Children's
Hospital
Obligated
Group,
Series
2017
5
.000
11/15/47
509,548
775,000
Douglas
County
Hospital
Authority
2,
Nebraska,
Hospital
Revenue
Bonds,
Madonna
Rehabilitation
Hospital
Project,
Series
2014
5
.000
05/15/44
775,089
500,000
Douglas
County
Hospital
Authority
3,
Nebraska,
Health
Facilities
Revenue
Bonds,
Nebraska
Methodist
Health
System,
Refunding
Series
2015
4
.125
11/01/36
500,457
2,000,000
Douglas
County
Hospital
Authority
3,
Nebraska,
Health
Facilities
Revenue
Bonds,
Nebraska
Methodist
Health
System,
Refunding
Series
2015
5
.000
11/01/45
2,016,300
250,000
Madison
County
Hospital
Authority
1,
Nebraska,
Hospital
Revenue
Bonds,
Faith
Regional
Health
Services
Project,
Refunding
Series
2017A
5
.000
07/01/30
257,300
500,000
Madison
County
Hospital
Authority
1,
Nebraska,
Hospital
Revenue
Bonds,
Faith
Regional
Health
Services
Project,
Series
2018
5
.000
07/01/34
500,646
435,000
Madison
County
Hospital
Authority
1,
Nebraska,
Hospital
Revenue
Bonds,
Faith
Regional
Health
Services
Project,
Series
2018
5
.000
07/01/35
435,440
875,000
Scotts
Bluff
County
Hospital
Authority
1,
Nebraska,
Hospital
Revenue
Bonds,
Regional
West
Medical
Center
Project,
Refunding
&
Improvement
Series
2016A
5
.250
02/01/37
856,253
TOTAL
HEALTH
CARE
6,915,737
HOUSING/SINGLE
FAMILY
-
1.0%
660,000
Nebraska
Investment
Finance
Authority,
Single
Family
Housing
Revenue
Bonds,
Refunding
Series
2016A
3
.500
09/01/36
650,774
100,000
Nebraska
Investment
Finance
Authority,
Single
Family
Housing
Revenue
Bonds,
Series
2021A
1
.850
09/01/35
78,462
45,000
Nebraska
Investment
Finance
Authority,
Single
Family
Housing
Revenue
Bonds,
Series
2021A
1
.950
09/01/37
34,650
TOTAL
HOUSING/SINGLE
FAMILY
763,886
Portfolio
of
Investments
November
30,
2024
(continued)
Nebraska
Municipal
Bond
PRINCIPAL
DESCRIPTION
RATE
MATURITY
VALUE
LONG-TERM
CARE
-
4.6%
$
3,700,000
Nebraska
Educational,
Health,
Cultural
and
Social
Services
Finance
Authority,
Revenue
Bonds,
Immanuel
Retirement
Communities
Obligated
Group,
Series
2019A
4
.000
%
01/01/49
$
3,424,918
TOTAL
LONG-TERM
CARE
3,424,918
TAX
OBLIGATION/GENERAL
-
42.9%
500,000
Adams
County,
Nebraska,
General
Obligation
Bonds,
Series
2023A
5
.000
12/15/42
520,887
1,000,000
Bellevue,
Nebraska,
Tax
Supported
Municipal
Improvement
Bonds,
Series
2024
4
.000
09/15/49
992,008
500,000
Buffalo
County
School
District
007
Kearney
Public
Schools,
Nebraska,
General
Obligation
Bonds,
School
Building
Series
2016
3
.000
12/15/36
475,311
750,000
City
of
Omaha,
Nebraska,
Special
Tax
Revenue
Redevelopment
and
Refunding
Bonds,
Series
2024A
5
.000
04/15/44
830,271
1,000,000
Custer
County
School
District
025
Broken
Bow
Public
Schools,
Nebraska,
General
Obligation
Bonds,
School
Building
Series
2024
-
BAM
Insured
5
.000
12/15/41
1,052,848
750,000
Dodge
County
School
District
1
Fremont,
Nebraska,
General
Obligation
Bonds,
Series
2023
-
AGM
Insured
5
.000
12/15/48
822,014
450,000
Douglas
County
Sanitary
and
Improvement
District
607
Deer
Crest,
Nebraska,
General
Obligation
Bonds,
Series
2024
5
.000
09/15/44
451,952
840,000
Douglas
County
School
District
059,
Nebraska,
General
Obligation
Bonds,
Bennington
Public
Schools,
School
Building
Series
2019
4
.000
06/15/33
840,152
1,000,000
Douglas
County
School
District
059,
Nebraska,
General
Obligation
Bonds,
Bennington
Public
Schools,
Series
2016
3
.375
12/15/41
936,505
500,000
Douglas
County
School
District
059,
Nebraska,
General
Obligation
Bonds,
School
Building
Series
2020B
3
.000
12/15/45
410,702
1,500,000
Douglas
County
School
District
1,
Nebraska,
General
Obligation
Bonds,
Omaha
Public
Schools
Series
2020
3
.000
12/15/43
1,327,037
1,000,000
Douglas
County
School
District
10
Elkhorn,
Nebraska,
General
Obligation
Bonds,
Series
2018
4
.000
12/15/38
1,008,451
750,000
Douglas
County
School
District
10
Elkhorn,
Nebraska,
General
Obligation
Bonds,
Series
2019
4
.000
12/15/39
762,502
1,000,000
Douglas
County
School
District
10
Elkhorn,
Nebraska,
General
Obligation
Bonds,
Series
2024
-
AGM
Insured
4
.000
12/15/45
1,003,985
405,000
Douglas
County
School
District
54,
Ralston,
Nebraska,
General
Obligation
Bonds,
Series
2023
5
.000
12/15/43
444,469
1,500,000
Douglas
County
School
District
54,
Ralston,
Nebraska,
General
Obligation
Bonds,
Series
2023
5
.000
12/15/48
1,623,859
635,000
Douglas
County
School
District
66,
Westside,
Nebraska,
General
Obligation
Bonds,
Series
2023
5
.000
12/01/41
695,102
250,000
Hall
County,
Nebraska,
Limited
Tax
Bonds,
Building
Series
2024
5
.000
12/15/40
266,711
250,000
Hall
County,
Nebraska,
Limited
Tax
Bonds,
Building
Series
2024
4
.000
12/15/44
248,229
375,000
Kearney
County
School
District
501,
Nebraska,
General
Obligation
Bonds,
Axtell
Community
Schools
School
Building
Series
2024
5
.000
12/15/39
402,095
375,000
Kearney
County
School
District
501,
Nebraska,
General
Obligation
Bonds,
Axtell
Community
Schools
School
Building
Series
2024
4
.000
12/15/44
374,386
965,000
Kearney
County,
Nebraska,
General
Obligation
Bonds,
Recreational
Facilities
Series
2022
4
.000
05/15/42
965,558
1,000,000
La
Vista,
Nebraska,
General
Obligation
Bonds,
Highway
Allocation
Pledge
Series
2023
5
.000
09/15/43
1,042,797
1,000,000
La
Vista,
Sarpy
County,
Nebraska,
Tax
Supported
Bonds,
Taxable
Refunding
Series
2022
-
AGM
Insured
5
.000
09/15/42
1,036,857
1,000,000
Lancaster
County
School
District
1,
Lincoln,
Nebraska,
General
Obligation
Bonds,
Series
2020
3
.000
01/15/43
883,020
500,000
Nance
County
School
District
30,
Nebraska,
General
Obligation
Bonds,
Twin
River
Public
School
School
Building
Series
2024
-
BAM
Insured
4
.125
12/15/49
499,999
300,000
North
Platte
Airport
Authority,
Nebraska,
General
Obligation
Bonds,
Series
2024
4
.750
12/15/44
301,167
PRINCIPAL
DESCRIPTION
RATE
MATURITY
VALUE
TAX
OBLIGATION/GENERAL
(continued)
$
500,000
Omaha,
Nebraska,
General
Obligation
Bonds,
Refunding
&
Various
Purpose
Series
2018A
4
.000
%
01/15/37
$
507,574
500,000
Omaha,
Nebraska,
General
Obligation
Bonds,
Refunding
&
Various
Purpose
Series
2019
4
.000
04/15/37
512,357
1,000,000
Omaha,
Nebraska,
General
Obligation
Bonds,
Various
Purpose
Series
2022
5
.000
04/15/41
1,104,095
500,000
Omaha,
Nebraska,
Special
Tax
Redevelopment
Bonds,
Series
2018A
5
.000
01/15/33
522,993
1,000,000
Omaha,
Nebraska,
Special
Tax
Redevelopment
Bonds,
Series
2019A
4
.000
01/15/40
1,012,353
1,000,000
Omaha,
Nebraska,
Special
Tax
Redevelopment
Bonds,
Series
2024C
4
.000
04/15/49
1,002,797
1,000,000
Otoe
County
School
District
0501
Palmyra
District
OR-1,
Nebraska,
General
Obligation
Bonds,
School
Building
Series
2022
5
.000
12/15/42
1,035,003
760,000
Papillion-LaVista
School
District
27,
Sarpy
County,
Nebraska,
General
Obligation
Bonds,
Refunding
Series
2020B
3
.000
12/01/40
694,031
1,000,000
Papillion-LaVista
School
District
27,
Sarpy
County,
Nebraska,
General
Obligation
Bonds,
Series
2023
4
.250
12/01/43
1,027,092
500,000
Sarpy
County
School
District
037
Gretna
Public
Schools,
Nebraska,
General
Obligation
Bonds,
Refunding
Series
2019C
4
.000
06/15/43
502,022
1,000,000
Sarpy
County
School
District
037
Gretna
Public
Schools,
Nebraska,
General
Obligation
Bonds,
Series
2019
5
.000
06/15/40
1,065,202
215,000
Southeast
Community
College
Area,
Nebraska,
Certificates
of
Participation,
Series
2018
5
.000
12/15/30
230,485
1,000,000
Southeast
Community
College
Area,
Nebraska,
Certificates
of
Participation,
Series
2018
5
.000
12/15/47
1,042,881
1,000,000
Wayne
County
School
District
17,
Nebraska,
General
Obligation
Bonds,
Wayne
Community
Schools,
School
Building
Series
2023
4
.250
12/15/48
1,006,373
530,000
Wayne
County
School
District
17,
Nebraska,
General
Obligation
Bonds,
Wayne
Community
Schools,
School
Building
Series
2024
5
.000
12/15/43
560,230
TOTAL
TAX
OBLIGATION/GENERAL
32,044,362
TAX
OBLIGATION/LIMITED
-
7.7%
500,000
Blair,
Nebraska,
Highway
Allocation
Fund
Pledge
Bonds,
Series
2023
4
.000
06/15/43
500,958
500,000
Columbus,
Nebraska,
Sales
Tax
Revenue
Bonds,
Police
&
Fire
Project,
Series
2018
4
.000
09/15/27
500,428
1,250,000
Douglas
County
Nebraska,
Sanitary
and
Improvement,
District
Number
608,
General
Obligation
Bonds,
North
Streams,
Series
2022
6
.000
12/15/47
1,169,511
1,060,000
Matching
Fund
Special
Purpose
Securitization
Corporation,
Virgin
Islands,
Revenue
Bonds,
Series
2022A
5
.000
10/01/28
1,105,242
500,000
Omaha
Public
Facilities
Corporation,
Nebraska,
Lease
Revenue
Bonds,
Omaha
Baseball
Stadium
Project,
Refunding
Series
2016A
4
.000
06/01/36
504,233
1,200,000
Puerto
Rico
Sales
Tax
Financing
Corporation,
Sales
Tax
Revenue
Bonds,
Restructured
2018A-1
5
.000
07/01/58
1,205,417
750,000
Puerto
Rico
Sales
Tax
Financing
Corporation,
Sales
Tax
Revenue
Bonds,
Taxable
Restructured
Cofina
Project
Series
2019A-2
4
.784
07/01/58
751,539
TOTAL
TAX
OBLIGATION/LIMITED
5,737,328
TRANSPORTATION
-
3.6%
1,000,000
Lincoln,
Nebraska,
Airport
Revenue
Bonds,
Series
2021,
(AMT)
4
.000
07/01/36
1,005,632
550,000
Omaha
Airport
Authority,
Nebraska,
Airport
Facilities
Revenue
Bonds,
Series
2017A,
(AMT)
5
.000
12/15/36
561,876
1,000,000
(a)
Omaha
Airport
Authority,
Nebraska,
Airport
Facilities
Revenue
Bonds,
Series
2024,
(AMT)
5
.250
12/15/49
1,087,351
TOTAL
TRANSPORTATION
2,654,859
U.S.
GUARANTEED
-
1.6%
(b)
750,000
Douglas
County
School
District
10
Elkhorn,
Nebraska,
General
Obligation
Bonds,
Series
2016,
(Pre-refunded
12/15/25)
4
.000
12/15/36
758,453
450,000
Omaha
Airport
Authority,
Nebraska,
Airport
Facilities
Revenue
Bonds,
Series
2017A,
(Pre-refunded
12/15/26),
(AMT)
5
.000
12/15/36
465,808
TOTAL
U.S.
GUARANTEED
1,224,261
Portfolio
of
Investments
November
30,
2024
(continued)
Nebraska
Municipal
Bond
PRINCIPAL
DESCRIPTION
RATE
MATURITY
VALUE
UTILITIES
-
18.0%
$
465,000
Central
Plains
Energy
Project,
Nebraska,
Gas
Project
3
Revenue
Bonds,
Refunding
Crossover
Series
2017A
5
.000
%
09/01/37
$
512,257
1,000,000
Central
Plains
Energy
Project,
Nebraska,
Gas
Project
4
Revenue
Bonds,
Refunding
Series
2023A-1,
(Mandatory
Put
11/01/29)
5
.000
05/01/54
1,063,741
1,930,000
Guam
Government
Waterworks
Authority,
Water
and
Wastewater
System
Revenue
Bonds,
Refunding
Series
2017
5
.000
07/01/40
1,985,672
500,000
Guam
Power
Authority,
Revenue
Bonds,
Refunding
Series
2022A
5
.000
10/01/43
532,266
500,000
Metropolitan
Utilities
District
Omaha,
Nebraska,
Water
Revenue
Bonds,
Series
2015
3
.250
12/01/32
496,306
1,000,000
Nebraska
Public
Power
District,
General
Revenue
Bonds,
Series
2016A
5
.000
01/01/41
1,012,933
1,200,000
Nebraska
Public
Power
District,
General
Revenue
Bonds,
Series
2023A
5
.000
07/01/28
1,284,164
500,000
Omaha
Public
Power
District,
Nebraska,
Electric
System
Revenue
Bonds,
Refunding
Series
2015C
4
.000
02/01/38
500,630
1,000,000
Omaha
Public
Power
District,
Nebraska,
Electric
System
Revenue
Bonds,
Series
2018A
5
.000
02/01/39
1,058,437
750,000
Omaha
Public
Power
District,
Nebraska,
Electric
System
Revenue
Bonds,
Series
2022B
5
.000
02/01/47
816,055
790,000
Omaha
Public
Power
District,
Nebraska,
Electric
System
Revenue
Bonds,
Series
2022B
5
.250
02/01/52
866,732
1,000,000
Omaha
Public
Power
District,
Nebraska,
Electric
System
Revenue
Bonds,
Series
2024A
5
.500
02/01/49
1,134,333
320,000
Omaha
Public
Power
District,
Nebraska,
Separate
Electric
System
Revenue
Bonds,
Nebraska
City
2,
Refunding
Series
2015A
3
.500
02/01/42
301,894
1,500,000
Public
Power
Generation
Agency,
Nebraska,
Whelan
Energy
Center
Unit
2
Revenue
Bonds,
Refunding
Series
2016A
5
.000
01/01/40
1,530,616
300,000
Public
Power
Generation
Agency,
Nebraska,
Whelan
Energy
Center
Unit
2
Revenue
Bonds,
Refunding
Series
2024A
5
.000
01/01/37
342,366
TOTAL
UTILITIES
13,438,402
TOTAL
MUNICIPAL
BONDS
(Cost
$74,420,453)
74,181,667
TOTAL
LONG-TERM
INVESTMENTS
(Cost
$74,420,453)
74,181,667
OTHER
ASSETS
&
LIABILITIES,
NET
-
0.6%
460,270
NET
ASSETS
-
100%
$
74,641,937
(a)
When-issued
or
delayed
delivery
security.
(b)
Backed
by
an
escrow
or
trust
containing
sufficient
U.S.
Government
or
U.S.
Government
agency
securities,
which
ensure
the
timely
payment
of
principal
and
interest.
AMT
Alternative
Minimum
Tax
See
Notes
to
Financial
Statements.
Portfolio
of
Investments
November
30,
2024
Oregon
Intermediate
Municipal
Bond
(Unaudited)
PRINCIPAL
DESCRIPTION
RATE
MATURITY
VALUE
LONG-TERM
INVESTMENTS
-
98.0%
X
191,065,650
MUNICIPAL
BONDS
-
98.0%
X
–
EDUCATION
AND
CIVIC
ORGANIZATIONS
-
5.4%
$
1,095,000
Forest
Grove,
Oregon,
Campus
Improvement
Revenue
Bonds,
Pacific
University
Project,
Refunding
Series
2015A
5
.000
%
05/01/30
$
1,099,717
1,525,000
Forest
Grove,
Oregon,
Campus
Improvement
Revenue
Bonds,
Pacific
University
Project,
Refunding
Series
2022A
5
.000
05/01/32
1,599,943
505,000
Forest
Grove,
Oregon,
Student
Housing
Revenue
Bonds,
Oak
Tree
Foundation,
Inc.
Project,
Series
2017
5
.000
03/01/25
505,840
95,000
(a)
Oregon
Facilities
Authority,
Revenue
Bonds,
Howard
Street
Charter
School
Project,
Series
2019A
5
.000
06/15/29
96,383
920,000
(a)
Oregon
Facilities
Authority,
Revenue
Bonds,
Metro
East
Web
Academy
Project,
Series
2019A
5
.000
06/15/34
934,143
100,000
(a)
Oregon
Facilities
Authority,
Revenue
Bonds,
Redmond
Proficiency
Academy
Project,
Series
2015A
5
.500
06/15/35
100,003
600,000
Oregon
Facilities
Authority,
Revenue
Bonds,
Redmond
Proficiency
Academy
Project,
Series
2016A
5
.000
06/15/33
590,178
450,000
Oregon
Facilities
Authority,
Revenue
Bonds,
University
of
Portland
Projects,
Series
2015A
5
.000
04/01/29
453,012
800,000
Oregon
Facilities
Authority,
Revenue
Bonds,
University
of
Portland
Projects,
Series
2015A
5
.000
04/01/30
805,384
490,000
(a)
Oregon
State
Facilities
Authority,
Oregon,
Charter
School
Revenue
Bonds,
Academy
for
Character
Education,
Series
2022A
6
.750
06/15/42
511,702
1,000,000
Yamhill
County,
Oregon,
Revenue
Bonds,
George
Fox
University
Project,
Refunding
Series
2021
4
.000
12/01/36
1,014,417
1,875,000
Yamhill
County,
Oregon,
Revenue
Bonds,
George
Fox
University
Project,
Refunding
Series
2021
4
.000
12/01/41
1,877,845
1,000,000
Yamhill
County,
Oregon,
Revenue
Bonds,
Linfield
University
Project,
Refunding
Series
2020A
5
.000
10/01/35
1,032,700
TOTAL
EDUCATION
AND
CIVIC
ORGANIZATIONS
10,621,267
HEALTH
CARE
-
12.8%
455,000
Astoria
Hospital
Facilities
Authority,
Oregon,
Hospital
Revenue
Bonds,
Columbia
Memorial
Hospital
Project,
Series
2024
5
.250
08/01/39
507,877
1,000,000
Astoria
Hospital
Facilities
Authority,
Oregon,
Hospital
Revenue
Bonds,
Columbia
Memorial
Hospital
Project,
Series
2024
5
.250
08/01/40
1,109,283
375,000
Deschutes
County
Hospital
Facility
Authority,
Oregon,
Hospital
Revenue
Bonds,
Saint
Charles
Health
System,
Inc.,
Series
2016A
4
.000
01/01/33
376,044
1,000,000
Deschutes
County
Hospital
Facility
Authority,
Oregon,
Hospital
Revenue
Bonds,
Saint
Charles
Health
System,
Inc.,
Series
2016A
5
.000
01/01/33
1,014,036
715,000
Deschutes
County
Hospital
Facility
Authority,
Oregon,
Hospital
Revenue
Bonds,
Saint
Charles
Health
System,
Inc.,
Series
2020A
4
.000
01/01/34
726,817
1,000,000
Oregon
Facilities
Authority,
Revenue
Bonds,
Legacy
Health
Project,
Series
2016A
5
.000
06/01/30
1,023,267
690,000
Oregon
Facilities
Authority,
Revenue
Bonds,
Peacehealth
System,
Refunding
Series
2014A
5
.000
11/15/25
690,508
4,155,000
Oregon
Facilities
Authority,
Revenue
Bonds,
Peacehealth
System,
Refunding
Series
2014A
4
.125
11/15/32
4,155,730
600,000
Oregon
Facilities
Authority,
Revenue
Bonds,
Samaritan
Health
Services
Project,
Refunding
Series
2020A
5
.000
10/01/30
641,927
485,000
Oregon
Facilities
Authority,
Revenue
Bonds,
Samaritan
Health
Services,
Refunding
Series
2016A
5
.000
10/01/29
495,347
1,325,000
Oregon
Facilities
Authority,
Revenue
Bonds,
Samaritan
Health
Services,
Refunding
Series
2016A
5
.000
10/01/30
1,352,619
4,105,000
Oregon
Health
and
Science
University,
Revenue
Bonds,
Green
Series
2021B-1,
(Mandatory
Put
2/01/30)
5
.000
07/01/46
4,440,205
1,000,000
Oregon
Health
and
Science
University,
Revenue
Bonds,
Series
2019A
5
.000
07/01/29
1,085,202
560,000
Salem
Hospital
Facility
Authority,
Oregon,
Revenue
Bonds,
Salem
Health
Projects,
Refunding
Series
2016A
5
.000
05/15/30
573,711
1,000,000
Salem
Hospital
Facility
Authority,
Oregon,
Revenue
Bonds,
Salem
Health
Projects,
Refunding
Series
2016A
5
.000
05/15/31
1,023,719
1,200,000
Salem
Hospital
Facility
Authority,
Oregon,
Revenue
Bonds,
Salem
Health
Projects,
Refunding
Series
2016A
5
.000
05/15/46
1,215,956
Portfolio
of
Investments
November
30,
2024
(continued)
Oregon
Intermediate
Municipal
Bond
PRINCIPAL
DESCRIPTION
RATE
MATURITY
VALUE
HEALTH
CARE
(continued)
$
2,235,000
Salem
Hospital
Facility
Authority,
Oregon,
Revenue
Bonds,
Salem
Health
Projects,
Series
2019A
5
.000
%
05/15/32
$
2,403,431
1,230,000
Union
County
Oregon,
Hospital
Facility
Authority
Revenue
Bonds,
Grande
Ronde
Hospital
Incorporated,
Series
2022
5
.000
07/01/33
1,303,501
695,000
Union
County
Oregon,
Hospital
Facility
Authority
Revenue
Bonds,
Grande
Ronde
Hospital
Incorporated,
Series
2022
5
.000
07/01/34
732,394
TOTAL
HEALTH
CARE
24,871,574
HOUSING/MULTIFAMILY
-
0.7%
340,000
Home
Forward,
Oregon,
Multifamily
Housing
Revenue
Bonds,
Lovejoy
Station
Apartments,
Refunding
Series
2016
4
.000
07/15/29
344,896
1,000,000
Oregon
Housing
and
Community
Services
Department,
Oregon,
Multifamily
Housing
Revenue
Bonds,
Hollywood
Hub
Apartments
Project,
Series
2024R,
(Mandatory
Put
1/01/29)
4
.000
01/10/48
1,015,076
TOTAL
HOUSING/MULTIFAMILY
1,359,972
HOUSING/SINGLE
FAMILY
-
0.7%
935,000
Oregon
Housing
and
Community
Services
Department,
Single
Family
Mortgage
Program
Revenue
Bonds,
Series
2021A
1
.900
01/01/33
784,438
825,000
Oregon
Housing
and
Community
Services
Department,
Single
Family
Mortgage
Program
Revenue
Bonds,
Series
2021A
1
.950
07/01/33
688,880
TOTAL
HOUSING/SINGLE
FAMILY
1,473,318
INFORMATION
TECHNOLOGY
-
1.0%
2,000,000
Oregon
State Business
Development
Commission,
Recovery
Zone
Facility
Revenue
Bonds,
Intel
Corporation
Project,
232
Series
2010,
(Mandatory
Put
6/15/28)
3
.800
12/01/40
2,023,883
TOTAL
INFORMATION
TECHNOLOGY
2,023,883
LONG-TERM
CARE
-
5.8%
285,000
Clackamas
County
Hospital
Facility
Authority,
Oregon,
Revenue
Bonds,
Rose
Villa
Inc.,
Series
2020A
5
.000
11/15/27
292,378
300,000
Clackamas
County
Hospital
Facility
Authority,
Oregon,
Revenue
Bonds,
Rose
Villa
Inc.,
Series
2020A
5
.000
11/15/28
307,431
315,000
Clackamas
County
Hospital
Facility
Authority,
Oregon,
Revenue
Bonds,
Rose
Villa
Inc.,
Series
2020A
5
.000
11/15/29
322,714
330,000
Clackamas
County
Hospital
Facility
Authority,
Oregon,
Revenue
Bonds,
Rose
Villa
Inc.,
Series
2020A
5
.000
11/15/30
337,621
355,000
Clackamas
County
Hospital
Facility
Authority,
Oregon,
Senior
Living
Revenue
Bonds,
Willamette
View
Project,
Series
2017A
4
.000
05/15/25
354,577
460,000
Clackamas
County
Hospital
Facility
Authority,
Oregon,
Senior
Living
Revenue
Bonds,
Willamette
View
Project,
Series
2017A
4
.000
11/15/25
458,887
200,000
Clackamas
County
Hospital
Facility
Authority,
Oregon,
Senior
Living
Revenue
Bonds,
Willamette
View
Project,
Series
2017A
4
.000
05/15/26
199,801
400,000
Clackamas
County
Hospital
Facility
Authority,
Oregon,
Senior
Living
Revenue
Bonds,
Willamette
View
Project,
Series
2017A
4
.000
11/15/26
399,473
350,000
Clackamas
County
Hospital
Facility
Authority,
Oregon,
Senior
Living
Revenue
Bonds,
Willamette
View
Project,
Series
2017A
4
.000
05/15/27
350,156
350,000
Clackamas
County
Hospital
Facility
Authority,
Oregon,
Senior
Living
Revenue
Bonds,
Willamette
View
Project,
Series
2017A
4
.000
11/15/27
350,187
1,130,000
Multnomah
County
Hospital
Facilities
Authority,
Oregon,
Revenue
Bond,
Terwilliger
Plaza,
Inc.,
Refunding
Series
2012
5
.000
12/01/29
1,130,127
325,000
Multnomah
County
Hospital
Facilities
Authority,
Oregon,
Revenue
Bond,
Terwilliger
Plaza,
Inc.,
Refunding
Series
2016
5
.000
12/01/30
327,084
1,005,000
Multnomah
County
Hospital
Facilities
Authority,
Oregon,
Revenue
Bonds,
Terwilliger
Plaza-Parkview
Project,
Refunding
Green
Series
2021A
4
.000
12/01/36
931,445
1,040,000
Polk
County
Hospital
Facility
Authority,
Oregon,
Revenue
Bonds,
Dallas
Retirement
Village
Project,
Series
2015A
5
.125
07/01/35
1,044,177
1,540,000
Salem
Hospital
Facility
Authority,
Oregon,
Revenue
Bonds,
Capital
Manor,
Inc.,
Refunding
Bonds,
Series
2022
4
.000
05/15/40
1,435,338
1,150,000
Yamhill
County
Hospital
Authority,
Oregon,
Revenue
Bonds,
Friendsview
Retirement
Community,
Refunding
Series
2016A
5
.000
11/15/31
1,150,181
1,940,000
Yamhill
County
Hospital
Authority,
Oregon,
Revenue
Bonds,
Friendsview
Retirement
Community,
Refunding
Series
2021A
5
.000
11/15/36
1,898,974
TOTAL
LONG-TERM
CARE
11,290,551
PRINCIPAL
DESCRIPTION
RATE
MATURITY
VALUE
TAX
OBLIGATION/GENERAL
-
40.3%
$
750,000
Aurora,
Marion
County,
Oregon,
General
Obligation
Bonds,
Taxable
Series
2024
-
BAM
Insured
5
.250
%
06/01/45
$
831,562
2,400,000
Beaverton
School
District
48J,
Washington
and
Multnomah
Counties,
Oregon,
General
Obligation
Bonds,
Current
Interest
Series
2017C
5
.000
06/15/35
2,514,033
2,000,000
Beaverton
School
District
48J,
Washington
and
Multnomah
Counties,
Oregon,
General
Obligation
Bonds,
Deferred
Interest
Series
2017B
0
.000
06/15/33
1,424,308
1,380,000
Bend,
Oregon,
General
Obligation
Bonds,
Full
Faith
&
Credit
Series
2023
5
.000
06/01/36
1,605,371
350,000
Benton
and
Linn
Counties
District
School
District
509J
Corvallis,
Oregon,
General
Obligation
Bonds,
Series
2018A
5
.000
06/15/26
361,831
2,835,000
Benton
and
Linn
Counties
District
School
District
509J
Corvallis,
Oregon,
General
Obligation
Bonds,
Series
2018A
5
.000
06/15/27
2,999,257
350,000
Benton
County,
Oregon,
Full
Faith
and
Credit
Obligations,
Series
2023
5
.000
06/01/37
397,622
250,000
Benton
County,
Oregon,
Full
Faith
and
Credit
Obligations,
Series
2023
5
.000
06/01/38
282,972
1,000,000
Boardman,
Morrow
County,
Oregon,
General
Obligation
Bonds,
Series
2021
-
BAM
Insured
4
.000
06/15/35
1,032,116
200,000
Clackamas
and
Multnomah
Counties
School
District
7J
Lake
Oswego,
Oregon,
General
Obligation
Bonds,
Refunding
Series
2005
-
AGM
Insured
5
.250
06/01/25
202,228
1,665,000
Clackamas
and
Multnomah
Counties
School
District
7J
Lake
Oswego,
Oregon,
General
Obligation
Bonds,
Series
2017
4
.000
06/01/32
1,703,215
4,000,000
Clackamas
County
School
District
12,
North
Clackamas,
Oregon,
General
Obligation
Bonds,
Deferred
Interest
Series
2017A
0
.000
06/15/41
1,906,897
1,000,000
Clackamas
County
School
District
12,
North
Clackamas,
Oregon,
General
Obligation
Bonds,
Series
2017B
5
.000
06/15/30
1,054,274
585,000
Clackamas
County
School
District
12,
North
Clackamas,
Oregon,
General
Obligation
Bonds,
Series
2018
5
.000
06/15/31
628,882
550,000
Clackamas
County
School
District
12,
North
Clackamas,
Oregon,
General
Obligation
Bonds,
Series
2018
5
.000
06/15/32
589,019
605,000
Clackamas
County
School
District
62,
Oregon
City,
Oregon,
General
Obligation
Bonds,
Refunding
Series
2018B
5
.000
06/15/33
645,850
1,000,000
David
Douglas
School
District
40,
Multnomah
County,
Oregon,
General
Obligation
Bonds,
Series
2012B
0
.000
06/15/25
983,418
1,135,000
David
Douglas
School
District
40,
Multnomah
County,
Oregon,
General
Obligation
Bonds,
Series
2023A
0
.000
06/15/34
817,605
2,000,000
David
Douglas
School
District
40,
Multnomah
County,
Oregon,
General
Obligation
Bonds,
Series
2023A
0
.000
06/15/35
1,370,745
1,210,000
David
Douglas
School
District
40,
Multnomah
County,
Oregon,
General
Obligation
Bonds,
Series
2023A
0
.000
06/15/37
739,137
1,000,000
David
Douglas
School
District
40,
Multnomah
County,
Oregon,
General
Obligation
Bonds,
Series
2023A
0
.000
06/15/38
574,506
1,335,000
Deschutes
County
Administrative
School
District
1,
Bend-La
Pine,
Oregon,
General
Obligation
Bonds,
Series
2023
5
.000
06/15/36
1,533,437
1,845,000
Jackson
County
School
District
5
Ashland,
Oregon,
General
Obligation
Bonds,
Series
2019
5
.000
06/15/34
1,999,354
1,675,000
Jackson
County
School
District
6,
Central
Point,
Oregon,
General
Obligation
Bonds,
Series
2019A
4
.000
06/15/34
1,730,495
1,700,000
Jackson
County
School
District
6,
Central
Point,
Oregon,
General
Obligation
Bonds,
Series
2019A
4
.000
06/15/35
1,753,147
250,000
Keizer,
Oregon,
General
Obligation
Assessment
Bonds,
Keizer
Station
Area
A
Local
Improvement
District,
Series
2008
5
.200
06/01/31
251,356
1,000,000
Lane
Community
College,
Lane,
Linn,
Benton
and
Douglas
Counties,
Oregon,
General
Obligation
Bonds,
Series
2020A
4
.000
06/15/33
1,048,554
1,750,000
Lane
Community
College,
Lane,
Linn,
Benton
and
Douglas
Counties,
Oregon,
General
Obligation
Bonds,
Series
2020A
4
.000
06/15/34
1,827,811
3,900,000
Lane
County
School
District
4J
Eugene,
Oregon,
General
Obligation
Bonds,
School
Bond
Guaranty
Series
2019
4
.000
06/15/35
4,030,246
2,000,000
Marion
and
Polk
Counties
School
District
24J,
Salem-Kreizer,
Oregon,
General
Obligation
Bonds,
Convertible
Deferred
Interest
Series
2020B
5
.000
06/15/34
2,215,236
Portfolio
of
Investments
November
30,
2024
(continued)
Oregon
Intermediate
Municipal
Bond
PRINCIPAL
DESCRIPTION
RATE
MATURITY
VALUE
TAX
OBLIGATION/GENERAL
(continued)
$
2,145,000
Marion
and
Polk
Counties
School
District
24J,
Salem-Kreizer,
Oregon,
General
Obligation
Bonds,
Convertible
Deferred
Interest
Series
2020B
5
.000
%
06/15/35
$
2,367,208
1,500,000
Marion
and
Polk
Counties
School
District
24J,
Salem-Kreizer,
Oregon,
General
Obligation
Bonds,
Series
2018
5
.000
06/15/31
1,605,199
2,000,000
Marion
and
Polk
Counties
School
District
24J,
Salem-Kreizer,
Oregon,
General
Obligation
Bonds,
Series
2018
5
.000
06/15/33
2,131,581
1,050,000
Marion
and
Polk
Counties
School
District
24J,
Salem-Kreizer,
Oregon,
General
Obligation
Bonds,
Series
2018
5
.000
06/15/38
1,112,849
1,250,000
Marion
County
School
District
1,
Gervais,
Oregon,
General
Obligation
Bonds,
Series
2024
5
.000
06/15/42
1,399,054
1,000,000
Marion
County
School
District
15
North
Marion,
Oregon,
General
Obligation
Bonds,
Series
2018B
5
.000
06/15/31
1,075,013
2,500,000
Metro,
Oregon,
General
Obligation
Bonds,
Series
2020A
4
.000
06/01/34
2,630,233
1,190,000
Nestucca
Valley
School
District
101,
Tillamook
&
Yamhill
Counties,
Oregon,
General
Obligation
Bonds,
Series
2018B.
Current
Interest
5
.000
06/15/29
1,285,897
765,000
Oregon
City,
Oregon,
General
Obligation
Bonds,
Series
2018
5
.000
06/01/31
823,168
450,000
(b)
Oregon
Coast
Community
College
District,
Lincoln
County,
Oregon,
General
Obligation
Bonds,
Convertible
Deferred
Interest
Series
2024
0
.000
06/15/39
485,203
350,000
(b)
Oregon
Coast
Community
College
District,
Lincoln
County,
Oregon,
General
Obligation
Bonds,
Convertible
Deferred
Interest
Series
2024
0
.000
06/15/41
373,703
770,000
Oregon
State,
General
Obligation
Bonds,
Series
2024A
5
.000
05/01/37
894,998
1,210,000
Phoenix-Talent
School
District
4,
Jackson
County,
Oregon,
General
Obligation
Bonds,
Current
Interest
Series
2018B
5
.000
06/15/32
1,298,370
185,000
Port
of
Alsea,
Lincoln
County,
Oregon,
General
Obligation
Bonds,
Series
2018
3
.750
06/15/28
184,777
180,000
Port
of
Alsea,
Lincoln
County,
Oregon,
General
Obligation
Bonds,
Series
2018
4
.000
06/15/33
180,919
900,000
Portland
Community
College
District,
Multnomah
County,
Oregon,
General
Obligation
Bonds,
Refunding
Series
2016
5
.000
06/15/29
930,559
500,000
Redmond
Area
Park
and
Recreation
District,
Deschutes
County,
Oregon,
General
Obligation
Bonds,
Series
2023
5
.000
06/15/34
574,296
350,000
Redmond,
Oregon,
Full
Faith
and
Credit
Obligations,
Series
2014A
5
.000
06/01/25
350,306
630,000
Redmond,
Oregon,
Full
Faith
and
Credit
Obligations,
Series
2019B-1
5
.000
06/01/36
679,345
2,285,000
Saint
Helens,
Oregon,
Full
Faith
and
Credit
Obligations,
Series
2021
4
.000
08/01/41
2,327,546
245,000
Umatilla
County
School
District
6R
Umatilla,
Oregon,
General
Obligation
Bonds,
Series
2017
5
.000
06/15/27
258,269
340,000
Umatilla
County
School
District
6R
Umatilla,
Oregon,
General
Obligation
Bonds,
Series
2017
5
.000
06/15/29
359,473
315,000
Umatilla
County
School
District
6R
Umatilla,
Oregon,
General
Obligation
Bonds,
Series
2017
5
.000
06/15/31
331,781
1,260,000
Washington
and
Clackamas
Counties
School
District
23J
Tigard-
Tualatin,
Oregon,
General
Obligation
Bonds,
Series
2017
5
.000
06/15/30
1,325,539
6,000,000
Washington
County
School
District
13,
Oregon,
General
Obligation
Bonds,
Series
2024A
0
.000
06/15/44
2,527,913
965,000
Washington
County
School
District
15,
Forest
Grove,
Oregon,
General
Obligation
Bonds,
Series
2012B
0
.000
06/15/25
947,856
1,000,000
Washington
County
School
District
15,
Forest
Grove,
Oregon,
General
Obligation
Bonds,
Series
2023
5
.000
06/15/35
1,148,653
1,320,000
Washington
County,
Oregon,
General
Obligation
Bonds,
Full
Faith
&
Credit
Obligation
Series
2016B
4
.000
03/01/31
1,337,010
3,750,000
Washington
Multnomah
&
Yamhill
Counties
School
District
1J
Hillsboro,
Oregon,
General
Obligation
Bonds,
Series
2017
5
.000
06/15/32
3,938,481
1,450,000
Washington
Multnomah
&
Yamhill
Counties
School
District
1J
Hillsboro,
Oregon,
General
Obligation
Bonds,
Series
2017
5
.000
06/15/34
1,519,980
1,000,000
Washington,
Clackamas
and
Yamhill
Counties
School
District
88J
Sherwood,
Oregon,
General
Obligation
Bonds,
Series
2017B
5
.000
06/15/30
1,052,266
1,000,000
Yamhill
County
School
District
40,
McMinnville,
Oregon,
General
Obligation
Bonds,
Refunding
Series
2016
4
.000
06/15/31
1,013,683
PRINCIPAL
DESCRIPTION
RATE
MATURITY
VALUE
TAX
OBLIGATION/GENERAL
(continued)
$
1,000,000
Yamhill
County
School
District
40,
McMinnville,
Oregon,
General
Obligation
Bonds,
Refunding
Series
2016
4
.000
%
06/15/32
$
1,012,380
TOTAL
TAX
OBLIGATION/GENERAL
78,537,992
TAX
OBLIGATION/LIMITED
-
12.1%
1,000,000
Beaverton,
Oregon,
Special
Revenue
Bonds,
Series
2020A
4
.000
06/01/37
1,035,609
200,000
Cannon
Beach,
Clatsop
County,
Oregon,
General
Obligation
Bonds,
Full
Faith
Credit
Series
2024
5
.000
06/01/37
227,676
2,260,000
Government
of
Guam,
Business
Privilege
Tax
Bonds,
Refunding
Series
2015D
5
.000
11/15/28
2,289,909
500,000
Government
of
Guam,
Business
Privilege
Tax
Bonds,
Refunding
Series
2015D
5
.000
11/15/29
506,572
300,000
Hermiston,
Umatilla
County,
Oregon,
Full
Faith
and
Credit
Obligation
Bonds,
Series
2024
-
AGM
Insured
5
.000
12/01/37
342,098
1,635,000
Matching
Fund
Special
Purpose
Securitization
Corporation,
Virgin
Islands,
Revenue
Bonds,
Series
2022A
5
.000
10/01/28
1,704,784
460,000
Matching
Fund
Special
Purpose
Securitization
Corporation,
Virgin
Islands,
Revenue
Bonds,
Series
2022A
5
.000
10/01/32
483,070
2,095,000
Oregon
Department
of
Transportation,
Revenue
Bonds,
Grant
Anticipation,
Social
2024
5
.000
05/15/37
2,426,571
2,000,000
Oregon
State
Department
of
Transportation,
Highway
User
Tax
Revenue
Bonds,
Refunding
Subordinate
Lien
Series
2019A
5
.000
11/15/35
2,184,336
750,000
Oregon
State
Department
of
Transportation,
Highway
User
Tax
Revenue
Bonds,
Senior
Lien
Series
2022A
5
.000
11/15/35
858,043
5,470,000
Oregon
State
Department
of
Transportation,
Highway
User
Tax
Revenue
Bonds,
Subordinate
Lien
Series
2020A
4
.000
11/15/39
5,604,855
1,000,000
Puerto
Rico
Sales
Tax
Financing
Corporation,
Sales
Tax
Revenue
Bonds,
Taxable
Restructured
Cofina
Project
Series
2019A-2
4
.329
07/01/40
1,000,009
1,600,000
Seaside,
Clatsop
County,
Oregon,
Transient
Lodgings
Tax
Revenue
Bonds,
Series
2018
5
.000
12/15/30
1,709,147
1,000,000
Tri-County
Metropolitan
Transportation
District,
Oregon,
Capital
Grant
Receipt
Revenue
Bonds,
Series
2018A
5
.000
10/01/31
1,059,175
2,060,000
Tri-County
Metropolitan
Transportation
District,
Oregon,
Capital
Grant
Receipt
Revenue
Bonds,
Series
2018A
4
.000
10/01/33
2,099,378
TOTAL
TAX
OBLIGATION/LIMITED
23,531,232
TRANSPORTATION
-
7.1%
430,000
Jackson
County,
Oregon,
Airport
Revenue
Bonds,
Refunding
Series
2016
-
AGM
Insured
5
.000
12/01/31
440,841
380,000
Jackson
County,
Oregon,
Airport
Revenue
Bonds,
Refunding
Series
2016
-
AGM
Insured
5
.000
12/01/33
389,143
350,000
Jackson
County,
Oregon,
Airport
Revenue
Bonds,
Refunding
Series
2016
-
AGM
Insured
4
.000
12/01/34
352,365
1,000,000
(a)
Port
of
Morrow,
Morrow
County
Oregon,
Full
Faith
and
Credit
Obligations,
Series
2024A
5
.150
10/01/26
991,999
3,745,000
Port
of
Portland,
Oregon,
International
Airport
Revenue
Bonds,
Green
Series
2023-29,
(AMT)
5
.000
07/01/29
3,996,267
2,400,000
Port
of
Portland,
Oregon,
International
Airport
Revenue
Bonds,
Green
Series
2024-30A,
(AMT)
5
.000
07/01/37
2,626,140
1,690,000
Port
of
Portland,
Oregon,
International
Airport
Revenue
Bonds,
Series
2017-24B,
(AMT)
5
.000
07/01/35
1,729,667
3,040,000
Port
of
Portland,
Oregon,
International
Airport
Revenue
Bonds,
Series
2022-28,
(AMT)
5
.000
07/01/34
3,317,024
TOTAL
TRANSPORTATION
13,843,446
UTILITIES
-
12.1%
2,140,000
Beaverton,
Oregon,
Water
Revenue
Bonds,
Series
2020
5
.000
04/01/40
2,322,760
2,090,000
Beaverton,
Oregon,
Water
Revenue
Bonds,
Series
2022
4
.000
04/01/35
2,217,944
2,150,000
Beaverton,
Oregon,
Water
Revenue
Bonds,
Series
2022
4
.000
04/01/36
2,268,368
500,000
Central
Lincoln
Peoples
Utility
District,
Oregon,
Electric
Revenue
Bonds,
Series
2016
3
.500
12/01/29
502,763
350,000
Central
Lincoln
Peoples
Utility
District,
Oregon,
Electric
Revenue
Bonds,
Series
2016
5
.000
12/01/33
355,938
350,000
Central
Lincoln
Peoples
Utility
District,
Oregon,
Electric
Revenue
Bonds,
Series
2016
5
.000
12/01/34
355,938
1,135,000
Eugene,
Oregon,
Electric
Utility
Revenue
Bonds,
Refunding
Series
2024
5
.000
08/01/42
1,281,754
Portfolio
of
Investments
November
30,
2024
(continued)
Oregon
Intermediate
Municipal
Bond
PRINCIPAL
DESCRIPTION
RATE
MATURITY
VALUE
UTILITIES
(continued)
$
250,000
Eugene,
Oregon,
Water
Utility
System
Revenue
Bonds,
Series
2023
5
.000
%
08/01/35
$
287,505
250,000
Eugene,
Oregon,
Water
Utility
System
Revenue
Bonds,
Series
2023
5
.000
08/01/36
286,494
250,000
Eugene,
Oregon,
Water
Utility
System
Revenue
Bonds,
Series
2023
5
.000
08/01/37
284,397
250,000
Eugene,
Oregon,
Water
Utility
System
Revenue
Bonds,
Series
2023
5
.000
08/01/38
284,370
1,065,000
Guam
Government
Waterworks
Authority,
Water
and
Wastewater
System
Revenue
Bonds,
Series
2016
5
.000
07/01/28
1,093,012
1,120,000
Guam
Government
Waterworks
Authority,
Water
and
Wastewater
System
Revenue
Bonds,
Series
2016
5
.000
07/01/29
1,149,320
1,180,000
Guam
Government
Waterworks
Authority,
Water
and
Wastewater
System
Revenue
Bonds,
Series
2016
5
.000
07/01/30
1,210,063
500,000
Guam
Power
Authority,
Revenue
Bonds,
Refunding
Series
2024A
5
.000
10/01/36
558,564
1,050,000
Guam
Power
Authority,
Revenue
Bonds,
Refunding
Series
2024A
5
.000
10/01/37
1,167,986
2,500,000
Portland,
Oregon,
Water
System
Revenue
Bonds,
Refunding
First
Lien
Series
2016A
4
.000
04/01/33
2,529,227
2,000,000
Portland,
Oregon,
Water
System
Revenue
Bonds,
Refunding
First
Lien
Series
2022A
4
.000
04/01/35
2,107,345
1,000,000
(a)
Puerto
Rico
Aqueduct
and
Sewerage
Authority,
Revenue
Bonds,
Refunding
Senior
Lien
Series
2021B
5
.000
07/01/33
1,062,609
1,525,000
(a)
Warm
Springs
Reservation
Confederated
Tribes,
Oregon,
Hydroelectric
Revenue
Bonds,
Tribal
Economic
Development
Bond
Pelton
Round
Butte
Project,
Taxable
Refunding
Green
Series
2019B
5
.000
11/01/33
1,648,455
500,000
(a)
Warm
Springs
Reservation
Confederated
Tribes,
Oregon,
Hydroelectric
Revenue
Bonds,
Tribal
Economic
Development
Bond
Pelton
Round
Butte
Project,
Taxable
Refunding
Green
Series
2019B
5
.000
11/01/36
537,603
TOTAL
UTILITIES
23,512,415
TOTAL
MUNICIPAL
BONDS
(Cost
$190,476,916)
191,065,650
TOTAL
LONG-TERM
INVESTMENTS
(Cost
$190,476,916)
191,065,650
PRINCIPAL
DESCRIPTION
RATE
MATURITY
VALUE
SHORT-TERM
INVESTMENTS
-
0.9%
X
1,710,000
MUNICIPAL
BONDS
-
0.9%
X
–
HEALTH
CARE
-
0.5%
$
300,000
(a),(c)
Medford
Hospital
Facilities
Authority,
Oregon,
Hospital
Revenue
Bonds,
Asante
Health
System,
Refunding
Tender
Option
Bond
Trust
Series
2022-XM1089
3
.528
08/15/28
$
300,000
600,000
(c)
Oregon
Facilities
Authority,
Revenue
Bonds,
Peacehealth
System,
Refunding
Series
2018B
3
.150
08/01/34
600,000
TOTAL
HEALTH
CARE
900,000
TAX
OBLIGATION/GENERAL
-
0.4%
810,000
(c)
Oregon
State,
General
Obligation
Bonds,
Veteran's
Welfare
Series
110
Series
2022E
3
.250
06/01/45
810,000
TOTAL
TAX
OBLIGATION/GENERAL
810,000
TOTAL
MUNICIPAL
BONDS
(Cost
$1,710,000)
1,710,000
TOTAL
SHORT-TERM
INVESTMENTS
(Cost
$1,710,000)
1,710,000
TOTAL
INVESTMENTS
-
98.9%
(Cost
$192,186,916)
192,775,650
OTHER
ASSETS
&
LIABILITIES,
NET
-
1.1%
2,136,352
NET
ASSETS
-
100%
$
194,912,002
(a)
Security
is
exempt
from
registration
under
Rule
144A
of
the
Securities
Act
of
1933,
as
amended.
These
securities
are
deemed
liquid
and
may
be
resold
in
transactions
exempt
from
registration,
which
are
normally
those
transactions
with
qualified
institutional
buyers.
As
of
the
end
of
the
reporting
period,
the
aggregate
value
of
these
securities
is
$6,182,897
or
3.2%
of
Total
Investments.
(b)
Step-up
coupon
bond,
a
bond
with
a
coupon
that
increases
("steps
up"),
usually
at
regular
intervals,
while
the
bond
is
outstanding.
The
rate
shown
is
the
coupon
as
of
the
end
of
the
reporting
period.
(c)
Investment
has
a
maturity
of
greater
than
one
year,
but
has
variable
rate
and/or
demand
features
which
qualify
it
as
a
short-term
investment.
The
rate
disclosed,
as
well
as
the
reference
rate
and
spread,
where
applicable,
is
that
in
effect
as
of
the
end
of
the
reporting
period.
This
rate
changes
periodically
based
on
market
conditions
or
a
specified
market
index.
AMT
Alternative
Minimum
Tax
See
Notes
to
Financial
Statements.
Statement
of
Assets
and
Liabilities
See
Notes
to
Financial
Statements.
November
30,
2024
(Unaudited)
Minnesota
Intermediate
Minnesota
Nebraska
Oregon
Intermediate
ASSETS
Long-term
investments,
at
value
†
$
320,827,928
$
650,576,905
$
74,181,667
$
191,065,650
Short-term
investments,
at
value
◊
–
10,045,000
–
1,710,000
Cash
853,338
–
515,087
–
Receivables:
Interest
4,093,692
8,832,580
1,123,211
2,534,020
Investments
sold
35,000
1,130,000
–
210,000
Reimbursement
from
Adviser
–
–
11,808
–
Shares
sold
353,992
255,986
49,040
95,025
Other
24,228
30,584
13,276
12,037
Total
assets
326,188,178
670,871,055
75,894,089
195,626,732
LIABILITIES
Cash
overdraft
–
2,141
–
243,016
Payables:
Management
fees
132,560
263,985
30,500
80,175
Dividends
280,622
312,068
24,627
138,081
Interest
784
1,013
292
399
Investments
purchased
-
when-issued/delayed-delivery
settlement
–
–
1,072,490
–
Shares
redeemed
214,039
678,958
53,338
150,310
Accrued
expenses:
Custodian
fees
47,463
63,838
21,664
30,071
Directors
fees
17,315
22,398
1,665
5,416
Professional
fees
34,651
44,764
23,075
27,214
Shareholder
reporting
expenses
14,692
20,239
9,010
10,137
Shareholder
servicing
agent
fees
38,371
78,733
9,252
24,477
12b-1
distribution
and
service
fees
17,762
46,311
6,239
5,389
Other
42
2,256
—
45
Total
liabilities
798,301
1,536,704
1,252,152
714,730
Net
assets
$
325,389,877
$
669,334,351
$
74,641,937
$
194,912,002
NET
ASSETS
CONSIST
OF:
Paid-in
capital
$
342,888,370
$
722,063,918
$
87,985,455
$
207,799,139
Total
distributable
earnings
(loss)
(
17,498,493
)
(
52,729,567
)
(
13,343,518
)
(
12,887,137
)
Net
assets
$
325,389,877
$
669,334,351
$
74,641,937
$
194,912,002
†
Long-term
investments,
cost
$
320,846,765
$
650,836,789
$
74,420,453
$
190,476,916
◊
Short-term
investments,
cost
—
10,045,000
—
1,710,000
Minnesota
Intermediate
Minnesota
Nebraska
Oregon
Intermediate
CLASS
A:
Net
assets
$
79,640,020
$
224,940,886
$
33,623,157
$
25,943,001
Shares
outstanding
8,113,388
20,614,637
3,380,058
2,643,111
Net
asset
value
("NAV")
per
share
$
9.82
$
10.91
$
9.95
$
9.82
Maximum
sales
charge
3.00%
4.20%
4.20%
3.00%
Offering
price
per
share
(NAV
per
share
plus
maximum
sales
charge)
$
10.12
$
11.39
$
10.39
$
10.12
CLASS
C:
Net
assets
$
5,704,787
$
12,144,728
$
991,743
$
1,355,537
Shares
outstanding
585,023
1,113,894
99,845
138,902
NAV
and
offering
price
per
share
$
9.75
$
10.90
$
9.93
$
9.76
CLASS
I:
Net
assets
$
240,045,070
$
432,248,737
$
40,027,037
$
167,613,464
Shares
outstanding
24,560,862
39,661,422
4,017,369
17,043,382
NAV
and
offering
price
per
share
$
9.77
$
10.90
$
9.96
$
9.83
Authorized
shares
-
per
class
2
billion
2
billion
2
billion
2
billion
Par
value
per
share
$
0.0001
$
0.0001
$
0.0001
$
0.0001
See
Notes
to
Financial
Statements.
Six
Months
Ended
November
30,
2024
(Unaudited)
Minnesota
Intermediate
Minnesota
Nebraska
Oregon
Intermediate
INVESTMENT
INCOME
Interest
$
6,231,438
$
13,081,486
$
1,404,735
$
3,359,176
Total
investment
income
6,231,438
13,081,486
1,404,735
3,359,176
EXPENSES
–
–
–
–
Management
fees
803,347
1,554,123
187,293
479,619
12b-1
service
fees
-
Class
A
81,084
219,382
34,405
26,326
12b-1
distribution
and
service
fees
-
Class
C
30,239
63,570
4,991
7,278
Shareholder
servicing
agent
fees
-
Class
A
12,943
38,879
6,314
4,509
Shareholder
servicing
agent
fees
-
Class
C
964
2,250
183
248
Shareholder
servicing
agent
fees
-
Class
I
37,803
72,193
7,074
27,952
Interest
expense
25,820
21,943
19,433
14,470
Directors
fees
6,452
12,678
1,475
3,807
Custodian
expenses
37,166
50,039
16,366
22,901
Registration
fees
8,793
13,215
11,673
7,504
Professional
fees
29,271
35,901
22,931
25,444
Shareholder
reporting
expenses
17,724
18,554
15,315
16,001
Other
5,807
7,311
4,083
3,709
Total
expenses
before
fee
waiver/expense
reimbursement
1,097,413
2,110,038
331,536
639,768
Fee
waiver/expense
reimbursement
—
—
(
49,471
)
—
Net
expenses
1,097,413
2,110,038
282,065
639,768
Net
investment
income
(loss)
5,134,025
10,971,448
1,122,670
2,719,408
REALIZED
AND
UNREALIZED
GAIN
(LOSS)
Realized
gain
(loss)
from:
Investments
(
281,368
)
(
215,567
)
(
179,574
)
307,392
Net
realized
gain
(loss)
(
281,368
)
(
215,567
)
(
179,574
)
307,392
Change
in
unrealized
appreciation
(depreciation)
on:
Investments
6,850,924
16,777,835
2,385,393
3,090,102
Net
change
in
unrealized
appreciation
(depreciation)
6,850,924
16,777,835
2,385,393
3,090,102
Net
realized
and
unrealized
gain
(loss)
6,569,556
16,562,268
2,205,819
3,397,494
Net
increase
(decrease)
in
net
assets
from
operations
$
11,703,581
$
27,533,716
$
3,328,489
$
6,116,902
Statement
of
Changes
in
Net
Assets
See
Notes
to
Financial
Statements.
Minnesota
Intermediate
Minnesota
Unaudited
Six
Months
Ended
11/30/24
Year
Ended
5/31/24
Unaudited
Six
Months
Ended
11/30/24
Year
Ended
5/31/24
OPERATIONS
Net
investment
income
(loss)
$
5,134,025
$
9,986,761
$
10,971,448
$
19,522,781
Net
realized
gain
(loss)
(
281,368
)
(
2,809,331
)
(
215,567
)
(
7,087,582
)
Net
change
in
unrealized
appreciation
(depreciation)
6,850,924
766,350
16,777,835
4,027,752
Net
increase
(decrease)
in
net
assets
from
operations
11,703,581
7,943,780
27,533,716
16,462,951
DISTRIBUTIONS
TO
SHAREHOLDERS
Dividends:
Class
A
(
1,215,252
)
(
2,465,421
)
(
3,820,268
)
(
6,990,788
)
Class
C
(
67,024
)
(
164,725
)
(
168,555
)
(
389,330
)
Class
I
(
3,779,775
)
(
7,544,954
)
(
7,421,354
)
(
12,424,196
)
Total
distributions
(
5,062,051
)
(
10,175,100
)
(
11,410,177
)
(
19,804,314
)
FUND
SHARE
TRANSACTIONS
Subscriptions
39,522,376
123,522,905
99,040,798
237,553,251
Reinvestments
of
distributions
3,404,271
6,589,877
9,615,907
16,610,305
Redemptions
(
45,504,307
)
(
145,993,852
)
(
59,239,044
)
(
188,985,378
)
Net
increase
(decrease)
from
Fund
share
transactions
(
2,577,660
)
(
15,881,070
)
49,417,661
65,178,178
Net
increase
(decrease)
in
net
assets
4,063,870
(
18,112,390
)
65,541,200
61,836,815
Net
assets
at
the
beginning
of
period
321,326,007
339,438,397
603,793,151
541,956,336
Net
assets
at
the
end
of
period
$
325,389,877
$
321,326,007
$
669,334,351
$
603,793,151
See
Notes
to
Financial
Statements.
Nebraska
Oregon
Intermediate
Unaudited
Six
Months
Ended
11/30/24
Year
Ended
5/31/24
Unaudited
Six
Months
Ended
11/30/24
Year
Ended
5/31/24
OPERATIONS
Net
investment
income
(loss)
$
1,122,670
$
2,323,504
$
2,719,408
$
4,872,328
Net
realized
gain
(loss)
(
179,574
)
(
4,870,716
)
307,392
(
1,607,620
)
Net
change
in
unrealized
appreciation
(depreciation)
2,385,393
3,195,950
3,090,102
491,186
Net
increase
(decrease)
in
net
assets
from
operations
3,328,489
648,738
6,116,902
3,755,894
DISTRIBUTIONS
TO
SHAREHOLDERS
Dividends:
Class
A
(
499,114
)
(
968,358
)
(
354,314
)
(
658,194
)
Class
C
(
10,395
)
(
24,103
)
(
13,824
)
(
34,968
)
Class
I
(
599,249
)
(
1,142,879
)
(
2,373,632
)
(
4,121,443
)
Total
distributions
(
1,108,758
)
(
2,135,340
)
(
2,741,770
)
(
4,814,605
)
FUND
SHARE
TRANSACTIONS
Subscriptions
6,588,235
16,074,653
24,842,378
71,354,403
Reinvestments
of
distributions
968,351
1,903,483
1,950,604
3,236,518
Redemptions
(
8,746,548
)
(
44,210,417
)
(
17,394,058
)
(
74,660,602
)
Net
increase
(decrease)
from
Fund
share
transactions
(
1,189,962
)
(
26,232,281
)
9,398,924
(
69,681
)
Net
increase
(decrease)
in
net
assets
1,029,769
(
27,718,883
)
12,774,056
(
1,128,392
)
Net
assets
at
the
beginning
of
period
73,612,168
101,331,051
182,137,946
183,266,338
Net
assets
at
the
end
of
period
$
74,641,937
$
73,612,168
$
194,912,002
$
182,137,946
The
following
data
is
for
a
share outstanding
for
each
fiscal year
end
unless
otherwise
noted:
Investment
Operations
Less
Distributions
Net
Asset
Value,
Beginning
of
Period
Net
Investment
Income
(NII)
(Loss)(a)
Net
Realized/
Unrealized
Gain
(Loss)
Total
From
NII
From
Net
Realized
Gains
Total
Net
Asset
Value,
End
of
Period
Minnesota
Intermediate
Class
A
11/30/24(d)
$
9.61
$
0.15
$
0.21
$
0.36
$
(
0.15
)
$
—
$
(
0.15
)
$
9.82
5/31/24
9.68
0.28
(
0.06
)
0.22
(
0.29
)
—
(
0.29
)
9.61
5/31/23
9.86
0.25
(
0.18
)
0.07
(
0.25
)
—
(
0.25
)
9.68
5/31/22
10.65
0.20
(
0.80
)
(
0.60
)
(
0.19
)
—
(
0.19
)
9.86
5/31/21
10.48
0.22
0.17
0.39
(
0.22
)
—
(
0.22
)
10.65
5/31/20
10.49
0.26
0.01
0.27
(
0.28
)
—
(
0.28
)
10.48
Class
C
11/30/24(d)
9.55
0.11
0.20
0.31
(
0.11
)
—
(
0.11
)
9.75
5/31/24
9.62
0.20
(
0.06
)
0.14
(
0.21
)
—
(
0.21
)
9.55
5/31/23
9.80
0.18
(
0.19
)
(
0.01
)
(
0.17
)
—
(
0.17
)
9.62
5/31/22
10.58
0.12
(
0.80
)
(
0.68
)
(
0.10
)
—
(
0.10
)
9.80
5/31/21
10.41
0.13
0.17
0.30
(
0.13
)
—
(
0.13
)
10.58
5/31/20
10.43
0.17
—
0.17
(
0.19
)
—
(
0.19
)
10.41
Class
I
11/30/24(d)
9.57
0.16
0.20
0.36
(
0.16
)
—
(
0.16
)
9.77
5/31/24
9.64
0.30
(
0.07
)
0.23
(
0.30
)
—
(
0.30
)
9.57
5/31/23
9.82
0.27
(
0.18
)
0.09
(
0.27
)
—
(
0.27
)
9.64
5/31/22
10.60
0.22
(
0.80
)
(
0.58
)
(
0.20
)
—
(
0.20
)
9.82
5/31/21
10.43
0.24
0.16
0.40
(
0.23
)
—
(
0.23
)
10.60
5/31/20
10.44
0.28
0.01
0.29
(
0.30
)
—
(
0.30
)
10.43
(a)
Based
on
average
shares
outstanding.
(b)
Total
returns
are
at
NAV
and
do
not
include
any
sales
charge.
Total
returns
are
not
annualized.
(c)
The
expense
ratios
reflect,
among
other
things,
the
interest
expense
deemed
to
have
been
paid
by
the
Fund
on
the
floating
rate
certificates
issued
by
the
special
purpose
trusts
for
the
self-deposited
inverse
floaters
held
by
the
Fund,
where
applicable,
as
described
in
Notes
to
Financial
Statements
and
the
interest
expense
and
fees
paid
on
borrowings,
as
described
in
Notes
to
Financial
Statements.
(d)
Unaudited.
(e)
Annualized.
See
Notes
to
Financial
Statements.
Ratio/Supplemental
Data
Ratios
to
Average
Net
Assets
Total
Return(b)
Net
Assets,
End
of
Period
(000)
Expenses
Including
Interest(c)
Expenses
Excluding
Interest
NII
(Loss)
Portfolio
Turnover
Rate
3
.73
%
$
79,640
0
.81
%
(e)
0
.79
%
(e)
3
.04
%
(e)
5
%
2
.27
87,301
0
.83
0
.81
2
.91
21
0
.71
85,313
0
.81
0
.81
2
.62
13
(
5
.75
)
113,097
0
.80
0
.80
1
.96
28
3
.71
138,393
0
.79
0
.79
2
.05
6
2
.57
115,325
0
.80
0
.80
2
.43
12
3
.23
5,705
1
.61
(e)
1
.59
(e)
2
.24
(e)
5
1
.45
6,364
1
.63
1
.61
2
.10
21
(
0
.11
)
8,829
1
.61
1
.61
1
.82
13
(
6
.46
)
11,621
1
.60
1
.60
1
.16
28
2
.91
13,672
1
.59
1
.59
1
.25
6
1
.67
13,064
1
.60
1
.60
1
.64
12
3
.74
240,045
0
.61
(e)
0
.59
(e)
3
.24
(e)
5
2
.47
227,661
0
.63
0
.61
3
.10
21
0
.90
245,297
0
.61
0
.61
2
.82
13
(
5
.52
)
272,534
0
.60
0
.60
2
.16
28
3
.90
306,289
0
.59
0
.59
2
.25
6
2
.76
273,269
0
.60
0
.60
2
.64
12
Financial
Highlights
(continued)
The
following
data
is
for
a
share outstanding
for
each
fiscal year
end
unless
otherwise
noted:
Investment
Operations
Less
Distributions
Net
Asset
Value,
Beginning
of
Period
Net
Investment
Income
(NII)
(Loss)(a)
Net
Realized/
Unrealized
Gain
(Loss)
Total
From
NII
From
Net
Realized
Gains
Total
Net
Asset
Value,
End
of
Period
Minnesota
Class
A
11/30/24(d)
$
10.63
$
0.18
$
0.29
$
0.47
$
(
0.19
)
$
—
$
(
0.19
)
$
10.91
5/31/24
10.68
0.36
(
0.05
)
0.31
(
0.36
)
—
(
0.36
)
10.63
5/31/23
11.08
0.33
(
0.41
)
(
0.08
)
(
0.32
)
—
(
0.32
)
10.68
5/31/22
12.11
0.24
(
1.06
)
(
0.82
)
(
0.21
)
—
(
0.21
)
11.08
5/31/21
11.78
0.25
0.34
0.59
(
0.26
)
—
(
0.26
)
12.11
5/31/20
11.84
0.32
(
0.04
)
0.28
(
0.34
)
—
(
0.34
)
11.78
Class
C
11/30/24(d)
10.62
0.14
0.28
0.42
(
0.14
)
—
(
0.14
)
10.90
5/31/24
10.67
0.27
(
0.04
)
0.23
(
0.28
)
—
(
0.28
)
10.62
5/31/23
11.07
0.24
(
0.41
)
(
0.17
)
(
0.23
)
—
(
0.23
)
10.67
5/31/22
12.10
0.15
(
1.06
)
(
0.91
)
(
0.12
)
—
(
0.12
)
11.07
5/31/21
11.77
0.15
0.34
0.49
(
0.16
)
—
(
0.16
)
12.10
5/31/20
11.83
0.22
(
0.03
)
0.19
(
0.25
)
—
(
0.25
)
11.77
Class
I
11/30/24(d)
10.62
0.19
0.29
0.48
(
0.20
)
—
(
0.20
)
10.90
5/31/24
10.66
0.38
(
0.04
)
0.34
(
0.38
)
—
(
0.38
)
10.62
5/31/23
11.07
0.34
(
0.41
)
(
0.07
)
(
0.34
)
—
(
0.34
)
10.66
5/31/22
12.10
0.26
(
1.05
)
(
0.79
)
(
0.24
)
—
(
0.24
)
11.07
5/31/21
11.77
0.27
0.34
0.61
(
0.28
)
—
(
0.28
)
12.10
5/31/20
11.83
0.34
(
0.03
)
0.31
(
0.37
)
—
(
0.37
)
11.77
(a)
Based
on
average
shares
outstanding.
(b)
Total
returns
are
at
NAV
and
do
not
include
any
sales
charge.
Total
returns
are
not
annualized.
(c)
The
expense
ratios
reflect,
among
other
things,
the
interest
expense
deemed
to
have
been
paid
by
the
Fund
on
the
floating
rate
certificates
issued
by
the
special
purpose
trusts
for
the
self-deposited
inverse
floaters
held
by
the
Fund,
where
applicable,
as
described
in
Notes
to
Financial
Statements
and
the
interest
expense
and
fees
paid
on
borrowings,
as
described
in
Notes
to
Financial
Statements.
(d)
Unaudited.
(e)
Annualized.
See
Notes
to
Financial
Statements.
Ratio/Supplemental
Data
Ratios
to
Average
Net
Assets
Total
Return(b)
Net
Assets,
End
of
Period
(000)
Expenses
Including
Interest(c)
Expenses
Excluding
Interest
NII
(Loss)
Portfolio
Turnover
Rate
4
.44
%
$
224,941
0
.78
%
(e)
0
.77
%
(e)
3
.32
%
(e)
1
%
2
.99
214,252
0
.80
0
.79
3
.36
26
(
0
.73
)
206,858
0
.79
0
.79
3
.03
29
(
6
.83
)
225,930
0
.77
0
.77
2
.03
28
5
.02
277,598
0
.77
0
.77
2
.07
7
2
.40
236,237
0
.79
0
.79
2
.67
13
4
.01
12,145
1
.57
(e)
1
.56
(e)
2
.52
(e)
1
2
.16
13,274
1
.60
1
.59
2
.56
26
(
1
.51
)
17,824
1
.59
1
.59
2
.22
29
(
7
.58
)
25,848
1
.57
1
.57
1
.23
28
4
.19
33,134
1
.57
1
.57
1
.28
7
1
.58
33,110
1
.59
1
.59
1
.88
13
4
.53
432,249
0
.58
(e)
0
.57
(e)
3
.53
(e)
1
3
.29
376,267
0
.60
0
.59
3
.56
26
(
0
.61
)
317,275
0
.59
0
.59
3
.21
29
(
6
.64
)
392,073
0
.57
0
.57
2
.23
28
5
.23
421,865
0
.57
0
.57
2
.27
7
2
.61
315,275
0
.59
0
.59
2
.87
13
Financial
Highlights
(continued)
The
following
data
is
for
a
share outstanding
for
each
fiscal year
end
unless
otherwise
noted:
Investment
Operations
Less
Distributions
Net
Asset
Value,
Beginning
of
Period
Net
Investment
Income
(NII)
(Loss)(a)
Net
Realized/
Unrealized
Gain
(Loss)
Total
From
NII
From
Net
Realized
Gains
Total
Net
Asset
Value,
End
of
Period
Nebraska
Class
A
11/30/24(e)
$
9.65
$
0.15
$
0.29
$
0.44
$
(
0.14
)
$
—
$
(
0.14
)
$
9.95
5/31/24
9.72
0.26
(
0.09
)
0.17
(
0.24
)
—
(
0.24
)
9.65
5/31/23
10.03
0.20
(
0.32
)
(
0.12
)
(
0.19
)
—
(
0.19
)
9.72
5/31/22
11.11
0.17
(
1.09
)
(
0.92
)
(
0.16
)
—
(
0.16
)
10.03
5/31/21
10.98
0.20
0.13
0.33
(
0.20
)
—
(
0.20
)
11.11
5/31/20
10.77
0.25
0.23
0.48
(
0.27
)
—
(
0.27
)
10.98
Class
C
11/30/24(e)
9.64
0.11
0.28
0.39
(
0.10
)
—
(
0.10
)
9.93
5/31/24
9.71
0.18
(
0.09
)
0.09
(
0.16
)
—
(
0.16
)
9.64
5/31/23
10.01
0.12
(
0.31
)
(
0.19
)
(
0.11
)
—
(
0.11
)
9.71
5/31/22
11.08
0.08
(
1.08
)
(
1.00
)
(
0.07
)
—
(
0.07
)
10.01
5/31/21
10.95
0.11
0.13
0.24
(
0.11
)
—
(
0.11
)
11.08
5/31/20
10.75
0.16
0.22
0.38
(
0.18
)
—
(
0.18
)
10.95
Class
I
11/30/24(e)
9.67
0.16
0.28
0.44
(
0.15
)
—
(
0.15
)
9.96
5/31/24
9.74
0.27
(
0.08
)
0.19
(
0.26
)
—
(
0.26
)
9.67
5/31/23
10.05
0.22
(
0.32
)
(
0.10
)
(
0.21
)
—
(
0.21
)
9.74
5/31/22
11.13
0.19
(
1.09
)
(
0.90
)
(
0.18
)
—
(
0.18
)
10.05
5/31/21
11.00
0.22
0.13
0.35
(
0.22
)
—
(
0.22
)
11.13
5/31/20
10.79
0.27
0.23
0.50
(
0.29
)
—
(
0.29
)
11.00
(a)
Based
on
average
shares
outstanding.
(b)
Total
returns
are
at
NAV
and
do
not
include
any
sales
charge.
Total
returns
are
not
annualized.
(c)
The
expense
ratios
reflect,
among
other
things,
the
interest
expense
deemed
to
have
been
paid
by
the
Fund
on
the
floating
rate
certificates
issued
by
the
special
purpose
trusts
for
the
self-deposited
inverse
floaters
held
by
the
Fund,
where
applicable,
as
described
in
Notes
to
Financial
Statements
and
the
interest
expense
and
fees
paid
on
borrowings,
as
described
in
Notes
to
Financial
Statements.
(d)
After
fee
waiver
and/or
expense
reimbursement
from
the
Adviser,
where
applicable.
See
Notes
to
Financial
Statements
for
more
information.
(e)
Unaudited.
(f)
Annualized.
See
Notes
to
Financial
Statements.
Ratio/Supplemental
Data
Ratios
to
Average
Net
Assets
Total
Return(b)
Net
Assets,
End
of
Period
(000)
Gross
Expenses
Including
Interest(c)
Gross
Expenses
Excluding
Interest
Net
Expenses
Including
Interest(c),(d)
Net
Expenses
Excluding
Interest(d)
NII
(Loss)(d)
Portfolio
Turnover
Rate
4
.62
%
$
33,623
0
.99
%
(f)
0
.94
%
(f)
0
.85
%
(f)
0
.80
%
(f)
2
.95
%
(f)
10
%
1
.75
35,597
0
.94
0
.91
0
.84
0
.81
2
.66
20
(
1
.20
)
44,057
0
.89
0
.89
0
.82
0
.82
2
.05
18
(
8
.34
)
55,101
0
.88
0
.88
0
.87
0
.87
1
.57
26
3
.03
62,259
0
.88
0
.88
0
.87
0
.87
1
.79
4
4
.50
47,070
0
.89
0
.89
0
.88
0
.88
2
.31
12
4
.09
992
1
.79
(f)
1
.74
(f)
1
.65
(f)
1
.60
(f)
2
.14
(f)
10
0
.93
991
1
.74
1
.71
1
.64
1
.61
1
.83
20
(
1
.89
)
1,985
1
.69
1
.69
1
.62
1
.62
1
.25
18
(
9
.03
)
2,650
1
.68
1
.68
1
.67
1
.67
0
.77
26
2
.20
3,110
1
.68
1
.68
1
.67
1
.67
1
.00
4
3
.58
2,833
1
.69
1
.69
1
.68
1
.68
1
.51
12
4
.61
40,027
0
.79
(f)
0
.74
(f)
0
.66
(f)
0
.61
(f)
3
.15
(f)
10
1
.95
37,025
0
.74
0
.71
0
.64
0
.61
2
.82
20
(
0
.99
)
55,289
0
.69
0
.69
0
.62
0
.62
2
.25
18
(
8
.12
)
64,848
0
.68
0
.68
0
.67
0
.67
1
.77
26
3
.24
66,647
0
.68
0
.68
0
.67
0
.67
1
.99
4
4
.71
47,500
0
.69
0
.69
0
.68
0
.68
2
.51
12
Financial
Highlights
(continued)
The
following
data
is
for
a
share outstanding
for
each
fiscal year
end
unless
otherwise
noted:
Investment
Operations
Less
Distributions
Net
Asset
Value,
Beginning
of
Period
Net
Investment
Income
(NII)
(Loss)(a)
Net
Realized/
Unrealized
Gain
(Loss)
Total
From
NII
From
Net
Realized
Gains
Total
Net
Asset
Value,
End
of
Period
Oregon
Intermediate
Class
A
11/30/24(d)
$
9.64
$
0.13
$
0.18
$
0.31
$
(
0.13
)
$
—
$
(
0.13
)
$
9.82
5/31/24
9.65
0.25
(
0.02
)
0.23
(
0.24
)
—
(
0.24
)
9.64
5/31/23
9.83
0.22
(
0.19
)
0.03
(
0.21
)
—
(
0.21
)
9.65
5/31/22
10.70
0.17
(
0.88
)
(
0.71
)
(
0.16
)
—
(
0.16
)
9.83
5/31/21
10.61
0.18
0.10
0.28
(
0.19
)
—
(
0.19
)
10.70
5/31/20
10.40
0.21
0.21
0.42
(
0.21
)
—
(
0.21
)
10.61
Class
C
11/30/24(d)
9.58
0.09
0.18
0.27
(
0.09
)
—
(
0.09
)
9.76
5/31/24
9.60
0.17
(
0.02
)
0.15
(
0.17
)
—
(
0.17
)
9.58
5/31/23
9.77
0.14
(
0.18
)
(
0.04
)
(
0.13
)
—
(
0.13
)
9.60
5/31/22
10.64
0.09
(
0.88
)
(
0.79
)
(
0.08
)
—
(
0.08
)
9.77
5/31/21
10.55
0.10
0.10
0.20
(
0.11
)
—
(
0.11
)
10.64
5/31/20
10.34
0.12
0.22
0.34
(
0.13
)
—
(
0.13
)
10.55
Class
I
11/30/24(d)
9.66
0.14
0.17
0.31
(
0.14
)
—
(
0.14
)
9.83
5/31/24
9.67
0.27
(
0.02
)
0.25
(
0.26
)
—
(
0.26
)
9.66
5/31/23
9.85
0.23
(
0.19
)
0.04
(
0.22
)
—
(
0.22
)
9.67
5/31/22
10.72
0.19
(
0.87
)
(
0.68
)
(
0.19
)
—
(
0.19
)
9.85
5/31/21
10.63
0.20
0.10
0.30
(
0.21
)
—
(
0.21
)
10.72
5/31/20
10.42
0.23
0.21
0.44
(
0.23
)
—
(
0.23
)
10.63
(a)
Based
on
average
shares
outstanding.
(b)
Total
returns
are
at
NAV
and
do
not
include
any
sales
charge.
Total
returns
are
not
annualized.
(c)
The
expense
ratios
reflect,
among
other
things,
the
interest
expense
deemed
to
have
been
paid
by
the
Fund
on
the
floating
rate
certificates
issued
by
the
special
purpose
trusts
for
the
self-deposited
inverse
floaters
held
by
the
Fund,
where
applicable,
as
described
in
Notes
to
Financial
Statements
and
the
interest
expense
and
fees
paid
on
borrowings,
as
described
in
Notes
to
Financial
Statements.
(d)
Unaudited.
(e)
Annualized.
See
Notes
to
Financial
Statements.
Ratio/Supplemental
Data
Ratios
to
Average
Net
Assets
Total
Return(b)
Net
Assets,
End
of
Period
(000)
Expenses
Including
Interest(c)
Expenses
Excluding
Interest
NII
(Loss)
Portfolio
Turnover
Rate
3
.25
%
$
25,943
0
.84
%
(e)
0
.82
%
(e)
2
.69
%
(e)
6
%
2
.45
25,293
0
.86
0
.84
2
.54
20
0
.27
26,804
0
.83
0
.83
2
.22
18
(
6
.69
)
33,236
0
.81
0
.81
1
.65
21
2
.69
35,100
0
.80
0
.80
1
.69
4
4
.07
25,357
0
.81
0
.81
1
.97
13
2
.86
1,356
1
.64
(e)
1
.62
(e)
1
.88
(e)
6
1
.52
1,536
1
.66
1
.64
1
.74
20
(
0
.43
)
2,218
1
.63
1
.63
1
.43
18
(
7
.48
)
2,905
1
.61
1
.61
0
.84
21
1
.88
4,473
1
.60
1
.60
0
.90
4
3
.27
4,285
1
.61
1
.61
1
.16
13
3
.25
167,613
0
.64
(e)
0
.62
(e)
2
.89
(e)
6
2
.64
155,309
0
.66
0
.64
2
.74
20
0
.46
154,245
0
.63
0
.63
2
.42
18
(
6
.46
)
190,601
0
.61
0
.61
1
.84
21
2
.88
248,222
0
.60
0
.60
1
.90
4
4
.24
210,368
0
.61
0
.61
2
.16
13
Notes
to
Financial
Statements
(U
naudited)
1.
General
Information
Trust
and
Fund
Information:
Nuveen
Investment
Funds,
Inc.
(the
“Trust”),
is
an
open-end
management
investment
company
registered
under
the
Investment
Company
Act
of
1940
(the
“1940
Act”),
as
amended.
The
Trust
is
comprised
of
Nuveen
Minnesota
Intermediate
Municipal
Bond
Fund
(“Minnesota
Intermediate”),
Nuveen
Minnesota
Municipal
Bond
Fund
(“Minnesota”),
Nuveen
Nebraska
Municipal
Bond
Fund
(“Nebraska”)
and
Nuveen
Oregon
Intermediate
Municipal
Bond
Fund
(“Oregon
Intermediate”),
(each
a
“Fund”
and
collectively,
the
“Funds”),
among
others.
The
Trust
was
incorporated
in
the
State
of
Maryland
on
August
20,
1987.
Current
Fiscal
Period:
The
end
of
the
reporting
period
for
the
Funds
is
November
30,
2024,
and
the
period
covered
by
these
Notes
to
Financial
Statements
is
the
six
months
ended
November
30,
2024
(the
"current
fiscal
period").
Investment
Adviser
and
Sub-Adviser:
The
Funds'
investment
adviser
is
Nuveen
Fund
Advisors,
LLC
(the
“Adviser”),
a
subsidiary
of
Nuveen,
LLC
(“Nuveen”).
Nuveen
is
the
investment
management
arm
of
Teachers
Insurance
and
Annuity
Association
of
America
(TIAA).
The
Adviser
has
overall
responsibility
for
management
of
the
Funds,
oversees
the
management
of
the
Funds'
portfolio,
manages
the
Funds'
business
affairs
and
provides
certain
clerical,
bookkeeping
and
other
administrative
services,
and,
if
necessary,
asset
allocation
decisions.
The
Adviser
has
entered
into sub-
advisory
agreements
with
Nuveen
Asset
Management,
LLC,
(the
“Sub-Adviser”),
a
subsidiary
of
the
Adviser,
under
which
the
Sub-Adviser
manages
the
investment
portfolios
of
the
Funds.
Share
Classes
and
Sales
Charges:
Class
A
Shares
are
generally
sold
with
an
up-front
sales
charge.
Class
A
Shares
purchases
of
$250,000
or
more
are
sold
at
net
asset
value
(“NAV”)
without
an
up-front
sales
charge
but
may
be
subject
to
a
contingent
deferred
sales
charge
(“CDSC”)
of
1%
if
redeemed
within
eighteen
months
of
purchase.
Class
C
Shares
are
sold
without
an
up-front
sales
charge
but
are
subject
to
a
CDSC
of
1%
if
redeemed
within
twelve
months
of
purchase.
Class
C
Shares
automatically
convert
to
Class
A
Shares
eight
years
after
purchase.
Class
I
Shares
are
sold
without
an
up-front
sales
charge.
2.
Significant
Accounting
Policies
The
accompanying
financial
statements
were
prepared
in
accordance
with
accounting
principles
generally
accepted
in
the
United
States
of
America
(“U.S.
GAAP”),
which
may
require
the
use
of
estimates
made
by
management
and
the
evaluation
of
subsequent
events.
Actual
results
may
differ
from
those
estimates.
Each
Fund
is
an
investment
company
and
follows
accounting
guidance
in
the
Financial
Accounting
Standards
Board
(“FASB”)
Accounting
Standards
Codification
946,
Financial
Services
—
Investment
Companies.
The
net
asset
value
("NAV")
for
financial
reporting
purposes
may
differ
from
the
NAV
for
processing
security
and shareholder
transactions.
The
NAV
for
financial
reporting
purposes
includes
security
and
common
share
transactions
through
the
date
of
the
report.
Total
return
is
computed
based
on
the
NAV
used
for
processing
security
and
common
share
transactions.
The
following
is
a
summary
of
the
significant
accounting
policies
consistently
followed
by
the
Funds.
Compensation:
The
Trust
pays
no
compensation
directly
to
those
of its
officers,
all
of
whom
receive
remuneration
for
their
services
to
the
Trust
from
the
Adviser
or
its
affiliates.
The
Funds’
Board
of Directors
(the
"Board")
has
adopted
a
deferred
compensation
plan
for
independent directors that
enables directors
to
elect
to
defer
receipt
of
all
or
a
portion
of
the
annual
compensation
they
are
entitled
to
receive
from
certain
Nuveen-advised
funds.
Under
the
plan,
deferred
amounts
are
treated
as
though
equal
dollar
amounts
had
been
invested
in
shares
of
select
Nuveen-advised
funds.
Custodian
Fee
Credit:
As
an
alternative
to
overnight
investments,
each
Fund
has
an
arrangement
with
its
custodian
bank,
State
Street
Bank
and
Trust
Company,
(the
“Custodian”)
whereby
certain
custodian
fees
and
expenses
are
reduced
by
net
credits
earned
on
each
Fund’s
cash
on
deposit
with
the
bank.
Credits
for
cash
balances
may
be
offset
by
charges
for
any
days
on
which
a
Fund
overdraws
its
account
at
the
Custodian.
The
amount
of
custodian
fee
credit
earned
by
a
Fund
is
recognized
on
the
Statement
of
Operations
as
a
component
of
“Custodian
expenses,
net.”
During
the
current
reporting
period,
the
custodian
fee
credit
earned
by
each
Fund
was
as
follows:
Distributions
to
Shareholders:
Distributions
to
shareholders
are
recorded
on
the
ex-dividend
date.
The
amount,
character
and
timing
of
distributions
are
determined
in
accordance
with
federal
income
tax
regulations,
which
may
differ
from
U.S.
GAAP.
Indemnifications:
Under
the
Trust’s
organizational
documents,
its
officers
and directors
are
indemnified
against
certain
liabilities
arising
out
of
the
performance
of
their
duties
to
the
Trust.
In
addition,
in
the
normal
course
of
business,
the
Trust
enters
into
contracts
that
provide
general
indemnifications
to
other
parties.
The
Trust’s
maximum
exposure
under
these
arrangements
is
unknown
as
this
would
involve
future
claims
that
may
be
made
against
the
Trust
that
have
not
yet
occurred.
However,
the
Trust
has
not
had
prior
claims
or
losses
pursuant
to
these
contracts
and
expects
the
risk
of
loss
to
be
remote.
Fund
Gross
Custodian
Fee
Credits
Minnesota
Intermediate
$
—
Minnesota
—
Nebraska
—
Oregon
Intermediate
—
Investments
and
Investment
Income:
Securities
transactions
are
accounted
for
as
of
the
trade
date
for
financial
reporting
purposes.
Realized
gains
and
losses
on
securities
transactions
are
based
upon
the
specific
identification
method.
Investment
income
is
comprised
of
interest
income,
which
is
recorded
on
an
accrual
basis
and
includes
accretion
of
discounts
and
amortization
of
premiums
for
financial
reporting
purposes.
Investment
income
also
reflects
payment-in-kind
(
“
PIK
”
)
interest
and
paydown
gains
and
losses,
if
any.
PIK
interest
represents
income
received
in
the
form
of
securities
in
lieu
of
cash.
Multiclass
Operations
and
Allocations:
Income
and
expenses
of
the
Funds
that
are
not
directly
attributable
to
a
specific
class
of
shares
are
prorated
among
the
classes
based
on
the
relative
net
assets
of
each
class.
Expenses
directly
attributable
to
a
class
of
shares
are
recorded
to
the
specific
class.
12b-1
distribution
and
service
fees
are
allocated
on
a
class-specific
basis.
Realized
and
unrealized
capital
gains
and
losses
of
the
Funds
are
prorated
among
the
classes
based
on
the
relative
net
assets
of
each
class.
Netting
Agreements:
In
the
ordinary
course
of
business,
the
Funds
may
enter
into
transactions
subject
to
enforceable International
Swaps
and
Derivatives
Association,
Inc.
(ISDA)
master
agreements
or
other
similar
arrangements
(“netting
agreements”).
Generally,
the
right
to
offset
in
netting
agreements
allows
each
Fund
to
offset
certain
securities
and
derivatives
with
a
specific
counterparty,
when
applicable,
as
well
as
any
collateral
received
or
delivered
to
that
counterparty
based
on
the
terms
of
the
agreements.
Generally,
each
Fund
manages
its
cash
collateral
and
securities
collateral
on
a
counterparty
basis.
With
respect
to
certain
counterparties,
in
accordance
with
the
terms
of
the
netting
agreements,
collateral
posted
to
the
Funds
is
held
in
a
segregated
account
by
the
Funds’
custodian
and/or
with
respect
to
those
amounts
which
can
be
sold
or
repledged,
are
presented
in
the
Funds’
Portfolio
of
Investments
or
Statement
of
Assets
and
Liabilities.
The
Funds’
investments
subject
to
netting
agreements
as
of
the
end
of
the
reporting
period,
if
any,
are
further
described
later
in
these
Notes
to
Financial
Statements.
New
Accounting
Pronouncement:
In
November
2023,
the
FASB
issued
Accounting
Standard
Update
(“ASU”)
No.
2023-07,
Segment
Reporting
(Topic
280)
Improvements
to
Reportable
Segment
Disclosures
(“ASU
2023-07”).
The
amendments
in
ASU
2023-07
improve
reportable
segment
disclosure
requirements,
primarily
through
enhanced
disclosures
about
significant
segment
expenses.
ASU
2023-07
also
requires
a
public
entity
that
has
a
single
reportable
segment
to
provide
all
the
disclosures
required
by
the
amendments
in
ASU
2023-07
and
all
existing
segment
disclosures
in
Topic
280.
The
amendments
in
ASU
2023-07
are
effective
for
fiscal
years
beginning
after
December
15,
2023,
and
interim
periods
within
fiscal
years
beginning
after
December
15,
2024.
Early
adoption
is
permitted.
Management
has
assessed
the
new
guidance
and
determined
that
it
will
not
have
a
material
impact
on
the
financial
positions
or
results
of
operations
of
the
Funds.
3.
Investment
Valuation
and
Fair
Value
Measurements
The
Funds’
investments
in
securities
are
recorded
at
their
estimated
fair
value
utilizing
valuation
methods
approved
by
the
Adviser,
subject
to
oversight
of
the Board.
Fair
value
is
defined
as
the
price
that
would
be
received
upon
selling
an
investment
or
transferring
a
liability
in
an
orderly
transaction
to
an
independent
buyer
in
the
principal
or
most
advantageous
market
for
the
investment.
U.S.
GAAP
establishes
the
three-tier
hierarchy
which
is
used
to
maximize
the
use
of
observable
market
data
and
minimize
the
use
of
unobservable
inputs
and
to
establish
classification
of
fair
value
measurements
for
disclosure
purposes.
Observable
inputs
reflect
the
assumptions
market
participants
would
use
in
pricing
the
asset
or
liability.
Observable
inputs
are
based
on
market
data
obtained
from
sources
independent
of
the
reporting
entity.
Unobservable
inputs
reflect
management’s
assumptions
about
the
assumptions
market
participants
would
use
in
pricing
the
asset
or
liability.
Unobservable
inputs
are
based
on
the
best
information
available
in
the
circumstances.
The
following
is
a
summary
of
the
three-tiered
hierarchy
of
valuation
input
levels.
Level
1
–
Inputs
are
unadjusted
and
prices
are
determined
using
quoted
prices
in
active
markets
for
identical
securities.
Level
2
–
Prices
are
determined
using
other
significant
observable
inputs
(including
quoted
prices
for
similar
securities,
interest
rates,
credit
spreads,
etc.).
Level
3
–
Prices
are
determined
using
significant
unobservable
inputs
(including
management’s
assumptions
in
determining
the
fair
value
of
investments).
A
description
of
the
valuation
techniques
applied
to
the
Funds’
major
classifications
of
assets
and
liabilities
measured
at
fair
value
follows:
Prices
of
fixed-income
securities
are
generally
provided
by
pricing
services
approved
by
the
Adviser,
which
is
subject
to
review
by
the
Adviser
and
oversight
of
the
Board. Pricing
services
establish
a
security’s
fair
value
using
methods
that
may
include
consideration
of
the
following:
yields
or
prices
of
investments
of
comparable
quality,
type
of
issue,
coupon,
maturity
and
rating,
market
quotes
or
indications
of
value
from
security
dealers,
evaluations
of
anticipated
cash
flows
or
collateral,
general
market
conditions
and
other
information
and
analysis,
including
the
obligor’s
credit
characteristics
considered
relevant.
In
pricing
certain
securities,
particularly
less
liquid
and
lower
quality
securities,
pricing
services
may
consider
information
about
a
security,
its
issuer
or
market
activity
provided
by
the
Adviser.
These
securities
are
generally
classified
as
Level
2.
For
any
portfolio
security
or
derivative
for
which
market
quotations
are
not
readily
available
or
for
which
the
Adviser
deems
the
valuations
derived
using
the
valuation
procedures
described
above
not
to
reflect
fair
value,
the
Adviser
will
determine
a
fair
value
in
good
faith
using
alternative
procedures
approved
by
the
Adviser,
subject
to
the
oversight
of
the
Board.
As
a
general
principle,
the
fair
value
of
a
security
is
the
amount
that
the
owner
might
reasonably
expect
to
receive
for
it
in
a
current
sale.
A
variety
of
factors
may
be
considered
in
determining
the
fair
value
of
such
securities,
which
may
include
consideration
of
the
following:
yields
or
prices
of
investments
of
comparable
quality,
type
of
issue,
coupon,
maturity
and
rating,
market
quotes
or
indications
of
value
from
security
dealers,
evaluations
of
anticipated
cash
flows
or
collateral,
general
market
conditions
and
other
information
and
analysis,
including
the
obligor’s
credit
characteristics
considered
relevant.
To
the
extent
the
inputs
are
observable
and
timely,
the
values
would
be
classified
as
Level
2;
otherwise
they
would
be
classified
as
Level
3.
Notes
to
Financial
Statements
(continued)
The
following
table
summarizes
the
market
value
of
the
Funds’
investments
as
of
the
end
of
the
reporting
period,
based
on
the
inputs
used
to
value
them:
The
Funds
hold
liabilities
in
floating
rate
obligations,
where
applicable,
which
are
not
reflected
in
the
tables
above.
The
fair
values
of
the
Funds'
liabilities
for
floating
rate
obligations
approximate
their
liquidation
values.
Floating
rate
obligations
are
generally
classified
as
Level
2
and
further
described
in
these
Notes
to
Financial
Statements.
4.
Portfolio
Securities
Inverse
Floating
Rate
Securities:
Each
Fund
is
authorized
to
invest
in
inverse
floating
rate
securities.
An
inverse
floating
rate
security
is
created
by
depositing
a
municipal
bond
(referred
to
as
an
“Underlying
Bond”),
typically
with
a
fixed
interest
rate,
into
a
special
purpose
tender
option
bond
(“TOB”)
trust
(referred
to
as
the
“TOB
Trust”)
created
by
or
at
the
direction
of
one
or
more
Funds.
In
turn,
the
TOB
Trust
issues
(a)
floating
rate
certificates
(referred
to
as
“Floaters”),
in
face
amounts
equal
to
some
fraction
of
the
Underlying
Bond’s
par
amount
or
market
value,
and
(b)
an
inverse
floating
rate
certificate
(referred
to
as
an
“Inverse
Floater”)
that
represents
all
remaining
or
residual
interest
in
the
TOB
Trust.
Floaters
typically
pay
short-term
tax-exempt
interest
rates
to
third
parties
who
are
also
provided
a
right
to
tender
their
certificate
and
receive
its
par
value,
which
may
be
paid
from
the
proceeds
of
a
remarketing
of
the
Floaters,
by
a
loan
to
the
TOB
Trust
from
a
third
party
liquidity
provider
(“Liquidity
Provider”),
or
by
the
sale
of
assets
from
the
TOB
Trust.
The
Inverse
Floater
is
issued
to
a
long
term
investor,
such
as
one
or
more
of
the
Funds.
The
income
received
by
the
Inverse
Floater
holder
varies
inversely
with
the
short-term
rate
paid
to
holders
of
the
Floaters,
and
in
most
circumstances
the
Inverse
Floater
holder
bears
substantially
all
of
the
Underlying
Bond’s
downside
investment
risk
and
also
benefits
disproportionately
from
any
potential
appreciation
of
the
Underlying
Bond’s
value.
The
value
of
an
Inverse
Floater
will
be
more
volatile
than
that
of
the
Underlying
Bond
because
the
interest
rate
is
dependent
on
not
only
the
fixed
coupon
rate
of
the
Underlying
Bond
but
also
on
the
short-term
interest
paid
on
the
Floaters,
and
because
the
Inverse
Floater
essentially
bears
the
risk
of
loss
(and
possible
gain)
of
the
greater
face
value
of
the
Underlying
Bond.
The
Inverse
Floater
held
by
a
Fund
gives
the
Fund
the
right
to
(a)
cause
the
holders
of
the
Floaters
to
tender
their
certificates
at
par
(or
slightly
more
than
par
in
certain
circumstances),
and
(b)
have
the
trustee
of
the
TOB
Trust
(the
“Trustee”)
transfer
the
Underlying
Bond
held
by
the
TOB
Trust
to
the
Fund,
thereby
collapsing
the
TOB
Trust.
The
Fund
may
acquire
an
Inverse
Floater
in
a
transaction
where
it
(a)
transfers
an
Underlying
Bond
that
it
owns
to
a
TOB
Trust
created
by
a
third
party
or
(b)
transfers
an
Underlying
Bond
that
it
owns,
or
that
it
has
purchased
in
a
secondary
market
transaction
for
the
purpose
of
creating
an
Inverse
Floater,
to
a
TOB
Trust
created
at
its
direction,
and
in
return
receives
the
Inverse
Floater
of
the
TOB
Trust
(referred
to
as
a
“self-deposited
Inverse
Floater”).
A
Fund
may
also
purchase
an
Inverse
Floater
in
a
secondary
market
transaction
from
a
third
party
creator
of
the
TOB
Trust
without
first
owning
the
Underlying
Bond
(referred
to
as
an
“externally-deposited
Inverse
Floater”).
An
investment
in
a
self-deposited
Inverse
Floater
is
accounted
for
as
a
“financing”
transaction
(i.e.,
a
secured
borrowing).
For
a
self-deposited
Inverse
Floater,
the
Underlying
Bond
deposited
into
the
TOB
Trust
is
identified
in
the
Fund’s
Portfolio
of
Investments
as
“(UB)
–
Underlying
bond
of
an
inverse
floating
rate
trust
reflected
as
a
financing
transaction,”
with
the
Fund
recognizing
as
liabilities,
labeled
“Floating
rate
obligations”
on
the
Statement
of
Assets
and
Liabilities,
(a)
the
liquidation
value
of
Floaters
issued
by
the
TOB
Trust,
and
(b)
the
amount
of
any
borrowings
by
the
TOB
Trust
from
a
Liquidity
Provider
to
enable
the
TOB
Trust
to
purchase
outstanding
Floaters
in
lieu
of
a
remarketing.
In
addition,
the
Fund
recognizes
in
“Investment
Income”
the
entire
earnings
of
the
Underlying
Bond,
and
recognizes
(a)
the
interest
paid
to
the
holders
of
the
Floaters
or
on
the
TOB
Minnesota
Intermediate
Level
1
Level
2
Level
3
Total
Long-Term
Investments:
Municipal
Bonds
$
–
$
320,827,928
$
–
$
320,827,928
Total
$
–
$
320,827,928
$
–
$
320,827,928
Minnesota
Level
1
Level
2
Level
3
Total
Long-Term
Investments:
Municipal
Bonds
$
–
$
650,576,905
$
–
$
650,576,905
Short-Term
Investments:
Municipal
Bonds
–
10,045,000
–
10,045,000
Total
$
–
$
660,621,905
$
–
$
660,621,905
Nebraska
Level
1
Level
2
Level
3
Total
Long-Term
Investments:
Municipal
Bonds
$
–
$
74,181,667
$
–
$
74,181,667
Total
$
–
$
74,181,667
$
–
$
74,181,667
Oregon
Intermediate
Level
1
Level
2
Level
3
Total
Long-Term
Investments:
Municipal
Bonds
$
–
$
191,065,650
$
–
$
191,065,650
Short-Term
Investments:
Municipal
Bonds
–
1,710,000
–
1,710,000
Total
$
–
$
192,775,650
$
–
$
192,775,650
Trust’s
borrowings,
and
(b)
other
expenses
related
to
remarketing,
administration,
trustee,
liquidity
and
other
services
to
a
TOB
Trust,
as
a
component
of
“Interest
expense”
on
the
Statement
of
Operations.
Earnings
due
from
the
Underlying
Bond
and
interest
due
to
the
holders
of
the
Floaters
as
of
the
end
of
the
reporting
period
are
recognized
as
components
of
“Receivable
for
interest”
and
“Payable
for
interest”
on
the
Statement
of
Assets
and
Liabilities,
respectively.
In
contrast,
an
investment
in
an
externally-deposited
Inverse
Floater
is
accounted
for
as
a
purchase
of
the
Inverse
Floater
and
is
identified
in
the
Fund’s
Portfolio
of
Investments
as
“(IF)
–
Inverse
floating
rate
investment.”
For
an
externally-deposited
Inverse
Floater,
a
Fund’s
Statement
of
Assets
and
Liabilities
recognizes
the
Inverse
Floater
and
not
the
Underlying
Bond
as
an
asset,
and
the
Fund
does
not
recognize
the
Floaters,
or
any
related
borrowings
from
a
Liquidity
Provider,
as
a
liability.
Additionally,
the
Fund
reflects
in
“Investment
Income”
only
the
net
amount
of
earnings
on
the
Inverse
Floater
(net
of
the
interest
paid
to
the
holders
of
the
Floaters
or
the
Liquidity
Provider
as
lender,
and
the
expenses
of
the
Trust),
and
does
not
show
the
amount
of
that
interest
paid
or
the
expenses
of
the
TOB
Trust
as
described
above
as
interest
expense
on
the
Statement
of
Operations.
Fees
paid
upon
the
creation
of
a
TOB
Trust
for
self-deposited
Inverse
Floaters
and
externally-deposited
Inverse
Floaters
are
recognized
as
part
of
the
cost
basis
of
the
Inverse
Floater
and
are
capitalized
over
the
term
of
the
TOB
Trust.
During
the
current
fiscal
period,
the
Funds
did
not
have
any
transactions
in
self-deposited
Inverse
Floaters
and/or
externally-deposited
Inverse
Floaters.
Zero
Coupon
Securities:
A
zero
coupon
security
does
not
pay
a
regular
interest
coupon
to
its
holders
during
the
life
of
the
security.
Income
to
the
holder
of
the
security
comes
from
accretion
of
the
difference
between
the
original
purchase
price
of
the
security
at
issuance
and
the
par
value
of
the
security
at
maturity
and
is
effectively
paid
at
maturity.
The
market
prices
of
zero
coupon
securities
generally
are
more
volatile
than
the
market
prices
of
securities
that
pay
interest
periodically.
Purchases
and
Sales:
Long-term
purchases
and
sales
during
the
current
fiscal
period
were
as
follows:
The
Funds
may
purchase
securities
on
a
when-issued
or
delayed-delivery
basis.
Securities
purchased
on
a
when-issued
or
delayed-delivery
basis
may
have
extended
settlement
periods;
interest
income
is
not
accrued
until
settlement
date.
Any
securities
so
purchased
are
subject
to
market
fluctuation
during
this
period. If
a
Fund
has
outstanding
when-issued/delayed-delivery
purchases
commitments
as
of
the
end
of
the
reporting
period,
such
amounts
are
recognized
on
the
Statement
of
Assets
and
Liabilities.
5.
Derivative
Investments
Each
Fund
is
authorized
to
invest
in
certain
derivative
instruments.
As
defined
by
U.S.
GAAP,
a
derivative
is
a
financial
instrument
whose
value
is
derived
from
an
underlying
security
price,
foreign
exchange
rate,
interest
rate,
index
of
prices
or
rates,
or
other
variables.
Investments
in
derivatives
as
of
the
end
of
and/or
during
the
current
fiscal
period,
if
any,
are
included
within
the
Statement
of
Assets
and
Liabilities
and
the
Statement
of
Operations,
respectively.
Market
and
Counterparty
Credit
Risk:
In
the
normal
course
of
business
each
Fund
may
invest
in
financial
instruments
and
enter
into
financial
transactions
where
risk
of
potential
loss
exists
due
to
changes
in
the
market
(market
risk)
or
failure
of
the
other
party
to
the
transaction
to
perform
(counterparty
credit
risk).
The
potential
loss
could
exceed
the
value
of
the
financial
assets
recorded
on
the
financial
statements.
Financial
assets,
which
potentially
expose
each
Fund
to
counterparty
credit
risk,
consist
principally
of
cash
due
from
counterparties
on
forward,
option
and
swap
transactions,
when
applicable.
The
extent
of
each
Fund’s
exposure
to
counterparty
credit
risk
in
respect
to
these
financial
assets
approximates
their
carrying
value
as
recorded
on
the
Statement
of
Assets
and
Liabilities.
Each
Fund
helps
manage
counterparty
credit
risk
by
entering
into
agreements
only
with
counterparties
the
Adviser
believes
have
the
financial
resources
to
honor
their
obligations
and
by
having
the
Adviser
monitor
the
financial
stability
of
the
counterparties.
Additionally,
counterparties
may
be
required
to
pledge
collateral
daily
(based
on
the
daily
valuation
of
the
financial
asset)
on
behalf
of
each
Fund
with
a
value
approximately
equal
to
the
amount
of
any
unrealized
gain
above
a
pre-determined
threshold.
Reciprocally,
when
each
Fund
has
an
unrealized
loss,
the
Funds
have
instructed
the
custodian
to
pledge
assets
of
the
Funds
as
collateral
with
a
value
approximately
equal
to
the
amount
of
the
unrealized
loss
above
a
pre-determined
threshold.
Collateral
pledges
are
monitored
and
subsequently
adjusted
if
and
when
the
valuations
fluctuate,
either
up
or
down,
by
at
least
the
pre-determined
threshold
amount.
Fund
Non-U.S.
Government
Purchases
Non-U.S.
Government
Sales
and
Maturities
Minnesota
Intermediate
$
17,366,345
$
17,216,113
Minnesota
69,912,947
4,574,384
Nebraska
7,086,809
8,302,612
Oregon
Intermediate
23,541,525
11,525,659
Notes
to
Financial
Statements
(continued)
6.
Fund
Shares
Transactions
in Fund
shares
during
the
current
and
prior
fiscal
period
were
as
follows:
Six
Months
Ended
11/30/24
Year
Ended
5/31/24
Minnesota
Intermediate
Shares
Amount
Shares
Amount
Subscriptions:
Class
A
485,315
$4,747,828
2,328,262
$22,465,347
Class
A
-
automatic
conversion
of
Class
C
922
8,917
771
7,440
Class
C
29,344
285,183
68,845
654,332
Class
I
3,539,085
34,480,448
10,495,977
100,395,786
Total
subscriptions
4,054,666
39,522,376
12,893,855
123,522,905
Reinvestments
of
distributions:
Class
A
116,423
1,138,725
237,324
2,289,705
Class
C
6,830
66,360
16,897
161,909
Class
I
225,863
2,199,186
430,917
4,138,263
Total
reinvestments
of
distributions
349,116
3,404,271
685,138
6,589,877
Redemptions:
Class
A
(1,571,298)
(15,288,337)
(2,298,901)
(22,137,569)
Class
C
(116,615)
(1,132,122)
(336,575)
(3,217,490)
Class
C
-
automatic
conversion
to
Class
A
(928)
(8,917)
(776)
(7,440)
Class
I
(2,990,300)
(29,074,931)
(12,593,914)
(120,631,353)
Total
redemptions
(4,679,141)
(45,504,307)
(15,230,166)
(145,993,852)
Net
increase
(decrease)
(275,359)
$(2,577,660)
(1,651,173)
$(15,881,070)
Six
Months
Ended
11/30/24
Year
Ended
5/31/24
Minnesota
Shares
Amount
Shares
Amount
Subscriptions:
Class
A
1,932,434
$20,986,842
4,709,617
$50,010,200
Class
A
-
automatic
conversion
of
Class
C
12,816
138,472
2,704
27,891
Class
C
91,408
989,530
242,951
2,593,198
Class
I
7,097,668
76,925,954
17,406,199
184,921,962
Total
subscriptions
9,134,326
99,040,798
22,361,471
237,553,251
Reinvestments
of
distributions:
Class
A
339,085
3,677,757
632,041
6,712,317
Class
C
14,957
162,090
35,529
376,856
Class
I
533,136
5,776,060
897,129
9,521,132
Total
reinvestments
of
distributions
887,178
9,615,907
1,564,699
16,610,305
Redemptions:
Class
A
(1,822,388)
(19,739,917)
(4,562,203)
(48,218,143)
Class
C
(229,285)
(2,481,180)
(696,881)
(7,402,095)
Class
C
-
automatic
conversion
to
Class
A
(12,828)
(138,472)
(2,706)
(27,891)
Class
I
(3,407,172)
(36,879,475)
(12,618,035)
(133,337,249)
Total
redemptions
(5,471,673)
(59,239,044)
(17,879,825)
(188,985,378)
Net
increase
(decrease)
4,549,831
$49,417,661
6,046,345
$65,178,178
7.
Income
Tax
Information
Each
Fund
is
a
separate
taxpayer
for
federal
income
tax
purposes.
Each
Fund
intends
to
distribute
substantially
all
of
its
net
investment
income
and
net
capital
gains
to
shareholders
and
otherwise
comply
with
the
requirements
of
Subchapter
M
of
the
Internal
Revenue
Code
applicable
to
regulated
investment
companies.
Therefore,
no
federal
income
tax
provision
is
required.
Each
Fund
intends
to
satisfy
conditions
that
will
enable
interest
from
municipal
securities,
which
is
exempt
from
regular
federal
and
designated
state
income
taxes,
to
retain
such
tax-exempt
status
when
distributed
to
shareholders
of
the
Funds.
Net
realized
capital
gains
and
ordinary
income
distributions
paid
by
the
Funds
are
subject
to
federal
taxation.
Each
Fund
files
income
tax
returns
in
U.S.
federal
and
applicable
state
and
local
jurisdictions.
A
Fund's
federal
income
tax
returns
are
generally
subject
to
examination
for
a
period
of
three
fiscal
years
after
being
filed.
State
and
local
tax
returns
may
be
subject
to
examination
for
an
additional
period
of
time
depending
on
the
jurisdiction.
Management
has
analyzed
each
Fund's
tax
positions
taken
for
all
open
tax
years
and
has
concluded
that
no
provision
for
income
tax
is
required
in
the
Fund's
financial
statements.
Six
Months
Ended
11/30/24
Year
Ended
5/31/24
Nebraska
Shares
Amount
Shares
Amount
Subscriptions:
Class
A
137,159
$1,352,132
277,481
$2,686,518
Class
C
21,423
209,606
10,038
98,930
Class
I
508,789
5,026,497
1,366,474
13,289,205
Total
subscriptions
667,371
6,588,235
1,653,993
16,074,653
Reinvestments
of
distributions:
Class
A
48,643
479,622
96,720
936,783
Class
C
1,055
10,395
2,492
24,104
Class
I
48,414
478,334
97,276
942,596
Total
reinvestments
of
distributions
98,112
968,351
196,488
1,903,483
Redemptions:
Class
A
(493,190)
(4,863,456)
(1,218,369)
(11,787,797)
Class
C
(25,464)
(249,641)
(114,203)
(1,101,721)
Class
I
(368,846)
(3,633,451)
(3,312,435)
(31,320,899)
Total
redemptions
(887,500)
(8,746,548)
(4,645,007)
(44,210,417)
Net
increase
(decrease)
(122,017)
$(1,189,962)
(2,794,526)
$(26,232,281)
Six
Months
Ended
11/30/24
Year
Ended
5/31/24
Oregon
Intermediate
Shares
Amount
Shares
Amount
Subscriptions:
Class
A
288,090
$2,821,997
568,714
$5,521,250
Class
C
3
29
26,668
255,785
Class
I
2,246,596
22,020,352
6,775,560
65,577,368
Total
subscriptions
2,534,689
24,842,378
7,370,942
71,354,403
Reinvestments
of
distributions:
Class
A
31,299
306,382
58,731
567,606
Class
C
1,409
13,708
3,593
34,554
Class
I
166,240
1,630,514
271,899
2,634,358
Total
reinvestments
of
distributions
198,948
1,950,604
334,223
3,236,518
Redemptions:
Class
A
(300,612)
(2,949,914)
(779,457)
(7,514,114)
Class
C
(22,806)
(222,591)
(101,027)
(974,263)
Class
I
(1,451,153)
(14,221,553)
(6,913,041)
(66,172,225)
Total
redemptions
(1,774,571)
(17,394,058)
(7,793,525)
(74,660,602)
Net
increase
(decrease)
959,066
$9,398,924
(88,360)
$(69,681)
Notes
to
Financial
Statements
(continued)
As
of
the
end
of
the
reporting
period,
the
aggregate
cost
and
the
net
unrealized
appreciation/(depreciation)
of
all
investments
for
federal
income
tax
purposes
were
as
follows:
For
purposes
of
this
disclosure,
tax
cost
generally
includes
the
cost
of
portfolio
investments
as
well
as
up-front
fees
or
premiums
exchanged
on
derivatives
and
any
amounts
unrealized
for
income
statement
reporting
but
realized
income
and/or
capital
gains
for
tax
reporting,
if
applicable.
As
of
prior
fiscal
period
end,
the
components
of
accumulated
earnings
on
a
tax
basis
were
as
follows:
As
of
prior
fiscal
period
end,
the
Funds
had
capital
loss
carryforwards,
which
will
not
expire:
8.
Management
Fees
and
Other
Transactions
with
Affiliates
Management
Fees:
Each
Fund’s
management
fee
compensates
the
Adviser
for
the
overall
investment
advisory
and
administrative
services
and
general
office
facilities.
The
Sub-Adviser
is
compensated
for
its
services
to
the
Funds
from
the
management
fees
paid
to
the
Adviser.
Each
Fund’s
management
fee
consists
of
two
components
–
a
fund-level
fee,
based
only
on
the
amount
of
assets
within
each
individual
Fund,
and
a
complex-level
fee,
based
on
the
aggregate
amount
of
all
eligible
fund
assets
managed
by
the
Adviser.
This
pricing
structure
enables
each
Fund’s
shareholders
to
benefit
from
growth
in
the
assets
within
their
respective
Fund
as
well
as
from
growth
in
the
amount
of
complex-wide
assets
managed
by
the
Adviser.
Annual
fund-level
fee,
payable
monthly,
for
each
Fund
was
calculated
according
to
the
following
schedule:
Fund
Tax
Cost
Gross
Unrealized
Appreciation
Gross
Unrealized
(Depreciation)
Net
Unrealized
Appreciation
(Depreciation)
Minnesota
Intermediate
$
320,779,144
$
3,293,315
$
(3,244,531)
$
48,784
Minnesota
660,816,577
9,905,286
(10,099,958)
(194,672)
Nebraska
74,395,155
993,498
(1,206,986)
(213,488)
Oregon
Intermediate
192,163,096
1,894,844
(1,282,290)
612,554
Fund
Undistributed
Tax-Exempt
Income
1
Undistributed
Ordinary
Income
Undistributed
Long-Term
Capital
Gains
Unrealized
Appreciation
(Depreciation)
Capital
Loss
Carryforwards
Late-Year
Loss
Deferrals
Other
Book-to-Tax
Differences
Total
Minnesota
Intermediate
$
1,234,560
$
—
$
—
$
(6,814,669)
$
(17,689,393)
$
—
$
(870,522)
$
(24,140,024)
Minnesota
2,542,135
37
—
(17,011,437)
(52,553,113)
—
(1,830,727)
(68,853,105)
Nebraska
372,975
—
—
(2,605,119)
(13,150,154)
—
(180,951)
(15,563,249)
Oregon
Intermediate
733,600
—
—
(2,501,358)
(14,072,482)
—
(422,029)
(16,262,269)
1
Undistributed
tax-exempt
income
(on
a
tax
basis)
has
not
been
reduced
for
the
dividends
declared
during
the
period
May
1,
2024
through
May
31,
2024
and
paid
on
June
3,
2024.
Fund
Short-Term
Long-Term
Total
Minnesota
Intermediate
$
9,187,153
$
8,502,240
$
17,689,393
Minnesota
22,818,369
29,734,744
52,553,113
Nebraska
3,315,168
9,834,986
13,150,154
Oregon
Intermediate
6,368,412
7,704,070
14,072,482
Average
Daily
Net
Assets
Minnesota
Intermediate
Minnesota
Nebraska
Oregon
Intermediate
For
the
first
$125
million
0.3500
%
0.3500
%
0.3500
%
0.3500
%
For
the
next
$125
million
0.3375
0.3375
0.3375
0.3375
For
the
next
$250
million
0.3250
0.3250
0.3250
0.3250
For
the
next
$500
million
0.3125
0.3125
0.3125
0.3125
For
the
next
$1
billion
0.3000
0.3000
0.3000
0.3000
For
the
next
$3
billion
0.2750
0.2750
0.2750
0.2750
For
the
next
$5
billion
0.2500
0.2500
0.2500
0.2500
For
net
assets
over
$10
billion
0.2375
0.2375
0.2375
0.2375
The
annual
complex-level
fee,
payable
monthly,
for
each
Fund
is
calculated
according
to
the
following
schedule:
*
The
complex-level
fee
is
calculated
based
upon
the
aggregate
daily
“eligible
assets”
of
all
Nuveen-branded
closed-end
funds
and
Nuveen
branded
open-end
funds
(“Nuveen
Mutual
Funds”).
Except
as
described
below,
eligible
assets
include
the
assets
of
all
Nuveen-branded
closed-end
funds
and
Nuveen
Mutual
Funds
organized
in
the
United
States.
Eligible
assets
do
not
include
the
net
assets
of:
Nuveen
fund-of-funds,
Nuveen
money
market
funds,
Nuveen
index
funds,
Nuveen
Large
Cap
Responsible
Equity
Fund
or
Nuveen
Life
Large
Cap
Responsible
Equity
Fund.
In
addition,
eligible
assets
include
a
fixed
percentage
of
the
aggregate
net
assets
of
the
active
equity
and
fixed
income
Nuveen
Mutual
Funds
advised
by
the
Adviser’s
affiliate,
Teachers
Advisors,
LLC
(except
those
identified
above).
The
fixed
percentage
will
increase
annually
until
May
1,
2033,
at
which
time
eligible
assets
will
include
all
of
the
aggregate
net
assets
of
the
active
equity
and
fixed
income
Nuveen
Mutual
Funds
advised
by
Teachers
Advisors,
LLC
(except
those
identified
above).
Eligible
assets
include
closed-end
fund
assets
managed
by
the
Adviser
that
are
attributable
to
financial
leverage.
For
these
purposes,
financial
leverage
includes
the
closed-end
funds’
use
of
preferred
stock
and
borrowings
and
certain
investments
in
the
residual
interest
certificates
(also
called
inverse
floating
rate
securities)
in
tender
option
bond
(TOB)
trusts,
including
the
portion
of
assets
held
by
a
TOB
trust
that
has
been
effectively
financed
by
the
trust’s
issuance
of
floating
rate
securities,
subject
to
an
agreement
by
the
Adviser
as
to
certain
funds
to
limit
the
amount
of
such
assets
for
determining
eligible
assets
in
certain
circumstances.
As
of
November
30,
2024,
the
complex-level
fee
rate
for
each
Fund
was
as
follows:
The
Adviser
has
agreed
to
waive
fees
and/or
reimburse
expenses
(“Expense
Cap”)
of
the
following
Fund
so
that
the
total
annual
Fund
operating
expenses
(excluding
12b-1
distribution
and/or
service
fees,
interest
expenses,
taxes,
acquired
fund
fees
and
expenses,
fees
incurred
in
acquiring
and
disposing
of
portfolio
securities
and
extraordinary
expenses)
do
not
exceed
the
average
daily
net
assets
of
any
class
of
Fund
shares
in
the
amounts
and
for
the
time
periods
stated
in
the
following
table:
Distribution
and
Service
Fees:
Each
Fund
has
adopted
a
distribution
and
service
plan
under
rule
12b-1
under
the
1940
Act.
Class
A
Shares
incur
a
0.20%
annual
12b-1
service
fee.
Class
C
Shares
incur
a
0.75%
annual
12b-1
distribution
fee
and
a
0.25%
annual
12b-1
service
fee.
Class
I
Shares
are
not
subject
to
12b-1
distribution
or
service
fees.
The
fees
under
this
plan
compensate
Nuveen
Securities,
LLC,
(the
“Distributor”),
a
wholly-owned
subsidiary
of
Nuveen,
for
services
provided
and
expenses
incurred
in
distributing
shares
of
the
Funds
and
establishing
and
maintaining
shareholder
accounts.
Other
Transactions
with
Affiliates:
Each
Fund
is
permitted
to
purchase
or
sell
securities
from
or
to
certain
other
funds
or
accounts
managed
by
the
Sub-Adviser
or
by
an
affiliate
of
the
Adviser (each
an,
“Affiliated
Entity”)
under
specified
conditions
outlined
in
procedures
adopted
by
the
Board
("cross-trade").
These
procedures
have
been
designed
to
ensure
that
any
cross-trade
of
securities
by
the
Fund
from
or
to
an
Affiliated
Entity
by
virtue
of
having
a
common
investment
adviser
(or
affiliated
investment
adviser),
common
officer
and/or
common
trustee
complies
with
Rule
17a-7
under
the
1940
Act.
These
transactions
are
effected
at
the
current
market
price
(as
provided
by
an
independent
pricing
service)
without
incurring
broker
commissions.
During
the
current
fiscal
period,
the
Funds
engaged
in
cross-trades
pursuant
to
these
procedures
as
follows:
Complex-Level
Asset
Breakpoint
Level*
Complex-Level
Fee
For
the
first
$124.3
billion
0.1600
%
For
the
next
$75.7
billion
0.1350
For
the
next
$200
billion
0.1325
For
eligible
assets
over
$400
billion
0.1300
Fund
Complex-Level
Fee
Minnesota
Intermediate
0
.1569%
Minnesota
0
.1569%
Nebraska
0
.1569%
Oregon
Intermediate
0
.1569%
Fund
Expense
Cap
Expense
Cap
Expiration
Date
Nebraska
0.65%
July
31,
2026
Fund
Purchases
Sales
Realized
Gain
(Loss)
Minnesota
Intermediate
$
—
$
1,578,048
$
(34,079)
Minnesota
9,830,468
—
—
Nebraska
—
—
—
Oregon
Intermediate
2,767,165
—
—
Notes
to
Financial
Statements
(continued)
During
the
current
fiscal
period,
the
Distributor,
collected
sales
charges
on
purchases
of
Class
A
Shares,
the
majority
of
which
were
paid
out
as
concessions
to
financial
intermediaries
as
follows:
The
Distributor
also
received
12b-1
service
fees
on
Class
A
Shares,
substantially
all
of
which
were
paid
to
compensate
financial
intermediaries
for
providing
services
to
shareholders
relating
to
their
investments.
During
the
current
fiscal
period,
the
Distributor
compensated
financial
intermediaries
directly
with
commission
advances
at
the
time
of
purchase
as
follows:
To
compensate
for
commissions
advanced
to
financial
intermediaries,
all
12b-1
service
and
distribution
fees
collected
on
Class
C
Shares
during
the
first
year
following
a
purchase
are
retained
by
the
Distributor.
During
the
current
fiscal
period,
the
Distributor
retained
such
12b-1
fees
as
follows:
The
remaining
12b-1
fees
charged
to
each
Fund
were
paid
to
compensate
financial
intermediaries
for
providing
services
to
shareholders
relating
to
their
investments.
The
Distributor
also
collected
and
retained
CDSC
on
share
redemptions
during
the
current
fiscal
period,
as
follows:
9.
Borrowing
Arrangements
Committed
Line
of
Credit:
The
Funds,
along
with
certain
funds
managed
by
the
Adviser
and
by
an
affiliate
of
the
Adviser
(“Participating
Funds”),
have
established
a
364-day,
$2.700
billion
standby
credit
facility
with
a
group
of
lenders,
under
which
the
Participating
Funds
may
borrow
for
temporary
purposes
(other
than
on-going
leveraging
for
investment
purposes).
Each
Participating
Fund
is
allocated
a
designated
proportion
of
the
facility’s
capacity
(and
its
associated
costs,
as
described
below)
based
upon
a
multi-factor
assessment
of
the
likelihood
and
frequency
of
its
need
to
draw
on
the
facility,
the
size
of
the
Fund
and
its
anticipated
draws,
and
the
potential
importance
of
such
draws
to
the
operations
and
well-being
of
the
Fund,
relative
to
those
of
the
other
Funds.
A
Fund
may
effect
draws
on
the
facility
in
excess
of
its
designated
capacity
if
and
to
the
extent
that
other
Participating
Funds
have
undrawn
capacity.
The
credit
facility
expires
in
June
2025
unless
extended
or
renewed.
The
credit
facility
has
the
following
terms:
0.15%
per
annum
on
unused
commitment
amounts
and
a
drawn
interest
rate
equal
to
the
higher
of
(a)
OBFR
(Overnight
Bank
Funding
Rate)
plus
1.20%
per
annum
or
(b)
the
Fed
Funds
Effective
Rate
plus
1.20%
per
annum
on
amounts
borrowed.
Interest
expense
incurred
by
the
Participating
Funds,
when
applicable,
is
recognized
as
a
component
of
“Interest
expense”
on
the
Statement
of
Operations.
Participating
Funds
paid
administration,
legal
and
arrangement
fees,
which
are
recognized
as
a
component
of
“Interest
expense”
Fund
Sales
Charges
Collected
Paid
to
Financial
Intermediaries
Minnesota
Intermediate
$
37,711
$
37,355
Minnesota
199,791
191,270
Nebraska
20,158
18,686
Oregon
Intermediate
23,371
23,371
Fund
Commission
Advances
Minnesota
Intermediate
$
38,495
Minnesota
144,706
Nebraska
11,284
Oregon
Intermediate
23,371
Fund
12b-1
Fees
Retained
Minnesota
Intermediate
$
2,152
Minnesota
8,248
Nebraska
724
Oregon
Intermediate
171
Fund
CDSC
Retained
Minnesota
Intermediate
$
166
Minnesota
22,535
Nebraska
280
Oregon
Intermediate
—
on
the
Statement
of
Operations,
and
along
with
commitment
fees,
have
been
allocated
among
such
Participating
Funds
based
upon
the
relative
proportions
of
the
facility’s
aggregate
capacity
reserved
for
them
and
other
factors
deemed
relevant
by
the
Adviser
and
the
Board
of
each
Participating
Fund.
During
the
current
period,
the
following
Funds
utilized
this
facility.
The
Funds’
maximum
outstanding
balance
during
the
utilization
period
was
as
follows:
During
each
Fund’s
utilization
period(s)
during
the
current
fiscal
period,
the
average
daily
balance
outstanding
and
average
annual
interest
rate
on
the
Borrowings
were
as
follows:
Borrowings
outstanding
as
of
the
end
of
the
reporting
period,
if
any,
are
recognized
as
“Borrowings”
on
the
Statement
of
Assets
and
Liabilities.
Fund
Maximum
Outstanding
Balance
Minnesota
Intermediate
$
3,711,501
Minnesota
216,711
Nebraska
188,338
Oregon
Intermediate
398,826
Fund
Utilization
Period
(Days
Outstanding)
Average
Daily
Balance
Outstanding
Average
Annual
Interest
Rate
Minnesota
Intermediate
3
$
3,711,501
6.53
%
Minnesota
3
216,711
6.53
Nebraska
3
188,338
6.53
Oregon
Intermediate
1
398,826
6.03
| Item 8. | Changes in and Disagreements with Accountants for Open-End Management Investment Companies. |
Not applicable.
| Item 9. | Proxy Disclosures for Open-End Management Investment Companies. |
Not applicable.
| Item 10. | Remuneration Paid to Directors, Officers, and Others of Open-End Management Investment Companies. |
Remuneration paid to directors, officers and others is included in the Statement of Operations under the line items “Trustee Fees” and “Management Fees” as part of the financial statements filed under Item 7 of this Form N-CSR.
| Item 11. | Statement Regarding Basis for Approval of Investment Advisory Contract. |
Not applicable to this filing.
| Item 12. | Disclosure of Proxy Voting Policies and Procedures for Closed-End Management Investment Companies. |
Not applicable to open-end investment companies.
| Item 13. | Portfolio Managers of Closed-End Management Investment Companies. |
Not applicable to open-end investment companies.
| Item 14. | Purchases of Equity Securities by Closed-End Management Investment Company and Affiliated Purchasers. |
Not applicable to open-end investment companies.
| Item 15. | Submission of Matters to a Vote of Security Holders. |
There have been no material changes to the procedures by which shareholders may recommend nominees to the registrant’s Board implemented after the registrant last provided disclosure in response to this Item.
| Item 16. | Controls and Procedures. |
| (a) | The registrant’s principal executive and principal financial officers, or persons performing similar functions, have concluded that the registrant’s disclosure controls and procedures (as defined in Rule 30a-3(c) under the Investment Company Act of 1940, as amended (the “1940 Act”) (17 CFR 270.30a-3(c))) are effective, as of a date within 90 days of the filing date of this report that includes the disclosure required by this paragraph, based on their evaluation of the controls and procedures required by Rule 30a-3(b) under the 1940 Act (17 CFR 270.30a-3(b)) and Rules 13a-15(b) or 15d-15(b) under the Securities Exchange Act of 1934, as amended (the “Exchange Act”) (17 CFR 240.13a-15(b) or 240.15d-15(b)). |
| (b) | There were no changes in the registrant’s internal control over financial reporting (as defined in Rule 30a-3(d) under the 1940 Act (17 CFR 270.30a-3(d)) that occurred during the period covered by this report that has materially affected, or is reasonably likely to materially affect, the registrant’s internal control over financial reporting. |
| Item 17. | Disclosure of Securities Lending Activities for Closed-End Management Investment Companies. |
| (a) | Not applicable to open-end investment companies. |
| (b) | Not applicable to open-end investment companies. |
| Item 18. | Recovery of Erroneously Awarded Compensation. |
| (a)(1) | Not applicable to this filing. |
| (a)(2) | Not applicable to this filing. |
SIGNATURES
Pursuant to the requirements of the Securities Exchange Act of 1934 and the Investment Company Act of 1940, the registrant has duly caused this report to be signed on its behalf by the undersigned, thereunto duly authorized.
Nuveen Investment Funds, Inc.
| | | | | | | | |
Date: February 5, 2025 | | | | By: | | /s/ Jordan M. Farris | | |
| | | | | | Jordan M. Farris | | |
| | | | | | Chief Administrative Officer | | |
Pursuant to the requirements of the Securities Exchange Act of 1934 and the Investment Company Act of 1940, this report has been signed below by the following persons on behalf of the registrant and in the capacities and on the dates indicated.
| | | | | | | | |
Date: February 5, 2025 | | | | By: | | /s/ Jordan M. Farris | | |
| | | | | | Jordan M. Farris | | |
| | | | | | Chief Administrative Officer (principal executive officer) | | |
| | | | |
Date: February 5, 2025 | | | | By: | | /s/ Marc Cardella | | |
| | | | | | Marc Cardella | | |
| | | | | | Vice President and Controller (principal financial officer) | | |