Second Quarter 2014 Results Clayton Deutsch CEO & President David Kaye Chief Financial Officer Mark Thompson CEO, Boston Private Bank & Trust Company July 16, 2014

2 Forward Looking Statements This presentation contains financial information determined by methods other than in accordance with accounting principles generally accepted in the United States of America (“GAAP”). The Company’s management uses these non-GAAP measures in its analysis of the Company’s performance. These measures typically adjust GAAP performance measures to exclude significant gains or losses that are unusual in nature. Because these items and their impact on the Company’s performance are difficult to predict, management believes that presentations of financial measures excluding the impact of these items provide useful supplemental information that is essential to a proper understanding of the operating results of the Company’s core businesses. These disclosures should not be viewed as a substitute for operating results determined in accordance with GAAP, nor are they necessarily comparable to non-GAAP performance measures which may be presented by other companies. Certain statements in this presentation that are not historical facts may constitute forward-looking statements within the meaning of Section 27A of the Securities Act of 1933, as amended, and Section 21E of the Securities Exchange Act of 1934, as amended, and are intended to be covered by the safe harbor provisions of the Private Securities Litigation Reform Act of 1995. Forward-looking statements involve risks and uncertainties. These statements include, among others, statements regarding our strategy, evaluations of future interest rate trends and liquidity, expectations as to growth in assets, deposits and results of operations, receipt of regulatory approval for pending acquisitions, success of acquisitions, future operations, market position, financial position, and prospects, plans and objectives of management. You should not place undue reliance on the Company’s forward-looking statements. You should exercise caution in interpreting and relying on forward-looking statements because they are subject to significant risks, uncertainties and other factors which are, in some cases, beyond the Company’s control. Forward-looking statements are based on the current assumptions and beliefs of management and are only expectations of future results. The Company’s actual results could differ materially from those projected in the forward-looking statements as a result of, among other factors, adverse conditions in the capital and debt markets and the impact of such conditions on the Company’s private banking, investment management and wealth advisory activities; changes in interest rates; competitive pressures from other financial institutions; the effects of continued weakness in general economic conditions on a national basis or in the local markets in which the Company operates; changes in the value of securities and other assets; changes in loan default and charge-off rates, the adequacy of loan loss reserves, or decreases in deposit levels necessitating increased borrowing to fund loans and investments; increasing government regulation; the risk that goodwill and intangibles recorded in the Company’s financial statements will become impaired; the risk that the Company’s deferred tax asset may not be realized; risks related to the identification and implementation of acquisitions, dispositions and restructurings; and changes in assumptions used in making such forward-looking statements, as well as the other risks and uncertainties detailed in the Company’s Annual Report on Form 10-K, as updated by the Company’s Quarterly Reports on Form 10-Q and other filings submitted to the Securities and Exchange Commission. Forward-looking statements speak only as of the date on which they are made. The Company does not undertake any obligation to update any forward-looking statement to reflect circumstances or events that occur after the date the forward-looking statements are made.

3 Results Driven By: ($millions) Q1 2014 Q2 2014 % Change NII $44.5 $46.3 4% Core Fees* $31.7 $34.1 8% Other Income** $1.0 $0.2 (79%) Total Revenue $77.3 $80.6 4% Total Expenses $55.0 $54.4 (1%) PTPP*** $22.3 $26.2 18% Provision/(Credit) ($1.2) ($5.0) NM Pre-Tax Income from Continuing Operations $23.5 $31.2 33% Efficiency Ratio**** 68% 64% (4 pts) Consolidated P&L Highlights – Linked Quarter Includes $1.9 million of interest recovered from previous nonaccrual loans ***Pre-tax, pre-provision income from Continuing Operations ****Excludes amortization of intangibles; FTE basis *Includes WM&T fees, wealth advisory fees, private banking fees and gain on sale of loans **Includes gain on sale of investments, debt repurchase, OREO and other Compensation and benefits decreased $2.2 million due to seasonally high Q1

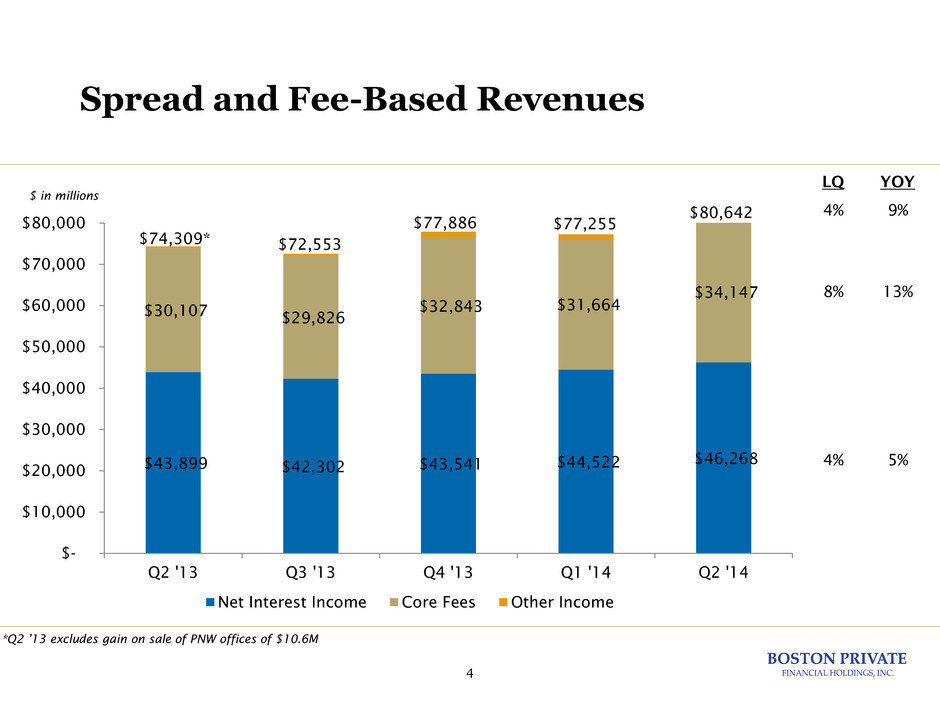
4 Spread and Fee-Based Revenues $43,899 $42,302 $43,541 $44,522 $46,268 $30,107 $29,826 $32,843 $31,664 $34,147 $- $10,000 $20,000 $30,000 $40,000 $50,000 $60,000 $70,000 $80,000 Q2 '13 Q3 '13 Q4 '13 Q1 '14 Q2 '14 Net Interest Income Core Fees Other Income LQ YOY 4% 9% 8% 13% 4% 5% $74,309* *Q2 ’13 excludes gain on sale of PNW offices of $10.6M $72,553 $77,886 $77,255 $80,642 $ in millions

5 Net Interest Margin 4.02% 3.88% 3.89% 3.83% 3.95% 0.27% 0.26% 0.26% 0.26% 0.27% 3.14% 2.99% 2.98% 3.04% 3.14% 1.49% 1.37% 1.25% 1.68% 1.64% 0.00% 0.50% 1.00% 1.50% 2.00% 2.50% 3.00% 3.50% 4.00% 4.50% Q2 '13 Q3 '13 Q4 '13 Q1 '14 Q2 '14 Loan Yield Deposit Costs* NIM Cash and Securities Yield *Includes Demand Deposit Accounts

6 Criticized Loans $0.5 $2.4 $1.2 $1.4 $2.9 -$6 -$4 -$2 $0 $2 $4 $6 $8 $10 $0 $50 $100 $150 $200 $250 Q2 '13 Q3 '13 Q4 '13 Q1 '14 Q2 '14 Classified Special Mention (Net Charge-Offs)/Recoveries $191 $169 $174 Q2 ‘14 provision credit of $5.0M driven by $2.9M in net recoveries and $1.2 million from the commercial loan sale $187 $188 $ in millions

7 Tier I Common Equity/Risk Weighted Assets 9.9% 10.1% 9.9% 10.1% 10.6% 5.0% 6.0% 7.0% 8.0% 9.0% 10.0% 11.0% Q2 '13 Q3 '13 Q4 '13 Q1 '14 Q2 '14 * * Estimated

8 Results Driven By: ($millions) Q1 2014 Q2 2014 % Change NII $45.4 $47.2 4% Core Fees* $8.7 $10.4 20% Other Income** $0.9 $0.1 (89%) Total Revenue $55.0 $57.8 5% Total Expenses $33.6 $33.2 (1%) PTPP*** $21.4 $24.6 15% Provision/(Credit) ($1.2) ($5.0) NM Pre-Tax Income $22.6 $29.6 31% Efficiency Ratio**** 59% 55% (4 pts) Private Bank Performance Highlights – Linked Quarter ***Pre-tax, pre-provision income ****Excludes amortization of intangibles; FTE basis *Includes Bank WM&T fees, other private banking fees and gain on sale of loans **Includes gain on sale of investments, OREO and other Impacted by $2.9 million of net recoveries and $1.2 million from portfolio loan sale in Q2 Q2 Gain on sale of portfolio loans contributed $1.6 million Drop in other income due to gain on OREO in Q1

9 Loans By Type: Quarterly Trend $2,213 $2,257 $2,279 $2,277 $2,292 $1,829 $1,877 $1,967 $2,033 $1,931 $797 $788 $866 $852 $883 $- $500 $1,000 $1,500 $2,000 $2,500 $3,000 $3,500 $4,000 $4,500 $5,000 $5,500 Q2 '13 Q3 '13 Q4 '13 Q1 '14 Q2 '14 Resi, Consumer & HELOC CRE & Construction C&I LQ YoY (1%) 6% 4% 11% (5%) 6% 1% 4% $4,839 $4,922 $5,112 $5,162 $5,106 $ in millions

10 Deposits: Quarterly Trend $1,163 $1,390 $1,328 $1,740 $1,321 $497 $472 $537 $554 $588 $2,281 $2,468 $2,625 $2,419 $2,436 $635 $613 $619 $629 $607 $- $500 $1,000 $1,500 $2,000 $2,500 $3,000 $3,500 $4,000 $4,500 $5,000 $5,500 Q2 '13 Q3 '13 Q4 '13 Q1 '14 Q2 '14 Demand Savings & NOW Money Market CDs LQ YoY (7%) 8% (3%) (4%) 1% 7% 6% 18% (24%) 14% $4,576 $4,943 $5,110 $5,342 $4,952 $ in millions

11 ($millions) Q1 2014 Q2 2014 % Change Inv Mgt Fees $11.5 $11.8 3% Total Revenue $11.5 $11.8 3% Operating Expenses $8.3 $9.1 9% Pre-Tax Income from Continuing Operations $3.1 $2.7 (15%) EBITDA Margin 34% 29% (5 Pts) Pre-tax Margin 27% 23% (4 Pts) AUM ($B) $10.5 $10.9 4% Net Flows ($M) ($123) ($54) NM Results Driven By: Investment Management Performance Highlights – Linked Quarter Q2 includes $0.9 million one-time charge to eliminate a recurring fee trail

12 ($millions) Q1 2014 Q2 2014 % Change Wealth Adv Fees $11.5 $12.0 5% Total Revenue $11.5 $12.0 5% Operating Expenses $7.8 $8.1 4% Pre-Tax Income from Continuing Operations $3.7 $3.9 4% EBITDA Margin 34% 35% --- Pre-tax Margin 32% 32% --- AUM ($B) $9.6 $9.8 1% Net Flows ($M) $206 ($37) NM Wealth Advisory Performance Highlights – Linked Quarter Results Driven By: Steady growth and stable pricing Continued margin stability

13 $16 $68 $206 ($37) ($36) $19 $117 $20 $5 ($233) $17 ($38) ($123) ($54) ($228) $52 $147 $103 ($86) ($300) ($200) ($100) $0 $100 $200 $300 Q2 '13 Q3 '13 Q4 '13 Q1 '14 Q2 '14 Investment Managers Private Bank Wealth Advisors Net Flows $41 AUM Net Flows *Assets Under Management/Advisory. $ in millions

Acquisition of Banyan Partners

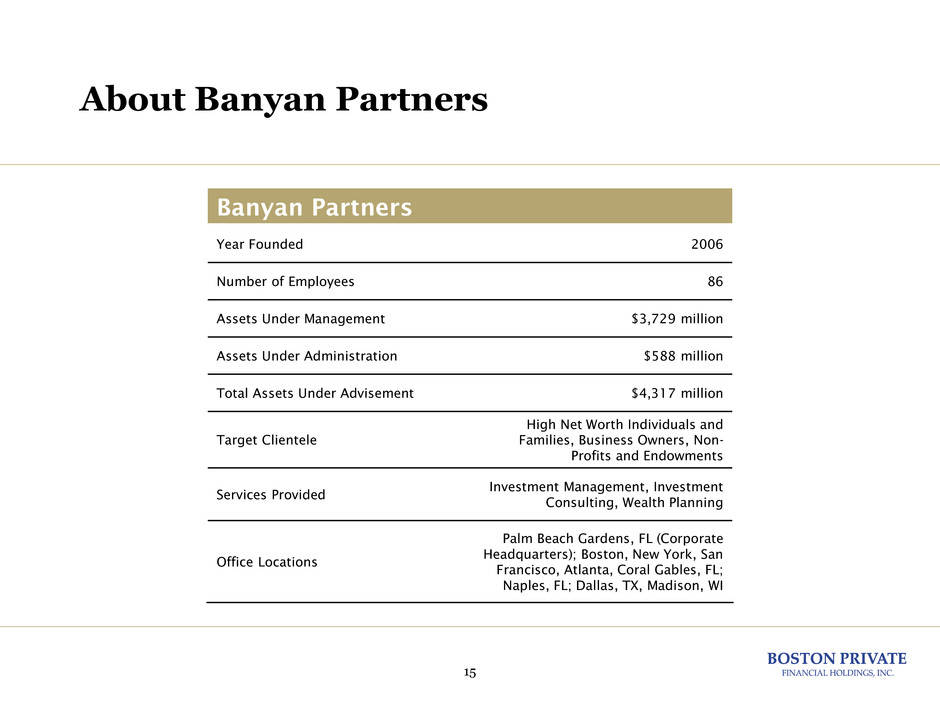
15 About Banyan Partners Banyan Partners Year Founded 2006 Number of Employees 86 Assets Under Management $3,729 million Assets Under Administration $588 million Total Assets Under Advisement $4,317 million Target Clientele High Net Worth Individuals and Families, Business Owners, Non- Profits and Endowments Services Provided Investment Management, Investment Consulting, Wealth Planning Office Locations Palm Beach Gardens, FL (Corporate Headquarters); Boston, New York, San Francisco, Atlanta, Coral Gables, FL; Naples, FL; Dallas, TX, Madison, WI

16 Strategic Rationale Boston Private Criteria Banyan Attributes Strong Leadership Team: Must be capable of managing transition of legacy Boston Private Bank Wealth Management platform to new investment platform and driving future growth Deep bench with proven experience founding and growing high performing wealth management companies Focus on High Net Worth Market: Clientele that closely matches distinct private client profile of Boston Private Bank & Trust High net worth clients account for 85% of relationships Robust Investment Capability: Well-developed, multi-faceted open architecture/hybrid model with sophisticated capabilities Leverages proprietary and 3rd party strategies to build customized portfolios for clients Alternatives offered through the manager of managers platform Streamlined investment process that emphasizes consistency across portfolios Strong Organic Growth Profile: Demonstrated ability to grow organically through diversified distribution channels 2013 and YTD 2014 organic growth of AUM in excess of 15% Strong positioning in 3rd party referral channels (Fidelity and TD Ameritrade) Scalable Platform: Must be able to fully integrate Boston Private Bank Wealth Management into newly formed company Robust technology platform and management reporting capabilities Proven capability in integrating mid-sized wealth management companies across the front office and back office Geographic Overlap: Located in current or contiguous markets ~50% of AUM is Boston-based 30% of employees, including the Chief Investment Officer and Chief Strategy Officer are based in Boston Accretive to EPS and ROATCE 4% accretive to diluted EPS and 230 bps accretive to ROATCE in year one

17 Key Transaction Terms Transaction Boston Private Bank & Trust Company is acquiring the assets of Banyan Partners Banyan will be combined with the existing Boston Private Bank’s Wealth Management business – Combined entity will be a new subsidiary (“NewCo”) of Boston Private Bank & Trust Company No financing contingencies Purchase Price Consideration at closing: – 9.0X baseline EBITDA at close – Estimated to be ~$60 million – Consideration mix of 65% cash / 35% BPFH stock Additional performance based contingent consideration – Earn-out eligibility requires incremental EBITDA of $3 million above and beyond combined baseline at close – Payable in two installments: year-end 2015 and year-end 2016 – Total estimated payments of $15-$20 million – Consideration mix of 55% cash / 45% BPFH stock Closing Conditions Regulatory and client consents Closing anticipated Q4-2014

18 Estimated Financial Impact Key Assumptions Purchase Price $60 million Earn-Out Payment ~$15-$20 million Projected Impact Pro-Forma Client Assets at Close (expected) $9 billion Pro-Forma Revenue at Close (expected) $50 million Year 1 Diluted EPS Accretion ~4% Year 1 Return on Average Tangible Equity Accretion ~230 bps Internal Rate of Return ~25% Tier I Common Equity Capital Ratio at Close ~9.5-9.7%

Second Quarter 2014 Results Clayton Deutsch CEO & President David Kaye Chief Financial Officer Mark Thompson CEO, Boston Private Bank & Trust Company July 16, 2014


