EXHIBIT 99.1
| | | | | |
| Table of Contents | |
| |
| Fourth Quarter 2020 | |
| Supplemental Financial and Operating Data | Page |
| |
| Income Statements | |
| Wellhead Volumes and Prices | |
| Balance Sheets | |
| Cash Flows Statements | |
| Non-GAAP Financial Measures | |
| Adjusted Net Income (Loss) | |
| Adjusted Net Income per Share | |
| Discretionary Cash Flow and Free Cash Flow | |
| Total Expenditures | |
| EBITDAX and Adjusted EBITDAX | |
| Net Debt-to-Total Capitalization Ratio | |
| Proved Reserves and Reserve Replacement Data | |
| Reserve Replacement Cost Data | |
| Financial Commodity Derivative Contracts | |
| Direct After-Tax Rate of Return | |
| ROCE & ROE | |
| Cost per Barrel of Oil Equivalent | |
| Quarter and Full Year Guidance | |
| | | | | | | | | | | | | | | | | | | | | | | | | | | | | |
| Income Statements | | | | | | | | | |
| | | | | | | | | |
| In thousands of USD, except per share data (Unaudited) |
| 4Q 2020 | | 3Q 2020 | | 4Q 2019 | | FY 2020 | | FY 2019 |
| Operating Revenues and Other | | | | |
| Crude Oil and Condensate | 1,710,862 | | | 1,394,622 | | | 2,464,274 | | | 5,785,609 | | | 9,612,532 | |
| Natural Gas Liquids | 228,299 | | | 184,771 | | | 215,070 | | | 667,514 | | | 784,818 | |
| Natural Gas | 301,883 | | | 183,790 | | | 309,606 | | | 837,133 | | | 1,184,095 | |
| Gains (Losses) on Mark-to-Market Commodity Derivative Contracts | 69,304 | | | (3,978) | | | (62,347) | | | 1,144,737 | | | 180,275 | |
| Gathering, Processing and Marketing | 642,597 | | | 538,955 | | | 1,238,792 | | | 2,582,984 | | | 5,360,282 | |
| Gains (Losses) on Asset Dispositions, Net | (5,600) | | | (70,976) | | | 119,963 | | | (46,883) | | | 123,613 | |
| Other, Net | 18,153 | | | 18,300 | | | 34,888 | | | 60,954 | | | 134,358 | |
| Total | 2,965,498 | | | 2,245,484 | | | 4,320,246 | | | 11,032,048 | | | 17,379,973 | |
| | | | | | | | | |
| Operating Expenses | | | | | | | | | |
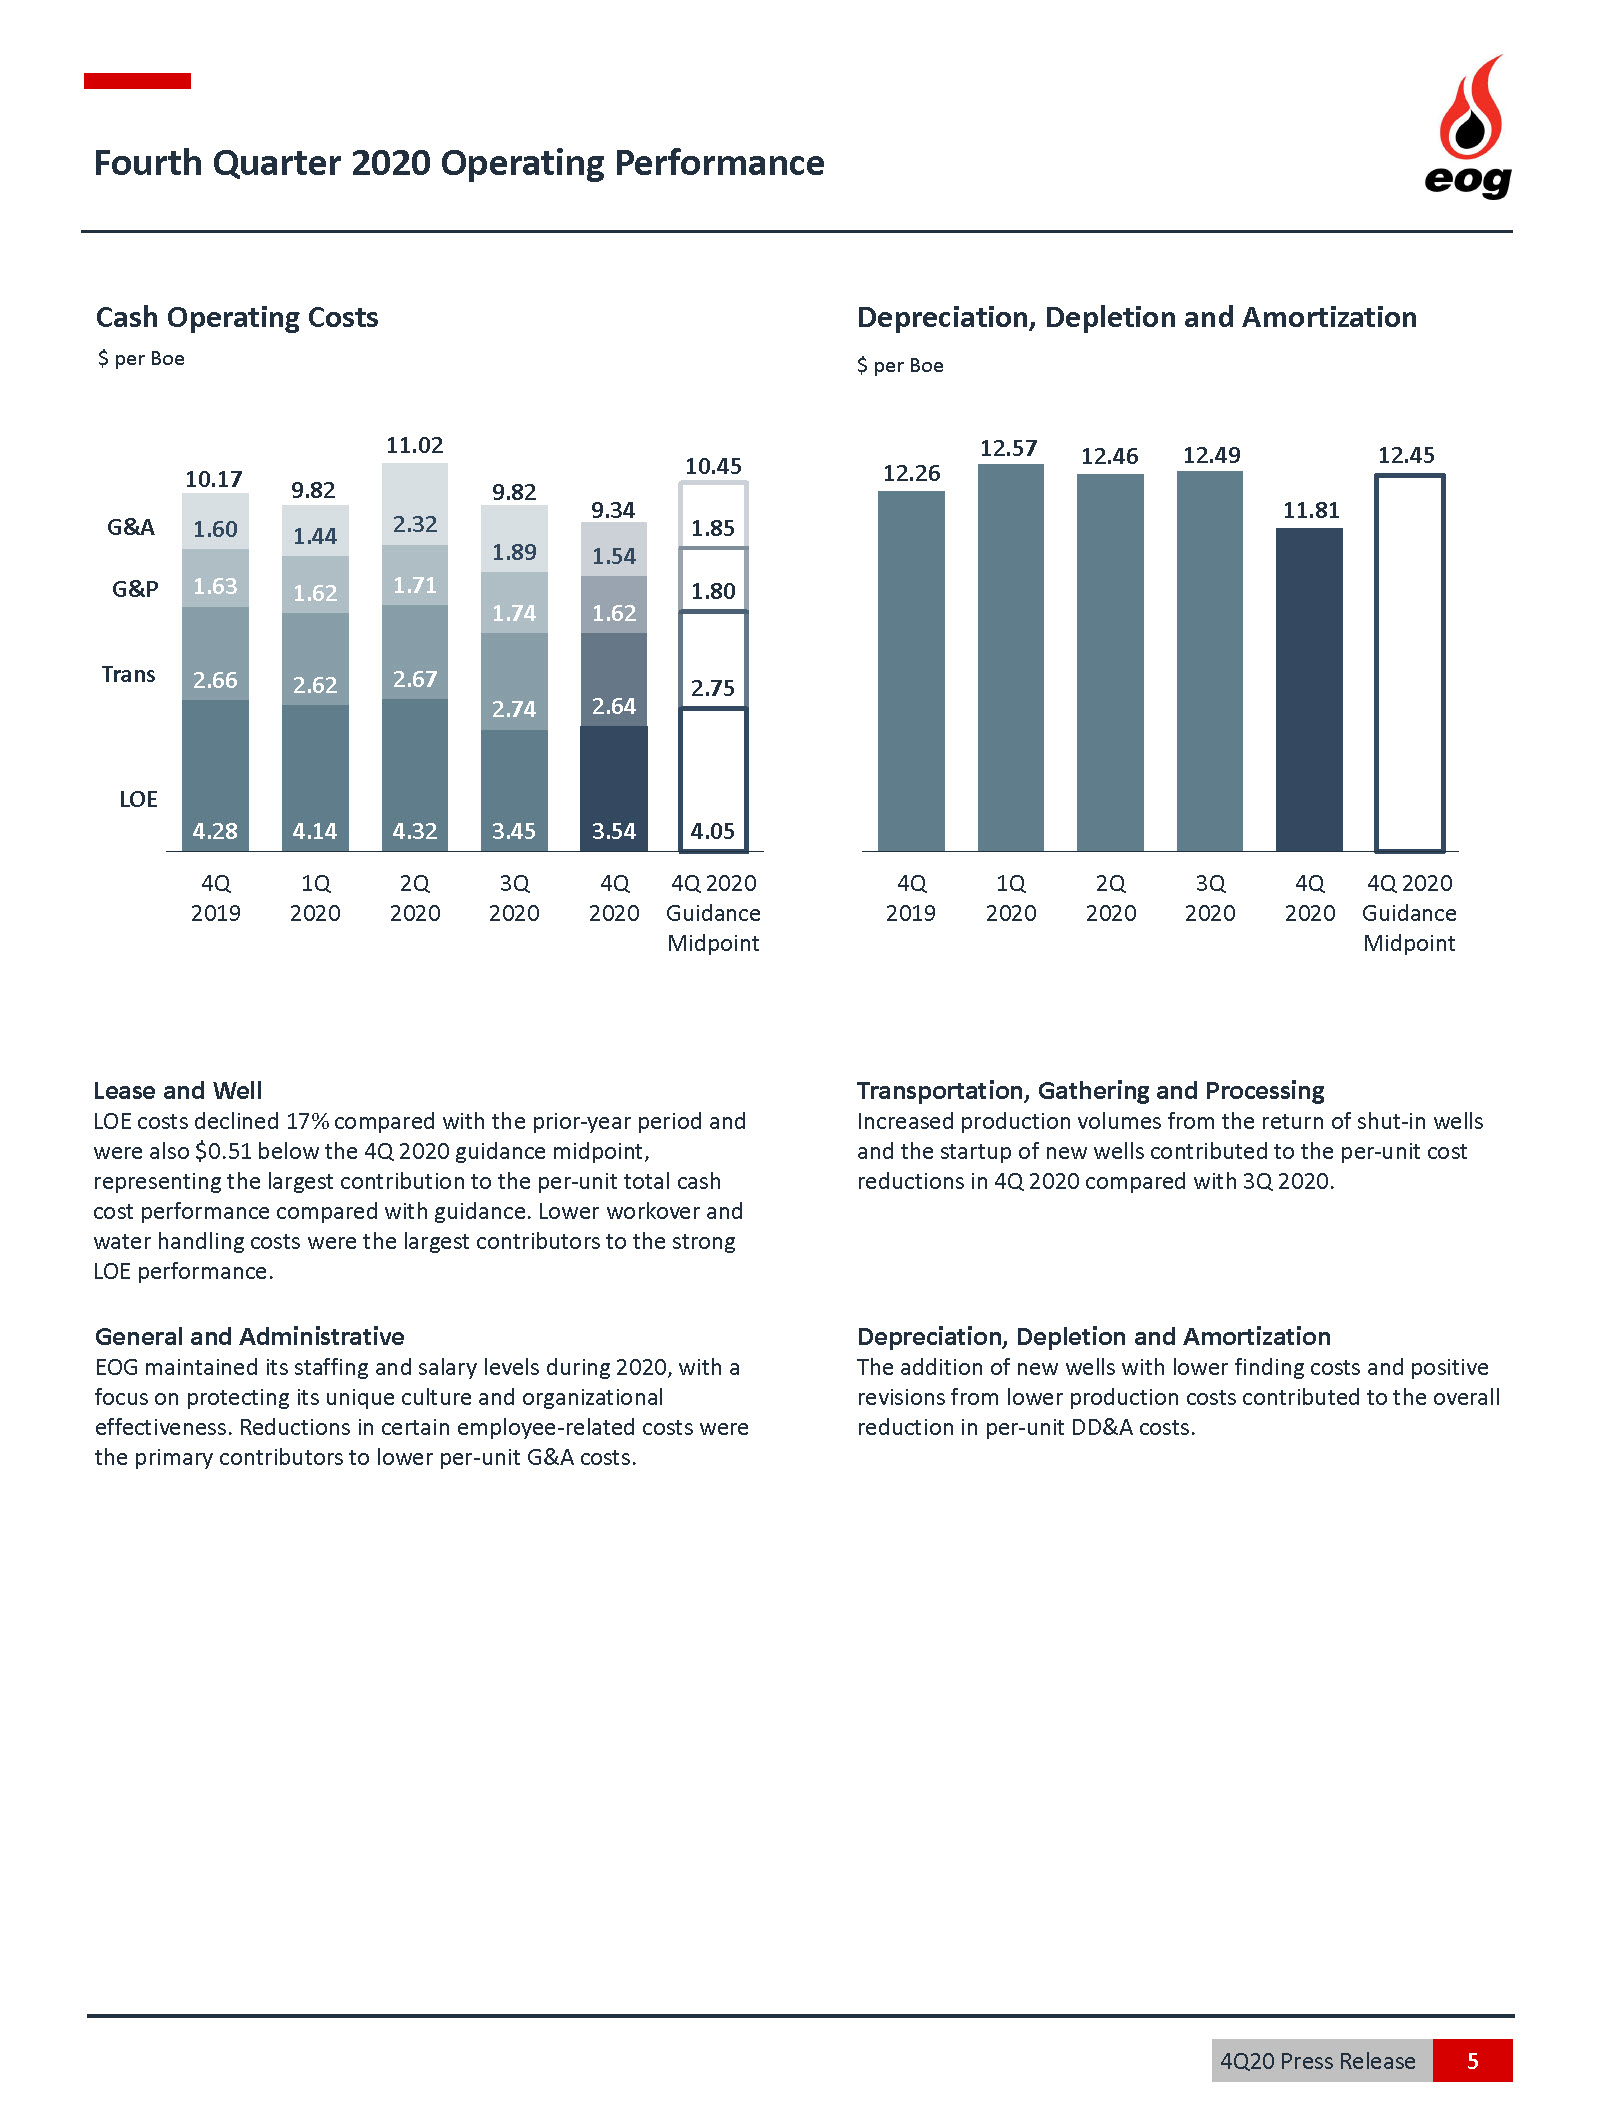
| Lease and Well | 260,896 | | | 227,473 | | | 334,538 | | | 1,063,374 | | | 1,366,993 | |
| Transportation Costs | 194,708 | | | 180,257 | | | 208,312 | | | 734,989 | | | 758,300 | |
| Gathering and Processing Costs | 119,172 | | | 114,790 | | | 127,615 | | | 459,211 | | | 479,102 | |
| Exploration Costs | 40,415 | | | 38,413 | | | 36,495 | | | 145,788 | | | 139,881 | |
| Dry Hole Costs | 20 | | | 12,604 | | | — | | | 13,083 | | | 28,001 | |
| Impairments | 142,440 | | | 78,990 | | | 228,135 | | | 2,099,780 | | | 517,896 | |
| Marketing Costs | 622,941 | | | 521,351 | | | 1,237,259 | | | 2,697,729 | | | 5,351,524 | |
| Depreciation, Depletion and Amortization | 870,564 | | | 823,050 | | | 959,208 | | | 3,400,353 | | | 3,749,704 | |
| General and Administrative | 113,235 | | | 124,460 | | | 125,187 | | | 483,823 | | | 489,397 | |
| Taxes Other Than Income | 113,445 | | | 126,810 | | | 199,746 | | | 477,934 | | | 800,164 | |
| Total | 2,477,836 | | | 2,248,198 | | | 3,456,495 | | | 11,576,064 | | | 13,680,962 | |
| | | | | | | | | |
| Operating Income (Loss) | 487,662 | | | (2,714) | | | 863,751 | | | (544,016) | | | 3,699,011 | |
| Other Income (Expense), Net | (6,781) | | | 3,401 | | | 8,152 | | | 10,228 | | | 31,385 | |
| Income (Loss) Before Interest Expense and Income Taxes | 480,881 | | | 687 | | | 871,903 | | | (533,788) | | | 3,730,396 | |
| Interest Expense, Net | 53,121 | | | 53,242 | | | 40,695 | | | 205,266 | | | 185,129 | |
| Income (Loss) Before Income Taxes | 427,760 | | | (52,555) | | | 831,208 | | | (739,054) | | | 3,545,267 | |
| Income Tax Provision (Benefit) | 90,294 | | | (10,088) | | | 194,687 | | | (134,482) | | | 810,357 | |
| Net Income (Loss) | 337,466 | | | (42,467) | | | 636,521 | | | (604,572) | | | 2,734,910 | |
| | | | | | | | | |
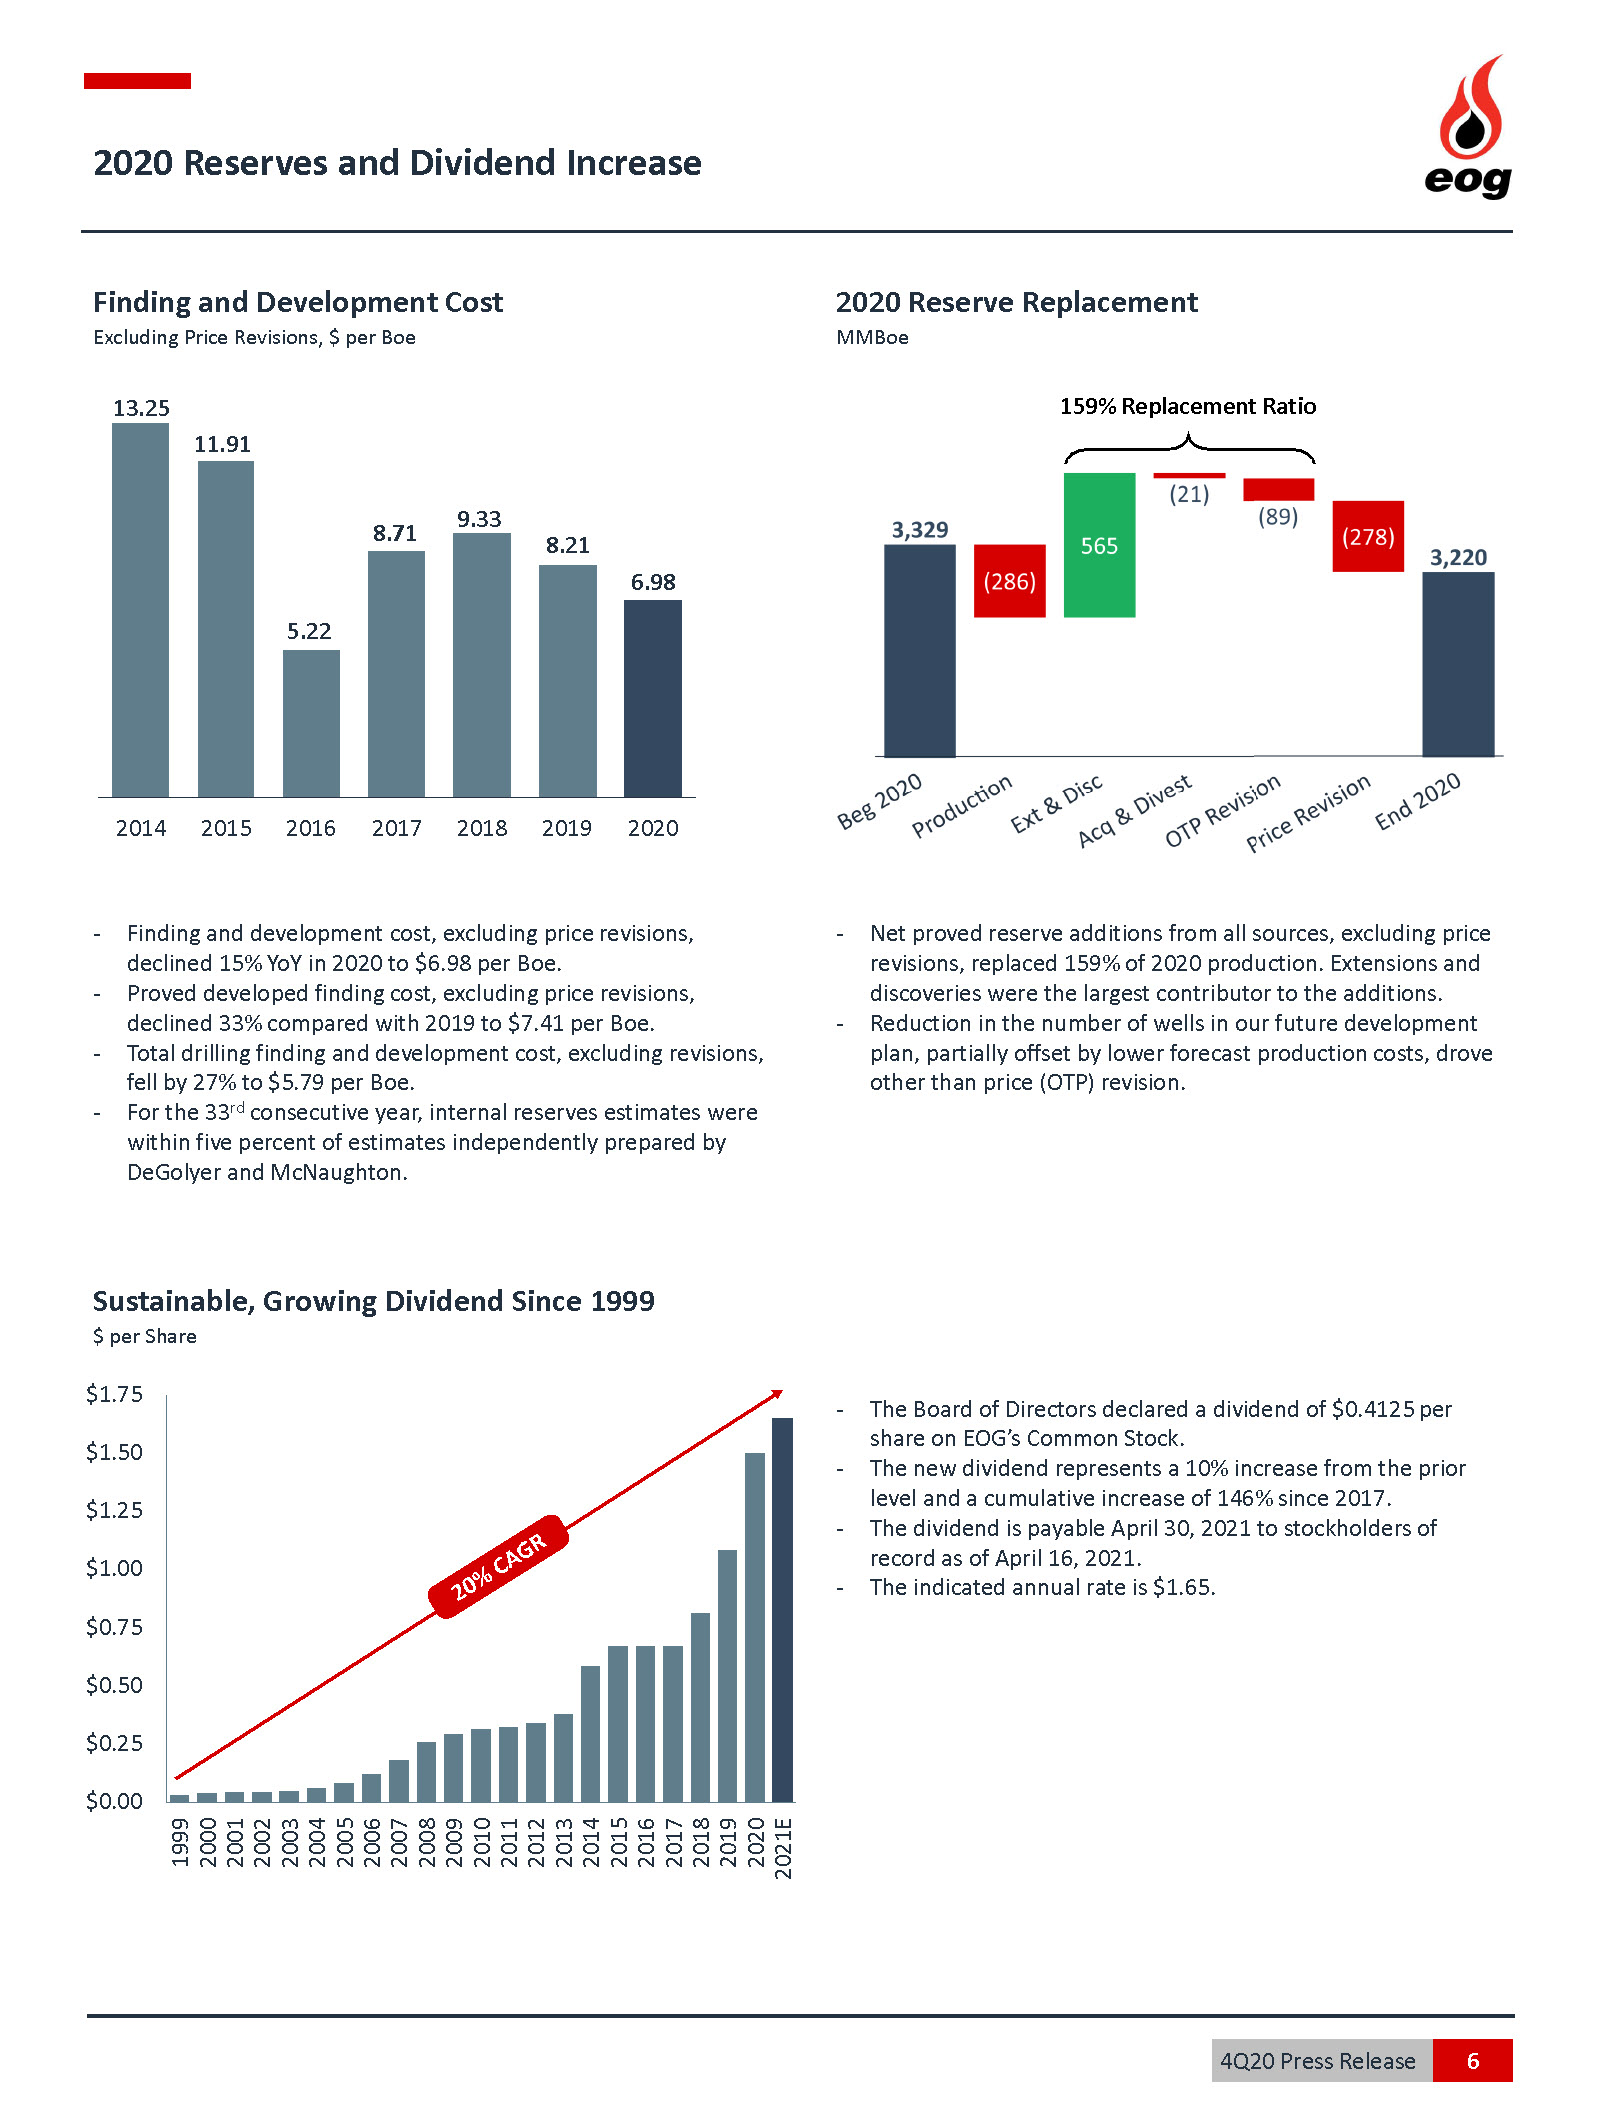
| Dividends Declared per Common Share | 0.3750 | | | 0.3750 | | | 0.2875 | | | 1.5000 | | | 1.0825 | |
| Net Income (Loss) Per Share | | | | | | | | | |
| Basic | 0.58 | | | (0.07) | | | 1.10 | | | (1.04) | | | 4.73 | |
| Diluted | 0.58 | | | (0.07) | | | 1.10 | | | (1.04) | | | 4.71 | |
| Average Number of Common Shares | | | | | | | | | |
| Basic | 579,624 | | | 579,055 | | | 578,219 | | | 578,949 | | | 577,670 | |
| Diluted | 580,885 | | | 579,055 | | | 580,849 | | | 578,949 | | | 580,777 | |
| | | | | | | | | | | | | | | | | | | | | | | | | | | | | | | | | | | | | | | | | | | | | | | |
| Wellhead Volumes and Prices | | | | | | | | | |
| (Unaudited) | | |
| 4Q 2020 | | 4Q 2019 | | % Change | | 3Q 2020 | | FY 2020 | | FY 2019 | | % Change | | | | | | |
| | | | | | | | | | | | | | | | | | | |
Crude Oil and Condensate Volumes (MBbld) (A) | | | | | | | | | | | | | | | |
| United States | 442.4 | | | 468.3 | | | -6 | % | | 376.6 | | | 408.1 | | | 455.5 | | | -10 | % | | | | | | |
| Trinidad | 2.3 | | | 0.5 | | | 360 | % | | 1.0 | | | 1.0 | | | 0.6 | | | 67 | % | | | | | | |
Other International (B) | 0.1 | | | 0.1 | | | 0 | % | | — | | | 0.1 | | | 0.1 | | | 0 | % | | | | | | |
| Total | 444.8 | | | 468.9 | | | -5 | % | | 377.6 | | | 409.2 | | | 456.2 | | | -10 | % | | | | | | |
| | | | | | | | | | | | | | | | | | | |
Average Crude Oil and Condensate Prices ($/Bbl) (C) | | | | | | | | | | | | | | | | | | | |
| United States | 41.86 | | | 57.14 | | | -27 | % | | 40.19 | | | 38.65 | | | 57.74 | | | -33 | % | | | | | | |
| Trinidad | 32.91 | | | 46.43 | | | -30 | % | | 25.41 | | | 30.20 | | | 47.16 | | | -36 | % | | | | | | |
Other International (B) | 35.90 | | | 53.76 | | | -33 | % | | 25.29 | | | 43.08 | | | 57.40 | | | -25 | % | | | | | | |
| Composite | 41.81 | | | 57.13 | | | -27 | % | | 40.15 | | | 38.63 | | | 57.72 | | | -33 | % | | | | | | |
| | | | | | | | | | | | | | | | | | | |
Natural Gas Liquids Volumes (MBbld) (A) | | | | | | | | | | | | | | | | | | | |
| United States | 141.4 | | | 144.0 | | | -2 | % | | 140.1 | | | 136.0 | | | 134.1 | | | 1 | % | | | | | | |
Other International (B) | — | | | — | | | | | — | | | — | | | — | | | | | | | | | |
| Total | 141.4 | | | 144.0 | | | -2 | % | | 140.1 | | | 136.0 | | | 134.1 | | | 1 | % | | | | | | |
| | | | | | | | | | | | | | | | | | | |
Average Natural Gas Liquids Prices ($/Bbl) (C) | | | | | | | | | | | | | | | | | | | |
| United States | 17.54 | | | 16.23 | | | 8 | % | | 14.34 | | | 13.41 | | | 16.03 | | | -16 | % | | | | | | |
Other International (B) | — | | | — | | | | | — | | | — | | | — | | | | | | | | | |
| Composite | 17.54 | | | 16.23 | | | 8 | % | | 14.34 | | | 13.41 | | | 16.03 | | | -16 | % | | | | | | |
| | | | | | | | | | | | | | | | | | | |
Natural Gas Volumes (MMcfd) (A) | | | | | | | | | | | | | | | | | | | |
| United States | 1,075 | | | 1,148 | | | -6 | % | | 1,008 | | | 1,040 | | | 1,069 | | | -3 | % | | | | | | |
| Trinidad | 192 | | | 242 | | | -21 | % | | 151 | | | 180 | | | 260 | | | -31 | % | | | | | | |
Other International (B) | 25 | | | 35 | | | -29 | % | | 31 | | | 32 | | | 37 | | | -14 | % | | | | | | |
| Total | 1,292 | | | 1,425 | | | -9 | % | | 1,190 | | | 1,252 | | | 1,366 | | | -8 | % | | | | | | |
| | | | | | | | | | | | | | | | | | | |
Average Natural Gas Prices ($/Mcf) (C) | | | | | | | | | | | | | | | | | | | |
| United States | 2.29 | | | 2.20 | | | 4 | % | | 1.49 | | | 1.61 | | | 2.22 | | | -27 | % | | | | | | |
| Trinidad | 3.57 | | | 2.78 | | | 28 | % | | 2.35 | | | 2.57 | | | 2.72 | | | -6 | % | | | | | | |
Other International (B) | 5.47 | | | 4.88 | | | 12 | % | | 4.73 | | | 4.66 | | | 4.44 | | | 5 | % | | | | | | |
| Composite | 2.54 | | | 2.36 | | | 8 | % | | 1.68 | | | 1.83 | | | 2.38 | | | -23 | % | | | | | | |
| | | | | | | | | | | | | | | | | | | |
Crude Oil Equivalent Volumes (MBoed) (D) | | | | | | | | | | | | | | | | | | | |
| United States | 763.0 | | | 803.6 | | | -5 | % | | 684.7 | | | 717.5 | | | 767.8 | | | -7 | % | | | | | | |
| Trinidad | 34.2 | | | 40.9 | | | -16 | % | | 26.2 | | | 30.9 | | | 44.0 | | | -30 | % | | | | | | |
Other International (B) | 4.3 | | | 5.8 | | | -26 | % | | 5.1 | | | 5.4 | | | 6.2 | | | -13 | % | | | | | | |
| Total | 801.5 | | | 850.3 | | | -6 | % | | 716.0 | | | 753.8 | | | 818.0 | | | -8 | % | | | | | | |
| | | | | | | | | | | | | | | | | | | |
Total MMBoe (D) | 73.7 | | | 78.2 | | | -6 | % | | 65.9 | | | 275.9 | | | 298.6 | | | -8 | % | | | | | | |
| | | | | | | | | | | | | | | | | | | |
| (A) Thousand barrels per day or million cubic feet per day, as applicable. | | | | | | |
(B) Other International includes EOG's China and Canada operations. | | | | | | |
(C) Dollars per barrel or per thousand cubic feet, as applicable. Excludes the impact of financial commodity derivative instruments (see Note 12 to the Consolidated Financial Statements in EOG's Annual Report on Form 10-K for the year ended December 31, 2020). | | | | | | |
(D) Thousand barrels of oil equivalent per day or million barrels of oil equivalent, as applicable; includes crude oil and condensate, NGLs and natural gas. Crude oil equivalent volumes are determined using a ratio of 1.0 barrel of crude oil and condensate or NGLs to 6.0 thousand cubic feet of natural gas. MMBoe is calculated by multiplying the MBoed amount by the number of days in the period and then dividing that amount by one thousand. | | | | | | |
| | | | | | | | | | | |
| Balance Sheets | | | |
| In thousands of USD, except share data (Unaudited) |
| December 31, | | December 31, |
| 2020 | | 2019 |
| Current Assets | | | |
| Cash and Cash Equivalents | 3,328,928 | | | 2,027,972 | |
| Accounts Receivable, Net | 1,522,256 | | | 2,001,658 | |
| Inventories | 629,401 | | | 767,297 | |
| Assets from Price Risk Management Activities | 64,559 | | | 1,299 | |
| Income Taxes Receivable | 23,037 | | | 151,665 | |
| Other | 293,987 | | | 323,448 | |
| Total | 5,862,168 | | | 5,273,339 | |
|
| Property, Plant and Equipment | | | |
| Oil and Gas Properties (Successful Efforts Method) | 64,792,798 | | | 62,830,415 | |
| Other Property, Plant and Equipment | 4,478,976 | | | 4,472,246 | |
| Total Property, Plant and Equipment | 69,271,774 | | | 67,302,661 | |
| Less: Accumulated Depreciation, Depletion and Amortization | (40,673,147) | | | (36,938,066) | |
| Total Property, Plant and Equipment, Net | 28,598,627 | | | 30,364,595 | |
| Deferred Income Taxes | 2,127 | | | 2,363 | |
| Other Assets | 1,341,679 | | | 1,484,311 | |
| Total Assets | 35,804,601 | | | 37,124,608 | |
|
| Current Liabilities | | | |
| Accounts Payable | 1,681,193 | | | 2,429,127 | |
| Accrued Taxes Payable | 205,754 | | | 254,850 | |
| Dividends Payable | 217,419 | | | 166,273 | |
| Liabilities from Price Risk Management Activities | — | | | 20,194 | |
| Current Portion of Long-Term Debt | 781,054 | | | 1,014,524 | |
| Current Portion of Operating Lease Liabilities | 295,089 | | | 369,365 | |
| Other | 279,595 | | | 232,655 | |
| Total | 3,460,104 | | | 4,486,988 | |
| | | |
| Long-Term Debt | 5,035,351 | | | 4,160,919 | |
| Other Liabilities | 2,147,932 | | | 1,789,884 | |
| Deferred Income Taxes | 4,859,327 | | | 5,046,101 | |
| Commitments and Contingencies | | | |
| | | |
| Stockholders' Equity | | | |
| Common Stock, $0.01 Par, 1,280,000,000 Shares Authorized and 583,694,850 Shares and 582,213,016 Shares Issued at December 31, 2020 and 2019, respectively | 205,837 | | | 205,822 | |
| Additional Paid in Capital | 5,945,024 | | | 5,817,475 | |
| Accumulated Other Comprehensive Loss | (12,328) | | | (4,652) | |
| Retained Earnings | 14,169,969 | | | 15,648,604 | |
| Common Stock Held in Treasury, 124,265 Shares and 298,820 Shares at December 31, 2020 and 2019, respectively | (6,615) | | | (26,533) | |
| Total Stockholders' Equity | 20,301,887 | | | 21,640,716 | |
| Total Liabilities and Stockholders' Equity | 35,804,601 | | | 37,124,608 | |
| | | | | | | | | | | | | | | | | | | | | | | |
| Cash Flows Statements | | | | | | | |
| In thousands of USD (Unaudited) |
| 4Q 2020 | | 4Q 2019 | | FY 2020 | | FY 2019 |
| Cash Flows from Operating Activities | | | | | | | |
| Reconciliation of Net Income (Loss) to Net Cash Provided by Operating Activities: | | | | | | | |
| Net Income (Loss) | 337,466 | | | 636,521 | | | (604,572) | | | 2,734,910 | |
| Items Not Requiring (Providing) Cash | | | | | | | |
| Depreciation, Depletion and Amortization | 870,564 | | | 959,208 | | | 3,400,353 | | | 3,749,704 | |
| Impairments | 142,440 | | | 228,135 | | | 2,099,780 | | | 517,896 | |
| Stock-Based Compensation Expenses | 32,942 | | | 42,415 | | | 146,396 | | | 174,738 | |
| Deferred Income Taxes | 54,613 | | | 123,082 | | | (186,390) | | | 631,658 | |
| (Gains) Losses on Asset Dispositions, Net | 5,600 | | | (119,963) | | | 46,883 | | | (123,613) | |
| Other, Net | 11,190 | | | 341 | | | 12,826 | | | 4,496 | |
| Dry Hole Costs | 20 | | | — | | | 13,083 | | | 28,001 | |
| Mark-to-Market Commodity Derivative Contracts | | | | | | | |
| Total (Gains) Losses | (69,304) | | | 62,347 | | | (1,144,737) | | | (180,275) | |
| Net Cash Received from Settlements of Commodity Derivative Contracts | 71,753 | | | 91,521 | | | 1,070,647 | | | 231,229 | |
| Other, Net | 2,539 | | | (253) | | | 1,354 | | | 962 | |
| Changes in Components of Working Capital and Other Assets and Liabilities | | | | | | | |
| Accounts Receivable | (464,105) | | | (85,937) | | | 466,523 | | | (91,792) | |
| Inventories | 30,633 | | | 34,686 | | | 122,647 | | | 90,284 | |
| Accounts Payable | 427,206 | | | 34,286 | | | (795,267) | | | 168,539 | |
| Accrued Taxes Payable | (61,491) | | | (47,925) | | | (49,096) | | | 40,122 | |
| Other Assets | (90,336) | | | (36,572) | | | 324,521 | | | 358,001 | |
| Other Liabilities | 20,837 | | | (38,304) | | | 8,098 | | | (56,619) | |
| Changes in Components of Working Capital Associated with Investing Activities | (201,329) | | | (76,384) | | | 74,734 | | | (115,061) | |
| Net Cash Provided by Operating Activities | 1,121,238 | | | 1,807,204 | | | 5,007,783 | | | 8,163,180 | |
| Investing Cash Flows | | | | | | | |
| Additions to Oil and Gas Properties | (784,954) | | | (1,285,003) | | | (3,243,474) | | | (6,151,885) | |
| Additions to Other Property, Plant and Equipment | (56,208) | | | (83,291) | | | (221,226) | | | (270,641) | |
| Proceeds from Sales of Assets | 2,985 | | | 104,883 | | | 191,928 | | | 140,292 | |
| Other Investing Activities | — | | | (10,000) | | | — | | | (10,000) | |
| Changes in Components of Working Capital Associated with Investing Activities | 201,329 | | | 76,384 | | | (74,734) | | | 115,061 | |
| Net Cash Used in Investing Activities | (636,848) | | | (1,197,027) | | | (3,347,506) | | | (6,177,173) | |
| Financing Cash Flows | | | | | | | |
| Long-Term Debt Borrowings | — | | | — | | | 1,483,852 | | | — | |
| Long-Term Debt Repayments | — | | | — | | | (1,000,000) | | | (900,000) | |
| Dividends Paid | (219,581) | | | (167,349) | | | (820,823) | | | (588,200) | |
| Treasury Stock Purchased | (1,309) | | | (2,914) | | | (16,130) | | | (25,152) | |
| Proceeds from Stock Options Exercised and Employee Stock Purchase Plan | 7,555 | | | 8,388 | | | 16,169 | | | 17,946 | |
| Debt Issuance Costs | (14) | | | — | | | (2,649) | | | (5,016) | |
| Repayment of Finance Lease Liabilities | (6,135) | | | (3,261) | | | (19,444) | | | (12,899) | |
| Net Cash Used in Financing Activities | (219,484) | | | (165,136) | | | (359,025) | | | (1,513,321) | |
| Effect of Exchange Rate Changes on Cash | (1,534) | | | (174) | | | (296) | | | (348) | |
| Increase in Cash and Cash Equivalents | 263,372 | | | 444,867 | | | 1,300,956 | | | 472,338 | |
| Cash and Cash Equivalents at Beginning of Period | 3,065,556 | | | 1,583,105 | | | 2,027,972 | | | 1,555,634 | |
| Cash and Cash Equivalents at End of Period | 3,328,928 | | | 2,027,972 | | | 3,328,928 | | | 2,027,972 | |
| | | | | | | | | | | | | | |
| Non-GAAP Financial Measures | | |
| | | | |
| | | | |
To supplement the presentation of its financial results prepared in accordance with generally accepted accounting principles in the United States of America (GAAP), EOG’s quarterly earnings releases and related conference calls, accompanying investor presentation slides and presentation slides for investor conferences contain certain financial measures that are not prepared or presented in accordance with GAAP. These non-GAAP financial measures may include, but are not limited to, Adjusted Net Income (Loss), Discretionary Cash Flow, Free Cash Flow, Adjusted EBITDAX, Net Debt and related statistics.
A reconciliation of each of these measures to their most directly comparable GAAP financial measure is included in the tables below and can also be found in the “Reconciliations & Guidance” section of the “Investors” page of the EOG website at www.eogresources.com.
EOG believes these measures may be useful to investors who follow the practice of some industry analysts who make certain adjustments to GAAP measures (for example, to exclude non-recurring items) to facilitate comparisons to others in EOG’s industry, and who utilize non-GAAP measures in their calculations of certain statistics (for example, return on capital employed and return on equity) used to evaluate EOG’s performance.
EOG believes that the non-GAAP measures presented, when viewed in combination with its financial and operating results prepared in accordance with GAAP, provide a more complete understanding of the factors and trends affecting the company’s performance. EOG uses these non-GAAP measures for purposes of (i) comparing EOG’s financial and operating performance with the financial and operating performance of other companies in the industry and (ii) analyzing EOG’s financial and operating performance across periods.
The non-GAAP measures presented should not be considered in isolation, and should not be considered as a substitute for, or as an alternative to, EOG’s reported Net Income (Loss), Total Debt, Net Cash Provided by Operating Activities and other financial results calculated in accordance with GAAP. The non-GAAP measures presented should be read in conjunction with EOG's consolidated financial statements prepared in accordance with GAAP.
In addition, because not all companies use identical calculations, EOG’s presentation of non-GAAP measures may not be comparable to, and may be calculated differently from, similarly titled measures disclosed by other companies, including its peer companies. EOG may also change the calculation of one or more of its non-GAAP measures from time to time – for example, to account for changes in its business and operations or to more closely conform to peer company or industry analysts’ practices.
| | | | | | | | | | | | | | | | | | | | | | | |
| Adjusted Net Income (Loss) | | | | | | |
| In thousands of USD, except per share data (Unaudited) | | | | | | | |
| 4Q 2020 |
| Before
Tax | | Income Tax Impact | | After
Tax | | Diluted Earnings per Share |
| | | | | | | |
| Reported Net Income (GAAP) | 427,760 | | | (90,294) | | | 337,466 | | | 0.58 | |
| Adjustments: | | | | | | | |
| Gains on Mark-to-Market Commodity Derivative Contracts | (69,304) | | | 15,211 | | | (54,093) | | | (0.10) | |
| Net Cash Received from Settlements of Commodity Derivative Contracts | 71,753 | | | (15,749) | | | 56,004 | | | 0.10 | |
| Add: Losses on Asset Dispositions, Net | 5,600 | | | (1,248) | | | 4,352 | | | 0.01 | |
| Add: Certain Impairments | 86,451 | | | (18,692) | | | 67,759 | | | 0.12 | |
| Adjustments to Net Income | 94,500 | | | (20,478) | | | 74,022 | | | 0.13 | |
| | | | | | | |
| Adjusted Net Income (Non-GAAP) | 522,260 | | | (110,772) | | | 411,488 | | | 0.71 | |
| | | | | | | |
| Average Number of Common Shares (GAAP) | | | | | | | |
| Basic | | | | | | | 579,624 | |
| Diluted | | | | | | | 580,885 | |
| | | | | | | |
| Average Number of Common Shares (Non-GAAP) | | | | | | | |
| Basic | | | | | | | 579,624 | |
| Diluted | | | | | | | 580,885 | |
| | | | | | | | | | | | | | | | | | | | | | | |
| 3Q 2020 |
| Before
Tax | | Income Tax Impact | | After
Tax | | Diluted Earnings per Share |
| | | | | | | |
| Reported Net Loss (GAAP) | (52,555) | | | 10,088 | | | (42,467) | | | (0.07) | |
| Adjustments: | | | | | | | |
| Losses on Mark-to-Market Commodity Derivative Contracts | 3,978 | | | (873) | | | 3,105 | | | (0.01) | |
| Net Cash Received from Settlements of Commodity Derivative Contracts | 275,133 | | | (60,386) | | | 214,747 | | | 0.37 | |
| Add: Losses on Asset Dispositions, Net | 70,976 | | | (15,600) | | | 55,376 | | | 0.10 | |
| Add: Certain Impairments | 26,531 | | | (5,636) | | | 20,895 | | | 0.04 | |
| Adjustments to Net Loss | 376,618 | | | (82,495) | | | 294,123 | | | 0.50 | |
| | | | | | | |
| Adjusted Net Income (Non-GAAP) | 324,063 | | | (72,407) | | | 251,656 | | | 0.43 | |
| | | | | | | |
| Average Number of Common Shares (GAAP) | | | | | | | |
| Basic | | | | | | | 579,055 | |
| Diluted | | | | | | | 579,055 | |
| | | | | | | |
| Average Number of Common Shares (Non-GAAP) | | | | | | | 579,055 | |
| Basic | | | | | | | 580,609 | |
| Diluted | | | | | | | |
| | | | | | | | | | | | | | | | | | | | | | | |
| Adjusted Net Income (Loss) | | | | | | |
| In thousands of USD, except per share data (Unaudited) | | | | | | | |
| 4Q 2019 |
| Before
Tax | | Income Tax Impact | | After
Tax | | Diluted Earnings per Share |
| | | | | | | |
| Reported Net Income (GAAP) | 831,208 | | | (194,687) | | | 636,521 | | | 1.10 | |
| Adjustments: | | | | | | | |
| Losses on Mark-to-Market Commodity Derivative Contracts | 62,347 | | | (13,684) | | | 48,663 | | | 0.08 | |
| Net Cash Received from Settlements of Commodity Derivative Contracts | 91,521 | | | (20,087) | | | 71,434 | | | 0.12 | |
| Less: Gains on Asset Dispositions, Net | (119,963) | | | 26,342 | | | (93,621) | | | (0.16) | |
| Add: Certain Impairments | 158,725 | | | (34,837) | | | 123,888 | | | 0.21 | |
| Adjustments to Net Income | 192,630 | | | (42,266) | | | 150,364 | | | 0.25 | |
| | | | | | | |
| Adjusted Net Income (Non-GAAP) | 1,023,838 | | | (236,953) | | | 786,885 | | | 1.35 | |
| | | | | | | |
| Average Number of Common Shares (GAAP) | | | | | | | |
| Basic | | | | | | | 578,219 | |
| Diluted | | | | | | | 580,849 | |
| | | | | | | |
| Average Number of Common Shares (Non-GAAP) | | | | | | | 578,219 | |
| Basic | | | | | | | 580,849 | |
| Diluted | | | | | | | |
| | | | | | | | | | | | | | | | | | | | | | | |
| Adjusted Net Income (Loss) | | | | | | |
| In thousands of USD, except per share data (Unaudited) | | | | | | | |
| FY 2020 |
| Before
Tax | | Income Tax Impact | | After
Tax | | Diluted Earnings per Share |
| | | | | | | |
| Reported Net Loss (GAAP) | (739,054) | | | 134,482 | | | (604,572) | | | (1.04) | |
| Adjustments: | | | | | | | |
| Gains on Mark-to-Market Commodity Derivative Contracts | (1,144,737) | | | 251,247 | | | (893,490) | | | (1.55) | |
| Net Cash Received from Settlements of Commodity Derivative Contracts | 1,070,647 | | | (234,986) | | | 835,661 | | | 1.44 | |
| Add: Losses on Asset Dispositions, Net | 46,883 | | | (10,305) | | | 36,578 | | | 0.06 | |
| Add: Certain Impairments | 1,868,465 | | | (392,652) | | | 1,475,813 | | | 2.55 | |
| Adjustments to Net Loss | 1,841,258 | | | (386,696) | | | 1,454,562 | | | 2.50 | |
| | | | | | | |
| Adjusted Net Income (Non-GAAP) | 1,102,204 | | | (252,214) | | | 849,990 | | | 1.46 | |
| | | | | | | |
| Average Number of Common Shares (GAAP) | | | | | | | |
| Basic | | | | | | | 578,949 | |
| Diluted | | | | | | | 578,949 | |
| | | | | | | |
| Average Number of Common Shares (Non-GAAP) | | | | | | | |
| Basic | | | | | | | 578,949 | |
| Diluted | | | | | | | 580,595 | |
| | | | | | | | | | | | | | | | | | | | | | | |
| FY 2019 |
| Before
Tax | | Income Tax Impact | | After
Tax | | Diluted Earnings per Share |
| | | | | | | |
| Reported Net Income (GAAP) | 3,545,267 | | | (810,357) | | | 2,734,910 | | | 4.71 | |
| Adjustments: | | | | | | | |
| Gains on Mark-to-Market Commodity Derivative Contracts | (180,275) | | | 39,567 | | | (140,708) | | | (0.24) | |
| Net Cash Received from Settlements of Commodity Derivative Contracts | 231,229 | | | (50,750) | | | 180,479 | | | 0.31 | |
| Less: Gains on Asset Dispositions, Net | (123,613) | | | 27,252 | | | (96,361) | | | (0.17) | |
| Add: Certain Impairments | 274,974 | | | (60,351) | | | 214,623 | | | 0.37 | |
| Adjustments to Net Income | 202,315 | | | (44,282) | | | 158,033 | | | 0.27 | |
| | | | | | | |
| Adjusted Net Income (Non-GAAP) | 3,747,582 | | | (854,639) | | | 2,892,943 | | | 4.98 | |
| | | | | | | |
| Average Number of Common Shares (GAAP) | | | | | | | |
| Basic | | | | | | | 577,670 | |
| Diluted | | | | | | | 580,777 | |
| | | | | | | |
| Average Number of Common Shares (Non-GAAP) | | | | | | | |
| Basic | | | | | | | 577,670 | |
| Diluted | | | | | | | 580,777 | |
| | | | | | | | | | | |
| Adjusted Net Income per Share | | | |
| In thousands of USD, except share and per Boe data (Unaudited) |
| 3Q 2020 Adjusted Net Income per Share (Non-GAAP) | | | 0.43 | |
| | | |
| Realized Price | | | |
| 4Q 2020 Composite Average Wellhead Revenue per Boe | 30.39 | | | |
| Less: 3Q 2020 Composite Average Welhead Revenue per Boe | (26.77) | | | |
| Subtotal | 3.62 | | | |
| Multiplied by: 4Q 2020 Crude Oil Equivalent Volumes (MMBoe) | 73.7 | | | |
| Total Change in Revenue | 266,794 | | | |
| Less: Taxes Other Than Income Benefit (Cost) Imputed (based on 6.5%) | (17,342) | | | |
| Net Change in Revenue | 249,452 | | | |
| Less: Tax Benefit Imputed (based on 21%) | (52,385) | | | |
| Change in Net Income | 197,067 | | | |
| Change in Diluted Earnings per Share | | | 0.34 | |
| | | |
| Net Cash Received (Paid) from Settlements of Commodity Derivative Contracts | | | |
| 4Q 2020 Net Cash Received from Settlement of Commodity Derivative Contracts | 71,753 | | | |
| Less: Income Tax Impact | (15,749) | | | |
| After Tax - (a) | 56,004 | | | |
| 3Q 2020 Net Cash Received from Settlement of Commodity Derivative Contracts | 275,133 | | | |
| Less: Income Tax Impact | (60,386) | | | |
| After Tax - (b) | 214,747 | | | |
| Change in Net Income - (a) - (b) | (158,743) | | | |
| Change in Diluted Earnings per Share | | | (0.27) | |
| | | |
| Wellhead Volumes | | | |
| 4Q 2020 Crude Oil Equivalent Volumes (MMBoe) | 73.7 | | | |
| Less: 3Q 2020 Crude Oil Equivalent Volumes (MMBoe) | (65.9) | | | |
| Subtotal | 7.8 | | | |
Times: 4Q 2020 Composite Average Margin per Boe (Non-GAAP)
(Including Total Exploration Costs) (refer to "Costs per Barrel of Oil Equivalent" schedule) | 5.67 | | | |
| Change in Revenue | 44,226 | | | |
| Less: Taxes Other Than Income Benefit (Cost) Imputed (based on 6.5%) | (2,875) | | | |
| Net Change in Reveue | 41,351 | | | |
| Less: Tax Benefit Imputed (based on 21%) | (8,684) | | | |
| Change in Net Income | 32,668 | | | |
| Change in Diluted Earnings per Share | | | 0.06 | |
| | | |
| Operating Cost per Boe | | | |
| 3Q 2020 Total Operating Cost per Boe (Non-GAAP) (including Total Exploration Costs) (refer to "Costs per Barrel of Oil Equivalent" schedule) | 26.62 | | | |
| Less: 4Q 2020 Total Operating Cost per Boe (Non-GAAP) (including Total Exploration Costs) (refer to "Costs per Barrel of Oil Equivalent" schedule) | (24.72) | | | |
| Subtotal | 1.9 | | | |
| Times: 4Q 2020 Crude Oil Equivalent Volumes (MMBoe) | 73.7 | | | |
| Change in Before-Tax Net Income | 140,030 | | | |
| Less: Tax Benefit Imputed (based on 21%) | (29,406) | | | |
| Change in Net Income | 110,624 | | | |
| Change in Diluted Earnings per Share | | | 0.19 | |
| | | |
| Other Items | | | (0.04) | |
| | | |
| 4Q 2020 Adjusted Net Income per Share (Non-GAAP) | | | 0.71 | |
| | | |
| 4Q 2020 Average Number of Common Shares (Non-GAAP) - Diluted | 580,885 | | | |
| | | | | | | | | | | |
| Adjusted Net Income per Share | | | |
| In thousands of USD, except share and per Boe data (Unaudited) |
| FY 2019 Adjusted Net Income per Share (Non-GAAP) | | | 4.98 | |
| | | |
| Realized Price | | | |
| FY 2020 Composite Average Wellhead Revenue per Boe | 26.42 | | | |
| Less: FY 2019 Composite Average Welhead Revenue per Boe | (38.79) | | | |
| Subtotal | (12.37) | | | |
| Multiplied by: FY 2020 Crude Oil Equivalent volumes (MMBoe) | 275.9 | | | |
| Total Change in Revenue | (3,412,883) | | | |
| Less: Taxes Other Than Income Benefit (Cost) Imputed (based on 6.5%) | 221,837 | | | |
| Net Change in Revenue | (3,191,046) | | | |
| Less: Tax Benefit Imputed (based on 21%) | 670,120 | | | |
| Change in Net Income | (2,520,926) | | | |
| Change in Diluted Earnings per Share | | | (4.34) | |
| | | |
| Net Cash Received (Paid) from Settlements of Commodity Derivative Contracts | | | |
| FY 2020 Net Cash Received from Settlement of Commodity Derivative Contracts | 1,070,647 | | | |
| Less: Income Tax Impact | (234,986) | | | |
| After Tax - (a) | 835,661 | | | |
| FY 2019 Net Cash Received from Settlement of Commodity Derivative Contracts | 231,229 | | | |
| Less: Income Tax Impact | (50,750) | | | |
| After Tax - (b) | 180,479 | | | |
| Change in Net Income - (a) - (b) | 655,182 | | | |
| Change in Diluted Earnings per Share | | | 1.13 | |
| | | |
| Wellhead Volumes | | | |
| FY 2020 Crude Oil Equivalent Volumes (MMBoe) | 275.9 | | | |
| Less: FY 2019 Crude Oil Equivalent Volumes (MMBoe) | (298.6) | | | |
| Subtotal | (22.7) | | | |
Times: FY 2020 Composite Average Margin per Boe (Non-GAAP)
(Including Total Exploration Costs) (refer to "Costs per Barrel of Oil Equivalent" schedule) | 0.29 | | | |
| Change in Revenue | (6,583) | | | |
| Less: Taxes Other Than Income Benefit (Cost) Imputed (based on 6.5%) | 428 | | | |
| Net Change in Reveue | (6,155) | | | |
| Less: Tax Benefit Imputed (based on 21%) | 1,293 | | | |
| Change in Net Income | (4,863) | | | |
| Change in Diluted Earnings per Share | | | (0.01) | |
| | | |
| Operating Cost per Boe | | | |
| FY 2019 Total Operating Cost per Boe (Non-GAAP) (including Total Exploration Costs) (refer to "Costs per Barrel of Oil Equivalent" schedule) | 27.6 | | | |
| Less: FY 2020 Total Operating Cost per Boe (Non-GAAP) (including Total Exploration Costs) (refer to "Costs per Barrel of Oil Equivalent" schedule) | (26.13) | | | |
| Subtotal | 1.47 | | | |
| Times: FY 2020 Crude Oil Equivalent Volumes (MMBoe) | 275.9 | | | |
| Change in Before-Tax Net Income | 405,573 | | | |
| Less: Tax Benefit Imputed (based on 21%) | (85,170) | | | |
| Change in Net Income | 320,403 | | | |
| Change in Diluted Earnings per Share | | | 0.55 | |
| | | |
| Other Items | | | (0.85) | |
| | | |
| FY 2020 Adjusted Net Income per Share (Non-GAAP) | | | 1.46 | |
| | | |
| FY 2020 Average Number of Common Shares (Non-GAAP) - Diluted | 580,595 | | | |
| | | | | | | | | | | | | | | | | | | | | | | | | | | | | | | | | | |
| Discretionary Cash Flow and Free Cash Flow | | | | | | |
| In thousands of USD (Unaudited) | | | | | | | | | | | | | | |
| 4Q 2020 | | 3Q 2020 | | 4Q 2019 | | FY 2020 | | FY 2019 | | | | | |
| | | | | | | | | | | | | | |
| Net Cash Provided by Operating Activities (GAAP) | 1,121,238 | | | 1,213,553 | | | 1,807,204 | | | 5,007,783 | | | 8,163,180 | | | | | | |
| | | | | | | | | | | | | | |
| Adjustments: | | | | | | | | | | | | | | |
| Exploration Costs (excluding Stock-Based Compensation Expenses) | 34,295 | | | 37,380 | | | 28,483 | | | 124,641 | | | 113,733 | | | | | | |
| Other Non-Current Income Taxes - Net Receivable | — | | | — | | | 59,174 | | | 112,704 | | | 238,711 | | | | | | |
| Changes in Components of Working Capital and Other Assets and Liabilities | | | | | | | | | | | | | | |
| Accounts Receivable | 464,105 | | | 260,829 | | | 85,937 | | | (466,523) | | | 91,792 | | | | | | |
| Inventories | (30,633) | | | (7,439) | | | (34,686) | | | (122,647) | | | (90,284) | | | | | | |
| Accounts Payable | (427,206) | | | 37,755 | | | (34,286) | | | 795,267 | | | (168,539) | | | | | | |
| Accrued Taxes Payable | 61,491 | | | (73,482) | | | 47,925 | | | 49,096 | | | (40,122) | | | | | | |
| Other Assets | 90,336 | | | (161,879) | | | 36,572 | | | (324,521) | | | (358,001) | | | | | | |
| Other Liabilities | (20,837) | | | (51,664) | | | 38,304 | | | (8,098) | | | 56,619 | | | | | | |
| Changes in Components of Working Capital Associated with Investing and Financing Activities | 201,329 | | | 6,091 | | | 76,384 | | | (74,734) | | | 115,061 | | | | | | |
| Discretionary Cash Flow (Non-GAAP) | 1,494,118 | | | 1,261,144 | | | 2,111,011 | | | 5,092,968 | | | 8,122,150 | | | | | | |
| | | | | | | | | | | | | | |
| Discretionary Cash Flow (Non-GAAP) - Percentage Decrease | -29 | % | | | | | | -37 | % | | | | | | | |
| | | | | | | | | | | | | | |
| Discretionary Cash Flow (Non-GAAP) | 1,494,118 | | | 1,261,144 | | | 2,111,011 | | | 5,092,968 | | | 8,122,150 | | | | | | |
| Less: | | | | | | | | | | | | | | |
Total Cash Capital Expenditures Before Acquisitions (Non-GAAP) (a) | (828,507) | | | (499,305) | | | (1,388,233) | | | (3,490,148) | | | (6,234,454) | | | | | | |
Free Cash Flow (Non-GAAP) (b) | 665,611 | | | 761,839 | | | 722,778 | | | 1,602,820 | | | 1,887,696 | | | | | | |
| | | | | | | | | | | | | | |
| (a) See below reconciliation of Total Expenditures (GAAP) to Total Cash Capital Expenditures Before Acquisitions (Non-GAAP) for the three-month periods ended September 30, 2020 and December 31, 2020 and 2019 and twelve-month periods ended December 31, 2020 and 2019: | | | | | |
| | | | | | | | | | | | | | |
| Total Expenditures (GAAP) | 1,107,557 | | | 645,534 | | | 1,506,061 | | | 4,113,280 | | | 6,900,450 | | | | | | |
| Less: | | | | | | | | | | | | | | |
| Asset Retirement Costs | (49,109) | | | (42,650) | | | (34,537) | | | (117,322) | | | (186,088) | | | | | | |
| Non-Cash Expenditures of Other Property, Plant and Equipment | (1) | | | — | | | (1,680) | | | (61) | | | (2,266) | | | | | | |
| Non-Cash Acquisition Costs of Unproved Properties | (68,337) | | | (80,757) | | | (33,317) | | | (196,825) | | | (97,704) | | | | | | |
| Non-Cash Finance Leases | (100,485) | | | — | | | — | | | (173,762) | | | — | | | | | | |
| Acquisition Costs of Proved Properties | (61,118) | | | (22,822) | | | (48,294) | | | (135,162) | | | (379,938) | | | | | | |
| Total Cash Capital Expenditures Before Acquisitions (Non-GAAP) | 828,507 | | | 499,305 | | | 1,388,233 | | | 3,490,148 | | | 6,234,454 | | | | | | |
| | | | | | | | | | | | | | |
| (b) To better align the presentation of free cash flow for comparative purposes within the industry, free cash flow excludes dividends paid (GAAP) as a reconciling item for the three-month periods ending September 30, 2020 and December 31, 2020 and twelve-month periods ending December 31, 2020. The comparative prior periods shown have been revised to conform to this presentation. | | | | | |
| | | | | | | | | | | | | | |
| Maintenance Capital Expenditures | | | | | | | | | | | | | | |
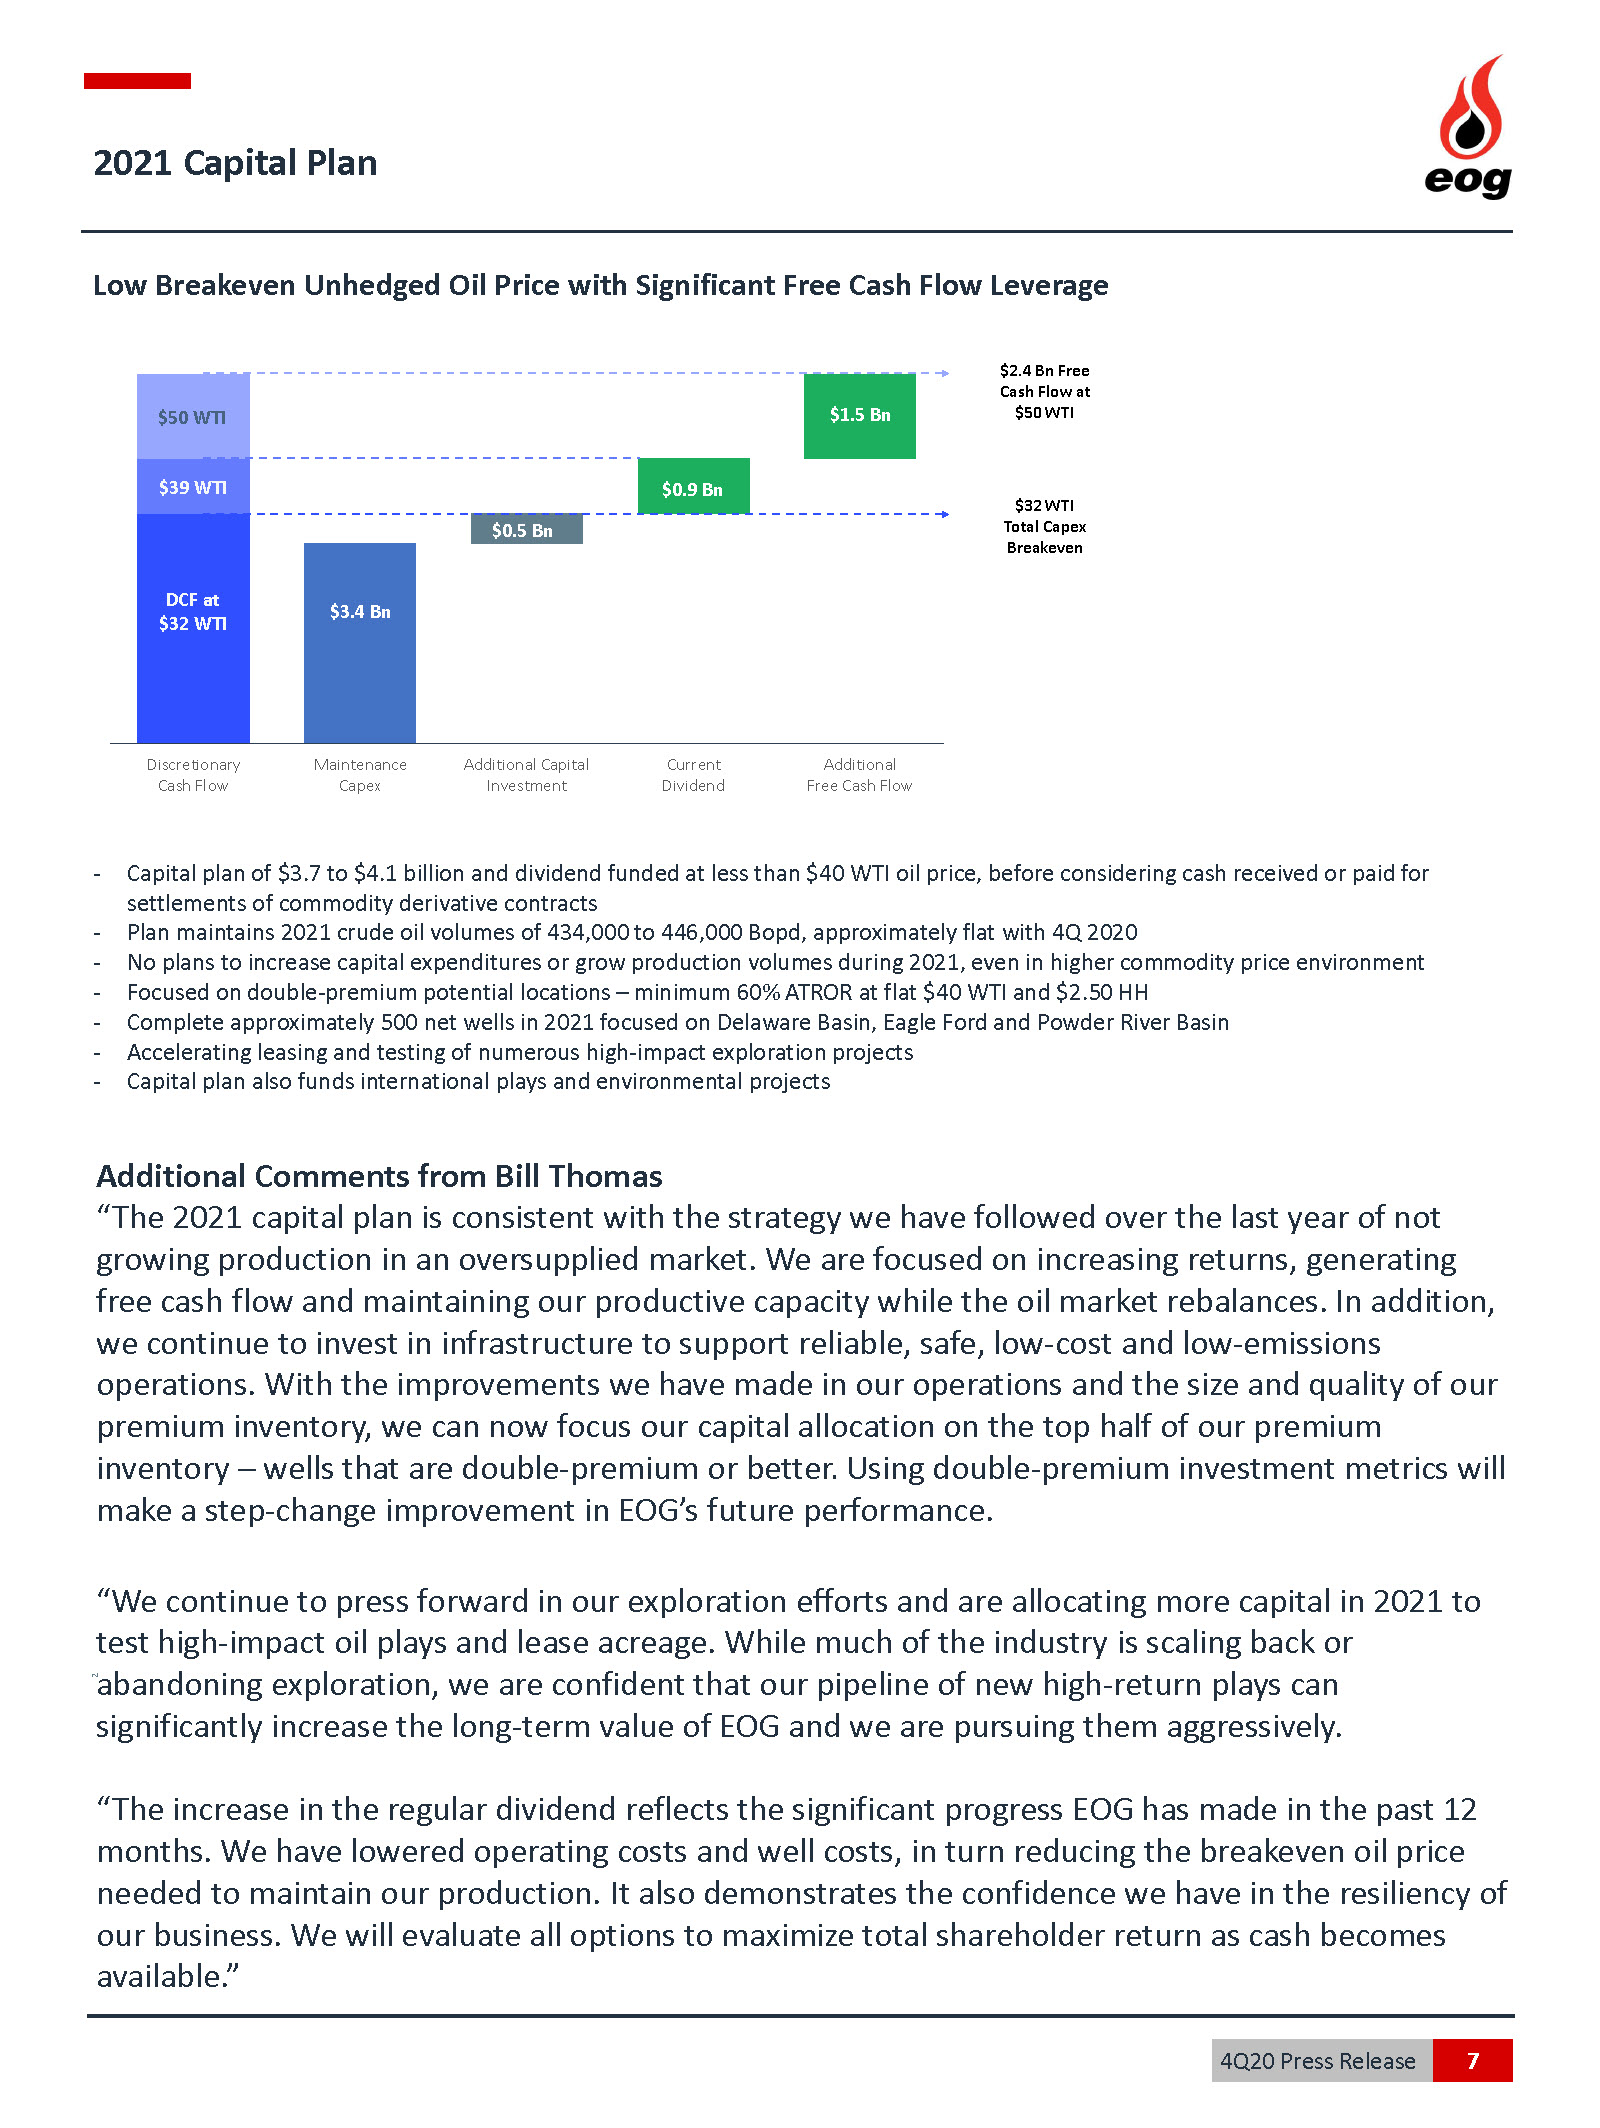
| The capital expenditures required to fund drilling and infrastructure requirements to keep U.S. oil production in 2021 flat relative to 4Q 2020 U.S. oil production. |
| | | | | | | | | | | | | | | | | | | | | | |
| Discretionary Cash Flow and Free Cash Flow | | | | | | |
| In thousands of USD (Unaudited) | | | | | | | | | | |
| | | | | | | | | | |
| FY 2019 | | FY 2018 | | FY 2017 | | | | | |
| | | | | | | | | | |
| Net Cash Provided by Operating Activities (GAAP) | 8,163,180 | | | 7,768,608 | | | 4,265,336 | | | | | | |
| | | | | | | | | | |
| Adjustments: | | | | | | | | | | |
| Exploration Costs (excluding Stock-Based Compensation Expenses) | 113,733 | | | 123,986 | | | 122,688 | | | | | | |
| Other Non-Current Income Taxes - Net (Payable) Receivable | 238,711 | | | 148,993 | | | (513,404) | | | | | | |
| Changes in Components of Working Capital and Other Assets and Liabilities | | | | | | | | | | |
| Accounts Receivable | 91,792 | | | 368,180 | | | 392,131 | | | | | | |
| Inventories | (90,284) | | | 395,408 | | | 174,548 | | | | | | |
| Accounts Payable | (168,539) | | | (439,347) | | | (324,192) | | | | | | |
| Accrued Taxes Payable | (40,122) | | | 92,461 | | | 63,937 | | | | | | |
| Other Assets | (358,001) | | | 125,435 | | | 658,609 | | | | | | |
| Other Liabilities | 56,619 | | | (10,949) | | | 89,871 | | | | | | |
| Changes in Components of Working Capital Associated with Investing and Financing Activities | 115,061 | | | (301,083) | | | (89,992) | | | | | | |
| Discretionary Cash Flow (Non-GAAP) | 8,122,150 | | | 8,271,692 | | | 4,839,532 | | | | | | |
| | | | | | | | | | |
| Discretionary Cash Flow (Non-GAAP) - Percentage Increase (Decrease) | -2 | % | | 71 | % | | 76 | % | | | | | |
| | | | | | | | | | |
| Discretionary Cash Flow (Non-GAAP) | 8,122,150 | | | 8,271,692 | | | 4,839,532 | | | | | | |
| Less: | | | | | | | | | | |
Total Cash Capital Expenditures Before Acquisitions (Non-GAAP) (a) | (6,234,454) | | | (6,172,950) | | | (4,228,859) | | | | | | |
Free Cash Flow (Non-GAAP) (b) | 1,887,696 | | | 2,098,742 | | | 610,673 | | | | | | |
| | | | | | | | | | |
| (a) See below reconciliation of Total Expenditures (GAAP) to Total Cash Capital Expenditures Before Acquisitions (Non-GAAP) for the twelve-month periods ended December 31, 2019, 2018 and 2017: | | | | | |
| | | | | | | | | | |
| Total Expenditures (GAAP) | 6,900,450 | | | 6,706,359 | | | 4,612,746 | | | | | | |
| Less: | | | | | | | | | | |
| Asset Retirement Costs | (186,088) | | | (69,699) | | | (55,592) | | | | | | |
| Non-Cash Expenditures of Other Property, Plant and Equipment | (2,266) | | | (49,484) | | | — | | | | | | |
| Non-Cash Acquisition Costs of Unproved Properties | (97,704) | | | (290,542) | | | (255,711) | | | | | | |
| Acquisition Costs of Proved Properties | (379,938) | | | (123,684) | | | (72,584) | | | | | | |
| Total Cash Capital Expenditures Before Acquisitions (Non-GAAP) | 6,234,454 | | | 6,172,950 | | | 4,228,859 | | | | | | |
| | | | | | | | | | |
| (b) To better align the presentation of free cash flow for comparative purposes within the industry, free cash flow excludes dividends paid (GAAP) as a reconciling item for the twelve-month period ending December 31, 2019. The comparative prior periods shown have been revised to conform to this presentation. | | | | | |
| | | | | | | | | | | | | | | | | | | | | | | | | | | | | | | | | | |
| Discretionary Cash Flow and Free Cash Flow | | | | | | |
| In thousands of USD (Unaudited) | | | | | | | | | | | | | | |
| | | | | | | | | | | | | | |
| FY 2016 | | FY 2015 | | FY 2014 | | FY 2013 | | FY 2012 | | | | | |
| | | | | | | | | | | | | | |
| Net Cash Provided by Operating Activities (GAAP) | 2,359,063 | | | 3,595,165 | | | 8,649,155 | | | 7,329,414 | | | 5,236,777 | | | | | | |
| | | | | | | | | | | | | | |
| Adjustments: | | | | | | | | | | | | | | |
| Exploration Costs (excluding Stock-Based Compensation Expenses) | 104,199 | | | 124,011 | | | 157,453 | | | 134,531 | | | 159,182 | | | | | | |
| Excess Tax Benefits from Stock-Based Compensation | 29,357 | | | 26,058 | | | 99,459 | | | 55,831 | | | 67,035 | | | | | | |
| Changes in Components of Working Capital and Other Assets and Liabilities | | | | | | | | | | | | | | |
| Accounts Receivable | 232,799 | | | (641,412) | | | (84,982) | | | 23,613 | | | 178,683 | | | | | | |
| Inventories | (170,694) | | | (58,450) | | | 161,958 | | | (53,402) | | | 156,762 | | | | | | |
| Accounts Payable | 74,048 | | | 1,409,197 | | | (543,630) | | | (178,701) | | | 17,150 | | | | | | |
| Accrued Taxes Payable | (92,782) | | | (11,798) | | | (16,486) | | | (75,142) | | | (78,094) | | | | | | |
| Other Assets | 40,636 | | | (118,143) | | | 14,448 | | | 109,567 | | | 118,520 | | | | | | |
| Other Liabilities | 16,225 | | | 66,257 | | | (75,420) | | | 20,382 | | | (36,114) | | | | | | |
| Changes in Components of Working Capital Associated with Investing and Financing Activities | 156,102 | | | (499,767) | | | 103,414 | | | 51,361 | | | (74,158) | | | | | | |
| Discretionary Cash Flow (Non-GAAP) | 2,748,953 | | | 3,891,118 | | | 8,465,369 | | | 7,417,454 | | | 5,745,743 | | | | | | |
| | | | | | | | | | | | | | |
| Discretionary Cash Flow (Non-GAAP) - Percentage Increase (Decrease) | -29 | % | | -54 | % | | 14 | % | | 29 | % | | | | | | | |
| | | | | | | | | | | | | | |
| Discretionary Cash Flow (Non-GAAP) | 2,748,953 | | | 3,891,118 | | | 8,465,369 | | | 7,417,454 | | | 5,745,743 | | | | | | |
| Less: | | | | | | | | | | | | | | |
Total Cash Capital Expenditures Before Acquisitions (Non-GAAP) (a) | (2,706,397) | | | (4,682,326) | | | (8,292,090) | | | (7,101,791) | | | (7,539,994) | | | | | | |
Free Cash Flow (Non-GAAP) (b) | 42,556 | | | (791,208) | | | 173,279 | | | 315,663 | | | (1,794,251) | | | | | | |
| | | | | | | | | | | | | | |
| (a) See below reconciliation of Total Expenditures (GAAP) to Total Cash Capital Expenditures Before Acquisitions (Non-GAAP) for the twelve-month periods ended December 31, 2016, 2015, 2014, 2013 and 2012: | | | | | |
| | | | | | | | | | | | | | |
| Total Expenditures (GAAP) | 6,554,053 | | | 5,216,413 | | | 8,631,906 | | | 7,361,457 | | | 7,753,828 | | | | | | |
| Less: | | | | | | | | | | | | | | |
| Asset Retirement Costs | 19,865 | | | (53,470) | | | (195,630) | | | (134,445) | | | (126,987) | | | | | | |
| Non-Cash Expenditures of Other Property, Plant and Equipment | (16,585) | | | — | | | — | | | — | | | (65,791) | | | | | | |
| Non-Cash Acquisition Costs of Unproved Properties | (3,101,913) | | | — | | | (5,085) | | | (5,007) | | | (20,317) | | | | | | |
| Acquisition Costs of Proved Properties | (749,023) | | | (480,617) | | | (139,101) | | | (120,214) | | | (739) | | | | | | |
| Total Cash Capital Expenditures Before Acquisitions (Non-GAAP) | 2,706,397 | | | 4,682,326 | | | 8,292,090 | | | 7,101,791 | | | 7,539,994 | | | | | | |
| | | | | | | | | | | | | | |
| (b) To better align the presentation of free cash flow for comparative purposes within the industry, the presentation of free cash flow for the comparative prior periods shown has been revised to exclude dividends paid (GAAP) as a reconciling item. | | | | | |
| | | | | | | | | | | | | | | | | | | | | | | | | | | | | | | | | | | |
| Total Expenditures | | | | | | | | | |
| In millions of USD (Unaudited) | | | | | | | | | | | |
| | | | | | | | | | | |
| 4Q 2020 | | 4Q 2019 | | FY 2020 | | FY 2019 | | FY 2018 | | FY 2017 |
| | | | | | | | | | | |
| Exploration and Development Drilling | 592 | | | 1,086 | | | 2,664 | | | 4,951 | | | 4,935 | | | 3,132 | |
| Facilities | 99 | | | 130 | | | 347 | | | 629 | | | 625 | | | 575 | |
| Leasehold Acquisitions | 102 | | | 75 | | | 265 | | | 276 | | | 488 | | | 427 | |
| Property Acquisitions | 61 | | | 48 | | | 135 | | | 380 | | | 124 | | | 73 | |
| Capitalized Interest | 7 | | | 10 | | | 31 | | | 38 | | | 24 | | | 27 | |
| Subtotal | 861 | | | 1,349 | | | 3,442 | | | 6,274 | | | 6,196 | | | 4,234 | |
| Exploration Costs | 41 | | | 37 | | | 146 | | | 140 | | | 149 | | | 145 | |
| Dry Hole Costs | — | | | — | | | 13 | | | 28 | | | 5 | | | 5 | |
| Exploration and Development Expenditures | 902 | | | 1,386 | | | 3,601 | | | 6,442 | | | 6,350 | | | 4,384 | |
| Asset Retirement Costs | 48 | | | 35 | | | 117 | | | 186 | | | 70 | | | 56 | |
| Total Exploration and Development Expenditures | 950 | | | 1,421 | | | 3,718 | | | 6,628 | | | 6,420 | | | 4,440 | |
| Other Property, Plant and Equipment | 157 | | | 85 | | | 395 | | | 272 | | | 286 | | | 173 | |
| Total Expenditures | 1,107 | | | 1,506 | | | 4,113 | | | 6,900 | | | 6,706 | | | 4,613 | |
| | | | | | | | | | | | | | | | | | | | | | | | | | |
| EBITDAX and Adjusted EBITDAX | | | | | | | | | |
| In thousands of USD (Unaudited) | | | | | | | | | | |
| 4Q 2020 | | 4Q 2019 | | FY 2020 | | FY 2019 | | | |
| | | | | | | | | | |
| Net Income (Loss) (GAAP) | 337,466 | | | 636,521 | | | (604,572) | | | 2,734,910 | | | | |
| | | | | | | | | | |
| Adjustments: | | | | | | | | | | |
| Interest Expense, Net | 53,121 | | | 40,695 | | | 205,266 | | | 185,129 | | | | |
| Income Tax Provision (Benefit) | 90,294 | | | 194,687 | | | (134,482) | | | 810,357 | | | | |
| Depreciation, Depletion and Amortization | 870,564 | | | 959,208 | | | 3,400,353 | | | 3,749,704 | | | | |
| Exploration Costs | 40,415 | | | 36,495 | | | 145,788 | | | 139,881 | | | | |
| Dry Hole Costs | 20 | | | — | | | 13,083 | | | 28,001 | | | | |
| Impairments | 142,440 | | | 228,135 | | | 2,099,780 | | | 517,896 | | | | |
| EBITDAX (Non-GAAP) | 1,534,320 | | | 2,095,741 | | | 5,125,216 | | | 8,165,878 | | | | |
| (Gains) Losses on MTM Commodity Derivative Contracts | (69,304) | | | 62,347 | | | (1,144,737) | | | (180,275) | | | | |
| Net Cash Received from Settlements of Commodity Derivative Contracts | 71,753 | | | 91,521 | | | 1,070,647 | | | 231,229 | | | | |
| (Gains) Losses on Asset Dispositions, Net | 5,600 | | | (119,963) | | | 46,883 | | | (123,613) | | | | |
| | | | | | | | | | |
| Adjusted EBITDAX (Non-GAAP) | 1,542,369 | | | 2,129,646 | | | 5,098,009 | | | 8,093,219 | | | | |
| | | | | | | | | | |
| Adjusted EBITDAX (Non-GAAP) - Percentage Decrease | -28 | % | | | | -37 | % | | | | | |
| | | | | | | | | | |
| Definitions | | | | | | | | | | |
| EBITDAX - Earnings Before Interest Expense, Net; Income Tax Provision (Benefit); Depreciation, Depletion and Amortization; Exploration Costs; Dry Hole Costs; and Impairments | | | |
| | | | | | | | | | | | | | | | | | | | | | | |
| Net Debt-to-Total Capitalization Ratio | | | | | | |
| In millions of USD, except ratio data (Unaudited) | | | | | | | |
| December 31,
2020 | | September 30,
2020 | | June 30,
2020 | | March 31,
2020 |
| | | | | | | |
| Total Stockholders' Equity - (a) | 20,302 | | | 20,148 | | | 20,388 | | | 21,471 | |
| | | | | | | |
| Current and Long-Term Debt (GAAP) - (b) | 5,816 | | | 5,721 | | | 5,724 | | | 5,222 | |
| Less: Cash | (3,329) | | | (3,066) | | | (2,417) | | | (2,907) | |
| Net Debt (Non-GAAP) - (c) | 2,487 | | | 2,655 | | | 3,307 | | | 2,315 | |
| | | | | | | |
| Total Capitalization (GAAP) - (a) + (b) | 26,118 | | | 25,869 | | | 26,112 | | | 26,693 | |
| | | | | | | |
| Total Capitalization (Non-GAAP) - (a) + (c) | 22,789 | | | 22,803 | | | 23,695 | | | 23,786 | |
| | | | | | | |
| Debt-to-Total Capitalization (GAAP) - (b) / [(a) + (b)] | 22.3 | % | | 22.1 | % | | 21.9 | % | | 19.6 | % |
| | | | | | | |
| Net Debt-to-Total Capitalization (Non-GAAP) - (c) / [(a) + (c)] | 10.9 | % | | 11.6 | % | | 14.0 | % | | 9.7 | % |
| | | | | | | | | | | | | | | | | | | | | | | |
| Net Debt-to-Total Capitalization Ratio | | | | |
| In millions of USD, except ratio data (Unaudited) | | | | | | | |
| December 31, 2019 | | September 30, 2019 | | June 30,
2019 | | March 31,
2019 |
| | | | | | | |
| Total Stockholders' Equity - (a) | 21,641 | | | 21,124 | | | 20,630 | | | 19,904 | |
| | | | | | | |
| Current and Long-Term Debt (GAAP) - (b) | 5,175 | | | 5,177 | | | 5,179 | | | 6,081 | |
| Less: Cash | (2,028) | | | (1,583) | | | (1,160) | | | (1,136) | |
| Net Debt (Non-GAAP) - (c) | 3,147 | | | 3,594 | | | 4,019 | | | 4,945 | |
| | | | | | | |
| Total Capitalization (GAAP) - (a) + (b) | 26,816 | | | 26,301 | | | 25,809 | | | 25,985 | |
| | | | | | | |
| Total Capitalization (Non-GAAP) - (a) + (c) | 24,788 | | | 24,718 | | | 24,649 | | | 24,849 | |
| | | | | | | |
| Debt-to-Total Capitalization (GAAP) - (b) / [(a) + (b)] | 19.3 | % | | 19.7 | % | | 20.1 | % | | 23.4 | % |
| | | | | | | |
| Net Debt-to-Total Capitalization (Non-GAAP) - (c) / [(a) + (c)] | 12.7 | % | | 14.5 | % | | 16.3 | % | | 19.9 | % |
| | | | | | | | | | | | | | | | | | | | | | | | | |
| Net Debt-to-Total Capitalization Ratio | | | | | | |
| In millions of USD, except ratio data (Unaudited) | | | | | | | | |
| December 31,
2018 | | September 30,
2018 | | June 30,
2018 | | March 31,
2018 | | |
| | | | | | | | |
| Total Stockholders' Equity - (a) | 19,364 | | | 18,538 | | | 17,452 | | | 16,841 | | | |
| | | | | | | | | |
| Current and Long-Term Debt (GAAP) - (b) | 6,083 | | | 6,435 | | | 6,435 | | | 6,435 | | | |
| Less: Cash | (1,556) | | | (1,274) | | | (1,008) | | | (816) | | | |
| Net Debt (Non-GAAP) - (c) | 4,527 | | | 5,161 | | | 5,427 | | | 5,619 | | | |
| | | | | | | | | |
| Total Capitalization (GAAP) - (a) + (b) | 25,447 | | | 24,973 | | | 23,887 | | | 23,276 | | | |
| | | | | | | | | |
| Total Capitalization (Non-GAAP) - (a) + (c) | 23,891 | | | 23,699 | | | 22,879 | | | 22,460 | | | |
| | | | | | | | | |
| Debt-to-Total Capitalization (GAAP) - (b) / [(a) + (b)] | 23.9 | % | | 25.8 | % | | 26.9 | % | | 27.6 | % | | |
| | | | | | | | | |
| Net Debt-to-Total Capitalization (Non-GAAP) - (c) / [(a) + (c)] | 18.9 | % | | 21.8 | % | | 23.7 | % | | 25.0 | % | | |
| | | | | | | | | | | | | | | | | | | | | | | | | |
| Net Debt-to-Total Capitalization Ratio | | | | | | |
| In millions of USD, except ratio data (Unaudited) | | | | | | | | |
| December 31,
2017 | | September 30,
2017 | | June 30,
2017 | | March 31,
2017 | | |
| | | | | | | | |
| Total Stockholders' Equity - (a) | 16,283 | | | 13,922 | | | 13,902 | | | 13,928 | | | |
| | | | | | | | | |
| Current and Long-Term Debt (GAAP) - (b) | 6,387 | | | 6,387 | | | 6,987 | | | 6,987 | | | |
| Less: Cash | (834) | | | (846) | | | (1,649) | | | (1,547) | | | |
| Net Debt (Non-GAAP) - (c) | 5,553 | | | 5,541 | | | 5,338 | | | 5,440 | | | |
| | | | | | | | | |
| Total Capitalization (GAAP) - (a) + (b) | 22,670 | | | 20,309 | | | 20,889 | | | 20,915 | | | |
| | | | | | | | | |
| Total Capitalization (Non-GAAP) - (a) + (c) | 21,836 | | | 19,463 | | | 19,240 | | | 19,368 | | | |
| | | | | | | | | |
| Debt-to-Total Capitalization (GAAP) - (b) / [(a) + (b)] | 28.2 | % | | 31.4 | % | | 33.4 | % | | 33.4 | % | | |
| | | | | | | | | |
| Net Debt-to-Total Capitalization (Non-GAAP) - (c) / [(a) + (c)] | 25.4 | % | | 28.5 | % | | 27.7 | % | | 28.1 | % | | |
| | | | | | | | | | | | | | | | | | | | | | | | | | | | | | | |
| Net Debt-to-Total Capitalization Ratio | | | | |
| In millions of USD, except ratio data (Unaudited) | | | | | | | | | | |
| December 31, 2016 | | September 30, 2016 | | June 30,
2016 | | March 31,
2016 | | December 31,
2015 | | |
| | | | | | | | | | |
| Total Stockholders' Equity - (a) | 13,982 | | | 11,798 | | | 12,057 | | | 12,405 | | | 12,943 | | | |
| | | | | | | | | | | |
| Current and Long-Term Debt (GAAP) - (b) | 6,986 | | | 6,986 | | | 6,986 | | | 6,986 | | | 6,660 | | | |
| Less: Cash | (1,600) | | | (1,049) | | | (780) | | | (668) | | | (719) | | | |
| Net Debt (Non-GAAP) - (c) | 5,386 | | | 5,937 | | | 6,206 | | | 6,318 | | | 5,941 | | | |
| | | | | | | | | | | |
| Total Capitalization (GAAP) - (a) + (b) | 20,968 | | | 18,784 | | | 19,043 | | | 19,391 | | | 19,603 | | | |
| | | | | | | | | | | |
| Total Capitalization (Non-GAAP) - (a) + (c) | 19,368 | | | 17,735 | | | 18,263 | | | 18,723 | | | 18,884 | | | |
| | | | | | | | | | | |
| Debt-to-Total Capitalization (GAAP) - (b) / [(a) + (b)] | 33.3 | % | | 37.2 | % | | 36.7 | % | | 36.0 | % | | 34.0 | % | | |
| | | | | | | | | | | |
| Net Debt-to-Total Capitalization (Non-GAAP) - (c) / [(a) + (c)] | 27.8 | % | | 33.5 | % | | 34.0 | % | | 33.7 | % | | 31.5 | % | | |
| | | | | | | | | | | | | | | | | | | | | | | |
| Proved Reserves and Reserve Replacement Data | | |
| (Unaudited) |
| | | | | | | |
| 2020 Net Proved Reserves Reconciliation Summary | United
States | | Trinidad | | Other
International | | Total |
| Crude Oil and Condensate (MMBbl) | | | | | | | |
| Beginning Reserves | 1,694.0 | | | 0.3 | | | 0.1 | | | 1,694.4 | |
| Revisions | (225.4) | | | — | | | — | | | (225.4) | |
| Purchases in Place | 2.2 | | | — | | | — | | | 2.2 | |
| Extensions, Discoveries and Other Additions | 194.7 | | | 0.9 | | | — | | | 195.6 | |
| Sales in Place | (3.2) | | | — | | | — | | | (3.2) | |
| Production | (149.4) | | | (0.4) | | | — | | | (149.8) | |
| Ending Reserves | 1,512.9 | | | 0.8 | | | 0.1 | | | 1,513.8 | |
| | | | | | | |
| Natural Gas Liquids (MMBbl) | | | | | | | |
| Beginning Reserves | 739.7 | | | — | | | — | | | 739.7 | |
| Revisions | (59.8) | | | — | | | — | | | (59.8) | |
| Purchases in Place | 3.8 | | | — | | | — | | | 3.8 | |
| Extensions, Discoveries and Other Additions | 180.2 | | | — | | | — | | | 180.2 | |
| Sales in Place | (1.4) | | | — | | | — | | | (1.4) | |
| Production | (49.8) | | | — | | | — | | | (49.8) | |
| Ending Reserves | 812.7 | | | — | | | — | | | 812.7 | |
| | | | | | | |
| Natural Gas (Bcf) | | | | | | | |
| Beginning Reserves | 5,034.8 | | | 276.1 | | | 58.8 | | | 5,369.7 | |
| Revisions | (497.7) | | | 4.8 | | | 1.6 | | | (491.3) | |
| Purchases in Place | 26.3 | | | — | | | — | | | 26.3 | |
| Extensions, Discoveries and Other Additions | 1,077.9 | | | 53.9 | | | — | | | 1,131.8 | |
| Sales in Place | (157.3) | | | — | | | — | | | (157.3) | |
| Production | (441.4) | | | (65.9) | | | (11.6) | | | (518.9) | |
| Ending Reserves | 5,042.6 | | | 268.9 | | | 48.8 | | | 5,360.3 | |
| | | | | | | |
| Oil Equivalents (MMBoe) | | | | | | | |
| Beginning Reserves | 3,272.8 | | | 46.3 | | | 10.0 | | | 3,329.1 | |
| Revisions | (368.1) | | | 0.8 | | | 0.2 | | | (367.1) | |
| Purchases in Place | 10.4 | | | — | | | — | | | 10.4 | |
| Extensions, Discoveries and Other Additions | 554.6 | | | 9.8 | | | — | | | 564.4 | |
| Sales in Place | (30.8) | | | — | | | — | | | (30.8) | |
| Production | (272.8) | | | (11.3) | | | (2.0) | | | (286.1) | |
| Ending Reserves | 3,166.1 | | | 45.6 | | | 8.2 | | | 3,219.9 | |
| | | | | | | |
| Net Proved Developed Reserves (MMBoe) | | | | | | | |
| At December 31, 2019 | 1,684.2 | | | 29.9 | | | 7.1 | | | 1,721.2 | |
| At December 31, 2020 | 1,614.4 | | | 29.3 | | | 5.4 | | | 1,649.1 | |
| | | | | | | |
| 2020 Exploration and Development Expenditures ($ Millions) |
| | | | | | | |
| Acquisition Cost of Unproved Properties | 264.8 | | | — | | | — | | | 264.8 | |
| Exploration Costs | 203.4 | | | 81.2 | | | 11.4 | | | 296.0 | |
| Development Costs | 2,901.0 | | | 3.9 | | | — | | | 2,904.9 | |
| Total Drilling | 3,369.2 | | | 85.1 | | | 11.4 | | | 3,465.7 | |
| Acquisition Cost of Proved Properties | 97.0 | | | — | | | 38.2 | | | 135.2 | |
| Asset Retirement Costs | 97.2 | | | 0.2 | | | 19.9 | | | 117.3 | |
| Total Exploration and Development Expenditures | 3,563.4 | | | 85.3 | | | 69.5 | | | 3,718.2 | |
| Gathering, Processing and Other | 394.9 | | | 0.1 | | | 0.1 | | | 395.1 | |
| Total Expenditures | 3,958.3 | | | 85.4 | | | 69.6 | | | 4,113.3 | |
| Proceeds from Sales in Place | (191.9) | | | — | | | — | | | (191.9) | |
| Net Expenditures | 3,766.4 | | | 85.4 | | | 69.6 | | | 3,921.4 | |
| | | | | | | |
| Reserve Replacement Costs ($ / Boe) * | | | | | | | |
| All-in Total, Net of Revisions | 16.53 | | | 8.03 | | | 248.00 | | | 16.32 | |
| All-in Total, Excluding Revisions Due to Price | 6.85 | | | 8.03 | | | 248.00 | | | 6.98 | |
| | | | | | | |
| Reserve Replacement * | | | | | | | |
| Drilling Only | 203 | % | | 87 | % | | 0 | % | | 197 | % |
| All-in Total, Net of Revisions and Dispositions | 61 | % | | 94 | % | | 10 | % | | 62 | % |
| All-in Total, Excluding Revisions Due to Price | 163 | % | | 94 | % | | 10 | % | | 159 | % |
| All-in Total, Liquids | 46 | % | | 225 | % | | 0 | % | | 46 | % |
| | | | | | | |
| * See following reconciliation schedule for calculation methodology |
| | | | | | | | | | | | | | | | | | | | | | | |
Reserve Replacement Cost Data | | |
| (Unaudited; in millions, except ratio data) | | | | | | | |
|
| For the Twelve Months Ended December 31, 2020 | United
States | | Trinidad | | Other
International | | Total |
| | | | | | | |
| Total Costs Incurred in Exploration and Development Activities (GAAP) | 3,563.4 | | | 85.3 | | | 69.5 | | | 3,718.2 | |
| Less: Asset Retirement Costs | (97.2) | | | (0.2) | | | (19.9) | | | (117.3) | |
| Non-Cash Acquisition Costs of Unproved Properties | (196.8) | | | — | | | — | | | (196.8) | |
| Total Acquisition Costs of Proved Properties | (97.0) | | | — | | | (38.2) | | | (135.2) | |
| Total Exploration and Development Expenditures for Drilling Only (Non-GAAP) - (a) | 3,172.4 | | | 85.1 | | | 11.4 | | | 3,268.9 | |
| | | | | | | |
| Total Costs Incurred in Exploration and Development Activities (GAAP) | 3,563.4 | | | 85.3 | | | 69.5 | | | 3,718.2 | |
| Less: Asset Retirement Costs | (97.2) | | | (0.2) | | | (19.9) | | | (117.3) | |
| Non-Cash Acquisition Costs of Unproved Properties | (196.8) | | | — | | | — | | | (196.8) | |
| Non-Cash Acquisition Costs of Proved Properties | (14.6) | | | — | | | — | | | (14.6) | |
| Total Exploration and Development Expenditures (Non-GAAP) - (b) | 3,254.8 | | | 85.1 | | | 49.6 | | | 3,389.5 | |
| | | | | | | |
| Total Expenditures (GAAP) | 3,958.3 | | | 85.4 | | | 69.6 | | | 4,113.3 | |
| Less: Asset Retirement Costs | (97.2) | | | (0.2) | | | (19.9) | | | (117.3) | |
| Non-Cash Acquisition Costs of Unproved Properties | (196.8) | | | — | | | — | | | (196.8) | |
| Non-Cash Acquisition Costs of Proved Properties | (14.6) | | | — | | | — | | | (14.6) | |
| Non-Cash Capital - Other Miscellaneous | (173.9) | | | — | | | — | | | (173.9) | |
| Total Cash Expenditures (Non-GAAP) | 3,475.8 | | | 85.2 | | | 49.7 | | | 3,610.7 | |
| | | | | | | |
| Net Proved Reserve Additions From All Sources - Oil Equivalents (MMBoe) | | | | | | | |
| Revisions Due to Price - (c) | (278.2) | | | — | | | — | | | (278.2) | |
| Revisions Other Than Price | (89.9) | | | 0.8 | | | 0.2 | | | (88.9) | |
| Purchases in Place | 10.4 | | | — | | | — | | | 10.4 | |
| Extensions, Discoveries and Other Additions - (d) | 554.6 | | | 9.8 | | | — | | | 564.4 | |
| Total Proved Reserve Additions - (e) | 196.9 | | | 10.6 | | | 0.2 | | | 207.7 | |
| Sales in Place | (30.8) | | | — | | | — | | | (30.8) | |
| Net Proved Reserve Additions From All Sources - (f) | 166.1 | | | 10.6 | | | 0.2 | | | 176.9 | |
| | | | | | | |
| Production - (g) | 272.8 | | | 11.3 | | | 2.0 | | | 286.1 | |
| | | | | | | |
| Reserve Replacement Costs ($ / Boe) | | | | | | | |
| Total Drilling, Before Revisions - (a / d) | 5.72 | | | 8.68 | | | — | | | 5.79 | |
| All-in Total, Net of Revisions - (b / e) | 16.53 | | | 8.03 | | | 248.00 | | | 16.32 | |
| All-in Total, Excluding Revisions Due to Price - (b / (e - c)) | 6.85 | | | 8.03 | | | 248.00 | | | 6.98 | |
| | | | | | | |
| Reserve Replacement | | | | | | | |
| Drilling Only - (d / g) | 203 | % | | 87 | % | | 0 | % | | 197 | % |
| All-in Total, Net of Revisions and Dispositions - (f / g) | 61 | % | | 94 | % | | 10 | % | | 62 | % |
| All-in Total, Excluding Revisions Due to Price - ((f - c) / g) | 163 | % | | 94 | % | | 10 | % | | 159 | % |
| | | | | | | |
| Net Proved Reserve Additions From All Sources - Liquids (MMBbl) | | | | | | | |
| Revisions | (285.2) | | | — | | | — | | | (285.2) | |
| Purchases in Place | 6.0 | | | — | | | — | | | 6.0 | |
| Extensions, Discoveries and Other Additions - (h) | 374.9 | | | 0.9 | | | — | | | 375.8 | |
| Total Proved Reserve Additions | 95.7 | | | 0.9 | | | — | | | 96.6 | |
| Sales in Place | (4.6) | | | — | | | — | | | (4.6) | |
| Net Proved Reserve Additions From All Sources - (i) | 91.1 | | | 0.9 | | | — | | | 92.0 | |
| | | | | | | |
| Production - (j) | 199.2 | | | 0.4 | | | — | | | 199.6 | |
| | | | | | | |
| Reserve Replacement - Liquids | | | | | | | |
| Drilling Only - (h / j) | 188 | % | | 225 | % | | 0 | % | | 188 | % |
| All-in Total, Net of Revisions and Dispositions - (i / j) | 46 | % | | 225 | % | | 0 | % | | 46 | % |
| | | | | |
| Reserve Replacement Cost Data | |
| (Unaudited; in millions, except ratio data) | |
| |
| For the Twelve Months Ended December 31, 2020 | |
| |
| Proved Developed Reserve Replacement Costs ($ / Boe) | Total |
| Total Costs Incurred in Exploration and Development Activities (GAAP) | 3,718.2 | |
| Less: Asset Retirement Costs | (117.3) | |
| Acquisition Costs of Unproved Properties | (264.8) | |
| Acquisition Costs of Proved Properties | (135.2) | |
| Drillbit Exploration and Development Expenditures (Non-GAAP) - (k) | 3,200.9 | |
| |
| Total Proved Reserves - Extensions, Discoveries and Other Additions (MMBoe) | 564.4 | |
| Add: Conversion of Proved Undeveloped Reserves to Proved Developed | 212.2 | |
| Less: Proved Undeveloped Extensions and Discoveries | (456.1) | |
| Proved Developed Reserves - Extensions and Discoveries (MMBoe) | 320.5 | |
| |
| Total Proved Reserves - Revisions (MMBoe) | (367.1) | |
| Less: Proved Undeveloped Reserves - Revisions | 277.3 | |
| Proved Developed - Revisions Due to Price | 201.0 | |
| Proved Developed Reserves - Revisions Other Than Price (MMBoe) | 111.2 | |
| |
| Proved Developed Reserves - Extensions and Discoveries Plus Revisions Other Than Price (MMBoe) - (l) | 431.7 | |
| |
| Proved Developed Reserve Replacement Costs Excluding Revisions Due to Price ($ / Boe) - (k / l) | 7.41 | |
| | | | | | | | | | | | | | | | | | | | | | | | | | | | | | | | | | | | | | | | | |
| Reserve Replacement Cost Data | | | | | |
| In millions of USD, except reserves and ratio data (Unaudited) | | | | | | |
| | | | | | | | | | | | | |
| 2020 | | 2019 | | 2018 | | 2017 | | 2016 | | 2015 | | 2014 |
| | | | | | | | | | | | | |
| Total Costs Incurred in Exploration and Development Activities (GAAP) | 3,718.2 | | | 6,628.2 | | | 6,419.7 | | | 4,439.4 | | | 6,445.2 | | | 4,928.3 | | | 7,904.8 | |
| Less: Asset Retirement Costs | (117.3) | | | (186.1) | | | (69.7) | | | (55.6) | | | 19.9 | | | (53.5) | | | (195.6) | |
| Non-Cash Acquisition Costs of Unproved Properties | (196.8) | | | (97.7) | | | (290.5) | | | (255.7) | | | (3,101.8) | | | — | | | — | |
| Acquisition Costs of Proved Properties | (135.2) | | | (379.9) | | | (123.7) | | | (72.6) | | | (749.0) | | | (480.6) | | | (139.1) | |
| Total Exploration and Development Expenditures for Drilling Only (Non-GAAP) - (a) | 3,268.9 | | | 5,964.5 | | | 5,935.8 | | | 4,055.5 | | | 2,614.3 | | | 4,394.2 | | | 7,570.1 | |
| | | | | | | | | | | | | |
| Total Costs Incurred in Exploration and Development Activities (GAAP) | 3,718.2 | | | 6,628.2 | | | 6,419.7 | | | 4,439.4 | | | 6,445.2 | | | 4,928.3 | | | 7,904.8 | |
| Less: Asset Retirement Costs | (117.3) | | | (186.1) | | | (69.7) | | | (55.6) | | | 19.9 | | | (53.5) | | | (195.6) | |
| Non-Cash Acquisition Costs of Unproved Properties | (196.8) | | | (97.7) | | | (290.5) | | | (255.7) | | | (3,101.8) | | | — | | | — | |
| Non-Cash Acquisition Costs of Proved Properties | (14.6) | | | (52.3) | | | (70.9) | | | (26.2) | | | (732.3) | | | — | | | — | |
| Total Exploration and Development Expenditures (Non-GAAP) - (b) | 3,389.5 | | | 6,292.1 | | | 5,988.6 | | | 4,101.9 | | | 2,631.0 | | | 4,874.8 | | | 7,709.2 | |
| | | | | | | | | | | | | |
| Net Proved Reserve Additions From All Sources - Oil Equivalents (MMBoe) | | | | | | | | | | | | | |
| Revisions Due to Price - (c) | (278.2) | | | (59.7) | | | 34.8 | | | 154.0 | | | (100.7) | | | (573.8) | | | 52.2 | |
| Revisions Other Than Price | (88.9) | | | (0.3) | | | (39.5) | | | 48.0 | | | 252.9 | | | 107.2 | | | 48.4 | |
| Purchases in Place | 10.4 | | | 16.8 | | | 11.6 | | | 2.3 | | | 42.3 | | | 56.2 | | | 14.4 | |
| Extensions, Discoveries and Other Additions - (d) | 564.4 | | | 750.0 | | | 669.7 | | | 420.8 | | | 209.0 | | | 245.9 | | | 519.2 | |
| Total Proved Reserve Additions - (e) | 207.7 | | | 706.8 | | | 676.6 | | | 625.1 | | | 403.5 | | | (164.5) | | | 634.2 | |
| Sales in Place | (30.8) | | | (4.6) | | | (10.8) | | | (20.7) | | | (167.6) | | | (3.5) | | | (36.3) | |
| Net Proved Reserve Additions From All Sources | 176.9 | | | 702.2 | | | 665.8 | | | 604.4 | | | 235.9 | | | (168.0) | | | 597.9 | |
| | | | | | | | | | | | | |
| Production | 286.1 | | | 300.9 | | | 265.0 | | | 224.4 | | | 207.1 | | | 211.2 | | | 219.1 | |
| | | | | | | | | | | | | |
| Reserve Replacement Costs ($ / Boe) | | | | | | | | | | | | | |
| Total Drilling, Before Revisions - (a / d) | 5.79 | | | 7.95 | | | 8.86 | | | 9.64 | | | 12.51 | | | 17.87 | | | 14.58 | |
| All-in Total, Net of Revisions - (b / e) | 16.32 | | | 8.90 | | | 8.85 | | | 6.56 | | | 6.52 | | | (29.63) | | | 12.16 | |
| All-in Total, Excluding Revisions Due to Price - (b / ( e - c)) | 6.98 | | | 8.21 | | | 9.33 | | | 8.71 | | | 5.22 | | | 11.91 | | | 13.25 | |
| | | | | |
| Definitions | |
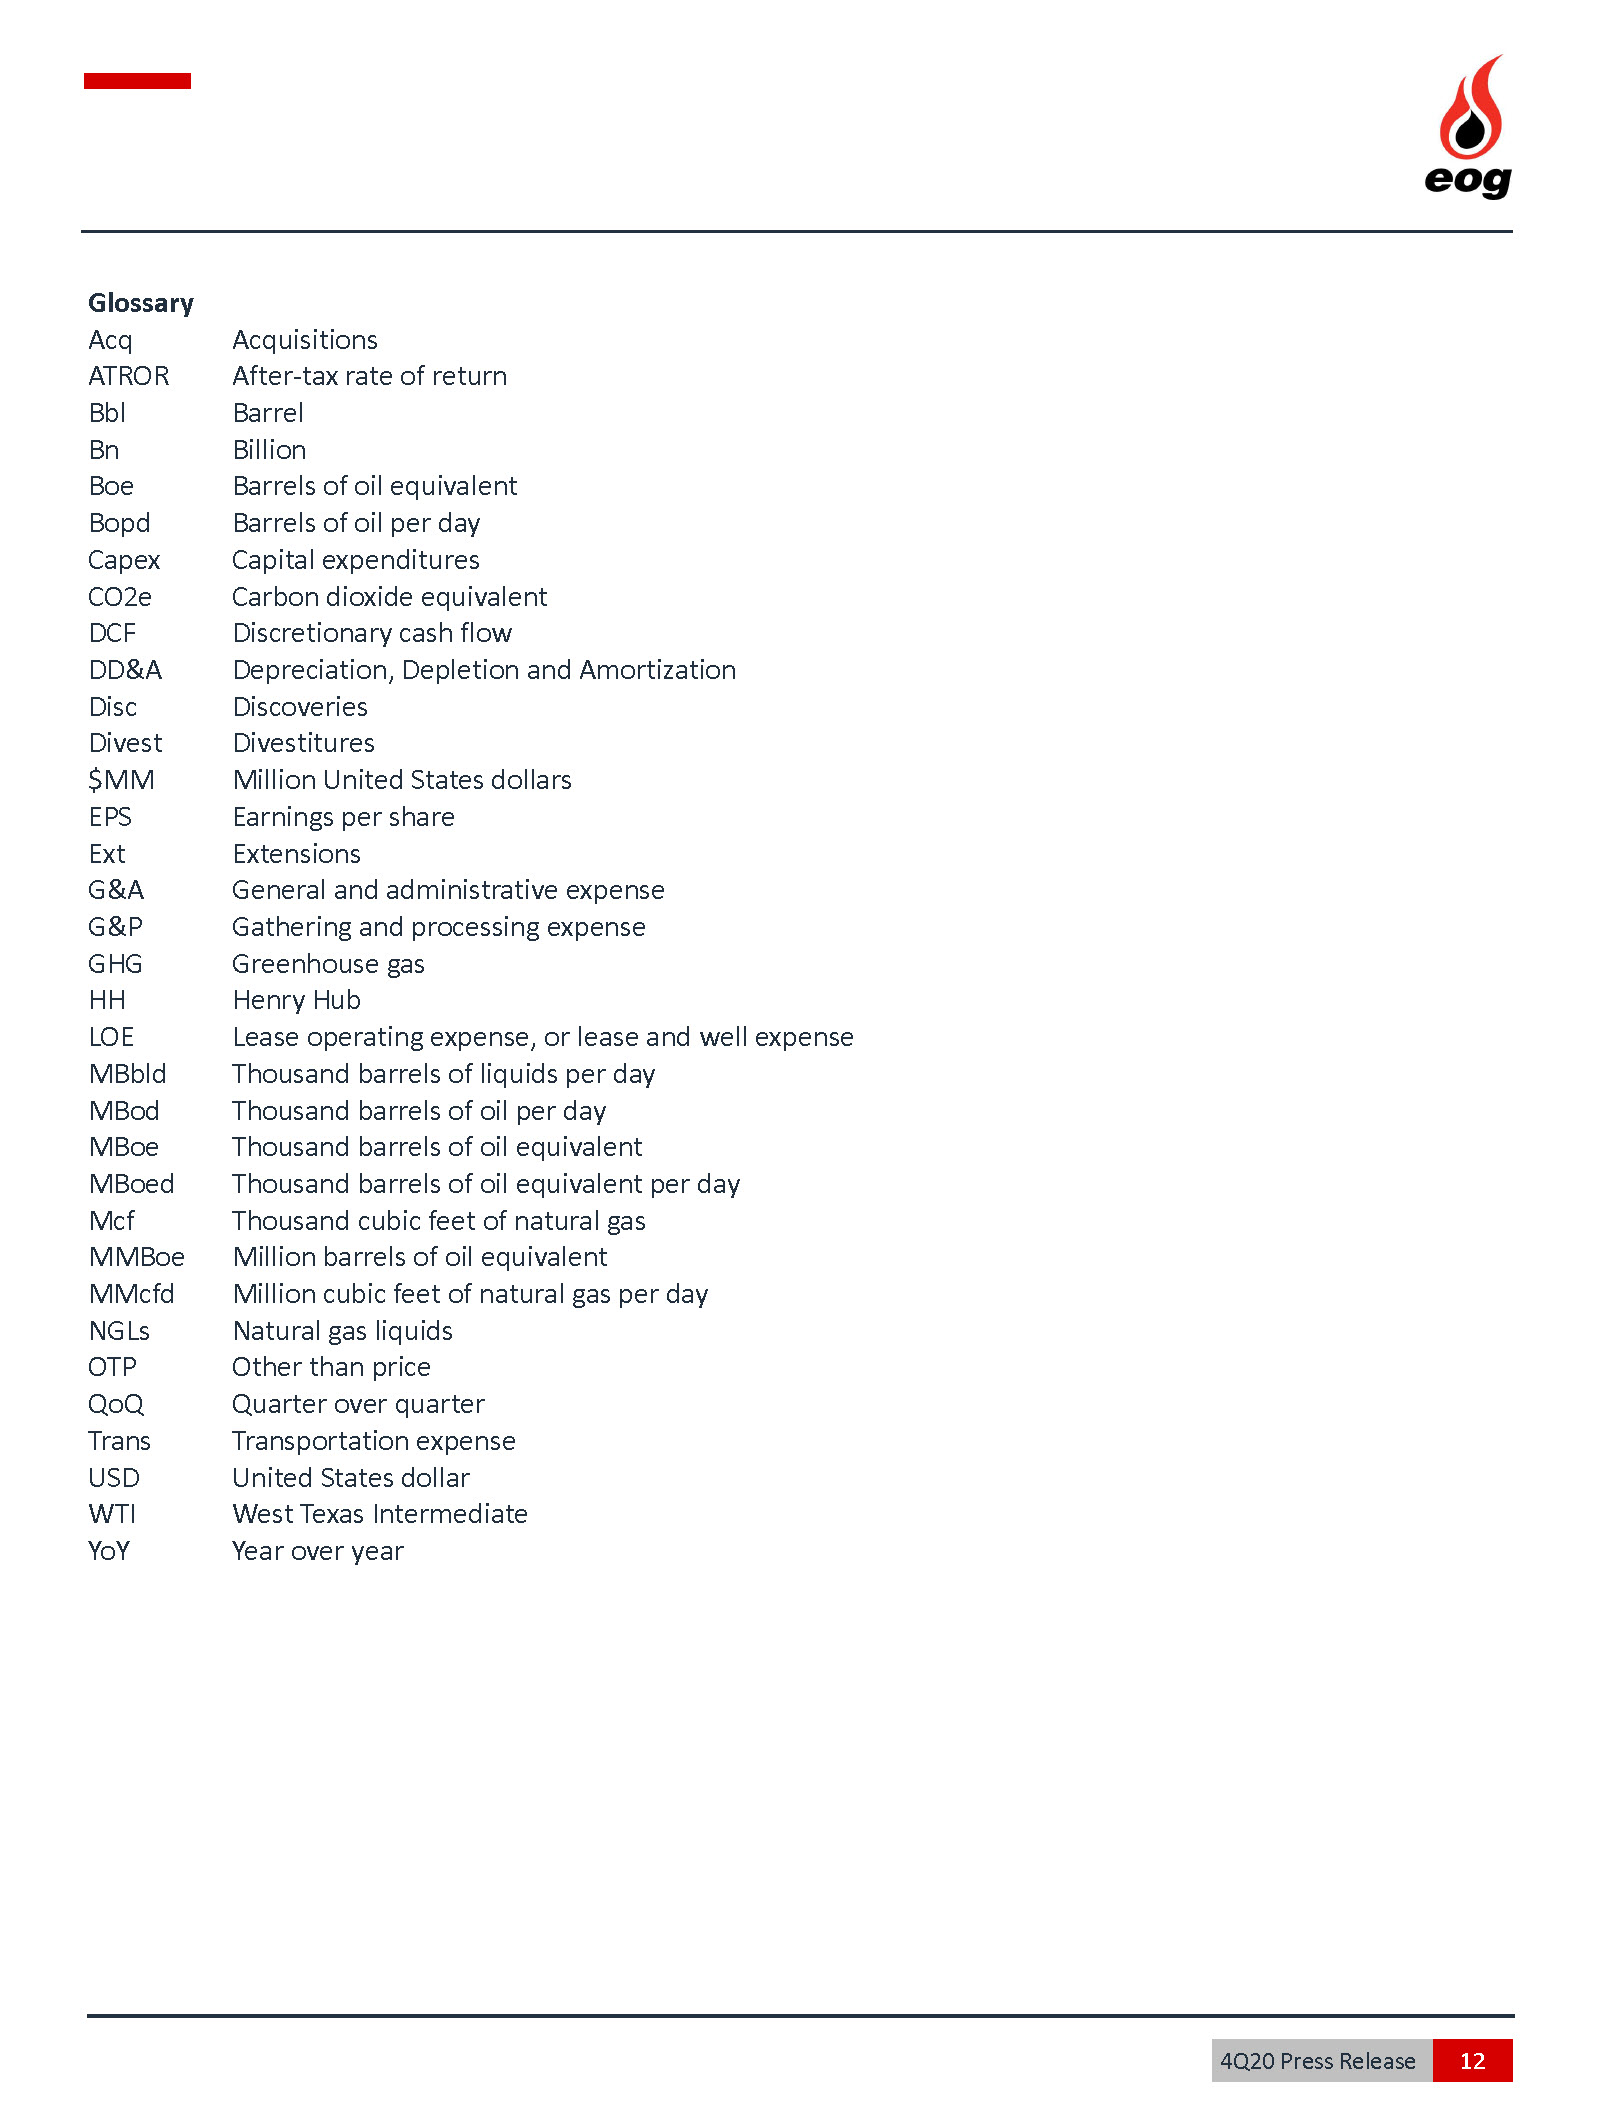
| $/Boe | U.S. Dollars per barrel of oil equivalent |
| MMBoe | Million barrels of oil equivalent |
| | | | | | | | | | | | | | |
| Financial Commodity Derivative Contracts | |
| | | | |
| EOG accounts for financial commodity derivative contracts using the mark-to-market accounting method. |
|
| | | | | | | | | | | | | | |
| ICE Brent Differential Basis Swap Contracts |
| Prices received by EOG for its crude oil production generally vary from NYMEX WTI prices due to adjustments for delivery location (basis) and other factors. EOG has entered into crude oil basis swap contracts in order to fix the differential between ICE Brent pricing and pricing in Cushing, Oklahoma (ICE Brent Differential). Presented below is a comprehensive summary of EOG's ICE Brent Differential basis swap contracts through February 18, 2021. The weighted average price differential expressed in $/Bbl represents the amount of addition to Cushing, Oklahoma, prices for the notional volumes expressed in Bbld covered by the basis swap contracts. |
| | | | |
| 2020 | | Volume (Bbld) | | Weighted Average Price Differential
($/Bbl) |
|
|
| May 2020 (CLOSED) | | 10,000 | | | 4.92 | |
| | | | | | | | | | | | | | |
| Houston Differential Basis Swap Contracts |
| EOG has also entered into crude oil basis swap contracts in order to fix the differential between pricing in Houston, Texas, and Cushing, Oklahoma (Houston Differential). Presented below is a comprehensive summary of EOG's Houston Differential basis swap contracts through February 18, 2021. The weighted average price differential expressed in $/Bbl represents the amount of addition to Cushing, Oklahoma, prices for the notional volumes expressed in Bbld covered by the basis swap contracts. |
| | | | |
| 2020 | | Volume (Bbld) | | Weighted Average Price Differential
($/Bbl) |
|
|
| May 2020 (CLOSED) | | 10,000 | | | 1.55 | |
| | | | | | | | | | | | | | |
| Roll Differential Basis Swap Contracts |
| EOG has also entered into crude oil swaps in order to fix the differential in pricing between the NYMEX calendar month average and the physical crude oil delivery month (Roll Differential). Presented below is a comprehensive summary of EOG's Roll Differential basis swap contracts through February 18, 2021. The weighted average price differential expressed in $/Bbl represents the amount of net addition (reduction) to delivery month prices for the notional volumes expressed in Bbld covered by the swap contracts. |
| | | | |
| 2020 | | Volume (Bbld) | | Weighted Average Price Differential
($/Bbl) |
|
|
| February 1, 2020 through June 30, 2020 (CLOSED) | | 10,000 | | | 0.70 | |
| July 1, 2020 through September 30, 2020 (CLOSED) | | 88,000 | | | (1.16) | |
| October 1, 2020 through December 31, 2020 (CLOSED) | | 66,000 | | | (1.16) | |
| | | | |
| 2021 | | | | |
| February 2021 (CLOSED) | | 30,000 | | | 0.11 | |
| March 1, 2021 through December 31, 2021 | | 125,000 | | | 0.17 | |
| | | | |
| 2022 | | | | |
| January 1, 2022 through December 31, 2022 | | 125,000 | | | 0.15 | |
| | | | | | | | | | | | | | |
| In May 2020, EOG entered into crude oil Roll Differential basis swap contracts for the period from July 1, 2020 through September 30, 2020, with notional volumes of 22,000 Bbld at a weighted average price differential of $(0.43) per Bbl, and for the period from October 1, 2020 through December 31, 2020, with notional volumes of 44,000 Bbld at a weighted average price differential of $(0.73) per Bbl. These contracts partially offset certain outstanding Roll Differential basis swap contracts for the same time periods and volumes at a weighted average price differential of $(1.16) per Bbl. EOG paid net cash of $3.2 million for the settlement of these contracts. The offsetting contracts were excluded from the above table. |
| | | | |
| | | | | | | | | | | | | | |
| Crude Oil NYMEX WTI Price Swap Contracts |
| Presented below is a comprehensive summary of EOG's crude oil NYMEX WTI price swap contracts through February 18, 2021, with notional volumes expressed in Bbld and prices expressed in $/Bbl. |
| | | | |
| 2020 | | Volume (Bbld) | | Weighted Average Price ($/Bbl) |
|
|
| January 1, 2020 through March 31, 2020 (CLOSED) | | 200,000 | | | 59.33 | |
| April 1, 2020 through May 31, 2020 (CLOSED) | | 265,000 | | | 51.36 | |
| | | | |
| 2021 | | | | |
| January 2021 (CLOSED) | | 151,000 | | | 50.06 | |
| February 1, 2021 through March 31, 2021 | | 201,000 | | | 51.29 | |
| April 1, 2021 through June 30, 2021 | | 150,000 | | | 51.68 | |
| July 1, 2021 through September 30, 2021 | | 150,000 | | | 52.71 | |
| | | | |
| In April and May 2020, EOG entered into crude oil NYMEX WTI price swap contracts for the period from June 1, 2020 through June 30, 2020, with notional volumes of 265,000 Bbld at a weighted average price of $33.80 per Bbl, for the period from July 1, 2020 through July 31, 2020, with notional volumes of 254,000 Bbld at a weighted average price of $33.75 per Bbl, for the period from August 1, 2020 through September 30, 2020, with notional volumes of 154,000 Bbld at a weighted average price of $34.18 per Bbl and for the period from October 1, 2020 through December 31, 2020, with notional volumes of 47,000 Bbld at a weighted average price of $30.04 per Bbl. These contracts offset the remaining crude oil NYMEX WTI price swap contracts for the same time periods and volumes at a weighted average price of $51.36 per Bbl for the period from June 1, 2020 through June 30, 2020, $42.36 per Bbl for the period from July 1, 2020 through July 31, 2020, $50.42 per Bbl for the period from August 1, 2020 through September 30, 2020 and $31.00 per Bbl for the period from October 1, 2020 through December 31, 2020. EOG received net cash of $364.0 million for the settlement of these contracts. The offsetting contracts were excluded from the above table. |
| | | | | | | | | | | | | | |
| Crude Oil ICE Brent Price Swap Contracts |
| Presented below is a comprehensive summary of EOG's crude oil ICE Brent price swap contracts through February 18, 2021, with notional volumes expressed in Bbld and prices expressed in $/Bbl. |
| | | | |
| 2020 | | Volume (Bbld) | | Weighted Average Price ($/Bbl) |
|
|
| April 2020 (CLOSED) | | 75,000 | | | 25.66 | |
| May 2020 (CLOSED) | | 35,000 | | | 26.53 | |
| | | | | | | | | | | | | | |
| Mont Belvieu Propane Price Swap Contracts |
| Presented below is a comprehensive summary of EOG's Mont Belvieu propane (non-TET) financial price swap contracts (Mont Belvieu Propane Price Swap Contracts) through February 18, 2021, with notional volumes expressed in Bbld and prices expressed in $/Bbl. |
| | | | |
| 2020 | | Volume (Bbld) | | Weighted Average Price ($/Bbl) |
|
|
| January 1, 2020 through February 29, 2020 (CLOSED) | | 4,000 | | | 21.34 | |
| March 1, 2020 through April 30, 2020 (CLOSED) | | 25,000 | | | 17.92 | |
| | | | |
| 2021 | | | | |
| January 2021 (CLOSED) | | 15,000 | | | 29.44 | |
| February 1, 2021 through December 31, 2020 (CLOSED) | | 15,000 | | | 29.44 | |
| | | | |
| In April and May 2020, EOG entered into Mont Belvieu propane price swap contracts for the period from May 1, 2020 through December 31, 2020, with notional volumes of 25,000 Bbld at a weighted average price of $16.41 per Bbl. These contracts offset the remaining Mont Belvieu propane price swap contracts for the same time period with notional volumes of 25,000 Bbld at a weighted average price of $17.92 per Bbl. EOG received net cash of $9.2 million for the settlement of these contracts. The offsetting contracts were excluded from the above table. |
| | | | | | | | | | | | | | |
| Natural Gas NYMEX Henry Hub Price Swap Contracts |
| Presented below is a comprehensive summary of EOG's natural gas NYMEX Henry Hub price swap contracts through February 18, 2021, with notional volumes sold (purchased) expressed in MMBtud and prices expressed in $/MMBtu. In January 2021, EOG executed the early termination provision granting EOG the right to terminate certain 2022 natural gas NYMEX Henry Hub price swap contracts with notional volumes of 20,000 MMBtud at a weighted average price of $2.75 per MMBtu for the period from January 1, 2022 though December 31, 2022. EOG received net cash of $0.6 million for the settlement of these contracts. |
| | | | |
| 2021 | | Volume (MMBtud) | | Weighted Average Price
($/MMBtu) |
|
|
| April 1, 2021 through September 30, 2021 | | (70,000) | | | 2.64 | |
| | | | |
| 2022 | | | | |
| January 1, 2022 through December 31, 2022 (CLOSED) | | 20,000 | | | 2.75 | |
| | | | |
| In December 2020 and January 2021, EOG entered into natural gas NYMEX Henry Hub price swap contracts for the period from January 1, 2021 through March 31, 2021, with notional volumes of 500,000 MMBtud at a weighted average price of $2.43 per MMBtu and for the period from April 1, 2021 through December 31, 2021, with notional volumes of 500,000 MMBtud at a weighted average price of $2.83 per MMBtu. These contracts offset the remaining natural gas NYMEX Henry Hub price swap contracts for the same time periods with notional volumes of 500,000 MMBtud at a weighted average price of $2.99 per MMBtu. EOG received net cash of $16.5 million through February 18, 2021, for the settlement of certain of these contracts, and expects to receive net cash of $30.3 million during the remainder of 2021 for the settlement of the remaining contracts. The offsetting contracts were excluded from the above table. |
| | | | | | | | | | | | | | |
| Natural Gas JKM Price Swap Contracts |
| Presented below is a comprehensive summary of EOG's natural gas JKM price swap contracts through February 18, 2021, with notional volumes expressed in MMBtud and prices expressed in $/MMBtu. |
| | | | |
| 2021 | | Volume (MMBtud) | | Weighted Average Price
($/MMBtu) |
|
|
| April 1, 2021 through September 30, 2021 | | 70,000 | | | 6.65 | |
| | | | | | | | | | | | | | | | | | | | |
| Natural Gas Collar Contracts |
| EOG has entered into natural gas collar contracts, which establish ceiling and floor prices for the sale of notional volumes of natural gas as specified in the collar contracts. The collars require that EOG pay the difference between the ceiling price and the Henry Hub Index Price in the event the Henry Hub Index Price is above the ceiling price. The collars grant EOG the right to receive the difference between the floor price and the Henry Hub Index Price in the event the Henry Hub Index Price is below the floor price. In March 2020, EOG executed the early termination provision granting EOG the right to terminate certain 2020 natural gas collar contracts with notional volumes of 250,000 MMBtud at a weighted average ceiling price of $2.50 per MMBtu and a weighted average floor price of $2.00 per MMBtu for the period from April 1, 2020 through July 31, 2020. EOG received net cash of $7.8 million for the settlement of these contracts. Presented below is a comprehensive summary of EOG's natural gas collar contracts through February 18, 2021, with notional volumes expressed in MMBtud and prices expressed in $/MMBtu. |
| | | | | | |
| 2020 | | Volume (MMBtud) | | Weighted Average
Ceiling Price
($/MMBtu) | | Weighted
Average
Floor Price
($/MMBtu) |
|
| April 1, 2020 through July 31, 2020 (CLOSED) | | 250,000 | | | 2.50 | | | 2.00 | |
| | | | | | |
| In April 2020, EOG entered into natural gas collar contracts for the period from August 1, 2020 through October 31, 2020, with notional volumes of 250,000 MMBtud at a ceiling price of $2.50 per MMBtu and a floor price of $2.00 per MMBtu. These contracts offset the remaining natural gas collar contracts for the same time period with notional volumes of 250,000 MMBtud at a ceiling price of $2.50 per MMBtu and a floor price of $2.00 per MMBtu. EOG received net cash of $1.1 million for the settlement of these contracts. The offsetting contracts were excluded from the above table. |
| | | | | | | | | | | | | | |
| Rockies Differential Basis Swap Contracts |
| Prices received by EOG for its natural gas production generally vary from NYMEX Henry Hub prices due to adjustments for delivery location (basis) and other factors. EOG has entered into natural gas basis swap contracts in order to fix the differential between pricing in the Rocky Mountain area and NYMEX Henry Hub prices (Rockies Differential). Presented below is a comprehensive summary of EOG's Rockies Differential basis swap contracts through February 18, 2021. The weighted average price differential expressed in $/MMBtu represents the amount of reduction to NYMEX Henry Hub prices for the notional volumes expressed in MMBtud covered by the basis swap contracts. |
| | | | |
| 2020 | | Volume (MMBtud) | | Weighted Average Price Differential
($/MMBtu) |
|
|
| January 1, 2020 through December 31, 2020 (CLOSED) | | 30,000 | | | 0.55 | |
| | | | | | | | | | | | | | |
| HSC Differential Basis Swap Contracts |
| EOG has also entered into natural gas basis swap contracts in order to fix the differential between pricing at the Houston Ship Channel (HSC) and NYMEX Henry Hub prices (HSC Differential). In March 2020, EOG executed the early termination provision granting EOG the right to terminate certain 2020 HSC Differential basis swaps with notional volumes of 60,000 MMBtud at a weighted average price differential of $0.05 per MMBtu for the period from April 1, 2020 through December 31, 2020. EOG paid net cash of $0.4 million for the settlement of these contracts. Presented below is a comprehensive summary of EOG's HSC Differential basis swap contracts through February 18, 2021. The weighted average price differential expressed in $/MMBtu represents the amount of reduction to NYMEX Henry Hub prices for the notional volumes expressed in MMBtud covered by the basis swap contracts. |
| | | | |
| 2020 | | Volume (MMBtud) | | Weighted Average Price Differential
($/MMBtu) |
|
|
| January 1, 2020 through December 31, 2020 (CLOSED) | | 60,000 | | | 0.05 | |
| | | | | | | | | | | | | | |
| Waha Differential Basis Swap Contracts |
| EOG has also entered into natural gas basis swap contracts in order to fix the differential between pricing at the Waha Hub in West Texas and NYMEX Henry Hub prices (Waha Differential). Presented below is a comprehensive summary of EOG's Waha Differential basis swap contracts through February 18, 2021. The weighted average price differential expressed in $/MMBtu represents the amount of reduction to NYMEX Henry Hub prices for the notional volumes expressed in MMBtud covered by the basis swap contracts. |
| | | | |
| 2020 | | Volume (MMBtud) | | Weighted Average Price Differential
($/MMBtu) |
|
|
| January 1, 2020 through April 30, 2020 (CLOSED) | | 50,000 | | | 1.40 | |
| | | | |
| In April 2020, EOG entered into Waha Differential basis swap contracts for the period from May 1, 2020 through December 31, 2020, with notional volumes of 50,000 MMBtud at a weighted average price differential of $0.43 per MMBtu. These contracts offset the remaining Waha Differential basis swap contracts for the same time period with notional volumes of 50,000 MMBtud at a weighted average price differential of $1.40 per MMBtu. EOG paid net cash of 11.9 million for the settlement of these contracts. The offsetting contracts were excluded from the above table. |
| | | | | | | | | | | |
| Definitions | |
| Bbld | | Barrels per day | |
| $/Bbl | | Dollars per barrel | |
| ICE | | Intercontinental Exchange | |
| MMBtud | | Million British thermal units per day | |
| $/MMBtu | | Dollars per million British thermal units | |
| NYMEX | | U.S. New York Mercantile Exchange | |
| WTI | | West Texas Intermediate | |
| | | | | |
| Direct After-Tax Rate of Return | |
| |
| The calculation of our direct after-tax rate of return (ATROR) with respect to our capital expenditure program for a particular play or well is based on the estimated recoverable reserves ("net" to EOG’s interest) for all wells in such play or such well (as the case may be), the estimated net present value (NPV) of the future net cash flows from such reserves (for which we utilize certain assumptions regarding future commodity prices and operating costs) and our direct net costs incurred in drilling or acquiring (as the case may be) such wells or well (as the case may be). As such, our direct ATROR with respect to our capital expenditures for a particular play or well cannot be calculated from our consolidated financial statements. |
| |
| Direct ATROR | |
| Based on Cash Flow and Time Value of Money | |
| - Estimated future commodity prices and operating costs | |
| - Costs incurred to drill, complete and equip a well, including facilities | |
| Excludes Indirect Capital | |
| - Gathering and Processing and other Midstream | |
| - Land, Seismic, Geological and Geophysical | |
| |
| Payback ~12 Months on 100% Direct ATROR Wells | |
| First Five Years ~1/2 Estimated Ultimate Recovery Produced but ~3/4 of NPV Captured | |
| |
| Return on Equity / Return on Capital Employed | |
| Based on GAAP Accrual Accounting | |
| Includes All Indirect Capital and Growth Capital for Infrastructure | |
| - Eagle Ford, Bakken, Permian Facilities | |
| - Gathering and Processing | |
| Includes Legacy Gas Capital and Capital from Mature Wells | |
| | | | | | | | | | | | | | | | | | | | | | | |
| ROCE & ROE | | | | | | |
| In millions of USD, except ratio data (Unaudited) | | | | | | | |
| 2020 | | 2019 | | 2018 | | 2017 |
| | | | | | | |
| Net Interest Expense (GAAP) | 205 | | | 185 | | | 245 | | | |
| Tax Benefit Imputed (based on 21%) | (43) | | | (39) | | | (51) | | | |
| After-Tax Net Interest Expense (Non-GAAP) - (a) | 162 | | | 146 | | | 194 | | | |
| | | | | | | |
| Net Income (Loss) (GAAP) - (b) | (605) | | | 2,735 | | | 3,419 | | | |
Adjustments to Net Income (Loss), Net of Tax (See Below Detail) (1) | 1,455 | | | 158 | | | (201) | | | |
| Adjusted Net Income (Non-GAAP) - (c) | 850 | | | 2,893 | | | 3,218 | | | |
| | | | | | | |
| Total Stockholders' Equity - (d) | 20,302 | | | 21,641 | | | 19,364 | | | 16,283 | |
| | | | | | | |
| Average Total Stockholders' Equity * - (e) | 20,972 | | | 20,503 | | | 17,824 | | | |
| | | | | | | |
| Current and Long-Term Debt (GAAP) - (f) | 5,816 | | | 5,175 | | | 6,083 | | | 6,387 | |
| Less: Cash | (3,329) | | | (2,028) | | | (1,556) | | | (834) | |
| Net Debt (Non-GAAP) - (g) | 2,487 | | | 3,147 | | | 4,527 | | | 5,553 | |
| | | | | | | |
| Total Capitalization (GAAP) - (d) + (f) | 26,118 | | | 26,816 | | | 25,447 | | | 22,670 | |
| | | | | | | |
| Total Capitalization (Non-GAAP) - (d) + (g) | 22,789 | | | 24,788 | | | 23,891 | | | 21,836 | |
| | | | | | | |
| Average Total Capitalization (Non-GAAP) * - (h) | 23,789 | | | 24,340 | | | 22,864 | | | |
| | | | | | | |
| Return on Capital Employed (ROCE) | | | | | | | |
| GAAP Net Income (Loss) - [(a) + (b)] / (h) | (1.9) | % | | 11.8 | % | | 15.8 | % | | |
| Non-GAAP Adjusted Net Income - [(a) + (c)] / (h) | 4.3 | % | | 12.5 | % | | 14.9 | % | | |
| | | | | | | |
| Return on Equity (ROE) | | | | | | | |
| GAAP Net Income (Loss) - (b) / (e) | (2.9) | % | | 13.3 | % | | 19.2 | % | | |
| Non-GAAP Adjusted Net Income - (c) / (e) | 4.1 | % | | 14.1 | % | | 18.1 | % | | |
| | | | | | | |
| * Average for the current and immediately preceding year | | | | | | | |
| | | | | | | |
| | | | | | | | | | | | | | | | | | | | | | | |
| (1) Detail of adjustments to Net Income (Loss) (GAAP): | | | | | | | |
| | | Before
Tax | | Income Tax Impact | | After
Tax |
| Year Ended December 31, 2020 | | | | | | | |
| Adjustments: | | | | | | | |
| Add: Mark-to-Market Commodity Derivative Contracts Impact | | | (74) | | | 16 | | | (58) | |
| Add: Impairments of Certain Assets | | | 1,868 | | | (392) | | | 1,476 | |
| Add: Net Losses on Asset Dispositions | | | 47 | | | (10) | | | 37 | |
| Total | | | 1,841 | | | (386) | | | 1,455 | |
| | | | | | | |
| Year Ended December 31, 2019 | | | | | | | |
| Adjustments: | | | | | | | |
| Add: Mark-to-Market Commodity Derivative Contracts Impact | | | 51 | | | (11) | | | 40 | |
| Add: Impairments of Certain Assets | | | 275 | | | (60) | | | 215 | |
| Less: Net Gains on Asset Dispositions | | | (124) | | | 27 | | | (97) | |
| Total | | | 202 | | | (44) | | | 158 | |
| | | | | | | |
| Year Ended December 31, 2018 | | | | | | | |
| Adjustments: | | | | | | | |
| Add: Mark-to-Market Commodity Derivative Contracts Impact | | | (93) | | | 20 | | | (73) | |
| Add: Impairments of Certain Assets | | | 153 | | | (34) | | | 119 | |
| Less: Net Gains on Asset Dispositions | | | (175) | | | 38 | | | (137) | |
| Less: Tax Reform Impact | | | — | | | (110) | | | (110) | |
| Total | | | (115) | | | (86) | | | (201) | |
| | | | | | | | | | | | | | | | | | | | | | | | | | | | | |
| ROCE & ROE | | | | | | | |
| In millions of USD, except ratio data (Unaudited) | | | | | | | | | |
| | | | | | | | | |
| 2017 | | 2016 | | 2015 | | 2014 | | 2013 |
| | | | | | | | | |
| Net Interest Expense (GAAP) | 274 | | | 282 | | | 237 | | | 201 | | | 235 | |
| Tax Benefit Imputed (based on 35%) | (96) | | | (99) | | | (83) | | | (70) | | | (82) | |
| After-Tax Net Interest Expense (Non-GAAP) - (a) | 178 | | | 183 | | | 154 | | | 131 | | | 153 | |
| | | | | | | | | |
| Net Income (Loss) (GAAP) - (b) | 2,583 | | | (1,097) | | | (4,525) | | | 2,915 | | | 2,197 | |
| | | | | | | | | |
| Total Stockholders' Equity - (d) | 16,283 | | | 13,982 | | | 12,943 | | | 17,713 | | | 15,418 | |
| | | | | | | | | |
| Average Total Stockholders' Equity* - (e) | 15,133 | | | 13,463 | | | 15,328 | | | 16,566 | | | 14,352 | |
| | | | | | | | | |
| Current and Long-Term Debt (GAAP) - (f) | 6,387 | | | 6,986 | | | 6,655 | | | 5,906 | | | 5,909 | |
| Less: Cash | (834) | | | (1,600) | | | (719) | | | (2,087) | | | (1,318) | |
| Net Debt (Non-GAAP) - (g) | 5,553 | | | 5,386 | | | 5,936 | | | 3,819 | | | 4,591 | |
| | | | | | | | | |
| Total Capitalization (GAAP) - (d) + (f) | 22,670 | | | 20,968 | | | 19,598 | | | 23,619 | | | 21,327 | |
| | | | | | | | | |
| Total Capitalization (Non-GAAP) - (d) + (g) | 21,836 | | | 19,368 | | | 18,879 | | | 21,532 | | | 20,009 | |
| | | | | | | | | |
| Average Total Capitalization (Non-GAAP)* - (h) | 20,602 | | | 19,124 | | | 20,206 | | | 20,771 | | | 19,365 | |
| | | | | | | | | |
| Return on Capital Employed (ROCE) | | | | | | | | | |
| GAAP Net Income (Loss) - [(a) + (b)] / (h) | 13.4 | % | | -4.8 | % | | -21.6 | % | | 14.7 | % | | 12.1 | % |
| | | | | | | | | |
| Return on Equity (ROE) | | | | | | | | | |
| GAAP Net Income (Loss) - (b) / (e) | 17.1 | % | | -8.1 | % | | -29.5 | % | | 17.6 | % | | 15.3 | % |
| | | | | | | | | |
| * Average for the current and immediately preceding year | | | | | | | | | |
| | | | | | | | | | | | | | | | | | | | | | | | | | | | | |
| ROCE & ROE | | | | | | | |
| In millions of USD, except ratio data (Unaudited) | | | | | | | | | |
|
| 2012 | | 2011 | | 2010 | | 2009 | | 2008 |
| | | | | | | | | |
| Net Interest Expense (GAAP) | 214 | | | 210 | | | 130 | | | 101 | | | 52 | |
| Tax Benefit Imputed (based on 35%) | (75) | | | (74) | | | (46) | | | (35) | | | (18) | |
| After-Tax Net Interest Expense (Non-GAAP) - (a) | 139 | | | 136 | | | 84 | | | 66 | | | 34 | |
| | | | | | | | | |
| Net Income (GAAP) - (b) | 570 | | | 1,091 | | | 161 | | | 547 | | | 2,437 | |
| | | | | | | | | |
| Total Stockholders' Equity - (d) | 13,285 | | | 12,641 | | | 10,232 | | | 9,998 | | | 9,015 | |
| | | | | | | | | |
| Average Total Stockholders' Equity* - (e) | 12,963 | | | 11,437 | | | 10,115 | | | 9,507 | | | 8,003 | |
| | | | | | | | | |
| Current and Long-Term Debt (GAAP) - (f) | 6,312 | | | 5,009 | | | 5,223 | | | 2,797 | | | 1,897 | |
| Less: Cash | (876) | | | (616) | | | (789) | | | (686) | | | (331) | |
| Net Debt (Non-GAAP) - (g) | 5,436 | | | 4,393 | | | 4,434 | | | 2,111 | | | 1,566 | |
| | | | | | | | | |
| Total Capitalization (GAAP) - (d) + (f) | 19,597 | | | 17,650 | | | 15,455 | | | 12,795 | | | 10,912 | |
| | | | | | | | | |
| Total Capitalization (Non-GAAP) - (d) + (g) | 18,721 | | | 17,034 | | | 14,666 | | | 12,109 | | | 10,581 | |
| | | | | | | | | |
| Average Total Capitalization (Non-GAAP)* - (h) | 17,878 | | | 15,850 | | | 13,388 | | | 11,345 | | | 9,351 | |
| | | | | | | | | |
| Return on Capital Employed (ROCE) | | | | | | | | | |
| GAAP Net Income - [(a) + (b)] / (h) | 4.0 | % | | 7.7 | % | | 1.8 | % | | 5.4 | % | | 26.4 | % |
| | | | | | | | | |
| Return on Equity (ROE) | | | | | | | | | |
| GAAP Net Income - (b) / (e) | 4.4 | % | | 9.5 | % | | 1.6 | % | | 5.8 | % | | 30.5 | % |
| | | | | | | | | |
| * Average for the current and immediately preceding year | | | | | | | | | |
| | | | | | | | | | | | | | | | | | | | | | | | | | | | | |
| ROCE & ROE | | | | | | | |
| In millions of USD, except ratio data (Unaudited) | | | | | | | | | |
| | | | | | | | | |
| 2007 | | 2006 | | 2005 | | 2004 | | 2003 |
| | | | | | | | | |
| Net Interest Expense (GAAP) | 47 | | | 43 | | | 63 | | | 63 | | | 59 | |
| Tax Benefit Imputed (based on 35%) | (16) | | | (15) | | | (22) | | | (22) | | | (21) | |
| After-Tax Net Interest Expense (Non-GAAP) - (a) | 31 | | | 28 | | | 41 | | | 41 | | | 38 | |
| | | | | | | | | |
| Net Income (GAAP) - (b) | 1,090 | | | 1,300 | | | 1,260 | | | 625 | | | 430 | |
| | | | | | | | | |
| Total Stockholders' Equity - (d) | 6,990 | | | 5,600 | | | 4,316 | | | 2,945 | | | 2,223 | |
| | | | | | | | | |
| Average Total Stockholders' Equity* - (e) | 6,295 | | | 4,958 | | | 3,631 | | | 2,584 | | | 1,948 | |
| | | | | | | | | |
| Current and Long-Term Debt (GAAP) - (f) | 1,185 | | | 733 | | | 985 | | | 1,078 | | | 1,109 | |
| Less: Cash | (54) | | | (218) | | | (644) | | | (21) | | | (4) | |
| Net Debt (Non-GAAP) - (g) | 1,131 | | | 515 | | | 341 | | | 1,057 | | | 1,105 | |
| | | | | | | | | |
| Total Capitalization (GAAP) - (d) + (f) | 8,175 | | | 6,333 | | | 5,301 | | | 4,023 | | | 3,332 | |
| | | | | | | | | |
| Total Capitalization (Non-GAAP) - (d) + (g) | 8,121 | | | 6,115 | | | 4,657 | | | 4,002 | | | 3,328 | |
| | | | | | | | | |
| Average Total Capitalization (Non-GAAP)* - (h) | 7,118 | | | 5,386 | | | 4,330 | | | 3,665 | | | 3,068 | |
| | | | | | | | | |
| Return on Capital Employed (ROCE) | | | | | | | | | |
| GAAP Net Income - [(a) + (b)] / (h) | 15.7 | % | | 24.7 | % | | 30.0 | % | | 18.2 | % | | 15.3 | % |
| | | | | | | | | |
| Return on Equity (ROE) | | | | | | | | | |
| GAAP Net Income - (b) / (e) | 17.3 | % | | 26.2 | % | | 34.7 | % | | 24.2 | % | | 22.1 | % |
| | | | | | | | | |
| * Average for the current and immediately preceding year | | | | | | | | | |
| | | | | | | | | | | | | | | | | | | | | | | | | | | | | |
| ROCE & ROE | | | | | | | |
| In millions of USD, except ratio data (Unaudited) | | | | | | | | | |
|
| 2002 | | 2001 | | 2000 | | 1999 | | 1998 |
| | | | | | | | | |
| Net Interest Expense (GAAP) | 60 | | | 45 | | | 61 | | | 62 | | | |
| Tax Benefit Imputed (based on 35%) | (21) | | | (16) | | | (21) | | | (22) | | | |
| After-Tax Net Interest Expense (Non-GAAP) - (a) | 39 | | | 29 | | | 40 | | | 40 | | | |
| | | | | | | | | |
| Net Income (GAAP) - (b) | 87 | | | 399 | | | 397 | | | 569 | | | |
| | | | | | | | | |
| Total Stockholders' Equity - (d) | 1,672 | | | 1,643 | | | 1,381 | | | 1,130 | | | 1,280 | |
| | | | | | | | | |
| Average Total Stockholders' Equity* - (e) | 1,658 | | | 1,512 | | | 1,256 | | | 1,205 | | | |
| | | | | | | | | |
| Current and Long-Term Debt (GAAP) - (f) | 1,145 | | | 856 | | | 859 | | | 990 | | | 1,143 | |
| Less: Cash | (10) | | | (3) | | | (20) | | | (25) | | | (6) | |
| Net Debt (Non-GAAP) - (g) | 1,135 | | | 853 | | | 839 | | | 965 | | | 1,137 | |
| | | | | | | | | |
| Total Capitalization (GAAP) - (d) + (f) | 2,817 | | | 2,499 | | | 2,240 | | | 2,120 | | | 2,423 | |
| | | | | | | | | |
| Total Capitalization (Non-GAAP) - (d) + (g) | 2,807 | | | 2,496 | | | 2,220 | | | 2,095 | | | 2,417 | |
| | | | | | | | | |
| Average Total Capitalization (Non-GAAP)* - (h) | 2,652 | | | 2,358 | | | 2,158 | | | 2,256 | | | |
| | | | | | | | | |
| Return on Capital Employed (ROCE) | | | | | | | | | |
| GAAP Net Income - [(a) + (b)] / (h) | 4.8 | % | | 18.2 | % | | 20.2 | % | | 27.0 | % | | |
| | | | | | | | | |
| Return on Equity (ROE) | | | | | | | | | |
| GAAP Net Income - (b) / (e) | 5.2 | % | | 26.4 | % | | 31.6 | % | | 47.2 | % | | |
| | | | | | | | | |
| * Average for the current and immediately preceding year | | | | | | | | | |
| | | | | | | | | | | | | | | | | | | | | | | |
| Costs per Barrel of Oil Equivalent | |
| In thousands of USD, except Boe and per Boe amounts (Unaudited) | | | | | | | |
| | | | | | | |
| 1Q 2020 | | 2Q 2020 | | 3Q 2020 | | 4Q 2020 |
| | | | | | | |
| Cost per Barrel of Oil Equivalent (Boe) Calculation | | | | | | | |
| Volume - Thousand Barrels of Oil Equivalent - (a) | 79,548 | | | 56,733 | | | 65,873 | | | 73,740 | |
| | | | | | | |
| Crude Oil and Condensate | 2,065,498 | | | 614,627 | | | 1,394,622 | | | 1,710,862 | |
| Natural Gas Liquids | 160,535 | | | 93,909 | | | 184,771 | | | 228,299 | |
| Natural Gas | 209,764 | | | 141,696 | | | 183,790 | | | 301,883 | |
| Total Wellhead Revenues - (b) | 2,435,797 | | | 850,232 | | | 1,763,183 | | | 2,241,044 | |
| | | | | | | |
| Operating Costs | | | | | | | |
| Lease and Well | 329,659 | | | 245,346 | | | 227,473 | | | 260,896 | |
| Transportation Costs | 208,296 | | | 151,728 | | | 180,257 | | | 194,708 | |
| Gathering and Processing Costs | 128,482 | | | 96,767 | | | 114,790 | | | 119,172 | |
| General and Administrative | 114,273 | | | 131,855 | | | 124,460 | | | 113,235 | |
| Taxes Other Than Income | 157,360 | | | 80,319 | | | 126,810 | | | 113,445 | |
| Interest Expense, Net | 44,690 | | | 54,213 | | | 53,242 | | | 53,121 | |
| Total Cash Cost (excluding DD&A and Total Exploration Costs) - (c) | 982,760 | | | 760,228 | | | 827,032 | | | 854,577 | |
| | | | | | | |
| Depreciation, Depletion and Amortization (DD&A) | 1,000,060 | | | 706,679 | | | 823,050 | | | 870,564 | |
| Total Operating Cost (excluding Total Exploration Costs) - (d) | 1,982,820 | | | 1,466,907 | | | 1,650,082 | | | 1,725,141 | |
| | | | | | | |
| Exploration Costs | 39,677 | | | 27,283 | | | 38,413 | | | 40,415 | |
| Dry Hole Costs | 372 | | | 87 | | | 12,604 | | | 20 | |
| Impairments | 1,572,935 | | | 305,415 | | | 78,990 | | | 142,440 | |
| Total Exploration Costs | 1,612,984 | | | 332,785 | | | 130,007 | | | 182,875 | |
| Less: Certain Impairments (Non-GAAP) | (1,516,316) | | | (239,167) | | | (26,531) | | | (86,451) | |
| Total Exploration Costs (Non-GAAP) | 96,668 | | | 93,618 | | | 103,476 | | | 96,424 | |
| | | | | | | |
| Total Operating Cost (Non-GAAP) (including Total Exploration Costs) - (e) | 2,079,488 | | | 1,560,525 | | | 1,753,558 | | | 1,821,565 | |
| | | | | | | |
| Composite Average Wellhead Revenue per Boe - (b) / (a) | 30.62 | | | 14.99 | | | 26.77 | | | 30.39 | |
| | | | | | | |
| Total Operating Cost per Boe (excluding DD&A and Total Exploration Costs) - (c) / (a) | 12.36 | | | 13.40 | | | 12.56 | | | 11.60 | |
| | | | | | | |
| Composite Average Margin per Boe (excluding DD&A and Total Exploration Costs) - [(b) / (a) - (c) / (a)] | 18.26 | | | 1.59 | | | 14.21 | | | 18.79 | |
| | | | | | | |
| Total Operating Cost per Boe (excluding Total Exploration Costs) - (d) / (a) | 24.93 | | | 25.86 | | | 25.05 | | | 23.41 | |
| | | | | | | |
| Composite Average Margin per Boe (excluding Total Exploration Costs) - [(b) / (a) - (d) / (a)] | 5.69 | | | (10.87) | | | 1.72 | | | 6.98 | |
| | | | | | | |
| Total Operating Cost per Boe (Non-GAAP) (including Total Exploration Costs) - (e) / (a) | 26.15 | | | 27.51 | | | 26.62 | | | 24.72 | |
| | | | | | | |
| Composite Average Margin per Boe (Non-GAAP) (including Total Exploration Costs) - [(b) / (a) - (e) / (a)] | 4.47 | | | (12.52) | | | 0.15 | | | 5.67 | |
| | | | | | | | | | | | | | | | | | | | | | | |
| Costs per Barrel of Oil Equivalent | | | | | |
| In thousands of USD, except Boe and per Boe amounts (Unaudited) |
| 2020 | | 2019 | | 2018 | | 2017 |
| Cost per Barrel of Oil Equivalent (Boe) Calculation | | | | | | | |
| Volume - Thousand Barrels of Oil Equivalent - (a) | 275,893 | | | 298,565 | | | 262,516 | | | 222,251 | |
| | | | | | | |
| Crude Oil and Condensate | 5,785,609 | | | 9,612,532 | | | 9,517,440 | | | 6,256,396 | |
| Natural Gas Liquids | 667,514 | | | 784,818 | | | 1,127,510 | | | 729,561 | |
| Natural Gas | 837,133 | | | 1,184,095 | | | 1,301,537 | | | 921,934 | |
| Total Wellhead Revenues - (b) | 7,290,256 | | | 11,581,445 | | | 11,946,487 | | | 7,907,891 | |
| | | | | | | |
| Operating Costs | | | | | | | |
| Lease and Well | 1,063,374 | | | 1,366,993 | | | 1,282,678 | | | 1,044,847 | |
| Transportation Costs | 734,989 | | | 758,300 | | | 746,876 | | | 740,352 | |
| Gathering and Processing Costs | 459,211 | | | 479,102 | | | 436,973 | | | 148,775 | |
| General and Administrative | 483,823 | | | 489,397 | | | 426,969 | | | 434,467 | |
| Less: Legal Settlement - Early Leasehold Termination | — | | | — | | | — | | | (10,202) | |
| Less: Joint Venture Transaction Costs | — | | | — | | | — | | | (3,056) | |
| Less: Joint Interest Billings Deemed Uncollectible | — | | | — | | | — | | | (4,528) | |
| General and Administrative (Non-GAAP) | 483,823 | | | 489,397 | | | 426,969 | | | 416,681 | |
| Taxes Other Than Income | 477,934 | | | 800,164 | | | 772,481 | | | 544,662 | |
| Interest Expense, Net | 205,266 | | | 185,129 | | | 245,052 | | | 274,372 | |
| Total Operating Cost (Non-GAAP) (excluding DD&A and Total Exploration Costs) - (c) | 3,424,597 | | | 4,079,085 | | | 3,911,029 | | | 3,169,689 | |
| | | | | | | |
| Depreciation, Depletion and Amortization (DD&A) | 3,400,353 | | | 3,749,704 | | | 3,435,408 | | | 3,409,387 | |
| Total Operating Cost (Non-GAAP) (excluding Total Exploration Costs) - (d) | 6,824,950 | | | 7,828,789 | | | 7,346,437 | | | 6,579,076 | |
| | | | | | | |
| Exploration Costs | 145,788 | | | 139,881 | | | 148,999 | | | 145,342 | |
| Dry Hole Costs | 13,083 | | | 28,001 | | | 5,405 | | | 4,609 | |
| Impairments | 2,099,780 | | | 517,896 | | | 347,021 | | | 479,240 | |
| Total Exploration Costs | 2,258,651 | | | 685,778 | | | 501,425 | | | 629,191 | |
| Less: Certain Impairments (Non-GAAP) | (1,868,465) | | | (274,974) | | | (152,671) | | | (261,452) | |
| Total Exploration Costs (Non-GAAP) | 390,186 | | | 410,804 | | | 348,754 | | | 367,739 | |
| | | | | | | |
| Total Operating Cost (Non-GAAP) (including Total Exploration Costs) - (e) | 7,215,136 | | | 8,239,593 | | | 7,695,191 | | | 6,946,815 | |
| | | | | | | |
| | | | | | | | | | | | | | | | | | | | | | | |
| Cost per Barrel of Oil Equivalent | | | | | |
| In thousands of USD, except Boe and per Boe amounts (Unaudited) | | | | | | | |
| 2020 | | 2019 | | 2018 | | 2017 |
| | | | | | | |
| Composite Average Wellhead Revenue per Boe - (b) / (a) | 26.42 | | | 38.79 | | | 45.51 | | | 35.58 | |
| | | | | | | |
| Total Operating Cost per Boe (Non-GAAP) (excluding DD&A and Total Exploration Costs) - (c) / (a) | 12.39 | | | 13.66 | | | 14.90 | | | 14.25 | |
| | | | | | | |
| Composite Average Margin per Boe (Non-GAAP) (excluding DD&A and Total Exploration Costs) - [(b) / (a) - (c) / (a)] | 14.03 | | | 25.13 | | | 30.61 | | | 21.33 | |
| | | | | | | |
Total Operating Cost per Boe (Non-GAAP) (excluding Total Exploration Costs) -
(d) / (a) | 24.71 | | | 26.22 | | | 27.99 | | | 29.59 | |
| | | | | | | |
| Composite Average Margin per Boe (Non-GAAP) (excluding Total Exploration Costs) - [(b) / (a) - (d) / (a)] | 1.71 | | | 12.57 | | | 17.52 | | | 5.99 | |
| | | | | | | |
Total Operating Cost per Boe (Non-GAAP) (including Total Exploration Costs) -
(e) / (a) | 26.13 | | | 27.60 | | | 29.32 | | | 31.24 | |
| | | | | | | |
| Composite Average Margin per Boe (Non-GAAP) (including Total Exploration Costs) - [(b) / (a) - (e) / (a)] | 0.29 | | | 11.19 | | | 16.19 | | | 4.34 | |
| | | | | | | | | | | | | | | | | |
| Cost per Barrel of Oil Equivalent | | | |
| In thousands of USD, except Boe and per Boe amounts (Unaudited) |
| |
| 2016 | | 2015 | | 2014 |
| Cost per Barrel of Oil Equivalent (Boe) Calculation | | | | | |
| Volume - Thousand Barrels of Oil Equivalent - (a) | 204,929 | | | 208,862 | | | 217,073 | |
| | | | | |
| Crude Oil and Condensate | 4,317,341 | | | 4,934,562 | | | 9,742,480 | |
| Natural Gas Liquids | 437,250 | | | 407,658 | | | 934,051 | |
| Natural Gas | 742,152 | | | 1,061,038 | | | 1,916,386 | |
| Total Wellhead Revenues - (b) | 5,496,743 | | | 6,403,258 | | | 12,592,917 | |
| | | | | |
| Operating Costs | | | | | |
| Lease and Well | 927,452 | | | 1,182,282 | | | 1,416,413 | |
| Transportation Costs | 764,106 | | | 849,319 | | | 972,176 | |
| Gathering and Processing Costs | 122,901 | | | 146,156 | | | 145,800 | |
| | | | | |
| General and Administrative | 394,815 | | | 366,594 | | | 402,010 | |
| Less: Voluntary Retirement Expense | (42,054) | | | — | | | — | |
| Less: Acquisition Costs | (5,100) | | | — | | | — | |
| Less: Legal Settlement - Early Leasehold Termination | — | | | (19,355) | | | — | |
| General and Administrative (Non-GAAP) | 347,661 | | | 347,239 | | | 402,010 | |
| | | | | |
| Taxes Other Than Income | 349,710 | | | 421,744 | | | 757,564 | |
| Interest Expense, Net | 281,681 | | | 237,393 | | | 201,458 | |
| Total Operating Cost (Non-GAAP) (excluding DD&A and Total Exploration Costs) - (c) | 2,793,511 | | | 3,184,133 | | | 3,895,421 | |
| | | | | |
| Depreciation, Depletion and Amortization (DD&A) | 3,553,417 | | | 3,313,644 | | | 3,997,041 | |
| Total Operating Cost (Non-GAAP) (excluding Total Exploration Costs) - (d) | 6,346,928 | | | 6,497,777 | | | 7,892,462 | |
| | | | | |
| Exploration Costs | 124,953 | | | 149,494 | | | 184,388 | |
| Dry Hole Costs | 10,657 | | | 14,746 | | | 48,490 | |
| Impairments | 620,267 | | | 6,613,546 | | | 743,575 | |
| Total Exploration Costs | 755,877 | | | 6,777,786 | | | 976,453 | |
| Less: Certain Impairments (Non-GAAP) | (320,617) | | | (6,307,593) | | | (824,312) | |
| Total Exploration Costs (Non-GAAP) | 435,260 | | | 470,193 | | | 152,141 | |
| | | | | |
| Total Operating Cost (Non-GAAP) (including Total Exploration Costs) - (e) | 6,782,188 | | | 6,967,970 | | | 8,044,603 | |
| | | | | |
| | | | | | | | | | | | | | | | | |
| Cost per Barrel of Oil Equivalent | | | |
| In thousands of USD, except Boe and per Boe amounts (Unaudited) |
| |
| 2016 | | 2015 | | 2014 |
| | | | | |
| Composite Average Wellhead Revenue per Boe - (b) / (a) | 26.82 | | | 30.66 | | | 58.01 | |
| | | | | |
| Total Operating Cost per Boe (Non-GAAP) (excluding DD&A and Total Exploration Costs) - (c) / (a) | 13.64 | | | 15.25 | | | 17.95 | |
| | | | | |
| Composite Average Margin per Boe (Non-GAAP) (excluding DD&A and Total Exploration Costs) - [(b) / (a) - (c) / (a)] | 13.18 | | | 15.41 | | | 40.06 | |
| | | | | |
Total Operating Cost per Boe (Non-GAAP) (excluding Total Exploration Costs) -
(d) / (a) | 30.98 | | | 31.11 | | | 36.38 | |
| | | | | |
| Composite Average Margin per Boe (Non-GAAP) (excluding Total Exploration Costs) - [(b) / (a) - (d) / (a)] | (4.16) | | | (0.45) | | | 21.63 | |
| | | | | |
Total Operating Cost per Boe (Non-GAAP) (including Total Exploration Costs) -
(e) / (a) | 33.10 | | | 33.36 | | | 37.08 | |
| | | | | |
| Composite Average Margin per Boe (Non-GAAP) (including Total Exploration Costs) - [(b) / (a) - (e) / (a)] | (6.28) | | | (2.70) | | | 20.93 | |
| | | | | | | | | | | | | | | | | | | | | | | | | | | | | | | | | | | | | | | | | | | | | | | |
| Quarter and Full Year Guidance | | | |
| (Unaudited) |
|
| (a) First Quarter and Full Year 2021 Forecast |
| The forecast items for the first quarter and full year 2021 set forth below for EOG Resources, Inc. (EOG) are based on current available information and expectations as of the date of the accompanying press release. EOG undertakes no obligation, other than as required by applicable law, to update or revise this forecast, whether as a result of new information, subsequent events, anticipated or unanticipated circumstances or otherwise. This forecast, which should be read in conjunction with the accompanying press release and EOG’s related Current Report on Form 8-K filing, replaces and supersedes any previously issued guidance or forecast. |
|
| (b) Capital Expenditures |
| The forecast includes expenditures for Exploration and Development Drilling, Facilities, Leasehold Acquisitions, Capitalized Interest, Exploration Costs, Dry Hole Costs and Other Property, Plant and Equipment. The forecast excludes Property Acquisitions, Asset Retirement Costs and any Non-Cash Transactions. |
|
| (c) Benchmark Commodity Pricing |
| EOG bases United States and Trinidad crude oil and condensate price differentials upon the West Texas Intermediate crude oil price at Cushing, Oklahoma, using the simple average of the NYMEX settlement prices for each trading day within the applicable calendar month. |
|
| EOG bases United States natural gas price differentials upon the natural gas price at Henry Hub, Louisiana, using the simple average of the NYMEX settlement prices for the last three trading days of the applicable month. |
|
|
| Estimated Ranges for First Quarter and Full Year 2021 | | 1Q 2021 | | | FY 2021 |
| Daily Sales Volumes | | | | | | | | | | | |
| Crude Oil and Condensate Volumes (MBbld) | | | | | | | | | | | |
| United States | | 418.0 | | - | | 428.0 | | | | 433.0 | | - | | 444.0 | |
| Trinidad | | 1.6 | | - | | 2.4 | | | | 1.0 | | - | | 1.8 | |
| Other International | | 0.0 | | - | | 0.2 | | | | 0.0 | | - | | 0.2 | |
| Total | | 419.6 | | - | | 430.6 | | | | 434.0 | | - | | 446.0 | |
| Natural Gas Liquids Volumes (MBbld) | | | | | | | | | | | |
| Total | | 125.0 | | - | | 135.0 | | | | 130.0 | | - | | 170.0 | |
| Natural Gas Volumes (MMcfd) | | | | | | | | | | | |
| United States | | 1,095 | | - | | 1,155 | | | | 1,100 | | - | | 1,200 | |
| Trinidad | | 200 | | - | | 230 | | | | 180 | | - | | 220 | |
| Other International | | 15 | | - | | 25 | | | | 15 | | - | | 25 | |
| Total | | 1,310 | | - | | 1,410 | | | | 1,295 | | - | | 1,445 | |
| Crude Oil Equivalent Volumes (MBoed) | | | | | | | | | | | |
| United States | | 725.5 | | - | | 755.5 | | | | 746.3 | | - | | 814.0 | |
| Trinidad | | 34.9 | | - | | 40.7 | | | | 31.0 | | - | | 38.5 | |
| Other International | | 2.5 | | - | | 4.4 | | | | 2.5 | | - | | 4.4 | |
| Total | | 762.9 | | - | | 800.6 | | | | 779.8 | | - | | 856.9 | |
| | | | | | | | | | | |
| Capital Expenditures ($MM) | | 900 | | - | | 1,100 | | | | 3,700 | | - | | 4,100 | |
| | | | | | | | | | | | | | | | | | | | | | | | | | | | | | | | | | | | | | | | | | | | | | | |
| Quarter and Full Year Guidance | | | |
| (Unaudited) |
|
| Estimated Ranges for First Quarter and Full Year 2021 | | 1Q 2021 | | | FY 2021 |
| Operating Costs | | | | | | | | | | | |
| Unit Costs ($/Boe) | | | | | | | | | | | |
| Lease and Well | | 3.60 | | - | | 4.30 | | | | 3.50 | | - | | 4.20 | |
| Transportation Costs | | 2.60 | | - | | 3.00 | | | | 2.65 | | - | | 3.05 | |
| Gathering and Processing | | 1.75 | | - | | 1.85 | | | | 1.65 | | - | | 1.85 | |
| Depreciation, Depletion and Amortization | | 12.60 | | - | | 13.10 | | | | 11.70 | | - | | 12.70 | |
| General and Administrative | | 1.60 | | - | | 1.70 | | | | 1.50 | | - | | 1.60 | |
| | | | | | | | | | | | | | | |
| Expenses ($MM) | | | | | | | | | | | |
| Exploration and Dry Hole | | 35 | | - | | 45 | | | | 140 | | - | | 180 | |
| Impairment | | 45 | | - | | 95 | | | | 255 | | - | | 295 | |
| Capitalized Interest | | 5 | | - | | 10 | | | | 25 | | - | | 30 | |
| Net Interest | | 45 | | - | | 50 | | | | 180 | | - | | 185 | |
| | | | | | | | | | | | | | | |
| Taxes Other Than Income (% of Wellhead Revenue) | | 6.0 | % | - | | 8.0 | % | | | 6.5 | % | - | | 7.5 | % |
| | | | | | | | | | | | | | | |
| Income Taxes | | | | | | | | | | | |
| Effective Rate | | 21 | % | - | | 26 | % | | | 21 | % | - | | 26 | % |
| Deferred Ratio | | (5) | % | - | | 5 | % | | | 0 | % | - | | 15 | % |
| | | | | | | | | | | | | | | |
Pricing - (Refer to Benchmark Commodity Pricing in text) | | | | | | | | | | | |
| Crude Oil and Condensate ($/Bbl) | | | | | | | | | | | |
| Differentials | | | | | | | | | | | |
| United States - above (below) WTI | | (0.80) | | - | | 1.20 | | | | (0.55) | | - | | 1.45 | |
| Trinidad - above (below) WTI | | (11.50) | | - | | (9.50) | | | | (12.40) | | - | | (10.40) | |
| Other International - above (below) WTI | | (21.00) | | - | | (15.00) | | | | (19.20) | | - | | (17.20) | |
| Natural Gas Liquids | | | | | | | | | | | |
| Realizations as % of WTI | | 43 | % | - | | 55 | % | | | 38 | % | - | | 50 | % |
| Natural Gas ($/Mcf) | | | | | | | | | | | |
| Differentials | | | | | | | | | | | |
| United States - above (below) NYMEX Henry Hub | | 1.75 | | - | | 4.25 | | | | (0.25) | | - | | 1.25 | |
| Realizations | | | | | | | | | | | |
| Trinidad | | 3.10 | | - | | 3.60 | | | | 3.10 | | - | | 3.60 | |
| Other International | | 5.45 | | - | | 5.95 | | | | 5.20 | | - | | 6.20 | |
| | | | | | | | | | | | | | | | | | | | | | | | | | | | | | | | | | | | | | | | | | | | | | | |
| Definitions | | | | | | | | | | | |
| $/Bbl | | U.S. Dollars per barrel | | | | | | | | | | | |
| $/Boe | | U.S. Dollars per barrel of oil equivalent | | | | | | | | | | | |
| $/Mcf | | U.S. Dollars per thousand cubic feet | | | | | | | | | | | |
| $MM | | U.S. Dollars in millions | | | | | | | | | | | |
| MBbld | | Thousand barrels per day | | | | | | | | | | | |
| MBoed | | Thousand barrels of oil equivalent per day | | | | | | | | | | | |
| MMcfd | | Million cubic feet per day | | | | | | | | | | | |
| NYMEX | | U.S. New York Mercantile Exchange | | | | | | | | | | | |
| WTI | | West Texas Intermediate | | | | | | | | | | | |