EXHIBIT 99.1
| | | | | |
| Table of Contents | |
| |
| Fourth Quarter 2022 | |
| Supplemental Financial and Operating Data | Page |
| |
| Income Statements | |
| Wellhead Volumes and Prices | |
| Balance Sheets | |
| Cash Flows Statements | |
| Non-GAAP Financial Measures | |
| Adjusted Net Income (Loss) | |
| Adjusted Net Income Per Share | |
| Net Income Per Share | |
| Cash Flow from Operations and Free Cash Flow | |
| Net Debt-to-Total Capitalization Ratio | |
| Proved Reserves and Reserve Replacement Data | |
| Reserve Replacement Cost Data | |
| | | | | | | | | | | | | | | | | | | | | | | | | | | | | |
| Income Statements | | | | | | | | | |
| In millions of USD, except share data (in millions) and per share data (Unaudited) | | | | |
| 4Q 2022 | | 3Q 2022 | | 4Q 2021 | | FY 2022 | | FY 2021 |
| Operating Revenues and Other | | | | | | | | | |
| Crude Oil and Condensate | 3,670 | | | 4,109 | | | 3,246 | | | 16,367 | | | 11,125 | |
| Natural Gas Liquids | 497 | | | 693 | | | 583 | | | 2,648 | | | 1,812 | |
| Natural Gas | 830 | | | 1,235 | | | 847 | | | 3,781 | | | 2,444 | |
| Gains (Losses) on Mark-to-Market Financial Commodity Derivative Contracts, Net | 233 | | | (18) | | | 136 | | | (3,982) | | | (1,152) | |
| Gathering, Processing and Marketing | 1,497 | | | 1,561 | | | 1,232 | | | 6,696 | | | 4,288 | |
| Gains (Losses) on Asset Dispositions, Net | (27) | | | (21) | | | (29) | | | 74 | | | 17 | |
| Other, Net | 19 | | | 34 | | | 29 | | | 118 | | | 108 | |
| Total | 6,719 | | | 7,593 | | | 6,044 | | | 25,702 | | | 18,642 | |
| | | | | | | | | |
| Operating Expenses | | | | | | | | | |
| Lease and Well | 354 | | | 335 | | | 325 | | | 1,331 | | | 1,135 | |
| Transportation Costs | 237 | | | 257 | | | 228 | | | 966 | | | 863 | |
| Gathering and Processing Costs | 158 | | | 167 | | | 147 | | | 621 | | | 559 | |
| Exploration Costs | 44 | | | 35 | | | 42 | | | 159 | | | 154 | |
| Dry Hole Costs | 4 | | | 18 | | | 43 | | | 45 | | | 71 | |
| Impairments | 142 | | | 94 | | | 206 | | | 382 | | | 376 | |
| Marketing Costs | 1,504 | | | 1,621 | | | 1,160 | | | 6,535 | | | 4,173 | |
| Depreciation, Depletion and Amortization | 878 | | | 906 | | | 910 | | | 3,542 | | | 3,651 | |
| General and Administrative | 156 | | | 162 | | | 139 | | | 570 | | | 511 | |
| Taxes Other Than Income | 389 | | | 334 | | | 316 | | | 1,585 | | | 1,047 | |
| Total | 3,866 | | | 3,929 | | | 3,516 | | | 15,736 | | | 12,540 | |
| | | | | | | | | |
| Operating Income | 2,853 | | | 3,664 | | | 2,528 | | | 9,966 | | | 6,102 | |
| Other Income, Net | 48 | | | 40 | | | 9 | | | 114 | | | 9 | |
| Income Before Interest Expense and Income Taxes | 2,901 | | | 3,704 | | | 2,537 | | | 10,080 | | | 6,111 | |
| Interest Expense, Net | 42 | | | 41 | | | 38 | | | 179 | | | 178 | |
| Income Before Income Taxes | 2,859 | | | 3,663 | | | 2,499 | | | 9,901 | | | 5,933 | |
| Income Tax Provision | 582 | | | 809 | | | 514 | | | 2,142 | | | 1,269 | |
| Net Income | 2,277 | | | 2,854 | | | 1,985 | | | 7,759 | | | 4,664 | |
| | | | | | | | | |
| Dividends Declared per Common Share | 2.3250 | | | 2.2500 | | | 2.7500 | | | 8.8750 | | | 4.9875 | |
| Net Income Per Share | | | | | | | | | |
| Basic | 3.90 | | | 4.90 | | | 3.42 | | | 13.31 | | | 8.03 | |
| Diluted | 3.87 | | | 4.86 | | | 3.39 | | | 13.22 | | | 7.99 | |
| Average Number of Common Shares | | | | | | | | | |
| Basic | 584 | | | 583 | | | 581 | | | 583 | | | 581 | |
| Diluted | 588 | | | 587 | | | 585 | | | 587 | | | 584 | |
| | | | | | | | | | | | | | | | | | | | | | | | | | | | | | | | | | | | | | | | | | | | | | | |
| Wellhead Volumes and Prices | | | | | | | | | | | | | | |
| (Unaudited) | | |
| 4Q 2022 | | 4Q 2021 | | % Change | | | | | | | | 3Q 2022 | | FY 2022 | | FY 2021 | | % Change |
| | | | | | | | | | | | | | | | | | | |
Crude Oil and Condensate Volumes (MBbld) (A) | | | | | | | | | | | | | | | | | |
| United States | 465.1 | | | 449.7 | | | 3 | % | | | | | | | | 464.6 | | | 460.7 | | | 443.4 | | | 4 | % |
| Trinidad | 0.5 | | | 0.9 | | | -44 | % | | | | | | | | 0.5 | | | 0.6 | | | 1.5 | | | -60 | % |
Other International (B) | — | | | — | | | | | | | | | | | — | | | — | | | 0.1 | | | -100 | % |
| Total | 465.6 | | | 450.6 | | | 3 | % | | | | | | | | 465.1 | | | 461.3 | | | 445.0 | | | 4 | % |
| | | | | | | | | | | | | | | | | | | |
Average Crude Oil and Condensate Prices ($/Bbl) (C) | | | | | | | | | | | | | | | | | | | |
| United States | $ | 85.68 | | | $ | 78.31 | | | 9 | % | | | | | | | | $ | 96.05 | | | $ | 97.22 | | | $ | 68.54 | | | 42 | % |
| Trinidad | 75.21 | | | 66.86 | | | 12 | % | | | | | | | | 84.98 | | | 86.16 | | | 56.26 | | | 53 | % |
Other International (B) | — | | | — | | | | | | | | | | | — | | | — | | | 42.36 | | | -100 | % |
| Composite | 85.67 | | | 78.29 | | | 9 | % | | | | | | | | 96.04 | | | 97.21 | | | 68.50 | | | 42 | % |
| | | | | | | | | | | | | | | | | | | |
Natural Gas Liquids Volumes (MBbld) (A) | | | | | | | | | | | | | | | | | | | |
| United States | 189.0 | | | 156.9 | | | 20 | % | | | | | | | | 209.3 | | | 197.7 | | | 144.5 | | | 37 | % |
| Total | 189.0 | | | 156.9 | | | 20 | % | | | | | | | | 209.3 | | | 197.7 | | | 144.5 | | | 37 | % |
| | | | | | | | | | | | | | | | | | | |
Average Natural Gas Liquids Prices ($/Bbl) (C) | | | | | | | | | | | | | | | | | | | |
| United States | $ | 28.55 | | | $ | 40.40 | | | -29 | % | | | | | | | | $ | 36.02 | | | $ | 36.70 | | | $ | 34.35 | | | 7 | % |
| Composite | 28.55 | | | 40.40 | | | -29 | % | | | | | | | | 36.02 | | | 36.70 | | | 34.35 | | | 7 | % |
| | | | | | | | | | | | | | | | | | | |
Natural Gas Volumes (MMcfd) (A) | | | | | | | | | | | | | | | | | | | |
| United States | 1,378 | | | 1,328 | | | 4 | % | | | | | | | | 1,306 | | | 1,315 | | | 1,210 | | | 9 | % |
| Trinidad | 149 | | | 206 | | | -28 | % | | | | | | | | 163 | | | 180 | | | 217 | | | -17 | % |
Other International (B) | — | | | — | | | | | | | | | | | — | | | — | | | 9 | | | -100 | % |
| Total | 1,527 | | | 1,534 | | | 0 | % | | | | | | | | 1,469 | | | 1,495 | | | 1,436 | | | 4 | % |
| | | | | | | | | | | | | | | | | | | |
Average Natural Gas Prices ($/Mcf) (C) | | | | | | | | | | | | | | | | | | | |
| United States | $ | 6.12 | | | $ | 6.40 | | | -4 | % | | | | | | | | $ | 9.35 | | | $ | 7.27 | | | $ | 4.88 | | | 49 | % |
| Trinidad | 3.97 | | | 3.48 | | | 14 | % | | | | | | | | 7.45 | | (E) | 4.43 | | (E) | 3.40 | | | 30 | % |
Other International (B) | — | | | — | | | | | | | | | | | — | | | — | | | 5.67 | | | -100 | % |
| Composite | 5.91 | | | 6.00 | | | -2 | % | | | | | | | | 9.14 | | | 6.93 | | | 4.66 | | | 49 | % |
| | | | | | | | | | | | | | | | | | | |
Crude Oil Equivalent Volumes (MBoed) (D) | | | | | | | | | | | | | | | | | | | |
| United States | 883.8 | | | 827.8 | | | 7 | % | | | | | | | | 891.6 | | | 877.5 | | | 789.6 | | | 11 | % |
| Trinidad | 25.3 | | | 35.3 | | | -28 | % | | | | | | | | 27.6 | | | 30.7 | | | 37.7 | | | -19 | % |
Other International (B) | — | | | — | | | | | | | | | | | — | | | — | | | 1.6 | | | -100 | % |
| Total | 909.1 | | | 863.1 | | | 5 | % | | | | | | | | 919.2 | | | 908.2 | | | 828.9 | | | 10 | % |
| | | | | | | | | | | | | | | | | | | |
Total MMBoe (D) | 83.6 | | | 79.4 | | | 5 | % | | | | | | | | 84.6 | | | 331.5 | | | 302.5 | | | 10 | % |
| | | | | | | | | | | | | | | | | | | |
(A)Thousand barrels per day or million cubic feet per day, as applicable.
(B)Other International includes EOG's China and Canada operations. The China operations were sold in the second quarter of 2021.
(C)Dollars per barrel or per thousand cubic feet, as applicable. Excludes the impact of financial commodity derivative instruments (see Note 12 to the Consolidated Financial Statements in EOG's Annual Report on Form 10-K for the year ended December 31, 2022).
(D)Thousand barrels of oil equivalent per day or million barrels of oil equivalent, as applicable; includes crude oil and condensate, NGLs and natural gas. Crude oil equivalent volumes are determined using a ratio of 1.0 barrel of crude oil and condensate or NGLs to 6.0 thousand cubic feet of natural gas. MMBoe is calculated by multiplying the MBoed amount by the number of days in the period and then dividing that amount by one thousand.
(E)Includes revenue adjustment of $3.37 per Mcf and $0.76 per Mcf ($0.37 per Mcf and $0.09 per Mcf of EOG's composite wellhead natural gas price) for the three months ended September 30, 2022 and the twelve months ended December 31, 2022, respectively, related to a price adjustment per a provision of the natural gas sales contract with NGC amended in July 2022 for natural gas sales during the period from September 2020 through June 2022.
| | | | | | | | | | | |
| Balance Sheets | | | |
| In millions of USD, except share data (Unaudited) |
| December 31, | | December 31, |
| 2022 | | 2021 |
| Current Assets | | | |
| Cash and Cash Equivalents | 5,972 | | | 5,209 | |
| Accounts Receivable, Net | 2,774 | | | 2,335 | |
| Inventories | 1,058 | | | 584 | |
| Income Taxes Receivable | 97 | | | — | |
| Other | 574 | | | 456 | |
| Total | 10,475 | | | 8,584 | |
|
| Property, Plant and Equipment | | | |
| Oil and Gas Properties (Successful Efforts Method) | 67,322 | | | 67,644 | |
| Other Property, Plant and Equipment | 4,786 | | | 4,753 | |
| Total Property, Plant and Equipment | 72,108 | | | 72,397 | |
| Less: Accumulated Depreciation, Depletion and Amortization | (42,679) | | | (43,971) | |
| Total Property, Plant and Equipment, Net | 29,429 | | | 28,426 | |
| Deferred Income Taxes | 33 | | | 11 | |
| Other Assets | 1,434 | | | 1,215 | |
| Total Assets | 41,371 | | | 38,236 | |
|
| Current Liabilities | | | |
| Accounts Payable | 2,532 | | | 2,242 | |
| Accrued Taxes Payable | 405 | | | 518 | |
| Dividends Payable | 482 | | | 436 | |
| Liabilities from Price Risk Management Activities | 169 | | | 269 | |
| Current Portion of Long-Term Debt | 1,283 | | | 37 | |
| Current Portion of Operating Lease Liabilities | 296 | | | 240 | |
| Other | 346 | | | 300 | |
| Total | 5,513 | | | 4,042 | |
| | | |
| Long-Term Debt | 3,795 | | | 5,072 | |
| Other Liabilities | 2,574 | | | 2,193 | |
| Deferred Income Taxes | 4,710 | | | 4,749 | |
| Commitments and Contingencies | | | |
| | | |
| Stockholders' Equity | | | |
| Common Stock, $0.01 Par, 1,280,000,000 Shares Authorized and 588,396,757 Shares and 585,521,512 Shares Issued at December 31, 2022 and 2021, respectively | 206 | | | 206 | |
| Additional Paid in Capital | 6,187 | | | 6,087 | |
| Accumulated Other Comprehensive Loss | (8) | | | (12) | |
| Retained Earnings | 18,472 | | | 15,919 | |
| Common Stock Held in Treasury, 700,281 Shares and 257,268 Shares at December 31, 2022 and 2021, respectively | (78) | | | (20) | |
| Total Stockholders' Equity | 24,779 | | | 22,180 | |
| Total Liabilities and Stockholders' Equity | 41,371 | | | 38,236 | |
| | | | | | | | | | | | | | | | | | | | | | | | | | | | | |
| Cash Flows Statements | | | | | | | | | |
| In millions of USD (Unaudited) | | | | | | | | | |
| 4Q 2022 | | 3Q 2022 | | 4Q 2021 | | FY 2022 | | FY 2021 |
| Cash Flows from Operating Activities | | | | | | | | | |
| Reconciliation of Net Income to Net Cash Provided by Operating Activities: | | | | | | | | | |
| Net Income | 2,277 | | | 2,854 | | | 1,985 | | | 7,759 | | | 4,664 | |
| Items Not Requiring (Providing) Cash | | | | | | | | | |
| Depreciation, Depletion and Amortization | 878 | | | 906 | | | 910 | | | 3,542 | | | 3,651 | |
| Impairments | 142 | | | 94 | | | 206 | | | 382 | | | 376 | |
| Stock-Based Compensation Expenses | 34 | | | 34 | | | 35 | | | 133 | | | 152 | |
| Deferred Income Taxes | 179 | | | 327 | | | 122 | | | (61) | | | (122) | |
| (Gains) Losses on Asset Dispositions, Net | 27 | | | 21 | | | 29 | | | (74) | | | (17) | |
| Other, Net | 15 | | | (5) | | | (2) | | | — | | | 13 | |
| Dry Hole Costs | 4 | | | 18 | | | 43 | | | 45 | | | 71 | |
| Mark-to-Market Financial Commodity Derivative Contracts (Gains) Losses, Net | (233) | | | 18 | | | (136) | | | 3,982 | | | 1,152 | |
| Net Cash Payments for Settlements of Financial Commodity Derivative Contracts | (244) | | | (847) | | | (122) | | | (3,501) | | | (638) | |
| Other, Net | 12 | | | 12 | | | (1) | | | 45 | | | 7 | |
| Changes in Components of Working Capital and Other Assets and Liabilities | | | | | | | | | |
| Accounts Receivable | 661 | | | 392 | | | (182) | | | (347) | | | (821) | |
| Inventories | (223) | | | (140) | | | (108) | | | (534) | | | (13) | |
| Accounts Payable | (211) | | | (88) | | | 341 | | | 90 | | | 456 | |
| Accrued Taxes Payable | (137) | | | (53) | | | 26 | | | (113) | | | 312 | |
| Other Assets | (93) | | | (129) | | | (81) | | | (364) | | | (136) | |
| Other Liabilities | 282 | | | 1,269 | | | 201 | | | (266) | | | (116) | |
| Changes in Components of Working Capital Associated with Investing Activities | 74 | | | 90 | | | (100) | | | 375 | | | (200) | |
| Net Cash Provided by Operating Activities | 3,444 | | | 4,773 | | | 3,166 | | | 11,093 | | | 8,791 | |
| Investing Cash Flows | | | | | | | | | |
| Additions to Oil and Gas Properties | (1,229) | | | (1,102) | | | (949) | | | (4,619) | | | (3,638) | |
| Additions to Other Property, Plant and Equipment | (133) | | | (103) | | | (65) | | | (381) | | | (212) | |
| Proceeds from Sales of Assets | 39 | | | 79 | | | 77 | | | 349 | | | 231 | |
| Other Investing Activities | — | | | — | | | — | | | (30) | | | — | |
| Changes in Components of Working Capital Associated with Investing Activities | (74) | | | (90) | | | 100 | | | (375) | | | 200 | |
| Net Cash Used in Investing Activities | (1,397) | | | (1,216) | | | (837) | | | (5,056) | | | (3,419) | |
| Financing Cash Flows | | | | | | | | | |
| Long-Term Debt Repayments | — | | | — | | | — | | | — | | | (750) | |
| Dividends Paid | (1,327) | | | (1,312) | | | (1,406) | | | (5,148) | | | (2,684) | |
| Treasury Stock Purchased | (23) | | | (37) | | | (8) | | | (118) | | | (41) | |
| Proceeds from Stock Options Exercised and Employee Stock Purchase Plan | 11 | | | — | | | 10 | | | 28 | | | 19 | |
| Repayment of Finance Lease Liabilities | (8) | | | (8) | | | (10) | | | (35) | | | (37) | |
| Net Cash Used in Financing Activities | (1,347) | | | (1,357) | | | (1,414) | | | (5,273) | | | (3,493) | |
| Effect of Exchange Rate Changes on Cash | — | | | (1) | | | 1 | | | (1) | | | 1 | |
| Increase in Cash and Cash Equivalents | 700 | | | 2,199 | | | 916 | | | 763 | | | 1,880 | |
| Cash and Cash Equivalents at Beginning of Period | 5,272 | | | 3,073 | | | 4,293 | | | 5,209 | | | 3,329 | |
| Cash and Cash Equivalents at End of Period | 5,972 | | | 5,272 | | | 5,209 | | | 5,972 | | | 5,209 | |
| | | | | | | | | | | | | | |
| Non-GAAP Financial Measures | | |
| | | | |
| | | | |
To supplement the presentation of its financial results prepared in accordance with generally accepted accounting principles in the United States of America (GAAP), EOG’s quarterly earnings releases and related conference calls, accompanying investor presentation slides and presentation slides for investor conferences contain certain financial measures that are not prepared or presented in accordance with GAAP. These non-GAAP financial measures may include, but are not limited to, Adjusted Net Income (Loss), Cash Flow from Operations Before Working Capital, Free Cash Flow, Net Debt and related statistics.
A reconciliation of each of these measures to their most directly comparable GAAP financial measure and related discussion is included in the tables on the following pages and can also be found in the “Reconciliations & Guidance” section of the “Investors” page of the EOG website at www.eogresources.com.
As further discussed in the tables on the following pages, EOG believes these measures may be useful to investors who follow the practice of some industry analysts who make certain adjustments to GAAP measures (for example, to exclude non-recurring items) to facilitate comparisons to others in EOG’s industry, and who utilize non-GAAP measures in their calculations of certain statistics (for example, return on capital employed and return on equity) used to evaluate EOG’s performance.
EOG believes that the non-GAAP measures presented, when viewed in combination with its financial and operating results prepared in accordance with GAAP, provide a more complete understanding of the factors and trends affecting the company’s performance. As is discussed in the tables on the following pages, EOG uses these non-GAAP measures for purposes of (i) comparing EOG’s financial and operating performance with the financial and operating performance of other companies in the industry and (ii) analyzing EOG’s financial and operating performance across periods.
The non-GAAP measures presented should not be considered in isolation, and should not be considered as a substitute for, or as an alternative to, EOG’s reported Net Income (Loss), Long-Term Debt (including Current Portion of Long-Term Debt), Net Cash Provided by Operating Activities and other financial results calculated in accordance with GAAP. The non-GAAP measures presented should be read in conjunction with EOG's consolidated financial statements prepared in accordance with GAAP.
In addition, because not all companies use identical calculations, EOG’s presentation of non-GAAP measures may not be comparable to, and may be calculated differently from, similarly titled measures disclosed by other companies, including its peer companies. EOG may also change the calculation of one or more of its non-GAAP measures from time to time – for example, to account for changes in its business and operations or to more closely conform to peer company or industry analysts’ practices.
| | | | | | | | | | | | | | | | | | | | | | | |
| Adjusted Net Income (Loss) | | | | | | |
| In millions of USD, except share data (in millions) and per share data (Unaudited) | | | | | | | |
| | | | | | | |
| The following tables adjust the reported Net Income (Loss) (GAAP) to reflect actual net cash received from (payments for) settlements of financial commodity derivative contracts by eliminating the unrealized mark-to-market (gains) losses from these transactions, to eliminate the net (gains) losses on asset dispositions, to add back impairment charges related to certain of EOG's assets (which are generally (i) attributable to declines in commodity prices, (ii) related to sales of certain oil and gas properties or (iii) the result of certain other events or decisions (e.g., a periodic review of EOG's oil and gas properties or other assets), and to make certain other adjustments to exclude non-recurring and certain other items as further described below. EOG believes this presentation may be useful to investors who follow the practice of some industry analysts who adjust reported company earnings to match hedge realizations to production settlement months and make certain other adjustments to exclude non-recurring and certain other items. EOG management uses this information for purposes of comparing its financial performance with the financial performance of other companies in the industry. |
| | | | | | | |
| 4Q 2022 |
| Before
Tax | | Income Tax Impact | | After
Tax | | Diluted Earnings per Share |
| | | | | | | |
| Reported Net Income (GAAP) | 2,859 | | | (582) | | | 2,277 | | | 3.87 | |
| Adjustments: | | | | | | | |
| Gains on Mark-to-Market Financial Commodity Derivative Contracts, Net | (233) | | | 57 | | | (176) | | | (0.31) | |
Net Cash Payments for Settlements of Financial Commodity Derivative Contracts (1) | (244) | | | 48 | | | (196) | | | (0.33) | |
| Less: Losses on Asset Dispositions, Net | 27 | | | (6) | | | 21 | | | 0.04 | |
| Add: Certain Impairments | 31 | | | (16) | | | 15 | | | 0.03 | |
| Adjustments to Net Income | (419) | | | 83 | | | (336) | | | (0.57) | |
| | | | | | | |
| Adjusted Net Income (Non-GAAP) | 2,440 | | | (499) | | | 1,941 | | | 3.30 | |
| | | | | | | |
| Average Number of Common Shares (Non-GAAP) | | | | | | | |
| Basic | | | | | | | 584 | |
| Diluted | | | | | | | 588 | |
| | | | | | | |
(1) Consistent with its customary practice, in calculating Adjusted Net Income (Loss) (non-GAAP), EOG subtracts from reported Net Income (Loss) (GAAP) the total net cash paid for settlements of financial commodity derivative contracts during such period. For the three months ended December 31, 2022, such amount was $244 million.
| | | | | | | | | | | | | | | | | | | | | | | |
Adjusted Net Income (Loss) (Continued) | | | | | | |
| In millions of USD, except share data (in millions) and per share data (Unaudited) | | | | | | | |
| 3Q 2022 |
| Before
Tax | | Income Tax Impact | | After
Tax | | Diluted Earnings per Share |
| | | | | | | |
| Reported Net Income (GAAP) | 3,663 | | | (809) | | | 2,854 | | | 4.86 | |
| Adjustments: | | | | | | | |
| Losses on Mark-to-Market Financial Commodity Derivative Contracts, Net | 18 | | | (4) | | | 14 | | | 0.03 | |
Net Cash Payments for Settlements of Financial Commodity Derivative Contracts (1) | (847) | | | 184 | | | (663) | | | (1.13) | |
| Add: Losses on Asset Dispositions, Net | 21 | | | (3) | | | 18 | | | 0.03 | |
| Add: Certain Impairments | 46 | | | (8) | | | 38 | | | 0.06 | |
| Less: Severance Tax Refund | (115) | | | 25 | | | (90) | | | (0.15) | |
| Add: Severance Tax Consulting Fees | 16 | | | (3) | | | 13 | | | 0.02 | |
| Less: Interest on Severance Tax Refund | (7) | | | 2 | | | (5) | | | (0.01) | |
| Adjustments to Net Income | (868) | | | 193 | | | (675) | | | (1.15) | |
| | | | | | | |
| Adjusted Net Income (Non-GAAP) | 2,795 | | | (616) | | | 2,179 | | | 3.71 | |
| | | | | | | |
| Average Number of Common Shares (Non-GAAP) | | | | | | | |
| Basic | | | | | | | 583 | |
| Diluted | | | | | | | 587 | |
(1) Consistent with its customary practice, in calculating Adjusted Net Income (Loss) (non-GAAP), EOG subtracts from reported Net Income (Loss) (GAAP) the total net cash paid for settlements of financial commodity derivative contracts during such period. For the three months ended September 30, 2022, such amount was $847 million, of which $63 million was related to the early termination of certain contracts.
| | | | | | | | | | | | | | | | | | | | | | | |
Adjusted Net Income (Loss) (Continued) | | | | | | |
| | | | | | | |
| 4Q 2021 |
| Before
Tax | | Income Tax Impact | | After
Tax | | Diluted Earnings per Share |
| | | | | | | |
| Reported Net Income (GAAP) | 2,499 | | | (514) | | | 1,985 | | | 3.39 | |
| Adjustments: | | | | | | | |
| Gains on Mark-to-Market Financial Commodity Derivative Contracts, Net | (136) | | | 32 | | | (104) | | | (0.17) | |
Net Cash Payments for Settlements of Financial Commodity Derivative Contracts (1) | (122) | | | 25 | | | (97) | | | (0.17) | |
| Add: Losses on Asset Dispositions, Net | 29 | | | (7) | | | 22 | | | 0.04 | |
| Add: Certain Impairments | — | | | — | | | — | | | — | |
| Adjustments to Net Income | (229) | | | 50 | | | (179) | | | (0.30) | |
| | | | | | | |
| Adjusted Net Income (Non-GAAP) | 2,270 | | | (464) | | | 1,806 | | | 3.09 | |
| | | | | | | |
| Average Number of Common Shares (Non-GAAP) | | | | | | | |
| Basic | | | | | | | 581 | |
| Diluted | | | | | | | 585 | |
(1) Consistent with its customary practice, in calculating Adjusted Net Income (Loss) (non-GAAP), EOG subtracts from reported Net Income (Loss) (GAAP) the total net cash paid for settlements of financial commodity derivative contracts during such period. For the three months ended December 31, 2021, such amount was $122 million.
| | | | | | | | | | | | | | | | | | | | | | | |
Adjusted Net Income (Loss) (Continued) | | | | | | |
| In millions of USD, except share data (in millions) and per share data (Unaudited) | | | | | | | |
| FY 2022 |
| Before
Tax | | Income Tax Impact | | After
Tax | | Diluted Earnings per Share |
| | | | | | | |
| Reported Net Income (GAAP) | 9,901 | | | (2,142) | | | 7,759 | | | 13.22 | |
| Adjustments: | | | | | | | |
| Losses on Mark-to-Market Financial Commodity Derivative Contracts, Net | 3,982 | | | (858) | | | 3,124 | | | 5.32 | |
Net Cash Payments for Settlements of Financial Commodity Derivative Contracts (1) | (3,501) | | | 755 | | | (2,746) | | | (4.68) | |
| Less: Gains on Asset Dispositions, Net | (74) | | | 17 | | | (57) | | | (0.10) | |
| Add: Certain Impairments | 113 | | | (31) | | | 82 | | | 0.14 | |
| Less: Severance Tax Refund | (115) | | | 25 | | | (90) | | | (0.15) | |
| Add: Severance Tax Consulting Fees | 16 | | | (3) | | | 13 | | | 0.02 | |
| Less: Interest on Severance Tax Refund | (7) | | | 2 | | | (5) | | | (0.01) | |
| Adjustments to Net Income | 414 | | | (93) | | | 321 | | | 0.54 | |
| | | | | | | |
| Adjusted Net Income (Non-GAAP) | 10,315 | | | (2,235) | | | 8,080 | | | 13.76 | |
| | | | | | | |
| Average Number of Common Shares (Non-GAAP) | | | | | | | |
| Basic | | | | | | | 583 | |
| Diluted | | | | | | | 587 | |
| | | | | | | |
(1) Consistent with its customary practice, in calculating Adjusted Net Income (Loss) (non-GAAP), EOG subtracts from reported Net Income (Loss) (GAAP) the total net cash paid for settlements of financial commodity derivative contracts during such period. For the twelve months ended December 31, 2022, such amount was $3,501 million, of which $1,391 million was related to the early termination of certain contracts.
| | | | | | | | | | | | | | | | | | | | | | | |
Adjusted Net Income (Loss) (Continued) | | | | | | |
| In millions of USD, except share data (in millions) and per share data (Unaudited) | | | | | | | |
| FY 2021 |
| Before
Tax | | Income Tax Impact | | After
Tax | | Diluted Earnings per Share |
| | | | | | | |
| Reported Net Income (GAAP) | 5,933 | | | (1,269) | | | 4,664 | | | 7.99 | |
| Adjustments: | | | | | | | |
| Losses on Mark-to-Market Financial Commodity Derivative Contracts, Net | 1,152 | | | (250) | | | 902 | | | 1.54 | |
Net Cash Payments for Settlements of Financial Commodity Derivative Contracts (1) | (638) | | | 138 | | | (500) | | | (0.86) | |
| Less: Gains on Asset Dispositions, Net | (17) | | | 9 | | | (8) | | | (0.01) | |
| Add: Certain Impairments | 15 | | | — | | | 15 | | | 0.03 | |
| Less: Tax Benefits Related to Exiting Canada Operations | — | | | (45) | | | (45) | | | (0.08) | |
| Adjustments to Net Income | 512 | | | (148) | | | 364 | | | 0.62 | |
| | | | | | | |
| Adjusted Net Income (Non-GAAP) | 6,445 | | | (1,417) | | | 5,028 | | | 8.61 | |
| | | | | | | |
| Average Number of Common Shares (Non-GAAP) | | | | | | | |
| Basic | | | | | | | 581 | |
| Diluted | | | | | | | 584 | |
(1) Consistent with its customary practice, in calculating Adjusted Net Income (Loss) (non-GAAP), EOG subtracts from reported Net Income (Loss) (GAAP) the total net cash paid for settlements of financial commodity derivative contracts during such period. For the twelve months ended December 31, 2021, such amount was $638 million.
| | | | | | | | | | | |
| Adjusted Net Income Per Share | | | |
| In millions of USD, except share data (in millions), per share data, production volume data and per Boe data (Unaudited) |
| | | |
| 3Q 2022 Adjusted Net Income per Share (Non-GAAP) | | | 3.71 | |
| | | |
| Realized Price | | | |
| 4Q 2022 Composite Average Wellhead Revenue per Boe | 59.74 | | | |
| Less: 3Q 2022 Composite Average Wellhead Revenue per Boe | (71.40) | | | |
| Subtotal | (11.66) | | | |
| Multiplied by: 4Q 2022 Crude Oil Equivalent Volumes (MMBoe) | 83.6 | | | |
| Total Change in Revenue | (975) | | | |
| Less: Income Tax Benefit (Provision) Imputed (based on 23%) | 224 | | | |
| Change in Net Income | (751) | | | |
| Change in Diluted Earnings per Share | | | (1.28) | |
| | | |
| Wellhead Volumes | | | |
| 4Q 2022 Crude Oil Equivalent Volumes (MMBoe) | 83.6 | | | |
| Less: 3Q 2022 Crude Oil Equivalent Volumes (MMBoe) | (84.6) | | | |
| Subtotal | (1.0) | | | |
| Multiplied by: 4Q 2022 Composite Average Margin per Boe (Non-GAAP) (Including Total Exploration Costs) (refer to "Revenues, Costs and Margins Per Barrel of Oil Equivalent" schedule) | 31.37 | | | |
| Change in Revenue | (31) | | | |
| Less: Income Tax Benefit (Provision) Imputed (based on 23%) | 7 | | | |
| Change in Net Income | (24) | | | |
| Change in Diluted Earnings per Share | | | (0.04) | |
| | | |
| Certain Operating Costs per Boe | | | |
| 3Q 2022 Total Cash Operating Costs (Non-GAAP) and Total DD&A per Boe (refer to "Revenues, Costs and Margins Per Barrel of Oil Equivalent" schedule) | 21.41 | | | |
| Less: 4Q 2022 Total Cash Operating Costs (Non-GAAP) and Total DD&A per Boe (refer to "Revenues, Costs and Margins Per Barrel of Oil Equivalent" schedule) | (21.32) | | | |
| Subtotal | 0.09 | | | |
| Multiplied by: 4Q 2022 Crude Oil Equivalent Volumes (MMBoe) | 83.6 | | | |
| Change in Before-Tax Net Income | 8 | | | |
| Less: Income Tax Benefit (Provision) Imputed (based on 23%) | (2) | | | |
| Change in Net Income | 6 | | | |
| Change in Diluted Earnings per Share | | | 0.01 | |
| | | | | | | | | | | |
Adjusted Net Income Per Share (Continued) | | | |
| In millions of USD, except share data (in millions), per share data, production volume data and per Boe data (Unaudited) |
| | | |
| Net Cash Received from (Payments for) Settlements of Financial Commodity Derivative Contracts | | |
| 4Q 2022 Net Cash Received from (Payments for) Settlement of Financial Commodity Derivative Contracts | (244) | | | |
| Less: Income Tax Benefit (Provision) | 48 | | | |
| After Tax - (a) | (196) | | | |
| 3Q 2022 Net Cash Received from (Payments for) Settlement of Financial Commodity Derivative Contracts | (847) | | | |
| Less: Income Tax Benefit (Provision) | 184 | | | |
| After Tax - (b) | (663) | | | |
| Change in Net Income - (a) - (b) | 467 | | | |
| Change in Diluted Earnings per Share | | | 0.79 | |
| | | |
Other (1) | | | 0.11 | |
| | | |
| 4Q 2022 Adjusted Net Income per Share (Non-GAAP) | | | 3.30 | |
| | | |
| 4Q 2022 Average Number of Common Shares (Non-GAAP) - Diluted | 588 | | | |
| | | |
(1)Includes gathering, processing and marketing revenue, gains (losses) on asset dispositions, other revenue, exploration, dry hole, impairments and marketing costs, taxes other than income, other income (expense), interest expense and the impact of changes in the effective income tax rate.
| | | | | | | | | | | |
| Adjusted Net Income per Share | | | |
| In millions of USD, except share data (in millions), per share data, production volume data and per Boe data (Unaudited) |
| | | |
| FY 2021 Adjusted Net Income per Share (Non-GAAP) | | | 8.61 | |
| | | |
| Realized Price | | | |
| FY 2022 Composite Average Wellhead Revenue per Boe | 68.77 | | | |
| Less: FY 2021 Composite Average Wellhead Revenue per Boe | (50.84) | | | |
| Subtotal | 17.93 | | | |
| Multiplied by: FY 2022 Crude Oil Equivalent Volumes (MMBoe) | 331.5 | | | |
| Total Change in Revenue | 5,944 | | | |
| Less: Income Tax Benefit (Provision) Imputed (based on 23%) | (1,367) | | | |
| Change in Net Income | 4,577 | | | |
| Change in Diluted Earnings per Share | | | 7.80 | |
| | | |
| Wellhead Volumes | | | |
| FY 2022 Crude Oil Equivalent Volumes (MMBoe) | 331.5 | | | |
| Less: FY 2021 Crude Oil Equivalent Volumes (MMBoe) | (302.5) | | | |
| Subtotal | 29.0 | | | |
Multiplied by: FY 2022 Composite Average Margin per Boe (Non-GAAP)
(Including Total Exploration Costs) (refer to "Revenues, Costs and Margins Per Barrel of Oil Equivalent" schedule) | 40.51 | | | |
| Change in Revenue | 1,175 | | | |
| Less: Income Tax Benefit (Provision) Imputed (based on 23%) | (270) | | | |
| Change in Net Income | 905 | | | |
| Change in Diluted Earnings per Share | | | 1.54 | |
| | | |
| Certain Operating Costs per Boe | | | |
| FY 2021 Total Cash Operating Costs (Non-GAAP) and Total DD&A per Boe (refer to "Revenues, Costs and Margins Per Barrel of Oil Equivalent" schedule) | 22.21 | | | |
| Less: FY 2022 Total Cash Operating Costs (Non-GAAP) and Total DD&A per Boe (refer to "Revenues, Costs and Margins Per Barrel of Oil Equivalent" schedule) | (21.16) | | | |
| Subtotal | 1.05 | | | |
| Multiplied by: FY 2022 Crude Oil Equivalent Volumes (MMBoe) | 331.5 | | | |
| Change in Before-Tax Net Income | 348 | | | |
| Less: Income Tax Benefit (Provision) Imputed (based on 23%) | (80) | | | |
| Change in Net Income | 268 | | | |
| Change in Diluted Earnings per Share | | | 0.46 | |
| | | | | | | | | | | |
Adjusted Net Income Per Share (Continued) | | | |
| In millions of USD, except share data (in millions), per share data, production volume data and per Boe data (Unaudited) |
| | | |
| Net Cash Received from (Payments for) Settlements of Financial Commodity Derivative Contracts | | |
| FY 2022 Net Cash Received from (Payments for) Settlement of Financial Commodity Derivative Contracts | (3,501) | | | |
| Less: Income Tax Benefit (Provision) | 755 | | | |
| After Tax - (a) | (2,746) | | | |
| FY 2021 Net Cash Received from (Payments for) Settlement of Financial Commodity Derivative Contracts | (638) | | | |
| Less: Income Tax Benefit (Provision) | 138 | | | |
| After Tax - (b) | (500) | | | |
| Change in Net Income - (a) - (b) | (2,246) | | | |
| Change in Diluted Earnings per Share | | | (3.83) | |
| | | |
Other (1) | | | (0.82) | |
| | | |
| FY 2022 Adjusted Net Income per Share (Non-GAAP) | | | 13.76 | |
| | | |
| FY 2022 Average Number of Common Shares (Non-GAAP) - Diluted | 587 | | | |
| | | |
(1)Includes gathering, processing and marketing revenue, gains (losses) on asset dispositions, other revenue, exploration, dry hole, impairments and marketing costs, taxes other than income, other income (expense), interest expense and the impact of changes in the effective income tax rate.
| | | | | | | | | | | |
| Net Income per Share | | | |
| In millions of USD, except share data (in millions), per share data, production volume data and per Boe data (Unaudited) |
| | | |
| 3Q 2022 Net Income per Share (GAAP) | | | 4.86 | |
| | | |
| Realized Price | | | |
| 4Q 2022 Composite Average Wellhead Revenue per Boe | 59.74 | | | |
| Less: 3Q 2022 Composite Average Wellhead Revenue per Boe | (71.40) | | | |
| Subtotal | (11.66) | | | |
| Multiplied by: 4Q 2022 Crude Oil Equivalent Volumes (MMBoe) | 83.6 | | | |
| Total Change in Revenue | (975) | | | |
| Less: Income Tax Benefit (Provision) Imputed (based on 23%) | 224 | | | |
| Change in Net Income | (751) | | | |
| Change in Diluted Earnings per Share | | | (1.28) | |
| | | |
| Wellhead Volumes | | | |
| 4Q 2022 Crude Oil Equivalent Volumes (MMBoe) | 83.6 | | | |
| Less: 3Q 2022 Crude Oil Equivalent Volumes (MMBoe) | (84.6) | | | |
| Subtotal | (1.0) | | | |
Multiplied by: 4Q 2022 Composite Average Margin per Boe (Non-GAAP)
(Including Total Exploration Costs) (refer to "Revenues, Costs and Margins Per Barrel of Oil Equivalent" schedule) | 31.37 | | | |
| Change in Revenue | (31) | | | |
| Less: Income Tax Benefit (Provision) Imputed (based on 23%) | 7 | | | |
| Change in Net Income | (24) | | | |
| Change in Diluted Earnings per Share | | | (0.04) | |
| | | |
| Certain Operating Costs per Boe | | | |
| 3Q 2022 Total Cash Operating Costs (GAAP) and Total DD&A per Boe (refer to "Revenues, Costs and Margins Per Barrel of Oil Equivalent" schedule) | 21.60 | | | |
| Less: 4Q 2022 Total Cash Operating Costs (GAAP) and Total DD&A per Boe (refer to "Revenues, Costs and Margins Per Barrel of Oil Equivalent" schedule) | (21.32) | | | |
| Subtotal | 0.28 | | | |
| Multiplied by: 4Q 2022 Crude Oil Equivalent Volumes (MMBoe) | 83.6 | | | |
| Change in Before-Tax Net Income | 23 | | | |
| Less: Income Tax Benefit (Provision) Imputed (based on 23%) | (5) | | | |
| Change in Net Income | 18 | | | |
| Change in Diluted Earnings per Share | | | 0.03 | |
| | | | | | | | | | | |
Net Income Per Share (Continued) | | | |
| In millions of USD, except share data (in millions), per share data, production volume data and per Boe data (Unaudited) |
| | | |
| Gains (Losses) on Mark-to-Market Financial Commodity Derivative Contracts, Net | | |
| 4Q 2022 Net Gains (Losses) on Mark-to-Market Financial Commodity Derivative Contracts | 233 | | | |
| Less: 3Q 2022 Net (Gains) Losses on Mark-to-Market Financial Commodity Derivative Contracts | 18 | | | |
| Subtotal | 251 | | | |
| Less: Income Tax Benefit (Provision) Imputed (based on 23%) | (58) | | | |
| Change in Net Income | 193 | | | |
| Change in Diluted Earnings per Share | | | 0.33 | |
| | | |
Other (1) | | | (0.03) | |
| | | |
| 4Q 2022 Net Income per Share (GAAP) | | | 3.87 | |
| | | |
| 4Q 2022 Average Number of Common Shares (GAAP) - Diluted | 588 | | | |
| | | |
(1)Includes gathering, processing and marketing revenue, gains (losses) on asset dispositions, other revenue, exploration, dry hole, impairments and marketing costs, taxes other than income, other income (expense), interest expense and the impact of changes in the effective income tax rate.
| | | | | | | | | | | |
| Net Income per Share | | | |
| In millions of USD, except share data (in millions), per share data, production volume data and per Boe data (Unaudited) |
| | | |
| FY 2021 Net Income per Share (GAAP) | | | 7.99 | |
| | | |
| Realized Price | | | |
| FY 2022 Composite Average Wellhead Revenue per Boe | 68.77 | | | |
| Less: FY 2021 Composite Average Wellhead Revenue per Boe | (50.84) | | | |
| Subtotal | 17.93 | | | |
| Multiplied by: FY 2022 Crude Oil Equivalent Volumes (MMBoe) | 331.5 | | | |
| Total Change in Revenue | 5,944 | | | |
| Less: Income Tax Benefit (Provision) Imputed (based on 23%) | (1,367) | | | |
| Change in Net Income | 4,577 | | | |
| Change in Diluted Earnings per Share | | | 7.80 | |
| | | |
| Wellhead Volumes | | | |
| FY 2022 Crude Oil Equivalent Volumes (MMBoe) | 331.5 | | | |
| Less: FY 2021 Crude Oil Equivalent Volumes (MMBoe) | (302.5) | | | |
| Subtotal | 29.0 | | | |
Multiplied by: FY 2022 Composite Average Margin per Boe (Non-GAAP)
(Including Total Exploration Costs) (refer to "Revenues, Costs and Margins Per Barrel of Oil Equivalent" schedule) | 40.51 | | | |
| Change in Revenue | 1,175 | | | |
| Less: Income Tax Benefit (Provision) Imputed (based on 23%) | (270) | | | |
| Change in Net Income | 905 | | | |
| Change in Diluted Earnings per Share | | | 1.54 | |
| | | |
| Certain Operating Costs per Boe | | | |
| FY 2021 Total Cash Operating Costs (GAAP) and Total DD&A per Boe (refer to "Revenues, Costs and Margins Per Barrel of Oil Equivalent" schedule) | 22.21 | | | |
| Less: FY 2022 Total Cash Operating Costs (GAAP) and Total DD&A per Boe (refer to "Revenues, Costs and Margins Per Barrel of Oil Equivalent" schedule) | (21.21) | | | |
| Subtotal | 1.00 | | | |
| Multiplied by: FY 2022 Crude Oil Equivalent Volumes (MMBoe) | 331.5 | | | |
| Change in Before-Tax Net Income | 332 | | | |
| Less: Income Tax Benefit (Provision) Imputed (based on 23%) | (76) | | | |
| Change in Net Income | 256 | | | |
| Change in Diluted Earnings per Share | | | 0.44 | |
| | | | | | | | | | | |
Net Income Per Share (Continued) | | | |
| In millions of USD, except share data (in millions), per share data, production volume data and per Boe data (Unaudited) |
| | | |
| Gains (Losses) on Mark-to-Market Financial Commodity Derivative Contracts, Net | | |
| FY 2022 Net Gains (Losses) on Mark-to-Market Financial Commodity Derivative Contracts | (3,982) | | | |
| Less: FY 2021 Net (Gains) Losses on Mark-to-Market Financial Commodity Derivative Contracts | 1,152 | | | |
| Subtotal | (2,830) | | | |
| Less: Income Tax Benefit (Provision) Imputed (based on 23%) | 651 | | | |
| Change in Net Income | (2,179) | | | |
| Change in Diluted Earnings per Share | | | (3.71) | |
| | | |
Other (1) | | | (0.84) | |
| | | |
| FY 2022 Net Income per Share (GAAP) | | | 13.22 | |
| | | |
| FY 2022 Average Number of Common Shares (GAAP) - Diluted | 587 | | | |
| | | |
(1)Includes gathering, processing and marketing revenue, gains (losses) on asset dispositions, other revenue, exploration, dry hole, impairments and marketing costs, taxes other than income, other income (expense), interest expense and the impact of changes in the effective income tax rate.
| | | | | | | | | | | | | | | | | | | | | | | | | | | | | | | | | |
| Cash Flow from Operations and Free Cash Flow | |
| In millions of USD (Unaudited) | | | | | | | | | | | | | |
| | | | | | | | | | | | | |
| The following tables reconcile Net Cash Provided by Operating Activities (GAAP) to Cash Flow from Operations Before Working Capital (Non-GAAP). EOG believes this presentation may be useful to investors who follow the practice of some industry analysts who adjust Net Cash Provided by Operating Activities for Changes in Components of Working Capital and Other Assets and Liabilities, Changes in Components of Working Capital Associated with Investing and Financing Activities and certain other adjustments to exclude non-recurring and certain other items as further described below. EOG defines Free Cash Flow (Non-GAAP) for a given period as Cash Flow from Operations Before Working Capital (Non-GAAP) (see below reconciliation) for such period less the total capital expenditures (Non-GAAP) during such period, as is illustrated below. EOG management uses this information for comparative purposes within the industry. To further the comparability of EOG’s financial results with those of EOG’s peer companies and other companies in the industry, EOG now utilizes Cash Flow from Operations Before Working Capital (Non-GAAP), instead of Discretionary Cash Flow (Non-GAAP), in calculating its Free Cash Flow (Non-GAAP). Accordingly, Free Cash Flow (Non-GAAP) for the fourth, third, second and first quarter of 2022 and twelve-month period ended December 31 2022, have been calculated on such basis, and the calculations of Free Cash Flow (Non-GAAP) for each of the prior periods shown have been revised and conformed. |
| | | | | | | | | | | | | |
| | | | | 4Q 2022 | | 3Q 2022 | | 2Q 2022 | | 1Q 2022 | | 4Q 2021 |
| | | | | | | | | | | | | |
| Net Cash Provided by Operating Activities (GAAP) | | | | | 3,444 | | | 4,773 | | | 2,048 | | | 828 | | | 3,166 | |
| | | | | | | | | | | | | |
| Adjustments: | | | | | | | | | | | | | |
| Changes in Components of Working Capital and Other Assets and Liabilities | | | | | | | | | | | | | |
| Accounts Receivable | | | | | (661) | | | (392) | | | 522 | | | 878 | | | 182 | |
| Inventories | | | | | 223 | | | 140 | | | 157 | | | 14 | | | 108 | |
| Accounts Payable | | | | | 211 | | | 88 | | | (259) | | | (130) | | | (341) | |
| Accrued Taxes Payable | | | | | 137 | | | 53 | | | 536 | | | (613) | | | (26) | |
| Other Assets | | | | | 93 | | | 129 | | | (71) | | | 213 | | | 81 | |
| Other Liabilities | | | | | (282) | | | (1,269) | | | (433) | | | 2,250 | | | (201) | |
| Changes in Components of Working Capital Associated with Investing Activities | | | | | (74) | | | (90) | | | (143) | | | (68) | | | 100 | |
| Cash Flow from Operations Before Working Capital (Non-GAAP) | | | | | 3,091 | | | 3,432 | | | 2,357 | | | 3,372 | | | 3,069 | |
| | | | | | | | | | | | | |
| Cash Flow from Operations Before Working Capital (Non-GAAP) | | | | | 3,091 | | | 3,432 | | | 2,357 | | | 3,372 | | | 3,069 | |
| Less: | | | | | | | | | | | | | |
Total Capital Expenditures (Non-GAAP) (a) | | | | | (1,361) | | | (1,166) | | | (1,071) | | | (1,009) | | | (1,015) | |
| Free Cash Flow (Non-GAAP) | | | | | 1,730 | | | 2,266 | | | 1,286 | | | 2,363 | | | 2,054 | |
| | | | | | | | | | | | | |
| (a) See below reconciliation of Total Expenditures (GAAP) to Total Capital Expenditures (Non-GAAP): |
| | | | | | | | | | | | | |
| | | | | 4Q 2022 | | 3Q 2022 | | 2Q 2022 | | 1Q 2022 | | 4Q 2021 |
| | | | | | | | | | | | | |
| Total Expenditures (GAAP) | | | | | 1,535 | | | 1,410 | | | 1,521 | | | 1,144 | | | 1,137 | |
| Less: | | | | | | | | | | | | | |
| Asset Retirement Costs | | | | | (89) | | | (139) | | | (43) | | | (27) | | | (71) | |
| Non-Cash Acquisition Costs of Unproved Properties | | | | | (20) | | | (28) | | | (21) | | | (58) | | | (8) | |
| Acquisition Costs of Proved Properties | | | | | (21) | | | (42) | | | (351) | | | (5) | | | (1) | |
| Exploration Costs | | | | | (44) | | | (35) | | | (35) | | | (45) | | | (42) | |
| Total Capital Expenditures (Non-GAAP) | | | | | 1,361 | | | 1,166 | | | 1,071 | | | 1,009 | | | 1,015 | |
| | | | | | | | | | | | | | | | | | | | | | | | | | | | | | | | | |
Cash Flow from Operations and Free Cash Flow (Continued) | |
| In millions of USD (Unaudited) | | | | | | | | | | | | | |
| | | | | | | | | | | | | |
| | | | | | | | | | | FY 2022 | | FY 2021 |
| | | | | | | | | | | | | |
| Net Cash Provided by Operating Activities (GAAP) | | | | | | | | | | | 11,093 | | | 8,791 | |
| | | | | | | | | | | | | |
| Adjustments: | | | | | | | | | | | | | |
| Changes in Components of Working Capital and Other Assets and Liabilities | | | | | | |
| Accounts Receivable | | | | | | | | | | | 347 | | | 821 | |
| Inventories | | | | | | | | | | | 534 | | | 13 | |
| Accounts Payable | | | | | | | | | | | (90) | | | (456) | |
| Accrued Taxes Payable | | | | | | | | | | | 113 | | | (312) | |
| Other Assets | | | | | | | | | | | 364 | | | 136 | |
| Other Liabilities | | | | | | | | | | | 266 | | | 116 | |
| Changes in Components of Working Capital Associated with Investing Activities | | | | (375) | | | 200 | |
| Cash Flow from Operations Before Working Capital (Non-GAAP) | | | | 12,252 | | | 9,309 | |
| | | | | | | | | | | | | |
| Cash Flow from Operations Before Working Capital (Non-GAAP) | | | | 12,252 | | | 9,309 | |
| Less: | | | | | | | | | | | | | |
Total Capital Expenditures (Non-GAAP) (a) | | | | | | | | | | | (4,607) | | | (3,755) | |
| Free Cash Flow (Non-GAAP) | | | | | | | | | | | 7,645 | | | 5,554 | |
| | | | | | | | | | | | | |
| (a) See below reconciliation of Total Expenditures (GAAP) to Total Capital Expenditures (Non-GAAP): |
| | | | | | | | | | | | | |
| | | | | | | | | | | FY 2022 | | FY 2021 |
| | | | | | | | | | | | | |
| Total Expenditures (GAAP) | | | | | | | | | | | 5,610 | | | 4,255 | |
| Less: | | | | | | | | | | | | | |
| Asset Retirement Costs | | | | | | | | | | | (298) | | | (127) | |
| Non-Cash Acquisition Costs of Unproved Properties | | | | (127) | | | (45) | |
| Non-Cash Finance Leases | | | | | | | | | | | — | | | (74) | |
| Acquisition Costs of Proved Properties | | | | | | | | | | | (419) | | | (100) | |
| Exploration Costs | | | | | | | | | | | (159) | | | (154) | |
| Total Capital Expenditures (Non-GAAP) | | | | | | | | | | | 4,607 | | | 3,755 | |
| | | | | | | | | | | | | | | | | | | | | | | | | | | | | | | | | | | |
| Net Debt-to-Total Capitalization Ratio | | | | | | |
| In millions of USD, except ratio data (Unaudited) | | | | | | | | | | | | | | | |
| | | | | | | | | | | | | | | |
| The following tables reconcile Current and Long-Term Debt (GAAP) to Net Debt (Non-GAAP) and Total Capitalization (GAAP) to Total Capitalization (Non-GAAP), as used in the Net Debt-to-Total Capitalization ratio calculation. A portion of the cash is associated with international subsidiaries; tax considerations may impact debt paydown. EOG believes this presentation may be useful to investors who follow the practice of some industry analysts who utilize Net Debt and Total Capitalization (Non-GAAP) in their Net Debt-to-Total Capitalization ratio calculation. EOG management uses this information for comparative purposes within the industry. |
| | | | | | | | | | | | | | | |
| | | | | | | December 31, 2022 | | September 30, 2022 | | June 30, 2022 | | March 31, 2022 | | December 31, 2021 |
| | | | | | | | | | | | | | | |
| Total Stockholders' Equity - (a) | | | | | | | 24,779 | | | 23,849 | | | 22,312 | | | 21,540 | | | 22,180 | |
| | | | | | | | | | | | | | | |
| Current and Long-Term Debt (GAAP) - (b) | | | | | | | 5,078 | | | 5,084 | | | 5,091 | | | 5,099 | | | 5,109 | |
| Less: Cash | | | | | | | (5,972) | | | (5,272) | | | (3,073) | | | (4,009) | | | (5,209) | |
| Net Debt (Non-GAAP) - (c) | | | | | | | (894) | | | (188) | | | 2,018 | | | 1,090 | | | (100) | |
| | | | | | | | | | | | | | | |
| Total Capitalization (GAAP) - (a) + (b) | | | | | | | 29,857 | | | 28,933 | | | 27,403 | | | 26,639 | | | 27,289 | |
| | | | | | | | | | | | | | | |
| Total Capitalization (Non-GAAP) - (a) + (c) | | | | | | | 23,885 | | | 23,661 | | | 24,330 | | | 22,630 | | | 22,080 | |
| | | | | | | | | | | | | | | |
| Debt-to-Total Capitalization (GAAP) - (b) / [(a) + (b)] | | | | | | | 17.0 | % | | 17.6 | % | | 18.6 | % | | 19.1 | % | | 18.7 | % |
| | | | | | | | | | | | | | | |
| Net Debt-to-Total Capitalization (Non-GAAP) - (c) / [(a) + (c)] | | | | | | | -3.7 | % | | -0.8 | % | | 8.3 | % | | 4.8 | % | | -0.5 | % |
| | | | | | | | | | | | | | | | | | | | | | | | |
| Proved Reserves and Reserve Replacement Data | | | |
| (Unaudited) | |
| | | | | | | | |
| 2022 Net Proved Reserves Reconciliation Summary | United
States | | Trinidad | | Other
International | | Total | |
| Crude Oil and Condensate (MMBbl) | | | | | | | | |
| Beginning Reserves | 1,546 | | | 2 | | | — | | | 1,548 | | |
| Revisions | 120 | | | — | | | — | | | 120 | | |
| Purchases in Place | 7 | | | — | | | — | | | 7 | | |
| Extensions, Discoveries and Other Additions | 175 | | | — | | | — | | | 175 | | |
| Sales in Place | (21) | | | — | | | — | | | (21) | | |
| Production | (168) | | | — | | | — | | | (168) | | |
| Ending Reserves | 1,659 | | | 2 | | | — | | | 1,661 | | |
| | | | | | | | |
| Natural Gas Liquids (MMBbl) | | | | | | | | |
| Beginning Reserves | 829 | | | — | | | — | | | 829 | | |
| Revisions | 258 | | | — | | | — | | | 258 | | |
| Purchases in Place | 4 | | | — | | | — | | | 4 | | |
| Extensions, Discoveries and Other Additions | 140 | | | — | | | — | | | 140 | | |
| Sales in Place | (14) | | | — | | | — | | | (14) | | |
| Production | (72) | | | — | | | — | | | (72) | | |
| Ending Reserves | 1,145 | | | — | | | — | | | 1,145 | | |
| | | | | | | | |
| Natural Gas (Bcf) | | | | | | | | |
| Beginning Reserves | 7,907 | | | 315 | | | — | | | 8,222 | | |
| Revisions | (271) | | | 18 | | | — | | | (253) | | |
| Purchases in Place | 32 | | | — | | | — | | | 32 | | |
| Extensions, Discoveries and Other Additions | 1,414 | | | 51 | | | — | | | 1,465 | | |
| Sales in Place | (316) | | | — | | | — | | | (316) | | |
| Production | (493) | | | (66) | | | — | | | (559) | | |
| Ending Reserves | 8,273 | | | 318 | | | — | | | 8,591 | | |
| | | | | | | | |
| Oil Equivalents (MMBoe) | | | | | | | | |
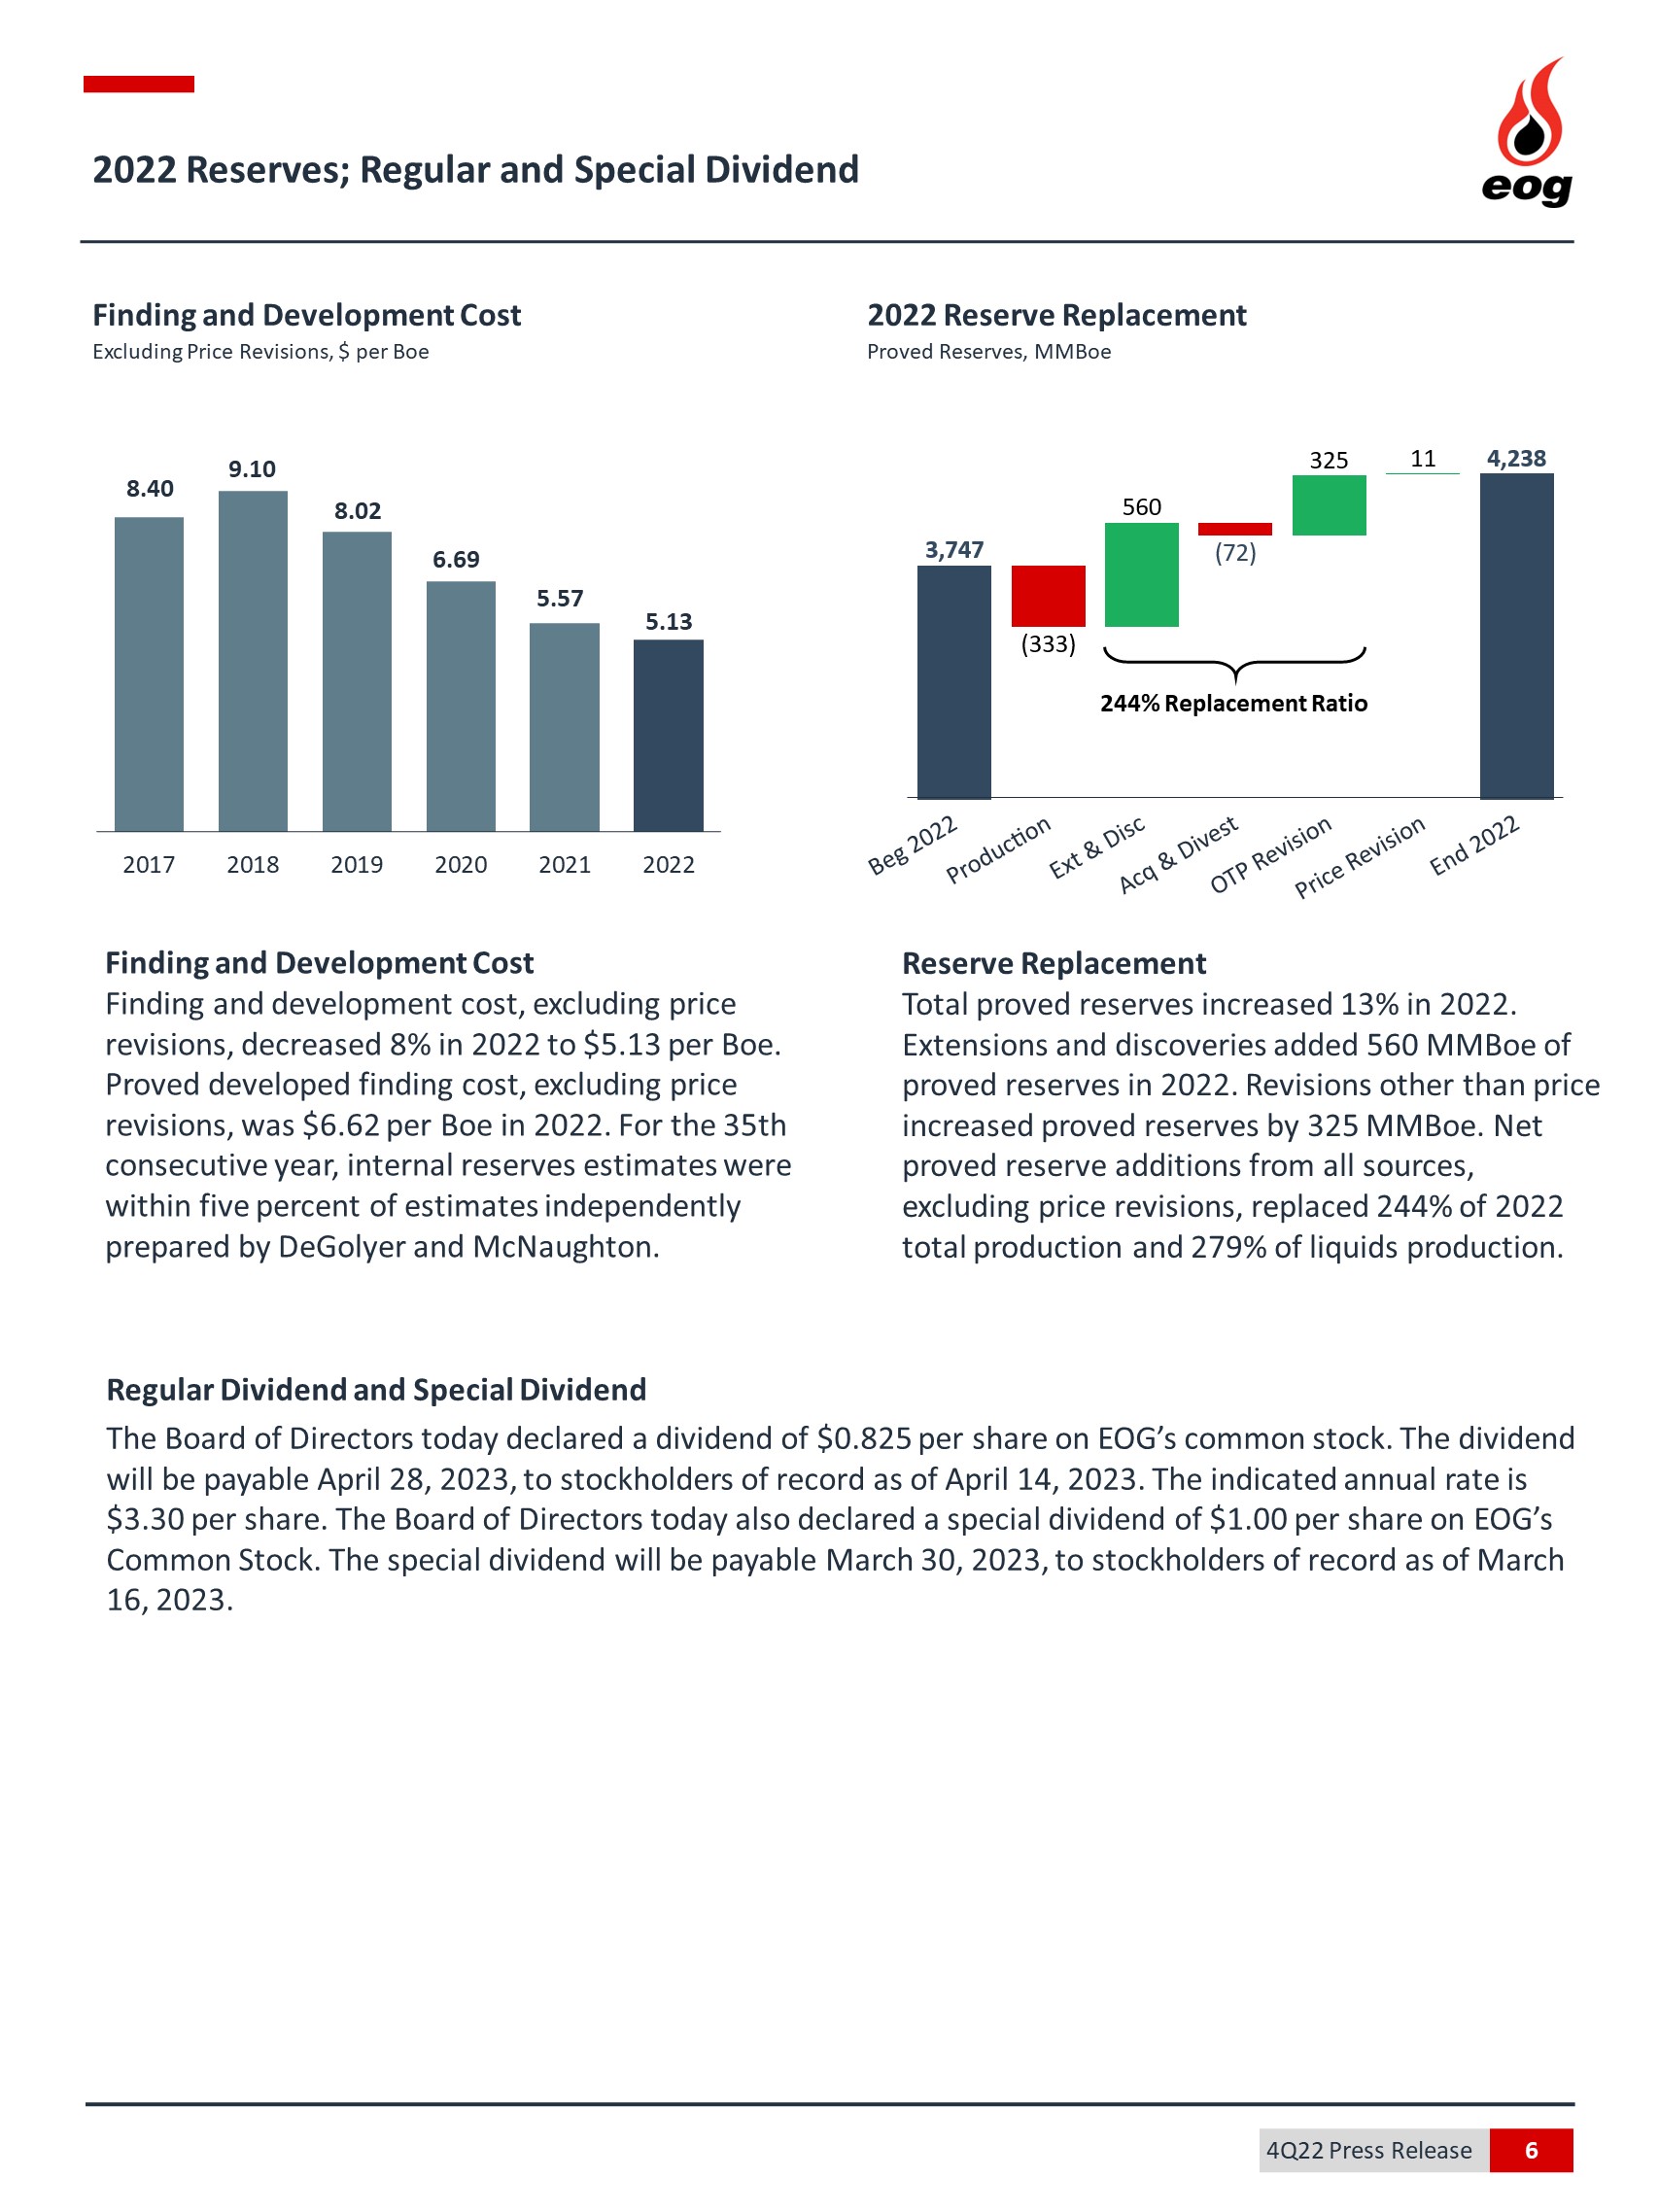
| Beginning Reserves | 3,693 | | | 54 | | | — | | | 3,747 | | |
| Revisions | 333 | | | 3 | | | — | | | 336 | | |
| Purchases in Place | 16 | | | — | | | — | | | 16 | | |
| Extensions, Discoveries and Other Additions | 551 | | | 9 | | | — | | | 560 | | |
| Sales in Place | (88) | | | — | | | — | | | (88) | | |
| Production | (322) | | | (11) | | | — | | | (333) | | |
| Ending Reserves | 4,183 | | | 55 | | | — | | | 4,238 | | |
| | | | | | | | |
| Net Proved Developed Reserves (MMBoe) | | | | | | | | |
| At December 31, 2021 | 1,926 | | | 22 | | | — | | | 1,948 | | |
| At December 31, 2022 | 2,162 | | | 23 | | | — | | | 2,185 | | |
| | | | | | | | |
| 2022 Exploration and Development Expenditures ($ Millions) | |
| | | | | | | | |
| Acquisition Cost of Unproved Properties | 186 | | | — | | | — | | | 186 | | |
| Exploration Costs | 263 | | | 84 | | | 17 | | | 364 | | |
| Development Costs | 3,898 | | | 64 | | | — | | | 3,962 | | |
| Total Drilling | 4,347 | | | 148 | | | 17 | | | 4,512 | | |
| Acquisition Cost of Proved Properties | 419 | | | — | | | — | | | 419 | | |
| Asset Retirement Costs | 208 | | | 81 | | | 9 | | | 298 | | |
| Total Exploration and Development Expenditures | 4,974 | | | 229 | | | 26 | | | 5,229 | | |
| Gathering, Processing and Other | 381 | | | 1 | | | (1) | | | 381 | | |
| Total Expenditures | 5,355 | | | 230 | | | 25 | | | 5,610 | | |
| Proceeds from Sales in Place | (349) | | | — | | | — | | | (349) | | |
| Net Expenditures | 5,006 | | | 230 | | | 25 | | | 5,261 | | |
| | | | | | | | |
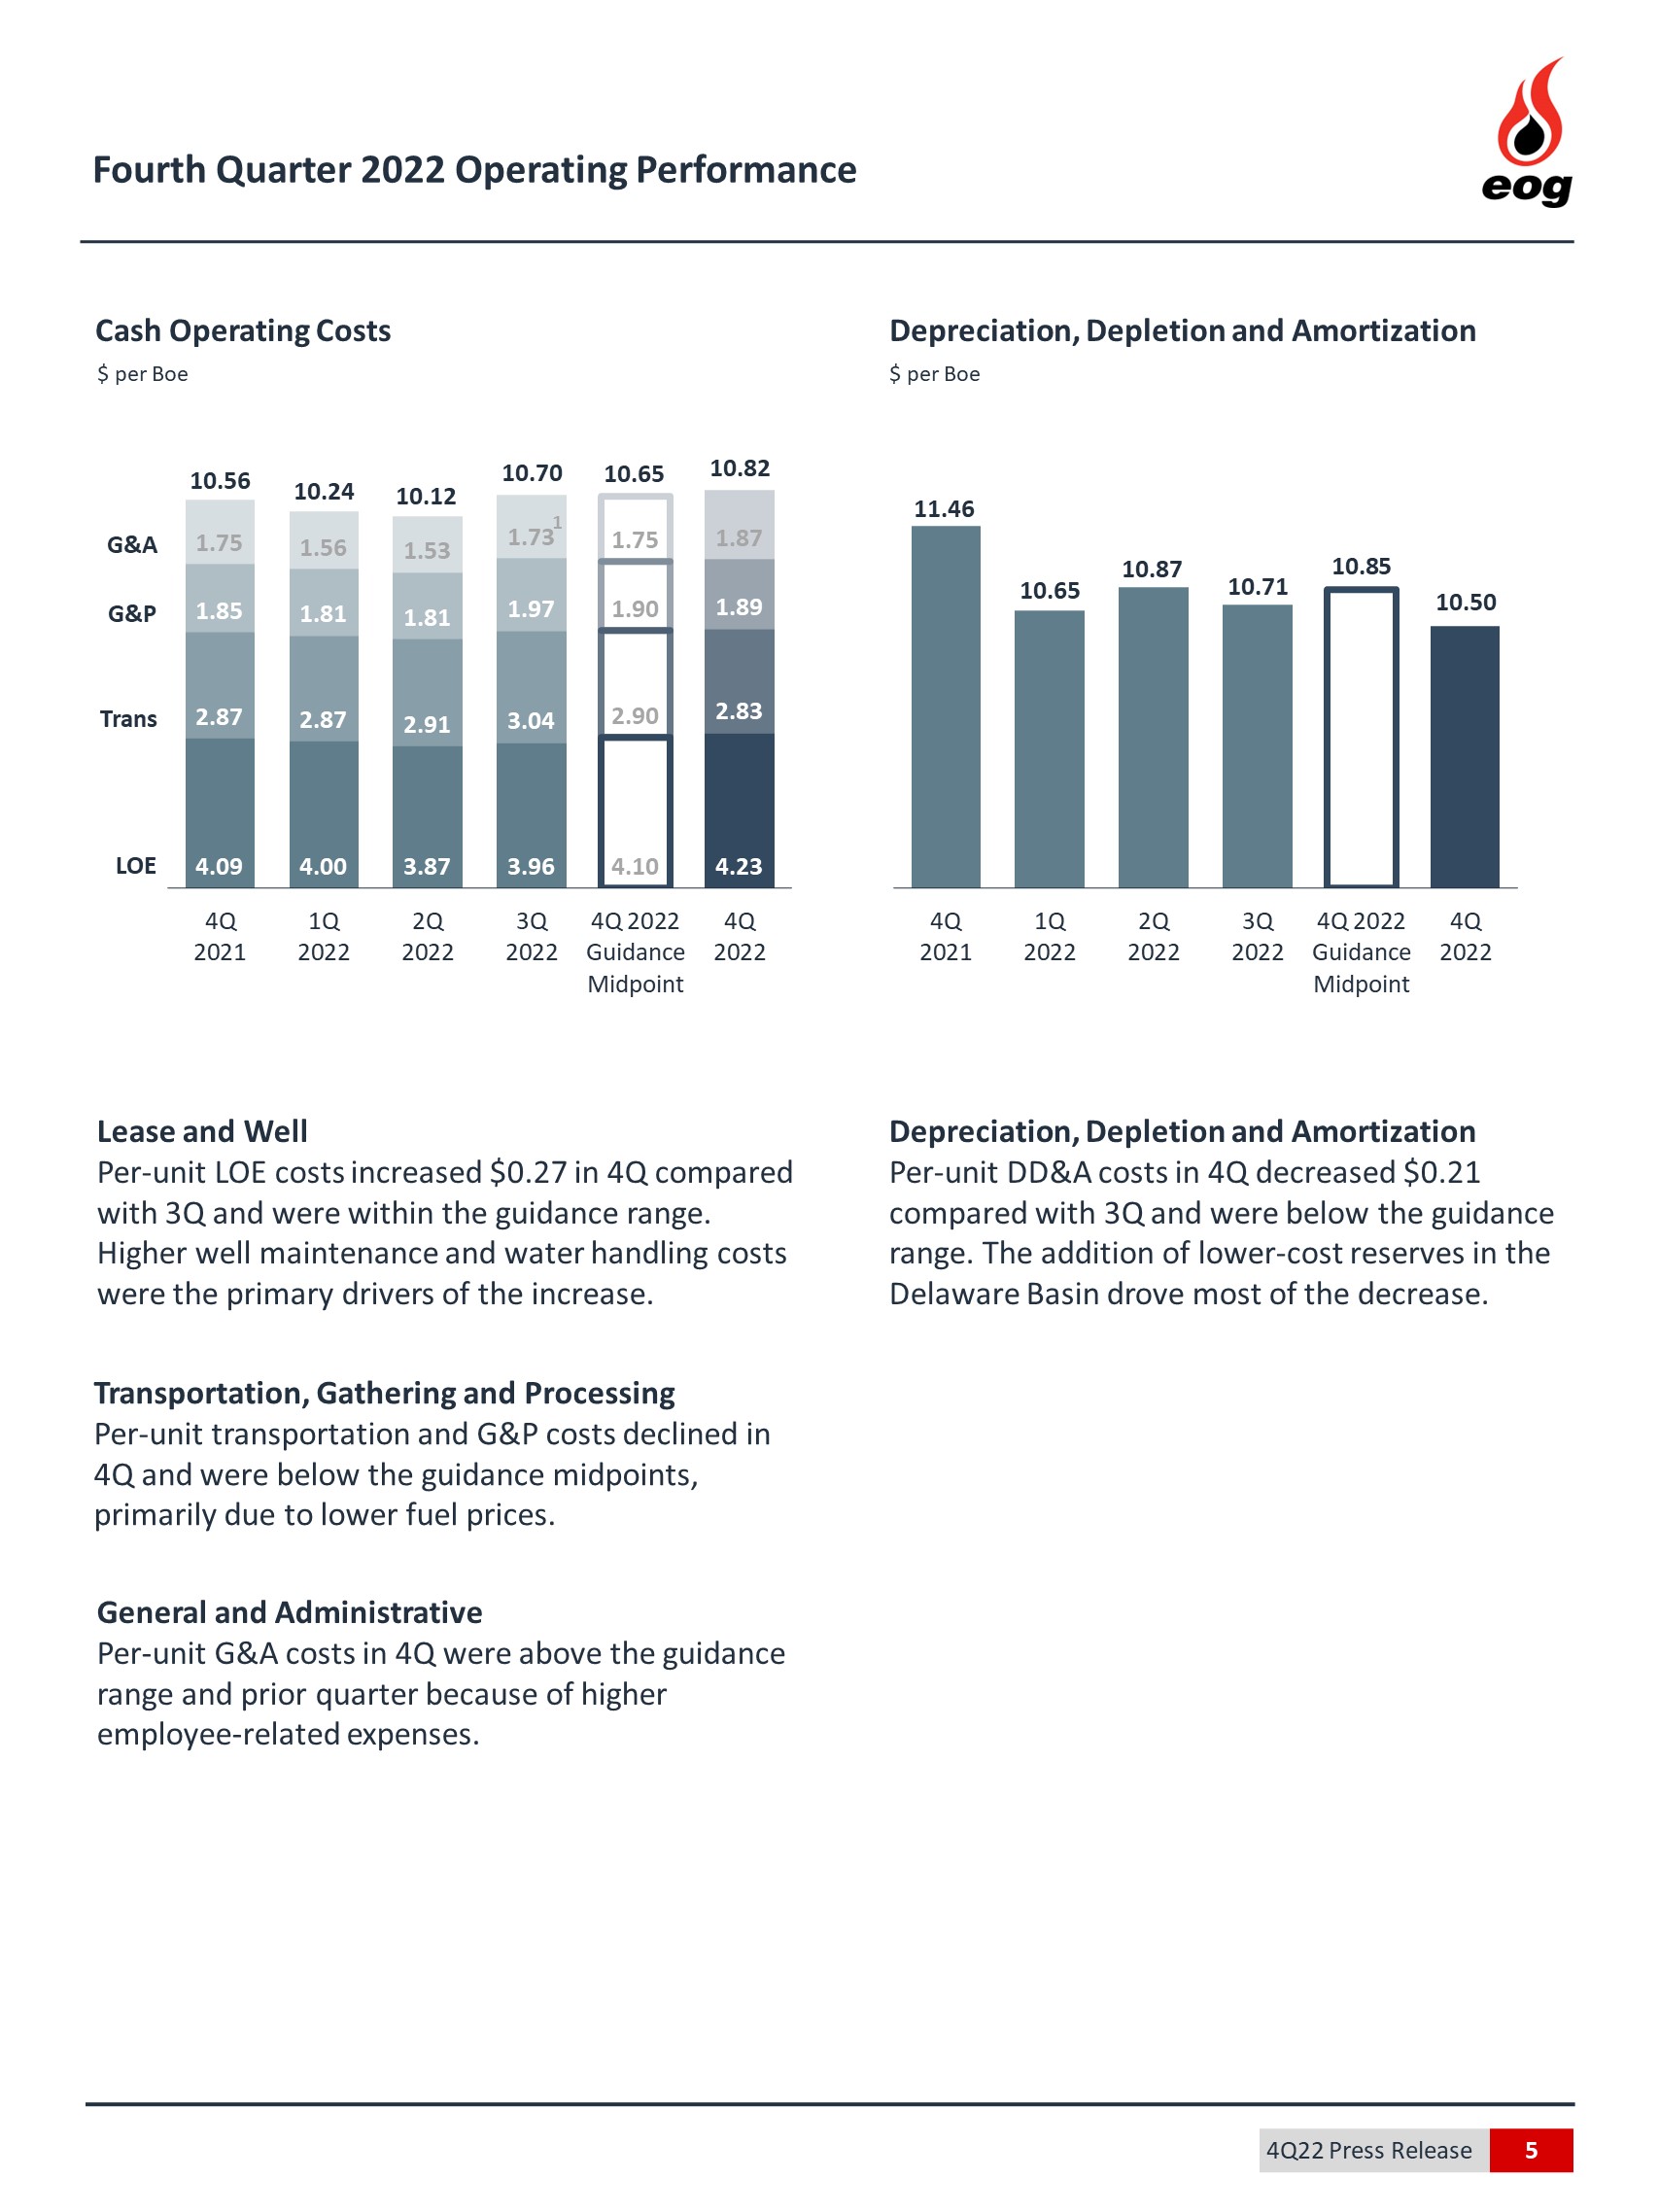
| Reserve Replacement Costs ($ / Boe) * | | | | | | | | |
| All-in Total, Net of Revisions | 4.96 | | | 11.92 | | | — | | | 5.06 | | |
| All-in Total, Excluding Revisions Due to Price | 5.03 | | | 11.92 | | | — | | | 5.13 | | |
| | | | | | | | |
| Reserve Replacement * | | | | | | | | |
| Drilling Only | 171 | % | | 82 | % | | 0 | % | | 168 | % | |
| All-in Total, Net of Revisions and Dispositions | 252 | % | | 109 | % | | 0 | % | | 247 | % | |
| All-in Total, Excluding Revisions Due to Price | 249 | % | | 109 | % | | 0 | % | | 244 | % | |
| All-in Total, Liquids | 279 | % | | 0 | % | | 0 | % | | 279 | % | |
| | | | | | | | |
| * See following reconciliation schedule for calculation methodology | |
| | | | | | | | | | | | | | | | | | | | | | | |
Reserve Replacement Cost Data | | |
| (Unaudited; in millions, except ratio data) | | | | | | | |
|
| For the Twelve Months Ended December 31, 2022 | United
States | | Trinidad | | Other
International | | Total |
| | | | | | | |
| Total Costs Incurred in Exploration and Development Activities (GAAP) | 4,974 | | | 229 | | | 26 | | | 5,229 | |
| Less: Asset Retirement Costs | (208) | | | (81) | | | (9) | | | (298) | |
| Non-Cash Acquisition Costs of Unproved Properties | (127) | | | — | | | — | | | (127) | |
| Total Acquisition Costs of Proved Properties | (419) | | | — | | | — | | | (419) | |
| Exploration Expenses | (145) | | | (5) | | | (9) | | | (159) | |
| Total Exploration and Development Expenditures for Drilling Only (Non-GAAP) - (a) | 4,075 | | | 143 | | | 8 | | | 4,226 | |
| | | | | | | |
| Total Costs Incurred in Exploration and Development Activities (GAAP) | 4,974 | | | 229 | | | 26 | | | 5,229 | |
| Less: Asset Retirement Costs | (208) | | | (81) | | | (9) | | | (298) | |
| Non-Cash Acquisition Costs of Unproved Properties | (127) | | | — | | | — | | | (127) | |
| Non-Cash Acquisition Costs of Proved Properties | (26) | | | — | | | — | | | (26) | |
| Exploration Expenses | (145) | | | (5) | | | (9) | | | (159) | |
| Total Exploration and Development Expenditures (Non-GAAP) - (b) | 4,468 | | | 143 | | | 8 | | | 4,619 | |
| | | | | | | |
| Total Expenditures (GAAP) | 5,355 | | | 230 | | | 25 | | | 5,610 | |
| Less: Asset Retirement Costs | (208) | | | (81) | | | (9) | | | (298) | |
| Non-Cash Acquisition Costs of Unproved Properties | (127) | | | — | | | — | | | (127) | |
| Non-Cash Acquisition Costs of Proved Properties | (26) | | | — | | | — | | | (26) | |
| Exploration Expenses | (145) | | | (5) | | | (9) | | | (159) | |
| Total Cash Expenditures (Non-GAAP) | 4,849 | | | 144 | | | 7 | | | 5,000 | |
| | | | | | | |
| Net Proved Reserve Additions From All Sources - Oil Equivalents (MMBoe) | | | | | | | |
| Revisions Due to Price - (c) | 11 | | | — | | | — | | | 11 | |
| Revisions Other Than Price | 322 | | | 3 | | | — | | | 325 | |
| Purchases in Place | 16 | | | — | | | — | | | 16 | |
| Extensions, Discoveries and Other Additions - (d) | 551 | | | 9 | | | — | | | 560 | |
| Total Proved Reserve Additions - (e) | 900 | | | 12 | | | — | | | 912 | |
| Sales in Place | (88) | | | — | | | — | | | (88) | |
| Net Proved Reserve Additions From All Sources - (f) | 812 | | | 12 | | | — | | | 824 | |
| | | | | | | |
| Production - (g) | 322 | | | 11 | | | — | | | 333 | |
| | | | | | | |
| Reserve Replacement Costs ($ / Boe) | | | | | | | |
| Total Drilling, Before Revisions - (a / d) | 7.40 | | | 15.89 | | | — | | | 7.55 | |
| All-in Total, Net of Revisions - (b / e) | 4.96 | | | 11.92 | | | — | | | 5.06 | |
| All-in Total, Excluding Revisions Due to Price - (b / (e - c)) | 5.03 | | | 11.92 | | | — | | | 5.13 | |
| | | | | | | |
| Reserve Replacement | | | | | | | |
| Drilling Only - (d / g) | 171 | % | | 82 | % | | 0 | % | | 168 | % |
| All-in Total, Net of Revisions and Dispositions - (f / g) | 252 | % | | 109 | % | | 0 | % | | 247 | % |
| All-in Total, Excluding Revisions Due to Price - ((f - c) / g) | 249 | % | | 109 | % | | 0 | % | | 244 | % |
| | | | | | | |
| | | | | | | |
| | | | | | | | | | | | | | | | | | | | | | | |
Reserve Replacement Cost Data (Continued) | | |
| (Unaudited; in millions, except ratio data) | | | | | | | |
| | | | | | | |
| For the Twelve Months Ended December 31, 2022 | United
States | | Trinidad | | Other
International | | Total |
| | | | | | | |
| Net Proved Reserve Additions From All Sources - Liquids (MMBbl) | | | | | | | |
| Revisions | 378 | | | — | | | — | | | 378 | |
| Purchases in Place | 11 | | | — | | | — | | | 11 | |
| Extensions, Discoveries and Other Additions - (h) | 315 | | | — | | | — | | | 315 | |
| Total Proved Reserve Additions | 704 | | | — | | | — | | | 704 | |
| Sales in Place | (35) | | | — | | | — | | | (35) | |
| Net Proved Reserve Additions From All Sources - (i) | 669 | | | — | | | — | | | 669 | |
| | | | | | | |
| Production - (j) | 240 | | | — | | | — | | | 240 | |
| | | | | | | |
| Reserve Replacement - Liquids | | | | | | | |
| Drilling Only - (h / j) | 131 | % | | 0 | % | | 0 | % | | 131 | % |
| All-in Total, Net of Revisions and Dispositions - (i / j) | 279 | % | | 0 | % | | 0 | % | | 279 | % |
| | | | | |
Reserve Replacement Cost Data (Continued) | |
| (Unaudited; in millions, except ratio data) | |
| |
| For the Twelve Months Ended December 31, 2022 | |
| |
| Proved Developed Reserve Replacement Costs ($ / Boe) | Total |
| Total Costs Incurred in Exploration and Development Activities (GAAP) | 5,229 | |
| Less: Asset Retirement Costs | (298) | |
| Acquisition Costs of Unproved Properties | (186) | |
| Acquisition Costs of Proved Properties | (419) | |
| Exploration Expenses | (159) | |
| Drillbit Exploration and Development Expenditures (Non-GAAP) - (k) | 4,167 | |
| |
| Total Proved Reserves - Extensions, Discoveries and Other Additions (MMBoe) | 560 | |
| Add: Conversion of Proved Undeveloped Reserves to Proved Developed | 293 | |
| Less: Proved Undeveloped Extensions and Discoveries | (410) | |
| Proved Developed Reserves - Extensions and Discoveries (MMBoe) | 443 | |
| |
| Total Proved Reserves - Revisions (MMBoe) | 336 | |
| Less: Proved Undeveloped Reserves - Revisions | (141) | |
| Proved Developed - Revisions Due to Price | (9) | |
| Proved Developed Reserves - Revisions Other Than Price (MMBoe) | 186 | |
| |
| Proved Developed Reserves - Extensions and Discoveries Plus Revisions Other Than Price (MMBoe) - (l) | 629 | |
| |
| Proved Developed Reserve Replacement Costs Excluding Revisions Due to Price ($ / Boe) - (k / l) | 6.62 | |
| | | | | | | | | | | | | | | | | | | |
| Reserve Replacement Cost Data | | | | | |
| In millions of USD, except reserves and ratio data (Unaudited) | | | | | | |
| | | | | | | |
| The following table reconciles Total Costs Incurred in Exploration and Development Activities (GAAP) to Total Exploration and Development Expenditures for Drilling Only (Non-GAAP) and Total Exploration and Development Expenditures (Non-GAAP), as used in the calculation of Reserve Replacement Costs per Boe. There are numerous ways that industry participants present Reserve Replacement Costs, including “Drilling Only” and “All-In”, which reflect total exploration and development expenditures divided by total net proved reserve additions from extensions and discoveries only, or from all sources. Combined with Reserve Replacement, these statistics (and the non-GAAP measures used in calculating such statistics) provide management and investors with an indication of the results of the current year capital investment program. Reserve Replacement Cost statistics (and the non-GAAP measures used in calculating such statistics) are widely recognized and reported by industry participants and are used by EOG management and other third parties for comparative purposes within the industry. Please note that the actual cost of adding reserves will vary from the reported statistics due to timing differences in reserve bookings and capital expenditures. Accordingly, some analysts use three or five year averages of reported statistics, while others prefer to estimate future costs. EOG has not included future capital costs to develop proved undeveloped reserves in exploration and development expenditures. In addition, to further the comparability of the results of EOG’s current-year capital investment program with those of EOG’s peer companies and other companies in the industry, EOG now deducts Exploration Expenses, as illustrated below, in calculating Total Exploration and Development Expenditures for Drilling Only (Non-GAAP), Total Exploration and Development Expenditures (Non-GAAP), Total Cash Expenditures (Non-GAAP), Drillbit Exploration and Development Expenditures (Non-GAAP) and the related Reserve Replacement Costs metrics. Accordingly, Total Exploration and Development Expenditures for Drilling Only (Non-GAAP), Total Exploration and Development Expenditures (Non-GAAP), Total Cash Expenditures (Non-GAAP), Drillbit Exploration and Development Expenditures (Non-GAAP) and the related Reserve Replacement Costs metrics, in each case for fiscal year 2022, have been calculated on such basis, and the calculations for each of the prior periods shown have been revised and conformed. |
| | | | | | | |
| | | 2022 | | 2021 | | 2020 |
| | | | | | | |
| Total Costs Incurred in Exploration and Development Activities (GAAP) | | | 5,229 | | | 3,969 | | | 3,718 | |
| Less: Asset Retirement Costs | | | (298) | | | (127) | | | (117) | |
| Non-Cash Acquisition Costs of Unproved Properties | | | (127) | | | (45) | | | (197) | |
| Acquisition Costs of Proved Properties | | | (419) | | | (100) | | | (135) | |
| Exploration Expenses | | | (159) | | | (154) | | | (146) | |
| Total Exploration and Development Expenditures for Drilling Only (Non-GAAP) - (a) | | | 4,226 | | | 3,543 | | | 3,123 | |
| | | | | | | |
| Total Costs Incurred in Exploration and Development Activities (GAAP) | | | 5,229 | | | 3,969 | | | 3,718 | |
| Less: Asset Retirement Costs | | | (298) | | | (127) | | | (117) | |
| Non-Cash Acquisition Costs of Unproved Properties | | | (127) | | | (45) | | | (197) | |
| Non-Cash Acquisition Costs of Proved Properties | | | (26) | | | (5) | | | (15) | |
| Exploration Expenses | | | (159) | | | (154) | | | (146) | |
| Total Exploration and Development Expenditures (Non-GAAP) - (b) | | | 4,619 | | | 3,638 | | | 3,243 | |
| | | | | | | |
| Net Proved Reserve Additions From All Sources - Oil Equivalents (MMBoe) | | | | | | | |
| Revisions Due to Price - (c) | | | 11 | | | 194 | | | (278) | |
| Revisions Other Than Price | | | 325 | | | (308) | | | (89) | |
| Purchases in Place | | | 16 | | | 9 | | | 10 | |
| Extensions, Discoveries and Other Additions - (d) | | | 560 | | | 952 | | | 564 | |
| Total Proved Reserve Additions - (e) | | | 912 | | | 847 | | | 207 | |
| Sales in Place | | | (88) | | | (11) | | | (31) | |
| Net Proved Reserve Additions From All Sources | | | 824 | | | 836 | | | 176 | |
| | | | | | | |
| Production | | | 333 | | | 309 | | | 285 | |
| | | | | | | |
| Reserve Replacement Costs ($ / Boe) | | | | | | | |
| Total Drilling, Before Revisions - (a / d) | | | 7.55 | | | 3.72 | | | 5.54 | |
| All-in Total, Net of Revisions - (b / e) | | | 5.06 | | | 4.30 | | | 15.67 | |
| All-in Total, Excluding Revisions Due to Price - (b / ( e - c)) | | | 5.13 | | | 5.57 | | | 6.69 | |
| | | | | | | | | | | | | | | | | | | |
Reserve Replacement Cost Data (Continued) | | | | | |
| In millions of USD, except reserves and ratio data (Unaudited) | | | | | | |
| | | | | | | |
| | | 2019 | | 2018 | | 2017 |
| | | | | | | |
| Total Costs Incurred in Exploration and Development Activities (GAAP) | | | 6,628 | | | 6,420 | | | 4,440 | |
| Less: Asset Retirement Costs | | | (186) | | | (70) | | | (56) | |
| Non-Cash Acquisition Costs of Unproved Properties | | | (98) | | | (291) | | | (256) | |
| Acquisition Costs of Proved Properties | | | (380) | | | (124) | | | (73) | |
| Exploration Expenses | | | (140) | | | (149) | | | (145) | |
| Total Exploration and Development Expenditures for Drilling Only (Non-GAAP) - (a) | | | 5,824 | | | 5,786 | | | 3,910 | |
| | | | | | | |
| Total Costs Incurred in Exploration and Development Activities (GAAP) | | | 6,628 | | | 6,420 | | | 4,440 | |
| Less: Asset Retirement Costs | | | (186) | | | (70) | | | (56) | |
| Non-Cash Acquisition Costs of Unproved Properties | | | (98) | | | (291) | | | (256) | |
| Non-Cash Acquisition Costs of Proved Properties | | | (52) | | | (71) | | | (26) | |
| Exploration Expenses | | | (140) | | | (149) | | | (145) | |
| Total Exploration and Development Expenditures (Non-GAAP) - (b) | | | 6,152 | | | 5,839 | | | 3,957 | |
| | | | | | | |
| Net Proved Reserve Additions From All Sources - Oil Equivalents (MMBoe) | | | | | | | |
| Revisions Due to Price - (c) | | | (60) | | | 35 | | | 154 | |
| Revisions Other Than Price | | | — | | | (40) | | | 48 | |
| Purchases in Place | | | 17 | | | 12 | | | 2 | |
| Extensions, Discoveries and Other Additions - (d) | | | 750 | | | 670 | | | 421 | |
| Total Proved Reserve Additions - (e) | | | 707 | | | 677 | | | 625 | |
| Sales in Place | | | (5) | | | (11) | | | (21) | |
| Net Proved Reserve Additions From All Sources | | | 702 | | | 666 | | | 604 | |
| | | | | | | |
| Production | | | 301 | | | 265 | | | 224 | |
| | | | | | | |
| Reserve Replacement Costs ($ / Boe) | | | | | | | |
| Total Drilling, Before Revisions - (a / d) | | | 7.77 | | | 8.64 | | | 9.29 | |
| All-in Total, Net of Revisions - (b / e) | | | 8.70 | | | 8.62 | | | 6.33 | |
| All-in Total, Excluding Revisions Due to Price - (b / ( e - c)) | | | 8.02 | | | 9.10 | | | 8.40 | |
| | | | | |
| Definitions | |
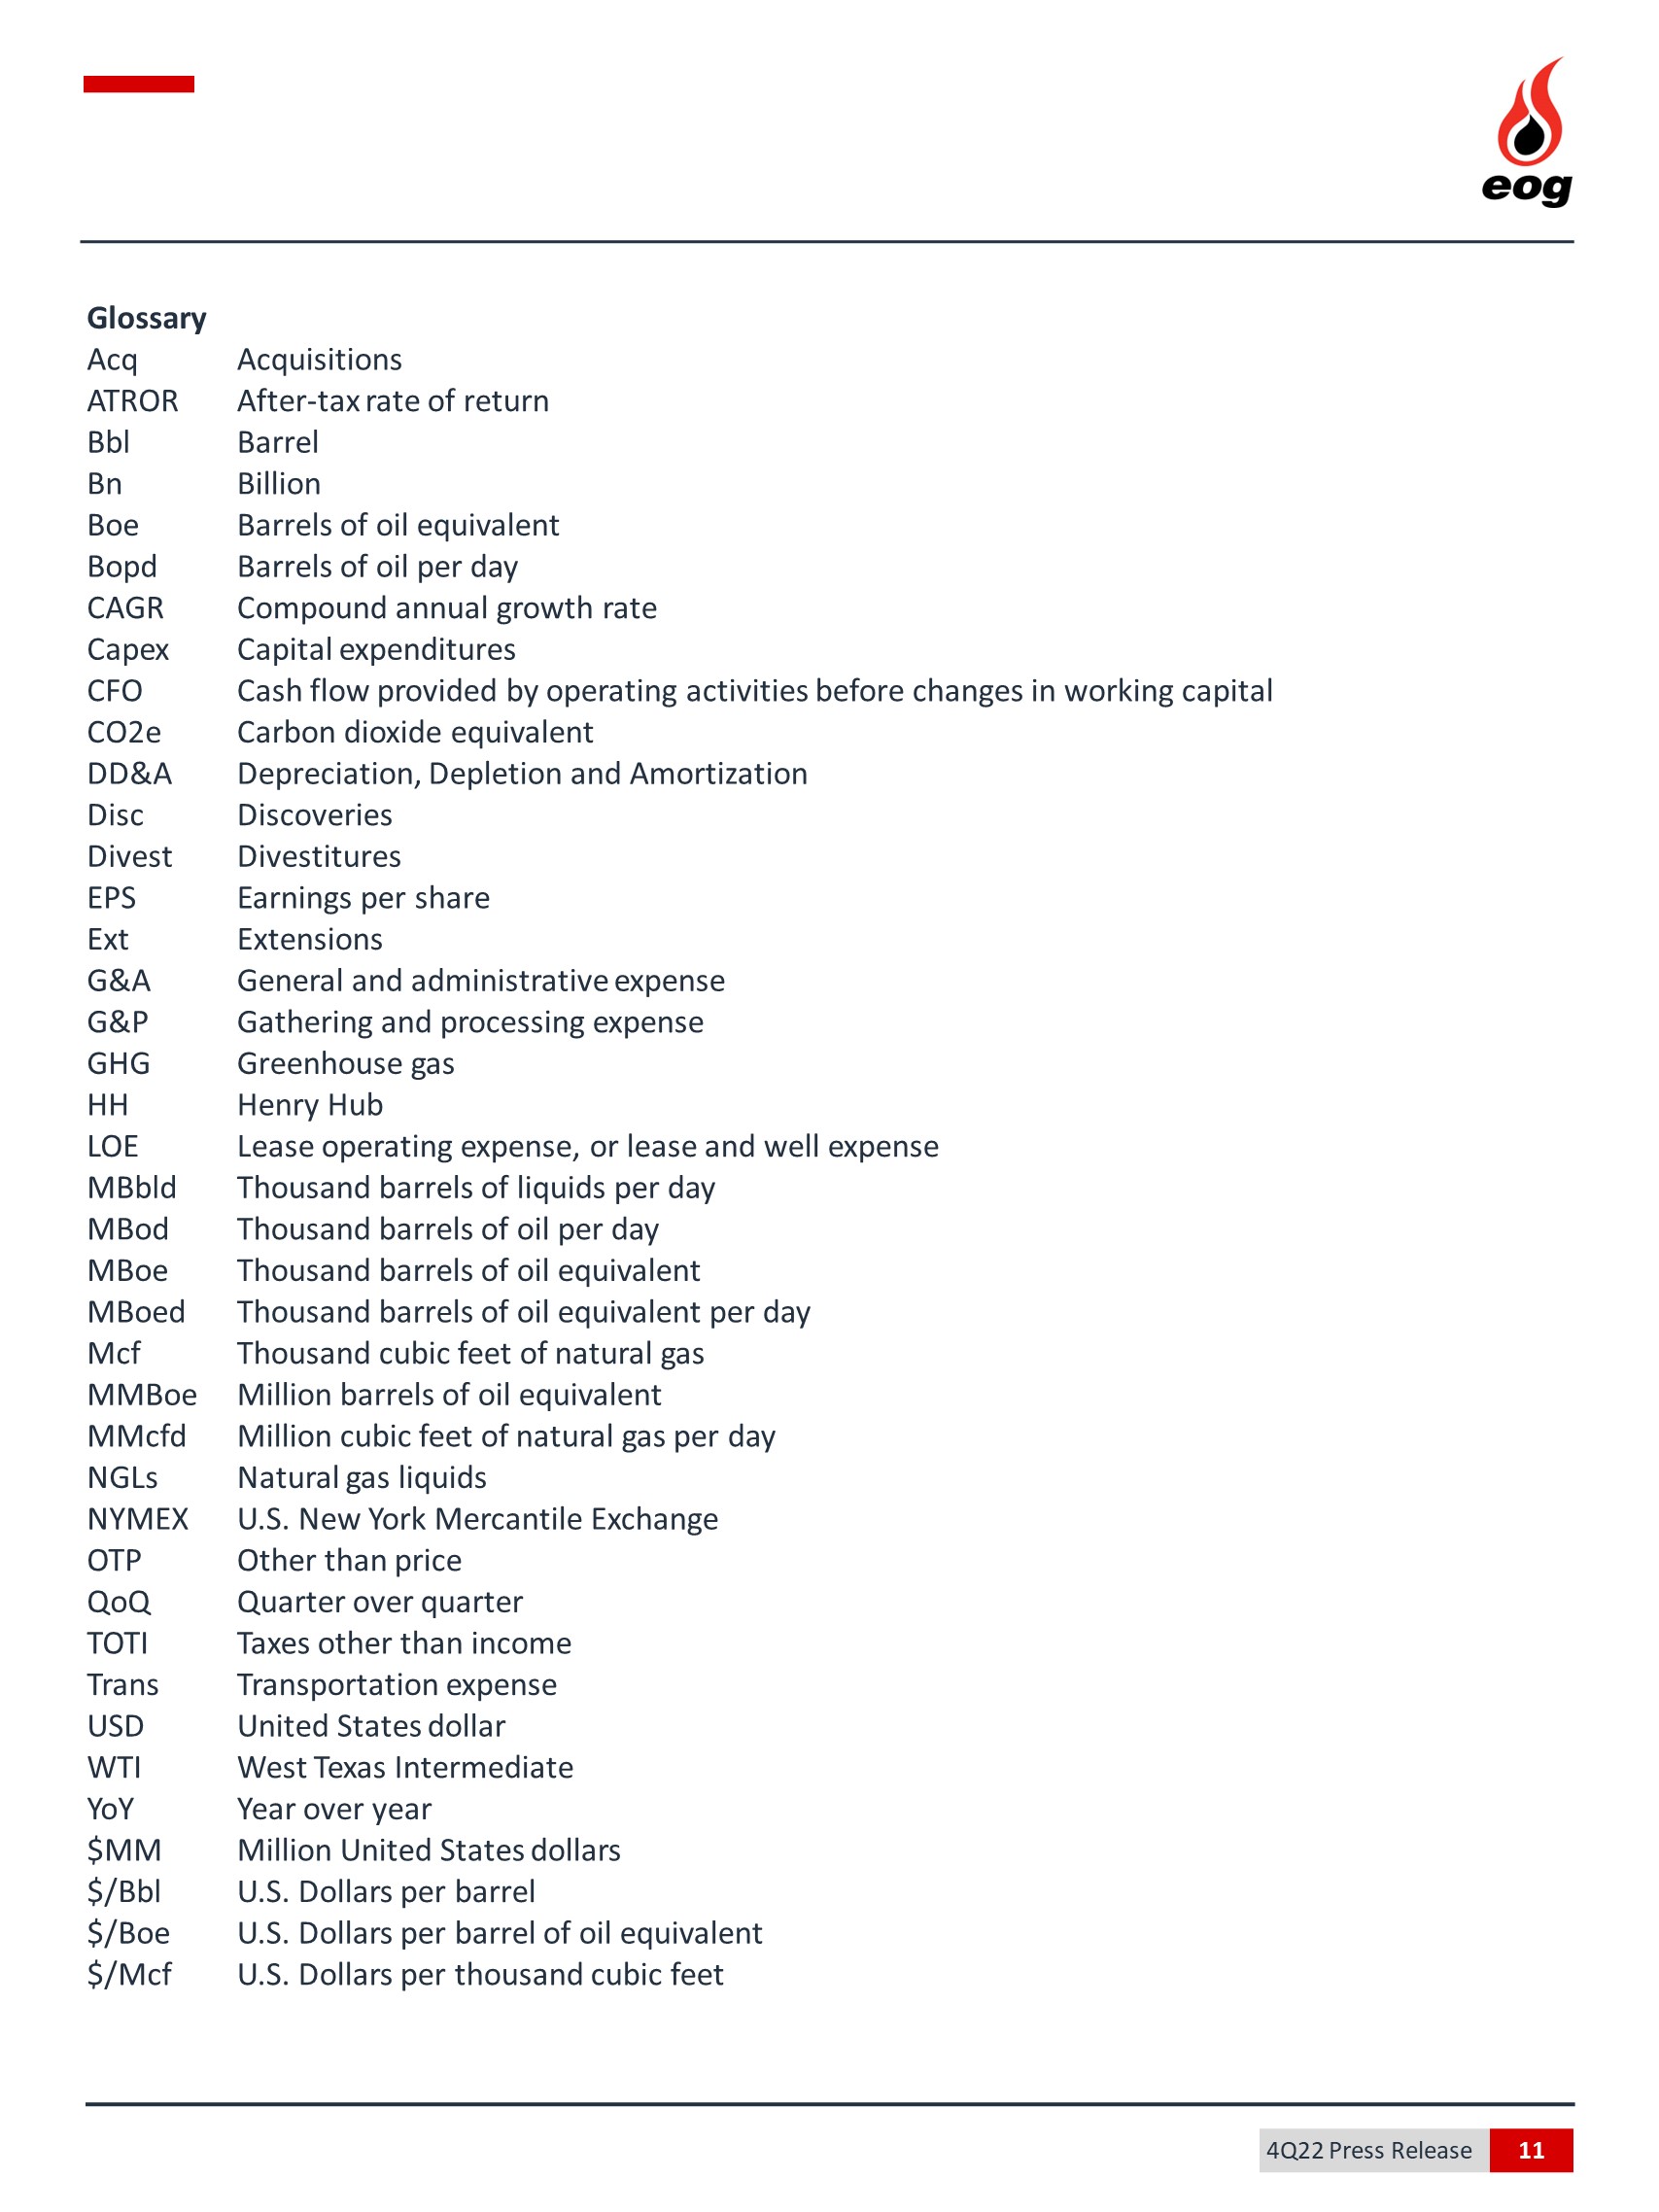
| $/Boe | U.S. Dollars per barrel of oil equivalent |
| MMBoe | Million barrels of oil equivalent |