UNITED STATES
SECURITIES AND EXCHANGE COMMISSION
Washington, D.C. 20549
FORM N-CSR
CERTIFIED SHAREHOLDER REPORT
OF
REGISTERED MANAGEMENT INVESTMENT COMPANIES
Investment Company Act file number: 811-05340
| Name of Registrant: | Vanguard New Jersey Tax-Free Funds |
| Address of Registrant: | P.O. Box 2600
Valley Forge, PA 19482 |
| Name and address of agent for service: | Anne E. Robinson, Esquire
P.O. Box 876
Valley Forge, PA 19482 |
Registrant’s telephone number, including area code:(610) 669-1000
Date of fiscal year end: November 30
Date of reporting period: December 1, 2018—November 30, 2019
Item 1:Reports to Shareholders

Annual Report|November 30, 2019 Vanguard New Jersey Tax-Exempt Funds |
Vanguard New Jersey Municipal Money Market Fund Vanguard New Jersey Long-Term Tax-Exempt Fund See the inside front cover for important information about access to your fund’s annual and semiannual shareholder reports. |
Important information about access to shareholder reports
Beginning on January 1, 2021, as permitted by regulations adopted by the Securities and Exchange Commission, paper copies of your fund’s annual and semiannual shareholder reports will no longer be sent to you by mail, unless you specifically request them. Instead, you will be notified by mail each time a report is posted on the website and will be provided with a link to access the report.
If you have already elected to receive shareholder reports electronically, you will not be affected by this change and do not need to take any action. You may elect to receive shareholder reports and other communications from the fund electronically by contacting your financial intermediary (such as a broker-dealer or bank) or, if you invest directly with the fund, by calling Vanguard at one of the phone numbers on the back cover of this report or by logging on to vanguard.com.
You may elect to receive paper copies of all future shareholder reports free of charge. If you invest through a financial intermediary, you can contact the intermediary to request that you continue to receive paper copies. If you invest directly with the fund, you can call Vanguard at one of the phone numbers on the back cover of this report or log on to vanguard.com. Your election to receive paper copies will apply to all the funds you hold through an intermediary or directly with Vanguard.
Contents
| A Note From Our Chairman | 1 |
| Your Fund’s Performance at a Glance | 2 |
| Advisor’s Report | 3 |
| About Your Fund’s Expenses | 7 |
| New Jersey Municipal Money Market Fund | 9 |
| New Jersey Long-Term Tax-Exempt Fund | 24 |
Please note: The opinions expressed in this report are just that—informed opinions. They should not be considered promises or advice. Also, please keep in mind that the information and opinions cover the period through the date on the front of this report. Of course, the risks of investing in your fund are spelled out in the prospectus.
A Note From Our Chairman

Tim Buckley
Chairman and Chief Executive Officer
Dear Shareholder,
Recent volatility in financial markets—affecting stocks, bonds, and commodities—has been a good reminder of the wise old adage, “Never keep all your eggs in one basket.” Maintaining balance and diversification in your investment portfolio can help to both limit risk and set you up for long-term success.
It’s understandable why some investors might become complacent after a long market run-up like the one that lifted stock prices, especially U.S. stock prices, in the years following the global financial crisis. But failing to rebalance regularly can leave a portfolio with a much different mix of assets than intended and, often, more risk than intended.
Balance across and diversification within asset classes are powerful tools for managing risk and achieving your investment goals. A portfolio’s allocation will determine a large portion of its long-term return and also the majority of its volatility risk. A well-diversified portfolio is less vulnerable to significant swings in the performance of any one segment of the asset classes in which it invests.
Balance and diversification will never eliminate the risk of loss, nor will they guarantee positive returns in a declining market. But they may reduce the chance that you’ll suffer disproportionate losses in one particular high-flying asset class or sector when it comes back to earth. And exposure to all key market components should give you at least some participation in the sectors that are performing best at any given time.
Vanguard is committed to helping you achieve balance and diversification in your portfolios to help meet your investment goals. We thank you for your continued loyalty.
Sincerely,

Mortimer J. Buckley
Chairman and Chief Executive Officer
December 17, 2019
Your Fund’s Performance at a Glance
· For the 12 months ended November 30, 2019, Vanguard New Jersey Long-Term Tax-Exempt Fund returned 10.00% for Investor Shares and 10.09% for Admiral Shares. These results slightly trailed those of the fund’s benchmark, the Bloomberg Barclays New Jersey Municipal Bond Index, which returned 10.18%.
· Vanguard New Jersey Municipal Money Market Fund returned 1.31%.
· Global monetary policy shifted markedly during the fiscal year. Faced with slowing global growth and intensifying trade disputes, many central banks turned more accommodative. The U.S. Federal Reserve, after raising its target for short-term interest rates four times in 2018, cut rates three times in 2019 and ended its balance-sheet tapering. Bonds, including municipal issues, saw their yields fall and prices rise.
· Compared with its benchmark index, the Long-Term Fund is more diversified and tilted more toward higher-quality investment-grade bonds. This difference held back relative results for the period, as lower-quality municipal bonds outperformed. Specifically, the fund’s underweighting of three top BBB-rated issuers that together account for nearly two-thirds of the benchmark detracted. The fund’s average duration (a measure of the price sensitivity of the fund’s holdings to movements in interest rates) was longer than that of its benchmark, a stance that helped returns.
Market Barometer
| | | Average Annual Total Returns |
| | Periods Ended November 30, 2019 |
| | One Year | Three Years | Five Years |
| Stocks | | | |
| Russell 1000 Index (Large-caps) | 16.10% | 14.67% | 10.80% |
| Russell 2000 Index (Small-caps) | 7.51 | 8.57 | 8.22 |
| Russell 3000 Index (Broad U.S. market) | 15.49 | 14.22 | 10.61 |
| FTSE All-World ex US Index (International) | 11.50 | 9.39 | 4.20 |
| | | | |
| Bonds | | | |
| Bloomberg Barclays U.S. Aggregate Bond Index (Broad taxable market) | 10.79% | 4.10% | 3.08% |
| Bloomberg Barclays Municipal Bond Index (Broad tax-exempt market) | 8.49 | 5.02 | 3.57 |
| FTSE Three-Month U.S. Treasury Bill Index | 2.31 | 1.61 | 1.01 |
| | | | |
| CPI | | | |
| Consumer Price Index | 2.05% | 2.14% | 1.72% |
Advisor’s Report
For the 12 months ended November 30, 2019, Vanguard New Jersey Long-Term Tax-Exempt Fund returned 10.00% for Investor Shares and 10.09% for Admiral Shares. Those results fell short of the 10.18% return of its benchmark, the Bloomberg Barclays NJ Municipal Bond Index.
Municipal bond yields declined across the board; prices increased most at the long end. For both Investor and Admiral Shares, the capital return was 6.45%. Return from income was 3.55% for Investor Shares and 3.64% for Admiral Shares. The Long-Term Fund’s 30-day SEC yield fell 130 basis points to 2.07% for Investor Shares and 128 basis points to 2.15% for Admiral Shares. (A basis point is one-hundredth of a percentage point.)
Vanguard New Jersey Municipal Money Market Fund returned 1.31%. The fund’s 7-day SEC yield fell 49 basis points to 0.93%.
Please note that the funds are permitted to invest in securities that can generate income distributions subject to the alternative minimum tax (AMT). At the end of the fiscal year, only the Money Market Fund owned such securities.
The investment environment
The financial markets were driven largely by shifts in the outlook for global growth and monetary policy during the 12 months.
Further signs of a global slowdown and tepid inflation at the start of 2019 led to a pivot in monetary policy across much of the world as major central banks took a more accommodative stance. In the United States, the labor market remained robust even as the pace of job creation eased a little. The unemployment rate continued to trend lower—it fell to 3.5% by the end of the 12 months—supporting consumer spending.
Although gross domestic product, the broadest measure of economic activity, expanded in the first quarter of 2019 at an annual rate of about 3% after adjusting for inflation, its growth then slowed amid fading effects from tax cuts, weaker business confidence, and trade disputes. Inflation remained tame.
Yields of Tax-Exempt Municipal Securities
(National Averages, AAA-Rated General Obligation Issues)
| | November 30, | November 30, |
| Maturity | 2018 | 2019 |
| 2 years | 1.98% | 1.10% |
| 5 years | 2.16 | 1.17 |
| 10 years | 2.55 | 1.50 |
| 30 years | 3.27 | 2.13 |
Source: Vanguard.
After raising rates in December 2018, the Federal Reserve began to reverse gears with an announcement in March that it would end its balance-sheet tapering. It went on to lower the federal funds rate in August, September, and October. Those cuts, the first in more than a decade, were characterized by policymakers as “insurance” meant to cushion the effects of trade policies and prolong an economic expansion already in its 11th year.
Although international developments typically have little effect on municipal bonds, the bonds largely took their cues from U.S. Treasuries, whose yields fell across the maturity spectrum. The average yield of 2-year AAA-rated general obligation issues slipped 88 basis points to 1.10% by the end of the period. The comparable 10-year yield dropped 105 basis points to 1.50%.
Demand for muni bonds was strong through much of the fiscal year. That supported prices, as did supply in recent months. The 2017 tax reform legislation eliminated municipal issuers’ ability to advance-refund their outstanding debt prior to the call date with another tax-exempt debt issuance. However, with rates falling, municipalities have been pre-refunding tax-exempt securities by issuing taxable securities, thereby shrinking the supply of longer-dated tax-exempt munis.
Credit quality in the municipal market remained solid overall as revenue collections were supported by the strong economy.
New Jersey ended fiscal 2019 with estimated revenues that enabled the operating fund balance of $1.2 billion (3.2% of the overall budget) to exceed the $990 million (2.8%) balance for the prior fiscal year. The state projects a slight decrease in the fund balance for fiscal 2020, but overall reserves are expected to remain higher than in prior years at $1.3 billion (3.3%), including a $401 million deposit into a rainy day fund for the first time in 11 years. This contribution improves flexibility; since 2008, the state had used the operating fund balance as a budgetary cushion.
The fiscal 2020 budget was adopted on time in June. It was balanced by health care savings of $800 million and departmental savings of $200 million. The state will benefit from the ability to tax online sales following a U.S. Supreme Court decision that was implemented in November 2018. Several one-time and temporary revenue sources were included in the fiscal 2019 budget and will be discontinued or reduced in fiscal 2020. Future budgets should address new sources of revenue and expenditure cuts to offset continued growth in long-term liabilities such as pensions.
New Jersey funded its pension actuarially determined contribution (ADC) at 60% during fiscal 2019 and has budgeted to fund the ADC at 70% in fiscal 2020 with a goal of 100% funding by fiscal 2023.
New Jersey’s credit ratings and outlook were stable for the period. Standard & Poor’s has maintained an A–/stable rating since August 2017, Moody’s Investors
Service has maintained an A3/stable rating since March 2017, and Fitch Ratings has maintained an A/stable rating since August 2016. The ratings primarily reflect the continued phasing-in of 10-percentage-point increases per year in pension ADC contributions.
We expect ratings to remain stable for the next 12 to 18 months. However, we expect that the state will be challenged to meet the additional ADC funding requirements if it doesn’t come up with additional revenue sources or expenditure cuts—which could weaken credit, especially in a recessionary scenario.
Although the state has a diverse economy in the central Northeast Corridor and high wealth and education levels, the cost of living and doing business is very high. New Jersey has one of the highest property taxes in the nation and a large foreclosure inventory. Migration out of the state, combined with the effects of the state and local tax deduction cap implemented as part of the 2017 federal tax legislation, could limit future economic performance and revenue growth.
The state typically issues debt between September and January following the finalization of the annual budget and before the budget process commences for the upcoming fiscal year. In 2019, New Jersey issued $1.85 billion of new debt to fund transportation and education projects. The state also issued refinancing deals of $2 billion for the Transportation Trust Fund and approximately $350 million for school facilities construction. Vanguard participated in all bond issues during 2019.
Management of the funds
The Long-Term Fund’s average duration—a measure, expressed in years, of a portfolio’s sensitivity to changes in interest rates—was longer than that of its benchmark, boosting the fund’s relative performance. However, the fund is also considerably more diversified than the index, which had a countervailing effect. The top three issuers in the index constitute approximately two-thirds of the index but only 38% of our fund. Those issuers also have investment-grade ratings in the BBB range, meaning that our fund is higher in quality as well as more diversified. Lower quality paid during this period and the underweighting of those three issuers was a detractor. However, we strongly believe in the value of diversification over time.
Outlook
Global growth is expected to keep softening, owing in part to trade tensions and policy uncertainty. U.S. growth may slow to a pace of around 1% in 2020 after adjusting for inflation, below its normal trend growth of around 2%.
Other major economies are likely to see a slowdown as well. Growth in China, the world’s second-largest economy, is likely to slow to a below-trend pace of around 5.8% in 2020—but that figure could be markedly lower without further stimulus. Likewise, in the euro area, growth may stay below trend, at about 1%, given
recent indications that manufacturing weakness is spilling over into supply chains and the services sector.
This backdrop, along with modest wage gains and structural factors such as technology advancements and globalization, is unlikely to fuel a surge in consumer prices.
We expect to see periods of turbulence in the global economy in the year ahead. Based on that outlook and the fact that rates are low and credit spreads are tight, we are positioned going into the new fiscal year with plenty of dry powder on hand, which will allow us to take advantage of price dislocations as they arise.
Whatever the markets may bring, our experienced team of portfolio managers, traders, and credit analysts will continue to navigate this large, fragmented market to seek attractive investment opportunities that will add to the funds’ performance.
Paul M. Malloy, CFA, Principal,
Head of Municipal Bond Group
John M. Carbone, Principal,
Portfolio Manager
Adam M. Ferguson, CFA,
Portfolio Manager
Vanguard Fixed Income Group
December 18, 2019
About Your Fund’s Expenses
As a shareholder of the fund, you incur ongoing costs, which include costs for portfolio management, administrative services, and shareholder reports (like this one), among others. Operating expenses, which are deducted from a fund’s gross income, directly reduce the investment return of the fund.
A fund’s expenses are expressed as a percentage of its average net assets. This figure is known as the expense ratio. The following examples are intended to help you understand the ongoing costs (in dollars) of investing in your fund and to compare these costs with those of other mutual funds. The examples are based on an investment of $1,000 made at the beginning of the period shown and held for the entire period.
The accompanying table illustrates your fund’s costs in two ways:
· Based on actual fund return. This section helps you to estimate the actual expenses that you paid over the period. The “Ending Account Value” shown is derived from the fund’s actual return, and the third column shows the dollar amount that would have been paid by an investor who started with $1,000 in the fund. You may use the information here, together with the amount you invested, to estimate the expenses that you paid over the period.
To do so, simply divide your account value by $1,000 (for example, an $8,600 account value divided by $1,000 = 8.6), then multiply the result by the number given for your fund under the heading “Expenses Paid During Period.”
· Based on hypothetical 5% yearly return. This section is intended to help you compare your fund’s costs with those of other mutual funds. It assumes that the fund had a yearly return of 5% before expenses, but that the expense ratio is unchanged. In this case—because the return used is not the fund’s actual return—the results do not apply to your investment. The example is useful in making comparisons because the Securities and Exchange Commission requires all mutual funds to calculate expenses based on a 5% return. You can assess your fund’s costs by comparing this hypothetical example with the hypothetical examples that appear in shareholder reports of other funds.
Note that the expenses shown in the table are meant to highlight and help you compareongoingcosts only and do not reflect transaction costs incurred by the fund for buying and selling securities. Further, the expenses do not include any purchase, redemption, or account service fees described in the fund prospectus. If such fees were applied to your account, your costs would be higher. Your fund does not carry a “sales load.”
The calculations assume no shares were bought or sold during the period. Your actual costs may have been higher or lower, depending on the amount of your investment and the timing of any purchases or redemptions.
You can find more information about the fund’s expenses, including annual expense ratios, in the Financial Statements section of this report. For additional information on operating expenses and other shareholder costs, please refer to your fund’s current prospectus.
Six Months Ended November 30, 2019
| | Beginning | Ending | Expenses |
| | Account Value | Account Value | Paid During |
| | 5/31/2019 | 11/30/2019 | Period |
| Based on Actual Fund Return | | | |
| New Jersey Municipal Money Market Fund | $1,000.00 | $1,005.88 | $0.80 |
| New Jersey Long-Term Tax-Exempt Fund | | | |
| Investor Shares | $1,000.00 | $1,027.38 | $0.86 |
| Admiral™ Shares | 1,000.00 | 1,027.80 | 0.46 |
| Based on Hypothetical 5% Yearly Return | | | |
| New Jersey Municipal Money Market Fund | $1,000.00 | $1,024.27 | $0.81 |
| New Jersey Long-Term Tax-Exempt Fund | | | |
| Investor Shares | $1,000.00 | $1,024.22 | $0.86 |
| Admiral Shares | 1,000.00 | 1,024.62 | 0.46 |
The calculations are based on expenses incurred in the most recent six-month period. The funds’ annualized six-month expense ratios for that period are: for the New Jersey Municipal Money Market Fund, 0.16%; and for the New Jersey Long-Term Tax-Exempt Fund, 0.17% for Investor Shares and 0.09% for Admiral Shares. The dollar amounts shown as “Expenses Paid” are equal to the annualized expense ratio multiplied by the average account value over the period, multiplied by the number of days in the most recent six-month period, then divided by the number of days in the most recent 12-month period (183/365).
New Jersey Municipal Money Market Fund
Distribution by Issuer
As of November 30, 2019
| Tax-Exempt Securities | 100.0% |
New Jersey Municipal Money Market Fund
Financial Statements
Statement of Net Assets
As of November 30, 2019
The fund publishes its holdings on a monthly basis on Vanguard’s website and files them with the Securities and Exchange Commission (SEC) on Form N-MFP. The fund’s Form N-MFP filings may be viewed via a link on the “Portfolio Holdings” page at www.vanguard.com or on the SEC’s website at www.sec.gov.
| | | | | | | Face | | Market | |
| | | | Maturity | | | Amount | | Value· | |
| | | Coupon | Date | | | ($000 | ) | ($000 | ) |
| Tax-Exempt Municipal Bonds (97.6%) | | | | | | | | |
| New Jersey (97.5%) | | | | | | | | |
| | Bergen County NJ GO | 3.250% | 12/12/19 | | | 12,900 | | 12,906 | |
| | Bergen County NJ GO | 3.000% | 7/15/20 | | | 2,470 | | 2,498 | |
| | Bergen County NJ Improvement Authority Revenue (Bergen New Bridge Medical Center Project) | 4.000% | 9/1/20 | | | 1,675 | | 1,707 | |
| | Brick Township NJ BAN | 2.250% | 6/24/20 | | | 4,000 | | 4,019 | |
| | Burlington County NJ Bridge Commission Revenue | 2.750% | 4/17/20 | | | 12,500 | | 12,550 | |
| | Burlington County NJ Bridge Commission Revenue | 3.000% | 4/17/20 | | | 15,000 | | 15,108 | |
| | Burlington County NJ Bridge Commission Revenue (Lutheran Home at Moorestown Project) VRDO | 1.120% | 12/6/19 | | LOC | 1,780 | | 1,780 | |
| | Burlington County NJ GO | 2.500% | 5/7/20 | | | 8,000 | | 8,026 | |
| | Delaware River Port Authority Pennsylvania & New Jersey Revenue | 5.000% | 1/1/20 | | (Prere.) | 1,340 | | 1,344 | |
| | Delaware River Port Authority Pennsylvania & New Jersey Revenue | 5.000% | 1/1/20 | | (Prere.) | 9,742 | | 9,773 | |
| | Delaware River Port Authority Pennsylvania & New Jersey Revenue | 5.000% | 1/1/20 | | (Prere.) | 2,710 | | 2,719 | |
| | Edison Township NJ BAN | 4.000% | 2/7/20 | | | 2,000 | | 2,010 | |
| | Essex County NJ Improvement Authority Revenue (Fern Senior Housing Project) VRDO | 1.100% | 12/6/19 | | LOC | 7,300 | | 7,300 | |
| | Essex County NJ Improvement Authority Revenue (Jewish Community Center of MetroWest Inc. Project) VRDO | 1.070% | 12/6/19 | | LOC | 8,515 | | 8,515 | |
| | Essex County NJ Improvement Authority Revenue (Pooled Government Loan) VRDO | 0.980% | 12/6/19 | | LOC | 17,115 | | 17,115 | |
| | Evesham NJ BAN | 2.750% | 5/7/20 | | | 2,906 | | 2,918 | |
| | Fair Lawn NJ BAN | 1.750% | 9/11/20 | | | 2,500 | | 2,510 | |
| | Gloucester County NJ Pollution Control Financing Authority Revenue (ExxonMobil Project) VRDO | 0.380% | 12/2/19 | | | 31,540 | | 31,540 | |
| | Haddonfield NJ BAN | 2.250% | 2/20/20 | | | 6,000 | | 6,010 | |
| | Hamilton Township NJ Mercer County BAN | 2.500% | 5/19/20 | | | 13,966 | | 14,024 | |
| | Hopewell Township NJ BAN | 2.000% | 4/3/20 | | | 4,444 | | 4,454 | |
| | Hopewell Township NJ BAN | 2.500% | 4/3/20 | | | 8,757 | | 8,780 | |
| | Howell Township NJ BAN | 2.000% | 10/9/20 | | | 3,000 | | 3,018 | |
| | Hudson County NJ BAN | 4.000% | 12/10/19 | | | 18,451 | | 18,461 | |
New Jersey Municipal Money Market Fund
| | | | | | | Face | | Market | |
| | | | Maturity | | | Amount | | Value· | |
| | | Coupon | Date | | | ($000 | ) | ($000 | ) |
| | Hudson County NJ Improvement Authority Lease Revenue | 2.500% | 9/18/20 | | | 3,750 | | 3,782 | |
| 1 | Hudson County NJ Improvement Authority Lease Revenue (Hudson County Vocational-Technical Schools Project) TOB VRDO | 1.100% | 12/6/19 | | | 1,730 | | 1,730 | |
| 1 | Hudson County NJ Improvement Authority Lease Revenue (Hudson County Vocational-Technical Schools Project) TOB VRDO | 1.140% | 12/6/19 | | | 4,875 | | 4,875 | |
| | Hudson County NJ Improvement Authority Pooled BAN | 3.000% | 5/22/20 | | | 1,500 | | 1,510 | |
| | Hudson County NJ Improvement Authority Pooled Revenue | 3.000% | 3/6/20 | | | 5,951 | | 5,969 | |
| | Jefferson Township NJ BAN | 2.250% | 6/19/20 | | | 2,851 | | 2,863 | |
| | Lawrence Township NJ BAN | 2.250% | 6/19/20 | | | 3,015 | | 3,027 | |
| | Lawrence Township NJ BAN | 2.000% | 7/17/20 | | | 6,950 | | 6,975 | |
| | Livingston NJ BAN | 3.000% | 2/4/20 | | | 5,211 | | 5,220 | |
| | Livingston NJ BAN | 2.000% | 10/9/20 | | | 13,000 | | 13,077 | |
| | Mahwah Township NJ BAN | 2.000% | 7/31/20 | | | 5,000 | | 5,021 | |
| | Mahwah Township NJ BAN | 1.750% | 10/2/20 | | | 3,950 | | 3,962 | |
| | Mercer County NJ BAN | 5.000% | 2/26/20 | | | 1,000 | | 1,009 | |
| | Middlesex NJ BAN | 3.000% | 6/5/20 | | | 14,554 | | 14,669 | |
| | Monmouth County NJ GO | 5.000% | 1/15/20 | | | 5,060 | | 5,085 | |
| | Monroe Township NJ Middlesex County BAN | 2.500% | 6/10/20 | | | 6,000 | | 6,031 | |
| | Montclair NJ BAN | 2.500% | 10/30/20 | | | 5,034 | | 5,091 | |
| | Morristown NJ BAN | 2.500% | 6/5/20 | | | 1,822 | | 1,829 | |
| | New Jersey Economic Development Authority Industrial Development Revenue (Ocean Spray Cranberries Inc. Project) VRDO | 1.150% | 12/6/19 | | LOC | 8,000 | | 8,000 | |
| | New Jersey Economic Development Authority Natural Gas Facilities Revenue (New Jersey Natural Gas) VRDO | 0.450% | 12/6/19 | | LOC | 24,900 | | 24,900 | |
| | New Jersey Economic Development Authority Revenue (Applewood Estates Project) VRDO | 0.880% | 12/6/19 | | LOC | 15,000 | | 15,000 | |
| | New Jersey Economic Development Authority Revenue (Columbia University Project) CP | 1.230% | 1/6/20 | | | 4,665 | | 4,665 | |
| | New Jersey Economic Development Authority Revenue (Cooper Health System Project) VRDO | 1.120% | 12/6/19 | | LOC | 34,100 | | 34,100 | |
| 1 | New Jersey Economic Development Authority Revenue (New Jersey Gas Co. Project) TOB VRDO | 1.140% | 12/6/19 | | LOC | 13,575 | | 13,575 | |
| 1 | New Jersey Economic Development Authority Revenue (School Facilities Construction) TOB VRDO | 1.150% | 12/6/19 | | LOC | 9,805 | | 9,805 | |
| 1 | New Jersey Economic Development Authority Revenue VRDO | 1.130% | 12/6/19 | | | 3,000 | | 3,000 | |
| | New Jersey Economic Development Authority Revenue(Provident Group-Montclair Properties LLC - Montclair State University Student Housing Project) | 5.875% | 6/1/20 | | (Prere.) | 3,000 | | 3,071 | |
| | New Jersey Economic Development Authority Revenue(Trustees of the Lawrenceville School Project) VRDO | 0.430% | 12/2/19 | | | 21,100 | | 21,100 | |
New Jersey Municipal Money Market Fund
| | | | | | | Face | | Market | |
| | | | Maturity | | | Amount | | Value· | |
| | | Coupon | Date | | | ($000 | ) | ($000 | ) |
| | New Jersey Economic Development Authority Revenue (Trustees of the Lawrenceville School Project) VRDO | 0.470% | 12/2/19 | | | 17,450 | | 17,450 | |
| 1 | New Jersey Economic Development Authority TOB VRDO | 1.140% | 12/6/19 | | LOC | 15,525 | | 15,525 | |
| | New Jersey Educational Facilities Authority Revenue (Institute for Advanced Studies) VRDO | 0.400% | 12/6/19 | | | 13,600 | | 13,600 | |
| | New Jersey Educational Facilities Authority Revenue (Institute for Advanced Studies) VRDO | 0.400% | 12/6/19 | | | 18,100 | | 18,100 | |
| 1 | New Jersey Educational Facilities Authority Revenue (Princeton University) TOB VRDO | 0.950% | 12/6/19 | | | 6,000 | | 6,000 | |
| 1 | New Jersey Educational Facilities Authority Revenue (Princeton University) TOB VRDO | 0.950% | 12/6/19 | | | 4,000 | | 4,000 | |
| 1 | New Jersey Educational Facilities Authority Revenue (Princeton University) TOB VRDO | 1.070% | 12/6/19 | | | 3,330 | | 3,330 | |
| 1 | New Jersey Educational Facilities Authority Revenue (Princeton University) TOB VRDO | 1.130% | 12/6/19 | | | 4,330 | | 4,330 | |
| | New Jersey Environmental Infrastructure Trust Revenue | 5.000% | 9/1/20 | | | 1,220 | | 1,255 | |
| | New Jersey Environmental Infrastructure Trust Revenue | 5.000% | 9/1/20 | | | 860 | | 884 | |
| | New Jersey Environmental Infrastructure Trust Revenue | 5.000% | 9/1/20 | | | 1,565 | | 1,610 | |
| | New Jersey Health Care Facilities Finance Authority (Community Hospital Group Inc.) VRDO | 1.170% | 12/6/19 | | LOC | 800 | | 800 | |
| | New Jersey Health Care Facilities Financing Authority Revenue (AHS Hospital Corp.) VRDO | 1.000% | 12/6/19 | | LOC | 12,965 | | 12,965 | |
| | New Jersey Health Care Facilities Financing Authority Revenue (AHS Hospital Corp.) VRDO | 1.000% | 12/6/19 | | LOC | 29,540 | | 29,540 | |
| | New Jersey Health Care Facilities Financing Authority Revenue (Hackensack Meridian Health) VRDO | 1.000% | 12/6/19 | | LOC | 19,540 | | 19,540 | |
| | New Jersey Health Care Facilities Financing Authority Revenue (Hospital Capital Asset Pooled Program) VRDO | 1.120% | 12/6/19 | | LOC | 23,365 | | 23,365 | |
| | New Jersey Health Care Facilities Financing Authority Revenue (Hospital Capital Asset Pooled Program) VRDO | 1.120% | 12/6/19 | | LOC | 23,950 | | 23,950 | |
| | New Jersey Health Care Facilities Financing Authority Revenue (MHAC I LLC) VRDO | 0.820% | 12/6/19 | | LOC | 10,520 | | 10,520 | |
| | New Jersey Health Care Facilities Financing Authority Revenue (MHAC I LLC) VRDO | 0.820% | 12/6/19 | | LOC | 8,540 | | 8,540 | |
| 1 | New Jersey Health Care Facilities Financing Authority Revenue (Princeton Healthcare System) TOB VRDO | 1.100% | 12/6/19 | | | 4,140 | | 4,140 | |
| | New Jersey Health Care Facilities Financing Authority Revenue (Robert Wood Johnson University) | 5.000% | 1/1/20 | | (Prere.) | 3,000 | | 3,010 | |
New Jersey Municipal Money Market Fund
| | | | | | | Face | | Market | |
| | | | Maturity | | | Amount | | Value· | |
| | | Coupon | Date | | | ($000 | ) | ($000 | ) |
| | New Jersey Health Care Facilities Financing Authority Revenue (Southern Ocean County Hospital) VRDO | 0.820% | 12/6/19 | | LOC | 14,020 | | 14,020 | |
| | New Jersey Health Care Facilities Financing Authority Revenue (Virtua Health) VRDO | 0.470% | 12/2/19 | | LOC | 400 | | 400 | |
| | New Jersey Health Care Facilities Financing Authority Revenue (Virtua Health) VRDO | 0.700% | 12/6/19 | | LOC | 4,730 | | 4,730 | |
| | New Jersey Health Care Facilities Financing Authority Revenue (Virtua Health) VRDO | 0.700% | 12/6/19 | | LOC | 7,820 | | 7,820 | |
| | New Jersey Health Care Facilities Financing Authority Revenue (Virtua Health) VRDO | 0.700% | 12/6/19 | | LOC | 46,940 | | 46,940 | |
| | New Jersey Health Care Facilities Financing Authority Revenue VRDO | 1.080% | 12/6/19 | | LOC | 3,260 | | 3,260 | |
| | New Jersey Higher Education Assistance Authority Student Loan Revenue | 4.500% | 12/1/19 | | | 1,000 | | 1,000 | |
| | New Jersey Higher Education Assistance Authority Student Loan Revenue | 5.000% | 12/1/19 | | | 3,850 | | 3,850 | |
| 1 | New Jersey Higher Education Assistance Authority Student Loan Revenue TOB VRDO | 1.130% | 12/6/19 | | | 2,380 | | 2,380 | |
| 1 | New Jersey Higher Education Assistance Authority Student Loan Revenue TOB VRDO | 1.140% | 12/6/19 | | | 17,150 | | 17,150 | |
| | New Jersey Housing & Mortgage Finance Agency Multi-Family Housing Revenue PUT | 1.580% | 6/1/20 | | | 1,700 | | 1,700 | |
| | New Jersey Housing & Mortgage Finance Agency Multi-Family Housing Revenue VRDO | 0.450% | 12/6/19 | | LOC | 6,415 | | 6,415 | |
| | New Jersey Housing & Mortgage Finance Agency Multi-Family Housing Revenue VRDO | 1.160% | 12/6/19 | | LOC | 65,435 | | 65,435 | |
| 1 | New Jersey Housing & Mortgage Finance Agency Single Family Housing Revenue TOB VRDO | 1.100% | 12/6/19 | | | 6,800 | | 6,800 | |
| 1 | New Jersey Housing & Mortgage Finance Agency Single Family Housing Revenue TOB VRDO | 1.110% | 12/6/19 | | | 4,780 | | 4,780 | |
| 1 | New Jersey Housing & Mortgage Finance Agency Single Family Housing Revenue TOB VRDO | 1.150% | 12/6/19 | | | 1,060 | | 1,060 | |
| 1 | New Jersey Transportation Trust Fund Authority Transportation Program Revenue TOB VRDO | 1.130% | 12/6/19 | | LOC | 16,900 | | 16,900 | |
| 1 | New Jersey Transportation Trust Fund Authority Transportation Program Revenue TOB VRDO | 1.130% | 12/6/19 | | LOC | 6,720 | | 6,720 | |
| 1 | New Jersey Transportation Trust Fund Authority Transportation System Revenue TOB VRDO | 1.150% | 12/6/19 | | LOC | 18,750 | | 18,750 | |
| 1 | New Jersey Turnpike Authority Revenue TOB VRDO | 1.150% | 12/6/19 | | LOC | 15,430 | | 15,430 | |
| | New Milford NJ GO | 2.500% | 4/9/20 | | | 11,211 | | 11,241 | |
| | North Bergen Township NJ BAN | 2.500% | 4/30/20 | | | 4,593 | | 4,608 | |
| | North Brunswick Township NJ BAN | 3.000% | 7/21/20 | | | 8,951 | | 9,048 | |
| | Paramus NJ TAN | 2.000% | 2/14/20 | | | 8,400 | | 8,409 | |
| | Parsippany-Troy Hills Township NJ BAN | 2.000% | 11/13/20 | | | 3,185 | | 3,210 | |
| 2 | Passaic County NJ BAN | 2.000% | 12/3/20 | | | 7,000 | | 7,059 | |
New Jersey Municipal Money Market Fund
| | | | | | | Face | | Market | |
| | | | Maturity | | | Amount | | Value· | |
| | | Coupon | Date | | | ($000 | ) | ($000 | ) |
| | Passaic County NJ Improvement Authority Revenue (200 Hospital Plaza Corp. Project) | 5.000% | 5/1/20 | | (Prere.) | 1,000 | | 1,016 | |
| | Port Authority of New York & New Jersey Revenue CP | 1.290% | 12/4/19 | | | 6,700 | | 6,700 | |
| | Port Authority of New York & New Jersey Revenue CP | 1.300% | 12/11/19 | | | 5,905 | | 5,905 | |
| | Port Authority of New York & New Jersey Revenue CP | 1.300% | 12/18/19 | | | 13,715 | | 13,715 | |
| | Port Authority of New York & New Jersey Revenue CP | 1.250% | 1/2/20 | | | 2,000 | | 2,000 | |
| | Port Authority of New York & New Jersey Revenue CP | 1.340% | 1/2/20 | | | 10,550 | | 10,550 | |
| | Port Authority of New York & New Jersey Revenue CP | 1.350% | 1/8/20 | | | 1,430 | | 1,430 | |
| | Port Authority of New York & New Jersey Revenue CP | 1.300% | 1/16/20 | | | 3,595 | | 3,595 | |
| | Port Authority of New York & New Jersey Revenue CP | 1.380% | 1/22/20 | | | 5,065 | | 5,065 | |
| | Port Authority of New York & New Jersey Revenue CP | 1.350% | 1/29/20 | | | 18,015 | | 18,015 | |
| | Port Authority of New York & New Jersey Revenue CP | 1.300% | 2/5/20 | | | 8,945 | | 8,945 | |
| | Port Authority of New York & New Jersey Revenue CP | 1.250% | 2/6/20 | | | 11,025 | | 11,025 | |
| | Port Authority of New York & New Jersey Revenue CP | 1.170% | 2/20/20 | | | 11,000 | | 11,000 | |
| | Port Authority of New York & New Jersey Revenue CP | 1.110% | 2/26/20 | | | 12,090 | | 12,090 | |
| | Port Authority of New York & New Jersey Revenue CP | 1.170% | 3/18/20 | | | 13,700 | | 13,700 | |
| | Port Authority of New York & New Jersey Revenue CP | 1.180% | 3/26/20 | | | 12,160 | | 12,160 | |
| 1 | Port Authority of New York & New Jersey Revenue TOB VRDO | 1.120% | 12/6/19 | | | 8,000 | | 8,000 | |
| 1 | Port Authority of New York & New Jersey Revenue TOB VRDO | 1.120% | 12/6/19 | | | 4,295 | | 4,295 | |
| 1 | Port Authority of New York & New Jersey Revenue TOB VRDO | 1.120% | 12/6/19 | | | 6,110 | | 6,110 | |
| 1 | Port Authority of New York & New Jersey Revenue TOB VRDO | 1.120% | 12/6/19 | | | 1,215 | | 1,215 | |
| 1 | Port Authority of New York & New Jersey Revenue TOB VRDO | 1.130% | 12/6/19 | | | 1,170 | | 1,170 | |
| 1 | Port Authority of New York & New Jersey Revenue TOB VRDO | 1.130% | 12/6/19 | | | 3,500 | | 3,500 | |
| 1 | Port Authority of New York & New Jersey Revenue TOB VRDO | 1.150% | 12/6/19 | | | 15,500 | | 15,500 | |
| 1 | Port Authority of New York & New Jersey Revenue TOB VRDO | 1.150% | 12/6/19 | | | 850 | | 850 | |
| 1 | Port Authority of New York & New Jersey Revenue TOB VRDO | 1.150% | 12/6/19 | | | 1,000 | | 1,000 | |
| 1 | Port Authority of New York & New Jersey TOB VRDO | 1.130% | 12/6/19 | | | 5,265 | | 5,265 | |
| | Princeton University New Jersey CP | 1.190% | 12/12/19 | | | 12,000 | | 12,000 | |
| | Princeton University New Jersey CP | 1.190% | 12/12/19 | | | 3,000 | | 3,000 | |
New Jersey Municipal Money Market Fund
| | | | | | | Face | | Market | |
| | | | Maturity | | | Amount | | Value· | |
| | | Coupon | Date | | | ($000 | ) | ($000 | ) |
| | River Vale NJ GO | 1.750% | 7/17/20 | | | 6,157 | | 6,171 | |
| | Rutgers State University New Jersey CP | 1.150% | 3/4/20 | | | 20,207 | | 20,207 | |
| 1 | Rutgers State University New Jersey Revenue TOB VRDO | 1.080% | 12/6/19 | | | 24,985 | | 24,985 | |
| 1 | Rutgers State University New Jersey Revenue TOB VRDO | 1.090% | 12/6/19 | | | 1,840 | | 1,840 | |
| 1 | Rutgers State University New Jersey Revenue TOB VRDO | 1.090% | 12/6/19 | | | 3,315 | | 3,315 | |
| 1 | Rutgers State University New Jersey Revenue TOB VRDO | 1.110% | 12/6/19 | | | 4,035 | | 4,035 | |
| 1 | Rutgers State University New Jersey Revenue TOB VRDO | 1.130% | 12/6/19 | | | 6,700 | | 6,700 | |
| 1 | Rutgers State University New Jersey Revenue TOB VRDO | 1.130% | 12/6/19 | | | 11,780 | | 11,780 | |
| | Rutgers State University New Jersey Revenue VRDO | 1.110% | 12/2/19 | | | 5,250 | | 5,250 | |
| | Secaucus NJ BAN | 1.750% | 8/7/20 | | | 4,000 | | 4,010 | |
| | Somerset County NJ BAN | 3.000% | 9/11/20 | | | 5,000 | | 5,072 | |
| | Somerset County NJ Improvement Authority Capital Equipment Lease Revenue | 2.750% | 2/28/20 | | | 2,070 | | 2,075 | |
| | Somerset County NJ Improvement Authority Capital Equipment Lease Revenue | 3.000% | 9/11/20 | | | 10,000 | | 10,142 | |
| | Sussex County NJ BAN | 2.500% | 6/19/20 | | | 7,383 | | 7,427 | |
| 1 | Union County NJ Improvement Authority Lease Revenue TOB VRDO | 1.100% | 12/6/19 | | | 1,600 | | 1,600 | |
| | Union County NJ Pollution Control Financing Authority Revenue (Exxon Project) VRDO | 0.380% | 12/2/19 | | | 27,145 | | 27,145 | |
| | Union County NJ Pollution Control Financing Authority Revenue (Exxon Project) VRDO | 0.400% | 12/2/19 | | | 12,200 | | 12,200 | |
| 1 | Union County NJ Utilities Authority Revenue TOB VRDO | 1.100% | 12/6/19 | | | 3,500 | | 3,500 | |
| 1 | Union County NJ Utilities Authority Revenue TOB VRDO | 1.170% | 12/6/19 | | | 8,815 | | 8,815 | |
| | Union Township NJ BAN | 3.000% | 2/3/20 | | | 5,063 | | 5,072 | |
| | Voorhees NJ BAN | 1.750% | 1/15/20 | | | 5,709 | | 5,712 | |
| | Voorhees NJ BAN | 1.750% | 8/20/20 | | | 5,208 | | 5,227 | |
| | Wall Township NJ BAN | 2.250% | 2/25/20 | | | 5,000 | | 5,009 | |
| | West Milford NJ BAN | 1.750% | 9/18/20 | | | 8,449 | | 8,481 | |
| | Woodbridge Township NJ BAN | 3.000% | 3/20/20 | | | 21,950 | | 22,026 | |
| | Woodbridge Township NJ BAN | 3.000% | 10/16/20 | | | 2,500 | | 2,539 | |
| | Woodland Park NJ BAN | 2.500% | 5/29/20 | | | 4,352 | | 4,371 | |
| | | | | | | | | 1,363,117 | |
| Guam (0.1%) | | | | | | | | |
| | Guam Government Limited Obligation Revenue | 5.625% | 12/1/19 | | (Prere.) | 1,500 | | 1,500 | |
| | Guam Government Limited Obligation Revenue | 5.750% | 12/1/19 | | (Prere.) | 600 | | 600 | |
| | | | | | | | | 2,100 | |
| Total Tax-Exempt Municipal Bonds (Cost $1,365,217) | | | | | | 1,365,217 | |
New Jersey Municipal Money Market Fund
| | Amount |
| | ($000) |
| Other Assets and Liabilities (2.4%) | |
| Other Assets | |
| Investment in Vanguard | 65 |
| Receivables for Investment Securities Sold | 11,125 |
| Receivables for Capital Shares Issued | 3,463 |
| Receivables for Accrued Income | 6,725 |
| Other Assets | 23,562 |
| Total Other Assets | 44,940 |
| Liabilities | |
| Payables for Investment Securities Purchased | (10,130) |
| Payables for Capital Shares Redeemed | (1,405) |
| Payables for Distributions | (84) |
| Payables to Vanguard | (104) |
| Total Liabilities | (11,723) |
| Net Assets (100%) | |
| Applicable to 1,398,081,547 outstanding $.001 par value shares of beneficial interest (unlimited authorization) | 1,398,434 |
| Net Asset Value Per Share | $1.00 |
At November 30, 2019, net assets consisted of:
| | Amount |
| | ($000) |
| Paid-in Capital | 1,398,420 |
| Total Distributable Earnings (Loss) | 14 |
| Net Assets | 1,398,434 |
| • | See Note A in Notes to Financial Statements. |
| 1 | Security exempt from registration under Rule 144A of the Securities Act of 1933. Such securities may be sold in transactions exempt from registration, normally to qualified institutional buyers. At November 30, 2019, the aggregate value of these securities was $273,755,000, representing 19.6% of net assets. |
| 2 | Security purchased on a when-issued or delayed-delivery basis for which the fund has not taken delivery as of November 30, 2019. |
A key to abbreviations and other references follows the Statement of Net Assets.
See accompanying Notes, which are an integral part of the Financial Statements.
New Jersey Municipal Money Market Fund
Key to Abbreviations
ARS—Auction Rate Security.
BAN—Bond Anticipation Note.
CMT—Constant Maturing Treasury Rate.
COP—Certificate of Participation.
CP—Commercial Paper.
FR—Floating Rate.
GAN—Grant Anticipation Note.
GO—General Obligation Bond.
LIBOR—London Interbank Offered Rate.
PILOT—Payments in Lieu of Taxes.
PUT—Put Option Obligation.
RAN—Revenue Anticipation Note.
SIFMA—Securities Industry and Financial Markets Association.
SOFR—Secured Overnight Financing Rate.
TAN—Tax Anticipation Note.
TOB—Tender Option Bond.
TRAN—Tax Revenue Anticipation Note.
VRDO—Variable Rate Demand Obligation.
VRDP—Variable Rate Demand Preferred.
(ETM)—Escrowed to Maturity.
(Prere.)—Prerefunded.
Scheduled principal and interest payments are guaranteed by:
(1) MBIA (Municipal Bond Investors Assurance).
(2) AMBAC (Ambac Assurance Corporation).
(3) FGIC (Financial Guaranty Insurance Company).
(4) AGM (Assured Guaranty Municipal Corporation).
(5) BIGI (Bond Investors Guaranty Insurance).
(6) Connie Lee Inc.
(7) FHA (Federal Housing Authority).
(8) CapMAC (Capital Markets Assurance Corporation).
(9) American Capital Access Financial Guaranty Corporation.
(10) XL Capital Assurance Inc.
(11) CIFG (CDC IXIS Financial Guaranty).
(12) AGC (Assured Guaranty Corporation).
(13) BHAC (Berkshire Hathaway Assurance Corporation).
(14) NPFG (National Public Finance Guarantee Corporation).
(15) BAM (Build America Mutual Assurance Company).
(16) MAC (Municipal Assurance Corporation).
(17) RAA (Radian Asset Assurance Inc.).
(18) SBLF (Michigan School Bond Loan Fund).
(19) TPSF (Texas Permanent School Fund).
The insurance does not guarantee the market value of the municipal bonds.
LOC—Scheduled principal and interest payments are guaranteed by bank letter of credit.
New Jersey Municipal Money Market Fund
Statement of Operations
| | Year Ended |
| | | November 30, 2019 |
| | ($000) |
| Investment Income | |
| Income | |
| Interest | 20,797 |
| Total Income | 20,797 |
| Expenses | |
| The Vanguard Group—Note B | |
| Investment Advisory Services | 395 |
| Management and Administrative | 1,602 |
| Marketing and Distribution | 200 |
| Custodian Fees | 10 |
| Auditing Fees | 28 |
| Shareholders’ Reports and Proxy | 44 |
| Trustees’ Fees and Expenses | 1 |
| Total Expenses | 2,280 |
| Expenses Paid Indirectly | (9) |
| Net Expenses | 2,271 |
| Net Investment Income | 18,526 |
| Realized Gain (Loss) on Investment Securities Sold | 110 |
| Net Increase (Decrease) in Net Assets Resulting from Operations | 18,636 |
See accompanying Notes, which are an integral part of the Financial Statements.
New Jersey Municipal Money Market Fund
Statement of Changes in Net Assets
| | Year Ended November 30, |
| | 2019 | 2018 |
| | ($000) | ($000) |
| Increase (Decrease) in Net Assets | | |
| Operations | | |
| Net Investment Income | 18,526 | 16,431 |
| Realized Net Gain (Loss) | 110 | (42) |
| Net Increase (Decrease) in Net Assets Resulting from Operations | 18,636 | 16,389 |
| Distributions | | |
| Net Investment Income | (18,525) | (16,432) |
| Realized Capital Gain | — | — |
| Total Distributions | (18,525) | (16,432) |
| Capital Share Transactions (at $1.00 per share) | | |
| Issued | 737,215 | 899,807 |
| Issued in Lieu of Cash Distributions | 17,199 | 15,409 |
| Redeemed | (777,596) | (783,089) |
| Net Increase (Decrease) from Capital Share Transactions | (23,182) | 132,127 |
| Total Increase (Decrease) | (23,071) | 132,084 |
| Net Assets | | |
| Beginning of Period | 1,421,505 | 1,289,421 |
| End of Period | 1,398,434 | 1,421,505 |
See accompanying Notes, which are an integral part of the Financial Statements.
New Jersey Municipal Money Market Fund
Financial Highlights
| For a Share Outstanding | | | Year Ended November 30, |
| Throughout Each Period | 2019 | 2018 | 2017 | 2016 | 2015 |
| Net Asset Value, Beginning of Period | $1.00 | $1.00 | $1.00 | $1.00 | $1.00 |
| Investment Operations | | | | | |
| Net Investment Income | .0131 | .0121 | .0061 | .002 | .0001 |
| Net Realized and Unrealized Gain (Loss) on Investments | — | — | — | — | — |
| Total from Investment Operations | .013 | .012 | .006 | .002 | .0001 |
| Distributions | | | | | |
| Dividends from Net Investment Income | (.013) | (.012) | (.006) | (.002) | (.0001) |
| Distributions from Realized Capital Gains | — | — | — | — | — |
| Total Distributions | (.013) | (.012) | (.006) | (.002) | (.0001) |
| Net Asset Value, End of Period | $1.00 | $1.00 | $1.00 | $1.00 | $1.00 |
| | | | | | |
| Total Return2 | 1.31% | 1.21% | 0.63% | 0.24% | 0.01% |
| | | | | | |
| Ratios/Supplemental Data | | | | | |
| Net Assets, End of Period (Millions) | $1,398 | $1,422 | $1,289 | $1,198 | $1,345 |
| Ratio of Total Expenses to Average Net Assets | 0.16% | 0.16% | 0.16% | 0.14%3 | 0.08%3 |
| Ratio of Net Investment Income to Average Net Assets | 1.31% | 1.21% | 0.63% | 0.23% | 0.01% |
| 1 | Calculated based on average shares outstanding. |
| 2 | Total returns do not include account service fees that may have applied in the periods shown. Fund prospectuses provide information about any applicable account service fees. |
| 3 | The ratio of total expenses to average net assets before an expense reduction was 0.16% for 2016 and 0.16% for 2015. Vanguard and the board of trustees have agreed to temporarily limit certain net operating expenses in excess of the fund’s daily yield in order to maintain a zero or positive yield for the fund. The fund is not obligated to repay this amount to Vanguard. |
See accompanying Notes, which are an integral part of the Financial Statements.
New Jersey Municipal Money Market Fund
Notes to Financial Statements
Vanguard New Jersey Municipal Money Market Fund is registered under the Investment Company Act of 1940 as an open-end investment company, or mutual fund. The fund invests in debt instruments of municipal issuers whose ability to meet their obligations may be affected by economic and political developments in the state.
A. The following significant accounting policies conform to generally accepted accounting principles for U.S. investment companies. The fund consistently follows such policies in preparing its financial statements.
1. Security Valuation: Securities are valued as of the close of trading on the New York Stock Exchange (generally 4 p.m., Eastern time) on the valuation date. Securities are valued at amortized cost, which approximates market value.
2. Federal Income Taxes: The fund intends to continue to qualify as a regulated investment company and distribute all of its taxable income. Management has analyzed the fund’s tax positions taken for all open federal income tax years (November 30, 2016–2019), and has concluded that no provision for federal income tax is required in the fund’s financial statements.
3. Distributions: Distributions from net investment income are declared daily and paid on the first business day of the following month. Annual distributions from realized capital gains, if any, are recorded on the ex-dividend date. Distributions are determined on a tax basis and may differ from net investment income and realized capital gains for financial reporting purposes.
4. Credit Facility: The fund and certain other funds managed by The Vanguard Group (“Vanguard”) participate in a $4.3 billion committed credit facility provided by a syndicate of lenders pursuant to a credit agreement that may be renewed annually; each fund is individually liable for its borrowings, if any, under the credit facility. Borrowings may be utilized for temporary and emergency purposes, and are subject to the fund’s regulatory and contractual borrowing restrictions. The participating funds are charged administrative fees and an annual commitment fee of 0.10% of the undrawn amount of the facility; these fees are allocated to the funds based on a method approved by the fund’s board of trustees and included in Management and Administrative expenses on the fund’s Statement of Operations. Any borrowings under this facility bear interest at a rate based upon the higher of the one-month London Interbank Offered Rate, federal funds effective rate, or overnight bank funding rate plus an agreed-upon spread.
The fund had no borrowings outstanding at November 30, 2019, or at any time during the period then ended.
5. Other: Interest income is accrued daily. Premiums and discounts on debt securities purchased are amortized and accreted, respectively, to interest income over the lives of the respective securities. Security transactions are accounted for on the date securities are bought or sold. Costs used to determine realized gains (losses) on the sale of investment securities are those of the specific securities sold.
B. In accordance with the terms of a Funds’ Service Agreement (the “FSA”) between Vanguard and the fund, Vanguard furnishes to the fund investment advisory, corporate management, administrative, marketing, and distribution services at Vanguard’s cost of operations (as defined by the FSA). These costs of operations are allocated to the fund based on methods and guidelines approved by the board of trustees and are generally settled twice a month.
New Jersey Municipal Money Market Fund
Upon the request of Vanguard, the fund may invest up to 0.40% of its net assets as capital in Vanguard. At November 30, 2019, the fund had contributed to Vanguard capital in the amount of $65,000, representing less than 0.01% of the fund’s net assets and 0.03% of Vanguard’s capital received pursuant to the FSA. The fund’s trustees and officers are also directors and employees, respectively, of Vanguard.
C. The fund’s custodian bank has agreed to reduce its fees when the fund maintains cash on deposit in the non-interest-bearing custody account. For the year ended November 30, 2019, custodian fee offset arrangements reduced the fund’s expenses by $9,000 (an annual rate of less than 0.01% of average net assets).
D. Various inputs may be used to determine the value of the fund’s investments. These inputs are summarized in three broad levels for financial statement purposes. The inputs or methodologies used to value securities are not necessarily an indication of the risk associated with investing in those securities.
Level 1—Quoted prices in active markets for identical securities.
Level 2—Other significant observable inputs (including quoted prices for similar securities, interest rates, prepayment speeds, credit risk, etc.).
Level 3—Significant unobservable inputs (including the fund’s own assumptions used to determine the fair value of investments). Any investments valued with significant unobservable inputs are noted on the Statement of Net Assets.
At November 30, 2019, 100% of the market value of the fund’s investments was determined using amortized cost, in accordance with rules under the Investment Company Act of 1940. Amortized cost approximates the current fair value of a security, but since the value is not obtained from a quoted price in an active market, securities valued at amortized cost are considered to be valued using Level 2 inputs.
E. Permanent differences between book-basis and tax-basis components of net assets, if any, are reclassified among capital accounts in the financial statements to reflect their tax character. These reclassifications have no effect on net assets or net asset value per share.
Temporary differences between book-basis and tax-basis components of total distributable earnings (loss) arise when certain items of income, gain, or loss are recognized in different periods for financial statement and tax purposes; these differences will reverse at some time in the future. The differences are primarily related to payables for distributions. As of period end, the tax-basis components of total distributable earnings (loss) are detailed in the table as follows:
| | Amount |
| | ($000) |
| Undistributed Ordinary Income | — |
| Undistributed Tax-Exempt Income | 84 |
| Undistributed Long-Term Gains | — |
| Capital Loss Carryforwards (Non-expiring)* | — |
| Net Unrealized Gains (Losses) | — |
| * | The fund used capital loss carryforwards of $47,000 to offset taxable capital gains realized during the year ended November 30, 2019. |
New Jersey Municipal Money Market Fund
As of November 30, 2019, gross unrealized appreciation and depreciation for investments based on cost for U.S. federal income tax purposes were as follows:
| | Amount |
| | ($000) |
| Tax Cost | 1,365,217 |
| Gross Unrealized Appreciation | — |
| Gross Unrealized Depreciation | — |
| Net Unrealized Appreciation (Depreciation) | — |
F. The fund purchased securities from and sold securities to other Vanguard funds or accounts managed by Vanguard or its affiliates, in accordance with procedures adopted by the board of trustees in compliance with Rule 17a-7 of the Investment Company Act of 1940. For the year ended November 30, 2019, such purchases and sales were $423,000,000 and $299,815,000, respectively.
G. Management has determined that no events or transactions occurred subsequent to November 30, 2019, that would require recognition or disclosure in these financial statements.
New Jersey Long-Term Tax-Exempt Fund
Performance Summary
All of the returns in this report represent past performance, which is not a guarantee of future results that may be achieved by the fund. (Current performance may be lower or higher than the performance data cited. For performance data current to the most recent month-end, visit our website at vanguard.com/performance.) Note, too, that both investment returns and principal value can fluctuate widely, so an investor’s shares, when sold, could be worth more or less than their original cost. The returns shown do not reflect taxes that a shareholder would pay on fund distributions or on the sale of fund shares.
Cumulative Performance: November 30, 2009, Through November 30, 2019
Initial Investment of $10,000
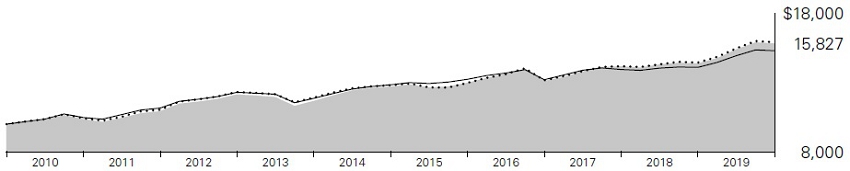
| | | Average Annual Total Returns | |
| | | Periods Ended November 30, 2019 | |
| | | | | | Final Value |
| | | One | Five | Ten | of a $10,000 |
| | | Year | Years | Years | Investment |
 | New Jersey Long-Term Tax-Exempt Fund Investor Shares | 10.00% | 4.49% | 4.70% | $15,827 |
 | Bloomberg Barclays NJ Municipal Bond Index | 10.18 | 4.44 | 4.76 | 15,914 |
 | Bloomberg Barclays Municipal Bond Index | 8.49 | 3.57 | 4.34 | 15,300 |
| | | | | Final Value |
| | One | Five | Ten | of a $50,000 |
| | Year | Years | Years | Investment |
| New Jersey Long-Term Tax-Exempt Fund Admiral Shares | 10.09% | 4.58% | 4.79% | $79,797 |
| Bloomberg Barclays NJ Municipal Bond Index | 10.18 | 4.44 | 4.76 | 79,571 |
| Bloomberg Barclays Municipal Bond Index | 8.49 | 3.57 | 4.34 | 76,500 |
See Financial Highlights for dividend and capital gains information.
New Jersey Long-Term Tax-Exempt Fund
Distribution by Stated Maturity
As of November 30, 2019
| Under 1 Year | 3.1% |
| 1 - 3 Years | 4.0 |
| 3 - 5 Years | 4.3 |
| 5 - 10 Years | 13.9 |
| 10 - 20 Years | 44.8 |
| 20 - 30 Years | 26.9 |
| Over 30 Years | 3.0 |
New Jersey Long-Term Tax-Exempt Fund
Financial Statements
Statement of Net Assets
As of November 30, 2019
The fund files its complete schedule of portfolio holdings with the Securities and Exchange Commission (SEC) for the first and third quarters of each fiscal year as an exhibit to its reports on Form N-PORT. The fund’s Form N-PORT reports are available on the SEC’s website at www.sec.gov.
| | | | | | | Face | | Market | |
| | | | Maturity | | | Amount | | Value· | |
| | | Coupon | Date | | | ($000 | ) | ($000 | ) |
| Tax-Exempt Municipal Bonds (100.7%) | | | | | | | | |
| New Jersey (100.2%) | | | | | | | | |
| | Atlantic City NJ GO | 5.000% | 11/1/22 | | | 3,000 | | 3,137 | |
| | Atlantic City NJ GO | 4.000% | 11/1/23 | | (4) | 1,425 | | 1,523 | |
| | Atlantic City NJ GO | 5.000% | 12/1/23 | | | 1,115 | | 1,183 | |
| | Atlantic City NJ GO | 5.000% | 3/1/26 | | (15) | 250 | | 297 | |
| | Atlantic City NJ GO | 5.000% | 3/1/32 | | (15) | 750 | | 891 | |
| | Atlantic City NJ GO | 5.000% | 3/1/37 | | (15) | 1,000 | | 1,174 | |
| | Atlantic City NJ GO | 5.000% | 3/1/42 | | (15) | 1,250 | | 1,451 | |
| | Atlantic City NJ Municipal Utilities Authority Revenue | 4.000% | 5/1/21 | | | 200 | | 201 | |
| | Atlantic County NJ Improvement Authority Revenue | 5.000% | 9/1/28 | | (4) | 3,000 | | 3,636 | |
| | Atlantic County NJ Improvement Authority Revenue | 4.000% | 7/1/46 | | (4) | 5,000 | | 5,375 | |
| | Bergen County NJ GO | 3.000% | 7/15/38 | | | 1,620 | | 1,678 | |
| | Bergen County NJ Improvement Authority Pooled Loan Revenue | 5.000% | 2/15/20 | | | 455 | | 458 | |
| | Bergen County NJ Improvement Authority Pooled Loan Revenue | 5.000% | 2/15/39 | | | 4,000 | | 4,570 | |
| | Brick Township NJ BAN | 4.000% | 3/1/22 | | | 1,110 | | 1,180 | |
| | Brick Township NJ BAN | 3.000% | 3/1/23 | | | 1,155 | | 1,220 | |
| | Brigantine NJ GO | 5.000% | 10/1/20 | | | 1,020 | | 1,053 | |
| | Brigantine NJ GO | 5.000% | 10/1/21 | | | 935 | | 1,000 | |
| | Brigantine NJ GO | 5.000% | 10/1/22 | | | 1,175 | | 1,296 | |
| | Brigantine NJ GO | 5.000% | 10/1/23 | | | 1,220 | | 1,388 | |
| | Burlington County NJ Bridge Commission Revenue | 5.000% | 4/15/32 | | | 500 | | 641 | |
| | Burlington County NJ Bridge Commission Revenue | 5.000% | 10/1/36 | | | 1,000 | | 1,250 | |
| | Burlington County NJ Bridge Commission Revenue (Burlington County Solid Waste Project) | 5.000% | 10/1/27 | | | 4,100 | | 4,650 | |
| | Burlington County NJ GO | 3.000% | 5/1/30 | | | 1,610 | | 1,733 | |
| | Burlington County NJ GO | 3.000% | 5/1/31 | | | 1,650 | | 1,758 | |
| | Burlington County NJ GO | 3.000% | 5/1/32 | | | 1,695 | | 1,791 | |
| | Burlington County NJ GO | 3.000% | 5/1/33 | | | 1,745 | | 1,831 | |
| | Burlington County NJ GO | 3.000% | 5/1/34 | | | 1,790 | | 1,874 | |
| | Camden County NJ GO | 3.000% | 3/1/33 | | | 550 | | 575 | |
| | Camden County NJ Improvement Authority Health Care Redevelopment Project Revenue (Cooper Health System Obligated Group) | 5.000% | 2/15/28 | | | 1,500 | | 1,687 | |
New Jersey Long-Term Tax-Exempt Fund
| | | | | | | Face | | Market | |
| | | | Maturity | | | Amount | | Value· | |
| | | Coupon | Date | | | ($000 | ) | ($000 | ) |
| | Camden County NJ Improvement Authority Health Care Redevelopment Project Revenue (Cooper Health System Obligated Group) | 5.000% | 2/15/29 | | | 3,500 | | 3,926 | |
| | Camden County NJ Improvement Authority Health Care Redevelopment Project Revenue (Cooper Health System Obligated Group) | 5.000% | 2/15/30 | | | 3,805 | | 4,257 | |
| | Camden County NJ Improvement Authority Health Care Redevelopment Project Revenue (Cooper Health System Obligated Group) | 5.000% | 2/15/31 | | | 4,970 | | 5,547 | |
| | Camden County NJ Improvement Authority Health Care Redevelopment Project Revenue (Cooper Health System Obligated Group) | 5.000% | 2/15/32 | | | 2,500 | | 2,786 | |
| | Camden County NJ Improvement Authority Health Care Redevelopment Project Revenue (Cooper Health System Obligated Group) | 5.000% | 2/15/33 | | | 1,000 | | 1,112 | |
| | Camden County NJ Improvement Authority Health Care Redevelopment Project Revenue (Cooper Health System Obligated Group) | 5.000% | 2/15/34 | | | 1,500 | | 1,665 | |
| | Camden County NJ Improvement Authority Health Care Redevelopment Project Revenue (Cooper Health System Obligated Group) | 5.750% | 2/15/42 | | | 12,625 | | 14,014 | |
| | Camden County NJ Improvement Authority Lease Revenue (Rowan University School of Osteopathic Medicine Project) | 5.000% | 12/1/32 | | | 6,035 | | 6,725 | |
| | Camden County NJ Improvement Authority Revenue | 5.000% | 1/15/22 | | (Prere.) | 3,600 | | 3,894 | |
| | Camden County NJ Improvement Authority Revenue | 5.000% | 1/15/22 | | (Prere.) | 3,225 | | 3,488 | |
| | Camden County NJ Improvement Authority Revenue | 5.000% | 1/15/32 | | | 515 | | 625 | |
| | Camden County NJ Improvement Authority Revenue | 5.000% | 1/15/34 | | | 500 | | 603 | |
| 1 | Camden County NJ Improvement Authority Revenue | 4.000% | 1/15/36 | | | 1,655 | | 1,868 | |
| | Camden County NJ Improvement Authority Revenue | 4.000% | 1/15/36 | | | 500 | | 561 | |
| 1 | Camden County NJ Improvement Authority Revenue | 4.000% | 1/15/37 | | | 3,470 | | 3,912 | |
| 1 | Camden County NJ Improvement Authority Revenue | 4.000% | 1/15/38 | | | 1,705 | | 1,919 | |
| | Camden County NJ Improvement Authority Revenue | 4.000% | 1/15/38 | | | 880 | | 983 | |
| 1 | Camden County NJ Improvement Authority Revenue | 4.000% | 1/15/39 | | | 1,260 | | 1,414 | |
| | Camden County NJ Improvement Authority Revenue | 4.000% | 1/15/39 | | | 1,000 | | 1,114 | |
| | Cedar Grove Township NJ School District GO | 2.000% | 8/15/24 | | | 290 | | 296 | |
| | Cumberland NJ Improvement Authority Lease Revenue (Correctional Facility Project) | 4.000% | 10/1/54 | | (15) | 6,000 | | 6,492 | |
| | Cumberland NJ Improvement Authority Lease Revenue (Correctional Facility Project) | 5.000% | 10/1/58 | | (15) | 5,500 | | 6,498 | |
| | Delaware River & Bay Authority Delaware Revenue | 3.000% | 1/1/35 | | | 1,000 | | 1,039 | |
| | Delaware River & Bay Authority Delaware Revenue | 3.000% | 1/1/36 | | | 1,000 | | 1,033 | |
New Jersey Long-Term Tax-Exempt Fund
| | | | | | | Face | | Market | |
| | | | Maturity | | | Amount | | Value· | |
| | | Coupon | Date | | | ($000 | ) | ($000 | ) |
| | Delaware River & Bay Authority Delaware Revenue | 3.000% | 1/1/37 | | | 1,000 | | 1,029 | |
| | Delaware River & Bay Authority Delaware Revenue | 3.000% | 1/1/38 | | | 1,000 | | 1,024 | |
| | Delaware River & Bay Authority Delaware Revenue | 5.000% | 1/1/42 | | | 9,980 | | 10,845 | |
| | Delaware River & Bay Authority Delaware Revenue | 4.000% | 1/1/44 | | | 2,000 | | 2,236 | |
| | Delaware River Joint Toll Bridge Commission Pennsylvania & New Jersey Revenue | 5.000% | 7/1/24 | | | 625 | | 730 | |
| | Delaware River Joint Toll Bridge Commission Pennsylvania & New Jersey Revenue | 5.000% | 7/1/25 | | (Prere.) | 500 | | 599 | |
| | Delaware River Joint Toll Bridge Commission Pennsylvania & New Jersey Revenue | 5.000% | 7/1/25 | | (Prere.) | 300 | | 359 | |
| | Delaware River Joint Toll Bridge Commission Pennsylvania & New Jersey Revenue | 5.000% | 7/1/31 | | | 1,540 | | 1,897 | |
| | Delaware River Joint Toll Bridge Commission Pennsylvania & New Jersey Revenue | 5.000% | 7/1/33 | | | 100 | | 127 | |
| | Delaware River Joint Toll Bridge Commission Pennsylvania & New Jersey Revenue | 5.000% | 7/1/33 | | | 2,250 | | 2,758 | |
| | Delaware River Joint Toll Bridge Commission Pennsylvania & New Jersey Revenue | 4.000% | 7/1/34 | | (15) | 2,660 | | 2,922 | |
| | Delaware River Joint Toll Bridge Commission Pennsylvania & New Jersey Revenue | 5.000% | 7/1/34 | | | 135 | | 171 | |
| | Delaware River Joint Toll Bridge Commission Pennsylvania & New Jersey Revenue | 5.000% | 7/1/35 | | | 175 | | 221 | |
| | Delaware River Joint Toll Bridge Commission Pennsylvania & New Jersey Revenue | 5.000% | 7/1/35 | | | 4,495 | | 5,487 | |
| | Delaware River Joint Toll Bridge Commission Pennsylvania & New Jersey Revenue | 5.000% | 7/1/36 | | | 155 | | 196 | |
| | Delaware River Joint Toll Bridge Commission Pennsylvania & New Jersey Revenue | 5.000% | 7/1/37 | | | 150 | | 189 | |
| | Delaware River Joint Toll Bridge Commission Pennsylvania & New Jersey Revenue | 5.000% | 7/1/38 | | | 170 | | 213 | |
| | Delaware River Joint Toll Bridge Commission Pennsylvania & New Jersey Revenue | 5.000% | 7/1/39 | | | 170 | | 212 | |
| | Delaware River Joint Toll Bridge Commission Pennsylvania & New Jersey Revenue | 5.000% | 7/1/42 | | | 9,000 | | 10,812 | |
| | Delaware River Joint Toll Bridge Commission Pennsylvania & New Jersey Revenue | 5.000% | 7/1/47 | | | 5,500 | | 6,558 | |
| | Delaware River Port Authority Pennsylvania & New Jersey Revenue | 5.000% | 1/1/24 | | | 420 | | 462 | |
| | Delaware River Port Authority Pennsylvania & New Jersey Revenue | 5.000% | 1/1/26 | | | 4,460 | | 4,896 | |
| | Delaware River Port Authority Pennsylvania & New Jersey Revenue | 5.000% | 1/1/27 | | | 2,660 | | 2,914 | |
| | Delaware River Port Authority Pennsylvania & New Jersey Revenue | 5.000% | 1/1/31 | | | 1,730 | | 2,199 | |
| | Delaware River Port Authority Pennsylvania & New Jersey Revenue | 5.000% | 1/1/33 | | | 3,000 | | 3,397 | |
| | Delaware River Port Authority Pennsylvania & New Jersey Revenue | 5.000% | 1/1/35 | | | 1,385 | | 1,737 | |
| | Delaware River Port Authority Pennsylvania & New Jersey Revenue | 5.000% | 1/1/37 | | | 15,020 | | 16,896 | |
New Jersey Long-Term Tax-Exempt Fund
| | | | | | | Face | | Market | |
| | | | Maturity | | | Amount | | Value· | |
| | | Coupon | Date | | | ($000 | ) | ($000 | ) |
| | Delaware River Port Authority Pennsylvania & New Jersey Revenue | 5.000% | 1/1/38 | | | 3,500 | | 4,348 | |
| | Delaware River Port Authority Pennsylvania & New Jersey Revenue | 5.000% | 1/1/39 | | | 3,500 | | 4,334 | |
| | Delaware River Port Authority Pennsylvania & New Jersey Revenue | 5.000% | 1/1/40 | | | 3,000 | | 3,703 | |
| | Delaware River Port Authority Pennsylvania & New Jersey Revenue | 5.000% | 1/1/40 | | | 2,500 | | 2,800 | |
| | Delran Township NJ GO | 2.000% | 10/15/23 | | | 1,000 | | 1,014 | |
| | Delran Township NJ GO | 2.000% | 10/15/24 | | | 1,000 | | 1,012 | |
| | East Orange NJ (Board of Education Project) GO | 5.000% | 10/15/32 | | (4) | 795 | | 1,004 | |
| | East Orange NJ (Board of Education Project) GO | 5.000% | 10/15/33 | | (4) | 610 | | 769 | |
| | East Orange NJ (Board of Education Project) GO | 3.000% | 10/15/34 | | (4) | 400 | | 418 | |
| | East Orange NJ (Board of Education Project) GO | 3.000% | 10/15/35 | | (4) | 400 | | 417 | |
| | East Orange NJ (Board of Education Project) GO | 4.000% | 10/15/40 | | (4) | 1,345 | | 1,524 | |
| | East Orange NJ GO | 4.000% | 9/15/23 | | (4) | 705 | | 771 | |
| | East Orange NJ GO | 4.000% | 9/15/24 | | (4) | 255 | | 284 | |
| | East Orange NJ GO | 4.000% | 9/15/25 | | (4) | 1,360 | | 1,544 | |
| | Essex County NJ Improvement Authority GO | 4.000% | 9/1/40 | | | 1,440 | | 1,592 | |
| | Essex County NJ Improvement Authority GO | 4.000% | 9/1/41 | | | 1,440 | | 1,588 | |
| | Essex County NJ Improvement Authority GO | 4.000% | 9/1/42 | | | 1,440 | | 1,586 | |
| | Essex County NJ Improvement Authority GO | 4.000% | 9/1/43 | | | 1,440 | | 1,584 | |
| | Essex County NJ Improvement Authority GO | 4.000% | 9/1/44 | | | 1,440 | | 1,582 | |
| | Essex County NJ Improvement Authority GO | 4.000% | 9/1/45 | | | 1,440 | | 1,580 | |
| | Essex County NJ Improvement Authority GO | 4.000% | 9/1/46 | | | 1,440 | | 1,578 | |
| | Essex County NJ Improvement Authority GO | 4.000% | 9/1/47 | | | 1,440 | | 1,577 | |
| | Essex County NJ Improvement Authority GO | 4.000% | 9/1/48 | | | 1,440 | | 1,576 | |
| | Essex County NJ Improvement Authority Revenue | 4.000% | 11/1/37 | | | 1,540 | | 1,720 | |
| | Essex County NJ Improvement Authority Revenue | 4.000% | 11/1/38 | | | 1,000 | | 1,114 | |
| | Essex County NJ Improvement Authority Revenue | 4.000% | 11/1/44 | | | 2,470 | | 2,723 | |
| | Ewing Township NJ School District GO | 4.000% | 7/15/32 | | | 2,610 | | 2,978 | |
| | Ewing Township NJ School District GO | 4.000% | 7/15/34 | | | 3,040 | | 3,447 | |
| | Ewing Township NJ School District GO | 4.000% | 7/15/35 | | | 3,045 | | 3,441 | |
| | Ewing Township NJ School District GO | 4.000% | 7/15/37 | | | 3,000 | | 3,365 | |
| | Fort Lee NJ Parking Authority Parking Revenue | 5.000% | 9/15/46 | | | 5,000 | | 5,976 | |
| | Garden State Preservation Trust New Jersey Revenue (Open Space & Farmland Preservation) | 0.000% | 11/1/28 | | (4) | 6,535 | | 5,376 | |
| | Gloucester County NJ Improvement Authority Revenue (Rowan University) | 5.000% | 11/1/29 | | (4) | 1,500 | | 1,815 | |
| | Gloucester County NJ Improvement Authority Revenue (Rowan University) | 5.000% | 7/1/30 | | | 3,910 | | 4,555 | |
| | Gloucester County NJ Improvement Authority Revenue (Rowan University) | 5.000% | 11/1/30 | | (4) | 1,200 | | 1,445 | |
| | Gloucester County NJ Improvement Authority Revenue (Rowan University) | 5.000% | 7/1/31 | | | 1,950 | | 2,266 | |
New Jersey Long-Term Tax-Exempt Fund
| | | | | | | Face | | Market | |
| | | | Maturity | | | Amount | | Value· | |
| | | Coupon | Date | | | ($000 | ) | ($000 | ) |
| | Gloucester County NJ Improvement Authority Revenue (Rowan University) | 5.000% | 7/1/32 | | | 1,775 | | 2,059 | |
| | Gloucester County NJ Improvement Authority Revenue (Rowan University) | 5.000% | 7/1/33 | | | 2,275 | | 2,634 | |
| | Gloucester County NJ Improvement Authority Revenue (Rowan University) | 5.000% | 7/1/34 | | | 1,200 | | 1,387 | |
| | Gloucester County NJ Improvement Authority Revenue (Rowan University) | 4.000% | 7/1/37 | | | 750 | | 867 | |
| | Gloucester County NJ Improvement Authority Revenue (Rowan University) | 4.000% | 7/1/38 | | | 700 | | 807 | |
| | Gloucester County NJ Improvement Authority Revenue (Rowan University) | 4.000% | 7/1/39 | | | 600 | | 690 | |
| | Gloucester County NJ Improvement Authority Revenue (Rowan University) | 5.000% | 7/1/44 | | | 1,500 | | 1,706 | |
| | Gloucester County NJ Improvement Authority Revenue (Rowan University) | 5.000% | 7/1/44 | | | 2,250 | | 2,786 | |
| | Gloucester County NJ Improvement Authority Revenue (Rowan University) | 4.000% | 7/1/48 | | | 2,000 | | 2,249 | |
| | Hardyston NJ School District GO | 4.000% | 8/1/23 | | | 570 | | 623 | |
| | Harrison NJ GO | 4.000% | 3/1/38 | | (15) | 1,945 | | 2,174 | |
| | Harrison NJ GO | 4.000% | 3/1/41 | | (15) | 2,180 | | 2,420 | |
| | Harrison Township NJ GO | 2.000% | 5/15/23 | | | 270 | | 275 | |
| | Harrison Township NJ GO | 2.000% | 5/15/24 | | | 645 | | 657 | |
| | Haworth NJ GO | 2.000% | 8/1/23 | | | 450 | | 458 | |
| | Haworth NJ GO | 2.000% | 8/1/24 | | | 455 | | 465 | |
| | Hawthorne NJ School District GO | 3.000% | 9/1/31 | | (15) | 1,350 | | 1,400 | |
| | Hawthorne NJ School District GO | 3.000% | 9/1/32 | | (15) | 1,350 | | 1,397 | |
| | Hudson County NJ Improvement Authority Lease Revenue | 5.000% | 5/1/41 | | | 5,515 | | 6,452 | |
| | Hudson County NJ Improvement Authority Lease Revenue | 5.000% | 8/1/42 | | | 1,300 | | 1,498 | |
| | Hudson County NJ Improvement Authority Lease Revenue | 5.250% | 5/1/51 | | | 7,000 | | 8,214 | |
| | Hudson County NJ Improvement Authority Lease Revenue (Union City School District Parking Project) | 5.000% | 6/15/37 | | | 1,500 | | 1,741 | |
| | Hudson County NJ Improvement Authority Solid Waste Systems Revenue | 5.750% | 1/1/35 | | | 2,000 | | 2,007 | |
| | Hudson County NJ Improvement Authority Solid Waste Systems Revenue | 6.000% | 1/1/40 | | | 3,000 | | 3,011 | |
| 2 | Inspira Health Obligated Group TOB VRDO | 1.220% | 12/6/19 | | | 200 | | 200 | |
| | Jersey City NJ GO | 4.000% | 12/1/24 | | (15) | 250 | | 280 | |
| | Jersey City NJ GO | 5.000% | 11/1/31 | | | 510 | | 623 | |
| | Jersey City NJ GO | 5.000% | 11/1/33 | | | 415 | | 504 | |
| | Jersey City NJ GO | 4.000% | 11/1/34 | | | 2,000 | | 2,279 | |
| | Jersey City NJ GO | 4.000% | 11/1/35 | | | 1,170 | | 1,330 | |
| | Jersey City NJ GO | 4.000% | 11/1/36 | | | 1,765 | | 2,004 | |
| | Jersey City NJ GO | 5.000% | 11/1/37 | | | 1,000 | | 1,203 | |
| | Kingsway NJ Regional School District GO | 3.000% | 1/15/28 | | | 430 | | 456 | |
| | Longport NJ GO | 2.000% | 7/15/23 | | | 490 | | 503 | |
| | Longport NJ GO | 2.000% | 7/15/24 | | | 500 | | 514 | |
| | Maple Shade Township NJ School District GO | 3.000% | 7/15/23 | | (4) | 1,150 | | 1,214 | |
| | Maple Shade Township NJ School District GO | 3.000% | 7/15/24 | | (4) | 1,180 | | 1,259 | |
| | Maple Shade Township NJ School District GO | 3.000% | 7/15/25 | | (4) | 950 | | 1,023 | |
| | Maple Shade Township NJ School District GO | 3.000% | 7/15/31 | | (4) | 1,850 | | 1,923 | |
New Jersey Long-Term Tax-Exempt Fund
| | | | | | | Face | | Market | |
| | | | Maturity | | | Amount | | Value· | |
| | | Coupon | Date | | | ($000 | ) | ($000 | ) |
| | Maple Shade Township NJ School District GO | 3.000% | 7/15/37 | | (4) | 1,920 | | 1,962 | |
| | Maple Shade Township NJ School District GO | 3.000% | 7/15/38 | | (4) | 1,925 | | 1,962 | |
| | Maple Shade Township NJ School District GO | 3.000% | 7/15/39 | | (4) | 1,925 | | 1,959 | |
| | Maple Shade Township NJ School District GO | 3.000% | 7/15/40 | | (4) | 1,985 | | 2,016 | |
| | Mercer County NJ GO | 3.000% | 2/15/31 | | | 1,000 | | 1,050 | |
| | Mercer County NJ Improvement Authority Revenue (Courthouse Annex Project) | 5.000% | 9/1/40 | | | 2,480 | | 2,896 | |
| | Middle Township NJ School District GO | 3.000% | 7/15/29 | | (4) | 1,000 | | 1,044 | |
| | Middlesex County NJ COP | 4.000% | 6/15/28 | | | 350 | | 411 | |
| | Monmouth County NJ Improvement Authority Revenue (Pooled Government Loan) | 5.000% | 7/15/32 | | | 1,000 | | 1,217 | |
| | Monmouth County NJ Improvement Authority Revenue (Pooled Government Loan) | 4.000% | 8/1/33 | | | 950 | | 1,141 | |
| | Monmouth County NJ Improvement Authority Revenue (Pooled Government Loan) | 4.000% | 7/15/34 | | | 1,800 | | 2,061 | |
| | Monmouth County NJ Improvement Authority Revenue (Pooled Government Loan) | 4.000% | 8/1/34 | | | 650 | | 779 | |
| | Monmouth County NJ Improvement Authority Revenue (Pooled Government Loan) | 5.000% | 7/15/35 | | | 1,275 | | 1,542 | |
| | Monmouth County NJ Improvement Authority Revenue (Pooled Government Loan) | 4.000% | 8/1/35 | | | 525 | | 624 | |
| | Monmouth County NJ Improvement Authority Revenue (Pooled Government Loan) | 5.000% | 7/15/36 | | | 1,200 | | 1,448 | |
| | Monmouth County NJ Improvement Authority Revenue (Pooled Government Loan) | 4.000% | 8/1/36 | | | 500 | | 591 | |
| | Monmouth County NJ Improvement Authority Revenue (Pooled Government Loan) | 4.000% | 7/15/37 | | | 2,000 | | 2,264 | |
| | Monmouth County NJ Improvement Authority Revenue (Pooled Government Loan) | 4.000% | 8/1/37 | | | 275 | | 323 | |
| | Monmouth County NJ Improvement Authority Revenue (Pooled Government Loan) | 4.000% | 7/15/38 | | | 1,500 | | 1,690 | |
| | Monmouth County NJ Improvement Authority Revenue (Pooled Government Loan) | 4.000% | 8/1/38 | | | 250 | | 292 | |
| | Monmouth County NJ Improvement Authority Revenue (Pooled Government Loan) | 4.000% | 8/1/39 | | | 200 | | 232 | |
| | Monmouth NJ Regional High School District GO | 3.000% | 2/1/31 | | | 1,755 | | 1,838 | |
| | Monmouth NJ Regional High School District GO | 3.000% | 2/1/32 | | | 1,255 | | 1,309 | |
| | Monmouth NJ Regional High School District GO | 3.000% | 2/1/33 | | | 1,015 | | 1,054 | |
| | Monroe Township NJ Board of Education GO | 5.000% | 3/1/38 | | | 3,000 | | 3,463 | |
| | New Brunswick NJ GO | 3.000% | 2/15/30 | | (15) | 3,880 | | 4,090 | |
| | New Brunswick NJ GO | 3.000% | 2/15/31 | | (15) | 1,370 | | 1,433 | |
| | New Brunswick NJ GO | 3.000% | 2/15/32 | | (15) | 1,370 | | 1,423 | |
| | New Brunswick NJ GO | 3.000% | 2/15/36 | | (15) | 1,370 | | 1,405 | |
| | New Brunswick NJ GO | 3.000% | 2/15/37 | | (15) | 1,370 | | 1,402 | |
| | New Brunswick NJ Parking Authority Revenue | 5.000% | 9/1/25 | | | 615 | | 673 | |
| | New Brunswick NJ Parking Authority Revenue | 5.000% | 9/1/28 | | | 465 | | 507 | |
| | New Brunswick NJ Parking Authority Revenue | 5.000% | 9/1/30 | | | 570 | | 621 | |
| | New Brunswick NJ Parking Authority Revenue | 5.000% | 9/1/31 | | | 600 | | 654 | |
| | New Brunswick NJ Parking Authority Revenue | 4.000% | 9/1/37 | | (4) | 2,000 | | 2,208 | |
| | New Brunswick NJ Parking Authority Revenue | 5.000% | 9/1/39 | | (15) | 2,000 | | 2,362 | |
| | New Jersey Building Authority Revenue | 4.000% | 6/15/26 | | (Prere.) | 395 | | 460 | |
| | New Jersey Building Authority Revenue | 4.000% | 6/15/30 | | | 605 | | 649 | |
New Jersey Long-Term Tax-Exempt Fund
| | | | | | | Face | | Market | |
| | | | Maturity | | | Amount | | Value· | |
| | | Coupon | Date | | | ($000 | ) | ($000 | ) |
| | New Jersey Casino Reinvestment Development Authority Revenue (Luxury Tax) | 5.000% | 11/1/28 | | (4) | 2,000 | | 2,242 | |
| | New Jersey Casino Reinvestment Development Authority Revenue (Luxury Tax) | 5.000% | 11/1/29 | | (4) | 2,500 | | 2,794 | |
| | New Jersey Casino Reinvestment Development Authority Revenue (Luxury Tax) | 5.000% | 11/1/30 | | (4) | 2,950 | | 3,292 | |
| | New Jersey Casino Reinvestment Development Authority Revenue (Luxury Tax) | 5.000% | 11/1/31 | | (4) | 1,500 | | 1,672 | |
| | New Jersey Casino Reinvestment Development Authority Revenue (Luxury Tax) | 5.000% | 11/1/32 | | (4) | 1,250 | | 1,392 | |
| | New Jersey Casino Reinvestment Development Authority Revenue (Luxury Tax) | 5.250% | 11/1/44 | | | 13,930 | | 15,065 | |
| | New Jersey Economic Development Authority Lease Revenue (Rutgers State University) | 5.000% | 6/15/38 | | | 4,650 | | 5,175 | |
| | New Jersey Economic Development Authority Lease Revenue (Rutgers State University) | 5.000% | 6/15/46 | | | 8,150 | | 9,047 | |
| | New Jersey Economic Development Authority Revenue | 5.000% | 6/15/23 | | | 2,375 | | 2,645 | |
| | New Jersey Economic Development Authority Revenue | 4.000% | 6/15/24 | | | 150 | | 164 | |
| | New Jersey Economic Development Authority Revenue | 4.000% | 11/1/25 | | | 125 | | 138 | |
| | New Jersey Economic Development Authority Revenue | 4.125% | 6/15/26 | | | 2,515 | | 2,753 | |
| | New Jersey Economic Development Authority Revenue | 4.125% | 6/15/27 | | | 2,750 | | 2,991 | |
| | New Jersey Economic Development Authority Revenue | 5.000% | 6/15/28 | | | 245 | | 275 | |
| | New Jersey Economic Development Authority Revenue | 5.500% | 6/15/29 | | | 5,000 | | 5,981 | |
| | New Jersey Economic Development Authority Revenue | 5.500% | 6/15/30 | | | 9,000 | | 10,720 | |
| | New Jersey Economic Development Authority Revenue | 5.500% | 6/15/31 | | | 5,475 | | 6,501 | |
| | New Jersey Economic Development Authority Revenue | 5.000% | 6/15/33 | | | 1,420 | | 1,680 | |
| | New Jersey Economic Development Authority Revenue | 5.000% | 6/15/33 | | | 3,500 | | 4,026 | |
| | New Jersey Economic Development Authority Revenue | 5.250% | 6/15/33 | | | 6,000 | | 6,833 | |
| | New Jersey Economic Development Authority Revenue | 5.000% | 6/15/34 | | | 1,180 | | 1,391 | |
| | New Jersey Economic Development Authority Revenue | 5.000% | 6/15/34 | | | 3,000 | | 3,440 | |
| | New Jersey Economic Development Authority Revenue | 5.000% | 6/15/35 | | | 1,800 | | 2,055 | |
| | New Jersey Economic Development Authority Revenue | 3.350% | 7/15/36 | | | 325 | | 326 | |
| | New Jersey Economic Development Authority Revenue | 5.000% | 6/15/38 | | | 11,790 | | 13,569 | |
| | New Jersey Economic Development Authority Revenue | 5.250% | 6/15/40 | | | 10,000 | | 11,308 | |
| | New Jersey Economic Development Authority Revenue | 5.000% | 6/15/41 | | | 4,250 | | 4,802 | |
New Jersey Long-Term Tax-Exempt Fund
| | | | | | | Face | | Market | |
| | | | Maturity | | | Amount | | Value· | |
| | | Coupon | Date | | | ($000 | ) | ($000 | ) |
| | New Jersey Economic Development Authority Revenue | 5.000% | 6/15/42 | | | 5,000 | | 5,626 | |
| | New Jersey Economic Development Authority Revenue | 5.000% | 6/15/42 | | | 5,000 | | 5,595 | |
| | New Jersey Economic Development Authority Revenue | 5.000% | 6/15/47 | | | 10,000 | | 11,200 | |
| | New Jersey Economic Development Authority Revenue | 4.625% | 6/15/48 | | | 8,000 | | 8,745 | |
| | New Jersey Economic Development Authority Revenue (Bancroft NeuroHealth Project) | 5.000% | 6/1/41 | | | 2,105 | | 2,262 | |
| | New Jersey Economic Development Authority Revenue (Beloved Community Charter School Inc. Project) | 4.000% | 6/15/29 | | | 1,330 | | 1,406 | |
| | New Jersey Economic Development Authority Revenue (Beloved Community Charter School Inc. Project) | 5.000% | 6/15/54 | | | 730 | | 778 | |
| | New Jersey Economic Development Authority Revenue (Biomedical Research Facilities) | 5.000% | 7/15/30 | | | 1,000 | | 1,150 | |
| | New Jersey Economic Development Authority Revenue (Cigarette Tax) | 5.000% | 6/15/23 | | | 2,500 | | 2,696 | |
| | New Jersey Economic Development Authority Revenue (Cigarette Tax) | 5.000% | 6/15/25 | | | 5,990 | | 6,430 | |
| | New Jersey Economic Development Authority Revenue (Cigarette Tax) | 5.000% | 6/15/26 | | | 8,500 | | 9,104 | |
| | New Jersey Economic Development Authority Revenue (Cigarette Tax) | 5.000% | 6/15/28 | | | 2,000 | | 2,134 | |
| | New Jersey Economic Development Authority Revenue (Cigarette Tax) | 5.000% | 6/15/29 | | | 1,400 | | 1,491 | |
| | New Jersey Economic Development Authority Revenue (Cranes Mill Project) | 5.000% | 1/1/49 | | | 3,000 | | 3,360 | |
| | New Jersey Economic Development Authority Revenue (Lions Gate Project) | 5.250% | 1/1/44 | | | 4,130 | | 4,296 | |
| | New Jersey Economic Development Authority Revenue (Motor Vehicle Surcharge) | 5.250% | 7/1/26 | | (14) | 2,025 | | 2,412 | |
| | New Jersey Economic Development Authority Revenue (Motor Vehicle Surcharge) | 5.000% | 7/1/33 | | | 4,465 | | 5,139 | |
| | New Jersey Economic Development Authority Revenue (Motor Vehicle Surcharge) | 4.000% | 7/1/34 | | | 2,500 | | 2,655 | |
| 2 | New Jersey Economic Development Authority Revenue (Motor Vehicle Surcharge) TOB VRDO | 1.250% | 12/6/19 | | | 4,250 | | 4,250 | |
| 3 | New Jersey Economic Development Authority Revenue (Motor Vehicle Surcharges) | 5.250% | 7/1/24 | | (14) | 6,000 | | 6,897 | |
| | New Jersey Economic Development Authority Revenue (Provident Group-Montclair Properties LLC - Kean University Student Housing Project) | 5.000% | 7/1/32 | | | 1,100 | | 1,242 | |
| | New Jersey Economic Development Authority Revenue (Provident Group-Montclair Properties LLC - Kean University Student Housing Project) | 5.000% | 7/1/37 | | | 600 | | 670 | |
| | New Jersey Economic Development Authority Revenue (Provident Group-Montclair Properties LLC - Kean University Student Housing Project) | 5.000% | 7/1/47 | | | 1,500 | | 1,649 | |
New Jersey Long-Term Tax-Exempt Fund
| | | | | | | Face | | Market | |
| | | | Maturity | | | Amount | | Value· | |
| | | Coupon | Date | | | ($000 | ) | ($000 | ) |
| | New Jersey Economic Development Authority Revenue (Provident Group-Montclair Properties LLC - Montclair State University Student Housing Project) | 5.375% | 6/1/20 | | (Prere.) | 1,440 | | 1,471 | |
| | New Jersey Economic Development Authority Revenue (Provident Group-Montclair Properties LLC - Montclair State University Student Housing Project) | 5.750% | 6/1/20 | | (Prere.) | 1,160 | | 1,187 | |
| | New Jersey Economic Development Authority Revenue (Provident Group-Montclair Properties LLC - Montclair State University Student Housing Project) | 5.875% | 6/1/20 | | (Prere.) | 8,280 | | 8,476 | |
| | New Jersey Economic Development Authority Revenue (Provident Group-Montclair Properties LLC - Montclair State University Student Housing Project) | 5.000% | 6/1/42 | | (4) | 10,000 | | 11,648 | |
| | New Jersey Economic Development Authority Revenue (Provident Group-Rowan Properties LLC - Rowan University Housing Project) | 5.000% | 1/1/30 | | | 2,515 | | 2,768 | |
| | New Jersey Economic Development Authority Revenue (Provident Group-Rowan Properties LLC - Rowan University Housing Project) | 5.000% | 1/1/35 | | | 2,000 | | 2,178 | |
| | New Jersey Economic Development Authority Revenue (Provident Group-Rowan Properties LLC - Rowan University Housing Project) | 5.000% | 1/1/48 | | | 13,000 | | 13,936 | |
| | New Jersey Economic Development Authority Revenue (School Facilities Construction) | 5.250% | 3/1/21 | | (Prere.) | 3,005 | | 3,154 | |
| | New Jersey Economic Development Authority Revenue (School Facilities Construction) | 5.250% | 3/1/21 | | (Prere.) | 1,210 | | 1,270 | |
| | New Jersey Economic Development Authority Revenue (School Facilities Construction) | 5.750% | 3/1/21 | | (Prere.) | 2,700 | | 2,850 | |
| | New Jersey Economic Development Authority Revenue (School Facilities Construction) | 5.000% | 9/1/22 | | (Prere.) | 4,005 | | 4,410 | |
| | New Jersey Economic Development Authority Revenue (School Facilities Construction) | 5.000% | 9/1/22 | | (Prere.) | 6,360 | | 7,003 | |
| | New Jersey Economic Development Authority Revenue (School Facilities Construction) | 5.000% | 9/1/22 | | (Prere.) | 5,000 | | 5,506 | |
| | New Jersey Economic Development Authority Revenue (School Facilities Construction) | 5.250% | 9/1/22 | | | 1,110 | | 1,162 | |
| | New Jersey Economic Development Authority Revenue (School Facilities Construction) | 5.250% | 9/1/23 | | | 2,290 | | 2,396 | |
| | New Jersey Economic Development Authority Revenue (School Facilities Construction) | 5.750% | 9/1/23 | | | 300 | | 315 | |
| | New Jersey Economic Development Authority Revenue (School Facilities Construction) | 5.250% | 9/1/24 | | | 375 | | 392 | |
| | New Jersey Economic Development Authority Revenue (School Facilities Construction) | 5.500% | 9/1/24 | | (2) | 1,500 | | 1,749 | |
| | New Jersey Economic Development Authority Revenue (School Facilities Construction) | 5.000% | 3/1/25 | | | 3,265 | | 3,603 | |
| | New Jersey Economic Development Authority Revenue (School Facilities Construction) | 5.000% | 6/15/25 | | (4) | 2,380 | | 2,728 | |
| | New Jersey Economic Development Authority Revenue (School Facilities Construction) | 5.250% | 9/1/25 | | | 3,460 | | 3,618 | |
| | New Jersey Economic Development Authority Revenue (School Facilities Construction) | 5.500% | 9/1/25 | | (4) | 3,210 | | 3,885 | |
New Jersey Long-Term Tax-Exempt Fund
| | | | | | | Face | | Market | |
| | | | Maturity | | | Amount | | Value· | |
| | | Coupon | Date | | | ($000 | ) | ($000 | ) |
| | New Jersey Economic Development Authority Revenue (School Facilities Construction) | 5.000% | 6/15/26 | | | 6,105 | | 7,162 | |
| | New Jersey Economic Development Authority Revenue (School Facilities Construction) | 5.250% | 9/1/26 | | | 3,000 | | 3,136 | |
| | New Jersey Economic Development Authority Revenue (School Facilities Construction) | 5.500% | 9/1/26 | | (2) | 2,000 | | 2,421 | |
| | New Jersey Economic Development Authority Revenue (School Facilities Construction) | 5.250% | 9/1/27 | | | 1,000 | | 1,045 | |
| | New Jersey Economic Development Authority Revenue (School Facilities Construction) | 5.500% | 9/1/27 | | (14) | 3,000 | | 3,695 | |
| | New Jersey Economic Development Authority Revenue (School Facilities Construction) | 5.500% | 6/15/28 | | | 6,465 | | 7,774 | |
| | New Jersey Economic Development Authority Revenue (School Facilities Construction) | 5.500% | 9/1/28 | | (14) | 2,165 | | 2,707 | |
| | New Jersey Economic Development Authority Revenue (School Facilities Construction) | 5.500% | 9/1/29 | | (14) | 9,055 | | 11,480 | |
| | New Jersey Economic Development Authority Revenue (School Facilities Construction) | 5.000% | 6/15/30 | | | 6,975 | | 7,776 | |
| | New Jersey Economic Development Authority Revenue (School Facilities Construction) | 4.750% | 6/15/31 | | | 3,890 | | 4,366 | |
| | New Jersey Economic Development Authority Revenue (School Facilities Construction) | 5.000% | 6/15/31 | | | 4,000 | | 4,450 | |
| | New Jersey Economic Development Authority Revenue (School Facilities Construction) | 5.000% | 12/15/31 | | | 7,105 | | 7,222 | |
| | New Jersey Economic Development Authority Revenue (School Facilities Construction) | 5.000% | 6/15/32 | | | 1,290 | | 1,530 | |
| | New Jersey Economic Development Authority Revenue (School Facilities Construction) | 5.000% | 12/15/32 | | | 3,780 | | 3,841 | |
| | New Jersey Economic Development Authority Revenue (School Facilities Construction) | 5.000% | 6/15/33 | | (4) | 1,500 | | 1,680 | |
| | New Jersey Economic Development Authority Revenue (School Facilities Construction) | 5.000% | 6/15/34 | | | 2,685 | | 3,019 | |
| | New Jersey Economic Development Authority Revenue (School Facilities Construction) | 5.000% | 3/1/35 | | | 12,095 | | 12,992 | |
| | New Jersey Economic Development Authority Revenue (School Facilities Construction) | 5.000% | 6/15/35 | | | 1,620 | | 1,903 | |
| | New Jersey Economic Development Authority Revenue (School Facilities Construction) | 5.000% | 6/15/36 | | | 1,500 | | 1,756 | |
| | New Jersey Economic Development Authority Revenue (School Facilities Construction) | 5.000% | 6/15/37 | | | 1,440 | | 1,679 | |
| | New Jersey Economic Development Authority Revenue (School Facilities Construction) | 5.000% | 6/15/38 | | | 1,280 | | 1,488 | |
| | New Jersey Economic Development Authority Revenue (School Facilities Construction) | 5.000% | 6/15/40 | | | 11,485 | | 12,611 | |
| | New Jersey Economic Development Authority Revenue (School Facilities Construction) | 4.000% | 6/15/44 | | | 2,500 | | 2,608 | |
| | New Jersey Economic Development Authority Revenue (School Facilities Construction) | 5.000% | 6/15/44 | | | 1,500 | | 1,718 | |
| | New Jersey Economic Development Authority Revenue (School Facilities Construction) | 4.000% | 6/15/49 | | | 2,500 | | 2,591 | |
| | New Jersey Economic Development Authority Revenue (School Facilities Construction) | 5.000% | 6/15/49 | | | 2,500 | | 2,844 | |
| 2 | New Jersey Economic Development Authority Revenue (School Facilities Construction) TOB VRDO | 1.130% | 12/6/19 | | LOC | 18,310 | | 18,310 | |
New Jersey Long-Term Tax-Exempt Fund
| | | | | | | Face | | Market | |
| | | | Maturity | | | Amount | | Value· | |
| | | Coupon | Date | | | ($000 | ) | ($000 | ) |
| | New Jersey Economic Development Authority Revenue (Seeing Eye Inc. Project) | 5.000% | 6/1/32 | | | 2,295 | | 2,798 | |
| | New Jersey Economic Development Authority Revenue (State Capitol Joint Management Commission) | 5.000% | 6/15/35 | | | 900 | | 1,046 | |
| | New Jersey Economic Development Authority Revenue (State Capitol Joint Management Commission) | 4.500% | 6/15/40 | | | 1,565 | | 1,717 | |
| | New Jersey Economic Development Authority Revenue (State Capitol Joint Management Commission) | 5.000% | 6/15/43 | | | 3,545 | | 4,029 | |
| | New Jersey Economic Development Authority Revenue (Team Academy Charter School Project) | 5.000% | 12/1/48 | | | 2,500 | | 2,846 | |
| | New Jersey Economic Development Authority Revenue (United Methodist Homes Obligated Group) | 4.000% | 7/1/24 | | | 2,000 | | 2,087 | |
| | New Jersey Economic Development Authority Revenue (United Methodist Homes Obligated Group) | 5.000% | 7/1/29 | | | 2,000 | | 2,171 | |
| | New Jersey Economic Development Authority Revenue (West Campus Housing LLC) | 5.000% | 7/1/35 | | | 6,025 | | 6,451 | |
| | New Jersey Economic Development Authority Revenue (West Campus Housing LLC) | 5.000% | 7/1/38 | | | 720 | | 767 | |
| | New Jersey Economic Development Authority Revenue (West Campus Housing LLC) | 5.000% | 7/1/47 | | | 7,905 | | 8,345 | |
| 2 | New Jersey Economic Development Authority Revenue TOB VRDO | 1.130% | 12/6/19 | | | 4,500 | | 4,500 | |
| | New Jersey Economic Development Authority School Revenue (Foundation Academy Charter School Project) | 4.000% | 7/1/29 | | | 350 | | 380 | |
| | New Jersey Economic Development Authority School Revenue (Foundation Academy Charter School Project) | 5.000% | 7/1/38 | | | 350 | | 401 | |
| | New Jersey Economic Development Authority School Revenue (Foundation Academy Charter School Project) | 5.000% | 7/1/50 | | | 1,100 | | 1,239 | |
| | New Jersey Educational Facilities Authority Revenue (College of New Jersey) | 5.000% | 7/1/28 | | | 1,000 | | 1,200 | |
| | New Jersey Educational Facilities Authority Revenue (College of New Jersey) | 5.000% | 7/1/29 | | | 750 | | 896 | |
| | New Jersey Educational Facilities Authority Revenue (College of New Jersey) | 4.000% | 7/1/32 | | | 1,000 | | 1,121 | |
| | New Jersey Educational Facilities Authority Revenue (College of New Jersey) | 4.000% | 7/1/33 | | | 1,250 | | 1,399 | |
| | New Jersey Educational Facilities Authority Revenue (College of New Jersey) | 5.000% | 7/1/38 | | | 1,250 | | 1,379 | |
| | New Jersey Educational Facilities Authority Revenue (College of New Jersey) | 5.000% | 7/1/43 | | | 2,500 | | 2,750 | |
| | New Jersey Educational Facilities Authority Revenue (Higher Education Capital Improvement Fund) | 4.000% | 9/1/25 | | | 105 | | 116 | |
| | New Jersey Educational Facilities Authority Revenue (Higher Education Trust Fund) | 5.000% | 6/1/21 | | | 4,335 | | 4,560 | |
New Jersey Long-Term Tax-Exempt Fund
| | | | | | | Face | | Market | |
| | | | Maturity | | | Amount | | Value· | |
| | | Coupon | Date | | | ($000 | ) | ($000 | ) |
| | New Jersey Educational Facilities Authority Revenue (Higher Education Trust Fund) | 4.000% | 9/1/26 | | | 320 | | 353 | |
| | New Jersey Educational Facilities Authority Revenue (Higher Education Trust Fund) | 5.000% | 9/1/26 | | | 1,100 | | 1,245 | |
| | New Jersey Educational Facilities Authority Revenue (Montclair State University) | 5.000% | 7/1/30 | | | 2,500 | | 2,999 | |
| | New Jersey Educational Facilities Authority Revenue (Montclair State University) | 5.000% | 7/1/31 | | | 13,385 | | 16,011 | |
| | New Jersey Educational Facilities Authority Revenue (Montclair State University) | 5.000% | 7/1/32 | | | 1,730 | | 2,065 | |
| | New Jersey Educational Facilities Authority Revenue (Montclair State University) | 5.000% | 7/1/33 | | | 3,170 | | 3,690 | |
| | New Jersey Educational Facilities Authority Revenue (Montclair State University) | 5.000% | 7/1/33 | | | 75 | | 89 | |
| | New Jersey Educational Facilities Authority Revenue (Montclair State University) | 5.000% | 7/1/34 | | | 2,000 | | 2,325 | |
| | New Jersey Educational Facilities Authority Revenue (Montclair State University) | 5.000% | 7/1/35 | | | 2,100 | | 2,437 | |
| | New Jersey Educational Facilities Authority Revenue (Montclair State University) | 5.000% | 7/1/36 | | | 1,150 | | 1,332 | |
| | New Jersey Educational Facilities Authority Revenue (Montclair State University) | 5.000% | 7/1/39 | | | 8,015 | | 9,032 | |
| | New Jersey Educational Facilities Authority Revenue (New Jersey City University) | 5.000% | 7/1/40 | | | 4,000 | | 4,529 | |
| | New Jersey Educational Facilities Authority Revenue (New Jersey City University) | 5.000% | 7/1/45 | | | 1,000 | | 1,125 | |
| | New Jersey Educational Facilities Authority Revenue (Princeton University) | 5.000% | 7/1/31 | | | 3,800 | | 4,749 | |
| | New Jersey Educational Facilities Authority Revenue (Princeton University) | 5.000% | 7/1/32 | | | 3,000 | | 3,739 | |
| | New Jersey Educational Facilities Authority Revenue (Princeton University) | 5.000% | 7/1/32 | | | 1,000 | | 1,246 | |
| | New Jersey Educational Facilities Authority Revenue (Princeton University) | 5.000% | 7/1/34 | | | 1,825 | | 2,265 | |
| | New Jersey Educational Facilities Authority Revenue (Princeton University) | 5.000% | 7/1/36 | | | 4,975 | | 6,162 | |
| | New Jersey Educational Facilities Authority Revenue (Ramapo College) | 5.000% | 7/1/29 | | | 1,430 | | 1,550 | |
| | New Jersey Educational Facilities Authority Revenue (Ramapo College) | 5.000% | 7/1/30 | | | 1,500 | | 1,625 | |
| | New Jersey Educational Facilities Authority Revenue (Ramapo College) | 5.000% | 7/1/31 | | | 1,575 | | 1,706 | |
| | New Jersey Educational Facilities Authority Revenue (Ramapo College) | 5.000% | 7/1/33 | | (4) | 2,500 | | 3,016 | |
| | New Jersey Educational Facilities Authority Revenue (Ramapo College) | 5.000% | 7/1/34 | | (4) | 2,500 | | 3,010 | |
| | New Jersey Educational Facilities Authority Revenue (Ramapo College) | 5.000% | 7/1/37 | | | 2,065 | | 2,227 | |
| | New Jersey Educational Facilities Authority Revenue (Ramapo College) | 5.000% | 7/1/40 | | | 2,150 | | 2,452 | |
| | New Jersey Educational Facilities Authority Revenue (Ramapo College) | 5.000% | 7/1/42 | | | 2,390 | | 2,573 | |
| | New Jersey Educational Facilities Authority Revenue (Rowan University) | 5.000% | 7/1/24 | | (4) | 1,090 | | 1,269 | |
New Jersey Long-Term Tax-Exempt Fund
| | | | | | | Face | | Market | |
| | | | Maturity | | | Amount | | Value· | |
| | | Coupon | Date | | | ($000 | ) | ($000 | ) |
| | New Jersey Educational Facilities Authority Revenue (Rowan University) | 5.000% | 7/1/30 | | (4) | 565 | | 676 | |
| | New Jersey Educational Facilities Authority Revenue (Seton Hall University) | 5.000% | 7/1/31 | | | 1,165 | | 1,346 | |
| | New Jersey Educational Facilities Authority Revenue (Seton Hall University) | 5.000% | 7/1/33 | | | 1,000 | | 1,111 | |
| | New Jersey Educational Facilities Authority Revenue (Seton Hall University) | 5.000% | 7/1/33 | | | 430 | | 495 | |
| | New Jersey Educational Facilities Authority Revenue (Seton Hall University) | 5.000% | 7/1/34 | | | 850 | | 977 | |
| | New Jersey Educational Facilities Authority Revenue (Seton Hall University) | 5.000% | 7/1/37 | | | 1,445 | | 1,653 | |
| | New Jersey Educational Facilities Authority Revenue (Seton Hall University) | 5.000% | 7/1/38 | | | 1,225 | | 1,356 | |
| | New Jersey Educational Facilities Authority Revenue (Seton Hall University) | 5.000% | 7/1/42 | | | 2,900 | | 3,402 | |
| | New Jersey Educational Facilities Authority Revenue (Seton Hall University) | 5.000% | 7/1/43 | | | 1,500 | | 1,653 | |
| | New Jersey Educational Facilities Authority Revenue (Seton Hall University) | 4.000% | 7/1/47 | | | 6,000 | | 6,519 | |
| | New Jersey Educational Facilities Authority Revenue (Stevens Institute of Technology) | 5.000% | 7/1/22 | | | 430 | | 469 | |
| | New Jersey Educational Facilities Authority Revenue (Stevens Institute of Technology) | 5.000% | 7/1/32 | | | 2,530 | | 3,053 | |
| | New Jersey Educational Facilities Authority Revenue (Stevens Institute of Technology) | 5.000% | 7/1/33 | | | 2,340 | | 2,810 | |
| | New Jersey Educational Facilities Authority Revenue (Stevens Institute of Technology) | 5.000% | 7/1/34 | | | 1,340 | | 1,606 | |
| | New Jersey Educational Facilities Authority Revenue (Stevens Institute of Technology) | 5.000% | 7/1/35 | | | 1,485 | | 1,776 | |
| | New Jersey Educational Facilities Authority Revenue (Stevens Institute of Technology) | 5.000% | 7/1/42 | | | 2,000 | | 2,354 | |
| | New Jersey Educational Facilities Authority Revenue (Stevens Institute of Technology) | 5.000% | 7/1/47 | | | 1,750 | | 2,047 | |
| | New Jersey Educational Facilities Authority Revenue (Stockton University) | 5.000% | 7/1/28 | | | 3,000 | | 3,552 | |
| | New Jersey Educational Facilities Authority Revenue (Stockton University) | 5.000% | 7/1/30 | | | 4,000 | | 4,698 | |
| | New Jersey Educational Facilities Authority Revenue (Stockton University) | 5.000% | 7/1/31 | | | 6,250 | | 7,320 | |
| | New Jersey Educational Facilities Authority Revenue (Stockton University) | 5.000% | 7/1/32 | | | 2,890 | | 3,377 | |
| | New Jersey Educational Facilities Authority Revenue (Stockton University) | 5.000% | 7/1/33 | | | 1,475 | | 1,720 | |
| | New Jersey Educational Facilities Authority Revenue (Stockton University) | 5.000% | 7/1/34 | | (4) | 1,475 | | 1,740 | |
| | New Jersey Educational Facilities Authority Revenue (Stockton University) | 5.000% | 7/1/35 | | (4) | 2,100 | | 2,472 | |
| | New Jersey Educational Facilities Authority Revenue (Stockton University) | 4.000% | 7/1/36 | | (4) | 1,800 | | 1,976 | |
| | New Jersey Educational Facilities Authority Revenue (Stockton University) | 5.000% | 7/1/41 | | | 3,000 | | 3,465 | |
| | New Jersey Educational Facilities Authority Revenue (William Paterson University) | 5.000% | 7/1/31 | | (15) | 2,145 | | 2,545 | |
New Jersey Long-Term Tax-Exempt Fund
| | | | | | | Face | | Market | |
| | | | Maturity | | | Amount | | Value· | |
| | | Coupon | Date | | | ($000 | ) | ($000 | ) |
| | New Jersey Educational Facilities Authority Revenue (William Paterson University) | 5.000% | 7/1/37 | | (4) | 1,450 | | 1,734 | |
| | New Jersey Educational Facilities Authority Revenue (William Paterson University) | 5.000% | 7/1/42 | | (4) | 1,750 | | 2,070 | |
| | New Jersey GO | 3.000% | 6/1/25 | | | 10,000 | | 10,426 | |
| | New Jersey GO | 5.000% | 6/1/29 | | | 4,955 | | 5,991 | |
| | New Jersey GO | 5.000% | 6/1/31 | | | 4,590 | | 5,298 | |
| | New Jersey GO | 5.000% | 6/1/31 | | | 4,000 | | 4,798 | |
| | New Jersey GO | 5.000% | 6/1/32 | | | 2,760 | | 3,181 | |
| | New Jersey Health Care Facilities Financing Authority Lease Revenue (Greystone Park Psychiatric Hospital Project) | 5.000% | 9/15/27 | | | 11,095 | | 12,316 | |
| | New Jersey Health Care Facilities Financing Authority Lease Revenue (Marlboro Psychiatric Hospital Project) | 5.000% | 9/15/33 | | | 5,085 | | 5,569 | |
| | New Jersey Health Care Facilities Financing Authority Revenue (AHS Hospital Corp.) | 6.000% | 7/1/21 | | (Prere.) | 1,500 | | 1,614 | |
| | New Jersey Health Care Facilities Financing Authority Revenue (AHS Hospital Corp.) | 5.000% | 7/1/27 | | | 95 | | 95 | |
| | New Jersey Health Care Facilities Financing Authority Revenue (AHS Hospital Corp.) | 5.000% | 7/1/30 | | | 500 | | 607 | |
| | New Jersey Health Care Facilities Financing Authority Revenue (AHS Hospital Corp.) | 5.000% | 7/1/31 | | | 300 | | 362 | |
| | New Jersey Health Care Facilities Financing Authority Revenue (AHS Hospital Corp.) | 4.000% | 7/1/41 | | | 16,050 | | 17,720 | |
| | New Jersey Health Care Facilities Financing Authority Revenue (AHS Hospital Corp.) VRDO | 1.000% | 12/6/19 | | LOC | 5,375 | | 5,375 | |
| | New Jersey Health Care Facilities Financing Authority Revenue (AHS Hospital Corp.) VRDO | 1.000% | 12/6/19 | | LOC | 12,010 | | 12,010 | |
| | New Jersey Health Care Facilities Financing Authority Revenue (Barnabas Health) | 4.000% | 7/1/30 | | | 6,515 | | 7,353 | |
| | New Jersey Health Care Facilities Financing Authority Revenue (Barnabas Health) | 4.000% | 7/1/43 | | | 6,900 | | 7,482 | |
| | New Jersey Health Care Facilities Financing Authority Revenue (Barnabas Health) | 5.000% | 7/1/44 | | | 17,730 | | 20,257 | |
| | New Jersey Health Care Facilities Financing Authority Revenue (Barnabas Health) PUT | 5.000% | 7/1/24 | | | 4,000 | | 4,636 | |
| | New Jersey Health Care Facilities Financing Authority Revenue (Barnabas Health) PUT | 5.000% | 7/1/25 | | | 5,000 | | 5,943 | |
| | New Jersey Health Care Facilities Financing Authority Revenue (Barnabas Health) PUT | 5.000% | 7/1/26 | | | 5,000 | | 6,085 | |
| | New Jersey Health Care Facilities Financing Authority Revenue (Hackensack Meridian Health) | 5.000% | 1/1/20 | | (Prere.) | 2,025 | | 2,031 | |
| | New Jersey Health Care Facilities Financing Authority Revenue (Hackensack Meridian Health) | 5.000% | 7/1/27 | | | 3,645 | | 3,974 | |
| | New Jersey Health Care Facilities Financing Authority Revenue (Hackensack Meridian Health) | 5.000% | 7/1/32 | | | 2,000 | | 2,229 | |
| | New Jersey Health Care Facilities Financing Authority Revenue (Hackensack Meridian Health) | 4.000% | 7/1/34 | | | 1,280 | | 1,437 | |
New Jersey Long-Term Tax-Exempt Fund
| | | | | | | Face | | Market | |
| | | | Maturity | | | Amount | | Value· | |
| | | Coupon | Date | | | ($000 | ) | ($000 | ) |
| | New Jersey Health Care Facilities Financing Authority Revenue (Hackensack Meridian Health) | 4.000% | 7/1/36 | | | 5,000 | | 5,585 | |
| | New Jersey Health Care Facilities Financing Authority Revenue (Hackensack University Medical Center) | 5.000% | 7/1/31 | | | 2,345 | | 2,876 | |
| | New Jersey Health Care Facilities Financing Authority Revenue (Hackensack University Medical Center) | 5.000% | 7/1/32 | | | 2,370 | | 2,895 | |
| | New Jersey Health Care Facilities Financing Authority Revenue (Hackensack University Medical Center) | 5.000% | 7/1/33 | | | 3,315 | | 4,035 | |
| | New Jersey Health Care Facilities Financing Authority Revenue (Hackensack University Medical Center) | 5.000% | 7/1/35 | | | 6,925 | | 8,383 | |
| | New Jersey Health Care Facilities Financing Authority Revenue (Hackensack University Medical Center) | 5.000% | 7/1/37 | | | 6,755 | | 8,123 | |
| | New Jersey Health Care Facilities Financing Authority Revenue (Hackensack University Medical Center) | 5.000% | 7/1/38 | | | 2,500 | | 2,995 | |
| | New Jersey Health Care Facilities Financing Authority Revenue (Hackensack University Medical Center) | 5.000% | 7/1/39 | | | 8,000 | | 9,550 | |
| | New Jersey Health Care Facilities Financing Authority Revenue (Hackensack University Medical Center) | 5.000% | 7/1/52 | | | 3,000 | | 3,532 | |
| | New Jersey Health Care Facilities Financing Authority Revenue (Hackensack University Medical Center) | 5.000% | 7/1/57 | | | 5,000 | | 5,867 | |
| | New Jersey Health Care Facilities Financing Authority Revenue (Hackensack University Medical Center) | 5.250% | 7/1/57 | | | 6,250 | | 7,437 | |
| | New Jersey Health Care Facilities Financing Authority Revenue (Holy Name Medical Center) | 5.000% | 7/1/25 | | | 3,625 | | 3,696 | |
| | New Jersey Health Care Facilities Financing Authority Revenue (Hospital Asset Transformation Program) | 5.000% | 10/1/25 | | | 4,380 | | 5,088 | |
| | New Jersey Health Care Facilities Financing Authority Revenue (Hunterdon Medical Center Obligated Group) | 5.000% | 7/1/31 | | | 700 | | 786 | |
| | New Jersey Health Care Facilities Financing Authority Revenue (Hunterdon Medical Center Obligated Group) | 5.000% | 7/1/32 | | | 800 | | 897 | |
| | New Jersey Health Care Facilities Financing Authority Revenue (Hunterdon Medical Center Obligated Group) | 5.000% | 7/1/33 | | | 1,615 | | 1,807 | |
| | New Jersey Health Care Facilities Financing Authority Revenue (Hunterdon Medical Center Obligated Group) | 5.000% | 7/1/34 | | | 1,415 | | 1,582 | |
| | New Jersey Health Care Facilities Financing Authority Revenue (Hunterdon Medical Center Obligated Group) | 5.000% | 7/1/45 | | | 4,050 | | 4,446 | |
New Jersey Long-Term Tax-Exempt Fund
| | | | | | | Face | | Market | |
| | | | Maturity | | | Amount | | Value· | |
| | | Coupon | Date | | | ($000 | ) | ($000 | ) |
| | New Jersey Health Care Facilities Financing Authority Revenue (Inspira Health Obligated Group) | 5.000% | 7/1/24 | | | 190 | | 220 | |
| | New Jersey Health Care Facilities Financing Authority Revenue (Inspira Health Obligated Group) | 5.000% | 7/1/35 | | | 2,500 | | 3,007 | |
| | New Jersey Health Care Facilities Financing Authority Revenue (Inspira Health Obligated Group) | 5.000% | 7/1/36 | | | 2,365 | | 2,834 | |
| | New Jersey Health Care Facilities Financing Authority Revenue (Inspira Health Obligated Group) | 5.000% | 7/1/37 | | | 2,000 | | 2,390 | |
| | New Jersey Health Care Facilities Financing Authority Revenue (Inspira Health Obligated Group) | 5.000% | 7/1/42 | | | 3,000 | | 3,546 | |
| | New Jersey Health Care Facilities Financing Authority Revenue (Inspira Health Obligated Group) | 4.000% | 7/1/47 | | | 15,335 | | 16,838 | |
| 2 | New Jersey Health Care Facilities Financing Authority Revenue (Inspira Health Obligated Group) TOB VRDO | 1.250% | 12/6/19 | | | 8,975 | | 8,975 | |
| 2 | New Jersey Health Care Facilities Financing Authority Revenue (Inspira Health Obligated Group) TOB VRDO | 1.250% | 12/6/19 | | | 2,175 | | 2,175 | |
| | New Jersey Health Care Facilities Financing Authority Revenue (Inspira Health System Obligated Group) | 5.000% | 7/1/28 | | | 5,130 | | 6,172 | |
| | New Jersey Health Care Facilities Financing Authority Revenue (Inspira Health System Obligated Group) | 5.000% | 7/1/30 | | | 5,000 | | 5,968 | |
| | New Jersey Health Care Facilities Financing Authority Revenue (Inspira Health System Obligated Group) | 5.000% | 7/1/33 | | | 2,220 | | 2,629 | |
| | New Jersey Health Care Facilities Financing Authority Revenue (Inspira Health System Obligated Group) | 5.000% | 7/1/34 | | | 2,725 | | 3,222 | |
| | New Jersey Health Care Facilities Financing Authority Revenue (Inspira Health System Obligated Group) | 4.000% | 7/1/41 | | | 3,710 | | 4,064 | |
| | New Jersey Health Care Facilities Financing Authority Revenue (Inspira Health System Obligated Group) | 5.000% | 7/1/46 | | | 2,000 | | 2,311 | |
| | New Jersey Health Care Facilities Financing Authority Revenue (Kennedy Health Systems) | 5.000% | 7/1/22 | | (Prere.) | 1,750 | | 1,921 | |
| | New Jersey Health Care Facilities Financing Authority Revenue (Princeton Healthcare System) | 5.000% | 7/1/31 | | | 2,000 | | 2,409 | |
| | New Jersey Health Care Facilities Financing Authority Revenue (Princeton Healthcare System) | 5.000% | 7/1/32 | | | 2,630 | | 3,160 | |
| | New Jersey Health Care Facilities Financing Authority Revenue (Princeton Healthcare System) | 5.000% | 7/1/33 | | | 3,340 | | 4,006 | |
New Jersey Long-Term Tax-Exempt Fund
| | | | | | | Face | | Market | |
| | | | Maturity | | | Amount | | Value· | |
| | | Coupon | Date | | | ($000 | ) | ($000 | ) |
| | New Jersey Health Care Facilities Financing Authority Revenue (Princeton Healthcare System) | 5.000% | 7/1/34 | | | 2,190 | | 2,622 | |
| | New Jersey Health Care Facilities Financing Authority Revenue (Princeton Healthcare System) | 5.000% | 7/1/39 | | | 5,000 | | 5,897 | |
| | New Jersey Health Care Facilities Financing Authority Revenue (Robert Wood Johnson University) | 5.000% | 7/1/32 | | | 1,000 | | 1,156 | |
| | New Jersey Health Care Facilities Financing Authority Revenue (Robert Wood Johnson University) | 5.000% | 7/1/33 | | | 2,150 | | 2,483 | |
| | New Jersey Health Care Facilities Financing Authority Revenue (Robert Wood Johnson University) | 5.000% | 7/1/34 | | | 1,200 | | 1,385 | |
| | New Jersey Health Care Facilities Financing Authority Revenue (Robert Wood Johnson University) | 5.250% | 7/1/35 | | | 7,070 | | 7,908 | |
| | New Jersey Health Care Facilities Financing Authority Revenue (Robert Wood Johnson University) | 5.000% | 7/1/39 | | | 3,500 | | 4,022 | |
| | New Jersey Health Care Facilities Financing Authority Revenue (Robert Wood Johnson University) | 5.000% | 7/1/43 | | | 4,000 | | 4,576 | |
| | New Jersey Health Care Facilities Financing Authority Revenue (Robert Wood Johnson University) | 5.500% | 7/1/43 | | | 8,010 | | 9,037 | |
| | New Jersey Health Care Facilities Financing Authority Revenue (RWJ Barnabas Health Obligated Group) | 5.000% | 7/1/31 | | | 2,500 | | 2,999 | |
| | New Jersey Health Care Facilities Financing Authority Revenue (RWJ Barnabas Health Obligated Group) | 5.000% | 7/1/33 | | | 5,080 | | 6,068 | |
| | New Jersey Health Care Facilities Financing Authority Revenue (RWJ Barnabas Health Obligated Group) | 5.000% | 7/1/43 | | | 20,000 | | 23,497 | |
| | New Jersey Health Care Facilities Financing Authority Revenue (St. Barnabas Health Care System) | 0.000% | 7/1/21 | | (ETM) | 1,260 | | 1,234 | |
| | New Jersey Health Care Facilities Financing Authority Revenue (St. Barnabas Health Care System) | 5.000% | 7/1/21 | | (Prere.) | 2,000 | | 2,119 | |
| | New Jersey Health Care Facilities Financing Authority Revenue (St. Barnabas Health Care System) | 5.625% | 7/1/21 | | (Prere.) | 2,330 | | 2,491 | |
| | New Jersey Health Care Facilities Financing Authority Revenue (St. Barnabas Health Care System) | 5.625% | 7/1/21 | | (Prere.) | 5,260 | | 5,624 | |
| | New Jersey Health Care Facilities Financing Authority Revenue (St. Joseph’s Healthcare System) | 5.000% | 7/1/28 | | | 1,500 | | 1,760 | |
| | New Jersey Health Care Facilities Financing Authority Revenue (St. Joseph’s Healthcare System) | 5.000% | 7/1/29 | | | 1,335 | | 1,560 | |
New Jersey Long-Term Tax-Exempt Fund
| | | | | | | Face | | Market | |
| | | | Maturity | | | Amount | | Value· | |
| | | Coupon | Date | | | ($000 | ) | ($000 | ) |
| | New Jersey Health Care Facilities Financing Authority Revenue (St. Joseph’s Healthcare System) | 5.000% | 7/1/30 | | | 1,100 | | 1,280 | |
| | New Jersey Health Care Facilities Financing Authority Revenue (St. Joseph’s Healthcare System) | 5.000% | 7/1/31 | | | 1,200 | | 1,393 | |
| | New Jersey Health Care Facilities Financing Authority Revenue (St. Joseph’s Healthcare System) | 3.125% | 7/1/33 | | | 3,420 | | 3,442 | |
| | New Jersey Health Care Facilities Financing Authority Revenue (St. Joseph’s Healthcare System) | 5.000% | 7/1/35 | | | 3,185 | | 3,667 | |
| | New Jersey Health Care Facilities Financing Authority Revenue (St. Joseph’s Healthcare System) | 5.000% | 7/1/36 | | | 1,000 | | 1,149 | |
| | New Jersey Health Care Facilities Financing Authority Revenue (St. Joseph’s Healthcare System) | 5.000% | 7/1/41 | | | 9,510 | | 10,794 | |
| | New Jersey Health Care Facilities Financing Authority Revenue (St. Joseph’s Healthcare System) | 4.000% | 7/1/48 | | | 10,060 | | 10,706 | |
| | New Jersey Health Care Facilities Financing Authority Revenue (St. Luke’s Warren Hospital Obligated Group) | 4.500% | 8/15/43 | | | 5,800 | | 6,132 | |
| | New Jersey Health Care Facilities Financing Authority Revenue (St. Peter’s University Hospital Obligated Group) | 6.250% | 7/1/35 | | | 2,115 | | 2,237 | |
| | New Jersey Health Care Facilities Financing Authority Revenue (Trinitas Hospital Obligated Group) | 5.000% | 7/1/26 | | | 50 | | 59 | |
| | New Jersey Health Care Facilities Financing Authority Revenue (Trinitas Hospital Obligated Group) | 5.000% | 7/1/27 | | | 1,165 | | 1,379 | |
| | New Jersey Health Care Facilities Financing Authority Revenue (Trinitas Hospital Obligated Group) | 5.000% | 7/1/28 | | | 1,000 | | 1,178 | |
| | New Jersey Health Care Facilities Financing Authority Revenue (Trinitas Hospital Obligated Group) | 5.000% | 7/1/29 | | | 2,875 | | 3,379 | |
| | New Jersey Health Care Facilities Financing Authority Revenue (Trinitas Hospital Obligated Group) | 5.000% | 7/1/30 | | | 800 | | 935 | |
| | New Jersey Health Care Facilities Financing Authority Revenue (Trinitas Hospital Obligated Group) | 5.000% | 7/1/30 | | | 2,745 | | 3,208 | |
| | New Jersey Health Care Facilities Financing Authority Revenue (University Hospital) | 5.000% | 7/1/27 | | (4) | 2,000 | | 2,325 | |
| | New Jersey Health Care Facilities Financing Authority Revenue (University Hospital) | 5.000% | 7/1/29 | | (4) | 1,950 | | 2,252 | |
| | New Jersey Health Care Facilities Financing Authority Revenue (University Hospital) | 5.000% | 7/1/30 | | (4) | 1,650 | | 1,897 | |
| | New Jersey Health Care Facilities Financing Authority Revenue (University Hospital) | 4.125% | 7/1/38 | | (4) | 3,780 | | 4,040 | |
| | New Jersey Health Care Facilities Financing Authority Revenue (University Hospital) | 5.000% | 7/1/46 | | (4) | 7,950 | | 8,954 | |
New Jersey Long-Term Tax-Exempt Fund
| | | | | | | Face | | Market | |
| | | | Maturity | | | Amount | | Value· | |
| | | Coupon | Date | | | ($000 | ) | ($000 | ) |
| 1 | New Jersey Health Care Facilities Financing Authority Revenue (Valley Health System) | 5.000% | 7/1/30 | | | 1,530 | | 1,943 | |
| 1 | New Jersey Health Care Facilities Financing Authority Revenue (Valley Health System) | 5.000% | 7/1/32 | | | 2,455 | | 3,087 | |
| 1 | New Jersey Health Care Facilities Financing Authority Revenue (Valley Health System) | 5.000% | 7/1/33 | | | 3,305 | | 4,135 | |
| 1 | New Jersey Health Care Facilities Financing Authority Revenue (Valley Health System) | 5.000% | 7/1/34 | | | 2,000 | | 2,493 | |
| 1 | New Jersey Health Care Facilities Financing Authority Revenue (Valley Health System) | 4.000% | 7/1/35 | | | 1,000 | | 1,144 | |
| 1 | New Jersey Health Care Facilities Financing Authority Revenue (Valley Health System) | 4.000% | 7/1/36 | | | 2,000 | | 2,279 | |
| 1 | New Jersey Health Care Facilities Financing Authority Revenue (Valley Health System) | 4.000% | 7/1/37 | | | 2,130 | | 2,420 | |
| 1 | New Jersey Health Care Facilities Financing Authority Revenue (Valley Health System) | 4.000% | 7/1/38 | | | 1,000 | | 1,134 | |
| 1 | New Jersey Health Care Facilities Financing Authority Revenue (Valley Health System) | 4.000% | 7/1/39 | | | 1,730 | | 1,956 | |
| 1 | New Jersey Health Care Facilities Financing Authority Revenue (Valley Health System) | 4.000% | 7/1/44 | | | 8,000 | | 8,937 | |
| 1 | New Jersey Health Care Facilities Financing Authority Revenue (Valley Health System) | 3.000% | 7/1/49 | | | 7,000 | | 6,900 | |
| | New Jersey Health Care Facilities Financing Authority Revenue (Virtua Health) | 5.000% | 7/1/28 | | | 3,000 | | 3,406 | |
| | New Jersey Health Care Facilities Financing Authority Revenue (Virtua Health) | 5.000% | 7/1/29 | | | 2,410 | | 2,729 | |
| | New Jersey Higher Education Assistance Authority Student Loan Revenue | 4.750% | 12/1/21 | | | 2,300 | | 2,302 | |
| | New Jersey Higher Education Assistance Authority Student Loan Revenue | 5.000% | 12/1/23 | | | 5,480 | | 6,249 | |
| | New Jersey Higher Education Assistance Authority Student Loan Revenue | 5.000% | 12/1/24 | | | 3,630 | | 4,251 | |
| | New Jersey Higher Education Assistance Authority Student Loan Revenue | 5.000% | 12/1/25 | | | 740 | | 741 | |
| | New Jersey Higher Education Assistance Authority Student Loan Revenue | 5.000% | 12/1/26 | | | 665 | | 665 | |
| | New Jersey Higher Education Assistance Authority Student Loan Revenue | 2.375% | 12/1/29 | | | 6,000 | | 6,051 | |
| | New Jersey Housing & Mortgage Finance Agency Multi-Family Housing Revenue | 3.950% | 11/1/43 | | | 1,100 | | 1,173 | |
| | New Jersey Housing & Mortgage Finance Agency Multi-Family Housing Revenue | 3.750% | 11/1/45 | | | 1,000 | | 1,038 | |
| | New Jersey Housing & Mortgage Finance Agency Multi-Family Housing Revenue | 4.000% | 11/1/48 | | | 825 | | 886 | |
| | New Jersey Housing & Mortgage Finance Agency Multi-Family Housing Revenue | 3.900% | 11/1/50 | | | 3,000 | | 3,127 | |
| | New Jersey Housing & Mortgage Finance Agency Multi-Family Housing Revenue | 4.100% | 11/1/53 | | | 500 | | 535 | |
| 2 | New Jersey Housing & Mortgage Finance Agency Multi-Family Housing Revenue TOB VRDO | 1.130% | 12/6/19 | | | 10,000 | | 10,000 | |
| | New Jersey Housing & Mortgage Finance Agency Single Family Housing Revenue | 4.250% | 10/1/32 | | | 400 | | 405 | |
| | New Jersey Housing & Mortgage Finance Agency Single Family Housing Revenue | 3.500% | 10/1/34 | | | 7,170 | | 7,670 | |
New Jersey Long-Term Tax-Exempt Fund
| | | | | | | Face | | Market | |
| | | | Maturity | | | Amount | | Value· | |
| | | Coupon | Date | | | ($000 | ) | ($000 | ) |
| | New Jersey Housing & Mortgage Finance Agency Single Family Housing Revenue | 3.750% | 10/1/35 | | | 9,085 | | 9,732 | |
| | New Jersey Housing & Mortgage Finance Agency Single Family Housing Revenue | 3.850% | 10/1/39 | | | 5,255 | | 5,627 | |
| | New Jersey Housing & Mortgage Finance Agency Single Family Housing Revenue | 3.950% | 10/1/44 | | | 3,185 | | 3,401 | |
| | New Jersey Housing & Mortgage Finance Agency Single Family Housing Revenue | 4.000% | 4/1/49 | | | 2,390 | | 2,563 | |
| | New Jersey Institute of Technology Revenue | 5.000% | 7/1/22 | | (Prere.) | 460 | | 505 | |
| | New Jersey Institute of Technology Revenue | 5.000% | 7/1/32 | | | 1,075 | | 1,169 | |
| | New Jersey Institute of Technology Revenue | 5.000% | 7/1/40 | | | 6,910 | | 7,991 | |
| | New Jersey Institute of Technology Revenue | 5.000% | 7/1/42 | | | 4,810 | | 5,205 | |
| | New Jersey Institute of Technology Revenue | 5.000% | 7/1/45 | | | 9,090 | | 10,494 | |
| | New Jersey Transportation Trust Fund Authority Federal Highway Reimbursement Revenue | 5.000% | 6/15/21 | | | 135 | | 142 | |
| | New Jersey Transportation Trust Fund Authority Federal Highway Reimbursement Revenue | 5.000% | 6/15/22 | | | 595 | | 646 | |
| | New Jersey Transportation Trust Fund Authority Federal Highway Reimbursement Revenue | 5.000% | 6/15/27 | | | 13,975 | | 16,492 | |
| | New Jersey Transportation Trust Fund Authority Federal Highway Reimbursement Revenue | 5.000% | 6/15/28 | | | 6,580 | | 7,731 | |
| | New Jersey Transportation Trust Fund Authority Federal Highway Reimbursement Revenue | 5.000% | 6/15/29 | | | 5,805 | | 6,790 | |
| | New Jersey Transportation Trust Fund Authority Federal Highway Reimbursement Revenue | 5.000% | 6/15/30 | | | 8,020 | | 9,338 | |
| | New Jersey Transportation Trust Fund Authority Federal Highway Reimbursement Revenue | 5.000% | 6/15/30 | | | 10,600 | | 12,343 | |
| | New Jersey Transportation Trust Fund Authority Federal Highway Reimbursement Revenue | 5.000% | 6/15/31 | | | 10,945 | | 12,706 | |
| | New Jersey Transportation Trust Fund Authority Revenue | 5.250% | 12/15/21 | | (4) | 295 | | 318 | |
| | New Jersey Transportation Trust Fund Authority Revenue | 5.500% | 12/15/21 | | (14) | 315 | | 341 | |
| | New Jersey Transportation Trust Fund Authority Revenue | 0.000% | 12/15/24 | | (12)(2) | 100 | | 91 | |
| | New Jersey Transportation Trust Fund Authority Revenue | 0.000% | 12/15/26 | | (13)(2) | 475 | | 412 | |
| | New Jersey Transportation Trust Fund Authority Revenue | 5.000% | 6/15/30 | | | 1,000 | | 1,186 | |
| | New Jersey Transportation Trust Fund Authority Revenue | 5.000% | 6/15/31 | | | 1,000 | | 1,178 | |
| | New Jersey Transportation Trust Fund Authority Revenue | 5.000% | 6/15/32 | | | 1,000 | | 1,173 | |
| | New Jersey Transportation Trust Fund Authority Revenue | 5.000% | 12/15/32 | | | 3,000 | | 3,513 | |
| | New Jersey Transportation Trust Fund Authority Revenue | 5.000% | 6/15/33 | | | 1,000 | | 1,168 | |
New Jersey Long-Term Tax-Exempt Fund
| | | | | | | Face | | Market | |
| | | | Maturity | | | Amount | | Value· | |
| | | Coupon | Date | | | ($000 | ) | ($000 | ) |
| | New Jersey Transportation Trust Fund Authority Revenue | 5.000% | 12/15/33 | | | 2,810 | | 3,281 | |
| | New Jersey Transportation Trust Fund Authority Revenue | 5.000% | 6/15/34 | | | 1,000 | | 1,166 | |
| | New Jersey Transportation Trust Fund Authority Revenue | 5.000% | 12/15/34 | | | 2,810 | | 3,273 | |
| | New Jersey Transportation Trust Fund Authority Revenue | 5.000% | 6/15/35 | | | 1,000 | | 1,163 | |
| | New Jersey Transportation Trust Fund Authority Revenue | 5.000% | 12/15/35 | | | 2,325 | | 2,701 | |
| | New Jersey Transportation Trust Fund Authority Revenue | 4.000% | 6/15/36 | | | 1,000 | | 1,064 | |
| | New Jersey Transportation Trust Fund Authority Revenue | 5.000% | 12/15/36 | | | 2,370 | | 2,750 | |
| | New Jersey Transportation Trust Fund Authority Revenue | 4.000% | 6/15/37 | | | 1,000 | | 1,060 | |
| | New Jersey Transportation Trust Fund Authority Revenue | 4.000% | 12/15/37 | | (15) | 2,610 | | 2,854 | |
| | New Jersey Transportation Trust Fund Authority Revenue | 4.000% | 6/15/38 | | | 1,000 | | 1,057 | |
| | New Jersey Transportation Trust Fund Authority Revenue | 4.250% | 12/15/38 | | | 2,355 | | 2,532 | |
| | New Jersey Transportation Trust Fund Authority Revenue | 3.250% | 6/15/39 | | | 1,000 | | 981 | |
| | New Jersey Transportation Trust Fund Authority Revenue | 4.000% | 6/15/44 | | | 2,500 | | 2,613 | |
| | New Jersey Transportation Trust Fund Authority Revenue | 5.000% | 6/15/44 | | | 2,000 | | 2,274 | |
| | New Jersey Transportation Trust Fund Authority Revenue | 3.500% | 6/15/46 | | | 2,500 | | 2,451 | |
| | New Jersey Transportation Trust Fund Authority Revenue | 4.000% | 6/15/50 | | | 2,500 | | 2,597 | |
| | New Jersey Transportation Trust Fund Authority Revenue | 5.000% | 6/15/50 | | | 2,000 | | 2,266 | |
| | New Jersey Transportation Trust Fund Authority Transportation Program Revenue | 5.000% | 6/15/25 | | | 4,500 | | 4,874 | |
| | New Jersey Transportation Trust Fund Authority Transportation Program Revenue | 5.000% | 6/15/27 | | | 4,880 | | 5,405 | |
| | New Jersey Transportation Trust Fund Authority Transportation Program Revenue | 5.250% | 6/15/29 | | | 2,000 | | 2,302 | |
| | New Jersey Transportation Trust Fund Authority Transportation Program Revenue | 5.250% | 6/15/31 | | | 1,500 | | 1,662 | |
| | New Jersey Transportation Trust Fund Authority Transportation Program Revenue | 4.000% | 12/15/31 | | | 5,165 | | 5,597 | |
| | New Jersey Transportation Trust Fund Authority Transportation Program Revenue | 5.000% | 6/15/32 | | | 10,000 | | 10,722 | |
| | New Jersey Transportation Trust Fund Authority Transportation Program Revenue | 5.000% | 6/15/33 | | | 4,500 | | 4,821 | |
| | New Jersey Transportation Trust Fund Authority Transportation Program Revenue | 4.000% | 6/15/36 | | | 2,500 | | 2,660 | |
| | New Jersey Transportation Trust Fund Authority Transportation Program Revenue | 0.000% | 12/15/36 | | | 700 | | 405 | |
| | New Jersey Transportation Trust Fund Authority Transportation Program Revenue | 4.750% | 6/15/38 | | | 3,030 | | 3,293 | |
New Jersey Long-Term Tax-Exempt Fund
| | | | | | | Face | | Market | |
| | | | Maturity | | | Amount | | Value· | |
| | | Coupon | Date | | | ($000 | ) | ($000 | ) |
| | New Jersey Transportation Trust Fund Authority Transportation Program Revenue | 5.000% | 6/15/38 | | | 10,550 | | 11,633 | |
| | New Jersey Transportation Trust Fund Authority Transportation Program Revenue | 5.000% | 6/15/38 | | | 6,575 | | 6,995 | |
| | New Jersey Transportation Trust Fund Authority Transportation Program Revenue | 4.125% | 6/15/39 | | | 2,500 | | 2,661 | |
| | New Jersey Transportation Trust Fund Authority Transportation Program Revenue | 5.500% | 6/15/39 | | | 5,400 | | 5,951 | |
| | New Jersey Transportation Trust Fund Authority Transportation Program Revenue | 5.250% | 6/15/41 | | | 7,700 | | 8,668 | |
| | New Jersey Transportation Trust Fund Authority Transportation Program Revenue | 5.250% | 6/15/43 | | | 3,000 | | 3,488 | |
| | New Jersey Transportation Trust Fund Authority Transportation Program Revenue | 5.000% | 6/15/44 | | | 3,585 | | 3,860 | |
| | New Jersey Transportation Trust Fund Authority Transportation Program Revenue | 5.000% | 6/15/45 | | | 1,000 | | 1,102 | |
| | New Jersey Transportation Trust Fund Authority Transportation Program Revenue | 5.000% | 6/15/46 | | | 5,385 | | 5,926 | |
| | New Jersey Transportation Trust Fund Authority Transportation Program Revenue | 5.000% | 6/15/46 | | | 3,000 | | 3,402 | |
| | New Jersey Transportation Trust Fund Authority Transportation Program Revenue | 4.500% | 6/15/49 | | | 5,000 | | 5,432 | |
| | New Jersey Transportation Trust Fund Authority Transportation System Revenue | 5.000% | 6/15/20 | | | 200 | | 204 | |
| | New Jersey Transportation Trust Fund Authority Transportation System Revenue | 5.750% | 6/15/20 | | | 2,570 | | 2,628 | |
| | New Jersey Transportation Trust Fund Authority Transportation System Revenue | 5.250% | 12/15/22 | | | 250 | | 277 | |
| | New Jersey Transportation Trust Fund Authority Transportation System Revenue | 0.000% | 12/15/23 | | | 3,950 | | 3,651 | |
| | New Jersey Transportation Trust Fund Authority Transportation System Revenue | 5.250% | 12/15/23 | | (2) | 100 | | 114 | |
| | New Jersey Transportation Trust Fund Authority Transportation System Revenue | 0.000% | 12/15/24 | | | 550 | | 494 | |
| | New Jersey Transportation Trust Fund Authority Transportation System Revenue | 0.000% | 12/15/24 | | (2) | 775 | | 698 | |
| | New Jersey Transportation Trust Fund Authority Transportation System Revenue | 0.000% | 12/15/25 | | | 380 | | 331 | |
| | New Jersey Transportation Trust Fund Authority Transportation System Revenue | 0.000% | 12/15/25 | | | 1,315 | | 1,144 | |
| | New Jersey Transportation Trust Fund Authority Transportation System Revenue | 0.000% | 12/15/26 | | (2) | 2,000 | | 1,693 | |
| | New Jersey Transportation Trust Fund Authority Transportation System Revenue | 0.000% | 12/15/26 | | | 5,850 | | 4,919 | |
| | New Jersey Transportation Trust Fund Authority Transportation System Revenue | 5.125% | 6/15/28 | | | 5,245 | | 5,513 | |
| | New Jersey Transportation Trust Fund Authority Transportation System Revenue | 0.000% | 12/15/28 | | (2) | 755 | | 592 | |
| | New Jersey Transportation Trust Fund Authority Transportation System Revenue | 0.000% | 12/15/28 | | | 3,955 | | 3,090 | |
| | New Jersey Transportation Trust Fund Authority Transportation System Revenue | 0.000% | 12/15/28 | | | 11,915 | | 9,308 | |
| | New Jersey Transportation Trust Fund Authority Transportation System Revenue | 5.000% | 6/15/29 | | | 2,785 | | 3,071 | |
New Jersey Long-Term Tax-Exempt Fund
| | | | | | | Face | | Market | |
| | | | Maturity | | | Amount | | Value· | |
| | | Coupon | Date | | | ($000 | ) | ($000 | ) |
| | New Jersey Transportation Trust Fund Authority Transportation System Revenue | 0.000% | 12/15/29 | | (4) | 10,000 | | 7,739 | |
| | New Jersey Transportation Trust Fund Authority Transportation System Revenue | 5.250% | 6/15/30 | | | 3,565 | | 3,748 | |
| | New Jersey Transportation Trust Fund Authority Transportation System Revenue | 5.250% | 6/15/31 | | | 5,395 | | 5,668 | |
| | New Jersey Transportation Trust Fund Authority Transportation System Revenue | 5.500% | 6/15/31 | | | 6,015 | | 6,342 | |
| | New Jersey Transportation Trust Fund Authority Transportation System Revenue | 0.000% | 12/15/31 | | (14) | 14,190 | | 10,108 | |
| | New Jersey Transportation Trust Fund Authority Transportation System Revenue | 0.000% | 12/15/31 | | | 12,195 | | 8,554 | |
| | New Jersey Transportation Trust Fund Authority Transportation System Revenue | 5.000% | 6/15/32 | | | 8,275 | | 9,306 | |
| | New Jersey Transportation Trust Fund Authority Transportation System Revenue | 0.000% | 12/15/32 | | (4) | 19,280 | | 13,660 | |
| | New Jersey Transportation Trust Fund Authority Transportation System Revenue | 0.000% | 12/15/32 | | | 995 | | 673 | |
| | New Jersey Transportation Trust Fund Authority Transportation System Revenue | 0.000% | 12/15/32 | | | 150 | | 101 | |
| | New Jersey Transportation Trust Fund Authority Transportation System Revenue | 0.000% | 12/15/33 | | | 5,000 | | 3,261 | |
| | New Jersey Transportation Trust Fund Authority Transportation System Revenue | 0.000% | 12/15/33 | | | 3,000 | | 1,956 | |
| | New Jersey Transportation Trust Fund Authority Transportation System Revenue | 0.000% | 12/15/34 | | | 60 | | 38 | |
| | New Jersey Transportation Trust Fund Authority Transportation System Revenue | 6.000% | 6/15/35 | | | 385 | | 408 | |
| | New Jersey Transportation Trust Fund Authority Transportation System Revenue | 0.000% | 12/15/35 | | | 170 | | 103 | |
| | New Jersey Transportation Trust Fund Authority Transportation System Revenue | 5.250% | 6/15/36 | | | 3,000 | | 3,143 | |
| | New Jersey Transportation Trust Fund Authority Transportation System Revenue | 0.000% | 12/15/36 | | | 6,710 | | 3,884 | |
| | New Jersey Transportation Trust Fund Authority Transportation System Revenue | 0.000% | 12/15/37 | | | 5,785 | | 3,196 | |
| | New Jersey Transportation Trust Fund Authority Transportation System Revenue | 0.000% | 12/15/37 | | | 1,265 | | 699 | |
| | New Jersey Transportation Trust Fund Authority Transportation System Revenue | 0.000% | 12/15/38 | | | 3,855 | | 2,044 | |
| | New Jersey Transportation Trust Fund Authority Transportation System Revenue | 0.000% | 12/15/38 | | | 9,725 | | 5,167 | |
| | New Jersey Transportation Trust Fund Authority Transportation System Revenue | 0.000% | 12/15/39 | | | 315 | | 160 | |
| | New Jersey Transportation Trust Fund Authority Transportation System Revenue | 0.000% | 12/15/40 | | | 1,575 | | 769 | |
| | New Jersey Transportation Trust Fund Authority Transportation System Revenue | 5.500% | 6/15/41 | | | 8,000 | | 8,388 | |
| | New Jersey Transportation Trust Fund Authority Transportation System Revenue | 5.000% | 6/15/42 | | | 15,535 | | 16,156 | |
| | New Jersey Turnpike Authority Revenue | 5.000% | 7/1/22 | | (Prere.) | 10,355 | | 11,381 | |
| | New Jersey Turnpike Authority Revenue | 5.000% | 7/1/22 | | (Prere.) | 5,395 | | 5,930 | |
| | New Jersey Turnpike Authority Revenue | 5.000% | 1/1/31 | | | 3,000 | | 3,637 | |
| | New Jersey Turnpike Authority Revenue | 5.000% | 1/1/31 | | | 2,000 | | 2,470 | |
| | New Jersey Turnpike Authority Revenue | 5.000% | 1/1/31 | | | 3,000 | | 3,705 | |
New Jersey Long-Term Tax-Exempt Fund
| | | | | | | Face | | Market | |
| | | | Maturity | | | Amount | | Value· | |
| | | Coupon | Date | | | ($000 | ) | ($000 | ) |
| | New Jersey Turnpike Authority Revenue | 5.000% | 1/1/32 | | | 3,250 | | 3,780 | |
| | New Jersey Turnpike Authority Revenue | 5.000% | 1/1/32 | | | 3,100 | | 3,814 | |
| | New Jersey Turnpike Authority Revenue | 5.000% | 1/1/33 | | | 3,000 | | 3,482 | |
| | New Jersey Turnpike Authority Revenue | 5.000% | 1/1/33 | | | 1,250 | | 1,533 | |
| | New Jersey Turnpike Authority Revenue | 5.000% | 1/1/33 | | | 15 | | 18 | |
| | New Jersey Turnpike Authority Revenue | 4.000% | 1/1/34 | | | 5,000 | | 5,702 | |
| | New Jersey Turnpike Authority Revenue | 5.000% | 1/1/34 | | | 20 | | 23 | |
| | New Jersey Turnpike Authority Revenue | 5.000% | 1/1/34 | | | 3,395 | | 3,936 | |
| | New Jersey Turnpike Authority Revenue | 5.000% | 1/1/34 | | | 5,000 | | 6,011 | |
| | New Jersey Turnpike Authority Revenue | 5.000% | 1/1/34 | | | 7,100 | | 8,693 | |
| | New Jersey Turnpike Authority Revenue | 4.000% | 1/1/35 | | | 2,000 | | 2,276 | |
| | New Jersey Turnpike Authority Revenue | 5.000% | 1/1/35 | | | 4,000 | | 4,796 | |
| | New Jersey Turnpike Authority Revenue | 4.000% | 1/1/36 | | | 650 | | 737 | |
| | New Jersey Turnpike Authority Revenue | 5.000% | 1/1/36 | | | 3,890 | | 4,740 | |
| | New Jersey Turnpike Authority Revenue | 4.000% | 1/1/37 | | | 2,500 | | 2,824 | |
| | New Jersey Turnpike Authority Revenue | 5.000% | 1/1/37 | | | 9,755 | | 11,856 | |
| | New Jersey Turnpike Authority Revenue | 4.000% | 1/1/43 | | | 12,525 | | 13,946 | |
| | New Jersey Turnpike Authority Revenue | 5.000% | 1/1/43 | | | 3,200 | | 3,459 | |
| | New Jersey Turnpike Authority Revenue | 5.000% | 1/1/45 | | | 14,360 | | 16,411 | |
| | New Jersey Turnpike Authority Revenue | 4.000% | 1/1/48 | | | 4,440 | | 4,966 | |
| | New Jersey Turnpike Authority Revenue | 5.000% | 1/1/48 | | | 4,000 | | 4,840 | |
| 2 | New Jersey Turnpike Authority Revenue TOB VRDO | 1.130% | 12/6/19 | | LOC | 65 | | 65 | |
| 2 | New Jersey Turnpike Authority Revenue TOB VRDO | 1.220% | 12/6/19 | | | 15,615 | | 15,615 | |
| 2 | New Jersey Turnpike Authority Revenue TOB VRDO | 1.250% | 12/6/19 | | | 6,665 | | 6,665 | |
| | Newark NJ Housing Authority Port Authority-Port Newark Marine Terminal Revenue (City of Newark Redevelopment Projects) | 5.000% | 1/1/32 | | (14) | 2,500 | | 3,139 | |
| | Newark NJ Housing Authority Port Authority-Port Newark Marine Terminal Revenue (City of Newark Redevelopment Projects) | 4.000% | 1/1/37 | | | 8,500 | | 9,519 | |
| | North Brunswick NJ Township Board of Education GO | 3.250% | 8/15/31 | | | 395 | | 426 | |
| | North Brunswick NJ Township Board of Education GO | 3.375% | 8/15/36 | | | 1,940 | | 2,073 | |
| | North Brunswick NJ Township Board of Education GO | 3.375% | 8/15/37 | | | 1,695 | | 1,802 | |
| | North Brunswick Township NJ GO | 2.000% | 7/15/23 | | | 265 | | 272 | |
| | North Brunswick Township NJ GO | 2.000% | 7/15/24 | | | 225 | | 232 | |
| | Passaic County NJ GO | 3.000% | 5/1/32 | | | 540 | | 578 | |
| | Passaic County NJ Improvement Authority Government Loan Revenue (City of Paterson Project) | 5.000% | 6/15/34 | | | 1,000 | | 1,213 | |
| | Passaic County NJ Improvement Authority Government Loan Revenue (City of Paterson Project) | 5.000% | 6/15/35 | | | 1,200 | | 1,452 | |
| | Passaic County NJ Improvement Authority Lease Revenue | 5.000% | 5/1/33 | | | 720 | | 835 | |
| | Passaic County NJ Improvement Authority Revenue (200 Hospital Plaza Corp. Project) | 5.000% | 5/1/42 | | | 2,500 | | 2,938 | |
| 1 | Passaic NJ GO | 1.000% | 12/1/35 | | | 1,675 | | 1,270 | |
| | Passaic Valley NJ Sewage Commissioners Revenue | 5.000% | 12/1/24 | | (4) | 3,010 | | 3,534 | |
New Jersey Long-Term Tax-Exempt Fund
| | | | | | | Face | | Market | |
| | | | Maturity | | | Amount | | Value· | |
| | | Coupon | Date | | | ($000 | ) | ($000 | ) |
| | Passaic Valley NJ Water Commission Revenue | 5.000% | 12/15/32 | | (4) | 1,385 | | 1,606 | |
| | Pennsauken Township NJ School District GO | 4.000% | 7/15/38 | | | 2,525 | | 2,727 | |
| | Pinelands NJ Regional School District GO | 4.000% | 3/1/24 | | | 230 | | 253 | |
| | Plainfield NJ Board of Education GO | 5.000% | 8/1/20 | | (15) | 1,470 | | 1,506 | |
| | Plainfield NJ Board of Education GO | 5.000% | 8/1/21 | | (15) | 1,175 | | 1,247 | |
| | Plainfield NJ Board of Education GO | 5.000% | 8/1/22 | | (15) | 1,600 | | 1,754 | |
| | Plainfield NJ Board of Education GO | 5.000% | 8/1/23 | | (15) | 1,750 | | 1,976 | |
| | Plainfield NJ Board of Education GO | 5.000% | 8/1/24 | | (15) | 1,000 | | 1,161 | |
| | Plainfield NJ Board of Education GO | 5.000% | 8/1/25 | | (15) | 1,000 | | 1,192 | |
| | Port Authority of New York & New Jersey Revenue | 5.375% | 3/1/28 | | | 1,280 | | 1,521 | |
| | Port Authority of New York & New Jersey Revenue | 5.000% | 12/1/34 | | | 7,000 | | 7,970 | |
| | Port Authority of New York & New Jersey Revenue | 5.000% | 11/15/35 | | | 2,000 | | 2,468 | |
| | Port Authority of New York & New Jersey Revenue | 5.000% | 9/1/36 | | | 5,560 | | 7,067 | |
| | Port Authority of New York & New Jersey Revenue | 5.000% | 11/15/36 | | | 5,000 | | 6,154 | |
| | Port Authority of New York & New Jersey Revenue | 4.000% | 9/1/37 | | | 3,630 | | 4,192 | |
| | Port Authority of New York & New Jersey Revenue | 5.000% | 7/15/38 | | | 3,605 | | 4,448 | |
| | Port Authority of New York & New Jersey Revenue | 4.000% | 9/1/38 | | | 4,000 | | 4,605 | |
| | Port Authority of New York & New Jersey Revenue | 4.000% | 9/1/39 | | | 4,555 | | 5,230 | |
| | Port Authority of New York & New Jersey Revenue | 5.000% | 9/1/39 | | | 4,090 | | 4,660 | |
| | Port Authority of New York & New Jersey Revenue | 4.000% | 9/1/43 | | | 5,000 | | 5,619 | |
| | Port Authority of New York & New Jersey Revenue | 4.000% | 9/1/45 | | | 2,000 | | 2,266 | |
| | Port Authority of New York & New Jersey Revenue | 5.000% | 10/15/47 | | | 4,000 | | 4,764 | |
| | Port Authority of New York & New Jersey Revenue | 5.000% | 9/1/48 | | | 1,740 | | 2,111 | |
| 1 | Port Authority of New York & New Jersey Revenue | 4.000% | 11/1/49 | | | 4,125 | | 4,662 | |
| | Port Authority of New York & New Jersey Revenue | 5.250% | 10/15/55 | | | 5,080 | | 5,999 | |
| | Port Authority of New York & New Jersey Revenue | 5.250% | 11/15/56 | | | 5,010 | | 6,019 | |
| | Port Authority of New York & New Jersey Revenue | 5.000% | 4/15/57 | | | 4,000 | | 4,721 | |
| | Port Authority of New York & New Jersey Revenue | 5.000% | 5/15/57 | | | 3,000 | | 3,580 | |
| | Port Authority of New York & New Jersey Revenue | 5.250% | 11/15/57 | | | 4,405 | | 5,370 | |
| 2 | Port Authority of New York & New Jersey Revenue TOB VRDO | 1.150% | 12/6/19 | | | 20 | | 20 | |
| | Port Authority of New York & New Jersey Special Obligation Revenue (John F. Kennedy International Air Terminal LLC) | 5.500% | 12/1/31 | | | 5,000 | | 5,212 | |
New Jersey Long-Term Tax-Exempt Fund
| | | | | | | Face | | Market | |
| | | | Maturity | | | Amount | | Value· | |
| | | Coupon | Date | | | ($000 | ) | ($000 | ) |
| | Port Authority of New York & New Jersey Special Obligation Revenue (John F. Kennedy International Air Terminal LLC) | 6.000% | 12/1/42 | | | 5,000 | | 5,220 | |
| | Rutgers State University New Jersey Revenue | 5.000% | 5/1/23 | | (Prere.) | 350 | | 395 | |
| | Rutgers State University New Jersey Revenue | 5.000% | 5/1/23 | | (Prere.) | 7,000 | | 7,896 | |
| | Rutgers State University New Jersey Revenue | 5.000% | 5/1/23 | | (Prere.) | 3,010 | | 3,395 | |
| | Rutgers State University New Jersey Revenue | 5.000% | 5/1/23 | | (Prere.) | 14,290 | | 16,120 | |
| | Rutgers State University New Jersey Revenue | 5.000% | 5/1/23 | | (Prere.) | 13,650 | | 15,398 | |
| | Rutgers State University New Jersey Revenue VRDO | 1.110% | 12/2/19 | | | 19,850 | | 19,850 | |
| | Salem County NJ | 3.000% | 6/15/32 | | (15) | 765 | | 790 | |
| | Salem County NJ | 3.000% | 6/15/33 | | (15) | 270 | | 278 | |
| | Somers Point NJ GO | 3.000% | 10/1/23 | | | 1,165 | | 1,236 | |
| | Somers Point NJ GO | 3.000% | 10/1/24 | | | 1,265 | | 1,360 | |
| | Somers Point NJ GO | 4.000% | 10/1/25 | | | 1,085 | | 1,240 | |
| | Somers Point NJ GO | 4.000% | 10/1/26 | | | 1,360 | | 1,575 | |
| | South Jersey NJ Port Corp. Revenue | 5.000% | 1/1/39 | | | 2,440 | | 2,752 | |
| | South Jersey NJ Port Corp. Revenue | 5.000% | 1/1/49 | | | 2,500 | | 2,870 | |
| | South Jersey Transportation Authority New Jersey Transportation System Revenue | 5.000% | 11/1/21 | | | 3,000 | | 3,195 | |
| | South Jersey Transportation Authority New Jersey Transportation System Revenue | 5.000% | 11/1/22 | | (Prere.) | 4,010 | | 4,440 | |
| | South Jersey Transportation Authority New Jersey Transportation System Revenue | 5.000% | 11/1/22 | | | 2,780 | | 3,051 | |
| | South Jersey Transportation Authority New Jersey Transportation System Revenue | 5.000% | 11/1/22 | | (Prere.) | 2,050 | | 2,270 | |
| | South Jersey Transportation Authority New Jersey Transportation System Revenue | 5.000% | 11/1/23 | | | 250 | | 274 | |
| | South Jersey Transportation Authority New Jersey Transportation System Revenue | 5.000% | 11/1/25 | | | 4,000 | | 4,377 | |
| | South Jersey Transportation Authority New Jersey Transportation System Revenue | 5.000% | 11/1/26 | | | 5,000 | | 5,462 | |
| | South Jersey Transportation Authority New Jersey Transportation System Revenue | 5.000% | 11/1/27 | | | 2,960 | | 3,228 | |
| | South Jersey Transportation Authority New Jersey Transportation System Revenue | 5.000% | 11/1/28 | | (4) | 200 | | 252 | |
| | South Jersey Transportation Authority New Jersey Transportation System Revenue | 5.000% | 11/1/28 | | (4) | 1,140 | | 1,418 | |
| | South Jersey Transportation Authority New Jersey Transportation System Revenue | 5.000% | 11/1/28 | | | 240 | | 261 | |
| | South Jersey Transportation Authority New Jersey Transportation System Revenue | 5.000% | 11/1/29 | | (4) | 500 | | 638 | |
| | South Jersey Transportation Authority New Jersey Transportation System Revenue | 5.000% | 11/1/30 | | | 450 | | 511 | |
| | South Jersey Transportation Authority New Jersey Transportation System Revenue | 5.000% | 11/1/30 | | (4) | 500 | | 635 | |
| | South Jersey Transportation Authority New Jersey Transportation System Revenue | 5.000% | 11/1/31 | | (4) | 500 | | 632 | |
| | South Jersey Transportation Authority New Jersey Transportation System Revenue | 5.000% | 11/1/32 | | (4) | 500 | | 629 | |
| | South Jersey Transportation Authority New Jersey Transportation System Revenue | 5.000% | 11/1/33 | | (4) | 500 | | 628 | |
| | South Jersey Transportation Authority New Jersey Transportation System Revenue | 5.000% | 11/1/39 | | | 5,600 | | 6,268 | |
| | Sussex County NJ GO | 3.000% | 6/1/24 | | | 1,600 | | 1,724 | |
New Jersey Long-Term Tax-Exempt Fund
| | | | | | | Face | | Market | |
| | | | Maturity | | | Amount | | Value· | |
| | | Coupon | Date | | | ($000 | ) | ($000 | ) |
| | Tobacco Settlement Financing Corp. New Jersey Revenue | 5.000% | 6/1/22 | | | 1,000 | | 1,082 | |
| | Tobacco Settlement Financing Corp. New Jersey Revenue | 5.000% | 6/1/25 | | | 1,200 | | 1,400 | |
| | Tobacco Settlement Financing Corp. New Jersey Revenue | 5.000% | 6/1/26 | | | 1,405 | | 1,673 | |
| | Tobacco Settlement Financing Corp. New Jersey Revenue | 3.200% | 6/1/27 | | | 3,085 | | 3,149 | |
| | Tobacco Settlement Financing Corp. New Jersey Revenue | 5.000% | 6/1/28 | | | 1,955 | | 2,406 | |
| | Tobacco Settlement Financing Corp. New Jersey Revenue | 5.000% | 6/1/29 | | | 1,500 | | 1,836 | |
| | Tobacco Settlement Financing Corp. New Jersey Revenue | 5.000% | 6/1/30 | | | 1,500 | | 1,825 | |
| | Tobacco Settlement Financing Corp. New Jersey Revenue | 5.000% | 6/1/31 | | | 3,500 | | 4,233 | |
| | Tobacco Settlement Financing Corp. New Jersey Revenue | 5.000% | 6/1/32 | | | 2,850 | | 3,428 | |
| | Tobacco Settlement Financing Corp. New Jersey Revenue | 5.000% | 6/1/33 | | | 2,750 | | 3,298 | |
| | Tobacco Settlement Financing Corp. New Jersey Revenue | 5.000% | 6/1/34 | | | 2,000 | | 2,385 | |
| | Tobacco Settlement Financing Corp. New Jersey Revenue | 5.000% | 6/1/35 | | | 2,500 | | 2,972 | |
| | Tobacco Settlement Financing Corp. New Jersey Revenue | 5.000% | 6/1/36 | | | 2,000 | | 2,369 | |
| | Tobacco Settlement Financing Corp. New Jersey Revenue | 4.000% | 6/1/37 | | | 3,000 | | 3,221 | |
| | Tobacco Settlement Financing Corp. New Jersey Revenue | 5.000% | 6/1/37 | | | 2,000 | | 2,360 | |
| | Tobacco Settlement Financing Corp. New Jersey Revenue | 5.000% | 6/1/46 | | | 2,500 | | 2,760 | |
| | Tobacco Settlement Financing Corp. New Jersey Revenue | 5.000% | 6/1/46 | | | 5,000 | | 5,673 | |
| | Tobacco Settlement Financing Corp. New Jersey Revenue | 5.250% | 6/1/46 | | | 13,300 | | 15,410 | |
| | Toms River NJ Board of Education GO | 3.000% | 7/15/29 | | | 1,500 | | 1,580 | |
| | Toms River NJ Board of Education GO | 3.000% | 7/15/30 | | | 1,500 | | 1,572 | |
| | Toms River NJ Board of Education GO | 3.000% | 7/15/31 | | | 1,500 | | 1,567 | |
| | Toms River NJ Board of Education GO | 3.000% | 7/15/32 | | | 1,500 | | 1,558 | |
| | Toms River NJ Board of Education GO | 3.000% | 7/15/33 | | | 2,000 | | 2,073 | |
| | Toms River NJ Board of Education GO | 3.000% | 7/15/38 | | | 2,675 | | 2,719 | |
| | Trenton NJ GO | 5.000% | 7/15/37 | | (4) | 1,055 | | 1,264 | |
| | Trenton NJ GO | 5.000% | 7/15/40 | | (4) | 500 | | 593 | |
| | Union City NJ GO | 5.000% | 11/1/23 | | | 1,060 | | 1,196 | |
| | Union County NJ Improvement Authority Lease Revenue (Family Court Building Project) | 5.000% | 5/1/42 | | | 5,000 | | 5,405 | |
| | Union Township NJ Union City GO | 1.000% | 8/1/32 | | | 1,094 | | 912 | |
| | West Deptford Township NJ GO | 2.000% | 2/15/24 | | | 385 | | 395 | |
| | West Deptford Township NJ GO | 3.000% | 2/15/30 | | | 645 | | 689 | |
| | West Deptford Township NJ GO | 3.000% | 2/15/32 | | | 925 | | 978 | |
| | Woodland Park NJ GO | 3.000% | 7/15/24 | | | 435 | | 467 | |
| | | | | | | | | 2,504,376 | |
New Jersey Long-Term Tax-Exempt Fund
| | | | | | | Face | | Market | |
| | | | Maturity | | | Amount | | Value· | |
| | | Coupon | Date | | | ($000 | ) | ($000 | ) |
| Guam (0.3%) | | | | | | | | |
| | Guam Government Waterworks Authority | �� | | | | | | | |
| | Water & Waste Water System Revenue | 5.500% | 7/1/43 | | | 3,000 | | 3,287 | |
| | Guam Power Authority Revenue | 5.000% | 10/1/27 | | | 1,135 | | 1,273 | |
| | Guam Power Authority Revenue | 5.000% | 10/1/29 | | | 1,355 | | 1,512 | |
| | | | | | | | | 6,072 | |
| Puerto Rico (0.2%) | | | | | | | | |
| | Puerto Rico Sales Tax Financing Corp. Revenue | 0.000% | 7/1/24 | | | 520 | | 455 | |
| | Puerto Rico Sales Tax Financing Corp. Revenue | 0.000% | 7/1/27 | | | 1,204 | | 958 | |
| | Puerto Rico Sales Tax Financing Corp. Revenue | 0.000% | 7/1/29 | | | 1,032 | | 763 | |
| | Puerto Rico Sales Tax Financing Corp. Revenue | 4.329% | 7/1/40 | | | 125 | | 127 | |
| | Puerto Rico Sales Tax Financing Corp. Revenue | 4.329% | 7/1/40 | | | 1,948 | | 1,975 | |
| | Puerto Rico Sales Tax Financing Corp. Revenue | 5.000% | 7/1/58 | | | 335 | | 351 | |
| | | | | | | | | 4,629 | |
| Total Tax-Exempt Municipal Bonds (Cost $2,361,052) | | | | | | 2,515,077 | |
| | | Amount | |
| | | | ($000 | ) |
| Other Assets and Liabilities (-0.7%) | | | | |
| Other Assets | | | | |
| Investment in Vanguard | | | 114 | |
| Receivables for Investment Securities Sold | | | 1,000 | |
| Receivables for Accrued Income | | | 35,698 | |
| Receivables for Capital Shares Issued | | | 681 | |
| Variation Margin Receivable—Futures Contracts | | | 66 | |
| Other Assets | | | 201 | |
| Total Other Assets | | | 37,760 | |
| Liabilities | | | | |
| Payables for Investment Securities Purchased | | | (51,120 | ) |
| Payables for Capital Shares Redeemed | | | (410 | ) |
| Payables for Distributions | | | (1,851 | ) |
| Payables to Vanguard | | | (1,064 | ) |
| Total Liabilities | | | (54,445 | ) |
| Net Assets (100%) | | | 2,498,392 | |
| | | | | |
| At November 30, 2019, net assets consisted of: | | | | |
| | | | Amount | |
| | | | ($000 | ) |
| Paid-in Capital | | | 2,332,473 | |
| Total Distributable Earnings (Loss) | | | 165,919 | |
| Net Assets | | | 2,498,392 | |
| | | | | |
| Investor Shares—Net Assets | | | | |
| Applicable to 23,227,668 outstanding $.001 par value shares of beneficial interest (unlimited authorization) | | | 290,227 | |
| Net Asset Value Per Share—Investor Shares | | | $12.49 | |
New Jersey Long-Term Tax-Exempt Fund
| | | Amount | |
| | | | ($000 | ) |
| Admiral Shares—Net Assets | | | | |
| Applicable to 176,725,724 outstanding $.001 par value shares of beneficial interest (unlimited authorization) | | | 2,208,165 | |
| Net Asset Value Per Share—Admiral Shares | | | $12.49 | |
| • | See Note A in Notes to Financial Statements. |
| | |
| 1 | Security purchased on a when-issued or delayed-delivery basis for which the fund has not taken delivery as of November 30, 2019. |
| | |
| 2 | Security exempt from registration under Rule 144A of the Securities Act of 1933. Such securities may be sold in transactions exempt from registration, normally to qualified institutional buyers. At November 30, 2019, the aggregate value of these securities was $70,775,000, representing 2.8% of net assets. |
| | |
| 3 | Securities with a value of $402,000 have been segregated as initial margin for open futures contracts. |
A key to abbreviations and other references follows the Statement of Net Assets.
See accompanying Notes, which are an integral part of the Financial Statements.
New Jersey Long-Term Tax-Exempt Fund
Key to Abbreviations
ARS—Auction Rate Security.
BAN—Bond Anticipation Note.
CMT—Constant Maturing Treasury Rate.
COP—Certificate of Participation.
CP—Commercial Paper.
FR—Floating Rate.
GAN—Grant Anticipation Note.
GO—General Obligation Bond.
LIBOR—London Interbank Offered Rate.
PILOT—Payments in Lieu of Taxes.
PUT—Put Option Obligation.
RAN—Revenue Anticipation Note.
SIFMA—Securities Industry and Financial Markets Association.
SOFR—Secured Overnight Financing Rate.
TAN—Tax Anticipation Note.
TOB—Tender Option Bond.
TRAN—Tax Revenue Anticipation Note.
VRDO—Variable Rate Demand Obligation.
VRDP—Variable Rate Demand Preferred.
(ETM)—Escrowed to Maturity.
(Prere.)—Prerefunded.
Scheduled principal and interest payments are guaranteed by:
(1) MBIA (Municipal Bond Investors Assurance).
(2) AMBAC (Ambac Assurance Corporation).
(3) FGIC (Financial Guaranty Insurance Company).
(4) AGM (Assured Guaranty Municipal Corporation).
(5) BIGI (Bond Investors Guaranty Insurance).
(6) Connie Lee Inc.
(7) FHA (Federal Housing Authority).
(8) CapMAC (Capital Markets Assurance Corporation).
(9) American Capital Access Financial Guaranty Corporation.
(10) XL Capital Assurance Inc.
(11) CIFG (CDC IXIS Financial Guaranty).
(12) AGC (Assured Guaranty Corporation).
(13) BHAC (Berkshire Hathaway Assurance Corporation).
(14) NPFG (National Public Finance Guarantee Corporation).
(15) BAM (Build America Mutual Assurance Company).
(16) MAC (Municipal Assurance Corporation).
(17) RAA (Radian Asset Assurance Inc.).
(18) SBLF (Michigan School Bond Loan Fund).
(19)TPSF (Texas Permanent School Fund).
The insurance does not guarantee the market value of the municipal bonds.
LOC—Scheduled principal and interest payments are guaranteed by bank letter of credit.
New Jersey Long-Term Tax-Exempt Fund
| Derivative Financial Instruments Outstanding as of Period End | | | | | | |
| | | | | | | | | | | | | |
| Futures Contracts | | | | | | | | | | | | | | | | |
| | | | | | | | | | | | ($000 | ) |
| | | | | | | | | | | | | | | | Value and | |
| | | | | | | | Number of | | | | | | | | Unrealized | |
| | | | | | | | Long (Short | ) | | | Notional | | | | Appreciation | |
| | | | Expiration | | | | Contracts | | | | Amount | | | | (Depreciation | ) |
| Long Futures Contracts | | | | | | | | | | | | | | | | |
| 2-Year U.S. Treasury Note | | | March 2020 | | | | 276 | | | | 59,502 | | | | (31 | ) |
| 5-Year U.S. Treasury Note | | | March 2020 | | | | 94 | | | | 11,183 | | | | (10 | ) |
| | | | | | | | | | | | | | | | (41 | ) |
| | | | | | | | | | | | | | | | | |
| Short Futures Contracts | | | | | | | | | | | | | | | | |
| Ultra 10-Year U.S. Treasury Note | | | March 2020 | | | | (135 | ) | | | (19,200 | ) | | | 44 | |
| 10-Year U.S. Treasury Note | | | March 2020 | | | | (43 | ) | | | (5,562 | ) | | | 11 | |
| Ultra Long U.S. Treasury Bond | | | March 2020 | | | | (16 | ) | | | (3,004 | ) | | | 1 | |
| | | | | | | | | | | | | | | | 56 | |
| | | | | | | | | | | | | | | | 15 | |
See accompanying Notes, which are an integral part of the Financial Statements.
New Jersey Long-Term Tax-Exempt Fund
Statement of Operations
| | | Year Ended | |
| | | November 30, 2019 | |
| | | | ($000) | |
| Investment Income | | | | |
| Income | | | | |
| Interest | | | 80,475 | |
| Total Income | | | 80,475 | |
| Expenses | | | | |
| The Vanguard Group—Note B | | | | |
| Investment Advisory Services | | | 324 | |
| Management and Administrative—Investor Shares | | | 339 | |
| Management and Administrative—Admiral Shares | | | 1,412 | |
| Marketing and Distribution—Investor Shares | | | 34 | |
| Marketing and Distribution—Admiral Shares | | | 94 | |
| Custodian Fees | | | 13 | |
| Auditing Fees | | | 34 | |
| Shareholders’ Reports—Investor Shares | | | 31 | |
| Shareholders’ Reports—Admiral Shares | | | 35 | |
| Trustees’ Fees and Expenses | | | 1 | |
| Total Expenses | | | 2,317 | |
| Expenses Paid Indirectly | | | (12) | |
| Net Expenses | | | 2,305 | |
| Net Investment Income | | | 78,170 | |
| Realized Net Gain (Loss) | | | | |
| Investment Securities Sold | | | 14,482 | |
| Futures Contracts | | | (1,764) | |
| Realized Net Gain (Loss) | | | 12,718 | |
| Change in Unrealized Appreciation (Depreciation) | | | | |
| Investment Securities | | | 129,314 | |
| Futures Contracts | | | 23 | |
| Change in Unrealized Appreciation (Depreciation) | | | 129,337 | |
| Net Increase (Decrease) in Net Assets Resulting from Operations | | | 220,225 | |
See accompanying Notes, which are an integral part of the Financial Statements.
New Jersey Long-Term Tax-Exempt Fund
Statement of Changes in Net Assets
| | | Year Ended November 30, | |
| | | 2019 | | | 2018 | |
| | | | ($000) | | | | ($000) | |
| Increase (Decrease) in Net Assets | | | | | | | | |
| Operations | | | | | | | | |
| Net Investment Income | | | 78,170 | | | | 75,756 | |
| Realized Net Gain (Loss) | | | 12,718 | | | | 9,451 | |
| Change in Unrealized Appreciation (Depreciation) | | | 129,337 | | | | (53,109) | |
| Net Increase (Decrease) in Net Assets Resulting from Operations | | | 220,225 | | | | 32,098 | |
| Distributions | | | | | | | | |
| Net Investment Income | | | | | | | | |
| Investor Shares | | | (8,559 | ) | | | (8,278) | |
| Admiral Shares | | | (69,641 | ) | | | (67,557) | |
| Realized Capital Gain1 | | | | | | | | |
| Investor Shares | | | (908 | ) | | | (1,291) | |
| Admiral Shares | | | (7,435 | ) | | | (10,355) | |
| Total Distributions | | | (86,543 | ) | | | (87,481) | |
| Capital Share Transactions | | | | | | | | |
| Investor Shares | | | 46,437 | | | | 289 | |
| Admiral Shares | | | 224,674 | | | | 38,927 | |
| Net Increase (Decrease) from Capital Share Transactions | | | 271,111 | | | | 39,216 | |
| Total Increase (Decrease) | | | 404,793 | | | | (16,167) | |
| Net Assets | | | | | | | | |
| Beginning of Period | | | 2,093,599 | | | | 2,109,766 | |
| End of Period | | | 2,498,392 | | | | 2,093,599 | |
| 1 | Includes fiscal 2019 and 2018 short-term gain distributions totaling $89,000 and $819,000, respectively. Short-term gain distributions are treated as ordinary income dividends for tax purposes. |
See accompanying Notes, which are an integral part of the Financial Statements.
New Jersey Long-Term Tax-Exempt Fund
Financial Highlights
| Investor Shares | | | | | | | | | | | | | | | |
| | | | | | | | | | | | | | | | |
| For a Share Outstanding | | | | | | | | Year Ended November 30, | |
| Throughout Each Period | | 2019 | | | 2018 | | | 2017 | | | 2016 | | | 2015 | |
| Net Asset Value, Beginning of Period | | $11.78 | | | $12.09 | | | $11.69 | | | $12.00 | | | $12.22 | |
| Investment Operations | | | | | | | | | | | | | | | |
| Net Investment Income | | .40 | 21 | | .41 | 91 | | .42 | 51 | | .43 | 0 | | .42 | 7 |
| Net Realized and Unrealized Gain (Loss) on Investments | | .75 | 8 | | (.24 | 2) | | .49 | 4 | | (.28 | 9) | | (.16 | 7) |
| Total from Investment Operations | | 1.16 | 0 | | .17 | 7 | | .91 | 9 | | .14 | 1 | | .26 | 0 |
| Distributions | | | | | | | | | | | | | | | |
| Dividends from Net Investment Income | | (.40 | 3) | | (.42 | 0) | | (.42 | 2) | | (.43 | 0) | | (.42 | 7) |
| Distributions from Realized Capital Gains | | (.04 | 7) | | (.06 | 7) | | (.09 | 7) | | (.02 | 1) | | (.05 | 3) |
| Total Distributions | | (.45 | 0) | | (.48 | 7) | | (.51 | 9) | | (.45 | 1) | | (.48 | 0) |
| Net Asset Value, End of Period | | $12.49 | | | $11.78 | | | $12.09 | | | $11.69 | | | $12.00 | |
| | | | | | | | | | | | | | | | |
| Total Return2 | | 10.00% | | | 1.49% | | | 8.03% | | | 1.06% | | | 2.17% | |
| | | | | | | | | | | | | | | | |
| Ratios/Supplemental Data | | | | | | | | | | | | | | | |
| Net Assets, End of Period (Millions) | | $290 | | | $229 | | | $235 | | | $234 | | | $241 | |
| Ratio of Total Expenses to Average Net Assets | | 0.17% | | | 0.17% | | | 0.19% | | | 0.19% | | | 0.20% | |
| Ratio of Net Investment Income to | | | | | | | | | | | | | | | |
| Average Net Assets | | 3.28% | | | 3.53% | | | 3.57% | | | 3.50% | | | 3.54% | |
| Portfolio Turnover Rate | | 12% | | | 19% | | | 19% | | | 19% | | | 25% | |
| 1 | Calculated based on average shares outstanding. |
| | | |
| 2 | Total returns do not include account service fees that may have applied in the periods shown. Fund prospectuses provide information about any applicable account service fees. |
See accompanying Notes, which are an integral part of the Financial Statements.
New Jersey Long-Term Tax-Exempt Fund
Financial Highlights
| Admiral Shares | | | | | | | | | | | | | | | |
| | | | | | | | | | | | | | | | |
| For a Share Outstanding | | Year Ended November 30, | |
| Throughout Each Period | | 2019 | | | 2018 | | | 2017 | | | 2016 | | | 2015 | |
| Net Asset Value, Beginning of Period | | $11.78 | | | $12.09 | | | $11.69 | | | $12.00 | | | $12.22 | |
| Investment Operations | | | | | | | | | | | | | | | |
| Net Investment Income | | .41 | 31 | | .42 | 91 | | .43 | 71 | | .44 | 3 | | .43 | 6 |
| Net Realized and Unrealized Gain (Loss) on Investments | | .75 | 7 | | (.24 | 2) | | .49 | 4 | | (.28 | 9) | | (.16 | 7) |
| Total from Investment Operations | | 1.17 | 0 | | .18 | 7 | | .93 | 1 | | .15 | 4 | | .26 | 9 |
| Distributions | | | | | | | | | | | | | | | |
| Dividends from Net Investment Income | | (.41 | 3) | | (.43 | 0) | | (.43 | 4) | | (.44 | 3) | | (.43 | 6) |
| Distributions from Realized Capital Gains | | (.04 | 7) | | (.06 | 7) | | (.09 | 7) | | (.02 | 1) | | (.05 | 3) |
| Total Distributions | | (.46 | 0) | | (.49 | 7) | | (.53 | 1) | | (.46 | 4) | | (.48 | 9) |
| Net Asset Value, End of Period | | $12.49 | | | $11.78 | | | $12.09 | | | $11.69 | | | $12.00 | |
| | | | | | | | | | | | | | | | |
| Total Return2 | | 10.09% | | | 1.57% | | | 8.14% | | | 1.16% | | | 2.25% | |
| | | | | | | | | | | | | | | | |
| Ratios/Supplemental Data | | | | | | | | | | | | | | | |
| Net Assets, End of Period (Millions) | | $2,208 | | | $1,865 | | | $1,875 | | | $1,742 | | | $1,738 | |
| Ratio of Total Expenses to Average Net Assets | | 0.09% | | | 0.09% | | | 0.09% | | | 0.09% | | | 0.12% | |
| Ratio of Net Investment Income to | | | | | | | | | | | | | | | |
| Average Net Assets | | 3.36% | | | 3.61% | | | 3.67% | | | 3.60% | | | 3.62% | |
| Portfolio Turnover Rate | | 12% | | | 19% | | | 19% | | | 19% | | | 25% | |
| 1 | Calculated based on average shares outstanding. |
| 2 | Total returns do not include account service fees that may have applied in the periods shown. Fund prospectuses provide information about any applicable account service fees. |
See accompanying Notes, which are an integral part of the Financial Statements.
New Jersey Long-Term Tax-Exempt Fund
Notes to Financial Statements
Vanguard New Jersey Long-Term Tax-Exempt Fund is registered under the Investment Company Act of 1940 as an open-end investment company, or mutual fund. The fund invests in debt instruments of municipal issuers whose ability to meet their obligations may be affected by economic and political developments in the state. The fund offers two classes of shares: Investor Shares and Admiral Shares. Each of the share classes has different eligibility and minimum purchase requirements, and is designed for different types of investors.
A. The following significant accounting policies conform to generally accepted accounting principles for U.S. investment companies. The fund consistently follows such policies in preparing its financial statements.
1. Security Valuation: Securities are valued as of the close of trading on the New York Stock Exchange (generally 4 p.m., Eastern time) on the valuation date. Bonds and temporary cash investments are valued using the latest bid prices or using valuations based on a matrix system (which considers such factors as security prices, yields, maturities, and ratings), both as furnished by independent pricing services. Securities for which market quotations are not readily available, or whose values have been affected by events occurring before the fund’s pricing time but after the close of the securities’ primary markets, are valued by methods deemed by the board of trustees to represent fair value.
2. Futures Contracts: The fund uses futures contracts to invest in fixed income asset classes with greater efficiency and lower cost than is possible through direct investment, to add value when these instruments are attractively priced, or to adjust sensitivity to changes in interest rates. The primary risks associated with the use of futures contracts are imperfect correlation between changes in market values of bonds held by the fund and the prices of futures contracts, and the possibility of an illiquid market. Counterparty risk involving futures is mitigated because a regulated clearinghouse is the counterparty instead of the clearing broker. To further mitigate counterparty risk, the fund trades futures contracts on an exchange, monitors the financial strength of its clearing brokers and clearinghouse, and has entered into clearing agreements with its clearing brokers. The clearinghouse imposes initial margin requirements to secure the fund’s performance and requires daily settlement of variation margin representing changes in the market value of each contract. Any assets pledged as initial margin for open contracts are noted in the Statement of Net Assets.
Futures contracts are valued at their quoted daily settlement prices. The notional amounts of the contracts are not recorded in the Statement of Net Assets. Fluctuations in the value of the contracts are recorded in the Statement of Net Assets as an asset (liability) and in the Statement of Operations as unrealized appreciation (depreciation) until the contracts are closed, when they are recorded as realized futures gains (losses).
During the year ended November 30, 2019, the fund’s average investments in long and short futures contracts represented 6% and 3% of net assets, respectively, based on the average of the notional amounts at each quarter-end during the period.
3. Federal Income Taxes: The fund intends to continue to qualify as a regulated investment company and distribute all of its income. Management has analyzed the fund’s tax positions taken for all open federal income tax years (November 30, 2016–2019), and has concluded that no provision for federal income tax is required in the fund’s financial statements.
4. Distributions: Distributions from net investment income are declared daily and paid on the first business day of the following month. Annual distributions from realized capital gains, if any, are recorded on the ex-dividend date. Distributions are determined on a tax basis and may differ from net investment income and realized capital gains for financial reporting purposes.
New Jersey Long-Term Tax-Exempt Fund
5. Credit Facility: The fund and certain other funds managed by The Vanguard Group (“Vanguard”) participate in a $4.3 billion committed credit facility provided by a syndicate of lenders pursuant to a credit agreement that may be renewed annually; each fund is individually liable for its borrowings, if any, under the credit facility. Borrowings may be utilized for temporary and emergency purposes, and are subject to the fund’s regulatory and contractual borrowing restrictions. The participating funds are charged administrative fees and an annual commitment fee of 0.10% of the undrawn amount of the facility; these fees are allocated to the funds based on a method approved by the fund’s board of trustees and included in Management and Administrative expenses on the fund’s Statement of Operations. Any borrowings under this facility bear interest at a rate based upon the higher of the one-month London Interbank Offered Rate, federal funds effective rate, or overnight bank funding rate plus an agreed-upon spread.
The fund had no borrowings outstanding at November 30, 2019, or at any time during the period then ended.
6. Other: Interest income is accrued daily. Premiums and discounts on debt securities purchased are amortized and accreted, respectively, to interest income over the lives of the respective securities. Security transactions are accounted for on the date securities are bought or sold. Costs used to determine realized gains (losses) on the sale of investment securities are those of the specific securities sold.
Each class of shares has equal rights as to assets and earnings, except that each class separately bears certain class-specific expenses related to maintenance of shareholder accounts (included in Management and Administrative expenses) and shareholder reporting. Marketing and distribution expenses are allocated to each class of shares based on a method approved by the board of trustees. Income, other non-class-specific expenses, and gains and losses on investments are allocated to each class of shares based on its relative net assets.
B. In accordance with the terms of a Funds’ Service Agreement (the “FSA”) between Vanguard and the fund, Vanguard furnishes to the fund investment advisory, corporate management, administrative, marketing, and distribution services at Vanguard’s cost of operations (as defined by the FSA). These costs of operations are allocated to the fund based on methods and guidelines approved by the board of trustees. Vanguard does not require reimbursement in the current period for certain costs of operations (such as deferred compensation/benefits and risk/insurance costs); the fund’s liability for these costs of operations is included in Payables to Vanguard on the Statement of Net Assets. All other costs of operations payable to Vanguard are generally settled twice a month.
Upon the request of Vanguard, the fund may invest up to 0.40% of its net assets as capital in Vanguard. At November 30, 2019, the fund had contributed to Vanguard capital in the amount of $114,000, representing less than 0.01% of the fund’s net assets and 0.05% of Vanguard’s capital received pursuant to the FSA. The fund’s trustees and officers are also directors and employees, respectively, of Vanguard.
C. The fund’s custodian bank has agreed to reduce its fees when the fund maintains cash on deposit in the non-interest-bearing custody account. For the year ended November 30, 2019, custodian fee offset arrangements reduced the fund’s expenses by $12,000 (an annual rate of less than 0.01% of average net assets).
New Jersey Long-Term Tax-Exempt Fund
D. Various inputs may be used to determine the value of the fund’s investments. These inputs are summarized in three broad levels for financial statement purposes. The inputs or methodologies used to value securities are not necessarily an indication of the risk associated with investing in those securities.
Level 1—Quoted prices in active markets for identical securities.
Level 2—Other significant observable inputs (including quoted prices for similar securities, interest rates, prepayment speeds, credit risk, etc.).
Level 3—Significant unobservable inputs (including the fund’s own assumptions used to determine the fair value of investments). Any investments valued with significant unobservable inputs are noted on the Statement of Net Assets.
The following table summarizes the market value of the fund’s investments and derivatives as of November 30, 2019, based on the inputs used to value them:
| | Level 1 | Level 2 | Level 3 |
| Investments | ($000) | ($000) | ($000) |
| Tax-Exempt Municipal Bonds | — | 2,515,077 | — |
| Futures Contracts—Assets1 | 66 | — | — |
| Total | 66 | 2,515,077 | — |
1 Represents variation margin on the last day of the reporting period.
E. Permanent differences between book-basis and tax-basis components of net assets are reclassified among capital accounts in the financial statements to reflect their tax character. These reclassifications have no effect on net assets or net asset value per share. As of period end, permanent differences primarily attributable to the accounting for distributions in connection with fund share redemptions were reclassified between the following accounts:
| | Amount |
| | ($000) |
| Paid-in Capital | 397 |
| Total Distributable Earnings (Loss) | (397) |
Temporary differences between book-basis and tax-basis components of total distributable earnings (loss) arise when certain items of income, gain, or loss are recognized in different periods for financial statement and tax purposes; these differences will reverse at some time in the future. The differences are primarily related to the tax deferral of losses on wash sales and straddles; the realization of unrealized gains or losses on certain futures contracts; and payables for distributions. As of period end, the tax-basis components of total distributable earnings (loss) are detailed in the table as follows:
| | Amount |
| | ($000) |
| Undistributed Ordinary Income | 1,498 |
| Undistributed Tax-Exempt Income | 2,817 |
| Undistributed Long-Term Gains | 12,861 |
| Capital Loss Carryforwards (Non-expiring) | — |
| Net Unrealized Gains (Losses) | 151,542 |
New Jersey Long-Term Tax-Exempt Fund
As of November 30, 2019, gross unrealized appreciation and depreciation for investments and derivatives based on cost for U.S. federal income tax purposes were as follows:
| | Amount |
| | ($000) |
| Tax Cost | 2,363,535 |
| Gross Unrealized Appreciation | 152,105 |
| Gross Unrealized Depreciation | (563) |
| Net Unrealized Appreciation (Depreciation) | 151,542 |
F. During the year ended November 30, 2019, the fund purchased $530,755,000 of investment securities and sold $270,532,000 of investment securities, other than U.S. government securities and temporary cash investments.
The fund purchased securities from and sold securities to other Vanguard funds or accounts managed by Vanguard or its affiliates, in accordance with procedures adopted by the board of trustees in compliance with Rule 17a-7 of the Investment Company Act of 1940. For the year ended November 30, 2019, such purchases and sales were $231,399,000 and $253,950,000, respectively; these amounts are included in the purchases and sales of investment securities noted above.
G. Capital share transactions for each class of shares were:
| | | Year Ended November 30, | |
| | | 2019 | | | 2018 | |
| | | Amount | | | Shares | | | Amount | | | Shares | |
| | | | ($000) | | | | (000) | | | | ($000) | | | | (000) | |
| Investor Shares | | | | | | | | | | | | | | | | |
| Issued | | | 99,631 | | | | 8,139 | | | | 60,864 | | | | 5,111 | |
| Issued in Lieu of Cash Distributions | | | 7,830 | | | | 640 | | | | 7,770 | | | | 652 | |
| Redeemed | | | (61,024) | | | | (4,993) | | | | (68,345) | | | | (5,754) | |
| Net Increase (Decrease)—Investor Shares | | | 46,437 | | | | 3,786 | | | | 289 | | | | 9 | |
| Admiral Shares | | | | | | | | | | | | | | | | |
| Issued | | | 384,692 | | | | 31,557 | | | | 238,561 | | | | 20,065 | |
| Issued in Lieu of Cash Distributions | | | 53,692 | | | | 4,389 | | | | 55,011 | | | | 4,616 | |
| Redeemed | | | (213,710) | | | | (17,490) | | | | (254,645) | | | | (21,427) | |
| Net Increase (Decrease)—Admiral Shares | | | 224,674 | | | | 18,456 | | | | 38,927 | | | | 3,254 | |
H. Management has determined that no events or transactions occurred subsequent to November 30, 2019, that would require recognition or disclosure in these financial statements.
Report of Independent Registered Public Accounting Firm
To the Board of Trustees of Vanguard New Jersey Tax-Free Funds and Shareholders of Vanguard New Jersey Municipal Money Market Fund and Vanguard New Jersey Long-Term Tax-Exempt Fund
Opinions on the Financial Statements
We have audited the accompanying statements of net assets of Vanguard New Jersey Municipal Money Market Fund and Vanguard New Jersey Long-Term Tax-Exempt Fund (constituting Vanguard New Jersey Tax-Free Funds, hereafter collectively referred to as the “Funds”) as of November 30, 2019, the related statements of operations for the year ended November 30, 2019, the statements of changes in net assets for each of the two years in the period ended November 30, 2019, including the related notes, and the financial highlights for each of the five years in the period ended November 30, 2019 (collectively referred to as the “financial statements”). In our opinion, the financial statements present fairly, in all material respects, the financial position of each of the Funds as of November 30, 2019, the results of each of their operations for the year then ended, the changes in each of their net assets for each of the two years in the period ended November 30, 2019 and each of the financial highlights for each of the five years in the period ended November 30, 2019 in conformity with accounting principles generally accepted in the United States of America.
Basis for Opinions
These financial statements are the responsibility of the Funds’ management. Our responsibility is to express an opinion on the Funds’ financial statements based on our audits. We are a public accounting firm registered with the Public Company Accounting Oversight Board (United States) (“PCAOB”) and are required to be independent with respect to the Funds in accordance with the U.S. federal securities laws and the applicable rules and regulations of the Securities and Exchange Commission and the PCAOB.
We conducted our audits of these financial statements in accordance with the standards of the PCAOB. Those standards require that we plan and perform the audit to obtain reasonable assurance about whether the financial statements are free of material misstatement, whether due to error or fraud.
Our audits included performing procedures to assess the risks of material misstatement of the financial statements, whether due to error or fraud, and performing procedures that respond to those risks. Such procedures included examining, on a test basis, evidence regarding the amounts and disclosures in the financial statements. Our audits also included evaluating the accounting principles used and significant estimates made by management, as well as evaluating the overall presentation of the financial statements. Our procedures included confirmation of securities owned as of November 30, 2019 by correspondence with the custodian and brokers; when replies were not received from brokers, we performed other auditing procedures. We believe that our audits provide a reasonable basis for our opinions.
/s/PricewaterhouseCoopers LLP
Philadelphia, Pennsylvania
January 16, 2020
We have served as the auditor of one or more investment companies in The Vanguard Group of Funds since 1975.
Special 2019 tax information (unaudited) for Vanguard New Jersey Tax-Exempt Funds
This information for the fiscal year ended November 30, 2019, is included pursuant to provisions of the Internal Revenue Code.
The Long-Term Tax- Exempt Fund distributed $8,610,000 as capital gain dividends (20% rate gain distributions) to shareholders during the fiscal year.
For nonresident alien shareholders, 100% of short-term capital gain dividends distributed by the Long-Term Tax-Exempt Fund are qualified short-term capital gains.
Each fund designates 100% of its income dividends as exempt-interest dividends.
BLOOMBERG is a trademark and service mark of Bloomberg Finance L.P. BARCLAYS is a trademark and service mark of Barclays Bank Plc, used under license. Bloomberg Finance L.P. and its affiliates, including Bloomberg Index Services Limited (BISL) (collectively, Bloomberg), or Bloomberg’s licensors, own all proprietary rights in the Bloomberg Barclays NJ Municipal Bond Index (Index or Bloomberg Barclays Index).
Neither Barclays Bank Plc, Barclays Capital Inc., or any affiliate (collectively Barclays) or Bloomberg is the issuer or producer of the New Jersey Long-Term Tax-Exempt Fund and neither Bloomberg nor Barclays has any responsibilities, obligations or duties to investors in the New Jersey Long-Term Tax-Exempt Fund. The Index is licensed for use by The Vanguard Group, Inc. (Vanguard) as the sponsor of the New Jersey Long-Term Tax-Exempt Fund. Bloomberg and Barclays’ only relationship with Vanguard in respect of the Index is the licensing of the Index, which is determined, composed and calculated by BISL, or any successor thereto, without regard to the Issuer or the New Jersey Long-Term Tax-Exempt Fund or the owners of the New Jersey Long-Term Tax-Exempt Fund.
Additionally, Vanguard may for itself execute transaction(s) with Barclays in or relating to the Index in connection with the New Jersey Long-Term Tax-Exempt Fund. Investors acquire the New Jersey Long-Term Tax-Exempt Fund from Vanguard and investors neither acquire any interest in the Index nor enter into any relationship of any kind whatsoever with Bloomberg or Barclays upon making an investment in the New Jersey Long-Term Tax-Exempt Fund. The New Jersey Long-Term Tax-Exempt Fund is not sponsored, endorsed, sold or promoted by Bloomberg or Barclays. Neither Bloomberg nor Barclays makes any representation or warranty, express or implied regarding the advisability of investing in the New Jersey Long-Term Tax-Exempt Fund or the advisability of investing in securities generally or the ability of the Index to track corresponding or relative market performance. Neither Bloomberg nor Barclays has passed on the legality or suitability of the New Jersey Long-Term Tax-Exempt Fund with respect to any person or entity. Neither Bloomberg nor Barclays is responsible for and has not participated in the determination of the timing of, prices at, or quantities of the New Jersey Long-Term Tax-Exempt Fund to be issued. Neither Bloomberg nor Barclays has any obligation to take the needs of the Issuer or the owners of the New Jersey Long-Term Tax-Exempt Fund or any other third party into consideration in determining, composing or calculating the Index. Neither Bloomberg nor Barclays has any obligation or liability in connection with administration, marketing or trading of the New Jersey Long-Term Tax-Exempt Fund.
The licensing agreement between Bloomberg and Barclays is solely for the benefit of Bloomberg and Barclays and not for the benefit of the owners of the New Jersey Long-Term Tax-Exempt Fund, investors or other third parties. In addition, the licensing agreement between Vanguard and Bloomberg is solely for the benefit of Vanguard and Bloomberg and not for the benefit of the owners of the New Jersey Long-Term Tax-Exempt Fund, investors or other third parties.
NEITHER BLOOMBERG NOR BARCLAYS SHALL HAVE ANY LIABILITY TO THE ISSUER, INVESTORS OR TO OTHER THIRD PARTIES FOR THE QUALITY, ACCURACY AND/OR COMPLETENESS OF THE BLOOMBERG BARCLAYS INDEX OR ANY DATA INCLUDED THEREIN OR FOR INTERRUPTIONS IN THE DELIVERY OF THE BLOOMBERG BARCLAYS INDEX. NEITHER BLOOMBERG NOR BARCLAYS MAKES ANY WARRANTY, EXPRESS OR IMPLIED, AS TO RESULTS TO BE OBTAINED BY THE ISSUER, THE INVESTORS OR ANY OTHER PERSON OR ENTITY FROM THE USE OF THE BLOOMBERG BARCLAYS INDEX OR ANY DATA INCLUDED THEREIN. NEITHER BLOOMBERG NOR BARCLAYS MAKES ANY EXPRESS OR IMPLIED WARRANTIES, AND EACH HEREBY EXPRESSLY DISCLAIMS ALL WARRANTIES OF MERCHANTABILITY OR FITNESS FOR A PARTICULAR PURPOSE OR USE WITH RESPECT TO THE BLOOMBERG BARCLAYS INDEX OR ANY DATA INCLUDED THEREIN. BLOOMBERG RESERVES THE RIGHT TO CHANGE THE METHODS OF CALCULATION OR PUBLICATION, OR TO CEASE THE CALCULATION OR PUBLICATION OF THE BLOOMBERG BARCLAYS INDEX, AND NEITHER BLOOMBERG NOR BARCLAYS SHALL BE LIABLE FOR ANY MISCALCULATION OF OR ANY INCORRECT, DELAYED OR INTERRUPTED PUBLICATION WITH RESPECT TO ANY OF THE BLOOMBERG BARCLAYS INDEX. NEITHER BLOOMBERG NOR BARCLAYS SHALL BE LIABLE FOR ANY DAMAGES, INCLUDING, WITHOUT LIMITATION, ANY SPECIAL, INDIRECT OR CONSEQUENTIAL DAMAGES, OR ANY LOST PROFITS AND EVEN IF ADVISED OF THE POSSIBILITY OF SUCH, RESULTING FROM THE USE OF THE BLOOMBERG BARCLAYS INDEX OR ANY DATA INCLUDED THEREIN OR WITH RESPECT TO THE NEW JERSEY LONG-TERM TAX-EXEMPT FUND.
None of the information supplied by Bloomberg or Barclays and used in this publication may be reproduced in any manner without the prior written permission of both Bloomberg and Barclays Capital, the investment banking division of Barclays Bank Plc. Barclays Bank Plc is registered in England No. 1026167. Registered office 1 Churchill Place London E14 5HP.
© 2020 Bloomberg. Used with Permission.
Source: Bloomberg Index Services Limited. Copyright 2020, Bloomberg. All rights reserved.
This page intentionally left blank.
This page intentionally left blank.
The People Who Govern Your Fund
The trustees of your mutual fund are there to see that the fund is operated and managed in your best interests since, as a shareholder, you are a part owner of the fund. Your fund’s trustees also serve on the board of directors of The Vanguard Group, Inc., which is owned by the Vanguard funds and provides services to them.
A majority of Vanguard’s board members are independent, meaning that they have no affiliation with Vanguard or the funds they oversee, apart from the sizable personal investments they have made as private individuals. The independent board members have distinguished backgrounds in business, academia, and public service. Each of the trustees and executive officers oversees 213 Vanguard funds.
Information for each trustee and executive officer of the fund appears below. That information, as well as the Vanguard fund count, is as of the date on the cover of this fund report. The mailing address of the trustees and officers is P.O. Box 876, Valley Forge, PA 19482. More information about the trustees is in theStatement of Additional Information, which can be obtained, without charge, by contacting Vanguard at 800-662-7447, or online at vanguard.com.
Interested Trustee1
Mortimer J. Buckley
Born in 1969. Trustee since January 2018. Principal occupation(s) during the past five years and other experience: chairman of the board (January 2019–present) of Vanguard and of each of the investment companies served by Vanguard; chief executive officer (January 2018–present) of Vanguard; chief executive officer, president, and trustee (January 2018–present) of each of the investment companies served by Vanguard; president and director (2017–present) of Vanguard; and president (February 2018–present) of Vanguard Marketing Corporation. Chief investment officer (2013–2017), managing director (2002–2017), head of the Retail Investor Group (2006–2012), and chief information officer (2001–2006) of Vanguard. Chairman of the board (2011–2017) and trustee (2009–2017) of the Children’s Hospital of Philadelphia; trustee (2018–present) of The Shipley School.
Independent Trustees
Emerson U. Fullwood
Born in 1948. Trustee since January 2008. Principal occupation(s) during the past five years and other experience: executive chief staff and marketing officer for North America and corporate vice president (retired 2008) of Xerox Corporation (document management products and services). Former president of the Worldwide Channels Group, Latin America, and Worldwide Customer Service and executive chief staff officer of Developing Markets of Xerox. Executive in residence and 2009–2010 Distinguished Minett Professor at the Rochester Institute of Technology. Director of SPX FLOW, Inc. (multi-industry manufacturing). Director of the University of Rochester Medical Center, the Monroe Community College Foundation, the United Way of Rochester, North Carolina A&T University, and Roberts Wesleyan College. Trustee of the University of Rochester.
Amy Gutmann
Born in 1949. Trustee since June 2006. Principal occupation(s) during the past five years and other experience: president (2004–present) of the University of Pennsylvania. Christopher H. Browne Distinguished Professor of Political Science, School of Arts and Sciences, and professor of communication, Annenberg School for Communication, with secondary faculty appointments in the Department of Philosophy, School of Arts and Sciences, and at the Graduate School of Education, University of Pennsylvania. Trustee of the National Constitution Center.
F. Joseph Loughrey
Born in 1949. Trustee since October 2009. Principal occupation(s) during the past five years and other experience: president and chief operating officer (retired 2009) and vice chairman of the board (2008–2009) of Cummins Inc. (industrial machinery). Chairman of the board of Hillenbrand, Inc. (specialized consumer services), and the Lumina Foundation.
| 1 | Mr. Buckley is considered an “interested person,” as defined in the Investment Company Act of 1940, because he is an officer of the Vanguard funds. |
Director of the V Foundation and Oxfam America. Member of the advisory council for the College of Arts and Letters and chair of the advisory board to the Kellogg Institute for International Studies, both at the University of Notre Dame.
Mark Loughridge
Born in 1953. Trustee since March 2012. Principal occupation(s) during the past five years and other experience: senior vice president and chief financial officer (retired 2013) of IBM (information technology services). Fiduciary member of IBM’s Retirement Plan Committee (2004–2013), senior vice president and general manager (2002–2004) of IBM Global Financing, vice president and controller (1998–2002) of IBM, and a variety of other prior management roles at IBM. Member of the Council on Chicago Booth.
Scott C. Malpass
Born in 1962. Trustee since March 2012. Principal occupation(s) during the past five years and other experience: chief investment officer (1989–present) and vice president (1996–present) of the University of Notre Dame. Assistant professor of finance at the Mendoza College of Business, University of Notre Dame, and member of the Notre Dame 403(b) Investment Committee. Chairman of the board of TIFF Advisory Services, Inc. Member of the board of Catholic Investment Services, Inc. (investment advisors) and the board of superintendence of the Institute for the Works of Religion.
Deanna Mulligan
Born in 1963. Trustee since January 2018. Principal occupation(s) during the past five years and other experience: president (2010–present) and chief executive officer (2011–present) of The Guardian Life Insurance Company of America. Chief operating officer (2010–2011) and executive vice president (2008–2010) of Individual Life and Disability of The Guardian Life Insurance Company of America. Member of the board of The Guardian Life Insurance Company of America, the American Council of Life Insurers, the Partnership for New York City (business leadership), and the Committee Encouraging Corporate Philanthropy. Trustee of the Economic Club of New York and the Bruce Museum (arts and science). Member of the Advisory Council for the Stanford Graduate School of Business.
André F. Perold
Born in 1952. Trustee since December 2004. Principal occupation(s) during the past five years and other experience: George Gund Professor of Finance and Banking, Emeritus at the Harvard Business School (retired 2011). Chief investment officer and co-managing partner of HighVista Strategies (private investment firm). Board of advisors and investment committee member of the Museum of Fine Arts Boston. Board member (2018–present) of RIT Capital Partners (investment firm); investment committee member of Partners Health Care System.
Sarah Bloom Raskin
Born in 1961. Trustee since January 2018. Principal occupation(s) during the past five years and other experience: deputy secretary (2014–2017) of the United States Department of the Treasury. Governor (2010–2014) of the Federal Reserve Board. Commissioner (2007–2010) of financial regulation for the State of Maryland. Member of the board of directors (2012–2014) of Neighborhood Reinvestment Corporation. Director (2017–present) of i(x) Investments; director (2017–present) of Reserve Trust. Rubinstein Fellow (2017–present) of Duke University; trustee (2017–present) of Amherst College.
Peter F. Volanakis
Born in 1955. Trustee since July 2009. Principal occupation(s) during the past five years and other experience: president and chief operating officer (retired 2010) of Corning Incorporated (communications equipment) and director of Corning Incorporated (2000–2010) and Dow Corning (2001–2010). Director (2012) of SPX Corporation (multi-industry manufacturing). Overseer of the Amos Tuck School of Business Administration, Dartmouth College (2001–2013). Chairman of the board of trustees of Colby-Sawyer College. Member of the board of Hypertherm Inc. (industrial cutting systems, software, and consumables).
Executive Officers
John Bendl
Born in 1970. Principal occupation(s) during the past five years and other experience: principal of Vanguard. Chief financial officer (October 2019–present) of each of the investment companies served by Vanguard. Chief accounting officer, treasurer, and controller of Vanguard (2017–present). Partner (2003–2016) at KPMG (audit, tax, and advisory services).
Glenn Booraem
Born in 1967. Principal occupation(s) during the past five years and other experience: principal of Vanguard. Investment stewardship officer (2017–present), treasurer (2015–2017), controller (2010–2015), and assistant controller (2001–2010) of each of the investment companies served by Vanguard.
Christine M. Buchanan
Born in 1970. Principal occupation(s) during the past five years and other experience: principal of Vanguard. Treasurer (2017–present) of each of the investment companies served by Vanguard. Partner (2005–2017) at KPMG (audit, tax, and advisory services).
David Cermak
Born in 1960. Principal occupation(s) during the past five years and other experience: principal of Vanguard. Finance director (October 2019–present) of each of the investment companies served by Vanguard. Managing director and head (2017–present) of Vanguard Investments Singapore. Managing director and head (2017–2019) of Vanguard Investments Hong Kong. Representative director and head (2014–2017) of Vanguard Investments Japan.
Thomas J. Higgins
Born in 1957. Principal occupation(s) during the past five years and other experience: principal of Vanguard. Finance director (October 2019–present), chief financial officer (2008–2019), and treasurer (1998–2008) of each of the investment companies served by Vanguard.
Peter Mahoney
Born in 1974. Principal occupation(s) during the past five years and other experience: principal of Vanguard. Controller (2015–present) of each of the investment companies served by Vanguard. Head of International Fund Services (2008–2014) at Vanguard.
Anne E. Robinson
Born in 1970. Principal occupation(s) during the past five years and other experience: general counsel (2016–present) of Vanguard. Secretary (2016–present) of Vanguard and of each of the investment companies served by Vanguard. Managing director (2016–present) of Vanguard. Managing director and general counsel of Global Cards and Consumer Services (2014–2016) at Citigroup. Counsel (2003–2014) at American Express.
Michael Rollings
Born in 1963. Principal occupation(s) during the past five years and other experience: finance director (2017–present) and treasurer (2017) of each of the investment companies served by Vanguard. Managing director (2016–present) of Vanguard. Chief financial officer (2016–present) of Vanguard. Director (2016–present) of Vanguard Marketing Corporation. Executive vice president and chief financial officer (2006–2016) of MassMutual Financial Group.
John E. Schadl
Born in 1972. Principal occupation(s) during the past five years and other experience: principal of Vanguard. Chief compliance officer (2019–present) of Vanguard and of each of the investment companies served by Vanguard. Assistant vice president (May 2019–present) of Vanguard Marketing Corporation.
| Vanguard Senior Management Team |
| | |
| Joseph Brennan | Chris D. McIsaac |
| Mortimer J. Buckley | James M. Norris |
| Gregory Davis | Thomas M. Rampulla |
| John James | Karin A. Risi |
| Martha G. King | Anne E. Robinson |
| John T. Marcante | Michael Rollings |
| | |
| | |
| | P.O. Box 2600 |
| | Valley Forge, PA 19482-2600 |
Connect with Vanguard® > vanguard.com
Fund Information> 800-662-7447
Direct Investor Account Services> 800-662-2739
Institutional Investor Services> 800-523-1036
Text Telephone for People
Who Are Deaf or Hard of Hearing> 800-749-7273
This material may be used in conjunction with the offering of shares of any Vanguard fund only if preceded or accompanied by the fund’s current prospectus.
All comparative mutual fund data are from Morningstar, Inc., unless otherwise noted.
You can obtain a free copy of Vanguard’s proxy voting guidelines by visiting vanguard.com/proxyreporting or by calling Vanguard at 800-662-2739. The guidelines are also available from the SEC’s website, www.sec.gov. In addition, you may obtain a free report on how your fund voted the proxies for securities it owned during the 12 months ended June 30. To get the report, visit either vanguard.com/proxyreporting or www.sec.gov.
You can review information about your fund on the SEC’s website, and you can receive copies of this information, for a fee, by sending a request via email addressed to publicinfo@sec.gov.
CFA®is a registered trademark owned by CFA Institute.
| | © 2020 The Vanguard Group, Inc. |
| | All rights reserved. |
| | Vanguard Marketing Corporation, Distributor. |
| | |
| | Q140 012020 |
Item 2: Code of Ethics. The Registrant has adopted a code of ethics that applies to the Registrant’s principal executive officer, principal financial officer, principal accounting officer or controller or persons performing similar functions. The Code of Ethics was amended during the reporting period covered by this report to make certain technical, non-material changes.
Item 3: Audit Committee Financial Expert. All members of the Audit Committee have been determined by the Registrant’s Board of Trustees to be Audit Committee Financial Experts and to be independent: F. Joseph Loughrey, Mark Loughridge, Sarah Bloom Raskin, and Peter F. Volanakis.
Item 4: Principal Accountant Fees and Services.
(a) Audit Fees.
Audit Fees of the Registrant.
Fiscal Year Ended November 30, 2019: $62,000
Fiscal Year Ended November 30, 2018: $64,000
Aggregate Audit Fees of Registered Investment Companies in the Vanguard Group.
Fiscal Year Ended November 30, 2019: $9,568,215
Fiscal Year Ended November 30, 2018: $9,734,277
Includes fees billed in connection with audits of the Registrant, other registered investment companies in the Vanguard complex, The Vanguard Group, Inc., and Vanguard Marketing Corporation.
(b) Audit-Related Fees.
Fiscal Year Ended November 30, 2019: $3,012,031
Fiscal Year Ended November 30, 2018: $5,581,336
Includes fees billed in connection with assurance and related services provided to the Registrant, other registered investment companies in the Vanguard complex, The Vanguard Group, Inc., and Vanguard Marketing Corporation.
(c) Tax Fees.
Fiscal Year Ended November 30, 2019: $357,238
Fiscal Year Ended November 30, 2018: $347,985
Includes fees billed in connection with tax compliance, planning, and advice services provided to the Registrant, other registered investment companies in the Vanguard complex, The Vanguard Group, Inc., and Vanguard Marketing Corporation.
(d) All Other Fees.
Fiscal Year Ended November 30, 2019: $0
Fiscal Year Ended November 30, 2018: $0
Includes fees billed for services related to tax reported information provided to the Registrant, other registered investment companies in the Vanguard complex, The Vanguard Group, Inc., and Vanguard Marketing Corporation.
(e) (1) Pre-Approval Policies. The policy of the Registrant’s Audit Committee is to consider, and, if appropriate, approve before the principal accountant is engaged for such services, all specific audit and non-audit services provided to: the Registrant, other registered investment companies in the Vanguard complex, The Vanguard Group, Inc., and entities controlled by The Vanguard Group, Inc. that provide ongoing services to the Registrant. In making a determination, the Audit Committee considers whether the services are consistent with maintaining the principal accountant’s independence.
In the event of a contingency situation in which the principal accountant is needed to provide services in between scheduled Audit Committee meetings, the Chairman of the Audit Committee would be called on to consider and, if appropriate, pre-approve audit or permitted non-audit services in an amount sufficient to complete services through the next Audit Committee meeting, and to determine if such services would be consistent with maintaining the accountant’s independence. At the next scheduled Audit Committee meeting, services and fees would be presented to the Audit Committee for formal consideration, and, if appropriate, approval by the entire Audit Committee. The Audit Committee would again consider whether such services and fees are consistent with maintaining the principal accountant’s independence.
The Registrant’s Audit Committee is informed at least annually of all audit and non-audit services provided by the principal accountant to the Vanguard complex, whether such services are provided to: the Registrant, other registered investment companies in the Vanguard complex, The Vanguard Group, Inc., or other entities controlled by The Vanguard Group, Inc. that provide ongoing services to the Registrant.
(2) No percentage of the principal accountant’s fees or services were approved pursuant to the waiver provision of paragraph (c)(7)(i)(C) of Rule 2-01 of Regulation S-X.
(f) For the most recent fiscal year, over 50% of the hours worked under the principal accountant’s engagement werenot performed by persons other than full-time, permanent employees of the principal accountant.
(g) Aggregate Non-Audit Fees.
Fiscal Year Ended November 30, 2019: $357,238
Fiscal Year Ended November 30, 2018: $347,985
Includes fees billed for non-audit services provided to the Registrant, other registered investment companies in the Vanguard complex, The Vanguard Group, Inc., and Vanguard Marketing Corporation.
(h) For the most recent fiscal year, the Audit Committee has determined that the provision of all non-audit services was consistent with maintaining the principal accountant’s independence.
Item 5: Audit Committee of Listed Registrants.
The Registrant is a listed issuer as defined in rule 10A-3 under the Securities Exchange Act of 1934 (“Exchange Act”). The Registrant has a separately-designated standing audit committee established in accordance with Section 3(a)(58)(A) of the Exchange Act. The Registrant’s audit committee members are: F. Joseph Loughrey, Mark Loughridge, Sarah Bloom Raskin, and Peter F. Volanakis.
Item 6: Investments.
Not applicable.
Item 7: Disclosure of Proxy Voting Policies and Procedures for Closed-End Management Investment Companies.
Not applicable.
Item 8: Portfolio Managers of Closed-End Management Investment Companies.
Not applicable.
Item 9: Purchase of Equity Securities by Closed-End Management Investment Company and Affiliated Purchasers.
Not applicable.
Item 10: Submission of Matters to a Vote of Security Holders.
Not applicable.
Item 11: Controls and Procedures.
(a) Disclosure Controls and Procedures. The Principal Executive and Financial Officers concluded that the Registrant’s Disclosure Controls and Procedures are effective based on their evaluation of the Disclosure Controls and Procedures as of a date within 90 days of the filing date of this report.
(b) Internal Control Over Financial Reporting. There were no significant changes in Registrant’s Internal Control Over Financial Reporting or in other factors that could significantly affect this control subsequent to the date of the evaluation, including any corrective actions with regard to significant deficiencies and material weaknesses.
Item 12: Disclosure of Securities Lending Activities for Closed-End Management Investment Companies.
Not applicable.
Item 13: Exhibits.
Pursuant to the requirements of the Securities Exchange Act of 1934 and the Investment Company Act of 1940, the registrant has duly caused this report to be signed on its behalf by the undersigned, thereunto duly authorized.
| | VANGUARD NEW JERSEY TAX-FREE FUNDS |
| | | |
| BY: | /s/ MORTIMER J. BUCKLEY* | |
| | MORTIMER J. BUCKLEY | |
| | CHIEF EXECUTIVE OFFICER | |
Date: January 21, 2020
Pursuant to the requirements of the Securities Exchange Act of 1934 and the Investment Company Act of 1940, this report has been signed below by the following persons on behalf of the registrant and in the capacities and on the dates indicated.
| | VANGUARD NEW JERSEY TAX-FREE FUNDS |
| | | |
| BY: | /s/ MORTIMER J. BUCKLEY* | |
| | MORTIMER J. BUCKLEY | |
| | CHIEF EXECUTIVE OFFICER | |
Date: January 21, 2020
| | VANGUARD NEW JERSEY TAX-FREE FUNDS |
| | | |
| BY: | /s/ JOHN BENDL* | |
| | JOHN BENDL | |
| | CHIEF FINANCIAL OFFICER | |
Date: January 21, 2020
* By: /s/ Anne E. Robinson
Anne E. Robinson, pursuant to a Power of Attorney filed on January 18, 2018 (see file Number 33-32216) and a Power of Attorney filed on October 30, 2019 (see file Number 811-02554), Incorporated by Reference.