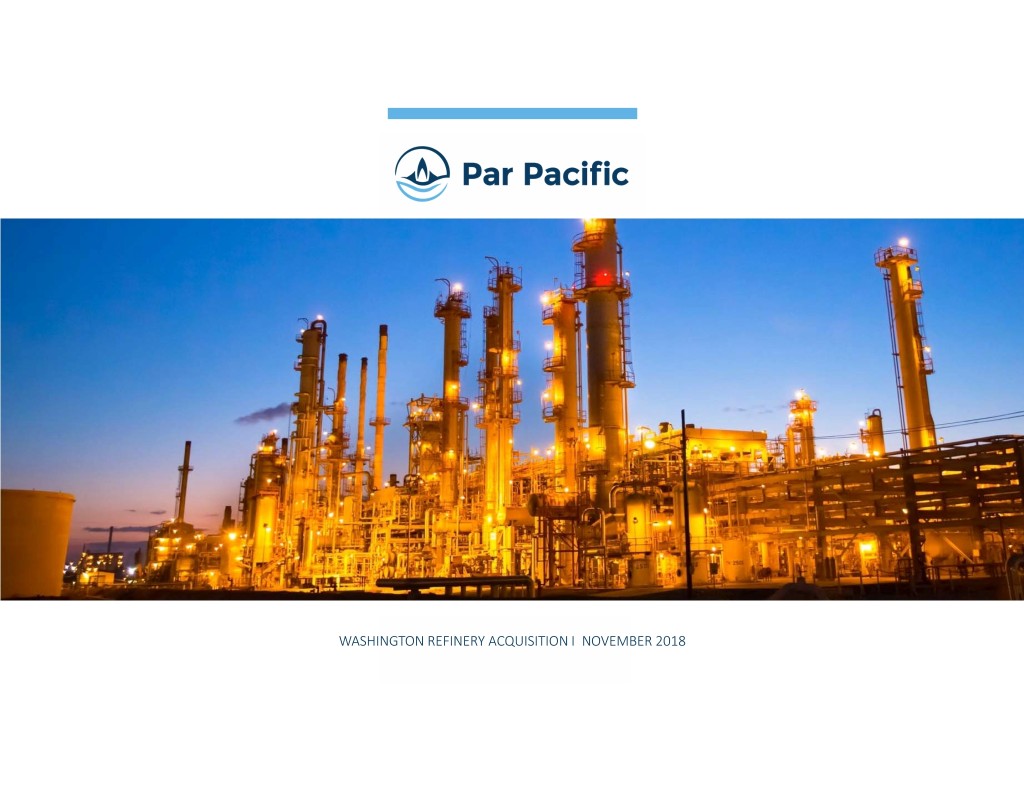
WASHINGTON REFINERY ACQUISITION I NOVEMBER 2018
Forward‐Looking Statements / Disclaimers The information contained in this presentation has been prepared to assist you in making your own evaluation of the company and does not purport to contain all of the information you may consider important. Any estimates or projections with respect to future performance have been provided to assist you in your evaluation but should not be relied upon as an accurate representation of future results. Certain statements, estimates and financial information contained in this presentation constitute forward‐looking statements. Such forward‐looking statements involve known and unknown risks and uncertainties that could cause actual events or results to differ materially from the results implied or expressed in such forwarding statements. While presented with numerical specificity, certain forward‐looking statements are based (1) upon assumptions that are inherently subject to significant business, economic, regulatory, environmental, seasonal and competitive uncertainties, contingencies and risks including, without limitation, our ability to maintain adequate liquidity, to realize the potential benefit of our net operating loss tax carryforwards, to obtain sufficient debt and equity financings, our capital costs, well production performance, and operating costs, anticipated commodity pricing, differentials or crack spreads, anticipated or projected pricing information related to oil, NGLs, and natural gas, realize the potential benefits of our supply and offtake agreements, our ability to realize the benefit of our investment in Laramie Energy, LLC, assumptions related to our investment in Laramie Energy, LLC, including completion activity and projected capital contributions, Laramie Energy, LLC’s financial and operational performance and plans for 2018, our ability to meet environmental and regulatory requirements, our ability to increase refinery throughput and profitability, estimated production, our ability to evaluate and pursue strategic and growth opportunities, our estimates of anticipated Adjusted EBITDA, Adjusted Net income per share, and Adjusted earnings per share, the amount and scope of anticipated capital expenditures, estimates regarding our anticipated diesel hydrotreater project and our naphtha hydrotreater and isomerization unit project, including costs, timing, and benefits, anticipated throughput, production costs, and on‐island sales expectations in Hawaii, anticipated throughput and distillate yield expectations in Wyoming, our estimates related to the annual gross margin impact of changes in RINs prices, the ability of our refinery in Wyoming to provide supply in the Northwest region, estimates regarding the IES acquisition and the Washington refinery acquisition, including anticipated closing dates, financing plans, ability to successfully integrate each acquisition and realize the synergies and other benefits related to each acquisition, and anticipated financial and operating results of each acquisition and their effect on the company’s earnings profile and profitability (including Adjusted EBITDA, Adjusted Net Income per Share, and Adjusted earnings per share), and other known and unknown risks (all of which are difficult to predict and many of which are beyond the company's control), some of which are further discussed in the company’s periodic and other filings with the SEC and (2) upon assumptions with respect to future business decisions that are subject to change. There can be no assurance that the results implied or expressed in such forward‐looking statements or the underlying assumptions will be realized and that actual results of operations or future events will not be materially different from the results implied or expressed in such forward‐looking statements. Under no circumstances should the inclusion of the forward‐looking statements be regarded as a representation, undertaking, warranty or prediction by the company or any other person with respect to the accuracy thereof or the accuracy of the underlying assumptions, or that the company will achieve or is likely to achieve any particular results. The forward‐looking statements are made as of the date hereof and the company disclaims any intent or obligation to update publicly or to revise any of the forward‐looking statements, whether as a result of new information, future events or otherwise, except as may be required by applicable law. Recipients are cautioned that forward‐looking statements are not guarantees of future performance and, accordingly, recipients are expressly cautioned not to put undue reliance on forward‐looking statements due to the inherent uncertainty therein. This presentation contains non‐GAAP financial measures, such as Adjusted EBITDA and Adjusted Net Income (loss). Please see the Appendix for the definitions and reconciliations to GAAP of the non‐GAAP financial measures that are based on reconcilable historical information. 1
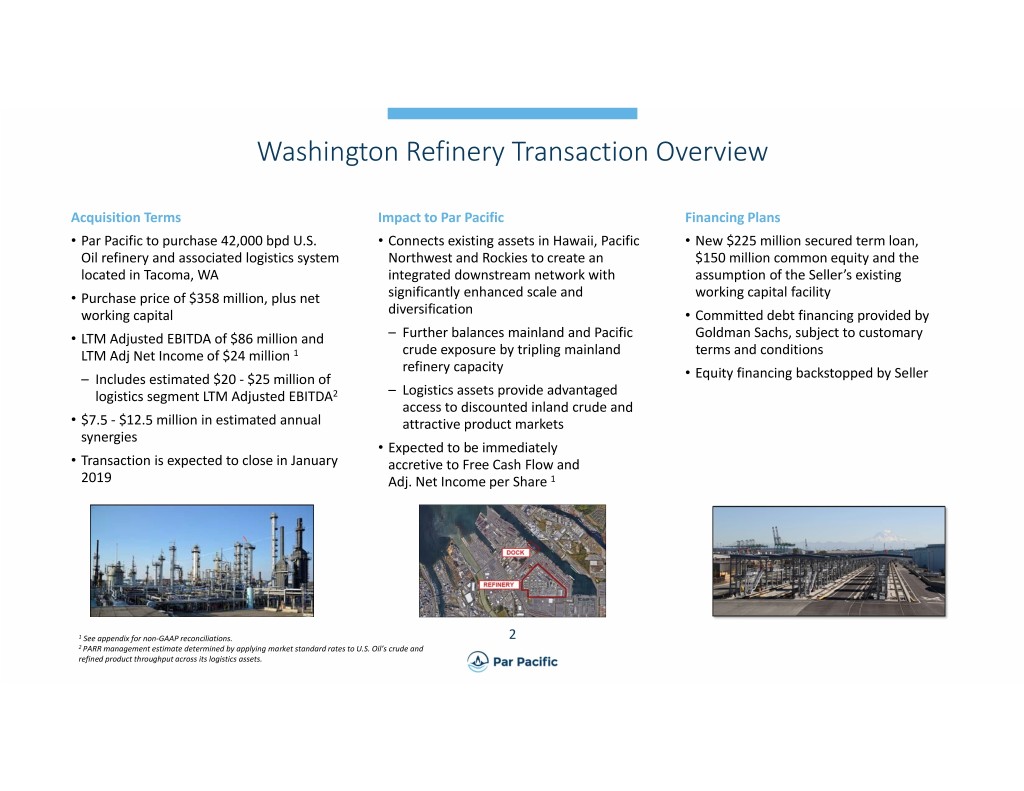
Washington Refinery Transaction Overview Acquisition Terms Impact to Par Pacific Financing Plans • Par Pacific to purchase 42,000 bpd U.S. • Connects existing assets in Hawaii, Pacific • New $225 million secured term loan, Oil refinery and associated logistics system Northwest and Rockies to create an $150 million common equity and the located in Tacoma, WA integrated downstream network with assumption of the Seller’s existing • Purchase price of $358 million, plus net significantly enhanced scale and working capital facility working capital diversification • Committed debt financing provided by • LTM Adjusted EBITDA of $86 million and –Further balances mainland and Pacific Goldman Sachs, subject to customary LTM Adj Net Income of $24 million 1 crude exposure by tripling mainland terms and conditions refinery capacity – Includes estimated $20 ‐ $25 million of • Equity financing backstopped by Seller logistics segment LTM Adjusted EBITDA2 –Logistics assets provide advantaged access to discounted inland crude and • $7.5 ‐ $12.5 million in estimated annual attractive product markets synergies • Expected to be immediately • Transaction is expected to close in January accretive to Free Cash Flow and 2019 Adj. Net Income per Share 1 1 See appendix for non‐GAAP reconciliations. 2 2 PARR management estimate determined by applying market standard rates to U.S. Oil’s crude and refined product throughput across its logistics assets.

Washington Refinery Overview Refining Highlights • Refinery configuration allows crude slate flexibility based on market dynamics Crude Slate & Product Yield* • Geographically well‐positioned to source 25% Other Products currently discounted Western Canadian and 64% Bakken Bakken crudes 23% Gasoline • Production profile fits Pacific Northwest market demand diversification – 60% clean product yield 3% Other 16% Asphalt – Leading asphalt producer in the Pacific Northwest 36% Distillate –VGO is sold to West Coast refiners 33% Cold Lake • Tier 3 sulfur compliant gasoline production *For the last twelve months ended September 30, 2018. 3
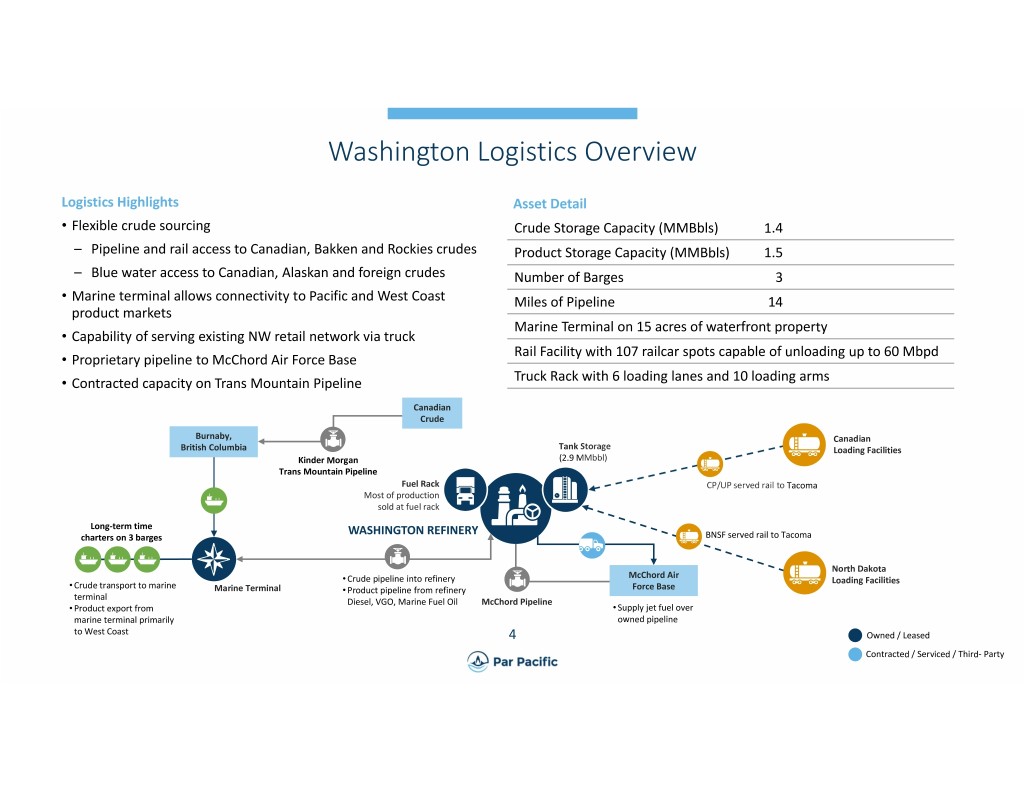
Washington Logistics Overview Logistics Highlights Asset Detail • Flexible crude sourcing Crude Storage Capacity (MMBbls) 1.4 – Pipeline and rail access to Canadian, Bakken and Rockies crudes Product Storage Capacity (MMBbls) 1.5 –Blue water access to Canadian, Alaskan and foreign crudes Number of Barges 3 • Marine terminal allows connectivity to Pacific and West Coast Miles of Pipeline 14 product markets Marine Terminal on 15 acres of waterfront property • Capability of serving existing NW retail network via truck Rail Facility with 107 railcar spots capable of unloading up to 60 Mbpd • Proprietary pipeline to McChord Air Force Base • Contracted capacity on Trans Mountain Pipeline Truck Rack with 6 loading lanes and 10 loading arms Canadian Crude Burnaby, Canadian British Columbia Tank Storage Loading Facilities Kinder Morgan (2.9 MMbbl) Trans Mountain Pipeline Fuel Rack CP/UP served rail to Tacoma Most of production sold at fuel rack Long‐term time WASHINGTON REFINERY charters on 3 barges BNSF served rail to Tacoma North Dakota McChord Air • Crude pipeline into refinery Loading Facilities • Crude transport to marine Marine Terminal • Product pipeline from refinery Force Base terminal Diesel, VGO, Marine Fuel Oil McChord Pipeline • Product export from • Supply jet fuel over marine terminal primarily owned pipeline to West Coast 4 Owned / Leased Contracted / Serviced / Third‐ Party
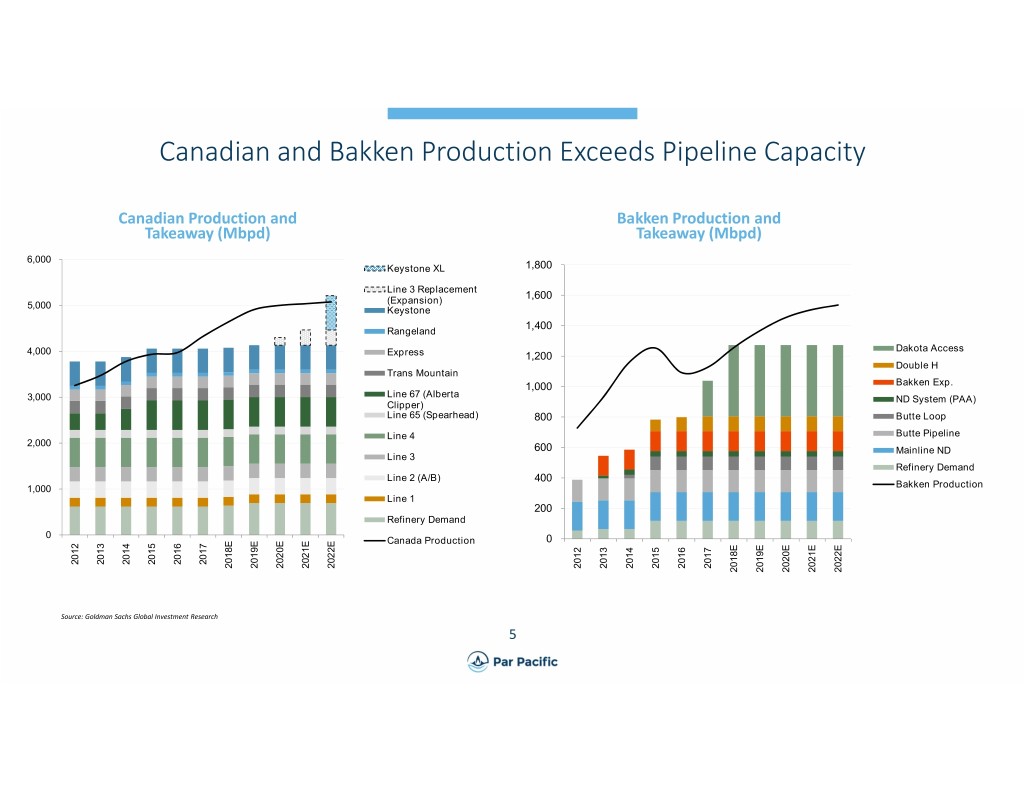
Canadian and Bakken Production Exceeds Pipeline Capacity Canadian Production and Bakken Production and Takeaway (Mbpd) Takeaway (Mbpd) 6,000 Keystone XL 1,800 Line 3 Replacement (Expansion) 1,600 5,000 Keystone 1,400 Rangeland Dakota Access 4,000 Express 1,200 Double H Trans Mountain 1,000 Bakken Exp. Line 67 (Alberta 3,000 ND System (PAA) Clipper) Line 65 (Spearhead) 800 Butte Loop Line 4 Butte Pipeline 2,000 600 Mainline ND Line 3 Refinery Demand Line 2 (A/B) 400 1,000 Bakken Production Line 1 200 Refinery Demand 0 Canada Production 0 2012 2013 2014 2015 2016 2017 2018E 2019E 2020E 2021E 2022E 2012 2013 2014 2015 2016 2017 2018E 2019E 2020E 2021E 2022E Source: Goldman Sachs Global Investment Research 5

Advantaged Access to Canadian and Bakken Crudes Limited Available Pipeline Capacity WCS and Bakken (Clearbrook) Diffs Reflect this Dynamic LTM at 9/30 $10.00 $ 4.00 $0.00 $ 0.00 $(10.00) $(4.00) $(20.00) $(8.00) $(30.00) $(12.00) $(40.00) $(16.00) $(50.00) $(20.00) $(60.00) $(24.00) Jan-15 Jan-16 Jan-17 Jan-18 Bakken (Clearbrook) WCS ‐ WTI ‐ WTI $/bbl WCS ‐ WTI Bakken (Clearbrook) ‐ WTI 9/30/18 LTM Avg $(22.03) $(0.29) Source: CAPP Source: Platts 6
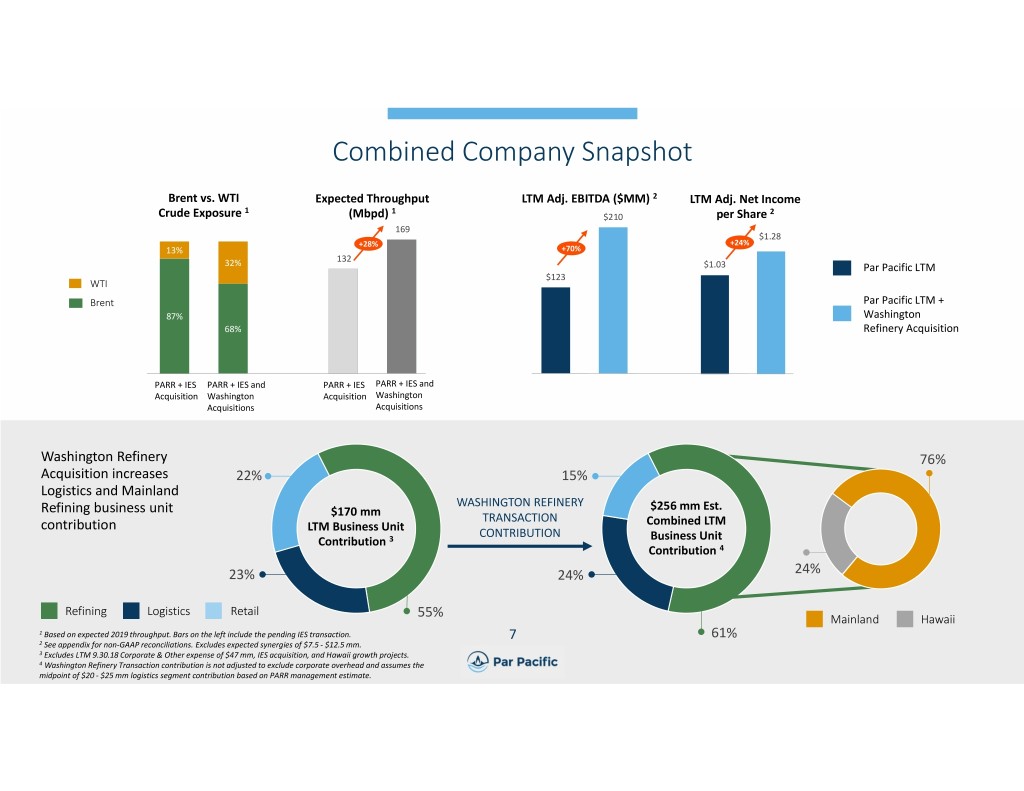
Combined Company Snapshot Brent vs. WTI Expected Throughput LTM Adj. EBITDA ($MM) 2 LTM Adj. Net Income 1 1 2 Crude Exposure (Mbpd) $210 per Share 169 $1.28 +28% +24% 13% +70% 132 32% $1.03 Par Pacific LTM $123 WTI Brent Par Pacific LTM + 87% Washington 68% Refinery Acquisition PARR + IES PARR + IES and PARR + IES PARR + IES and Acquisition Washington Acquisition Washington Acquisitions Acquisitions Washington Refinery 76% Acquisition increases 22% 15% Logistics and Mainland Refining business unit WASHINGTON REFINERY $256 mm Est. $170 mm TRANSACTION contribution LTM Business Unit Combined LTM CONTRIBUTION Contribution 3 Business Unit Contribution 4 23% 24% 24% Refining Logistics Retail 55% Mainland Hawaii 1 Based on expected 2019 throughput. Bars on the left include the pending IES transaction. 7 61% 2 See appendix for non‐GAAP reconciliations. Excludes expected synergies of $7.5 ‐ $12.5 mm. 3 Excludes LTM 9.30.18 Corporate & Other expense of $47 mm, IES acquisition, and Hawaii growth projects. 4 Washington Refinery Transaction contribution is not adjusted to exclude corporate overhead and assumes the midpoint of $20 ‐ $25 mm logistics segment contribution based on PARR management estimate.
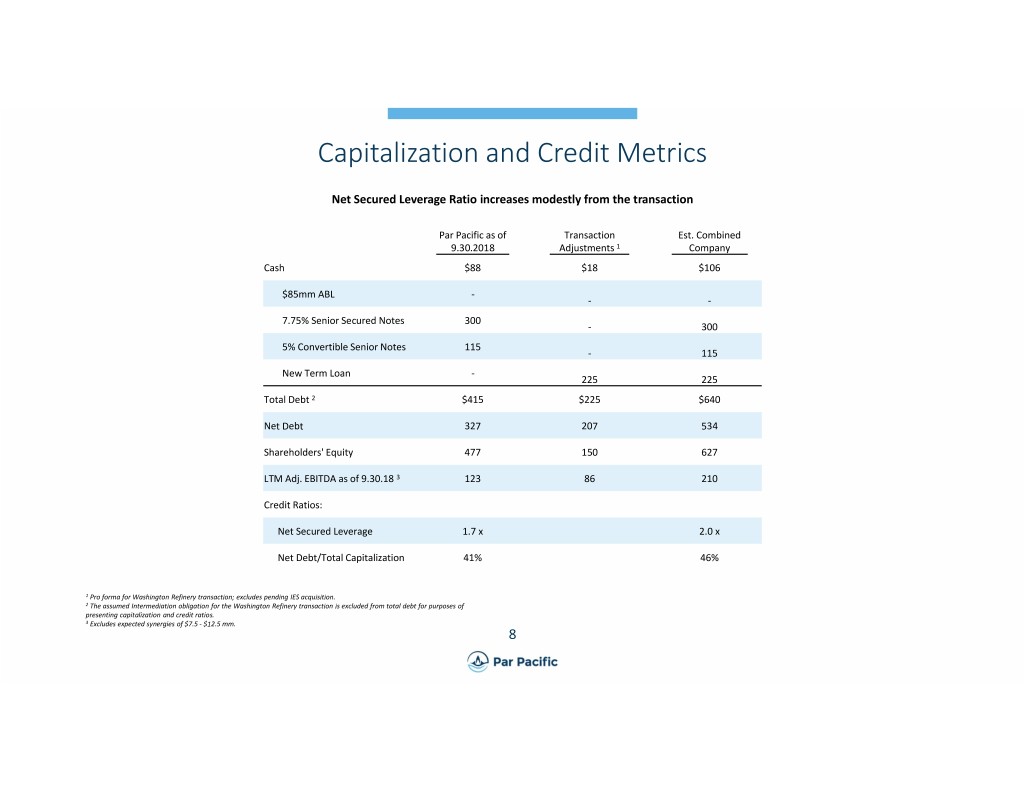
Capitalization and Credit Metrics Net Secured Leverage Ratio increases modestly from the transaction Par Pacific as of Transaction Est. Combined 9.30.2018 Adjustments 1 Company Cash $88 $18 $106 $85mm ABL ‐ ‐‐ 7.75% Senior Secured Notes 300 ‐ 300 5% Convertible Senior Notes 115 ‐ 115 New Term Loan ‐ 225 225 Total Debt 2 $415 $225 $640 Net Debt 327 207 534 Shareholders' Equity 477 150 627 LTM Adj. EBITDA as of 9.30.18 3 123 86 210 Credit Ratios: Net Secured Leverage 1.7 x 2.0 x Net Debt/Total Capitalization 41% 46% 1 Pro forma for Washington Refinery transaction; excludes pending IES acquisition. 2 The assumed Intermediation obligation for the Washington Refinery transaction is excluded from total debt for purposes of presenting capitalization and credit ratios. 3 Excludes expected synergies of $7.5 ‐ $12.5 mm. 8
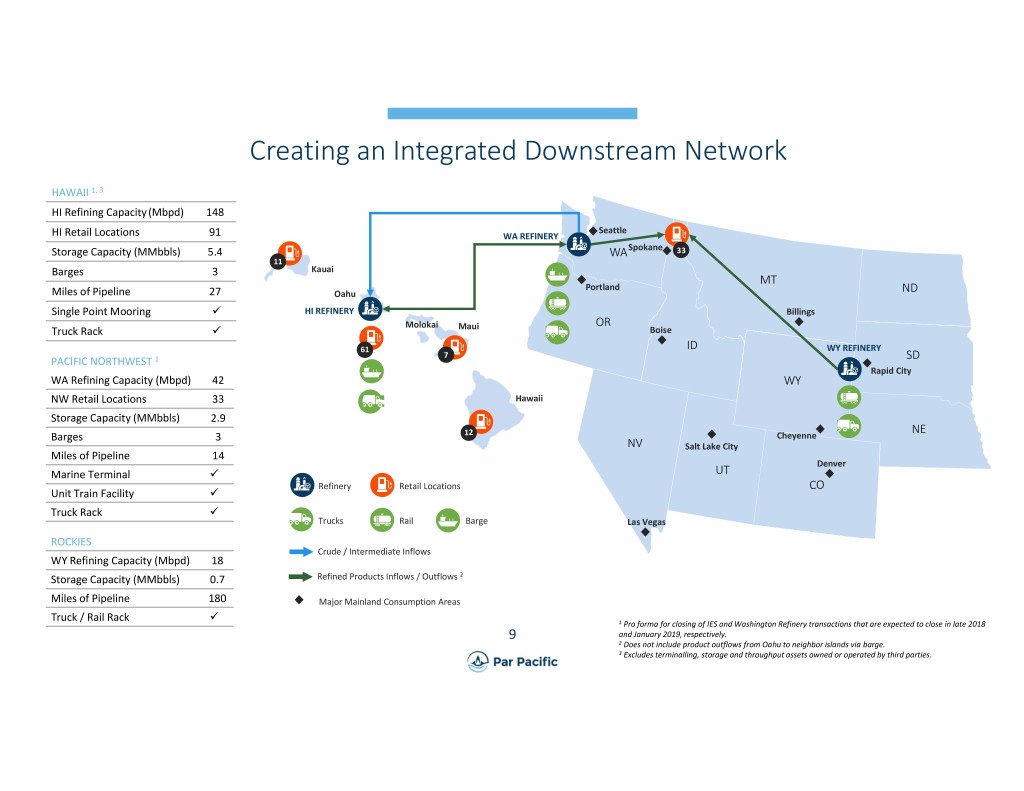
Creating an Integrated Downstream Network HAWAII 1, 3 HI Refining Capacity (Mbpd) 148 Seattle HI Retail Locations 91 WA REFINERY Storage Capacity (MMbbls) 5.4 WA Spokane 33 11 Barges 3 Kauai MT Portland Miles of Pipeline 27 Oahu ND Single Point Mooring HI REFINERY Billings Molokai OR Truck Rack Maui Boise 61 ID WY REFINERY 7 PACIFIC NORTHWEST 1 SD Rapid City WA Refining Capacity (Mbpd) 42 WY NW Retail Locations 33 Hawaii Storage Capacity (MMbbls) 2.9 NE Barges 3 12 Cheyenne NV Salt Lake City Miles of Pipeline 14 Denver Marine Terminal UT Refinery Retail Locations CO Unit Train Facility Truck Rack Trucks Rail Barge Las Vegas ROCKIES Crude / Intermediate Inflows WY Refining Capacity (Mbpd) 18 Storage Capacity (MMbbls) 0.7 Refined Products Inflows / Outflows 2 Miles of Pipeline 180 Major Mainland Consumption Areas Truck / Rail Rack 1 Pro forma for closing of IES and Washington Refinery transactions that are expected to close in late 2018 9 and January 2019, respectively. 2 Does not include product outflows from Oahu to neighbor islands via barge. 3 Excludes terminalling, storage and throughput assets owned or operated by third parties.

Appendix 10
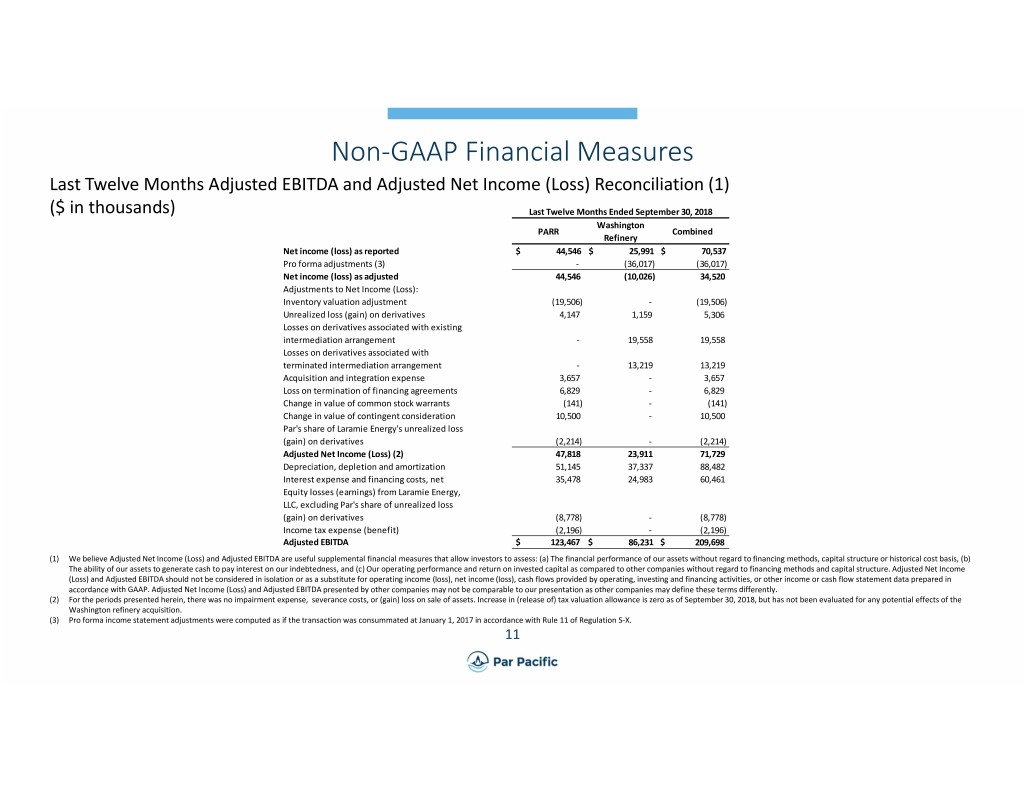
Non‐GAAP Financial Measures Last Twelve Months Adjusted EBITDA and Adjusted Net Income (Loss) Reconciliation (1) ($ in thousands) Last Twelve Months Ended September 30, 2018 Washington PARR Combined Refinery Net income (loss) as reported $ 44,546 $ 25,991 $ 70,537 Pro forma adjustments (3) ‐ (36,017) (36,017) Net income (loss) as adjusted 44,546 (10,026) 34,520 Adjustments to Net Income (Loss): Inventory valuation adjustment (19,506) ‐ (19,506) Unrealized loss (gain) on derivatives 4,147 1,159 5,306 Losses on derivatives associated with existing intermediation arrangement ‐ 19,558 19,558 Losses on derivatives associated with terminated intermediation arrangement ‐ 13,219 13,219 Acquisition and integration expense 3,657 ‐ 3,657 Loss on termination of financing agreements 6,829 ‐ 6,829 Change in value of common stock warrants (141) ‐ (141) Change in value of contingent consideration 10,500 ‐ 10,500 Par's share of Laramie Energy's unrealized loss (gain) on derivatives (2,214) ‐ (2,214) Adjusted Net Income (Loss) (2) 47,818 23,911 71,729 Depreciation, depletion and amortization 51,145 37,337 88,482 Interest expense and financing costs, net 35,478 24,983 60,461 Equity losses (earnings) from Laramie Energy, LLC, excluding Par's share of unrealized loss (gain) on derivatives (8,778) ‐ (8,778) Income tax expense (benefit) (2,196) ‐ (2,196) Adjusted EBITDA $ 123,467 $ 86,231 $ 209,698 (1) We believe Adjusted Net Income (Loss) and Adjusted EBITDA are useful supplemental financial measures that allow investors to assess: (a) The financial performance of our assets without regard to financing methods, capital structure or historical cost basis, (b) The ability of our assets to generate cash to pay interest on our indebtedness, and (c) Our operating performance and return on invested capital as compared to other companies without regard to financing methods and capital structure. Adjusted Net Income (Loss) and Adjusted EBITDA should not be considered in isolation or as a substitute for operating income (loss), net income (loss), cash flows provided by operating, investing and financing activities, or other income or cash flow statement data prepared in accordance with GAAP. Adjusted Net Income (Loss) and Adjusted EBITDA presented by other companies may not be comparable to our presentation as other companies may define these terms differently. (2) For the periods presented herein, there was no impairment expense, severance costs, or (gain) loss on sale of assets. Increase in (release of) tax valuation allowance is zero as of September 30, 2018, but has not been evaluated for any potential effects of the Washington refinery acquisition. (3) Pro forma income statement adjustments were computed as if the transaction was consummated at January 1, 2017 in accordance with Rule 11 of Regulation S‐X. 11
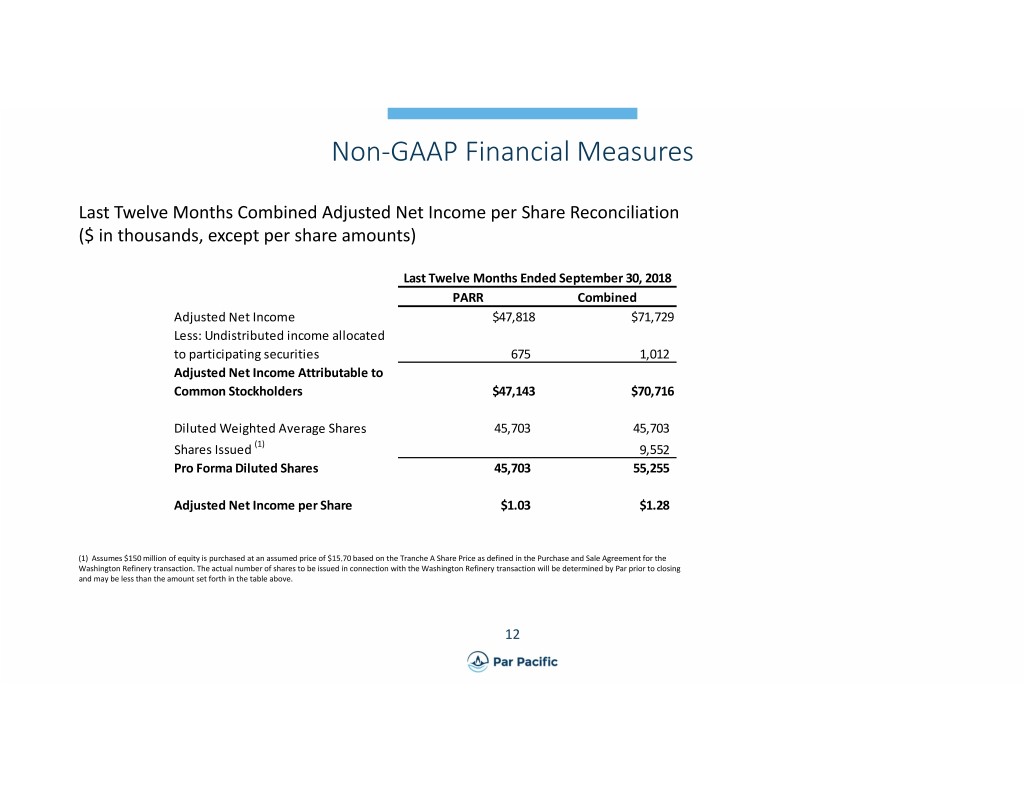
Non‐GAAP Financial Measures Last Twelve Months Combined Adjusted Net Income per Share Reconciliation ($ in thousands, except per share amounts) Last Twelve Months Ended September 30, 2018 PARR Combined Adjusted Net Income $47,818 $71,729 Less: Undistributed income allocated to participating securities 675 1,012 Adjusted Net Income Attributable to Common Stockholders $47,143 $70,716 Diluted Weighted Average Shares 45,703 45,703 Shares Issued (1) 9,552 Pro Forma Diluted Shares 45,703 55,255 Adjusted Net Income per Share $1.03 $1.28 (1) Assumes $150 million of equity is purchased at an assumed price of $15.70 based on the Tranche A Share Price as defined in the Purchase and Sale Agreement for the Washington Refinery transaction. The actual number of shares to be issued in connection with the Washington Refinery transaction will be determined by Par prior to closing and may be less than the amount set forth in the table above. 12


