Exhibit 99.1
PAR PETROLEUM REPORTS THIRD QUARTER AND YEAR TO DATE 2014 RESULTS
| | • | | Third Quarter 2014 Net loss of $39.5 million and Negative Adjusted EBITDA of $29.0 million |
| | • | | Nine Months 2014 Net loss of $78.7 million and Negative Adjusted EBITDA of $56.7 million |
HOUSTON, TEXAS (Wednesday, November 12, 2014) Par Petroleum Corporation (NYSE MKT: PARR) today reported a third quarter and nine month 2014 net loss of $39.5 million and $78.7 million and negative Adjusted EBITDA of $29.0 million and $56.7 million, respectively. See the reconciliation of GAAP and non-GAAP financial measures included as Attachment 2.
“During the quarter, we continued our transition efforts and were successful in contracting additional on-island sales, from which we expect to benefit beginning in the fourth quarter of 2014, and to a larger extent, in 2015. We saw steady improvements in market conditions during the quarter; however, our overall results were negatively impacted by higher feedstock costs and higher operating costs largely due to planned and unplanned maintenance,” said William Monteleone, Chief Executive Officer. “We are continuing to work through the regulatory process to close the Mid Pac acquisition and expect that the transaction will close in late 2014 or early 2015. Additionally, due to Piceance Energy’s strong operating cash flow, we will likely defer the previously announced capital contribution by Par of approximately $3.3 million until the first or second quarter of 2015,” continued Mr. Monteleone.
The company will hold a conference call with investors on Wednesday, November 12, 2014 at 9:00 AM CT, which will include a discussion of the market information included as slides in Attachment 3. See dial-in information below.
Third Quarter 2014 and Nine Months 2014
The company reported a consolidated net loss of $39.5 million and negative Adjusted EBITDA of $29.0 million for the third quarter 2014. Significant non-cash items or acquisition and integration costs included in the third quarter results relate to the following:
| | • | | $3.9 million of acquisition and integration costs related to the HIE and the Mid Pac acquisitions; |
| | • | | $2.4 million in gains related to the change in the fair value of common stock warrants; and |
| | • | | $1.0 million in gains related to a change in the value of contingent consideration related to the HIE acquisition. |
The company reported a consolidated net loss of $78.7 million and negative Adjusted EBITDA of $56.7 million for nine months 2014. Significant non-cash items or acquisition and integration costs included in the nine months results relate to the following:
| | • | | $9.1 million of acquisition and integration costs related to the HIE and Mid Pac acquisitions; |
| | • | | $4.1 million in gains related to a change in the fair value of our common stock warrants; and |
| | • | | $5.8 million in gains related to a change in the value of contingent consideration related to the HIE acquisition. |
See the reconciliation of GAAP and non-GAAP financial measures included in Attachment 2.
Refining, Distribution & Marketing
During the third quarter, the refining, distribution and marketing segment had revenue of $799.2 million, gross margin of $21.4 million, and an operating loss of $26.9 million, which includes operating expenses of $42.7 million and depreciation, depletion and amortization (DD&A) expense of $2.8 million.
During the nine months, the refining, distribution and marketing segment had revenue of $2,292.2 million, gross margin of $66.8 million, and an operating loss of $58.7 million, which includes operating expenses of $109.9 million and depreciation, depletion and amortization (DD&A) expense of $7.5 million.
The refinery operated at an average throughput of 69,000 barrels per day, or 73% utilization, for the third quarter 2014. Production costs before DD&A expense (see table below) for the third quarter averaged $5.67/bbl of throughput. Gross refining margin per barrel totaled $1.62/bbl during the same period.
| | | | | | | | | | | | | | | | |
| | | YTD | | | Q3 | | | Q2 | | | Q1 | |
Throughput (thousand bbls per day) | | | | | | | | | | | | | | | | |
Heavy Crude (a) | | | 16 | | | | 12 | | | | 17 | | | | 20 | |
Light Crude | | | 53 | | | | 57 | | | | 54 | | | | 47 | |
| | | | | | | | | | | | | | | | |
Total Throughput | | | 69 | | | | 69 | | | | 71 | | | | 67 | |
| | | | | | | | | | | | | | | | |
Yield (thousand bbls per day) | | | | | | | | | | | | | | | | |
Gasoline and gasoline blendstocks | | | 17 | | | | 18 | | | | 19 | | | | 16 | |
Jet fuel | | | 18 | | | | 18 | | | | 17 | | | | 17 | |
Diesel fuel | | | 9 | | | | 11 | | | | 9 | | | | 8 | |
Heavy fuel oils, residual products, internally produced fuel and other | | | 26 | | | | 24 | | | | 26 | | | | 27 | |
| | | | | | | | | | | | | | | | |
Total Yield | | | 70 | | | | 71 | | | | 71 | | | | 68 | |
| | | | | | | | | | | | | | | | |
Gross margin (in millions) | | $ | 40.0 | | | $ | 10.4 | | | $ | 10.4 | | | $ | 19.1 | |
Gross refining margin ($/throughput bbl) (b) | | $ | 2.12 | | | $ | 1.62 | | | $ | 1.63 | | | $ | 3.17 | |
Production costs before DD&A expense ($/throughput bbl) (c) | | $ | 4.86 | | | $ | 5.67 | | | $ | 4.35 | | | $ | 4.53 | |
| (a) | We define heavy crude oil as crude oil with an American Petroleum Institute gravity of 24 degrees or less. |
| (b) | We use gross refining margin per barrel to evaluate performance and compare profitability to other companies in the industry. There are a variety of ways to calculate gross refining margin per barrel; different companies within the industry may calculate it in different ways. We calculate gross refining margin per barrel by dividing gross refining margin (revenues less feedstocks, purchased refined products, refinery fuel burn, and transportation and distribution costs) by total refining throughput. |
| (c) | We use production costs before DD&A expense per barrel to evaluate performance and compare efficiency to other companies in the industry. There are a variety of ways to calculate production cost before DD&A expense per barrel; different companies within the industry calculate it in different ways. We calculate production costs before DD&A expense per barrel by dividing all direct production costs by total refining throughput. |
Commodity Marketing and Logistics
During the third quarter, our wholly owned subsidiary, Texadian Energy, Inc., generated gross margin of $0.8 million vs. $2.6 million for the third quarter 2013, a decrease of approximately $1.8 million. During the third quarter 2014, segment operating loss was $0.5 million which included approximately $0.5 million of DD&A expense vs. $0.9 million of operating income for the third quarter 2013 which included $0.6 million of DD&A expense.
During the nine months, Texadian generated gross margin of $5.0 million vs. $15.8 million for the nine months 2013, a decrease of approximately $10.8 million. During the nine months, segment operating income was $1.0 million which included approximately $1.5 million of DD&A expense vs. $9.2 million of operating income for the nine months 2013 which included $1.6 million of DD&A expense. Texadian profitability was lower because operating conditions on the Mississippi River during early 2013 provided the company a unique position to capture arbitrage opportunities; the conditions have since abated.
Natural Gas and Oil
Par’s investment in Piceance Energy, LLC is accounted for using the equity method of accounting. During the third quarter, Piceance generated revenue of $21.3 million vs. $14.6 million for the third quarter 2013, an increase of $6.7 million. During the quarter, Piceance generated operating income of approximately $0.9 million which included $9.6 million of DD&A expense vs. operating loss of $2.1 million for the third quarter 2013 which included $6.9 million of DD&A expense.
During the nine months, Piceance generated revenue of $62.3 million vs. $44.1 million for the nine months 2013, an increase of $18.2 million. During the nine months, Piceance generated operating income of approximately $6.5 million which included $24.9 million of DD&A expense vs. an operating loss of $3.9 million for the nine months 2013 which included $17.6 million of DD&A expense.
The change in operating income was driven by higher natural gas and natural gas liquids pricing. Piceance’s production for the third quarter 2014 was 4.8 Bcfe compared to 3.7 Bcfe for the third quarter 2013.
Conference Call
The company will host a live conference call on Wednesday, November 12, 2014, at 9:00 AM CT. You may listen or participate in the call by telephone or listen only on our webcast.
| | |
| Attendee Audio: |
| |
| Dial-In: | | 1(888) 517-2458 US Toll Free |
| |
| Passcode: | | 7642445# |
Live Audio Webcast:
http://event.onlineseminarsolutions.com/r.htm?e=881910&s=1&k=758C95FB38B72C597B389DDD0E2A07D9
Par Petroleum Corporation
Par Petroleum Corporation is a Houston-based company that manages and maintains interests in a variety of energy-related assets. Par is a growth company that looks for acquisitions with strong fundamentals and employees who can move the business forward.
Par, through its subsidiaries, owns and operates a 94,000 bpd refinery located in Hawaii on the island of Oahu. This refinery, together with substantial storage capacity, a 27-mile pipeline system, terminals, and retail outlets, provides a substantial portion of the energy demands of Hawaii.
Par’s largest oil and gas asset is its 33% ownership of Piceance Energy, LLC, which owns and operates natural gas properties located across approximately 40,000 acres in the Piceance Basin of Colorado.
Par also markets, transports and distributes crude petroleum-based energy products. With significant logistics capability on key pipeline systems, a rail car fleet, and a fleet of chartered barge tows, Par believes it has a competitive advantage in moving crude oil efficiently from land locked locations in the Western U.S. and Canada to the refining hubs in the Midwest, the Gulf Coast, and the East Coast.
Par’s charter contains restrictions that prohibit parties from acquiring 5% or more of Par’s common stock without the company’s prior consent.
Forward-Looking Statements
This press release includes “forward-looking statements” within the meaning of Section 27A of the Securities Act of 1933, as amended, and Section 21E of the Securities Exchange Act of 1934, as amended. All statement other than statements of historical fact are forward-looking statements. Forward-looking statements are subject to certain risks, trends and uncertainties that could cause actual results to differ materially from those projected. Among those risks, trends and uncertainties are our ability to successfully complete the pending acquisition of Mid Pac, integrate it into our operations and realize the anticipated benefits from the acquisition; our ability to identify all potential risks and liabilities in our due diligence of Mid Pac and its business; any unexpected costs or delays, including modifications to the terms of the transaction which may be required by our compliance with HSR, in connection with the pending acquisition of Mid Pac; the volatility of crude oil and refined product prices; uncertainties inherent in estimating oil, natural gas and NGL reserves; environmental risks; and risks of political or regulatory changes. Although the company believes that in making such forward-looking statements its expectations are based upon reasonable assumptions, such statements may be influenced by factors that could cause actual outcomes and results to be materially different from those projected. The company cannot assure that the assumptions upon which these statements are based will prove to have been correct. Important risk factors that may affect the company’s business, results of operations and financial position are discussed in its most recently filed Annual Report on Form 10-K, as amended, recent Quarterly Reports on Form 10-Q, recent Current Reports on Form 8-K and other SEC filings.
Investor Relations Contact:
Stonegate Securities, Inc.
Preston Graham
preston@stonegateinc.com
214-987-4121
ATTACHMENT 1
CONSOLIDATED STATEMENT OF OPERATIONS
(In thousands, except per share data)
| | | | | | | | | | | | | | | | |
| | | Three Months Ended | | | Nine Months Ended | |
| | | September 30, | | | September 30, | |
| | | 2014 | | | 2013 | | | 2014 | | | 2013 | |
Revenues | | | | | | | | | | | | | | | | |
Refining, distribution and marketing revenues | | $ | 799,213 | | | $ | 28,605 | | | $ | 2,292,202 | | | $ | 28,605 | |
Commodity marketing and logistics revenues | | | 53,406 | | | | 4,598 | | | | 102,384 | | | | 95,045 | |
Natural gas and oil revenues | | | 1,667 | | | | 2,182 | | | | 5,083 | | | | 5,988 | |
| | | | | | | | | | | | | | | | |
Total operating revenues | | | 854,286 | | | | 35,385 | | | | 2,399,669 | | | | 129,638 | |
Operating expenses | | | | | | | | | | | | | | | | |
Cost of revenues | | | 830,438 | | | | 30,656 | | | | 2,322,788 | | | | 107,841 | |
Operating expense, excluding depreciation, depletion and amortization expense | | | 42,729 | | | | 1,190 | | | | 109,897 | | | | 1,190 | |
Lease operating expense | | | 1,204 | | | | 1,015 | | | | 3,963 | | | | 4,214 | |
Depreciation, depletion, and amortization | | | 3,918 | | | | 1,218 | | | | 10,269 | | | | 3,022 | |
Loss (gain) on sale of assets, net | | | 624 | | | | — | | | | 624 | | | | (50 | ) |
Trust litigation and settlements | | | — | | | | 549 | | | | — | | | | 5,713 | |
General and administrative expense | | | 8,115 | | | | 3,026 | | | | 18,782 | | | | 11,795 | |
Acquisition and integration costs | | | 3,856 | | | | 6,147 | | | | 9,126 | | | | 6,437 | |
| | | | | | | | | | | | | | | | |
Total operating expenses | | | 890,884 | | | | 43,801 | | | | 2,475,449 | | | | 140,162 | |
| | | | | | | | | | | | | | | | |
Operating loss | | | (36,598 | ) | | | (8,416 | ) | | | (75,780 | ) | | | (10,524 | ) |
Other income (expense) | | | | | | | | | | | | | | | | |
Interest expense and financing costs, net | | | (7,076 | ) | | | (3,935 | ) | | | (13,980 | ) | | | (9,761 | ) |
Other income (expense), net | | | (164 | ) | | | 28 | | | | (304 | ) | | | 747 | |
Change in value of common stock warrants | | | 2,401 | | | | (1,390 | ) | | | 4,118 | | | | (6,690 | ) |
Change in value of contingent consideration | | | 996 | | | | — | | | | 5,758 | | | | — | |
Equity earnings (losses) from Piceance Energy, LLC | | | 835 | | | | (907 | ) | | | 1,374 | | | | (1,772 | ) |
| | | | | | | | | | | | | | | | |
Total other income (expense), net | | | (3,008 | ) | | | (6,204 | ) | | | (3,034 | ) | | | (17,476 | ) |
| | | | | | | | | | | | | | | | |
Loss before income taxes | | | (39,606 | ) | | | (14,620 | ) | | | (78,814 | ) | | | (28,000 | ) |
Income tax benefit (expense) | | | 150 | | | | — | | | | 113 | | | | (650 | ) |
| | | | | | | | | | | | | | | | |
Net loss | | $ | (39,456 | ) | | $ | (14,620 | ) | | | (78,701 | ) | | | (28,650 | ) |
| | | | | | | | | | | | | | | | |
Basic and diluted loss per common share | | $ | (1.19 | ) | | $ | (0.87 | ) | | $ | (2.51 | ) | | $ | (1.77 | ) |
| | | | | | | | | | | | | | | | |
Weighted average number of shares outstanding: | | | | | | | | | | | | | | | | |
Basic | | | 33,137 | | | | 16,752 | | | | 31,311 | | | | 16,163 | |
Diluted | | | 33,137 | | | | 16,752 | | | | 31,311 | | | | 16,163 | |
ATTACHMENT 2
RECONCILIATION OF GAAP AND NON-GAAP PERFORMANCE MEASURES
Adjusted EBITDA
Below is a reconciliation of net loss as presented in accordance with United States generally accepted accounting principles (GAAP) to Adjusted EBITDA (a non-GAAP financial measure) as required under Regulation G of the Securities Exchange Act of 1934:
| | | | | | | | |
| (in thousands) | | Nine Months
ended September 30,
2014 | | | Quarter ended
September 30,
2014 | |
Adjusted EBITDA | | $ | (56,689) | | | $ | (28,988) | |
Change in value of common stock warrants | | | 4,118 | | | | 2,401 | |
Change in value of contingent consideration | | | 5,758 | | | | 996 | |
Equity earnings (losses) from Piceance Energy, LLC | | | 1,374 | | | | 835 | |
Acquisition and integration costs | | | (9,126) | | | | (3,856) | |
| | | | | | | | |
EBITDA | | | (54,565) | | | | (28,612) | |
Interest expense and financing costs, net | | | (13,980) | | | | (7,076) | |
Depreciation, depletion and amortization expense | | | (10,269) | | | | (3,918) | |
Income tax benefit (expense) | | | 113 | | | | 150 | |
| | | | | | | | |
Net loss | | $ | (78,701) | | | $ | (39,456) | |
| | | | | | | | |
Adjusted EBITDA should not be considered in isolation or as a substitute for operating income, net income or loss, cash flows provided by operating, investing and financing activities, or other income or cash flow statement data prepared in accordance with GAAP. However, we believe Adjusted EBITDA is a useful supplemental financial measure to assess:
| | • | | The financial performance of our assets without regard to financing methods, capital structure or historical cost basis; |
| | • | | The ability of our assets to generate cash to pay interest on our indebtedness; and |
| | • | | Our operating performance and return on invested capital as compared to other companies without regard to financing methods and capital structure. |
Adjusted EBITDA has limitations as an analytical tool and should not be considered an alternative to net income, operating income, cash flow from operating activities or any other measure of financial performance or liquidity presented in accordance with GAAP. Adjusted EBITDA excludes some, but not all, items that affect net income and operating income and these measures may vary among other companies. Limitations to using Adjusted EBITDA as an analytical tool include:
| | • | | Adjusted EBITDA does not reflect the company’s current or future requirements for capital expenditures or capital commitments; |
| | • | | Adjusted EBITDA does not reflect changes in, or cash requirements necessary to service interest or principal payments on, the company’s debt; |
| | • | | Although depreciation and amortization are non-cash charges, the assets being depreciated and amortized will often have to be replaced in the future, and Adjusted EBITDA does not reflect any cash requirements for such replacements; and |
| | • | | Other companies may calculate Adjusted EBITDA differently than we do, limiting its usefulness as a comparative measure. |
Gross Margin
Below is a reconciliation of operating (loss) income as presented in accordance with United States generally accepted accounting principles (GAAP) to gross margin (a non-GAAP financial measure) as required under Regulation G of the Securities Exchange Act of 1934:
| | | | | | | | |
| | | Quarter Ended September 30,
2014 | |
| (in thousands) | | Refining,
distribution
and marketing | | | Commodity
marketing and
logistics | |
Gross margin | | $ | 21,392 | | | $ | 789 | |
Operating expense, excluding DD&A expense | | | (42,729 | ) | | | — | |
Depreciation, depletion and amortization expense | | | (2,765 | ) | | | (499 | ) |
General and administrative expense | | | (2,737 | ) | | | (769 | ) |
Acquisition and integration costs | | | (98 | ) | | | — | |
| | | | | | | | |
Operating (loss) income | | $ | (26,937 | ) | | $ | (479 | ) |
| | | | | | | | |
| | | | | | | | |
| | | Nine Months Ended
September 30, 2014 | |
| (in thousands) | | Refining,
distribution
and marketing | | | Commodity
marketing and
logistics | |
Gross margin | | $ | 66,813 | | | $ | 4,985 | |
Operating expense, excluding DD&A expense | | | (109,897 | ) | | | — | |
Depreciation, depletion and amortization expense | | | (7,497 | ) | | | (1,513 | ) |
General and administrative expense | | | (4,006 | ) | | | (2,426 | ) |
Acquisition and integration costs | | | (4,126 | ) | | | — | |
| | | | | | | | |
Operating (loss) income | | $ | (58,713 | ) | | $ | 1,046 | |
| | | | | | | | |
| | | | | | | | |
| | | Commodity marketing and logistics | |
| (in thousands) | | For the Three Months
Ended September 30,
2013 | | | For the Nine Months
Ended September 30,
2013 | |
Gross margin | | $ | 2,552 | | | $ | 15,814 | |
Depreciation, depletion and amortization expense | | | (599 | ) | | | (1,630 | ) |
General and administrative expense | | | (1,045 | ) | | | (5,014 | ) |
| | | | | | | | |
Operating income | | $ | 908 | | | $ | 9,170 | |
| | | | | | | | |
Gross margin is defined as revenues less cost of revenues, excluding operating expenses and depreciation, depletion and amortization expense. We believe gross margin is an important measure of operating performance and provides useful information to investors because it eliminates the impact of volatile market prices on revenues and demonstrates the earnings potential of the business before other fixed and variable costs. In order to assess our operating performance, we compare our gross margin (revenue less cost of revenues) to industry gross margin benchmarks.
Gross margin should not be considered an alternative to operating (loss) income, net cash flows from operating activities or any other measure of financial performance or liquidity presented in accordance with GAAP. Gross margin presented by other companies may not be comparable to our presentation since each company may define this term differently.
|
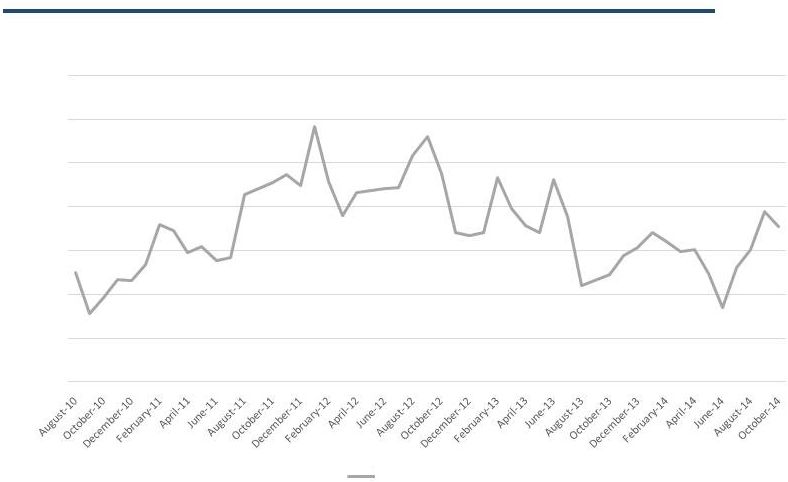
Benchmark Crack Spreads – Singapore $/BBL $- $2.00 $4.00 $6.00 $8.00 $10.00 $12.00 $14.00 Singapore 4:1:2:1 Crack Spreads Singapore 4:1:2:1 *Data Source: Platts, OPIS, and the Intercontinental Exchange **The 4:1:2:1 Crack Spread is computed by taking 1 part gasoline (Platts RON 92), 2 parts middle distillates (Platts Sing Jet & Sing Gasoil), and 1 part fuel oil (Platts Sing 180) created from a barrel of Brent Crude ATTACHMENT 3 MARKET INFORMATION This information will be referenced in the company's earnings call on Wednesday, November 12, 2014 at 9:00 AM CT. |
|
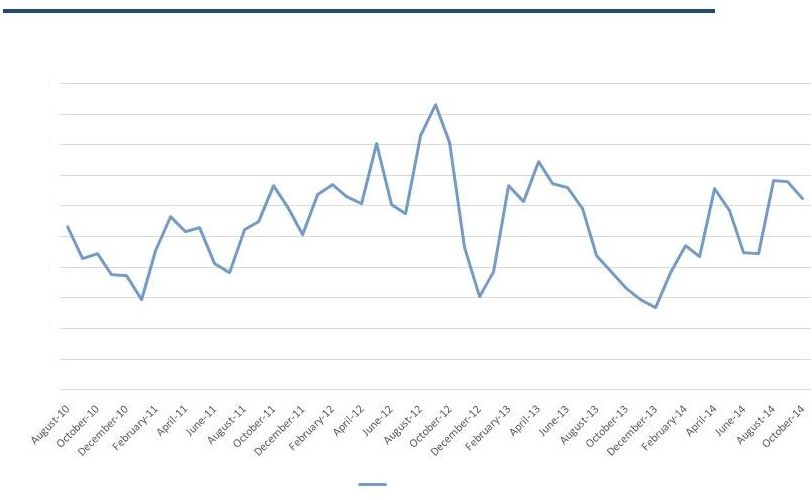
Benchmark Crack Spreads – San Francisco $- $2.00 $4.00 $6.00 $8.00 $10.00 $12.00 $14.00 $16.00 $18.00 $20.00 San Fran 4:1:2:1 Crack Spreads San Fran 4:1:2:1 $/BBL *Data Source: Platts, OPIS, and the Intercontinental Exchange **The 4:1:2:1 Crack Spread is computed by taking 1 part gasoline (OPIS SF Reg Unl), 2 parts middle distillates (OPIS SF Jet 54 & SF ULSD), and 1 part fuel oil (Platts SF 180 Waterborne) created from a barrel of Brent Crude |
|
Quarterly 4:1:2:1 Crack Spread Comparison Quarterly 4:1:2:1 Crack Spread Comparison (Dollars per Barrel) Oct 14 Q3 14 Q2 14 Q1 14 Q4 13 Q3 13 Q2 13 Q1 13 Singapore $ 7.11 $ 6.34 $ 4.79 $ 6.39 $ 5.60 $ 5.18 $ 7.74 $ 8.01 San Francisco $ 12.46 $ 12.05 $ 11.29 $ 8.59 $ 5.96 $ 9.70 $ 13.86 $ 11.12 50% Sing, 50% San Fran $ 9.78 $ 9.20 $ 8.04 $ 7.49 $ 5.78 $ 7.44 $ 10.80 $ 9.56 *Data Source: Platts, OPIS, and the Intercontinental Exchange **The 4:1:2:1 Crack Spread is computed by taking 1 part gasoline, 2 parts middle distillates, and 1 part fuel oil created from a barrel of Brent Crude. For Singapore we use Platts RON 92, Platts Sing Jet, Platts Gasoil, and Platts Sing 180. For San Francisco we use OPIS Reg Unl, OPIS Jet 54, OPIS ULSD, and Platts SF 180 Waterborne. |
|
ANS Pricing vs. Brent $(5.00) $(4.00) $(3.00) $(2.00) $(1.00) $- $1.00 $2.00 $3.00 $4.00 $5.00 $75.00 $80.00 $85.00 $90.00 $95.00 $100.00 $105.00 $110.00 $115.00 $120.00 Brent vs Alaska North Slope Brent ANS ANS (-) Brent $/BBL $/BBL *Source: Argus Media and the Intercontinental Exchange **The ANS information has been provided by and remains the exclusive property of Argus Media, Inc. The ANS information may not be reproduced in any other form or for any other purpose whatsoever without the prior written consent of Argus Media, Inc. |