Exhibit (e)
Group management report
KFW
Basic information on KfW Group
Overview
Strategic objectives
Internal management system
Economic report
General economic environment
Development of KfW Group
Development of earnings position
Development of net assets
Development of financial position
Subsequent events (as of 3 March 2015)
Risk report
Current developments
Basic principles and objectives of risk management
Organisation of risk management and monitoring
Risk management approach of KfW Group
Overview
Internal capital adequacy assessment process
Types of risk
Counterparty default risk
Market price risk
Liquidity risk
Operational risk and business continuity management (operating risk)
Other risks
Internal monitoring procedures
Forecast and opportunity report
General economic environment, development trends
Risk outlook – Risk situation and risk-bearing capacity
New business projections
Funding projections
Earnings projections
HR strategy/development of workforce
3 3 4 5 6 6 7 9 12 14 15 16 16 17 17 19 19 20 24 24 30 31 33 34 35 37 37 37 39 41 41 42
Basic information on KfW Group
Overview
KfW Group consists of KfW and five consolidated subsidiaries. As the promotional bank of the Federal Republic of Germany – which owns 80% of KfW while the German Federal States own
20% – KfW is one of the world’s leading promotional banks.
The institutional framework for the promotional mandate including the Federal Republic of Germany’s liability for KfW’s obligations is defined in the KfW Law.
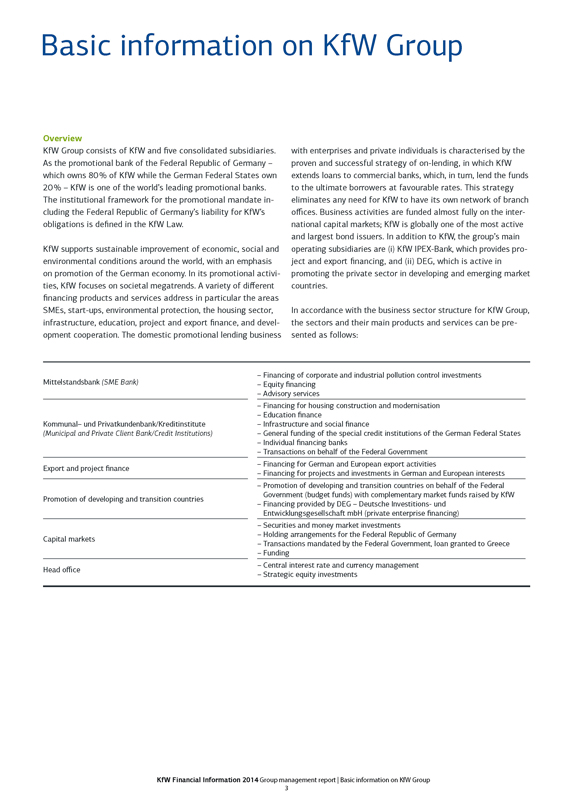
KfW supports sustainable improvement of economic, social and environmental conditions around the world, with an emphasis on promotion of the German economy. In its promotional activities, KfW focuses on societal megatrends. A variety of different financing products and services address in particular the areas SMEs, start-ups, environmental protection, the housing sector, infrastructure, education, project and export finance, and development cooperation. The domestic promotional lending business
with enterprises and private individuals is characterised by the proven and successful strategy of on-lending, in which KfW extends loans to commercial banks, which, in turn, lend the funds to the ultimate borrowers at favourable rates. This strategy eliminates any need for KfW to have its own network of branch offices. Business activities are funded almost fully on the international capital markets; KfW is globally one of the most active and largest bond issuers. In addition to KfW, the group’s main operating subsidiaries are (i) KfW IPEX-Bank, which provides project and export financing, and (ii) DEG, which is active in promoting the private sector in developing and emerging market countries.
In accordance with the business sector structure for KfW Group, the sectors and their main products and services can be presented as follows:
Mittelstandsbank (SME Bank)
Kommunal– und Privatkundenbank/Kreditinstitute
(Municipal and Private Client Bank/Credit Institutions)
Export and project finance
Promotion of developing and transition countries
Capital markets
Head office
– Financing of corporate and industrial pollution control investments
– Equity financing
– Advisory services
– Financing for housing construction and modernisation
– Education finance
– Infrastructure and social finance
– General funding of the special credit institutions of the German Federal States
– Individual financing banks
– Transactions on behalf of the Federal Government
– Financing for German and European export activities
– Financing for projects and investments in German and European interests
– Promotion of developing and transition countries on behalf of the Federal
Government (budget funds) with complementary market funds raised by KfW
– Financing provided by DEG – Deutsche Investitions- und
Entwicklungsgesellschaft mbH (private enterprise financing)
– Securities and money market investments
– Holding arrangements for the Federal Republic of Germany
– Transactions mandated by the Federal Government, loan granted to Greece
– Funding
– Central interest rate and currency management
– Strategic equity investments
KfW Financial Information 2014 Group management report | Basic information on KfW Group 3
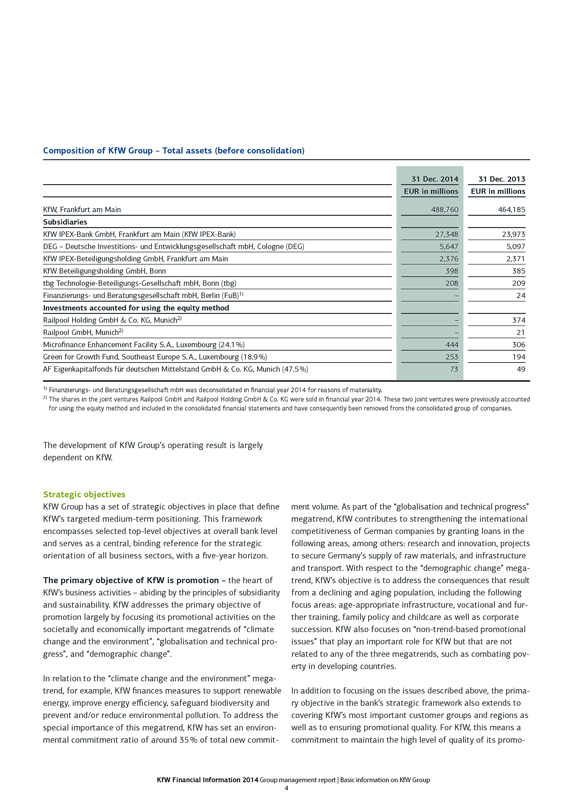
Composition of KfW Group – Total assets (before consolidation)
KfW, Frankfurt am Main
Subsidiaries
KfW IPEX-Bank GmbH, Frankfurt am Main (KfW IPEX-Bank)
DEG – Deutsche Investitions- und Entwicklungsgesellschaft mbH, Cologne (DEG)
KfW IPEX-Beteiligungsholding GmbH, Frankfurt am Main
KfW Beteiligungsholding GmbH, Bonn
tbg Technologie-Beteiligungs-Gesellschaft mbH, Bonn (tbg)
Finanzierungs- und Beratungsgesellschaft mbH, Berlin (FuB)1)
Investments accounted for using the equity method
Railpool Holding GmbH & Co. KG, Munich2)
Railpool GmbH, Munich2)
Microfinance Enhancement Facility S.A., Luxembourg (24.1%)
Green for Growth Fund, Southeast Europe S.A., Luxembourg (18.9%)
AF Eigenkapitalfonds für deutschen Mittelstand GmbH & Co. KG, Munich (47.5%)
31 Dec. 2014 EUR in millions 488,760 27,348 5,647 2,376 398 208 – – – 444 253 73
31 Dec. 2013 EUR in millions 464,185 23,973 5,097 2,371 385 209 24 374 21 306 194 49
1) Finanzierungs- und Beratungsgesellschaft mbH was deconsolidated in financial year 2014 for reasons of materiality.
2) The shares in the joint ventures Railpool GmbH and Railpool Holding GmbH & Co. KG were sold in financial year 2014. These two joint ventures were previously accounted for using the equity method and included in the consolidated financial statements and have consequently been removed from the consolidated group of companies.
The development of KfW Group’s operating result is largely dependent on KfW.
Strategic objectives
KfW Group has a set of strategic objectives in place that define KfW’s targeted medium-term positioning. This framework encompasses selected top-level objectives at overall bank level and serves as a central, binding reference for the strategic orientation of all business sectors, with a five-year horizon.
The primary objective of KfW is promotion – the heart of KfW’s business activities – abiding by the principles of subsidiarity and sustainability. KfW addresses the primary objective of promotion largely by focusing its promotional activities on the societally and economically important megatrends of “climate change and the environment”, “globalisation and technical progress”, and “demographic change”.
In relation to the “climate change and the environment” megatrend, for example, KfW finances measures to support renewable energy, improve energy efficiency, safeguard biodiversity and prevent and/or reduce environmental pollution. To address the special importance of this megatrend, KfW has set an environmental commitment ratio of around 35% of total new commitment volume. As part of the “globalisation and technical progress” megatrend, KfW contributes to strengthening the international competitiveness of German companies by granting loans in the following areas, among others: research and innovation, projects to secure Germany’s supply of raw materials, and infrastructure and transport. With respect to the “demographic change” megatrend, KfW’s objective is to address the consequences that result from a declining and aging population, including the following focus areas: age-appropriate infrastructure, vocational and further training, family policy and childcare as well as corporate succession. KfW also focuses on “non-trend-based promotional issues” that play an important role for KfW but that are not related to any of the three megatrends, such as combating poverty in developing countries.
In addition to focusing on the issues described above, the primary objective in the bank’s strategic framework also extends to covering KfW’s most important customer groups and regions as well as to ensuring promotional quality. For KfW, this means a commitment to maintain the high level of quality of its promo-
KfW Financial Information 2014 Group management report | Basic information on KfW Group 4
tional products that it has achieved in recent years and sufficient coverage of KfW’s key regions and customer groups. KfW aims to have around 50% of new domestic promotional business volume utilised for the SME target group because of its special importance.
The stated priorities set for the primary objective are complemented by a set of secondary objectives or strict ancillary conditions that reflect profitability and risk-bearing capacity aspects. Moreover, KfW’s success depends upon continuing to pursue the path of professionalism in the modernisation process upon which it has embarked.
Internal management system
KfW has a closely interlinked strategy and planning process. The results of the strategic planning process are summarised in the business strategy adopted by the Executive Board, which comprises KfW Group’s strategic objectives for its main business activities as well as the contribution of the different business sectors to the strategic target system and measures for achieving the individual targets. The business strategy forms the basis for the risk strategy. The business and risk strategies are approved by the Executive Board and then presented to the supervisory body (Board of Supervisory Directors) for approval (at the last Board of Supervisory Directors meeting each year).
Conceived as a group-wide strategy process, group business sector planning is KfW Group’s central planning and management tool. The group business sector planning process deals first with strategic planning with a medium to long-term perspective and then with operational planning focused on the following financial year. The group-wide strategic objectives set by the Executive Board form the basis for the strategic planning stage.
Strategic courses of action are developed by the business sectors within this strategic activities framework. Assumptions are made with respect to the future development of determining factors on the basis of assessments of risks and opportunities. These assessments take into account internal factors and resources, as well as targeted earnings levels. The central areas
(e.g. Information Technology, Human Ressources, and Central Services) also play important roles in achieving the strategic objectives. By involving the central areas in the planning phase, the consistency of their strategic considerations with the larger strategic objectives is enhanced. Cost and FTE planning are conducted in parallel to business sector strategic planning for all areas, applying a top-down approach.
The Executive Board defines business sector objectives, including cost targets, for all sectors in the form of guidelines on the basis of a group-level assessment of these strategic considerations. The business sectors plan their new business, risks and earnings, and all areas of the bank plan their budgets for the following year based on these guidelines, taking into account any changes in external or internal factors. These plans are
checked for consistency with the group’s strategic planning and for any risk implications. A forecast for the following three years is then calculated in this context. The Executive Board either approves the resultant operating budget or instructs the business sectors to adjust their plans. Any changes to the business strategy are subject to consultation with risk management in order to ensure consistency of business and risk strategy. The operational planning process ends when management has adopted the final budget for the next financial year.
The Executive Board reviews achievement of the objectives both on a regular and an ad hoc basis during the current financial year. The assumptions concerning external and internal factors made when determining the business strategy are also subject to regular checks. As part of strategic controlling, the development of relevant control variables, their attainment, and the cause of any failure in this respect are analysed on an ongoing basis using the strategic objectives and the business sectors’ strategic plans. Ad hoc issues of strategic relevance are also addressed in consultation with group areas. Recommendations for action concerning potential strategy adjustments or an optimised use of resources are made to the Executive Board by means of the monthly strategic performance report and the quarterly strategy and efficiency report. The results of the analysis are included in further strategy discussions and strategic planning processes.
The achievement of objectives is regularly monitored by the Board of Supervisory Directors based on reports submitted to it according to the Bylaws of KfW. The commentary in these reports outlines analyses of causes and any potential plans for action.
Comprehensive and detailed reports are prepared on a monthly/quarterly basis as part of operational controlling. These detailed analyses comprise earnings, cost and full-time equivalents (“FTE”) developments and are reported to specific departments. Additionally, complete analyses and extrapolations of significant relevance to the overall group performance are also presented directly to the Executive Board.
KfW Financial Information 2014 Group management report | Basic information on KfW Group 5
Economic report
General economic environment
Overall, the development of the global economy was disappointing in 2014. Momentum in major countries and economic areas was considerably lower than anticipated at the beginning of the year. Among the industrialised countries, this was particularly the case for the euro area and Japan. Other industrialised countries performed surprisingly well (particularly the USA). As a group, the developing and emerging market countries continued to grow faster than the industrialised countries. Nevertheless, growth in many emerging market countries has decreased to a very low level, and some face real crises. This is the result of a variety of structural weaknesses that require fundamental reform and will take time to overcome. The decline of the oil price, which fell considerably in 2014, caused a swift from oil exporters to oil importers. Many oil exporting countries were able to weather the losses, but others encountered serious difficulties. This is particularly significant when combined with regional or geopolitical risks, as in the case of Russia. The world economy was affected by various geopolitical risks in 2014.
Economic recovery was moderate in member states of the European Economic and Monetary Union (“EMU”) in 2014 and the growth environment remained very fragile. This was due to increased geopolitical risks, ongoing high unemployment and the continuing difficulties in accessing credit for many businesses and private households. Overall, the economic output in EMU member states increased by 0.9% year-on-year in 2014. Growth was thus weaker than KfW expected a year ago. In particular the increased uncertainty resulting from worsening geopolitical conflicts had a negative impact.
Germany grew considerably more strongly in 2014 than in the two previous years. The continuing favourable situation on the labour market, with employment recently hitting an all-time high (42.7 million people in employment), once again had a positive impact on consumer spending and housing construction. Private investments in both equipment and commercial buildings returned to positive territory for the first time since 2011. Unlike in 2013, net exports had a stimulating effect on economic growth. Annual average price-adjusted GDP for 2014 rose by 1.6% overall. This means that KfW correctly anticipated the trends in the GDP expenditure components a year ago, but that economic growth was in the lower range of the group’s projections, which had predicted growth of up to 2%. This was largely due to the disappointing performance in the second and third quarters of 2014, when economic activity was more or less flat in the face of an increasingly unfavourable international environment. The recovery in investment stalled and companies were unsettled by dashed growth expectations in the euro area and the numerous geopolitical crises.
The key factors influencing the financial markets in 2014 were the worsening geopolitical conflicts and continuing very expansionary monetary policies of the world’s largest central banks. While the US Federal Reserve tapered its securities purchases over the course of the year, bringing them to a close at the end of October, the Japanese and European central banks expanded their monetary stimulus measures. Financial markets around the world thus continued to benefit from abundant liquidity. Given the geopolitical risks, safe investments were particularly in demand. The beneficiaries included bonds from European countries undergoing reforms. Yields fell considerably and, in the case of Italy and Spain, reached new all-time lows for ten-year maturities.
The sudden, sharp fall in crude oil prices caused substantial unrest on the financial markets in the second half of 2014. The currency and financial markets of some oil-producing countries came under more pressure in this environment.
In response to the fragile economic environment and falling inflation, key interest rates in the euro area were cut further in the course of 2014. The European Central Bank agreed its first ever negative deposit rate. It also launched programmes to buy covered bonds and asset-backed securities in the autumn and raised the prospect of further measures. In light of this, there was a major decline in money market rates in the euro area from mid-year onwards. Subject to some volatility, US money market rates trended almost sideways into the autumn. It was not until the end of the year that they rose somewhat amid speculation that key interest rates in the USA were about to turn. Over longer maturities, interest rates in the euro area saw a clear downward trend in 2014. Yields on ten-year German government bonds fell by almost 140 basis points to reach a new low of 0.54% p.a. in late December. Yields on ten-year US government bonds saw greater volatility during the year. By year-end they were a full 85 basis points lower than at the start. Yields on ten-year German government bonds in 2014 were down an average of 40 basis points year-on-year, while yields on ten-year US government bonds recorded an increase of around 20 basis points compared to their 2013 average. In the USA, the average slope of yield curves increased in 2014 compared to 2013, while those in Europe flattened.
The diverging monetary policy prospects in the euro area and the USA put considerable downward pressure on the EUR/USD exchange rate. This hit 1.21 at the end of December, the lowest it had been all year. The average exchange rate in 2014 was 1.33, almost unchanged on the previous year.
KfW Financial Information 2014 Group management report | Economic report 6
Development of KfW Group
KfW reported another highly satisfactory financial year in 2014. The plans and strategic objectives for the positioning targeted in the medium term were achieved overall. In spite of an increasingly difficult environment, the 2014 financial year was a successful one with a promotional business volume of EUR 74.1 billion (2013: EUR 72.5 billion). Promotional activities focused on the socially and economically significant megatrends of “climate change and the environment”, “globalisation and technical progress” and “demographic change”. The measures introduced for comprehensive modernisation were continued.
The earnings position developed better than expected, exceeding the figure reported in 2013, primarily as a result of the excellent valuation result. At EUR 2.0 billion, the Operating result before valuation (before promotional activity) is, as expected, lower year-on-year (2013: EUR 2.3 billion). This was primarily due to the deterioration of the interest rate environment. The figure was also lower than projected. The cost-income ratio (before promotional activity) increased to 34.4% as a result of declining operating income and increasing administrative costs. The latter were attributable in particular to modernisation efforts and regulatory measures, such as KfW’s mandatory application, by analogy, of the German Banking Act (Kreditwesengesetz – “KWG”). The valuation result closed with moderate expenses in net terms and thus much better than expected. This was primarily due to lower than projected net charges from risk provisions for lending business as well as to positive contributions to earnings from the securities and equity investment portfolios. At EUR 1.5 billion (2013: EUR 1.3 billion), consolidated profit exceeded the projected level. With this result, KfW is improving its capital base in order to safeguard its promotional capacity in the long term and to ensure it can meet higher regulatory requirements. In its current consolidated income projections for 2015, KfW expects Consolidated profit before IFRS effects from hedging of slightly under EUR 1 billion, which is in the range of strategic projections.
Consolidated total assets rose by EUR 24.3 billion to EUR 489.1 billion in 2014. This increase is primarily due to interest-rate and exchange-rate-induced fair value changes
in derivatives used for hedging purposes and their recognition in hedge accounting. The increase in the volume of new business is reflected in the EUR 7.1 billion rise in Net loans and advances to EUR 365.3 billion. Unscheduled repayments in domestic promotional lending business decreased year-on-year. The promotional business is primarily funded through the international capital markets. The volume of own issues reported under Certificated liabilities amounted to EUR 404.0 billion (year-end 2013: EUR 385.5 billion).
KfW Group’s business in 2014 was largely characterised by the following developments:
A. Successful promotional year for KfW
With a promotional business volume of EUR 74.1 billion in 2014 (2013: EUR 72.5 billion), the group exceeded its projected new business volume of EUR 69.4 billion.
KfW’s domestic promotional business reached a high level with commitments totalling EUR 47.6 billion, despite companies’ declining investment propensity (2013: EUR 51.6 billion). The decline on the previous year had been expected and primarily affects corporate financing by Mittelstandsbank. This development is also reflected by the decline in the SME share of financing to 44% (2013: 47%). Foreign business, meanwhile, recorded strong growth and reached EUR 25.5 billion. This development was due to both stronger demand in business sector Export and project finance and higher commitments in business sector Promotion of developing and transition countries. A high 36% across all business sectors was attributable to the “climate change and environment” megatrend (2013: 38%). The promotional business volume in the business sector Capital markets expanded to EUR 1.2 billion.
KfW raised EUR 57.4 billion on the international capital markets to fund its business activities (2013: EUR 65.4 billion). The lower borrowing, compared to both the previous year and the forecast level (EUR 65 to 70 billion), was largely due to declining yet still high unscheduled repayments in the lending business, which led to greater cash inflow than expected.
KfW Financial Information 2014 Group management report | Economic report 7
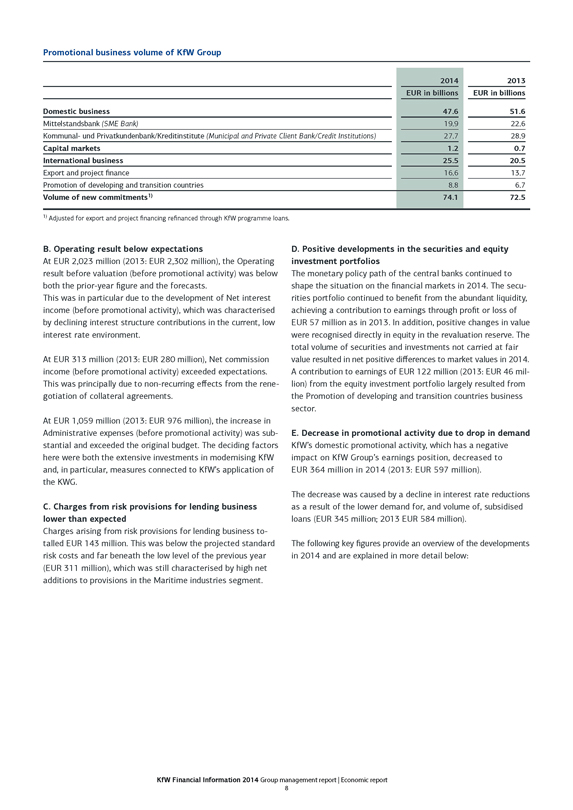
Promotional business volume of KfW Group
Domestic business
Mittelstandsbank (SME Bank)
Kommunal- und Privatkundenbank/Kreditinstitute (Municipal and Private Client Bank/Credit Institutions)
Capital markets
International business
Export and project finance
Promotion of developing and transition countries
Volume of new commitments1)
2014 EUR in billions 47.6 19.9 27.7 1.2 25.5 16.6 8.8 74.1
2013 EUR in billions 51.6 22.6 28.9 0.7 20.5 13.7 6.7 72.5
1) Adjusted for export and project financing refinanced through KfW programme loans.
B. Operating result below expectations
At EUR 2,023 million (2013: EUR 2,302 million), the Operating result before valuation (before promotional activity) was below both the prior-year figure and the forecasts.
This was in particular due to the development of Net interest income (before promotional activity), which was characterised by declining interest structure contributions in the current, low interest rate environment.
At EUR 313 million (2013: EUR 280 million), Net commission income (before promotional activity) exceeded expectations. This was principally due to non-recurring effects from the renegotiation of collateral agreements.
At EUR 1,059 million (2013: EUR 976 million), the increase in Administrative expenses (before promotional activity) was substantial and exceeded the original budget. The deciding factors here were both the extensive investments in modernising KfW and, in particular, measures connected to KfW’s application of the KWG.
C. Charges from risk provisions for lending business lower than expected
Charges arising from risk provisions for lending business totalled EUR 143 million. This was below the projected standard risk costs and far beneath the low level of the previous year (EUR 311 million), which was still characterised by high net additions to provisions in the Maritime industries segment.
D. Positive developments in the securities and equity investment portfolios
The monetary policy path of the central banks continued to shape the situation on the financial markets in 2014. The securities portfolio continued to benefit from the abundant liquidity, achieving a contribution to earnings through profit or loss of EUR 57 million as in 2013. In addition, positive changes in value were recognised directly in equity in the revaluation reserve. The total volume of securities and investments not carried at fair value resulted in net positive differences to market values in 2014. A contribution to earnings of EUR 122 million (2013: EUR 46 million) from the equity investment portfolio largely resulted from the Promotion of developing and transition countries business sector.
E. Decrease in promotional activity due to drop in demand
KfW’s domestic promotional activity, which has a negative impact on KfW Group’s earnings position, decreased to EUR 364 million in 2014 (2013: EUR 597 million).
The decrease was caused by a decline in interest rate reductions as a result of the lower demand for, and volume of, subsidised loans (EUR 345 million; 2013 EUR 584 million).
The following key figures provide an overview of the developments in 2014 and are explained in more detail below:
KfW Financial Information 2014 Group management report | Economic report 8
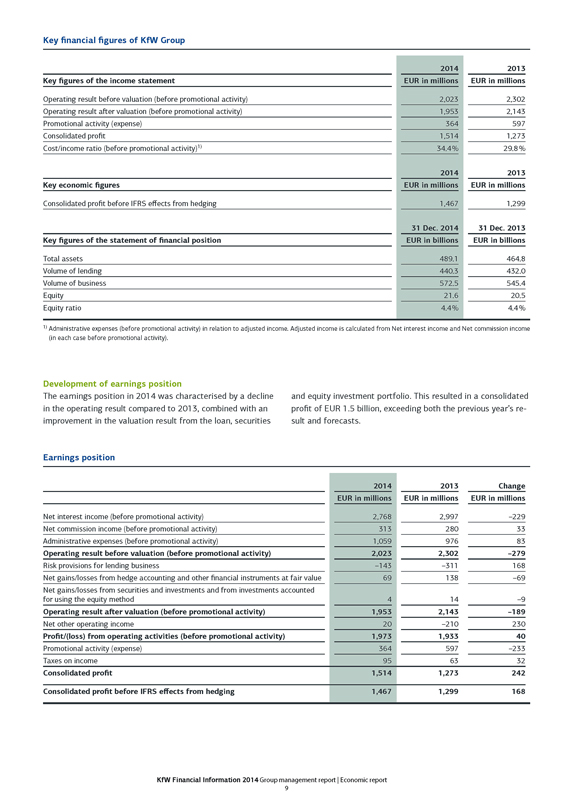
Key financial figures of KfW Group
Key figures of the income statement
Operating result before valuation (before promotional activity)
Operating result after valuation (before promotional activity)
Promotional activity (expense)
Consolidated profit
Cost/income ratio (before promotional activity)1)
Key economic figures
Consolidated profit before IFRS effects from hedging
Key figures of the statement of financial position
Total assets
Volume of lending
Volume of business
Equity
Equity ratio
2014 EUR in millions 2,023 1,953 364 1,514 34.4% 2014 EUR in millions 1,467 31 Dec. 2014 EUR in billions 489.1 440.3 572.5 21.6 4.4%
2013 EUR in millions 2,302 2,143 597 1,273 29.8% 2013 EUR in millions 1,299 31 Dec. 2013 EUR in billions 464.8 432.0 545.4 20.5 4.4%
1) Administrative expenses (before promotional activity) in relation to adjusted income. Adjusted income is calculated from Net interest income and Net commission income (in each case before promotional activity).
Development of earnings position
The earnings position in 2014 was characterised by a decline in the operating result compared to 2013, combined with an improvement in the valuation result from the loan, securities
and equity investment portfolio. This resulted in a consolidated profit of EUR 1.5 billion, exceeding both the previous year’s result and forecasts.
Earnings position
Net interest income (before promotional activity)
Net commission income (before promotional activity)
Administrative expenses (before promotional activity)
Operating result before valuation (before promotional activity)
Risk provisions for lending business
Net gains/losses from hedge accounting and other financial instruments at fair value
Net gains/losses from securities and investments and from investments accounted for using the equity method
Operating result after valuation (before promotional activity)
Net other operating income
Profit/(loss) from operating activities (before promotional activity)
Promotional activity (expense)
Taxes on income
Consolidated profit
Consolidated profit before IFRS effects from hedging
2014 EUR in millions 2,768 313 1,059 2,023 –143 69 4 1,953 20 1,973 364 95 1,514 1,467
2013 EUR in millions 2,997 280 976 2,302 –311 138 14 2,143 –210 1,933 597 63 1,273 1,299
Change EUR in millions –229 33 83 –279 168 –69 –9 –189 230 40 –233 32 242 168
KfW Financial Information 2014 Group management report | Economic report 9
At EUR 2,023 million (2013: EUR 2,302 million), the Operating result before valuation (before promotional activity) was below both the prior-year figure and forecasts.
At EUR 2,768 million, Net interest income (before promotional activity) decreased due to the worsening of the interest rate environment with a low interest rate and flatter yield curve than in the 2013 financial year (EUR 2,997 million). However, it remains the most important source of income.
While the interest margins in the lending business, particularly from the business sector Export and project finance, remained stable and KfW enjoyed very good funding opportunities given its high credit rating, Net interest income declined due to the lower profit from maturity transformation, which was less than expected. Interest rate movements resulted in lower income from reinvestment following the very high unscheduled repayments in the previous years and the declining but still high unscheduled repayments in the current financial year. Income from early repayment penalties as a result of unscheduled repayments in 2014, which may in the future lead to corresponding reduced income, was down year-on-year.
The Net commission income (before promotional activity) was EUR 313 million, which is higher than the 2013 figure of EUR 280 million.
Non-recurring compensation paid by derivatives partners following renegotiation of the collateral agreements totalled EUR 57 million in the 2014 financial year and was a key factor for the increase in Net commission income (before promotional activity). At EUR 82 million, loan processing fees moved in the opposite direction (2013: EUR 91 million). Income generated from managing Financial Cooperation on behalf of the German Federal Government in the business sector Promotion of developing and transition countries, which included non-recurring effects in the previous year due to renegotiation of the remuneration arrangement, also decreased, to EUR 156 million (2013: EUR 169 million). This item was offset by an increase in KfW’s Administrative expenses, in part, due to branch offices in partner countries.
The substantial rise in Administrative expenses (before promotional activity) to EUR 1,059 million (2013: EUR 976 million) was in particular due to the measures required to fulfil KWG requirements and to extensive investments in modernising KfW accounted for as Personnel and Non-personnel expenses. Projections were exceeded as a result of non-recurring effects.
Personnel expenses increased by EUR 44 million to EUR 585 million (2013: EUR 541 million). This was due to the higher number of employees, standard and performance-based pay increases as well as non-recurring charges connected to the ongoing revaluation of personnel measures taken in previous years.
Non-personnel expenses (before promotional activity) amounted to EUR 474 million (2013: EUR 434 million). Besides the non- recurring charges in connection with the ECB review of KfW IPEX-Bank, the increase of EUR 40 million was attributable
to advisory services. These services related in particular to the necessary fulfilment of regulatory requirements and the comprehensive modernisation of KfW’s IT architecture, which will continue to be intensively pursued in the next few years. This extensive project portfolio is also expected to lead to a rise in Administrative expenses in the future, particularly due to the mandatory application of significant bank regulatory requirements.
The cost-income ratio before promotional activity increased to
34.4% (2013: 29.8%). This was primarily due to the expected decline in operating income as well as increased expenditure associated with KfW’s mandatory application of the KWG and the further modernisation of KfW.
KfW Group’s Risk provisions for lending business resulted in charges of EUR 143 million (2013: EUR 311 million), which was below the projected standard risk costs. Risk provisions were required particularly in domestic business and in the Promotion of developing and transition countries business sector. Compared with the previous year, there was a lower requirement for risk provisioning of export and project financing in the Maritime industries segment.
At EUR 221 million, net additions to the provision for imminent credit risks including direct write-offs were significantly lower than in 2013 (EUR 382 million). This decline was particularly concentrated on the business sector Export and project finance with additions of just EUR 34 million (2013: EUR 218 million), especially in the Maritime industries segment with net additions of just EUR 4 million (2013: EUR 170 million). The Export and project finance business sector also recorded income from recoveries of loans written off totalling EUR 37 million (2013: EUR 22 million). The main focuses of the net additions in 2014 were the business sectors Promotion of developing and transition countries with EUR 64 million and Kommunal- und Privatkundenbank/Kreditinstitute with EUR 57 million. As of year-end 2014, risk provisions amounted to EUR 1.4 billion (2013: EUR
1.5 billion), of which EUR 0.7 billion (2013: EUR 0.9 billion) related to Export and project finance.
In 2014, there was almost no change in the risk provisions for loan portfolio risks which were not yet allocable. As of year-end 2014, risk provisions remained at EUR 0.6 billion.
Risk provisions for lending business cover all imminent and latent risks, reflecting the consistent implementation of KfW Group’s conservative risk policy.
Net gains/losses from hedge accounting and other financial instruments at fair value stood at EUR 69 million (2013: EUR 138 million) and in 2014 were primarily driven by positive effects from the equity investment portfolio partially offset by the valuation of foreign currency positions and hedging transactions.
The equity investment portfolio measured at fair value through profit or loss was primarily influenced by the positive perfor-
KfW Financial Information 2014 Group management report | Economic report 10
mance of investments and the appreciation of the US dollar against the euro. It generated income of EUR 175 million (2013: EUR 78 million). This contribution is primarily attributable to the business activities of DEG in promoting developing and transitional countries.
The result from foreign currency translation had a negative effect with a charge of EUR 57 million (2013: EUR –10 million). This was primarily attributable to non-monetary financial instruments in the US dollar equity investment portfolio not recognised at fair value, which are recognised at the rate on the transaction date, while the relevant refinancing is converted at the exchange rate on the balance sheet date.
Hedge accounting, borrowings recognised at fair value, including derivatives used for hedging purposes, and other derivatives transactions had a total net negative effect on earnings of EUR 54 million (2013: EUR +56 million). The mark-to-market derivatives are part of economically hedged positions. However, situations where the other part of the hedging relationship cannot be carried at fair value or has to be measured with a different method inevitably result in temporary fluctuations in income that fully reverse over the term of the transaction. Hedging derivatives that in previous years had led to purely IFRS-induced negative earnings effects were sold early in the reporting year in order to optimise collateral management. This did not have a significant impact on risk management.
Net gains from securities and investments accounted for using the equity method of EUR 4 million (2013: EUR 14 million) largely resulted from offsetting developments in the securities and equity investment portfolio.
Net gains/losses from securities not carried at fair value through profit or loss slightly improved on 2013 with a positive earnings contribution of EUR 53 million (2013: EUR 43 million). Structured securities performed particularly well.
The general development of financial markets led to an increase in the value of securities not recognised through profit or loss of EUR 55 million (2013: EUR 38 million), which were recognised in equity under Revaluation reserves. These increases included write-ups of EUR 22 million (2013: EUR 28 million) due to the reclassifications between measurement categories that took place in 2008 (structured securities) and 2009 (securities held as a liquidity reserve).
Moreover, the net negative difference of EUR 8 million between the carrying amount and the fair value for those securities and investments not carried at fair value improved by EUR 53 million (2013: by EUR 169 million) to a positive difference of EUR 45 million as of 31 December 2014. This development was primarily due to price recoveries of well-collateralised covered bonds and securities in the ABS portfolio. Overall, the total volume decreased further and amounted to EUR 9.2 billion as of 31 December 2014 (year-end 2013: EUR 10.3 billion).
Net losses from equity investments not carried at fair value through profit or loss amounted to EUR 54 million were largely due to Mittelstandsbank’s domestic promotional lending portfolio. The comparable expense for financial year 2013 was EUR 32 million.
Net other operating income of EUR 20 million (2013:
EUR –210 million) includes income from repurchasing own issues of EUR 29 million. The previous year’s negative result was primarily due to the non-recurring charge of EUR 264 million from the substitution of federal funds.
KfW’s domestic promotional activity, which has a negative impact on KfW Group’s earnings, fell below the prior-year level to EUR 364 million in 2014 (2013: EUR 597 million). This was due to a decline in demand.
The key component of KfW’s promotional activity is interest rate reductions. KfW grants these for certain domestic promotional loans during the first fixed interest rate period in addition to passing on its favourable refinancing conditions. The volume of interest rate reductions provided fell to EUR 345 million in 2014 (2013: EUR 584 million). This was primarily due to the decline, due to demand factors, in volume of interest rate-reduced promotional loans in Mittelstandsbank’s corporate financing, which resulted from ongoing investment reticence, uncertainties in the economic environment and, at the same time, the healthy liquidity position of businesses. The generally low interest rates also reduced the potential to stimulate the promotional business with additional reductions.
Moreover, promotional activities, as reported in Net commission income and Administrative expenses, were provided in the amount of EUR 19 million (2013: EUR 13 million). These activities were particularly targeted at improving sales opportunities for KfW’s promotional products.
Accounting for taxes on income, a consolidated profit of EUR 1,514 million was recorded, which exceeded that of the previous year (EUR 1,273 million). This performance is characterised by a very good valuation result in 2014 and high non-recurring charges from the substitution of federal funds in 2013.
Consolidated profit before IFRS effects from hedging is a further key financial figure based on consolidated profit in accordance with IFRS. Derivative financial instruments are entered into for hedging purposes. Under IFRS, the requirements for recognition and valuation of derivatives and hedges nevertheless give rise to temporary net gains or losses. In KfW’s opinion, such net gains or losses do not sufficiently reflect economically effective hedges.
KfW Financial Information 2014 Group management report | Economic report 11
As a result, the following reconciliations were performed by eliminating temporary contributions to income in the amount of EUR –47 million (2013: EUR +27 million) as follows:
– Valuation results from micro and macro hedge accounting. All hedging relationships are economically effective and do not give rise to any net gain or loss over the entire life of the hedge.
– Net gains or losses from the use of the fair value option to avoid an accounting mismatch in the case of borrowings include related hedging derivatives. Accumulated over the entire life of the hedge, the economically effective hedges do not give rise to any net gain or loss.
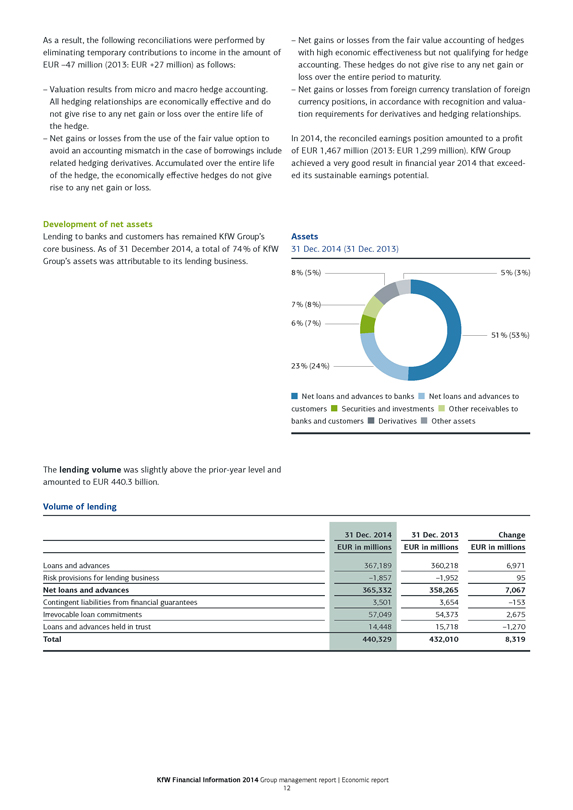
Development of net assets
Lending to banks and customers has remained KfW Group’s core business. As of 31 December 2014, a total of 74% of KfW Group’s assets was attributable to its lending business.
– Net gains or losses from the fair value accounting of hedges with high economic effectiveness but not qualifying for hedge accounting. These hedges do not give rise to any net gain or loss over the entire period to maturity.
– Net gains or losses from foreign currency translation of foreign currency positions, in accordance with recognition and valuation requirements for derivatives and hedging relationships.
In 2014, the reconciled earnings position amounted to a profit of EUR 1,467 million (2013: EUR 1,299 million). KfW Group achieved a very good result in financial year 2014 that exceeded its sustainable earnings potential.
Assets 31 Dec. 2014 (31 Dec. 2013) 8% 7% 6% 23% (24%) (5%) (8%) (7%)
5% (3%) 51% (53%)
Net loans and advances to banks Net loans and advances to customers Securities and investments Other receivables to banks and customers Derivatives Other assets
The lending volume was slightly above the prior-year level and amounted to EUR 440.3 billion.
Volume of lending
Loans and advances
Risk provisions for lending business
Net loans and advances
Contingent liabilities from financial guarantees
Irrevocable loan commitments
Loans and advances held in trust
Total
31 Dec. 2014 EUR in millions 367,189 –1,857 365,332 3,501 57,049 14,448 440,329
31 Dec. 2013 EUR in millions 360,218 –1,952 358,265 3,654 54,373 15,718 432,010
Change EUR in millions 6,971 95 7,067 –153 2,675 –1,270 8,319
KfW Financial Information 2014 Group management report | Economic report 12
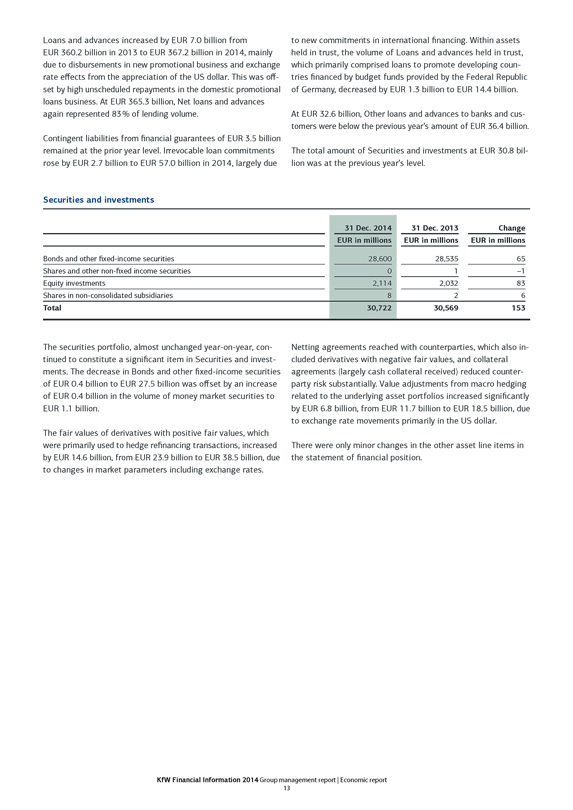
Loans and advances increased by EUR 7.0 billion from EUR 360.2 billion in 2013 to EUR 367.2 billion in 2014, mainly due to disbursements in new promotional business and exchange rate effects from the appreciation of the US dollar. This was offset by high unscheduled repayments in the domestic promotional loans business. At EUR 365.3 billion, Net loans and advances again represented 83% of lending volume.
Contingent liabilities from financial guarantees of EUR 3.5 billion remained at the prior year level. Irrevocable loan commitments rose by EUR 2.7 billion to EUR 57.0 billion in 2014, largely due
to new commitments in international financing. Within assets held in trust, the volume of Loans and advances held in trust, which primarily comprised loans to promote developing countries financed by budget funds provided by the Federal Republic of Germany, decreased by EUR 1.3 billion to EUR 14.4 billion.
At EUR 32.6 billion, Other loans and advances to banks and customers were below the previous year’s amount of EUR 36.4 billion.
The total amount of Securities and investments at EUR 30.8 billion was at the previous year’s level.
Securities and investments
Bonds and other fixed-income securities
Shares and other non-fixed income securities
Equity investments
Shares in non-consolidated subsidiaries
Total
31 Dec. 2014 EUR in millions 28,600 0 2,114 8 30,722
31 Dec. 2013 EUR in millions 28,535 1 2,032 2 30,569
Change EUR in millions 65 –1 83 6 153
The securities portfolio, almost unchanged year-on-year, continued to constitute a significant item in Securities and investments. The decrease in Bonds and other fixed-income securities of EUR 0.4 billion to EUR 27.5 billion was offset by an increase of EUR 0.4 billion in the volume of money market securities to EUR 1.1 billion.
The fair values of derivatives with positive fair values, which were primarily used to hedge refinancing transactions, increased by EUR 14.6 billion, from EUR 23.9 billion to EUR 38.5 billion, due to changes in market parameters including exchange rates.
Netting agreements reached with counterparties, which also included derivatives with negative fair values, and collateral agreements (largely cash collateral received) reduced counterparty risk substantially. Value adjustments from macro hedging related to the underlying asset portfolios increased significantly by EUR 6.8 billion, from EUR 11.7 billion to EUR 18.5 billion, due to exchange rate movements primarily in the US dollar.
There were only minor changes in the other asset line items in the statement of financial position.
KfW Financial Information 2014 Group management report | Economic report 13
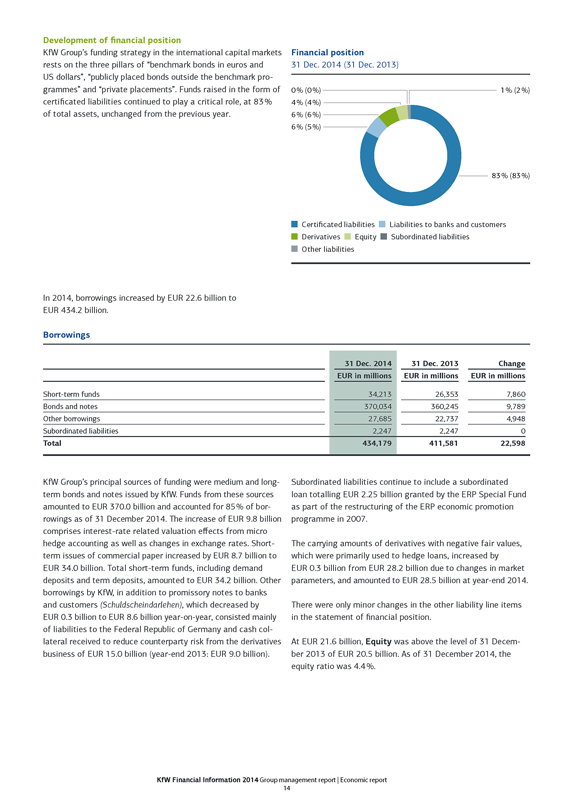
Development of financial position
KfW Group’s funding strategy in the international capital markets rests on the three pillars of “benchmark bonds in euros and US dollars”, “publicly placed bonds outside the benchmark programmes” and “private placements”. Funds raised in the form of certificated liabilities continued to play a critical role, at 83% of total assets, unchanged from the previous year.
Financial position
31 Dec. 2014 (31 Dec. 2013)
0% (0%) 1% (2%)
4% (4%)
6% (6%)
6% (5%)
83% (83%)
Certificated liabilities Liabilities to banks and customers
Derivatives Equity Subordinated liabilities
Other liabilities
In 2014, borrowings increased by EUR 22.6 billion to EUR 434.2 billion.
Borrowings
31 Dec. 2014 31 Dec. 2013 Change
EUR in millions EUR in millions EUR in millions
Short-term funds 34,213 26,353 7,860
Bonds and notes 370,034 360,245 9,789
Other borrowings 27,685 22,737 4,948
Subordinated liabilities 2,247 2,247 0
Total 434,179 411,581 22,598
KfW Group’s principal sources of funding were medium and long-term bonds and notes issued by KfW. Funds from these sources amounted to EUR 370.0 billion and accounted for 85% of borrowings as of 31 December 2014. The increase of EUR 9.8 billion comprises interest-rate related valuation effects from micro hedge accounting as well as changes in exchange rates. Short-term issues of commercial paper increased by EUR 8.7 billion to EUR 34.0 billion. Total short-term funds, including demand deposits and term deposits, amounted to EUR 34.2 billion. Other borrowings by KfW, in addition to promissory notes to banks and customers (Schuldscheindarlehen), which decreased by EUR 0.3 billion to EUR 8.6 billion year-on-year, consisted mainly of liabilities to the Federal Republic of Germany and cash collateral received to reduce counterparty risk from the derivatives business of EUR 15.0 billion (year-end 2013: EUR 9.0 billion).
Subordinated liabilities continue to include a subordinated loan totalling EUR 2.25 billion granted by the ERP Special Fund as part of the restructuring of the ERP economic promotion programme in 2007.
The carrying amounts of derivatives with negative fair values, which were primarily used to hedge loans, increased by EUR 0.3 billion from EUR 28.2 billion due to changes in market parameters, and amounted to EUR 28.5 billion at year-end 2014.
There were only minor changes in the other liability line items in the statement of financial position.
At EUR 21.6 billion, Equity was above the level of 31 December 2013 of EUR 20.5 billion. As of 31 December 2014, the equity ratio was 4.4%.
KfW Financial Information 2014 Group management report | Economic report 14
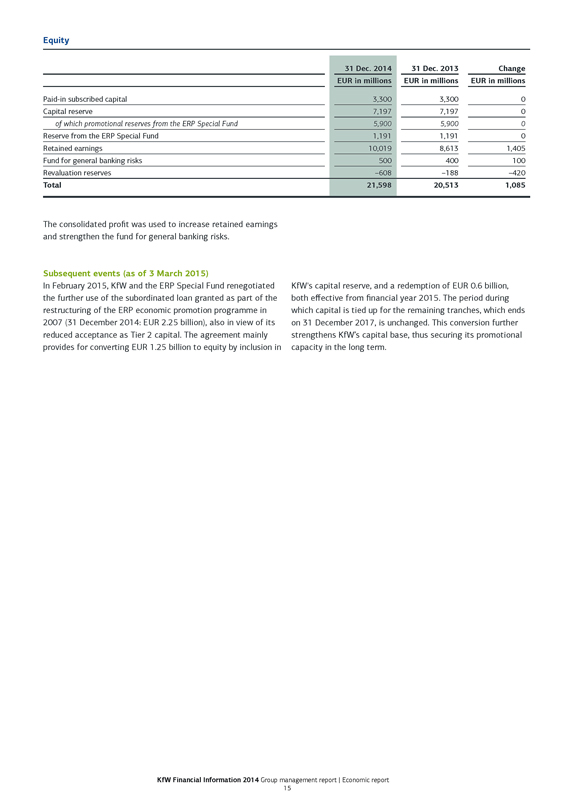
Equity
31 Dec. 2014 31 Dec. 2013 Change
EUR in millions EUR in millions EUR in millions
Paid-in subscribed capital 3,300 3,300 0
Capital reserve 7,197 7,197 0
of which promotional reserves from the ERP Special Fund 5,900 5,900 0
Reserve from the ERP Special Fund 1,191 1,191 0
Retained earnings 10,019 8,613 1,405
Fund for general banking risks 500 400 100
Revaluation reserves –608 –188 –420
Total 21,598 20,513 1,085
The consolidated profit was used to increase retained earnings and strengthen the fund for general banking risks.
Subsequent events (as of 3 March 2015)
In February 2015, KfW and the ERP Special Fund renegotiated the further use of the subordinated loan granted as part of the restructuring of the ERP economic promotion programme in 2007 (31 December 2014: EUR 2.25 billion), also in view of its reduced acceptance as Tier 2 capital. The agreement mainly provides for converting EUR 1.25 billion to equity by inclusion in
KfW’s capital reserve, and a redemption of EUR 0.6 billion, both effective from financial year 2015. The period during which capital is tied up for the remaining tranches, which ends on 31 December 2017, is unchanged. This conversion further strengthens KfW’s capital base, thus securing its promotional capacity in the long term.
KfW Financial Information 2014 Group management report | Economic report 15
Risk report
Current developments
Global economic development was largely disappointing in 2014 and it seems unlikely that momentum will accelerate in 2015 either, probably remaining at the same level as the previous year. We expect to see industrialised countries and emerging markets diverge in performance. The US economy will likely continue its positive growth trend in the coming quarters, mainly driven by an improved labour market and more robust private consumption. Monetary policy is expected to continue to support demand at the beginning of the year, with the expected rise in US interest rates during the course of 2015 carrying a certain risk for the financial markets. In Japan, economic performance is expected to be relatively subdued, given that neither monentary nor fiscal policy have much scope left for creating effective long-term impetus. The euro area faces a similar dilemma; despite a somewhat “more neutral” budgetary policy than in recent years and the ECB’s foreseeable quantitative easing, euro-area economic growth is likely to mark time in 2015. In light of forthcoming elections in Europe, new debates on the need to balance government budgets are expected to emerge. These could generate nervous sentiment on the capital markets at any time – as occurred at the beginning of the year in Greece. In some emerging market countries economic momentum is likely to decrease compared to the previous year. Although growth rates in China and India are expected to remain relatively high, macroeconomic performance in other countries is expected to be very subdued (Brazil, South Africa) or even negative (Russia). Overall, this economic outlook is overshadowed by a large number of downside risks. The geopolitical tensions between Russia and Ukraine as well as in the Middle East are creating considerable uncertainty. Despite the fact that the current low price of oil is generating opportunities for many economies, the risks faced by some crude oil-exporting countries have increased considerably. Moreover, certain misallocations on the financial markets due to current monetary policy could result in new crises at any time.
Despite stabilisation of economic parameters in some peripheral countries (Ireland, Spain), European banks’ asset quality continued to reflect diverging economic performance in Europe. Peripheral country banks, in particular, continue to hold large portfolios of non-performing loans. The sale of non-strategic assets resulting in further balance sheet reductions as well as cautious lending on the part of European banks was noticeable in the months prior to the ECB/EBA’s balance sheet and stress tests. In addition, a number of participating banks strengthened their equity through capital increases, thus improving the banks’ overall capital adequacy in 2014. The results of the balance sheet assessment, with a negative focus particularly on Italian banks, were comprehensible, and hardly came as any surprise. Refinancing of European institutions was rendered more stable through
increased deposit financing in combination with asset reduction. Furthermore, peripheral banks continued to return to the capital markets. Due to considerably declining risk costs and a stabilising economic environment, US banks made a positive impression compared to the relatively weak earnings posted by European banks. However, high burdens resulted from fines levied on certain financial institutions, setting a new overall record for the US banking sector.
The European banking sector will remain structurally vulnerable in 2015 due to the further deterioration of the economic outlook. In addition, the low-interest environment as well as regulatory requirements and the costs of legal disputes will negatively affect the profitability of European banks. For this reason, restructuring in the European banking sector, combined with a further reduction in non-strategic assets (in Italy, among other countries) is likely to continue. The political uncertainty in Greece could also shift the European sovereign debt crisis back into focus, with a largely negative impact on the still fragile banks of the peripheral countries. In addition, the persisting geopolitical tensions between Russia and Ukraine are likely to have a negative effect on the banks active in those countries – primarily Austrian and French – at an increasing rate. The gradual interest rate increases expected from the US Federal Reserve represent a rise in potential risks to banking markets of emerging countries with export deficits (such as Brazil, Turkey and South Africa) due to continued capital outflows and a further depreciation of own currencies.
The German and European economies were marked by stagnation last year, which we expect to continue this year. On the whole, the performance of businesses remained stable in this environment, even if investment was cautious due to the disappointing developments in Europe and various geopolitical uncertainties. It should be noted that companies are benefitting from favourable terms due to good credit availability and lending structures that are gradually being eased. The automobile industry which is important for Germany continues to grow due to brisk demand in developing countries and the USA; Europe too seems to have bottomed out after a number of difficult years, despite increasing sector risks. The merchant shipping situation remains difficult, with the exception of the gas tanker segment.
KfW Group has been affected by the aforementioned developments due to its international promotional mandate. Overall, however, KfW’s portfolio recorded a stable performance. Meanwhile, the merchant shipping crisis appears to be largely digested for the portfolio. All recognisable risks are measured using conservative standards and are taken into account in
KfW Financial Information 2014 Group management report | Risk report 16
KfW Group’s new business management through systematic implementation of risk guidelines. The regularly performed calculations of risk-bearing capacity show that KfW Group can bear the risks assumed in the context of its mandate – even based on conservative stress scenarios. In 2014, as in previous years, KfW Group systematically refined the processes and instruments in its Risk Management and Controlling department, taking account of current banking regulations.
As a result of an amendment to the KfW Law in 2013 and the publication of the “Regulation concerning key banking supervision standards under the German Banking Act to be declared applicable by analogy to KfW and supervision of compliance to these standards to be assigned to the German Federal Financial Supervisory Authority” (the “KfW Regulation”), the expanded application of the German Banking Act was introduced. In the future, KfW Group will be obliged to apply key bank regulatory standards by analogy. The German Federal Financial Supervisory Authority
and the German Central Bank (Bundesbank) will be responsible for supervising compliance with these bank regulatory standards. The relevant rules and regulations will enter into force in stages. The key provisions relating to risk will apply to KfW Group with effect from 1 January 2016. The Compliance department centrally coordinates fulfilment of the requirements of the German
Banking Act (Kreditwesengesetz – “KWG”).
As part of implementing the European regulatory mechanism, KfW IPEX-Bank was included in the ECB’s comprehensive assessment in 2014. The results of KfW IPEX-Bank’s asset quality review were announced in writing on 11 February 2015. No balance sheet adjustments have been required. The asset quality review and the stress test demonstrated that, in view of its business model, KfW IPEX-Bank is currently adequately capitalised overall. ECB has decided not to include KfW IPEX-Bank in the institutions under the ECB’s supervision.
Basic principles and objectives of risk management
KfW Group has a statutory promotional mandate, which provides the basis for its special position and institutional structure. Sustainable promotion is KfW Group’s overarching purpose. In order to utilise available resources to best carry out KfW Group’s promotional mandate, it is vital to measure and control incurred risks. As part of its risk management, KfW Group takes risks only to the extent that they appear manageable in the context of its current and anticipated earnings position and the development of the risks. KfW Group’s risk/return management takes into account the special characteristics of a promotional bank, with
adherence to supervisory requirements constituting a fundamental prerequisite to the group’s business activities.
In order to solidify risk management and controlling competence within its organisation, KfW Group offers its employees training that includes a modular programme on risk topics. The training programme enables management and non-management staff throughout KfW Group to acquire basic knowledge or to deepen their specialised knowledge.
Organisation of risk management and monitoring Risk management bodies and responsibilities
As part of its overall responsibility, KfW’s Executive Board determines the bank’s risk policies. The Board of Supervisory Directors is informed at least quarterly of KfW Group’s risk situation. The Presidial and Nomination Committee is responsible for dealing with legal and administrative matters as well as fundamental business and corporate policy issues. Moreover, in certain urgent cases, the committee has the authority to adopt resolutions in place of the Board of Supervisory Directors. The Chairman of the Board of Supervisory Directors decides whether an issue is urgent. The Risk and Credit Committee is primarily responsible for advising the Board of Supervisory Directors on the group’s current and future overall risk tolerance and strategy, and supports it in monitoring implementation of the latter. It
decides on loan approval, operational level equity investments, funding and swap transactions, if these require committee authorisation in accordance with the KfW Bylaws. The Audit Committee monitors, above all, the accounting process and the effectiveness of the risk management system and offers recommendations to the Board of Supervisory Directors concerning its approval of the (consolidated) financial statements. The Remuneration Committee monitors whether the structure of the remuneration system for the Executive Board and employees is appropriate – particularly for the remuneration paid to the heads of the Risk Controlling and Compliance functions and any employees who have a significant impact on the group’s overall risk profile.
KfW Financial Information 2014 Group management report | Risk report 17
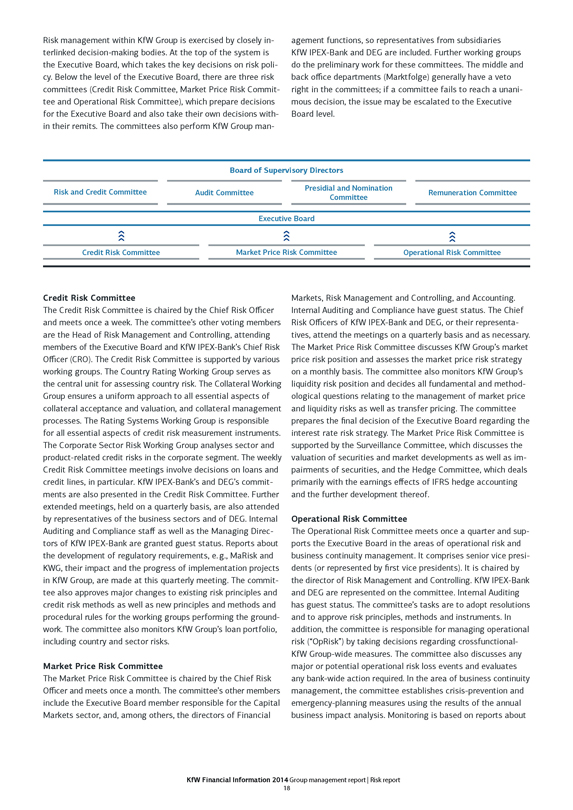
Risk management within KfW Group is exercised by closely interlinked decision-making bodies. At the top of the system is the Executive Board, which takes the key decisions on risk policy. Below the level of the Executive Board, there are three risk committees (Credit Risk Committee, Market Price Risk Committee and Operational Risk Committee), which prepare decisions for the Executive Board and also take their own decisions within their remits. The committees also perform KfW Group management functions, so representatives from subsidiaries KfW IPEX-Bank and DEG are included. Further working groups do the preliminary work for these committees. The middle and back office departments (Marktfolge) generally have a veto right in the committees; if a committee fails to reach a unanimous decision, the issue may be escalated to the Executive Board level.
Board of Supervisory Directors
Presidial and Nomination Committee
Risk and Credit Committee Audit Committee Remuneration Committee
Executive Board
Credit Risk Committee Market Price Risk Committee Operational Risk Committee
Credit Risk Committee
The Credit Risk Committee is chaired by the Chief Risk Officer and meets once a week. The committee’s other voting members are the Head of Risk Management and Controlling, attending members of the Executive Board and KfW IPEX-Bank’s Chief Risk Officer (CRO). The Credit Risk Committee is supported by various working groups. The Country Rating Working Group serves as the central unit for assessing country risk. The Collateral Working Group ensures a uniform approach to all essential aspects of collateral acceptance and valuation, and collateral management processes. The Rating Systems Working Group is responsible for all essential aspects of credit risk measurement instruments. The Corporate Sector Risk Working Group analyses sector and product-related credit risks in the corporate segment. The weekly Credit Risk Committee meetings involve decisions on loans and credit lines, in particular. KfW IPEX-Bank’s and DEG’s commitments are also presented in the Credit Risk Committee. Further extended meetings, held on a quarterly basis, are also attended by representatives of the business sectors and of DEG. Internal Auditing and Compliance staff as well as the Managing Directors of KfW IPEX-Bank are granted guest status. Reports about the development of regulatory requirements, e.g., MaRisk and KWG, their impact and the progress of implementation projects in KfW Group, are made at this quarterly meeting. The committee also approves major changes to existing risk principles and credit risk methods as well as new principles and methods and procedural rules for the working groups performing the groundwork. The committee also monitors KfW Group’s loan portfolio, including country and sector risks.
Market Price Risk Committee
The Market Price Risk Committee is chaired by the Chief Risk Officer and meets once a month. The committee’s other members include the Executive Board member responsible for the Capital Markets sector, and, among others, the directors of Financial
Markets, Risk Management and Controlling, and Accounting. Internal Auditing and Compliance have guest status. The Chief Risk Officers of KfW IPEX-Bank and DEG, or their representatives, attend the meetings on a quarterly basis and as necessary. The Market Price Risk Committee discusses KfW Group’s market price risk position and assesses the market price risk strategy on a monthly basis. The committee also monitors KfW Group’s liquidity risk position and decides all fundamental and methodological questions relating to the management of market price and liquidity risks as well as transfer pricing. The committee prepares the final decision of the Executive Board regarding the interest rate risk strategy. The Market Price Risk Committee is supported by the Surveillance Committee, which discusses the valuation of securities and market developments as well as impairments of securities, and the Hedge Committee, which deals primarily with the earnings effects of IFRS hedge accounting and the further development thereof.
Operational Risk Committee
The Operational Risk Committee meets once a quarter and supports the Executive Board in the areas of operational risk and business continuity management. It comprises senior vice presidents (or represented by first vice presidents). It is chaired by the director of Risk Management and Controlling. KfW IPEX-Bank and DEG are represented on the committee. Internal Auditing has guest status. The committee’s tasks are to adopt resolutions and to approve risk principles, methods and instruments. In addition, the committee is responsible for managing operational risk (“OpRisk”) by taking decisions regarding crossfunctional-KfW Group-wide measures. The committee also discusses any major or potential operational risk loss events and evaluates any bank-wide action required. In the area of business continuity management, the committee establishes crisis-prevention and emergency-planning measures using the results of the annual business impact analysis. Monitoring is based on reports about
KfW Financial Information 2014 Group management report | Risk report 18
planned or implemented emergency and crisis team tests and significant disruptions to business. All resolutions and recommendations by the Operational Risk Committee are presented to the Executive Board.
Additionally, the subsidiaries and organisational entities of KfW Group exercise their own control functions within the Group-wide risk management system. In these entities, Group-wide projects and working groups ensure a coordinated approach, for example, in the rollout of rating instruments to subsidiaries or in the management and valuation of collateral.
The responsibility for developing and structuring risk management and risk control activities is located outside the market areas and lies in particular with the Risk Management and Controlling area.
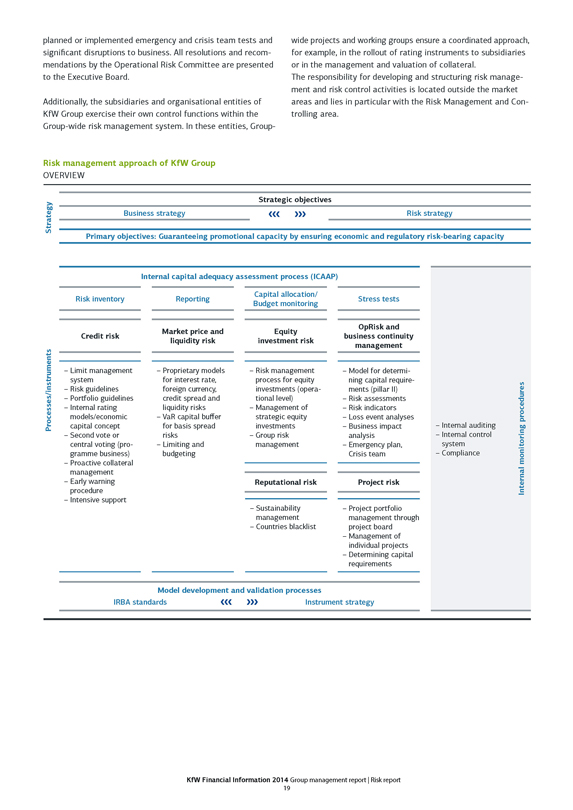
Risk management approach of KfW Group
OVERVIEW
Strategic objectives
Strategy Business strategy Risk strategy
Primary objectives: Guaranteeing promotional capacity by ensuring economic and regulatory risk-bearing capacity
Risk inventory Processes/instruments Model development and validation processes
Credit risk
– Limit management system
– Risk guidelines
– Portfolio guidelines
– Internal rating models/economic capital concept
– Second vote or central voting (programme business)
– Proactive collateral management
– Early warning procedure
– Intensive support
IRBA standards
Internal capital adequacy assessment process (ICAAP)
Reporting
Market price and liquidity risk
– Proprietary models for interest rate, foreign currency, credit spread and liquidity risks
– VaR capital buffer for basis spread risks
– Limiting and budgeting
Capital allocation/Budget monitoring
Equity investment risk
– Risk management process for equity investments (operational level)
– Management of strategic equity investments
– Group risk management
Reputational risk
– Sustainability management
– Countries blacklist
Instrument strategy
Stress tests
OpRisk and business continuity management
– Model for determining capital requirements (pillar II)
– Risk assessments
– Risk indicators
– Loss event analyses
– Business impact analysis
– Emergency plan, Crisis team
Project risk
– Project portfolio management through project board
– Management of individual projects
– Determining capital requirements
– Internal auditing
– Internal control system
– Compliance
Internal monitoring procedures
KfW Financial Information 2014 Group management report | Risk report 19
To ensure risk-bearing capacity in line with KfW Group’s defined risk tolerance, Risk Management formulates and regularly reviews KfW Group’s risk strategy, including the risk management of significant subsidiaries. The risk strategy builds on KfW Group’s basic business policy and establishes general risk principles and specific risk policy measures in line with its strategic objectives and business strategy. To implement the risk strategy, a variety of instruments to control KfW Group’s major risks are used, including risk management instruments for individual counterparties and portfolios.
In order to determine its material risks, KfW Group undertakes a risk inventory at least once a year. The risk inventory identifies and defines types of risks relevant to KfW Group in a structured process and then subjects these risks to an evaluation of materiality. The materiality of a risk type depends primarily on the potential danger for KfW Group’s net assets, earnings and liquidity. The key outcome of the risk inventory is an overall risk pro-file, which provides an overview of KfW Group’s material and immaterial risk types. The 2014 inventory identified the material risks facing KfW Group to be credit, market price, liquidity, operational, equity investment, project and reputational risks. Risk concentrations within a risk type or across various risk types are taken into account in the risk inventory.
INTERNAL CAPITAL ADEQUACY ASSESSMENT PROCESS KfW Group’s internal capital adequacy assessment process is characterised by the fact that economic and regulatory requirements regarding risk-bearing capacity are equally important overarching objectives for KfW Group. Accordingly, all risk monitoring and management measures must ensure compliance with both an economic solvency target and minimum requirements for Tier 1 and total capital ratios. This approach combines economically practicable capital management with the obligation to fulfil regulatory minimum capital requirements. As the basis for the close integration of these two perspectives, KfW Group takes a uniform definition of the resources available for risk coverage: regulatory capital in line with Sections 10 and 10a KWG in conjunction with Regulation (EU) No 575/2013 (CRR) is used as available financial resources for both views.
A further core feature of the capital adequacy assessment process is the proactive focus resulting from an additional forward-looking component. This focus evaluates the absorption potential of KfW Group’s reserves – and thus also its ability to act – in the event of certain economic and stress scenarios. A traffic light system, established in this context with thresholds for economic and regulatory risk-bearing capacity, signals the required action in the event of critical developments as part of operational and strategic management.
Risk reporting is in line with regulatory requirements (MaRisk). The Executive Board is informed about KfW Group’s risk situation on a monthly basis. A risk report is issued quarterly to KfW Group’s supervisory bodies. The respective bodies are informed on an ad hoc basis as required. The risk indicators and information systems used by the Risk Management and Controlling department are reviewed on an ongoing basis.
The methods and instruments for KfW Group-wide risk analysis and control are regularly validated and enhanced through further development. The focus is on models to measure, control and price both credit and market price risks. Validation and further development activities also take into account the requirements arising from extended KWG application.
The risk management approach is set out in KfW Group’s risk manual. The risk manual ensures that uniform procedures are applied throughout KfW Group to identify, measure, control and monitor risk. In addition, KfW Group-wide regulations are supplemented by rules specific to each business sector. The rules and regulations laid out in the risk manual are binding for the entire KfW Group, accessible to all employees and continually updated. See the following sections for details on other elements of KfW Group’s risk management approach.
KfW Group’s risk-bearing capacity concept serves first and foremost to protect debt capital providers from losses and therefore adopts a liquidation approach in its basic form. However, the addition of a forward-looking component, which also guarantees compliance with regulatory minimum capital requirements, expands the concept to include a going-concern view. KfW Group’s risk-bearing concept thus includes elements of both basic types of risk-bearing capacity approaches.
The targets for risk-bearing capacity are transferred via capital allocation in the form of economic capital budgets to individual business sectors/areas. The allocated available financial resources are available to the business sectors/areas for backing old and new business for the various types of risk. Capital allocation is conducted as part of KfW Group’s annual business sector planning. In addition to the requirements induced by business sector planning, this process also takes into account the risk objectives and the risk appetite of KfW Group (e.g. traffic light limits). At the same time, the Executive Board establishes a centrally held capital buffer for stress cases, which serves anti-cyclical risk management. Compliance is checked quarterly and action is taken as necessary. In addition, the corresponding target figures for regulatory capital requirements are determined at KfW Group level for the business sectors/areas and their utilisation is also monitored quarterly.
KfW Financial Information 2014 Group management report | Risk report 20
In addition to KfW Group’s risk-bearing capacity concept, the capital planning process monitors the medium-term development of risk-bearing capacity. Reliance on scenario-based extrapolations of economic and regulatory risk-bearing capacity over a multi-year observation horizon enables the capital planning process to identify potential capital bottlenecks early in order to derive recommendations for action strengthening capital or reducing risk, as necessary. The process takes into account changes in strategic objectives, business activity and the economic environment. In addition to a base case, economic and regulatory risk-bearing capacity are also observed in a stress case. Capital planning is performed as part of the overall KfW Group-wide planning and strategy process. The risk-bearing capacity concept is subject to annual review of its limits and restrictions. The results are used accordingly in the assessment of risk-bearing capacity.
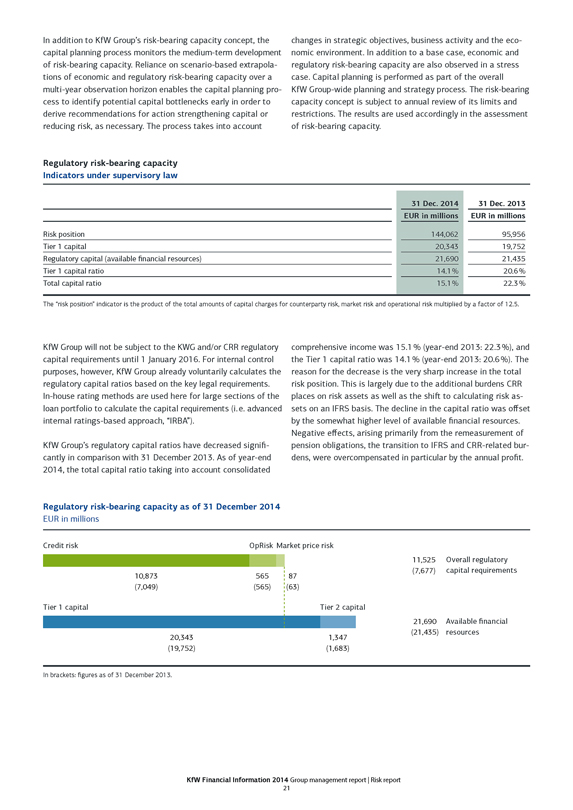
Regulatory risk-bearing capacity Indicators under supervisory law
31 Dec. 2014 31 Dec. 2013
EUR in millions EUR in millions
Risk position 144,062 95,956
Tier 1 capital 20,343 19,752
Regulatory capital (available financial resources) 21,690 21,435
Tier 1 capital ratio 14.1% 20.6%
Total capital ratio 15.1% 22.3%
The “risk position” indicator is the product of the total amounts of capital charges for counterparty risk, market risk and operational risk multiplied by a factor of 12.5.
KfW Group will not be subject to the KWG and/or CRR regulatory capital requirements until 1 January 2016. For internal control purposes, however, KfW Group already voluntarily calculates the regulatory capital ratios based on the key legal requirements. In-house rating methods are used here for large sections of the loan portfolio to calculate the capital requirements (i.e. advanced internal ratings-based approach, “IRBA”).
KfW Group’s regulatory capital ratios have decreased significantly in comparison with 31 December 2013. As of year-end 2014, the total capital ratio taking into account consolidated comprehensive income was 15.1% (year-end 2013: 22.3%), and the Tier 1 capital ratio was 14.1% (year-end 2013: 20.6%). The reason for the decrease is the very sharp increase in the total risk position. This is largely due to the additional burdens CRR places on risk assets as well as the shift to calculating risk assets on an IFRS basis. The decline in the capital ratio was offset by the somewhat higher level of available financial resources. Negative effects, arising primarily from the remeasurement of pension obligations, the transition to IFRS and CRR-related burdens, were overcompensated in particular by the annual profit.
Regulatory risk-bearing capacity as of 31 December 2014
EUR in millions
Credit risk OpRisk Market price risk
11,525 Overall regulatory
(7,677) capital requirements
10,873 565 87
(7,049) (565) (63)
Tier 1 capital Tier 2 capital
21,690 Available financial
20,343 1,347 (21,435) resources
(19,752) (1,683)
In brackets: figures as of 31 December 2013.
KfW Financial Information 2014 Group management report | Risk report 21
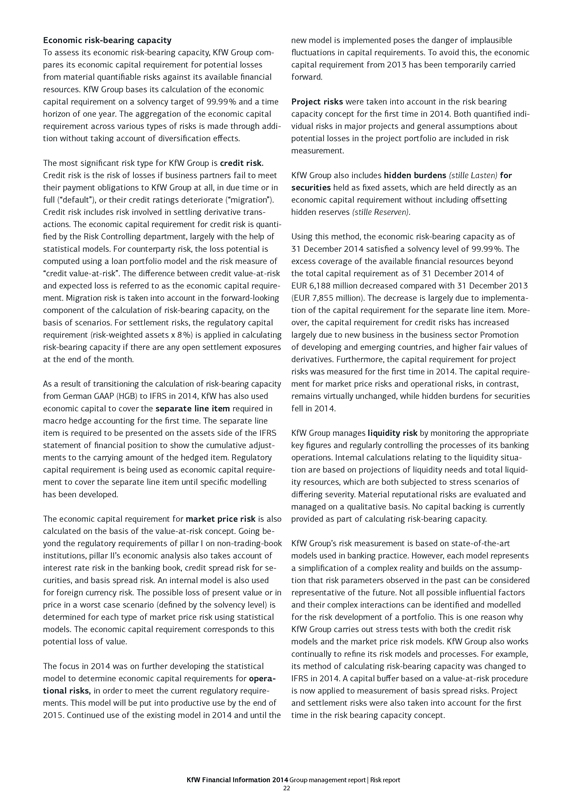
Economic risk-bearing capacity
To assess its economic risk-bearing capacity, KfW Group compares its economic capital requirement for potential losses from material quantifiable risks against its available financial resources. KfW Group bases its calculation of the economic capital requirement on a solvency target of 99.99% and a time horizon of one year. The aggregation of the economic capital requirement across various types of risks is made through addition without taking account of diversification effects.
The most significant risk type for KfW Group is credit risk. Credit risk is the risk of losses if business partners fail to meet their payment obligations to KfW Group at all, in due time or in full (“default”), or their credit ratings deteriorate (“migration”). Credit risk includes risk involved in settling derivative transactions. The economic capital requirement for credit risk is quantified by the Risk Controlling department, largely with the help of statistical models. For counterparty risk, the loss potential is computed using a loan portfolio model and the risk measure of “credit value-at-risk”. The difference between credit value-at-risk and expected loss is referred to as the economic capital requirement. Migration risk is taken into account in the forward-looking component of the calculation of risk-bearing capacity, on the basis of scenarios. For settlement risks, the regulatory capital requirement (risk-weighted assets x 8%) is applied in calculating risk-bearing capacity if there are any open settlement exposures at the end of the month.
As a result of transitioning the calculation of risk-bearing capacity from German GAAP (HGB) to IFRS in 2014, KfW has also used economic capital to cover the separate line item required in macro hedge accounting for the first time. The separate line item is required to be presented on the assets side of the IFRS statement of financial position to show the cumulative adjustments to the carrying amount of the hedged item. Regulatory capital requirement is being used as economic capital requirement to cover the separate line item until specific modelling has been developed.
The economic capital requirement for market price risk is also calculated on the basis of the value-at-risk concept. Going beyond the regulatory requirements of pillar I on non-trading-book institutions, pillar II’s economic analysis also takes account of interest rate risk in the banking book, credit spread risk for securities, and basis spread risk. An internal model is also used for foreign currency risk. The possible loss of present value or in price in a worst case scenario (defined by the solvency level) is determined for each type of market price risk using statistical models. The economic capital requirement corresponds to this potential loss of value.
The focus in 2014 was on further developing the statistical model to determine economic capital requirements for operational risks, in order to meet the current regulatory requirements. This model will be put into productive use by the end of 2015. Continued use of the existing model in 2014 and until the new model is implemented poses the danger of implausible fluctuations in capital requirements. To avoid this, the economic capital requirement from 2013 has been temporarily carried forward.
Project risks were taken into account in the risk bearing capacity concept for the first time in 2014. Both quantified individual risks in major projects and general assumptions about potential losses in the project portfolio are included in risk measurement.
KfW Group also includes hidden burdens (stille Lasten) for securities held as fixed assets, which are held directly as an economic capital requirement without including offsetting hidden reserves (stille Reserven).
Using this method, the economic risk-bearing capacity as of
31 December 2014 satisfied a solvency level of 99.99%. The excess coverage of the available financial resources beyond the total capital requirement as of 31 December 2014 of EUR 6,188 million decreased compared with 31 December 2013 (EUR 7,855 million). The decrease is largely due to implementation of the capital requirement for the separate line item. Moreover, the capital requirement for credit risks has increased largely due to new business in the business sector Promotion of developing and emerging countries, and higher fair values of derivatives. Furthermore, the capital requirement for project risks was measured for the first time in 2014. The capital requirement for market price risks and operational risks, in contrast, remains virtually unchanged, while hidden burdens for securities fell in 2014.
KfW Group manages liquidity risk by monitoring the appropriate key figures and regularly controlling the processes of its banking operations. Internal calculations relating to the liquidity situation are based on projections of liquidity needs and total liquidity resources, which are both subjected to stress scenarios of differing severity. Material reputational risks are evaluated and managed on a qualitative basis. No capital backing is currently provided as part of calculating risk-bearing capacity.
KfW Group’s risk measurement is based on state-of-the-art models used in banking practice. However, each model represents a simplification of a complex reality and builds on the assumption that risk parameters observed in the past can be considered representative of the future. Not all possible influential factors and their complex interactions can be identified and modelled for the risk development of a portfolio. This is one reason why KfW Group carries out stress tests with both the credit risk models and the market price risk models. KfW Group also works continually to refine its risk models and processes. For example, its method of calculating risk-bearing capacity was changed to IFRS in 2014. A capital buffer based on a value-at-risk procedure is now applied to measurement of basis spread risks. Project and settlement risks were also taken into account for the first time in the risk bearing capacity concept.
KfW Financial Information 2014 Group management report | Risk report 22
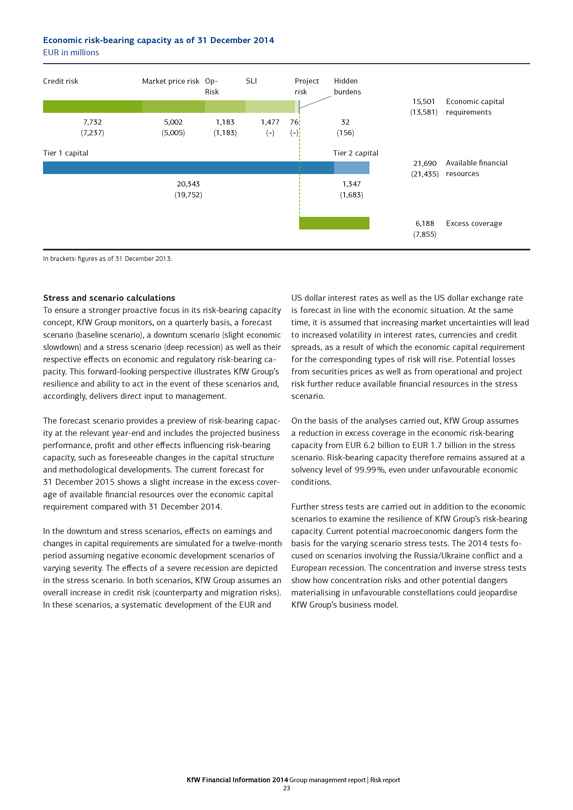
Economic risk-bearing capacity as of 31 December 2014
EUR in millions
Credit risk Market price risk OpRisk SLI Project risk Hidden burdens
15,501 Economic capital
(13,581) requirements
7,732 5,002 1,183 1,477 76 32
(7,237) (5,005) (1,183) (–) (–) (156)
Tier 1 capital Tier 2 capital
21,690 Available financial
(21,435) resources
20,343 1,347
(19,752) (1,683)
6,188 Excess coverage
(7,855)
In brackets: figures as of 31 December 2013.
Stress and scenario calculations
To ensure a stronger proactive focus in its risk-bearing capacity concept, KfW Group monitors, on a quarterly basis, a forecast scenario (baseline scenario), a downturn scenario (slight economic slowdown) and a stress scenario (deep recession) as well as their respective effects on economic and regulatory risk-bearing capacity. This forward-looking perspective illustrates KfW Group’s resilience and ability to act in the event of these scenarios and, accordingly, delivers direct input to management.
The forecast scenario provides a preview of risk-bearing capacity at the relevant year-end and includes the projected business performance, profit and other effects influencing risk-bearing capacity, such as foreseeable changes in the capital structure and methodological developments. The current forecast for 31 December 2015 shows a slight increase in the excess coverage of available financial resources over the economic capital requirement compared with 31 December 2014.
In the downturn and stress scenarios, effects on earnings and changes in capital requirements are simulated for a twelve-month period assuming negative economic development scenarios of varying severity. The effects of a severe recession are depicted in the stress scenario. In both scenarios, KfW Group assumes an overall increase in credit risk (counterparty and migration risks). In these scenarios, a systematic development of the EUR and US dollar interest rates as well as the US dollar exchange rate is forecast in line with the economic situation. At the same time, it is assumed that increasing market uncertainties will lead to increased volatility in interest rates, currencies and credit spreads, as a result of which the economic capital requirement for the corresponding types of risk will rise. Potential losses from securities prices as well as from operational and project risk further reduce available financial resources in the stress scenario.
On the basis of the analyses carried out, KfW Group assumes a reduction in excess coverage in the economic risk-bearing capacity from EUR 6.2 billion to EUR 1.7 billion in the stress scenario. Risk-bearing capacity therefore remains assured at a solvency level of 99.99%, even under unfavourable economic conditions.
Further stress tests are carried out in addition to the economic scenarios to examine the resilience of KfW Group’s risk-bearing capacity. Current potential macroeconomic dangers form the basis for the varying scenario stress tests. The 2014 tests focused on scenarios involving the Russia/Ukraine conflict and a European recession. The concentration and inverse stress tests show how concentration risks and other potential dangers materialising in unfavourable constellations could jeopardise KfW Group’s business model.
KfW Financial Information 2014 Group management report | Risk report 23
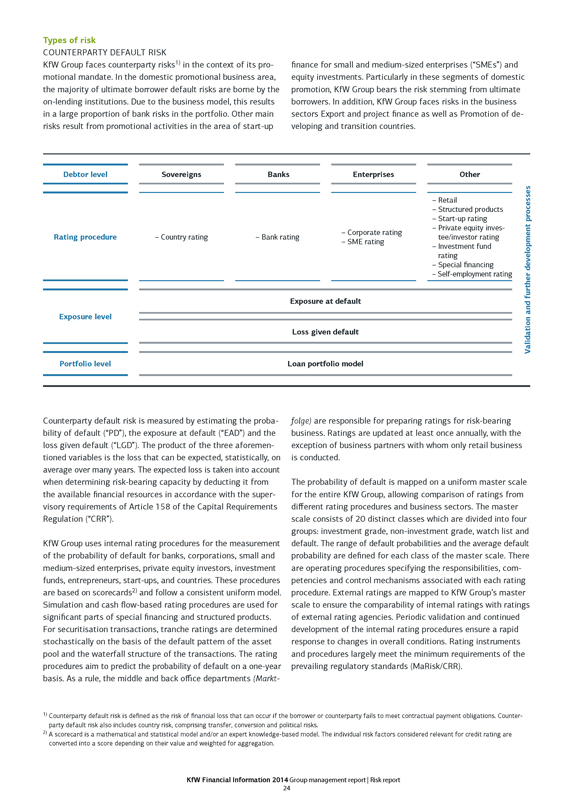
Types of risk
COUNTERPARTY DEFAULT RISK
KfW Group faces counterparty risks1) in the context of its promotional mandate. In the domestic promotional business area, the majority of ultimate borrower default risks are borne by the on-lending institutions. Due to the business model, this results in a large proportion of bank risks in the portfolio. Other main risks result from promotional activities in the area of start-up finance for small and medium-sized enterprises (“SMEs”) and equity investments. Particularly in these segments of domestic promotion, KfW Group bears the risk stemming from ultimate borrowers. In addition, KfW Group faces risks in the business sectors Export and project finance as well as Promotion of developing and transition countries.
Debtor level
Rating procedure
Exposure level
Portfolio level
Sovereigns
– Country rating
Banks
– Bank rating
Enterprises
– Corporate rating
– SME rating
Other
– Retail
– Structured products
– Start-up rating
– Private equity investee/investor rating
– Investment fund rating
– Special financing
– Self-employment rating
Exposure at default
Loss given default
Loan portfolio model
Validation and further development processes
Counterparty default risk is measured by estimating the probability of default (“PD”), the exposure at default (“EAD”) and the loss given default (“LGD”). The product of the three aforementioned variables is the loss that can be expected, statistically, on average over many years. The expected loss is taken into account when determining risk-bearing capacity by deducting it from the available financial resources in accordance with the supervisory requirements of Article 158 of the Capital Requirements Regulation (“CRR”).
KfW Group uses internal rating procedures for the measurement of the probability of default for banks, corporations, small and medium-sized enterprises, private equity investors, investment funds, entrepreneurs, start-ups, and countries. These procedures are based on scorecards2) and follow a consistent uniform model. Simulation and cash flow-based rating procedures are used for significant parts of special financing and structured products. For securitisation transactions, tranche ratings are determined stochastically on the basis of the default pattern of the asset pool and the waterfall structure of the transactions. The rating procedures aim to predict the probability of default on a one-year basis. As a rule, the middle and back office departments (Marktfolge) are responsible for preparing ratings for risk-bearing business. Ratings are updated at least once annually, with the exception of business partners with whom only retail business is conducted.
The probability of default is mapped on a uniform master scale for the entire KfW Group, allowing comparison of ratings from different rating procedures and business sectors. The master scale consists of 20 distinct classes which are divided into four groups: investment grade, non-investment grade, watch list and default. The range of default probabilities and the average default probability are defined for each class of the master scale. There are operating procedures specifying the responsibilities, competencies and control mechanisms associated with each rating procedure. External ratings are mapped to KfW Group’s master scale to ensure the comparability of internal ratings with ratings of external rating agencies. Periodic validation and continued development of the internal rating procedures ensure a rapid response to changes in overall conditions. Rating instruments and procedures largely meet the minimum requirements of the prevailing regulatory standards (MaRisk/CRR).
1) Counterparty default risk is defined as the risk of financial loss that can occur if the borrower or counterparty fails to meet contractual payment obligations. Counterparty default risk also includes country risk, comprising transfer, conversion and political risks.
2) A scorecard is a mathematical and statistical model and/or an expert knowledge-based model. The individual risk factors considered relevant for credit rating are converted into a score depending on their value and weighted for aggregation.
KfW Financial Information 2014 Group management report | Risk report 24
Exposure at default and valuation of collateral are heavily weighted when determining the severity of loss. Collateral has a risk-mitigating effect in calculating loss given default. In valuing acceptable collateral, the expected net revenue from collateral realisation in the case of loss, including haircuts, is determined. For tangible collateral, the haircuts are attributable, among other things, to devaluation resulting from depreciation, in addition to fluctuations in market prices and the costs of realisation. Depending on the availability of data, the various valuation procedures for individual types of collateral are based on internal and external historical data and on expert estimates. A risk principle for loan collateral regulates uniform management, valuation and recognition of collateral across KfW Group. In addition to net revenue from collateral realisation, the recovery rate for uncollateralised exposure amounts is also an important component in determining loss given default (LGD). All valuation parameters are regularly subject to validation.
KfW Group has limit management systems, risk guidelines and various portfolio guidelines to limit risks from new business. This set of risk management instruments forms the basis for the second vote on lending transactions, serves as an orientation guide for loan approvals and has the function of ensuring the appropriate quality and risk structure of KfW Group’s portfolio.3) At KfW, Group Risk Management has the second vote on a single exposure level. KfW IPEX-Bank and DEG each have their own second vote independent of the front office. The relevant business decision-making processes are structured with a view to risk. Lending transactions currently require a second vote depending on the type, scope (material risk content and effect on the overall risk position) and complexity of the transaction. All major and higher risk commitments are presented at least to the Credit Risk Committee, and if necessary, also to the Executive Board, the Credit Committee or the Board of Supervisory Directors.
The portfolio guidelines distinguish between different types of counterparties and product variants and define the conditions under which business transactions may generally be conducted. In addition, risk guidelines for countries, sectors and products are defined in order to react to existing or potential negative developments with specific requirements for lending. The limit management systems ultimately track both risk concentrations (concentration limits) and credit rating dependent individual counterparty risk (counterparty limits). Concentration limits serve to restrict risk concentrations in the loan portfolio and thus to prevent major individual losses. Counterparty limits serve to fine tune the counterparty-specific management of credit default risk.
Existing higher-risk exposures are divided into a watch list and a list for non-performing loans. The watch list serves to identify potential problem loans early and, if necessary, to make preparations for handling these loans. It regularly reviews and documents the economic situation, the particular borrower’s market environment and the collateral provided, and formulates proposals for remedial action – particularly proposals for risk-limiting measures. Non-performing loans and to a great extent watch-list loan commitments4) are handed over to restructuring units. This transfer of responsibility enables the involvement of specialists from an early stage to ensure professional management of problematic loans. The objective of this system is to achieve recovery of a loan through restructuring, reorganisation and workout arrangements. If the business partner is deemed incapable or unworthy of restructuring, the priority becomes optimum realisation of the asset and the related collateral. The Restructuring department is responsible for non-performing loans and for providing intensive support to banks and higher volume loans with a risk amount greater than EUR 1 million in KfW’s portfolio. The portfolio credit management department is responsible for supporting retail business. KfW IPEX-Bank and DEG’s non-performing loans and commitments requiring intensive support are managed directly by each subsidiary. If more than one KfW Group company is involved, Restructuring will coordinate centrally. Internal interface regulations are in place in the relevant business sectors to ensure clear control of responsibilities and allocation. Restructuring also cooperates closely with the business areas and the legal department.
In the event of a crisis in the banking sector, the department has to be able to act immediately both in-house and externally. The financial institution crisis plan has been refined for this purpose. It primarily provides for the establishment of a working group headed by the Risk Management department, immediate loss analysis and implementation of the necessary next steps.
Risk provisions for lending business
KfW Group takes appropriate measures to address all identifiable default risks in its lending business by making risk provisions for loans. These risks include the political risk resulting from financing transactions outside Germany. For loans with an imminent risk of default (i.e. non-performing loans), KfW Group recognises individual impairment charges or provisions for undisbursed portions. These events are identified on the basis of criteria that meet both Basel II and IFRS requirements. Criteria include the identification of considerable financial difficulties on the part of the debtor, payment arrears, concessions made to the debtor owing to its financial situation (for example, in the context of restructuring measures), conspicuous measures undertaken by the debtor to increase its liquidity, and a substantial deterioration in the value of collateral received. Individual impairment charges are determined by means of an impairment procedure. The calculation of individual impairment charges in the non-retail business incorporates an individual assessment of the borrower’s
3) The special nature of KfW’s promotional business is taken into account in the process.
4) The assumption of responsibility for watch-list cases at KfW IPEX-Bank is decided on a case-by-case basis by Risk Management in consultation with the unit responsible for restructuring.
KfW Financial Information 2014 Group management report | Risk report 25
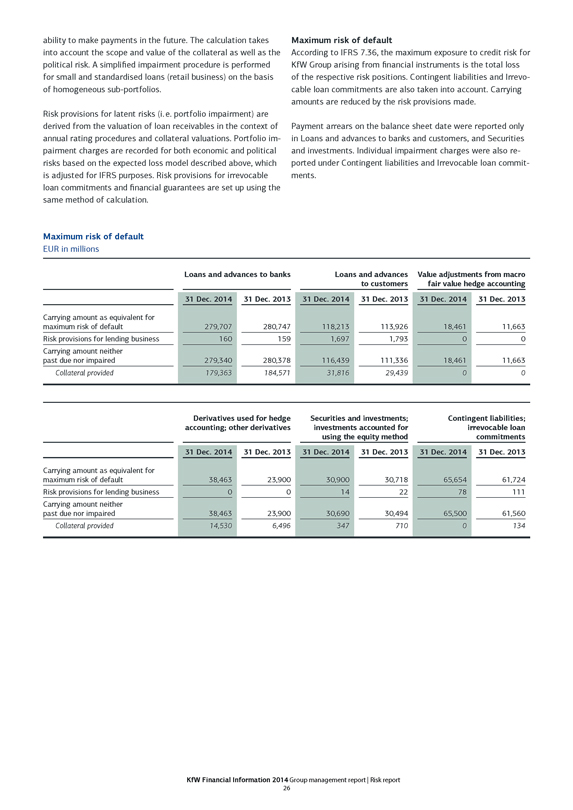
ability to make payments in the future. The calculation takes into account the scope and value of the collateral as well as the political risk. A simplified impairment procedure is performed for small and standardised loans (retail business) on the basis of homogeneous sub-portfolios.
Risk provisions for latent risks (i.e. portfolio impairment) are derived from the valuation of loan receivables in the context of annual rating procedures and collateral valuations. Portfolio impairment charges are recorded for both economic and political risks based on the expected loss model described above, which is adjusted for IFRS purposes. Risk provisions for irrevocable loan commitments and financial guarantees are set up using the same method of calculation.
Maximum risk of default
According to IFRS 7.36, the maximum exposure to credit risk for KfW Group arising from financial instruments is the total loss of the respective risk positions. Contingent liabilities and Irrevocable loan commitments are also taken into account. Carrying amounts are reduced by the risk provisions made.
Payment arrears on the balance sheet date were reported only in Loans and advances to banks and customers, and Securities and investments. Individual impairment charges were also reported under Contingent liabilities and Irrevocable loan commitments.
Maximum risk of default
EUR in millions
Loans and advances to banks Loans and advances to customers Value adjustments from macro fair value hedge accounting
31 Dec. 2014 31 Dec. 2013 31 Dec. 2014 31 Dec. 2013 31 Dec. 2014 31 Dec. 2013
Carrying amount as equivalent for maximum risk of default 279,707 280,747 118,213 113,926 18,461 11,663
Risk provisions for lending business 160 159 1,697 1,793 0 0
Carrying amount neither past due nor impaired 279,340 280,378 116,439 111,336 18,461 11,663
Collateral provided 179,363 184,571 31,816 29,439 0 0
Derivatives used for hedge accounting; other derivatives Securities and investments; investments accounted for using the equity method Contingent liabilities; irrevocable loan commitments
31 Dec. 2014 31 Dec. 2013 31 Dec. 2014 31 Dec. 2013 31 Dec. 2014 31 Dec. 2013
Carrying amount as equivalent for maximum risk of default 38,463 23,900 30,900 30,718 65,654 61,724
Risk provisions for lending business 0 0 14 22 78 111
Carrying amount neither past due nor impaired 38,463 23,900 30,690 30,494 65,500 61,560
Collateral provided 14,530 6,496 347 710 0 134
KfW Financial Information 2014 Group management report | Risk report 26
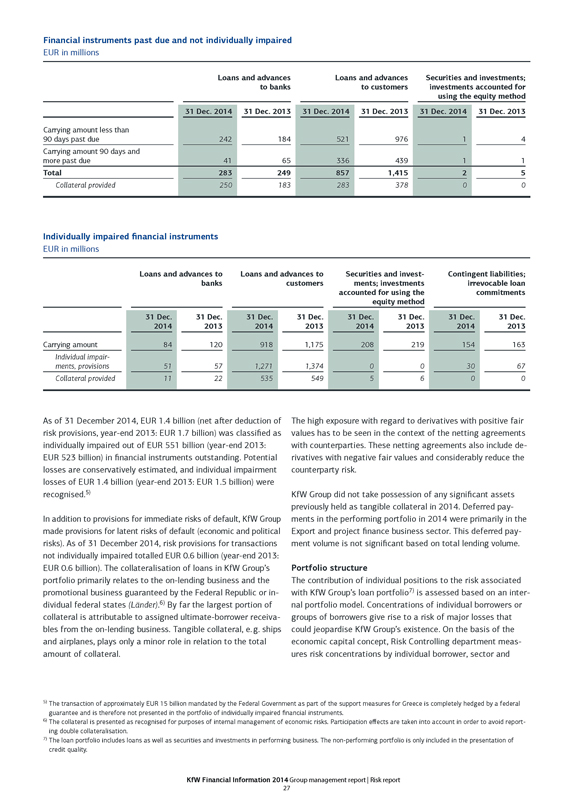
Financial instruments past due and not individually impaired
EUR in millions
Loans and advances to banks
Loans and advances to customers
Securities and investments; investments accounted for using the equity method
31 Dec. 2014 31 Dec. 2013 31 Dec. 2014 31 Dec. 2013 31 Dec. 2014 31 Dec. 2013
Carrying amount less than 90 days past due 242 184 521 976 1 4
Carrying amount 90 days and more past due 41 65 336 439 1 1
Total 283 249 857 1,415 2 5
Collateral provided 250 183 283 378 0 0
Individually impaired financial instruments
EUR in millions
Loans and advances to banks
Loans and advances to customers
Securities and investments; investments accounted for using the equity method
Contingent liabilities; irrevocable loan commitments
31 Dec. 2014 31 Dec. 2013 31 Dec. 2014 31 Dec. 2013 31 Dec. 2014 31 Dec. 2013 31 Dec. 2014 31 Dec. 2013
Carrying amount 84 120 918 1,175 208 219 154 163
Individual impairments, provisions 51 57 1,271 1,374 0 0 30 67
Collateral provided 11 22 535 549 5 6 0 0
As of 31 December 2014, EUR 1.4 billion (net after deduction of risk provisions, year-end 2013: EUR 1.7 billion) was classified as individually impaired out of EUR 551 billion (year-end 2013: EUR 523 billion) in financial instruments outstanding. Potential losses are conservatively estimated, and individual impairment losses of EUR 1.4 billion (year-end 2013: EUR 1.5 billion) were recognised.5)
In addition to provisions for immediate risks of default, KfW Group made provisions for latent risks of default (economic and political risks). As of 31 December 2014, risk provisions for transactions not individually impaired totalled EUR 0.6 billion (year-end 2013: EUR 0.6 billion). The collateralisation of loans in KfW Group’s portfolio primarily relates to the on-lending business and the promotional business guaranteed by the Federal Republic or individual federal states (Länder).6) By far the largest portion of collateral is attributable to assigned ultimate-borrower receivables from the on-lending business. Tangible collateral, e. g. ships and airplanes, plays only a minor role in relation to the total amount of collateral.
The high exposure with regard to derivatives with positive fair values has to be seen in the context of the netting agreements with counterparties. These netting agreements also include derivatives with negative fair values and considerably reduce the counterparty risk.
KfW Group did not take possession of any significant assets previously held as tangible collateral in 2014. Deferred payments in the performing portfolio in 2014 were primarily in the Export and project finance business sector. This deferred payment volume is not significant based on total lending volume.
Portfolio structure
The contribution of individual positions to the risk associated with KfW Group’s loan portfolio7) is assessed based on an internal portfolio model. Concentrations of individual borrowers or groups of borrowers give rise to a risk of major losses that could jeopardise KfW Group’s existence. On the basis of the economic capital concept, Risk Controlling department measures risk concentrations by individual borrower, sector and
5) The transaction of approximately EUR 15 billion mandated by the Federal Government as part of the support measures for Greece is completely hedged by a federal guarantee and is therefore not presented in the portfolio of individually impaired financial instruments.
6) The collateral is presented as recognised for purposes of internal management of economic risks. Participation effects are taken into account in order to avoid reporting double collateralisation.
7) The loan portfolio includes loans as well as securities and investments in performing business. The non-performing portfolio is only included in the presentation of credit quality.
KfW Financial Information 2014 Group management report | Risk report 27
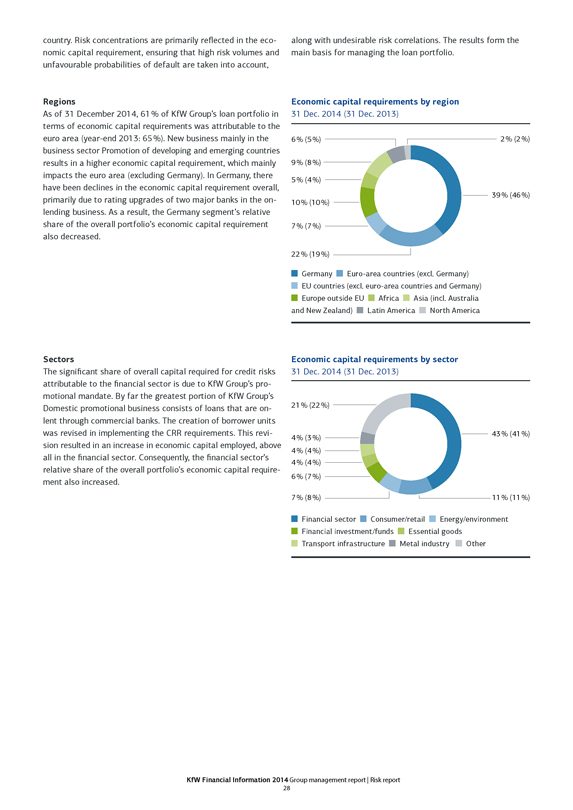
country. Risk concentrations are primarily reflected in the economic capital requirement, ensuring that high risk volumes and unfavourable probabilities of default are taken into account, along with undesirable risk correlations. The results form the main basis for managing the loan portfolio.
Regions
As of 31 December 2014, 61% of KfW Group’s loan portfolio in terms of economic capital requirements was attributable to the euro area (year-end 2013: 65%). New business mainly in the business sector Promotion of developing and emerging countries results in a higher economic capital requirement, which mainly impacts the euro area (excluding Germany). In Germany, there have been declines in the economic capital requirement overall, primarily due to rating upgrades of two major banks in the on-lending business. As a result, the Germany segment’s relative share of the overall portfolio’s economic capital requirement also decreased.
Sectors
The significant share of overall capital required for credit risks attributable to the financial sector is due to KfW Group’s promotional mandate. By far the greatest portion of KfW Group’s Domestic promotional business consists of loans that are on-lent through commercial banks. The creation of borrower units was revised in implementing the CRR requirements. This revision resulted in an increase in economic capital employed, above all in the financial sector. Consequently, the financial sector’s relative share of the overall portfolio’s economic capital requirement also increased.
Economic capital requirements by region
31 Dec. 2014 (31 Dec. 2013)
6% (5%) 2%(2%)
9% (8%)
5% (4%)
39% (46%)
10% (10%)
7% (7%)
22% (19%)
Germany Euro-area countries (excl. Germany)
EU countries (excl. euro-area countries and Germany)
Europe outside EU Africa Asia (incl. Australia
and New Zealand) Latin America North America
Economic capital requirements by sector
31 Dec. 2014 (31 Dec. 2013)
21% (22 %)
4% (3%)
43% (41%)
4% (4%)
4% (4%)
6% (7%)
7% (8%) 11% (11%)
Financial sector Consumer/retail Energy/environment
Financial investment/funds Essential goods
Transport infrastructure Metal industry Other
KfW Financial Information 2014 Group management report | Risk report 28
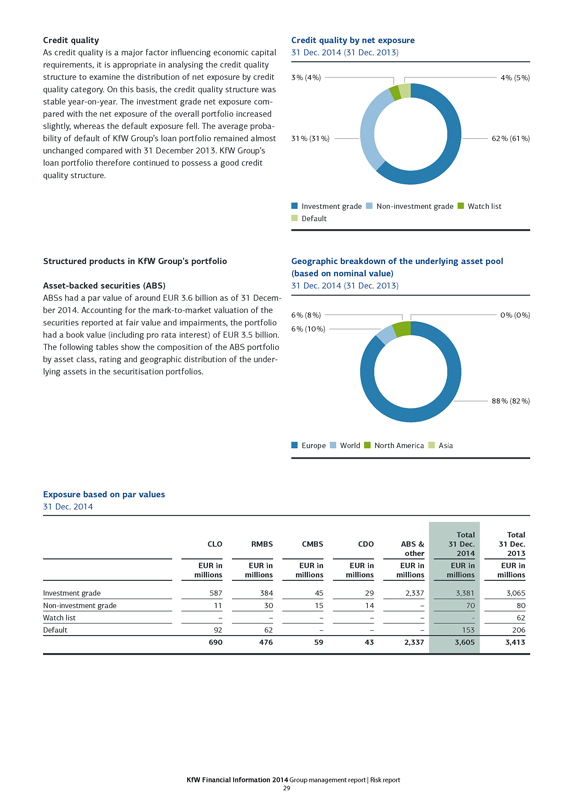
Credit quality
As credit quality is a major factor influencing economic capital requirements, it is appropriate in analysing the credit quality structure to examine the distribution of net exposure by credit quality category. On this basis, the credit quality structure was stable year-on-year. The investment grade net exposure compared with the net exposure of the overall portfolio increased slightly, whereas the default exposure fell. The average probability of default of KfW Group’s loan portfolio remained almost unchanged compared with 31 December 2013. KfW Group’s loan portfolio therefore continued to possess a good credit quality structure.
Structured products in KfW Group’s portfolio
Asset-backed securities (ABS)
ABSs had a par value of around EUR 3.6 billion as of 31 December 2014. Accounting for the mark-to-market valuation of the securities reported at fair value and impairments, the portfolio had a book value (including pro rata interest) of EUR 3.5 billion. The following tables show the composition of the ABS portfolio by asset class, rating and geographic distribution of the underlying assets in the securitisation portfolios.
Credit quality by net exposure
31 Dec. 2014 (31 Dec. 2013)
3% (4%) 4% (5%)
31% (31%)
62% (61%)
Investment grade Non-investment grade Watch list Default
Geographic breakdown of the underlying asset pool (based on nominal value)
31 Dec. 2014 (31 Dec. 2013)
6% (8%) 0% (0%)
6% (10%)
88% (82%)
Europe World North America Asia
Exposure based on par values
31 Dec. 2014
CLO RMBS CMBS CDO ABS & other Total 31 Dec. 2014 Total 31 Dec. 2013
EUR in millions EUR in millions EUR in millions EUR in millions EUR in millions EUR in millions EUR in millions
Investment grade 587 384 45 29 2,337 3,381 3,065
Non-investment grade 11 30 15 14 - 70 80
Watch list - - - - - - 62
Default 92 62 - - - 153 206
690 476 59 43 2,337 3,605 3,413
KfW Financial Information 2014 Group management report | Risk report 29
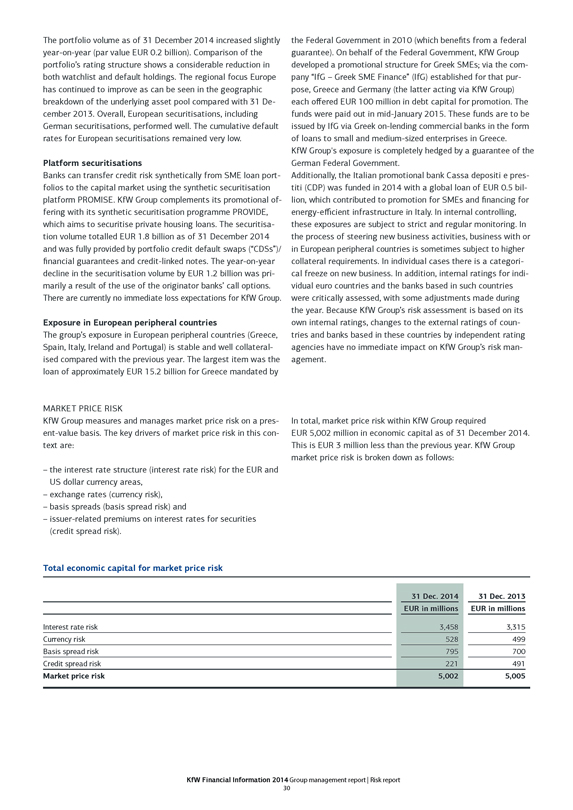
The portfolio volume as of 31 December 2014 increased slightly year-on-year (par value EUR 0.2 billion). Comparison of the portfolio’s rating structure shows a considerable reduction in both watchlist and default holdings. The regional focus Europe has continued to improve as can be seen in the geographic breakdown of the underlying asset pool compared with 31 December 2013. Overall, European securitisations, including German securitisations, performed well. The cumulative default rates for European securitisations remained very low.
Platform securitisations
Banks can transfer credit risk synthetically from SME loan portfolios to the capital market using the synthetic securitisation platform PROMISE. KfW Group complements its promotional offering with its synthetic securitisation programme PROVIDE, which aims to securitise private housing loans. The securitisation volume totalled EUR 1.8 billion as of 31 December 2014 and was fully provided by portfolio credit default swaps (“CDSs”)/ financial guarantees and credit-linked notes. The year-on-year decline in the securitisation volume by EUR 1.2 billion was primarily a result of the use of the originator banks’ call options. There are currently no immediate loss expectations for KfW Group.
Exposure in European peripheral countries
The group’s exposure in European peripheral countries (Greece, Spain, Italy, Ireland and Portugal) is stable and well collateralised compared with the previous year. The largest item was the loan of approximately EUR 15.2 billion for Greece mandated by
the Federal Government in 2010 (which benefits from a federal guarantee). On behalf of the Federal Government, KfW Group developed a promotional structure for Greek SMEs; via the company “IfG - Greek SME Finance” (IfG) established for that purpose, Greece and Germany (the latter acting via KfW Group) each offered EUR 100 million in debt capital for promotion. The funds were paid out in mid-January 2015. These funds are to be issued by IfG via Greek on-lending commercial banks in the form of loans to small and medium-sized enterprises in Greece. KfW Group’s exposure is completely hedged by a guarantee of the German Federal Government.
Additionally, the Italian promotional bank Cassa depositi e prestiti (CDP) was funded in 2014 with a global loan of EUR 0.5 billion, which contributed to promotion for SMEs and financing for energy-efficient infrastructure in Italy. In internal controlling, these exposures are subject to strict and regular monitoring. In the process of steering new business activities, business with or in European peripheral countries is sometimes subject to higher collateral requirements. In individual cases there is a categorical freeze on new business. In addition, internal ratings for individual euro countries and the banks based in such countries were critically assessed, with some adjustments made during the year. Because KfW Group’s risk assessment is based on its own internal ratings, changes to the external ratings of countries and banks based in these countries by independent rating agencies have no immediate impact on KfW Group’s risk management.
MARKET PRICE RISK
KfW Group measures and manages market price risk on a present-value basis. The key drivers of market price risk in this context are:
- the interest rate structure (interest rate risk) for the EUR and US dollar currency areas,
- exchange rates (currency risk),
- basis spreads (basis spread risk) and
- issuer-related premiums on interest rates for securities (credit spread risk).
In total, market price risk within KfW Group required EUR 5,002 million in economic capital as of 31 December 2014. This is EUR 3 million less than the previous year. KfW Group market price risk is broken down as follows:
Total economic capital for market price risk
31 Dec. 2014 31 Dec. 2013
EUR in millions EUR in millions
Interest rate risk 3,458 3,315
Currency risk 528 499
Basis spread risk 795 700
Credit spread risk 221 491
Market price risk 5,002 5,005
KfW Financial Information 2014 Group management report | Risk report 30
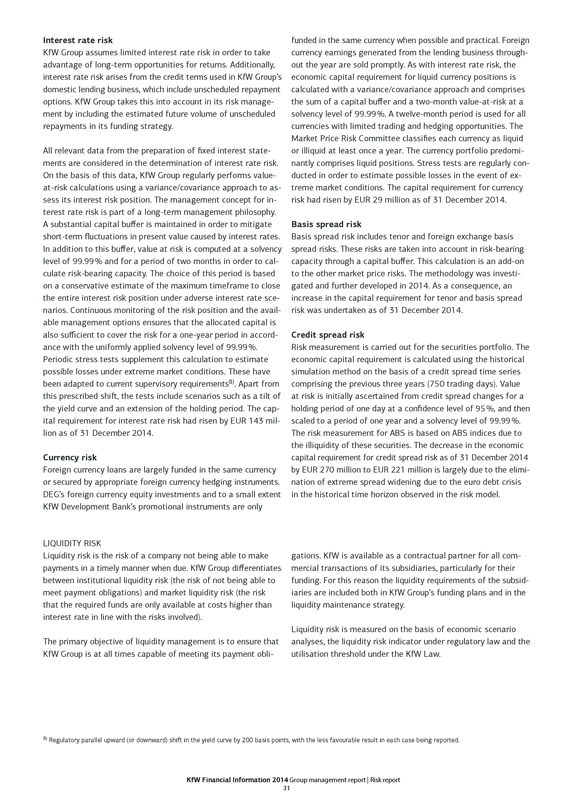
Interest rate risk
KfW Group assumes limited interest rate risk in order to take advantage of long-term opportunities for returns. Additionally, interest rate risk arises from the credit terms used in KfW Group’s domestic lending business, which include unscheduled repayment options. KfW Group takes this into account in its risk management by including the estimated future volume of unscheduled repayments in its funding strategy.
All relevant data from the preparation of fixed interest statements are considered in the determination of interest rate risk. On the basis of this data, KfW Group regularly performs value-at-risk calculations using a variance/covariance approach to assess its interest risk position. The management concept for interest rate risk is part of a long-term management philosophy. A substantial capital buffer is maintained in order to mitigate short-term fluctuations in present value caused by interest rates. In addition to this buffer, value at risk is computed at a solvency level of 99.99% and for a period of two months in order to calculate risk-bearing capacity. The choice of this period is based on a conservative estimate of the maximum timeframe to close the entire interest risk position under adverse interest rate scenarios. Continuous monitoring of the risk position and the available management options ensures that the allocated capital is also sufficient to cover the risk for a one-year period in accordance with the uniformly applied solvency level of 99.99%. Periodic stress tests supplement this calculation to estimate possible losses under extreme market conditions. These have been adapted to current supervisory requirements8). Apart from this prescribed shift, the tests include scenarios such as a tilt of the yield curve and an extension of the holding period. The capital requirement for interest rate risk had risen by EUR 143 million as of 31 December 2014.
Currency risk
Foreign currency loans are largely funded in the same currency or secured by appropriate foreign currency hedging instruments. DEG’s foreign currency equity investments and to a small extent KfW Development Bank’s promotional instruments are only
funded in the same currency when possible and practical. Foreign currency earnings generated from the lending business throughout the year are sold promptly. As with interest rate risk, the economic capital requirement for liquid currency positions is calculated with a variance/covariance approach and comprises the sum of a capital buffer and a two-month value-at-risk at a solvency level of 99.99%. A twelve-month period is used for all currencies with limited trading and hedging opportunities. The Market Price Risk Committee classifies each currency as liquid or illiquid at least once a year. The currency portfolio predominantly comprises liquid positions. Stress tests are regularly conducted in order to estimate possible losses in the event of extreme market conditions. The capital requirement for currency risk had risen by EUR 29 million as of 31 December 2014.
Basis spread risk
Basis spread risk includes tenor and foreign exchange basis spread risks. These risks are taken into account in risk-bearing capacity through a capital buffer. This calculation is an add-on to the other market price risks. The methodology was investigated and further developed in 2014. As a consequence, an increase in the capital requirement for tenor and basis spread risk was undertaken as of 31 December 2014.
Credit spread risk
Risk measurement is carried out for the securities portfolio. The economic capital requirement is calculated using the historical simulation method on the basis of a credit spread time series comprising the previous three years (750 trading days). Value at risk is initially ascertained from credit spread changes for a holding period of one day at a confidence level of 95%, and then scaled to a period of one year and a solvency level of 99.99%. The risk measurement for ABS is based on ABS indices due to the illiquidity of these securities. The decrease in the economic capital requirement for credit spread risk as of 31 December 2014 by EUR 270 million to EUR 221 million is largely due to the elimination of extreme spread widening due to the euro debt crisis in the historical time horizon observed in the risk model.
LIQUIDITY RISK
Liquidity risk is the risk of a company not being able to make payments in a timely manner when due. KfW Group differentiates between institutional liquidity risk (the risk of not being able to meet payment obligations) and market liquidity risk (the risk that the required funds are only available at costs higher than interest rate in line with the risks involved).
The primary objective of liquidity management is to ensure that KfW Group is at all times capable of meeting its payment obligations. KfW is available as a contractual partner for all commercial transactions of its subsidiaries, particularly for their funding. For this reason the liquidity requirements of the subsidiaries are included both in KfW Group’s funding plans and in the liquidity maintenance strategy.
Liquidity risk is measured on the basis of economic scenario analyses, the liquidity risk indicator under regulatory law and the utilisation threshold under the KfW Law.
8) Regulatory parallel upward (or downward) shift in the yield curve by 200 basis points, with the less favourable result in each case being reported.
KfW Financial Information 2014 Group management report | Risk report 31
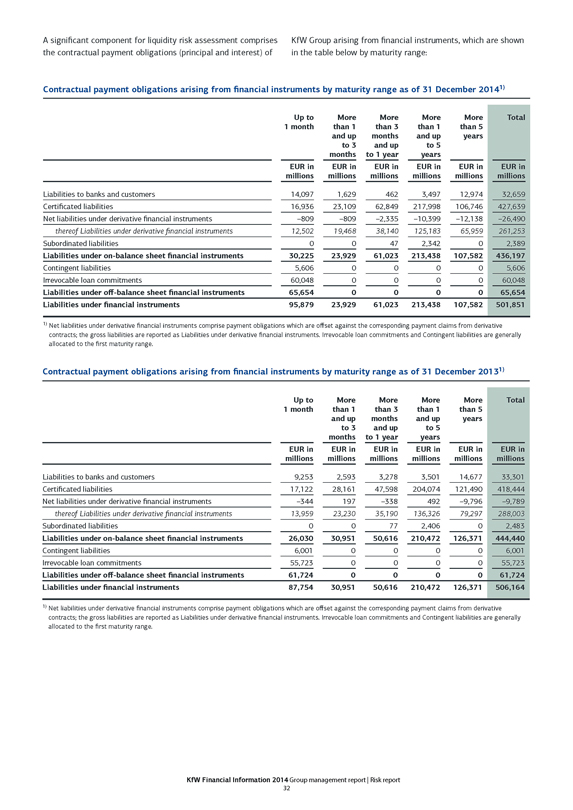
A significant component for liquidity risk assessment comprises the contractual payment obligations (principal and interest) of KfW Group arising from financial instruments, which are shown in the table below by maturity range:
Contractual payment obligations arising from financial instruments by maturity range as of 31 December 20141)
Up to 1 month
More than 1 and up to 3 months
More than 3 months and up to 1 year
More than 1 and up to 5 years
More than 5 years
Total
EUR in millions EUR in millions EUR in millions EUR in millions EUR in millions EUR in millions
Liabilities to banks and customers 14,097 1,629 462 3,497 12,974 32,659
Certificated liabilities 16,936 23,109 62,849 217,998 106,746 427,639
Net liabilities under derivative financial instruments –809 –809 –2,335 –10,399 –12,138 –26,490
thereof Liabilities under derivative financial instruments 12,502 19,468 38,140 125,183 65,959 261,253
Subordinated liabilities 0 0 47 2,342 0 2,389
Liabilities under on-balance sheet financial instruments 30,225 23,929 61,023 213,438 107,582 436,197
Contingent liabilities 5,606 0 0 0 0 5,606
Irrevocable loan commitments 60,048 0 0 0 0 60,048
Liabilities under off-balance sheet financial instruments 65,654 0 0 0 0 65,654
Liabilities under financial instruments 95,879 23,929 61,023 213,438 107,582 501,851
1) Net liabilities under derivative financial instruments comprise payment obligations which are offset against the corresponding payment claims from derivative contracts; the gross liabilities are reported as Liabilities under derivative financial instruments. Irrevocable loan commitments and Contingent liabilities are generally allocated to the first maturity range.
Contractual payment obligations arising from financial instruments by maturity range as of 31 December 20131)
Up to 1 month
More than 1 and up to 3 months
More than 3 months and up to 1 year
More than 1 and up to 5 years
More than 5 years
Total
EUR in millions EUR in millions EUR in millions EUR in millions EUR in millions EUR in millions
Liabilities to banks and customers 9,253 2,593 3,278 3,501 14,677 33,301
Certificated liabilities 17,122 28,161 47,598 204,074 121,490 418,444
Net liabilities under derivative financial instruments –344 197 –338 492 –9,796 –9,789
thereof Liabilities under derivative financial instruments 13,959 23,230 35,190 136,326 79,297 288,003
Subordinated liabilities 0 0 77 2,406 0 2,483
Liabilities under on-balance sheet financial instruments 26,030 30,951 50,616 210,472 126,371 444,440
Contingent liabilities 6,001 0 0 0 0 6,001
Irrevocable loan commitments 55,723 0 0 0 0 55,723
Liabilities under off-balance sheet financial instruments 61,724 0 0 0 0 61,724
Liabilities under financial instruments 87,754 30,951 50,616 210,472 126,371 506,164
1) Net liabilities under derivative financial instruments comprise payment obligations which are offset against the corresponding payment claims from derivative contracts; the gross liabilities are reported as Liabilities under derivative financial instruments. Irrevocable loan commitments and Contingent liabilities are generally allocated to the first maturity range.
KfW Financial Information 2014 Group management report | Risk report 32
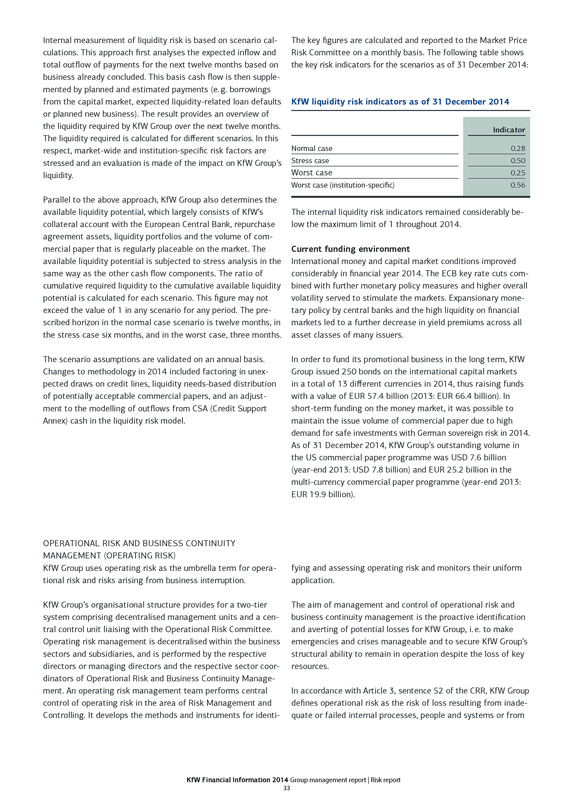
Internal measurement of liquidity risk is based on scenario calculations. This approach first analyses the expected inflow and total outflow of payments for the next twelve months based on business already concluded. This basis cash flow is then supplemented by planned and estimated payments (e.g. borrowings from the capital market, expected liquidity-related loan defaults or planned new business). The result provides an overview of the liquidity required by KfW Group over the next twelve months. The liquidity required is calculated for different scenarios. In this respect, market-wide and institution-specific risk factors are stressed and an evaluation is made of the impact on KfW Group’s liquidity.
Parallel to the above approach, KfW Group also determines the available liquidity potential, which largely consists of KfW’s collateral account with the European Central Bank, repurchase agreement assets, liquidity portfolios and the volume of commercial paper that is regularly placeable on the market. The available liquidity potential is subjected to stress analysis in the same way as the other cash flow components. The ratio of cumulative required liquidity to the cumulative available liquidity potential is calculated for each scenario. This figure may not exceed the value of 1 in any scenario for any period. The prescribed horizon in the normal case scenario is twelve months, in the stress case six months, and in the worst case, three months.
The scenario assumptions are validated on an annual basis. Changes to methodology in 2014 included factoring in unexpected draws on credit lines, liquidity needs-based distribution of potentially acceptable commercial papers, and an adjustment to the modelling of outflows from CSA (Credit Support Annex) cash in the liquidity risk model.
The key figures are calculated and reported to the Market Price Risk Committee on a monthly basis. The following table shows the key risk indicators for the scenarios as of 31 December 2014:
KfW liquidity risk indicators as of 31 December 2014
Indicator
Normal case 0.28
Stress case 0.50
Worst case 0.25
Worst case (institution-specific) 0.56
The internal liquidity risk indicators remained considerably below the maximum limit of 1 throughout 2014.
Current funding environment
International money and capital market conditions improved considerably in financial year 2014. The ECB key rate cuts combined with further monetary policy measures and higher overall volatility served to stimulate the markets. Expansionary monetary policy by central banks and the high liquidity on financial markets led to a further decrease in yield premiums across all asset classes of many issuers.
In order to fund its promotional business in the long term, KfW Group issued 250 bonds on the international capital markets in a total of 13 different currencies in 2014, thus raising funds with a value of EUR 57.4 billion (2013: EUR 66.4 billion). In short-term funding on the money market, it was possible to maintain the issue volume of commercial paper due to high demand for safe investments with German sovereign risk in 2014. As of 31 December 2014, KfW Group’s outstanding volume in the US commercial paper programme was USD 7.6 billion (year-end 2013: USD 7.8 billion) and EUR 25.2 billion in the multi-currency commercial paper programme (year-end 2013: EUR 19.9 billion).
OPERATIONAL RISK AND BUSINESS CONTINUITY MANAGEMENT (OPERATING RISK)
KfW Group uses operating risk as the umbrella term for operational risk and risks arising from business interruption.
KfW Group’s organisational structure provides for a two-tier system comprising decentralised management units and a central control unit liaising with the Operational Risk Committee. Operating risk management is decentralised within the business sectors and subsidiaries, and is performed by the respective directors or managing directors and the respective sector coordinators of Operational Risk and Business Continuity Management. An operating risk management team performs central control of operating risk in the area of Risk Management and Controlling. It develops the methods and instruments for identifying and assessing operating risk and monitors their uniform application.
The aim of management and control of operational risk and business continuity management is the proactive identification and averting of potential losses for KfW Group, i.e. to make emergencies and crises manageable and to secure KfW Group’s structural ability to remain in operation despite the loss of key resources.
In accordance with Article 3, sentence 52 of the CRR, KfW Group defines operational risk as the risk of loss resulting from inadequate or failed internal processes, people and systems or from
KfW Financial Information 2014 Group management report | Risk report 33
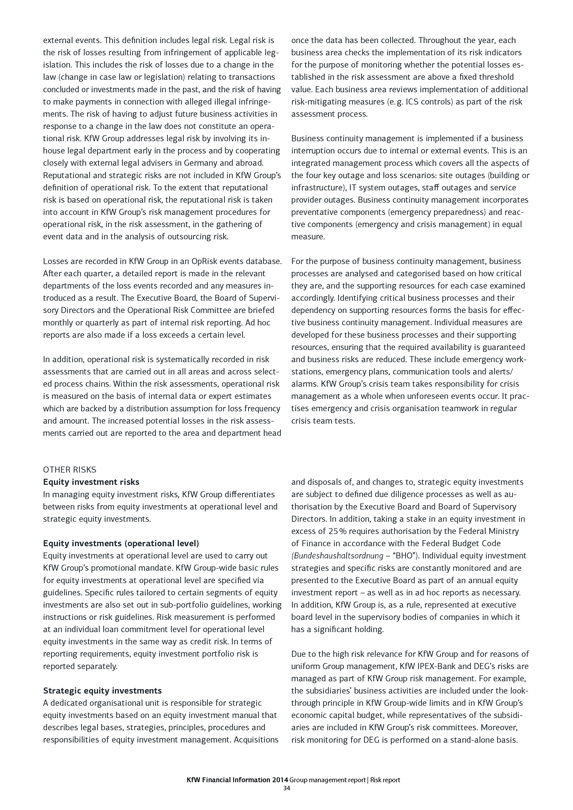
external events. This definition includes legal risk. Legal risk is the risk of losses resulting from infringement of applicable legislation. This includes the risk of losses due to a change in the law (change in case law or legislation) relating to transactions concluded or investments made in the past, and the risk of having to make payments in connection with alleged illegal infringements. The risk of having to adjust future business activities in response to a change in the law does not constitute an operational risk. KfW Group addresses legal risk by involving its in-house legal department early in the process and by cooperating closely with external legal advisers in Germany and abroad. Reputational and strategic risks are not included in KfW Group’s definition of operational risk. To the extent that reputational risk is based on operational risk, the reputational risk is taken into account in KfW Group’s risk management procedures for operational risk, in the risk assessment, in the gathering of event data and in the analysis of outsourcing risk.
Losses are recorded in KfW Group in an OpRisk events database. After each quarter, a detailed report is made in the relevant departments of the loss events recorded and any measures introduced as a result. The Executive Board, the Board of Supervisory Directors and the Operational Risk Committee are briefed monthly or quarterly as part of internal risk reporting. Ad hoc reports are also made if a loss exceeds a certain level.
In addition, operational risk is systematically recorded in risk assessments that are carried out in all areas and across selected process chains. Within the risk assessments, operational risk is measured on the basis of internal data or expert estimates which are backed by a distribution assumption for loss frequency and amount. The increased potential losses in the risk assessments carried out are reported to the area and department head once the data has been collected. Throughout the year, each business area checks the implementation of its risk indicators for the purpose of monitoring whether the potential losses established in the risk assessment are above a fixed threshold value. Each business area reviews implementation of additional risk-mitigating measures (e. g. ICS controls) as part of the risk assessment process.
Business continuity management is implemented if a business interruption occurs due to internal or external events. This is an integrated management process which covers all the aspects of the four key outage and loss scenarios: site outages (building or infrastructure), IT system outages, staff outages and service provider outages. Business continuity management incorporates preventative components (emergency preparedness) and reactive components (emergency and crisis management) in equal measure.
For the purpose of business continuity management, business processes are analysed and categorised based on how critical they are, and the supporting resources for each case examined accordingly. Identifying critical business processes and their dependency on supporting resources forms the basis for effective business continuity management. Individual measures are developed for these business processes and their supporting resources, ensuring that the required availability is guaranteed and business risks are reduced. These include emergency workstations, emergency plans, communication tools and alerts/ alarms. KfW Group’s crisis team takes responsibility for crisis management as a whole when unforeseen events occur. It practises emergency and crisis organisation teamwork in regular crisis team tests.
OTHER RISKS
Equity investment risks
In managing equity investment risks, KfW Group differentiates between risks from equity investments at operational level and strategic equity investments.
Equity investments (operational level)
Equity investments at operational level are used to carry out KfW Group’s promotional mandate. KfW Group-wide basic rules for equity investments at operational level are specified via guidelines. Specific rules tailored to certain segments of equity investments are also set out in sub-portfolio guidelines, working instructions or risk guidelines. Risk measurement is performed at an individual loan commitment level for operational level equity investments in the same way as credit risk. In terms of reporting requirements, equity investment portfolio risk is reported separately.
Strategic equity investments
A dedicated organisational unit is responsible for strategic equity investments based on an equity investment manual that describes legal bases, strategies, principles, procedures and responsibilities of equity investment management. Acquisitions
and disposals of, and changes to, strategic equity investments are subject to defined due diligence processes as well as authorisation by the Executive Board and Board of Supervisory Directors. In addition, taking a stake in an equity investment in excess of 25% requires authorisation by the Federal Ministry of Finance in accordance with the Federal Budget Code (Bundeshaushaltsordnung - “BHO”). Individual equity investment strategies and specific risks are constantly monitored and are presented to the Executive Board as part of an annual equity investment report - as well as in ad hoc reports as necessary. In addition, KfW Group is, as a rule, represented at executive board level in the supervisory bodies of companies in which it has a significant holding.
Due to the high risk relevance for KfW Group and for reasons of uniform Group management, KfW IPEX-Bank and DEG’s risks are managed as part of KfW Group risk management. For example, the subsidiaries’ business activities are included under the look-through principle in KfW Group-wide limits and in KfW Group’s economic capital budget, while representatives of the subsidiaries are included in KfW Group’s risk committees. Moreover, risk monitoring for DEG is performed on a stand-alone basis.
KfW Financial Information 2014 Group management report | Risk report 34

This monitoring includes regular reporting to the Executive Board as part of the monthly internal KfW Group risk report. All relevant risk control responsibilities for IPEX-Bank are performed in the group.
Reputational risk
Reputational risk is the risk that the perception of KfW Group from the point of view of the relevant internal and external interest groups will deteriorate for the long term with a negative impact on KfW Group. This negative impact could lead to a decrease in KfW Group’s net assets, earnings or liquidity (e. g. decline in new business) or may be of a non-monetary nature (e. g. difficulty in recruiting new staff). Reputational risk may arise as a consequence of other types of risk, or independently. In the risk management process, reputational risk is managed using a number of decentralised approaches. Examples include sustainability management with group-wide environmental and social principles relevant to credit approvals, or basing the management of KfW Group’s own securities portfolio on sustainability criteria. New activities, such as the new product process and outsourcing, are also to be examined with a view to potential reputational risk.
In parallel to this, as part of risk identification, the central reputational risk control function coordinates qualitative reputational risk assessment and creates a risk profile outlining KfW Group’s greatest reputational risks. In addition, regular reporting of reputational risk events is undertaken.
Project risk
Original project risk comprises, in particular, planning assumptions that turn out to be inaccurate. Project risk has implications for the achievement of project objectives with regard to cost, time and quality (e. g. underestimating the cost of implementation, failing to take account of time constraints arising from parallel projects). KfW Group’s project risk arises particularly in connection with various major long-term projects. Managing project risk is part of project management and takes place in both the project planning and execution stages.
The Central Project Management Office supports major projects in fulfilling their objectives and achieving their targets. As the central authority for project portfolio management, it provides the methodological framework for KfW Group’s major project implementation and creates transparency at the level of the entire project portfolio. This enables the Project Board and Executive Board to take targeted decisions. Setting methodological requirements through the Central Project Management Office enables a consistently high quality of implementation. Compliance with this framework and these requirements by major projects is also monitored and supported.
Internal monitoring procedures Internal Auditing
Internal Auditing is an instrument of the Executive Board. As an entity that works independently of KfW Group procedures, it audits and assesses all of KfW Group’s processes and activities to identify the risks involved and reports directly to the Executive Board.
With a view to risk management processes, Internal Auditing in 2014 audited the decentralised risk management processes and central aspects of risk management which were relevant bank-wide. Focal points included analyses of market and credit risk in support of major projects, as well as assessing the implementation of significant regulatory changes. Regarding decentralised risk management processes, the audit focused on equity finance processes in the domestic promotional business, among other areas.
As in previous years, Internal Auditing also monitored the continued development of risk measurement procedures in 2014 by participating (with guest status) in meetings of decision-making bodies.
Internal Auditing also functions as KfW Group’s internal auditing department. It is involved in subsidiaries’ audit planning and incorporates the audit results of the subsidiaries’ internal auditing departments in Group-wide internal audit reporting.
Compliance
The success of KfW Group is largely based on the confidence its shareholders, customers, business partners, employees and the general public place in its efficiency and above all in its integrity. This confidence rests not least on the implementation of and compliance with relevant statutory, supervisory and internal regulations and other relevant laws and rules.
The Executive Board bears the overall responsibility for compliance in KfW Group. The Executive Board delegates the associated tasks to the Compliance department.
The Compliance organisation structure is aligned with the requirements for a MaRisk compliance function. Adhering to this, group compliance has, for a number of years, included measures to comply with data protection regulations as well as measures for the prevention of insider trading, money laundering, terrorism financing and other criminal activities, and for monitoring legal requirements and the associated implementation measures. There are therefore binding rules and procedures that influence the day-to-day implementation of values and the corporate culture and that are continually updated to reflect the latest legal requirements and market conditions.
Regular training sessions on compliance and anti-money laundering are held for KfW Group employees. E-learning programmes are available in addition to classroom seminars.
KfW Financial Information 2014 Group management report | Risk report 35
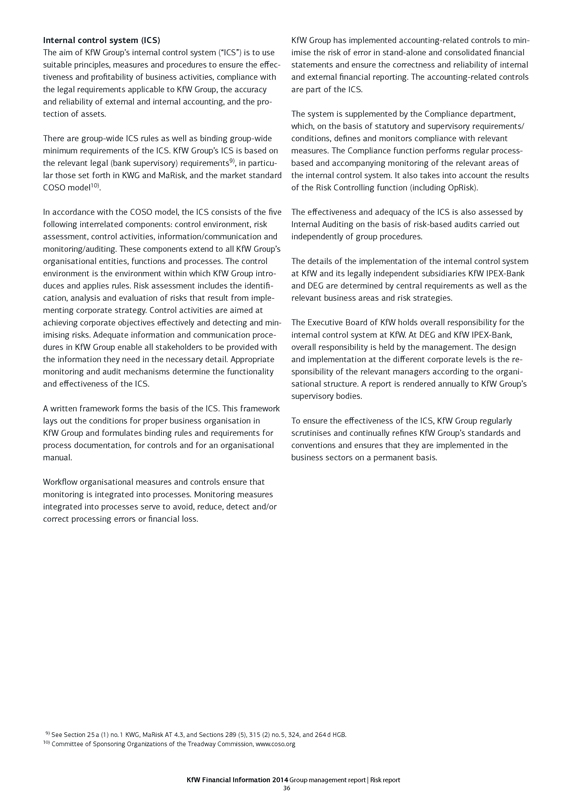
Internal control system (ICS)
The aim of KfW Group’s internal control system (“ICS”) is to use suitable principles, measures and procedures to ensure the effectiveness and profitability of business activities, compliance with the legal requirements applicable to KfW Group, the accuracy and reliability of external and internal accounting, and the protection of assets.
There are group-wide ICS rules as well as binding group-wide minimum requirements of the ICS. KfW Group’s ICS is based on the relevant legal (bank supervisory) requirements9), in particular those set forth in KWG and MaRisk, and the market standard COSO model10).
In accordance with the COSO model, the ICS consists of the five following interrelated components: control environment, risk assessment, control activities, information/communication and monitoring/auditing. These components extend to all KfW Group’s organisational entities, functions and processes. The control environment is the environment within which KfW Group introduces and applies rules. Risk assessment includes the identification, analysis and evaluation of risks that result from implementing corporate strategy. Control activities are aimed at achieving corporate objectives effectively and detecting and minimising risks. Adequate information and communication procedures in KfW Group enable all stakeholders to be provided with the information they need in the necessary detail. Appropriate monitoring and audit mechanisms determine the functionality and effectiveness of the ICS.
A written framework forms the basis of the ICS. This framework lays out the conditions for proper business organisation in KfW Group and formulates binding rules and requirements for process documentation, for controls and for an organisational manual.
Workflow organisational measures and controls ensure that monitoring is integrated into processes. Monitoring measures integrated into processes serve to avoid, reduce, detect and/or correct processing errors or financial loss.
KfW Group has implemented accounting-related controls to minimise the risk of error in stand-alone and consolidated financial statements and ensure the correctness and reliability of internal and external financial reporting. The accounting-related controls are part of the ICS.
The system is supplemented by the Compliance department, which, on the basis of statutory and supervisory requirements/ conditions, defines and monitors compliance with relevant measures. The Compliance function performs regular process-based and accompanying monitoring of the relevant areas of the internal control system. It also takes into account the results of the Risk Controlling function (including OpRisk).
The effectiveness and adequacy of the ICS is also assessed by Internal Auditing on the basis of risk-based audits carried out independently of group procedures.
The details of the implementation of the internal control system at KfW and its legally independent subsidiaries KfW IPEX-Bank and DEG are determined by central requirements as well as the relevant business areas and risk strategies.
The Executive Board of KfW holds overall responsibility for the internal control system at KfW. At DEG and KfW IPEX-Bank, overall responsibility is held by the management. The design and implementation at the different corporate levels is the responsibility of the relevant managers according to the organisational structure. A report is rendered annually to KfW Group’s supervisory bodies.
To ensure the effectiveness of the ICS, KfW Group regularly scrutinises and continually refines KfW Group’s standards and conventions and ensures that they are implemented in the business sectors on a permanent basis.
9) See Section 25 a (1) no. 1 KWG, MaRisk AT 4.3, and Sections 289 (5), 315 (2) no. 5, 324, and 264 d HGB.
10) Committee of Sponsoring Organizations of the Treadway Commission, www.coso.org
KfW Financial Information 2014 Group management report | Risk report 36
Forecast and opportunity report
General economic environment and development trends
Overall, the trend in the global economy in 2014 was disappointing. Momentum in major countries and economic areas was considerably less than expected at the beginning of the year. The assumption is that the global growth rate will also remain unsatisfactory in 2015, increasing slightly at best.
While the group of industrialised countries continues to grow at a slower rate than developing and emerging market countries, it still provides a strong impetus. This is especially true for the USA, whose economy is growing comparatively fast, enabling other countries to benefit from its growth. Overall, performance was widely divergent among the industrialised countries. The economies of Japan and the euro area continue to remain stagnant in 2015, with many countries performing below their potential.
Wide disparity in performance also continues to mark developing and emerging market countries. Russia and Brazil are in the throes of a veritable crisis; in China, the times of double-digit growth are clearly over. India and Indonesia have sustained solid growth.
The price of oil, which has tumbled since mid-2014, will continue to boost the economies of oil-importing countries in 2015. The industrialised countries will continue to work through their post-crisis reform agenda - a process that will nonetheless require stamina. Particular responsibility for the world economy in 2015 will rest with the central banks of the major industrialised countries: not only must their monetary decisions be suitable for the problem at hand, but their timing is critical as well. Geopolitical risks remain serious, and their development as well as their impact on the global economy are almost incalculable.
In the member states of the European Economic and Monetary Union (“EMU”), economic development will likely remain weak in 2015 as well. Private consumption will benefit from a slight decline in the unemployment rate and lower energy prices. The net export of goods and services will also contribute to growth, not least as favourable exchange rates help exports. Yet the economy is not expected to gain much momentum. Fiscal policy remains pro-cyclical; measures to reduce unemployment are progressing at a very slow pace, with investment activity by companies further impeded by the uncertain setting. Overall, KfW forecasts annual growth in price-adjusted GDP of around 1% in EMU countries in 2015 in comparison with 2014. The euro area remains susceptible to shocks due to its fragile situation.
The German economy was in a less favourable economic state at the beginning of 2015 compared with a year earlier. Economic momentum has practically come to a halt compared with most of the previous year. Business sentiment has deteriorated noticeably because of the many geopolitical uncertainties, but primarily owing to the repeatedly unfulfilled expectations of a euro-area upswing. Expectations for business were up at the start of the year. Real economic momentum will, however, likely pick up only gradually, despite impetus from the fall in oil prices and the euro’s depreciation - assuming that the crisis in Russia can be contained in the future and the euro area gets back on the road to growth. The difficult international situation - including renewed potential unsettling political discussions in the euro area following elections in Greece - is not only hampering growth in German exports but has also been keeping many companies from making investments for the time being. The labour market, private consumption and housing construction, in contrast, are aiding the economy. All in all, German GDP in 2015 will likely grow at a slower rate than in 2014. KfW forecasts real growth of around one per cent on the basis of data available at the beginning of the year. Yet this forecast is clouded with uncertainty, as emphasised by the wide range of publicly available economic forecasts for 2015. These range from less than one to around two and a half per cent.
The major central banks are expected to continue to pursue an expansionary monetary policy in 2015. The European Central Bank (“ECB”) expanded its stimulus programme further at the beginning of the year and resolved to increase its asset buyback programme. This will include the future purchase of securities from private and public issuers totalling EUR 60 billion each month. The ECB is expected to continue in expansionary mode, in an economic environment characterised by moderate economic growth and very low inflation. The USA, in contrast, faces a key rate reversal. The US Federal Reserve is expected to undertake this with great caution, raising key rates only moderately up to the end of 2015. Overall, the structural low-interest environment will continue. For the euro area in particular, there is very little potential for raising interest rates.
Risk outlook - Risk situation and risk-bearing capacity
The industrialised countries as a group are showing heterogeneous economic growth at present. While economic growth in the euro area and Japan remains weak, relatively positive production increases have been recorded in the USA and the UK. Although the euro crisis played a subordinate role in the financial markets in 2014, the possibility should not be ruled out that the
KfW Financial Information 2014 Group management report | Forecast and opportunity report 37
crisis may be rekindled as a result of political risks and ongoing major structural challenges in some member countries. Many emerging market countries are now struggling with a considerable cooling-off of growth (including Brazil and South Africa). In Russia, in particular, the economic outlook is very negative, magnified by sanctions issued by the West and the declining price of oil. In addition, there is the risk that geopolitical tensions or new unrest in the financial markets may trigger a considerable setback. Accordingly, the risks for global economic activity remain high.
The European banking sector will remain structurally vulnerable in 2015 owing to the further weakening of economic prospects. In addition, the low-interest environment, regulatory requirements and the costs of legal disputes will negatively affect the profitability of European banks. For this reason, restructuring in the European banking sector, combined with a further reduction in non-strategic assets (in Italy, among other countries) is likely to continue. Moreover, the discussions triggered by Greece’s new government on debt restructuring and a halt to the austerity and reform policy may also shift the European sovereign debt crisis back into focus and have a largely negative impact on the still fragile banks of the peripheral countries. In addition, the persisting geopolitical tensions between Russia and Ukraine are likely to have an increasingly negative effect on the banks active in those countries – primarily Austrian and French banks. Under the “Juncker Plan”, the European Commission has developed a proposal for a European Fund for Strategic Investments (EFSI) established with the European Investment Bank (EIB). The European Commission and the EIB will provide a total of EUR 21 billion in risk hedging for the fund. At EIB level and through involvement of further investors, this is supposed to permit additional investments in infrastructure and SME promotion in a total amount of approximately EUR 315 billion over a period of three years. Germany and KfW will not be participating in the EFSI with own funds. However, in consultation with the Federal Government, KfW has promised to fund investments in Europe (project financing, global loans, securitisations) of up to EUR 8 billion over the next three years if the hedging instruments made available under the EFSI are also made available to KfW in a suitable manner and, accordingly, such investments would not entail an increased risk profile for KfW. Negotiations between the European Council, Commission and Parliament regarding the precise structure of the EFSI, and thus also access for national promotional banks (like KfW) to its hedging instruments, are still underway. Accordingly, it is not yet possible to specify which investments in what amount KfW will in fact offer in connection with the Juncker Plan. The gradual interest rate increases expected from the US Federal Reserve heighten the potential risks to banking markets of emerging countries with export deficits (such as Brazil, Turkey and South Africa) due to continued capital outflows and the further depreciation of the currencies of those countries.
The German corporate sector is expected initially to see further stagnation and investment reluctance in 2015. Owing to a very favourable credit supply, companies are likely to continue to benefit from advantageous loan terms and relaxed lending structures. Risks are increasing in particular in the automotive industry, which is crucial to Germany, and which benefits from strong demand in developing countries and the USA as well as a stabilising situation in Europe. The merchant shipping situation remains difficult, with the exception of the gas tanker segment.
Although the German private equity market is on a positive footing, it has recently exhibited a declining trend. The persisting low-interest environment and the increasing propensity of foreign investors in German companies could boost investment in this asset class in the future. Follow-on financing in the early growth phase, however, will continue to be a weakness in the area of venture capital. The overall market outlook for 2015 is positive as well; however, it remains volatile in view of the potential rekindling of the euro crisis.
Compared with the previous year, higher economic growth is expected in 2015 for most of the major countries in which KfW subsidiary DEG invests. In view of the monetary policy changes in the USA, high rates of inflation in some of these countries and in light of the mainly political risks that have increased in some cases, some of these countries’ currencies are expected to weaken by the end of 2015.
The European securitisation market is likely to be influenced by the ECB’s purchase programme for securitisations in 2015. Yet strong demand from the ECB will run up against an invariably limited supply, thus resulting in lower yields. This will lead to higher market prices for KfW’s existing ABS investments but will also increase the pressure on returns from new investments. Moreover, the ECB as a major purchaser will reduce the available investment volume for other investors.
Overall, KfW does not anticipate the expected developments in the segments of the group which are relevant in terms of risk to have material effects on the risk situation.
As part of KfW’s assessment of its risk-bearing capacity for
2015, forecasts for KfW Group’s tier 1 and total capital ratios demonstrate that KfW remains well capitalised. The capital ratios are expected to remain considerably above the legally required minimum levels in 2015 as well. Stable overall developments are anticipated for the group’s economic risk-bearing capacity (99.99 % solvency level) in 2015. Potential changes in economic, political and legal conditions may have a significant impact on capital ratios and economic risk-bearing capacity. There is thus considerable uncertainty regarding the forecast for 2015.
2014 saw a stable liquidity situation and key liquidity risk indicators within the defined limits at all times. An adjustment to the planned funding volume was made in the second half of 2014. This slightly lower target figure was also used for 2015. No significant changes in the liquidity risk situation are forecast for 2015 owing to the unchanged refinancing situation, a slightly lower forecast again for the volume of new business and a constantly high expected volume of unscheduled repayments.
KfW Financial Information 2014 Group management report | Forecast and opportunity report 38
New business projections Overview
The planned new business volume of EUR 69.5 billion for 2015 is slightly below the 2014 figure (EUR 74.1 billion). A negligible decrease in promotional business volume is forecast for both German and foreign business sectors. To implement KfW Group’s strategic objectives, the plans for the group’s business sectors contain measures with a strategic focus on promotional quality and an orientation of business activities towards the key areas of “climate change and environment”, “globalisation and technical progress” and “demographic change”. The portion of new promotional business volume dedicated to climate and environmental protection financing is planned to be 36%, thereby slightly exceeding the strategic objective requirement of approximately 35 %. At 45%, the share of planned financing for small and medium-sized enterprises (“SMEs”) in domestic promotional business (the SME ratio) is expected to be within the range of the target level set in the strategic objectives (approximately 50%).
The focus in KfW’s domestic promotional business will remain on SME financing and on safeguarding the viability of companies. KfW’s international business areas are staying on course for growth in the medium term in order to support the internationalisation of German companies as part of globalisation.
Domestic promotional business
Domestically, KfW supports the German economy with the promotional programmes of the business sectors Mittelstandsbank (SME Bank) and Kommunal- und Privatkundenbank/Kreditinstitute (Municipal and Private Client Bank/Credit Institutions) through the promotion of investments by private individuals, companies, cities and municipalities as well as non-profit and social organisations.
Mittelstandsbank will also remain the primary provider to SMEs in the future. It makes an important contribution to securing and creating jobs through the provision of low-interest, long-term financing for corporate investments and start-ups. Through innovation financing, it also strengthens the SME sector’s flexibility in global competition and strongly promotes environmental and climate protection projects. For 2015, Mittelstandsbank expects a new promotional business volume of EUR 20.0 billion for its promotional areas.
The demand for general corporate financing from KfW is closely tied to economic trends. Mittelstandsbank thus continues to anticipate subdued demand for loans by companies and self-employed persons in view of uncertain growth prospects. The business sector does not see any impetus for increased demand in start-up financing either. In the area of innovation financing, in contrast, Mittelstandsbank anticipates demand at a similarly high level to 2014. The financing offering in this area was further strengthened by the KfW-Unternehmerkredit Plus entrepreneur loan introduced in December 2014.
Financing for environmental and climate protection financing depends on the prevailing legal conditions. This is particularly the case for investments in renewable energy (i. e. gradual decline in the feed-in tariffs). The new conditions are set out in the reform of the German Renewable Energy Act (Erneuerbare- Energien-Gesetz), which came into force on 1 August 2014. Mittelstandsbank expects that the expansion objectives defined therein will be achieved and the promotional business volume in the area of renewable energy (electricity) will remain constant in the next few years. Additionally, Mittelstandsbank anticipates increased demand for financing offshore wind energy in the German territory of the Baltic Sea and the North Sea. The business sector continues to see major potential in energy efficiency measures.
The persisting low interest rates present a challenge. A further decline in interest rates in the capital markets would, all other things being equal, make it increasingly difficult to set terms and maintain the relative advantages of promotional loans through afforded by interest rate reductions.
Kommunal- und Privatkundenbank/Kreditinstitute (Municipal and Private Client Bank/Credit Institutions) continues to focus its promotional activities on the two megatrends of “climate change and environmental protection” and “demographic development”. In addition to its focus on private clients, the long-term objective of the business sector is to continue being a reliable partner to municipalities and municipal service companies as well as the promotional institutions of the federal states (Landesförderinstitute). Four major factors contribute to ongoing high demand in the medium term in our private client business:
1. Climate change, the energy transition and rising energy costs drive up demand in the housing programmes for “Energy-efficient Construction and Refurbishment”.
2. The persisting low interest rate favours investments in residential properties.
3. Advancing demographic change will result in further investment requirements in housing.
4. The need to raise the level of education and alleviate the shortage of education professionals, moreover, has resulted in a continued need for promotional loans geared towards educational programmes for primary and secondary school pupils, university students and those in professional training.
With respect to promotional loans to municipalities, their investment opportunities are primarily characterised by the increasing diversification of their budget and debt situation. The funding situation of partner banks meanwhile has improved in individual financing with financing partners in Germany and Europe as well as general refinancing of promotional institutions of the federal states. The “Energy-efficient Construction and Refurbishment” programmes, in particular, position KfW as the central promoter of environmental protection for private clients and the setter of standards for energy efficiency in residential buildings. In promotion of municipal infrastructure, the two basic programmes “IKK - Investment Loans for Municipalities” and “IKU - Investment Loans for Municipal Companies and Social Organisations” serve to position KfW as a reliable partner to municipalities and municipal service companies. In infrastructure
KfW Financial Information 2014 Group management report | Forecast and opportunity report 39
promotion too, KfW is increasingly focusing on the aims of environmental and climate protection and consequently the promotion of energy efficiency and energy-saving. The business sector pursues the strategic aim of “demographic development” within the framework of promotional activities through programmes to improve accessibility in existing properties and public space, as well as through reliable and customer-focused financing offerings for housing and education. As a financing partner of the promotional institutions of the federal states, the business sector aims to ensure the business volume of programme-based global loans at the current high level and selectively expand it for programmes relevant to the energy transition. In general financing, the aim is to maintain the business volume at its current level despite the improved refinancing situation of the promotional institutions of the federal states. The business sector’s traditional domestic promotional offerings are complemented with capital market-related products (e. g. the SME Collateralized Bond), as well as global loans for lease financing and European SME and energy efficiency financing.
For 2015, Kommunal- und Privatkundenbank/Kreditinstitute expects a promotional business volume of EUR 26.7 billion.
Capital markets
The debate about the future role of increased capital market oriented financing in the real economy, and in the SME sector in particular, gained momentum in 2014. The focus of this SME financing is on the instrument of securitisation. Through bundling receivables from SMEs, this instrument gives smaller enterprises access to the capital markets and financing.
Through investing in the securitisation of SME receivables, the business sector Capital markets makes a major contribution to KfW’s capital market oriented promotion of SMEs. Current assessment is under way on expanding these activities in Europe. For 2015, the business sector Capital markets expects a new business volume of EUR 0.8 billion.
International business
The objective of the Export and project finance business sector continues to be to strengthen its position as a specialist financier of, and responsible partner to, the German and European economies. The economy in this business sector’s key German and European markets has experienced moderate growth, while showing weaker trends in some of the relevant developing and emerging market countries (e. g. Brazil). The current crises, particularly in Russia, have meanwhile led to a reluctance to invest on the part of customers. Overall, there is still sufficient potential for German and European exporters and enterprises that invest in their competitiveness, which leads to opportunities for the business sector.
The Export and project finance business sector is aimed at sustainably supporting the German and European economy with project and export financing to maintain and increase competitiveness and internationalisation, as well as increasing its contribution to the group result. The business sector aims towards the continuous expansion of its business volume (organic growth) to achieve its two strategic objectives. Sales activities in all regions will continue to be intensified to expand its market position; selective strengthening will also be undertaken for representative offices abroad. Targeted measures are to be undertaken to enhance structuring expertise, to focus product consultation on the Export Credit Agencies (ECA) business and to ensure that more tasks are performed as a modelling agent. Above all, these measures serve to address the challenges faced in the “globalisation and technical progress” megatrend. For 2015, the Export and project finance business sector expects a new business volume of EUR 14.2 billion.
The Promotion of developing and transition countries business sector encompasses the business activities of KfW Development Bank and DEG – Deutsche Investitions- und Entwicklungs-gesellschaft mbH (German Investment and Development Company, “DEG”).
The market environment of KfW Development Bank will remain highly complex. A distinction can be seen here between partner countries as well as a shift in political, economic and strategic weightings from industrialised to developing and emerging market countries. A growing number of players (emerging market countries, government officials in the lender countries, private players, multilateral funds) and additional financing opportunities (including low interest rates on international capital markets, creation of a BRICS (Brazil, Russia, India, China, South Africa) development bank, corporate foundations, foreign direct investments, remittances by migrants) increase the competition. KfW Development Bank will continue to be positioned with its comparative advantage as part of the largest German promotional bank. This includes securing and expanding the relevance of KfW Development Bank and its instruments for the Federal Government and increasing its competitiveness. Further expansion of new commitments in development and promotional loans as well as the development of further promotional solutions for fragile countries play an important role here. Support of the German positioning in the new United Nations (UN) post-2015 development agenda and the Official Development Assistance (ODA) reform are also key.
KfW Development Bank will continue to position itself as the main implementer of the Federal Government’s environmental and climate financing, in order to ensure relevance and legitimisation for the government beyond traditional, poverty-focused development cooperation, to diversify the business sector and to exploit growth potential, particularly in emerging market countries. Measures include the expansion of climate financing in the reduction of and adaptation to climate change. Other goals include supporting the reshaping of the international climate finance architecture and development of innovative promotional approaches. Efforts continue to intensify the cooperation with the European Commission. The focus here is on developing a collateralisation instrument, collaboration on the European Union (EU) blending platform and designing the blending facilities. For 2015, KfW Development Bank expects a commitment volume of EUR 6.3 billion.
Apart from the “climate change and environment” megatrend, the main trend affecting DEG’s business is globalisation, especially
KfW Financial Information 2014 Group management report | Forecast and opportunity report 40
the changing role of developing and emerging market countries. In many developing and emerging market countries, there is, however, a need for structural reform in order to increase the potential for sustainable growth (e. g. in Latin America). Yet at the same time, numerous conflicts are severely limiting activity in some regions. The current regional outlook for Asia is positive, as it is for Africa, although significant effects are anticipated in some regions as a result of the Ebola outbreak. Demand for development financing in these markets remains high and significantly exceeds supply. However, as the leading European development financier, DEG must pursue further innovative development of its business model. Bilateral and multilateral development financing institutions are developing regionally and expanding their product range. Socially responsible investors (SRIs) are becoming increasingly involved in DEG’s markets. In order to establish its role as a promoter of the private economy for the long term, DEG focuses on differentiation and offers added-value-creating solutions in addition to financing. SME promotion and risk capital financing continue to form DEG’s strategic foundation. As the sole risk capital provider in KfW’s
foreign business, DEG offers its customers mezzanine capital and equity in this context. DEG directly and indirectly complements financing of SMEs through targeted advisory services as well. In financing renewable and efficient energy providers and improving the climate and environmental quality of their projects, DEG also reinforces its position as a sustainable promoter of climate and environmental protection. As a pioneer investor, DEG is active in markets relevant to development policy with high growth potential and is further expanding its activities in Africa and other future markets, such as in the International Development Association (IDA) group and post-conflict countries. For financial year 2015, DEG expects a new promotional business volume of EUR 1.5 billion.
Privatisation transactions with the German Federal Government
In connection with the Federal Government’s privatisation transactions, KfW is generally prepared to conduct further privatisation transactions in 2015, taking into account market conditions and strategic requirements of the Federal Government.
Funding projections
KfW is one of the most active and largest bond issuers in the world. The combination of top-grade credit quality and a diversified and reliable funding strategy means that KfW enjoys an excellent reputation in the international capital markets. KfW seeks to maintain this position with great care and responsibility. KfW anticipates a high funding volume over the next two years. In 2015, KfW expects a funding volume comparable to the 2014 level of between EUR 55 billion and EUR 60 billion.
With the explicit, direct guarantee of the German Federal Government, KfW is well positioned on the capital market. Its reliable and forward-looking issuing policy has been very well received by investors around the world. KfW’s funding will thus remain on a solid foundation.
In addition to public bonds and private placements, highly liquid benchmark bonds denominated in euros and US dollars will continue to represent the most important pillars of KfW’s funding in the future. The wide range of products in the issuing business will continue to be focussed on investors’ needs. In view of the persisting low rate of interest, KfW expects that the share of foreign currencies in the total funding volume will continue to increase in the future. Moreover, KfW expects the Chinese renminbi’s importance as a global currency to increase.
KfW plans to expand its green bonds offering in 2015. New currencies, such as the Australian dollar and British pound, and new products such as private placements, are to be offered in addition to issues in the core currencies of the euro and US dollar.
Earnings projections
In its current earnings projections for the group, KfW expects to achieve consolidated profit (before IFRS effects from hedging) of just under EUR 1 billion in financial year 2015 based on anticipated macroeconomic conditions. The expected result is thus at the lower end of the strategic objectives range. Anticipated contributions from Net interest income and Net commission income (in each case, before promotional activities) are at a high level similar to that of previous years; however, the negative effects due to the ongoing low interest environment are increasingly noticeable. Thus interest rate margins from the lending business that are slightly higher than in 2014 are offset by declining results from interest rate and liquidity maturity transformation. Further negative effects on earnings result from the noticeable increase in administrative expense (before promotional activities) compared with 2014. This is largely due to cost increases from modernisation and regulation measures; otherwise, barely any increases in costs are anticipated beyond those of personnel costs associated with collective agreements. While current efficiency projects are having a dampening effect on costs, they cannot fully offset the cost increase planned for 2015. Overall, this will result in a significant increase in the expected cost/income ratio (CIR) before promotional activities. The risk provisions for lending business, which are expected to be higher than 2014 based on projected standard risk costs, will have a negative effect on earnings. An increase is expected in planned promotional activities compared with 2014, in particular in Mittelstandsbank.
The KfW business model is oriented towards the medium to long term; income from the lending business (interest rate margins and Net commission income) in particular is very stable. Opportunities and risks for consolidated profit may arise in particular from differences between actual and forecast interest rate movements, from risk provisions that deviate from those planned as well as from temporary effects on results arising from the valuation of economically effective hedges (IFRS-related effects on results). The latter have no economic basis and therefore are not explicitly included in KfW’s planning.
KfW Financial Information 2014 Group management report | Forecast and opportunity report 41
The interest rate on which the earnings forecast is based is expected to remain at a low rate initially and rise slightly towards the end of 2015. Should interest rates increase more strongly than expected, then this could negatively affect Net interest income as a result of maturity transformation. However, it may be assumed that in an economic environment where interest rates increase significantly, expenses for risk provisioning tend to be less than standard risk costs, which would at least partially compensate the effects on earnings. Should interest rates not
rise at the end of 2015 or fall further, this would have a favourable effect in the short term with respect to maturity transformation and earnings due to a rise in unscheduled repayments. However, in this scenario only, considerably lower reinvestment interest rates from the cumulatively very high unscheduled repayments of previous years would be realisable, with negative effects on Net interest income, so negative effects on Net interest income would be expected in the medium term.
HR strategy/development of workforce
Further savings in personnel requirements are expected in 2015 due to KfW’s current projects in modernisation, professionalisation, and increased efficiency. These will be implemented through a reduction in external workers, natural staff turnover and by the necessary transfer of employees within the company. These savings will be offset by a moderate increase in personnel due to regulatory requirements.
KfW’s personnel development with its core function of professional and personal qualification of all employees also plays an important role. This is supported by a comprehensive programme of seminars, language courses, workshops and individual departmental and team training courses, as well as practical observation training and job rotation, offered both in-house and externally. A new skills model for the selection and development of managers was developed, and established instruments like shadowing, assessment of potential and mentoring further developed. With its professionalised and expanded change management programme, HR provides support for the numerous intensive change processes and major projects under way at the bank.
KfW supports its staff in terms of gender balance, particularly by reconciling career and family life and offering flexible working hours.
KfW Financial Information 2014 Group management report | Forecast and opportunity report 42

Consolidated financial statements
KFW

Consolidated statement of comprehensive income 46
Consolidated statement of financial position 48
Consolidated statement of changes in equity 49
Consolidated statement of cash flows 53
Notes 55
Accounting polices 56
(1) Basis of presentation 56
(2) Judgements and accounting estimates 57
(3) Assessment of the impact of new or amended IFRS/IFRIC standards applied for the first time 57
(4) Group of consolidated companies 58
(5) Basis of consolidation 59
(6) Financial instruments: recognition and measurement 59
(7) Financial instruments: valuation techniques 62
(8) Promotional lending business at KfW 64
(9) Financial derivatives and hedging relationships 65
(10) Treatment of embedded derivatives 66
(11) Credit derivatives 67
(12) Foreign currency translation 67
(13) Loans and advances to banks and customers 67
(14) Risk provisions for lending business 68
(15) Securities and investments 68
(16) Repurchase agreements 69
(17) Property, plant and equipment 69
(18) Intangible assets 70
(19) Taxes on income 70
(20) Liabilities to banks and customers and Certificated liabilities 70
(21) Provisions 71
(22) Subordinated liabilities 72
(23) Equity 72
(24) Contingent liabilities and irrevocable loan commitments 72
(25) Trust activities 73
(26) Leasing transactions 73
Notes to the statement of comprehensive income 74
(27) Net interest income 74
(28) Risk provisions for lending business 75
(29) Net commission income 75
(30) Net gains/losses from hedge accounting 76
(31) Net gains/losses from other financial instruments at fair value through profit or loss 77
(32) Net gains/losses from Securities and investments 79
(33) Net gains/losses from investments accounted for using the equity method 80
(34) Administrative expense 80
(35) Net other operating income 81
(36) Taxes on income 81
(37) Other comprehensive income 83
Segment reporting 84
(38) Segment reporting by business sector 84
(39) Segment reporting by region 88
KfW Financial Information 2014 Consolidated financial statements 44
Notes to the statement of financial position 89
(40) Cash reserves 89
(41) Loans and advances to banks 89
(42) Loans and advances to customers 90
(43) Risk provisions for lending business 91
(44) Value adjustments from macro fair value hedge accounting 92
(45) Derivatives used for hedge accounting 92
(46) Other derivatives 93
(47) Securities and investments 94
(48) Investments accounted for using the equity method 94
(49) Property, plant and equipment 94
(50) Intangible assets 95
(51) Income tax assets 96
(52) Other assets 97
(53) Liabilities to banks 97
(54) Liabilities to customers 98
(55) Certificated liabilities 98
(56) Value adjustments from macro fair value hedge accounting 98
(57) Derivatives used for hedge accounting 99
(58) Other derivatives 99
(59) Provisions 100
(60) Income tax liabilities 103
(61) Other liabilities 104
(62) Subordinated liabilities 105
(63) Equity 105
Notes to financial instruments 106
(64) Gains and losses from financial instruments by measurement category 106
(65) Balance sheet for financial instruments by measurement category 108
(66) Disclosures on the reclassification of financial assets 112
(67) Fair values of financial instruments 113
(68) Disclosures on methods used to measure financial instruments at fair value 114
(69) Additional disclosures on Liabilities to banks 126
(70) Additional disclosures on Liabilities to customers 127
(71) Additional disclosures on Certificated liabilities 127
(72) Additional disclosures on financial liabilities designated at fair value through profit or loss 128
(73) Additional disclosures on derivatives 128
(74) Additional disclosures on the PROMISE/PROVIDE synthetic securitisation platforms 129
(75) Disclosures on repurchase agreements 130
(76) Disclosure on offsetting financial instruments 131
Other notes 134
(77) Contingent liabilities and irrevocable loan commitments 134
(78) Trust activities and administered loans 134
(79) Leasing transactions as lessee 135
(80) Average number of employees during the financial year 135
(81) Compensation report 136
(82) Related party disclosures 143
(83) Auditor’s fees 144
(84) Disclosures on unconsolidated structured entities 144
(85) Disclosures on shareholdings 146
KfW Financial Information 2014 Consolidated financial statements 45
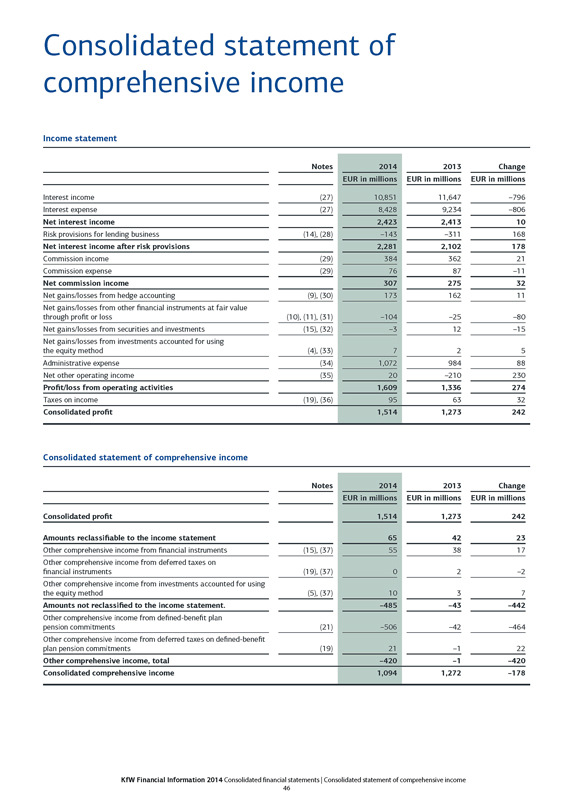
Consolidated statement of comprehensive income
Income statement
Notes 2014 2013 Change
EUR in millions EUR in millions EUR in millions
Interest income (27) 10,851 11,647 –796
Interest expense (27) 8,428 9,234 –806
Net interest income 2,423 2,413 10
Risk provisions for lending business (14), (28) –143 –311 168
Net interest income after risk provisions 2,281 2,102 178
Commission income (29) 384 362 21
Commission expense (29) 76 87 –11
Net commission income 307 275 32
Net gains/losses from hedge accounting (9), (30) 173 162 11
Net gains/losses from other financial instruments at fair value through profit or loss (10), (11), (31) –104 –25 –80
Net gains/losses from securities and investments (15), (32) –3 12 –15
Net gains/losses from investments accounted for using the equity method (4), (33) 7 2 5
Administrative expense (34) 1,072 984 88
Net other operating income (35) 20 –210 230
Profit/loss from operating activities 1,609 1,336 274
Taxes on income (19),(36) 95 63 32
Consolidated profit 1,514 1,273 242
Consolidated statement of comprehensive income
Notes 2014 2013 Change
EUR in millions EUR in millions EUR in millions
Consolidated profit 1,514 1,273 242
Amounts reclassifiable to the income statement 65 42 23
Other comprehensive income from financial instruments (15), (37) 55 38 17
Other comprehensive income from deferred taxes on financial instruments (19), (37) 0 2 –2
Other comprehensive income from investments accounted for using the equity method (5),(37) 10 3 7
Amounts not reclassified to the income statement. –485 –43 –442
Other comprehensive income from defined-benefit plan pension commitments (21) –506 –42 –464
Other comprehensive income from deferred taxes on defined-benefit plan pension commitments (19) 21 –1 22
Other comprehensive income, total –420 –1 –420
Consolidated comprehensive income 1,094 1,272 –178
KfW Financial Information 2014 Consolidated financial statements | Consolidated statement of comprehensive income 46
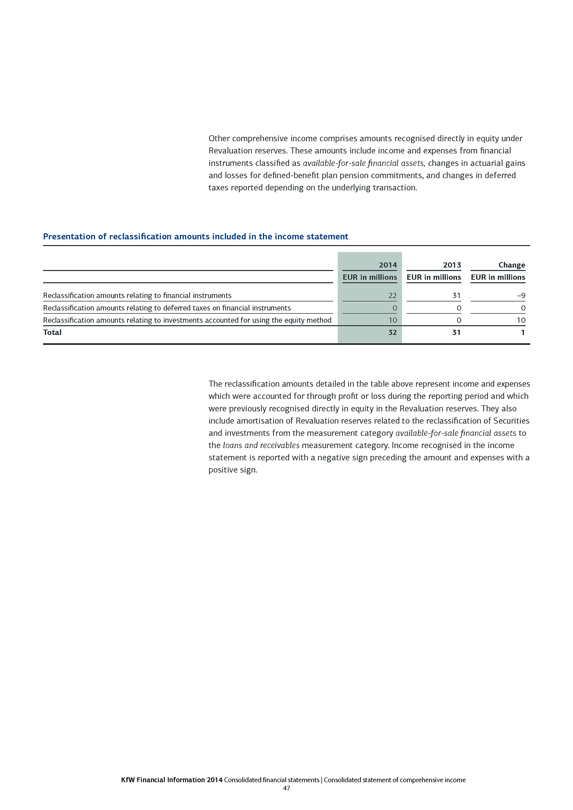
Other comprehensive income comprises amounts recognised directly in equity under Revaluation reserves. These amounts include income and expenses from financial instruments classified as available-for-sale financial assets, changes in actuarial gains and losses for defined-benefit plan pension commitments, and changes in deferred taxes reported depending on the underlying transaction.
Presentation of reclassification amounts included in the income statement
2014 2013 Change
EUR in millions EUR in millions EUR in millions
Reclassification amounts relating to financial instruments 22 31 –9
Reclassification amounts relating to deferred taxes on financial instruments 0 0 0
Reclassification amounts relating to investments accounted for using the equity method 10 0 10
Total 32 31 1
The reclassification amounts detailed in the table above represent income and expenses which were accounted for through profit or loss during the reporting period and which were previously recognised directly in equity in the Revaluation reserves. They also include amortisation of Revaluation reserves related to the reclassification of Securities and investments from the measurement category available-for-sale financial assets to the loans and receivables measurement category. Income recognised in the income statement is reported with a negative sign preceding the amount and expenses with a positive sign.
KfW Financial Information 2014 Consolidated financial statements | Consolidated statement of comprehensive income 47
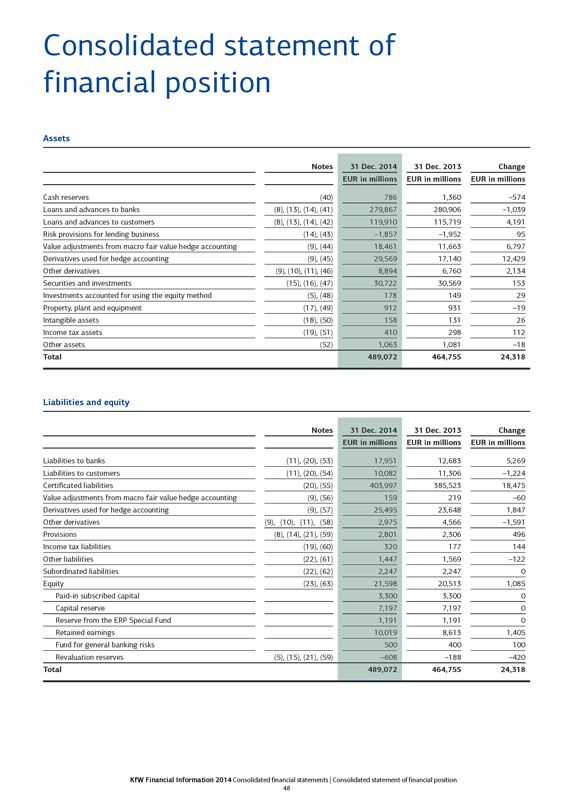
Consolidated statement of financial position
Assets
Notes 31 Dec. 2014 31 Dec. 2013 Change
EUR in millions EUR in millions EUR in millions
Cash reserves (40) 786 1,360 –574
Loans and advances to banks (8), (13), (14), (41) 279,867 280,906 –1,039
Loans and advances to customers (8), (13), (14), (42) 119,910 115,719 4,191
Risk provisions for lending business (14), (43) –1,857 –1,952 95
Value adjustments from macro fair value hedge accounting (9), (44) 18,461 11,663 6,797
Derivatives used for hedge accounting (9), (45) 29,569 17,140 12,429
Other derivatives (9), (10), (11), (46) 8,894 6,760 2,134
Securities and investments (15), (16), (47) 30,722 30,569 153
Investments accounted for using the equity method (5), (48) 178 149 29
Property, plant and equipment (17), (49) 912 931 –19
Intangible assets (18), (50) 158 131 26
Income tax assets (19), (51) 410 298 112
Other assets (52) 1,063 1,081 –18
Total 489,072 464,755 24,318
Liabilities and equity
Notes 31 Dec. 2014 31 Dec. 2013 Change
EUR in millions EUR in millions EUR in millions
Liabilities to banks (11), (20), (53) 17,951 12,683 5,269
Liabilities to customers (11), (20), (54) 10,082 11,306 –1,224
Certificated liabilities (20), (55) 403,997 385,523 18,475
Value adjustments from macro fair value hedge accounting (9), (56) 159 219 –60
Derivatives used for hedge accounting (9), (57) 25,495 23,648 1,847
Other derivatives (9), (10), (11), (58) 2,975 4,566 –1,591
Provisions (8), (14), (21), (59) 2,801 2,306 496
Income tax liabilities (19), (60) 320 177 144
Other liabilities (22), (61) 1,447 1,569 –122
Subordinated liabilities (22), (62) 2,247 2,247 0
Equity (23), (63) 21,598 20,513 1,085
Paid-in subscribed capital 3,300 3,300 0
Capital reserve 7,197 7,197 0
Reserve from the ERP Special Fund 1,191 1,191 0
Retained earnings 10,019 8,613 1,405
Fund for general banking risks 500 400 100
Revaluation reserves (5), (15), (21), (59) –608 –188 –420
Total 489,072 464,755 24,318
KfW Financial Information 2014 Consolidated financial statements | Consolidated statement of financial position 48
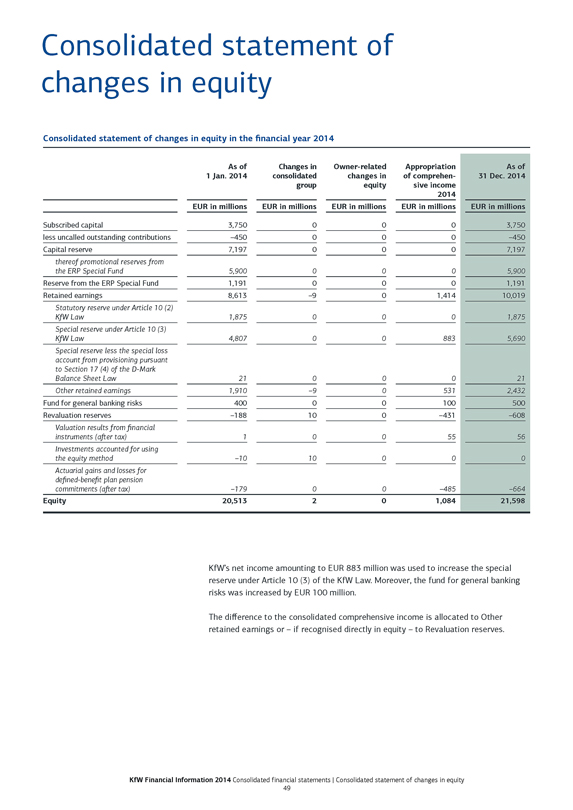
Consolidated statement of changes in equity
Consolidated statement of changes in equity in the financial year 2014
As of 1 Jan. 2014 Changes in consolidated group Owner-related changes in equity Appropriation of comprehensive income 2014
As of 31 Dec. 2014
EUR in millions EUR in millions EUR in millions EUR in millions EUR in millions
Subscribed capital 3,750 0 0 0 3,750
less uncalled outstanding contributions –450 0 0 0 –450
Capital reserve 7,197 0 0 0 7,197
thereof promotional reserves from the ERP Special Fund 5,900 0 0 0 5,900
Reserve from the ERP Special Fund 1,191 0 0 0 1,191
Retained earnings 8,613 –9 0 1,414 10,019
Statutory reserve under Article 10 (2)
KfW Law 1,875 0 0 0 1,875
Special reserve under Article 10 (3)
KfW Law 4,807 0 0 883 5,690
Special reserve less the special loss account from provisioning pursuant to Section 17 (4) of the D-Mark
Balance Sheet Law 21 0 0 0 21
Other retained earnings 1,910 –9 0 531 2,432
Fund for general banking risks 400 0 0 100 500
Revaluation reserves –188 10 0 –431 –608
Valuation results from financial instruments (after tax) 1 0 0 55 56
Investments accounted for using the equity method –10 10 0 0 0
Actuarial gains and losses for defined-benefit plan pension commitments (after tax) –179 0 0 –485 –664
Equity 20,513 2 0 1,084 21,598
KfW’s net income amounting to EUR 883 million was used to increase the special reserve under Article 10 (3) of the KfW Law. Moreover, the fund for general banking risks was increased by EUR 100 million.
The difference to the consolidated comprehensive income is allocated to Other retained earnings or – if recognised directly in equity – to Revaluation reserves.
KfW Financial Information 2014 Consolidated financial statements | Consolidated statement of changes in equity 49
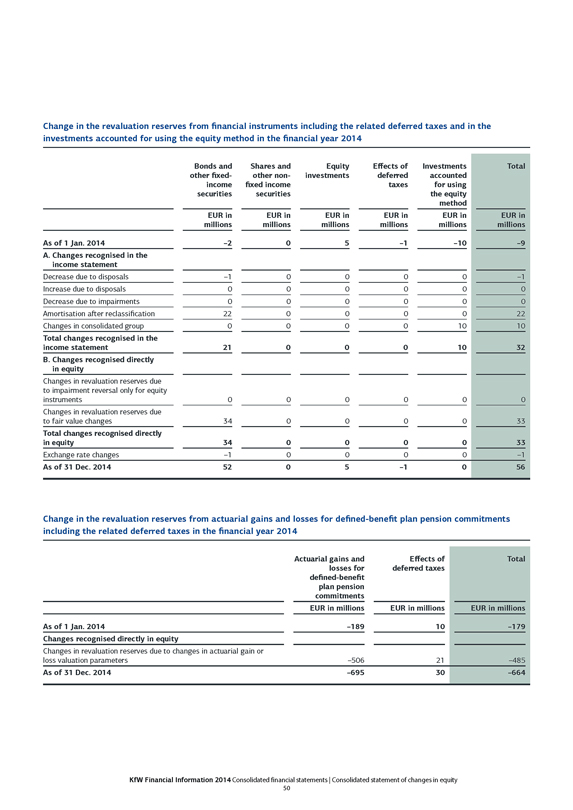
Change in the revaluation reserves from financial instruments including the related deferred taxes and in the investments accounted for using the equity method in the financial year 2014
Bonds and other fixed- income securities Shares and other non- fixed income securities Equity investments Effects of deferred taxes Investments accounted for using the equity method Total
EUR in millions EUR in millions EUR in millions EUR in millions EUR in millions EUR in millions
As of 1 Jan. 2014 –2 0 5 –1 –10 –9
A. Changes recognised in the income statement
Decrease due to disposals –1 0 0 0 0 –1
Increase due to disposals 0 0 0 0 0 0
Decrease due to impairments 0 0 0 0 0 0
Amortisation after reclassification 22 0 0 0 0 22
Changes in consolidated group 0 0 0 0 10 10
Total changes recognised in the income statement 21 0 0 0 10 32
B. Changes recognised directly in equity
Changes in revaluation reserves due to impairment reversal only for equity instruments 0 0 0 0 0 0
Changes in revaluation reserves due to fair value changes 34 0 0 0 0 33
Total changes recognised directly in equity 34 0 0 0 0 33
Exchange rate changes –1 0 0 0 0 –1
As of 31 Dec. 2014 52 0 5 –1 0 56
Change in the revaluation reserves from actuarial gains and losses for defined-benefit plan pension commitments including the related deferred taxes in the financial year 2014
Actuarial gains and losses for defined-benefit plan pension commitments Effects of deferred taxes Total
EUR in millions EUR in millions EUR in millions
As of 1 Jan. 2014 –189 10 –179
Changes recognised directly in equity
Changes in revaluation reserves due to changes in actuarial gain or loss valuation parameters –506 21 –485
As of 31 Dec. 2014 –695 30 –664
KfW Financial Information 2014 Consolidated financial statements | Consolidated statement of changes in equity 50
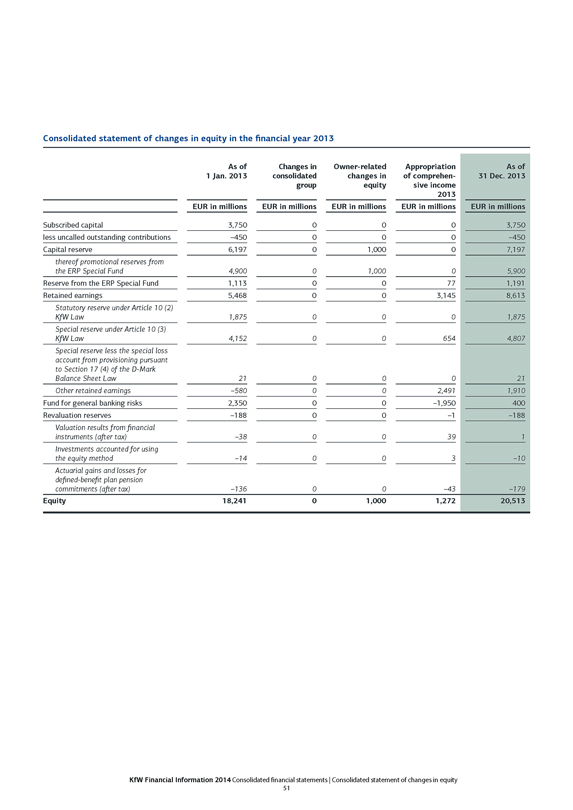
Consolidated statement of changes in equity in the financial year 2013
As of 1 Jan. 2013 Changes in consolidated group Owner-related changes in equity Appropriation of comprehensive income 2013 As of 31 Dec. 2013
EUR in millions EUR in millions EUR in millions EUR in millions EUR in millions
Subscribed capital 3,750 0 0 0 3,750
less uncalled outstanding contributions –450 0 0 0 –450
Capital reserve 6,197 0 1,000 0 7,197
thereof promotional reserves from the ERP Special Fund 4,900 0 1,000 0 5,900
Reserve from the ERP Special Fund 1,113 0 0 77 1,191
Retained earnings 5,468 0 0 3,145 8,613
Statutory reserve under Article 10 (2)
KfW Law 1,875 0 0 0 1,875
Special reserve under Article 10 (3)
KfW Law 4,152 0 0 654 4,807
Special reserve less the special loss account from provisioning pursuant to Section 17 (4) of the D-Mark
Balance Sheet Law 21 0 0 0 21
Other retained earnings –580 0 0 2,491 1,910
Fund for general banking risks 2,350 0 0 –1,950 400
Revaluation reserves –188 0 0 –1 –188
Valuation results from financial instruments (after tax) –38 0 0 39 1
Investments accounted for using the equity method –14 0 0 3 –10
Actuarial gains and losses for defined-benefit plan pension commitments (after tax) –136 0 0 –43 –179
Equity 18,241 0 1,000 1,272 20,513
KfW Financial Information 2014 Consolidated financial statements | Consolidated statement of changes in equity 51
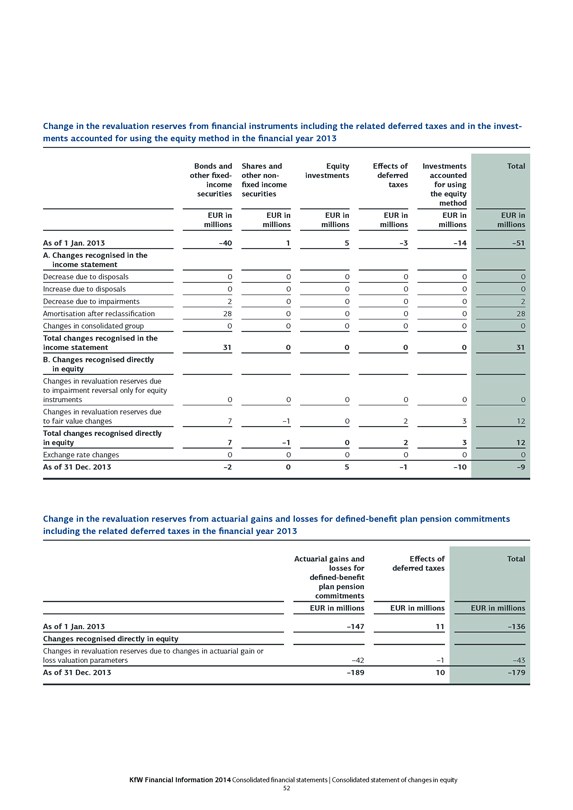
Change in the revaluation reserves from financial instruments including the related deferred taxes and in the investments accounted for using the equity method in the financial year 2013
Bonds and other fixed- income securities Shares and other non- fixed income securities Equity investments Effects of deferred taxes Investments accounted for using the equity method Total
EUR in millions EUR in millions EUR in millions EUR in millions EUR in millions EUR in millions
As of 1 Jan. 2013 –40 1 5 –3 –14 –51
A. Changes recognised in the income statement
Decrease due to disposals 0 0 0 0 0 0
Increase due to disposals 0 0 0 0 0 0
Decrease due to impairments 2 0 0 0 0 2
Amortisation after reclassification 28 0 0 0 0 28
Changes in consolidated group 0 0 0 0 0 0
Total changes recognised in the income statement 31 0 0 0 0 31
B. Changes recognised directly in equity
Changes in revaluation reserves due to impairment reversal only for equity instruments 0 0 0 0 0 0
Changes in revaluation reserves due to fair value changes 7 –1 0 2 3 12
Total changes recognised directly in equity 7 –1 0 2 3 12
Exchange rate changes 0 0 0 0 0 0
As of 31 Dec. 2013 –2 0 5 –1 –10 –9
Change in the revaluation reserves from actuarial gains and losses for defined-benefit plan pension commitments including the related deferred taxes in the financial year 2013
Actuarial gains and losses for defined-benefit plan pension commitments Effects of deferred taxes Total
EUR in millions EUR in millions EUR in millions
As of 1 Jan. 2013 –147 11 –136
Changes recognised directly in equity
Changes in revaluation reserves due to changes in actuarial gain or loss valuation parameters –42 –1 –43
As of 31 Dec. 2013 –189 10 –179
KfW Financial Information 2014 Consolidated financial statements | Consolidated statement of changes in equity 52
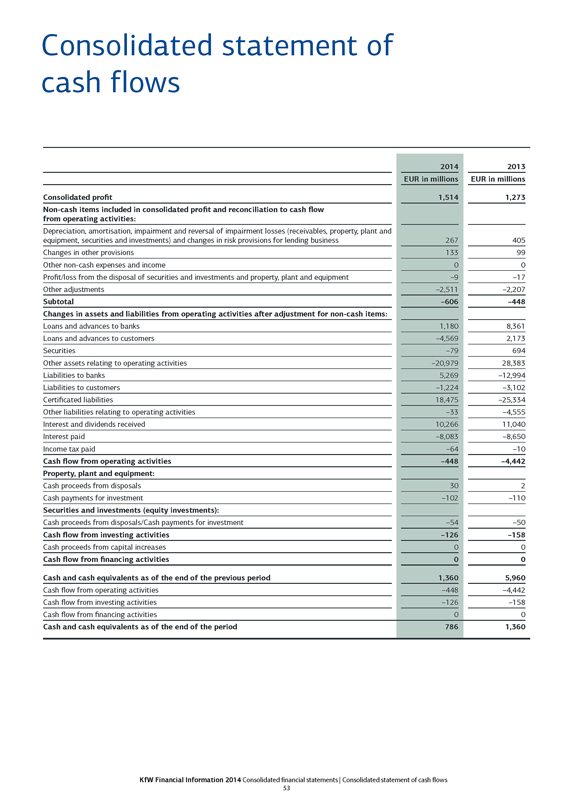
Consolidated statement of cash flows
2014 2013
EUR in millions EUR in millions
Consolidated profit 1,514 1,273
Non-cash items included in consolidated profit and reconciliation to cash flow
from operating activities:
Depreciation, amortisation, impairment and reversal of impairment losses (receivables, property, plant and equipment, securities and investments) and changes in risk provisions for lending business 267 405
Changes in other provisions 133 99
Other non-cash expenses and income 0 0
Profit/loss from the disposal of securities and investments and property, plant and equipment –9 –17
Other adjustments –2,511 –2,207
Subtotal –606 –448
Changes in assets and liabilities from operating activities after adjustment for non-cash items:
Loans and advances to banks 1,180 8,361
Loans and advances to customers –4,569 2,173
Securities –79 694
Other assets relating to operating activities –20,979 28,383
Liabilities to banks 5,269 –12,994
Liabilities to customers –1,224 –3,102
Certificated liabilities 18,475 –25,334
Other liabilities relating to operating activities –33 –4,555
Interest and dividends received 10,266 11,040
Interest paid –8,083 –8,650
Income tax paid –64 –10
Cash flow from operating activities –448 –4,442
Property, plant and equipment:
Cash proceeds from disposals 30 2
Cash payments for investment –102 –110
Securities and investments (equity investments):
Cash proceeds from disposals/Cash payments for investment –54 –50
Cash flow from investing activities –126 –158
Cash proceeds from capital increases 0 0
Cash flow from financing activities 0 0
Cash and cash equivalents as of the end of the previous period 1,360 5,960
Cash flow from operating activities –448 –4,442
Cash flow from investing activities –126 –158
Cash flow from financing activities 0 0
Cash and cash equivalents as of the end of the period 786 1,360
KfW Financial Information 2014 Consolidated financial statements | Consolidated statement of cash flows 53
The balance of Cash and cash equivalents reported in the statement of cash flows according to IAS 7 is identical to the balance sheet item Cash reserves and thus comprises cash on hand and balances with central banks.
The Statement of cash flows shows the changes in Cash and cash equivalents in the financial year classified between the Cash flows from operating activities, investing activities and financing activities. Other adjustments largely comprise the adjustments for net interest income in the amount of EUR –2,424 million (2013: EUR –2,413 million) as well as for valuation results amounting to EUR –310 million (2013: EUR –206 million) and effects of foreign exchange rate changes amounting to EUR +103 million (2013: EUR –50 million).
For more information on KfW Group’s liquidity risk management, see “Risk report – Liquidity risk”.
KfW Financial Information 2014 Consolidated financial statements | Consolidated statement of cash flows 54

>>> Notes
KFW
Accounting policies
(1) Basis of presentation
KfW is the promotional bank of the Federal Republic of Germany and was founded in 1948 as a public law institution based in Frankfurt am Main.
The Executive Board of KfW is responsible for the preparation of the consolidated financial statements and the group management report. After the recommendation of the Audit Committee, the consolidated financial statements and the group management report are submitted to KfW’s Board of Supervisory Directors for approval. As of 3 March 2015, no significant events have occurred since the reporting date (31 December 2014).
As of 31 December 2014, KfW Group comprises KfW and five subsidiaries that are fully consolidated. Three associated companies are accounted for using the equity method.
Pursuant to Section 315a (1) of the German Commercial Code (Handelsgesetzbuch – “HGB” ), the consolidated financial statements as of 31 December 2014 have been prepared in accordance with International Financial Reporting Standards (“IFRS”), as adopted by the European Union (“EU”), and with the interpretations set out by the International Financial Reporting Interpretations Committee (“IFRIC”), as mandatory consolidated accounts in accordance with Article 4 of Regulation (EC) No. 1606/2002 (IAS Regulation) of the European Parliament and of the Council of 19 July 2002, as well as further regulations on the adoption of certain international accounting standards. The standards and interpretations that apply are those that have been published and endorsed by the European Union as of the reporting date.
The supplementary provisions of the German Commercial Code that also apply to IFRS consolidated financial statements have been taken into account. The group management report prepared in accordance with Section 315 of the German Commercial Code includes the risk report with risk-oriented information on financial instruments as set out in IFRS 7, information on material events after the balance sheet date in accordance with IAS 10, as well as information on capital and capital management as set out in IAS 1.134.
The consolidated financial statements were prepared in accordance with accounting policies that are consistent across KfW Group and are prepared on a going concern basis. The subsidiaries included in the consolidated financial statement have prepared their annual financial statements as of 31 December 2014. Financial statements as of 30 September 2014 were used for the associated companies accounted for at equity in the consolidated financial statements.
The accounting policies in the consolidated financial statements were applied consistently.
The reporting currency and functional currency is the euro. Unless otherwise specified, all amounts are stated in millions of euros (EUR in millions).
KfW Financial Information 2014 Consolidated financial statements | Notes – Accounting policies 56
As a general rule, assets and liabilities are measured at the reporting date at (amortised) cost, with the exception of the following financial instruments:
– derivative financial instruments measured at fair value through profit or loss;
– designated financial instruments measured at fair value through profit or loss; and
– available-for-sale financial assets measured at fair value, with fair value changes recognised directly in equity.
(2) Judgements and accounting estimates
The consolidated financial statements include amounts based on management’s judgements and/or estimates and assumptions which are determined to the best of our ability and in accordance with the applicable accounting standard. Actual results realised in a future period may differ from these estimates. Estimates and assumptions are required, in particular, for calculating risk provisions, recognising and measuring provisions (for pension liabilities and legal risks), measuring the fair value of financial instruments based on valuation models, assessing and measuring impairment of assets, and assessing the utilisation of deferred tax assets. The estimates and the assumptions underlying these estimates are reviewed on an ongoing basis and are based, among other things, on historical experience or expected future events that appear likely given the particular circumstances. Where estimates and their underlying assumptions were required, the assumptions made are explained in the relevant notes.
KfW does not expect any deviations from its assumptions and does not foresee any uncertainties in its estimates that could result in a material adjustment to the related assets and liabilities within the next financial year. Given the strong dependency on the development of the economic situation and financial markets, however, such deviations and uncertainties cannot be fully excluded. These risks are nevertheless low because valuation models for measuring the fair value of financial instruments – especially those not based on observable market data – are only applied for part of the portfolio and financial derivatives are used to economically hedge risks.
Further material judgements in the application of accounting policies concern the voluntary early application of new or amended IFRS/IFRIC standards, the determination of the consolidated group, the use of the fair value option for the classification of financial assets and liabilities, the use of possibilities to reclassify options for financial assets in accordance with IAS 39, the determination of fair values for certain financial instruments including the assessment as to whether an active market exists, the reporting of economic hedging relationships, and the creation of classes as part of disclosing information on financial instruments.
(3) Assessment of the impact of new or amended IFRS/IFRIC standards applied for the first time
IFRS 10 was published in May 2011 and supersedes all comments and guidance contained in IAS 27 “Consolidated and Separate Financial Statements” and SIC-12 “Consolidation – Special Purpose Entities” on the issue of control and consolidation. No changes regarding mandatory inclusion of subsidiaries in the consolidated financial statements resulted from the first-time application of IFRS 10. IAS 27 was amended in connection with the publication of IFRS 10. The amended IAS 27 now only provides accounting guidance for subsidiaries, associated companies and joint ventures with financial statements prepared separately from the parent company.
KfW Financial Information 2014 Consolidated financial statements | Notes – Accounting policies 57
The new IFRS 11 “Joint Arrangements” published along with IFRS 10 sets out accounting policies for joint ventures or joint operations if at least two companies exercise joint control. The previous IAS 31 and interpretation SIC 13 have been superseded by IFRS 11. The first-time application of standard IFRS 11 and amendments to IAS 28 (Investments in Associates) did not necessitate any adjustment for those companies accounted for using the equity method.
IFRS 12 was also published in May 2011 and contains requirements for disclosure of interests in subsidiaries, joint arrangements, associates and unconsolidated structured entities. The Notes have been supplemented to reflect the new requirements.
The amendments to IFRS 10, IFRS 12 and IAS 27 (Investment Entities) which applied for the first time did not have any impact on the group’s net assets, financial position and results of operations or the group of consolidated companies.
The amendments to IFRS 10, IFRS 11 and IFRS 12 provide relief in relation to the transition provisions, which the group has benefited from for IFRS 12.
The amendments to IAS 39 “Financial Instruments: Recognition and Measurement” (December 2013, Novation of Derivatives and Continuation of Hedge Accounting), with an effective date for reporting periods commencing on or after 1 January 2014, have not yet been applied as KfW has yet to novate a hedging instrument to a central counterparty. To the extent that KfW novates such an instrument in the future, these amendments may have a material impact on the group’s net assets, financial position and results of operations.
The amendments to IAS 32 “Financial Instruments: Presentation” (December 2012, Offsetting Financial Assets and Financial Liabilities), which applied for the first time, did not have any impact on the group’s net assets, financial position and results of operations.
The amendments to IAS 36 “Impairment of Assets” (December 2013, Recoverable Amount Disclosures for Non-Financial Assets), which applied for the first time, did not have any impact on the group’s Notes.
The interpretation IFRIC 21 “Levies” on accounting for the liability to pay levies charged by public authorities, which applied for the first time, did not have any significant impact on the group’s net assets, financial position and results of operations.
(4) Group of consolidated companies
All significant subsidiaries and associated companies are included in the consolidated financial statements.
Subsidiaries are all business units (including structured entities) over which the group exercises control. Control exists when a group is exposed or entitled to variable cash flows through its relationship and has the opportunity to use its power of disposal to influence the amount of such cash flows. Subsidiaries are included in the consolidated financial statements (full consolidation) from the point at which control is transferred to the group. They are deconsolidated when control is lost.
Associates are included in the consolidated financial statements in accordance with IAS 28 if the group has significant influence.
The composition of the consolidated group is presented in the Notes under “List of KfW Group shareholdings”.
KfW Financial Information 2014 Consolidated financial statements | Notes – Accounting policies 58
(5) Basis of consolidation
Consolidation involves revaluing the total assets and liabilities of the subsidiaries at the acquisition date, irrespective of the equity interest held, and incorporating them into the consolidated statement of financial position. The resulting adjustments from hidden reserves and hidden burdens are treated in accordance with the applicable standards. If the revaluation adjustments result in an excess compared to acquisition cost, this excess amount is capitalised as goodwill. No goodwill is currently recognised.
Any intercompany assets and liabilities as well as expenses and revenues from transactions between group companies are eliminated. Intercompany profits between consolidated companies are also eliminated.
Investments in associates are accounted for using the equity method. The contribution to the results made by associates is recognised as a separate line item in the income statement.
There are no minority interests within KfW Group.
(6) Financial instruments: recognition and measurement
A financial instrument is any contract that gives rise to a financial asset of one entity and a financial liability or equity instrument of another entity. The following explanations provide an overview of how the requirements of IAS 39 are implemented.
Initial recognition is as of the settlement date for non-derivative financial instruments and as of the trade date for derivatives.
Upon initial recognition, financial instruments must be classified into one of the following categories. The subsequent measurement depends on the following classification:
A. Loans and receivables
B. Held-to-maturity investments
C. Financial assets and liabilities at fair value through profit or loss
a. Financial assets and liabilities designated at fair value through profit or loss, fair value option
b. Financial assets and liabilities held for trading
D. Available-for-sale financial assets
E. Other liabilities
The loans and receivables category includes non-derivative financial assets with fixed or determinable payments that are not quoted in an active market. These are measured at amortised cost using the effective interest method. For KfW Group, this primarily relates to the lending business presented under Loans and advances to banks and Loans and advances to customers. For its lending business, KfW Group uses the Basel definition for its default criteria and applies a consistent definition across the group. Default criteria are, in particular, payments more than 90 days past due (taking a marginality limit into account) and anticipated non-fulfilment of payment obligations given indicators such as filing for insolvency, material adverse change, distressed loan indication, conversion and transfer events, debt to equity swaps, deferment of payment/restructuring and disposal of loans or advances at significant loss due to deterioration in the borrower’s credit rating.
KfW Financial Information 2014 Consolidated financial statements | Notes – Accounting policies 59
Held-to-maturity investments are non-derivative financial instruments with fixed or determinable payments and fixed maturity for which the group has the intention and ability to hold to maturity. This category is used on a case-by-case basis for financial instruments which are part of the group’s securities portfolio at inception. These instruments are presented as Securities and investments; any impairments and reversals of impairment losses are recognised in Net gains/losses from securities and investments. Premiums and discounts are amortised according to the effective interest method. The amortisation for the period is recognised as Net interest income.
For financial assets and liabilities, the fair value option can be irrevocably exercised if
– the classification can resolve or substantially reduce an accounting mismatch resulting from the measurement of financial assets or financial liabilities or the recognition of a loss or a gain as a result of different accounting policies; or
– a group of financial assets and/or financial liabilities is managed in accordance with a documented risk management or investment strategy and its performance is assessed on the basis of fair value and the information is reported to key management personnel; or
– a contract contains one or more embedded derivatives which significantly modify the cash flows required by the contract or an analysis is required to determine that the embedded derivative(s) may not be separated.
Designated financial assets and liabilities are measured at fair value through profit or loss. KfW Group uses the fair value option for economic hedging relationships, structured products, securitisation transactions, and equity finance business. These financial instruments in particular are recognised in Securities and investments, Liabilities to banks and customers and Certificated liabilities. Fair value changes are presented in Net gains/losses from other financial instruments at fair value through profit or loss, while interest income/expense is presented in Net interest income.
Financial instruments that belong to the financial assets and liabilities held for trading category are measured at fair value through profit or loss. This category includes derivatives as well as non-derivative financial instruments purchased with the intention of generating a short-term profit. KfW Group does not enter into any transactions with the intention of generating a short-term profit. Derivative transactions entered into exclusively for hedging purposes are classified as held-for-trading if they do not fulfil the hedge accounting requirements in accordance with IAS 39. They are presented as Other derivatives. Fair value changes are recognised in Net gains/losses from other financial instruments at fair value through profit or loss. Derivatives used for hedge accounting are presented in the statement of financial position in the line item of the same name. Fair value changes are recognised in Net gains/losses from hedge accounting. Interest income/expense from derivatives is reported in Net interest income.
All other financial assets fall under the available-for-sale financial assets category. The difference between the fair value and the (amortised) cost is recognised directly in a separate component of equity until the asset is sold or an impairment loss has to be recognised in profit or loss. A debt instrument is impaired if there is objective evidence (trigger) of impairment with an impact on the expected future cash flows. Specific trigger events are defined according to the type of financial instrument. Events such as payments overdue for 30 days or more, deterioration in the internal rating to the non-performing loans category, or a considerable decline in the market price can be considered as objective evidence of impairment. Furthermore, for equity instruments, an impairment loss has to be recognised in profit or loss in the case of a significant or prolonged decline of the fair value below the acquisition cost of equity instruments. The impairment loss of a debt security is reversed through profit or loss if there is no longer any objective evidence of impairment. Impairment losses of equity instruments may only be reversed directly in Other comprehensive income. Equity instruments that
KfW Financial Information 2014 Consolidated financial statements | Notes – Accounting policies 60
cannot be reliably measured at fair value are accounted for at cost. Impairments are recognised in profit or loss, while reversals of impairment losses are not accounted for in this case. Within KfW Group, the available-for-sale financial assets are reported in Securities and investments. Gains and losses from disposals, impairment losses and the reversal of impairments from debt instruments are reported in Net gains/losses from securities and investments. Premiums and discounts are amortised through profit or loss using the effective interest method. The amortisation is recognised under Interest income.
All non-derivative financial liabilities for which the fair value option has not been exercised are classified as other liabilities. These are measured at amortised cost using the effective interest method. For KfW Group, this category covers borrowings that are reported in Liabilities to banks and customers, Certificated liabilities and Subordinated liabilities.
Financial assets are derecognised as of the settlement date, with the exception of derivatives. Financial assets are derecognised when the contractual rights from the assets have expired, the power of disposal or control has been transferred, or a substantial portion of the risks and rewards has been transferred to a third party unrelated to KfW Group.
Financial liabilities are derecognised if the obligations specified in the contract have been discharged or cancelled, or have expired.
For transactions mandated by the German Federal Government in accordance with Article 2 (4) of the KfW Law, the group’s general recognition procedures for the relevant financial instruments will be applied. Measurement is based on the relevant individual contractual terms and conditions concerning risk allocation.
The amendment to IAS 39 dated 13 October 2008 expanded the reclassification options for financial assets. Accordingly, until 31 October 2008, it was possible to reclassify assets classified as available-for-sale financial assets as loans and receivables with retroactive effect to 1 July 2008, and thereafter prospectively from the date of the reclassification, if there was the intention and ability to hold the financial instruments for the foreseeable future or until maturity and if the general classification criteria for loans and receivables were met at the date of reclassification.
On 31 October 2008, KfW Group decided to make use of its option to reclassify its asset-backed securities retroactively as of 1 July 2008. Due to the general crisis of confidence in the financial markets, there was no longer an active market for these securities at the date of the resolution (i. e. no current, regularly occurring market transactions on an arm’s length basis could be observed) and which were to be held through to maturity.
In addition, on 17 February 2009, some of the securities that were held to meet the group’s liquidity needs – through their use in repurchase transactions or open market transactions with the European Central Bank – were reclassified with prospective effect. As a result of the general crisis of confidence in the financial markets, an active market for these securities that were to be held for the foreseeable future no longer existed at the date of the resolution.
The fair value at the date of reclassification is the new cost of the reclassified financial assets. Amortisation is accounted for through profit or loss under Interest income using the effective interest method. The difference between the fair value and amortised cost, which had been recognised directly in equity until the reclassification date, remains in Other comprehensive income as a separate line item. Amortisation is accounted for through profit or loss under Interest income using the effective interest method.
KfW Financial Information 2014 Consolidated financial statements | Notes – Accounting policies 61
Classes for financial instruments have been defined in agreement with the group’s business model for lending business – carried at (amortised) cost – and are based on products (e. g. Loans and advances to banks broken down into money-market transactions and loans and advances) or on line items of the statement of financial position. The balance sheet items thus generally reflect a view oriented to the material risks each encompasses against the backdrop of interest rate and currency risk management at the overall bank level (interaction between non-derivative financial instruments and derivative hedging transactions). In this context, please refer to the risk report in the group management report.
(7) Financial instruments: valuation techniques
KfW Group initially recognises financial instruments at fair value.
Financial instruments measured at amortised cost are subsequently measured, within KfW Group, based on the fair value at initial recognition, taking into account any principal repayments and any impairment. The amortisation of premiums and discounts, transaction costs and fees is performed in accordance with the effective interest method on the basis of the contractual cash flows. Discounts are amortised in the promotional lending business until the end of the first fixed interest rate period (generally five or ten years).
The subsequent measurement at fair value, which, depending on the measurement category, is regularly determined either for recognition in the statement of financial position and for the disclosure of financial instruments in the Notes, is based on the following hierarchy at KfW Group:
A. Active market (allocation to the “Quoted market price” level)
The best objective evidence of fair value is provided by published price quotations in an active market. A financial instrument is regarded as quoted in an active market if quoted prices are readily and regularly available and those prices represent current – i. e. traded on the reporting date or shortly before – and regularly occurring market transactions on an arm’s length basis. Together with the traded nominal volumes, the contract sizes and the number of contracts, this assessment takes into account in particular the bid-ask spreads observed which in the event of a significant increase indicate the absence of an active market.
B. No active market – valuation techniques (allocation to “Valuation methods based on observable market data (model)” or “Valuation methods based in part on market unobservable data”)
If the financial instrument is not quoted in an active market, valuation techniques are used. The valuation techniques applied include, in particular, the discounted cash flow (DCF) method and option pricing models, as well as a comparison to the fair value of a financial instrument with almost identical characteristics (e. g. multiple-based models). The valuation techniques take account of all input parameters that the market participants would include in the pricing of that financial instrument, e. g. market interest rates, risk-free interest rates, credit spreads or swap curves. As these input parameters can generally be observed in the market and are usually the only significant parameters for measuring financial instruments using valuation techniques, the level for the financial instruments measured at fair value using valuation methods usually is “Valuation methods based on observable market data (model)”. This allocation also generally applies for prices quoted on inactive markets published by price service agencies.
If, however, significant input parameters that are not observable on the market, such as expected risk-free customer margin or capital costs, are used in valuation techniques, the financial instrument is allocated to the “Valuation methods based in part on market unobservable data” level.
KfW Financial Information 2014 Consolidated financial statements | Notes – Accounting policies 62
If, at the date of initial recognition, differences arise between the market-based transaction price and the model price resulting from a valuation technique that makes significant use of unobservable parameters, an analysis is performed to determine whether there are economic reasons for these initial differences (e. g. conclusion of a transaction on a market that is not the main market for this business.) These economic reasons only apply to a small part of the derivative portfolio of KfW Group, which comprises a hedging instrument for clients with respect to the export and project financing business. In relation to this, OTC (over the counter) derivatives in line with the market are not concluded on the main market (OTC interbank market) relevant to valuation. The initial differences determined upon conclusion of these derivatives are amortised through profit or loss over the life of the financial instruments, as the valuation parameters unobservable on the market are relevant to the valuation procedure. The reliability of this valuation technique is ensured via regular model validations.
C. No active market – equity instruments (allocation to “Valuation methods based in part on market unobservable data”)
If in exceptional cases it is not possible to reliably determine the fair value of equity instruments that are not quoted in an active market using valuation models, they are measured at cost. The fair value cannot be measured reliably if the range of reasonable fair value estimates for this instrument is significant and the probabilities of the various estimates cannot be reasonably assessed.
This hierarchy is applied at KfW Group as follows:
Fair values are derived from active markets, in particular, for bonds and other fixed-income securities – unless there are inactive markets, and valuation techniques or prices quoted on inactive markets published by price service agencies are therefore used – as well as own issues reported on the liabilities side. However, fair values are derived from valuation techniques for non-derivative financial instruments recognised in Loans and advances to banks and customers, Liabilities to banks and customers, and Certificated liabilities. Valuation techniques are also used for OTC derivatives.
The steps detailed below are undertaken for certain product groups:
For securities in the Securities and investments line item, the group examines whether a financial instrument is quoted on an active market on the basis of homogeneous portfolios. Market activity is assessed based on the following criteria:
– There is more than one market maker.
– Prices are set on a regular basis.
– Prices deviate only slightly between market makers.
– The bid-ask spread is narrow.
Prices on active markets are used to determine the fair value of the group’s asset securities as of the reporting date. In addition, for parts of the portfolio, prices from price service agencies are used that do not qualify as prices quoted on active markets. Should these not be available in individual cases, valuation techniques are used to determine fair value taking into account observable market parameters. The input parameters include, in particular, changes in creditworthiness and risk-free interest rates, but they also take into account general and financial instrument-specific tightening of the market due to lower liquidity.
In the case of OTC derivatives, valuation techniques are used that pay special attention to counterparty-specific default risks, taking into account available collateral. Default risks are not calculated separately for each transaction but for the portfolio of transactions on which a framework agreement is based. The resulting credit risk ad-
KfW Financial Information 2014 Consolidated financial statements | Notes – Accounting policies 63
justment amounts are very low as KfW generally pledges collateral for positive market values in accordance with the collateral agreements concluded. In accordance with market practices, risk-free overnight interest rates were used for the valuation of a major part of the derivatives portfolio with collateralisation agreements.
Equity investments and shares which cannot be reliably measured at fair value are measured at cost.
The fair value for Loans to banks and customers is calculated using the discounted cash flow (“DCF”) method based on the discounting of the risk-adjusted cash flows with the swap curve. The expected loss calculated for the respective reporting date is used to correct the contractual cash flows. The customer fee includes operating expenses, the margin, the equity and debt risk premium, and any subsidies. Calculation of the client fee involves offsetting a subsidy granted at the expense of KfW’s earnings position and applying parameters of a relevant promotional market subsegment (“special promotional loans market”) so that the fair value at initial recognition determined for the purposes of subsequent measurement will correspond to the transaction value. The customer fee remains unchanged for subsequent valuation (constant spread).
The Federal Republic of Germany’s liability for specific KfW liabilities in accordance with Article 1a of the KfW Law has an advantageous effect on KfW’s ability to fund itself. In determining the fair value of KfW’s liabilities, the effect of this explicit direct state guarantee is also taken into account. The state guarantee does not represent an independent unit of account.
The fair value of financial instruments due on demand, such as Cash reserves or receivables and liabilities due on demand, is their carrying amount.
When no prices from liquid markets are available and prices on inactive markets cannot be provided by price service agencies, recognised valuation models and methods are used. The DCF method is used for securities, swaps, and currency and money market transactions with no embedded options and no complex coupons. Stand-alone options, as well as derivatives with embedded options, triggers, guaranteed interest rates and/or complex coupon agreements, are measured using recognised models
(e. g. Hull & White) unless they are listed on a stock exchange. The aforementioned models are calibrated, if possible, on the basis of observable market data for instruments that are similar in terms of the type of transaction, maturity, and credit quality.
(8) Promotional lending business at KfW
The general promotional loans market, which distinguishes itself from the market for general lending business, is relevant for KfW’s promotional lending business conducted as part of its legal promotional mandate. In particular, this market is characterised by the fact that promotional banks, as part of their legal mandate, fully pass on the financing costs for projects eligible for promotion. In setting the terms and conditions of the corresponding promotional loans, KfW uses its current term-differentiated refinancing rates.
On initial recognition of KfW promotional loans, for which KfW’s funding costs based on current term-differentiated refinancing rates are used to determine the terms and conditions of the promotional loans, the fair value is equivalent to the transaction value.
KfW also grants promotional loans which include additional subsidies granted during the first fixed interest rate period, in the form of interest rate reductions impacting KfW’s earnings. The fair value of these promotional loans – measured using the parameters of the general promotional loan market – is thus not equivalent to the transaction value at initial recognition as in this case the interest rate is below the market rate.
KfW Financial Information 2014 Consolidated financial statements | Notes – Accounting policies 64
The difference that normally results upon loan commitment – present value of the nominal scheduled interest rate reductions during the first fixed interest rate period – is recognised in profit or loss as an interest expense and accounted for as an adjustment to the carrying amount in loans and advances under the items Loans and advances to banks or Loans and advances to customers. The adjustment to the carrying amount is amortised in Net interest income using the effective interest rate method. In the event of unscheduled repayment in full, this will be recognised in profit or loss under Interest income.
Differences that relate to irrevocable loan commitments are reported in Provisions. Changes to the portfolio are offset via the adjustments to the carrying amounts of already disbursed promotional loans recognised on the assets side.
(9) Financial derivatives and hedging relationships
KfW Group enters into financial derivatives to economically hedge interest rate and currency risks, particularly those related to funding, lending and securities activities.
Economic hedging relationships are designated as hedge accounting relationships or designated as fair value through profit or loss by using the fair value option when the IFRS requirements are met. Economic hedging relationships can be recognised in the financial statements through mandatory separated embedded derivatives that are accounted for through profit or loss. In these cases, if the hedges are economically effective, the impact on the financial statements, with respect to the hedged risks, from the derivatives used for hedging purposes and the hedged transactions will substantially offset each other, so that the group’s income statement substantially reflects the risk-mitigating impact of these hedging relationships.
However, not all economic hedging relationships qualify for hedge accounting or the fair value option. In these cases, the risk-mitigating impact of the derivatives used for hedging purposes is not reflected in the accounts because the hedged risk associated with the underlying transactions is not recognised in profit or loss under IFRS. The applicable recognition requirements may therefore lead to one-sided valuation results from the derivatives used for hedging purposes in the group’s income statement – as well as volatility in profit or loss – despite an economically effective hedging relationship.
Hedge accounting, i. e. the accounting for hedging instruments (derivatives) and hedged transactions in accordance with specific requirements, is subject to strict requirements.
Within KfW Group, hedge accounting is solely applied in the form of fair value hedges to recognise economic hedging relationships between derivatives and the respective financial assets/liabilities. The hedging relationship is designated at the individual transaction level in the form of micro fair value hedge accounting, and at portfolio level in the form of macro fair value hedge accounting. If risk-free overnight interest rates are used in the valuation of the derivatives, this market practice is taken into account for the measurement of the hedged risk related to the hedged item. The effectiveness of the hedging relationships is assessed using the dollar offset method and a regression analysis.
In micro fair value hedge accounting, the hedged risks are interest rate and currency risks from bonds allocated to Securities and investments (loans and receivables and available-for-sale financial assets categories) and, in particular, Borrowings (other liabilities category). The fair values attributable to the hedged risks are reported as an adjustment of the carrying amount of the hedged items with the corresponding gain or loss recognised in Net gains/losses from hedge accounting. The hedging instruments are recognised at fair value in Derivatives used for hedge accounting. Changes in the value of the hedging instruments are also recognised in Net gains/losses from hedge accounting, largely compensating the profit or loss effects of the hedged items.
KfW Financial Information 2014 Consolidated financial statements | Notes – Accounting policies 65
The fair value of the hedged risks from hedging relationships which no longer fulfil the strict hedge accounting requirements is amortised over the residual term of the original hedging relationship under Net gains/losses from hedge accounting.
Interest rate risks, primarily from loans (loans and receivables category), are hedged in macro fair value hedge accounting. The fair values attributable to the hedged risks in the hedged portfolios in the loans and receivables category are accounted for in Value adjustments from macro fair value hedge accounting on the assets side. Fair value changes attributable to the hedged risks from the hedged portfolios are shown in Net gains/losses from hedge accounting. The hedging instruments are reported at fair value in Derivatives used for hedge accounting. Changes in the value of these instruments are also recognised in Net gains/losses from hedge accounting, with the effect that they almost fully offset the earnings effects from the valuation of the hedged portfolios.
The portfolio of hedged items is updated monthly in the context of a dynamic hedge de-designation and designation process. The resulting fair value adjustments are amortised over the residual term of the maturity period in Net gains/losses from hedge accounting. Disposals from the hedged portfolios result in a proportional amortisation of the related fair value adjustments in Net gains/losses from hedge accounting. When the hedging instrument is derecognised and substituted with new transactions during the hedging period, the related fair value adjustments from the hedged portfolios are amortised in Net interest income.
If the strict hedge accounting requirements for the designation of hedging relationships between derivatives and financial assets/liabilities are not fulfilled within KfW Group, the fair value option is used for the non-derivative financial instruments in certain circumstances, in particular for structured products. Depending on the product group of some structured financial liabilities, the embedded derivatives are bifurcated instead of using the fair value option. The fair values of the corresponding hedging instruments are presented in Other derivatives and fair value changes are recognised in Net gains/losses from other financial instruments at fair value through profit or loss. These are largely offset by valuation effects from the hedged transactions.
Further derivative financial instruments are also used to hedge risks, but fair value changes of the hedged item are not reflected in the accounts. The fair values of these hedging instruments are also recognised in Other derivatives item and changes therein are recognised in Net gains/losses from other financial instruments at fair value through profit or loss.
KfW Group neither uses derivatives for trading purposes nor does it act as broker or intermediary on behalf of third parties.
(10) Treatment of embedded derivatives
Derivative financial instruments can be part of a hybrid (combined) financial instrument as embedded derivatives. Under certain conditions, they are accounted for separately from the host contract, similar to stand-alone derivatives. They must be bifurcated if the economic characteristics and risks of the embedded derivative are not closely related to the economic characteristics and risks of the host contract. The host contract will be accounted for according to its classification at inception.
KfW Group enters into contracts with embedded derivatives requiring bifurcation particularly with respect to its own funding. In making use of the fair value option, KfW accounts for these hybrid (combined) financial instruments at fair value. In the case of certain products, however, the embedded derivatives must be bifurcated. Changes in fair value are then recognised in Net gains/losses from other financial instruments at fair value through profit or loss in the sub-line item Financial derivatives not qualifying for hedge accounting, where they have a compensatory effect on the valuation of the economic hedging derivatives.
KfW Financial Information 2014 Consolidated financial statements | Notes – Accounting policies 66
Ancillary agreements made within KfW Group’s equity finance business are accounted for as separate embedded derivatives which are measured at fair value through profit or loss and recognised in Other derivatives. Changes in fair value are recorded in Net gains/losses from other financial instruments at fair value through profit or loss in the sub-line item Financial derivatives not qualifying for hedge accounting. The loan receivables are recognised in Loans and advances to customers.
Prepayment rights that are granted regularly in the promotional lending business are not bifurcated embedded derivatives since the economic characteristics and risks associated with the prepayment rights are closely related to the economic characteristics and risks of the loan and the early prepayment amount approximately equals the amortised cost of the loan.
(11) Credit derivatives
As part of its promotional lending business, KfW Group offers commercial banks the opportunity to place their credit risks in the capital market as part of a synthetic securitisation via the two standardised platforms PROMISE (programme for the securitisation of SME loans) and PROVIDE (programme for the securitisation of housing loans). In the first stage, KfW Group assumes the default risks of the reference portfolio via portfolio credit default swaps (“CDSs”), while the risks are simultaneously passed on to third parties via portfolio CDSs/credit-linked notes. These transactions are recognised using the fair value option. The fair values are reported as receivables or liabilities. Fair value changes are recognised under Net gains/losses from other financial instruments at fair value through profit or loss. The ongoing risk premiums are recognised in Net commission income.
In the case of transactions for which, in line with individual contractual conditions, the fair value option in the case of accounting mismatch has not been exercised, portfolio CDSs are recognised in the statement of financial position as financial guarantees issued or received in accordance with the generally applicable accounting policies for these financial instruments. Credit-linked notes with embedded financial guarantees not requiring separation are accounted for as other liabilities.
(12) Foreign currency translation
The functional currency of KfW and its consolidated subsidiaries is the euro. Monetary assets and liabilities denominated in a foreign currency are converted at the spot rate as of the reporting date.
Non-monetary assets and liabilities denominated in a foreign currency are normally converted at historical cost, unless they are measured at (amortised) cost.
Translation is made as of the balance sheet date using the European Central Bank reference rates. Income and expenses are translated generally at the average monthly rate.
The results from the translation of foreign currency transactions are recognised in profit or loss under Net gains/losses from other financial instruments at fair value through profit or loss.
(13) Loans and advances to banks and customers
KfW Group’s lending business carried at amortised cost is recognised in Loans and advances to banks and customers. These line items primarily consist of the promotional lending business, in which loans are typically granted to the final borrowers through accredited commercial banks and insurance companies. These assets are presented in Loans and advances to banks when the commercial banks underwrite part of the liability. Promotional loans that the commercial banks on-lend without underwriting of liability are recognised in Loans and advances to customers.
Current interest and similar income are recorded under Interest income. Premiums, discounts, processing fees and charges are amortised in Interest income using the effective interest method. Processing fees that are not part of the effective interest method are recognised under Commission income.
KfW Financial Information 2014 Consolidated financial statements | Notes – Accounting policies 67
Loans and advances to banks and customers also include loans with a subsidy element (interest rate reductions) granted by KfW as part of the economic promotion by ERP. The promotional subsidies granted annually to KfW through the ERP Special Fund based on the ERP Economic Planning Act (ERP-Wirtschaftsplangesetz) for the purpose of executing the ERP economic promotion programme are recognised as deferred income in Other liabilities and are amortised in profit or loss under Interest income as the underlying funding expenses occur.
(14) Risk provisions for lending business
The overall risk provisions for lending business include the provisions for losses on loans and advances and money market investments, including reverse repurchase agreements, as a separate line item on the assets side of the statement of financial position, as well as the provisions for contingent liabilities and irrevocable loan commitments accounted for on the liabilities side as Provisions.
The risks resulting from on balance sheet lending business are accounted for by individual and portfolio impairments recognised in profit or loss.
Individual impairment is recognised for incurred losses and is computed on the basis of individual loans. The amount of the impairment loss equals the difference between the carrying amount of the loan and the sum of discounted expected future cash flows from interest, redemption payments and collateral cash flows. The recognition of interest income in accordance with the original contractual terms ends with the date of the first individual impairment. In the subsequent measurement, the effect of compounding the present value of anticipated cash flows using the effective interest rate at inception is determined and recognised as interest income (unwinding). The risk provisions are reduced by this amount. Any reversals of individual impairment losses are accounted for through profit or loss.
Smaller and standardised loans are grouped into homogenous sub-portfolios and assessed for portfolio impairment on the basis of the default risks identified. Any reversals of portfolio impairment losses are recognised in profit or loss.
For performing loans not subject to individual impairment, the risk of impairment losses that have already occurred but have not yet been individually identified is addressed by portfolio impairment. Economic risk and transfer risk are taken into account in the calculation. The key parameters are the outstanding loan volume (based on the carrying amount) as of the reporting date, the expected loss given default and one-year probabilities of default (given a LIP (loss identification period) factor of 1). The probabilities of default and the loss given default are provided by credit risk controlling whereby the latter is adjusted for imputed cost. The underlying assumptions of expected losses are backtested on a regular basis against the actual loss experience.
For contingent liabilities and irrevocable loan commitments, impairment is assessed on an individual basis and accounted for as a provision in the statement of financial position with a corresponding effect on the income statement. For irrevocable loan commitments, impairments not yet identified individually are assessed on a portfolio basis and recognised as provisions.
If the loans are deemed partially or fully uncollectible, they are written down or written off against the allowance account. Uncollectible loans for which no individual impairments were recorded are written off directly. Recoveries on loans already written off are recognised as income in Risk provisions for lending business.
(15) Securities and investments
Securities and investments include, in particular, securities portfolios. These mainly serve to support KfW’s liquidity position or are used to optimise and stabilise the ability of KfW Group to fulfil its long-term promotional mandate.
KfW Financial Information 2014 Consolidated financial statements | Notes – Accounting policies 68
The Securities and investments item on the statement of financial position includes bonds and other fixed-income securities, shares and other non-fixed income securities, equity investments, and shares in subsidiaries not included in the consolidated financial statements which are held by KfW or its subsidiaries.
To achieve the same accounting treatment for equity investments with and without significant influence, individual group business divisions that provide equity financing as part of their promotional mandate are considered as venture capital organisations for accounting purposes provided they meet the respective requirements. These equity investments, like other equity investments, are recognised in Securities and investments.
Securities and investments are initially recognised at fair value and subsequently measured depending on their classification either as financial assets at fair value through profit or loss or as available-for-sale financial assets. Financial instruments with fixed or determinable payments which are not quoted in an active market are categorised as loans and receivables. Classification as held-to-maturity investments is conducted on a case-by-case basis provided that the relevant criteria are fulfilled at inception.
When non-listed equity investments are measured at fair value, appropriate allowances are made for illiquidity. For example, when applying the discounted cash flow (DCF) models the discount rate is adjusted for a fungibility factor. In cases where the fair value of non-listed equity investments cannot be reliably measured, such assets are carried at cost less any impairment losses.
Any fair value changes of financial assets at fair value through profit or loss are recognised in Net gains/losses from other financial instruments at fair value through profit or loss. Realised gains and losses and impairment losses relating to the available-for-sale financial assets, loans and receivables and held-to-maturity investments categories are recognised under Net gains/losses from securities and investments; amounts reported for loans and receivables and held-to-maturity investments include allowances for impairment losses that have already occurred but have not yet been individually identified, based on the expected loss for one year. Unrealised gains from available-for-sale financial assets are recognised directly in equity as Revaluation reserves. Current interest payments and dividends are recognised in Interest income.
(16) Repurchase agreements
KfW Group enters into repurchase agreements as standardised repos or reverse repos. These are combinations of simultaneous spot and forward transactions on securities with the same counterparty. The terms, modalities of collateral and the use of collateral follow common market practice. Credit claims are also an eligible type of collateral for open-market transactions.
The securities sold under repo transactions (spot sales) continue to be recognised and measured as securities. The repayment obligation towards the counterparty is carried as a liability to banks or customers for the amount of cash consideration received. Interest is recorded in Interest expense in accordance with the respective conditions of the repurchase agreements.
A repayment claim is recognised and measured as a loan or advance to banks or customers for the amount of cash outflow generated by reverse repos. The securities received (spot purchases) are not recognised or measured. Interest is recorded in Interest income in accordance with the respective conditions of the reverse repurchase agreements.
(17) Property, plant and equipment
The land and buildings and the plant and equipment reported by KfW Group are carried at cost less depreciation on a straight-line basis and any impairment, both recognised in Administrative expense. Impairment is recognised if the carrying amount of the asset
KfW Financial Information 2014 Consolidated financial statements | Notes – Accounting policies 69
exceeds the recoverable amount, which is the higher of the fair value less the cost to sell or the value in use. The useful life is determined based on expected wear and tear. KfW Group assumes an estimated useful life of 40 to 50 years for buildings, 4 years for workstation computer equipment and 5 to 15 years for other property, plant and equipment. Gains and losses from the sale of property, plant and equipment are recognised in Net other operating income.
Payments in advance and assets under construction are recognised in Other property, plant and equipment and are not subject to depreciation.
(18) Intangible assets
Under Intangible assets, KfW Group reports purchased and internally generated software at cost, less straight-line amortisation and impairments, both recognised in Administrative expense. The useful life is determined based on expected economic life. KfW Group assumes a useful life of five years.
Assets are impaired when the carrying amount of an asset exceeds the recoverable amount. An impairment is recorded when no future economic benefits can be identified.
Internally generated software under development is reported under Other intangible assets and is not subject to amortisation.
(19) Taxes on income
KfW is a non-taxable entity. Taxes on income for non-exempt subsidiaries and their affiliates are determined according to the tax laws in the country of residence. Current taxes on income as well as deferred tax expenses and income are recognised in profit or loss as Taxes on income or directly in equity under Revaluation reserves depending on the underlying transaction. Current and deferred tax assets and liabilities are reported as a separate line item in the statement of financial position. Deferred Income tax assets and liabilities are offset only when the requirements are met.
Current taxes on income are calculated using currently applicable tax rates.
Deferred tax assets and liabilities arise as a result of differences between carrying values of an asset or a liability and the respective tax bases if the differences are likely to result in taxable or tax deductible amounts in the future (temporary differences). Deferred tax assets relating to loss carryforwards not yet used are recognised only if there is a sufficient degree of certainty that the taxable entity will earn sufficient taxable income in subsequent periods to use the loss carryforward.
(20) Liabilities to banks and customers and Certificated liabilities
Liabilities to banks and customers primarily include non-current borrowings carried at amortised cost and KfW Group’s money-market transactions. Certificated liabilities contain issued bonds, notes and money-market instruments. Own issues repurchased for market-making purposes are deducted from the liabilities as of the repurchase date.
The fair value option is exercised for structured liabilities, or, in the case of certain products, the embedded derivatives must be separated from the host contract and accounted for as stand-alone derivatives. Presentation of the different types of funding is not based on their classification or their designation as hedged items. Measurement of liabilities is based on their respective classification.
Current interest is recorded in Interest expense; premiums and discounts are amortised using the effective interest method over the expected life in Interest expense. Fair value changes of liabilities designated at fair value are recognised in profit or loss under Net gains/losses from other financial instruments at fair value through profit or loss, where they have an offsetting effect with the fair value changes from economic hedging derivatives. Results from the repurchase of own issues categorised
KfW Financial Information 2014 Consolidated financial statements | Notes – Accounting policies 70
as other liabilities are recognised at the repurchase date in Net other operating income.
(21) Provisions
Provisions include provisions for pensions and similar commitments, provisions for credit risks, interest rate reductions in irrevocable loan commitments granted by KfW in the promotional lending business and negatively impacting its earnings, as well as other obligations of uncertain amount and timing involving a probable outflow of funds.
The employees of KfW Group participate in a company pension plan that pays retirement, long-term disability and survivor benefits. KfW Group has various exclusively defined-benefit pension plans. The benefits largely depend on the length of company service and salary. The pension plan that was applied for new hires until 1985 offered a full pension (Gesamtversorgung), in which a certain portion of the income paid before the benefits were due was allocated as a benefit and deducted from the state pension. Apart from employer-financed pension plans there are also plans in place involving contributions by employees.
KfW Group pension plans are subject to the following risks in particular: longevity, interest rate, pension adjustment risk as well as the risk of future changes to the assessment bases.
Longevity risk is the risk that higher expenses will be incurred for the company pension plan if the pensioners live longer than projected. In general, this risk is balanced out across all pensioners and would only have an impact if life expectancy were to rise faster in the future than anticipated.
Due to the long term of the company pension plan, provisions for pension obligations are subject to general interest rate risks.
Pension adjustment risk largely relates to the pension plan’s full provision structure. Benefits are recalculated as soon as there is a change in the base income eligible for pension or the state pension to be offset. Another pension plan must be examined regularly in terms of forecast and actual pension adjustments, undertaking such adjustments if necessary.
The amount of the benefits promised under the existing pension plans at KfW Group depends, among other things, on development of the income eligible for benefits and the social security contribution ceiling (Beitragsbemessungsgrenze). There is a risk that the basis of assessment will develop differently than was assumed.
The pension obligation is calculated by independent qualified actuaries in accordance with the projected unit credit method on the basis of group-wide uniform parameters such as age, length of company service and salary. The pension provision is recognised at the present value of the defined-benefit obligations as of the reporting date. The discount factor is based on current market conditions for a portfolio of high quality corporate bonds/bonds from supranational issuers with a maturity matching that of the obligations. The definition of the portfolio takes into account actual market conditions. Additional demographic factors (including the 2005 G Heubeck actuarial tables) and actuarial assumptions (rate of salary and pension increases, rate of staff turnover, etc.) are taken into account.
No plan assets were defined for the pension obligations of KfW Group, so the related special accounting rules do not apply. Provisions for pensions and similar obligations are financed in-house with sufficient assets with corresponding maturities.
KfW Financial Information 2014 Consolidated financial statements | Notes – Accounting policies 71
Actuarial gains and losses are immediately recognised at the time they occur. They occur as a result of remeasurement of pension obligations as of the reporting date compared to the figures forecast at the beginning of the year.
Additions to pension provisions distinguish between service cost and interest expense. Service cost is reported under Administrative expense; interest expense is reported under Other interest expense. The pension provision changes recognised directly in equity comprise the actuarial gains and losses reported in Revaluation reserves; these are reported in Other comprehensive income.
Pension-like obligations include commitments for deferred compensation, early retirement and partial retirement. Actuarial reports are prepared and a provision is recognised accordingly for these types of commitments as well. No actuarial gains or losses are incurred.
Other provisions, including those for obligations to employees and for audit and consultancy services, are recognised at the estimated expenditure. Long-term provisions are discounted where the effect is material. Added to this are obligations arising from the assumption of the tasks of the State Insurance Company of the German Democratic Republic in liquidation (Staatliche Versicherung der Deutschen Demokratischen Republik in Abwicklung – SinA (institution under public law)), which are offset by receivables in the same amount from the Federal Agency for Special Tasks Arising from Unification (Bundesanstalt für vereinigungsbedingte Sonderaufgaben – BvS) reported under Other assets.
(22) Subordinated liabilities
Subordinated liabilities include liabilities to the ERP Special Fund.
Subordinated liabilities are classified as other liabilities and carried at amortised cost.
Deferred interest as well as value adjustments from micro fair value hedge accounting are recognised in Other liabilities.
Current interest expenses are recorded in Interest expense.
(23) Equity
The equity structure is, in particular, determined by the KfW Law and the requirements of IFRS.
Pursuant to Article 10 (2) and (3) of the KfW Law, KfW’s net income for the period determined in accordance with the German Commercial Code is transferred to reserves and is included in equity under IFRS.
KfW Group has created a fund for general banking risks. Additions to or reductions of the fund are shown under IFRS as appropriation of consolidated profit/loss.
Under IFRS, any remaining consolidated net income is allocated to Other retained earnings in the same period.
Under IFRS, revaluation reserves comprise transactions to be recognised directly in equity. These include valuation results from financial instruments of the category available-for-sale financial assets, and actuarial gains and losses in the case of defined-benefit plan pension commitments. They also may include deferred taxes, depending on the underlying transaction.
(24) Contingent liabilities and irrevocable loan commitments
KfW Group’s contingent liabilities result mainly from guarantees (financial guarantee contracts). All contingent liabilities are disclosed in the Notes at their nominal amounts less any related provision.
KfW Financial Information 2014 Consolidated financial statements | Notes – Accounting policies 72
As part of the sale of its stake in IKB, the German industry bank, in 2008, KfW agreed to indemnify IKB for certain legal risks to a certain amount. As of the end of the reporting period, no proceedings are pending against IKB which are relevant in this context.
Irrevocable loan commitments are firm commitments by KfW Group to grant a loan under contractually agreed terms. These are disclosed in the Notes at their nominal amounts less any related provision.
(25) Trust activities
Assets and liabilities held by KfW Group in its own name but for the account of third parties are not recognised. This applies in particular to loans granted under German Financial Cooperation to support developing countries. The related funds are granted and underwritten by the German federal budget. The fees earned associated with these transactions are recognised under Commission income.
(26) Leasing transactions
Leases are classified as operating leases or as finance leases depending on the risks and rewards relating to ownership of an asset. This classification determines their accounting treatment.
Contracts where the group is a lessee (including real estate leases) are largely classified as operating leases; the corresponding rental payments are included in Administrative expense.
The small number of contracts in which KfW Group acts as a lessor are classified as operating leases. The corresponding rental income is recognised in Other operating income.
KfW Financial Information 2014 Consolidated financial statements | Notes – Accounting policies 73
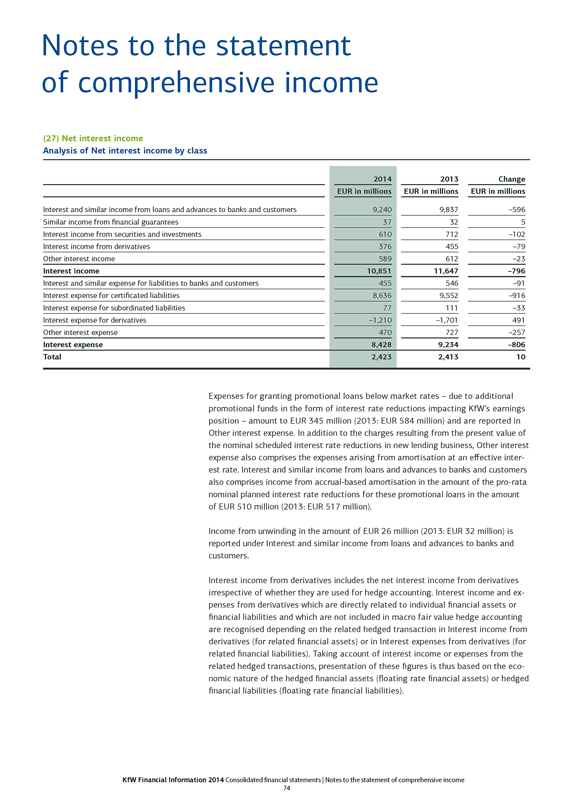
Notes to the statement of comprehensive income
(27) Net interest income
Analysis of Net interest income by class
2014 2013 Change
EUR in millions EUR in millions EUR in millions
Interest and similar income from loans and advances to banks and customers 9,240 9,837 –596
Similar income from financial guarantees 37 32 5
Interest income from securities and investments 610 712 –102
Interest income from derivatives 376 455 –79
Other interest income 589 612 –23
Interest income 10,851 11,647 –796
Interest and similar expense for liabilities to banks and customers 455 546 –91
Interest expense for certificated liabilities 8,636 9,552 –916
Interest expense for subordinated liabilities 77 111 –33
Interest expense for derivatives –1,210 –1,701 491
Other interest expense 470 727 –257
Interest expense 8,428 9,234 –806
Total 2,423 2,413 10
Expenses for granting promotional loans below market rates – due to additional promotional funds in the form of interest rate reductions impacting KfW’s earnings position – amount to EUR 345 million (2013: EUR 584 million) and are reported in Other interest expense. In addition to the charges resulting from the present value of the nominal scheduled interest rate reductions in new lending business, Other interest expense also comprises the expenses arising from amortisation at an effective interest rate. Interest and similar income from loans and advances to banks and customers also comprises income from accrual-based amortisation in the amount of the pro-rata nominal planned interest rate reductions for these promotional loans in the amount of EUR 510 million (2013: EUR 517 million).
Income from unwinding in the amount of EUR 26 million (2013: EUR 32 million) is reported under Interest and similar income from loans and advances to banks and customers.
Interest income from derivatives includes the net interest income from derivatives irrespective of whether they are used for hedge accounting. Interest income and expenses from derivatives which are directly related to individual financial assets or financial liabilities and which are not included in macro fair value hedge accounting are recognised depending on the related hedged transaction in Interest income from derivatives (for related financial assets) or in Interest expenses from derivatives (for related financial liabilities). Taking account of interest income or expenses from the related hedged transactions, presentation of these figures is thus based on the economic nature of the hedged financial assets (floating rate financial assets) or hedged financial liabilities (floating rate financial liabilities).
KfW Financial Information 2014 Consolidated financial statements | Notes to the statement of comprehensive income 74
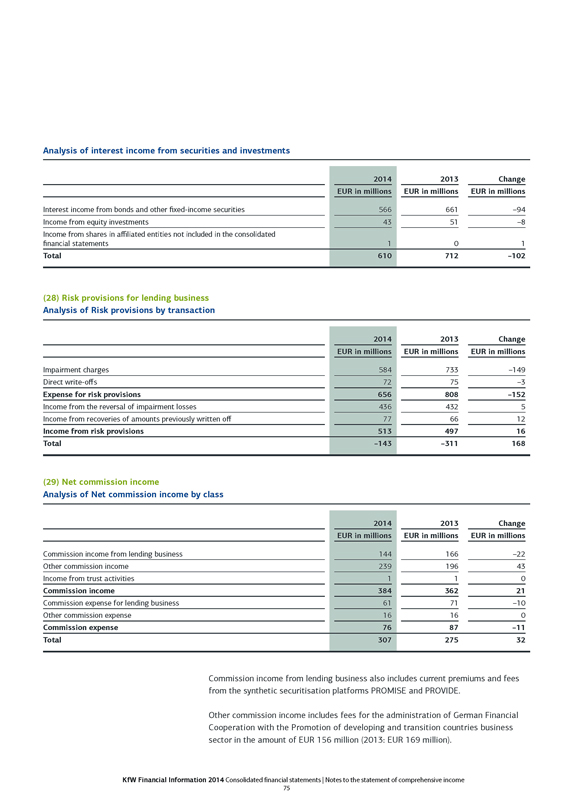
Analysis of interest income from securities and investments
2014 2013 Change
EUR in millions EUR in millions EUR in millions
Interest income from bonds and other fixed-income securities 566 661 –94
Income from equity investments 43 51 –8
Income from shares in affiliated entities not included in the consolidated financial statements 1 0 1
Total 610 712 –102
(28) Risk provisions for lending business Analysis of Risk provisions by transaction
2014 2013 Change
EUR in millions EUR in millions EUR in millions
Impairment charges 584 733 –149
Direct write-offs 72 75 –3
Expense for risk provisions 656 808 –152
Income from the reversal of impairment losses 436 432 5
Income from recoveries of amounts previously written off 77 66 12
Income from risk provisions 513 497 16
Total –143 –311 168
(29) Net commission income
Analysis of Net commission income by class
2014 2013 Change
EUR in millions EUR in millions EUR in millions
Commission income from lending business 144 166 –22
Other commission income 239 196 43
Income from trust activities 1 1 0
Commission income 384 362 21
Commission expense for lending business 61 71 –10
Other commission expense 16 16 0
Commission expense 76 87 –11
Total 307 275 32
Commission income from lending business also includes current premiums and fees from the synthetic securitisation platforms PROMISE and PROVIDE.
Other commission income includes fees for the administration of German Financial Cooperation with the Promotion of developing and transition countries business sector in the amount of EUR 156 million (2013: EUR 169 million).
KfW Financial Information 2014 Consolidated financial statements | Notes to the statement of comprehensive income 75
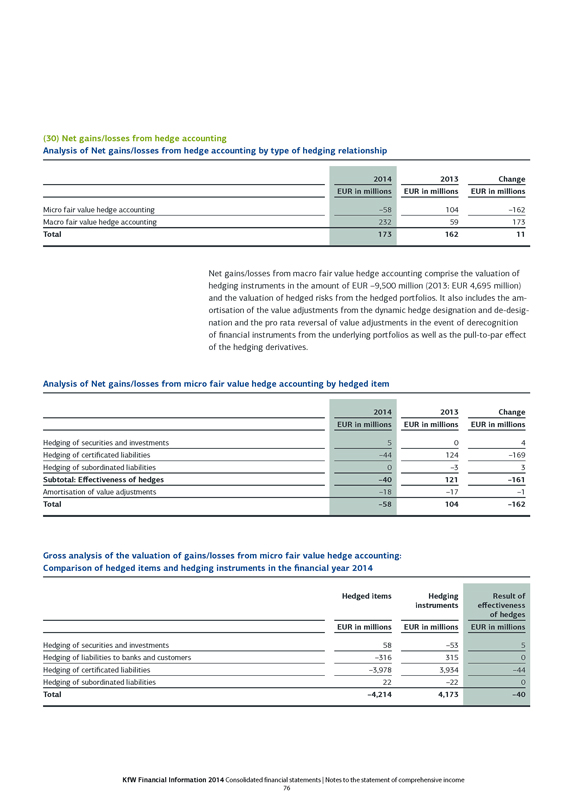
(30) Net gains/losses from hedge accounting
Analysis of Net gains/losses from hedge accounting by type of hedging relationship
2014 2013 Change
EUR in millions EUR in millions EUR in millions
Micro fair value hedge accounting –58 104 –162
Macro fair value hedge accounting 232 59 173
Total 173 162 11
Net gains/losses from macro fair value hedge accounting comprise the valuation of hedging instruments in the amount of EUR –9,500 million (2013: EUR 4,695 million) and the valuation of hedged risks from the hedged portfolios. It also includes the amortisation of the value adjustments from the dynamic hedge designation and de-designation and the pro rata reversal of value adjustments in the event of derecognition of financial instruments from the underlying portfolios as well as the pull-to-par effect of the hedging derivatives.
Analysis of Net gains/losses from micro fair value hedge accounting by hedged item
2014 2013 Change
EUR in millions EUR in millions EUR in millions
Hedging of securities and investments 5 0 4
Hedging of certificated liabilities –44 124 –169
Hedging of subordinated liabilities 0 –3 3
Subtotal: Effectiveness of hedges –40 121 –161
Amortisation of value adjustments –18 –17 –1
Total –58 104 –162
Gross analysis of the valuation of gains/losses from micro fair value hedge accounting: Comparison of hedged items and hedging instruments in the financial year 2014
Hedged items Hedging instruments Result of effectiveness of hedges
EUR in millions EUR in millions EUR in millions
Hedging of securities and investments 58 –53 5
Hedging of liabilities to banks and customers –316 315 0
Hedging of certificated liabilities –3,978 3,934 –44
Hedging of subordinated liabilities 22 –22 0
Total –4,214 4,173 –40
KfW Financial Information 2014 Consolidated financial statements | Notes to the statement of comprehensive income 76
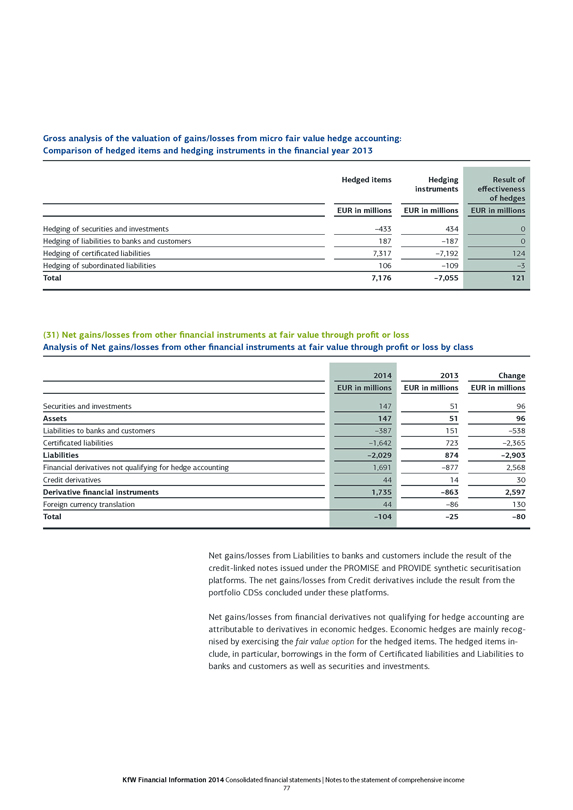
Gross analysis of the valuation of gains/losses from micro fair value hedge accounting: Comparison of hedged items and hedging instruments in the financial year 2013
Hedged items Hedging instruments Result of effectiveness of hedges
EUR in millions EUR in millions EUR in millions
Hedging of securities and investments –433 434 0
Hedging of liabilities to banks and customers 187 –187 0
Hedging of certificated liabilities 7,317 –7,192 124
Hedging of subordinated liabilities 106 –109 –3
Total 7,176 –7,055 121
(31) Net gains/losses from other financial instruments at fair value through profit or loss
Analysis of Net gains/losses from other financial instruments at fair value through profit or loss by class
2014 2013 Change
EUR in millions EUR in millions EUR in millions
Securities and investments 147 51 96
Assets 147 51 96
Liabilities to banks and customers –387 151 –538
Certificated liabilities –1,642 723 –2,365
Liabilities –2,029 874 –2,903
Financial derivatives not qualifying for hedge accounting 1,691 –877 2,568
Credit derivatives 44 14 30
Derivative financial instruments 1,735 –863 2,597
Foreign currency translation 44 –86 130
Total –104 –25 –80
Net gains/losses from Liabilities to banks and customers include the result of the credit-linked notes issued under the PROMISE and PROVIDE synthetic securitisation platforms. The net gains/losses from Credit derivatives include the result from the portfolio CDSs concluded under these platforms.
Net gains/losses from financial derivatives not qualifying for hedge accounting are attributable to derivatives in economic hedges. Economic hedges are mainly recognised by exercising the fair value option for the hedged items. The hedged items include, in particular, borrowings in the form of Certificated liabilities and Liabilities to banks and customers as well as securities and investments.
KfW Financial Information 2014 Consolidated financial statements | Notes to the statement of comprehensive income 77
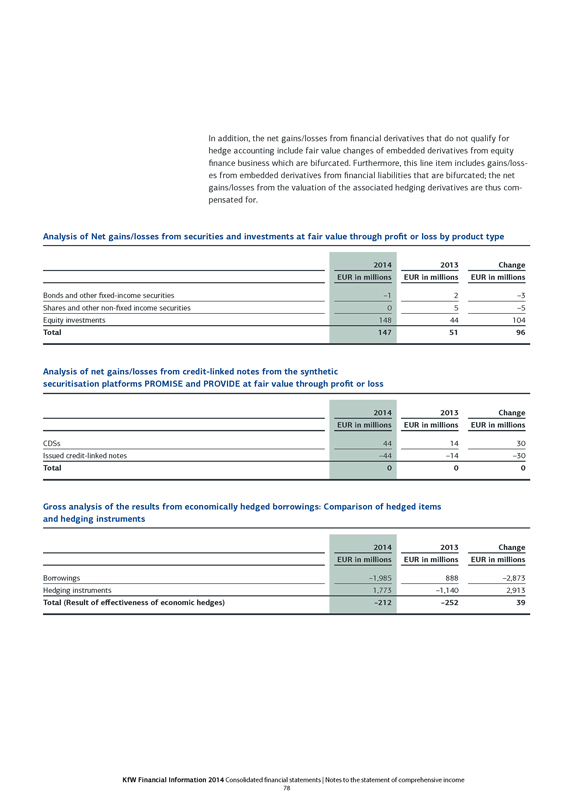
In addition, the net gains/losses from financial derivatives that do not qualify for hedge accounting include fair value changes of embedded derivatives from equity finance business which are bifurcated. Furthermore, this line item includes gains/losses from embedded derivatives from financial liabilities that are bifurcated; the net gains/losses from the valuation of the associated hedging derivatives are thus compensated for.
Analysis of Net gains/losses from securities and investments at fair value through profit or loss by product type
2014 2013 Change
EUR in millions EUR in millions EUR in millions
Bonds and other fixed-income securities –1 2 –3
Shares and other non-fixed income securities 0 5 –5
Equity investments 148 44 104
Total 147 51 96
Analysis of net gains/losses from credit-linked notes from the synthetic securitisation platforms PROMISE and PROVIDE at fair value through profit or loss
2014 2013 Change
EUR in millions EUR in millions EUR in millions
CDSs 44 14 30
Issued credit-linked notes –44 –14 –30
Total 0 0 0
Gross analysis of the results from economically hedged borrowings: Comparison of hedged items and hedging instruments
2014 2013 Change
EUR in millions EUR in millions EUR in millions
Borrowings –1,985 888 –2,873
Hedging instruments 1,773 –1,140 2,913
Total (Result of effectiveness of economic hedges) –212 –252 39
KfW Financial Information 2014 Consolidated financial statements | Notes to the statement of comprehensive income 78
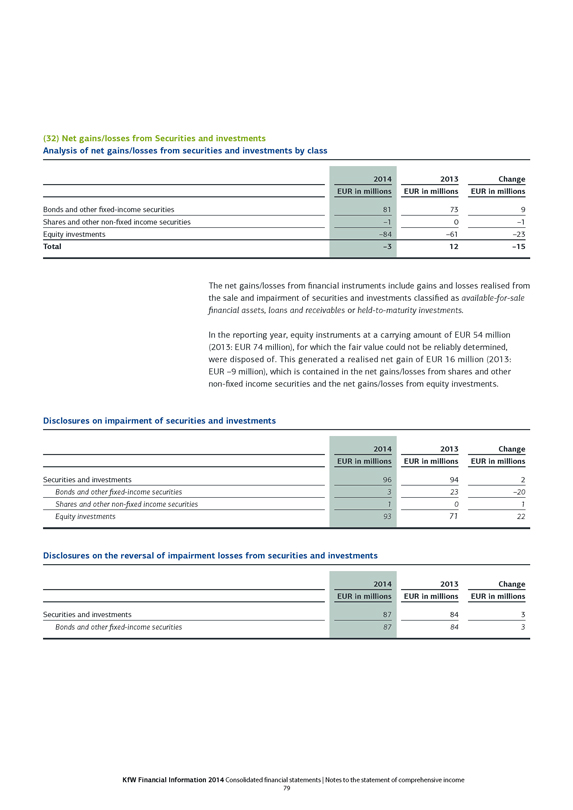
(32) Net gains/losses from Securities and investments
Analysis of net gains/losses from securities and investments by class
2014 2013 Change
EUR in millions EUR in millions EUR in millions
Bonds and other fixed-income securities 81 73 9
Shares and other non-fixed income securities –1 0 –1
Equity investments –84 –61 –23
Total –3 12 –15
The net gains/losses from financial instruments include gains and losses realised from the sale and impairment of securities and investments classified as available-for-sale financial assets, loans and receivables or held-to-maturity investments.
In the reporting year, equity instruments at a carrying amount of EUR 54 million (2013: EUR 74 million), for which the fair value could not be reliably determined, were disposed of. This generated a realised net gain of EUR 16 million (2013: EUR –9 million), which is contained in the net gains/losses from shares and other non-fixed income securities and the net gains/losses from equity investments.
Disclosures on impairment of securities and investments
2014 2013 Change
EUR in millions EUR in millions EUR in millions
Securities and investments 96 94 2
Bonds and other fixed-income securities 3 23 –20
Shares and other non-fixed income securities 1 0 1
Equity investments 93 71 22
Disclosures on the reversal of impairment losses from securities and investments
2014 2013 Change
EUR in millions EUR in millions EUR in millions
Securities and investments 87 84 3
Bonds and other fixed-income securities 87 84 3
KfW Financial Information 2014 Consolidated financial statements | Notes to the statement of comprehensive income 79
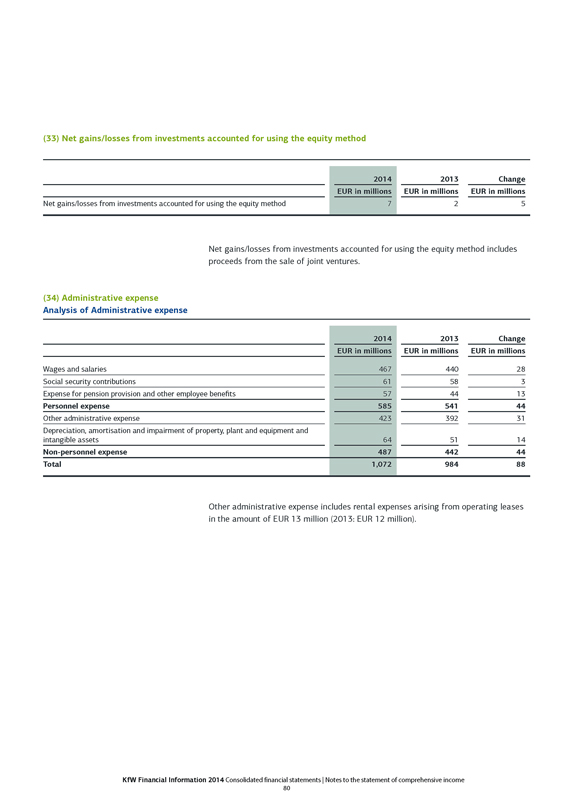
(33) Net gains/losses from investments accounted for using the equity method
2014 2013 Change
EUR in millions EUR in millions EUR in millions
Net gains/losses from investments accounted for using the equity method 7 2 5
Net gains/losses from investments accounted for using the equity method includes proceeds from the sale of joint ventures.
(34) Administrative expense Analysis of Administrative expense
2014 2013 Change
EUR in millions EUR in millions EUR in millions
Wages and salaries 467 440 28
Social security contributions 61 58 3
Expense for pension provision and other employee benefits 57 44 13
Personnel expense 585 541 44
Other administrative expense 423 392 31
Depreciation, amortisation and impairment of property, plant and equipment and intangible assets 64 51 14
Non-personnel expense 487 442 44
Total 1,072 984 88
Other administrative expense includes rental expenses arising from operating leases in the amount of EUR 13 million (2013: EUR 12 million).
KfW Financial Information 2014 Consolidated financial statements | Notes to the statement of comprehensive income 80
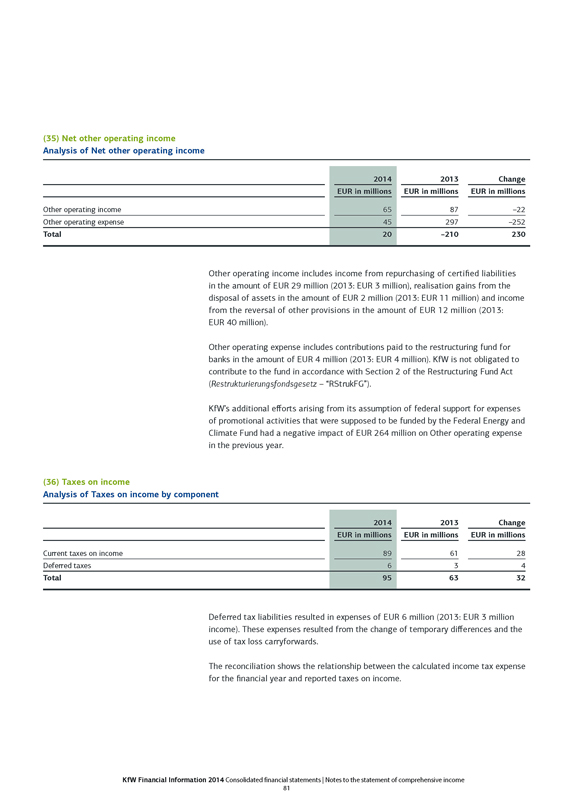
(35) Net other operating income Analysis of Net other operating income
2014 2013 Change
EUR in millions EUR in millions EUR in millions
Other operating income 65 87 –22
Other operating expense 45 297 –252
Total 20 –210 230
Other operating income includes income from repurchasing of certified liabilities in the amount of EUR 29 million (2013: EUR 3 million), realisation gains from the disposal of assets in the amount of EUR 2 million (2013: EUR 11 million) and income from the reversal of other provisions in the amount of EUR 12 million (2013: EUR 40 million).
Other operating expense includes contributions paid to the restructuring fund for banks in the amount of EUR 4 million (2013: EUR 4 million). KfW is not obligated to contribute to the fund in accordance with Section 2 of the Restructuring Fund Act (Restrukturierungsfondsgesetz – “RStrukFG”).
KfW’s additional efforts arising from its assumption of federal support for expenses of promotional activities that were supposed to be funded by the Federal Energy and Climate Fund had a negative impact of EUR 264 million on Other operating expense in the previous year.
(36) Taxes on income
Analysis of Taxes on income by component
2014 2013 Change
EUR in millions EUR in millions EUR in millions
Current taxes on income 89 61 28
Deferred taxes 6 3 4
Total 95 63 32
Deferred tax liabilities resulted in expenses of EUR 6 million (2013: EUR 3 million income). These expenses resulted from the change of temporary differences and the use of tax loss carryforwards.
The reconciliation shows the relationship between the calculated income tax expense for the financial year and reported taxes on income.
KfW Financial Information 2014 Consolidated financial statements | Notes to the statement of comprehensive income 81
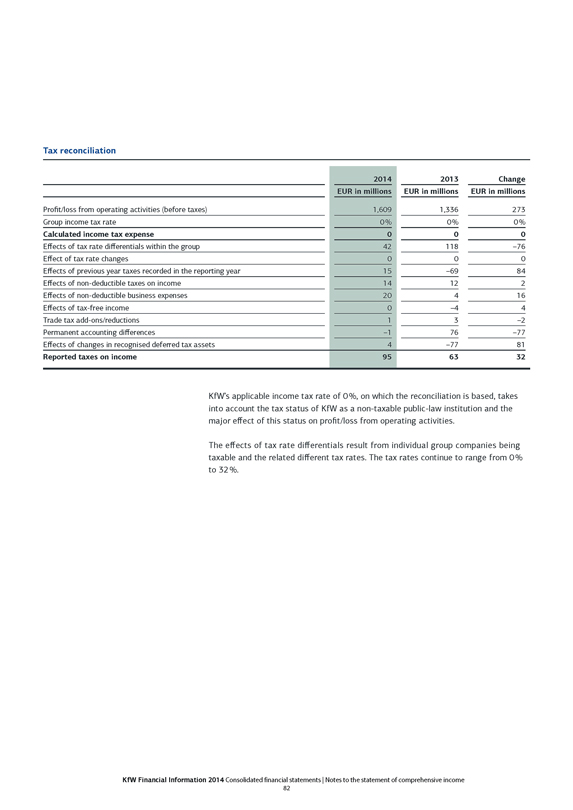
Tax reconciliation
2014 2013 Change
EUR in millions EUR in millions EUR in millions
Profit/loss from operating activities (before taxes) 1,609 1,336 273
Group income tax rate 0% 0% 0%
Calculated income tax expense 0 0 0
Effects of tax rate differentials within the group 42 118 –76
Effect of tax rate changes 0 0 0
Effects of previous year taxes recorded in the reporting year 15 –69 84
Effects of non-deductible taxes on income 14 12 2
Effects of non-deductible business expenses 20 4 16
Effects of tax-free income 0 –4 4
Trade tax add-ons/reductions 1 3 –2
Permanent accounting differences –1 76 –77
Effects of changes in recognised deferred tax assets 4 –77 81
Reported taxes on income 95 63 32
KfW’s applicable income tax rate of 0%, on which the reconciliation is based, takes into account the tax status of KfW as a non-taxable public-law institution and the major effect of this status on profit/loss from operating activities.
The effects of tax rate differentials result from individual group companies being taxable and the related different tax rates. The tax rates continue to range from 0% to 32%.
KfW Financial Information 2014 Consolidated financial statements | Notes to the statement of comprehensive income 82
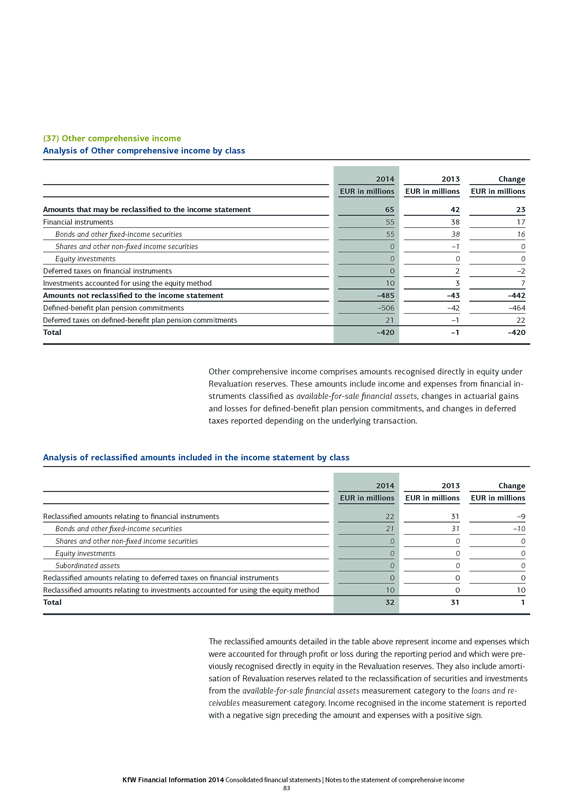
(37) Other comprehensive income
Analysis of Other comprehensive income by class
2014 2013 Change
EUR in millions EUR in millions EUR in millions
Amounts that may be reclassified to the income statement 65 42 23
Financial instruments 55 38 17
Bonds and other fixed-income securities 55 38 16
Shares and other non-fixed income securities 0 –1 0
Equity investments 0 0 0
Deferred taxes on financial instruments 0 2 –2
Investments accounted for using the equity method 10 3 7
Amounts not reclassified to the income statement –485 –43 –442
Defined-benefit plan pension commitments –506 –42 –464
Deferred taxes on defined-benefit plan pension commitments 21 –1 22
Total –420 –1 –420
Other comprehensive income comprises amounts recognised directly in equity under Revaluation reserves. These amounts include income and expenses from financial instruments classified as available-for-sale financial assets, changes in actuarial gains and losses for defined-benefit plan pension commitments, and changes in deferred taxes reported depending on the underlying transaction.
Analysis of reclassified amounts included in the income statement by class
2014 2013 Change
EUR in millions EUR in millions EUR in millions
Reclassified amounts relating to financial instruments 22 31 –9
Bonds and other fixed-income securities 21 31 –10
Shares and other non-fixed income securities 0 0 0
Equity investments 0 0 0
Subordinated assets 0 0 0
Reclassified amounts relating to deferred taxes on financial instruments 0 0 0
Reclassified amounts relating to investments accounted for using the equity method 10 0 10
Total 32 31 1
The reclassified amounts detailed in the table above represent income and expenses which were accounted for through profit or loss during the reporting period and which were previously recognised directly in equity in the Revaluation reserves. They also include amortisation of Revaluation reserves related to the reclassification of securities and investments from the available-for-sale financial assets measurement category to the loans and receivables measurement category. Income recognised in the income statement is reported with a negative sign preceding the amount and expenses with a positive sign.
KfW Financial Information 2014 Consolidated financial statements | Notes to the statement of comprehensive income 83

Segment reporting
(38) Segment reporting by business sector
In accordance with the provisions of IFRS 8, segment reporting follows the internal management reporting system, which is used by the group’s main decision-makers to assess each segment’s performance and to allocate resources to segments.
In accordance with the business sector structure for KfW Group, the segments and their products and services can be presented as follows:
Mittelstandsbank (SME Bank)
– Financing of corporate and industrial pollution control investments
– Equity financing
– Advisory services
Kommunal- und Privatkundenbank/Kreditinstitute (Municipal and Private Client Bank/Credit Institutions)
– Financing for housing construction and modernisation
– Education finance
– Infrastructure and social finance
– General funding of the special credit institutions of the German Federal States
– Individual financing banks
– Transactions on behalf of the Federal Government
Export and project finance
– Financing for German and European export activities
– Financing for projects and investments in German and European interests
Promotion of developing and transition countries
– Promotion of developing and transition countries on behalf of the Federal Government (budget funds) with complementary market funds raised by KfW
– Financing provided by DEG – Deutsche Investitions- und Entwicklungs-gesellschaft mbH (private enterprise financing)
Capital markets
– Securities and money market investments
– Holding arrangements for the Federal Republic of Germany
– Transactions mandated by the Federal Government, loan granted to Greece
– Funding
Head office
– Central interest rate and currency management
– Strategic equity investments
The business sectors are measured on the basis of their contribution to consolidated profit. The individual line items are based on the following methods:
– Net interest income (before promotional activity) comprises interest margins from asset operations calculated on the basis of the market interest rate method1). The item also includes the imputed return on equity with an analysis based on economic capital usage. Head office also includes the treasury result, which largely comprises the income/loss from interest rate management. The profit contribution from KfW funding2) is allocated to the Capital markets business sector.
– The promotional activity included in interest, commission and administrative expense in the income statement is reported separately pursuant to the internal management report due to the special relevance of the promotional activity as a management variable. Promotional activity is understood to mean certain expenses of
1) Refinancing at matching maturities using KfW’s internal refinancing curve is assumed for the calculation of interest margins in this method.
2) The difference between the realised refinancing rates and the maturity-matched refinancing rates calculated in-house.
KfW Financial Information 2014 Consolidated financial statements | Notes – Segment reporting 84
both business sectors Mittelstandsbank (SME Bank) and Kommunal- und Privatkundenbank/Kreditinstitute (Municipal and Private Client Bank/Credit Institutions) with a positive impact on the achievement of KfW’s promotional objectives. Promotional activity primarily consists of additions of the interest rate reductions3) accounted for at present value from new promotion business as well as from the compounding effect. Additional support components are the expense for consultancy grants and sales partner incentives through upfront fees in certain products of the Mittelstandsbank business sector (included in Commission expense) as well as for available and product-related marketing measures (included in Administrative expense).
The allocation of Administrative expense (before promotional activity) is based on the results from activity-based accounting by cost centres4). Administrative expense (before promotional support) includes depreciation on property, plant and equipment and amortisation of intangible assets.
In the Risk provisions for lending business item, net impairment charges, direct write-offs and recoveries on loans written off are distributed among the segments according to the underlying loan.
The valuation result comprises the net gains/losses from hedge accounting, the net gains/losses from other financial instruments at fair value, the net gains/losses from securities and investments, the net gains/losses from investments accounted for using the equity method and net other operating income. The prior-year figures included the expense from the EUR 264 million assumption of federal support for KfW promotional activities that were supposed to be financed by the Energy and Climate Fund (allocation to Head office).
When taxes on income are allocated to the business sectors (excluding the Head office) only the current taxes on income are taken in account. Deferred taxes are allocated to the Head office.
The reported economic capital requirement is quantified for a solvency level of 99.99% and covers potential credit, market price and operating risks as well as hidden burdens for securities. The economic capital requirement also includes the separate line item and project risks as of the reporting date 31 December 2014.5)
Segment assets are not reported in accordance with the internal management reporting system as it is used neither to assess each segment’s performance nor to allocate resources to segments.
3) See note (8) for details of KfW’s interest rate reductions in the promotional lending business. The present value of the nominal scheduled interest rate reductions, which is recognised as interest expense in profit or loss, is allocated to the Mittelstandsbank and Kommunal- und Privatkundenbank/Kreditinstitute business sectors.
The effect of accrued interest on the present values contained in interest expense is allocated to the Head office for simplification reasons.
4) The costs incurred in the organisational units are allocated to the products by means of core services.
5) The statistical models and methods used are explained in the risk report section of the group management report.
KfW Financial Information 2014 Consolidated financial statements | Notes – Segment reporting 85
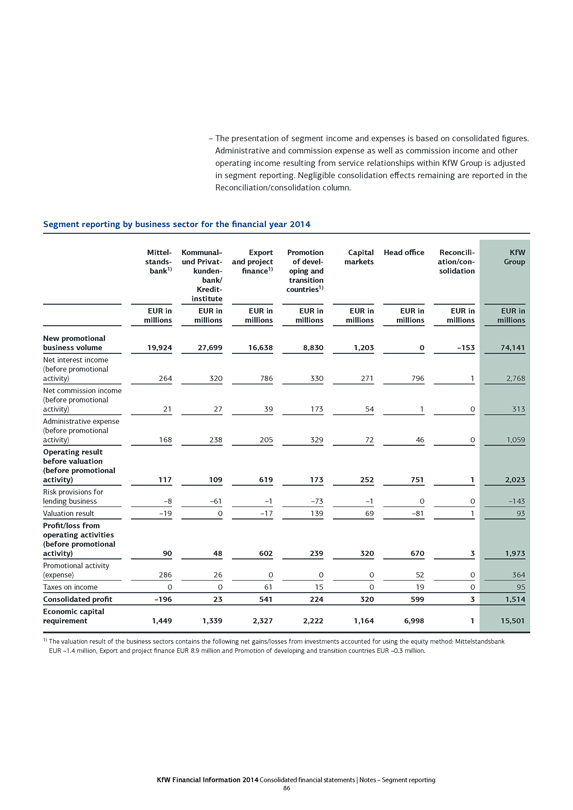
The presentation of segment income and expenses is based on consolidated figures. Administrative and commission expense as well as commission income and other operating income resulting from service relationships within KfW Group is adjusted in segment reporting. Negligible consolidation effects remaining are reported in the Reconciliation/consolidation column.
Segment reporting by business sector for the financial year 2014
Mittelstandsbank1) Kommunal– und Privatkundenbank/Kreditinstitute Export and project finance1) Promotion of developing and transition countries1) Capital markets Head office Reconciliation/consolidation KfW Group
EUR in EUR in EUR in EUR in EUR in EUR in EUR in EUR in
millions millions millions millions millions millions millions millions
New promotional business volume 19,924 27,699 16,638 8,830 1,203 0 –153 74,141
Net interest income (before promotional activity) 264 320 786 330 271 796 1 2,768
Net commission income (before promotional activity) 21 27 39 173 54 1 0 313
Administrative expense (before promotional activity) 168 238 205 329 72 46 0 1,059
Operating result before valuation (before promotional activity) 117 109 619 173 252 751 1 2,023
Risk provisions for lending business –8 –61 –1 –73 –1 0 0 –143
Valuation result –19 0 –17 139 69 –81 1 93
Profit/loss from operating activities (before promotional activity) 90 48 602 239 320 670 3 1,973
Promotional activity (expense) 286 26 0 0 0 52 0 364
Taxes on income 0 0 61 15 0 19 0 95
Consolidated profit –196 23 541 224 320 599 3 1,514
Economic capital requirement 1,449 1,339 2,327 2,222 1,164 6,998 1 15,501
1) The valuation result of the business sectors contains the following net gains/losses from investments accounted for using the equity method: Mittelstandsbank EUR –1.4 million, Export and project finance EUR 8.9 million and Promotion of developing and transition countries EUR –0.3 million.
KfW Financial Information 2014 Consolidated financial statements | Notes – Segment reporting 86
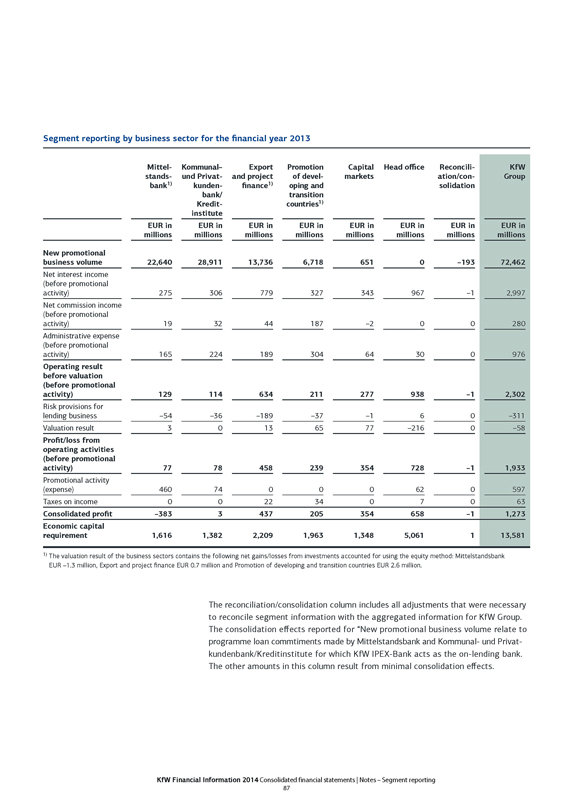
Segment reporting by business sector for the financial year 2013
Mittelstandsbank1) Kommunal– und Privatkundenbank/Kreditinstitute Export and project finance1) Promotion of developing and transition countries1) Capital markets Head office Reconciliation/consolidation KfW Group
EUR in millions EUR in millions EUR in millions EUR in millions EUR in millions EUR in millions EUR in millions EUR in millions
New promotional business volume 22,640 28,911 13,736 6,718 651 0 –193 72,462
Net interest income (before promotional activity) 275 306 779 327 343 967 –1 2,997
Net commission income (before promotional activity) 19 32 44 187 –2 0 0 280
Administrative expense (before promotional activity) 165 224 189 304 64 30 0 976
Operating result before valuation (before promotional activity) 129 114 634 211 277 938 –1 2,302
Risk provisions for lending business –54 –36 –189 –37 –1 6 0 –311
Valuation result 3 0 13 65 77 –216 0 –58
Profit/loss from operating activities (before promotional activity) 77 78 458 239 354 728 –1 1,933
Promotional activity (expense) 460 74 0 0 0 62 0 597
Taxes on income 0 0 22 34 0 7 0 63
Consolidated profit –383 3 437 205 354 658 –1 1,273
Economic capital requirement 1,616 1,382 2,209 1,963 1,348 5,061 1 13,581
1) The valuation result of the business sectors contains the following net gains/losses from investments accounted for using the equity method: Mittelstandsbank EUR –1.3 million, Export and project finance EUR 0.7 million and Promotion of developing and transition countries EUR 2.6 million.
The reconciliation/consolidation column includes all adjustments that were necessary to reconcile segment information with the aggregated information for KfW Group. The consolidation effects reported for “New promotional business volume relate to programme loan commtiments made by Mittelstandsbank and Kommunal- und Privatkundenbank/Kreditinstitute for which KfW IPEX-Bank acts as the on-lending bank. The other amounts in this column result from minimal consolidation effects.
KfW Financial Information 2014 Consolidated financial statements | Notes – Segment reporting 87
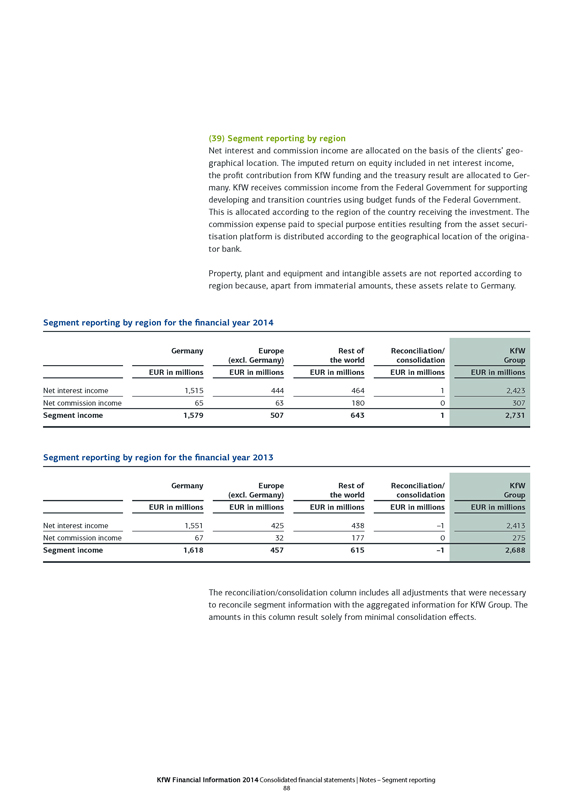
(39) Segment reporting by region
Net interest and commission income are allocated on the basis of the clients’ geographical location. The imputed return on equity included in net interest income, the profit contribution from KfW funding and the treasury result are allocated to Germany. KfW receives commission income from the Federal Government for supporting developing and transition countries using budget funds of the Federal Government. This is allocated according to the region of the country receiving the investment. The commission expense paid to special purpose entities resulting from the asset securitisation platform is distributed according to the geographical location of the originator bank.
Property, plant and equipment and intangible assets are not reported according to region because, apart from immaterial amounts, these assets relate to Germany.
Segment reporting by region for the financial year 2014
Germany Europe (excl. Germany) Rest of the world Reconciliation/consolidation KfW Group
EUR in millions EUR in millions EUR in millions EUR in millions EUR in millions
Net interest income 1,515 444 464 1 2,423
Net commission income 65 63 180 0 307
Segment income 1,579 507 643 1 2,731
Segment reporting by region for the financial year 2013
Germany Europe (excl. Germany) Rest of the world Reconciliation/consolidation
KfW Group
EUR in millions EUR in millions EUR in millions EUR in millions EUR in millions
Net interest income 1,551 425 438 –1 2,413
Net commission income 67 32 177 0 275
Segment income 1,618 457 615 –1 2,688
The reconciliation/consolidation column includes all adjustments that were necessary to reconcile segment information with the aggregated information for KfW Group. The amounts in this column result solely from minimal consolidation effects.
KfW Financial Information 2014 Consolidated financial statements | Notes – Segment reporting 88
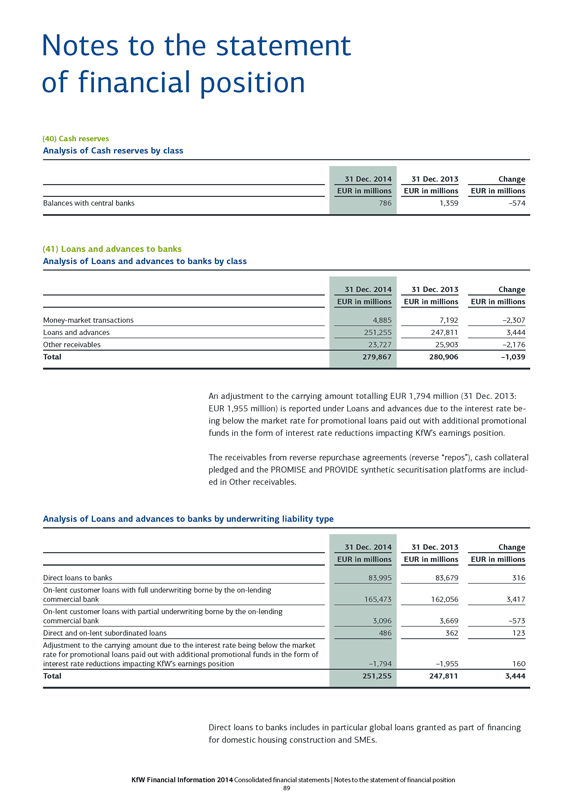
Notes to the statement of financial position
(40) Cash reserves
Analysis of Cash reserves by class
31 Dec. 2014 31 Dec. 2013 Change
EUR in millions EUR in millions EUR in millions
Balances with central banks 786 1,359 –574
(41) Loans and advances to banks
Analysis of Loans and advances to banks by class
31 Dec. 2014 31 Dec. 2013 Change
EUR in millions EUR in millions EUR in millions
Money-market transactions 4,885 7,192 –2,307
Loans and advances 251,255 247,811 3,444
Other receivables 23,727 25,903 –2,176
Total 279,867 280,906 –1,039
An adjustment to the carrying amount totalling EUR 1,794 million (31 Dec. 2013: EUR 1,955 million) is reported under Loans and advances due to the interest rate being below the market rate for promotional loans paid out with additional promotional funds in the form of interest rate reductions impacting KfW’s earnings position.
The receivables from reverse repurchase agreements (reverse “repos”), cash collateral pledged and the PROMISE and PROVIDE synthetic securitisation platforms are included in Other receivables.
Analysis of Loans and advances to banks by underwriting liability type
31 Dec. 2014 31 Dec. 2013 Change
EUR in millions EUR in millions EUR in millions
Direct loans to banks 83,995 83,679 316
On-lent customer loans with full underwriting borne by the on-lending commercial bank 165,473 162,056 3,417
On-lent customer loans with partial underwriting borne by the on-lending commercial bank 3,096 3,669 –573
Direct and on-lent subordinated loans 486 362 123
Adjustment to the carrying amount due to the interest rate being below the market rate for promotional loans paid out with additional promotional funds in the form of interest rate reductions impacting KfW’s earnings position –1,794 –1,955 160
Total 251,255 247,811 3,444
Direct loans to banks includes in particular global loans granted as part of financing for domestic housing construction and SMEs.
KfW Financial Information 2014 Consolidated financial statements | Notes to the statement of financial position 89
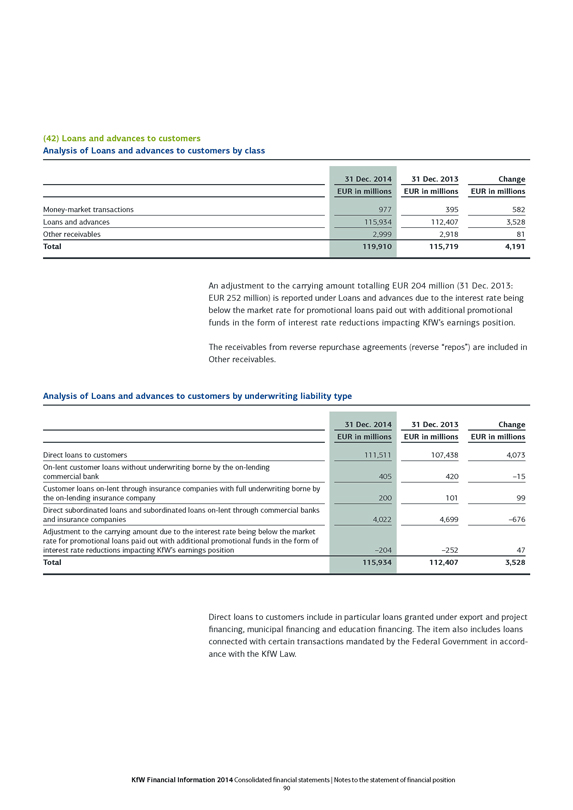
(42) Loans and advances to customers
Analysis of Loans and advances to customers by class
31 Dec. 2014 31 Dec. 2013 Change
EUR in millions EUR in millions EUR in millions
Money-market transactions 977 395 582
Loans and advances 115,934 112,407 3,528
Other receivables 2,999 2,918 81
Total 119,910 115,719 4,191
An adjustment to the carrying amount totalling EUR 204 million (31 Dec. 2013: EUR 252 million) is reported under Loans and advances due to the interest rate being below the market rate for promotional loans paid out with additional promotional funds in the form of interest rate reductions impacting KfW’s earnings position.
The receivables from reverse repurchase agreements (reverse “repos”) are included in Other receivables.
Analysis of Loans and advances to customers by underwriting liability type
31 Dec. 2014 31 Dec. 2013 Change
EUR in millions EUR in millions EUR in millions
Direct loans to customers 111,511 107,438 4,073
On-lent customer loans without underwriting borne by the on-lending commercial bank 405 420 –15
Customer loans on-lent through insurance companies with full underwriting borne by the on-lending insurance company 200 101 99
Direct subordinated loans and subordinated loans on-lent through commercial banks and insurance companies 4,022 4,699 –676
Adjustment to the carrying amount due to the interest rate being below the market rate for promotional loans paid out with additional promotional funds in the form of interest rate reductions impacting KfW’s earnings position –204 –252 47
Total 115,934 112,407 3,528
Direct loans to customers include in particular loans granted under export and project financing, municipal financing and education financing. The item also includes loans connected with certain transactions mandated by the Federal Government in accordance with the KfW Law.
KfW Financial Information 2014 Consolidated financial statements | Notes to the statement of financial position 90
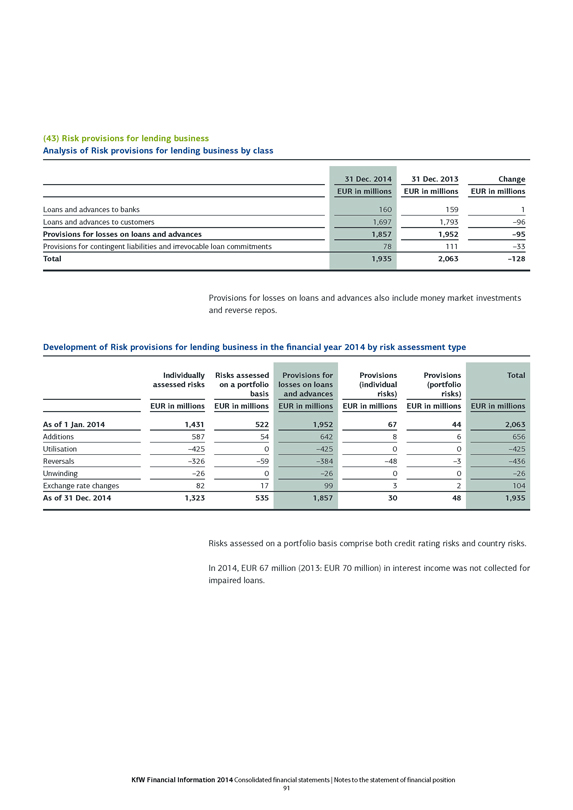
(43) Risk provisions for lending business
Analysis of Risk provisions for lending business by class
31 Dec. 2014 31 Dec. 2013 Change
EUR in millions EUR in millions EUR in millions
Loans and advances to banks 160 159 1
Loans and advances to customers 1,697 1,793 –96
Provisions for losses on loans and advances 1,857 1,952 –95
Provisions for contingent liabilities and irrevocable loan commitments 78 111 –33
Total 1,935 2,063 –128
Provisions for losses on loans and advances also include money market investments and reverse repos.
Development of Risk provisions for lending business in the financial year 2014 by risk assessment type
Individually assessed risks Risks assessed on a portfolio basis Provisions for losses on loans and advances Provisions (individual risks) Provisions (portfolio risks) Total
EUR in millions EUR in millions EUR in millions EUR in millions EUR in millions EUR in millions
As of 1 Jan. 2014 1,431 522 1,952 67 44 2,063
Additions 587 54 642 8 6 656
Utilisation –425 0 –425 0 0 –425
Reversals –326 –59 –384 –48 –3 –436
Unwinding –26 0 –26 0 0 –26
Exchange rate changes 82 17 99 3 2 104
As of 31 Dec. 2014 1,323 535 1,857 30 48 1,935
Risks assessed on a portfolio basis comprise both credit rating risks and country risks.
In 2014, EUR 67 million (2013: EUR 70 million) in interest income was not collected for impaired loans.
KfW Financial Information 2014 Consolidated financial statements | Notes to the statement of financial position 91
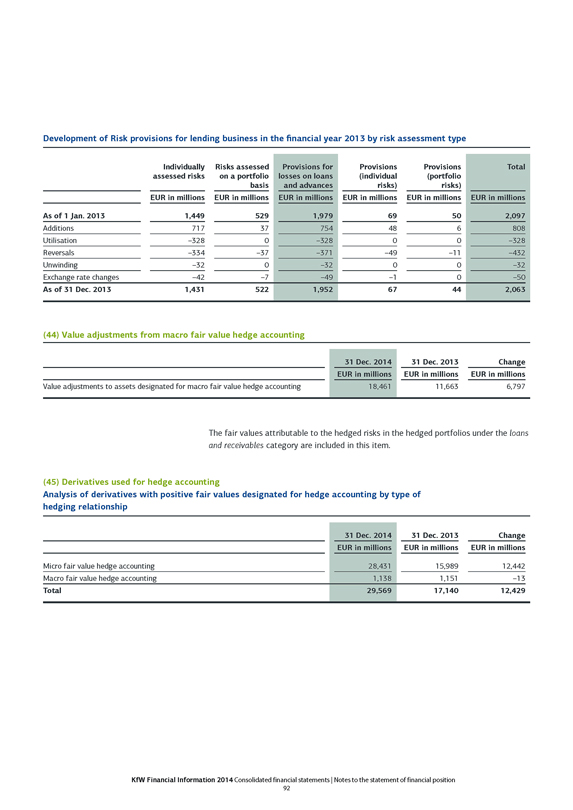
Development of Risk provisions for lending business in the financial year 2013 by risk assessment type
Individually assessed risks Risks assessed on a portfolio basis Provisions for losses on loans and advances Provisions (individual risks) Provisions (portfolio risks) Total
EUR in millions EUR in millions EUR in millions EUR in millions EUR in millions EUR in millions
As of 1 Jan. 2013 1,449 529 1,979 69 50 2,097
Additions 717 37 754 48 6 808
Utilisation –328 0 –328 0 0 –328
Reversals –334 –37 –371 –49 –11 –432
Unwinding –32 0 –32 0 0 –32
Exchange rate changes –42 –7 –49 –1 0 –50
As of 31 Dec. 2013 1,431 522 1,952 67 44 2,063
(44) Value adjustments from macro fair value hedge accounting
31 Dec. 2014 31 Dec. 2013 Change
EUR in millions EUR in millions EUR in millions
Value adjustments to assets designated for macro fair value hedge accounting 18,461 11,663 6,797
The fair values attributable to the hedged risks in the hedged portfolios under the loans and receivables category are included in this item.
(45) Derivatives used for hedge accounting
Analysis of derivatives with positive fair values designated for hedge accounting by type of hedging relationship
31 Dec. 2014 31 Dec. 2013 Change
EUR in millions EUR in millions EUR in millions
Micro fair value hedge accounting 28,431 15,989 12,442
Macro fair value hedge accounting 1,138 1,151 –13
Total 29,569 17,140 12,429
KfW Financial Information 2014 Consolidated financial statements | Notes to the statement of financial position 92
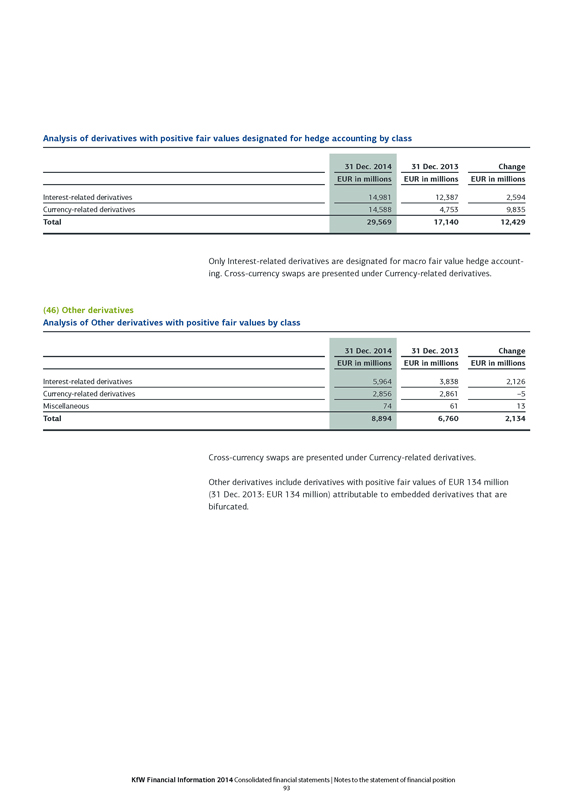
Analysis of derivatives with positive fair values designated for hedge accounting by class
31 Dec. 2014 31 Dec. 2013 Change
EUR in millions EUR in millions EUR in millions
Interest-related derivatives 14,981 12,387 2,594
Currency-related derivatives 14,588 4,753 9,835
Total 29,569 17,140 12,429
Only Interest-related derivatives are designated for macro fair value hedge accounting. Cross-currency swaps are presented under Currency-related derivatives.
(46) Other derivatives
Analysis of Other derivatives with positive fair values by class
31 Dec. 2014 31 Dec. 2013 Change
EUR in millions EUR in millions EUR in millions
Interest-related derivatives 5,964 3,838 2,126
Currency-related derivatives 2,856 2,861 –5
Miscellaneous 74 61 13
Total 8,894 6,760 2,134
Cross-currency swaps are presented under Currency-related derivatives.
Other derivatives include derivatives with positive fair values of EUR 134 million (31 Dec. 2013: EUR 134 million) attributable to embedded derivatives that are bifurcated.
KfW Financial Information 2014 Consolidated financial statements | Notes to the statement of financial position 93
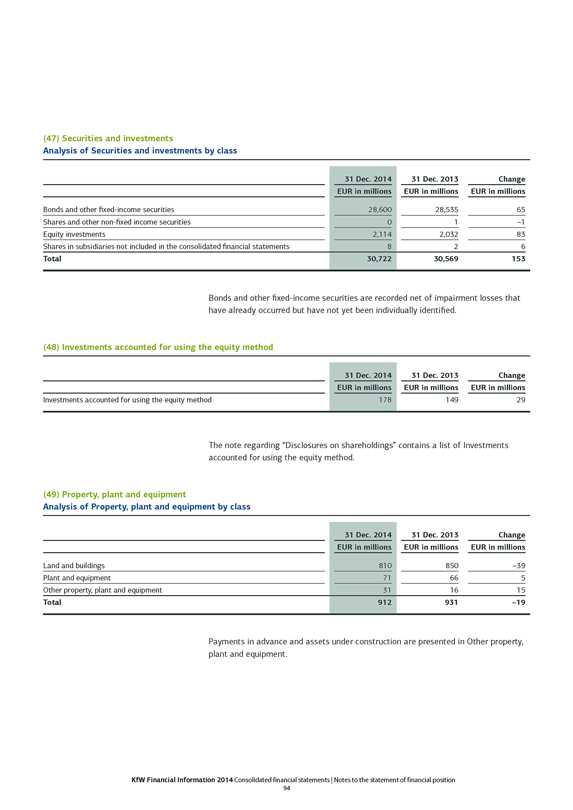
(47) Securities and investments
Analysis of Securities and investments by class
31 Dec. 2014 31 Dec. 2013 Change
EUR in millions EUR in millions EUR in millions
Bonds and other fixed-income securities 28,600 28,535 65
Shares and other non-fixed income securities 0 1 –1
Equity investments 2,114 2,032 83
Shares in subsidiaries not included in the consolidated financial statements 8 2 6
Total 30,722 30,569 153
Bonds and other fixed-income securities are recorded net of impairment losses that have already occurred but have not yet been individually identified.
(48) Investments accounted for using the equity method
31 Dec. 2014 31 Dec. 2013 Change
EUR in millions EUR in millions EUR in millions
Investments accounted for using the equity method 178 149 29
The note regarding “Disclosures on shareholdings” contains a list of Investments accounted for using the equity method.
(49) Property, plant and equipment
Analysis of Property, plant and equipment by class
31 Dec. 2014 31 Dec. 2013 Change
EUR in millions EUR in millions EUR in millions
Land and buildings 810 850 –39
Plant and equipment 71 66 5
Other property, plant and equipment 31 16 15
Total 912 931 –19
Payments in advance and assets under construction are presented in Other property, plant and equipment.
KfW Financial Information 2014 Consolidated financial statements | Notes to the statement of financial position 94
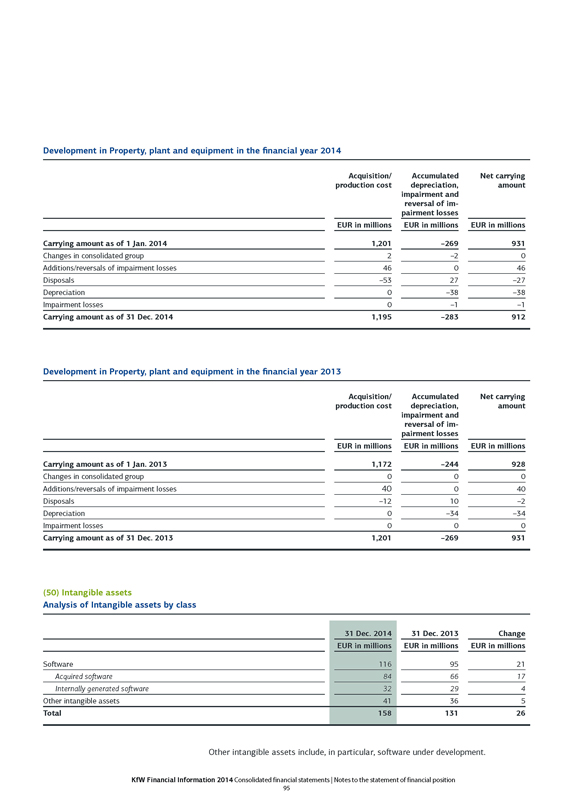
Development in Property, plant and equipment in the financial year 2014
Acquisition/production cost Accumulated depreciation, impairment and reversal of impairment losses Net carrying amount
EUR in millions EUR in millions EUR in millions
Carrying amount as of 1 Jan. 2014 1,201 –269 931
Changes in consolidated group 2 –2 0
Additions/reversals of impairment losses 46 0 46
Disposals –53 27 –27
Depreciation 0 –38 –38
Impairment losses 0 –1 –1
Carrying amount as of 31 Dec. 2014 1,195 –283 912
Development in Property, plant and equipment in the financial year 2013
Acquisition/production cost Accumulated depreciation, impairment and reversal of impairment losses Net carrying amount
EUR in millions EUR in millions EUR in millions
Carrying amount as of 1 Jan. 2013 1,172 –244 928
Changes in consolidated group 0 0 0
Additions/reversals of impairment losses 40 0 40
Disposals –12 10 –2
Depreciation 0 –34 –34
Impairment losses 0 0 0
Carrying amount as of 31 Dec. 2013 1,201 –269 931
(50) Intangible assets
Analysis of Intangible assets by class
31 Dec. 2014 31 Dec. 2013 Change
EUR in millions EUR in millions EUR in millions
Software 116 95 21
Acquired software 84 66 17
Internally generated software 32 29 4
Other intangible assets 41 36 5
Total 158 131 26
Other intangible assets include, in particular, software under development.
KfW Financial Information 2014 Consolidated financial statements | Notes to the statement of financial position 95
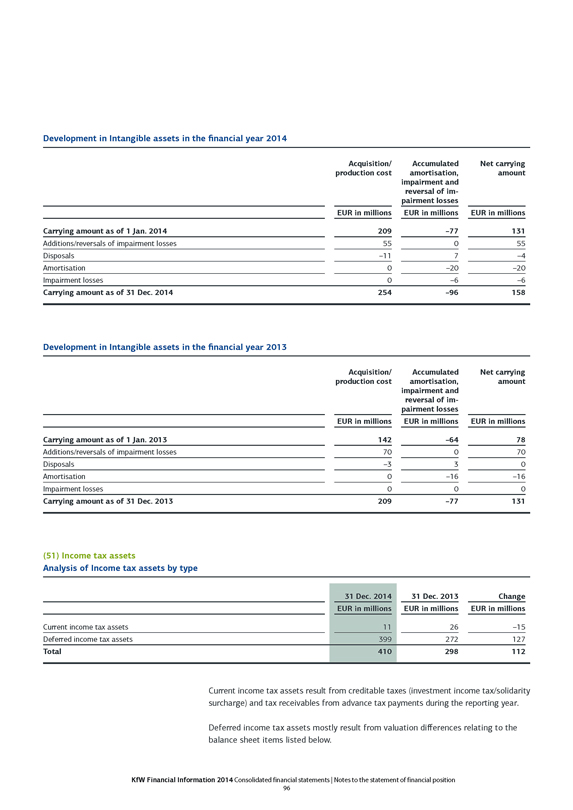
Development in Intangible assets in the financial year 2014
Acquisition/production cost Accumulated amortisation, impairment and reversal of impairment losses Net carrying amount
EUR in millions EUR in millions EUR in millions
Carrying amount as of 1 Jan. 2014 209 –77 131
Additions/reversals of impairment losses 55 0 55
Disposals –11 7 –4
Amortisation 0 –20 –20
Impairment losses 0 –6 –6
Carrying amount as of 31 Dec. 2014 254 –96 158
Development in Intangible assets in the financial year 2013
Acquisition/production cost Accumulated amortisation, impairment and reversal of impairment losses Net carrying amount
EUR in millions EUR in millions EUR in millions
Carrying amount as of 1 Jan. 2013 142 –64 78
Additions/reversals of impairment losses 70 0 70
Disposals –3 3 0
Amortisation 0 –16 –16
Impairment losses 0 0 0
Carrying amount as of 31 Dec. 2013 209 –77 131
(51) Income tax assets
Analysis of Income tax assets by type
31 Dec. 2014 31 Dec. 2013 Change
EUR in millions EUR in millions EUR in millions
Current income tax assets 11 26 –15
Deferred income tax assets 399 272 127
Total 410 298 112
Current income tax assets result from creditable taxes (investment income tax/solidarity surcharge) and tax receivables from advance tax payments during the reporting year.
Deferred income tax assets mostly result from valuation differences relating to the balance sheet items listed below.
KfW Financial Information 2014 Consolidated financial statements | Notes to the statement of financial position 96
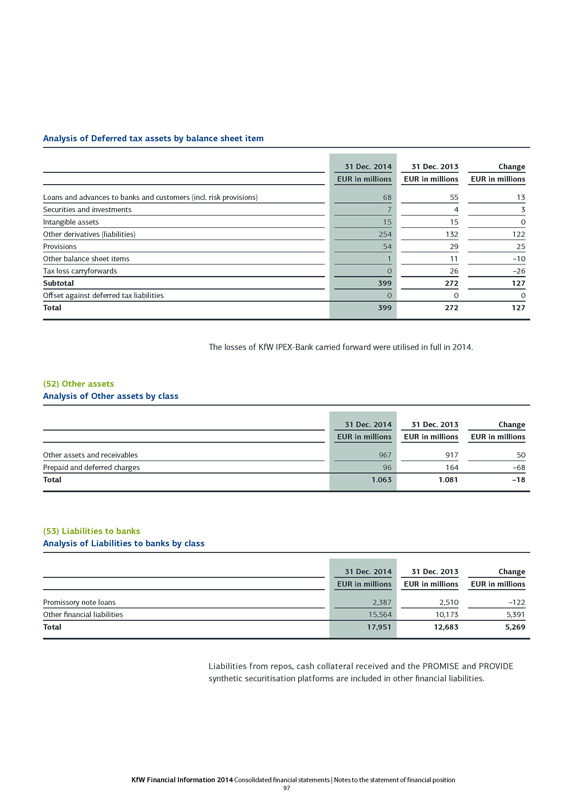
Analysis of Deferred tax assets by balance sheet item
31 Dec. 2014 31 Dec. 2013 Change
EUR in millions EUR in millions EUR in millions
Loans and advances to banks and customers (incl. risk provisions) 68 55 13
Securities and investments 7 4 3
Intangible assets 15 15 0
Other derivatives (liabilities) 254 132 122
Provisions 54 29 25
Other balance sheet items 1 11 –10
Tax loss carryforwards 0 26 –26
Subtotal 399 272 127
Offset against deferred tax liabilities 0 0 0
Total 399 272 127
The losses of KfW IPEX-Bank carried forward were utilised in full in 2014.
(52) Other assets
Analysis of Other assets by class
31 Dec. 2014 31 Dec. 2013 Change
EUR in millions EUR in millions EUR in millions
Other assets and receivables 967 917 50
Prepaid and deferred charges 96 164 –68
Total 1.063 1.081 –18
(53) Liabilities to banks
Analysis of Liabilities to banks by class
31 Dec. 2014 31 Dec. 2013 Change
EUR in millions EUR in millions EUR in millions
Promissory note loans 2,387 2,510 –122
Other financial liabilities 15,564 10,173 5,391
Total 17,951 12,683 5,269
Liabilities from repos, cash collateral received and the PROMISE and PROVIDE synthetic securitisation platforms are included in other financial liabilities.
KfW Financial Information 2014 Consolidated financial statements | Notes to the statement of financial position 97
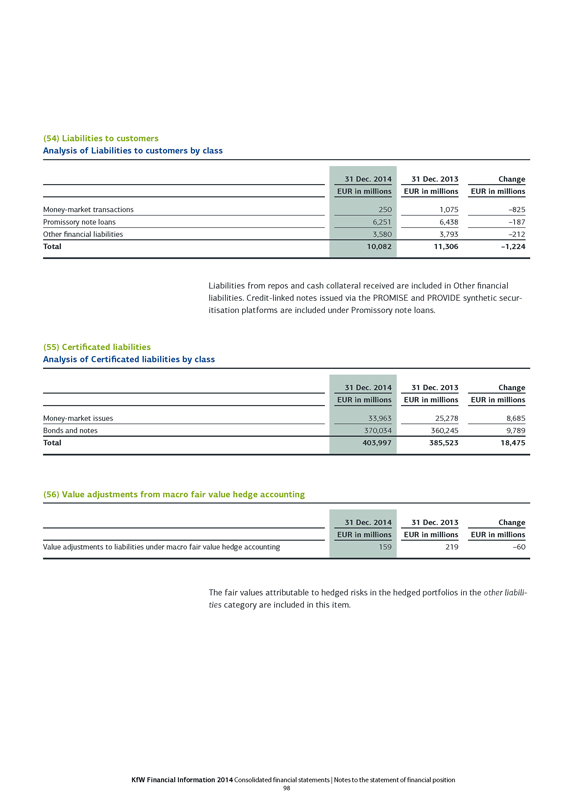
(54) Liabilities to customers
Analysis of Liabilities to customers by class
31 Dec. 2014 31 Dec. 2013 Change
EUR in millions EUR in millions EUR in millions
Money-market transactions 250 1,075 –825
Promissory note loans 6,251 6,438 –187
Other financial liabilities 3,580 3,793 –212
Total 10,082 11,306 –1,224
Liabilities from repos and cash collateral received are included in Other financial liabilities. Credit-linked notes issued via the PROMISE and PROVIDE synthetic securitisation platforms are included under Promissory note loans.
(55) Certificated liabilities
Analysis of Certificated liabilities by class
31 Dec. 2014 31 Dec. 2013 Change
EUR in millions EUR in millions EUR in millions
Money-market issues 33,963 25,278 8,685
Bonds and notes 370,034 360,245 9,789
Total 403,997 385,523 18,475
(56) Value adjustments from macro fair value hedge accounting
31 Dec. 2014 31 Dec. 2013 Change
EUR in millions EUR in millions EUR in millions
Value adjustments to liabilities under macro fair value hedge accounting 159 219 –60
The fair values attributable to hedged risks in the hedged portfolios in the other liabilities category are included in this item.
KfW Financial Information 2014 Consolidated financial statements | Notes to the statement of financial position 98
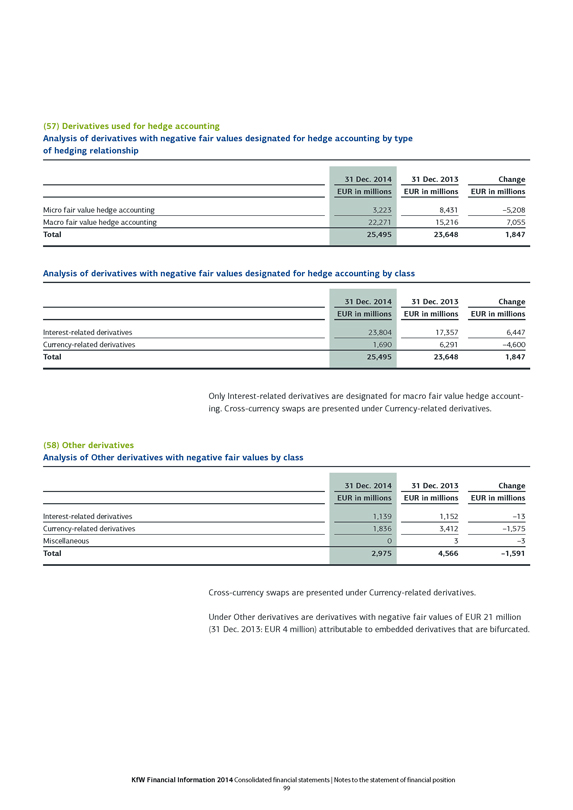
(57) Derivatives used for hedge accounting
Analysis of derivatives with negative fair values designated for hedge accounting by type of hedging relationship
31 Dec. 2014 31 Dec. 2013 Change
EUR in millions EUR in millions EUR in millions
Micro fair value hedge accounting 3,223 8,431 –5,208
Macro fair value hedge accounting 22,271 15,216 7,055
Total 25,495 23,648 1,847
Analysis of derivatives with negative fair values designated for hedge accounting by class
31 Dec. 2014 31 Dec. 2013 Change
EUR in millions EUR in millions EUR in millions
Interest-related derivatives 23,804 17,357 6,447
Currency-related derivatives 1,690 6,291 –4,600
Total 25,495 23,648 1,847
Only Interest-related derivatives are designated for macro fair value hedge accounting. Cross-currency swaps are presented under Currency-related derivatives.
(58) Other derivatives
Analysis of Other derivatives with negative fair values by class
31 Dec. 2014 31 Dec. 2013 Change
EUR in millions EUR in millions EUR in millions
Interest-related derivatives 1,139 1,152 –13
Currency-related derivatives 1,836 3,412 –1,575
Miscellaneous 0 3 –3
Total 2,975 4,566 –1,591
Cross-currency swaps are presented under Currency-related derivatives.
Under Other derivatives are derivatives with negative fair values of EUR 21 million (31 Dec. 2013: EUR 4 million) attributable to embedded derivatives that are bifurcated.
KfW Financial Information 2014 Consolidated financial statements | Notes to the statement of financial position 99
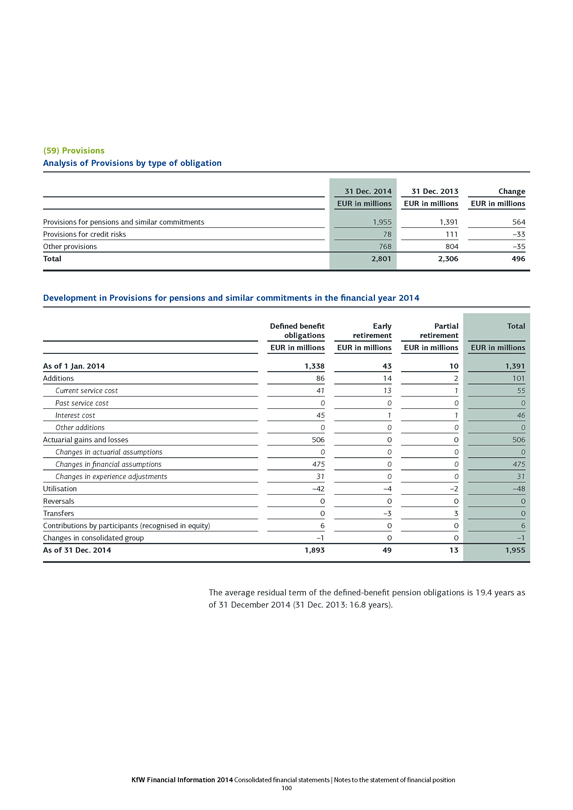
(59) Provisions
Analysis of Provisions by type of obligation
31 Dec. 2014 31 Dec. 2013 Change
EUR in millions EUR in millions EUR in millions
Provisions for pensions and similar commitments 1,955 1,391 564
Provisions for credit risks 78 111 –33
Other provisions 768 804 –35
Total 2,801 2,306 496
Development in Provisions for pensions and similar commitments in the financial year 2014
Defined benefit obligations Early retirement Partial retirement Total
EUR in millions EUR in millions EUR in millions EUR in millions
As of 1 Jan. 2014 1,338 43 10 1,391
Additions 86 14 2 101
Current service cost 41 13 1 55
Past service cost 0 0 0 0
Interest cost 45 1 1 46
Other additions 0 0 0 0
Actuarial gains and losses 506 0 0 506
Changes in actuarial assumptions 0 0 0 0
Changes in financial assumptions 475 0 0 475
Changes in experience adjustments 31 0 0 31
Utilisation –42 –4 –2 –48
Reversals 0 0 0 0
Transfers 0 –3 3 0
Contributions by participants (recognised in equity) 6 0 0 6
Changes in consolidated group –1 0 0 –1
As of 31 Dec. 2014 1,893 49 13 1,955
The average residual term of the defined-benefit pension obligations is 19.4 years as of 31 December 2014 (31 Dec. 2013: 16.8 years).
KfW Financial Information 2014 Consolidated financial statements | Notes to the statement of financial position
100

Development in Provisions for pensions and similar commitments in the financial year 2013
Defined benefit obligations Early retirement Partial retirement Total
EUR in millions EUR in millions EUR in millions EUR in millions
As of 1 Jan. 2013 1,244 53 12 1,309
Additions 84 1 0 85
Current service cost 40 1 0 41
Past service cost 0 0 0 0
Interest cost 43 0 0 43
Other additions 0 1 0 1
Actuarial gains and losses 42 0 0 42
Changes in actuarial assumptions –6 0 0 –6
Changes in financial assumptions 46 0 0 46
Changes in experience adjustments 2 0 0 2
Utilisation –38 –4 –1 –43
Reversals 0 –3 –4 –7
Transfers 0 –4 3 –1
Contributions by participants (recognised in equity) 6 0 0 6
Changes in consolidated group 0 0 0 0
As of 31 Dec. 2013 1,338 43 10 1,391
Provisions for pensions and similar commitments are calculated on the basis of the 2005 G Heubeck actuarial tables and the following other actuarial assumptions:
Actuarial assumptions in % p. a.
31 Dec. 2014 31 Dec. 2013
Technical discount rate 1.75 3.30
Rate of salary increases 3.00 3.00
Rate of pension increases 2.50 2.50
Rate of staff turnover 1.60 1.60
KfW Financial Information 2014 Consolidated financial statements | Notes to the statement of financial position
101
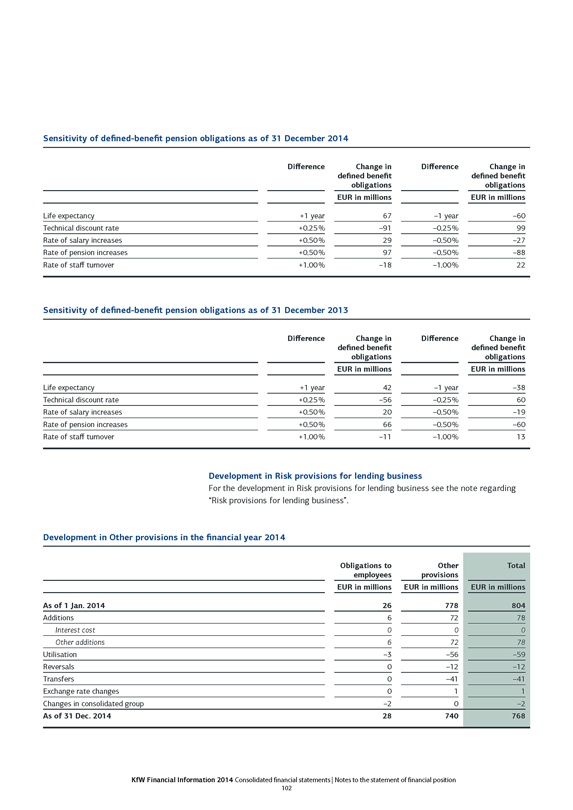
Sensitivity of defined-benefit pension obligations as of 31 December 2014
Difference Change in defined benefit obligations Difference Change in defined benefit obligations
EUR in millions EUR in millions
Life expectancy +1 year 67 –1 year –60
Technical discount rate +0.25% –91 –0.25% 99
Rate of salary increases +0.50% 29 –0.50% –27
Rate of pension increases +0.50% 97 –0.50% –88
Rate of staff turnover +1.00% –18 –1.00% 22
Sensitivity of defined-benefit pension obligations as of 31 December 2013
Difference Change in defined benefit obligations Difference Change in defined benefit obligations
EUR in millions EUR in millions
Life expectancy +1 year 42 –1 year –38
Technical discount rate +0.25% –56 –0.25% 60
Rate of salary increases +0.50% 20 –0.50% –19
Rate of pension increases +0.50% 66 –0.50% –60
Rate of staff turnover +1.00% –11 –1.00% 13
Development in Risk provisions for lending business
For the development in Risk provisions for lending business see the note regarding “Risk provisions for lending business”.
Development in Other provisions in the financial year 2014
Obligations to employees Other provisions Total
EUR in millions EUR in millions EUR in millions
As of 1 Jan. 2014 26 778 804
Additions 6 72 78
Interest cost 0 0 0
Other additions 6 72 78
Utilisation –3 –56 –59
Reversals 0 –12 –12
Transfers 0 –41 –41
Exchange rate changes 0 1 1
Changes in consolidated group –2 0 –2
As of 31 Dec. 2014 28 740 768
KfW Financial Information 2014 Consolidated financial statements | Notes to the statement of financial position
102
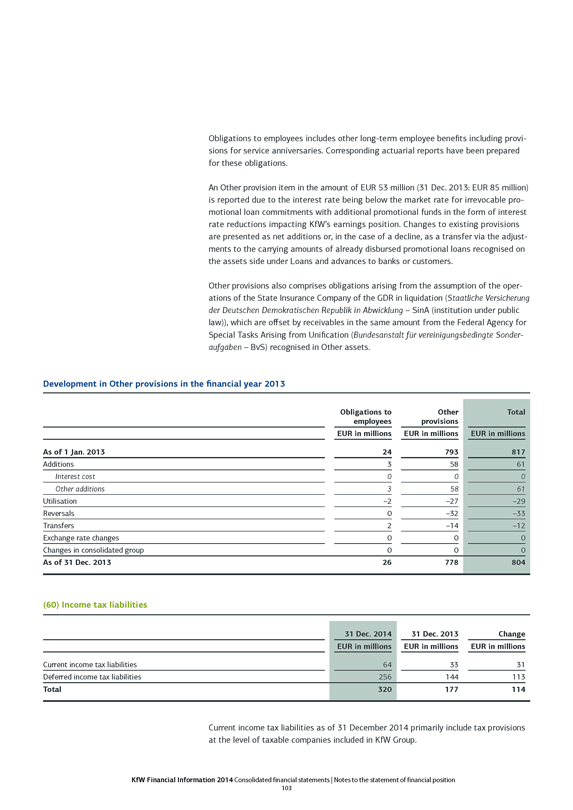
Obligations to employees includes other long-term employee benefits including provisions for service anniversaries. Corresponding actuarial reports have been prepared for these obligations.
An Other provision item in the amount of EUR 53 million (31 Dec. 2013: EUR 85 million) is reported due to the interest rate being below the market rate for irrevocable promotional loan commitments with additional promotional funds in the form of interest rate reductions impacting KfW’s earnings position. Changes to existing provisions are presented as net additions or, in the case of a decline, as a transfer via the adjustments to the carrying amounts of already disbursed promotional loans recognised on the assets side under Loans and advances to banks or customers.
Other provisions also comprises obligations arising from the assumption of the operations of the State Insurance Company of the GDR in liquidation (Staatliche Versicherung der Deutschen Demokratischen Republik in Abwicklung – SinA (institution under public law)), which are offset by receivables in the same amount from the Federal Agency for Special Tasks Arising from Unification (Bundesanstalt für vereinigungsbedingte Sonder-aufgaben – BvS) recognised in Other assets.
Development in Other provisions in the financial year 2013
Obligations to employees Other provisions Total
EUR in millions EUR in millions EUR in millions
As of 1 Jan. 2013 24 793 817
Additions 3 58 61
Interest cost 0 0 0
Other additions 3 58 61
Utilisation –2 –27 –29
Reversals 0 –32 –33
Transfers 2 –14 –12
Exchange rate changes 0 0 0
Changes in consolidated group 0 0 0
As of 31 Dec. 2013 26 778 804
(60) Income tax liabilities
31 Dec. 2014 31 Dec. 2013 Change
EUR in millions EUR in millions EUR in millions
Current income tax liabilities 64 33 31
Deferred income tax liabilities 256 144 113
Total 320 177 114
Current income tax liabilities as of 31 December 2014 primarily include tax provisions at the level of taxable companies included in KfW Group.
KfW Financial Information 2014 Consolidated financial statements | Notes to the statement of financial position
103
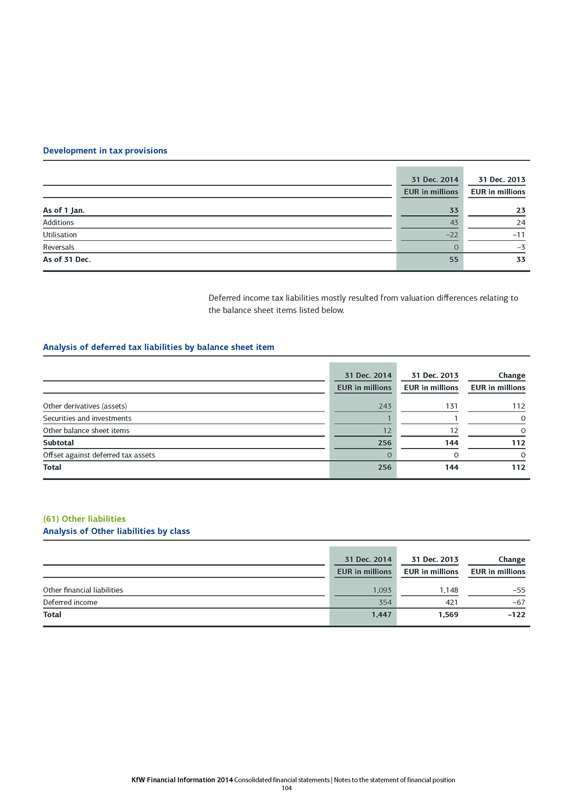
Development in tax provisions
31 Dec. 2014 31 Dec. 2013
EUR in millions EUR in millions
As of 1 Jan. 33 23
Additions 43 24
Utilisation –22 –11
Reversals 0 –3
As of 31 Dec. 55 33
Deferred income tax liabilities mostly resulted from valuation differences relating to the balance sheet items listed below.
Analysis of deferred tax liabilities by balance sheet item
31 Dec. 2014 31 Dec. 2013 Change
EUR in millions EUR in millions EUR in millions
Other derivatives (assets) 243 131 112
Securities and investments 1 1 0
Other balance sheet items 12 12 0
Subtotal 256 144 112
Offset against deferred tax assets 0 0 0
Total 256 144 112
(61) Other liabilities
Analysis of Other liabilities by class
31 Dec. 2014 31 Dec. 2013 Change
EUR in millions EUR in millions EUR in millions
Other financial liabilities 1,093 1,148 –55
Deferred income 354 421 –67
Total 1,447 1,569 –122
KfW Financial Information 2014 Consolidated financial statements | Notes to the statement of financial position
104
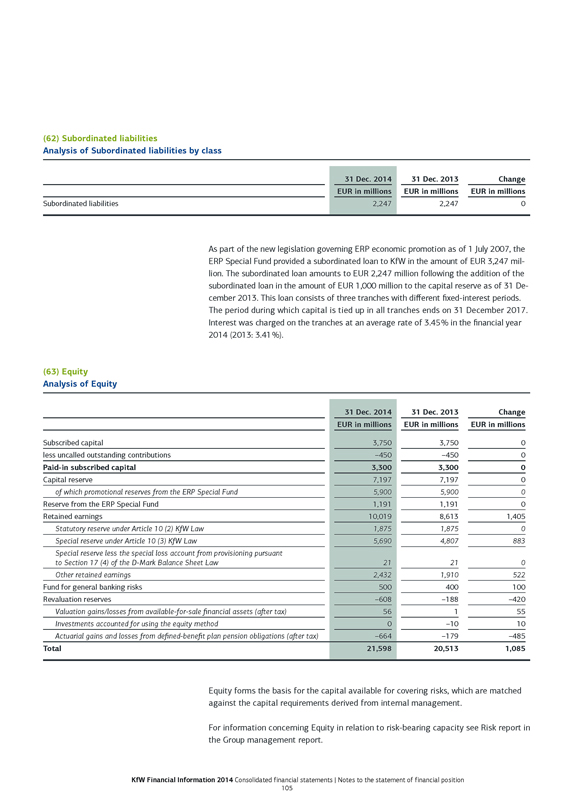
(62) Subordinated liabilities
Analysis of Subordinated liabilities by class
31 Dec. 2014 31 Dec. 2013 Change
EUR in millions EUR in millions EUR in millions
Subordinated liabilities 2,247 2,247 0
As part of the new legislation governing ERP economic promotion as of 1 July 2007, the ERP Special Fund provided a subordinated loan to KfW in the amount of EUR 3,247 million. The subordinated loan amounts to EUR 2,247 million following the addition of the subordinated loan in the amount of EUR 1,000 million to the capital reserve as of 31 December 2013. This loan consists of three tranches with different fixed-interest periods. The period during which capital is tied up in all tranches ends on 31 December 2017. Interest was charged on the tranches at an average rate of 3.45 % in the financial year 2014 (2013: 3.41 %).
(63) Equity Analysis of Equity
31 Dec. 2014 31 Dec. 2013 Change
EUR in millions EUR in millions EUR in millions
Subscribed capital 3,750 3,750 0
less uncalled outstanding contributions –450 –450 0
Paid-in subscribed capital 3,300 3,300 0
Capital reserve 7,197 7,197 0
of which promotional reserves from the ERP Special Fund 5,900 5,900 0
Reserve from the ERP Special Fund 1,191 1,191 0
Retained earnings 10,019 8,613 1,405
Statutory reserve under Article 10 (2) KfW Law 1,875 1,875 0
Special reserve under Article 10 (3) KfW Law 5,690 4,807 883
Special reserve less the special loss account from provisioning pursuant to Section 17 (4) of the D-Mark Balance Sheet Law 21 21 0
Other retained earnings 2,432 1,910 522
Fund for general banking risks 500 400 100
Revaluation reserves –608 –188 –420
Valuation gains/losses from available-for-sale financial assets (after tax) 56 1 55
Investments accounted for using the equity method 0 –10 10
Actuarial gains and losses from defined-benefit plan pension obligations (after tax) –664 –179 –485
Total 21,598 20,513 1,085
Equity forms the basis for the capital available for covering risks, which are matched against the capital requirements derived from internal management.
For information concerning Equity in relation to risk-bearing capacity see Risk report in the Group management report.
KfW Financial Information 2014 Consolidated financial statements | Notes to the statement of financial position
105
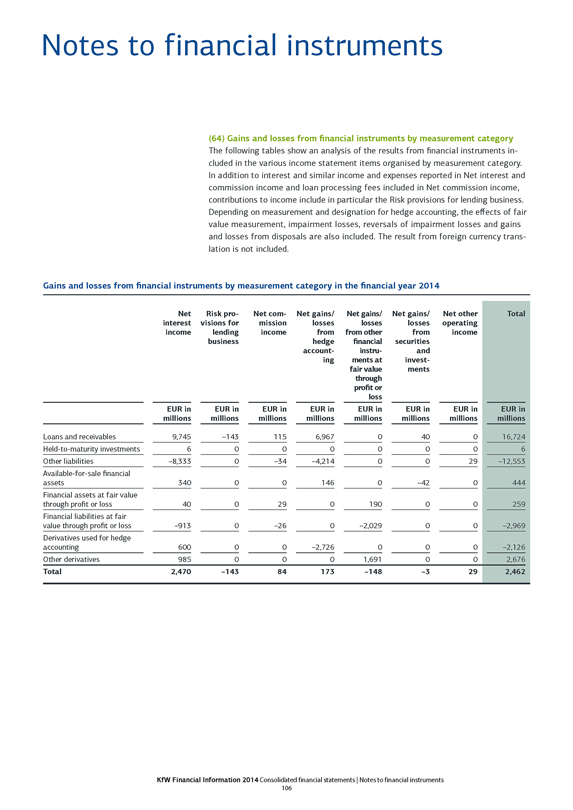
Notes to financial instruments
(64) Gains and losses from financial instruments by measurement category
The following tables show an analysis of the results from financial instruments included in the various income statement items organised by measurement category. In addition to interest and similar income and expenses reported in Net interest and commission income and loan processing fees included in Net commission income, contributions to income include in particular the Risk provisions for lending business. Depending on measurement and designation for hedge accounting, the effects of fair value measurement, impairment losses, reversals of impairment losses and gains and losses from disposals are also included. The result from foreign currency translation is not included.
Gains and losses from financial instruments by measurement category in the financial year 2014
Net interest income
Risk provisions for lending business
Net commission income
Net gains/losses from hedge accounting
Net gains/losses from other financial instruments at fair value through profit or loss
Net gains/losses from securities and investments
Net other operating income
Total
EUR in millions
EUR in millions
EUR in millions
EUR in millions
EUR in millions
EUR in millions
EUR in millions
EUR in millions
Loans and receivables 9,745 –143 115 6,967 0 40 0 16,724
Held-to-maturity investments 6 0 0 0 0 0 0 6
Other liabilities –8,333 0 –34 –4,214 0 0 29 –12,553
Available-for-sale financial assets 340 0 0 146 0 –42 0 444
Financial assets at fair value through profit or loss 40 0 29 0 190 0 0 259
Financial liabilities at fair value through profit or loss –913 0 –26 0 –2,029 0 0 –2,969
Derivatives used for hedge accounting 600 0 0 –2,726 0 0 0 –2,126
Other derivatives 985 0 0 0 1,691 0 0 2,676
Total 2,470 –143 84 173 –148 –3 29 2,462
KfW Financial Information 2014 Consolidated financial statements | Notes to financial instruments
106
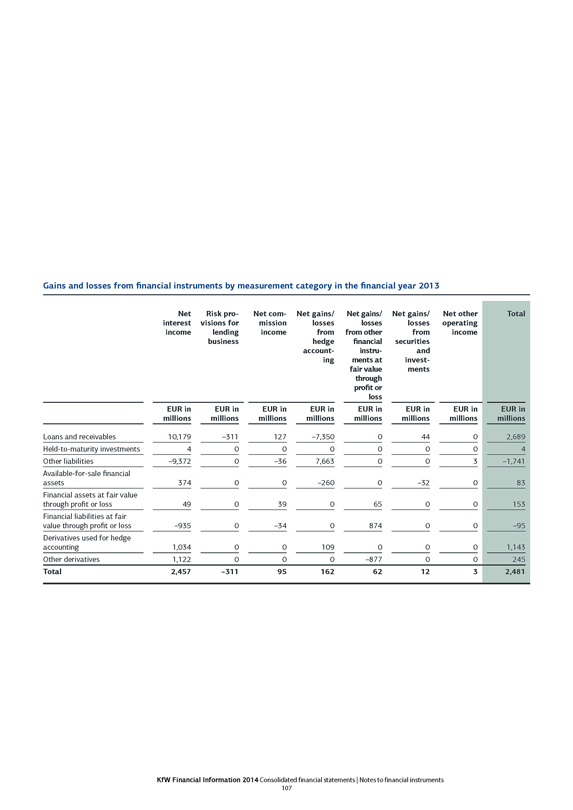
Gains and losses from financial instruments by measurement category in the financial year 2013
Net interest income
Risk provisions for lending business
Net commission income
Net gains/losses from hedge accounting
Net gains/losses from other financial instruments at fair value through profit or loss
Net gains/losses from securities and investments
Net other operating income
Total
EUR in millions EUR in millions EUR in millions EUR in millions EUR in millions EUR in millions EUR in millions
EUR in millions
Loans and receivables 10,179 –311 127 –7,350 0 44 0 2,689
Held-to-maturity investments 4 0 0 0 0 0 0 4
Other liabilities –9,372 0 –36 7,663 0 0 3 –1,741
Available-for-sale financial assets 374 0 0 –260 0 –32 0 83
Financial assets at fair value through profit or loss 49 0 39 0 65 0 0 153
Financial liabilities at fair value through profit or loss –935 0 –34 0 874 0 0 –95
Derivatives used for hedge accounting 1,034
0
0
109
0
0
0
1,143
Other derivatives
1,122
0
0
0
–877
0
0
245
Total
2,457
–311
95
162
62
12
3
2,481
KfW Financial Information 2014 Consolidated financial statements | Notes to financial instruments
107
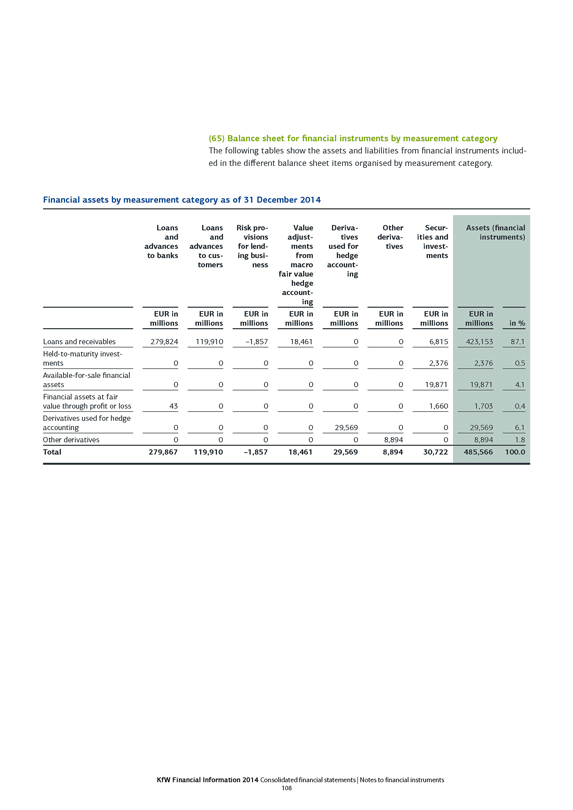
(65) Balance sheet for financial instruments by measurement category
The following tables show the assets and liabilities from financial instruments included in the different balance sheet items organised by measurement category.
Financial assets by measurement category as of 31 December 2014
Loans and advances to banks
Loans and advances to customers
Risk provisions for lending business
Value adjustments from macro fair value hedge accounting
Derivatives used for hedge accounting
Other derivatives
Securities and investments
Assets (financial instruments)
EUR in millions EUR in millions EUR in millions EUR in millions EUR in millions EUR in millions EUR in millions
EUR in millions in %
Loans and receivables 279,824 119,910 –1,857 18,461 0 0 6,815 423,153 87.1
Held-to-maturity investments 0 0 0 0 0 0 2,376 2,376 0.5
Available-for-sale financial assets 0 0 0 0 0 0 19,871 19,871 4.1
Financial assets at fair value through profit or loss 43 0 0 0 0 0 1,660 1,703 0.4
Derivatives used for hedge accounting 0 0 0 0 29,569 0 0 29,569 6.1
Other derivatives 0 0 0 0 0 8,894 0 8,894 1.8
Total 279,867 119,910 –1,857 18,461 29,569 8,894 30,722 485,566 100.0
KfW Financial Information 2014 Consolidated financial statements | Notes to financial instruments
108
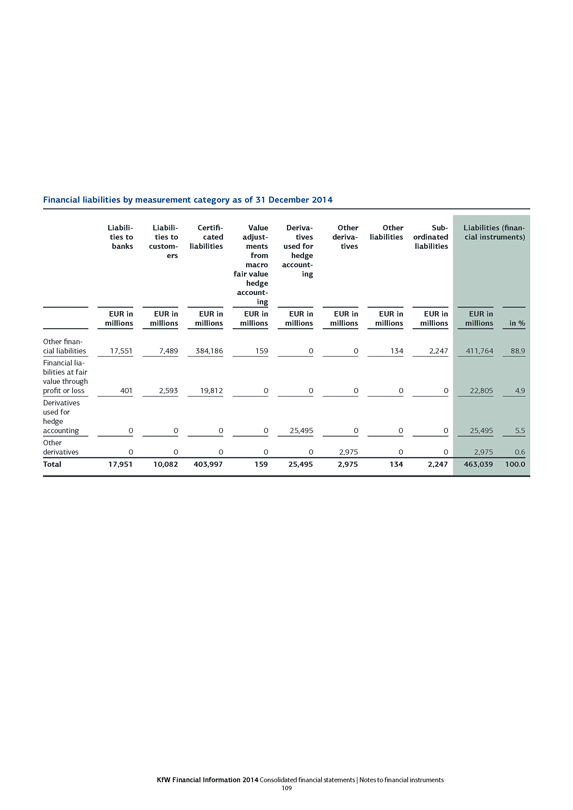
Financial liabilities by measurement category as of 31 December 2014
Liabilities to banks
Liabilities to customers
Certificated liabilities
Value adjustments from macro fair value hedge accounting
Derivatives used for hedge accounting
Other derivatives
Other liabilities
Subordinated liabilities
Liabilities (financial instruments)
EUR in millions EUR in millions EUR in millions EUR in millions EUR in millions EUR in millions EUR in millions
EUR in millions EUR in millions in %
Other financial liabilities
17,551
7,489
384,186
159
0
0
134
2,247
411,764
88.9
Financial liabilities at fair value through profit or loss
401
2,593
19,812
0
0
0
0
0
22,805
4.9
Derivatives used for hedge accounting
0
0
0
0
25,495
0
0
0
25,495
5.5
Other derivatives
0
0
0
0
0
2,975
0
0
2,975
0.6
Total
17,951
10,082
403,997
159
25,495
2,975
134
2,247
463,039
100.0
KfW Financial Information 2014 Consolidated financial statements | Notes to financial instruments
109
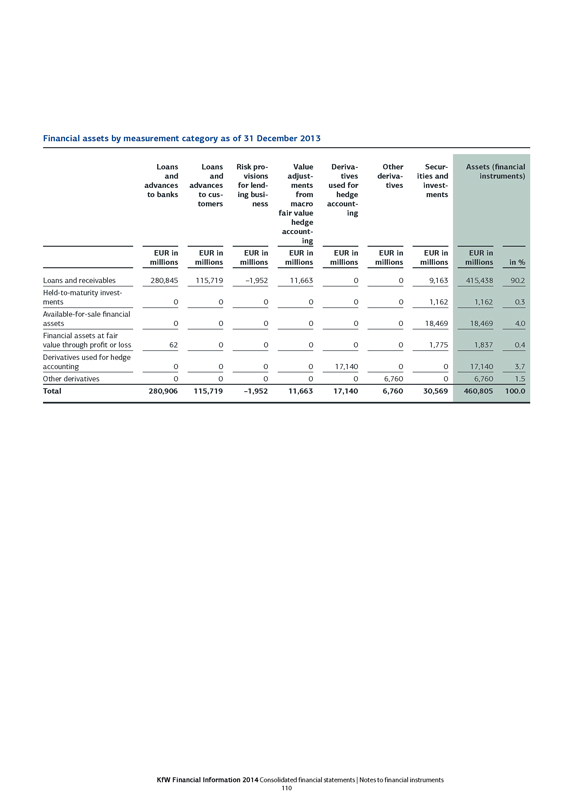
Financial assets by measurement category as of 31 December 2013
Loans and advances to banks
Loans and advances to customers
Risk provisions for lending business
Value adjustments from macro fair value hedge accounting
Derivatives used for hedge accounting
Other derivatives
Securities and investments
Assets (financial instruments)
EUR in millions EUR in millions EUR in millions EUR in millions EUR in millions EUR in millions EUR in millions
EUR in millions in %
Loans and receivables
280,845
115,719
–1,952
11,663
0
0
9,163
415,438
90.2
Held-to-maturity investments
0
0
0
0
0
0
1,162
1,162
0.3
Available-for-sale financial assets
0
0
0
0
0
0
18,469
18,469
4.0
Financial assets at fair value through profit or loss
62
0
0
0
0
0
1,775
1,837
0.4
Derivatives used for hedge accounting
0
0
0
0
17,140
0
0
17,140
3.7
Other derivatives
0
0
0
0
0
6,760
0
6,760
1.5
Total
280,906
115,719
–1,952
11,663
17,140
6,760
30,569
460,805
100.0
KfW Financial Information 2014 Consolidated financial statements | Notes to financial instruments
110
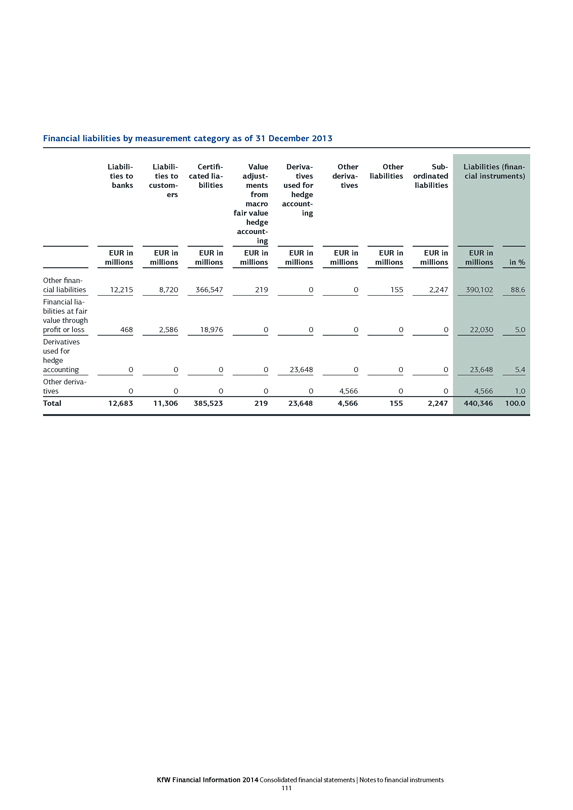
Financial liabilities by measurement category as of 31 December 2013
Liabilities to banks
Liabilities to customers
Certificated liabilities
Value adjustments from macro fair value hedge accounting
Derivatives used for hedge accounting
Other derivatives
Other liabilities
Subordinated liabilities
Liabilities (financial instruments)
EUR in millions EUR in millions EUR in millions EUR in millions EUR in millions EUR in millions EUR in millions
EUR in millions EUR in millions in %
Other financial liabilities
12,215
8,720
366,547
219
0
0
155
2,247
390,102
88.6
Financial liabilities at fair value through profit or loss
468
2,586
18,976
0
0
0
0
0
22,030
5.0
Derivatives used for hedge accounting
0
0
0
0
23,648
0
0
0
23,648
5.4
Other derivatives
0
0
0
0
0
4,566
0
0
4,566
1.0
Total
12,683
11,306
385,523
219
23,648
4,566
155
2,247
440,346
100.0
KfW Financial Information 2014 Consolidated financial statements | Notes to financial instruments
111
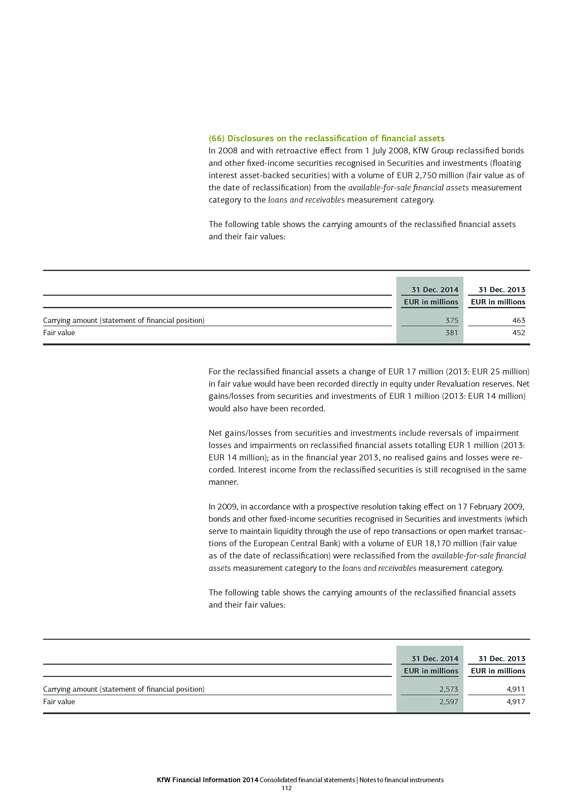
(66) Disclosures on the reclassification of financial assets
In 2008 and with retroactive effect from 1 July 2008, KfW Group reclassified bonds and other fixed-income securities recognised in Securities and investments (floating interest asset-backed securities) with a volume of EUR 2,750 million (fair value as of the date of reclassification) from the available-for-sale financial assets measurement category to the loans and receivables measurement category.
The following table shows the carrying amounts of the reclassified financial assets and their fair values:
31 Dec. 2014 31 Dec. 2013
EUR in millions EUR in millions
Carrying amount (statement of financial position)
375
463
Fair value
381
452
For the reclassified financial assets a change of EUR 17 million (2013: EUR 25 million) in fair value would have been recorded directly in equity under Revaluation reserves. Net gains/losses from securities and investments of EUR 1 million (2013: EUR 14 million) would also have been recorded.
Net gains/losses from securities and investments include reversals of impairment losses and impairments on reclassified financial assets totalling EUR 1 million (2013: EUR 14 million); as in the financial year 2013, no realised gains and losses were recorded. Interest income from the reclassified securities is still recognised in the same manner.
In 2009, in accordance with a prospective resolution taking effect on 17 February 2009, bonds and other fixed-income securities recognised in Securities and investments (which serve to maintain liquidity through the use of repo transactions or open market transactions of the European Central Bank) with a volume of EUR 18,170 million (fair value as of the date of reclassification) were reclassified from the available-for-sale financial assets measurement category to the loans and receivables measurement category.
The following table shows the carrying amounts of the reclassified financial assets and their fair values:
31 Dec. 2014 31 Dec. 2013
EUR in millions EUR in millions
Carrying amount (statement of financial position)
2,573
4,911
Fair value
2,597
4,917
KfW Financial Information 2014 Consolidated financial statements | Notes to financial instruments
112
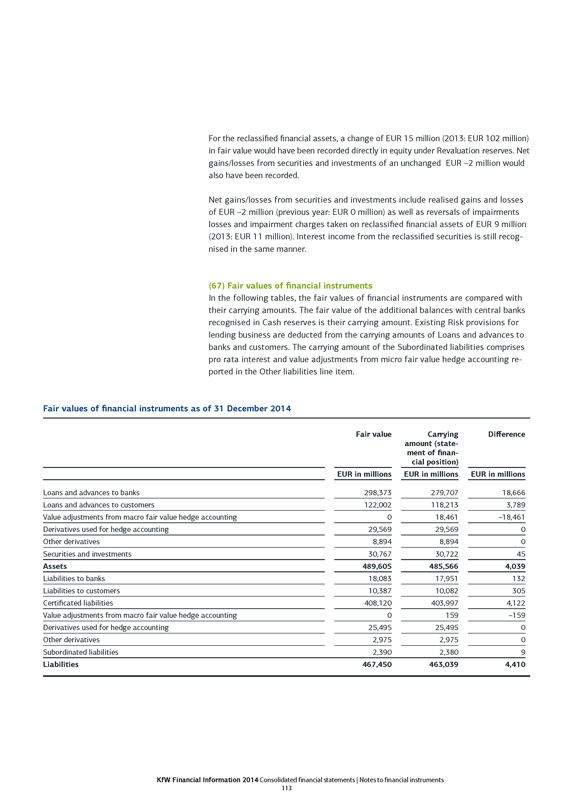
For the reclassified financial assets, a change of EUR 15 million (2013: EUR 102 million) in fair value would have been recorded directly in equity under Revaluation reserves. Net gains/losses from securities and investments of an unchanged EUR –2 million would also have been recorded.
Net gains/losses from securities and investments include realised gains and losses of EUR –2 million (previous year: EUR 0 million) as well as reversals of impairments losses and impairment charges taken on reclassified financial assets of EUR 9 million (2013: EUR 11 million). Interest income from the reclassified securities is still recognised in the same manner.
(67) Fair values of financial instruments
In the following tables, the fair values of financial instruments are compared with their carrying amounts. The fair value of the additional balances with central banks recognised in Cash reserves is their carrying amount. Existing Risk provisions for lending business are deducted from the carrying amounts of Loans and advances to banks and customers. The carrying amount of the Subordinated liabilities comprises pro rata interest and value adjustments from micro fair value hedge accounting reported in the Other liabilities line item.
Fair values of financial instruments as of 31 December 2014
Fair value
Carrying amount (statement of financial position)
Difference
EUR in millions EUR in millions EUR in millions
Loans and advances to banks
298,373
279,707
18,666
Loans and advances to customers
122,002
118,213
3,789
Value adjustments from macro fair value hedge accounting
0
18,461
–18,461
Derivatives used for hedge accounting
29,569
29,569
0
Other derivatives
8,894
8,894
0
Securities and investments
30,767
30,722
45
Assets
489,605
485,566
4,039
Liabilities to banks
18,083
17,951
132
Liabilities to customers
10,387
10,082
305
Certificated liabilities
408,120
403,997
4,122
Value adjustments from macro fair value hedge accounting
0
159
–159
Derivatives used for hedge accounting
25,495
25,495
0
Other derivatives
2,975
2,975
0
Subordinated liabilities
2,390
2,380
9
Liabilities
467,450
463,039
4,410
KfW Financial Information 2014 Consolidated financial statements | Notes to financial instruments
113
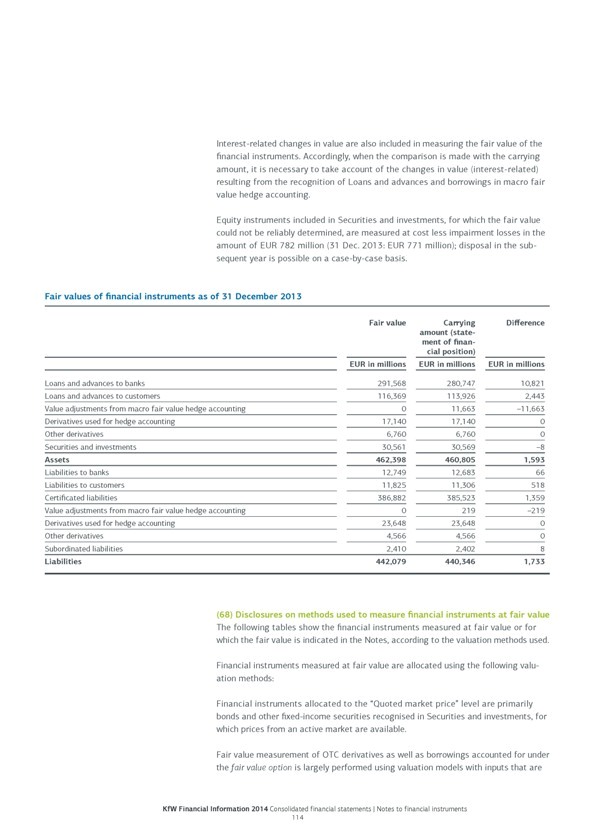
Interest-related changes in value are also included in measuring the fair value of the financial instruments. Accordingly, when the comparison is made with the carrying amount, it is necessary to take account of the changes in value (interest-related) resulting from the recognition of Loans and advances and borrowings in macro fair value hedge accounting.
Equity instruments included in Securities and investments, for which the fair value could not be reliably determined, are measured at cost less impairment losses in the amount of EUR 782 million (31 Dec. 2013: EUR 771 million); disposal in the subsequent year is possible on a case-by-case basis.
Fair values of financial instruments as of 31 December 2013
Fair value
Carrying amount (statement of financial position)
Difference EUR in millions EUR in millions EUR in millions
Loans and advances to banks 291,568 280,747 10,821
Loans and advances to customers 116,369 113,926 2,443
Value adjustments from macro fair value hedge accounting 0 11,663 –11,663
Derivatives used for hedge accounting 17,140 17,140 0
Other derivatives 6,760 6,760 0
Securities and investments 30,561 30,569 –8
Assets 462,398 460,805 1,593
Liabilities to banks 12,749 12,683 66
Liabilities to customers 11,825 11,306 518
Certificated liabilities 386,882 385,523 1,359
Value adjustments from macro fair value hedge accounting 0 219 –219
Derivatives used for hedge accounting 23,648 23,648 0
Other derivatives 4,566 4,566 0
Subordinated liabilities 2,410 2,402 8
Liabilities 442,079 440,346 1,733
(68) Disclosures on methods used to measure financial instruments at fair value
The following tables show the financial instruments measured at fair value or for which the fair value is indicated in the Notes, according to the valuation methods used.
Financial instruments measured at fair value are allocated using the following valuation methods:
Financial instruments allocated to the “Quoted market price” level are primarily bonds and other fixed-income securities recognised in Securities and investments, for which prices from an active market are available.
Fair value measurement of OTC derivatives as well as borrowings accounted for under the fair value option is largely performed using valuation models with inputs that are
KfW Financial Information 2014 Consolidated financial statements | Notes to financial instruments
114
observable on the market and are also usually the only relevant inputs, resulting in allocation to the “Valuation method based on observable market data (model)” level.
The “Valuation method based in part on market unobservable data” level largely comprises derivatives recognised in Other derivatives with positive or negative fair values, which comprise a hedging instrument for clients with respect to export and project financing business, as well as Securities and investments from equity finance business recorded at fair value through profit or loss, which are not listed or for which prices cannot be derived from similar financial instruments listed on an exchange.
Equity instruments included in Securities and investments – available-for-sale, for which the fair value could not be reliably determined, are also allocated to the “Valuation method based in part on market unobservable data” level.
Financial instruments carried at amortised cost, for which the fair value is indicated in the Notes, are allocated to the valuation methods used as follows:
The lending business presented under Loans and advances to banks and Loans and advances to customers is allocated to “Valuation method based in part on market unobservable data”. The measurement of fair value using the discounted cash flow method is based to a significant extent on market unobservable data (expected loss, etc.).
The bonds and other fixed-income securities reported under Certificated liabilities are primarily allocated to the “Quoted market price” level. These include in particular KfW’s large volume and highly liquid benchmark bonds denominated in euros and US dollars.
In subsequent measurement at fair value in line with the applicable hierarchy, changes of valuation method used are deemed to have been made as of the end of the financial year, because no specific event (and therefore no specific date) can generally be identified as the cause of the change of valuation method used.
KfW Financial Information 2014 Consolidated financial statements | Notes to financial instruments
115

Financial assets measured at fair value or for which the fair value is indicated in the Notes, as of 31 December 2014
Quoted market price
Valuation method based on observable market data (model)
Valuation method based in part on market unobservable data
Total
EUR in millions EUR in millions EUR in millions EUR in millions
Financial assets measured at fair value
Loans and advances to banks - recorded at fair value through profit or loss 0 31 12 43
Derivatives used for hedge accounting 0 29,569 0 29,569
Other derivatives 0 8,056 838 8,894
Securities and investments - available for sale 18,336 751 783 19,871
Securities and investments - recorded at fair value through profit or loss 222 982 456 1,660
Subtotal of financial assets measured at fair value 18,557 39,389 2,090 60,037
Fair values of financial assets carried at amortised cost
Loans and advances to banks - loans and receivables 0 28,497 269,833 298,330
Loans and advances to customers - loans and receivables 0 3,328 118,674 122,002
Securities and investments - loans and receivables 2,983 3,743 131 6,857
Securities and investments - held-to-maturity investments 2,223 157 0 2,380
Subtotal of fair values of financial assets carried at amortised cost 5,205 35,726 388,638 429,569
Total 23,763 75,115 390,728 489,605
KfW Financial Information 2014 Consolidated financial statements | Notes to financial instruments 116
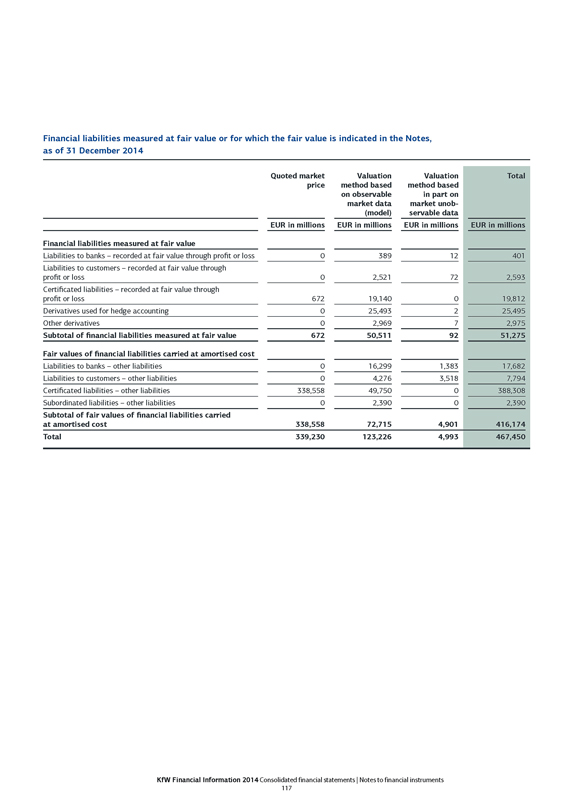
Financial liabilities measured at fair value or for which the fair value is indicated in the Notes, as of 31 December 2014
Quoted market price
Valuation method based on observable market data (model)
Valuation method based in part on market unobservable data
Total
EUR in millions EUR in millions EUR in millions EUR in millions
Financial liabilities measured at fair value
Liabilities to banks - recorded at fair value through profit or loss 0 389 12 401
Liabilities to customers - recorded at fair value through profit or loss 0 2,521 72 2,593
Certificated liabilities - recorded at fair value through profit or loss 672 19,140 0 19,812
Derivatives used for hedge accounting 0 25,493 2 25,495
Other derivatives 0 2,969 7 2,975
Subtotal of financial liabilities measured at fair value 672 50,511 92 51,275
Fair values of financial liabilities carried at amortised cost
Liabilities to banks - other liabilities 0 16,299 1,383 17,682
Liabilities to customers - other liabilities 0 4,276 3,518 7,794
Certificated liabilities - other liabilities 338,558 49,750 0 388,308
Subordinated liabilities - other liabilities 0 2,390 0 2,390
Subtotal of fair values of financial liabilities carried at amortised cost 338,558 72,715 4,901 416,174
Total 339,230 123,226 4,993 467,450
KfW Financial Information 2014 Consolidated financial statements | Notes to financial instruments 117
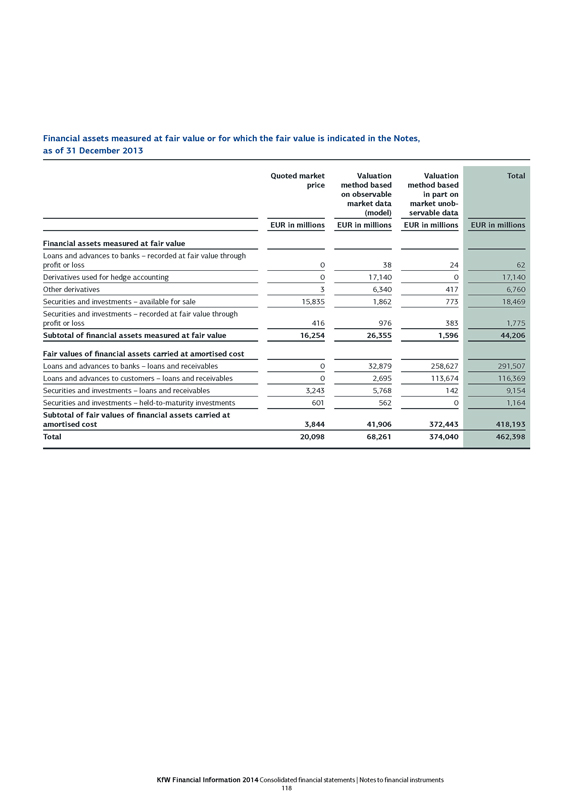
Financial assets measured at fair value or for which the fair value is indicated in the Notes, as of 31 December 2013
Quoted market price
Valuation method based on observable market data (model)
Valuation method based in part on market unobservable data
Total
EUR in millions EUR in millions EUR in millions EUR in millions
Financial assets measured at fair value
Loans and advances to banks - recorded at fair value through profit or loss 0 38 24 62
Derivatives used for hedge accounting 0 17,140 0 17,140
Other derivatives 3 6,340 417 6,760
Securities and investments - available for sale 15,835 1,862 773 18,469
Securities and investments - recorded at fair value through profit or loss 416 976 383 1,775
Subtotal of financial assets measured at fair value 16,254 26,355 1,596 44,206
Fair values of financial assets carried at amortised cost
Loans and advances to banks - loans and receivables 0 32,879 258,627 291,507
Loans and advances to customers - loans and receivables 0 2,695 113,674 116,369
Securities and investments - loans and receivables 3,243 5,768 142 9,154
Securities and investments - held-to-maturity investments 601 562 0 1,164
Subtotal of fair values of financial assets carried at amortised cost 3,844 41,906 372,443 418,193
Total 20,098 68,261 374,040 462,398
KfW Financial Information 2014 Consolidated financial statements | Notes to financial instruments 118

Financial liabilities measured at fair value or for which the fair value is indicated in the Notes, as of 31 December 2013
Quoted market price
Valuation method based on observable market data (model)
Valuation method based in part on market unobservable data
Total
EUR in millions EUR in millions EUR in millions EUR in millions
Financial liabilities measured at fair value
Liabilities to banks - recorded at fair value through profit or loss 0 444 24 468
Liabilities to customers - recorded at fair value through profit or loss 0 2,501 85 2,586
Certificated liabilities - recorded at fair value through profit or loss 234 18,742 0 18,976
Derivatives used for hedge accounting 0 23,644 4 23,648
Other derivatives 3 4,520 44 4,566
Subtotal of financial liabilities measured at fair value 236 49,851 156 50,244
Fair values of financial liabilities carried at amortised cost
Liabilities to banks - other liabilities 0 10,744 1,537 12,281
Liabilities to customers - other liabilities 0 5,486 3,752 9,238
Certificated liabilities - other liabilities 320,349 47,557 0 367,906
Subordinated liabilities - other liabilities 0 2,410 0 2,410
Subtotal of fair values of financial liabilities carried at amortised cost 320,349 66,196 5,289 391,835
Total 320,585 116,048 5,446 442,079
KfW Financial Information 2014 Consolidated financial statements | Notes to financial instruments 119
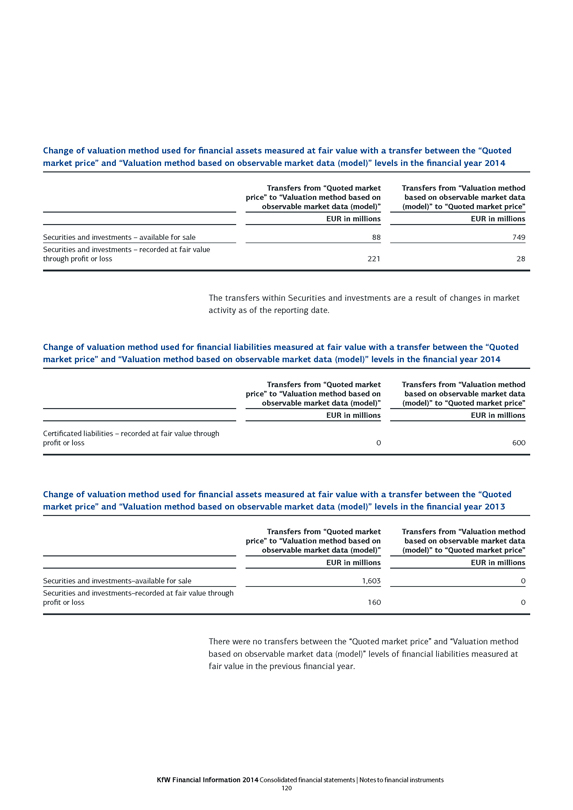
Change of valuation method used for financial assets measured at fair value with a transfer between the “Quoted market price” and “Valuation method based on observable market data (model)” levels in the financial year 2014
Transfers from “Quoted market price” to “Valuation method based on observable market data (model)”
Transfers from “Valuation method based on observable market data (model)” to “Quoted market price”
EUR in millions EUR in millions
Securities and investments - available for sale 88 749
Securities and investments - recorded at fair value through profit or loss 221 28
The transfers within Securities and investments are a result of changes in market activity as of the reporting date.
Change of valuation method used for financial liabilities measured at fair value with a transfer between the “Quoted market price” and “Valuation method based on observable market data (model)” levels in the financial year 2014
Transfers from “Quoted market price” to “Valuation method based on observable market data (model)”
Transfers from “Valuation method based on observable market data (model)” to “Quoted market price”
EUR in millions
EUR in millions
Certificated liabilities - recorded at fair value through profit or loss 0 600
Change of valuation method used for financial assets measured at fair value with a transfer between the “Quoted market price” and “Valuation method based on observable market data (model)” levels in the financial year 2013
Transfers from “Quoted market price” to “Valuation method based on observable market data (model)”
Transfers from “Valuation method based on observable market data (model)” to “Quoted market price”
EUR in millions EUR in millions
Securities and investments-available for sale 1,603 0
Securities and investments-recorded at fair value through profit or loss 160 0
There were no transfers between the “Quoted market price” and “Valuation method based on observable market data (model)” levels of financial liabilities measured at fair value in the previous financial year.
KfW Financial Information 2014 Consolidated financial statements | Notes to financial instruments 120
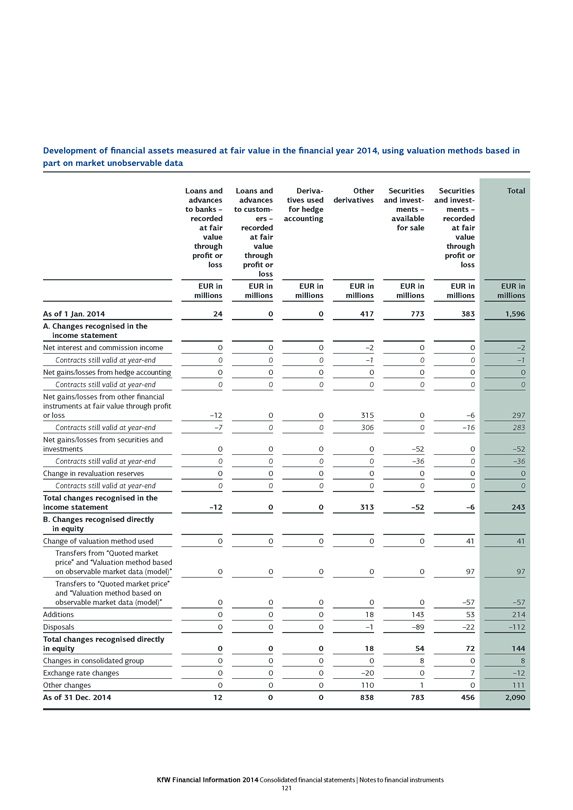
Development of financial assets measured at fair value in the financial year 2014, using valuation methods based in part on market unobservable data
Loans and advances to banks - recorded at fair value through profit or loss
Loans and advances to customers - recorded at fair value through profit or loss
Derivatives used for hedge accounting
Other derivatives Securities and investments - available for sale
Securities and investments - recorded at fair value through profit or loss
Total
EUR in millions EUR in millions EUR in millions EUR in millions EUR in millions EUR in millions EUR in millions
As of 1 Jan. 2014 24 0 0 417 773 383 1,596
A. Changes recognised in the income statement
Net interest and commission income 0 0 0 -2 0 0 -2
Contracts still valid at year-end 0 0 0 -1 0 0 -1
Net gains/losses from hedge accounting 0 0 0 0 0 0 0
Contracts still valid at year-end 0 0 0 0 0 0 0
Net gains/losses from other financial instruments at fair value through profit or loss -12 0 0 315 0 -6 297
Contracts still valid at year-end -7 0 0 306 0 -16 283
Net gains/losses from securities and investments 0 0 0 0 -52 0 -52
Contracts still valid at year-end 0 0 0 0 -36 0 -36
Change in revaluation reserves 0 0 0 0 0 0 0
Contracts still valid at year-end 0 0 0 0 0 0 0
Total changes recognised in the income statement -12 0 0 313 -52 -6 243
B. Changes recognised directly in equity
Change of valuation method used 0 0 0 0 0 41 41
Transfers from “Quoted market price” and “Valuation method based on observable market data (model)” 0 0 0 0 0 97 97
Transfers to “Quoted market price” and “Valuation method based on observable market data (model)” 0 0 0 0 0 -57 -57
Additions 0 0 0 18 143 53 214
Disposals 0 0 0 -1 -89 -22 -112
Total changes recognised directly in equity 0 0 0 18 54 72 144
Changes in consolidated group 0 0 0 0 8 0 8
Exchange rate changes 0 0 0 -20 0 7 -12
Other changes 0 0 0 110 1 0 111
As of 31 Dec. 2014 12 0 0 838 783 456 2,090
KfW Financial Information 2014 Consolidated financial statements | Notes to financial instruments 121
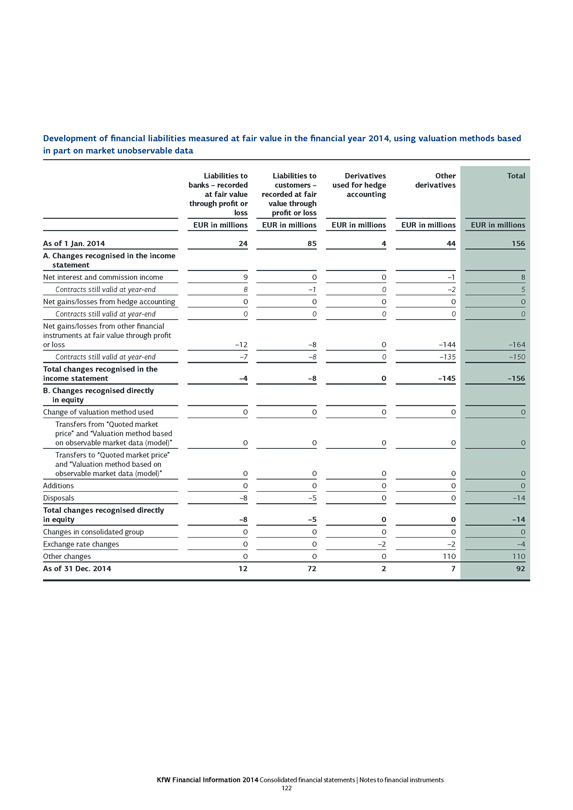
Development of financial liabilities measured at fair value in the financial year 2014, using valuation methods based in part on market unobservable data
Liabilities to banks - recorded at fair value through profit or loss
Liabilities to customers - recorded at fair value through profit or loss
Derivatives used for hedge accounting
Other derivatives
Total
EUR in millions EUR in millions EUR in millions EUR in millions EUR in millions
As of 1 Jan. 2014 24 85 4 44 156
A. Changes recognised in the income statement
Net interest and commission income 9 0 0 -1 8
Contracts still valid at year-end 8 -1 0 -2 5
Net gains/losses from hedge accounting 0 0 0 0 0
Contracts still valid at year-end 0 0 0 0 0
Net gains/losses from other financial instruments at fair value through profit or loss -12 -8 0 -144 -164
Contracts still valid at year-end -7 -8 0 -135 -150
Total changes recognised in the income statement -4 -8 0 -145 -156
B. Changes recognised directly in equity
Change of valuation method used 0 0 0 0 0
Transfers from “Quoted market price” and “Valuation method based on observable market data (model)” 0 0 0 0 0
Transfers to “Quoted market price” and “Valuation method based on observable market data (model)” 0 0 0 0 0
Additions 0 0 0 0 0
Disposals -8 -5 0 0 -14
Total changes recognised directly in equity -8 -5 0 0 -14
Changes in consolidated group 0 0 0 0 0
Exchange rate changes 0 0 -2 -2 -4
Other changes 0 0 0 110 110
As of 31 Dec. 2014 12 72 2 7 92
KfW Financial Information 2014 Consolidated financial statements | Notes to financial instruments 122
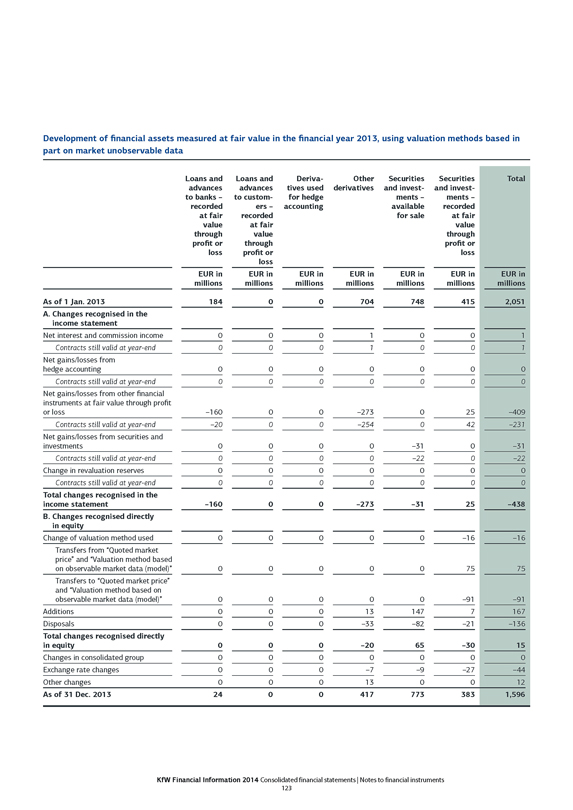
Development of financial assets measured at fair value in the financial year 2013, using valuation methods based in part on market unobservable data
Loans and advances to banks - recorded at fair value through profit or loss
Loans and advances to customers - recorded at fair value through profit or loss
Derivatives used for hedge accounting
Other derivatives
Securities and investments - available for sale
Securities and investments - recorded at fair value through profit or loss
Total
EUR in millions EUR in millions EUR in millions EUR in millions EUR in millions EUR in millions EUR in millions
As of 1 Jan. 2013 184 0 0 704 748 415 2,051
A. Changes recognised in the income statement
Net interest and commission income 0 0 0 1 0 0 1
Contracts still valid at year-end 0 0 0 1 0 0 1
Net gains/losses from hedge accounting 0 0 0 0 0 0 0
Contracts still valid at year-end 0 0 0 0 0 0 0
Net gains/losses from other financial instruments at fair value through profit or loss -160 0 0 -273 0 25 -409
Contracts still valid at year-end -20 0 0 -254 0 42 -231
Net gains/losses from securities and investments 0 0 0 0 -31 0 -31
Contracts still valid at year-end 0 0 0 0 -22 0 -22
Change in revaluation reserves 0 0 0 0 0 0 0
Contracts still valid at year-end 0 0 0 0 0 0 0
Total changes recognised in the income statement -160 0 0 -273 -31 25 -438
B. Changes recognised directly in equity
Change of valuation method used 0 0 0 0 0 -16 -16
Transfers from “Quoted market price” and “Valuation method based on observable market data (model)” 0 0 0 0 0 75 75
Transfers to “Quoted market price” and “Valuation method based on observable market data (model)” 0 0 0 0 0 -91 -91
Additions 0 0 0 13 147 7 167
Disposals 0 0 0 -33 -82 -21 -136
Total changes recognised directly in equity 0 0 0 -20 65 -30 15
Changes in consolidated group 0 0 0 0 0 0 0
Exchange rate changes 0 0 0 -7 -9 -27 -44
Other changes 0 0 0 13 0 0 12
As of 31 Dec. 2013 24 0 0 417 773 383 1,596
KfW Financial Information 2014 Consolidated financial statements | Notes to financial instruments 123
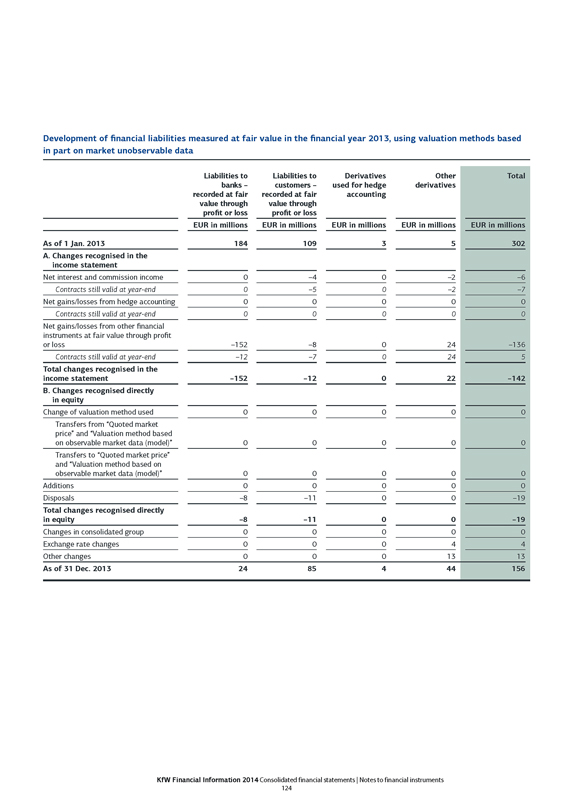
Development of financial liabilities measured at fair value in the financial year 2013, using valuation methods based in part on market unobservable data
Liabilities to banks - recorded at fair value through profit or loss
Liabilities to customers - recorded at fair value through profit or loss
Derivatives used for hedge accounting
Other derivatives
Total
EUR in millions EUR in millions EUR in millions EUR in millions EUR in millions
As of 1 Jan. 2013 184 109 3 5 302
A. Changes recognised in the income statement
Net interest and commission income 0 -4 0 -2 -6
Contracts still valid at year-end 0 -5 0 -2 -7
Net gains/losses from hedge accounting 0 0 0 0 0
Contracts still valid at year-end 0 0 0 0 0
Net gains/losses from other financial instruments at fair value through profit or loss -152 -8 0 24 -136
Contracts still valid at year-end -12 -7 0 24 5
Total changes recognised in the income statement -152 -12 0 22 -142
B. Changes recognised directly in equity
Change of valuation method used 0 0 0 0 0
Transfers from “Quoted market price” and “Valuation method based on observable market data (model)” 0 0 0 0 0
Transfers to “Quoted market price” and “Valuation method based on observable market data (model)” 0 0 0 0 0
Additions 0 0 0 0 0
Disposals -8 -11 0 0 -19
Total changes recognised directly in equity -8 -11 0 0 -19
Changes in consolidated group 0 0 0 0 0
Exchange rate changes 0 0 0 4 4
Other changes 0 0 0 13 13
As of 31 Dec. 2013 24 85 4 44 156
KfW Financial Information 2014 Consolidated financial statements | Notes to financial instruments 124
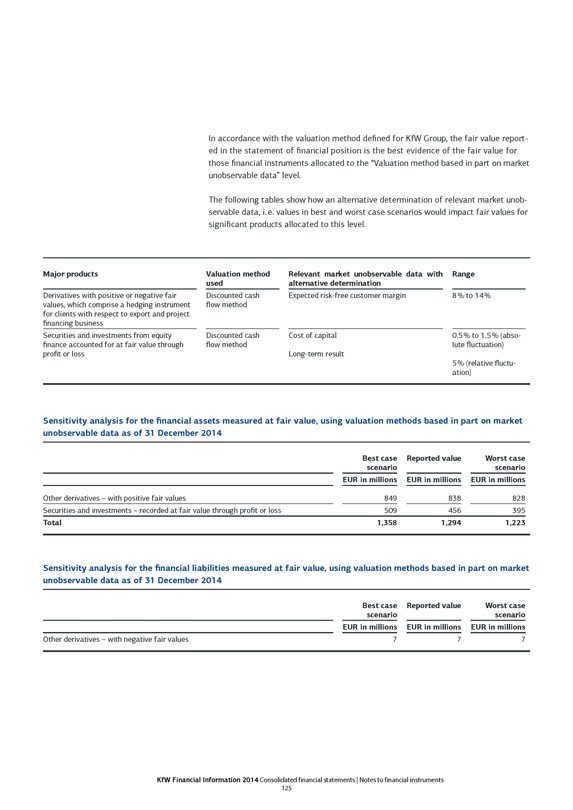
In accordance with the valuation method defined for KfW Group, the fair value reported in the statement of financial position is the best evidence of the fair value for those financial instruments allocated to the “Valuation method based in part on market unobservable data” level.
The following tables show how an alternative determination of relevant market unobservable data, i. e. values in best and worst case scenarios would impact fair values for significant products allocated to this level.
Major products
Valuation method used
Relevant market unobservable data with alternative determination
Range
Derivatives with positive or negative fair values, which comprise a hedging instrument for clients with respect to export and project financing business
Discounted cash flow method
Expected risk-free customer margin
8% to 14%
Securities and investments from equity finance accounted for at fair value through profit or loss
Discounted cash flow method
Cost of capital
Long-term result
0.5% to 1.5% (absolute fluctuation)
5% (relative fluctuation)
Sensitivity analysis for the financial assets measured at fair value, using valuation methods based in part on market unobservable data as of 31 December 2014
Best case scenario
Reported value
Worst case scenario
EUR in millions EUR in millions EUR in millions
Other derivatives - with positive fair values 849 838 828
Securities and investments - recorded at fair value through profit or loss 509 456 395
Total 1,358 1,294 1,223
Sensitivity analysis for the financial liabilities measured at fair value, using valuation methods based in part on market unobservable data as of 31 December 2014
Best case scenario
Reported value
Worst case scenario
EUR in millions
EUR in millions
EUR in millions
Other derivatives - with negative fair values 7 7 7
KfW Financial Information 2014 Consolidated financial statements | Notes to financial instruments 125
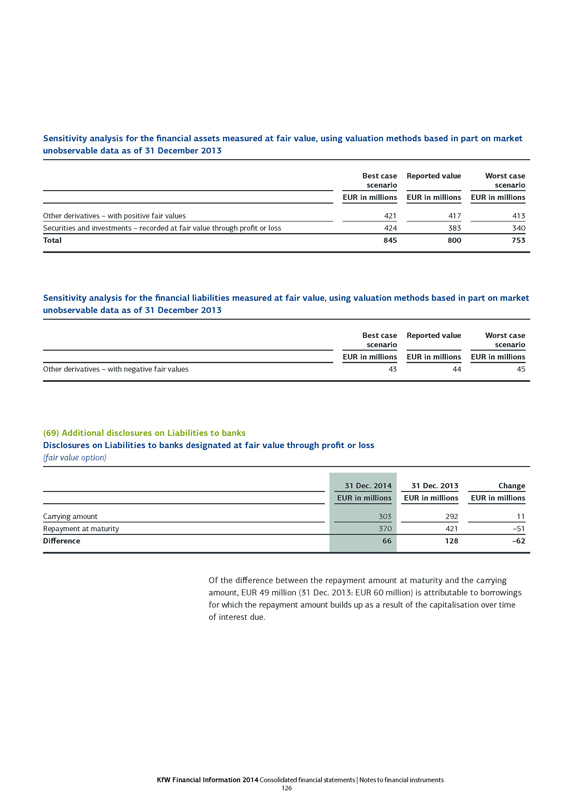
Sensitivity analysis for the financial assets measured at fair value, using valuation methods based in part on market unobservable data as of 31 December 2013
Best case scenario Reported value Worst case scenario EUR in millions EUR in millions EUR in millions
Other derivatives - with positive fair values 421 417 413
Securities and investments - recorded at fair value through profit or loss 424 383 340
Total 845 800 753
Sensitivity analysis for the financial liabilities measured at fair value, using valuation methods based in part on market unobservable data as of 31 December 2013
Best case scenario Reported value Worst case scenario EUR in millions EUR in millions EUR in millions
Other derivatives – with negative fair values 43 44 45
(69) Additional disclosures on Liabilities to banks
Disclosures on Liabilities to banks designated at fair value through profit or loss
(fair value option)
31 Dec. 2014 31 Dec. 2013 Change EUR in millions EUR in millions EUR in millions
Carrying amount 303 292 11
Repayment at maturity 370 421 -51
Difference 66 128 -62
Of the difference between the repayment amount at maturity and the carrying amount, EUR 49 million (31 Dec. 2013: EUR 60 million) is attributable to borrowings for which the repayment amount builds up as a result of the capitalisation over time of interest due.
KfW Financial Information 2014 Consolidated financial statements | Notes to financial instruments 126
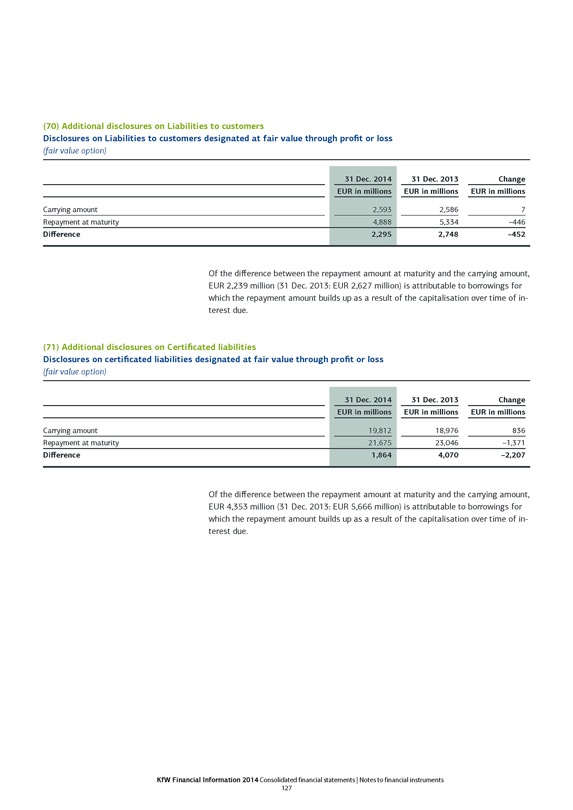
(70) Additional disclosures on Liabilities to customers
Disclosures on Liabilities to customers designated at fair value through profit or loss
(fair value option)
31 Dec. 2014 31 Dec. 2013 Change EUR in millions EUR in millions EUR in millions
Carrying amount 2,593 2,586 7
Repayment at maturity 4,888 5,334 -446
Difference 2,295 2,748 -452
Of the difference between the repayment amount at maturity and the carrying amount, EUR 2,239 million (31 Dec. 2013: EUR 2,627 million) is attributable to borrowings for which the repayment amount builds up as a result of the capitalisation over time of interest due.
(71) Additional disclosures on Certificated liabilities
Disclosures on certificated liabilities designated at fair value through profit or loss
(fair value option)
31 Dec. 2014 31 Dec. 2013 Change EUR in millions EUR in millions EUR in millions
Carrying amount 19,812 18,976 836
Repayment at maturity 21,675 23,046 -1,371
Difference 1,864 4,070 -2,207
Of the difference between the repayment amount at maturity and the carrying amount, EUR 4,353 million (31 Dec. 2013: EUR 5,666 million) is attributable to borrowings for which the repayment amount builds up as a result of the capitalisation over time of interest due.
KfW Financial Information 2014 Consolidated financial statements | Notes to financial instruments 127
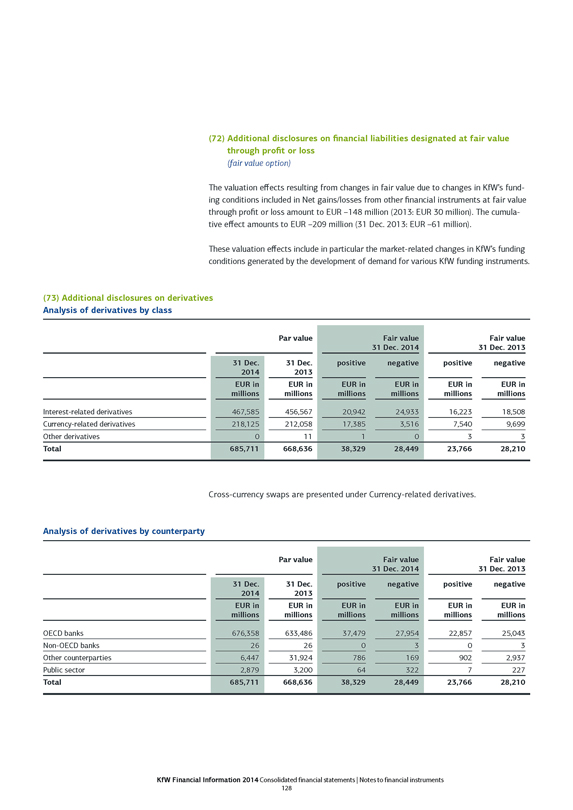
(72) Additional disclosures on financial liabilities designated at fair value through profit or loss
(fair value option)
The valuation effects resulting from changes in fair value due to changes in KfW’s funding conditions included in Net gains/losses from other financial instruments at fair value through profit or loss amount to EUR –148 million (2013: EUR 30 million). The cumulative effect amounts to EUR –209 million (31 Dec. 2013: EUR –61 million).
These valuation effects include in particular the market-related changes in KfW’s funding conditions generated by the development of demand for various KfW funding instruments.
(73) Additional disclosures on derivatives Analysis of derivatives by class
Par value Fair value Fair value 31 Dec. 2014 31 Dec. 2013 31 Dec. 2014 31 Dec. 2013 positive negative positive negative
EUR in millions EUR in millions EUR in millions EUR in millions EUR in millions EUR in millions
Interest-related derivatives 467,585 456,567 20,942 24,933 16,223 18,508
Currency-related derivatives 218,125 212,058 17,385 3,516 7,540 9,699
Other derivatives 0 111 033
Total 685,711 668,636 38,329 28,449 23,766 28,210
Cross-currency swaps are presented under Currency-related derivatives.
Analysis of derivatives by counterparty
Par value Fair value Fair value
31 Dec. 2014 31 Dec. 2013 31 Dec. 2014 31 Dec. 2013 positive negative positive negative
EUR in millions EUR in millions EUR in millions EUR in millions EUR in millions EUR in millions
OECD banks 676,358 633,486 37,479 27,954 22,857 25,043
Non-OECD banks 26 26 03 03
Other counterparties 6,447 31,924 786 169 902 2,937
Public sector 2,879 3,200 64 3227 227
Total 685,711 668,636 38,329 28,449 23,766 28,210
KfW Financial Information 2014 Consolidated financial statements | Notes to financial instruments 128
The analysis includes stand-alone financial derivatives which are presented in the items Derivatives used for hedge accounting and Other derivatives.
The volume of initial differences between the transaction price and model value arising from the use of a valuation technique that makes significant use of market unobservable data which have yet to be amortised over the life of the financial instrument amounts to EUR 64 million (31 Dec. 2013: EUR 53 million). The net gains/losses from derivatives not qualifying for hedge accounting includes amortisation effects in the amount of EUR 7 million (2013: EUR 6 million).
The economic hedge effect of financial derivatives with an aggregate principal amount of EUR 631.3 billion (31 Dec. 2013: EUR 617.5 billion) is presented in accordance with IAS 39; the risk-mitigating impact of the remaining financial derivatives is not reflect-ed in the accounts.
KfW Group did not pledge any collateral (in the form of securities) under derivative transactions that can be resold or repledged at any time without payments being past due, which was unchanged to 31 December 2013.
However, liquid collateral totalling EUR 3,719 million was provided, which was reported under Loans and advances to banks and customers. KfW Group received collateral (in the form of securities) under derivative transactions, which can be resold or repledged at any time without payments being past due by the protection seller. The fair value of this collateral totalled EUR 140 million. The collateral has been neither resold nor repledged. No such collateral was accepted in 2013.
Moreover, provision of liquid collateral totalling EUR 13,922 million (31 Dec. 2013: EUR 7,994 million) was accepted, which was reported under Liabilities to banks and customers.
(74) Additional disclosures on the PROMISE/PROVIDE synthetic securitisation platforms
KfW Group did not receive any collateral (in the form of securities) under platform transactions that can be resold or repledged at any time without payments being past due by the protection seller, which was unchanged to 31 December 2013.
However, provision of liquid collateral totalling EUR 48 million (31 Dec. 2013: EUR 108 million) was accepted, which was reported under Liabilities to banks and customers.
KfW Financial Information 2014 Consolidated financial statements | Notes to financial instruments 129
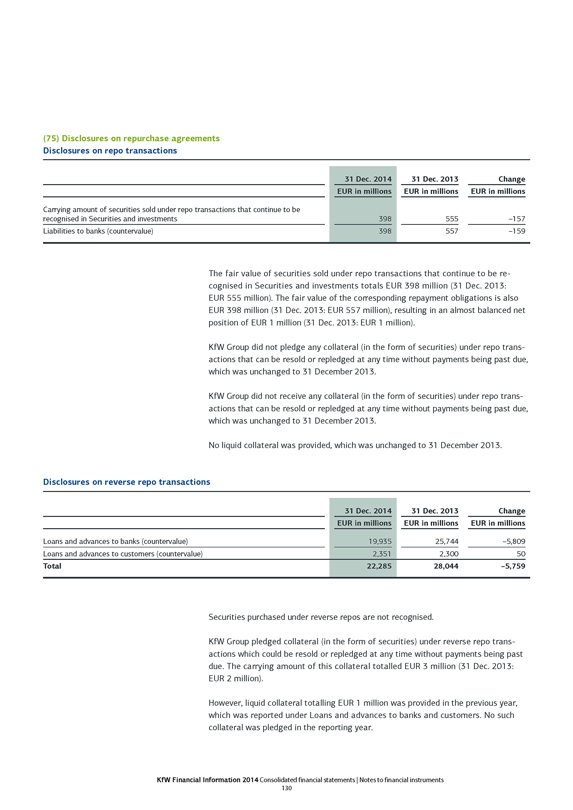
(75) Disclosures on repurchase agreements Disclosures on repo transactions
31 Dec. 2014 31 Dec. 2013 Change EUR in millions EUR in millions EUR in millions
Carrying amount of securities sold under repo transactions that continue to be recognised in Securities and investments
398 555 -157
Liabilities to banks (countervalue) 398 557 -159
The fair value of securities sold under repo transactions that continue to be recognised in Securities and investments totals EUR 398 million (31 Dec. 2013: EUR 555 million). The fair value of the corresponding repayment obligations is also EUR 398 million (31 Dec. 2013: EUR 557 million), resulting in an almost balanced net position of EUR 1 million (31 Dec. 2013: EUR 1 million).
KfW Group did not pledge any collateral (in the form of securities) under repo transactions that can be resold or repledged at any time without payments being past due, which was unchanged to 31 December 2013.
KfW Group did not receive any collateral (in the form of securities) under repo transactions that can be resold or repledged at any time without payments being past due, which was unchanged to 31 December 2013.
No liquid collateral was provided, which was unchanged to 31 December 2013.
Disclosures on reverse repo transactions
31 Dec. 2014 31 Dec. 2013 Change
EUR in millions EUR in millions EUR in millions
Loans and advances to banks (countervalue) 19,935 25,744 -5,809
Loans and advances to customers (countervalue) 2,351 2,300 50
Total 22,285 28,044 -5,759
Securities purchased under reverse repos are not recognised.
KfW Group pledged collateral (in the form of securities) under reverse repo transactions which could be resold or repledged at any time without payments being past due. The carrying amount of this collateral totalled EUR 3 million (31 Dec. 2013: EUR 2 million).
However, liquid collateral totalling EUR 1 million was provided in the previous year, which was reported under Loans and advances to banks and customers. No such collateral was pledged in the reporting year.
KfW Financial Information 2014 Consolidated financial statements | Notes to financial instruments 130
KfW Group did not receive any collateral (in the form of securities) under reverse repo transactions that can be resold or repledged at any time without payments being past due, which was unchanged to 31 December 2013.
However, liquid collateral totalling EUR 1 million was accepted in the previous year, which was reported under Liabilities to banks and customers. No such collateral was accepted in the reporting year.
(76) Disclosure on offsetting financial instruments
Offsetting agreements within framework agreements between KfW and its business partners
Framework agreements between KfW and its business partners include offsetting agreements relating to OTC derivatives and repo transactions.
One form of netting is close-out netting, which provides for the extinction of all rights and obligations relating to individual transactions under the framework agreement upon termination of said framework agreement by the contractual partner, or upon the latter’s insolvency, with the rights and obligations replaced by a single compensation claim (or obligation) in the amount of the net replacement costs of the terminated individual transactions. This does not represent a present legal claim for offsetting.
Close-out netting is not to be confused with the offsetting of payments in normal business. The same framework agreement provides for the latter case, that payments due on the same day and in the same currency may be offset and a net payment made instead of each individual payment (payment netting). This represents a present legal claim for offsetting.
KfW’s framework agreements relating to OTC derivatives all include close-out netting agreements with the contractual partners. Payment netting is limited in the agreement to the relevant individual transaction, so that multiple transaction payment netting does not occur. The requirements for offsetting financial assets and financial liabilities are therefore not met for KfW’s OTC derivatives.
KfW’s framework agreements for repo transactions include close-out netting agreements and in some cases also payment netting agreements with the business partners. However, as KfW does not generally perform multiple transaction payment netting with repo transactions either, the requirements for offsetting of financial assets and financial liabilities are not met for KfW repo transactions.
In accordance with the collateral agreements concluded for OTC derivatives and repo transactions, the values of the available collateral are used in determining the single compensation claim (or obligation) in close-out netting. Both cash and securities are permitted forms of collateral under the existing collateral agreements between KfW and its business partners. The collateral agreements provide for a transfer of title in the case of securities as collateral. Consequently, the transferred securities are not subject to any selling or pledging restrictions.
KfW Financial Information 2014 Consolidated financial statements | Notes to financial instruments 131
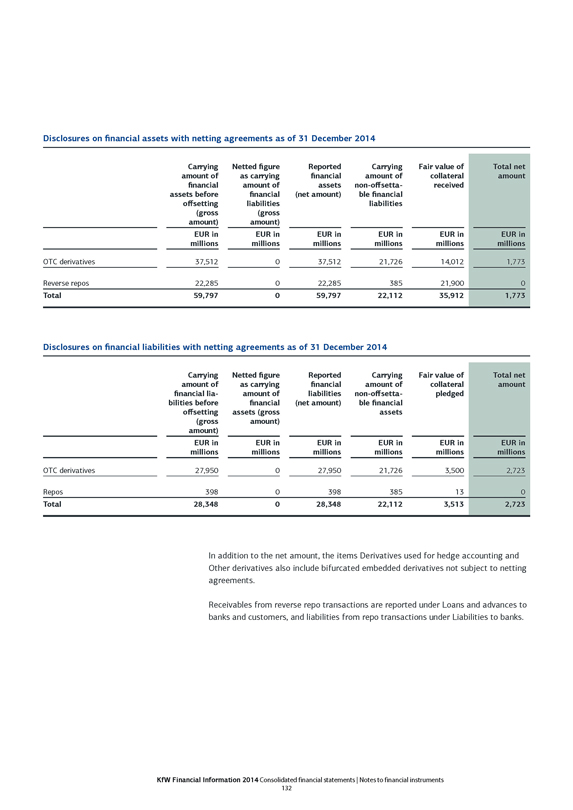
Disclosures on financial assets with netting agreements as of 31 December 2014
Carrying amount of financial assets before offsetting (gross amount) Netted figure as carrying amount of financial liabilities (gross amount) Reported financial assets (net amount) Carrying amount of non-offsettable financial liabilities Fair value of collateral received Total net amount
EUR in millions EUR in millions EUR in millions EUR in millions EUR in millions EUR in millions
OTC derivatives 37,512 0 37,512 21,726 14,012 1,773
Reverse repos 22,285 0 22,285 385 21,900 0
Total 59,797 0 59,797 22,112 35,912 1,773
Disclosures on financial liabilities with netting agreements as of 31 December 2014
Carrying amount of financial liabilities before offsetting (gross amount) Netted figure as carrying amount of financial assets (gross amount) Reported financial liabilities (net amount) Carrying amount of non-offsettable financial assets Fair value of collateral pledged Total net amount EUR in millions EUR in millions EUR in millions EUR in millions EUR in millions EUR in millions
OTC derivatives 27,950 0 27,950 21,726 3,500 2,723
Repos 398 0 398 385 13 0
Total 28,348 0 28,348 22,112 3,513 2,723
In addition to the net amount, the items Derivatives used for hedge accounting and Other derivatives also include bifurcated embedded derivatives not subject to netting agreements.
Receivables from reverse repo transactions are reported under Loans and advances to banks and customers, and liabilities from repo transactions under Liabilities to banks.
KfW Financial Information 2014 Consolidated financial statements | Notes to financial instruments 132
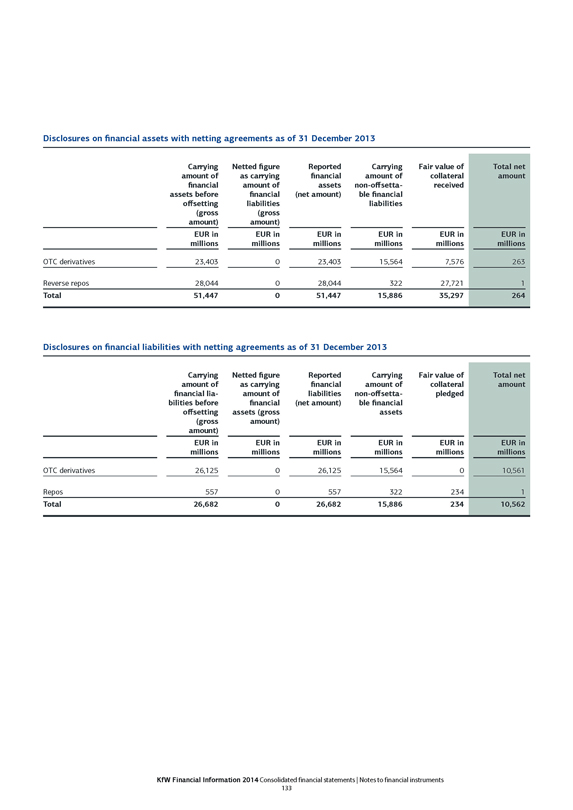
Disclosures on financial assets with netting agreements as of 31 December 2013
Carrying amount of financial assets before offsetting (gross amount) Netted figure as carrying amount of financial liabilities (gross amount) Reported financial assets (net amount) Carrying amount of non-offsettable financial liabilities Fair value of collateral received Total net amount
EUR in millions EUR in millions EUR in millions EUR in millions EUR in millions EUR in millions
OTC derivatives 23,403 0 23,403 15,564 7,576 263
Reverse repos 28,044 0 28,044 322 27,7211
Total 51,447 0 51,447 15,886 35,297 264
Disclosures on financial liabilities with netting agreements as of 31 December 2013
Carrying amount of financial liabilities before offsetting (gross amount) Netted figure as carrying amount of financial assets (gross amount) Reported financial liabilities (net amount) Carrying amount of non-offsettable financial assets Fair value of collateral pledged Total net amount
EUR in millions EUR in millions EUR in millions EUR in millions EUR in millions EUR in millions
OTC derivatives 26,125 0 26,125 15,564 0 10,561
Repos 557 0 557 322 2341
Total 26,682 0 26,682 15,886 234 10,562
KfW Financial Information 2014 Consolidated financial statements | Notes to financial instruments 133
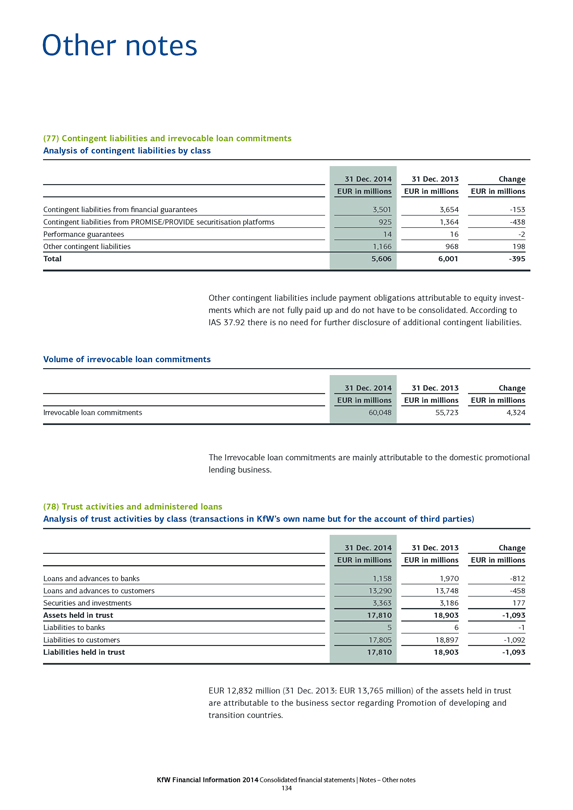
Other notes
(77) Contingent liabilities and irrevocable loan commitments Analysis of contingent liabilities by class
31 Dec. 2014 31 Dec. 2013 Change EUR in millions EUR in millions EUR in millions
Contingent liabilities from financial guarantees 3,501 3,654 -153
Contingent liabilities from PROMISE/PROVIDE securitisation platforms 925 1,364 -438
Performance guarantees 14 16 -2
Other contingent liabilities 1,166 968 198
Total 5,606 6,001 -395
Other contingent liabilities include payment obligations attributable to equity investments which are not fully paid up and do not have to be consolidated. According to IAS 37.92 there is no need for further disclosure of additional contingent liabilities.
Volume of irrevocable loan commitments
31 Dec. 2014 31 Dec. 2013 Change EUR in millions EUR in millions EUR in millions
Irrevocable loan commitments 60,048 55,723 4,324
The Irrevocable loan commitments are mainly attributable to the domestic promotional lending business.
(78) Trust activities and administered loans
Analysis of trust activities by class (transactions in KfW’s own name but for the account of third parties)
31 Dec. 2014 31 Dec. 2013 Change EUR in millions EUR in millions EUR in millions
Loans and advances to banks 1,158 1,970 -812
Loans and advances to customers 13,290 13,748 -458
Securities and investments 3,363 3,186 177
Assets held in trust 17,810 18,903 -1,093
Liabilities to banks 5 6 -1
Liabilities to customers 17,805 18,897 -1,092
Liabilities held in trust 17,810 18,903 -1,093
EUR 12,832 million (31 Dec. 2013: EUR 13,765 million) of the assets held in trust are attributable to the business sector regarding Promotion of developing and transition countries.
KfW Financial Information 2014 Consolidated financial statements | Notes – Other notes 134
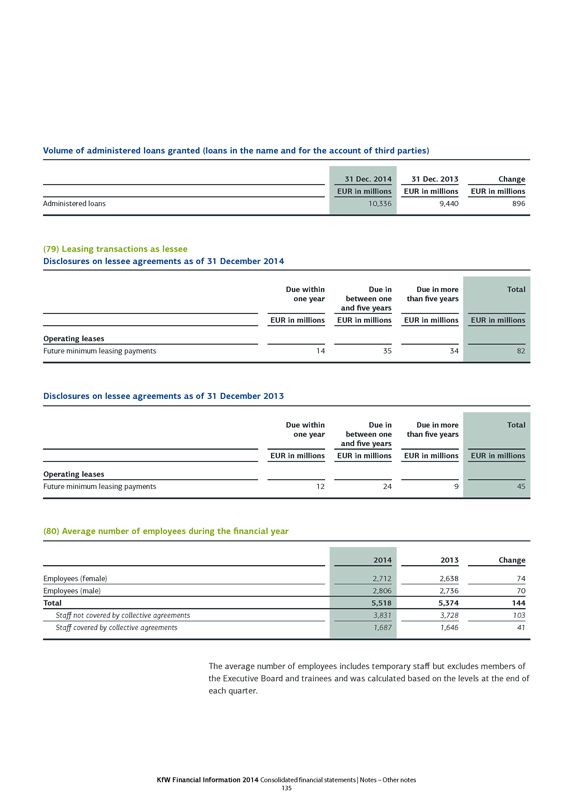
Volume of administered loans granted (loans in the name and for the account of third parties)
31 Dec. 2014 31 Dec. 2013 Change EUR in millions EUR in millions EUR in millions
Administered loans 10,336 9,440 896
(79) Leasing transactions as lessee
Disclosures on lessee agreements as of 31 December 2014
Due within one year Due in between one and five years Due in more than five years Total
EUR in millions EUR in millions EUR in millions EUR in millions
Operating leases Future minimum leasing payments 14 35 34 82
Disclosures on lessee agreements as of 31 December 2013
Due within one year Due in between one and five years Due in more than five years Total
EUR in millions EUR in millions EUR in millions EUR in millions
Operating leases Future minimum leasing payments 12 24 9 45
(80) Average number of employees during the financial year
2014 2013 Change
Employees (female) 2,712 2,638 74
Employees (male) 2,806 2,736 70
Total 5,518 5,374 144
Staff not covered by collective agreements 3,831 3,728 103
Staff covered by collective agreements 1,687 1,646 41
The average number of employees includes temporary staff but excludes members of the Executive Board and trainees and was calculated based on the levels at the end of each quarter.
KfW Financial Information 2014 Consolidated financial statements | Notes - Other notes 135
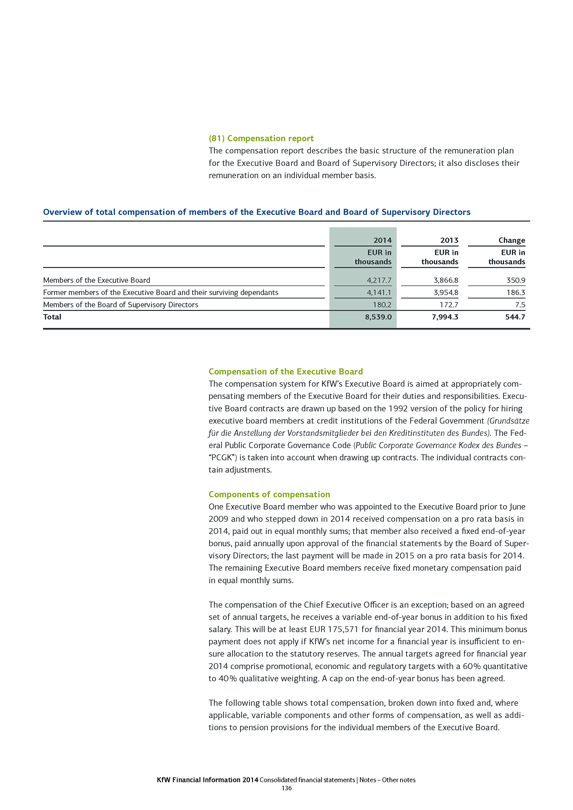
(81) Compensation report
The compensation report describes the basic structure of the remuneration plan for the Executive Board and Board of Supervisory Directors; it also discloses their remuneration on an individual member basis.
Overview of total compensation of members of the Executive Board and Board of Supervisory Directors
2014 EUR in thousands 2013 EUR in thousands Change EUR in thousands
Members of the Executive Board 4,217.7 3,866.8 350.9
Former members of the Executive Board and their surviving dependants 4,141.1 3,954.8 186.3
Members of the Board of Supervisory Directors 180.2 172.7 7.5
Total 8,539.0 7,994.3 544.7
Compensation of the Executive Board
The compensation system for KfW’s Executive Board is aimed at appropriately compensating members of the Executive Board for their duties and responsibilities. Executive Board contracts are drawn up based on the 1992 version of the policy for hiring executive board members at credit institutions of the Federal Government (Grundsätze für die Anstellung der Vorstandsmitglieder bei den Kreditinstituten des Bundes). The Federal Public Corporate Governance Code (Public Corporate Governance Kodex des Bundes - “PCGK”) is taken into account when drawing up contracts. The individual contracts contain adjustments.
Components of compensation
One Executive Board member who was appointed to the Executive Board prior to June 2009 and who stepped down in 2014 received compensation on a pro rata basis in 2014, paid out in equal monthly sums; that member also received a fixed end-of-year bonus, paid annually upon approval of the financial statements by the Board of Supervisory Directors; the last payment will be made in 2015 on a pro rata basis for 2014. The remaining Executive Board members receive fixed monetary compensation paid in equal monthly sums.
The compensation of the Chief Executive Officer is an exception; based on an agreed set of annual targets, he receives a variable end-of-year bonus in addition to his fixed salary. This will be at least EUR 175,571 for financial year 2014. This minimum bonus payment does not apply if KfW’s net income for a financial year is insufficient to ensure allocation to the statutory reserves. The annual targets agreed for financial year 2014 comprise promotional, economic and regulatory targets with a 60 % quantitative to 40 % qualitative weighting. A cap on the end-of-year bonus has been agreed.
The following table shows total compensation, broken down into fixed and, where applicable, variable components and other forms of compensation, as well as additions to pension provisions for the individual members of the Executive Board.
KfW Financial Information 2014 Consolidated financial statements | Notes - Other notes 136
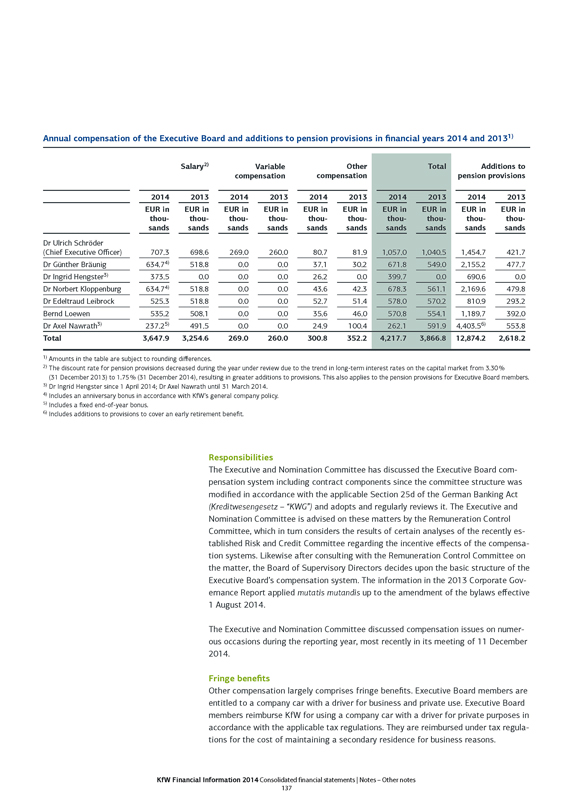
Annual compensation of the Executive Board and additions to pension provisions in financial years 2014 and 20131)
Salary2) Variable compensation Other compensation Total Additions to pension provisions
2014 2013 2014 2013 2014 2013 2014 2013 2014 2013
EUR in thousands EUR in thousands EUR in thousands EUR in thousands EUR in thousands EUR in thousands EUR in thousands EUR in thousands EUR in thousands EUR in thousands
Dr Ulrich Schröder (Chief Executive Officer) 707.3 698.6 269.0 260.0 80.7 81.9 1,057.0 1,040.5 1,454.7 421.7
Dr Günther Bräunig 634.74) 518.8 0.0 0.0 37.1 30.2 671.8 549.0 2,155.2 477.7
Dr Ingrid Hengster3) 373.5 0.0 0.0 0.0 26.2 0.0 399.7 0.0 690.6 0.0
Dr Norbert Kloppenburg 634.74) 518.8 0.0 0.0 43.6 42.3 678.3 561.1 2,169.6 479.8
Dr Edeltraud Leibrock 525.3 518.8 0.0 0.0 52.7 51.4 578.0 570.2 810.9 293.2
Bernd Loewen 535.2 508.1 0.0 0.0 35.6 46.0 570.8 554.1 1,189.7 392.0
Dr Axel Nawrath3) 237.25) 491.5 0.0 0.0 24.9 100.4 262.1 591.9 4,403.56) 553.8
Total 3,647.9 3,254.6 269.0 260.0 300.8 352.2 4,217.7 3,866.8 12,874.2 2,618.2
1) Amounts in the table are subject to rounding differences.
2) The discount rate for pension provisions decreased during the year under review due to the trend in long-term interest rates on the capital market from 3.30 % (31 December 2013) to 1.75 % (31 December 2014), resulting in greater additions to provisions. This also applies to the pension provisions for Executive Board members.
3) Dr Ingrid Hengster since 1 April 2014; Dr Axel Nawrath until 31 March 2014.
4) Includes an anniversary bonus in accordance with KfW’s general company policy.
5) Includes a fixed end-of-year bonus.
6) Includes additions to provisions to cover an early retirement benefit.
Responsibilities
The Executive and Nomination Committee has discussed the Executive Board compensation system including contract components since the committee structure was modified in accordance with the applicable Section 25d of the German Banking Act (Kreditwesengesetz - “KWG”) and adopts and regularly reviews it. The Executive and Nomination Committee is advised on these matters by the Remuneration Control Committee, which in turn considers the results of certain analyses of the recently established Risk and Credit Committee regarding the incentive effects of the compensation systems. Likewise after consulting with the Remuneration Control Committee on the matter, the Board of Supervisory Directors decides upon the basic structure of the Executive Board’s compensation system. The information in the 2013 Corporate Governance Report applied mutatis mutandis up to the amendment of the bylaws effective 1 August 2014.
The Executive and Nomination Committee discussed compensation issues on numerous occasions during the reporting year, most recently in its meeting of 11 December 2014.
Fringe benefits
Other compensation largely comprises fringe benefits. Executive Board members are entitled to a company car with a driver for business and private use. Executive Board members reimburse KfW for using a company car with a driver for private purposes in accordance with the applicable tax regulations. They are reimbursed under tax regulations for the cost of maintaining a secondary residence for business reasons.
KfW Financial Information 2014 Consolidated financial statements | Notes - Other notes 137
Executive Board members are insured under a group accident insurance policy. Allowances are provided for health and long-term care insurance. Executive Board members are covered by a directors and officers liability insurance policy, which insures them against the risks of financial loss associated with their actions in their capacity as Executive Board members and by a supplemental legal expenses insurance policy. There currently is no excess. KfW Executive Board members acting in their management capacity are also protected by a special legal expenses group policy for employees covering criminal action.
No compensation is paid to members of the Executive Board for assuming executive body functions at group companies.
As with all other executives, Executive Board members may also opt to participate in the deferred compensation programme - a supplemental company pension scheme financed via tax-free salary conversion. Moreover, they are entitled to anniversary bonuses in accordance with KfW’s general company policy.
Moreover, the fringe benefits contain the cost of security systems at Executive Board members’ residences; these benefits are not recognised as other compensation but as Non-personnel expenses.
The fringe benefits are subject to taxation as benefits in money’s worth for Executive Board members if they cannot be granted on a tax-free basis or if such treatment is contractually agreed.
There were no loans by KfW to any members of the Executive Board in 2014.
No Executive Board member was granted or promised any benefits by a third party during the past financial year with a view to his or her position as a member of the KfW Executive Board.
Pension benefits and termination benefits
In accordance with Article 1 (3) of the KfW Bylaws, the appointment of an Executive Board member should not generally extend beyond reaching the legal age of retirement. The Chief Executive Officer is exempt from this provision; he will be slightly above the statutory retirement age at the end of his current period of office on 31 December 2017. Upon reaching the age of 65 or statutory retirement age and the expiry of their Executive Board contract, Executive Board members are entitled to claim pension payments. Executive Board members whose service contracts were signed before 2013 may retire early at their own request upon turning 63. Pension benefits for Executive Board members as well as their surviving dependants are based on the 1992 version of the Federal Government’s policy for hiring executive board members at credit institutions. The Federal Public Corporate Governance Code was taken into account when drawing up the Executive Board contracts.
Executive Board member contracts include a severance pay cap in accordance with the recommendations of the Federal Public Corporate Governance Code. In other
KfW Financial Information 2014 Consolidated financial statements | Notes - Other notes 138
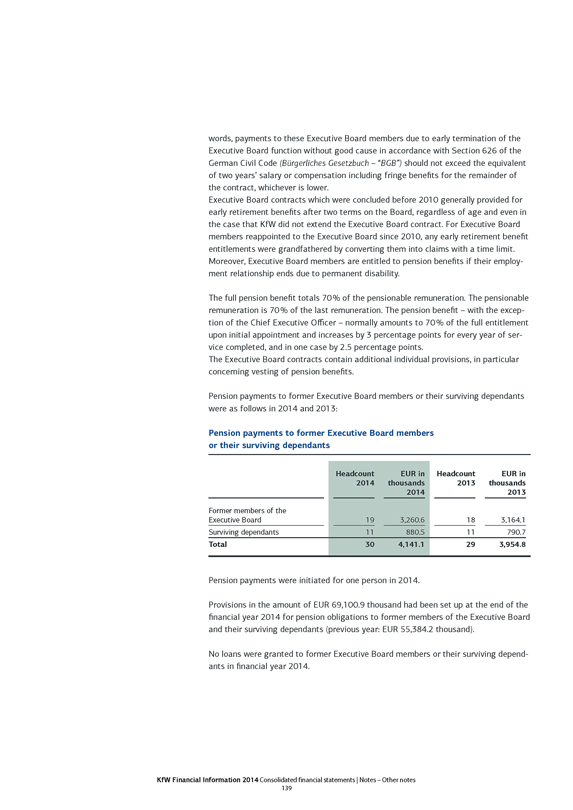
words, payments to these Executive Board members due to early termination of the Executive Board function without good cause in accordance with Section 626 of the German Civil Code (Bürgerliches Gesetzbuch - “BGB”) should not exceed the equivalent of two years’ salary or compensation including fringe benefits for the remainder of the contract, whichever is lower.
Executive Board contracts which were concluded before 2010 generally provided for early retirement benefits after two terms on the Board, regardless of age and even in the case that KfW did not extend the Executive Board contract. For Executive Board members reappointed to the Executive Board since 2010, any early retirement benefit entitlements were grandfathered by converting them into claims with a time limit. Moreover, Executive Board members are entitled to pension benefits if their employment relationship ends due to permanent disability.
The full pension benefit totals 70 % of the pensionable remuneration. The pensionable remuneration is 70 % of the last remuneration. The pension benefit - with the exception of the Chief Executive Officer - normally amounts to 70 % of the full entitlement upon initial appointment and increases by 3 percentage points for every year of service completed, and in one case by 2.5 percentage points.
The Executive Board contracts contain additional individual provisions, in particular concerning vesting of pension benefits.
Pension payments to former Executive Board members or their surviving dependants were as follows in 2014 and 2013:
Pension payments to former Executive Board members or their surviving dependants
Headcount 2014 EUR in thousands 2014 Headcount 2013 EUR in thousands 2013
Former members of the Executive Board 19 3,260.6 18 3,164.1
Surviving dependants 11 880.5 11 790.7
Total 30 4,141.1 29 3,954.8
Pension payments were initiated for one person in 2014.
Provisions in the amount of EUR 69,100.9 thousand had been set up at the end of the financial year 2014 for pension obligations to former members of the Executive Board and their surviving dependants (previous year: EUR 55,384.2 thousand).
No loans were granted to former Executive Board members or their surviving dependants in financial year 2014.
KfW Financial Information 2014 Consolidated financial statements | Notes - Other notes 139
Compensation of members of the Board of Supervisory Directors
The amount of compensation for members of the Board of Supervisory Directors is determined by the supervisory authority in accordance with Article 7 (10) of the KfW Bylaws. With the last revision in May 2010, compensation for members of the Federal Government who are members of the Board of Supervisory Directors pursuant to Article 7 (1) No. 1 and No. 2 of the KfW Law was set to EUR 0.
For the reporting year, compensation for other members of the Board of Supervisory Directors pursuant to Article 7 (1) Nos. 3-6 of the KfW Law amounted to EUR 5.1 thousand p. a.; compensation for sitting on a committee of the Board of Supervisory Directors was a standard amount of EUR 0.6 thousand p. a. for each member. Committee chairs received no special compensation.
Compensation is provided on a pro rata basis for joining the Board of Supervisory Directors during the year.
Upon request a daily allowance (EUR 0.2 thousand per meeting day) is paid and travelling expenses (including VAT) are reimbursed.
The following table provides details on the compensation paid to the Board of Supervisory Directors in financial year 2014: all amounts are shown net in thousands of euros. Travelling expenses are reimbursed upon submission of receipts and are not taken into account in the table.
KfW Financial Information 2014 Consolidated financial statements | Notes - Other notes 140
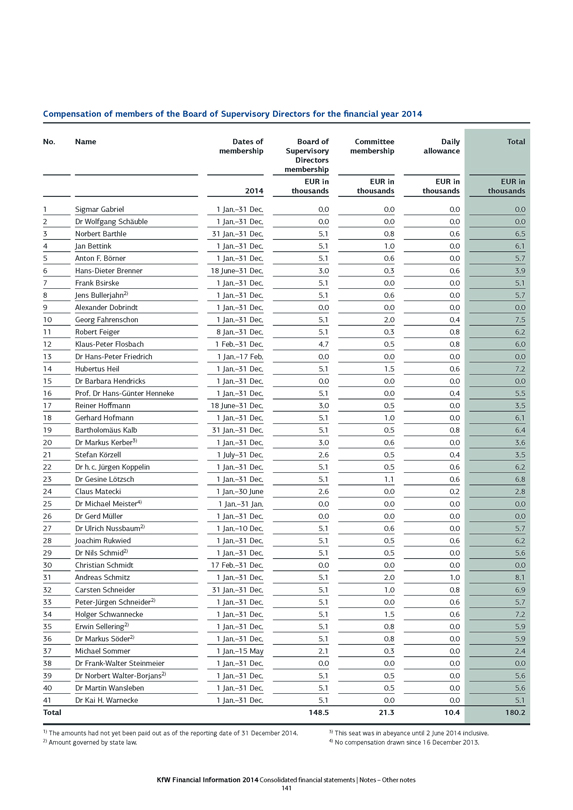
Compensation of members of the Board of Supervisory Directors for the financial year 2014
No. Name Dates of membership Board of Supervisory Directors membership Committee membership Daily allowance Total
2014 EUR in thousands EUR in thousands EUR in thousands EUR in thousands
1 Sigmar Gabriel 1 Jan.-31 Dec. 0.0 0.0 0.0 0.0
2 Dr Wolfgang Schäuble 1 Jan.-31 Dec. 0.0 0.0 0.0 0.0
3 Norbert Barthle 31 Jan.-31 Dec. 5.1 0.8 0.6 6.5
4 Jan Bettink 1 Jan.-31 Dec. 5.1 1.0 0.0 6.1
5 Anton F. Börner 1 Jan.-31 Dec. 5.1 0.6 0.0 5.7
6 Hans-Dieter Brenner 18 June-31 Dec. 3.0 0.3 0.6 3.9
7 Frank Bsirske 1 Jan.-31 Dec. 5.1 0.0 0.0 5.1
8 Jens Bullerjahn2) 1 Jan.-31 Dec. 5.1 0.6 0.0 5.7
9 Alexander Dobrindt 1 Jan.-31 Dec. 0.0 0.0 0.0 0.0
10 Georg Fahrenschon 1 Jan.-31 Dec. 5.1 2.0 0.4 7.5
11 Robert Feiger 8 Jan.-31 Dec. 5.1 0.3 0.8 6.2
12 Klaus-Peter Flosbach 1 Feb.-31 Dec. 4.7 0.5 0.8 6.0
13 Dr Hans-Peter Friedrich 1 Jan.-17 Feb. 0.0 0.0 0.0 0.0
14 Hubertus Heil 1 Jan.-31 Dec. 5.1 1.5 0.6 7.2
15 Dr Barbara Hendricks 1 Jan.-31 Dec. 0.0 0.0 0.0 0.0
16 Prof. Dr Hans-Günter Henneke 1 Jan.-31 Dec. 5.1 0.0 0.4 5.5
17 Reiner Hoffmann 18 June-31 Dec. 3.0 0.5 0.0 3.5
18 Gerhard Hofmann 1 Jan.-31 Dec. 5.1 1.0 0.0 6.1
19 Bartholomäus Kalb 31 Jan.-31 Dec. 5.1 0.5 0.8 6.4
20 Dr Markus Kerber3) 1 Jan.-31 Dec. 3.0 0.6 0.0 3.6
21 Stefan Körzell 1 July-31 Dec. 2.6 0.5 0.4 3.5
22 Dr h. c. Jürgen Koppelin 1 Jan.-31 Dec. 5.1 0.5 0.6 6.2
23 Dr Gesine Lötzsch 1 Jan.-31 Dec. 5.1 1.1 0.6 6.8
24 Claus Matecki 1 Jan.-30 June 2.6 0.0 0.2 2.8
25 Dr Michael Meister4) 1 Jan.-31 Jan. 0.0 0.0 0.0 0.0
26 Dr Gerd Müller 1 Jan.-31 Dec. 0.0 0.0 0.0 0.0
27 Dr Ulrich Nussbaum2) 1 Jan.-10 Dec. 5.1 0.6 0.0 5.7
28 Joachim Rukwied 1 Jan.-31 Dec. 5.1 0.5 0.6 6.2
29 Dr Nils Schmid2) 1 Jan.-31 Dec. 5.1 0.5 0.0 5.6
30 Christian Schmidt 17 Feb.-31 Dec. 0.0 0.0 0.0 0.0
31 Andreas Schmitz 1 Jan.-31 Dec. 5.1 2.0 1.0 8.1
32 Carsten Schneider 31 Jan.-31 Dec. 5.1 1.0 0.8 6.9
33 Peter-Jürgen Schneider2) 1 Jan.-31 Dec. 5.1 0.0 0.6 5.7
34 Holger Schwannecke 1 Jan.-31 Dec. 5.1 1.5 0.6 7.2
35 Erwin Sellering2) 1 Jan.-31 Dec. 5.1 0.8 0.0 5.9
36 Dr Markus Söder2) 1 Jan.-31 Dec. 5.1 0.8 0.0 5.9
37 Michael Sommer 1 Jan.-15 May 2.1 0.3 0.0 2.4
38 Dr Frank-Walter Steinmeier 1 Jan.-31 Dec. 0.0 0.0 0.0 0.0
39 Dr Norbert Walter-Borjans2) 1 Jan.-31 Dec. 5.1 0.5 0.0 5.6
40 Dr Martin Wansleben 1 Jan.-31 Dec. 5.1 0.5 0.0 5.6
41 Dr Kai H. Warnecke 1 Jan.-31 Dec. 5.1 0.0 0.0 5.1
Total 148.5 21.3 10.4 180.2
1) The amounts had not yet been paid out as of the reporting date of 31 December 2014. 3) This seat was in abeyance until 2 June 2014 inclusive.
2) Amount governed by state law. 4) No compensation drawn since 16 December 2013.
KfW Financial Information 2014 Consolidated financial statements | Notes - Other notes 141
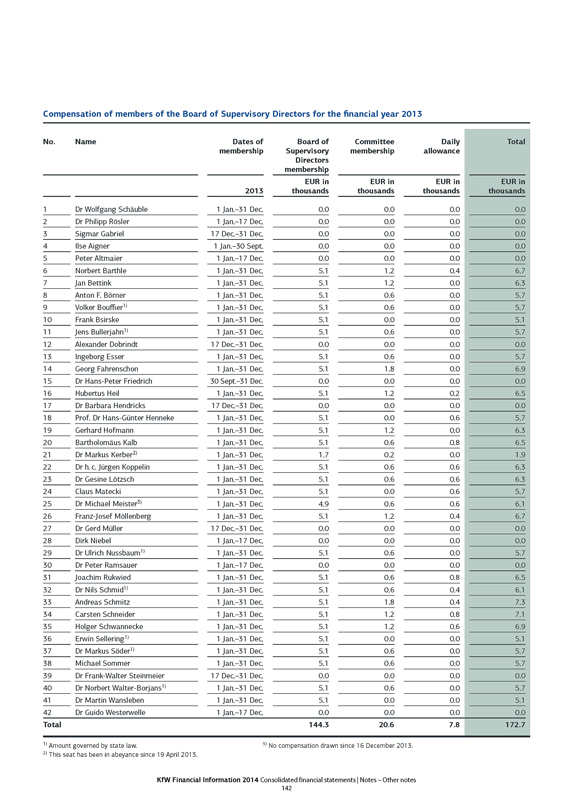
Compensation of members of the Board of Supervisory Directors for the financial year 2013
No. Name Dates of membership Board of Supervisory Directors membership Committee membership Daily allowance Total
2013 EUR in thousands EUR in thousands EUR in thousands EUR in thousands
1 Dr Wolfgang Schäuble 1 Jan.-31 Dec. 0.0 0.0 0.0 0.0
2 Dr Philipp Rösler 1 Jan.-17 Dec. 0.0 0.0 0.0 0.0
3 Sigmar Gabriel 17 Dec.-31 Dec. 0.0 0.0 0.0 0.0
4 Ilse Aigner 1 Jan.-30 Sept. 0.0 0.0 0.0 0.0
5 Peter Altmaier 1 Jan.-17 Dec. 0.0 0.0 0.0 0.0
6 Norbert Barthle 1 Jan.-31 Dec. 5.1 1.2 0.4 6.7
7 Jan Bettink 1 Jan.-31 Dec. 5.1 1.2 0.0 6.3
8 Anton F. Börner 1 Jan.-31 Dec. 5.1 0.6 0.0 5.7
9 Volker Bouffier1) 1 Jan.-31 Dec. 5.1 0.6 0.0 5.7
10 Frank Bsirske 1 Jan.-31 Dec. 5.1 0.0 0.0 5.1
11 Jens Bullerjahn1) 1 Jan.-31 Dec. 5.1 0.6 0.0 5.7
12 Alexander Dobrindt 17 Dec.-31 Dec. 0.0 0.0 0.0 0.0
13 Ingeborg Esser 1 Jan.-31 Dec. 5.1 0.6 0.0 5.7
14 Georg Fahrenschon 1 Jan.-31 Dec. 5.1 1.8 0.0 6.9
15 Dr Hans-Peter Friedrich 30 Sept.-31 Dec. 0.0 0.0 0.0 0.0
16 Hubertus Heil 1 Jan.-31 Dec. 5.1 1.2 0.2 6.5
17 Dr Barbara Hendricks 17 Dec.-31 Dec. 0.0 0.0 0.0 0.0
18 Prof. Dr Hans-Günter Henneke 1 Jan.-31 Dec. 5.1 0.0 0.6 5.7
19 Gerhard Hofmann 1 Jan.-31 Dec. 5.1 1.2 0.0 6.3
20 Bartholomäus Kalb 1 Jan.-31 Dec. 5.1 0.6 0.8 6.5
21 Dr Markus Kerber2) 1 Jan.-31 Dec. 1.7 0.2 0.0 1.9
22 Dr h. c. Jürgen Koppelin 1 Jan.-31 Dec. 5.1 0.6 0.6 6.3
23 Dr Gesine Lötzsch 1 Jan.-31 Dec. 5.1 0.6 0.6 6.3
24 Claus Matecki 1 Jan.-31 Dec. 5.1 0.0 0.6 5.7
25 Dr Michael Meister3) 1 Jan.-31 Dec. 4.9 0.6 0.6 6.1
26 Franz-Josef Möllenberg 1 Jan.-31 Dec. 5.1 1.2 0.4 6.7
27 Dr Gerd Müller 17 Dec.-31 Dec. 0.0 0.0 0.0 0.0
28 Dirk Niebel 1 Jan.-17 Dec. 0.0 0.0 0.0 0.0
29 Dr Ulrich Nussbaum1) 1 Jan.-31 Dec. 5.1 0.6 0.0 5.7
30 Dr Peter Ramsauer 1 Jan.-17 Dec. 0.0 0.0 0.0 0.0
31 Joachim Rukwied 1 Jan.-31 Dec. 5.1 0.6 0.8 6.5
32 Dr Nils Schmid1) 1 Jan.-31 Dec. 5.1 0.6 0.4 6.1
33 Andreas Schmitz 1 Jan.-31 Dec. 5.1 1.8 0.4 7.3
34 Carsten Schneider 1 Jan.-31 Dec. 5.1 1.2 0.8 7.1
35 Holger Schwannecke 1 Jan.-31 Dec. 5.1 1.2 0.6 6.9
36 Erwin Sellering1) 1 Jan.-31 Dec. 5.1 0.0 0.0 5.1
37 Dr Markus Söder1) 1 Jan.-31 Dec. 5.1 0.6 0.0 5.7
38 Michael Sommer 1 Jan.-31 Dec. 5.1 0.6 0.0 5.7
39 Dr Frank-Walter Steinmeier 17 Dec.-31 Dec. 0.0 0.0 0.0 0.0
40 Dr Norbert Walter-Borjans1) 1 Jan.-31 Dec. 5.1 0.6 0.0 5.7
41 Dr Martin Wansleben 1 Jan.-31 Dec. 5.1 0.0 0.0 5.1
42 Dr Guido Westerwelle 1 Jan.-17 Dec. 0.0 0.0 0.0 0.0
Total 144.3 20.6 7.8 172.7
1) Amount governed by state law. 3) No compensation drawn since 16 December 2013.
2) This seat has been in abeyance since 19 April 2013.
KfW Financial Information 2014 Consolidated financial statements | Notes - Other notes 142
There are no pension obligations for members of the Board of Supervisory Directors.
Members of the Board of Supervisory Directors received no compensation in the reporting year for personal services provided.
No direct loans were granted to members of the Board of Supervisory Directors in the reporting year.
Members of the Board of Supervisory Directors are also covered by a directors and officers liability insurance policy, which insures them against the risks of financial loss associated with their actions in their capacity as Supervisory Directors and by a supplemental legal expenses insurance policy. There is currently no excess here either. KfW’s Supervisory Directors acting in that capacity are also protected by a special legal expenses group policy for employees covering criminal action and by a group accident insurance policy.
(82) Related party disclosures
In accordance with IAS 24, KfW Group’s related entities include the consolidated subsidiaries, the non-consolidated subsidiaries, joint ventures, associates and the interests held by the Federal Government.
Natural persons considered related parties in accordance with IAS 24 include the members of the Executive Board and of the Board of Supervisory Directors, the Directors of KfW, the managing directors of all subsidiaries included in the consolidated financial statements, the members of the supervisory boards of certain consolidated subsidiaries and their close family members.
KfW is a public law institution in which the Federal Government holds an 80 % stake and the Federal States hold a 20 % stake. Any transactions with the Federal Government and the Federal States in the financial year 2014 are covered by the rules and regulations set forth in the KfW Law. This also includes operations in which the Federal Republic of Germany has a state interest and for which the Federal Government has mandated KfW (mandated transactions in accordance with Article 2 (4) of the KfW Law). In addition to mandated transactions, the Federal Government also has agency agreements with KfW, which primarily govern the individual promotional programmes.
The business relationships between KfW and natural persons considered related parties are primarily determined by the KfW Bylaws and by applying the principles of the Federal Public Corporate Governance Code. The conditions and prices reflect market conditions or are concluded in accordance with KfW’s general conditions for its loan programmes open to the general public.
KfW Financial Information 2014 Consolidated financial statements | Notes - Other notes 143
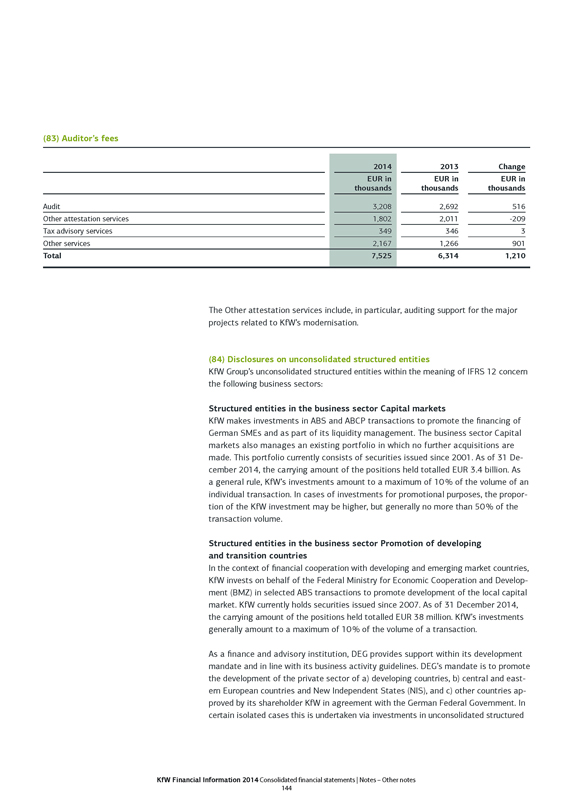
(83) Auditor’s fees
2014 2013 Change
EUR in thousands EUR in thousands EUR in thousands
Audit 3,208 2,692 516
Other attestation services 1,802 2,011 -209
Tax advisory services 349 346 3
Other services 2,167 1,266 901
Total 7,525 6,314 1,210
The Other attestation services include, in particular, auditing support for the major projects related to KfW’s modernisation.
(84) Disclosures on unconsolidated structured entities
KfW Group’s unconsolidated structured entities within the meaning of IFRS 12 concern the following business sectors:
Structured entities in the business sector Capital markets
KfW makes investments in ABS and ABCP transactions to promote the financing of German SMEs and as part of its liquidity management. The business sector Capital markets also manages an existing portfolio in which no further acquisitions are made. This portfolio currently consists of securities issued since 2001. As of 31 December 2014, the carrying amount of the positions held totalled EUR 3.4 billion. As a general rule, KfW’s investments amount to a maximum of 10 % of the volume of an individual transaction. In cases of investments for promotional purposes, the proportion of the KfW investment may be higher, but generally no more than 50 % of the transaction volume.
Structured entities in the business sector Promotion of developing and transition countries
In the context of financial cooperation with developing and emerging market countries, KfW invests on behalf of the Federal Ministry for Economic Cooperation and Development (BMZ) in selected ABS transactions to promote development of the local capital market. KfW currently holds securities issued since 2007. As of 31 December 2014, the carrying amount of the positions held totalled EUR 38 million. KfW’s investments generally amount to a maximum of 10 % of the volume of a transaction.
As a finance and advisory institution, DEG provides support within its development mandate and in line with its business activity guidelines. DEG’s mandate is to promote the development of the private sector of a) developing countries, b) central and eastern European countries and New Independent States (NIS), and c) other countries approved by its shareholder KfW in agreement with the German Federal Government. In certain isolated cases this is undertaken via investments in unconsolidated structured
KfW Financial Information 2014 Consolidated financial statements | Notes - Other notes 144
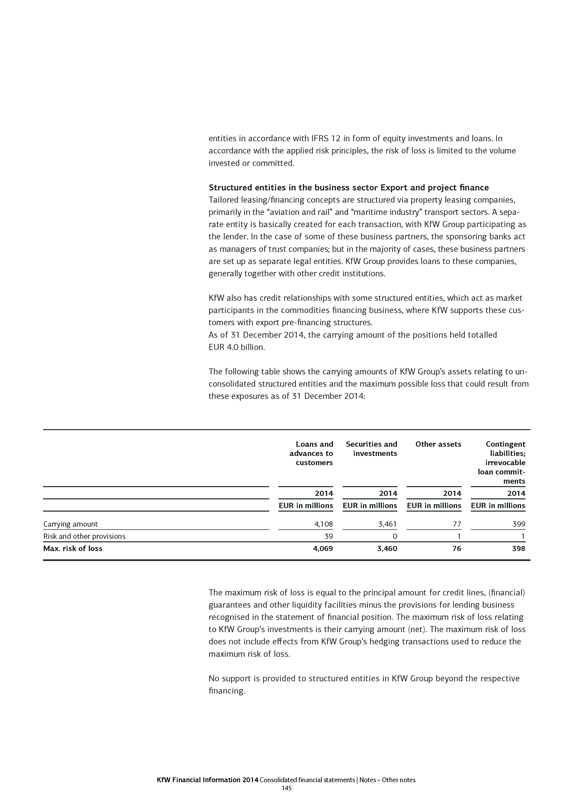
entities in accordance with IFRS 12 in form of equity investments and loans. In accordance with the applied risk principles, the risk of loss is limited to the volume invested or committed.
Structured entities in the business sector Export and project finance
Tailored leasing/financing concepts are structured via property leasing companies, primarily in the “aviation and rail” and “maritime industry” transport sectors. A separate entity is basically created for each transaction, with KfW Group participating as the lender. In the case of some of these business partners, the sponsoring banks act as managers of trust companies; but in the majority of cases, these business partners are set up as separate legal entities. KfW Group provides loans to these companies, generally together with other credit institutions.
KfW also has credit relationships with some structured entities, which act as market participants in the commodities financing business, where KfW supports these customers with export pre-financing structures.
As of 31 December 2014, the carrying amount of the positions held totalled EUR 4.0 billion.
The following table shows the carrying amounts of KfW Group’s assets relating to unconsolidated structured entities and the maximum possible loss that could result from these exposures as of 31 December 2014:
Loans and advances to customers Securities and investments Other assets Contingent liabilities; irrevocable loan commitments
2014 2014 2014 2014
EUR in millions EUR in millions EUR in millions EUR in millions
Carrying amount 4,108 3,461 77 399
Risk and other provisions 39 0 1 1
Max. risk of loss 4,069 3,460 76 398
The maximum risk of loss is equal to the principal amount for credit lines, (financial) guarantees and other liquidity facilities minus the provisions for lending business recognised in the statement of financial position. The maximum risk of loss relating to KfW Group’s investments is their carrying amount (net). The maximum risk of loss does not include effects from KfW Group’s hedging transactions used to reduce the maximum risk of loss.
No support is provided to structured entities in KfW Group beyond the respective financing.
KfW Financial Information 2014 Consolidated financial statements | Notes - Other notes 145

In exceptional cases, KfW Group acts as the sponsor for structured entities in which it holds shares purely on a trust basis on behalf of the Federal Government. The risk of these structured entities lies exclusively with the Federal Government. In such cases, KfW Group is considered as the sponsor of the structured entities because the entities were initiated and/or structured by KfW Group on behalf of the Federal Government.
(85) Disclosures on shareholdings
Subsidiaries included in the consolidated financial statements
Name/registered office Capital share Equity (IFRS) as of 31 Dec. 2014
% EUR in millions
KfW IPEX-Bank GmbH, Frankfurt am Main (www.kfw-ipex-bank.de) 100.0 3,549
KfW IPEX-Beteiligungsholding GmbH, Frankfurt am Main 100.0 2,373
DEG – Deutsche Investitions- und Entwicklungsgesellschaft mbH, Cologne (www.deginvest.de) 100.0 2,410
KfW Beteiligungsholding GmbH, Bonn 100.0 396
tbg Technologie-Beteiligungs-Gesellschaft mbH, Bonn 100.0 185
Associates included in the consolidated financial statements using the equity method
Name/registered office Capital share Equity as of 30 Sept. 2014
% EUR in millions
Microfinance Enhancement Facility S. A., Luxembourg 24.1 351
Green for Growth Fund, Southeast Europe S. A., Luxembourg 18.9 242
AF Eigenkapitalfonds für deutschen Mittelstand GmbH & Co KG, Munich 47.5 73
KfW Financial Information 2014 Consolidated financial statements | Notes – Other notes
146
Microfinance Enhancement Facility S. A. (MEF) has been accounted for using the equity method since 2009. MEF, a KfW investment in a refinancing facility for microfinance institutions is part of the business sector Promotion of developing and transition countries. Details of the business sectors as well as a summary of financial information can be found on the company’s website (http://www.mef-fund.com/).
Green for Growth Fund, Southeast Europe S. A. (GGF) has been included in the consolidated financial statements using the equity method since 2010. GGF is a fund to promote SME and private household investment in energy efficiency and renewable energy in the Western Balkans and in Turkey (also business sector Promotion of developing and transition countries). Details of the business sectors as well as a summary of financial information can be found on the company’s website (http://www.ggf.lu).
Mittelstandsbank initiated the Eigenkapitalfonds für deutschen Mittelstand (German SME Equity Fund) together with Commerzbank in July 2010, each providing funds of almost EUR 100 million. It is accounted for using the equity method. The fund focuses on small and medium-sized (family) companies with a maximum annual revenue of EUR 500 million. The fund acquires minority interests and provides the company with real equity particularly for the purpose of financing growth.
Entities not included in the consolidated financial statements
Six subsidiaries, seven joint ventures, 13 associated companies, and 19 special purpose vehicles (including structured entities) of minor significance to the presentation of the net assets, financial position and results of operations of KfW Group have not been consolidated; instead they are shown in the statement of financial position under Securities and investments or Loans and advances. These companies account for approximately 0.1 % of KfW Group’s total assets.
KfW Financial Information 2014 Consolidated financial statements | Notes – Other notes
147
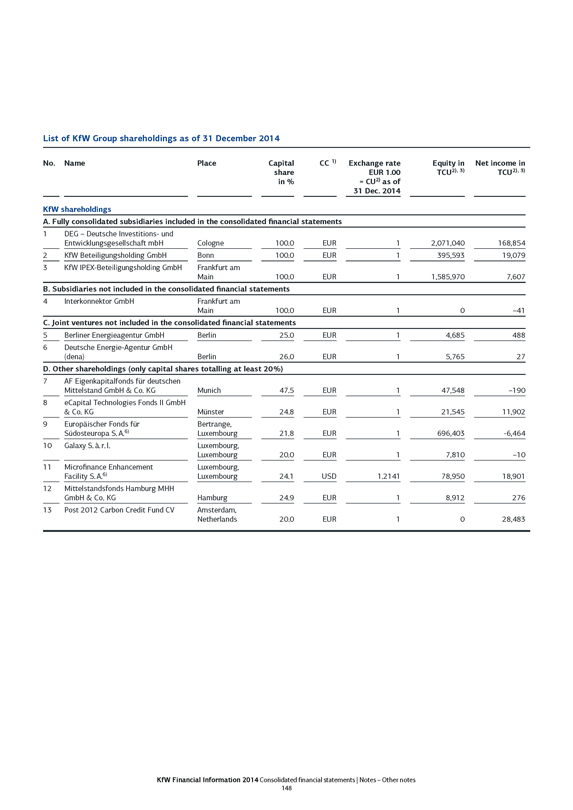
List of KfW Group shareholdings as of 31 December 2014
No. Name Place Capital share in % CC 1) Exchange rate EUR 1.00 = CU2) as of 31 Dec. 2014 Equity in TCU2), 3) Net income in TCU2), 3)
KfW shareholdings
A. Fully consolidated subsidiaries included in the consolidated financial statements
1 DEG – Deutsche Investitions- und Entwicklungsgesellschaft mbH Cologne 100.0 EUR 1 2,071,040 168,854
2 KfW Beteiligungsholding GmbH Bonn 100.0 EUR 1 395,593 19,079
3 KfW IPEX-Beteiligungsholding GmbH Frankfurt am Main 100.0 EUR 1 1,585,970 7,607
B. Subsidiaries not included in the consolidated financial statements
4 Interkonnektor GmbH Frankfurt am Main 100.0 EUR 1 0 –41
C. Joint ventures not included in the consolidated financial statements
5 Berliner Energieagentur GmbH Berlin 25.0 EUR 1 4,685 488
6 Deutsche Energie-Agentur GmbH (dena) Berlin 26.0 EUR 1 5,765 27
D. Other shareholdings (only capital shares totalling at least 20 %)
7 AF Eigenkapitalfonds für deutschen Mittelstand GmbH & Co. KG Munich 47.5 EUR 1 47,548 –190
8 eCapital Technologies Fonds II GmbH & Co. KG Münster 24.8 EUR 1 21,545 11,902
9 Europäischer Fonds für Bertrange, Südosteuropa S. A.6) Luxembourg 21.8 EUR 1 696,403 -6,464
10 Galaxy S. à. r. l. Luxembourg, Luxembourg 20.0 EUR 1 7,810 –10
11 Microfinance Enhancement Facility S. A.6) Luxembourg, Luxembourg 24.1 USD 1.2141 78,950 18,901
12 Mittelstandsfonds Hamburg MHH GmbH & Co. KG Hamburg 24.9 EUR 1 8,912 276
13 Post 2012 Carbon Credit Fund CV Amsterdam, Netherlands 20.0 EUR 1 0 28,483
KfW Financial Information 2014 Consolidated financial statements | Notes – Other notes
148
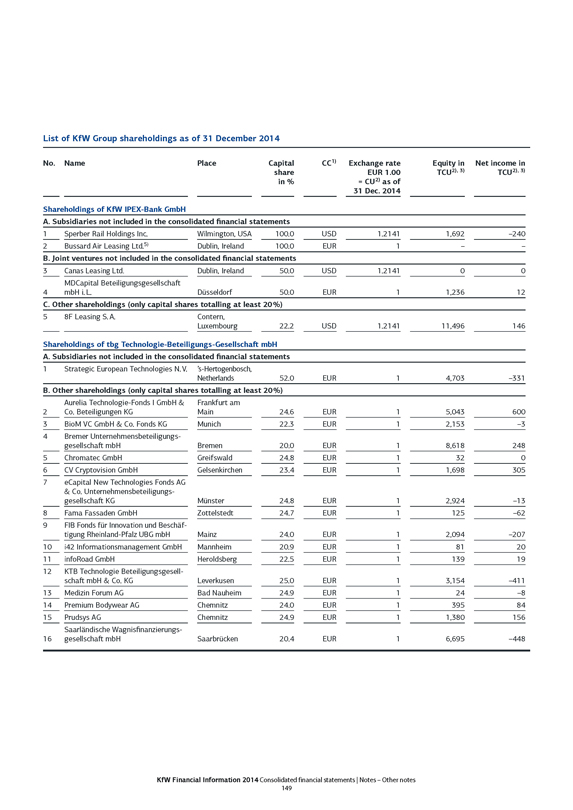
List of KfW Group shareholdings as of 31 December 2014
No. Name Place Capital share in % CC1) Exchange rate EUR 1.00 = CU2) as of 31 Dec. 2014 Equity in TCU2), 3) Net income in TCU2), 3)
Shareholdings of KfW IPEX-Bank GmbH
A. Subsidiaries not included in the consolidated financial statements
1 Sperber Rail Holdings Inc. Wilmington, USA 100.0 USD 1.2141 1,692 –240
2 Bussard Air Leasing Ltd.5) Dublin, Ireland 100.0 EUR 1 – –
B. Joint ventures not included in the consolidated financial statements
3 Canas Leasing Ltd. Dublin, Ireland 50.0 USD 1.2141 0 0
4 MDCapital Beteiligungsgesellschaft mbH i. L. Düsseldorf 50.0 EUR 1 1,236 12
C. Other shareholdings (only capital shares totalling at least 20 %)
5 8F Leasing S. A. Contern, Luxembourg 22.2 USD 1.2141 11,496 146
Shareholdings of tbg Technologie-Beteiligungs-Gesellschaft mbH
A. Subsidiaries not included in the consolidated financial statements
1 Strategic European Technologies N. V. ’s-Hertogenbosch, Netherlands 52.0 EUR 1 4,703 –331
B. Other shareholdings (only capital shares totalling at least 20 %)
2 Aurelia Technologie-Fonds I GmbH & Co. Beteiligungen KG Frankfurt am Main 24.6 EUR 1 5,043 600
3 BioM VC GmbH & Co. Fonds KG Munich 22.3 EUR 1 2,153 –3
4 Bremer Unternehmensbeteiligungs- gesellschaft mbH Bremen 20.0 EUR 1 8,618 248
5 Chromatec GmbH Greifswald 24.8 EUR 1 32 0
6 CV Cryptovision GmbH Gelsenkirchen 23.4 EUR 1 1,698 305
7 eCapital New Technologies Fonds AG & Co. Unternehmensbeteiligungs- gesellschaft KG Münster 24.8 EUR 1 2,924 –13
8 Fama Fassaden GmbH Zottelstedt 24.7 EUR 1 125 –62
9 FIB Fonds für Innovation und Beschäf- tigung Rheinland-Pfalz UBG mbH Mainz 24.0 EUR 1 2,094 –207
10 i42 Informationsmanagement GmbH Mannheim 20.9 EUR 1 81 20
11 infoRoad GmbH Heroldsberg 22.5 EUR 1 139 19
12 KTB Technologie Beteiligungsgesell- schaft mbH & Co. KG Leverkusen 25.0 EUR 1 3,154 –411
13 Medizin Forum AG Bad Nauheim 24.9 EUR 1 24 –8
14 Premium Bodywear AG Chemnitz 24.0 EUR 1 395 84
15 Prudsys AG Chemnitz 24.9 EUR 1 1,380 156
16 Saarländische Wagnisfinanzierungs- gesellschaft mbH Saarbrücken 20.4 EUR 1 6,695 –448
KfW Financial Information 2014 Consolidated financial statements | Notes – Other notes
149
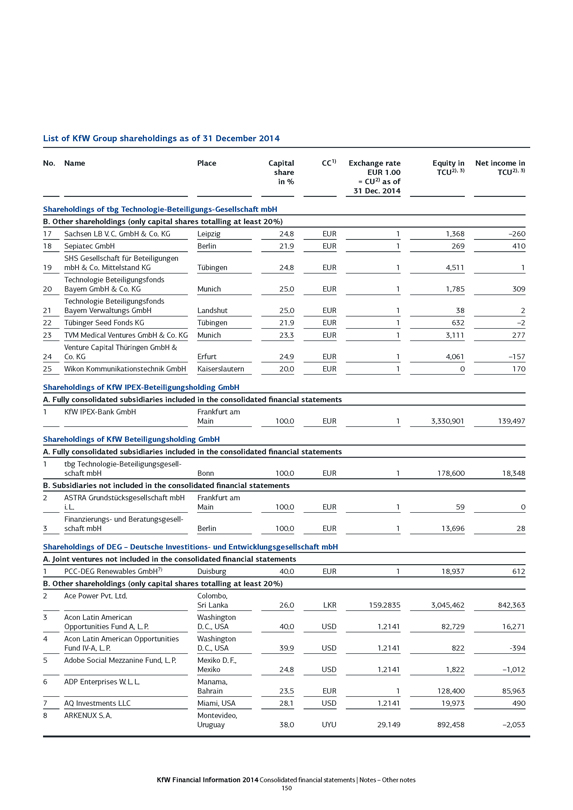
List of KfW Group shareholdings as of 31 December 2014
No. Name Place Capital share in % CC1) Exchange rate EUR 1.00 = CU2) as of 31 Dec. 2014 Equity in TCU2), 3) Net income in TCU2), 3)
Shareholdings of tbg Technologie-Beteiligungs-Gesellschaft mbH
B. Other shareholdings (only capital shares totalling at least 20 %)
17 Sachsen LB V. C. GmbH & Co. KG Leipzig 24.8 EUR 1 1,368 –260
18 Sepiatec GmbH Berlin 21.9 EUR 1 269 410
19 SHS Gesellschaft für Beteiligungen mbH & Co. Mittelstand KG Tübingen 24.8 EUR 1 4,511 1
20 Technologie Beteiligungsfonds Bayern GmbH & Co. KG Munich 25.0 EUR 1 1,785 309
21 Technologie Beteiligungsfonds Bayern Verwaltungs GmbH Landshut 25.0 EUR 1 38 2
22 Tübinger Seed Fonds KG Tübingen 21.9 EUR 1 632 –2
23 TVM Medical Ventures GmbH & Co. KG Munich 23.3 EUR 1 3,111 277
24 Venture Capital Thüringen GmbH & Co. KG Erfurt 24.9 EUR 1 4,061 –157
25 Wikon Kommunikationstechnik GmbH Kaiserslautern 20.0 EUR 1 0 170
Shareholdings of KfW IPEX-Beteiligungsholding GmbH
A. Fully consolidated subsidiaries included in the consolidated financial statements
1 KfW IPEX-Bank GmbH Frankfurt am Main 100.0 EUR 1 3,330,901 139,497
Shareholdings of KfW Beteiligungsholding GmbH
A. Fully consolidated subsidiaries included in the consolidated financial statements
1 tbg Technologie-Beteiligungsgesell- schaft mbH Bonn 100.0 EUR 1 178,600 18,348
B. Subsidiaries not included in the consolidated financial statements
2 ASTRA Grundstücksgesellschaft mbH i. L. Frankfurt am Main 100.0 EUR 1 59 0
3 Finanzierungs- und Beratungsgesell- schaft mbH Berlin 100.0 EUR 1 13,696 28
Shareholdings of DEG – Deutsche Investitions- und Entwicklungsgesellschaft mbH
A. Joint ventures not included in the consolidated financial statements
1 PCC-DEG Renewables GmbH7) Duisburg 40.0 EUR 1 18,937 612
B. Other shareholdings (only capital shares totalling at least 20 %)
2 Ace Power Pvt. Ltd. Colombo, Sri Lanka 26.0 LKR 159.2835 3,045,462 842,363
3 Acon Latin American Opportunities Fund A, L. P. Washington D. C., USA 40.0 USD 1.2141 82,729 16,271
4 Acon Latin American Opportunities Fund IV-A, L. P. Washington D. C., USA 39.9 USD 1.2141 822 -394
5 Adobe Social Mezzanine Fund, L. P. Mexiko D. F., Mexiko 24.8 USD 1.2141 1,822 –1,012
6 ADP Enterprises W. L. L. Manama, Bahrain 23.5 EUR 1 128,400 85,963
7 AQ Investments LLC Miami, USA 28.1 USD 1.2141 19,973 490
8 ARKENUX S. A. Montevideo, Uruguay 38.0 UYU 29.149 892,458 –2,053
KfW Financial Information 2014 Consolidated financial statements | Notes – Other notes
150
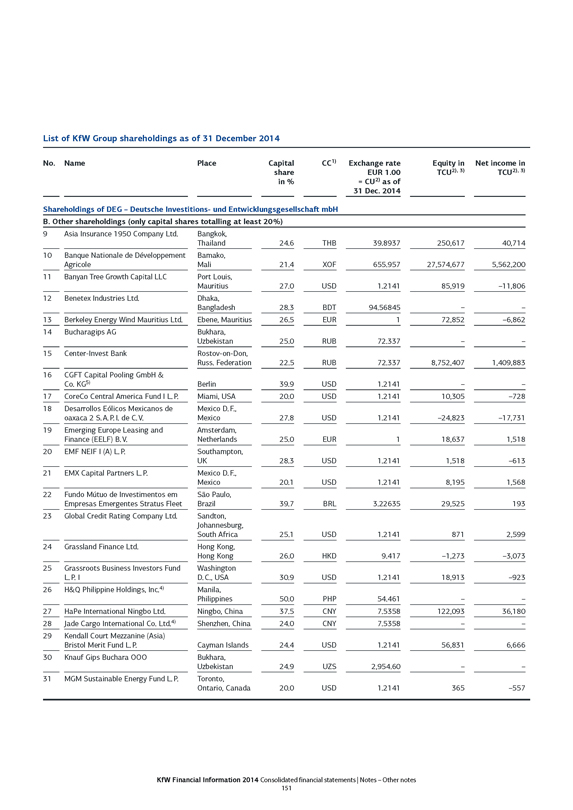
List of KfW Group shareholdings as of 31 December 2014
No. Name Place Capital share in % CC1) Exchange rate EUR 1.00 = CU2) as of 31 Dec. 2014 Equity in TCU2), 3) Net income in TCU2), 3)
Shareholdings of DEG – Deutsche Investitions- und Entwicklungsgesellschaft mbH
B. Other shareholdings (only capital shares totalling at least 20 %)
9 Asia Insurance 1950 Company Ltd. Bangkok, Thailand 24.6 THB 39.8937 250,617 40,714
10 Banque Nationale de Développement Agricole Bamako, Mali 21.4 XOF 655.957 27,574,677 5,562,200
11 Banyan Tree Growth Capital LLC Port Louis, Mauritius 27.0 USD 1.2141 85,919 –11,806
12 Benetex Industries Ltd. Dhaka, Bangladesh 28.3 BDT 94.56845 – –
13 Berkeley Energy Wind Mauritius Ltd. Ebene, Mauritius 26.5 EUR 1 72,852 –6,862
14 Bucharagips AG Bukhara, Uzbekistan 25.0 RUB 72.337 – –
15 Center-Invest Bank Rostov-on-Don, Russ. Federation 22.5 RUB 72.337 8,752,407 1,409,883
16 CGFT Capital Pooling GmbH & Co. KG5) Berlin 39.9 USD 1.2141 – –
17 CoreCo Central America Fund I L. P. Miami, USA 20.0 USD 1.2141 10,305 –728
18 Desarrollos Eólicos Mexicanos de oaxaca 2 S. A. P. I. de C. V. Mexico D. F., Mexico 27.8 USD 1.2141 –24,823 –17,731
19 Emerging Europe Leasing and Finance (EELF) B. V. Amsterdam, Netherlands 25.0 EUR 1 18,637 1,518
20 EMF NEIF I (A) L. P. Southampton, UK 28.3 USD 1.2141 1,518 –613
21 EMX Capital Partners L. P. Mexico D. F., Mexico 20.1 USD 1.2141 8,195 1,568
22 Fundo Mútuo de Investimentos em Empresas Emergentes Stratus Fleet São Paulo, Brazil 39.7 BRL 3.22635 29,525 193
23 Global Credit Rating Company Ltd. Sandton, Johannesburg, South Africa 25.1 USD 1.2141 871 2,599
24 Grassland Finance Ltd. Hong Kong, Hong Kong 26.0 HKD 9.417 –1,273 –3,073
25 Grassroots Business Investors Fund L. P. I Washington D. C., USA 30.9 USD 1.2141 18,913 –923
26 H&Q Philippine Holdings, Inc.4) Manila, Philippines 50.0 PHP 54.461 – –
27 HaPe International Ningbo Ltd. Ningbo, China 37.5 CNY 7.5358 122,093 36,180
28 Jade Cargo International Co. Ltd.4) Shenzhen, China 24.0 CNY 7.5358 – –
29 Kendall Court Mezzanine (Asia) Bristol Merit Fund L. P. Cayman Islands 24.4 USD 1.2141 56,831 6,666
30 Knauf Gips Buchara OOO Bukhara, Uzbekistan 24.9 UZS 2,954.60 – –
31 MGM Sustainable Energy Fund L. P. Toronto, Ontario, Canada 20.0 USD 1.2141 365 –557
KfW Financial Information 2014 Consolidated financial statements | Notes – Other notes
151
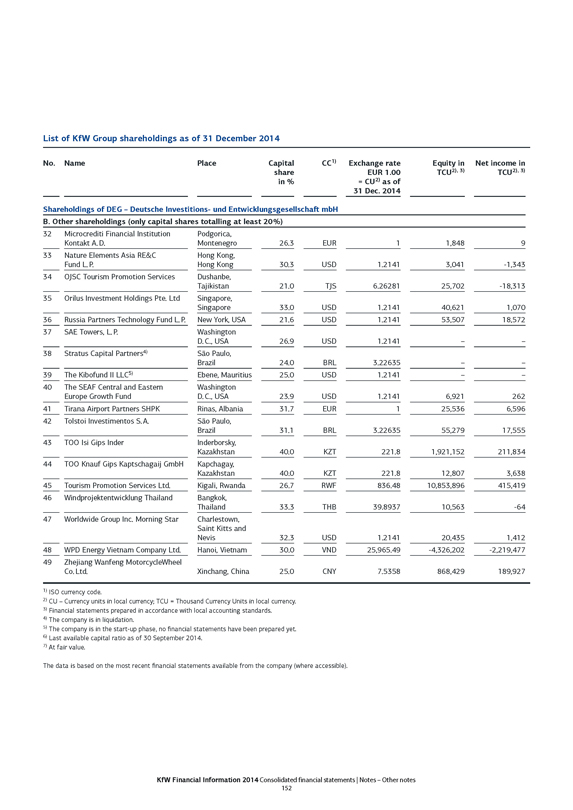
List of KfW Group shareholdings as of 31 December 2014
No. Name Place Capital share in % CC1) Exchange rate EUR 1.00 = CU2) as of 31 Dec. 2014 Equity in TCU2), 3) Net income in TCU2), 3)
Shareholdings of DEG – Deutsche Investitions- und Entwicklungsgesellschaft mbH
B. Other shareholdings (only capital shares totalling at least 20 %)
32 Microcrediti Financial Institution Kontakt A. D. Podgorica, Montenegro 26.3 EUR 1 1,848 9
33 Nature Elements Asia RE&C Fund L. P. Hong Kong, Hong Kong 30.3 USD 1.2141 3,041 -1,343
34 OJSC Tourism Promotion Services Dushanbe, Tajikistan 21.0 TJS 6.26281 25,702 -18,313
35 Orilus Investment Holdings Pte. Ltd Singapore, Singapore 33.0 USD 1.2141 40,621 1,070
36 Russia Partners Technology Fund L. P. New York, USA 21.6 USD 1.2141 53,507 18,572
37 SAE Towers, L. P. Washington D. C., USA 26.9 USD 1.2141 – –
38 Stratus Capital Partners4) São Paulo, Brazil 24.0 BRL 3.22635 – –
39 The Kibofund II LLC5) Ebene, Mauritius 25.0 USD 1.2141 – –
40 The SEAF Central and Eastern Europe Growth Fund Washington D. C., USA 23.9 USD 1.2141 6,921 262
41 Tirana Airport Partners SHPK Rinas, Albania 31.7 EUR 1 25,536 6,596
42 Tolstoi Investimentos S. A. São Paulo, Brazil 31.1 BRL 3.22635 55,279 17,555
43 TOO Isi Gips Inder Inderborsky, Kazakhstan 40.0 KZT 221.8 1,921,152 211,834
44 TOO Knauf Gips Kaptschagaij GmbH Kapchagay, Kazakhstan 40.0 KZT 221.8 12,807 3,638
45 Tourism Promotion Services Ltd. Kigali, Rwanda 26.7 RWF 836.48 10,853,896 415,419
46 Windprojektentwicklung Thailand Bangkok, Thailand 33.3 THB 39.8937 10,563 -64
47 Worldwide Group Inc. Morning Star Charlestown, Saint Kitts and Nevis 32.3 USD 1.2141 20,435 1,412
48 WPD Energy Vietnam Company Ltd. Hanoi, Vietnam 30.0 VND 25,965.49 -4,326,202 -2,219,477
49 Zhejiang Wanfeng MotorcycleWheel Co. Ltd. Xinchang, China 25.0 CNY 7.5358 868,429 189,927
1) ISO currency code.
2) CU – Currency units in local currency; TCU = Thousand Currency Units in local currency.
3) Financial statements prepared in accordance with local accounting standards.
4) The company is in liquidation.
5) The company is in the start-up phase, no financial statements have been prepared yet.
6) Last available capital ratio as of 30 September 2014.
7) At fair value.
The data is based on the most recent financial statements available from the company (where accessible).
KfW Financial Information 2014 Consolidated financial statements | Notes – Other notes
152

>>> Attestation
KFW
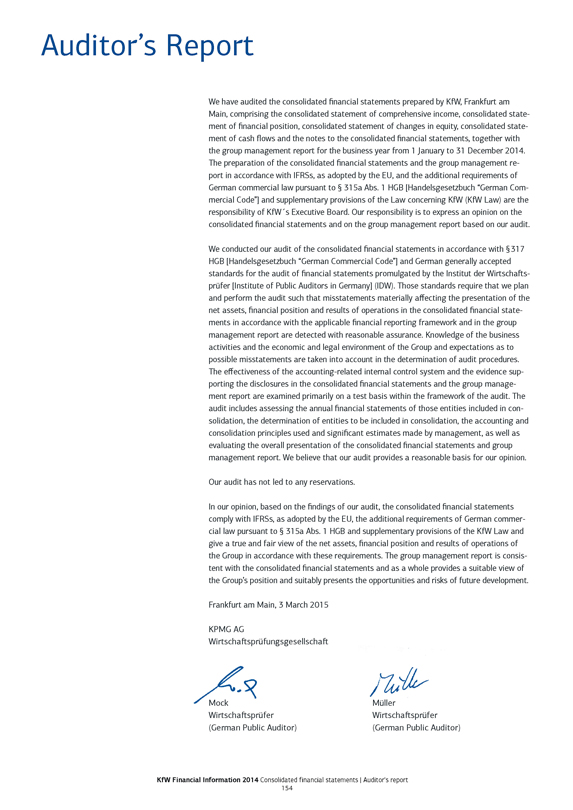
Auditor’s Report
We have audited the consolidated financial statements prepared by KfW, Frankfurt am Main, comprising the consolidated statement of comprehensive income, consolidated statement of financial position, consolidated statement of changes in equity, consolidated statement of cash flows and the notes to the consolidated financial statements, together with the group management report for the business year from 1 January to 31 December 2014. The preparation of the consolidated financial statements and the group management report in accordance with IFRSs, as adopted by the EU, and the additional requirements of German commercial law pursuant to § 315a Abs. 1 HGB [Handelsgesetzbuch “German Commercial Code”] and supplementary provisions of the Law concerning KfW (KfW Law) are the responsibility of KfW’s Executive Board. Our responsibility is to express an opinion on the consolidated financial statements and on the group management report based on our audit.
We conducted our audit of the consolidated financial statements in accordance with § 317 HGB [Handelsgesetzbuch “German Commercial Code”] and German generally accepted standards for the audit of financial statements promulgated by the Institut der Wirtschafts-prüfer [Institute of Public Auditors in Germany] (IDW). Those standards require that we plan and perform the audit such that misstatements materially affecting the presentation of the net assets, financial position and results of operations in the consolidated financial statements in accordance with the applicable financial reporting framework and in the group management report are detected with reasonable assurance. Knowledge of the business activities and the economic and legal environment of the Group and expectations as to possible misstatements are taken into account in the determination of audit procedures. The effectiveness of the accounting-related internal control system and the evidence supporting the disclosures in the consolidated financial statements and the group management report are examined primarily on a test basis within the framework of the audit. The audit includes assessing the annual financial statements of those entities included in consolidation, the determination of entities to be included in consolidation, the accounting and consolidation principles used and significant estimates made by management, as well as evaluating the overall presentation of the consolidated financial statements and group management report. We believe that our audit provides a reasonable basis for our opinion.
Our audit has not led to any reservations.
In our opinion, based on the findings of our audit, the consolidated financial statements comply with IFRSs, as adopted by the EU, the additional requirements of German commercial law pursuant to § 315a Abs. 1 HGB and supplementary provisions of the KfW Law and give a true and fair view of the net assets, financial position and results of operations of the Group in accordance with these requirements. The group management report is consistent with the consolidated financial statements and as a whole provides a suitable view of the Group’s position and suitably presents the opportunities and risks of future development.
Frankfurt am Main, 3 March 2015
KPMG AG
Wirtschaftsprüfungsgesellschaft
Mock
Wirtschaftsprüfer (German Public Auditor)
Müller
Wirtschaftsprüfer (German Public Auditor)
KfW Financial Information 2014 Consolidated financial statements | Auditor’s report
154