Exhibit (e)
 Group management report

Basic information on KfW Group
Overview
KfW Group consists of KfW and five consolidated subsidiaries. As the promotional bank of the Federal Republic of Germany – which owns 80% of KfW while the German Federal States own 20% – KfW is one of the world’s leading promotional banks. The institutional framework for the promotional mandate including the Federal Republic of Germany’s liability for KfW’s obligations is defined in the Law Concerning KfW (KfW Law).
KfW supports sustainable improvement of economic, social and environmental conditions around the world, with an emphasis on promotion of the German economy. In its promotional activities, KfW focuses on societal megatrends. A variety of different financing products and services address in particular the areas small and medium-sized enterprises (SMEs), start-ups, environmental protection, the housing sector, infrastructure, education, export and project finance, and development cooperation. The
domestic promotional lending business with enterprises and private individuals is characterised by the proven and successful strategy of on-lending, in which KfW extends loans to commercial banks, which, in turn, lend the funds to the ultimate borrowers at favourable rates. This strategy eliminates any need for KfW to have its own network of branch offices. Business activities are funded almost fully through the international capital markets; KfW is one of the most active and largest bond issuers worldwide. In addition to KfW, the group’s main operating subsidiaries are (i) KfW IPEX-Bank, which provides export and project financing, and (ii) DEG, which is active in promoting the private sector in developing countries and emerging economies.
In accordance with the business sector structure for KfW Group, the sectors and their main products and services can be presented as follows:
| | | | |
| Mittelstandsbank (SME Bank) | | | | – Financing of industrial pollution control and corporate investments |
| | | | – Equity financing |
| | | | – Advisory services |
| | | | |
Kommunal– und Privatkundenbank/Kreditinstitute (Municipal and Private Client Bank/Credit Institutions) | | | | – Financing for housing construction and modernisation |
| | | | – Education finance |
| | | | – Infrastructure and social finance |
| | | | – Global funding of the promotional institutions of the federal states |
| | | | (Landesförderinstitute) |
| | | | – Individual financing of banks |
| | | | – Transactions on behalf of the Federal Government |
| | | | |
| Export and project finance | | | | – Financing for German and European export activities |
| | | | – Financing for projects and investments in German and European interests |
| | | | |
| Promotion of developing countries and emerging economies | | | | – Promotion of developing countries and emerging economies on behalf of the |
| | | | Federal Government (budget funds) with complementary market funds raised by KfW |
| | | | – Financing provided by DEG – Deutsche Investitions- und |
| | | | Entwicklungsgesellschaft mbH (private enterprise financing) |
| | | | |
| Financial markets | | | | – Securities and money market investments |
| | | | – Holding arrangements of the Federal Republic of Germany |
| | | | – Transactions mandated by the Federal Government, loan granted to Greece |
| | | | – Funding |
| | | | |
| Head office | | | | – Central interest rate and currency management |
| | | | – Strategic equity investments |
3
KfW Financial Information 2016 Group management report
Composition of KfW Group – Total assets (IFRS, before consolidation)
| | | | | | | | | | | | | | | | | | |
| | | | | | | 31 Dec. 2016 | | | | | | | | | | 31 Dec. 2015 | | |
| | | | | | | EUR in millions | | | | | | | | | | EUR in millions | | |
| | | | | | | |
| KfW, Frankfurt am Main, Germany | | | | | | 505,597 | | | | | | | | | | 502,348 | | |
| Subsidiaries | | | | | | | | | | | | | | | | | | |
| KfW IPEX-Bank GmbH, Frankfurt am Main (KfW IPEX-Bank), Germany | | | | | | 30,561 | | | | | | | | | | 29,547 | | |
| DEG – Deutsche Investitions- und Entwicklungsgesellschaft mbH, Cologne (DEG), Germany | | | | | | 6,260 | | | | | | | | | | 6,244 | | |
| KfW IPEX-Beteiligungsholding GmbH, Frankfurt am Main, Germany1) | | | | | | 0 | | | | | | | | | | 2,378 | | |
| KfW Beteiligungsholding GmbH, Bonn, Germany | | | | | | 2,552 | | | | | | | | | | 414 | | |
| tbg Technologie-Beteiligungs-Gesellschaft mbH, Bonn (tbg), Germany | | | | | | 188 | | | | | | | | | | 207 | | |
| Interkonnektor GmbH, Frankfurt am Main, Germany | | | | | | 95 | | | | | | | | | | 50 | | |
| Investments accounted for using the equity method | | | | | | | | | | | | | | | | | | |
| Microfinance Enhancement Facility S.A., Luxembourg (19,8%), Luxembourg | | | | | | 617 | | | | | | | | | | 613 | | |
| Green for Growth Fund, Southeast Europe S.A., Luxembourg (17,6%), Luxembourg | | | | | | 373 | | | | | | | | | | 332 | | |
| AF Eigenkapitalfonds für deutschen Mittelstand GmbH & Co. KG, Munich (47,5%), Germany | | | | | | 193 | | | | | | | | | | 149 | | |
| DC Nordseekabel GmbH & Co. KG, Bayreuth (50,0 %), Germany | | | | | | 277 | | | | | | | | | | 127 | | |
coparion GmbH & Co. KG, Cologne (20,0%), Germany | | | | | | 6 | | | | | | | | | | 0 | | |
| 1) | KfW IPEX-Beteiligungsholding GmbH was merged into KfW Beteiligungsholding GmbH effective 1 January 2016. |
The development of the group’s operating result is largely dependent on KfW.
Strategic objectives
KfW Group has a set of strategic objectives in place that define KfW’s targeted medium-term positioning. This framework encompasses selected top-level objectives at the overall bank level and serves as a central, binding reference for the strategic orientation of all business sectors, with a five-year horizon.
The primary objective of all of KfW’s market areas is promotion – the heart of KfW’s business activities – abiding by the principles of subsidiarity and sustainability. KfW addresses the primary objective of promotion largely by focusing its promotional activities on the socially and economically important mega-trends of “climate change and the environment”, “globalisation and technological progress”, and “demographic change”.
In relation to the “climate change and the environment” mega-trend, KfW finances measures to support renewable energies, improve energy efficiency, safeguard biodiversity and prevent and/or reduce environmental pollution. To address the special importance of this megatrend, KfW has set an environmental commitment ratio of around 35% of total promotional business volume. In the context of the “globalisation and technological progress” megatrend, KfW contributes to strengthening the
international competitiveness of German companies by granting loans in the following areas, among others: research and innovation, projects to secure Germany’s supply of raw materials, and infrastructure and transport. With respect to the “demographic change” megatrend, KfW’s objective is to address the consequences that result from a declining and aging population, including the following focus areas: age-appropriate infrastructure, vocational and further training, family policy and childcare as well as corporate succession. KfW’s commitment in domestic business to meeting the challenges presented by the refugee issue is also reflected in this megatrend. KfW also focuses on “non-trend-based promotional issues” that play an important role for KfW but that are not related to any of the three mega-trends, such as combating poverty in developing countries.
In addition to focusing on the issues described above, the primary objective in the bank’s strategic framework also extends to covering KfW’s most important customer groups and regions as well as to ensuring promotional quality. For KfW, this means a commitment to maintain the high level of quality of its promotional products that it has achieved in recent years and sufficient coverage of KfW’s key regions and customer groups. Given the
4
KfW Financial Information 2016 Group management report
special importance of SMEs, KfW aims to have around 45% of its domestic promotional business volume utilised for this target group.
The stated priorities set for the primary objective are complemented by a set of secondary objectives or strict ancillary conditions that reflect profitability and efficiency, as well as
risk-bearing capacity and liquidity aspects. KfW acts in accordance with the principle of subsidiarity and plans nominal growth of 2% to 3% p. a. as measured by the group’s total commitment volume. Moreover, KfW’s success depends upon continuing to pursue the path of professionalism in the modernisation process upon which it has embarked.
Internal management system
KfW has a closely interlinked strategy and planning process. Conceived as a group-wide strategy process, group business sector planning is KfW Group’s central planning and management tool. Group business sector planning consists of two consecutive sub-processes performed every year: strategic planning and operational planning. Part of the overall strategy and planning process is an intense exchange with the Risk Controlling department.
The group-wide strategic objectives set by the Executive Board form the basis for strategic planning. This system of objectives serves KfW Group as a clear roadmap, indicating the direction in which KfW would like to develop over the next five years. The strategic objectives are reviewed annually and updated to reflect changing requirements and fill in any gaps. Efforts are made, however, to maintain a high degree of consistency to ensure that there are no fundamental changes made to strategic impetus in the course of the annual review. Strategic medium-term courses of action are developed by the business sectors within this strategic framework. Assumptions regarding the future development of determining factors are made on the basis of assessments of risks and opportunities. This analysis takes into account both external factors (including market development, regulatory requirements, the competitive situation, customer behaviour) and internal factors and resources (including human and capital resources, promotional activity, primary cost planning, tied-up capital) and targeted earnings levels. The central departments (e. g. information technology, human resources and central services) play important roles in achieving the strategic objectives. By involving these departments, their own strategies are aligned with the strategic objectives. Cost planning and full-time equivalent (staff) planning are conducted in parallel to business sector strategic planning for all business sectors for the entire planning period, applying a top-down approach. The underlying assumptions are reviewed annually via a rolling planning process. The Executive Board defines business sector objectives for all sectors in the form of guidelines (with regard to operations, risk and budget) for the entire planning period on the basis of the group-wide strategic assessment.
In operations planning, the business sectors plan their new business, risks and earnings, and all departments of the bank plan their budgets based on the guidelines issued by the Executive Board, taking into account any changes in external or internal factors. These plans are checked for consistency with the group’s and business sectors’ strategic planning. The plans are also assessed for future risk-bearing capacity. The Executive Board
either approves the resultant operating budget or has plans fine-tuned in a revision round. The external assumptions underlying the plans are also checked at this stage.
The key conclusions from the planning process are incorporated into the business and risk strategies. The management has overall responsibility for formulating and adopting both strategies. The business strategy comprises the group’s strategic objectives for its main business activities as well as important internal and external factors, which are included in the strategy process. It also contains the business sectors’ contribution to the strategic objectives and the measures for achieving each objective. Moreover, the business strategy combines the operating budget at the group and business sector levels. The Executive Board sets KfW Group’s risk policies in its risk strategy, which is consistent with the business strategy. KfW Group has defined strategic risk objectives for factors including risk-bearing capacity and liquidity. The main risk management approaches and risk tolerance are also incorporated into the risk strategy as a basis for operational risk management. Any changes to the business strategy are subject to consultation with the Risk Controlling department in order to ensure consistency between the business and risk strategy.
The Executive Board draws up the operating budget for the entire planning period, including any future capital requirement as well as the business and risk strategy. The budget is then presented to the supervisory body (Board of Supervisory Directors) for approval, along with the business and risk strategy for discussion. After the Board of Supervisory Directors has dealt with the business and risk strategy, it is appropriately communicated to the staff.
When the group business sector planning is approved, this establishes the group’s qualitative and quantitative objectives. The Executive Board reviews achievement of these objectives as part of controlling on both a regular and an ad hoc basis during the current financial year. The assumptions concerning external and internal factors made when determining the business strategy are also subject to regular checks. The development of relevant control variables, their attainment, and the cause of any failure in this respect are analysed as part of strategic controlling. An integrated forecasting process which was further developed in 2016 serves at mid-year as a comprehensive basis for interim quantitative management input on group variables of strategic importance (new business, risks, and earnings in respect of
5
KfW Financial Information 2016 Group management report
funding opportunities), while functioning as a well-founded guide to achieving planned objectives. Backtesting of central planning parameters was also expanded in 2016 with the aim of validating planning methods and parameters. Ad hoc issues of strategic relevance are also addressed in consultation with the group’s departments. Recommendations for action concerning potential strategy adjustments or optimising the use of resources are made to the Executive Board by means of the strategic performance report. The results of the analysis are included in further strategy discussions and strategic planning processes. The achievement of objectives is regularly monitored by the Board of Supervisory Directors based on reports submitted to under the KfW Bylaws. The commentary in these reports outlines analyses of causes and any potential plans for action. Compre-
hensive and detailed reports are prepared on a monthly or quarterly basis as part of operational controlling. These comprehensive detailed analyses at group, business sector and/or product group level comprise earnings, cost and full-time equivalent (staff) developments and are reported to specific departments. Additionally, complete analyses of significant relevance to overall group performance are also presented directly to the Executive Board. Risk controlling has been implemented alongside strategic and operational controlling. Early warning systems have been established and mitigation measures defined for all material risk types in line with the risk management requirements set out in the risk strategy. All controlling and monitoring approaches are integrated into regular and comprehensive risk reporting.
Alternative key financial figures used by KfW
The KfW Group management report contains key financial figures that are not determined in accordance with IFRS. KfW uses key financial figures in its strategic objectives that treat promotion as the core business activity. It also uses key figures in which the temporary effects on results, determined and reported in the consolidated financial statements in accordance with IFRS and which KfW does not consider representative, are adjusted.
KfW has defined the following alternative key financial figures:
Promotional business volume
Promotional business volume comprises the respective commitments of the individual business sectors in the reporting period. In addition to the lending commitments shown in the statement of financial position, promotional business volume comprises loans from Federal Government funds for promotion of developing countries and emerging economies – which are accounted for as trust activities – financial guarantees, equity financing and securities purchases in certain asset classes (green bonds, SME loan securitisation). Promotional business volume also includes grants committed as part of development aid and in domestic promotional programmes. Allocation to Promotional business volume for the current financial year is generally based on the commitment date of each loan, financial guarantee and grant, and the transaction date of the equity finance and securities transactions. On the other hand, allocation of global loans to the promotional institutions of the federal states (Landesförderinstitute) and BAföG government loans is based on individual drawdown volume and date, instead of the total volume of the contract at the time of commitment. Financing amounts denominated in foreign currency are translated into euros in the lending business at the exchange rate on the commitment date, and in the securities and equity finance business generally at the rate on the transaction date. See the “Development of KfW Group” economic report or segment reports for a breakdown of promotional business volume by individual segment.
Promotional activity
Promotional activity is understood to mean certain expenses of the two business sectors Mittelstandsbank (SME Bank) and Kommunal- und Privatkundenbank/Kreditinstitute (Municipal and Private Client Bank/Credit Institutions) with a positive impact on the achievement of KfW’s promotional objectives.
The key component of KfW’s promotional activity comprises interest rate reductions accounted for at present value. KfW grants these reductions for certain domestic promotional loans for new business during the first fixed interest rate period in addition to passing on KfW’s favourable funding conditions. The difference between the fair value of these promotional loans and the transaction value during the first fixed interest rate period, due to the interest rate being below the market rate, is recognised in profit or loss as an interest expense and accounted for as an adjustment to the carrying amount under the items Loans and advances to banks or Loans and advances to customers. In addition, the accumulated interest rate reductions over the fixed interest rate period are recognised in Net interest income through profit or loss (see the relevant Notes to KfW’s promotional lending business, Loans and advances to banks or customers, and provisions).
Promotional components in Commission expense include upfront fees paid to sales partners for processing microloans as well as grants for provision of advice to start-ups and SMEs in financial difficulties in the promotional programmes committed by KfW (“Start-up coaching in Germany”, “Round Table” and “Turnaround Consulting”) until the end of December 2015. Promotional expenses from KfW’s one-time financing share in the advisory programme newly launched by the Federal Office of Economics and Export Control (Bundesamt für Wirtschaft und Ausfuhrkontrolle – “BAFA”) in 2016 to promote entrepreneurial knowledge and skills are also taken into account.
Promotional activity also contains disposable and product-related marketing and sales expenses (Administrative expense).
6
KfW Financial Information 2016 Group management report
Cost/income ratio (before promotional activity)
The cost/income ratio (before promotional activity) comprises Administrative expense (excluding promotional activity) in relation to Net interest income and Net commission income before promotional activity.
The cost/income ratio (CIR) shows costs in relation to income and is thus a measure of efficiency. By incorporating the CIR as a long-term measure of efficiency into its strategic objectives, KfW aims to strengthen its leading position in Germany’s promotional banking landscape. The reason for this way of calculating the cost/income ratio is that promotional activity is a promotional bank-specific expense (and, as an interest rate reduction accounted for at present value, gives a multi-period view). To enable comparison of the CIR with other (non-promotional) institutions and to determine a correct standardised amount, it is necessary to make an adjustment for promotional activity expenses to the numerator (Administrative expense) and denominator (Net interest income and Net commission income). Promotional activity is managed separately and independently via own budgets.
Consolidated profit before IFRS effects
Consolidated profit before IFRS effects from hedging is another key financial figure based on Consolidated profit in accordance
with IFRS. Derivative financial instruments are entered into for hedging purposes. Under IFRS, the requirements for the recognition and valuation of derivatives and hedges nevertheless give rise to temporary net gains or losses. In KfW’s opinion, such net gains or losses do not sufficiently reflect economically effective hedges in financial terms.
As a result, the following reconciliations were performed by eliminating temporary contributions to income as follows:
| – | Valuation results from micro and macro hedge accounting. All hedging relationships are economically effective and do not give rise to any net gain or loss over the entire life of the hedge. |
| – | Net gains or losses from the use of the fair value option to avoid an accounting mismatch in the case of funding including related hedging derivatives. Accumulated over the entire life of the hedge, the economically effective hedges do not give rise to any net gain or loss. |
| – | Net gains or losses from the fair value accounting of hedges with high economic effectiveness but not qualifying for hedge accounting. These hedges do not give rise to any net gain or loss over the entire period to maturity. |
| – | Net gains or losses from foreign currency translation of foreign currency positions, in accordance with recognition and valuation requirements for derivatives and hedging relationships. |
7
KfW Financial Information 2016 Group management report
Economic report
General economic environment
Global economic growth in 2016 stagnated close to prior-year levels, although with contrasting performances by different economic areas. Growth slowed down in industrialised nations, particularly in the United States (US). Consumer spending proved robust in the industrialised nations, and a favourable interest rate environment continued. Meanwhile, private and public-sector investment was weak. While decreasing energy and commodity prices stimulated growth in many industrialised countries in 2015, this effect was much less pronounced in 2016. After several years of declining growth that continued into 2015, developing countries and emerging economies saw economic activity pick up somewhat in 2016. However, also within this group of countries, trends varied. In China, growth continued to cool gradually, while crisis-hit Brazil and Russia remained stuck in recession. By contrast, a number of other emerging economies and many poorer developing countries recorded solid growth. Global trade again saw only a weak increase in 2016, which was primarily attributable to the industrialised countries.
Economic recovery continued at a moderate pace in the member states of the European Economic and Monetary Union (EMU). Overall, the economic output in EMU member states rose by 1.7% year-on-year in 2016. This increase was in line with KfW’s expectations. The European economy thus held up well in the face of major political uncertainty following the Brexit vote in June and concerns about parts of the banking sector. The low oil price, a favourable exchange rate and spending to help refugees all provided a tailwind, as did the continued expansionary monetary policy, which further reduced financing costs. Consumer spending remained the main pillar of growth and continued to benefit from the rising employment rate. Government consumption and gross fixed capital formation also contributed to positive growth. However, investment activity continued to show structural weakness. Foreign trade growth halved in line with the slowing of global trade flows. However, as imports and exports were similarly affected by the slowdown, net exports (exports minus imports) only had a negligible dampening effect on growth.
Germany grew by a strong 1.9% in 2016 according to initial estimates by the German Federal Statistical Office and thus at a similar pace as the 1.7% growth recorded in 2015. A year ago, KfW predicted economic growth for 2016 to be on a par with that of the previous year and therefore accurately anticipated
the actual development of gross domestic product. Domestic demand remained strong. Consumption was by far the key driver, having profited from the continuous increase in employment and a noticeable increase in real wages. Private investment in housing construction has been growing since 2010 and accelerated in 2016. Private investments in equipment were in slightly positive territory, while investments in commercial buildings decreased again over the year as a whole. Corporate investments exhibited strong growth particularly at the beginning of 2016. A considerable slowdown followed during the remainder of the year. This was probably primarily attributable to the unexpected Brexit vote and the protectionist plans expressed by the new US president during the election campaign, which unsettled export-oriented German companies and caused them to postpone their investment decisions. Amid moderate export growth, net exports slightly dampened economic growth as strong domestic demand caused imports to rise somewhat more than exports.
In 2016, the financial markets continued to be dominated by very expansionary monetary policy around the world. At the start of the year, growing fears about global growth and the continued decline of the oil price put further downward pressure on prices and led the European Central Bank (ECB) to ramp up its expansionary monetary measures, once again. Global growth fears subsided over the remainder of 2016. From mid-year, however, political events – including the British electorate’s vote to leave the European Union (EU) and the outcome of the US presidential election – caused significant movement on the financial markets. Until the summer, financial market participants showed a greater preference for low-risk asset classes. A marked return in investor optimism followed only in the second half of the year, a trend accelerated by the victory of the Republican candidate in the US presidential election. The expectations of extensive fiscal stimulus made riskier asset classes considerably more attractive for investors while a noticeable correction began on the bond markets.
In response to the extremely low inflation rates, and even a temporary slide into deflation, the European Central Bank in March 2016 decided to expand its securities purchasing programme from EUR 60 billion to EUR 80 billion a month, while at the same time expanding its investment range to include investment grade corporate bonds. It also cut the deposit rate again, from –0.30% to –0.40%. This environment caused money
8
KfW Financial Information 2016 Group management report
market rates in the euro area, which were already negative across the board, to fall further. Ten-year German government bond yields also declined again, reaching negative territory for the first time in mid-June and hitting a new all-time low of
–0.19% in early July in the aftermath of the Brexit vote. In the second half of the year, however, yields on ten-year German government bonds trended upwards, again. The main factor driving yields was the US presidential election. In addition, the ECB decided at its December meeting that although it would extend its securities purchase programme until the end of 2017, the monthly purchase volume would be reduced to EUR 60 billion from April 2017 onwards. Yields on ten-year German government bonds in 2016 were down by an average of just over 40 basis points compared to the previous year.
Money market rates in the United States rose significantly, particularly in the second half of 2016. This was encouraged by the brightening economic picture, expectations of rising inflation, the election of the new US President and, last but not least,
expectations of the US Federal Reserve’s next interest rate increase. The key interest rate was raised for the second time in this tightening cycle in December.
The yields on ten-year US government bonds declined considerably in the first half of the year. It was only later, primarily in the weeks following the US presidential election, that the trend reversed markedly. The annual average for 2016 was around 30 basis points below that of the previous year. In both the United States and the euro area, the yield curve in 2016 flattened, on average, compared to 2015.
In 2016, the EUR/USD exchange rate moved in a range from just under 1.04 to 1.15. The euro initially appreciated against the US dollar in the first few months of the year, reaching its peak for the year at 1.15 at the beginning of May. It subsequently depreciated, falling to slightly below 1.04 in late December 2016. On average for 2016, the EUR/USD exchange rate remained almost unchanged from the previous year at just under 1.11.
Development of KfW Group
2016 was a successful financial year for KfW. Overall, the plans and strategic objectives for the positioning targeted in the medium term were achieved and, in some cases, far exceeded. With an increased promotional business volume of EUR 81.0 billion (2015: EUR 79.3 billion), it was also a very successful year in promotional terms. KfW made a key contribution to addressing current economic and social challenges with its promotional products. Promotional activities focused on the socially and economically significant megatrends of “climate change and the environment”, “globalisation and technical progress” and “demographic change”. The measures for a comprehensive modernisation of KfW were continued successfully.
KfW’s earnings position in 2016 developed far better than expected, primarily due to the positive valuation result, although consolidated profit was, as forecast, below that of 2015. At EUR 1.9 billion, the Operating result before valuation (before promotional activity) exceeded forecasts, despite a slight decline compared to the previous year (2015: EUR 2.1 billion), primarily due to continued favourable funding conditions for KfW. The cost/ income ratio (before promotional activity) increased to 38.4% (2015: 35.2%), due to increasing administrative costs, which were attributable, in particular, to the modernisation of KfW Group and measures addressing regulatory requirements, such as KfW’s mandatory application, by analogy, of the German Banking Act (Gesetz über das Kreditwesen – “KWG”) as well as to the slight decline in interest and commission income. The overall positive net valuation result was below the extraordinarily high level of the
previous year but still much better than expected. This was due in part to the increased but still moderate net charges from risk provisions for lending business and in part to the net gains from hedge accounting and other financial instruments at fair value through profit or loss. At EUR 2.0 billion, the consolidated profit exceeded the projected level, although it was below the level of the previous year (2015: EUR 2.2 billion). Consolidated profit adjusted for IFRS effects from hedging was EUR 1.8 billion (2015: EUR 1.9 billion). This result shows that KfW is improving its capital base, thereby safeguarding its promotional capacity in the long term and ensuring it can meet regulatory requirements. In its current consolidated income projections for 2017, KfW expects Consolidated profit before IFRS effects of around EUR 1 billion, which is at the lower end of the range of strategic projections.
Consolidated total assets rose by EUR 4.0 billion to EUR 507.0 billion in 2016. This increase was largely a result of the EUR 7.1 billion increase in net loan receivables to EUR 376.3 billion and the rise in liquidity held (+ EUR 4.6 billion). KfW’s promotional business is primarily funded in the international capital markets. The volume of own issues reported under Certificated liabilities amounted to EUR 422.6 billion (31 Dec. 2015: EUR 415.2 billion). The EUR 1.9 billion increase in equity to EUR 27.1 billion was entirely due to consolidated comprehensive income.
KfW Group’s business in 2016 was largely characterised by the following developments:
9
KfW Financial Information 2016 Group management report
A. Continued high demand for KfW products
With a promotional business volume of EUR 81.0 billion in 2016 (2015: EUR 79.3 billion), the group exceeded its projected new business volume of EUR 74.9 billion. This development was primarily due to the high demand for the promotion of climate and environmental projects, which, at 44% (2015: 37%), represents the largest proportion of total promotional volume and makes KfW one of the world’s largest finance providers in the area of climate and environmental protection.
KfW’s domestic promotional business showed dynamic development in 2016 and reached a promotional business volume of EUR 55.1 billion (2015: EUR 50.5 billion). The increase was largely due to the strong demand for housing construction loans and robust demand for commercial financing. The proportion of SME promotion at 41% was unchanged compared to the previous year.
The promotional business volume in international business remained on a stable level at EUR 24.9 billion (2015: EUR 27.9 billion). The new commitment volume in the business sector Export and project finance at EUR 16.1 billion (2015: EUR 20.2 billion) was considerably lower than in the exceptional previous year but was nevertheless around the level seen in the years prior to 2015. The business sector Promotion of developing countries and emerging economies gave a substantial boost to a promotional business volume of EUR 8.9 billion (2015: EUR 7.7 billion); the majority of new commitments were for climate and environmental protection projects.
KfW raised EUR 72.8 billion in the international capital markets to fund its business activities (2015: EUR 62.6 billion).
Promotional business volume of KfW Group
| | | | | | | | | | | | | | | | | | |
| | | | | | | 2016 | | | | | | | | | | 2015 | | |
| | | | | | | EUR in billions | | | | | | | | | | EUR in billions | | |
| | | | | | | |
| Domestic business | | | | | | 55.1 | | | | | | | | | | 50.5 | | |
| Mittelstandsbank (SME Bank) | | | | | | 21.4 | | | | | | | | | | 20.4 | | |
| Kommunal– und Privatkundenbank/Kreditinstitute (Municipal and Private Client Bank/Credit Institutions) | | | | | | 33.7 | | | | | | | | | | 30.1 | | |
| Financial markets | | | | | | 1.3 | | | | | | | | | | 1.1 | | |
| International business | | | | | | 24.9 | | | | | | | | | | 27.9 | | |
| Export and project finance | | | | | | 16.1 | | | | | | | | | | 20.2 | | |
Promotion of developing countries and emerging economies | | | | | | 8.9 | | | | | | | | | | 7.7 | | |
Volume of new commitments1) | | | | | | 81.0 | | | | | | | | | | 79.3 | | |
1) Adjusted for export and project financing refinanced through KfW programme loans
B. Stable operating result
At EUR 1,898 million (2015: EUR 2,066 million), the Operating result before valuation (before promotional activity) remained at a high level despite the expected decline. Net interest income (before promotional activity) in the amount of EUR 2,802 million (2015: EUR 2,904 million) based on continued favourable funding conditions for KfW remained the main source of income.
Net commission income (before promotional activity) of EUR 280 million remained at the prior-year level (2015: EUR 286 million).
Administrative expense (before promotional activity) increased to EUR 1,185 million (2015: EUR 1,125 million); however, this increase was below expectations. The decisive factor here was primarily extensive investments in modernising KfW Group.
C. Positive valuation result due in part to positive non-recurring effects
Charges arising from risk provisions for lending business totalled a moderate EUR 150 million in 2016. This was significantly below the projected standard risk costs but above the very low level of the previous year (EUR 48 million). The low amount of provisions recorded is also due to the limited need for provisions in the high-volume domestic business. High income from recoveries of loans previously written off, in the amount of EUR 216 million, also had a positive effect on the result. This resulted, in part, from exposures in the Export and project finance business sector.
Moreover, due to purely IFRS-induced effects from the valuation of derivatives used for hedging purposes, the earnings position was overstated by EUR 233 million (2015: EUR 271 million).
10
KfW Financial Information 2016 Group management report
A contribution to earnings of EUR 77 million (2015: EUR 147 million) from the equity investment portfolio largely resulted from the Promotion of developing countries and emerging economies business sector. Performance in the DEG portfolio was enhanced by exchange rate effects including those related to the US dollar.
The securities portfolio generated a lower contribution to earnings in 2016 of EUR 9 million (2015: EUR 18 million), which reflects the overall subdued development in the financial markets.
Other operating income from the waiver of the repayment of part of the ERP subordinated loan amounted to EUR 100 million.
D. Promotional activity lower than expected
KfW’s domestic promotional activity, which has a negative impact on KfW Group’s earnings position, decreased to EUR 230 million in 2016 (2015: EUR 345 million), which was significantly below expectations. This was due to declining interest rate reductions of EUR 193 million (2015: EUR 304 million), particularly as a result of lower demand for subsidised promotional loans and the decreased scope for reductions in the low interest rate environment.
The following key figures provide an overview of developments in 2016 and are explained in more detail below:
Key financial figures of KfW Group
| | | | | | | | | | | | | | | | | | |
| | | | | | | |
| | | | | | | 2016 | | | | | | | | | | 2015 | | |
| Key figures of the income statement | | | | | | EUR in millions | | | | | | | | | | EUR in millions | | |
| | | | | | | |
| Operating result before valuation (before promotional activity) | | | | | | 1,898 | | | | | | | | | | 2,066 | | |
| Operating result after valuation (before promotional activity) | | | | | | 2,108 | | | | | | | | | | 2,539 | | |
| Promotional activity | | | | | | 230 | | | | | | | | | | 345 | | |
| Consolidated profit | | | | | | 2,002 | | | | | | | | | | 2,171 | | |
| Cost/income ratio before promotional activity1) | | | | | | 38.4% | | | | | | | | | | 35.2% | | |
| | | | | | | |
| | | | | | | 2016 | | | | | | | | | | 2015 | | |
| Key economic figures | | | | | | EUR in millions | | | | | | | | | | EUR in millions | | |
| | | | | | | |
| Consolidated profit before IFRS effects | | | | | | 1,769 | | | | | | | | | | 1,900 | | |
| | | | | | | |
| | | | | | | 31 Dec. 2016 | | | | | | | | | | 31 Dec. 2015 | | |
| Key figures of the statement of financial position | | | | | | EUR in billions | | | | | | | | | | EUR in billions | | |
| | | | | | | |
| Total assets | | | | | | 507.0 | | | | | | | | | | 503.0 | | |
| Volume of lending | | | | | | 472.4 | | | | | | | | | | 447.0 | | |
| Volume of business | | | | | | 609.2 | | | | | | | | | | 587.2 | | |
| Equity | | | | | | 27.1 | | | | | | | | | | 25.2 | | |
Equity ratio | | | | | | 5.3% | | | | | | | | | | 5.0% | | |
| 1) | Administrative expense (before promotional activity) in relation to adjusted income. Adjusted income is calculated from Net interest income and Net commission income (in each case before promotional activity). |
11
KfW Financial Information 2016 Group management report
Development of earnings position
The earnings position in 2016 was characterised by a lower but stable operating result combined with a positive valuation result with various non-recurring effects.
This resulted in a Consolidated profit of EUR 2.0 billion, which considerably exceeded forecasts but was below the previous year’s results.
Reconciliation of earnings position before/after promotional activity for financial year 2016
| | | | | | | | | | | | | | | | | | | | | | | | | | | | | | | | | | | | | | | | |
| | | | | | | | | | | | | | | | | Promotional | | | | | | | | | | | | | | | | | |
| | | | | | | | | | | | | | | | | activity | | | | | | | | | | | | | | | | | |
| | | | | | | | | EUR in millions | | | | | | | | EUR in millions | | | | | | | | EUR in millions | | | | | | | | | |
| | | | | | | | | | | | | |
| Net interest income (before promotional activity) | | | | | | | | | | 2,802 | | | | | | | | | | –193 | | | | | | | | | | 2,610 | | | | | | | | Net interest income | | |
Net commission income (before promotional activity) | | | | | | | | | | 280 | | | | | | | | | | –23 | | | | | | | | | | 257 | | | | | | | | Net commission income | | |
Administrative expense (before promotional activity) | | | | | | | | | | 1,185 | | | | | | | | | | 14 | | | | | | | | | | 1,199 | | | | | | | | Administrative expense | | |
Operating result before valuation (before promotional activity) | | | | | | | | | | 1,898 | | | | | | | | | | –230 | | | | | | | | | | 1,668 | | | | | | | | Operating result before valuation | | |
Risk provisions for lending business | | | | | | | | | | –150 | | | | | | | | | | | | | | | | | | | | –150 | | | | | | | | Risk provisions for lending business | | |
| Net gains/losses from hedge accounting | | | | | | | | | | 294 | | | | | | | | | | | | | | | | | | | | 294 | | | | | | | | Net gains/losses from hedge accounting | | |
Net gains/losses from other financial instruments at fair value through profit or loss | | | | | | | | | | 55 | | | | | | | | | | | | | | | | | | | | 55 | | | | | | | | Net gains/losses from other financial instruments at fair value through profit or loss | | |
Net gains/losses from securities and investments | | | | | | | | | | –10 | | | | | | | | | | | | | | | | | | | | –10 | | | | | | | | Net gains/losses from securities and investments | | |
Net gains/losses from investments accounted for using the equity method | | | | | | | | | | 21 | | | | | | | | | | | | | | | | | | | | 21 | | | | | | | | Net gains/losses from investments accounted for using the equity method | | |
Operating result after valuation (before promotional activity) | | | | | | | | | | 2,108 | | | | | | | | | | –230 | | | | | | | | | | 1,878 | | | | | | | | Operating result after valuation | | |
Net other operating income | | | | | | | | | | 102 | | | | | | | | | | | | | | | | | | | | 102 | | | | | | | | Net other operating income | | |
Profit/loss from operating activities (before promotional activity) | | | | | | | | | | 2,210 | | | | | | | | | | –230 | | | | | | | | | | 1,980 | | | | | | | | Profit/loss from operating activities | | |
Promotional activity | | | | | | | | | | 230 | | | | | | | | | | –230 | | | | | | | | | | 0 | | | | | | | | – | | |
Taxes on income | | | | | | | | | | –21 | | | | | | | | | | | | | | | | | | | | –21 | | | | | | | | Taxes on income | | |
Consolidated profit | | | | | | | | | | 2,002 | | | | | | | | | | | | | | | | | | | | 2,002 | | | | | | | | Consolidated profit | | |
Temporary net gains/losses from hedge accounting | | | | | | | | | | –233 | | | | | | | | | | | | | | | | | | | | –233 | | | | | | | | Temporary net gains/losses from hedge accounting | | |
Consolidated profit before IFRS effects | | | | | | | | | | 1,769 | | | | | | | | | | | | | | | | | | | | 1,769 | | | | | | | | Consolidated profit before IFRS effects | | |
12
KfW Financial Information 2016 Group management report
Reconciliation of earnings position before/after promotional activity for financial year 2015
| | | | | | | | | | | | | | | | | | | | | | | | | | | | | | | | | | | | | | | | |
| | | | | | | | | | | | | | | | | Promotional | | | | | | | | | | | | | | | | | |
| | | | | | | | | | | | | | | | | activity | | | | | | | | | | | | | | | | | |
| | | | | | | | | EUR in millions | | | | | | | | EUR in millions | | | | | | | | EUR in millions | | | | | | | | | |
| | | | | | | | | | | | | |
| Net interest income (before promotional activity) | | | | | | | | | | 2,904 | | | | | | | | | | –304 | | | | | | | | | | 2,601 | | | | | | | | Net interest income | | |
Net commission income (before promotional activity) | | | | | | | | | | 286 | | | | | | | | | | –29 | | | | | | | | | | 257 | | | | | | | | Net commission income | | |
Administrative expense (before promotional activity) | | | | | | | | | | 1,125 | | | | | | | | | | 12 | | | | | | | | | | 1,136 | | | | | | | | Administrative expense | | |
Operating result before valuation (before promotional activity) | | | | | | | | | | 2,066 | | | | | | | | | | –345 | | | | | | | | | | 1,721 | | | | | | | | Operating result before valuation | | |
Risk provisions for lending business | | | | | | | | | | –48 | | | | | | | | | | | | | | | | | | | | –48 | | | | | | | | Risk provisions for lending business | | |
Net gains/losses from hedge accounting | | | | | | | | | | 175 | | | | | | | | | | | | | | | | | | | | 175 | | | | | | | | Net gains/losses from hedge accounting | | |
Net gains/losses from other financial instruments at fair value through profit or loss | | | | | | | | | | 303 | | | | | | | | | | | | | | | | | | | | 303 | | | | | | | | Net gains/losses from other financial instruments at fair value through profit or loss | | |
Net gains/losses from securities and investments | | | | | | | | | | 25 | | | | | | | | | | | | | | | | | | | | 25 | | | | | | | | Net gains/losses from securities and investments | | |
Net gains/losses from investments accounted for using the equity method | | | | | | | | | | 18 | | | | | | | | | | | | | | | | | | | | 18 | | | | | | | | Net gains/losses from investments accounted for using the equity method | | |
Operating result after valuation (before promotional activity) | | | | | | | | | | 2,539 | | | | | | | | | | –345 | | | | | | | | | | 2,195 | | | | | | | | Operating result after valuation | | |
Net other operating income | | | | | | | | | | 107 | | | | | | | | | | | | | | | | | | | | 107 | | | | | | | | Net other operating income | | |
Profit/loss from operating activities (before promotional activity) | | | | | | | | | | 2,647 | | | | | | | | | | –345 | | | | | | | | | | 2,302 | | | | | | | | Profit/loss from operating activities | | |
Promotional activity | | | | | | | | | | 345 | | | | | | | | | | –345 | | | | | | | | | | 0 | | | | | | | | – | | |
Taxes on income | | | | | | | | | | 130 | | | | | | | | | | | | | | | | | | | | 130 | | | | | | | | Taxes on income | | |
Consolidated profit | | | | | | | | | | 2,171 | | | | | | | | | | | | | | | | | | | | 2,171 | | | | | | | | Consolidated profit | | |
Temporary net gains/losses from hedge accounting | | | | | | | | | | –271 | | | | | | | | | | | | | | | | | | | | –271 | | | | | | | | Temporary net gains/losses from hedge accounting | | |
Consolidated profit before IFRS effects | | | | | | | | | | 1,900 | | | | | | | | | | | | | | | | | | | | 1,900 | | | | | | | | Consolidated profit before IFRS effects | | |
As expected, the Operating result before valuation (before promotional activity) was down from the previous year at EUR 1,898 million (2015: EUR 2,066 million), slightly exceeding the planned figure.
At EUR 2,802 million, Net interest income (before promotional activity) was lower than in the 2015 financial year (EUR 2,904 million) as a result of the continuing low interest rate environment, which limits the potential for profit from maturity transformation. Nevertheless, it remained the main source of income.
Interest margins in the lending business remained stable, and KfW continued to enjoy very good funding conditions on the capital and money markets, due to its top-notch credit rating. However, lower income from early repayment penalties, among other factors, caused a decline in Net interest income. Unscheduled loan repayments in financial year 2016, which will lead to corresponding reduced income in the future, decreased considerably compared with the previous year.
At EUR 280 million, Net commission income (before promotional activity) was on a par with 2015 (EUR 286 million). The slight decline was attributable to compensation payments to derivatives partners of EUR 5 million and lower income of EUR 175 million (2015: EUR 181 million) generated from manag-
ing Financial Cooperation on behalf of the German Federal Government in the business sector Promotion of developing countries and emerging economies. At EUR 98 million, loan processing fees recorded a positive trend (2015: EUR 87 million).
The increase in Administrative expense (before promotional activity) to EUR 1,185 million (2015: EUR 1,125 million) was slightly lower than expected. The main factors driving expenses remain the measures connected with the mandatory application of the KWG and the extensive investments in modernising the group.
Personnel expenses increased by EUR 4 million to EUR 634 million (2015: EUR 630 million). In addition to the higher number of employees, this was also due to negotiated pay increases. Non-personnel expenses (before promotional activity) amounted to EUR 550 million (2015: EUR 494 million). The increase of EUR 56 million was due to factors including higher amortisation of intangible assets and the use of consultancy and support services. These services related to, in particular, the necessary fulfilment of regulatory requirements and the comprehensive modernisation of KfW’s information technology architecture, which will continue to be pursued intensively over the coming years. This extensive project portfolio is also expected to entail a rise in Administrative expense in the future.
13
KfW Financial Information 2016 Group management report
The Cost/income ratio before promotional activity increased to 38.4 % (2015: 35.2%). This was primarily due to the expected decline in operating income as well as increased expenditures associated with KfW’s mandatory application of the KWG and the further modernisation of KfW.
Charges from group Risk provisions for lending business increased from the previous year to EUR 150 million (2015: EUR 48 million). However, this was still significantly below the projected standard risk costs. The expenses resulting from Risk provisions for lending business largely related to the business sector Export and project finance and were associated with reductions in portfolios in critical sectors and to the business sector Promotion of developing countries and emerging economies. In comparison, in the high-volume domestic business the need for risk provisions was relatively low.
Net additions to the provision for imminent credit risks including direct write-offs amounted to EUR 381 million (2015: EUR 343 million) and related primarily to the business sector Export and project finance with additions of EUR 192 million (2015: EUR 158 million), of which EUR 195 million (2015: EUR 65 million) was attributable to the Maritime industries segment. There were also net additions in the business sector Promotion of developing countries and emerging economies (EUR 108 million) and domestic promotional business (EUR 81 million). In contrast, the group generated a high income of EUR 216 million (2015: EUR 281 million) from recoveries of amounts previously written off. Of this, EUR 61 million was attributable to the business sector Export and project finance (2015: EUR 168 million), and EUR 44 million to domestic promotional business (2015: EUR 49 million). The risk provisions thus declined from EUR 1.2 billion in financial year 2015 to EUR 1.1 billion in financial year 2016. Of this total, EUR 0.5 billion were attributable to the Export and project finance business sector and EUR 0.4 billion to the Promotion of developing countries and emerging economies business sector.
In 2016, there was almost no change in the risk provisions for loan portfolio risks which were not yet allocable. As of year-end 2016, risk provisions remained at EUR 0.6 billion.
Risk provisions for lending business cover all imminent and latent risks, reflecting the consistent implementation of KfW Group’s conservative risk policy.
Net gains/losses from hedge accounting and other financial instruments at fair value through profit or loss stood at EUR 349 million (2015: EUR 478 million) and were primarily driven by positive effects from the equity investment portfolio and high positive purely IFRS-related effects from the valuation of derivatives used for hedging purposes in the financial year 2016.
The equity investment portfolio measured at fair value through profit or loss was primarily influenced by the positive performance of investments and exchange rate-induced increases in value,
largely due to the appreciation of the US dollar. It generated income of EUR 99 million (2015: EUR 145 million). This contribution is primarily attributable to the business activities of DEG in the business sector Promotion of developing countries and emerging economies.
The result from foreign currency translation also had a positive effect with income of EUR 11 million (2015: EUR –54 million) resulting from exchange rate changes, particularly in the US dollar, combined with the corresponding foreign currency items in the consolidated statement of financial position. These were largely due to differences from the group companies’ financial statements prepared in accordance with the German commercial code (Handelsgesetzbuch – “HGB”) as regards recognition and measurement of financial instruments not used for hedging.
Moreover, hedge accounting and borrowings recognised at fair value, including derivatives used for hedging purposes, resulted in net gains of EUR 233 million (2015: EUR 271 million). The mark-to-market derivatives are part of economically hedged positions. However, situations where the other part of the hedging relationship cannot be carried at fair value or has to be measured with a different method inevitably result in temporary fluctuations in income that fully reverse over the term of the transaction.
Net gains from securities and investments accounted for using the equity method of EUR 11 million (2015: EUR 43 million) resulted from movements with an offsetting effect in the securities and equity investment portfolio.
Securities not carried at fair value through profit or loss contributed EUR 12 million to earnings (2015: EUR 22 million). This resulted partly from sales of covered bonds.
The general development of financial markets led to an increase in the value of securities not recognised in profit or loss of EUR 59 million (2015: decrease in value of EUR 37 million), which were recognised in equity under Revaluation reserves. This was primarily due to the contributions of well-collateralised European covered bonds and European government bonds.
Moreover, the net positive difference between the carrying amount and the fair value for those securities and investments not carried at fair value increased by EUR 36 million to EUR 56 million as of 31 December 2016 (2015: decrease of EUR 26 million). This was attributable to, among other things, the reversal of impairment losses on securities from securities-based lending. By contrast, equity investments not carried at fair value through profit or loss resulted in charges amounting to EUR 22 million.
The group generated a result of EUR 21 million (2015: EUR 18 million) from investments accounted for using the equity method.
Net other operating income of EUR 102 million (2015: EUR 107 million) primarily comprises income from a waiver of the repayment of a part of the ERP subordinated loan in the amount of EUR 100 million.
14
KfW Financial Information 2016 Group management report
At EUR 230 million, KfW’s domestic promotional activity in financial year 2016, which has a negative impact on its earnings position, was below the prior-year level (2015: EUR 345 million), and remained well below projections.
The key component of KfW’s promotional activity is interest rate reductions. KfW grants these for certain domestic promotional loans during the first fixed interest rate period in addition to passing on KfW’s favourable funding conditions, thus affecting its earnings position. The volume of interest rate reductions provided fell to EUR 193 million in financial year 2016 (2015: EUR 304 million). This was partly due to a demand-induced decline in the volume of interest rate-reduced promotional loans. The generally low interest rates also reduced the potential to stimulate the promotional business with additional reductions.
Moreover, promotional activity, as reported in Net commission income and Administrative expense, was provided in the amount of EUR 37 million (2015: EUR 41 million). This activity’s target included the improvement of sales opportunities for KfW’s promotional products.
The positive income taxes (EUR 21 million) resulted primarily from the recognition of deferred tax assets due to tax consolidation for income tax purposes between KfW IPEX-Bank GmbH and KfW Beteiligungsholding GmbH.
This resulted in a Consolidated profit of EUR 2,002 million, which was less than that of the previous year (EUR 2.171 million) but significantly exceeded expectations.
Consolidated profit before IFRS effects is another key financial figure based on Consolidated profit in accordance with
IFRS to reflect the fact that derivative financial instruments are entered into for hedging purposes. Under IFRS, the requirements for the recognition and valuation of derivatives and hedges nevertheless give rise to temporary net gains or losses. In KfW’s opinion, such net gains or losses do not sufficiently reflect economically effective hedges.
As a result, the following reconciliations were performed by eliminating temporary contributions to income in the amount of EUR –233 million (2015: EUR –271 million) as follows:
| – | Valuation results from micro and macro hedge accounting. All hedging relationships are economically effective and do not give rise to any net gain or loss over the entire life of the hedge. |
| – | Net gains or losses from the use of the fair value option to avoid an accounting mismatch in the case of funding include related hedging derivatives. Accumulated over the entire life of the hedge, the economically effective hedges do not give rise to any net gain or loss. |
| – | Net gains or losses from the fair value accounting of hedges with high economic effectiveness but not qualifying for hedge accounting. These hedges do not give rise to any net gain or loss over the entire period to maturity. |
| – | Net gains or losses from foreign currency translation of foreign currency positions, in accordance with recognition and valuation requirements for derivatives and hedging relationships. |
The reconciled earnings position amounted to a net gain of EUR 1,769 million (2015: EUR 1,900 million). KfW Group achieved a very good result in financial year 2016 that far exceeded its sustainable earnings potential.
Development of net assets
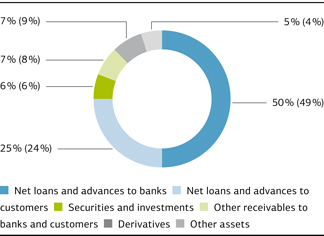
Lending to banks and customers has remained KfW Group’s core business. As of 31 December 2016, 75% of the Group’s assets were attributable to its lending business.
Assets
31 Dec. 2016 (31 Dec. 2015)
15
KfW Financial Information 2016 Group management report
Volume of lending at EUR 472.4 billion is up by EUR 25.4 billion on the previous year.
Volume of lending
| | | | | | | | | | | | | | | | | | | | |
| | | | | | | | | | |
| | | | | | | 31 Dec. 2016 | | | | | | 31 Dec. 2015 | | | | | | Change | | |
| | | | | | | EUR in millions | | | | | | EUR in millions | | | | | | EUR in millions | | |
| | | | | | | | | | |
| Loans and advances | | | | | | 377,871 | | | | | | 370,920 | | | | | | 6,952 | | |
| Risk provisions for lending business | | | | | | –1,610 | | | | | | –1,743 | | | | | | 133 | | |
| Net loans and advances | | | | | | 376,262 | | | | | | 369,177 | | | | | | 7,085 | | |
| Contingent liabilities from financial guarantees | | | | | | 2,647 | | | | | | 3,260 | | | | | | –613 | | |
| Irrevocable loan commitments | | | | | | 80,410 | | | | | | 61,091 | | | | | | 19,319 | | |
| Loans and advances held in trust | | | | | | 13,073 | | | | | | 13,434 | | | | | | –360 | | |
Total | | | | | | 472,392 | | | | | | 446,962 | | | | | | 25,431 | | |
Loans and advances increased by EUR 7.0 billion in 2016, from EUR 370.9 billion to EUR 377.9 billion, partly due to exchange rate effects from the appreciation of the US dollar. Disbursements in new lending business were offset by unscheduled loan repayments, primarily in the domestic promotional lending business. At EUR 12.8 billion (2015: EUR 18.0 billion), unscheduled loan repayments decreased compared to the previous year. At EUR 376.3 billion, Net loans and advances again represented 80% (31 December 2015: 83%) of lending volume.
Contingent liabilities from financial guarantees amounted to EUR 2.6 billion, slightly below the previous year’s level. Irrevocable loan commitments increased by EUR 19.3 billion to EUR 80.4 billion in 2016. This was due in particular to the restructuring of previous years’ BAföG loan commitments to the German
Federal Government amounting to EUR 12.5 billion. Within assets held in trust, the volume of loans and advances held in trust, which primarily comprise loans to support developing countries that are financed by budget funds of the Federal Republic of Germany, was EUR 13.1 billion, which is almost the previous year’s level.
At EUR 34.8 billion, Other loans and advances to banks and customers were below the previous year’s amount of EUR 40.8 billion. This item in particular includes short-term secured and unsecured investments held for general liquidity management purposes and in connection with collateral management in the derivatives business. These investments decreased over the course of the year due to an increase in liquidity held by central banks.
The total amount of Securities and investments at EUR 32.7 billion was on the same level as in the previous year.
Securities and investments
| | | | | | | | | | | | | | | | | | | | |
| | | | | | | | | | |
| | | | | | | 31 Dec. 2016 | | | | | | 31 Dec. 2015 | | | | | | Change | | |
| | | | | | | EUR in millions | | | | | | EUR in millions | | | | | | EUR in millions | | |
| | | | | | | | | | |
| Bonds and other fixed-income securities | | | | | | 30,118 | | | | | | 29,238 | | | | | | 879 | | |
| Shares and other non-fixed income securities | | | | | | 1 | | | | | | 0 | | | | | | 1 | | |
| Equity investments | | | | | | 2,595 | | | | | | 2,388 | | | | | | 207 | | |
| Shares in non-consolidated subsidiaries | | | | | | 0 | | | | | | 8 | | | | | | –8 | | |
Total | | | | | | 32,715 | | | | | | 31,634 | | | | | | 1,080 | | |
16
KfW Financial Information 2016 Group management report
The securities portfolio, which increased slightly in financial year 2016, constituted a significant item in Securities and investments. The increase in the portfolio was almost completely due to the increase of EUR 0.8 billion to EUR 28.9 billion in Bonds and other fixed-income securities, while the volume of money market securities rose slightly by EUR 0.1 billion to EUR 1.2 billion. In addition, equity investments increased by EUR 0.2 billion to EUR 2.6 billion.
The fair values of derivatives with positive fair values, which were primarily used to hedge funding transactions, decreased by a substantial EUR 8.8 billion, from EUR 43.7 billion to
EUR 34.8 billion, due to changes in market parameters. Netting agreements reached with counterparties, which also included derivatives with negative fair values, and collateral agreements (largely cash collateral received) reduced counterparty risk substantially. Value adjustments from macro hedging related to the underlying asset portfolios decreased slightly by EUR 0.5 billion, from EUR 14.4 billion to EUR 13.9 billion, due to changes in market parameters.
There were only minor changes in the other asset line items in the statement of financial position.
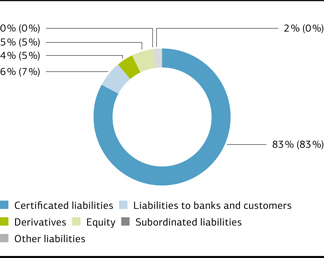
Development of financial position
KfW Group’s funding strategy in the international capital markets is based on three pillars: “benchmark bonds in euros and US dollars”, “other public bonds” and “private placements”. Funds raised in the form of Certificated liabilities continued to play a significant role, at 83% of total assets, unchanged from the previous year.
Financial position
31 Dec. 2016 (31 Dec. 2015)
In 2016, borrowings increased by EUR 5.1 billion to EUR 454.2 billion.
Borrowings
| | | | | | | | | | | | | | | | | | | | |
| | | | | | | | | | |
| | | | | | | 31 Dec. 2016 | | | | | | 31 Dec. 2015 | | | | | | Change | | |
| | | | | | | EUR in millions | | | | | | EUR in millions | | | | | | EUR in millions | | |
| | | | | | | | | | |
| Short-term funds | | | | | | 49,736 | | | | | | 40,363 | | | | | | 9,372 | | |
Bonds and notes | | | | | | 375,483 | | | | | | 375,316 | | | | | | 167 | | |
Other funding | | | | | | 28,806 | | | | | | 33,118 | | | | | | –4,312 | | |
Subordinated liabilities | | | | | | 200 | | | | | | 300 | | | | | | –100 | | |
Total | | | | | | 454,225 | | | | | | 449,098 | | | | | | 5,127 | | |
17
KfW Financial Information 2016 Group management report
KfW Group’s principal sources of funding were medium and long-term bonds and notes issued by KfW. Funds from these sources amounted to EUR 375.5 billion and accounted for 83% of borrowings as of 31 December 2016 (2015: EUR 375.3 billion). Short-term issues of commercial paper increased by EUR 7.2 billion to EUR 47.1 billion. Total short-term funds, including demand deposits and term deposits, amounted to EUR 49.7 billion. Other funding for KfW, in addition to promissory note loans from banks and customers (Schuldscheindarlehen), which decreased by EUR 0.6 billion year on year to EUR 7.4 billion, consisted mainly of liabilities to the Federal Republic of Germany and cash collateral received of EUR 17.8 billion (31 Dec. 2015: EUR 21.8 billion), which serves primarily to reduce counterparty risk from the derivatives business.
The carrying amounts of derivatives with negative fair values, which were primarily used to hedge loans, decreased by EUR 3.1 billion, from EUR 24.5 billion, primarily due to changes in market parameters, and amounted to EUR 21.5 billion at year-end 2016.
Subordinated liabilities continue to include a subordinated loan granted by the ERP Special Fund as part of the restructuring of the ERP economic promotion programme in 2007. In financial year 2016, the ERP Special Fund and KfW agreed to waive the repayment of EUR 0.1 billion. The subordinated loan was recognised with a balance of EUR 0.2 billion as of 31 December 2016.
There were only minor changes in the other liability line items in the statement of financial position.
At EUR 27.1 billion, Equity was above the level of EUR 25.2 billion as of 31 December 2015. The increase was largely due to the Consolidated profit of EUR 2.0 billion and the measurement
of pension obligations (EUR –0.2 billion). This led to an improvement in the equity ratio from 5.0% at the end of 2015 to 5.3% as of 31 December 2016.
Equity
| | | | | | | | | | | | | | | | | | | | |
| | | | | | | 31 Dec. 2016 | | | | | | 31 Dec. 2015 | | | | | | Change | | |
| | | | | | | EUR in millions | | | | | | EUR in millions | | | | | | EUR in millions | | |
| | | | | | | | | | |
Paid-in subscribed capital | | | | | | 3,300 | | | | | | 3,300 | | | | | | 0 | | |
Capital reserve | | | | | | 8,447 | | | | | | 8,447 | | | | | | 0 | | |
of which promotional reserves from the ERP Special Fund | | | | | | 7,150 | | | | | | 7,150 | | | | | | 0 | | |
Reserve from the ERP Special Fund | | | | | | 1,191 | | | | | | 1,191 | | | | | | 0 | | |
Retained earnings | | | | | | 14,092 | | | | | | 12,091 | | | | | | 2,002 | | |
Fund for general banking risks | | | | | | 600 | | | | | | 600 | | | | | | 0 | | |
Revaluation reserves | | | | | | –576 | | | | | | –429 | | | | | | –147 | | |
Total | | | | | | 27,055 | | | | | | 25,200 | | | | | | 1,855 | | |
The Consolidated profit was allocated to Retained earnings.
18
KfW Financial Information 2016 Group management report
Risk report
Overview of key indicators
Risks are reported in accordance with KfW Group’s internal risk management. The key risk indicators are presented below:
Regulatory equity ratios: Significant improvement
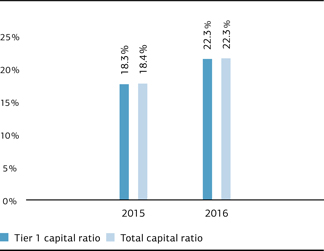
Besides the annual profit, the main force driving the improvement in regulatory equity ratios (based on the analogous application of the internal ratings-based approach (IRBA)) is the lower capital requirement in the derivatives portfolio.
Risk-bearing capacity: Sound capital adequacy
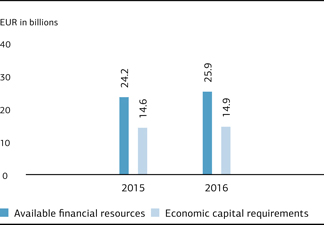
The excess coverage was considerably increased in 2016. Risk-bearing capacity at a solvency level of 99.99% for scenarios is adequate.
Credit risk: Good credit quality structure maintained
2016 (2015)
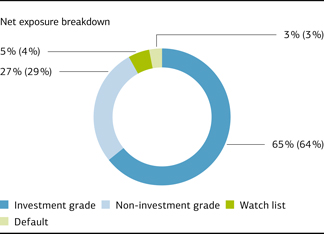
The share of investment grade net exposure comprised 65% of the total net exposure. Risk provisions (specific and portfolio valuation allowances, loan loss provisions) declined slightly in 2016 to EUR 1.7 billion (31 Dec. 2015: EUR 1.8 billion).
Market price risks: Slight increase in capital requirement
2016 (2015)
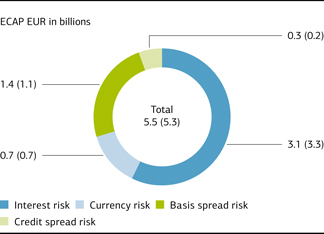
The increase in market price risks is primarily due to higher capital requirement for basis spread, currency and credit spread risks. It was offset by lower interest risk in the banking book.
19
KfW Financial Information 2016 Group management report
Liquidity risk: Situation remains comfortable
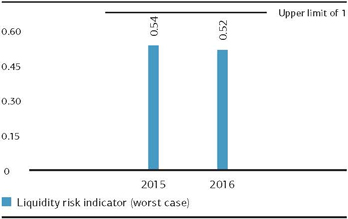
The liquidity risk indicators remained considerably below the internal limit throughout 2016.
Operational risk: Slight decrease in capital requirement
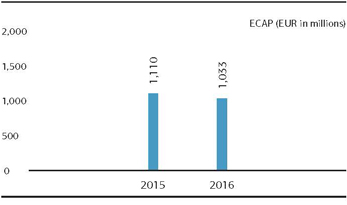
The capital requirement remained largely stable throughout the year. The slight decrease was due to the refinement of methods used in the calculation model.
Current developments
Following the fourth consecutive year of moderate global economic growth of just over three percent in 2016, the world economy faces greater uncertainties in 2017. Those uncertainties include, in particular, the economic agenda of the United States (US) under President Trump and its impact. Many financial market participants expect expansionary fiscal policy and consequently noticeable growth impetus in the US, which are, however, associated with the risk of increasing US sovereign debt, a significant rise in the interest rate and a highly volatile US dollar. Nonetheless, the short-term economic prospects in the US remain better than in other industrialised countries. While the euro area economies steered into calmer waters than in previous years, this development is overshadowed by potential policy shifts (parliamentary and presidential elections in the European Union’s core countries: the Netherlands, France and Germany, and likely Italy as well), uncertainty about the future of the European Union (EU) and structural problems. The United Kingdom’s (UK) recent strong economic momentum will likely wane given the prospects of Brexit, with the growth outlook for Japan expected to remain low.
Emerging economies retained a growth level approximating that of the weak previous year, albeit with considerable regional differences. The Asian economy driven by India, China and many smaller economies remained relatively robust, while particularly Latin American and Sub-Saharan African countries disappointed. All in all, the prospects for developing countries in 2017 remain muted. The recent stabilising energy prices are likely to have a positive effect on the macroeconomic indicators of certain countries, some of which are still in recession. However, the rise in interest rates in the US in connection with the strong US dollar
could result in renewed capital outflows and an increase in foreign currency debt in these countries.
China’s economic transition represents a further major threat to the global economy, in general: if crisis developments slow Chinese growth more than expected, there could be serious global repercussions. Last but not least, geopolitical tension is also likely to continue rising this year. The combination of existing conflict situations with unconventional US foreign, trade and security policy or even extremely protectionist measures poses an almost unpredictable risk of potential setback.
These trends are under constant observation and assessment at KfW Group. The downward adjustments to the country risk assessment in 2016 mainly concerned countries that are highly vulnerable to external shocks (exporters of commodities, above all) and those with significantly increased political risks. Moreover, new business in some of these countries was also restricted.
The European banking sector also saw considerable uncertainty in 2016. Although the beginning of the financial crisis dates back several years, many bank balance sheets have yet to be cleaned up. Investors’ focus has moved back to the extremely large derivatives positions of some global systemically important banks. Overall, declining investor confidence in the banking sector put heavy pressure on banks’ share prices, particularly at the beginning of the year. By the end of 2016, practically no systemically important European bank was valued with a price-to-book ratio of more than 100%. The unexpected Brexit vote fuelled additional fears. The consequences for the UK banking sector depend heavily on the forthcoming negotiations with the EU and will not be foreseeable until the medium term.
20
KfW Financial Information 2016 Group management report
The German banking sector also faced numerous problems in 2016. High legal risk costs, comprehensive restructuring measures and the serious shipping crisis, which has persisted for close to a decade, have caused financial distress for several major banks. Interest risk has also been on the rise as a consequence of the low interest environment – particularly for savings banks and cooperative banks, which have engaged in increasingly excessive maturity transformation to maintain or stabilise their interest margin. Overall, the sector’s low profitability remains the greatest weakness.
The European Banking Authority (EBA) stress test, which simulated a new financial and economic crisis, revealed that Italian, Irish, Austrian and some German banks fared badly. The Italian banking sector crisis continued in 2016, with solutions to the problems making slow progress. Both the targeted reduction in holdings of non-performing loans, such as through securitisations, and consolidation in the Italian banking sector are moving at a sluggish pace. The danger of a spillover to banks in other southern European countries (e.g. Portugal or Spain) persists. The environment has not improved in major emerging economies; for instance banks in Brazil and Russia remain under pressure. Turkish banks, too, are suffering from downgrades by external rating agencies and eroding investor confidence in view of the political changes in their country.
The sustained low interest rate environment will continue to exert pressure on German banking sector profitability in 2017. The currently high margin pressure, new competitors (such as FinTech (financial services and technology) companies) and increasing regulatory requirements will force banks to cut more costs and could accelerate the consolidation process.
EU banks significantly boosted their capitalisation levels, although banks in southern European countries report a below-average tier 1 capital ratio, meaning that strengthening capital will still be very important for them in 2017. A number of banks, particularly those from the Nordic countries, Germany, the Netherlands and Switzerland, could be confronted with increasing capital requirements due to the ongoing implementation of Basel III requirements and, above all, the new requirements affecting the calculation of risk assets (Basel IV).
The uncertainty factors in the European banking market remain significant in 2017. In addition to the unsolved banking crisis in Italy, political risks from the election results in the Netherlands, France and Germany, along with the EU’s Brexit negotiations (commencing in 2017) could also place a burden on banks. The outlook for the US banking market is positive for 2017 given that banks’ profitability is set to improve following further rate hikes by the US Federal Reserve and continued credit growth. The banking markets in developing countries and emerging economies may experience the downside of the climbing interest rates in the United States and a potential further appreciation of the US dollar. This affects countries dependent on foreign refinancing, such as Turkey, but also those in which banks have granted the majority of their loans in US dollars, including some
Commonwealth of Independent States (CIS) and Latin American countries. KfW Group closely analyses the developments on the international banking markets. Risk-mitigating measures for various markets in the Sub-Saharan African and Latin American regions in particular were stepped up in 2016.
Positive overall performance is expected for the German and European corporate sector in 2017 in light of stable domestic demand and increasing exports. However, there is heightened uncertainty worldwide due to the developments mentioned above. In particular, globally active export-led companies face another challenging year. The offshore oil industry and commercial shipping continue to grapple with excess supply, meaning that market participants have to make cost adjustments to cope with the market environment. Overall, KfW Group expects moderate deterioration in the credit quality of the portfolio as a whole with the possibility of specific valuation allowances. The sub-portfolios concerned are being monitored closely.
The group’s portfolio recorded stable performance overall. All recognisable risks are measured using conservative standards and are taken into account in KfW Group’s new business management through the systematic implementation of risk guidelines. The regularly performed calculations of risk-bearing capacity show that KfW Group can bear the risks assumed in the context of its mandate – even based on conservative stress scenarios. In financial year 2016, as in previous years, KfW Group systematically refined the processes and instruments in its Risk Management and Controlling department, taking into account current banking regulations. This particularly affected developing and implementing limits on shadow banks. Regulatory risks are analysed and measured on an ad hoc basis (e. g. in connection with the finalisation of capital requirements in accordance with Basel III) and in the context of scenario observations. The Market Price Risk Committee resolved to establish the Market Price Risk Working Group to support the committee.
As a result of an amendment to the KfW Law in 2013 and the issuance of the “Regulation concerning key banking supervision standards under the German Banking Act to be declared applicable by analogy to KfW and supervision of compliance to these standards to be assigned to the German Federal Financial Supervisory Authority” (the “KfW Regulation”), the German legislature enacted an expanded application of the KWG to KfW. KfW has since been obliged to apply key bank regulatory standards (KWG and Capital Requirements Regulation, “CRR”) by analogy. The German Federal Financial Supervisory Authority and the German Central Bank (Bundesbank) are responsible for supervising compliance with the relevant applicable bank regulatory standards. The KfW Regulation provides for their entry into force in stages. The corporate governance rules have been binding since mid-2014; the other provisions since the start of 2016. Since autumn 2015, KfW has been undergoing the approval process for application of the advanced IRBA. Until the planned initial IRBA (partial) approval as of 30 June 2017, KfW is applying the credit risk standardised approach (CRSA) to
21
KfW Financial Information 2016 Group management report
regulatory reporting; internal management and capital market communication have continued to apply the current IRBA by analogy for reasons of consistency. Once KfW has obtained regulatory approval for the IRBA, capital market communication,
internal management and reporting will apply the approved IRB approach. The IRBA approval process is currently scheduled to be fully completed as of 1 January 2020.
Basic principles and objectives of risk management
KfW Group has a statutory promotional mandate, which provides the basis for its special position and institutional structure. Sustainable promotion is KfW Group’s overarching purpose. In order to utilise available resources to best carry out KfW Group’s promotional mandate, it is vital to measure and control incurred risks. As part of its risk management, KfW Group takes risks only to the extent that they appear manageable in the context of its current and anticipated earnings position and the development of the risks. KfW Group’s risk/return management takes into account the special characteristics of a promotional bank, with adherence to supervisory requirements constituting a fundamental prerequisite to the group’s business activities.
KfW Group’s risk culture forms the basis for efficient risk management; this culture is largely characterised by the promotional bank business model with no primary intention of generating profit and no trading book. In addition to the code of conduct, the risk culture is also marked by open communication, clear responsibilities and an appropriate incentive structure. In order to solidify risk management and controlling know-how within its organisation, KfW Group offers its employees training that includes a modular programme on risk topics. The training programme enables management and non-management staff throughout KfW Group to acquire basic knowledge or to deepen their specialised knowledge.
Organisation of risk management and monitoring
Risk management bodies and responsibilities
As part of its overall responsibility, KfW’s Executive Board determines the group’s risk policies. The Board of Supervisory Directors is informed at least quarterly of KfW Group’s risk situation. The Presidial and Nomination Committee is responsible for dealing with legal and administrative matters as well as fundamental business and corporate policy issues. Moreover, in certain urgent cases, the committee has the authority to adopt resolutions in lieu of the Board of Supervisory Directors. The Chairman of the Board of Supervisory Directors decides whether an issue is urgent. The Risk and Credit Committee is primarily responsible for advising the Board of Supervisory Directors about the group’s current and future overall risk tolerance and strategy and supports it in monitoring implementation of the latter. It decides on loan approvals (including loans to members of management), operational level equity investments, funding and swap transactions where committee authorisation is required by the KfW Bylaws. The Audit Committee monitors, above all, the accounting process and the effectiveness of the risk management system and internal monitoring procedures and offers recommendations to the Board of Supervisory Directors concerning its approval of the consolidated financial statements. The Remuneration Committee monitors whether the structure of the remuneration
system for the Executive Board and employees is appropriate. In accordance with applicable bank regulatory provisions, the Remuneration Committee is also responsible for monitoring whether the structure of the remuneration system for the heads of the Risk Controlling and Compliance functions and for any employees who have a significant impact on the group’s overall risk profile is appropriate.
Risk management within KfW Group is exercised by closely interlinked decision-making bodies. At the top of the system is the Executive Board, which takes the key decisions on risk policy. There are three risk committees below the level of the Executive Board (Credit Risk Committee, Market Price Risk Committee and Operational Risk Committee) which prepare decisions for the Executive Board and also take their own decisions within their remits. The committees also perform KfW Group management functions; thus, representatives from the subsidiaries KfW IPEX-Bank and DEG are also included. Additional working groups do the preliminary work for these committees. The middle and back office departments (Marktfolge) and Risk Controlling generally have a veto right in the committees; if a committee fails to reach a unanimous decision, the issue may be escalated to the Executive Board level.
22
KfW Financial Information 2016 Group management report
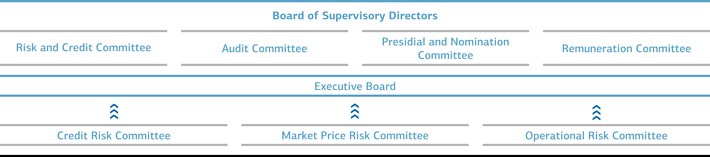
Credit Risk Committee
The Credit Risk Committee is chaired by the Chief Risk Officer and meets once a week. The committee’s other voting members are the Director of Credit Risk Management, attending members of the Executive Board and KfW IPEX-Bank’s Chief Risk Officer (CRO). The Credit Risk Committee is supported by various working groups. The Country Rating Working Group serves as the central unit for assessing country risk. The Collateral Working Group ensures a uniform approach to all essential aspects of collateral acceptance and valuation as well as the collateral management processes. The Rating Systems Working Group is responsible for all essential aspects of credit risk measurement instruments. The Corporate Sector Risk Working Group analyses sector and product-related credit risks in the corporate segment. The weekly Credit Risk Committee meetings in particular involve decisions on loans and credit lines. KfW IPEX-Bank’s and DEG’s commitments are also presented to the Credit Risk Committee. Additional meetings, held on a quarterly basis, also include the Director of Risk Controlling and the Director of Legal Affairs as well as representatives of the business sectors and DEG. Internal Auditing and Compliance have guest status. Reports about the development of regulatory requirements, e.g. the German Minimum Requirements for Risk Management (Mindestanforderungen an das Risikomanagement – “MaRisk”) and KWG, their impact and the progress of implementation projects in KfW Group, are made at this quarterly meeting. The committee also approves major changes to existing risk principles and credit risk methods as well as new principles and methods and procedural rules for the working groups performing the groundwork. The committee also monitors KfW Group’s loan portfolio, including country and sector risks.
Market Price Risk Committee
The Market Price Risk Committee is chaired by the Chief Risk Officer and meets once a month. The committee’s other members include the Executive Board members responsible for capital markets business and finance as well as the directors of Financial Markets, Risk Controlling, Accounting, Transaction Management, Group Development and Economics. Internal Auditing and Compliance have guest status. The Chief Risk Officers of KfW IPEX-Bank and DEG attend the meetings on a quarterly basis and as necessary. The Market Price Risk Committee discusses KfW Group’s market price risk position and assesses the market price risk strategy on a monthly basis. The committee also monitors KfW Group’s liquidity risk position and decides on all questions relating to the principles and methods for the
management of market price, liquidity risks and funding as well as transfer pricing and the valuation model for commercial transactions. The committee prepares the final decision of the Executive Board regarding the interest risk strategy. The Market Price Risk Committee is supported by the Surveillance Committee, which discusses the valuation of securities and market developments and impairments of securities, and the Hedge Committee, which deals primarily with the earnings effects of IFRS hedge accounting and its further development. In addition to accepting validation reports and changes to models, the Market Price Risk Working Group also develops and decides – or prepares decisions by the Market Price Risk Committee – on other methodological issues relating to market price and liquidity risks as well as measurement issues.
Operational Risk Committee
The Operational Risk Committee meets once a quarter and supports the Executive Board in the areas of operational risk and business continuity management. It comprises senior vice presidents (or represented by first vice presidents). It is chaired by the Director of Risk Controlling. KfW IPEX-Bank and DEG are represented in the committee. Internal Auditing has guest status. The committee’s tasks are to adopt resolutions and to approve risk principles, methods and instruments. In addition, the committee is responsible for managing operational risk (OpRisk) and taking decisions regarding cross-functional group-wide measures. The committee also discusses any major or potential operational risk loss events and evaluates any group-wide action required. In the area of business continuity management (BCM) the committee establishes crisis-prevention and emergency-planning measures using the results of the annual business impact analysis. Monitoring is based on reports about planned or implemented emergency and crisis team tests and significant disruptions to business. All resolutions and recommendations by the Operational Risk Committee are presented to the Executive Board.
Additionally, the subsidiaries and organisational entities of KfW Group exercise their own control functions within the group-wide risk management system. In these entities, group-wide projects and working groups ensure a coordinated approach, for example, in the rollout of rating instruments to subsidiaries or in the management and valuation of collateral. The responsibility for developing and structuring risk management and risk control activities is located outside the market areas and lies in particular with the Risk Controlling department.
23
KfW Financial Information 2016 Group management report
Risk management approach of KfW Group
OVERVIEW
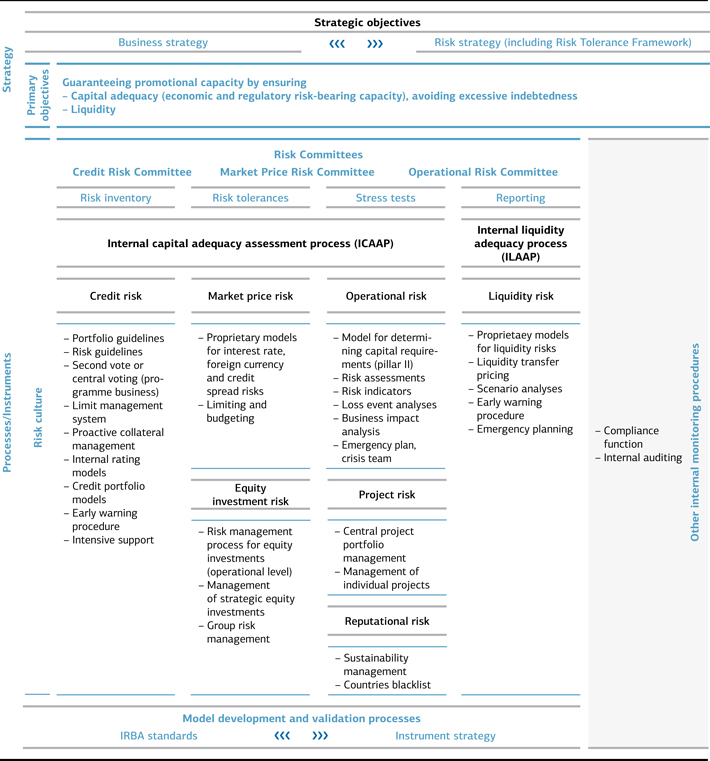
To ensure capital adequacy and liquidity in line with KfW Group’s defined risk tolerance, Risk Controlling formulates and regularly reviews the risk strategy of KfW Group, taking into account its significant subsidiaries.
The orientation of KfW Group’s risk strategy is in line with its business strategy and takes into account the regulatory requirements relating to KfW Group’s business model. The risk strategy translates the group’s long-term and strategic risk objectives into operational risk management requirements. This involves defining risk management objectives for core business activities
and measures for achieving targets as well as setting risk tolerance limits for managing KfW Group’s material risks. To implement the risk strategy, a variety of instruments to control KfW Group’s major risks are used, including risk management instruments for individual counterparties and portfolios.
In order to determine its material risks, KfW Group conducts a risk inventory at least once a year. The risk inventory identifies and defines types of risks relevant to KfW Group in a structured process and then subjects these risks to an evaluation of materiality. The materiality of a risk type depends primarily on the potential
|
24 KfW Financial Information 2016 Group management report |
danger for KfW Group’s net assets, earnings and liquidity. The key outcome of the risk inventory is an overall risk profile, which provides an overview of KfW Group’s material and immaterial risk types. The 2016 inventory identified that KfW Group faces the following material risks: credit, market price, liquidity, operational, equity investment, project and reputational risks. Risk concentrations within a risk type or across various risk types are taken into account in the risk inventory.
Risk reporting is in line with regulatory requirements (MaRisk). The Executive Board is informed about KfW Group’s risk situation on a monthly basis. A risk report is issued quarterly to KfW Group’s supervisory bodies. The respective bodies are informed on an ad hoc basis as required. The risk indicators and information systems used by the Risk Management and Controlling department are reviewed on an ongoing basis.
The methods and instruments for KfW group-wide risk analysis and controls are regularly validated and enhanced through further development. The focus is on models to measure, control and price both credit and market price risks. Validation and further development activities also take account of regulatory requirements.
The risk management approach is set out in KfW Group’s risk manual. The risk manual stipulates the framework for the application of uniform procedures and rules and regulations to identify, measure, control and monitor risk. The rules and regulations laid out in the risk manual are binding for the entire KfW Group, accessible to all employees and continually updated. KfW group-wide regulations are supplemented by rules specific to each business sector. See the following sections for details on other elements of KfW Group’s risk management approach.
INTERNAL CAPITAL ADEQUACY ASSESSMENT PROCESS
KfW Group’s internal capital adequacy assessment process is characterised by the fact that compliance with regulatory and economic requirements regarding risk-bearing capacity are equally important overarching objectives for KfW Group. Accordingly, all risk monitoring and management measures must ensure compliance with both an economic solvency target and minimum requirements for the regulatory capital ratios. This approach combines economically practicable capital management with the obligation to comply with regulatory capital requirements. KfW Group takes a uniform definition of capital as the basis for the close integration of these two perspectives: regulatory capital in line with Articles 25–91 of Regulation (EU) No. 575/2013 (CRR) is used as available financial resources for both views.
A further core feature of the capital adequacy assessment process is the proactive focus resulting from an additional forward-looking component. This focus evaluates the absorption potential of KfW Group’s reserves – and thus also its ability to act – in the event of certain economic and stress scenarios. A traffic light system, established in this context with thresholds for regulatory and economic risk-bearing capacity, signals the required action in the event of critical developments as part of operational and strategic management.
KfW Group’s risk-bearing capacity concept serves first and foremost to protect debt capital providers from losses and therefore adopts a liquidation approach in its basic form. However, the addition of a forward-looking component, which also guarantees compliance with regulatory capital requirements, expands the concept to include a going-concern view. KfW Group’s risk-bearing concept thus includes elements of both basic types of risk-bearing capacity approaches.
The targets for ensuring risk-bearing capacity are addressed via budgets based on risk-weighted assets at the level of each business sector/departments. The allocated budgets are available
to the business sectors/departments for backing old and new business for the various types of risk. Capital allocation is conducted as part of KfW Group’s annual business sector planning. In addition to the requirements induced by business sector planning, this process also takes into account the risk objectives and the bank’s risk tolerance. Budget compliance is checked on a monthly basis and action is taken, if necessary. Moreover, economic capital budgets are set for different types of risk, functioning as their central controlling and limiting variable, and monitored quarterly.
To avoid excessive debt, the leverage ratio is integrated into the capital adequacy assessment process as a further control variable. Similarly to risk-bearing capacity metrics, the leverage ratio is taken into account in additional forward-looking projections, and compliance with defined traffic light limits checked on at least a quarterly basis.
In addition to KfW Group’s risk-bearing capacity concept, the capital planning process monitors the medium-term development of capital adequacy. Reliance on scenario-based extrapolations of regulatory and economic risk-bearing capacity as well as the leverage ratio over a multi-year observation horizon enables the capital planning process to identify potential capital bottlenecks early on in order to derive recommendations for action that strengthen capital or reduce risk, as necessary. The process takes into account changes in strategic objectives, business activity and the economic environment. In addition to a base case, regulatory and economic risk-bearing capacity and the leverage ratio are also taken into account in a stress case. Capital planning is performed as part of the overall KfW group-wide planning and strategy process.
The risk-bearing capacity concept is subject to annual review of its limits and restrictions. The results are taken into account accordingly in the assessment of risk-bearing capacity.
25
KfW Financial Information 2016 Group management report
Regulatory risk-bearing capacity
Key regulatory figures (based on analogous application of advanced IRBA)
| | | | | | | | | | | | | | | | | | |
| | | | | | | 31 Dec. 2016 | | | | | | | | | | 31 Dec. 2015 | | |
| | | | | | | EUR in millions | | | | | | | | | | EUR in millions | | |
| | | | | | | |
Total risk exposure in accordance with Art. 92 CRR | | | | | | 116,108 | | | | | | | | | | 131,773 | | |
– Credit risk | | | | | | 108,723 | | | | | | | | | | 123,956 | | |
– Market price risk | | | | | | 1,298 | | | | | | | | | | 1,266 | | |
– Operational risk | | | | | | 6,087 | | | | | | | | | | 6,551 | | |
Regulatory capital (available financial resources) | | | | | | 25,890 | | | | | | | | | | 24,210 | | |
– Tier 1 capital | | | | | | 25,890 | | | | | | | | | | 24,090 | | |
– Tier 2 capital | | | | | | 0 | | | | | | | | | | 120 | | |
Tier 1 capital ratio | | | | | | 22.3% | | | | | | | | | | 18.3% | | |
Total capital ratio | | | | | | 22.3% | | | | | | | | | | 18.4% | | |
The group has been subject to the KWG or CRR regulatory capital requirements since 1 January 2016. KfW Group reports according to CRSA to the banking supervisory authorities until it has obtained supervisory approval of the advanced IRBA, for which an application is pending. For internal control purposes, however, as in previous years, it also continues to calculate capital ratios voluntarily based on the main legal requirements of the advanced IRBA.
KfW Group’s total capital ratio (based on analogous application of the advanced IRBA) improved significantly in 2016. As of year-end 2016, the total capital ratio taking into account consolidated comprehensive income was 22.3% (31 December 2015: 18.4%). This upward trend was driven mainly by the annual profit, which resulted in a sizable increase in available financial resources, and the reduction of the total amount at risk. This reduction was largely due to the CRSA taking financial securities into account as well as decreases in the fair value of derivatives. Both effects were reflected in the credit valuation adjustment (CVA) charge in addition to counterparty default risk.
Economic risk-bearing capacity
To assess its economic risk-bearing capacity, KfW Group compares its economic capital requirement for potential losses from material quantifiable risks to its available financial resources. KfW Group bases its calculation of the economic capital requirement on a solvency target of 99.99% and a time frame of one year. The aggregation of the economic capital requirement across various types of risks is made through addition without taking account of diversification effects.
The most significant risk type for KfW Group is credit risk. Credit risk is the risk of losses if business partners fail to meet their payment obligations to KfW Group at all, in due time or in full (default) or if their credit ratings deteriorate (migration). Credit risk includes settlement risk involved in settling derivative transactions. The economic capital requirement for credit risk is quantified by the Risk Controlling department, largely with the help of statistical models. For counterparty risk, the
loss potential is computed using a loan portfolio model and the risk measure of “credit value-at-risk”. The difference between credit value-at-risk and expected loss is referred to as the economic capital requirement. Migration risk is taken into account in the forward-looking component of the calculation of risk-bearing capacity on the basis of scenarios. For settlement risks, the regulatory capital requirement is applied in calculating risk-bearing capacity if there are any open settlement exposures at the end of the month.
The group determines a current capital requirement for the separate line item required in macro hedge accounting. The separate line item is required to be presented on the asset side of the IFRS statement of financial position to show the cumulative adjustments to the carrying amount of the hedged item. The capital resources are provided using individual credit risk parameters of the hedged transactions and are thus allocated accordingly at individual exposure level.
The economic capital requirement for market price risk is calculated on the basis of the value-at-risk concept. Pillar II’s economic analysis takes account of interest risk in the banking book, foreign currency risk, credit spread risk for securities, and basis spread risk. The possible loss of present value or price is determined for each type of market price risk using a value-at-risk based on statistical models. Moreover, a stop loss buffer is maintained for interest and foreign currency risks. Ultimately, the economic capital requirement is defined as the sum of value-at-risk and an additional stop loss buffer.
The capital requirement for operational risk is calculated using an internal statistical model, which was designed based on regulatory requirements for advanced measurement approaches. It takes a risk-sensitive approach to internal and external event data and risk scenarios. The capital requirement is calculated using diversification effects at the business sector level. Moreover, the measurement of the quality of operational risk management within the group generates premiums and discounts that are then applied to the capital requirement.
26
KfW Financial Information 2016 Group management report
Project risks are also taken into account in the risk-bearing capacity concept. Both quantified individual risks from major projects and general assumptions about potential losses in the project portfolio are included in risk measurement.
KfW Group also includes hidden burdens (stille Lasten) for securities held as fixed assets, which are held directly as an economic capital requirement without including offsetting hidden reserves (stille Reserven).
Using this method, the economic risk-bearing capacity as of 31 December 2016 satisfied a solvency level of 99.99 %. The excess coverage of the available financial resources beyond the total capital requirement as of 31 December 2016 of EUR 10,971 million increased significantly compared to 31 December 2015 (EUR 9,653 million). This increase is largely due to the inclusion of the 2016 annual profit in the calculation of the available financial resources. The increased capital requirement for credit risk is primarily due to the refinement of methods used in the loan portfolio model as well as a higher concentration risks as a result of a merger in the German banking market. The increased capital requirement for market price risks is mainly due to higher basis spread risks. The capital requirement for operational risks and hidden burdens fell slightly, while that for project risks rose.
KfW Group manages liquidity risk by regularly monitoring the appropriate internal key figures and the utilisation threshold in accordance with Article 4 of the KfW Law. Internal calculations relating to the liquidity situation are based on projections of liquidity needs and total liquidity resources, which are both subjected to stress scenarios of differing severity. No capital backing is currently provided as part of calculating risk-bearing capacity.
Reputational risks are evaluated and managed on a qualitative basis. No capital backing is currently provided as part of calculating risk-bearing capacity.
KfW Group’s risk measurement is based on state-of-the-art models used in banking practice. However, each model represents a simplification of a complex reality and builds on the assumption that risk parameters observed in the past can be considered representative of the future. Not all possible inputs and their complex interactions can be identified and modelled for the risk development of a portfolio. This is one reason why KfW Group carries out stress tests with both the credit risk models and the market price risk models. KfW Group also continually works to refine its risk models and processes.
Economic risk-bearing capacity as of 31 December 2016
EUR in millions
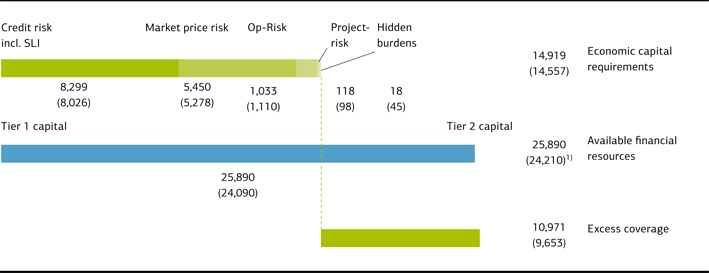
In brackets: figures as of 31 December 2015
| 1) | As of 31 December 2015 KfW’s tier 2 capital stood at EUR 120 million. |
Stress and scenario calculations
To ensure a stronger early indicator function and proactive focus in its risk-bearing capacity concept, KfW Group monitors, on a quarterly basis, a forecast scenario (baseline scenario), a downturn scenario (slight economic slowdown) and a stress scenario (deep recession) as well as their respective effects on economic and regulatory risk-bearing capacity. This forward-looking perspective illustrates KfW Group’s resilience and ability to act in the event of these scenarios and, accordingly, delivers
direct input to management. A forecast and stress scenario are also calculated for the leverage ratio.
The forecast scenario provides a preview of risk-bearing capacity at the relevant year-end and includes the projected business performance, expected comprehensive income, and other effects influencing risk-bearing capacity, such as foreseeable changes in the capital structure and methodological developments. The current forecast for 31 December 2017 shows almost constant
27
KfW Financial Information 2016 Group management report
excess coverage of available financial resources over the economic capital requirement compared with 31 December 2016 as well as a slight drop in the total capital ratio in the IRBA compared with 31 December 2016.
In the downturn and stress scenarios, effects on earnings and changes in capital requirements are simulated for a twelve-month period assuming negative economic development scenarios of varying severity. The effects of a severe global recession emanating from the euro area are depicted in the stress scenario. In both scenarios, KfW Group currently assumes an overall increase in credit risk (counterparty and migration risks). In these scenarios, the EUR and USD interest rates as well as the EUR-USD exchange rate are forecast to develop in line with the economic situation. At the same time, it is assumed that increasing market uncertainties will lead to increased volatility in interest rates, currencies and credit spreads, as a result of which the economic capital requirement for the corresponding types of risk will rise. Losses from securities prices as well as
from operational and project risk further reduce available financial resources in the stress scenario.
Overall, risk-bearing capacity at a solvency level of 99.99 % for all three scenarios and the leverage ratio in the forecast and stress scenarios are at an adequate level.
Further stress tests are carried out in addition to the economic scenarios to examine the resilience of KfW Group’s economic and regulatory risk-bearing capacity. Current potential macroeconomic dangers form the basis for the varying scenario stress tests. In 2016, they focused on Brexit scenarios, a sustained low oil price, consolidation pressure in the banking sector and the crisis in Turkey. The concentration and inverse stress tests show how concentration risks and other potential dangers materialising in unfavourable combinations could jeopardise KfW Group’s business model. In 2016, they also simulated the potential impact of the planned regulatory changes under Basel III on the group’s capital ratios.
Types of risk
COUNTERPARTY DEFAULT RISK
KfW Group faces counterparty risks1) in the context of its promotional mandate. In the domestic promotional lending business, the majority of ultimate borrower default risks are borne by the on-lending institutions. Due to the business model, this results in a large proportion of bank risks in the portfolio. Other main risks result from promotional activities in the area of start-up
finance for SMEs and equity investments. Particularly in these segments of domestic promotion, KfW Group bears the risk stemming from ultimate borrowers. In addition, KfW Group faces risks in the business sectors Export and project finance as well as Promotion of developing countries and emerging economies.
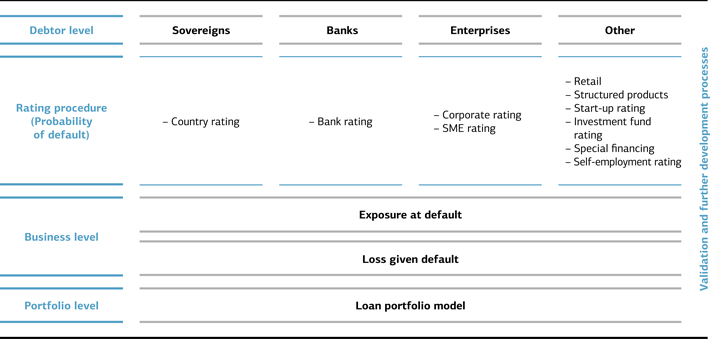
Counterparty default risk is measured by estimating the probability of default (PD), the exposure at default (EAD) and the loss given default (LGD). The product of the three aforementioned variables is the loss that can be expected, statistically,
on average over many years. The expected loss is taken into account when determining risk-bearing capacity by deducting it from the available financial resources in accordance with the supervisory requirements of Article 158 of the CRR.
| 1) | Counterparty default risk is defined as the risk of financial loss that can occur if the borrower or counterparty fails to meet contractual payment obligations. Counterparty default risk also includes country risk, comprising transfer, conversion and political risks. |
28
KfW Financial Information 2016 Group management report
KfW Group uses internal rating procedures for the measurement of the probability of default for banks, countries, corporations, small and medium-sized enterprises, start-ups, the self-employed, investment funds and private equity investors. These procedures are based on scorecards2) and follow a consistent uniform model. Simulation and cash flow-based rating procedures are used for significant parts of special financing and structured products, some of which were licensed by an external provider. For structured products, tranche ratings are determined on the basis of the default pattern of the asset pool and the waterfall structure of the transactions. The rating procedures aim to predict the probability of default on a one-year basis. As a rule, the middle and back office departments are responsible for preparing ratings for risk-bearing business. Ratings are updated regularly, at least once per year.
The probability of default is mapped on a uniform master scale for the entire KfW Group, allowing comparison of ratings from different rating procedures and business sectors. The master scale consists of 20 distinct classes which are divided into four groups: investment grade, non-investment grade, watch list and default. The range of default probabilities and the average default probability are defined for each class of the master scale. There are operating procedures specifying the responsibilities, competencies and control mechanisms associated with each rating procedure. External ratings are mapped to KfW Group’s master scale to ensure the comparability of internal ratings with ratings of external rating agencies. Periodic validation and continued development of the internal rating procedures ensure a rapid response to changes in overall conditions.
Exposure at default and valuation of collateral have significant influence on the severity of loss. Collateral has a risk-mitigating effect in calculating loss given default. In valuing acceptable collateral, the expected net revenue from collateral realisation in the case of loss, including haircuts, is determined. For tangible collateral, the haircuts are attributable, among other things, to devaluation resulting from depreciation, in addition to fluctuations in market prices and the costs of realisation. Depending on the availability of data, the various valuation procedures for individual types of collateral are based on internal and external historical data and on expert estimates. A risk principle for loan collateral regulates uniform management, valuation and recognition of collateral across KfW Group. In addition to net revenue from collateral realisation, the recovery rate for uncollateralised exposure amounts is also an important component in determining loss given default (LGD). All valuation parameters are regularly subject to validation.
KfW Group has limit management systems, risk guidelines and various portfolio guidelines to limit risks from new business. This set of risk management instruments forms the basis for the second vote on lending transactions, serves as an orientation guide for loan approvals and has the function of ensuring the appropriate quality and risk structure of KfW Group’s portfolio. The special nature of KfW Group’s promotional business is taken into account in the process. At KfW, Group Risk Management has the second vote on a single exposure level. KfW IPEX-Bank and DEG each have their own second vote independent of the front office. The relevant business decision-making processes are structured with a view to risk. Lending transactions currently require a second vote depending on the type, scope (material risk content and effect on the overall risk position) and complexity of the transaction. The qualification levels for approval of new business depend on rating, total commitments to the group of connected borrowers and product type. Approval is also required by the Board of Supervisory Directors’ Risk and Credit Committee for pre-defined, individual transaction volumes (according to rating and product type).
The portfolio guidelines distinguish between different types of counterparties and product variants and define the conditions under which business transactions may generally be conducted. In addition, risk guidelines for countries, sectors and products are defined in order to react to existing or potential negative developments with specific requirements for lending. The limit management systems ultimately track both risk concentrations (concentration limits) and credit rating dependent individual counterparty risk (counterparty limits). Concentration limits serve to restrict risk concentrations in the loan portfolio and thus to prevent major individual losses. Counterparty limits serve to fine tune the counterparty-specific management of credit default risk.
Existing higher-risk exposures are divided into a watch list and a list for non-performing loans. The watch list serves to identify potential problem loans early and, if necessary, to make preparations for handling these loans. It regularly reviews and documents the economic situation, the particular borrower’s market environment and the collateral provided, and formulates proposals for remedial action – particularly proposals for risk-limiting measures. Non-performing loans and to a great extent watch-list loan commitments3) are handed over to restructuring units. This transfer of responsibility enables the involvement of specialists from an early stage to ensure professional management of problematic loans. The objective of this system is to achieve recovery of a loan through restructuring, reorganisation and workout arrangements. If the business partner is deemed incapable or unworthy of restructuring, the priority becomes
| 2) | A scorecard is a mathematical and statistical model and/or an expert knowledge-based model. The individual risk factors considered relevant for credit rating are converted into a score depending on their value and weighted for aggregation. |
| 3) | The assumption of responsibility for watch-list cases at KfW IPEX-Bank is decided on a case-by-case basis by Risk Management in consultation with the unit responsible for restructuring. |
29
KfW Financial Information 2016 Group management report
optimum realisation of the asset and the related collateral. The Restructuring division is responsible for non-performing loans and for providing intensive support to banks and higher volume loans with a risk amount greater than EUR 1 million in the KfW portfolio. The portfolio credit management department is responsible for supporting retail business. KfW IPEX-Bank and DEG’s non-performing loans and commitments requiring intensive support are managed directly by each subsidiary. If more than one KfW Group company is involved, Restructuring will coordinate centrally. Internal interface regulations are in place in the relevant business sectors to ensure clear control of responsibilities and allocation. Restructuring also cooperates closely with the market areas and the central Legal Affairs department.
In the event of a crisis in the banking sector, the Risk Management department has to be able to act immediately both in-house and externally. A financial institution crisis plan is also in place for this purpose. It primarily provides for the establishment of a working group headed by the Credit Risk Management department, immediate loss analysis and implementation of the necessary next steps.
Risk provisions for lending business
KfW Group takes appropriate measures to address all identifiable default risks in its lending business by making risk provisions for loans. These risks include the political risk resulting from financing transactions outside Germany. For loans with an imminent risk of default (i.e. non-performing loans), KfW Group recognises individual impairment charges or provisions for undisbursed portions. These events are identified on the basis of criteria that meet both CRR and IFRS requirements. Criteria include the identification of considerable financial difficulties on the part of the debtor, payment arrears, concessions made to the debtor owing to its financial situation (for example, in the context of restructuring measures), conspicuous measures
undertaken by the debtor to increase its liquidity, and a substantial deterioration in the value of collateral received. Individual impairment charges are determined by means of an impairment procedure. The calculation of individual impairment charges in the non-retail business incorporates an individual assessment of the borrower’s ability to make payments in the future. The calculation takes into account the scope and value of the collateral as well as the political risk. A simplified impairment procedure is performed for small and standardised loans (retail business) on the basis of homogeneous sub-portfolios.
Risk provisions for latent risks (i.e. portfolio impairment) are derived from the valuation of loan receivables in the context of annual rating procedures and collateral valuations. Portfolio impairment charges are recorded for both economic and political risks based on the expected loss model described above, which is adjusted for IFRS purposes. Risk provisions for irrevocable loan commitments and financial guarantees are set up using the same method of calculation.
Maximum risk of default
According to IFRS 7.36, the maximum exposure to credit risk for KfW Group arising from financial instruments is the total loss of the respective risk positions. Contingent liabilities and irrevocable loan commitments are also taken into account. Carrying amounts are reduced by the risk provisions made.
Payment arrears on the balance sheet date were reported only in Loans and advances to banks and customers, and Securities and investments. Individual impairment charges were also reported under Contingent liabilities and Irrevocable loan commitments.
Maximum risk of default
EUR in millions
| | | | | | | | | | | | | | | | | | | | | | | | | | | | | | | | | | | | | | | | | | | | | | | | | | | | | | | | | | | | | | | | |
| | | | | | | | | | Loans and advances to banks | | | | | | | | | | Loans and advances to customers | | | | | | | | | | Value adjustments from macro fair value hedge accounting | | | | |
| | | | | | | | | | | | | | | | | | | | | | | | | | | | | | | | | | | | | | | | | | | | | | | | | | | | | | | | | | | | | | | | |
| | | | | | | | | | 31 Dec. 2016 | | | | | | | | | | 31 Dec. 2015 | | | | | | | | | | 31 Dec. 2016 | | | | | | | | | | 31 Dec. 2015 | | | | | | | | | | 31 Dec. 2016 | | | | | | | | | | 31 Dec. 2015 | | | | |
Carrying amount as equivalent for maximum risk of default | | | | | | | | | | 275,752 | | | | | | | | | | 276,880 | | | | | | | | | | 135,265 | | | | | | | | | | 133,135 | | | | | | | | | | 13,917 | | | | | | | | | | 14,420 | | | | |
Risk provisions for lending business | | | | | | | | | | 171 | | | | | | | | | | 169 | | | | | | | | | | 1,439 | | | | | | | | | | 1,573 | | | | | | | | | | 0 | | | | | | | | | | 0 | | | | |
Carrying amount neither past due nor impaired | | | | | | | | | | 275,482 | | | | | | | | | | 276,715 | | | | | | | | | | 132,900 | | | | | | | | | | 131,349 | | | | | | | | | | 13,917 | | | | | | | | | | 14,420 | | | | |
Collateral provided | | | | | | | | | | 167,033 | | | | | | | | | | 159,127 | | | | | | | | | | 53,409 | | | | | | | | | | 54,367 | | | | | | | | | | 0 | | | | | | | | | | 0 | | | | |
30
KfW Financial Information 2016 Group management report
| | | | | | | | | | | | | | | | | | | | | | | | | | | | | | | | | | | | | | | | | | | | | | | | | | | | | | | | | | | | | | | | |
| | | | | | | | | | Derivatives used for hedge accounting; other derivatives | | | | | | | | | | Securities and investments; investments accounted for
using the equity method | | | | | | | | | | Contingent liabilities; irrevocable loan commitments | | | | |
| | | | | | | | | | | | | | | | | | | | | | | | | | | | | | | | | | | | | | | | | | | | | | | | | | | | | | | | | | | | | | | | |
| | | | | | | | | | 31 Dec. 2016 | | | | | | | | | | 31 Dec. 2015 | | | | | | | | | | 31 Dec. 2016 | | | | | | | | | | 31 Dec. 2015 | | | | | | | | | | 31 Dec. 2016 | | | | | | | | | | 31 Dec. 2015 | | | | |
Carrying amount as equivalent for maximum risk of default | | | | | | | | | | 34,808 | | | | | | | | | | 43,655 | | | | | | | | | | 33,061 | | | | | | | | | | 31,925 | | | | | | | | | | 85,489 | | | | | | | | | | 67,349 | | | | |
Risk provisions for lending business | | | | | | | | | | 0 | | | | | | | | | | 0 | | | | | | | | | | 4 | | | | | | | | | | 6 | | | | | | | | | | 44 | | | | | | | | | | 62 | | | | |
Carrying amount neither past due nor impaired | | | | | | | | | | 34,808 | | | | | | | | | | 43,655 | | | | | | | | | | 32,883 | | | | | | | | | | 31,719 | | | | | | | | | | 85,438 | | | | | | | | | | 67,250 | | | | |
Collateral provided | | | | | | | | | | 17,355 | | | | | | | | | | 20,651 | | | | | | | | | | 294 | | | | | | | | | | 329 | | | | | | | | | | 0 | | | | | | | | | | 0 | | | | |
|
Financial instruments past due and not individually impaired EUR in millions | |
| | | | | | | | | | Loans and advances to banks | | | | | | | | | | Loans and advances
to customers | | | | | | | | | | Securities and investments; investments accounted for using the equity method | | | | |
| | | | | | | | | | | | | | | | | | | | | | | | | | | | | | | | | | | | | | | | | | | | | | | | | | | | | | | | | | | | | | | | |
| | | | | | | | | | 31 Dec. 2016 | | | | | | | | | | 31 Dec. 2015 | | | | | | | | | | 31 Dec. 2016 | | | | | | | | | | 31 Dec. 2015 | | | | | | | | | | 31 Dec. 2016 | | | | | | | | | | 31 Dec. 2015 | | | | |
Carrying amount less than 90 days past due | | | | | | | | | | 207 | | | | | | | | | | 52 | | | | | | | | | | 1,143 | | | | | | | | | | 318 | | | | | | | | | | 0 | | | | | | | | | | 1 | | | | |
Carrying amount 90 days and more past due | | | | | | | | | | 19 | | | | | | | | | | 48 | | | | | | | | | | 269 | | | | | | | | | | 324 | | | | | | | | | | 1 | | | | | | | | | | 0 | | | | |
Total | | | | | | | | | | 225 | | | | | | | | | | 100 | | | | | | | | | | 1,412 | | | | | | | | | | 641 | | | | | | | | | | 1 | | | | | | | | | | 1 | | | | |
Collateral provided | | | | | | | | | | 149 | | | | | | | | | | 58 | | | | | | | | | | 716 | | | | | | | | | | 203 | | | | | | | | | | 0 | | | | | | | | | | 0 | | | | |
Individually impaired financial instruments
EUR in millions
| | | | | | | | | | | | | | | | | | | | | | | | | | | | | | | | | | | | | | | | | | | | | | | | | | | | | | | | | | | | | | | | | | | | | | | | | | | | | | | | |
| | | | | Loans and advances to
banks | | | | | | Loans and advances to customers | | | | | | | | Securities and invest- ments; investments
accounted for using the equity method | | | | | | | | Contingent liabilities;
irrevocable loan commitments | | |
| | | | | | | | 31 Dec. | | | | | | | | 31 Dec. | | | | | | | | | 31 Dec. | | | | | | | | 31 Dec. | | | | | | | | 31 Dec. | | | | | | | | 31 Dec. | | | | | | | | 31 Dec. | | | | | | | | 31 Dec. | | |
| | | | | | | | 2016 | | | | | | | | 2015 | | | | | | | | | 2016 | | | | | | | | 2015 | | | | | | | | 2016 | | | | | | | | 2015 | | | | | | | | 2016 | | | | | | | | 2015 | | |
Carrying amount | | | | | | | | 45 | | | | | | | | | | 65 | | | | | | | | | | 952 | | | | | | | | | | 1,145 | | | | | | | | | | 177 | | | | | | | | | | 205 | | | | | | | | | | 51 | | | | | | | | | | 100 | | |
Individual impairments, provisions | | | | | | | | 40 | | | | | | | | | | 38 | | | | | | | | | | 1,024 | | | | | | | | | | 1,159 | | | | | | | | | | 0 | | | | | | | | | | 0 | | | | | | | | | | 9 | | | | | | | | | | 19 | | |
Collateral provided | | | | | | | | 1 | | | | | | | | | | 5 | | | | | | | | | | 438 | | | | | | | | | | 666 | | | | | | | | | | 2 | | | | | | | | | | 3 | | | | | | | | | | 0 | | | | | | | | | | 0 | | |
As of 31 December 2016, EUR 1.2 billion (net after deduction of risk provisions, year-end 2015: EUR 1.5 billion) was classified as individually impaired out of EUR 578 billion (year-end 2015: EUR 567 billion) in financial instruments outstanding. Potential losses are conservatively estimated, and individual impairment losses of EUR 1.1 billion (year-end 2015: EUR 1.2 billion) were recognised.4)
In addition to provisions for immediate risks of default, KfW Group made provisions for latent risks of default (economic and political risks). As of 31 December 2016, risk provisions for transactions not individually impaired totalled EUR 0.6 billion (year-end 2015: EUR 0.6 billion). The collateralisation of loans in KfW Group’s portfolio primarily relates to the on-lending business and the promotional business guaranteed by the
| 4) | The transaction of approximately EUR 15 billion mandated by the Federal Government as part of the support measures for Greece is completely hedged by a federal guarantee and is therefore not presented in the portfolio of individually impaired financial instruments. |
31
KfW Financial Information 2016 Group management report
Federal Republic or individual federal states (Länder).5) By far the largest portion of collateral is attributable to assigned ultimate-borrower receivables from the on-lending business. Tangible collateral, e. g. ships and aeroplanes, plays only a minor role in relation to the total amount of collateral.
The high exposure with regard to derivatives with positive fair values has to be seen in the context of the netting agreements with counterparties. These netting agreements also include derivatives with negative fair values and considerably reduce the counterparty risk.
There was an increase in loans and advances which were less than 90 days past due and not individually impaired in the year under review. These were largely arrears of one day. Most were settled on the following working day as the due date fell on a Saturday.
KfW Group did not take possession of any significant assets previously held as tangible collateral in 2016. Deferred payments in the performing portfolio in 2016 were primarily in the Export and project finance business sector. This deferred payment volume is not significant based on total lending volume.
Portfolio structure
The contribution of individual positions to the risk associated with KfW Group’s loan portfolio6) is assessed based on an internal portfolio model. Concentrations of individual borrowers or groups of borrowers give rise to a risk of major losses that could jeopardise KfW Group’s existence. On the basis of the economic capital concept, Risk Controlling department measures risk concentrations by individual borrower, sector and country. Risk concentrations are primarily reflected in the economic capital requirement, ensuring that high risk volumes and unfavourable probabilities of default are taken into account, along with undesirable risk correlations. The results form the main basis for managing the loan portfolio.
Regions
As of 31 December 2016, 67% of KfW Group’s loan portfolio in terms of economic capital requirements was attributable to the euro area (year-end 2015: 55%). The increase was primarily due to the refinement of methods (reparameterisation of correlations, improved method of calculation/breakdown of individual ECAP contributions), which resulted in a rise in the economic capital requirement, particularly in Germany. Moreover, concentration risks increased due to the merger of two principal business partners. Outside Germany, the refinement of methods led to a reduction of the economic capital requirements despite new business particularly in the business sectors Export and project finance and Promotion of developing countries and emerging economies.
Economic capital requirements by region
31 Dec. 2016 (31 Dec. 2015)
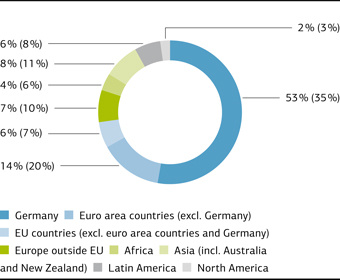
| 5) | The collateral is presented as recognised for purposes of internal management of economic risks. Participation effects are taken into account in order to avoid reporting double collateralisation. In addition, the prior-year figures were restated, as hedged exposure also takes hedges for political risk exposure into account as of 2016 (previously only economic risk exposure). |
| 6) | The loan portfolio includes loans as well as securities and investments in performing business. The non-performing portfolio is only included in the presentation of credit quality. |
32
KfW Financial Information 2016 Group management report
Sectors
The significant share of overall capital required for credit risks attributable to the financial sector is due to KfW Group’s promotional mandate. By far the greatest portion of KfW Group’s domestic promotional business consists of loans on-lent through commercial banks. The financial sector’s economic capital requirement increased overall due to higher concentration risks relating to the aforementioned merger, new business primarily in good rating classes and the methodology developments previously described. For merged banks, the capital requirement has risen particularly for those with large volumes of on-lending business, due to the new ECAP breakdown algorithm. The refinement of methods, in particular, led to a reduction of the capital requirement for all other sector clusters.
Economic capital requirements by sector
31 Dec. 2016 (31 Dec. 2015)
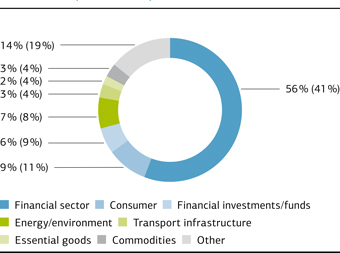
Credit quality
As credit quality is a major factor influencing economic capital requirements, it is appropriate in analysing the credit quality structure to examine the distribution of net exposure7) by credit quality category. Overall, the proportion of investment grade exposure to total net exposure rose slightly, largely due to new business in good rating classes. A greater share of watch list positions (mainly in the business sector Export and project finance) resulted in a slight increase in the average probability of default in KfW Group’s loan portfolio compared to 2015. KfW Group’s loan portfolio continued to possess a good credit quality structure.
Credit quality by net exposure
31 Dec. 2016 (31 Dec. 2015)
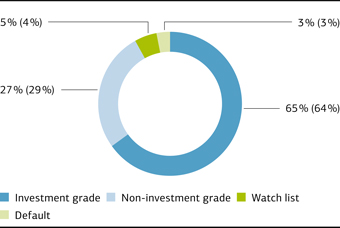
Structured products in KfW Group’s portfolio
Asset-backed securities (ABS)
ABSs had a par value of around EUR 4.9 billion as of 31 December 2016. Accounting for the mark-to-market valuation of the securities reported at fair value and impairments, the portfolio also had a book value (including pro rata interest) of around EUR 4.9 billion. The following tables show the composition of the ABS portfolio by asset class, rating and geographic distribution of the underlying assets in the securitisation portfolios.
Geographic breakdown of the underlying asset pool
(based on par value)
31 Dec. 2016 (31 Dec. 2015)
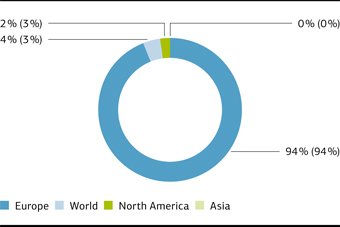
| 7) | Net exposure is the economic loss that potentially occurs in the event of an economic or political default event. |
33
KfW Financial Information 2016 Group management report
Exposure based on par values
| | | | | | | | | | | | | | | | | | | | | | | | | | | | | | | | | | | | | | | | | | | | | | | | | | | | | | | | | | | | | | | | | | | | | | | | |
| | | | | | | | | CLO | | | | | | | | RMBS | | | | | | | | CMBS | | | | | | | | CDO | | | | | | | | ABS & | | | | | | | | Total | | | | | | | | Total | | |
| | | | | | | | | | | | | | | | | | | | | | | | | | | | | | | | | | | | | | | | | other | | | | | | | | 31 Dec. | | | | | | | | 31 Dec. | | |
| | | | | | | | | | | | | | | | | | | | | | | | | | | | | | | | | | | | | | | | | | | | | | | | 2016 | | | | | | | | 2015 | | |
| | | | | | | | | EUR in | | | | | | | | EUR in | | | | | | | | EUR in | | | | | | | | EUR in | | | | | | | | EUR in | | | | | | | | EUR in | | | | | | | | EUR in | | |
| | | | | | | | millions | | | | | | | | millions | | | | | | | | millions | | | | | | | | millions | | | | | | | | millions | | | | | | | | millions | | | | | | | | millions | | |
Investment Grade | | | | | | | | | | 57 | | | | | | | | | | 880 | | | | | | | | | | 9 | | | | | | | | | | 5 | | | | | | | | | | 3,841 | | | | | | | | | | 4,792 | | | | | | | | | | 4,098 | | |
Non-Investment Grade | | | | | | | | | | 0 | | | | | | | | | | 38 | | | | | | | | | | 3 | | | | | | | | | | 15 | | | | | | | | | | 0 | | | | | | | | | | 56 | | | | | | | | | | 53 | | |
Watch list | | | | | | | | | | 0 | | | | | | | | | | 0 | | | | | | | | | | 0 | | | | | | | | | | 0 | | | | | | | | | | 0 | | | | | | | | | | 0 | | | | | | | | | | 16 | | |
Default | | | | | | | | | | 58 | | | | | | | | | | 0 | | | | | | | | | | 0 | | | | | | | | | | 0 | | | | | | | | | | 0 | | | | | | | | | | 58 | | | | | | | | | | 75 | | |
| | | | | | | | | | | 115 | | | | | | | | | | 918 | | | | | | | | | | 12 | | | | | | | | | | 20 | | | | | | | | | | 3,841 | | | | | | | | | | 4,906 | | | | | | | | | | 4,242 | | |
The portfolio volume as of 31 December 2016 increased year-on-year (par value EUR +0.7 billion). Comparison of the portfolios’ rating structure shows a reduction in both watch list and default positions. The volume of in-vestment grade holdings rose by EUR 0.7 billion. The regional focus on Europe remains unchanged
as can be seen in the geographic breakdown of the underlying asset pool compared with 31 December 2015. Overall, European securitisations, including German securitisations, performed well. The cumulative default rates for European securitisations remained low.
MARKET PRICE RISK
KfW Group measures and manages market price risk on a present-value basis. The key drivers of market price risk in this context are:
| – | the interest rate structure (interest risk) particularly for the EUR and USD currency areas, |
| – | exchange rates (currency risk), |
| – | basis spreads (basis spread risk) and |
| – | issuer-related spreads for securities (credit spread risk). |
In total, market price risk within the group required a total of EUR 5.5 billion in economic capital as of 31 December 2016. This is EUR 172 million more than as of 31 December 2015. KfW Group market price risk is bro-ken down as follows:
Total economic capital for market price risk
| | | | | | | | | | | | | | | | | | | | |
| | | | | | | | | 31 Dec. 2016 | | | | | | | | | | 31 Dec. 2015 | | |
| | | | | | | | | EUR in millions | | | | | | | | | | EUR in millions | | |
| | | | | | | |
| Interest risk | | | | | | | | 3,066 | | | | | | | | | | 3,356 | | |
Currency risk | | | | | | | | 744 | | | | | | | | | | 681 | | |
Basis spread risk | | | | | | | | 1,350 | | | | | | | | | | 1,057 | | |
Credit spread risk | | | | | | | | 290 | | | | | | | | | | 183 | | |
Market price risk | | | | | | | | 5,450 | | | | | | | | | | 5,278 | | |
Interest risk
KfW Group assumes limited interest risk in order to take advantage of long-term opportunities for returns. All relevant data from the preparation of fixed interest statements are considered in the determination of interest risk. On the basis of this data, KfW Group regularly performs value-at-risk calculations using a variance/covariance approach to assess its interest risk position. The management concept for interest risk is part of a long-term management philosophy. A substantial stop loss buffer is
maintained in order to mitigate short-term fluctuations in present value caused by interest rates. In addition to this buffer, value at risk is computed at a solvency level of 99.99% and for a period of two months in order to calculate risk-bearing capacity. The choice of this period is based on a conservative estimate of the maximum timeframe to close the entire interest risk position under adverse interest rate scenarios. Continuous monitoring of the risk position and the available management options ensures that the allocated capital is also sufficient to
34
KfW Financial Information 2016 Group management report
cover the risk for a one-year period in accordance with the uniformly applied solvency level of 99.99%. Periodic stress tests supplement this calculation to examine possible losses under extreme market conditions. Apart from this prescribed shift, the tests in-clude scenarios such as tilts of the yield curve and an extension of the holding period. The capital requirement for interest risk had fallen by EUR 291 million as of 31 December 2016. The reduction compared to the previous year’s figure is primarily a result of a reparameterisation of the model.
Currency risk
Foreign currency loans are largely funded in the same currency or secured by appropriate foreign currency hedging instruments. DEG’s foreign currency equity investments and to a small extent KfW Development Bank’s promotional instruments are only funded in the same currency when possible and practical. Foreign currency earnings generated from the lending business throughout the year are sold promptly. As with interest risk, the economic capital requirement for liquid currency positions is calculated analogously to interest risk using a variance/covariance approach as the sum of a stop loss buffer and a two-month value-at-risk at a solvency level of 99.99%. A twelve-month value-at-risk is used for all currencies with limited trading and hedging opportunities. The Market Price Risk Committee classifies each currency as liquid or illiquid at least once a year. The currency portfolio predominantly comprises liquid positions. Stress tests are regularly conducted in order to estimate possible losses in the event of extreme market conditions. The capital requirement for currency risk had risen by EUR 62 million as of 31 December 2016. The increase is due to the appreciation of the USD (EUR/USD as of 31 December 2015: 1.09 and 31 December 2016: 1.05), building
up a position (increasing lending volume and funding in USD) and the increase in the stop loss buffer.
Basis spread risk
Basis spread risk largely comprises tenor and foreign exchange basis spread risk. The economic capital requirement for this risk is calculated with a variance/covariance approach at a solvency level of 99.99% and with a holding period of twelve months. The capital requirement for basis spread risk as of 31 December 2016 stood at EUR 1,350 million, representing a year-on-year increase of EUR 293 million. This rise resulted primarily from greater contributions from the USD book, largely due to significantly higher volatilities.
Credit spread risk
Risk measurement is carried out for the securities portfolio. The economic capital requirement is calculated using the historical simulation method on the basis of a credit spread time series comprising the previous three years (750 trading days). Value at risk is initially ascertained from credit spread changes for a holding period of one day at a confidence level of 95%, and then scaled to a period of one year and a solvency level of 99.99%. The risk measurement for ABS is based on ABS indices due to the low liquidity of these securities. The economic capital requirement for credit spread risk as of 31 December 2016 was EUR 290 million. Credit spread risk rose by EUR 107 million year-on-year. The increased risk is due, above all, to the introduction of a correction factor, as backtesting identified an underestimated risk via the Value-at-Risk model. The model will be overhauled in 2017.
LIQUIDITY RISK
Liquidity risk is the risk of not being able to make payments in a timely manner when due. A distinction is made between
| – | institutional liquidity risk (the risk of not being able to meet payment obligations), |
| – | refinancing risk (the risk that the required funds are only available at costs higher than the interest rate in line with the risks involved), and |
| – | market liquidity risk (the risk of being unable to unwind specific exposures without significantly lowering market prices because of inadequate market depth or market disruptions). |
The primary objective of liquidity management is to ensure that KfW Group is capable of meeting its payment obligations at all times. KfW is available as a contractual partner for all commercial
transactions of its subsidiaries, particularly for their funding. For this reason the liquidity requirements of the subsidiaries are included both in KfW Group’s funding plans and in the liquidity maintenance strategy.
Liquidity risk is measured on the basis of economic scenario analyses and the utilisation threshold under the KfW Law. In addition, liquidity gaps are limited based on business already concluded and available liquidity potential.
A significant component for liquidity risk assessment comprises the contractual payment obligations (principal and interest) of KfW Group arising from financial instruments, which are shown in the table below by maturity range:
35
KfW Financial Information 2016 Group management report
Contractual payment obligations arising from financial instruments by maturity range
as of 31 December 20161)
| | | | | | | | | | | | | | | | | | | | | | | | | | | | |
| | | | | | | Up to 1 month | | | | More than 1 and up to 3 months | | | | More than 3 months and up to 1 year | | | | More than 1 and up to 5 years | | | | More than 5 years | | | | Total | | |
| | | | | | | EUR in millions | | | | EUR in millions | | | | EUR in millions | | | | EUR in millions | | | | EUR in millions | | | | EUR in millions | | |
| | | | | | | | | | | | | | |
Liabilities to banks and customers | | | | | | 18,481 | | | | 2,944 | | | | 603 | | | | 3,221 | | | | 8,828 | | | | 34,076 | | |
Certificated liabilities | | | | | | 30,398 | | | | 36,185 | | | | 50,879 | | | | 235,095 | | | | 91,766 | | | | 444,323 | | |
Net liabilities arising from derivative financial instruments | | | | | | –1,276 | | | | –2,503 | | | | –3,012 | | | | –13,632 | | | | –10,633 | | | | –31,057 | | |
thereof Liabilities arising from derivative financial instruments | | | | | | 14,921 | | | | 19,589 | | | | 28,398 | | | | 137,634 | | | | 50,427 | | | | 250,969 | | |
Subordinated liabilities | | | | | | 0 | | | | 0 | | | | 4 | | | | 23 | | | | 235 | | | | 262 | | |
Liabilities arising from on-balance sheet financial instruments | | | | | | 47,603 | | | | 36,626 | | | | 48,473 | | | | 224,707 | | | | 90,195 | | | | 447,604 | | |
Contingent liabilities | | | | | | 3,955 | | | | 0 | | | | 0 | | | | 0 | | | | 0 | | | | 3,955 | | |
Irrevocable loan commitments | | | | | | 81,534 | | | | 0 | | | | 0 | | | | 0 | | | | 0 | | | | 81,534 | | |
Liabilities arising from off-balance sheet financial instruments | | | | | | 85,489 | | | | 0 | | | | 0 | | | | 0 | | | | 0 | | | | 85,489 | | |
Liabilities arising from financial instruments | | | | | | 133,092 | | | | 36,626 | | | | 48,473 | | | | 224,707 | | | | 90,195 | | | | 533,093 | | |
| 1) | Net liabilities under derivative financial instruments comprise payment obligations which are offset against the corresponding payment claims from derivative contracts; the gross liabilities are reported as Liabilities arising from derivative financial instruments. Irrevocable loan commitments and Contingent liabilities are generally allocated to the first maturity range. |
The increase in payment obligations in the first maturity range was due primarily to the rise in Irrevocable loan commitments, of which EUR 18.7 billion resulted from the increase in domestic financing.
Contractual payment obligations arising from financial instruments by maturity range
as of 31 December 20151)
| | | | | | | | | | | | | | | | | | | | | | | | | | | | |
| | | | | | | Up to 1 month | | | | More than 1 and up to 3 months | | | | More than 3 months and up to 1 year | | | | More than 1 and up to 5 years | | | | More than 5 years | | | | Total | | |
| | | | | | | EUR in millions | | | | EUR in millions | | | | EUR in millions | | | | EUR in millions | | | | EUR in millions | | | | EUR in millions | | |
| | | | | | | | | | | | | | |
| Liabilities to banks and customers | | | | | | 21,281 | | | | 1,625 | | | | 1,097 | | | | 3,205 | | | | 10,842 | | | | 38,050 | | |
| Certificated liabilities | | | | | | 24,634 | | | | 30,837 | | | | 60,363 | | | | 225,338 | | | | 97,156 | | | | 438,328 | | |
| Net liabilities arising from derivative financial instruments | | | | | | –780 | | | | –1,298 | | | | –5,640 | | | | –15,273 | | | | –13,244 | | | | –36,236 | | |
thereof Liabilities arising from derivative financial instruments | | | | | | 20,522 | | | | 20,327 | | | | 40,608 | | | | 128,039 | | | | 62,049 | | | | 271,546 | | |
| Subordinated liabilities | | | | | | 0 | | | | 0 | | | | 5 | | | | 25 | | | | 345 | | | | 376 | | |
| Liabilities arising from on-balance sheet financial instruments | | | | | | 45,134 | | | | 31,164 | | | | 55,825 | | | | 213,295 | | | | 95,099 | | | | 440,518 | | |
| Contingent liabilities | | | | | | 5,186 | | | | 0 | | | | 0 | | | | 0 | | | | 0 | | | | 5,186 | | |
| Irrevocable loan commitments | | | | | | 62,163 | | | | 0 | | | | 0 | | | | 0 | | | | 0 | | | | 62,163 | | |
| Liabilities arising from off-balance sheet financial instruments | | | | | | 67,349 | | | | 0 | | | | 0 | | | | 0 | | | | 0 | | | | 67,349 | | |
Liabilities arising from financial instruments | | | | | | 112,483 | | | | 31,164 | | | | 55,825 | | | | 213,295 | | | | 95,099 | | | | 507,867 | | |
| 1) | Net liabilities under derivative financial instruments comprise payment obligations which are offset against the corresponding payment claims from derivative contracts; the gross liabilities are reported as Liabilities arising from derivative financial instruments. Irrevocable loan commitments and Contingent liabilities are generally allocated to the first maturity range. |
36
KfW Financial Information 2016 Group management report
Internal measurement of liquidity risk is based on scenario calculations. This approach first analyses the expected inflow and total outflow of payments for the next twelve months based on business already concluded. This basis cash flow is then supplemented by planned and estimated payments (e. g. borrowings from the capital market, expected liquidity-related loan defaults or planned new business). The result provides an overview of the liquidity required by KfW Group over the next twelve months. The liquidity required is calculated for different scenarios. In this respect, market-wide and institution-specific risk factors are stressed and an evaluation is made of the impact on KfW Group’s liquidity.
Parallel to the above approach, KfW Group also determines the available liquidity potential, which largely consists of KfW’s collateral account with the European Central Bank, repurchase agreement assets, the liquidity portfolio and the volume of commercial paper that is regularly placeable on the market. The available liquidity potential is subjected to stress analysis in the same way as the other cash flow components. The ratio of cumulative required liquidity to the cumulative available liquidity potential is calculated for each scenario. This figure may not exceed the value of 1 in any scenario for any period. The prescribed horizon in the normal case scenario is twelve months, in the stress case six months, and in the two worst case scenarios, three months. The scenario assumptions are validated on an annual basis.
The key figures are calculated and reported to the Market Price Risk Committee on a monthly basis. The following table shows the key risk indicators for the scenarios as of 31 December 2016:
KfW liquidity risk indicators as of 31 December 2016
| | | | | | |
| | | | | | Indicator | |
| | |
| Normal case | | | | | 0.09 | |
| Stress case | | | | | 0.24 | |
| Worst case (institution-specific) | | | | | 0.30 | |
Worst case | | | | | 0.52 | |
The internal liquidity risk indicators remained below the upper limit of 1 throughout 2016.
Current funding environment
Developments on the international capital markets in 2016 were characterised by the unexpected outcomes of two major political events: the UK vote to remain in or leave the European Union and the US presidential election. For example, following the US election, interest rates in the euro area and the US rose significantly. Throughout the year, the capital markets were also influenced by the continued very active central bank policy on the part of the European Central Bank as well as the US Federal Reserve. While the ECB’s monetary policy continued its expansionary course, the US Federal Reserve, in contrast, undertook a further rate hike at the end of the year, thereby taking another step towards a more contractionary monetary policy.
KfW successfully completed its funding activities in this volatile market environment thanks to its flexible attitude to currencies, instruments and structures. It raised a total volume of EUR 72.8 billion on the international capital markets (2015: EUR 62.6 billion) in 15 different currencies and 206 individual transactions in financial year 2016. The euro and the US dollar remained the two most important currencies for long-term funding. The share of bonds denominated in US dollars rose to a record high of 47% in 2016 (2015: 45%); those denominated in euros amounted to 36% (2015: 37%).
The development of KfW’s funding activities in the money market segment was equally positive in 2016. The programme volume of the Euro Commercial Paper (ECP) programme designed for investors around the world was increased from EUR 50 billion to EUR 60 billion in November 2016. As planned, the volume issued in the euro commercial paper programme was considerably higher in 2016 than in the previous year. The outstanding volume here amounted to EUR 37.8 billion at the end of 2016 (year-end 2015: EUR 31.8 billion). The issue volume in the US Commercial Paper (USCP) programme was also higher year-on-year in 2016. The USCP, with a programme volume of USD 10 billion, is specially designed for the US market. KfW uses this programme to cover a large portion of its need for short-term funds in US dollars. The outstanding volume amounted to USD 8.7 billion at the end of 2016 (year-end 2015: USD 8.1 billion).
OPERATIONAL RISK AND BUSINESS CONTINUITY
MANAGEMENT (OPERATING RISK)
KfW Group uses operating risk as the umbrella term for operational risk and risks arising from business interruption.
KfW Group’s organisational structure provides for a two-tier system comprising decentralised and centralised units liaising with the Operational Risk Committee. Operating risk management is decentralised within the business sectors and the subsidiaries, and is performed by the respective directors or managing directors, who are supported by the respective sector coordinators of the Operational Risk and Business Continuity Management. The operating risk management team organises the monitoring
and communication of operating risks in Risk Controlling (central OpRisk Controlling) and Compliance (central Business Continuity Management). It develops the methods and instruments for identifying and assessing operating risk and monitors their uniform application.
The aim of management and control of operational risk and business continuity management is the proactive identification and averting of potential losses for KfW Group, i. e. to make emergencies and crises manageable and to secure KfW Group’s structural ability to remain in operation despite the loss of key resources.
37
KfW Financial Information 2016 Group management report
In accordance with Article 3, sentence 52 of the CRR, KfW Group defines operational risk as the risk of loss resulting from inadequate or failed internal processes, people and systems or from external events. The following types of operational risk are also defined: behavioural risk, system and information and communication technology risk, model risk, legal risk (including compliance risk) and outsourcing risk.
Legal risk (including compliance risk) is the risk of loss that arises from violation of or non-compliance with requirements that could result in legal disputes or other measures to avoid legal disputes. Requirements include laws, regulations, prescribed practice, internal policies and procedures, ethical standards and rules of conduct. Compliance risk is the risk of legal or regulatory sanctions or financial losses that arises from non-compliance with laws, rules, regulations or market standards. KfW Group addresses legal risk via its organisationally independent central Legal Affairs department, in particular by involving it early in the process and by ensuring that the department cooperates closely with external legal advisers in Germany and abroad. Moreover, the group addresses risks that arise from changes in laws via its regulatory compliance function and the processes the function has established.
Model risk is the potential loss that an institution may suffer as the result of decisions taken largely based on the results of internal models that prove erroneous upon development, implementation or application.
Losses are recorded in KfW Group in an OpRisk events database. After each quarter, a detailed report is made in the relevant departments of the loss events recorded and any measures introduced as a result. The Executive Board, the Board of Supervisory Directors and the Operational Risk Committee are briefed monthly or quarterly as part of internal risk reporting. Ad hoc reports are also made if a loss exceeds a certain level.
In addition, operational risk is systematically recorded in risk assessments that are carried out group-wide. Such assessments also examine new activities in the New Products Process (NPP) as well as changes in operational processes for potential operational risks. Within the risk assessments, operational risk is measured on the basis of internal data or expert esti-
mates which are backed by a distribution assumption for loss frequency and amount. The potential losses revealed in the risk assessments carried out are reported to the directors and heads of department and the Executive Board once the data have been collected. Throughout the year, each business area checks the implementation of its risk indicators for the purpose of monitoring whether the potential losses established in the risk assessment are above a fixed threshold value. As part of the risk assessment, the business areas check the implementation of additional risk-mitigating measures (e.g. checks as part of the internal control system, or “ICS”).
In total, operational risk within the group required a total of EUR 1,033 million in economic capital as of 31 December 2016. This is EUR 77 million less than as of 31 December 2015, which is due to refinements to the methods used in the calculation model.
Business continuity management is implemented if a business interruption occurs due to internal or external events. This is an integrated management process which covers all the aspects of the four key outage and loss scenarios: site outages (building or infrastructure), IT system outages, staff outages and service provider outages. Business continuity management incorporates preventative components (emergency preparedness) and reactive components (emergency and crisis management) in equal measure.
For the purpose of business continuity management, business processes are analysed and categorised based on how critical they are, and the supporting resources for each case examined accordingly. Identifying critical business processes and their dependency on supporting resources forms the basis for effective business continuity management. Individual measures are developed for these business processes and their supporting resources, ensuring that the required availability is guaranteed and business risks are reduced. These include emergency workstations, emergency plans, communication tools and alerts/ alarms. KfW Group’s crisis team takes responsibility for crisis management as a whole when unforeseen events occur. It practises emergency and crisis organisation teamwork in regular crisis team tests.
38
KfW Financial Information 2016 Group management report
OTHER RISKS
Equity investment risks
In managing equity investment risks, KfW Group differentiates between risks from equity investments at operational level and strategic equity investments.
Equity investments (operational level)
In making operational level private equity investments, the bank fulfils its mandate from the Federal Government to conduct promotional business, particularly financings. Accordingly, there are equity investments in connection with domestic and Euro-pean investment financing and in the area of Financial Cooperation and in the business sector Export and project finance. KfW Group-wide basic rules for equity investments at operational level are set out in guidelines. Specific rules tailored to certain segments of equity investments are also set out in sub-portfolio guidelines, working instructions or risk guidelines. Risk measurement is performed at an individual loan commitment level for operational level equity investments in the same way as for credit risk. In terms of reporting requirements, equity investment portfolio risk is reported separately.
Strategic equity investments
Strategic equity investments support KfW’s mandate of providing an efficient and sustainable promotional offering. In addition to reinforcing and expanding core competencies, the focus of this investment type is on complementing KfW’s business sectors. Strategic equity investments normally have a long-term holding period. There are also equity investments in accordance with Article 2 (4) of the KfW Law (mandated transactions). Such equity investments are entered into particularly due to overarching strategic interests. A dedicated organisational unit is responsible for strategic equity investments based on an equity investment manual that describes legal bases, strategies, principles, procedures and responsibilities of equity investment management. Acquisitions and disposals of and changes to strategic equity investments are subject to defined due diligence processes as well as authorisation by the Executive Board and Board of Supervisory Directors in accordance with the KfW Bylaws. In addition, taking a stake in an equity investment in excess of 25% requires authorisation by the Federal Ministry of Finance in accordance with the Federal Budget Code (Bundeshaushaltsordnung – “BHO”). Strategic equity investments and their individual risks are constantly monitored and are presented to the Executive Board as part of an annual equity investment report – as well as in ad hoc reports. The individually defined strategies for the equity investments are updated annually. Moreover, the group is normally represented in the supervisory bodies of its strategic equity investments.
Due to the high risk relevance for KfW Group and for reasons of uniform group management, KfW IPEX-Bank and DEG’s risks are managed as part of KfW Group’s risk management. For example, the subsidiaries’ business activities are included under the look-through principle in KfW Group-wide limits and in KfW Group’s capital budget, while representatives of the subsidiaries are
included in KfW Group’s risk committees. The group also monitors DEG and KfW IPEX-Bank on a stand-alone basis and regularly reports to the Executive Board as part of the monthly internal KfW Group risk report.
Reputational risk
Reputational risk is the risk that the perception of the group from the point of view of the relevant internal and external interest groups will deteriorate for the long term with a negative impact on KfW Group. This negative impact could lead to a decrease in KfW Group’s net assets, earnings or liquidity (e. g. decline in new business) or may be of a non-monetary nature (e.g. difficulty in recruiting new staff). Reputational risk may arise as a consequence of other types of risk, or independently. In the risk management process, reputational risk is managed in a decentralised manner. The framework for this purpose includes sustainability management with group-wide environmental and social principles relevant to credit approvals, or basing the management of KfW Group’s own securities portfolio on sustainability criteria. Furthermore, examinations of new activities in the NPP as well as of outsourced activities in out-sourcing management are regularly conducted to detect potential reputational risks.
Moreover, as part of risk identification, the central reputational risk control function coordinates qualitative reputational risk assessment and creates a risk profile outlining the group’s greatest reputational risks. In addition, reputational risk events that have occurred are reported on an ongoing basis.
Project risk
Original project risk comprises, in particular, planning assumptions that turn out to be inaccurate. Project risk has implications for the achievement of project objectives with regard to cost, time and quality (e. g. underestimating the cost of implementation, and time constraints arising from parallel projects). KfW Group’s project risk arises particularly in connection with various major long-term projects. Managing project risk is part of project management and takes place in both the project planning and execution stages.
The Central Project Management Office supports major projects in fulfilling their objectives and achieving their targets. As the central authority for project portfolio management, it provides the methodological framework for KfW Group’s major project implementation and creates transparency at the level of the entire project portfolio. This enables the Project Board and Executive Board to take targeted decisions. Setting requirements in respect of methods through the Central Project Management Office enables a consistently high quality of implementation. Compliance with this framework and these requirements by major projects is also monitored and supported.
39
KfW Financial Information 2016 Group management report
Internal monitoring procedures
Internal Auditing
Internal Auditing is an instrument of the Executive Board. As an entity that works independently of KfW Group procedures, it audits and assesses all of KfW Group’s processes and activities to identify the risks involved and reports directly to the Executive Board. With a view to risk management processes, Internal Auditing in 2016 audited the decentralised risk management processes and central aspects of risk management and risk control which were relevant group-wide. Focal points included analyses of market and credit risk and reporting in support of major projects, as well as in the IRBA self-assessment and assessment of the capital planning process. Regarding decentralised risk management processes, the audit focused on processes in risk management of financial institutions and countries, among other areas.
As in previous years, Internal Auditing also monitored the continued development of risk measurement procedures in 2016 by participating (with guest status) in meetings of decision-making bodies.
Internal Auditing also functions as KfW Group’s internal auditing department. It is involved in subsidiaries’ audit planning and incorporates the audit results of the subsidiaries’ internal auditing departments in group-wide internal audit reporting.
Compliance
The success of KfW Group is largely based on the confidence its shareholders, customers, business partners, employees and the general public place in its efficiency and above all in its integrity. This confidence rests to a large extent on the implementation of and compliance with relevant statutory, supervisory and internal regulations and other relevant laws and rules. The Executive Board bears the overall responsibility for compliance within the Group. The Executive Board delegates the associated tasks to the Compliance department.
The Compliance organisation is structured in accordance with the Three Lines of Defence model and, as the second line of defence, it is aligned with the requirements for a MaRisk compliance function. In this connection, group compliance has, for a number of years, included measures to comply with data protection regulations as well as measures for the prevention of insider trading, money laundering, terrorism financing and other criminal activities, and for monitoring legal requirements and the associated implementation measures. This also includes protection of information, buildings, individuals and the IT infrastructure as well as ensuring business continuity management. There are therefore binding rules and procedures that influence the day-to-day implementation of values and the corporate culture, which are continually updated to reflect current law as well as market requirements.
Regular training sessions on compliance and anti-money laundering are held for KfW Group employees. In addition to these
classroom seminars, e-learning programmes on data protection, information security, securities compliance, and prevention of money laundering and fraud are available.
Internal control system (ICS)
The aim of KfW Group’s ICS is to use suitable principles, measures and procedures to ensure the effectiveness and profitability of business activities, compliance with the legal requirements applicable to KfW Group, the accuracy and reliability of external and internal accounting, and the protection of assets.
There are group-wide ICS rules as well as binding group-wide minimum requirements of the ICS. KfW Group’s ICS is based on the relevant legal (bank regulatory) requirements8), in particular those set forth in the KWG and MaRisk, and the market standard COSO model9).
In accordance with the COSO model, the ICS consists of the five following interrelated components: control environment, risk assessment, control activities, information/communication and monitoring/auditing. These components extend to all KfW Group’s organisational entities, functions and processes. The control environment is the environment within which KfW Group introduces and applies rules. Risk assessment includes the identification, analysis and evaluation of risks that result from implementing corporate strategy. Control activities are aimed at achieving corporate objectives effectively and detecting or minimising risks. Adequate information and communication procedures in KfW Group enable all stakeholders to be provided with the information they need in the necessary detail. Appropriate monitoring and audit mechanisms determine the functionality and effectiveness of the ICS.
Procedural rules form the basis of the ICS. These constitute the framework for a proper business organisation within KfW Group, in the form of a binding policy.
Workflow organisational measures and controls ensure that monitoring is integrated into processes. Monitoring measures integrated into processes serve to avoid, reduce, detect and/or correct processing errors or financial loss. The effects of any planned changes to the operational and organisational structure on the procedure and intensity of monitoring are analysed in advance.
KfW Group has implemented accounting-related controls to minimise the risk of error in stand-alone and consolidated financial statements and ensure the correctness and reliability of internal and external financial reporting. The accounting-related controls are part of the ICS.
In ICS testing, Internal Auditing examines the proper implementation of controls relevant to ICS.
| 8) | See section 25 a (1) no.1 KWG, MaRisk AT 4.3, and sections 289 (5), 315 (2) no.5, 324, and 264 d HGB. |
| 9) | COSO = Committee of Sponsoring Organizations of the Treadway Commission. |
40
KfW Financial Information 2016 Group management report
The system is supplemented by the Compliance department, which, on the basis of statutory and supervisory requirements/ conditions, defines and monitors compliance with relevant measures. The Compliance function performs regular process-based and accompanying monitoring of the relevant areas of the internal control system. It also takes into account the results of the Risk Controlling function (including OpRisk).
The adequacy and effectiveness of the ICS is also assessed by Internal Auditing on the basis of risk-based audits carried out independently of group procedures.
The details of the implementation of the internal control system at KfW and its legally independent subsidiaries KfW IPEX-Bank and DEG are determined by central requirements as well as the relevant business sectors and risk strategies.
The Executive Board holds overall responsibility for the group’s internal control system. At DEG and KfW IPEX-Bank, overall responsibility is held by the management. The design and implementation at the different corporate levels is the responsibility of the relevant managers according to the organisational structure. A report is rendered annually to KfW Group’s supervisory bodies.
To ensure the adequacy and effectiveness of the ICS, KfW Group regularly scrutinises and continually refines KfW Group’s standards and conventions and ensures that they are implemented in the business sectors on a permanent basis.
41
KfW Financial Information 2016 Group management report
Forecast and opportunity report
General economic environment and development trends
KfW expects global growth of 3.4% for 2017, which means somewhat stronger momentum than in 2016.
A moderate upturn is predicted for both industrialised countries (2017 forecast: 1.7%) and developing countries and emerging economies (2017 forecast: 4.6%). Economic momentum in the United States (US) is likely to see moderate acceleration compared to the previous year. The United Kingdom (UK), in contrast, can expect to see increased negative consequences of the Brexit vote, causing a considerable slowdown in growth. Among developing countries and emerging economies, the situation in the largest crisis countries Brazil and Russia is expected to stabilise in 2017, while the gradual downturn in China is expected to continue, although a “hard landing” is unlikely. Sustained solid growth is forecast in many other emerging economies and a lot of the poorer developing countries. However, this world economic outlook is subject to major economic and geopolitical risks. A monetary policy shift – such as pursued currently and likely to be continued by the US Federal Reserve – poses some adjustment problems and will affect other countries, too. The crisis in the euro area is not over yet.
The Brexit vote, the election of Donald Trump as US president and the failed referendum in Italy have unsettled investors in these countries as well as trading partners. Proponents of free trade and integration are increasingly finding themselves on the defensive side in the United States and Europe. Higher and more sustainable economic growth in industrialised nations, developing countries and emerging economies requires greater investment as well as structural reforms (e. g. in relation to the labour market, competition, fiscal policy, infrastructure and financial sector). In addition to these economic risks, geopolitical risks such as military conflicts persist in many regions of the world – not to mention the threat of terrorism and challenges posed by waves of refugees.
Growth is set to remain stable in the Economic and Monetary Union (EMU) member countries in 2017 but will not accelerate beyond a moderate pace. Economic recovery remains tied to private consumption, which benefits from the improved labour market situation. The level of employment may return to a level last seen in 2008, although the creation of new jobs is still proceeding too slowly. Fiscal policy may help in this regard, but a slight supportive impetus is the best that can be expected. Despite initial steps towards normalisation, the expansionary monetary policy means low financing costs. This, along with the already high degree of capacity utilisation, points towards a more dynamic trend in corporate investments. However, the fundamentally positive environment still harbours the political
risks outlined above, which makes it very difficult for businesses to advance their plans and thwarts any major turnaround in what has been weak investment activity for many years now. Overall, KfW forecasts price-adjusted GDP growth of around 1.5% in EMU countries in 2017. Although the recovery continues intact, this means that per capita production in the euro area economy is still lower than ten years ago. This is a factor in the political tension within the euro area, especially given that the countries particularly affected by the debt crisis are only catching up slowly.
The German economy was generally in a healthy state at the beginning of 2017, particularly considering the difficult international environment. Domestic demand, the main driver of economic momentum, remains strong. The country is likely to see further solid growth in consumption in 2017 because the employment rate continues to rise. However, the climbing inflation rate will put pressure on real wage growth, meaning that consumption will likely grow at a somewhat slower pace than in 2016. The same is true for housing construction, although increasing interest rates should have a slight braking effect. Although the high utilisation of industrial capacity as such points to a noticeable increase in corporate investments, it is likely to be moderate, given the uncertainty associated with the consequences of the Brexit vote and the US’s new trade policy. The risk of the world economy being less open in the future hampers investment planning, particularly in the export sectors that are key to the German economy. Nevertheless, exports are likely to recover to a certain extent, not least because important emerging economies such as Brazil and Russia seem to be able to overcome their recessions. Overall, KfW expects real growth of 1.3% in 2017, which would be around half a percentage point lower than that in 2016, with the majority of the deceleration due to considerable fluctuations in the number of working days. The 2017 economic growth forecasts publicly available at the end of 2016 ranged from 0.9% to 1.7%.
The financial market environment will remain characterised by an overall highly expansive monetary policy in 2017. Although the European Central Bank plans to reduce its bond purchases from EUR 80 billion to EUR 60 billion per month as of April 2017, this purchasing will continue until at least the end of 2017, which implies an additional major expansion of its balance sheet. The negative deposit rate is also expected to remain for quite some time in the euro area. In contrast, the US Federal Reserve has been tightening monetary policy since the end of 2015. So far, it has raised key interest rates only slightly and is expected to continue just as cautiously in 2017. In this environment, the potential for rising interest rates in the euro area in particular remains limited.
42
KfW Financial Information 2016 Group management report
Political events could again cause unrest in the financial markets in 2017. In addition to important elections in some euro member states and the expected start of negotiations on the UK’s exit from the European Union (EU), there is high uncertainty at the beginning of 2017 with regard to the economic policy decisions the new US president will take. In the event of stronger
fiscal policy impetus and related expectations of rising inflation, the US Federal Reserve may feel compelled to increase interest rates faster and higher than currently assumed by the majority of financial market players, entailing negative implications for other countries and the financial markets.
Risk outlook – Risk situation and risk-bearing capacity
After the election of a new US president, it is difficult to forecast economic performance for 2017 in terms of risk. Whereas the expansionary fiscal and tax policy promised by the new administration could stimulate the US economy, it is hard to estimate the impact on the world economy of such change in economic policy in the United States. Historically, experience with such economic policy, reminiscent of Reaganomics – associated with tax cuts and increased public spending – has been sobering and led to massive increases in government debt and interest rates. Such periods were also marked by a very volatile US dollar. Moreover, if the announced protectionist foreign policy is systemically implemented, the potential for conflict in other areas of international cooperation (e. g. the environment or security) will also increase in the medium term. Those affected by the trade restrictions primarily include North American Free Trade Agreement (NAFTA) partners Mexico and Canada, but also China and the euro area (particularly Germany). Overall, there is thus potential for new turbulence in the world economy.
The growth outlook for the industrialised countries remains mixed for 2017, particularly due to the persisting structural problems in the euro area. Economic momentum is likely to wane in the UK given the prospects of Brexit. Growth prospects in Japan remain low. The emerging economies, among them large countries such as China, Mexico, Nigeria and South Africa, some of which suffered major declines in growth and depreciating currencies in 2016, remain very vulnerable to new shocks. In addition, a considerable risk remains that geopolitical tensions or renewed unrest in the financial markets may trigger a setback. Accordingly, the risks for global economic activity remain significant.
As in the previous year, the persisting low interest rate environment will continue to exert pressure on the profitability of the German banking sector in 2017 – with increasing challenges primarily for banks whose business models are heavily dependent on interest rates. The high margin pressure, new competitors (such as FinTech companies) and increasing regulatory requirements will force banks to pursue further costs savings and could accelerate the consolidation process. The capitalisation of banks in the EU has improved steadily in recent years. Nevertheless, banks in the southern European countries report a below-average tier 1 capital ratio (CET1 ratio), meaning that strengthening capital will still be very important for them in 2017. Many banks, particularly those from the Nordic countries, Germany, the Netherlands and Switzerland, will likely continue to be confronted with increasing capital requirements in the next few years, due to implementation of Basel III, meeting the
Total Loss Absorbing Capacity/Minimum Requirement for Eligible Liabilities (TLAC/MREL) and the new requirements affecting, in particular, the calculation of risk assets (Basel IV). Factors leading to uncertainty remain significant for all European banks in 2017. In addition to the unsolved banking crisis in Italy, the election results in the Netherlands, France and Germany – along with Brexit negotiations with the UK – could place a burden on the financial markets and thus also the banks. The outlook for the US banking market is positive for 2017, given that profitability is set to improve following further rate hikes by the US Federal Reserve, continued credit growth and expected easing of banking regulation. However, some banking markets in developing countries and emerging economies will experience the downside to the higher interest rates in the US and a potential further appreciation of the US dollar. This will affect countries dependent on foreign refinancing, such as Turkey, but also those in which banks have written the majority of their loans in US dollars, including some Commonwealth of Independent States (CIS) countries and certain Latin American countries.
Positive overall performance is expected for the German corporate sector in 2017 in light of stable domestic demand and increasing exports. However, there is heightened uncertainty here, too, due to unpredictable political developments primarily in Europe and the US.
The positive sentiment in the German private equity market is now stable at a high level following a brief subdued period. Both fundraising and the exit climate are positive. The private equity scene is benefiting from the ongoing low interest rate environment and related continued investor interest in alternative investments. The Federal Government of Germany has also indicated its intention of improving the political and tax framework, making the market outlook favourable for 2017, too. However, this may deteriorate depending on the development of the general politico-economic environment.
The performance of European securitisations is expected to remain stable at a good level in 2017, despite various politico-economic uncertainties. This is due to the solid hedged structures in place, including for securitisation transactions from southern and south-western Europe.
Overall, KfW does not anticipate material effects on the group’s risk situation from the expected developments in the group’s risk-relevant segments.
43
KfW Financial Information 2016 Group management report
The forecasts for KfW Group’s tier 1 and total capital ratios prepared in the group’s internal capital adequacy process show that they will easily meet the expected minimum supervisory requirements in 2017. Stable overall developments are anticipated for the group’s economic risk-bearing capacity (99.99% solvency level) in 2017.
Potential changes in economic, political, legal and regulatory conditions may have a significant impact on capital ratios and economic risk-bearing capacity. There is thus considerable uncertainty regarding the forecast for 2017.
The liquidity situation was stable in 2016. The funding volume was in line with projections. The need for funding in 2017 is approximately EUR 75 billion and has thus increased compared to the previous year, due to lower cash inflows from repayments and higher outflows of funds compared to 2016. Unscheduled repayments can be expected to remain at a high level. No significant changes in liquidity risk are anticipated, due to the continued stable funding situation.
New business projections
Overview
KfW Group plans a promotional business volume of EUR 75.5 billion for 2017. This reflects a continuation of the moderate growth in the business sectors operating abroad, as well as stable domestic promotional business at a high level. The decline compared to 2016 is largely due to special factors in 2016 – particularly in the promotional areas housing and infrastructure in the business sector Kommunal- und Privatkundenbank/Kreditinstitute (Municipal and Private Client Bank/Credit Institutions) – that resulted in a higher commitment volume. To implement KfW Group’s strategic objectives, the plans for the group’s business sectors contain measures with a strategic focus on financings with a high degree of relevance to development and on an orientation of business activities towards the key megatrends “climate change and the environment”, “globalisation and technical progress” and “demographic change”. KfW facilitates the digital transformation of the economy through its promotional support. The portion of promotional business volume dedicated to climate and environmental protection financing is planned to be 35%, thereby achieving the strategic objective threshold of approximately 35%. The SME financing share continues its stable development; at 45%, the share of financing planned for SMEs in the domestic promotional business is expected to be at the target level set in the strategic objectives (approximately 45%). The focus in KfW’s domestic promotional business will remain on SME financing and on safeguarding the viability of companies. KfW’s international business sectors are on course for growth in the medium term in order to support the internationalisation of German companies as part of globalisation.
Domestic business
Domestically, KfW supports the German economy with the promotional programmes of the business sectors Mittelstandsbank (SME Bank) and Kommunal- und Privatkundenbank/Kreditinstitute (Municipal and Private Client Bank/Credit Institutions) through the promotion of investments by private individuals, companies, cities and municipalities as well as non-profit and social organisations.
Mittelstandsbank (SME Bank) continues to regard itself as a reliable and goal-oriented partner of German SMEs and ministries, as well as its financing partners, for the future. The bank’s long-term financings at favourable rates for investment and
start-up projects, as well as for corporate succession, contribute indirectly to maintaining the competitiveness and future viability of the German economy and creating and safeguarding jobs. Equity finance was successfully realigned with the establishment of ERP Venture Capital Fund Investments and the launch of the coparion co-investment fund’s operating activities. Mittelstandsbank remains an important financing partner in climate and environmental protection, particularly as part of the energy transition, with around 40% of its commitment volume. The KfW Energy Transition Action Plan launched in 2011 with a financing volume totalling over EUR 100 billion has been successfully implemented by the end of 2016. This area’s promotional offering saw considerable further improvements in 2016 through the introduction of the “waste heat” component to the energy efficiency programme and the expansion of the renewable energy product offering to include other purposes, in particular making the electricity network more flexible and the digitalisation of the energy transition.
The following market developments are important external factors for Mittelstandsbank:
| 1. | The low interest rate environment expected to persist will continue to enable banks to have ample liquidity. |
| 2. | Digitalisation is changing SMEs’ economic parameters for the long term (Industry 4.0). As a consequence, innovative ability and speed will remain key to the success of German companies and the national economy, and the main focal point of the Federal Government’s promotional policy, including its “Digital Strategy 2025” and “High-tech Strategy”. |
| 3. | Supporting the energy transition remains highly relevant as one of the German government’s chief economic and environmental policy projects. The government’s commitment to the Paris Agreement on climate change again reinforces the urgency of achieving the political objectives to reduce greenhouse gas emissions. Climate and environmental protection financing continues to be strongly shaped by the regulatory framework at national and European levels. |
For 2017, Mittelstandsbank plans to continue providing financing at the same level as in the previous year, with a promotional business volume totalling EUR 20.7 billion. It will focus primarily on the following developments:
44
KfW Financial Information 2016 Group management report
| – | Relevant energy and environmental products will be bundled and marketed under the KfW Energy Transition Action Plan. |
| – | The equity finance product offering with its three pillars, High-Tech Start-Up Fund, ERP Venture Capital Fund Investments and coparion co-investment fund, is to be maintained. |
| – | The promotion of innovation will focus on the future trend of digitalisation, as part of the expansion of the “Digitalisation/ Industry 4.0” promotional offerings. |
| – | Mittelstandsbank’s main medium-term strategic target is to systematically digitalise all aspects of the promotional business (products, marketing and processes). To this end, the “On-lending Online 2.0” distribution platform for Mittelstandsbank’s first products as well as for a pilot sales partner has paved the way for the fully online application and approval of commercial promotional products since mid-2016. In 2017, the platform will gradually be expanded to other sales partners and products in on-lending. |
Kommunal- und Privatkundenbank/Kreditinstitute (Municipal and Private Client Bank/Credit Institutions)
continues to focus its promotional activities on the two megatrends “climate change and the environment” and “demographic change”. The aim is to maintain high proportions of promotion within these megatrends along with high quality of promotional products. In addition to its focus on private clients, the long-term objective of the business sector is to continue to be a reliable partner to municipalities and municipal service companies as well as to the promotional institutions of the federal states (Landesförderinstitute). Moreover, support for leasing investment finance addresses the major importance of the SME client group.
Four major factors are expected to contribute to ongoing high demand in KfW’s private client business in the medium term:
| 1. | The persistent low interest rate environment and rising incomes promote investments in residential property. |
| 2. | Climate change and Germany’s energy transition bolster demand in the housing-related programmes for Energy-efficient Construction and Refurbishment. |
| 3. | Demographic change requires increasing investments in the needs-based development of housing. |
| 4. | The increased intensity of education and training of skilled workers result in continued funding needs in educational programmes for primary and secondary school pupils, university students and those in professional training. |
The Energy-efficient Construction and Refurbishment programmes, in particular, bring KfW in a position as the main promoter of environmental protection for private clients and standard-setter for energy efficiency in residential buildings. The business sector pursues the strategic aim of “demographic change” within the framework of promotional activities through programmes to improve accessibility in existing properties and public spaces, as well as through reliable and customer-focused financing offerings for housing and education. Moreover, the achievement of this strategic aim is underpinned by the continuation of the student
loan programme, which has been successfully established on the market for ten years, and accompanying educational offerings for academic and professional qualifications. The two basic programmes “IKK – Investment Loans for Municipalities” and “IKU – Investment Loans for Municipal Companies and Social Organisations” serve to position KfW as a reliable partner to municipalities and municipal service companies. As a financing partner to the promotional institutions of the federal states, the business sector aims to ensure a business volume of programme-based global loans at the current high level. The aim in “general funding”, too, is to maintain the business volume at a high level. Due to the major importance of KfW’s “SME” customer group, the business sector’s traditional domestic promotional offering is complemented primarily by global loans for lease financing and global loans to selected European commercial and promotional banks for SME and energy-efficiency financing.
After automating the online application process (On-lending Online 2.0) for housing-related promotional programmes, the business sector continues to drive the digitalisation strategy, particularly through the gradual expansion of KfW’s newly launched grant portal.
For 2017, Kommunal- und Privatkundenbank/Kreditinstitute is aiming for a promotional business volume of EUR 28.5 billion.
Financial markets
The business sector Financial markets invests in securitisation transactions in order to support improvement in the credit supply via capital market instruments. In this way, KfW contributes to the diversification and stabilisation of funding opportunities for SMEs in Germany and Europe. Investments of around EUR 1.3 billion are planned for 2017, of which up to EUR 500 million will be European SME-related. KfW and the European Investment Fund (EIF) were responsible for starting the EIF-NPB Securitisation Initiative (ENSI) in 2016, along with other European national promotional institutions (NPIs). The initiative is aimed at revitalising the market and thus improving funding opportunities for European SMEs via joint participation in securitisation transactions. The collaboration between KfW, EIF and NPIs will be further intensified in the framework of ENSI next year. In the future, capital market-supported SME financing in the framework of the European Fund for Strategic Investments (EFSI), also known as the “Juncker plan”, is to be strengthened via ENSI.
KfW’s purchase of green bonds under the promotional mandate issued by the Federal Ministry for the Environment, Nature Conservation, Building and Nuclear Safety in spring 2015 helps to fund suitable environmental and climate protection projects and support further development of the green bond market. The bank plans to expand its green bond portfolio volume to EUR 1 billion over the next two to three years and make new investments of around EUR 300 million in 2017.
For 2017, the business sector Financial markets is planning a promotional business volume of EUR 1.6 billion.
45
KfW Financial Information 2016 Group management report
International business
As a specialist financier and responsible partner, the objective of the Export and project finance business sector continues to be the strengthening of the German and European economies. Economic performance in the markets relevant to the business sector is stable in Germany and overall satisfactory in the OECD countries. In the relevant developing countries and emerging economies, the few regions with growth potential include Indo-nesia, the countries of the Andes and Mexico. Key markets such as Brazil, Russia and Turkey face challenges. Overall, there is sufficient potential for German and European exporters and enterprises that invest in their competitiveness; there are also opportunities for the Export and project finance business sector, accordingly. The Export and project finance business sector (i. e. the promotional business on KfW’s balance sheet and the market business of KfW’s subsidiary KfW IPEX-Bank) aims to sustainably support the German and European economy with project and export financing to maintain and increase competitiveness and internationalisation. The business sector aims to continuously enhance its structuring expertise to achieve its strategic objectives. This specifically means assessing and further developing strategic options in order to offer clients products geared to the market at competitive terms. Such products include those that conserve equity such as private risk insurance (PRI) and the assumption of selected roles in capital market transactions, like project bonds and structured corporate bonds, as well as the placement of large self-structured financings. A high priority is placed on the continued improvement of risk diversification to sustainably stabilise earnings. The main points are a stronger focus on marketing business that does not affect risk-weighted assets, and assessing the increased use of hedging instruments and transfer of risk to the market (PRI and syndication) as well as increased identification and management of hidden concentration risks (focus portfolios). Overall, this should result in less volatile and more limited risk costs. Moreover, a variety of projects have been pooled into the strategic initiative IPEXnext for the continuous development of the business sector. Following the normalisation of commitment volume in 2016, the business sector Export and project finance plans to continue along the growth path approved by the Executive Board for financial year 2017 with a promotional business volume of EUR 15.9 billion.
The Promotion of developing countries and emerging economies business sector encompasses the business activities of KfW Development Bank and DEG.
KfW Development Bank expects dynamic business growth to continue in the next few years: Germany’s large contribution to official development assistance (ODA) will continue in view of the country’s positive economic performance, the refugee and crisis situation and the ongoing need in climate financing. The main focal areas are crisis/refuge, vocational training/employment, climate financing and urban development. In view of the refugee and crisis situation, the European Commission announced a European External Investment Plan (EEIP) to combat the root causes of migration. In addition to the results of the 2015 climate summit, which were rendered more concrete and operational at this year’s COP22 (22nd Conference of the Parties, United
Nations), the implementation of the ambitious Sustainable Development Goals (SDGs) will strengthen the business models of bilateral and multilateral development banks as key sources of financing and expertise. Impact reporting requirements are also increasing in order to better measure progress. The majority of development banks – primarily the Asian Development Bank (ADB), the Agence Française de Développement (AFD) and the World Bank – are raising their financing volumes and further expanding their cooperation with regional and national development banks, particularly in Africa. As the Asian Infrastructure Investment Bank (AIIB) and the New Development Bank (NDB) commence operations, these new players and alliances will be able to support the growth objectives; however, at the same time, there is also a risk of a “race to the bottom” in terms of project quality. In addition, development banks are differentiating their products (e. g. non-sovereign loans, local currency financing and own guarantee mechanisms) and striving to achieve a greater role for the private sector in development work.
KfW Development Bank aims to quickly implement the additional budget funds and raise the promotional business volume accordingly as a means of supporting the Federal Government in expanding and globally positioning German Financial Cooperation. It will further expand its international climate financing, including through the implementation of new innovative promotional approaches such as climate risk insurance and further development of the climate adaptation portfolio, such as in the water sector or urban development. Collaboration with emerging economies will involve a focus on financing and technology transfers to support climate protection.
KfW aims to expand targeted cooperation with strategic partners. KfW has made important proposals under the EU’s EEIP in close cooperation with bilateral European promotional institutions (e.g. AFD), including a proposal to develop a European collateral instrument. In addition to intensive collaboration in a European context, selected cooperation projects are also being implemented with relevant international players.
KfW Development Bank is making a significant contribution to overcoming the refugee crisis with direct effects on Germany through the implementation of projects in crisis regions, as well as by reducing the consequences of climate change, globalisation and demographic change.
For 2017, KfW Development Bank expects a commitment volume of EUR 7.2 billion.
As a promoter of the private sector in developing countries and emerging economies, DEG makes a considerable contribution to the two primary aims “globalisation and technical progress” and “climate and environment”.
DEG has further optimised its strategy, given the changing environment – particularly the volatile, mixed performance on the markets, higher stakeholder expectations of private sector contributions to achieving the new SDGs, monitoring of German businesses, mainly SMEs, and stricter regulatory requirements. In doing so, it relies on its core competences in promoting the private sector in developing countries and emerging economies via an offering of comprehensive financing and consulting services. DEG’s activities are focused on its long-term and successful clients who, in their own activities, serve as a catalyst for local development, thereby contributing towards the achievement of
46
KfW Financial Information 2016 Group management report
SDGs. Primary contributions are creating good and fair jobs, generating local income and offering innovative products and services, while at the same time taking into consideration positive climate and environmental effects and the benefit to people and communities in surrounding areas. The current financing and promotional offerings will be expanded to support the commitment on the part of German companies, especially SMEs, in developing countries and emerging economies. The aim is to improve access to local financing for German clients and their business partners and enhance mobilisation of German private funds. Sustainable earnings ensure DEG’s risk-bearing capacity and organic growth. Profits are retained, thereby supporting DEG’s capital base and the qualitative growth of its financing business. This requires professional portfolio management and risk-adequate interest rates. Economic success is also important in order to obtain leverage as a pioneer investor in developing countries and emerging economies. As a risk capital provider, thereby setting a precedent, and as a provider of long-term sub-
ordinated loans, DEG increasingly aims to finance enterprises in the International Development Association (IDA) as well as conflict and post-conflict countries. The financing offering is also expanding in this area, given the growing visibility of the private sector’s importance in implementing the new development agenda. DEG focuses on continuous development of its “Financing +” approach, which offers clients individual financing and advisory services based on demand.
For financial year 2017, DEG expects a promotional business volume of EUR 1.6 billion.
Privatisation transactions with the German
Federal Government
In connection with the Federal Government’s privatisation transactions, KfW is generally also prepared to conduct further privatisation transactions in 2017, taking into account market conditions and the strategic requirements of the Federal Government.
Funding projections
As one of the world’s largest non-governmental issuers, KfW issues bonds worldwide and enjoys excellent credit quality thanks to the explicit, direct guarantee from the Federal Republic of Germany. KfW has achieved a stable position in the capital markets with a well-diversified long term-oriented funding strategy. It enjoys an excellent reputation among international market participants and is in a position to react in a flexible way to rapidly changing market conditions. KfW seeks to maintain this position with great care and responsibility in order to secure the funding of KfW’s promotional business.
KfW anticipates a high funding volume over the next two years. KfW expects funding volume via the capital markets of approximately EUR 75 billion in 2017.
Its funding strategy is based on reliable and forward-looking action, taking investor needs and market conditions into account. KfW aligns its bond supply and wide product range towards demand-side needs and is thus well received by investors around the world. The three most important pillars of KfW’s funding strategy remain highly liquid benchmark bonds in euros and US dollars, public bonds and private placements. The sustainability strategy in the capital markets will also be continued in the future through the issue of “Green Bonds – Made by KfW” denominated in different currencies. Following the successful return to the capital market with a bond issue denominated in Singapore dollars and Hong Kong dollars in 2016, KfW hopes to generate new impetus through further issues in local currency markets.
Earnings projections
In the current group earnings projections for 2017, KfW expects Consolidated profit (before IFRS effects) of approximately EUR 1 billion based on anticipated macroeconomic conditions. The expected result is thus at the level of the strategic objective. Contributions from Net interest income and Net commission income (in each case before promotional activity) are at a high level similar to that of previous years; however, the ongoing low interest rate environment may limit the potential for additional earnings contributions from interest rate and liquidity maturity
transformation and consequently place an increasing burden on Total net interest income in subsequent years.
The planned Administrative expense for 2017 moderately exceed those of 2016. This increase is expected to be largely due to cost increases from modernisation and regulation, growth in the foreign business sectors and personnel cost increases associated with collective agreements. This is anticipated to only slightly change the expected cost/income ratio before promotional activity.
47
KfW Financial Information 2016 Group management report
The projected standard risk costs, which as a long-standing historical average are considerably higher for 2017 than the actual risk provisions for lending business in 2016, will have a negative effect on earnings. Market conditions permitting, KfW also expects promotional activity in 2017 to be close to the previous budget.
KfW’s business model is oriented towards the medium to long term; income from the lending business (interest rate margins and net commission income) in particular is very stable.
Opportunities and risks for consolidated profit may arise above all for the treasury result from deviating market conditions in conjunction with KfW’s positioning. In addition, opportunities and risks may arise for the valuations as a result of risk provisions that may vary from those planned as well as from temporary effects on results arising from the valuation of economically effective hedges (IFRS-related effects on results). The latter have no economic basis and therefore are not explicitly included in KfW’s planning.
HR strategy/development of workforce
Adequate staffing is a key requirement for implementing KfW’s business strategy. Short and medium-term planning at KfW is complemented by strategic personnel planning for the future. This is currently being developed for major strategic projects in particular with the aim of early identification of necessary changes in terms of professional skills and to implement measures to accommodate these effects (e. g. targeted retraining of employees affected by staff reductions).
With a view to demographic change and the labour market situation, which also affect KfW, specialisation in recruiting will help to meet personnel needs in the future by hiring external staff – if necessary. Comprehensive talent and skills management is one of the core functions of Human Resources (HR) development in order to address changing needs regarding existing employees. In addition to using existing formats for hiring and developing managers, this includes expanding the definition of
talent and therefore succession management at specialist level, developing new career models, such as for project managers, as well as maintaining the existing comprehensive offering of further training. With its professionalised and expanded change management programme, HR provides support for the numerous intensive change processes and major projects under way at the bank, for example due to digitalisation of the working environment.
KfW supports its staff in terms of gender balance, particularly by reconciling career and family life and offering flexible working hours. Diversity will become a new focal point in the next few years.
The HR department was realigned as of 1 January 2017 with the main objective being to provide future-oriented services in line with the KfW strategy, HR client needs and the competitive situation on the market.
Digitalisation as an opportunity
The digitalisation of the economy drives productivity, innovation and new business models. It also presents significant challenges to businesses and policymakers. Digitalisation’s success hinges on investment in the digital infrastructure, adequate data security and data protection plans and the relevant skills for employees. On the one hand, KfW supports the digital transformation of the economy via its promotional activities; on the other, the banking environment – including KfW with its unique business model – is already experiencing considerable change through the trend towards digitalisation and will experience
more in the future. KfW recognised early on the need to take targeted steps to push KfW’s digital transformation in all areas where it would provide a strategic and/or quantifiable benefit for KfW. For this purpose, it created a “digital office” in 2016, with the aim of continuously developing KfW’s digital transformation, creating a broad technical understanding of digitalisation and advancing the necessary cultural change. An innovation lab was also created to increase innovation in digital and non-digital areas as well as to establish an active external network.
48
KfW Financial Information 2016 Group management report
Consolidated financial statements
Consolidated statement of
comprehensive income
Income statement
| | | | | | | | | | | | | | | | | | | | | | | | | | | | | | | | | | | | | | | | | | |
| | | | | | | | | | | | | |
| | | | | | | | Notes | | | | | | | | 2016 | | | | | | | | 2015 | | | | | | | | Change | | |
| | | | | | | | | | | | | | | | EUR in millions | | | | | | | | EUR in millions | | | | | | | | EUR in millions | | |
| | | | | | | | | | | | | |
Interest income | | | | | | | | | | (28) | | | | | | | | | | 8,420 | | | | | | | | | | 9,691 | | | | | | | | | | –1,271 | | |
Interest expense | | | | | | | | | | (28) | | | | | | | | | | 5,810 | | | | | | | | | | 7,090 | | | | | | | | | | –1,280 | | |
Net interest income | | | | | | | | | | | | | | | | | | | | 2,610 | | | | | | | | | | 2,601 | | | | | | | | | | 9 | | |
Risk provisions for lending business | | | | | | | | | | (15), (29) | | | | | | | | | | –150 | | | | | | | | | | –48 | | | | | | | | | | –103 | | |
Net interest income after risk provisions | | | | | | | | | | | | | | | | | | | | 2,460 | | | | | | | | | | 2,553 | | | | | | | | | | –94 | | |
Commission income | | | | | | | | | | (30) | | | | | | | | | | 336 | | | | | | | | | | 336 | | | | | | | | | | 0 | | |
Commission expense | | | | | | | | | | (30) | | | | | | | | | | 79 | | | | | | | | | | 80 | | | | | | | | | | 0 | | |
Net commission income | | | | | | | | | | | | | | | | | | | | 257 | | | | | | | | | | 257 | | | | | | | | | | 0 | | |
Net gains/losses from hedge accounting | | | | | | | | | | (10), (11) | | | | | | | | | | 294 | | | | | | | | | | 175 | | | | | | | | | | 119 | | |
Net gains/losses from other financial instruments at fair value through profit or loss | | | | | | | | | | (11), (12), (32) | | | | | | | | | | 55 | | | | | | | | | | 303 | | | | | | | | | | –248 | | |
Net gains/losses from securities and investments | | | | | | | | | | (16), (33) | | | | | | | | | | –10 | | | | | | | | | | 25 | | | | | | | | | | –35 | | |
Net gains/losses from investments accounted for using the equity method | | | | | | | | | | (6), (34) | | | | | | | | | | 21 | | | | | | | | | | 18 | | | | | | | | | | 3 | | |
Administrative expense | | | | | | | | | | (35) | | | | | | | | | | 1,199 | | | | | | | | | | 1,136 | | | | | | | | | | 63 | | |
Net other operating income | | | | | | | | | | (36) | | | | | | | | | | 102 | | | | | | | | | | 107 | | | | | | | | | | –5 | | |
Profit/loss from operating activities | | | | | | | | | | | | | | | | | | | | 1,980 | | | | | | | | | | 2,302 | | | | | | | | | | –322 | | |
Taxes on income | | | | | | | | | | (20), (37) | | | | | | | | | | –21 | | | | | | | | | | 130 | | | | | | | | | | –152 | | |
Consolidated profit | | | | | | | | | | | | | | | | | | | | 2,002 | | | | | | | | | | 2,171 | | | | | | | | | | –170 | | |
|
Consolidated statement of comprehensive income |
| | | | | | | | | | | | | |
| | | | | | | | Notes | | | | | | | | 2016 | | | | | | | | 2015 | | | | | | | | Change | | |
| | | | | | | | | | | | | | | | EUR in millions | | | | | | | | EUR in millions | | | | | | | | EUR in millions | | |
| | | | | | | | | | | | | |
Consolidated profit | | | | | | | | | | | | | | | | | | | | 2,002 | | | | | | | | | | 2,171 | | | | | | | | | | –170 | | |
Amounts reclassifiable to the income statement | | | | | | | | | | | | | | | | | | | | 60 | | | | | | | | | | –41 | | | | | | | | | | 101 | | |
Other comprehensive income from financial instruments | | | | | | | | | | (16), (38) | | | | | | | | | | 59 | | | | | | | | | | –42 | | | | | | | | | | 101 | | |
Other comprehensive income from deferred taxes on financial instruments | | | | | | | | | | (20), (38) | | | | | | | | | | 0 | | | | | | | | | | 1 | | | | | | | | | | 0 | | |
Other comprehensive income from investments accounted for using the equity method | | | | | | | | | | (6), (38) | | | | | | | | | | 0 | | | | | | | | | | 0 | | | | | | | | | | 0 | | |
Amounts not reclassified to the income statement | | | | | | | | | | | | | | | | | | | | –207 | | | | | | | | | | 221 | | | | | | | | | | –428 | | |
Other comprehensive income from defined-benefit plan pension commitments | | | | | | | | | | (22) | | | | | | | | | | –221 | | | | | | | | | | 231 | | | | | | | | | | –453 | | |
Other comprehensive income from deferred taxes on defined-benefit plan pension commitments | | | | | | | | | | (20) | | | | | | | | | | 15 | | | | | | | | | | –10 | | | | | | | | | | 25 | | |
Other comprehensive income, total | | | | | | | | | | | | | | | | | | | | –147 | | | | | | | | | | 180 | | | | | | | | | | –327 | | |
Consolidated comprehensive income | | | | | | | | | | | | | | | | | | | | 1,855 | | | | | | | | | | 2,351 | | | | | | | | | | –496 | | |
52
KfW Financial Information 2016 Consolidated financial statements
Other comprehensive income comprises amounts recognised directly in equity under Revaluation reserves. These amounts include income and expenses from financial instruments classified as available-for-sale financial assets, changes in actuarial gains and losses for defined-benefit plan pension commitments, and changes in deferred taxes reported depending on the underlying transaction.
Presentation of reclassification amounts included in the income statement
| | | | | | | | | | | | | | | | | | | | |
| | | | | | | | | | |
| | | | | | | 2016 | | | | | | 2015 | | | | | | Change | | |
| | | | | | | EUR in millions | | | | | | EUR in millions | | | | | | EUR in millions | | |
| | | | | | | | | | |
| Reclassification amounts relating to financial instruments | | | | | | 8 | | | | | | 17 | | | | | | –10 | | |
Reclassification amounts relating to deferred taxes on financial instruments | | | | | | 0 | | | | | | 0 | | | | | | 0 | | |
Reclassification amounts relating to investments accounted for using the equity method | | | | | | 0 | | | | | | 0 | | | | | | 0 | | |
Total | | | | | | 8 | | | | | | 17 | | | | | | –10 | | |
The reclassification amounts detailed in the table above represent income and expenses which were accounted for through profit or loss during the reporting period and which were previously recognised directly in equity in the Revaluation reserves. They also include amortisation of Revaluation reserves related to the reclassification of Securities and investments from the measurement category available-for-sale financial assets to the loans and receivables measurement category. Income recognised in the income statement is reported with a negative sign preceding the amount, and expenses with a positive sign.
53
KfW Financial Information 2016 Consolidated financial statements
Consolidated statement of
financial position
Assets
| | | | | | | | | | | | | | | | | | | | | | | | | | |
| | | | | | | Notes | | | | | | 31 Dec. 2016 | | | | | | 31 Dec. 2015 | | | | | | Change | | |
| | | | | | | | | | | | | EUR in millions | | | | | | EUR in millions | | | | | | EUR in millions | | |
Cash reserves | | | | | | (41) | | | | | | 11,573 | | | | | | 460 | | | | | | 11,113 | | |
Loans and advances to banks | | | | | | (9), (14), (15), (42) | | | | | | 275,922 | | | | | | 277,050 | | | | | | –1,127 | | |
Loans and advances to customers | | | | | | (9), (14), (15), (43) | | | | | | 136,704 | | | | | | 134,708 | | | | | | 1,996 | | |
Risk provisions for lending business | | | | | | (15), (44) | | | | | | –1,610 | | | | | | –1,743 | | | | | | 133 | | |
Value adjustments from macro fair value hedge accounting | | | | | | (10), (45) | | | | | | 13,917 | | | | | | 14,420 | | | | | | –503 | | |
Derivatives used for hedge accounting | | | | | | (10), (46) | | | | | | 27,464 | | | | | | 34,641 | | | | | | –7,178 | | |
Other derivatives | | | | | | (10), (11), (12), (47) | | | | | | 7,344 | | | | | | 9,014 | | | | | | –1,670 | | |
Securities and investments | | | | | | (16), (17), (48) | | | | | | 32,715 | | | | | | 31,634 | | | | | | 1,080 | | |
Investments accounted for using the equity method | | | | | | (6), (49) | | | | | | 346 | | | | | | 290 | | | | | | 56 | | |
Property, plant and equipment | | | | | | (18), (50) | | | | | | 931 | | | | | | 919 | | | | | | 12 | | |
Intangible assets | | | | | | (19), (51) | | | | | | 235 | | | | | | 206 | | | | | | 29 | | |
Income tax assets | | | | | | (20), (52) | | | | | | 540 | | | | | | 410 | | | | | | 130 | | |
Other assets | | | | | | (53) | | | | | | 932 | | | | | | 962 | | | | | | –31 | | |
Total | | | | | | | | | | | | 507,013 | | | | | | 502,973 | | | | | | 4,040 | | |
| | | | | | | | | | | | | |
Liabilities and equity | | | | | | | | | | | | | | | | | | | | | | | | | | |
| | | | | | | | | | | | | | | | | | | | | | | | | | |
| | | | | | | Notes | | | | | | 31 Dec. 2016 | | | | | | 31 Dec. 2015 | | | | | | Change | | |
| | | | | | | | | | | | | EUR in millions | | | | | | EUR in millions | | | | | | EUR in millions | | |
Liabilities to banks | | | | | | (12), (21), (54) | | | | | | 19,837 | | | | | | 24,004 | | | | | | –4,166 | | |
Liabilities to customers | | | | | | (12), (21), (55) | | | | | | 11,634 | | | | | | 9,624 | | | | | | 2,010 | | |
Certificated liabilities | | | | | | (21), (56) | | | | | | 422,574 | | | | | | 415,200 | | | | | | 7,374 | | |
Value adjustments from macro fair value hedge accounting | | | | | | (10), (57) | | | | | | 127 | | | | | | 132 | | | | | | –6 | | |
Derivatives used for hedge accounting | | | | | | (10), (58) | | | | | | 18,451 | | | | | | 21,892 | | | | | | –3,442 | | |
Other derivatives | | | | | | (10), (11), (12), (59) | | | | | | 3,007 | | | | | | 2,626 | | | | | | 380 | | |
Provisions | | | | | | (9), (15), (22), (60) | | | | | | 2,865 | | | | | | 2,598 | | | | | | 268 | | |
Income tax liabilities | | | | | | (20), (61) | | | | | | 324 | | | | | | 284 | | | | | | 41 | | |
Other liabilities | | | | | | (23), (62) | | | | | | 938 | | | | | | 1,113 | | | | | | –175 | | |
Subordinated liabilities | | | | | | (23), (63) | | | | | | 200 | | | | | | 300 | | | | | | –100 | | |
Equity | | | | | | (24), (64) | | | | | | 27,055 | | | | | | 25,200 | | | | | | 1,855 | | |
Paid-in subscribed capital | | | | | | | | | | | | 3,300 | | | | | | 3,300 | | | | | | 0 | | |
Capital reserve | | | | | | | | | | | | 8,447 | | | | | | 8,447 | | | �� | | | 0 | | |
Reserve from the ERP Special Fund | | | | | | | | | | | | 1,191 | | | | | | 1,191 | | | | | | 0 | | |
Retained earnings | | | | | | | | | | | | 14,092 | | | | | | 12,091 | | | | | | 2,002 | | |
Fund for general banking risks | | | | | | | | | | | | 600 | | | | | | 600 | | | | | | 0 | | |
Revaluation reserves | | | | | | (6), (16), (22), (60) | | | | | | –576 | | | | | | –429 | | | | | | –147 | | |
Total | | | | | | | | | | | | 507,013 | | | | | | 502,973 | | | | | | 4,040 | | |
54
KfW Financial Information 2016 Consolidated financial statements
Consolidated statement of
changes in equity
Consolidated statement of changes in equity in the financial year 2016
| | | | | | | | | | | | | | | | | | | | | | | | | | | | | | | | | | | | | | |
| | | | | | |
| As of
1 Jan. 2016 |
| | | | | | | | Changes in consolidated group | | | | | | Owner-related changes in equity | | | | | | Appropriation of comprehen- sive income 2016 | | | | | | As of 31 Dec. 2016 | | | | |
| | | | | | | | EUR in millions | | | | | | | | | EUR in millions | | | | | | EUR in millions | | | | | | EUR in millions | | | | | | EUR in millions | | | | |
Subscribed capital | | | | | | | 3,750 | | | | | | | | | 0 | | | | | | 0 | | | | | | 0 | | | | | | 3,750 | | | | |
| less uncalled outstanding contributions | | | | | | | –450 | | | | | | | | | 0 | | | | | | 0 | | | | | | 0 | | | | | | –450 | | | | |
| Capital reserve | | | | | | | 8,447 | | | | | | | | | 0 | | | | | | 0 | | | | | | 0 | | | | | | 8,447 | | | | |
of which promotional reserves from the ERP Special Fund | | | | | | | 7,150 | | | | | | | | | 0 | | | | | | 0 | | | | | | 0 | | | | | | 7,150 | | | | |
Reserve from the ERP Special Fund | | | | | | | 1,191 | | | | | | | | | 0 | | | | | | 0 | | | | | | 0 | | | | | | 1,191 | | | | |
Retained earnings | | | | | | | 12,091 | | | | | | | | | 0 | | | | | | 0 | | | | | | 2,002 | | | | | | 14,092 | | | | |
Statutory reserve under
Article 10 (2) KfW Law | | | | | | | 1,875 | | | | | | | | | 0 | | | | | | 0 | | | | | | 0 | | | | | | 1,875 | | | | |
Special reserve under
Article 10 (3) KfW Law | | | | | | | 7,022 | | | | | | | | | 0 | | | | | | 0 | | | | | | 1,290 | | | | | | 8,312 | | | | |
Special reserve less the special loss
account from provisioning pursuant to
Section 17 (4) of the D-Mark Balance
Sheet Law | | | | | | | 21 | | | | | | | | | 0 | | | | | | 0 | | | | | | 0 | | | | | | 21 | | | | |
Other retained earnings | | | | | | | 3,173 | | | | | | | | | 0 | | | | | | 0 | | | | | | 712 | | | | | | 3,885 | | | | |
Fund for general banking risks | | | | | | | 600 | | | | | | | | | 0 | | | | | | 0 | | | | | | 0 | | | | | | 600 | | | | |
Revaluation reserves | | | | | | | –429 | | | | | | | | | 0 | | | | | | 0 | | | | | | –147 | | | | | | –576 | | | | |
Valuation results from financial instruments (after tax) | | | | | | | 15 | | | | | | | | | 0 | | | | | | 0 | | | | | | 60 | | | | | | 75 | | | | |
Investments accounted for using the equity method | | | | | | | 0 | | | | | | | | | 0 | | | | | | 0 | | | | | | 0 | | | | | | 0 | | | | |
Actuarial gains and losses from defined-benefit plan pension commitments (after tax) | | | | | | | –443 | | | | | | | | | 0 | | | | | | 0 | | | | | | –207 | | | | | | –650 | | | | |
Equity | | | | | | | 25,200 | | | | | | | | | 0 | | | | | | 0 | | | | | | 1,855 | | | | | | 27,055 | | | | |
KfW’s net income amounting to EUR 1,290 million was used to increase the special reserve under Article 10 (3) of the KfW Law.
The difference to the consolidated comprehensive income is allocated to Other retained earnings or – if recognised directly in equity – to Revaluation reserves.
55
KfW Financial Information 2016 Consolidated financial statements
Change in the revaluation reserves from financial instruments including the related deferred taxes and in the investments accounted for using the equity method in the financial year 2016
| | | | | | | | | | | | | | | | | | | | | | | | | | | | | | | | | | | | | | | | |
| | | | | | | Bonds and other fixed- income securities | | | | | | Shares and other non- fixed income securities | | | | | | Equity investments | | | | | | Effects of deferred taxes | | | | | | Investments accounted for using the equity method | | | | | | Total | | | | |
| | | | | | | EUR in millions | | | | | | EUR in millions | | | | | | EUR in millions | | | | | | EUR in millions | | | | | | EUR in millions | | | | | | EUR in millions | | | | |
As of 1 Jan. 2016 | | | | | | 15 | | | | | | 0 | | | | | | 0 | | | | | | 0 | | | | | | 0 | | | | | | 15 | | | | |
A. Changes recognised in the income statement | | | | | | | | | | | | | | | | | | | | | | | | | | | | | | | | | | | | | | | | |
Decrease due to disposals | | | | | | –3 | | | | | | 0 | | | | | | 0 | | | | | | 0 | | | | | | 0 | | | | | | –3 | | | | |
Increase due to disposals | | | | | | 0 | | | | | | 0 | | | | | | 0 | | | | | | 0 | | | | | | 0 | | | | | | 0 | | | | |
Decrease due to impairments | | | | | | 0 | | | | | | 0 | | | | | | 0 | | | | | | 0 | | | | | | 0 | | | | | | 0 | | | | |
Amortisation after reclassification | | | | | | 11 | | | | | | 0 | | | | | | 0 | | | | | | 0 | | | | | | 0 | | | | | | 11 | | | | |
Changes in consolidated group | | | | | | 0 | | | | | | 0 | | | | | | 0 | | | | | | 0 | | | | | | 0 | | | | | | 0 | | | | |
Total changes recognised in the income statement | | | | | | 8 | | | | | | 0 | | | | | | 0 | | | | | | 0 | | | | | | 0 | | | | | | 8 | | | | |
B. Changes recognised directly in equity | | | | | | | | | | | | | | | | | | | | | | | | | | | | | | | | | | | | | | | | |
Changes in revaluation reserves due to impairment reversal only for equity instruments | | | | | | 0 | | | | | | 0 | | | | | | 0 | | | | | | 0 | | | | | | 0 | | | | | | 0 | | | | |
Changes in revaluation reserves due to fair value changes | | | | | | 52 | | | | | | 0 | | | | | | 0 | | | | | | 0 | | | | | | 0 | | | | | | 52 | | | | |
Total changes recognised directly in equity | | | | | | 52 | | | | | | 0 | | | | | | 0 | | | | | | 0 | | | | | | 0 | | | | | | 52 | | | | |
Exchange rate changes | | | | | | 0 | | | | | | 0 | | | | | | 0 | | | | | | 0 | | | | | | 0 | | | | | | 0 | | | | |
As of 31 Dec. 2016 | | | | | | 75 | | | | | | 0 | | | | | | 0 | | | | | | 0 | | | | | | 0 | | | | | | 75 | | | | |
Change in the revaluation reserves from actuarial gains and losses for defined-benefit plan pension commitments including the related deferred taxes in the financial year 2016
| | | | | | | | | | | | | | | | | | | | | | | | | | | | |
| | | | | | | | | | | | |
| | | | | | | Actuarial gains and losses for defined-benefit plan pension commitments | | | | | | | | Effects of deferred taxes | | | | | | | | | | Total | | | | |
| | | | | | | EUR in millions | | | | | | | | EUR in millions | | | | | | | | | | EUR in millions | | | | |
As of 1 Jan. 2016 | | | | | | –463 | | | | | | | | 20 | | | | | | | | | | –443 | | | | |
Changes recognised directly in equity | | | | | | | | | | | | | | | | | | | | | | | | | | | | |
Changes in revaluation reserves due to changes in actuarial gain or loss valuation parameters | | | | | | –221 | | | | | | | | 15 | | | | | | | | | | –207 | | | | |
As of 31 Dec. 2016 | | | | | | –685 | | | | | | | | 35 | | | | | | | | | | –650 | | | | |
56
KfW Financial Information 2016 Consolidated financial statements
Consolidated statement of changes in equity in the financial year 2015
| | | | | | | | | | | | | | | | | | | | | | | | | | | | | | | | |
| | | | | | | | | | | |
| | | | | As of
1 Jan. 2015 | | | | | Changes in
consolidated
group | | | | | Owner-related
changes in
equity | | | | | Appropriation
of comprehen-
sive income
2015 | | | | | As of
31 Dec. 2015 | | |
| | | | | EUR in millions | | | | | EUR in millions | | | | | EUR in millions | | | | | EUR in millions | | | | | EUR in millions | | |
| | | | | | | | | | | |
Subscribed capital | | | | | | 3,750 | | | | | | 0 | | | | | | 0 | | | | | | 0 | | | | | | 3,750 | | |
less uncalled outstanding contributions | | | | | | –450 | | | | | | 0 | | | | | | 0 | | | | | | 0 | | | | | | –450 | | |
Capital reserve | | | | | | 7,197 | | | | | | 0 | | | | | | 1,250 | | | | | | 0 | | | | | | 8,447 | | |
of which promotional reserves from the ERP Special Fund | | | | | | 5,900 | | | | | | 0 | | | | | | 1,250 | | | | | | 0 | | | | | | 7,150 | | |
Reserve from the ERP Special Fund | | | | | | 1,191 | | | | | | 0 | | | | | | 0 | | | | | | 0 | | | | | | 1,191 | | |
Retained earnings | | | | | | 10,019 | | | | | | 0 | | | | | | 0 | | | | | | 2,071 | | | | | | 12,091 | | |
Statutory reserve under Article 10 (2) KfW Law | | | | | | 1,875 | | | | | | 0 | | | | | | 0 | | | | | | 0 | | | | | | 1,875 | | |
Special reserve under Article 10 (3) KfW Law | | | | | | 5,690 | | | | | | 0 | | | | | | 0 | | | | | | 1,331 | | | | | | 7,022 | | |
Special reserve less the special loss account from provisioning pursuant to Section 17 (4) of the D-Mark Balance Sheet Law | | | | | | 21 | | | | | | 0 | | | | | | 0 | | | | | | 0 | | | | | | 21 | | |
Other retained earnings | | | | | | 2,432 | | | | | | 0 | | | | | | 0 | | | | | | 740 | | | | | | 3,173 | | |
Fund for general banking risks | | | | | | 500 | | | | | | 0 | | | | | | 0 | | | | | | 100 | | | | | | 600 | | |
Revaluation reserves | | | | | | –608 | | | | | | 0 | | | | | | 0 | | | | | | 180 | | | | | | –429 | | |
Valuation results from financial instruments (after tax) | | | | | | 56 | | | | | | 0 | | | | | | 0 | | | | | | –41 | | | | | | 15 | | |
Investments accounted for using the equity method | | | | | | 0 | | | | | | 0 | | | | | | 0 | | | | | | 0 | | | | | | 0 | | |
Actuarial gains and losses from defined-benefit plan pension commitments (after tax) | | | | | | –664 | | | | | | 0 | | | | | | 0 | | | | | | 221 | | | | | | –443 | | |
Equity | | | | | | 21,598 | | | | | | 0 | | | | | | 1,250 | | | | | | 2,351 | | | | | | 25,200 | | |
57
KfW Financial Information 2016 Consolidated financial statements
Change in the revaluation reserves from financial instruments including the related deferred taxes and in the investments accounted for using the equity method in the financial year 2015
| | | | | | | | | | | | | | | | | | | | | | | | | | | | | | | | | | | | | | | | |
| | | | | | | | | | | | | | |
| | | | | | Bonds and
other fixed-
income
securities | | | | | Shares and
other non-
fixed income
securities | | | | | Equity
investments | | | | | Effects of
deferred
taxes | | | | | Investments
accounted
for using the equity
method | | | | | Total | | | | |
| | | | | | EUR in
millions | | | | | EUR in
millions | | | | | EUR in
millions | | | | | EUR in
millions | | | | | EUR in
millions | | | | | EUR in
millions | | | | |
| | | | | | | | | | | | | | |
As of 1 Jan. 2015 | | | | | | 52 | | | | | | 0 | | | | | | 5 | | | | | | –1 | | | | | | 0 | | | | | | 56 | | | | |
A. Changes recognised in the income statement | | | | | | | | | | | | | | | | | | | | | | | | | | | | | | | | | | | | | | | | |
Decrease due to disposals | | | | | | 0 | | | | | | 0 | | | | | | 0 | | | | | | 0 | | | | | | 0 | | | | | | 0 | | | | |
Increase due to disposals | | | | | | 0 | | | | | | 0 | | | | | | 0 | | | | | | 0 | | | | | | 0 | | | | | | 0 | | | | |
Decrease due to impairments | | | | | | 2 | | | | | | 0 | | | | | | 0 | | | | | | 0 | | | | | | 0 | | | | | | 2 | | | | |
Amortisation after reclassification | | | | | | 15 | | | | | | 0 | | | | | | 0 | | | | | | 0 | | | | | | 0 | | | | | | 15 | | | | |
Changes in consolidated group | | | | | | 0 | | | | | | 0 | | | | | | 0 | | | | | | 0 | | | | | | 0 | | | | | | 0 | | | | |
Total changes recognised in the income statement | | | | | | 17 | | | | | | 0 | | | | | | 0 | | | | | | 0 | | | | | | 0 | | | | | | 17 | | | | |
B. Changes recognised directly in equity | | | | | | | | | | | | | | | | | | | | | | | | | | | | | | | | | | | | | | | | |
Changes in revaluation reserves due to impairment reversal only for equity instruments | | | | | | 0 | | | | | | 0 | | | | | | 0 | | | | | | 0 | | | | | | 0 | | | | | | 0 | | | | |
Changes in revaluation reserves due to fair value changes | | | | | | –54 | | | | | | 0 | | | | | | –5 | | | | | | 1 | | | | | | 0 | | | | | | –58 | | | | |
Total changes recognised directly in equity | | | | | | –54 | | | | | | 0 | | | | | | –5 | | | | | | 1 | | | | | | 0 | | | | | | –58 | | | | |
Exchange rate changes | | | | | | 0 | | | | | | 0 | | | | | | 0 | | | | | | 0 | | | | | | 0 | | | | | | 0 | | | | |
As of 31 Dec. 2015 | | | | | | 15 | | | | | | 0 | | | | | | 0 | | | | | | 0 | | | | | | 0 | | | | | | 15 | | | | |
Change in the revaluation reserves from actuarial gains and losses for defined-benefit plan pension commitments including the related deferred taxes in the financial year 2015
| | | | | | | | | | | | | | | | | | | | |
| | | | | | Actuarial gains and
losses for
defined-benefit
plan pension
commitments | | | | | | Effects of
deferred taxes | | | | | | Total | | |
| | | | | | EUR in millions | | | | | | EUR in millions | | | | | | EUR in millions | | |
| | | | | | | | | | |
As of 1 Jan. 2015 | | | | | | –695 | | | | | | 30 | | | | | | –664 | | |
Changes recognised directly in equity | | | | | | | | | | | | | | | | | | | | |
Changes in revaluation reserves due to changes in actuarial gain or loss valuation parameters | | | | | | 231 | | | | | | –10 | | | | | | 221 | | |
As of 31 Dec. 2015 | | | | | | –463 | | | | | | 20 | | | | | | –443 | | |
58
KfW Financial Information 2016 Consolidated financial statements
Consolidated statement of
cash flows
| | | | | | | | | | | | | | |
| | | | | | | |
| | | | | | 2016 | | | | | | 2015 | | |
| | | | | | EUR in millions | | | | | | EUR in millions | | |
| | | | | | | |
Consolidated profit | | | | | | 2,002 | | | | | | 2,171 | | |
Non-cash items included in consolidated profit and reconciliation to cash flow from operating activities: | | | | | | | | | | | | | | |
Depreciation, amortisation, impairment and reversal of impairment losses (receivables, property, plant and equipment, securities and investments) and changes in risk provisions for lending business | | | | | | 451 | | | | | | 362 | | |
Changes in other provisions | | | | | | 172 | | | | | | 143 | | |
Other non-cash expenses and income: | | | | | | | | | | | | | | |
Profit/loss from the disposal of securities and investments and property, plant and equipment | | | | | | 5 | | | | | | –23 | | |
Other adjustments | | | | | | –3,089 | | | | | | –2,803 | | |
Subtotal | | | | | | –460 | | | | | | –150 | | |
Changes in assets and liabilities from operating activities after adjustment for non-cash items: | | | | | | | | | | | | | | |
Loans and advances to banks | | | | | | 1,359 | | | | | | 3,024 | | |
Loans and advances to customers | | | | | | –2,475 | | | | | | –15,285 | | |
Securities | | | | | | –967 | | | | | | –930 | | |
Other assets relating to operating activities | | | | | | 9,751 | | | | | | –750 | | |
Liabilities to banks | | | | | | –4,166 | | | | | | 6,052 | | |
Liabilities to customers | | | | | | 2,010 | | | | | | –458 | | |
Certificated liabilities | | | | | | 7,374 | | | | | | 11,203 | | |
Other liabilities relating to operating activities | | | | | | –3,349 | | | | | | –4,410 | | |
Interest and dividends received | | | | | | 7,960 | | | | | | 9,145 | | |
Interest paid | | | | | | –5,618 | | | | | | –6,787 | | |
Income tax paid | | | | | | –34 | | | | | | –151 | | |
Cash flow from operating activities | | | | | | 11,384 | | | | | | 504 | | |
Property, plant and equipment: | | | | | | | | | | | | | | |
Cash proceeds from disposals | | | | | | 1 | | | | | | 2 | | |
Cash payments for investment | | | | | | –149 | | | | | | –122 | | |
Securities and investments (equity investments): | | | | | | | | | | | | | | |
Cash proceeds from disposals/Cash payments for investment | | | | | | –123 | | | | | | –113 | | |
Cash flow from investing activities | | | | | | –271 | | | | | | –233 | | |
Cash proceeds from/(cash payments for) capital increases/(decreases) | | | | | | 0 | | | | | | 0 | | |
Changes from other financing activities | | | | | | 0 | | | | | | –597 | | |
Cash flow from financing activities | | | | | | 0 | | | | | | –597 | | |
| | | | | | | |
Cash and cash equivalents as of the end of the previous period | | | | | | 460 | | | | | | 786 | | |
Cash flow from operating activities | | | | | | 11,384 | | | | | | 504 | | |
Cash flow from investing activities | | | | | | –271 | | | | | | –233 | | |
Cash flow from financing activities | | | | | | 0 | | | | | | –597 | | |
Cash and cash equivalents as of the end of the period | | | | | | 11,573 | | | | | | 460 | | |
59
KfW Financial Information 2016 Consolidated financial statements
The balance of Cash and cash equivalents reported in the statement of cash flows in accordance with IAS 7 is identical to the balance sheet item Cash reserves and thus comprises cash on hand and balances with central banks.
The Statement of cash flows shows the changes in Cash and cash equivalents in the financial year classified as the Cash flows from operating activities, investing activities and financing activities. Other adjustments largely comprise the adjustments for net interest income in the amount of EUR –2,610 million (2015: EUR –2,601 million) as well as for valuation results amounting to EUR –352 million (2015: EUR –305 million) and effects of foreign exchange rate changes amounting to EUR +27 million (2015: EUR +89 million).
For more information on KfW Group’s liquidity risk management, see “Risk report – Liquidity risk”.
60
KfW Financial Information 2016 Consolidated financial statements
Notes
Accounting policies
(1) Basis of presentation
KfW is the promotional bank of the Federal Republic of Germany and was founded in 1948 as a public law institution based in Frankfurt am Main.
The Executive Board of KfW is responsible for the preparation of the consolidated financial statements and the group management report. After the recommendation of the Audit Committee, the consolidated financial statements and the group management report are submitted to KfW’s Board of Supervisory Directors for approval. As of 28 February 20171), no significant events have occurred since the reporting date (31 December 2016).
As of 31 December 2016, KfW Group comprises KfW and five subsidiaries that are fully consolidated. One joint venture and four associated companies are accounted for using the equity method.
Pursuant to Section 315 a (1) of the German Commercial Code (Handelsgesetzbuch – “HGB”), the consolidated financial statements as of 31 December 2016 have been prepared in accordance with International Financial Reporting Standards (IFRS), as adopted by the European Union (EU), and with the interpretations set out by the International Financial Reporting Interpretations Committee (IFRIC), as mandatory consolidated accounts in accordance with Article 4 of Regulation (EC) No. 1606/2002 (IAS Regulation) of the European Parliament and of the Council of 19 July 2002, as well as further regulations on the adoption of certain international accounting standards. The standards and interpretations that apply are those that have been published and endorsed by the European Union as of the reporting date.
The supplementary provisions of the German Commercial Code that also apply to IFRS consolidated financial statements have been taken into account. The group management report prepared in accordance with Section 315 of the German Commercial Code includes the risk report with risk-oriented information on financial instruments as set out in IFRS 7, information on material events after the balance sheet date in accordance with IAS 10, and information on capital and capital management as set out in IAS 1.134.
The consolidated financial statements were prepared in accordance with accounting policies that are consistent across KfW Group and are prepared on a going concern basis. The companies included in the consolidated financial statements have prepared their annual financial statements as of 31 December 2016, except for some associated companies accounted for using the equity method, where financial statements as of 30 September 2016 were used. Material events for the latter companies as of the reporting date were also taken into account.
The accounting policies in the consolidated financial statements were applied consistently.
The reporting currency and functional currency is the euro. Unless otherwise specified, all amounts are stated in millions of euros (EUR in millions).
| | 1) | Date of Executive Board approval of publication |
62
KfW Financial Information 2016 Consolidated financial statements
As a general rule, assets and liabilities are measured at the reporting date at (amortised) cost, with the exception of the following financial instruments:
| | – | designated financial instruments measured at fair value through profit or loss |
| | – | financial instruments classified as held for trading and measured at fair value through profit or loss |
| | – | available-for-sale financial assets measured at fair value, with fair value changes recognised directly in equity |
(2) Judgements and accounting estimates
The consolidated financial statements include amounts based on management’s judgements and/or estimates and assumptions which are determined to the best of our ability and in accordance with the applicable accounting standard. Actual results realised in a future period may differ from these estimates. Judgements, estimates and assumptions are required, in particular, for calculating risk provisions (including risk provisions for contingent liabilities and irrevocable loan commitments), recognising and measuring provisions (primarily for pension liabilities and legal risks), measuring the fair value of financial instruments based on valuation models (including determining the existence of an active market), assessing and measuring impairment of assets, and assessing the utilisation of deferred tax assets. The estimates and the assumptions underlying these estimates are reviewed on an ongoing basis and are based, among other things, on historical experience or expected future events that appear likely given the particular circumstances. Where judgements as well as estimates and their underlying assumptions were required, the assumptions made are explained in the relevant notes.
KfW does not expect any deviations from its assumptions and does not foresee any uncertainties in its estimates that could result in a material adjustment to the related assets and liabilities within the next financial year. Given the strong dependency on the development of the economy and financial markets, however, such deviations and uncertainties cannot be fully ruled out. These risks are nevertheless low because valuation models – especially those involving the use of inputs not based on observable market data – are employed, firstly, for measuring the fair value of only small parts of the securities and investments portfolio and borrowings, and secondly, for measuring only a small portion of financial derivatives used to economically hedge risk.
Further material decisions in the application of accounting policies concern the voluntary early application of new or amended IFRS/IFRIC standards, the determination of the consolidated group, the use of the fair value option for the classification of financial assets and liabilities, the use of possibilities to reclassify options for financial assets in accordance with IAS 39, the reporting of economic hedging relationships, and the creation of classes as part of disclosing information on financial instruments.
63
KfW Financial Information 2016 Consolidated financial statements
| | (3) | Assessment of the impact of new or amended IFRS/IFRIC standards applied for the first time or to be applied in the future |
A. Impact of new or amended IFRS/IFRIC standards adopted for the first time in financial year 2016
The amendments to IAS 19 “Employee Benefits” (November 2013, Defined Benefit Plans: Employee Contributions), applied for the first time, did not have any material impact on the group’s net assets, financial position and results of operations.
The amendments to various standards to be applied for the first time due to the annual improvements to IFRS’s 2010 – 2012 cycle (December 2013) did not have any impact on the group’s net assets, financial position and results of operations.
The amendments to IFRS 11 “Joint Arrangements” (May 2014, Accounting for Acquisitions of Interests in Joint Operations), applied for the first time, did not have any material impact on the group’s net assets, financial position and results of operations.
The amendments to IAS 16 “Property, Plant and Equipment” and IAS 38 “Intangible Assets” (May 2014, Clarification of Acceptable Methods of Depreciation and Amortisation), applied for the first time, did not have any impact on the group’s net assets, financial position and results of operations.
The amendments to IAS 16 “Property, Plant and Equipment” and IAS 41 “Agriculture” (June 2014, Agriculture: Bearer Plants), applied for the first time, did not have any impact on the group’s net assets, financial position and results of operations.
The amendments to IAS 27 “Separate Financial Statements” (August 2014, Equity Method in Separate Financial Statements), applied for the first time, did not have any impact on the group’s net assets, financial position and results of operations.
The amendments to various standards to be applied for the first time due to the annual improvements to IFRS’s 2012 –2014 cycle (September 2014) did not have any impact on the group’s net assets, financial position and results of operations.
The amendments to IAS 1 “Presentation of Financial Statements” (December 2014, Disclosure Initiative), applied for the first time, did not have any impact on the group’s net assets, financial position and results of operations.
B. Impact of new or amended IFRS/IFRIC standards to be adopted in the future that were endorsed by the EU into European law before the reporting date
In July 2014, the IASB published IFRS 9 “Financial Instruments”, which will replace IAS 39 “Financial Instruments: Recognition and Measurement”. The standard – transposed into European law in November 2016 – is effective for financial years beginning on or after 1 January 2018. IFRS 9 contains new rules for classification and measurement of financial instruments and for impairment and hedge accounting.
Under IFRS 9, the rules on classification and measurement result in a changed classification of financial assets. The classification and related subsequent measurement is based on the business model and the characteristics of the contractual cash flows. As, according to its business model, KfW pursues sustainability and a long-term approach and has no intention of generating a short-term profit nor of realising fair value, the core business is measured at amortised cost. One exception to this is KfW IPEX-Bank’s syndication business, which is to be measured at fair value through profit or loss based on the business model. Another is the future measurement of equity investments and equity financing at fair value, as the cash flow criterion has not been met in this case.
On the other hand, the rules for financial liabilities will remain largely unchanged. In using the fair value option, however, the changes in fair value that result from changes in own credit risk will be recognised directly in equity in the revaluation reserve.
64
KfW Financial Information 2016 Consolidated financial statements
The changes to the measurement of impairments resulting from the new requirements pose another important accounting issue. The shift from the incurred loss model to the expected loss model substantially changes the impairment requirements. When determining expected losses from a financial instrument, the change in credit risk since initial recognition is relevant. In case of a significant increase in credit risk of a financial instrument since initial recognition, the expected losses for the entire remaining term will be recognised. Otherwise, only the expected losses over lifetime of the instrument associated with the possibility of default events within the next twelve months will be recognised.
With regard to hedge accounting, no material implications are expected for the consolidated financial statements, as the option to continue applying the requirements under IAS 39 until the macro hedge accounting rules become effective, is being used.
At first time application of IFRS 9, the group will use the option not to provide comparative figures in the 2018 consolidated financial statements. In contrast, the option of determining the lifetime expected losses for all existing financial instruments that do not fulfil the definition of “low credit risk” at initial recognition and at each subsequent reporting date, will not be used.
The precise effects of IFRS 9 on future earnings cannot yet be reliably estimated. At the time of transition to IFRS 9, a first-time application effect is to be expected in particular from the financial instruments which have experienced a significant increase in credit risk since they were initially recognised, and for which risk provisions have to be created under the new impairment accounting requirements in the amount of the lifetime expected credit losses.
In respect of the implementation of the new accounting rules, KfW Group’s specification of the functional requirements has largely been completed. The group is closely following the current discussions of the IFRS Interpretations Committee (IFRS IC) and other organisations (e. g. Institute of Public Auditors in Germany (Institut der Wirtschaftsprüfer – “IDW”) and the European Banking Authority (EBA)) and taking relevant aspects into account. At present, KfW is engaged in the technical and operational implementation of IFRS 9 requirements.
In May 2014, the IASB published IFRS 15 “Revenue from Contracts with Customers”, replacing standards IAS 11 “Construction Contracts”, IAS 18 “Revenue”, IFRIC 13 “Customer Loyalty Programmes”, IFRIC 15 “Agreements for the Construction of Real Estate”, IFRIC 18 “Transfers of Assets from Customers” and SIC 31 “Revenue – Barter Transactions Involving Advertising Services”. Retrospective application of the standard is mandatory for financial years beginning on or after 1 January 2018.
IFRS 15 defines the nature, amount and timing of revenue arising from contracts with customers. Such revenue includes fees which are not an integral part of the effective interest rate and which are to be reported under Commission income. In this context, a five-step principle-based model is to be applied to relevant customer contracts. Moreover, the Notes are to include comprehensive detailed information. IFRS 15 does not apply to fees and charges that are an integral part of the effective interest rate as they fall under the scope of IFRS 9. The IFRS 9 requirements on consideration received for financial services are largely the same as in IAS 18.
KfW has launched a project in this context where, in particular, revenue and fees arising from contracts with customers are analysed to study future effects on KfW. At this time, KfW does not anticipate any material impact on the group’s net assets, financial position and results of operations.
65
KfW Financial Information 2016 Consolidated financial statements
| | (4) | Assessment of the new and amended standards already published by the International Accounting Standards Board (IASB), which had not yet been adopted by the EU into European law as of the reporting date, and which are of importance to the group |
In January 2016, the IASB published IFRS 16 “Leases”, replacing standards IAS 17 “Leases”, IFRIC 4 “Determining Whether an Arrangement Contains a Lease”, SIC 15 “Operating Leases – Incentives” and SIC 27 “Evaluating the Substance of Transactions in the Legal Form of a Lease”. The standard is to be applied for financial years beginning on or after 1 January 2019.
Implementation of the new accounting model means that in the future, for all leases, lessees must recognise each right of use as an asset and the associated lease obligation as a liability on the balance sheet. Application is optional for leases with a term of less than 12 months or if the underlying asset is of low value.
The effects on KfW Group’s net assets, financial position and results of operations primarily arise from the leased asset “buildings”, which is to be reported on the balance sheet in the future. At present, this is classified as an operating lease in accordance with IAS 17, with the leasing expenses consequently recognised in the income statement.
There are no plans for voluntary early application of IFRS 16 along with IFRS 15.
(5) Group of consolidated companies
All significant subsidiaries, joint ventures and associated companies are included in the consolidated financial statements.
Subsidiaries are all business units (including structured entities) over which the group exercises control. Control exists when a group is exposed or entitled to variable cash flows through its relationship and has the opportunity to use its power of disposal to influence the amount of such cash flows. Subsidiaries are included in the consolidated financial statements (full consolidation) from the point at which control is transferred to the group. They are deconsolidated when control is lost.
Joint ventures and associated companies are included in the consolidated financial statements in accordance with IFRS 11/IAS 28 if there is a joint agreement or if the group has significant influence.
The composition of the consolidated group is presented in the Notes under “List of KfW Group shareholdings”.
(6) Basis of consolidation
Consolidation involves revaluing the total assets and liabilities of the subsidiaries at the acquisition date, irrespective of the equity interest held, and incorporating them into the consolidated statement of financial position. The resulting adjustments from hidden reserves and hidden burdens are treated in accordance with the applicable standards. If the revaluation adjustments result in an excess compared to acquisition cost, this excess amount is capitalised as goodwill. No goodwill is currently recognised.
Any intercompany assets and liabilities as well as expenses and revenues from transactions between group companies are eliminated. Intercompany profits between consolidated companies are also eliminated.
Investments in associates are accounted for using the equity method. The contribution to the results made by associates is recognised as a separate line item in the income statement.
There are no minority interests within KfW Group.
66
KfW Financial Information 2016 Consolidated financial statements
(7) Financial instruments: recognition and measurement
A financial instrument is any contract that gives rise to a financial asset of one entity and a financial liability or equity instrument of another entity. The following explanations provide an overview of how the requirements of IAS 39 are implemented.
Initial recognition is as of the settlement date for non-derivative financial instruments and as of the trade date for derivatives.
Upon initial recognition, financial instruments must be classified into one of the following categories. The subsequent measurement depends on the following classification:
| | B. | Held-to-maturity investments |
| | C. | Financial assets and liabilities at fair value through profit or loss |
| | a. | Financial assets and liabilities designated at fair value through profit or loss (fair value option) |
| | b. | Financial assets and liabilities held for trading |
| | D. | Available-for-sale financial assets |
The loans and receivables category includes non-derivative financial assets with fixed or determinable payments that are not quoted in an active market. These are measured at amortised cost using the effective interest method. For KfW Group, this primarily relates to the lending business presented under Loans and advances to banks and Loans and advances to customers. An assessment will be performed as of every balance sheet date as to whether there are objective indications of impairment (default criteria). For its lending business, KfW Group uses the Basel definition for its default criteria and applies a consistent definition across the group. Default criteria are payments more than 90 days past due (taking a marginality limit into account), anticipated non-fulfilment of payment obligations or disposal of loans or advances at significant loss due to deterioration in the borrower’s credit rating.
Held-to-maturity investments are non-derivative financial instruments with fixed or determinable payments and fixed maturity for which the group has the intention and ability to hold to maturity. This category is used on a case-by-case basis for financial instruments which are part of the group’s securities portfolio at inception. These instruments are presented as Securities and investments; any impairments and reversals of impairment losses are recognised in Net gains/losses from securities and investments. Premiums and discounts are amortised according to the effective interest method. The amortisation for the period is recognised as Net interest income.
For financial assets and liabilities, the fair value option can be irrevocably exercised upon initial recognition if
| | – | the classification can resolve or substantially reduce an accounting mismatch resulting from the measurement of financial assets or financial liabilities or the recognition of a loss or a gain as a result of different accounting policies; or |
| | – | a group of financial assets and/or financial liabilities is managed in accordance with a documented risk management or investment strategy and its performance is assessed on the basis of fair value and the information is reported to key management personnel; or |
| | – | a contract contains one or more embedded derivatives which significantly modify the cash flows required by the contract or an analysis is required to determine that the embedded derivative(s) may not be separated. |
67
KfW Financial Information 2016 Consolidated financial statements
Designated financial assets and liabilities are measured at fair value through profit or loss. KfW Group uses the fair value option for economic hedging relationships, structured products, securitisation transactions, and equity finance business. These financial instruments in particular are recognised in Securities and investments, Liabilities to banks and customers and Certificated liabilities. Fair value changes are presented in Net gains/losses from other financial instruments at fair value through profit or loss, while interest income/expense is presented in Net interest income.
Financial instruments that belong to the financial assets and liabilities held for trading category are measured at fair value through profit or loss. This category includes derivatives as well as non-derivative financial instruments purchased with the intention of generating a short-term profit or selling them. KfW Group does not enter into any transactions with the intention of generating a short-term profit. Instruments may be held in the group for short-term sale in anticipation of a loan syndication in export and project financing business. These are recognised under Loans and advances to banks and customers. Interest income is presented in Net interest income while changes in fair value are presented in Net gains/losses from other financial instruments at fair value through profit or loss. Derivative transactions entered into exclusively for hedging purposes are classified as held-for-trading if they do not fulfil the hedge accounting requirements in accordance with IAS 39. They are presented as Other derivatives. Fair value changes are recognised in Net gains/losses from other financial instruments at fair value through profit or loss. Derivatives used for hedge accounting are presented in the statement of financial position in the line item of the same name. Fair value changes are recognised in Net gains/losses from hedge accounting. Interest income/expense from derivatives is reported in Net interest income.
All other financial assets fall under the available-for-sale financial assets category. The difference between the fair value and the (amortised) cost is recognised directly in a separate component of equity until the asset is sold or an impairment loss has to be recognised in profit or loss. A debt instrument is impaired if there is objective evidence (trigger) of impairment with an impact on the expected future cash flows. Specific trigger events are defined according to the type of financial instrument. Events such as payments overdue for 30 days or more, deterioration in the internal rating to the non-performing loans category, or a considerable decline in the market price can be considered as objective evidence of impairment. Furthermore, for equity instruments, an impairment loss has to be recognised in profit or loss in the case of a significant or prolonged decline of the fair value below the acquisition cost of the equity instrument. A permanent impairment is assumed if the fair value of an exchange-listed equity instrument remains constantly below the historical cost for a period of nine months. A significant impairment is assumed for such financial instruments if the fair value is at least 20% below the historical cost as of the reporting date. The impairment loss of a debt security is reversed through profit or loss if there is no longer any objective evidence of impairment. Impairment losses of equity instruments may only be reversed directly in Other comprehensive income. Equity instruments that cannot be reliably measured at fair value are accounted for at cost. Impairments are recognised in profit or loss, while reversals of impairment losses are not accounted for in this case. Within KfW Group, the available-for-sale financial assets are reported in Securities and investments. Gains and losses from disposals, impairment losses and the reversal of impairments from debt instruments are reported in Net gains/losses from securities and investments. Premiums and discounts are amortised through profit or loss using the effective interest method. The amortisation is recognised under Interest income.
All non-derivative financial liabilities for which the fair value option has not been exercised are classified as other liabilities. These are measured at amortised cost using the effective interest method. For the group, this category covers borrowings that are reported in Liabilities to banks and customers, Certificated liabilities and Subordinated liabilities.
68
KfW Financial Information 2016 Consolidated financial statements
Derivatives are derecognised as of the trade date; all other financial assets as of the settlement date. Financial assets are derecognised when the contractual rights from the assets have expired, the power of disposal or control has been transferred, or a substantial portion of the risks and rewards has been transferred to a third party unrelated to KfW Group.
Financial liabilities are derecognised if the obligations specified in the contract have been discharged or cancelled, or have expired.
For transactions mandated by the German Federal Government in accordance with Article 2 (4) of the KfW Law, the group’s general recognition procedures for the relevant financial instruments are applied. Measurement is based on the relevant individual contractual terms and conditions concerning risk allocation.
The amendment to IAS 39 dated 13 October 2008 expanded the reclassification options for financial assets. Accordingly, until 31 October 2008, it was possible to reclassify assets classified as available-for-sale financial assets as loans and receivables with retrospective effect to 1 July 2008, and thereafter prospectively from the date of the reclassification, if there was the intention and ability to hold the financial instruments for the foreseeable future or until maturity and if the general classification criteria for loans and receivables were met at the date of reclassification.
On 31 October 2008, KfW Group decided to make use of its option to reclassify its asset-backed securities retrospectively as of 1 July 2008. Due to the general crisis of confidence in the financial markets, there was no longer an active market for these securities at the date of the resolution (i. e. no current, regularly occurring market transactions on an arm’s length basis could be observed) and which were to be held through to maturity. In addition, on 17 February 2009, some of the securities that were held to meet the group’s liquidity needs – through their use in repurchase transactions or open market transactions with the European Central Bank – were reclassified with prospective effect. As a result of the general crisis of confidence in the financial markets, an active market for these securities that were to be held for the foreseeable future no longer existed at the date of the resolution.
The fair value at the date of reclassification is the new cost of the reclassified financial assets. Amortisation is accounted for through profit or loss under Interest income using the effective interest method. The difference between the fair value and amortised cost, which had been recognised directly in equity until the reclassification date, remains in Other comprehensive income as a separate line item. Amortisation is accounted for through profit or loss under Interest income using the effective interest method.
Classes for financial instruments have been largely defined in agreement with the group’s business model for lending business – carried at (amortised) cost – and are based on products (e. g. Loans and advances to banks broken down into money-market transactions and loans and advances) or on line items of the statement of financial position. The balance sheet items thus generally reflect a view oriented to the material risks each encompasses against the backdrop of interest rate and currency risk management at the overall bank level (interaction between non-derivative financial instruments and derivative hedging transactions). Information about the type and extent of risks associated with financial instruments is also provided in the risk report section of the group management report.
69
KfW Financial Information 2016 Consolidated financial statements
(8) Financial instruments: valuation techniques
KfW Group initially recognises financial instruments at fair value.
Financial instruments measured at amortised cost are subsequently measured, within KfW Group, based on the fair value at initial recognition, taking into account any principal repayments and any impairment. The amortisation of premiums, discounts, transaction costs and fees is performed in accordance with the effective interest method on the basis of the contractual cash flows. Discounts are amortised in the promotional lending business until the end of the first fixed interest rate period (generally five or ten years).
The subsequent measurement at fair value, which, depending on the measurement category, is regularly determined either for recognition in the statement of financial position or for the disclosure of financial instruments in the Notes, is based on the following hierarchy at KfW Group:
A. Active market (allocation to the “Quoted market price” level)
The best objective evidence of fair value is provided by published price quotations in an active market. A financial instrument is regarded as quoted in an active market if quoted prices are readily and regularly available and those prices represent current – i.e. traded on the reporting date or shortly before – and regularly occurring market transactions on an arm’s length basis. Together with the traded nominal volumes, the contract sizes and the number of contracts, this assessment takes into account in particular the bid-ask spreads observed, which in the event of a significant increase indicate the absence of an active market.
B. No active market – valuation techniques (allocation to “Valuation methods based on observable market data (model)” or “Valuation methods based in part on market unobservable data”)
If the financial instrument is not quoted in an active market, valuation techniques are used. The valuation techniques applied include, in particular, the discounted cash flow (DCF) method and option pricing models, as well as a comparison to the fair value of a financial instrument with almost identical characteristics (e. g. multiple-based models). The valuation techniques take account of all input parameters that market participants would include in the pricing of that financial instrument, e. g. market interest rates, risk-free interest rates, credit spreads or swap curves. As these input parameters can generally be observed in the market and are usually the only significant parameters for measuring financial instruments using valuation techniques, the level for the financial instruments measured at fair value using valuation methods is usually “Valuation methods based on observable market data (model)”. This allocation also generally applies for prices quoted on inactive markets published by price service agencies.
If significant input parameters that are not observable in the market, such as expected risk-free customer margin or capital costs, are used in valuation techniques, the financial instrument is allocated to the “Valuation methods based in part on market unobservable data” level.
If, at the date of initial recognition, differences arise between the market-based transaction price and the model price resulting from a valuation technique that makes significant use of unobservable parameters, an analysis is performed to determine whether there are economic reasons for these initial differences (e. g. conclusion of a transaction on a market that is not the main market for this business). These economic reasons only apply to a small part of the derivative portfolio of KfW Group, which comprises a hedging instrument for customers with respect to the export and project financing business. In relation to this, over the counter (OTC) derivatives in line with the market are not concluded on the main market (OTC interbank market) relevant to valuation. The initial differences determined upon conclusion of these derivatives are
70
KfW Financial Information 2016 Consolidated financial statements
amortised through profit or loss over the life of the financial instruments, as the valuation parameters unobservable on the market are relevant to the valuation procedure. The reliability of this valuation technique is ensured via regular model validations.
C. No active market – equity instruments (allocation to “Valuation methods based in part on market unobservable data”)
If in exceptional cases it is not possible to reliably determine the fair value of equity instruments that are not quoted in an active market using valuation models, they are measured at cost. The fair value cannot be measured reliably if the range of reasonable fair value estimates for the instrument is significant and the probabilities of the various estimates cannot be reasonably assessed.
This hierarchy is applied at KfW Group as follows:
Fair values are derived from active markets, in particular, for bonds and other fixed-income securities – unless there are inactive markets, and valuation techniques or prices quoted on inactive markets published by price service agencies are therefore used – as well as own issues reported on the liabilities side. However, fair values are derived from valuation techniques for non-derivative financial instruments recognised in Loans and advances to banks and customers, Liabilities to banks and customers, and Certificated liabilities. Valuation techniques are also used for OTC derivatives.
The steps detailed below are undertaken for certain product groups:
For securities in the Securities and investments line item, the group examines whether a financial instrument is quoted on an active market on the basis of homogeneous portfolios. Market activity is assessed based on the following criteria:
| | – | There is more than one market maker. |
| | – | Prices are set on a regular basis. |
| | – | Prices deviate only slightly between market makers. |
| | – | The bid-ask spread is narrow. |
Prices on active markets are used to determine the fair value of the group’s asset securities as of the reporting date. In addition, for parts of the portfolio, prices from price service agencies are used that do not qualify as prices quoted on active markets. Should these not be available in individual cases, valuation techniques are used to determine fair value taking into account observable market parameters. The input parameters include, in particular, changes in creditworthiness and risk-free interest rates, but they also take into account general and financial instrument-specific tightening of the market due to lower liquidity.
In the case of OTC derivatives, valuation techniques are used that pay special attention to counterparty-specific default risks, taking into account available collateral. Default risks are not calculated separately for each transaction but for the portfolio of transactions on which a framework agreement is based. The resulting credit risk adjustment amounts are very low as KfW generally pledges collateral for positive market values in accordance with the collateral agreements concluded. In accordance with market practices, risk-free overnight interest rates were used for the valuation of a major part of the derivatives portfolio with collateralisation agreements.
Equity investments and shares that cannot be reliably measured at fair value are measured at cost.
The fair value for Loans to banks and customers is calculated using the DCF method based on the discounting of the risk-adjusted cash flows. The expected loss calculated for the respective reporting date is used to correct the contractual cash flows.
71
KfW Financial Information 2016 Consolidated financial statements
The Federal Republic of Germany’s liability for specific KfW liabilities in accordance with Article 1a of the KfW Law has an advantageous effect on KfW’s ability to fund itself. In determining the fair value of KfW’s liabilities, the effect of this explicit direct state guarantee is also taken into account. The state guarantee does not represent an independent unit of account.
The fair value of financial instruments due on demand, such as Cash reserves or receivables and liabilities due on demand, is their carrying amount.
When no prices from liquid markets are available and prices on inactive markets cannot be provided by price service agencies, recognised valuation models and methods are used. The DCF method is used for securities, swaps, and currency and money market transactions with no embedded options and no complex coupons. Stand-alone options, as well as derivatives with embedded options, triggers, guaranteed interest rates and/ or complex coupon agreements, are measured using recognised models (e. g. Hull & White) unless they are listed on a stock exchange.
The aforementioned models are calibrated, if possible, on the basis of observable market data for instruments that are similar in terms of the type of transaction, maturity, and credit quality.
(9) Promotional lending business at KfW
The general promotional loans market, which distinguishes itself from the market for general lending business, is relevant for KfW’s promotional lending business conducted as part of its legal promotional mandate. This market is characterised by the fact that promotional banks, as part of their legal mandate, pass on all funding cost advantages of funding projects eligible for promotion to the ultimate borrowers for projects eligible for promotion. In setting the terms and conditions of the corresponding promotional loans, KfW uses its current term-differentiated refinancing funding rates.
At initial recognition of such loans, the fair value is thus equivalent to the transaction value.
KfW also grants promotional loans which include additional subsidies granted during the first fixed interest rate period, in the form of interest rate reductions impacting KfW’s earnings position. The fair value of these promotional loans – measured using the parameters of the general promotional loan market – is thus not equivalent to the transaction value at initial recognition as in this case the interest rate is below the market rate.
The difference that normally results from such loan commitments – present value of the nominal scheduled interest rate reductions during the first fixed interest rate period – is recognised in profit or loss as an interest expense and accounted for as an adjustment to the carrying amount in loans and advances under the items Loans and advances to banks or Loans and advances to customers. The adjustment to the carrying amount is amortised in Net interest income using the effective interest rate method. In the event of unscheduled repayment in full, this will be recognised in profit or loss under Interest income.
Differences that relate to irrevocable loan commitments are reported in Provisions. Changes to the portfolio are offset via adjustments to the carrying amounts of already disbursed promotional loans recognised on the assets side.
72
KfW Financial Information 2016 Consolidated financial statements
(10) Financial derivatives and hedging relationships
KfW Group enters into financial derivatives to economically hedge interest rate and currency risks, particularly those related to funding, lending and securities activities.
Economic hedging relationships are designated as hedge accounting relationships or designated as fair value through profit or loss by using the fair value option when the IFRS requirements are met. Economic hedging relationships can be recognised in the financial statements through bifurcated embedded derivatives that are accounted for through profit or loss. In these cases, if the hedges are economically effective, the impact on the financial statements, with respect to the hedged risks, from the instruments used for hedging purposes and the hedged transactions will substantially offset each other, so that the group’s income statement substantially reflects the risk-mitigating impact of these hedging relationships.
However, not all economic hedging relationships qualify for hedge accounting or the fair value option. In these cases, the risk-mitigating impact of the derivatives used for hedging purposes is not reflected in the accounts because the hedged risk associated with the underlying transactions is not recognised in profit or loss under IFRS. The applicable recognition requirements may therefore lead to one-sided valuation results from the derivatives used for hedging purposes in the group’s income statement – as well as volatility in profit or loss – despite an economically effective hedging relationship.
Hedge accounting in the group is used solely in the form of fair value hedges to recognise hedging relationships. The hedging relationship is designated, firstly, at individual transaction and group level in the form of micro fair value hedge accounting and, secondly, at portfolio level in the form of macro fair value hedge accounting. Micro fair value hedging relationships at group level are created exclusively to hedge the foreign currency exposure. If risk-free overnight interest rates are used in the valuation of the derivatives, this market practice is also used for micro fair value hedge accounting in measuring the hedged risk related to the hedged item. The hedged risk in macro fair value hedge accounting relates to the variable interest rates of the derivative portfolio. The effectiveness of the hedging relationships is assessed using the dollar offset method and a regression analysis.
In micro fair value hedge accounting, the hedged risks are interest rate and currency risks from bonds allocated to Securities and investments (loans and receivables and available-for-sale financial assets categories) and, in particular, borrowings (other liabilities category). In micro fair value hedging relationships at the individual transaction level, the fair values attributable to the hedged risks are reported as an adjustment of the carrying amount of the hedged items with the corresponding gain or loss recognised in Net gains/losses from hedge accounting. The hedging instruments used for this purpose are recognised at fair value in Derivatives used for hedge accounting. Changes in the value of the hedging instruments are also recognised in Net gains/losses from hedge accounting, largely offsetting the profit or loss effects of the hedged items. The currency-related changes in value of the hedged items and hedging instruments in micro fair value hedging relationships at group level are presented in Net gains/ losses from other financial instruments at fair value through profit or loss. The fair value of the hedged risks from hedging relationships which no longer fulfil the strict hedge accounting requirements is amortised over the residual term of the original hedging relationship under Net gains/losses from hedge accounting.
73
KfW Financial Information 2016 Consolidated financial statements
Interest rate risks, primarily from loans (loans and receivables category), are hedged in macro fair value hedge accounting. The fair values attributable to the hedged risks in the hedged portfolios in the loans and receivables category are accounted for in Value adjustments from macro fair value hedge accounting on the assets side. Fair value changes attributable to the hedged risks from the hedged portfolios are shown in Net gains/losses from hedge accounting.
The hedging instruments are reported at fair value in Derivatives used for hedge accounting. Changes in the value of these instruments are also recognised in Net gains/losses from hedge accounting, with the effect that they almost fully offset the earnings effects from the valuation of the hedged portfolios.
The portfolio of hedged items is updated monthly in the context of a dynamic hedge de-designation and designation process. The resulting fair value adjustments are amortised over the residual term of the maturity period in Net gains/losses from hedge accounting. Disposals from the hedged portfolios result in a proportional amortisation of the related fair value adjustments in Net gains/losses from hedge accounting. When the hedging instrument is derecognised and substituted with new transactions during the hedging period, the related fair value adjustments from the hedged portfolios are amortised in Net interest income.
If the strict hedge accounting requirements for the designation of hedging relationships between derivatives and financial assets/liabilities are not fulfilled within KfW Group, the fair value option is used in certain circumstances. The fair values of the corresponding hedging instruments are presented in Other derivatives and fair value changes are recognised in Net gains/losses from other financial instruments at fair value through profit or loss. These are largely offset by valuation effects from the hedged transactions.
Further derivative financial instruments are also used to hedge risks, but fair value changes of the hedged item are not reflected in the accounts. The fair values of these hedging instruments are also recognised in Other derivatives item and changes therein are recognised in Net gains/losses from other financial instruments at fair value through profit or loss.
KfW Group neither uses derivatives for trading purposes nor does it act as broker or intermediary on behalf of third parties.
(11) Treatment of embedded derivatives
Derivative financial instruments can be part of a hybrid (combined) financial instrument as embedded derivatives. Under certain conditions, they are accounted for separately from the host contract, similar to stand-alone derivatives. They must be bifurcated if the economic characteristics and risks of the embedded derivative are not closely related to the economic characteristics and risks of the host contract. The host contract will be accounted for according to its classification at inception.
KfW Group enters into contracts with bifurcated embedded derivatives particularly with respect to its own funding. In making use of the fair value option, KfW accounts for these hybrid (combined) financial instruments at fair value. In the case of certain products, however, the embedded derivatives must be bifurcated. Changes in fair value are then recognised in Net gains/losses from other financial instruments at fair value through profit or loss in the sub-line item Financial derivatives not qualifying for hedge accounting, where they have a compensatory effect on the valuation of the economic hedging derivatives.
74
KfW Financial Information 2016 Consolidated financial statements
Ancillary agreements made within KfW Group’s equity finance business are accounted for as bifurcated embedded derivatives which are measured at fair value through profit or loss and recognised in Other derivatives. Changes in fair value are recorded in Net gains/losses from other financial instruments at fair value through profit or loss in the sub-line item Financial derivatives not qualifying for hedge accounting. The loan receivables are recognised in Loans and advances to customers.
Prepayment rights that are granted regularly in the promotional lending business are not bifurcated embedded derivatives since the economic characteristics and risks associated with the prepayment rights are closely related to the economic characteristics and risks of the loan and the early prepayment amount approximately equals the amortised cost of the loan.
(12) Credit derivatives
As part of its promotional lending business, KfW Group offers commercial banks the opportunity to place their credit risks in the capital market as part of a synthetic securitisation via the two standardised platforms PROMISE (programme for the securitisation of SME loans) and PROVIDE (programme for the securitisation of housing loans). In the first stage, KfW Group assumes the default risks of the reference portfolio via portfolio credit default swaps (CDSs), while the risks are simultaneously passed on to third parties via portfolio CDSs/credit-linked notes. Some of these transactions are recognised using the fair value option. The fair values are reported as receivables or liabilities. Fair value changes are recognised under Net gains/losses from other financial instruments at fair value through profit or loss. The ongoing risk premiums are recognised in Net commission income.
In the case of transactions for which, in line with individual contractual conditions, the fair value option in the case of accounting mismatch has not been exercised, portfolio CDSs are recognised in the statement of financial position as financial guarantees issued or received in accordance with the generally applicable accounting policies for these financial instruments. Credit-linked notes with non-bifurcated embedded financial guarantees are accounted for as other liabilities.
(13) Foreign currency translation
The functional currency of KfW and its consolidated subsidiaries is the euro.
Monetary assets and liabilities denominated in a foreign currency are converted at the spot rate as of the reporting date.
Non-monetary assets and liabilities denominated in a foreign currency are normally converted at historical cost, unless they are measured at (amortised) cost.
Translation is made as of the balance sheet date using the European Central Bank reference rates. Income and expenses are translated generally at the average monthly rate.
The results from the translation of foreign currency transactions are recognised in profit or loss under Net gains/losses from other financial instruments at fair value through profit or loss.
75
KfW Financial Information 2016 Consolidated financial statements
(14) Loans and advances to banks and customers
KfW Group’s lending business carried at amortised cost is recognised in Loans and advances to banks and customers, along with the pending syndication business measured at fair value in the business sector Export and project finance. These line items primarily consist of the promotional lending business, in which loans are typically granted to the final borrowers through accredited commercial banks and insurance companies. These assets are presented in Loans and advances to banks when the commercial banks underwrite part of the liability. Promotional loans that the commercial banks on-lend without underwriting of liability are recognised in Loans and advances to customers.
Current interest and similar income are generally recorded under Interest income. If, due to the low interest environment, negative interest rates arise from a financial asset, these are recorded in Interest expense. Premiums, discounts, processing fees and charges are amortised in Interest income using the effective interest method. Processing fees that are not part of the effective interest method are recognised under Commission income.
Loans and advances to banks and customers also include loans with a subsidy element (interest rate reductions) granted by KfW under the ERP economic promotion programme. The promotional grants awarded annually to KfW through the ERP Special Fund based on the ERP Economic Planning Act (ERP-Wirtschaftsplangesetz) for the purpose of executing the ERP economic promotion programme are recognised as deferred income in Other liabilities and are amortised in profit or loss under Interest income as the underlying funding expenses occur.
(15) Risk provisions for lending business
The overall risk provisions for lending business include the provisions for losses on loans and advances and money market investments, including reverse repurchase agreements (reverse repos), as a separate line item on the assets side of the statement of financial position, as well as the provisions for contingent liabilities and irrevocable loan commitments accounted for on the liabilities side as Provisions.
The risks resulting from on balance sheet lending business are accounted for by individual and portfolio impairments recognised in profit or loss.
Individual impairment is recognised for incurred losses and is computed on the basis of individual loans. The amount of the impairment loss equals the difference between the carrying amount of the loan and the sum of discounted expected future cash flows from interest, redemption payments and collateral cash flows. The recognition of interest income in accordance with the original contractual terms ends with the date of the first individual impairment. In subsequent measurements, the effect of compounding the present value of anticipated cash flows using the effective interest rate at inception is determined and recognised as interest income (unwinding). The risk provisions are reduced by this amount. Any reversals of individual impairment losses are accounted for through profit or loss.
Smaller and standardised loans are grouped into homogenous sub-portfolios and assessed for portfolio impairment on the basis of the default risks identified. Any reversals of portfolio impairment losses are recognised in profit or loss.
76
KfW Financial Information 2016 Consolidated financial statements
For performing loans not subject to individual impairment, the risk of impairment losses that have already occurred but have not yet been individually identified is addressed by portfolio impairment. Economic risk and transfer risk are taken into account in the calculation. The key parameters are the outstanding lending volume (based on the carrying amount) as of the reporting date, the expected loss given default and one-year probabilities of default (given a LIP (loss identification period) factor of 1). The probabilities of default and the loss given default are provided by credit risk controlling whereby the latter is adjusted for imputed cost. The underlying assumptions of expected losses are backtested on a regular basis against the actual loss experience.
For contingent liabilities and irrevocable loan commitments, impairment is assessed on an individual basis and accounted for as a provision in the statement of financial position with a corresponding effect on the income statement. For irrevocable loan commitments, impairments not yet identified individually are assessed on a portfolio basis and recognised as provisions.
If the loans are deemed partially or fully uncollectible, they are written down or written off against the allowance account. Uncollectible loans for which no individual impairments were recorded are written off directly. Recoveries on loans already written off are recognised as income in Risk provisions for lending business.
(16) Securities and investments
Securities and investments mainly comprise bonds and other fixed-income securities held in securities portfolios that belong to KfW and its subsidiaries, along with equity investments.
The securities portfolios mainly serve to support KfW’s liquidity position and to stabilise and sustainably ensure the group’s promotional capacity.
To achieve the same accounting treatment for equity investments with and without significant influence, individual group business sectors that provide equity financing as part of their promotional mandate are considered as venture capital organisations for accounting purposes provided they meet the respective requirements. These equity investments, like other equity investments, are recognised in Securities and investments.
Securities and investments are recognised at fair value and subsequently measured depending on the measurement category to which they are assigned.
When non-listed equity investments are measured at fair value, appropriate allowances are made for illiquidity. For example, when applying the DCF models the discount rate is adjusted for a fungibility factor. In cases where the fair value of non-listed equity investments cannot be reliably measured, such assets are carried at cost less any impairment losses.
Any fair value changes of financial assets at fair value through profit or loss are recognised in Net gains/losses from other financial instruments at fair value through profit or loss. Realised gains and losses and impairment losses relating to the available-for-sale financial assets, loans and receivables and held-to-maturity investments categories are recognised under Net gains/losses from securities and investments; amounts reported for loans and receivables and held-to-maturity investments include allowances for impairment losses that have already occurred but have not yet been individually identified, based on the expected loss for one year. Unrealised gains from available-for-sale financial assets are recognised directly in equity as Revaluation reserves. Current interest payments and dividends are recognised in Interest income.
77
KfW Financial Information 2016 Consolidated financial statements
(17) Repurchase agreements
KfW Group enters into repurchase agreements as standardised repos or reverse repos. These are combinations of simultaneous spot and forward transactions on securities with the same counterparty. The terms, modalities of collateral and the use of collateral follow common market practice. Credit claims are also an eligible type of collateral for open-market transactions.
The securities sold under repo transactions (spot sales) continue to be recognised and measured as securities. The repayment obligation towards the counterparty is carried as a liability to banks or customers for the amount of cash consideration received. Interest is recorded in Interest expense in accordance with the respective conditions of the repurchase agreements.
A repayment claim is recognised and measured as a loan or advance to banks or customers for the amount of cash outflow generated by reverse repos. The securities received (spot purchases) are not recognised or measured. Interest is recorded in Interest income in accordance with the respective conditions of the reverse repurchase agreements.
(18) Property, plant and equipment
The land and buildings and the plant and equipment reported by KfW Group are carried at cost less depreciation on a straight-line basis and any impairment, both recognised in Administrative expense. In accordance with the requirements in IAS 36, an impairment is recognised if there are indications of impairment and the carrying amount of the asset exceeds the recoverable amount, which is the higher of the fair value less the cost to sell or the value in use. The useful life is determined based on expected wear and tear. KfW Group assumes an estimated useful life of 40 to 50 years for buildings, 4 years for workstation computer equipment and 5 to 15 years for other property, plant and equipment. Gains and losses from the sale of property, plant and equipment are recognised in Net other operating income.
Payments in advance and assets under construction are recognised in Other property, plant and equipment and are not subject to depreciation.
(19) Intangible assets
Under Intangible assets, KfW Group reports purchased and internally generated software at cost, less straight-line amortisation and impairments, both recognised in Administrative expense. KfW Group assumes a useful life of five years, an assumption which is based on the expected economic life of the assets.
Assets are impaired when the carrying amount of an asset exceeds the recoverable amount. An impairment is recorded when no future economic benefits can be identified.
Internally generated software under development is reported under Other intangible assets and is not subject to amortisation.
78
KfW Financial Information 2016 Consolidated financial statements
(20) Taxes on income
KfW is a non-taxable entity. Taxes on income for non-exempt subsidiaries and their affiliates are determined according to the tax laws in the country of residence. Current taxes on income as well as deferred tax expenses and income are recognised in profit or loss as Taxes on income or directly in equity under Revaluation reserves depending on the underlying transaction. Current and deferred tax assets and liabilities are reported as a separate line item in the statement of financial position. Deferred Income tax assets and liabilities are offset only when the requirements are met.
Current taxes on income are calculated using currently applicable tax rates.
Deferred tax assets and liabilities arise as a result of differences between carrying values of an asset or a liability and the respective tax bases if the differences are likely to result in taxable or tax deductible amounts in the future (temporary differences). Deferred tax assets relating to loss carryforwards not yet used are recognised only if there is a sufficient degree of certainty that the taxable entity will earn sufficient taxable income in subsequent periods to use the loss carryforward.
(21) Liabilities to banks and customers and Certificated liabilities
Liabilities to banks and customers primarily include non-current funding carried at amortised cost and KfW Group’s money-market transactions. Certificated liabilities contain issued bonds, notes and money-market instruments. Own issues repurchased in the open market are deducted from the liabilities as of the repurchase date.
The fair value option is exercised for structured liabilities, or, in the case of certain products, the embedded derivatives must be bifurcated and accounted for as stand-alone derivatives. Presentation of the different types of funding is not based on their classification or their designation as hedged items. Measurement of liabilities is based on their respective classification.
Current interest is generally recorded in Interest expense. If, due to the low interest environment, negative interest rates arise from a financial liability, these are recorded in Interest income. Premiums and discounts are amortised using the effective interest method over the expected life in Interest expense. Fair value changes of liabilities designated at fair value are recognised in profit or loss under Net gains/losses from other financial instruments at fair value through profit or loss, where they have an offsetting effect with the fair value changes from economic hedging derivatives. Results from the repurchase of own issues categorised as other liabilities are recognised at the repurchase date in Net other operating income.
(22) Provisions
Provisions include provisions for pensions and similar commitments, provisions for credit risks, interest rate reductions in irrevocable loan commitments granted by KfW in the promotional lending business and negatively impacting its earnings position, as well as other obligations of uncertain amount and timing involving a probable outflow of funds.
The employees of KfW Group participate in a company pension plan that pays retirement, long-term disability and survivor benefits. KfW Group has various exclusively defined benefit pension plans. The benefits largely depend on the length of company service and salary. The pension plan that was applied for new hires until 1985 offered a full pension (Gesamtversorgung), in which a certain portion of the income paid before the benefits were due was allocated as a benefit and deducted from the state pension. Apart from employer-financed pension plans there are also plans in place involving contributions by employees.
79
KfW Financial Information 2016 Consolidated financial statements
KfW Group pension plans are subject to the following risks in particular: longevity risk, interest risk, pension adjustment risk as well as the risk of future changes to the assessment bases.
Longevity risk is the risk that higher expenses will be incurred for the company pension plan if the pensioners live longer than projected. In general, this risk is balanced out across all pensioners and would only have an impact if life expectancy were to rise faster in the future than anticipated.
Due to the long term of the company pension plan, provisions for pension obligations are subject to general interest rate risk.
Pension adjustment risk largely relates to the pension plan’s full provision structure. Benefits are recalculated as soon as there is a change in the base income eligible for pension or the state pension to be offset. Another pension plan must be examined regularly in terms of forecast and actual pension adjustments, undertaking such adjustments if necessary.
The amount of the benefits promised under the existing pension plans at KfW Group depends, among other things, on development of the income eligible for benefits and the social security contribution ceiling (Beitragsbemessungsgrenze). There is a risk that the basis of assessment will develop differently than was assumed.
The pension obligation is calculated by independent qualified actuaries in accordance with the projected unit credit method on the basis of group-wide uniform parameters such as age, length of company service and salary. The pension provision is recognised at the present value of the defined-benefit obligations as of the reporting date. The discount factor is based on current market conditions for a portfolio of high quality corporate bonds/bonds from supranational issuers with a maturity matching that of the obligations. The definition of the portfolio takes into account actual market conditions. Additional demographic factors (including the 2005 G Heubeck actuarial tables) and actuarial assumptions (rate of salary and pension increases, rate of staff turnover, etc.) are taken into account.
No plan assets were defined for the pension obligations of KfW Group, so the related special accounting rules do not apply. Provisions for pensions and similar obligations are financed in-house with sufficient assets with corresponding maturities.
Actuarial gains and losses are immediately recognised at the time they occur. They occur as a result of remeasurement of pension obligations as of the reporting date compared to the figures forecast at the beginning of the year.
Additions to pension provisions distinguish between service cost and interest expense. Service cost is reported under Administrative expense; interest expense is reported under Other interest expense. The pension provision changes recognised directly in equity comprise the actuarial gains and losses reported in Revaluation reserves; these are reported in Other comprehensive income.
80
KfW Financial Information 2016 Consolidated financial statements
Pension-like obligations include commitments for deferred compensation, early retirement and partial retirement. Actuarial reports are prepared and a provision is recognised accordingly for these types of commitments as well. No actuarial gains or losses are incurred.
Other provisions, including those for obligations to employees and for audit and consultancy services, are recognised at the estimated expenditure. Long-term provisions are discounted where the effect is material. Added to this are obligations arising from the assumption of the tasks of the State Insurance Company of the German Democratic Republic in liquidation (Staatliche Versicherung der Deutschen Demokratischen Republik in Abwicklung – “SinA”, institution under public law), which are offset by receivables in the same amount from the Federal Agency for Special Tasks Arising from Unification (Bundesanstalt für vereinigungsbedingte Sonderaufgaben – “BvS”) reported under Other assets.
(23) Subordinated liabilities
Subordinated liabilities include liabilities to the ERP Special Fund.
Subordinated liabilities are classified as other liabilities and carried at amortised cost.
Deferred interest as well as value adjustments from micro fair value hedge accounting are recognised in Other liabilities. Current interest expenses are recorded in Interest expense.
(24) Equity
The equity structure is, in particular, determined by the KfW Law and the requirements of IFRS.
Pursuant to Article 10 (2) and (3) of the KfW Law, KfW’s net income for the period determined in accordance with the German Commercial Code is transferred to reserves and is included in equity under IFRS.
KfW Group has created a fund for general banking risks. Additions to or reductions of the fund are shown under IFRS as appropriation of consolidated profit/loss.
Under IFRS, any remaining consolidated net income is allocated to Other retained earnings in the same period.
Under IFRS, revaluation reserves comprise transactions to be recognised directly in equity. These include valuation results from financial instruments of the category available-for-sale financial assets, and actuarial gains and losses in the case of defined-benefit plan pension commitments. They also may include deferred taxes, depending on the underlying transaction.
81
KfW Financial Information 2016 Consolidated financial statements
(25) Contingent liabilities and irrevocable loan commitments
KfW Group’s contingent liabilities result mainly from guarantees (financial guarantee contracts). All contingent liabilities are disclosed in the Notes at their nominal amounts less any related provision.
As part of the sale of its stake in IKB Deutsche Industriebank (“IKB”), in 2008, KfW agreed to indemnify IKB for certain legal risks to a certain amount. As of the end of the reporting period, no proceedings are pending against IKB which are relevant in this context.
Irrevocable loan commitments are firm commitments by KfW Group to grant a loan under contractually agreed terms. This also includes commitments on loans that are intended for placement in syndicate transactions. Irrevocable loan commitments are disclosed in the Notes at their nominal amounts less any related provision.
(26) Trust activities
Assets and liabilities held by KfW Group in its own name but for the account of third parties are not recognised. This applies in particular to loans granted under German Financial Cooperation to support developing countries. The related funds are granted and underwritten by the German federal budget. The fees earned associated with these transactions are recognised under Commission income.
(27) Leasing transactions
Leases are classified as operating leases or as finance leases depending on the risks and rewards relating to ownership of an asset. This classification determines their accounting treatment.
Contracts where the group is a lessee (including real estate leases) are largely classified as operating leases; the corresponding rental payments are included in Administrative expense.
The small number of contracts in which KfW Group acts as a lessor are classified as operating leases. The corresponding rental income is recognised in Other operating income.
82
KfW Financial Information 2016 Consolidated financial statements
Notes to the statement
of comprehensive income
(28) Net interest income
Analysis of Net interest income by class
| | | | | | | | | | | | | | | | | | | | |
| | | | | | 2016 | | | | | | 2015 | | | | | | Change | | |
| | | | | | EUR in millions | | | | | | EUR in millions | | | | | | EUR in millions | | |
| | | | | | | | | | |
Interest and similar income from loans and advances to banks and customers | | | | | | 7,849 | | | | | | 8,544 | | | | | | –695 | | |
Similar income from financial guarantees | | | | | | 25 | | | | | | 33 | | | | | | –8 | | |
Interest income from securities and investments | | | | | | 378 | | | | | | 461 | | | | | | –83 | | |
Interest income from derivatives | | | | | | –292 | | | | | | 91 | | | | | | –383 | | |
Other interest income | | | | | | 460 | | | | | | 561 | | | | | | –101 | | |
Interest income | | | | | | 8,420 | | | | | | 9,691 | | | | | | –1,271 | | |
Interest and similar expense for liabilities to banks and customers | | | | | | 383 | | | | | | 439 | | | | | | –55 | | |
Interest expense for certificated liabilities | | | | | | 7,587 | | | | | | 8,561 | | | | | | –974 | | |
Interest expense for subordinated liabilities | | | | | | 3 | | | | | | 5 | | | | | | –2 | | |
Interest expense for derivatives | | | | | | –2,442 | | | | | | –2,308 | | | | | | –135 | | |
Other interest expense | | | | | | 279 | | | | | | 394 | | | | | | –114 | | |
Interest expense | | | | | | 5,810 | | | | | | 7,090 | | | | | | –1,280 | | |
Total | | | | | | 2,610 | | | | | | 2,601 | | | | | | 9 | | |
Expenses for granting promotional loans below market rates – due to additional promotional funds in the form of interest rate reductions with an impact on KfW’s earnings position – amount to EUR 193 million (2015: EUR 304 million) and are reported in Other interest expense. In addition to the charges resulting from the present value of the nominal scheduled interest rate reductions in new lending business, the Other interest expense item also comprises the expenses arising from amortisation at a constant effective interest rate. Interest and similar income from loans and advances to banks and customers also comprises income from accrual-based amortisation in the amount of the pro-rata nominal planned interest rate reductions for these promotional loans in the amount of EUR 421 million (2015: EUR 473 million).
Income from unwinding in the amount of EUR 32 million (2015: EUR 32 million) is reported under Interest and similar income from loans and advances to banks and customers.
The Interest and similar income from loans and advances to banks and customers item comprises EUR 51 million (2015: EUR 21 million) from liabilities-side money-market transactions, while Interest and similar expenses for liabilities to banks and customers comprises EUR 112 million (2015: EUR 45 million) from assets-side money-market transactions and holding arrangements of the Federal Republic of Germany. This is due to the negative interest contributions as a result of the low interest environment.
83
KfW Financial Information 2016 Consolidated financial statements
Interest income from derivatives includes the net interest income and expenses from all derivatives irrespective of whether they are used for hedge accounting. Interest income and expense from derivatives which are directly related to individual financial assets or financial liabilities and which are not included in macro fair value hedge accounting are recognised depending on the related hedged transaction in Interest income from derivatives (for related financial assets) or in Interest expense from derivatives (for related financial liabilities). Taking account of interest income or expenses from the related hedged transactions, presentation is thus based on the economic nature of the hedged financial assets (floating rate financial assets) or hedged financial liabilities (floating rate financial liabilities).
Analysis of interest income from securities and investments
| | | | | | | | | | | | | | | | | | | | | | | | | | |
| | | | | | | | | |
| | | | | | | | 2016 | | | | | | | 2015 | | | | | Change | | |
| | | | | | | | EUR in millions | | | | | | | EUR in millions | | | | | EUR in millions | | |
| | | | | | | | | |
Interest income from bonds and other fixed-income securities | | | | | | | | | | 318 | | | | | | | | 415 | | | | | | –97 | | |
Income from equity investments | | | | | | | | | | 51 | | | | | | | | 46 | | | | | | 5 | | |
Income from shares in subsidiaries not included in the consolidated financial statements | | | | | | | | | | 9 | | | | | | | | 0 | | | | | | 9 | | |
Total | | | | | | | | | | 378 | | | | | | | | 461 | | | | | | –83 | | |
(29) Risk provisions for lending business Analysis of Risk provisions by transaction |
| | | | | | | | | |
| | | | | | | | 2016 | | | | | | | 2015 | | | | | Change | | |
| | | | | | | | EUR in millions | | | | | | | EUR in millions | | | | | EUR in millions | | |
| | | | | | | | | |
Impairment charges | | | | | | | | | | 667 | | | | | | | | 687 | | | | | | –20 | | |
Direct write-offs | | | | | | | | | | 78 | | | | | | | | 73 | | | | | | 4 | | |
Expense for risk provisions | | | | | | | | | | 744 | | | | | | | | 760 | | | | | | –16 | | |
Income from the reversal of impairment losses | | | | | | | | | | 378 | | | | | | | | 431 | | | | | | –53 | | |
Income from recoveries of amounts previously written off | | | | | | | | | | 216 | | | | | | | | 281 | | | | | | –66 | | |
Income from risk provisions | | | | | | | | | | 594 | | | | | | | | 712 | | | | | | –118 | | |
Total | | | | | | | | | | –150 | | | | | | | | –48 | | | | | | –103 | | |
84
KfW Financial Information 2016 Consolidated financial statements
(30) Net commission income
Analysis of Net commission income by class
| | | | | | | | | | | | | | | | | | | | |
| | | | | | | | | | |
| | | | | | 2016 | | | | | | 2015 | | | | | | Change | | |
| | | | | | EUR in millions | | | | | | EUR in millions | | | | | | EUR in millions | | |
| | | | | | | | | | |
Commission income from lending business | | | | | | 133 | | | | | | 126 | | | | | | 7 | | |
Other commission income | | | | | | 203 | | | | | | 210 | | | | | | –7 | | |
Income from trust activities | | | | | | 1 | | | | | | 1 | | | | | | 0 | | |
Commission income | | | | | | 336 | | | | | | 336 | | | | | | 0 | | |
Commission expense for lending business | | | | | | 50 | | | | | | 46 | | | | | | 4 | | |
Commission expense for credit derivatives | | | | | | 1 | | | | | | 0 | | | | | | 0 | | |
Other commission expense | | | | | | 29 | | | | | | 34 | | | | | | –5 | | |
Commission expense | | | | | | 79 | | | | | | 80 | | | | | | 0 | | |
Total | | | | | | 257 | | | | | | 257 | | | | | | 0 | | |
Commission income from lending business also includes current premiums and fees from the synthetic securitisation platforms PROMISE and PROVIDE.
Other commission income includes fees for the administration of German Financial Cooperation with the Promotion of developing countries and emerging economies business sector in the amount of EUR 175 million (2015: EUR 181 million).
(31) Net gains/losses from hedge accounting
Analysis of Net gains/losses from hedge accounting by type of hedging relationship
| | | | | | | | | | | | | | | | | | | | |
| | | | | | 2016 | | | | | | 2015 | | | | | | Change | | |
| | | | | | EUR in millions | | | | | | EUR in millions | | | | | | EUR in millions | | |
| | | | | | | | | | |
Micro fair value hedge accounting | | | | | | 45 | | | | | | –26 | | | | | | 71 | | |
Macro fair value hedge accounting | | | | | | 249 | | | | | | 202 | | | | | | 48 | | |
Total | | | | | | 294 | | | | | | 175 | | | | | | 119 | | |
Net gains/losses from macro fair value hedge accounting comprise the valuation of hedging instruments in the amount of EUR –2,904 million (2015: EUR 733 million) and the valuation of hedged risks from the hedged portfolios. It also includes the amortisation of the value adjustments from the dynamic hedge designation and de-designation and the pro rata reversal of value adjustments in the event of derecognition of financial instruments from the underlying portfolios as well as the pull-to-par effect of the hedging derivatives.
85
KfW Financial Information 2016 Consolidated financial statements
Analysis of Net gains/losses from micro fair value hedge accounting by hedged item
| | | | | | | | | | | | | | | | | | | | |
| | | | | | 2016 | | | | | | 2015 | | | | | | Change | | |
| | | | | | EUR in millions | | | | | | EUR in millions | | | | | | EUR in millions | | |
| | | | | | | | | | |
Hedging of securities and investments | | | | | | 1 | | | | | | 2 | | | | | | –2 | | |
Hedging of liabilities to banks and customers | | | | | | –1 | | | | | | –1 | | | | | | 0 | | |
Hedging of certificated liabilities | | | | | | 44 | | | | | | –29 | | | | | | 73 | | |
Subtotal: Effectiveness of hedges | | | | | | 44 | | | | | | –27 | | | | | | 70 | | |
Amortisation of value adjustments | | | | | | 1 | | | | | | 1 | | | | | | 0 | | |
Total | | | | | | 45 | | | | | | –26 | | | | | | 71 | | |
Gross analysis of valuation gains/losses from micro fair value hedge accounting:
Comparison of hedged items and hedging instruments in the financial year 2016
| | | | | | | | | | | | | | | | | | | | |
| | | | | | | Hedged items | | | | | | Hedging | | | | | | Effectiveness | | |
| | | | | | | | | | | | instruments | | | | | | of hedges | | |
| | | | | | EUR in millions | | | | | | EUR in millions | | | | | | EUR in millions | | |
| | | | | | | | | | |
Hedging of securities and investments | | | | | | –120 | | | | | | 120 | | | | | | 1 | | |
Hedging of liabilities to banks and customers | | | | | | –13 | | | | | | 12 | | | | | | –1 | | |
Hedging of certificated liabilities | | | | | | 2,286 | | | | | | –2,243 | | | | | | 44 | | |
Hedging of subordinated liabilities | | | | | | 5 | | | | | | –4 | | | | | | 0 | | |
Total | | | | | | 2,158 | | | | | | –2,115 | | | | | | 44 | | |
Gross analysis of valuation gains/losses from micro fair value hedge accounting:
Comparison of hedged items and hedging instruments in the financial year 2015
| | | | | | | | | | | | | | | | | | | | |
| | | | | | | Hedged items | | | | | | Hedging | | | | | | Effectiveness | | |
| | | | | | | | | | | | instruments | | | | | | of hedges | | |
| | | | | | EUR in millions | | | | | | EUR in millions | | | | | | EUR in millions | | |
| | | | | | | | | | |
Hedging of securities and investments | | | | | | –211 | | | | | | 213 | | | | | | 2 | | |
Hedging of liabilities to banks and customers | | | | | | 100 | | | | | | –101 | | | | | | –1 | | |
Hedging of certificated liabilities | | | | | | 3,324 | | | | | | –3,353 | | | | | | –29 | | |
Hedging of subordinated liabilities | | | | | | 3 | | | | | | –3 | | | | | | 0 | | |
Total | | | | | | 3,217 | | | | | | –3,244 | | | | | | –27 | | |
86
KfW Financial Information 2016 Consolidated financial statements
(32) Net gains/losses from other financial instruments at fair value through profit or loss
Analysis of Net gains/losses from other financial instruments at fair value through profit or loss by class
| | | | | | | | | | | | | | | | | | | | |
| | | | | | 2016 | | | | | | 2015 | | | | | | Change | | |
| | | | | | EUR in millions | | | | | | EUR in millions | | | | | | EUR in millions | | |
| | | | | | | | | | |
Securities and investments | | | | | | 74 | | | | | | 98 | | | | | | –24 | | |
Assets | | | | | | 74 | | | | | | 98 | | | | | | –24 | | |
Liabilities to banks and customers | | | | | | –15 | | | | | | 48 | | | | | | –63 | | |
Certificated liabilities | | | | | | 122 | | | | | | 698 | | | | | | –576 | | |
Liabilities | | | | | | 107 | | | | | | 747 | | | | | | –639 | | |
Financial derivatives not qualifying for hedge accounting | | | | | | –128 | | | | | | –620 | | | | | | 492 | | |
Credit derivatives | | | | | | 2 | | | | | | 28 | | | | | | –26 | | |
Derivative financial instruments | | | | | | –126 | | | | | | –592 | | | | | | 466 | | |
Foreign currency translation | | | | | | 0 | | | | | | 50 | | | | | | –50 | | |
Total | | | | | | 55 | | | | | | 303 | | | | | | –248 | | |
Net gains/losses from Liabilities to banks and customers include the result of the credit-linked notes issued under the PROMISE and PROVIDE synthetic securitisation platforms. The net gains/losses from Credit derivatives include the result from the portfolio CDSs concluded under these platforms.
Net gains/losses from financial derivatives not qualifying for hedge accounting are attributable to derivatives in economic hedges. Economic hedges are mainly recognised by exercising the fair value option for the hedged items. The hedged items include, in particular, borrowings in the form of Certificated liabilities and Liabilities to banks and customers as well as securities and investments.
In addition, the net gains/losses from financial derivatives that do not qualify for hedge accounting include fair value changes of embedded derivatives from the lending and equity finance business which are bifurcated. Furthermore, this line item includes gains/losses from embedded derivatives from financial liabilities that are bifurcated; the net gains/losses from the valuation of the associated hedging derivatives are thus compensated for.
Analysis of Net gains/losses from securities and investments at fair value through profit or loss by product type
| | | | | | | | | | | | | | | | | | | | |
| | | | | | 2016 | | | | | | 2015 | | | | | | Change | | |
| | | | | | EUR in millions | | | | | | EUR in millions | | | | | | EUR in millions | | |
| | | | | | | | | | |
| Bonds and other fixed-income securities | | | | | | –4 | | | | | | –5 | | | | | | 1 | | |
Equity investments | | | | | | 78 | | | | | | 102 | | | | | | –25 | | |
Total | | | | | | 74 | | | | | | 98 | | | | | | –24 | | |
87
KfW Financial Information 2016 Consolidated financial statements
Analysis of net gains/losses from credit derivatives and credit-linked notes from the PROMISE and PROVIDE synthetic securisation platforms at fair value through profit or loss
| | | | | | | | | | | | | | | | | | | | |
| | | | | | 2016 | | | | | | 2015 | | | | | | Change | | |
| | | | | | EUR in millions | | | | | | EUR in millions | | | | | | EUR in millions | | |
| | | | | | | | | | |
CDSs | | | | | | 2 | | | | | | 28 | | | | | | –26 | | |
Issued credit-linked notes | | | | | | –2 | | | | | | –28 | | | | | | 26 | | |
Total | | | | | | 0 | | | | | | 0 | | | | | | 0 | | |
Gross analysis of results from economically hedged borrowings:
Comparison of hedged items and hedging instruments
| | | | | | | | | | | | | | | | | | | | |
| | | | | | 2016 | | | | | | 2015 | | | | | | Change | | |
| | | | | | EUR in millions | | | | | | EUR in millions | | | | | | EUR in millions | | |
| | | | | | | | | | |
Borrowings | | | | | | 110 | | | | | | 775 | | | | | | –665 | | |
Hedging instruments | | | | | | 74 | | | | | | –796 | | | | | | 870 | | |
Total (Net effect of economic hedges) | | | | | | 183 | | | | | | –22 | | | | | | 205 | | |
(33) Net gains/losses from securities and investments
Analysis of Net gains/losses from securities and investments by class
| | | | | | | | | | | | | | | | | | | | |
| | | | | | 2016 | | | | | | 2015 | | | | | | Change | | |
| | | | | | EUR in millions | | | | | | EUR in millions | | | | | | EUR in millions | | |
| | | | | | | | | | |
Bonds and other fixed-income securities | | | | | | 23 | | | | | | 43 | | | | | | –20 | | |
Shares and other non-fixed income securities | | | | | | 0 | | | | | | 0 | | | | | | 0 | | |
Equity investments | | | | | | –25 | | | | | | –18 | | | | | | –7 | | |
Shares in subsidiaries not included in the consolidated financial statements | | | | | | –8 | | | | | | 0 | | | | | | –8 | | |
Total | | | | | | –10 | | | | | | 25 | | | | | | –35 | | |
The net gains/losses from financial instruments include gains and losses realised from the sale and impairment of Securities and investments classified as available-for-sale financial assets, loans and receivables or held-to-maturity investments.
In the reporting year, equity instruments at a carrying amount of EUR 106 million (2015: EUR 56 million), for which the fair value could not be reliably determined, were disposed of. This generated a realised net loss of EUR 8 million (2015: gain of EUR 22 million), which is contained in the net gains/losses from equity investments.
88
KfW Financial Information 2016 Consolidated financial statements
Disclosures on impairment of securities and investments
| | | | | | | | | | | | | | | | | | | | |
| | | | | | 2016 | | | | | | 2015 | | | | | | Change | | |
| | | | | | EUR in millions | | | | | | EUR in millions | | | | | | EUR in millions | | |
| | | | | | | | | | |
Securities and investments | | | | | | 32 | | | | | | 47 | | | | | | –15 | | |
Bonds and other fixed-income securities | | | | | | 3 | | | | | | 3 | | | | | | 0 | | |
Equity investments | | | | | | 20 | | | | | | 44 | | | | | | –24 | | |
Shares in subsidiaries not included in the consolidated financial statements | | | | | | 9 | | | | | | 0 | | | | | | 9 | | |
Disclosures on the reversal of impairment losses from securities and investments
| | | | | | | | | | | | | | | | | | | | |
| | | | | | 2016 | | | | | | 2015 | | | | | | Change | | |
| | | | | | EUR in millions | | | | | | EUR in millions | | | | | | EUR in millions | | |
| | | | | | | | | | |
Securities and investments | | | | | | 23 | | | | | | 46 | | | | | | –23 | | |
Bonds and other fixed-income securities | | | | | | 23 | | | | | | 46 | | | | | | –23 | | |
(34) Net gains/losses from investments accounted for using the equity method
| | | | | | | | | | | | | | | | | | | | |
| | | | | | 2016 | | | | | | 2015 | | | | | | Change | | |
| | | | | | EUR in millions | | | | | | EUR in millions | | | | | | EUR in millions | | |
Net gains/losses from investments accounted for using the equity method | | | | | | 21 | | | | | | 18 | | | | | | 3 | | |
89
KfW Financial Information 2016 Consolidated financial statements
(35) Administrative expense
Analysis of Administrative expense
| | | | | | | | | | | | | | | | | | | | |
| | | | | | 2016 | | | | | | 2015 | | | | | | Change | | |
| | | | | | EUR in millions | | | | | | EUR in millions | | | | | | EUR in millions | | |
| | | | | | | | | | |
Wages and salaries | | | | | | 506 | | | | | | 495 | | | | | | 11 | | |
Social security contributions | | | | | | 68 | | | | | | 65 | | | | | | 3 | | |
Expense for pension provision and other employee benefits | | | | | | 61 | | | | | | 71 | | | | | | –10 | | |
Personnel costs | | | | | | 634 | | | | | | 630 | | | | | | 4 | | |
Other administrative expense | | | | | | 456 | | | | | | 441 | | | | | | 15 | | |
Depreciation, amortisation and impairment of property, plant and equipment and intangible assets | | | | | | 108 | | | | | | 64 | | | | | | 44 | | |
Non-personnel expense | | | | | | 565 | | | | | | 506 | | | | | | 59 | | |
Total | | | | | | 1,199 | | | | | | 1,136 | | | | | | 63 | | |
The Other administrative expense item includes rental expenses arising from operating leases in the amount of EUR 13 million (2015: EUR 12 million).
(36) Net other operating income
Analysis of Net other operating income
| | | | | | | | | | | | | | | | | | | | |
| | | | | | 2016 | | | | | | 2015 | | | | | | Change | | |
| | | | | | EUR in millions | | | | | | EUR in millions | | | | | | EUR in millions | | |
| | | | | | | | | | |
Other operating income | | | | | | 135 | | | | | | 146 | | | | | | –10 | | |
Other operating expense | | | | | | 33 | | | | | | 38 | | | | | | –5 | | |
Total | | | | | | 102 | | | | | | 107 | | | | | | –5 | | |
Other operating income comprises income from the waiver of a repayment of a part of the ERP subordinated loan in the amount of EUR 100 million (2015: EUR 100 million), income from the reversal of other provisions and accruals in the amount of EUR 18 million (2015: EUR 22 million), and income from repurchasing own issues in the amount of EUR 1 million (2015: EUR 5 million).
The Other operating expense item includes contributions payable by KfW IPEX-Bank to the restructuring fund for banks in the amount of EUR 11 million (2015: EUR 8 million). KfW is not obligated to contribute to the fund in accordance with Section 2 of the Restructuring Fund Act (Restrukturierungsfondsgesetz – “RStrukFG”).
90
KfW Financial Information 2016 Consolidated financial statements
(37) Taxes on income
Analysis of Taxes on income by component
| | | | | | | | | | | | | | | | | | | | |
| | | | | | 2016 | | | | | | 2015 | | | | | | Change | | |
| | | | | | EUR in millions | | | | | | EUR in millions | | | | | | EUR in millions | | |
| | | | | | | | | | |
Current taxes on income | | | | | | 36 | | | | | | 141 | | | | | | –104 | | |
Deferred taxes | | | | | | –58 | | | | | | –10 | | | | | | –47 | | |
Total | | | | | | –21 | | | | | | 130 | | | | | | –152 | | |
Deferred tax assets resulted in tax income of EUR 58 million (2015: EUR 10 million in tax income). This resulted from the changed recognition of temporary differences and the recognition of tax loss carryforwards.
The reconciliation presents the relationship between the calculated income tax expense for the financial year and reported taxes on income.
Tax reconciliation
| | | | | | | | | | | | | | | | | | | | |
| | | | | | 2016 | | | | | | 2015 | | | | | | Change | | |
| | | | | | EUR in millions | | | | | | EUR in millions | | | | | | EUR in millions | | |
| | | | | | | | | | |
Profit/loss from operating activities (before taxes) | | | | | | 1,980 | | | | | | 2,302 | | | | | | –322 | | |
Group income tax rate | | | | | | 0% | | | | | | 0% | | | | | | 0% | | |
Calculated income tax expense | | | | | | 0 | | | | | | 0 | | | | | | 0 | | |
Effects of tax rate differentials within the group | | | | | | 9 | | | | | | 78 | | | | | | –69 | | |
Effect of tax rate changes | | | | | | 0 | | | | | | 0 | | | | | | 0 | | |
Effects of previous year taxes recorded in the reporting year | | | | | | 2 | | | | | | –11 | | | | | | 13 | | |
Effects of non-deductible taxes on income | | | | | | 7 | | | | | | 26 | | | | | | –19 | | |
Effects of non-deductible business expense | | | | | | 12 | | | | | | 30 | | | | | | –18 | | |
Effects of tax-free income | | | | | | 16 | | | | | | –8 | | | | | | 24 | | |
Trade tax add-ons/reductions | | | | | | 1 | | | | | | 1 | | | | | | 0 | | |
Permanent accounting differences | | | | | | 0 | | | | | | 0 | | | | | | 0 | | |
Effects of changes in recognised deferred tax assets | | | | | | –68 | | | | | | 14 | | | | | | –82 | | |
Reported taxes on income | | | | | | –21 | | | | | | 130 | | | | | | –152 | | |
KfW’s applicable income tax rate of 0%, on which the reconciliation is based, takes into account the tax status of KfW as a non-taxable public-law institution and the major effect of this status on profit/loss from operating activities.
The effects of tax rate differentials result from individual group companies being taxable and the related different tax rates. The tax rates continue to range from 0% to 32%.
91
KfW Financial Information 2016 Consolidated financial statements
(38) Other comprehensive income
Analysis of Other comprehensive income by class
| | | | | | | | | | | | | | | | | | | | |
| | | | | | 2016 | | | | | | 2015 | | | | | | Change | | |
| | | | | | EUR in millions | | | | | | EUR in millions | | | | | | EUR in millions | | |
| | | | | | | | | | |
Amounts reclassifiable to the income statement | | | | | | 60 | | | | | | –41 | | | | | | 101 | | |
Financial instruments | | | | | | 59 | | | | | | –42 | | | | | | 101 | | |
Bonds and other fixed-income securities | | | | | | 59 | | | | | | –37 | | | | | | 96 | | |
Shares and other non-fixed income securities | | | | | | 0 | | | | | | 0 | | | | | | 0 | | |
Equity investments | | | | | | 0 | | | | | | –5 | | | | | | 5 | | |
Deferred taxes on financial instruments | | | | | | 0 | | | | | | 1 | | | | | | 0 | | |
Investments accounted for using the equity method | | | | | | 0 | | | | | | 0 | | | | | | 0 | | |
Amounts not reclassified to the income statement | | | | | | –207 | | | | | | 221 | | | | | | –428 | | |
Defined benefit pension obligations | | | | | | –221 | | | | | | 231 | | | | | | –453 | | |
Deferred taxes on defined benefit pension obligations | | | | | | 15 | | | | | | –10 | | | | | | 25 | | |
Total | | | | | | –147 | | | | | | 180 | | | | | | –327 | | |
Other comprehensive income comprises amounts recognised directly in equity under Revaluation reserves. These amounts include income and expenses from financial instruments classified as available-for-sale financial assets, changes in actuarial gains and losses for defined benefit obligations, and changes in deferred taxes reported depending on the underlying transaction.
Analysis of reclassification amounts included in the income statement by class
| | | | | | | | | | | | | | | | | | | | |
| | | | | | 2016 | | | | | | 2015 | | | | | | Change | | |
| | | | | | EUR in millions | | | | | | EUR in millions | | | | | | EUR in millions | | |
| | | | | | | | | | |
Amounts relating to the reclassification of financial instruments | | | | | | 8 | | | | | | 17 | | | | | | –10 | | |
Bonds and other fixed-income securities | | | | | | 8 | | | | | | 17 | | | | | | –10 | | |
Shares and other non-fixed income securities | | | | | | 0 | | | | | | 0 | | | | | | 0 | | |
Equity investments | | | | | | 0 | | | | | | 0 | | | | | | 0 | | |
Subordinated assets | | | | | | 0 | | | | | | 0 | | | | | | 0 | | |
Amounts relating to the reclassification of deferred taxes on financial instruments | | | | | | 0 | | | | | | 0 | | | | | | 0 | | |
Amounts relating to the reclassification of investments accounted for using the equity method | | | | | | 0 | | | | | | 0 | | | | | | 0 | | |
Total | | | | | | 8 | | | | | | 17 | | | | | | –10 | | |
The reclassification amounts detailed in the table above represent income and expenses which were accounted for through profit or loss during the reporting period and which were previously recognised directly in equity in the Revaluation reserves. They also include amortisation of Revaluation reserves related to the reclassification of Securities and investments from the measurement category available-for-sale financial assets to the loans and receivables measurement category. Income recognised in the income statement is reported with a negative sign preceding the amount and expenses with a positive sign.
92
KfW Financial Information 2016 Consolidated financial statements
Segment reporting
(39) Segment reporting by business sector
In accordance with the provisions of IFRS 8, segment reporting follows the internal management reporting system, which is used by the group’s main decision-makers to assess each segment’s performance and to allocate resources to segments.
In accordance with the business sector structure for KfW Group, the segments and their products and services can be presented as follows:
| | | | |
| | |
| Mittelstandsbank (SME Bank) | | | | – Financing of corporate and industrial pollution control investments – Equity financing – Advisory services |
| | | | |
| | |
Kommunal- und Privatkundenbank/Kreditinstitute (Municipal and Private Client Bank/Credit Institutions) | | | | – Financing for housing construction and modernisation – Education financing – Infrastructure and social finance – Global funding of promotional institutions of the German Federal States (Landesförderinstitute) – Individual financing of banks – Transactions on behalf of the Federal Government |
| | | | |
| | |
| Export and project finance | | | | – Financing for German and European export activities – Financing for projects and investments in German and European interests |
| | | | |
| Promotion of developing countries and emerging economies | | | | – Promotion of developing countries and emerging economies on behalf of the Federal Government (budget funds) with complementary market funds raised by KfW – Financing provided by DEG – Deutsche Investitions- und Entwicklungsgesellschaft mbH (private enterprise financing) |
| | | | |
| Financial markets | | | | – Securities and money market investments – Holding arrangements for the Federal Republic of Germany – Transactions mandated by the Federal Government, loan granted to Greece – Funding |
| | | | |
| Head office | | | | – Central interest rate and currency management – Strategic equity investments |
The business sectors are measured on the basis of their contribution to consolidated profit. The individual line items are based on the following methods:
| | – | Net interest income (before promotional activity) comprises interest margins from lending business calculated on the basis of the market interest rate method1). The item also includes the imputed return on equity with an analysis based on economic capital usage. Head office also includes the treasury result, which largely comprises the income/loss from interest rate and spread management. The profit contribution from KfW funding2) is allocated to the Financial markets business sector. |
| | – | The promotional activity included in interest, commission and administrative expense in the income statement is reported separately pursuant to the internal management report due to the special relevance of the promotional activity as a management variable. |
| | 1) | Funding at matching maturities using KfW’s internal refinancing curve is assumed for the calculation of interest margins in this method. |
| | 2) | The difference between the realised funding rates and the maturity-matched refinancing rates calculated in-house. |
93
KfW Financial Information 2016 Consolidated financial statements
Promotional activity is understood to mean certain expenses of the two business sectors Mittelstandsbank (SME Bank) and Kommunal- und Privatkundenbank/Kreditinstitute (Municipal and Private Client Bank/Credit Institutions) with a positive impact on the achievement of KfW’s promotional objectives. Promotional activity primarily consists of additions of the interest rate reductions accounted for at present value3) from new commitments as well as from the compounding effect. Additional support components are the expenses for consultancy grants and sales partner incentives through upfront fees (included in Commission expense) as well as for available and product-related marketing and sales measures (included in Administrative expense).
| | – | The allocation of Administrative expense (before promotional activity) is based on the results from activity-based accounting by cost centres4). The Administrative expense (before promotional activity) item includes depreciation on property, plant and equipment and amortisation of intangible assets. |
| | – | In the Risk provisions for lending business item, net impairment charges, direct write-offs and recoveries on loans written off are distributed among the segments according to the underlying loan. |
| | – | The valuation result comprises the net gains/losses from hedge accounting, the net gains/losses from other financial instruments at fair value, the net gains/losses from securities and investments, the net gains/losses from investments accounted for using the equity method and net other operating income. |
| | – | When taxes on income are allocated to the business sectors (excluding the Head office), only the current taxes on income are taken in account. Deferred taxes are allocated to the Head office. |
| | – | The reported economic capital requirement covers all types of risk under the definition of economic capital requirements in the risk report section of the group management report. |
| | – | Segment assets are not reported as, in accordance with the internal management reporting system, they are used neither to assess each segment’s performance nor to allocate resources to segments. |
| | – | The presentation of segment income and expenses is based on consolidated figures. Administrative and commission expense as well as commission income and other operating income resulting from service relationships within KfW Group are adjusted in segment reporting. Any remaining negligible consolidation effects are reported in the reconciliation/consolidation column. |
| 3) | See note regarding “KfW’s promotional lending business” for details of KfW’s interest rate reductions in the promotional lending business. The present value of the nominal scheduled interest rate reductions, which is recognised as interest expense in profit or loss, is allocated to the Mittelstandsbank (SME Bank) and Kommunal- und Privatkundenbank/Kreditinstitute (Municipal and Private Client Bank/Credit Institutions) business sectors. The compounding effect on the present values contained in interest expense is allocated to the Head office for simplicity’s sake. |
| 4) | The costs incurred in the organisational units are largely allocated to the products by means of core services. |
94
KfW Financial Information 2016 Consolidated financial statements
Segment reporting by business sector for the financial year 2016
| | | | | | | | | | | | | | | | | | | | | | | | | | | | | | | | | | | | | | |
| | | | | | | | | | | | | | | | | | |
| | | | | | | Mittel- stands- bank (SME Bank)1) | | | | Kommunal- und Privat- kunden- bank/ Kredit- institute (Municipal and Private Client Bank/Credit Institutions) | | | | Export and project finance1) | | | | Promotion of devel- oping coun- tries and emerging economies1) | | | | Financial markets | | | | Head office | | | | Reconcili- ation/con- solidation | | | | | | KfW Group | | |
| | | | | | | EUR in millions | | | | EUR in millions | | | | EUR in millions | | | | EUR in millions | | | | EUR in millions | | | | EUR in millions | | | | EUR in millions | | | | | | EUR in millions | | |
| | | | | | | | | | | | | | | | | | |
| Volume of new commitments | | | | | | 21,388 | | | | 33,698 | | | | 16,072 | | | | 8,844 | | | | 1,274 | | | | 0 | | | | –273 | | | | | | 81,002 | | |
Net interest income (before promotional activity) | | | | | | 205 | | | | 380 | | | | 853 | | | | 400 | | | | 224 | | | | 742 | | | | 0 | | | | | | 2,802 | | |
Net commission income (before promotional activity) | | | | | | 12 | | | | 54 | | | | 26 | | | | 195 | | | | –7 | | | | 0 | | | | 0 | | | | | | 280 | | |
Administrative expense (before promotional activity) | | | | | | 177 | | | | 263 | | | | 233 | | | | 364 | | | | 92 | | | | 54 | | | | 0 | | | | | | 1,185 | | |
Operating result before valuation (before promotional activity) | | | | | | 39 | | | | 171 | | | | 645 | | | | 230 | | | | 124 | | | | 688 | | | | 0 | | | | | | 1,898 | | |
Risk provisions for lending business | | | | | | 21 | | | | –37 | | | | –134 | | | | –93 | | | | 0 | | | | 93 | | | | 0 | | | | | | –150 | | |
Valuation result | | | | | | 12 | | | | –8 | | | | –13 | | | | 78 | | | | 13 | | | | 380 | | | | 1 | | | | | | 463 | | |
Profit/loss from operating activities (before promotional activity) | | | | | | 72 | | | | 126 | | | | 499 | | | | 215 | | | | 138 | | | | 1,160 | | | | 1 | | | | | | 2,210 | | |
Promotional activity | | | | | | 170 | | | | 32 | | | | 0 | | | | 0 | | | | 0 | | | | 28 | | | | 0 | | | | | | 230 | | |
Taxes on income | | | | | | 0 | | | | 0 | | | | 14 | | | | 15 | | | | 0 | | | | –51 | | | | 0 | | | | | | –21 | | |
Consolidated profit | | | | | | –98 | | | | 94 | | | | 484 | | | | 200 | | | | 138 | | | | 1,183 | | | | 1 | | | | | | 2,002 | | |
Economic capital requirement | | | | | | 1,938 | | | | 2,109 | | | | 1,893 | | | | 2,440 | | | | 1,181 | | | | 5,357 | | | | 0 | | | | | | 14,919 | | |
| 1) | The valuation result of the business sectors contains the following net gains/losses from investments accounted for using the equity method: Mittelstandsbank (SME Bank) EUR 8.3 million, Export and project finance EUR 8.3 million and Promotion of developing countries and emerging economies EUR 4.3 million. |
95
KfW Financial Information 2016 Consolidated financial statements
Segment reporting by business sector for the financial year 2015
| | | | | | | | | | | | | | | | | | | | | | | | | | | | | | | | | | | | |
| | | | | | | | | | | | | | | | | | |
| | | | | Mittel- stands- bank (SME Bank)1) | | | | Kommunal- und Privat- kunden- bank/ Kredit- institute (Municipal and Private Client Bank/Credit Institutions) | | | | Export and project finance1) | | | | Promotion of devel- oping coun- tries and emerging economies1) | | | | Financial markets | | | | Head office | | | | Reconcili- ation/con- solidation | | | | | | KfW Group | | |
| | | | | EUR in millions | | | | EUR in millions | | | | EUR in millions | | | | EUR in millions | | | | EUR in millions | | | | EUR in millions | | | | EUR in millions | | | | | | EUR in millions | | |
| | | | | | | | | | | | | | | | | | |
| Volume of new commitments | | | | 20,431 | | | | 30,054 | | | | 20,214 | | | | 7,726 | | | | 1,119 | | | | 0 | | | | –229 | | | | | | 79,314 | | |
Net interest income (before promotional activity) | | | | 230 | | | | 337 | | | | 866 | | | | 400 | | | | 213 | | | | 858 | | | | 1 | | | | | | 2,904 | | |
Net commission income (before promotional activity) | | | | 16 | | | | 32 | | | | 37 | | | | 198 | | | | 3 | | | | 0 | | | | 0 | | | | | | 286 | | |
Administrative expense (before promotional activity) | | | | 176 | | | | 245 | | | | 214 | | | | 357 | | | | 85 | | | | 48 | | | | 0 | | | | | | 1,125 | | |
Operating result before valuation (before promotional activity) | | | | 70 | | | | 124 | | | | 690 | | | | 240 | | | | 131 | | | | 810 | | | | 1 | | | | | | 2,066 | | |
Risk provisions for lending business | | | | 5 | | | | –69 | | | | 33 | | | | –63 | | | | –5 | | | | 52 | | | | 0 | | | | | | –48 | | |
Valuation result | | | | 58 | | | | 0 | | | | 0 | | | | 65 | | | | 20 | | | | 484 | | | | 0 | | | | | | 628 | | |
Profit/loss from operating activities (before promotional activity) | | | | 133 | | | | 56 | | | | 722 | | | | 243 | | | | 146 | | | | 1,346 | | | | 0 | | | | | | 2,647 | | |
Promotional activity | | | | 258 | | | | 48 | | | | 0 | | | | 0 | | | | 0 | | | | 39 | | | | 0 | | | | | | 345 | | |
Taxes on income | | | | 20 | | | | 0 | | | | 94 | | | | 23 | | | | 0 | | | | –6 | | | | 0 | | | | | | 130 | | |
Consolidated profit | | | | –144 | | | | 7 | | | | 628 | | | | 220 | | | | 146 | | | | 1,313 | | | | 0 | | | | | | 2,171 | | |
Economic capital requirement | | | | 1,545 | | | | 1,256 | | | | 2,230 | | | | 2,902 | | | | 1,294 | | | | 5,330 | | | | 0 | | | | | | 14,557 | | |
| 1) | The valuation result of the business sectors contains the following net gains/losses from investments accounted for using the equity method: Mittelstandsbank (SME Bank) EUR 10.1 million, Export and project finance EUR 3.0 million and Promotion of developing countries and emerging economies EUR 4.5 million. |
The reconciliation/consolidation column includes all adjustments that were necessary to reconcile segment information with the aggregated information for KfW Group. The consolidation effects reported for “Volume of new commitments” relate to commitments for programme loans made by Mittelstandsbank (SME Bank) and Kommunal- und Privatkundenbank/Kreditinstitute (Municipal and Private Client Bank/Credit Institutions) for which KfW IPEX-Bank acts as on-lending bank. The other amounts in this column result from minimal consolidation effects.
96
KfW Financial Information 2016 Consolidated financial statements
(40) Segment reporting by region
Net interest and commission income are allocated on the basis of the customers’ geographical location. The imputed return on equity included in net interest income, the profit contribution from KfW funding and the treasury result are allocated to Germany. KfW receives commission income from the Federal Republic for supporting developing countries and emerging economies using budget funds of the Federal Republic. This is allocated according to the region of the country receiving the investment. The commission expense paid to special purpose entities resulting from the asset securitisation platform is distributed according to the geographical location of the originator bank.
Property, plant and equipment and intangible assets are not reported according to region because, apart from immaterial amounts, these assets relate to Germany.
Segment reporting by region for the financial year 2016
| | | | | | | | | | | | | | | | | | | | | | | | | | | | | | | | | | |
| | | | | Germany | | | | | | Europe (excl. Germany) | | | | | | Rest of the world | | | | | | Reconciliation/ consolidation | | | | | | | | KfW Group | | | | |
| | | | | EUR in millions | | | | | | EUR in millions | | | | | | EUR in millions | | | | | | EUR in millions | | | | | | | | EUR in millions | | | |
Net interest income | | | | 1,517 | | | | | | 458 | | | | | | 636 | | | | | | 0 | | | | | | | | 2,610 | | | | |
Net commission income | | | | 51 | | | | | | 24 | | | | | | 183 | | | | | | 0 | | | | | | | | 257 | | | | |
Segment income | | | | 1,567 | | | | | | 481 | | | | | | 818 | | | | | | 0 | | | | | | | | 2,867 | | | | |
Segment reporting by region for the financial year 2015 | | | | |
| | |
| | | | | Germany | | | | | | Europe (excl. Germany) | | | | | | Rest of the world | | | | | | Reconciliation/ consolidation | | | | | | | | KfW Group | | | | |
| | | | | EUR in millions | | | | | | EUR in millions | | | | | | EUR in millions | | | | | | EUR in millions | | | | | | | | EUR in millions | | | |
Net interest income | | | | 1,516 | | | | | | 482 | | | | | | 602 | | | | | | 1 | | | | | | | | 2,601 | | | | |
Net commission income | | | | 33 | | | | | | 39 | | | | | | 185 | | | | | | 0 | | | | | | | | 257 | | | | |
Segment income | | | | 1,549 | | | | | | 521 | | | | | | 787 | | | | | | 1 | | | | | | | | 2,858 | | | | |
The reconciliation/consolidation column includes all adjustments that were necessary to reconcile segment information with the aggregated information for KfW Group. The amounts in this column result solely from minimal consolidation effects.
97
KfW Financial Information 2016 Consolidated financial statements
Notes to the statement
of financial position
(41) Cash reserves
Analysis of Cash reserves by class
| | | | | | | | | | | | | | | | | | | | |
| | | | | | | 31 Dec. 2016 | | | | | | 31 Dec. 2015 | | | | | | Change | | |
| | | | | | | EUR in millions | | | | | | EUR in millions | | | | | | EUR in millions | | |
| Cash | | | | | | 0 | | | | | | 0 | | | | | | 0 | | |
Balances with central banks | | | | | | 11,572 | | | | | | 460 | | | | | | 11,113 | | |
Total | | | | | | 11,573 | | | | | | 460 | | | | | | 11,113 | | |
(42) Loans and advances to banks
Analysis of Loans and advances to banks by class
| | | | | | | | | | | | | | | | | | | | |
| | | | | | | 31 Dec. 2016 | | | | | | 31 Dec. 2015 | | | | | | Change | | |
| | | | | | | EUR in millions | | | | | | EUR in millions | | | | | | EUR in millions | | |
| | | | | | | | | | |
Money-market transactions | | | | | | 11,771 | | | | | | 17,171 | | | | | | –5,401 | | |
Loans and advances | | | | | | 251,833 | | | | | | 248,986 | | | | | | 2,847 | | |
Other receivables | | | | | | 12,318 | | | | | | 10,892 | | | | | | 1,426 | | |
Total | | | | | | 275,922 | | | | | | 277,050 | | | | | | –1,127 | | |
An adjustment to the carrying amount totalling EUR 1,357 million (31 Dec. 2015: EUR 1,588 million) is reported under Loans and advances due to the interest rate being below the market rate for promotional loans paid out with additional promotional funds in the form of interest rate reductions with an impact on KfW’s earnings position.
The receivables from reverse repurchase agreements (reverse “repos”), cash collateral pledged and the PROMISE and PROVIDE synthetic securitisation platforms are included in Other receivables.
Analysis of Loans and advances to banks by underwriting liability type
| | | | | | | | | | | | | | | | | | | | | | | | | | | | |
| | | | | | | 31 Dec. 2016 | | | | | | | | | | 31 Dec. 2015 | | | | | | | | | | Change | | |
| | | | | | | EUR in millions | | | | | | | | | | EUR in millions | | | | | | | | | | EUR in millions | | |
Direct loans to banks | | | | | | 79,099 | | | | | | | | | | 80,576 | | | | | | | | | | –1,477 | | |
On-lent customer loans with full underwriting borne by the on-lending commercial bank | | | | | | 171,293 | | | | | | | | | | 166,871 | | | | | | | | | | 4,422 | | |
On-lent customer loans with partial underwriting borne by the on-lending commercial bank | | | | | | 2,340 | | | | | | | | | | 2,604 | | | | | | | | | | –264 | | |
Direct and on-lent subordinated loans | | | | | | 459 | | | | | | | | | | 524 | | | | | | | | | | –65 | | |
Adjustment to the carrying amount due to the interest rate being below the market rate for promotional loans paid out with additional promotional funds in the form of interest rate reductions with an impact on KfW’s earnings position | | | | | | –1,357 | | | | | | | | | | –1,588 | | | | | | | | | | 231 | | |
Total | | | | | | 251,833 | | | | | | | | | | 248,986 | | | | | | | | | | 2,847 | | |
Direct loans to banks include in particular global loans granted as part of financing for domestic housing construction and SMEs.
98
KfW Financial Information 2016 Consolidated financial statements
(43) Loans and advances to customers
Analysis of Loans and advances to customers by class
| | | | | | | | | | | | | | | | | | | | |
| | | | | | | 31 Dec. 2016 | | | | | | 31 Dec. 2015 | | | | | | Change | | |
| | | | | | | EUR in millions | | | | | | EUR in millions | | | | | | EUR in millions | | |
Money-market transactions | | | | | | 9,592 | | | | | | 9,783 | | | | | | –192 | | |
Loans and advances | | | | | | 126,038 | | | | | | 121,934 | | | | | | 4,104 | | |
Other receivables | | | | | | 1,074 | | | | | | 2,991 | | | | | | –1,917 | | |
Total | | | | | | 136,704 | | | | | | 134,708 | | | | | | 1,996 | | |
An adjustment to the carrying amount totalling EUR 142 million (31 Dec. 2015: EUR 174 million) is reported under Loans and advances due to the interest rate being below the market rate for promotional loans paid out with additional promotional funds in the form of interest rate reductions with an impact on KfW’s earnings position.
The receivables from reverse repurchase agreements (reverse “repos”) are included in Other receivables.
Analysis of Loans and advances to customers by underwriting liability type
| | | | | | | | | | | | | | | | | | | | |
| | | | | | | 31 Dec. 2016 | | | | | | 31 Dec. 2015 | | | | | | Change | | |
| | | | | | | EUR in millions | | | | | | EUR in millions | | | | | | EUR in millions | | |
Direct loans to customers | | | | | | 122,564 | | | | | | 117,976 | | | | | | 4,588 | | |
On-lent customer loans without underwriting borne by the on-lending commercial bank | | | | | | 350 | | | | | | 376 | | | | | | –26 | | |
Customer loans on-lent through insurance companies with full underwriting borne by the on-lending insurance company | | | | | | 469 | | | | | | 311 | | | | | | 157 | | |
Customer loans on-lent through insurance companies without underwriting borne by the on-lending insurance company | | | | | | 0 | | | | | | 9 | | | | | | –9 | | |
Direct subordinated loans and subordinated loans on-lent through commercial banks and insurance companies | | | | | | 2,797 | | | | | | 3,435 | | | | | | –639 | | |
Adjustment to the carrying amount due to the interest rate being below the market rate for promotional loans paid out with additional promotional funds in the form of interest rate reductions with an impact on KfW’s earnings position | | | | | | –142 | | | | | | –174 | | | | | | 33 | | |
Total | | | | | | 126,038 | | | | | | 121,934 | | | | | | 4,104 | | |
Direct loans to customers include in particular loans granted under export and project financing, municipal financing and education financing. The item also includes loans connected with certain transactions mandated by the Federal Government in accordance with the KfW Law.
99
KfW Financial Information 2016 Consolidated financial statements
(44) Risk provisions for lending business
Analysis of Risk provisions for lending business by class
| | | | | | | | | | | | | | | | | | | | |
| | | | | | | 31 Dec. 2016 | | | | | | 31 Dec. 2015 | | | | | | Change | | |
| | | | | | | EUR in millions | | | | | | EUR in millions | | | | | | EUR in millions | | |
Loans and advances to banks | | | | | | 171 | | | | | | 169 | | | | | | 1 | | |
Loans and advances to customers | | | | | | 1,439 | | | | | | 1,573 | | | | | | –134 | | |
Provisions for losses on loans and advances | | | | | | 1,610 | | | | | | 1,743 | | | | | | –133 | | |
Provisions for contingent liabilities and irrevocable loan commitments | | | | | | 44 | | | | | | 62 | | | | | | –18 | | |
Total | | | | | | 1,654 | | | | | | 1,804 | | | | | | –151 | | |
Provisions for losses on loans and advances also include money market investments and reverse repos.
Development of Risk provisions for lending business in the financial year 2016 by risk assessment type
| | | | | | | | | | | | | | | | | | | | | | | | | | | | | | | | | | | | | | | | | | | | | | |
| | | | | | | Individually | | | | | | | | Risks assessed | | | | | | | Provisions for | | | | | | | Provisions | | | | | | | | Provisions | | | | | | | Total | | |
| | | | | | | assessed risks | | | | | | | | on a portfolio | | | | | | | losses on loans | | | | | | | (individual | | | | | | | | (portfolio | | | | | | | | | |
| | | | | | | | | | | | | | | basis | | | | | | | and advances | | | | | | | risks) | | | | | | | | risks) | | | | | | | | | |
| | | | | | | EUR in millions | | | | | | | | EUR in millions | | | | | | | EUR in millions | | | | | | | EUR in millions | | | | | | | | EUR in millions | | | | | | | EUR in millions | | |
As of 1 Jan. 2016 | | | | | | | 1,197 | | | | | | | | 546 | | | | | | | 1,743 | | | | | | | 19 | | | | | | | | 42 | | | | | | | 1,804 | | |
Additions | | | | | | | 692 | | | | | | | | 48 | | | | | | | 740 | | | | | | | 3 | | | | | | | | 1 | | | | | | | 744 | | |
Utilisation | | | | | | | –512 | | | | | | | | 0 | | | | | | | –512 | | | | | | | 0 | | | | | | | | 0 | | | | | | | –512 | | |
Reversals | | | | | | | –301 | | | | | | | | –54 | | | | | | | –356 | | | | | | | –13 | | | | | | | | –9 | | | | | | | –378 | | |
Unwinding | | | | | | | –32 | | | | | | | | 0 | | | | | | | –32 | | | | | | | 0 | | | | | | | | 0 | | | | | | | –32 | | |
Exchange rate changes | | | | | | | 21 | | | | | | | | 7 | | | | | | | 27 | | | | | | | 0 | | | | | | | | 0 | | | | | | | 28 | | |
As of 31 Dec. 2016 | | | | | | | 1,064 | | | | | | | | 546 | | | | | | | 1,610 | | | | | | | 9 | | | | | | | | 35 | | | | | | | 1,654 | | |
Risks assessed on a portfolio basis comprise both credit rating risks and country risks.
In the reporting year, EUR 60 million (2015: EUR 68 million) in interest income was not collected for impaired loans.
100
KfW Financial Information 2016 Consolidated financial statements
Development of Risk provisions for lending business in the financial year 2015 by risk assessment type
| | | | | | | | | | | | | | | | | | | | | | | | | | | | | | | | | | | | | | | | | | | | | | |
| | | | | | | Individually | | | | | | | | Risks assessed | | | | | | | Provisions for | | | | | | | Provisions | | | | | | | | Provisions | | | | | | | Total | | |
| | | | | | | assessed risks | | | | | | | | on a portfolio | | | | | | | losses on loans | | | | | | | (individual | | | | | | | | (portfolio | | | | | | | | | |
| | | | | | | | | | | | | | | basis | | | | | | | and advances | | | | | | | risks) | | | | | | | | risks) | | | | | | | | | |
| | | | | | | EUR in millions | | | | | | | | EUR in millions | | | | | | | EUR in millions | | | | | | | EUR in millions | | | | | | | | EUR in millions | | | | | | | EUR in millions | | |
As of 1 Jan. 2015 | | | | | | | 1,323 | | | | | | | | 535 | | | | | | | 1,857 | | | | | | | 30 | | | | | | | | 48 | | | | | | | 1,935 | | |
Additions | | | | | | | 700 | | | | | | | | 51 | | | | | | | 751 | | | | | | | 6 | | | | | | | | 3 | | | | | | | 760 | | |
Utilisation | | | | | | | –517 | | | | | | | | 0 | | | | | | | –517 | | | | | | | 0 | | | | | | | | 0 | | | | | | | –517 | | |
Reversals | | | | | | | –347 | | | | | | | | –57 | | | | | | | –404 | | | | | | | –17 | | | | | | | | –10 | | | | | | | –431 | | |
Unwinding | | | | | | | –32 | | | | | | | | 0 | | | | | | | –32 | | | | | | | 0 | | | | | | | | 0 | | | | | | | –32 | | |
Exchange rate changes | | | | | | | 70 | | | | | | | | 18 | | | | | | | 87 | | | | | | | 1 | | | | | | | | 1 | | | | | | | 89 | | |
As of 31 Dec. 2015 | | | | | | | 1,197 | | | | | | | | 546 | | | | | | | 1,743 | | | | | | | 19 | | | | | | | | 42 | | | | | | | 1,804 | | |
(45) Value adjustments from macro fair value hedge accounting
| | | | | | | | | | | | | | | | | | | | |
| | | | | | | 31 Dec. 2016 | | | | | | 31 Dec. 2015 | | | | | | Change | | |
| | | | | | | EUR in millions | | | | | | EUR in millions | | | | | | EUR in millions | | |
Value adjustments to assets under macro fair value hedge accounting | | | | | | 13,917 | | | | | | 14,420 | | | | | | –503 | | |
The fair values attributable to hedged risks in the hedged portfolios in the loans and receivables category are included in this item.
(46) Derivatives used for hedge accounting
Analysis of derivatives with positive fair values designated for hedge accounting by type of
hedging relationship
| | | | | | | | | | | | | | | | | | | | |
| | | | | | | 31 Dec. 2016 | | | | | | 31 Dec. 2015 | | | | | | Change | | |
| | | | | | | EUR in millions | | | | | | EUR in millions | | | | | | EUR in millions | | |
Micro fair value hedge accounting | | | | | | 26,471 | | | | | | 33,603 | | | | | | –7,132 | | |
Macro fair value hedge accounting | | | | | | 993 | | | | | | 1,039 | | | | | | –46 | | |
Total | | | | | | 27,464 | | | | | | 34,641 | | | | | | –7,178 | | |
101
KfW Financial Information 2016 Consolidated financial statements
Analysis of derivatives with positive fair values designated for hedge accounting by class
| | | | | | | | | | | | | | | | | | | | | | | | | | |
| | | | | | | | | | 31 Dec. 2016 | | | | | | 31 Dec. 2015 | | | | | | | | | Change | | |
| | | | | | | | | | EUR in millions | | | | | | EUR in millions | | | | | | | | | EUR in millions | | |
Interest-related derivatives | | | | | | | | | 8,181 | | | | | | 12,625 | | | | | | | | | –4,444 | | |
Currency-related derivatives | | | | | | | | | 19,283 | | | | | | 22,016 | | | | | | | | | –2,733 | | |
Total | | | | | | | | | 27,464 | | | | | | 34,641 | | | | | | | | | –7,178 | | |
Only Interest-related derivatives are designated for macro fair value hedge accounting. Cross-currency swaps are presented under Currency-related derivatives.
(47) Other derivatives
Analysis of Other derivatives with positive fair values by class
| | | | | | | | | | | | | | | | | | | | | | | | | | |
| | | | | | | | | | 31 Dec. 2016 | | | | | | 31 Dec. 2015 | | | | | | | | | Change | | |
| | | | | | | | | | EUR in millions | | | | | | EUR in millions | | | | | | | | | EUR in millions | | |
Interest-related derivatives | | | | | | | | | 5,515 | | | | | | 5,546 | | | | | | | | | –31 | | |
Currency-related derivatives | | | | | | | | | 1,776 | | | | | | 3,391 | | | | | | | | | –1,615 | | |
Credit derivatives | | | | | | | | | 1 | | | | | | 0 | | | | | | | | | 1 | | |
Miscellaneous | | | | | | | | | 53 | | | | | | 77 | | | | | | | | | –25 | | |
Total | | | | | | | | | 7,344 | | | | | | 9,014 | | | | | | | | | –1,670 | | |
Cross-currency swaps are presented under Currency-related derivatives.
Under Other derivatives are derivatives with positive fair values of EUR 123 million (31 Dec. 2015: EUR 148 million) attributable to embedded derivatives that are bifurcated.
(48) Securities and investments
Analysis of Securities and investments by class
| | | | | | | | | | | | | | | | | | | | | | | | | | |
| | | | | | | | | | 31 Dec. 2016 | | | | | | 31 Dec. 2015 | | | | | | | | | Change | | |
| | | | | | | | | | EUR in millions | | | | | | EUR in millions | | | | | | | | | EUR in millions | | |
Bonds and other fixed-income securities | | | | | | | | | 30,118 | | | | | | 29,238 | | | | | | | | | 879 | | |
Shares and other non-fixed income securities | | | | | | | | | 1 | | | | | | 0 | | | | | | | | | 1 | | |
Equity investments | | | | | | | | | 2,595 | | | | | | 2,388 | | | | | | | | | 207 | | |
Shares in non-consolidated subsidiaries | | | | | | | | | 0 | | | | | | 8 | | | | | | | | | –8 | | |
Total | | | | | | | | | 32,715 | | | | | | 31,634 | | | | | | | | | 1,080 | | |
Bonds and other fixed-income securities are recorded net of impairment losses that have already occurred but have not yet been individually identified.
102
KfW Financial Information 2016 Consolidated financial statements
(49) Investments accounted for using the equity method
| | | | | | | | | | | | | | | | | | | | | | | | | | | | |
| | | | | | | 31 Dec. 2016 | | | | | | | | | | 31 Dec. 2015 | | | | | | | | | | Change | | |
| | | | | | | EUR in millions | | | | | | | | | | EUR in millions | | | | | | | | | | EUR in millions | | |
Investments accounted for using the equity method | | | | | | 346 | | | | | | | | | | 290 | | | | | | | | | | 56 | | |
The note regarding “Disclosures on shareholdings” contains a list of Investments accounted for using the equity method.
(50) Property, plant and equipment
Analysis of Property, plant and equipment by class
| | | | | | | | | | | | | | | | | | | | |
| | | | | | | 31 Dec. 2016 | | | | | | 31 Dec. 2015 | | | | | | Change | | |
| | | | | | | EUR in millions | | | | | | EUR in millions | | | | | | EUR in millions | | |
| | | | | | | | | | |
Land and buildings | | | | | | 828 | | | | | | 806 | | | | | | 22 | | |
Plant and equipment | | | | | | 68 | | | | | | 72 | | | | | | –3 | | |
Other property, plant and equipment | | | | | | 35 | | | | | | 42 | | | | | | –7 | | |
Total | | | | | | 931 | | | | | | 919 | | | | | | 12 | | |
Payments in advance and assets under construction are presented in Other property, plant and equipment.
Development in Property, plant and equipment in the financial year 2016
| | | | | | | | | | | | | | | | | | | | |
| | | | | | Acquisition/ | | | | | | Accumulated | | | | | | Net carrying | | |
| | | | | | production cost | | | | | | depreciation, | | | | | | amount | | |
| | | | | | | | | | | | impairment and | | | | | | | | |
| | | | | | | | | | | | reversal of im- | | | | | | | | |
| | | | | | | | | | | | | pairment losses | | | | | | | | |
| | | | | | | EUR in millions | | | | | | EUR in millions | | | | | | EUR in millions | | |
| | | | | | | | | | |
| Carrying amount as of 1 Jan. 2016 | | | | | | 1,232 | | | | | | –312 | | | | | | 919 | | |
Additions/reversals of impairment losses | | | | | | 64 | | | | | | 0 | | | | | | 64 | | |
Disposals | | | | | | –17 | | | | | | 17 | | | | | | –1 | | |
Depreciation | | | | | | 0 | | | | | | –42 | | | | | | –42 | | |
Impairment losses | | | | | | 0 | | | | | | –9 | | | | | | –9 | | |
Carrying amount as of 31 Dec. 2016 | | | | | | 1,278 | | | | | | –347 | | | | | | 931 | | |
103
KfW Financial Information 2016 Consolidated financial statements
Development in Property, plant and equipment in the financial year 2015
| | | | | | | | | | | | | | | | | | | | |
| | | | | | Acquisition/ | | | | | | Accumulated | | | | | | Net carrying | | |
| | | | | | production cost | | | | | | depreciation, | | | | | | amount | | |
| | | | | | | | | | | | impairment and | | | | | | | | |
| | | | | | | | | | | | reversal of im- | | | | | | | | |
| | | | | | | | | | | | | pairment losses | | | | | | | | |
| | | | | | | EUR in millions | | | | | | EUR in millions | | | | | | EUR in millions | | |
| | | | | | | | | | |
| Carrying amount as of 1 Jan. 2015 | | | | | | 1,195 | | | | | | –283 | | | | | | 912 | | |
Additions/reversals of impairment losses | | | | | | 47 | | | | | | 0 | | | | | | 47 | | |
Disposals | | | | | | –11 | | | | | | 10 | | | | | | –1 | | |
Depreciation | | | | | | 0 | | | | | | –39 | | | | | | –39 | | |
Impairment losses | | | | | | 0 | | | | | | 0 | | | | | | 0 | | |
Carrying amount as of 31 Dec. 2015 | | | | | | 1,232 | | | | | | –312 | | | | | | 919 | | |
(51) Intangible assets
Analysis of Intangible assets by class
| | | | | | | | | | | | | | | | | | | | |
| | | | | | | 31 Dec. 2016 | | | | | | 31 Dec. 2015 | | | | | | Change | | |
| | | | | | | EUR in millions | | | | | | EUR in millions | | | | | | EUR in millions | | |
| | | | | | | | | | |
| Software | | | | | | 158 | | | | | | 161 | | | | | | –4 | | |
Purchased software | | | | | | 125 | | | | | | 114 | | | | | | 11 | | |
Internally generated software | | | | | | 33 | | | | | | 47 | | | | | | –14 | | |
Other intangible assets | | | | | | 77 | | | | | | 45 | | | | | | 32 | | |
Total | | | | | | 235 | | | | | | 206 | | | | | | 29 | | |
Other intangible assets include, in particular, software under development.
Development in Intangible assets in the financial year 2016
| | | | | | | | | | | | | | | | | | | | |
| | | | | | Acquisition/ | | | | | | Accumulated | | | | | | Net carrying | | |
| | | | | | production cost | | | | | | amortisation, | | | | | | amount | | |
| | | | | | | | | | | | impairment and | | | | | | | | |
| | | | | | | | | | | | reversal of im- | | | | | | | | |
| | | | | | | | | | | | | pairment losses | | | | | | | | |
| | | | | | | EUR in millions | | | | | | EUR in millions | | | | | | EUR in millions | | |
| | | | | | | | | | |
| Carrying amount as of 1 Jan. 2016 | | | | | | 324 | | | | | | –117 | | | | | | 206 | | |
Changes in consolidated group | | | | | | 0 | | | | | | 0 | | | | | | 0 | | |
Additions/reversals of impairment losses | | | | | | 85 | | | | | | 0 | | | | | | 85 | | |
Disposals | | | | | | –71 | | | | | | 71 | | | | | | 0 | | |
Amortisation | | | | | | 0 | | | | | | –29 | | | | | | –29 | | |
Impairment losses | | | | | | 0 | | | | | | –28 | | | | | | –28 | | |
Carrying amount as of 31 Dec. 2016 | | | | | | 338 | | | | | | –103 | | | | | | 235 | | |
104
KfW Financial Information 2016 Consolidated financial statements
Development in Intangible assets in the financial year 2015
| | | | | | | | | | | | | | | | | | | | |
| | | | | | Acquisition/ | | | | | | Accumulated | | | | | | Net carrying | | |
| | | | | | production cost | | | | | | amortisation, | | | | | | amount | | |
| | | | | | | | | | | | impairment and | | | | | | | | |
| | | | | | | | | | | | reversal of im- | | | | | | | | |
| | | | | | | | | | | | | pairment losses | | | | | | | | |
| | | | | | | EUR in millions | | | | | | EUR in millions | | | | | | EUR in millions | | |
| | | | | | | | | | |
| Carrying amount as of 1 Jan. 2015 | | | | | | 254 | | | | | | –96 | | | | | | 158 | | |
Changes in consolidated group | | | | | | 0 | | | | | | 0 | | | | | | 0 | | |
Additions/reversals of impairment losses | | | | | | 75 | | | | | | 0 | | | | | | 75 | | |
Disposals | | | | | | –6 | | | | | | 4 | | | | | | –2 | | |
Amortisation | | | | | | 0 | | | | | | –25 | | | | | | –25 | | |
Impairment losses | | | | | | 0 | | | | | | 0 | | | | | | 0 | | |
Carrying amount as of 31 Dec. 2015 | | | | | | 324 | | | | | | –117 | | | | | | 206 | | |
(52) Income tax assets
Analysis of Income tax assets by type
| | | | | | | | | | | | | | | | | | | | |
| | | | | | | 31 Dec. 2016 | | | | | | 31 Dec. 2015 | | | | | | Change | | |
| | | | | | | EUR in millions | | | | | | EUR in millions | | | | | | EUR in millions | | |
| | | | | | | | | | |
| Current income tax assets | | | | | | 10 | | | | | | 12 | | | | | | –2 | | |
Deferred income tax assets | | | | | | 529 | | | | | | 397 | | | | | | 132 | | |
Total | | | | | | 540 | | | | | | 410 | | | | | | 130 | | |
Current income tax assets result from creditable taxes (investment income tax/solidarity surcharge) and tax receivables from advance tax payments during the reporting year.
Deferred income tax assets mostly result from valuation differences relating to the balance sheet items listed below.
105
KfW Financial Information 2016 Consolidated financial statements
Analysis of deferred tax assets by balance sheet item
| | | | | | | | | | | | | | | | | | | | | | | | | | | | |
| | | | | | | 31 Dec. 2016 | | | | | | | | | | 31 Dec. 2015 | | | | | | | | | | Change | | |
| | | | | | | EUR in millions | | | | | | | | | | EUR in millions | | | | | | | | | | EUR in millions | | |
| | | | | | | | | | |
| Loans and advances to banks and customers (incl. risk provisions) | | | | | | 69 | | | | | | | | | | 66 | | | | | | | | | | 3 | | |
Securities and investments | | | | | | 19 | | | | | | | | | | 17 | | | | | | | | | | 2 | | |
Intangible assets | | | | | | 15 | | | | | | | | | | 15 | | | | | | | | | | 0 | | |
Other derivatives (liabilities) | | | | | | 312 | | | | | | | | | | 252 | | | | | | | | | | 60 | | |
Provisions | | | | | | 58 | | | | | | | | | | 46 | | | | | | | | | | 12 | | |
Other balance sheet items | | | | | | 1 | | | | | | | | | | 0 | | | | | | | | | | 1 | | |
Tax loss carryforwards | | | | | | 55 | | | | | | | | | | 1 | | | | | | | | | | 54 | | |
Subtotal | | | | | | 529 | | | | | | | | | | 397 | | | | | | | | | | 132 | | |
Offset against deferred tax liabilities | | | | | | 0 | | | | | | | | | | 0 | | | | | | | | | | 0 | | |
Total | | | | | | 529 | | | | | | | | | | 397 | | | | | | | | | | 132 | | |
KfW IPEX-Beteiligungsholding GmbH was merged into KfW Beteiligungsholding GmbH at book value in the reporting year, effective 1 January 2016. A profit and loss transfer agreement between KfW IPEX-Bank GmbH and KfW Beteiligungsholding GmbH was subsequently concluded, establishing tax consolidation for income tax purposes with effect from financial year 2016. The tax consolidation parent KfW Beteiligung-sholding GmbH has tax loss carryforwards that were recognised and measured as deferred income tax assets.
(53) Other assets
Analysis of Other assets by class
| | | | | | | | | | | | | | | | | | | | | | | | | | | | |
| | | | | | | 31 Dec. 2016 | | | | | | | | | | 31 Dec. 2015 | | | | | | | | | | Change | | |
| | | | | | | EUR in millions | | | | | | | | | | EUR in millions | | | | | | | | | | EUR in millions | | |
| | | | | | | | | | |
| Other assets and receivables | | | | | | 887 | | | | | | | | | | 909 | | | | | | | | | | –22 | | |
Prepaid and deferred charges | | | | | | 45 | | | | | | | | | | 53 | | | | | | | | | | –8 | | |
Total | | | | | | 932 | | | | | | | | | | 962 | | | | | | | | | | –31 | | |
(54) Liabilities to banks
Analysis of Liabilities to banks by class
| | | | | | | | | | | | | | | | | | | | | | | | | | | | |
| | | | | | | 31 Dec. 2016 | | | | | | | | | | 31 Dec. 2015 | | | | | | | | | | Change | | |
| | | | | | | EUR in millions | | | | | | | | | | EUR in millions | | | | | | | | | | EUR in millions | | |
| | | | | | | | | | |
| Money-market transactions | | | | | | 7 | | | | | | | | | | 4 | | | | | | | | | | 4 | | |
Promissory note loans | | | | | | 2,157 | | | | | | | | | | 2,330 | | | | | | | | | | –172 | | |
Other financial liabilities | | | | | | 17,672 | | | | | | | | | | 21,670 | | | | | | | | | | –3,998 | | |
Total | | | | | | 19,837 | | | | | | | | | | 24,004 | | | | | | | | | | –4,166 | | |
106
KfW Financial Information 2016 Consolidated financial statements
Liabilities from cash collateral received and the PROMISE and PROVIDE synthetic securitisation platforms are included in Other financial liabilities.
(55) Liabilities to customers
Analysis of Liabilities to customers by class
| | | | | | | | | | | | | | | | | | | | | | | | | | | | |
| | | | | | | 31 Dec. 2016 | | | | | | | | | | 31 Dec. 2015 | | | | | | | | | | Change | | |
| | | | | | | EUR in millions | | | | | | | | | | EUR in millions | | | | | | | | | | EUR in millions | | |
| | | | | | | | | | |
| Money-market transactions | | | | | | 2,638 | | | | | | | | | | 476 | | | | | | | | | | 2,162 | | |
Promissory note loans | | | | | | 5,266 | | | | | | | | | | 5,695 | | | | | | | | | | –429 | | |
Other financial liabilities | | | | | | 3,730 | | | | | | | | | | 3,453 | | | | | | | | | | 277 | | |
Total | | | | | | 11,634 | | | | | | | | | | 9,624 | | | | | | | | | | 2,010 | | |
Liabilities from cash collateral received are included in Other financial liabilities. Credit-linked notes issued via the PROMISE and PROVIDE synthetic securitisation platforms are included under Promissory note loans.
(56) Certificated liabilities
Analysis of Certificated liabilities by class
| | | | | | | | | | | | | | | | | | | | | | | | | | | | |
| | | | | | | 31 Dec. 2016 | | | | | | | | | | 31 Dec. 2015 | | | | | | | | | | Change | | |
| | | | | | | EUR in millions | | | | | | | | | | EUR in millions | | | | | | | | | | EUR in millions | | |
| | | | | | | | | | |
| Money-market issues | | | | | | 47,091 | | | | | | | | | | 39,884 | | | | | | | | | | 7,207 | | |
Bonds and notes | | | | | | 375,483 | | | | | | | | | | 375,316 | | | | | | | | | | 167 | | |
Total | | | | | | 422,574 | | | | | | | | | | 415,200 | | | | | | | | | | 7,374 | | |
(57) Value adjustments from macro fair value hedge accounting
| | | | | | | | | | | | | | | | | | | | | | | | | | | | |
| | | | | | | 31 Dec. 2016 | | | | | | | | | | 31 Dec. 2015 | | | | | | | | | | Change | | |
| | | | | | | EUR in millions | | | | | | | | | | EUR in millions | | | | | | | | | | EUR in millions | | |
Value adjustments to liabilities under macro fair value hedge accounting | | | | | | 127 | | | | | | | | | | 132 | | | | | | | | | | –6 | | |
The fair values attributable to hedged risks in the hedged portfolios in the other liabilities category are included in this item.
107
KfW Financial Information 2016 Consolidated financial statements
(58) Derivatives used for hedge accounting
Analysis of derivatives with negative fair values designated for hedge accounting by type
of hedging relationship
| | | | | | | | | | | | | | | | | | | | | | | | | | | | |
| | | | | | | 31 Dec. 2016 | | | | | | | | | | 31 Dec. 2015 | | | | | | | | | | Change | | |
| | | | | | | EUR in millions | | | | | | | | | | EUR in millions | | | | | | | | | | EUR in millions | | |
| | | | | | | | | | |
| Micro fair value hedge accounting | | | | | | 4,153 | | | | | | | | | | 4,179 | | | | | | | | | | –25 | | |
Macro fair value hedge accounting | | | | | | 14,297 | | | | | | | | | | 17,714 | | | | | | | | | | –3,416 | | |
Total | | | | | | 18,451 | | | | | | | | | | 21,892 | | | | | | | | | | –3,442 | | |
Analysis of derivatives with negative fair values designated for hedge accounting by class
| | | | | | | | | | | | | | | | | | | | | | | | | | | | |
| | | | | | | 31 Dec. 2016 | | | | | | | | | | 31 Dec. 2015 | | | | | | | | | | Change | | |
| | | | | | | EUR in millions | | | | | | | | | | EUR in millions | | | | | | | | | | EUR in millions | | |
| | | | | | | | | | |
| Interest-related derivatives | | | | | | 16,069 | | | | | | | | | | 19,116 | | | | | | | | | | –3,046 | | |
Currency-related derivatives | | | | | | 2,381 | | | | | | | | | | 2,777 | | | | | | | | | | –395 | | |
Total | | | | | | 18,451 | | | | | | | | | | 21,892 | | | | | | | | | | –3,442 | | |
Only Interest-related derivatives are designated for macro fair value hedge accounting. Cross-currency swaps are presented under Currency-related derivatives.
(59) Other derivatives
Analysis of Other derivatives with negative fair values by class
| | | | | | | | | | | | | | | | | | | | | | | | | | | | |
| | | | | | | 31 Dec. 2016 | | | | | | | | | | 31 Dec. 2015 | | | | | | | | | | Change | | |
| | | | | | | EUR in millions | | | | | | | | | | EUR in millions | | | | | | | | | | EUR in millions | | |
| | | | | | | | | | |
| Interest-related derivatives | | | | | | 1,211 | | | | | | | | | | 1,034 | | | | | | | | | | 177 | | |
Currency-related derivatives | | | | | | 1,796 | | | | | | | | | | 1,592 | | | | | | | | | | 204 | | |
Total | | | | | | 3,007 | | | | | | | | | | 2,626 | | | | | | | | | | 380 | | |
Cross-currency swaps are presented under Currency-related derivatives.
Under Other derivatives are derivatives with negative fair values of EUR 20 million (31 Dec. 2015: EUR 17 million) attributable to embedded derivatives that are bifurcated.
108
KfW Financial Information 2016 Consolidated financial statements
(60) Provisions
Analysis of Provisions by class
| | | | | | | | | | | | | | | | | | | | | | | | | | | | |
| | | | | | | | | 31 Dec. 2016 | | | | | | 31 Dec. 2015 | | | | | | | | | | Change | | | | |
| | | | | | | | | EUR in millions | | | | | | EUR in millions | | | | | | | | | | EUR in millions | | | | |
| | | | | | | | | | |
| Provisions for pensions and similar commitments | | | | | | | | 2,050 | | | | | | 1,780 | | | | | | | | | | 270 | | | | |
Provisions for credit risks | | | | | | | | 44 | | | | | | 62 | | | | | | | | | | –18 | | | | |
Other provisions | | | | | | | | 771 | | | | | | 756 | | | | | | | | | | 15 | | | | |
Total | | | | | | | | 2,865 | | | | | | 2,598 | | | | | | | | | | 268 | | | | |
Development in Provisions for pensions and similar commitments in the financial year 2016
| | | | | | | | | | | | | | | | | | | | | | | | | | | | | | | | |
| | | | | | | | | | | Defined benefit obligations | | | | | | Early retirement | | | | | | Partial retirement | | | | | | Total | | | | |
| | | | | | | | | | | EUR in millions | | | | | | EUR in millions | | | | | | EUR in millions | | | | | | EUR in millions | | | | |
| | | | | | | | | | | | | |
| As of 1 Jan. 2016 | | | | | | | | | | 1,726 | | | | | | 41 | | | | | | 13 | | | | | | 1,780 | | | | |
Additions | | | | | | | | | | 95 | | | | | | 0 | | | | | | 5 | | | | | | 100 | | | | |
Current service cost | | | | | | | | | | 55 | | | | | | 0 | | | | | | 5 | | | | | | 60 | | | | |
Past service cost | | | | | | | | | | 0 | | | | | | 0 | | | | | | 0 | | | | | | 0 | | | | |
Interest cost | | | | | | | | | | 40 | | | | | | 0 | | | | | | 0 | | | | | | 40 | | | | |
Other additions | | | | | | | | | | 0 | | | | | | 0 | | | | | | 0 | | | | | | 0 | | | | |
Actuarial gains and losses | | | | | | | | | | 221 | | | | | | 0 | | | | | | 0 | | | | | | 221 | | | | |
Changes in demographic assumptions | | | | | | | | | | 0 | | | | | | 0 | | | | | | 0 | | | | | | 0 | | | | |
Changes in financial assumptions | | | | | | | | | | 236 | | | | | | 0 | | | | | | 0 | | | | | | 236 | | | | |
Changes in experience adjustments | | | | | | | | | | –14 | | | | | | 0 | | | | | | 0 | | | | | | –14 | | | | |
Utilisation | | | | | | | | | | –45 | | | | | | –7 | | | | | | –4 | | | | | | –57 | | | | |
Reversals | | | | | | | | | | 0 | | | | | | 0 | | | | | | 0 | | | | | | 0 | | | | |
Transfers | | | | | | | | | | 0 | | | | | | 0 | | | | | | 0 | | | | | | 0 | | | | |
Contributions by members (recognised in equity) | | | | | | | | | | 6 | | | | | | 0 | | | | | | 0 | | | | | | 6 | | | | |
Changes in consolidated group | | | | | | | | | | 0 | | | | | | 0 | | | | | | 0 | | | | | | 0 | | | | |
As of 31 Dec. 2016 | | | | | | | | | | 2,002 | | | | | | 34 | | | | | | 14 | | | | | | 2,050 | | | | |
The average residual term of the defined benefit pension obligations is 20.0 years as of 31 December 2016 (31 Dec. 2015: 19.4 years).
109
KfW Financial Information 2016 Consolidated financial statements
Development in Provisions for pensions and similar commitments in the financial year 2015
| | | | | | | | | | | | | | | | | | | | | | | | | | | | | | | | |
| | | | | | | | | | | Defined benefit obligations | | | | | | Early retirement | | | | | | Partial retirement | | | | | | Total | | | | |
| | | | | | | | | | | EUR in millions | | | | | | EUR in millions | | | | | | EUR in millions | | | | | | EUR in millions | | | | |
| | | | | | | | | | | | | |
| As of 1 Jan. 2015 | | | | | | | | | | 1,893 | | | | | | 49 | | | | | | 13 | | | | | | 1,955 | | | | |
Additions | | | | | | | | | | 101 | | | | | | 1 | | | | | | 1 | | | | | | 103 | | | | |
Current service cost | | | | | | | | | | 67 | | | | | | 0 | | | | | | 1 | | | | | | 69 | | | | |
Past service cost | | | | | | | | | | 0 | | | | | | 0 | | | | | | 0 | | | | | | 0 | | | | |
Interest cost | | | | | | | | | | 34 | | | | | | 0 | | | | | | 0 | | | | | | 34 | | | | |
Other additions | | | | | | | | | | 0 | | | | | | 0 | | | | | | 0 | | | | | | 0 | | | | |
Actuarial gains and losses | | | | | | | | | | –231 | | | | | | 0 | | | | | | 0 | | | | | | –231 | | | | |
Changes in demographic assumptions | | | | | | | | | | 1 | | | | | | 0 | | | | | | 0 | | | | | | 1 | | | | |
Changes in financial assumptions | | | | | | | | | | –224 | | | | | | 0 | | | | | | 0 | | | | | | –224 | | | | |
Changes in experience adjustments | | | | | | | | | | –8 | | | | | | 0 | | | | | | 0 | | | | | | –8 | | | | |
Utilisation | | | | | | | | | | –44 | | | | | | –5 | | | | | | –3 | | | | | | –52 | | | | |
Reversals | | | | | | | | | | 0 | | | | | | –1 | | | | | | –1 | | | | | | –2 | | | | |
Transfers | | | | | | | | | | 0 | | | | | | –3 | | | | | | 3 | | | | | | 0 | | | | |
Contributions by members (recognised in equity) | | | | | | | | | | 6 | | | | | | 0 | | | | | | 0 | | | | | | 6 | | | | |
Changes in consolidated group | | | | | | | | | | 0 | | | | | | 0 | | | | | | 0 | | | | | | 0 | | | | |
As of 31 Dec. 2015 | | | | | | | | | | 1,726 | | | | | | 41 | | | | | | 13 | | | | | | 1,780 | | | | |
Provisions for pensions and similar commitments are calculated on the basis of the 2005 G Heubeck actuarial tables and the following other actuarial assumptions:
Actuarial assumptions in % p. a.
| | | | | | | | | | | | | | | | |
| | | | | | | |
| | | | | | | 31 Dec. 2016 | | | | | | 31 Dec. 2015 | | |
| | | | | | | |
Technical discount rate | | | | | | | | 1.63 | | | | | | 2.28 | | |
Rate of salary increases | | | | | | | | 2.20 | | | | | | 2.20 | | |
Rate of pension increases | | | | | | | | 2.50 | | | | | | 2.50 | | |
Rate of staff turnover | | | | | | | | 1.50 | | | | | | 1.50 | | |
110
KfW Financial Information 2016 Consolidated financial statements
Sensitivity of defined benefit pension obligations as of 31 December 2016
| | | | | | | | | | | | | | | | | | | | | | | | | | | | | | |
| | | | | | | Difference | | | | | | Change in | | | | | | Difference | | | | | | | | Change in | | |
| | | | | | | | | | | | | defined benefit | | | | | | | | | | | | | | defined benefit | | |
| | | | | | | | | | | | obligations | | | | | | | | | | | | | | obligations | | |
| | | | | | | | | | | | EUR in millions | | | | | | | | | | | | | | EUR in millions | | |
| | | | | | | | | | | | | |
Life expectancy | | | | | | +1 year | | | | | | 75 | | | | | | –1 year | | | | | | | | | | –74 | | |
Technical discount rate | | | | | | +0.25% | | | | | | –83 | | | | | | –0.25% | | | | | | | | | | 90 | | |
Rate of salary increases | | | | | | +0.50% | | | | | | 18 | | | | | | –0.50% | | | | | | | | | | –17 | | |
Rate of pension increases | | | | | | +0.50% | | | | | | 82 | | | | | | –0.50% | | | | | | | | | | –75 | | |
Rate of staff turnover | | | | | | +1.00% | | | | | | –17 | | | | | | –1.00% | | | | | | | | | | 21 | | |
Sensitivity of defined benefit pension obligations as of 31 December 2015 |
| | | | | | | Difference | | | | | | Change in | | | | | | Difference | | | | | | | | Change in | | |
| | | | | | | | | | | | | defined benefit | | | | | | | | | | | | | | defined benefit | | |
| | | | | | | | | | | | obligations | | | | | | | | | | | | | | obligations | | |
| | | | | | | | | | | | EUR in millions | | | | | | | | | | | | | | EUR in millions | | |
| | | | | | | | | | | | | |
Life expectancy | | | | | | +1 year | | | | | | 67 | | | | | | –1 year | | | | | | | | | | –52 | | |
Technical discount rate | | | | | | +0.25% | | | | | | –77 | | | | | | –0.25% | | | | | | | | | | 84 | | |
Rate of salary increases | | | | | | +0.50% | | | | | | 24 | | | | | | –0.50% | | | | | | | | | | –23 | | |
Rate of pension increases | | | | | | +0.50% | | | | | | 85 | | | | | | –0.50% | | | | | | | | | | –77 | | |
Rate of staff turnover | | | | | | +1.00% | | | | | | –16 | | | | | | –1.00% | | | | | | | | | | 19 | | |
111
KfW Financial Information 2016 Consolidated financial statements
Development in Risk provisions for lending business
For the development in Risk provisions for lending business see the note regarding “Risk provisions for lending business”.
Development in Other provisions in the financial year 2016
| | | | | | | | | | | | | | | | | | | | |
| | | | | | | Obligations to | | | | | | Other | | | | | | Total | | |
| | | | | | employees | | | | | | provisions | | | | | | | | |
| | | | | | EUR in millions | | | | | | EUR in millions | | | | | | EUR in millions | | |
| | | | | | | | | | |
As of 1 Jan. 2016 | | | | | | 28 | | | | | | 728 | | | | | | 756 | | |
Additions | | | | | | 7 | | | | | | 63 | | | | | | 69 | | |
Interest cost | | | | | | 0 | | | | | | 10 | | | | | | 10 | | |
Other additions | | | | | | 7 | | | | | | 52 | | | | | | 59 | | |
Utilisation | | | | | | –2 | | | | | | –48 | | | | | | –51 | | |
Reversals | | | | | | 0 | | | | | | –3 | | | | | | –4 | | |
Transfers | | | | | | 0 | | | | | | 0 | | | | | | 0 | | |
Exchange rate changes | | | | | | 0 | | | | | | 0 | | | | | | 0 | | |
Changes in consolidated group | | | | | | 0 | | | | | | 0 | | | | | | 0 | | |
As of 31 Dec. 2016 | | | | | | 33 | | | | | | 739 | | | | | | 771 | | |
Obligations to employees show other long-term employee benefits including provisions for service anniversaries. Corresponding actuarial reports have been prepared for these obligations.
An Other provision item in the amount of EUR 44 million (31 Dec. 2015: EUR 47 million) is reported due to the interest rate being below the market rate for irrevocable promotional loan commitments with additional promotional funds in the form of interest rate reductions with an impact on KfW’s earnings position. Changes to existing provisions are presented as net additions or, in the case of a decline, as a transfer via the adjustments to the carrying amounts of already disbursed promotional loans recognised on the assets side under Loans and advances to banks or customers.
Other provisions also comprise obligations arising from the assumption of the operations of the State Insurance Company of the GDR in liquidation (Staatliche Versicherung der Deutschen Demokratischen Republik in Abwicklung – “SinA”, an institution under public law), which are offset by receivables in the same amount from the Federal Agency for Special Tasks Arising from Unification (Bundesanstalt für vereinigungsbedingte Sonderaufgaben – “BvS”) recognised in Other assets.
112
KfW Financial Information 2016 Consolidated financial statements
Development in Other provisions in the financial year 2015
| | | | | | | | | | | | | | | | | | | | |
| | | | | | | Obligations to | | | | | | Other | | | | | | Total | | |
| | | | | | employees | | | | | | provisions | | | | | | | | |
| | | | | | EUR in millions | | | | | | EUR in millions | | | | | | EUR in millions | | |
| | | | | | | | | | |
As of 1 Jan. 2015 | | | | | | 28 | | | | | | 740 | | | | | | 768 | | |
Additions | | | | | | 4 | | | | | | 47 | | | | | | 51 | | |
Interest cost | | | | | | 0 | | | | | | 0 | | | | | | 0 | | |
Other additions | | | | | | 4 | | | | | | 47 | | | | | | 51 | | |
Utilisation | | | | | | –3 | | | | | | –44 | | | | | | –47 | | |
Reversals | | | | | | –1 | | | | | | –10 | | | | | | –10 | | |
Transfers | | | | | | 0 | | | | | | –6 | | | | | | –6 | | |
Exchange rate changes | | | | | | 0 | | | | | | 1 | | | | | | 1 | | |
Changes in consolidated group | | | | | | 0 | | | | | | 0 | | | | | | 0 | | |
As of 31 Dec. 2015 | | | | | | 28 | | | | | | 728 | | | | | | 756 | | |
(61) Income tax liabilities
| | | | | | | | | | | | | | | | | | | | |
| | | | | | 31 Dec. 2016 | | | | | | 31 Dec. 2015 | | | | | | Change | | |
| | | | | | EUR in millions | | | | | | EUR in millions | | | | | | EUR in millions | | |
| | | | | | | | | | |
Current income tax liabilities | | | | | | 11 | | | | | | 29 | | | | | | –18 | | |
Deferred income tax liabilities | | | | | | 314 | | | | | | 255 | | | | | | 59 | | |
Total | | | | | | 324 | | | | | | 284 | | | | | | 41 | | |
Current income tax liabilities as of 31 December 2016 primarily include tax provisions at the level of taxable companies included in KfW Group.
Development in tax provisions
| | | | | | | | | | | | | | | | | | | | |
| | | | | | | | 2016 | | | | | | | 2015 | | |
| | | | | | | | EUR in millions | | | | | | | EUR in millions | | |
| | | | | | | |
As of 1 Jan. | | | | | | | | | | 29 | | | | | | | | 55 | | |
Additions | | | | | | | | | | 15 | | | | | | | | 29 | | |
Utilisation | | | | | | | | | | –34 | | | | | | | | –43 | | |
Reversals | | | | | | | | | | 0 | | | | | | | | –12 | | |
As of 31 Dec. | | | | | | | | | | 11 | | | | | | | | 29 | | |
Deferred income tax liabilities mostly resulted from valuation differences relating to the balance sheet items listed below.
113
KfW Financial Information 2016 Consolidated financial statements
Analysis of deferred tax liabilities by balance sheet item
| | | | | | | | | | | | | | | | | | | | | | | | | | | | |
| | | | | | | | 31 Dec. 2016 | | | | | | | | 31 Dec. 2015 | | | | | Change | | |
| | | | | | | | EUR in millions | | | | | | | | EUR in millions | | | | | EUR in millions | | |
| | | | | | | | | |
Other derivatives (assets) | | | | | | | | | | 308 | | | | | | | | | | 226 | | | | | | 83 | | |
Securities and investments | | | | | | | | | | 0 | | | | | | | | | | 1 | | | | | | –1 | | |
Other balance sheet items | | | | | | | | | | 5 | | | | | | | | | | 28 | | | | | | –23 | | |
Subtotal | | | | | | | | | | 314 | | | | | | | | | | 255 | | | | | | 59 | | |
Offset against deferred tax assets | | | | | | | | | | 0 | | | | | | | | | | 0 | | | | | | 0 | | |
Total | | | | | | | | | | 314 | | | | | | | | | | 255 | | | | | | 59 | | |
(62) Other liabilities Analysis of Other liabilities by class |
| | | | | | | | 31 Dec. 2016 | | | | | | | | 31 Dec. 2015 | | | | | Change | | |
| | | | | | | | EUR in millions | | | | | | | | EUR in millions | | | | | EUR in millions | | |
| | | | | | | | | |
Other financial liabilities | | | | | | | | | | 723 | | | | | | | | | | 837 | | | | | | –114 | | |
Deferred income | | | | | | | | | | 215 | | | | | | | | | | 276 | | | | | | –61 | | |
Total | | | | | | | | | | 938 | | | | | | | | | | 1,113 | | | | | | –175 | | |
(63) Subordinated liabilities Analysis of Subordinated liabilities by class |
| | | | | | | | 31 Dec. 2016 | | | | | | | | 31 Dec. 2015 | | | | | Change | | |
| | | | | | | | EUR in millions | | | | | | | | EUR in millions | | | | | EUR in millions | | |
Subordinated liabilities | | | | | | | | | | 200 | | | | | | | | | | 300 | | | | | | –100 | | |
As part of the new legislation governing ERP economic promotion as of 1 July 2007, the ERP Special Fund provided a subordinated loan to KfW in the original amount of EUR 3,247 million. The ERP Special Fund waived repayment from KfW in the amount of EUR 100 million as of 1 January 2016. Subordinated liabilities in the amount of EUR 200 million were recognised as of the reporting date. The loan consists of three tranches with different fixed-interest periods. The period during which capital is tied up in all tranches ends on 31 December 2027. Interest was charged on the tranches at an average rate of 1.82% in the financial year 2016 (2015: 1.82%).
114
KfW Financial Information 2016 Consolidated financial statements
(64) Equity
Analysis of Equity
| | | | | | | | | | | | | | | | | | | | | | |
| | | | | | | | 31 Dec. 2016 | | | | | | | | 31 Dec. 2015 | | | | Change | | |
| | | | | | | | | EUR in millions | | | | | | | | EUR in millions | | | | EUR in millions | | |
| | | | | | | | | |
Subscribed capital | | | | | | | | 3,750 | | | | | | | | 3,750 | | | | 0 | | |
less uncalled outstanding contributions | | | | | | | | –450 | | | | | | | | –450 | | | | 0 | | |
Paid-in subscribed capital | | | | | | | | 3,300 | | | | | | | | 3,300 | | | | 0 | | |
Capital reserve | | | | | | | | 8,447 | | | | | | | | 8,447 | | | | 0 | | |
of which promotional reserve from the ERP Special Fund | | | | | | | | 7,150 | | | | | | | | 7,150 | | | | 0 | | |
Reserve from the ERP Special Fund | | | | | | | | 1,191 | | | | | | | | 1,191 | | | | 0 | | |
Retained earnings | | | | | | | | 14,092 | | | | | | | | 12,091 | | | | 2,002 | | |
Statutory reserve under Article 10 (2) KfW Law | | | | | | | | 1,875 | | | | | | | | 1,875 | | | | 0 | | |
Special reserve under Article 10 (3) KfW Law | | | | | | | | 8,312 | | | | | | | | 7,022 | | | | 1,290 | | |
Special reserve less the special loss account from provisioning pursuant to Section 17 (4) of the D-Mark Balance Sheet Law | | | | | | | | 21 | | | | | | | | 21 | | | | 0 | | |
Other retained earnings | | | | | | | | 3,885 | | | | | | | | 3,173 | | | | 712 | | |
Fund for general banking risks | | | | | | | | 600 | | | | | | | | 600 | | | | 0 | | |
Revaluation reserves | | | | | | | | –576 | | | | | | | | –429 | | | | –147 | | |
Valuation gains/losses from available-for-sale financial assets (after tax) | | | | | | | | 75 | | | | | | | | 15 | | | | 60 | | |
Actuarial gains and losses from defined benefit pension obligations (after tax) | | | | | | | | –650 | | | | | | | | –443 | | | | –207 | | |
Total | | | | | | | | 27,055 | | | | | | | | 25,200 | | | | 1,855 | | |
Equity forms the basis for the capital available for covering risks, which are matched against the capital requirements derived from internal management.
For information concerning Equity in relation to risk-bearing capacity see Risk report in the group management report.
115
KfW Financial Information 2016 Consolidated financial statements
Notes to financial instruments
(65) Gains and losses from financial instruments by measurement category
The following tables show an analysis of the results from financial instruments included in the various income statement items presented by measurement category. In addition to interest and similar income and expenses reported in Net interest and commission income and loan processing fees included in Net commission income, contributions to income include in particular the Risk provisions for lending business. Depending on measurement and designation for hedge accounting, the effects of fair value measurement, impairment losses, reversals of impairment losses and gains and losses from disposals are also included. The result from foreign currency translation is not included.
Gains and losses from financial instruments by measurement category in the financial year 2016
| | | | | | | | | | | | | | | | | | | | | | | | | | | | | | | | | | | | | | | | | | | | | | | | | | | | | | |
| | | | | | | | | | | | | | | | | | |
| | | | | Net interest income | | | | | | Risk pro- visions for lending business | | | | | | Net com- mission income | | | | | | Net gains/ losses from hedge account- ing | | | | | | Net gains/ losses from other financial instru- ments at fair value through profit or loss | | | | | | Net gains/ losses from securities and invest- ments | | | | | | Net other operating income | | | | | | | | | | Total | | | | |
| | | | | EUR in millions | | | | | | EUR in millions | | | | | | EUR in millions | | | | | | EUR in millions | | | | | | EUR in millions | | | | | | EUR in millions | | | | | | EUR in millions | | | | | | | | | | EUR in millions | | | | |
| | | | | | | | | | | | | | | | | | |
Loans and receivables | | | | 7,386 | | | | | | –150 | | | | | | 125 | | | | | | 28 | | | | | | 0 | | | | | | 2 | | | | | | 0 | | | | | | | | | | 7,391 | | | | |
Held-to-maturity investments | | | | –2 | | | | | | 0 | | | | | | 0 | | | | | | 0 | | | | | | 0 | | | | | | 0 | | | | | | 0 | | | | | | | | | | –2 | | | | |
Other liabilities | | | | –7,112 | | | | | | 0 | | | | | | –27 | | | | | | 2,287 | | | | | | 0 | | | | | | 0 | | | | | | 101 | | | | | | | | | | –4,751 | | | | |
Available-for-sale financial assets | | | | 253 | | | | | | 0 | | | | | | 0 | | | | | | –79 | | | | | | 0 | | | | | | –12 | | | | | | 0 | | | | | | | | | | 163 | | | | |
Financial assets at fair value through profit or loss | | | | 44 | | | | | | 0 | | | | | | 8 | | | | | | 0 | | | | | | 76 | | | | | | 0 | | | | | | 0 | | | | | | | | | | 128 | | | | |
Financial liabilities at fair value through profit or loss | | | | –644 | | | | | | 0 | | | | | | –8 | | | | | | 0 | | | | | | 107 | | | | | | 0 | | | | | | 0 | | | | | | | | | | –545 | | | | |
Financial instruments classified as held for trading | | | | 1,567 | | | | | | 0 | | | | | | –1 | | | | | | 0 | | | | | | –128 | | | | | | 0 | | | | | | 0 | | | | | | | | | | 1,439 | | | | |
Derivatives used for hedge accounting | | | | 1,158 | | | | | | 0 | | | | | | 0 | | | | | | –1,943 | | | | | | 0 | | | | | | 0 | | | | | | 0 | | | | | | | | | | –785 | | | | |
Total | | | | 2,650 | | | | | | –150 | | | | | | 97 | | | | | | 294 | | | | | | 55 | | | | | | –10 | | | | | | 101 | | | | | | | | | | 3,038 | | | | |
116
KfW Financial Information 2016 Consolidated financial statements
Gains and losses from financial instruments by measurement category in the financial year 2015
| | | | | | | | | | | | | | | | | | | | | | | | | | | | | | | | | | | | | | | | | | | | | | | | | | |
| | | | | | | | | | | | | | | | | | | | |
| | | | | | Net interest income | | | | Risk pro- visions for lending business | | | | Net com- mission income | | | | | | Net gains/ losses from hedge account-ing | | | | | | Net gains/ losses from other financial instru- ments at fair value through profit or loss | | | | | | Net gains/ losses from securities and invest-ments | | | | | | Net other operating income | | | | | | Total | | | | | | |
| | | | | | | | | | | | | | | | | | | | | | | | | | | | | | | | | | | |
| | | | | | | EUR in millions | | | | EUR in millions | | | | EUR in millions | | | | | | EUR in millions | | | | | | EUR in millions | | | | | | EUR in millions | | | | | | EUR in millions | | | | | | EUR in millions | | | | | | |
| | | | | | | | | | | | | | | | | | | | |
| Loans and receivables | | | | | | 8,654 | | | | –48 | | | | 110 | | | | | | –3,860 | | | | | | 0 | | | | | | 17 | | | | | | 0 | | | | | | 4,873 | | | | | | |
Held-to-maturity investments | | | | | | 3 | | | | 0 | | | | 0 | | | | | | 0 | | | | | | 0 | | | | | | 0 | | | | | | 0 | | | | | | 3 | | | | | | |
Other liabilities | | | | | | –8,119 | | | | 0 | | | | –30 | | | | | | 3,452 | | | | | | 0 | | | | | | 0 | | | | | | 105 | | | | | | –4,592 | | | | | | |
Available-for-sale financial assets | | | | | | 297 | | | | 0 | | | | 0 | | | | | | –136 | | | | | | 0 | | | | | | 8 | | | | | | 0 | | | | | | 169 | | | | | | |
Financial assets at fair value through profit or loss | | | | | | 42 | | | | 0 | | | | 16 | | | | | | 0 | | | | | | 126 | | | | | | 0 | | | | | | 0 | | | | | | 183 | | | | | | |
Financial liabilities at fair value through profit or loss | | | | | | –897 | | | | 0 | | | | –15 | | | | | | 0 | | | | | | 747 | | | | | | 0 | | | | | | 0 | | | | | | –166 | | | | | | |
Financial instruments classified as held for trading | | | | | | 1,306 | | | | 0 | | | | 0 | | | | | | 0 | | | | | | –620 | | | | | | 0 | | | | | | 0 | | | | | | 686 | | | | | | |
Derivatives used for hedge accounting | | | | | | 1,350 | | | | 0 | | | | 0 | | | | | | 719 | | | | | | 0 | | | | | | 0 | | | | | | 0 | | | | | | 2,069 | | | | | | |
Total | | | | | | 2,635 | | | | –48 | | | | 80 | | | | | | 175 | | | | | | 253 | | | | | | 25 | | | | | | 105 | | | | | | 3,225 | | | | | | |
117
KfW Financial Information 2016 Consolidated financial statements
(66) Balance sheet for financial instruments by measurement category
The following tables show the assets and liabilities from financial instruments included in the different balance sheet items presented by measurement category.
Financial assets by measurement category as of 31 December 2016
| | | | | | | | | | | | | | | | | | | | | | | | | | | | | | | | | | | | | | | | | | | | | | | | | | | | |
| | | | | | | | | | | | | | | | | | | | | | | | |
| | | | | | Loans and advances to banks | | | | | | Loans and advances to cus- tomers | | | | | | Risk pro-visions for lend-ing busi-ness | | | | | | Value adjust- ments from macro fair value hedge account-ing | | | | | | Derivati- ves used for hedge account-ing | | | | | | Other derivati- ves | | | | | | Secur-ities and invest-ments | | | | Assets (financial instruments) | | |
| | | | | | | | | | | | | | | | | | | | | | | | | | | | | | | | | | | | | | | | | | | | | | | | | | | | |
| | | | | | | EUR in millions | | | | | | EUR in millions | | | | | | EUR in millions | | | | | | EUR in millions | | | | | | EUR in millions | | | | | | EUR in millions | | | | | | EUR in millions | | | | EUR in millions | | | | in% | | |
| | | | | | | | | | | | | | | | | | | | | | | | | | |
| Loans and receivables | | | | | | 275,916 | | | | | | 136,704 | | | | | | –1,610 | | | | | | 13,917 | | | | | | 0 | | | | | | 0 | | | | | | 6,435 | | | | 431,362 | | | | 87.6 | | |
Held-to-maturity investments | | | | | | 0 | | | | | | 0 | | | | | | 0 | | | | | | 0 | | | | | | 0 | | | | | | 0 | | | | | | 3,029 | | | | 3,029 | | | | 0.6 | | |
Available-for-sale financial assets | | | | | | 0 | | | | | | 0 | | | | | | 0 | | | | | | 0 | | | | | | 0 | | | | | | 0 | | | | | | 21,267 | | | | 21,267 | | | | 4.3 | | |
Financial assets at fair value through profit or loss | | | | | | 6 | | | | | | 0 | | | | | | 0 | | | | | | 0 | | | | | | 0 | | | | | | 0 | | | | | | 1,983 | | | | 1,990 | | | | 0.4 | | |
Financial assets classified as held for trading | | | | | | 0 | | | | | | 0 | | | | | | 0 | | | | | | 0 | | | | | | 0 | | | | | | 7,344 | | | | | | 0 | | | | 7,344 | | | | 1.5 | | |
Derivatives used for hedge accounting | | | | | | 0 | | | | | | 0 | | | | | | 0 | | | | | | 0 | | | | | | 27,464 | | | | | | 0 | | | | | | 0 | | | | 27,464 | | | | 5.6 | | |
Total | | | | | | 275,922 | | | | | | 136,704 | | | | | | –1,610 | | | | | | 13,917 | | | | | | 27,464 | | | | | | 7,344 | | | | | | 32,715 | | | | 492,456 | | | | 100.0 | | |
118
KfW Financial Information 2016 Consolidated financial statements
Financial liabilities by measurement category as of 31 December 2016
| | | | | | | | | | | | | | | | | | | | | | | | | | | | | | | | | | | | | | | | | | |
| | | | Liabili- ties to banks | | | | Liabili- ties to custom- ers | | | | Certifi- cated liabilities | | | | Value adjust- ments from macro fair value hedge account- ing | | | | Derivati- ves used for hedge account- ing | | | | Other derivati- ves | | | | Other liabilities | | | | Sub- ordinated liabilities | | | | Liabilities (finan- cial instruments) |
| | | | | | | | | | | | | | | | | | | | | | | | | | | | | | | | | | | | | | | | | | |
| | | | | EUR in millions | | | | EUR in millions | | | | EUR in millions | | | | EUR in millions | | | | EUR in millions | | | | EUR in millions | | | | EUR in millions | | | | EUR in millions | | | | EUR in millions | | | | in% | | |
| | | | | | | | | | | | | | | | | | | | | |
| Other financial liabilities | | | | 19,541 | | | | 9,807 | | | | 408,173 | | | | 127 | | | | 0 | | | | 0 | | | | 4 | | | | 200 | | | | 437,852 | | | | 92.0 | | |
Financial liabilities at fair value through profit or loss | | | | 297 | | | | 1,828 | | | | 14,401 | | | | 0 | | | | 0 | | | | 0 | | | | 0 | | | | 0 | | | | 16,525 | | | | 3.5 | | |
Financial liabilities classified as held for trading | | | | 0 | | | | 0 | | | | 0 | | | | 0 | | | | 0 | | | | 3,007 | | | | 0 | | | | 0 | | | | 3,007 | | | | 0.6 | | |
Derivatives used for hedge accounting | | | | 0 | | | | 0 | | | | 0 | | | | 0 | | | | 18,451 | | | | 0 | | | | 0 | | | | 0 | | | | 18,451 | | | | 3.9 | | |
Total | | | | 19,837 | | | | 11,634 | | | | 422,574 | | | | 127 | | | | 18,451 | | | | 3,007 | | | | 4 | | | | 200 | | | | 475,834 | | | | 100.0 | | |
119
KfW Financial Information 2016 Consolidated financial statements
Financial assets by measurement category as of 31 December 2015
| | | | | | | | | | | | | | | | | | | | | | | | | | | | | | | | | | | | | | | | | | | | | | | | | | | | | | | | | | | | | | | | | | | | |
| | | | | | | | Loans and advances to banks | | | | | | Loans and advances to custo- mers | | | | | | Risk pro- visions for lend- ing busi- ness | | | | | | Value adjust- ments from macro fair value hedge account- ing | | | | | | Derivati- ves used for hedge account- ing | | | | | | Other derivati- ves | | | | | | Secur- ities and invest- ments | | | | | | | | Assets (financial instruments) | | |
| | | | | | | | EUR in millions | | | | | | EUR in millions | | | | | | EUR in millions | | | | | | EUR in millions | | | | | | EUR in millions | | | | | | EUR in millions | | | | | | EUR in millions | | | | | | | | EUR in millions | | | | in% | | |
| | | | | | | | | | | | | | | | | | | | |
Loans and receivables | | | | | | | 277,039 | | | | | | 134,680 | | | | | | –1,743 | | | | | | 14,420 | | | | | | 0 | | | | | | 0 | | | | | | 6,521 | | | | | | | | 430,917 | | | | 86.2 | | |
Held-to-maturity investments | | | | | | | 0 | | | | | | 0 | | | | | | 0 | | | | | | 0 | | | | | | 0 | | | | | | 0 | | | | | | 3,954 | | | | | | | | 3,954 | | | | 0.8 | | |
Available-for-sale financial assets | | | | | | | 0 | | | | | | 0 | | | | | | 0 | | | | | | 0 | | | | | | 0 | | | | | | 0 | | | | | | 19,315 | | | | | | | | 19,315 | | | | 3.9 | | |
Financial assets at fair value through profit or loss | | | | | | | 10 | | | | | | 0 | | | | | | 0 | | | | | | 0 | | | | | | 0 | | | | | | 0 | | | | | | 1,845 | | | | | | | | 1,855 | | | | 0.4 | | |
Financial assets classified as held for trading | | | | | | | 0 | | | | | | 28 | | | | | | 0 | | | | | | 0 | | | | | | 0 | | | | | | 9,014 | | | | | | 0 | | | | | | | | 9,042 | | | | 1.8 | | |
Derivatives used for hedge accounting | | | | | | | 0 | | | | | | 0 | | | | | | 0 | | | | | | 0 | | | | | | 34,641 | | | | | | 0 | | | | | | 0 | | | | | | | | 34,641 | | | | 6.9 | | |
Total | | | | | | | | | | | | | | | | | | 277,050 | | | | | | 134,708 | | | | | | –1,743 | | | | | | 14,420 | | | | | | 34,641 | | | | | | 9,014 | | | | | | 31,634 | | | | | | | | 499,725 | | | | 100.0 | | |
Financial liabilities by measurement category as of 31 December 2015 |
| | | | | | | | | | |
| Liabili-
ties to
banks |
| | | | | | Liabili- ties to custo- mers | | | | | | Certi- ficated liabilities | | | | | | Value adjust- ments from macro fair value hedge account- ing | | | | | | Derivati- ves used for hedge account- ing | | | | | | Other derivati- ves | | | | | | Other liabilities | | | | | | Sub- ordinated liabilities | | | | | | | | Liabilities (finan- cial instruments) | | |
| | | | | | | | | | |
| EUR in
millions |
| | | | | | EUR in millions | | | | | | EUR in millions | | | | | | EUR in millions | | | | | | EUR in millions | | | | | | EUR in millions | | | | | | EUR in millions | | | | | | EUR in millions | | | | | | | | EUR in millions | | | | in% | | |
| | | | | | | | | | | | | | | | | | | | | | | |
Other financial liabilities | | | | | | | | | | | 23,748 | | | | | | | 7,457 | | | | | | 399,303 | | | | | | 132 | | | | | | 0 | | | | | | 0 | | | | | | 11 | | | | | | 300 | | | | | | | | 430,951 | | | | 91.0 | | |
Financial liabilities at fair value through profit or loss | | | | | | | | | | | 255 | | | | | | | 2,167 | | | | | | 15,897 | | | | | | 0 | | | | | | 0 | | | | | | 0 | | | | | | 0 | | | | | | 0 | | | | | | | | 18,320 | | | | 3.9 | | |
Financial liabilities classified as held for trading | | | | | | | | | | | 0 | | | | | | | 0 | | | | | | 0 | | | | | | 0 | | | | | | 0 | | | | | | 2,626 | | | | | | 0 | | | | | | 0 | | | | | | | | 2,626 | | | | 0.6 | | |
Derivatives used for hedge accounting | | | | | | | | | | | 0 | | | | | | | 0 | | | | | | 0 | | | | | | 0 | | | | | | 21,892 | | | | | | 0 | | | | | | 0 | | | | | | 0 | | | | | | | | 21,892 | | | | 4.6 | | |
Total | | | | | | | | | | | 24,004 | | | | | | | 9,624 | | | | | | 415,200 | | | | | | 132 | | | | | | 21,892 | | | | | | 2,626 | | | | | | 11 | | | | | | 300 | | | | | | | | 473,790 | | | | 100.0 | | |
120
KfW Financial Information 2016 Consolidated financial statements
(67) Disclosures on the reclassification of financial assets
In 2008 and with retrospective effect from 1 July 2008, KfW Group reclassified bonds and other fixed-income securities recognised in Securities and investments (floating interest asset-backed securities) with a volume of EUR 2,750 million (fair value as of the date of reclassification) from the available-for-sale financial assets measurement category to the loans and receivables measurement category.
The following table shows the carrying amounts of the reclassified financial assets and their fair values:
| | | | | | | | | | | | | | | | | | | | | | |
| | | | | | | 31 Dec. 2016 | | | | | | | | | | | | | | 31 Dec. 2015 | | |
| | | | | | | EUR in millions | | | | | | | | | | | | | | EUR in millions | | |
| | | | | | | | |
Carrying amount (statement of financial position) | | | | | | 204 | | | | | | | | | | | | | | 291 | | |
Fair value | | | | | | 205 | | | | | | | | | | | | | | 288 | | |
For the reclassified financial assets, a change of EUR 2 million (2015: EUR –11 million) in fair value would have been recorded directly in equity under Revaluation reserves. No Net gains/losses from securities and investments would have been recorded (2015: EUR 1 million).
Net gains/losses from securities and investments include reversals of impairment losses and impairments on reclassified financial assets totalling EUR 0 million (2015: EUR 1 million); as in the financial year 2015, no realised gains and losses were recorded. Interest income from the reclassified securities is still recognised in the same manner.
In 2009, in accordance with a prospective resolution taking effect on 17 February 2009, bonds and other fixed-income securities recognised in Securities and investments (which serve to maintain liquidity through the use of repo transactions or open market transactions of the European Central Bank) with a volume of EUR 18,170 million (fair value as of the date of reclassification) were reclassified from the available-for-sale financial assets measurement category to the loans and receivables measurement category.
The following table shows the carrying amounts of the reclassified financial assets and their fair values:
| | | | | | | | | | | | | | | | | | | | | | |
| | | | | | | 31 Dec. 2016 | | | | | | | | | | | | | | 31 Dec. 2015 | | |
| | | | | | | EUR in millions | | | | | | | | | | | | | | EUR in millions | | |
| | | | | | | | |
Carrying amount (statement of financial position) | | | | | | 870 | | | | | | | | | | | | | | 1,582 | | |
Fair value | | | | | | 874 | | | | | | | | | | | | | | 1,591 | | |
121
KfW Financial Information 2016 Consolidated financial statements
For the reclassified financial assets, a change of EUR –36 million (2015: EUR –26 million) in fair value would have been recorded directly in equity under Revaluation reserves. Net gains/losses from securities and investments of EUR 0 million (2015: EUR 0 million) would also have been recorded.
Net gains/losses from securities and investments include reversals of impairment losses and impairment charges taken on reclassified financial assets totalling EUR 1 million (2015: EUR 8 million); realised gains and losses of EUR 0 million were recorded (2015: EUR 0 million). Interest income from the reclassified securities is still recognised in the same manner.
(68) Fair values of financial instruments
In the following tables, the fair values of financial instruments are compared with their carrying amounts. The fair value of the additional balances with central banks recognised in Cash reserves is their carrying amount. Existing Risk provisions for lending business are deducted from the carrying amounts of Loans and advances to banks and customers. The carrying amount of the Subordinated liabilities comprises pro rata interest and value adjustments from micro fair value hedge accounting reported in the Other liabilities line item.
Fair values of financial instruments as of 31 December 2016
| | | | | | | | | | | | | | | | | | | | | | | | | | | | |
| | | | | | | Fair value | | | | | | | | | | Carrying amount (state- ment of finan- cial position) | | | | | | | | | | Difference | | |
| | | | | | | EUR in millions | | | | | | | | | | EUR in millions | | | | | | | | | | EUR in millions | | |
Loans and advances to banks | | | | | | 290,070 | | | | | | | | | | 275,752 | | | | | | | | | | 14,318 | | |
Loans and advances to customers | | | | | | 138,198 | | | | | | | | | | 135,265 | | | | | | | | | | 2,933 | | |
Value adjustments from macro fair value hedge accounting | | | | | | 0 | | | | | | | | | | 13,917 | | | | | | | | | | –13,917 | | |
Derivatives used for hedge accounting | | | | | | 27,464 | | | | | | | | | | 27,464 | | | | | | | | | | 0 | | |
Other derivatives | | | | | | 7,344 | | | | | | | | | | 7,344 | | | | | | | | | | 0 | | |
Securities and investments | | | | | | 32,770 | | | | | | | | | | 32,715 | | | | | | | | | | 56 | | |
Assets | | | | | | 495,846 | | | | | | | | | | 492,456 | | | | | | | | | | 3,390 | | |
Liabilities to banks | | | | | | 19,998 | | | | | | | | | | 19,837 | | | | | | | | | | 161 | | |
Liabilities to customers | | | | | | 11,839 | | | | | | | | | | 11,634 | | | | | | | | | | 205 | | |
Certificated liabilities | | | | | | 426,854 | | | | | | | | | | 422,574 | | | | | | | | | | 4,280 | | |
Value adjustments from macro fair value hedge accounting | | | | | | 0 | | | | | | | | | | 127 | | | | | | | | | | –127 | | |
Derivatives used for hedge accounting | | | | | | 18,451 | | | | | | | | | | 18,451 | | | | | | | | | | 0 | | |
Other derivatives | | | | | | 3,007 | | | | | | | | | | 3,007 | | | | | | | | | | 0 | | |
Subordinated liabilities | | | | | | 208 | | | | | | | | | | 204 | | | | | | | | | | 4 | | |
Liabilities | | | | | | 480,356 | | | | | | | | | | 475,834 | | | | | | | | | | 4,522 | | |
122
KfW Financial Information 2016 Consolidated financial statements
Interest-related changes in value are also included in measuring the fair value of the financial instruments. Accordingly, when the comparison is made with the carrying amount, it is necessary to take into account the changes in value (interest-related) resulting from the recognition of Loans and advances and borrowings in macro fair value hedge accounting.
Equity instruments included in Securities and investments, for which the fair value could not be reliably determined, are measured at cost less impairment losses in the amount of EUR 825 million (31 Dec. 2015: EUR 796 million); disposal in the subsequent year is possible on a case-by-case basis.
Fair values of financial instruments as of 31 December 2015
| | | | | | | | | | | | | | | | | | | | | | | | | | | | |
| | | | | | | Fair value | | | | | | | | | | Carrying amount (state- ment of finan- cial position) | | | | | | | | | | Difference | | |
| | | | �� | | | EUR in millions | | | | | | | | | | EUR in millions | | | | | | | | | | EUR in millions | | |
Loans and advances to banks | | | | | | 290,643 | | | | | | | | | | 276,880 | | | | | | | | | | 13,763 | | |
Loans and advances to customers | | | | | | 135,954 | | | | | | | | | | 133,135 | | | | | | | | | | 2,820 | | |
Value adjustments from macro fair value hedge accounting | | | | | | 0 | | | | | | | | | | 14,420 | | | | | | | | | | –14,420 | | |
Derivatives used for hedge accounting | | | | | | 34,641 | | | | | | | | | | 34,641 | | | | | | | | | | 0 | | |
Other derivatives | | | | | | 9,014 | | | | | | | | | | 9,014 | | | | | | | | | | 0 | | |
Securities and investments | | | | | | 31,654 | | | | | | | | | | 31,634 | | | | | | | | | | 20 | | |
Assets | | | | | | 501,907 | | | | | | | | | | 499,725 | | | | | | | | | | 2,182 | | |
Liabilities to banks | | | | | | 24,187 | | | | | | | | | | 24,004 | | | | | | | | | | 183 | | |
Liabilities to customers | | | | | | 9,087 | | | | | | | | | | 9,624 | | | | | | | | | | –537 | | |
Certificated liabilities | | | | | | 418,227 | | | | | | | | | | 415,200 | | | | | | | | | | 3,027 | | |
Value adjustments from macro fair value hedge accounting | | | | | | 0 | | | | | | | | | | 132 | | | | | | | | | | –132 | | |
Derivatives used for hedge accounting | | | | | | 21,892 | | | | | | | | | | 21,892 | | | | | | | | | | 0 | | |
Other derivatives | | | | | | 2,626 | | | | | | | | | | 2,626 | | | | | | | | | | 0 | | |
Subordinated liabilities | | | | | | 312 | | | | | | | | | | 311 | | | | | | | | | | 1 | | |
Liabilities | | | | | | 476,331 | | | | | | | | | | 473,790 | | | | | | | | | | 2,542 | | |
(69) Disclosures on methods used to measure financial instruments at fair value
The following tables show the financial instruments measured at fair value or for which the fair value is indicated in the Notes according to the valuation methods used.
Financial instruments measured at fair value are allocated to the following valuation methods:
Financial instruments allocated to the “Quoted market price” level are primarily bonds and other fixed-income securities recognised in Securities and investments, as well as the majority of borrowings accounted for under the fair value option, for which prices from an active market are available.
123
KfW Financial Information 2016 Consolidated financial statements
Fair value measurement of OTC derivatives as well as borrowings accounted for under the fair value option for which no prices from an active market are available is largely performed using valuation models with inputs that are observable in the market and are also usually the only relevant inputs, resulting in allocation to the “Valuation method based on observable market data (model)” level.
The “Valuation method based in part on market unobservable data” level largely comprises derivatives recognised in Other derivatives with positive or negative fair values, which comprise a hedging instrument for customers with respect to export and project financing business, as well as Securities and investments from equity finance business recorded at fair value through profit or loss, which are not listed or for which prices cannot be derived from similar financial instruments listed on an exchange. This level also comprises, to a small extent, borrowings accounted for under the fair value option, whose fair value is based in part on market unobservable data.
Equity instruments included in Securities and investments – available-for-sale, for which the fair value could not be reliably determined, are also allocated to the “Valuation method based in part on market unobservable data” level.
Financial instruments carried at amortised cost, for which the fair value is indicated in the Notes, are allocated to the valuation methods used as follows:
The lending business presented under Loans and advances to banks and Loans and advances to customers is allocated to “Valuation method based in part on market unobservable data”. The measurement of fair value using the discounted cash flow method is based to a significant extent on market unobservable data (expected loss, etc.).
The majority of bonds and other fixed-income securities reported under Certificated liabilities are allocated to the “Quoted market price” level or – if there is no active market – the “Valuation method based on observable market data (model)” level. These include in particular KfW’s large volume and highly liquid benchmark bonds denominated in euros and US dollars as well as other public bonds.
In subsequent measurement at fair value in line with the applicable hierarchy, changes of valuation method used are deemed to have been made as of the end of the financial year because no specific event (and therefore no specific date) can generally be identified that caused the change of valuation method used.
124
KfW Financial Information 2016 Consolidated financial statements
Financial assets measured at fair value or for which the fair value is indicated in the Notes,
as of 31 December 2016
| | | | | | | | | | | | | | | | | | | | | | | | | | |
| | | | | | | Quoted market price | | | | | | Valuation method based on observable market data (model) | | | | | | Valuation method based in part on market unob- servable data | | | | | | Total | | |
| | | | | | | EUR in millions | | | | | | EUR in millions | | | | | | EUR in millions | | | | | | EUR in millions | | |
Financial assets measured at fair value | | | | | | | | | | | | | | | | | | | | | | | | | | |
Loans and advances to banks – recorded at fair value through profit or loss | | | | | | 0 | | | | | | 6 | | | | | | 0 | | | | | | 6 | | |
Loans and advances to customers – classified as held for trading | | | | | | 0 | | | | | | 0 | | | | | | 0 | | | | | | 0 | | |
Derivatives used for hedge accounting | | | | | | 0 | | | | | | 27,464 | | | | | | 0 | | | | | | 27,464 | | |
Other derivatives | | | | | | 0 | | | | | | 6,480 | | | | | | 864 | | | | | | 7,344 | | |
Securities and investments – available for sale | | | | | | 19,995 | | | | | | 446 | | | | | | 825 | | | | | | 21,267 | | |
Securities and investments – recorded at fair value through profit or loss | | | | | | 201 | | | | | | 1,350 | | | | | | 432 | | | | | | 1,983 | | |
Subtotal of financial assets measured at fair value | | | | | | 20,196 | | | | | | 35,746 | | | | | | 2,123 | | | | | | 58,064 | | |
Fair values of financial assets carried at amortised cost | | | | | | | | | | | | | | | | | | | | | | | | | | |
Loans and advances to banks – loans and receivables | | | | | | 0 | | | | | | 23,662 | | | | | | 266,402 | | | | | | 290,064 | | |
Loans and advances to customers – loans and receivables | | | | | | 0 | | | | | | 9,891 | | | | | | 128,307 | | | | | | 138,198 | | |
Securities and investments – loans and receivables | | | | | | 980 | | | | | | 5,406 | | | | | | 92 | | | | | | 6,477 | | |
Securities and investments – held-to-maturity investments | | | | | | 2,304 | | | | | | 739 | | | | | | 0 | | | | | | 3,043 | | |
Subtotal of fair values of financial assets carried at amortised cost | | | | | | 3,284 | | | | | | 39,697 | | | | | | 394,801 | | | | | | 437,782 | | |
Total | | | | | | 23,480 | | | | | | 75,443 | | | | | | 396,923 | | | | | | 495,846 | | |
125
KfW Financial Information 2016 Consolidated financial statements
Financial liabilities measured at fair value or for which the fair value is indicated in the Notes,
as of 31 December 2016
| | | | | | | | | | | | | | | | | | | | | | | | | | |
| | | | | | | | | | | | | |
| | | | | | Quoted market
price | | | | | | Valuation
method based
on observable
market data
(model) | | | | | | Valuation
method based
in part on
market unob-
servable data | | | | | | Total | | |
| | | | | | EUR in millions | | | | | | EUR in millions | | | | | | EUR in millions | | | | | | EUR in millions | | |
Financial liabilities measured at fair value | | | | | | | | | | | | | | | | | | | | | | | | | | |
Liabilities to banks – recorded at fair value through profit or loss | | | | | | 0 | | | | | | 296 | | | | | | 0 | | | | | | 297 | | |
Liabilities to customers – recorded at fair value through profit or loss | | | | | | 0 | | | | | | 1,796 | | | | | | 32 | | | | | | 1,828 | | |
Certificated liabilities – recorded at fair value through profit or loss | | | | | | 9,994 | | | | | | 4,292 | | | | | | 114 | | | | | | 14,401 | | |
Derivatives used for hedge accounting | | | | | | 0 | | | | | | 18,448 | | | | | | 3 | | | | | | 18,451 | | |
Other derivatives | | | | | | 0 | | | | | | 2,917 | | | | | | 90 | | | | | | 3,007 | | |
Subtotal of financial liabilities measured at fair value | | | | | | 9,994 | | | | | | 27,748 | | | | | | 240 | | | | | | 37,982 | | |
Fair values of financial liabilities carried at amortised cost | | | | | | | | | | | | | | | | | | | | | | | | | | |
Liabilities to banks – other liabilities | | | | | | 0 | | | | | | 19,017 | | | | | | 684 | | | | | | 19,701 | | |
Liabilities to customers – other liabilities | | | | | | 0 | | | | | | 7,124 | | | | | | 2,888 | | | | | | 10,011 | | |
Certificated liabilities – other liabilities | | | | | | 349,869 | | | | | | 62,580 | | | | | | 5 | | | | | | 412,453 | | |
Subordinated liabilities – other liabilities | | | | | | 0 | | | | | | 208 | | | | | | 0 | | | | | | 208 | | |
Subtotal of fair values of financial liabilities carried at amortised cost | | | | | | 349,869 | | | | | | 88,928 | | | | | | 3,576 | | | | | | 442,374 | | |
Total | | | | | | 359,863 | | | | | | 116,677 | | | | | | 3,816 | | | | | | 480,356 | | |
126
KfW Financial Information 2016 Consolidated financial statements
Financial assets measured at fair value or for which the fair value is indicated in the Notes,
as of 31 December 2015
| | | | | | | | | | | | | | | | | | | | | | | | |
| | | | | | | | | |
| | | | Quoted market
price | | | | | Valuation
method based
on observable
market data
(model) | | | | | Valuation
method based in part on
market unob- servable data | | | | | Total | | |
| | | | EUR in millions | | | | | EUR in millions | | | | | EUR in millions | | | | | EUR in millions | | |
Financial assets measured at fair value | | | | | | | | | | | | | | | | | | | | | | | | |
Loans and advances to banks – recorded at fair value through profit or loss | | | | 0 | | | | | | 7 | | | | | | 4 | | | | | | 10 | | |
Loans and advances to customers – classified as held for trading | | | | 0 | | | | | | 0 | | | | | | 28 | | | | | | 28 | | |
Derivatives used for hedge accounting | | | | 0 | | | | | | 34,641 | | | | | | 0 | | | | | | 34,641 | | |
Other derivatives | | | | 0 | | | | | | 8,232 | | | | | | 782 | | | | | | 9,014 | | |
Securities and investments – available for sale | | | | 17,202 | | | | | | 1,316 | | | | | | 796 | | | | | | 19,315 | | |
Securities and investments – recorded at fair value through profit or loss | | | | 87 | | | | | | 1,283 | | | | | | 475 | | | | | | 1,845 | | |
Subtotal of financial assets measured at fair value | | | | 17,289 | | | | | | 45,479 | | | | | | 2,086 | | | | | | 64,854 | | |
Fair values of financial assets carried at amortised cost | | | | | | | | | | | | | | | | | | | | | | | | |
Loans and advances to banks – loans and receivables | | | | 0 | | | | | | 27,957 | | | | | | 262,676 | | | | | | 290,632 | | |
Loans and advances to customers – loans and receivables | | | | 0 | | | | | | 12,129 | | | | | | 123,797 | | | | | | 135,926 | | |
Securities and investments – loans and receivables | | | | 1,810 | | | | | | 4,623 | | | | | | 109 | | | | | | 6,542 | | |
Securities and investments – held-to-maturity investments | | | | 3,558 | | | | | | 395 | | | | | | 0 | | | | | | 3,952 | | |
Subtotal of fair values of financial assets carried at amortised cost | | | | 5,368 | | | | | | 45,103 | | | | | | 386,582 | | | | | | 437,053 | | |
Total | | | | 22,657 | | | | | | 90,582 | | | | | | 388,668 | | | | | | 501,907 | | |
127
KfW Financial Information 2016 Consolidated financial statements
Financial liabilities measured at fair value or for which the fair value is indicated in the Notes,
as of 31 December 2015
| | | | | | | | | | | | | | | | | | | | | | | | | | |
| | | | | Quoted market
price | | | | | Valuation
method based
on observable
market data
(model) | | | | | Valuation
method based in part on market unob- servable data | | | | | Total | | |
| | | | | EUR in millions | | | | | EUR in millions | | | | | EUR in millions | | | | | EUR in millions | | |
Financial liabilities measured at fair value | | | | | | | | | | | | | | | | | | | | | | | | | | |
Liabilities to banks – recorded at fair value through profit or loss | | | | | | 0 | | | | | | 252 | | | | | | 4 | | | | | | 255 | | |
Liabilities to customers – recorded at fair value through profit or loss | | | | | | 0 | | | | | | 2,109 | | | | | | 58 | | | | | | 2,167 | | |
Certificated liabilities – recorded at fair value through profit or loss | | | | | | 56 | | | | | | 15,836 | | | | | | 5 | | | | | | 15,897 | | |
Derivatives used for hedge accounting | | | | | | 0 | | | | | | 21,891 | | | | | | 2 | | | | | | 21,892 | | |
Other derivatives | | | | | | 0 | | | | | | 2,612 | | | | | | 15 | | | | | | 2,626 | | |
Subtotal of financial liabilities measured at fair value | | | | | | 56 | | | | | | 42,699 | | | | | | 84 | | | | | | 42,838 | | |
Fair values of financial liabilities carried at amortised cost | | | | | | | | | | | | | | | | | | | | | | | | | | |
Liabilities to banks – other liabilities | | | | | | 0 | | | | | | 22,585 | | | | | | 1,346 | | | | | | 23,932 | | |
Liabilities to customers – other liabilities | | | | | | 0 | | | | | | 4,570 | | | | | | 2,349 | | | | | | 6,920 | | |
Certificated liabilities – other liabilities | | | | | | 222,529 | | | | | | 179,801 | | | | | | 0 | | | | | | 402,330 | | |
Subordinated liabilities – other liabilities | | | | | | 0 | | | | | | 312 | | | | | | 0 | | | | | | 312 | | |
Subtotal of fair values of financial liabilities carried at amortised cost | | | | | | 222,529 | | | | | | 207,269 | | | | | | 3,695 | | | | | | 433,493 | | |
Total | | | | | | 222,585 | | | | | | 249,968 | | | | | | 3,779 | | | | | | 476,331 | | |
Change of valuation method used for financial assets measured at fair value with a transfer between the “Quoted market price” and “Valuation method based on observable market data (model)” levels in the financial year 2016
| | | | | | | | | | | | | | |
| | | | | | | Transfers from “Quoted market price” to “Valuation method based on observable market data (model)” | | | | | | Transfers from “Valuation method based on observable market data (model)” to “Quoted market price” | | |
| | | | | | | EUR in millions | | | | | | EUR in millions | | |
Securities and investments – available for sale | | | | | | 70 | | | | | | 1,002 | | |
Securities and investments – recorded at fair value through profit or loss | | | | | | 62 | | | | | | 133 | | |
The transfers within Securities and investments are a result of changes in market activity as of the reporting date.
128
KfW Financial Information 2016 Consolidated financial statements
Change of valuation method used for financial liabilities measured at fair value with a transfer between the “Quoted market price” and “Valuation method based on observable market data (model)” levels in the financial year 2016
| | | | | | | | | | | | | | |
| | | | | | | Transfers from “Quoted market price” to “Valuation method based on observable market data (model)” | | | | | | Transfers from “Valuation method based on observable market data (model)” to “Quoted market price” | | |
| | | | | | | EUR in millions | | | | | | EUR in millions | | |
Certificated liabilities – recorded at fair value through profit or loss | | | | | | 0 | | | | | | 9,913 | | |
Change of valuation method used for financial assets measured at fair value with a transfer between the “Quoted market price” and “Valuation method based on observable market data (model)” levels in the financial year 2015
| | | | | | | | | | | | | | |
| | | | | | | Transfers from “Quoted market price” to “Valuation method based on observable market data (model)” | | | | | | Transfers from “Valuation method based on observable market data (model)” to “Quoted market price” | | |
| | | | | | | EUR in millions | | | | | | EUR in millions | | |
Securities and investments – available for sale | | | | | | 591 | | | | | | 21 | | |
Securities and investments – recorded at fair value through profit or loss | | | | | | 109 | | | | | | 0 | | |
Change of valuation method used for financial liabilities measured at fair value with a transfer between the “Quoted market price” and “Valuation method based on observable market data (model)” levels in the financial year 2015
| | | | | | | | | | | | | | |
| | | | | | | Transfers from “Quoted market price” to “Valuation method based on observable market data (model)” | | | | | | Transfers from “Valuation method based on observable market data (model)” to “Quoted market price” | | |
| | | | | | | EUR in millions | | | | | | EUR in millions | | |
Certificated liabilities – recorded at fair value through profit or loss | | | | | | 654 | | | | | | 0 | | |
129
KfW Financial Information 2016 Consolidated financial statements
Development of financial assets measured at fair value in the financial year 2016, using valuation methods based in part
| | | | | | | | | | | | | | | | | | | | | | | | | | | | | | | | | | |
| | | | | | | | | | | | | |
| | | | | | | Loans and advances to banks – recorded at fair value through profit or loss | | | | | | | Loans and advances
to banks – classified as held for trading | | | | | | | Loans and advances to customers – recorded at fair value through profit or loss | | | | | | | Loans and advances to customers – classified as held for trading | | |
| | | | | | | EUR in millions | | | | | | | EUR in millions | | | | | | | EUR in millions | | | | | | | EUR in millions | | |
| | | | | | | | | | | | | |
As of 1 Jan. 2016 | | | | | | | | 4 | | | | | | | | 0 | | | | | | | | 0 | | | | | | | | 29 | | |
A. Changes recognised in the income statement | | | | | | | | | | | | | | | | | | | | | | | | | | | | | | | | | | |
Net interest and commission income | | | | | | | | –2 | | | | | | | | 0 | | | | | | | | 0 | | | | | | | | 0 | | |
Contracts still valid at year-end | | | | | | | | –2 | | | | | | | | 0 | | | | | | | | 0 | | | | | | | | 0 | | |
Net gains/losses from hedge accounting | | | | | | | | 0 | | | | | | | | 0 | | | | | | | | 0 | | | | | | | | 0 | | |
Contracts still valid at year-end | | | | | | | | 0 | | | | | | | | 0 | | | | | | | | 0 | | | | | | | | 0 | | |
| | | | | | | | | | | | | |
Net gains/losses from other financial instruments at fair value through profit or loss | | | | | | | | –2 | | | | | | | | 0 | | | | | | | | 0 | | | | | | | | 0 | | |
Contracts still valid at year-end | | | | | | | | –2 | | | | | | | | 0 | | | | | | | | 0 | | | | | | | | 0 | | |
Net gains/losses from securities and investments | | | | | | | | 0 | | | | | | | | 0 | | | | | | | | 0 | | | | | | | | 0 | | |
Contracts still valid at year-end | | | | | | | | 0 | | | | | | | | 0 | | | | | | | | 0 | | | | | | | | 0 | | |
Change in revaluation reserves | | | | | | | | 0 | | | | | | | | 0 | | | | | | | | 0 | | | | | | | | 0 | | |
Contracts still valid at year-end | | | | | | | | 0 | | | | | | | | 0 | | | | | | | | 0 | | | | | | | | 0 | | |
Total changes recognised in the income statement | | | | | | | | –4 | | | | | | | | 0 | | | | | | | | 0 | | | | | | | | 0 | | |
B. Changes recognised directly in equity | | | | | | | | | | | | | | | | | | | | | | | | | | | | | | | | | | |
Change of valuation method used | | | | | | | | 0 | | | | | | | | 0 | | | | | | | | 0 | | | | | | | | 0 | | |
Transfers from “Quoted market price” and “Valuation method based on observable market data (model)” | | | | | | | | 0 | | | | | | | | 0 | | | | | | | | 0 | | | | | | | | 0 | | |
Transfers to “Quoted market price” and “Valuation method based on observable market data (model)” | | | | | | | | 0 | | | | | | | | 0 | | | | | | | | 0 | | | | | | | | 0 | | |
Additions | | | | | | | | 0 | | | | | | | | 0 | | | | | | | | 0 | | | | | | | | 0 | | |
Disposals | | | | | | | | 0 | | | | | | | | 0 | | | | | | | | 0 | | | | | | | | –28 | | |
Total changes recognised directly in equity | | | | | | | | 0 | | | | | | | | 0 | | | | | | | | 0 | | | | | | | | –28 | | |
Changes in consolidated group | | | | | | | | 0 | | | | | | | | 0 | | | | | | | | 0 | | | | | | | | 0 | | |
Exchange rate changes | | | | | | | | 0 | | | | | | | | 0 | | | | | | | | 0 | | | | | | | | 0 | | |
Other changes | | | | | | | | 0 | | | | | | | | 0 | | | | | | | | 0 | | | | | | | | 0 | | |
As of 31 Dec. 2016 | | | | | | | | 0 | | | | | | | | 0 | | | | | | | | 0 | | | | | | | | 0 | | |
130
KfW Financial Information 2016 Consolidated financial statements
on market unobservable data
| | | | | | | | | | | | | | | | | | | | | | | | | | | | |
| | | | | | | | | | |
| | | Derivatives used for hedge accounting | | | | | Other derivatives | | | | | Securities and investments – available for sale | | | | | Securities and investments – recorded at fair value through profit or loss | | | | | Total | | |
| | | EUR in millions | | | | | EUR in millions | | | | | EUR in millions | | | | | EUR in millions | | | | | EUR in millions | | |
| | | | | | | | | | |
| | 0 | | | | | | 782 | | | | | | 796 | | | | | | 475 | | | | | | 2,086 | | |
| | | | | | | | | | | | | | | | | | | | | | | | | | | | |
| | 0 | | | | | | –4 | | | | | | 0 | | | | | | 0 | | | | | | –6 | | |
| | 0 | | | | | | –3 | | | | | | 0 | | | | | | 0 | | | | | | –5 | | |
| | 0 | | | | | | 0 | | | | | | 0 | | | | | | 0 | | | | | | 0 | | |
| | 0 | | | | | | 0 | | | | | | 0 | | | | | | 0 | | | | | | 0 | | |
| | | | | | | | | | |
| | 0 | | | | | | 122 | | | | | | 0 | | | | | | –20 | | | | | | 100 | | |
| | 0 | | | | | | 134 | | | | | | 0 | | | | | | –20 | | | | | | 112 | | |
| | | | | | | | | | |
| | 0 | | | | | | 0 | | | | | | –20 | | | | | | 0 | | | | | | –20 | | |
| | 0 | | | | | | 0 | | | | | | –140 | | | | | | 0 | | | | | | –140 | | |
| | 0 | | | | | | 0 | | | | | | 0 | | | | | | 0 | | | | | | 0 | | |
| | 0 | | | | | | 0 | | | | | | 0 | | | | | | 0 | | | | | | 0 | | |
| | | | | | | | | | |
| | 0 | | | | | | 118 | | | | | | –20 | | | | | | –20 | | | | | | 75 | | |
| | | | | | | | | | | | | | | | | | | | | | | | | | | | |
| | 0 | | | | | | 3 | | | | | | 0 | | | | | | –72 | | | | | | –68 | | |
| | | | | | | | | | |
| | 0 | | | | | | 3 | | | | | | 0 | | | | | | 28 | | | | | | 31 | | |
| | | | | | | | | | |
| | 0 | | | | | | 0 | | | | | | 0 | | | | | | –100 | | | | | | –100 | | |
| | 0 | | | | | | 0 | | | | | | 157 | | | | | | 33 | | | | | | 190 | | |
| | 0 | | | | | | –30 | | | | | | –109 | | | | | | –1 | | | | | | –169 | | |
| | | | | | | | | | |
| | 0 | | | | | | –27 | | | | | | 47 | | | | | | –40 | | | | | | –48 | | |
| | 0 | | | | | | 0 | | | | | | –9 | | | | | | 0 | | | | | | –9 | | |
| | 0 | | | | | | –35 | | | | | | 15 | | | | | | 18 | | | | | | –2 | | |
| | 0 | | | | | | 26 | | | | | | –5 | | | | | | 0 | | | | | | 21 | | |
| | | 0 | | | | | | 864 | | | | | | 825 | | | | | | 432 | | | | | | 2,123 | | |
131
KfW Financial Information 2016 Consolidated financial statements
Development of financial liabilities measured at fair value in the financial year 2016, using valuation methods based in
| | | | | | | | | | | | | | |
| | | | | | | |
| | | | | | Liabilities to banks –
recorded at fair value
through profit or loss | | | | | | Liabilities to customers –
recorded at fair value
through profit or loss | | |
| | | | | | EUR in millions | | | | | | EUR in millions | | |
| | | | | | | |
As of 1 Jan. 2016 | | | | | | 4 | | | | | | 58 | | |
A. Changes recognised in the income statement | | | | | | | | | | | | | | |
Net interest and commission income | | | | | | –4 | | | | | | 0 | | |
Contracts still valid at year-end | | | | | | –4 | | | | | | 0 | | |
Net gains/losses from hedge accounting | | | | | | 0 | | | | | | 0 | | |
Contracts still valid at year-end | | | | | | 0 | | | | | | 0 | | |
Net gains/losses from other financial instruments at fair value through profit or loss | | | | | | 1 | | | | | | –2 | | |
Contracts still valid at year-end | | | | | | 1 | | | | | | –2 | | |
Total changes recognised in the income statement | | | | | | –4 | | | | | | –2 | | |
B. Changes recognised directly in equity | | | | | | | | | | | | | | |
Change of valuation method used | | | | | | 0 | | | | | | 0 | | |
Transfers from “Quoted market price” and “Valuation method based on observable market data (model)” | | | | | | 0 | | | | | | 0 | | |
Transfers to “Quoted market price” and “Valuation method based on observable market data (model)” | | | | | | 0 | | | | | | 0 | | |
Additions | | | | | | 0 | | | | | | 0 | | |
Disposals | | | | | | 0 | | | | | | –25 | | |
Total changes recognised directly in equity | | | | | | 0 | | | | | | –25 | | |
Changes in consolidated group | | | | | | 0 | | | | | | 0 | | |
Exchange rate changes | | | | | | 0 | | | | | | 0 | | |
Other changes | | | | | | 0 | | | | | | 0 | | |
As of 31 Dec. 2016 | | | | | | 0 | | | | | | 32 | | |
132
KfW Financial Information 2016 Consolidated financial statements
part on market unobservable data
| | | | | | | | | | | | | | | | | | |
| | | | | | | | |
| | | Certificated liabilities –
recorded at fair value through
profit or loss | | | | Derivatives used for
hedge accounting | | | | Other derivatives | | | | Total | | | |
| | | EUR in millions | | | | EUR in millions | | | | EUR in millions | | | | EUR in millions | | | |
| | | | | | | | |
| | 5 | | | | 2 | | | | 15 | | | | 84 | | | | |
| | | | | | | | | | | | | | | | | | |
| | 0 | | | | 0 | | | | 0 | | | | –4 | | | | |
| | 0 | | | | 0 | | | | 0 | | | | –4 | | | | |
| | 0 | | | | 0 | | | | 0 | | | | 0 | | | | |
| | 0 | | | | 0 | | | | 0 | | | | 0 | | | | |
| | 0 | | | | 0 | | | | 22 | | | | 20 | | | | |
| | 0 | | | | 0 | | | | 22 | | | | 20 | | | | |
| | 0 | | | | 0 | | | | 22 | | | | 17 | | | | |
| | | | | | | | | | | | | | | | | | |
| | 109 | | | | 0 | | | | 23 | | | | 132 | | | | |
| | 109 | | | | 0 | | | | 24 | | | | 133 | | | | |
| | 0 | | | | 0 | | | | –1 | | | | –1 | | | | |
| | | | | | | | |
| | 0 | | | | 0 | | | | 0 | | | | 0 | | | | |
| | | | | | | | |
| | 0 | | | | 0 | | | | –8 | | | | –32 | | | | |
| | 109 | | | | 0 | | | | 16 | | | | 100 | | | | |
| | 0 | | | | 0 | | | | 0 | | | | 0 | | | | |
| | 1 | | | | 1 | | | | 12 | | | | 13 | | | | |
| | 0 | | | | 0 | | | | 26 | | | | 26 | | | | |
| | | 114 | | | | 3 | | | | 90 | | | | 240 | | | | |
133
KfW Financial Information 2016 Consolidated financial statements
Development of financial assets measured at fair value in the financial year 2015, using valuation methods based in part
| | | | | | | | | | | | | | | | | | | | | | | | | | |
| | | | | | | Loans and advances | | | | | | Loans and advances | | | | | | Loans and advances | | | | | | Loans and advances | | |
| | | | | | | to banks – recorded at | | | | | | to banks – classified | | | | | | to customers – | | | | | | to customers – | | |
| | | | | | | fair value through | | | | | | as held for trading | | | | | | recorded at fair value | | | | | | classified as held | | |
| | | | | | | profit or loss | | | | | | | | | | | | through profit or loss | | | | | | for trading | | |
| | | | | | | EUR in millions | | | | | | EUR in millions | | | | | | EUR in millions | | | | | | EUR in millions | | |
As of 1 Jan. 2015 | | | | | | 12 | | | | | | 0 | | | | | | 0 | | | | | | 0 | | |
A. Changes recognised in the income statement | | | | | | | | | | | | | | | | | | | | | | | | | | |
Net interest and commission income | | | | | | 0 | | | | | | 0 | | | | | | 0 | | | | | | 0 | | |
Contracts still valid at year-end | | | | | | 0 | | | | | | 0 | | | | | | 0 | | | | | | 0 | | |
Net gains/losses from hedge accounting | | | | | | 0 | | | | | | 0 | | | | | | 0 | | | | | | 0 | | |
Contracts still valid at year-end | | | | | | 0 | | | | | | 0 | | | | | | 0 | | | | | | 0 | | |
Net gains/losses from other financial instruments at fair value through profit or loss | | | | | | –8 | | | | | | 0 | | | | | | 0 | | | | | | 0 | | |
Contracts still valid at year-end | | | | | | –3 | | | | | | 0 | | | | | | 0 | | | | | | 0 | | |
Net gains/losses from securities and investments | | | | | | 0 | | | | | | 0 | | | | | | 0 | | | | | | 0 | | |
Contracts still valid at year-end | | | | | | 0 | | | | | | 0 | | | | | | 0 | | | | | | 0 | | |
Change in revaluation reserves | | | | | | 0 | | | | | | 0 | | | | | | 0 | | | | | | 0 | | |
Contracts still valid at year-end | | | | | | 0 | | | | | | 0 | | | | | | 0 | | | | | | 0 | | |
Total changes recognised in the income statement | | | | | | –8 | | | | | | 0 | | | | | | 0 | | | | | | 0 | | |
B. Changes recognised directly in equity | | | | | | | | | | | | | | | | | | | | | | | | | | |
Change of valuation method used | | | | | | 0 | | | | | | 0 | | | | | | 0 | | | | | | 0 | | |
Transfers from “Quoted market price” and “Valuation method based on observable market data (model)” | | | | | | 0 | | | | | | 0 | | | | | | 0 | | | | | | 0 | | |
Transfers to “Quoted market price” and “Valuation method based on observable market data (model)” | | | | | | 0 | | | | | | 0 | | | | | | 0 | | | | | | 0 | | |
Additions | | | | | | 0 | | | | | | 0 | | | | | | 0 | | | | | | 28 | | |
Disposals | | | | | | 0 | | | | | | 0 | | | | | | 0 | | | | | | 0 | | |
Total changes recognised directly in equity | | | | | | 0 | | | | | | 0 | | | | | | 0 | | | | | | 28 | | |
Changes in consolidated group | | | | | | 0 | | | | | | 0 | | | | | | 0 | | | | | | 0 | | |
Exchange rate changes | | | | | | 0 | | | | | | 0 | | | | | | 0 | | | | | | 0 | | |
Other changes | | | | | | 0 | | | | | | 0 | | | | | | 0 | | | | | | 0 | | |
As of 31 Dec. 2015 | | | | | | 4 | | | | | | 0 | | | | | | 0 | | | | | | 28 | | |
134
KfW Financial Information 2016 Consolidated financial statements
on market unobservable data
| | | | | | | | | | | | | | | | | | | | | | | | | | | | | | |
| | | | | | | | | | | | | | | | | | | | | | | | | | | | |
| | | | | | | | | | | | | | | | | | | | | | | | | | | | |
| | | Derivatives used for | | | | Other derivatives | | | | Securities and | | | | Securities and | | | | | | | Total | | | | | | |
| | | hedge accounting | | | | | | | | investments – | | | | investments – recorded | | | | | | | | | | | | | |
| | | | | | | | | | | available for sale | | | | at fair value through | | | | | | | | | | | | | |
| | | | | | | | | | | | | | | profit or loss | | | | | | | | | | | | | |
| | EUR in millions | | | | EUR in millions | | | | EUR in millions | | | | EUR in millions | | | | | | | | EUR in millions | | | | | | | | |
| | 0 | | | | 838 | | | | 783 | | | | 456 | | | | | | | | 2,090 | | | | | | | | |
| | | | | | | | | | | | | | | | | | | | | | | | | | | | | | |
| | 0 | | | | 1 | | | | 0 | | | | 0 | | | | | | | | 1 | | | | | | | | |
| | 0 | | | | 2 | | | | 0 | | | | 0 | | | | | | | | 2 | | | | | | | | |
| | 0 | | | | 0 | | | | 0 | | | | 0 | | | | | | | | 0 | | | | | | | | |
| | 0 | | | | 0 | | | | 0 | | | | 0 | | | | | | | | 0 | | | | | | | | |
| | 0 | | | | –31 | | | | 0 | | | | –4 | | | | | | | | –42 | | | | | | | | |
| | 0 | | | | –19 | | | | 0 | | | | –4 | | | | | | | | –26 | | | | | | | | |
| | 0 | | | | 0 | | | | 2 | | | | 0 | | | | | | | | 2 | | | | | | | | |
| | 0 | | | | 0 | | | | –19 | | | | 0 | | | | | | | | –19 | | | | | | | | |
| | 0 | | | | 0 | | | | 0 | | | | 0 | | | | | | | | 0 | | | | | | | | |
| | 0 | | | | 0 | | | | 0 | | | | 0 | | | | | | | | 0 | | | | | | | | |
| | 0 | | | | –30 | | | | 2 | | | | –4 | | | | | | | | –39 | | | | | | | | |
| | | | | | | | | | | | | | | | | | | | | | | | | | | | | | |
| | 0 | | | | 0 | | | | 1 | | | | –2 | | | | | | | | –2 | | | | | | | | |
| | 0 | | | | 0 | | | | 1 | | | | 114 | | | | | | | | 114 | | | | | | | | |
| | 0 | | | | 0 | | | | 0 | | | | –116 | | | | | | | | –116 | | | | | | | | |
| | 0 | | | | 0 | | | | 97 | | | | 22 | | | | | | | | 148 | | | | | | | | |
| | 0 | | | | –5 | | | | –97 | | | | –3 | | | | | | | | –105 | | | | | | | | |
| | 0 | | | | –5 | | | | 1 | | | | 17 | | | | | | | | 41 | | | | | | | | |
| | 0 | | | | 0 | | | | 0 | | | | 0 | | | | | | | | 0 | | | | | | | | |
| | 0 | | | | –21 | | | | 10 | | | | 5 | | | | | | | | –6 | | | | | | | | |
| | 0 | | | | 0 | | | | 0 | | | | 0 | | | | | | | | 0 | | | | | | | | |
| | | 0 | | | | 782 | | | | 796 | | | | 475 | | | | | | | | 2,086 | | | | | | | | |
135
KfW Financial Information 2016 Consolidated financial statements
Development of financial liabilities measured at fair value in the financial year 2015, using valuation methods based in
| | | | | | | | | | | | | | | | | | |
| | | | | | | |
| | | | | | | Liabilities to banks – | | | | | | | | Liabilities to customers – | | |
| | | | | | | recorded at fair value | | | | | | | | recorded at fair value | | |
| | | | | | through profit or loss | | | | | | | | through profit or loss | | |
| | | | | | EUR in millions | | | | | | | | EUR in millions | | |
| | | | | | | |
As of 1 Jan. 2015 | | | | | | 12 | | | | | | | | | | 72 | | |
A. Changes recognised in the income statement | | | | | | | | | | | | | | | | | | |
Net interest and commission income | | | | | | –2 | | | | | | | | | | –12 | | |
Contracts still valid at year-end | | | | | | –2 | | | | | | | | | | –12 | | |
Net gains/losses from hedge accounting | | | | | | 0 | | | | | | | | | | 0 | | |
Contracts still valid at year-end | | | | | | 0 | | | | | | | | | | 0 | | |
Net gains/losses from other financial instruments at fair value through profit or loss | | | | | | –6 | | | | | | | | | | –2 | | |
Contracts still valid at year-end | | | | | | –1 | | | | | | | | | | –2 | | |
Total changes recognised in the income statement | | | | | | –8 | | | | | | | | | | –13 | | |
B. Changes recognised directly in equity | | | | | | | | | | | | | | | | | | |
Change of valuation method used | | | | | | 0 | | | | | | | | | | 0 | | |
Transfers from “Quoted market price” and “Valuation method based on observable market data (model)” | | | | | | 0 | | | | | | | | | | 0 | | |
Transfers to “Quoted market price” and “Valuation method based on observable market data (model)” | | | | | | 0 | | | | | | | | | | 0 | | |
Additions | | | | | | 0 | | | | | | | | | | 0 | | |
Disposals | | | | | | 0 | | | | | | | | | | 0 | | |
Total changes recognised directly in equity | | | | | | 0 | | | | | | | | | | 0 | | |
Changes in consolidated group | | | | | | 0 | | | | | | | | | | 0 | | |
Exchange rate changes | | | | | | 0 | | | | | | | | | | 0 | | |
Other changes | | | | | | 0 | | | | | | | | | | 0 | | |
As of 31 Dec. 2015 | | | | | | 4 | | | | | | | | | | 58 | | |
136
KfW Financial Information 2016 Consolidated financial statements
part on market unobservable data
| | | | | | | | | | | | | | | | | | | | | | | | |
| | | | | | | | |
| | | Certificated liabilities –
recorded at fair value through profit or loss | | | | | Derivatives used for
hedge accounting | | | | | Other derivatives | | | | | Total | | | |
| | | EUR in millions | | | | | EUR in millions | | | | | EUR in millions | | | | | EUR in millions | | | |
| | | | | | | | |
| | 0 | | | | | | 2 | | | | | | 7 | | | | | | 92 | | | | |
| | | | | | | | | | | | | | | | | | | | | | | | |
| | 0 | | | | | | 0 | | | | | | 0 | | | | | | –13 | | | | |
| | 0 | | | | | | 0 | | | | | | 0 | | | | | | –13 | | | | |
| | 0 | | | | | | 0 | | | | | | 0 | | | | | | 0 | | | | |
| | 0 | | | | | | 0 | | | | | | 0 | | | | | | 0 | | | | |
| | 0 | | | | | | 0 | | | | | | 4 | | | | | | –4 | | | | |
| | 0 | | | | | | 0 | | | | | | 4 | | | | | | 1 | | | | |
| | 0 | | | | | | 0 | | | | | | 4 | | | | | | –17 | | | | |
| | | | | | | | | | | | | | | | | | | | | | | | |
| | 5 | | | | | | 0 | | | | | | 1 | | | | | | 6 | | | | |
| | | | | | | | |
| | 5 | | | | | | 0 | | | | | | 1 | | | | | | 6 | | | | |
| | | | | | | | |
| | 0 | | | | | | 0 | | | | | | 0 | | | | | | 0 | | | | |
| | 0 | | | | | | 0 | | | | | | –2 | | | | | | –2 | | | | |
| | 0 | | | | | | 0 | | | | | | 0 | | | | | | 0 | | | | |
| | 5 | | | | | | 0 | | | | | | –2 | | | | | | 3 | | | | |
| | 0 | | | | | | 0 | | | | | | 0 | | | | | | 0 | | | | |
| | 0 | | | | | | 0 | | | | | | 5 | | | | | | 5 | | | | |
| | 0 | | | | | | 0 | | | | | | 0 | | | | | | 0 | | | | |
| | | 5 | | | | | | 2 | | | | | | 15 | | | | | | 84 | | | | |
137
KfW Financial Information 2016 Consolidated financial statements
In accordance with the valuation method defined for KfW Group, the fair value reported in the statement of financial position is the best evidence of the fair value for those financial instruments allocated to the “Valuation method based in part on market unobservable data” level.
The following tables show how an alternative determination of relevant market unobservable data, i.e. values in best and worst case scenarios would have an impact on fair values for significant products allocated to this level.
| | | | | | | | | | | | | | |
| | | | | | | |
| Major products | | | | Valuation method used | | | | Relevant market unobservable data with alternative determination | | | | Range | | |
Derivatives with positive or negative fair values, which comprise a hedging instrument for customers with respect to export and project finance | | | | Discounted cash flow method | | | | Expected risk-free customer margin | | | | 8% to 14% | | |
Securities and investments from equity finance accounted for at fair value through profit or loss | | | | Discounted cash flow method | | | | Cost of capital | | | | 0.5% to 1.5% (absolute fluctuation) | | |
| | | | | | | |
| | | | | | | | Long-term result | | | | 5% | | |
| | | | | | | | | | | | | (relative fluctuation) | | |
Sensitivity analysis for the financial assets measured at fair value, using valuation methods based in part on market unobservable data as of 31 December 2016
| | | | | | | | | | | | | | | | | | | | | | | | |
| | | | | | | Best case scenario | | | | | | | | Reported value | | | | | | | | Worst case scenario | | |
| | | | | | | EUR in millions | | | | | | | | EUR in millions | | | | | | | | EUR in millions | | |
| | | | | | | | | | |
| Other derivatives – with positive fair values | | | | | | 875 | | | | | | | | 864 | | | | | | | | 854 | | |
Securities and investments – recorded at fair value through profit or loss | | | | | | 512 | | | | | | | | 432 | | | | | | | | 373 | | |
Total | | | | | | 1,387 | | | | | | | | 1,297 | | | | | | | | 1,226 | | |
Sensitivity analysis for the financial liabilities measured at fair value, using valuation methods based in part on market unobservable data as of 31 December 2016
| | | | | | | | | | | | | | | | | | | | | | | | |
| | | | | | | Best case scenario | | | | | | | | Reported value | | | | | | | | Worst case scenario | | |
| | | | | | | EUR in millions | | | | | | | | EUR in millions | | | | | | | | EUR in millions | | |
| | | | | | | | | | |
| Certificated liabilities – recorded at fair value through profit or loss | | | | | | 113 | | | | | | | | 114 | | | | | | | | 115 | | |
Other derivatives – with negative fair values | | | | | | 89 | | | | | | | | 90 | | | | | | | | 91 | | |
Total | | | | | | 202 | | | | | | | | 204 | | | | | | | | 207 | | |
138
KfW Financial Information 2016 Consolidated financial statements
Sensitivity analysis for the financial assets measured at fair value, using valuation methods based in part on market unobservable data as of 31 December 2015
| | | | | | | | | | | | | | | | | | | | |
| | | | | Best case
scenario | | | | | Reported value | | | | | Worst case
scenario | | |
| | | | | EUR in millions | | | | | EUR in millions | | | | | EUR in millions | | |
| | | | | | | |
Other derivatives – with positive fair values | | | | | | 792 | | | | | | 782 | | | | | | 773 | | |
Securities and investments – recorded at fair value through profit or loss | | | | | | 539 | | | | | | 475 | | | | | | 410 | | |
Total | | | | | | 1,330 | | | | | | 1,257 | | | | | | 1,182 | | |
Sensitivity analysis for the financial liabilities measured at fair value, using valuation methods based in part on market unobservable data as of 31 December 2015
| | | | | | | | | | | | | | | | | | | | |
| | | | | | Best case
scenario | | | | | Reported value | | | | | Worst case
scenario | | |
| | | | | | EUR in millions | | | | | EUR in millions | | | | | EUR in millions | | |
| | | | | | | | |
Certificated liabilities – recorded at fair value through profit or loss | | | | | | 5 | | | | | | 5 | | | | | | 5 | | |
Other derivatives – with negative fair values | | | | | | 14 | | | | | | 15 | | | | | | 15 | | |
Total | | | | | | 19 | | | | | | 20 | | | | | | 20 | | |
(70) Additional disclosures on Liabilities to banks
Disclosures on Liabilities to banks designated at fair value through profit or loss
(fair value option)
| | | | | | | | | | | | | | | | | | | | | | | | |
| | | | | | 31 Dec. 2016 | | | | | | | | 31 Dec. 2015 | | | | | Change | | |
| | | | | | EUR in millions | | | | | | | | EUR in millions | | | | | EUR in millions | | |
| | | | | | | | | |
Carrying amount | | | | | | 276 | | | | | | | | | | 226 | | | | | | 50 | | |
Repayment at maturity | | | | | | 303 | | | | | | | | | | 245 | | | | | | 58 | | |
Difference | | | | | | 27 | | | | | | | | | | 19 | | | | | | 8 | | |
Of the difference between the repayment amount at maturity and the carrying amount, EUR 21 million (31 Dec. 2015: EUR 0 million) is attributable to borrowings for which the repayment amount builds up as a result of the capitalisation over time of interest due.
139
KfW Financial Information 2016 Consolidated financial statements
(71) Additional disclosures on Liabilities to customers
Disclosures on Liabilities to customers designated at fair value through profit or loss
(fair value option)
| | | | | | | | | | | | | | | | | | | | | | |
| | | | | | 31 Dec. 2016 | | | | | | | 31 Dec. 2015 | | | | | Change | | |
| | | | | | EUR in millions | | | | | | | EUR in millions | | | | | EUR in millions | | |
| | | | | | | | | |
Carrying amount | | | | | | 1,828 | | | | | | | | 2,167 | | | | | | –340 | | |
Repayment at maturity | | | | | | 3,113 | | | | | | | | 4,209 | | | | | | –1,097 | | |
Difference | | | | | | 1,285 | | | | | | | | 2,042 | | | | | | –757 | | |
Of the difference between the repayment amount at maturity and the carrying amount, EUR 1,244 million (31 Dec. 2015: EUR 1,989 million) is attributable to borrowings for which the repayment amount builds up as a result of the capitalisation over time of interest due.
(72) Additional disclosures on Certificated liabilities
Disclosures on certificated liabilities designated at fair value through profit or loss
(fair value option)
| | | | | | | | | | | | | | | | | | | | |
| | | | | | 31 Dec. 2016 | | | | | | 31 Dec. 2015 | | | | | | Change | | |
| | | | | | EUR in millions | | | | | | EUR in millions | | | | | | EUR in millions | | |
| | | | | | | | | | |
Carrying amount | | | | | | 14,401 | | | | | | 15,897 | | | | | | –1,496 | | |
Repayment at maturity | | | | | | 17,101 | | | | | | 18,152 | | | | | | –1,051 | | |
Difference | | | | | | 2,700 | | | | | | 2,255 | | | | | | 445 | | |
Of the difference between the repayment amount at maturity and the carrying amount, EUR 4,578 million (31 Dec. 2015: EUR 4,209 million) is attributable to borrowings for which the repayment amount builds up as a result of the capitalisation over time of interest due.
140
KfW Financial Information 2016 Consolidated financial statements
| | (73) | Additional disclosures on financial liabilities designated at fair value through profit or loss |
(fair value option)
The valuation effects resulting from changes in fair value due to changes in KfW’s funding conditions included in Net gains/losses from other financial instruments at fair value through profit or loss amount to EUR 264 million (2015: EUR –130 million). The cumulative effect amounts to EUR –74 million (31 Dec. 2015: EUR –339 million).
These valuation effects included in particular the market-related changes in KfW’s funding conditions generated by the development of demand for various KfW funding instruments.
(74) Additional disclosures on derivatives
Analysis of derivatives by class
| | | | | | | | | | | | | | | | | | | | | | | | | | | | | | | | | | | | | | | | |
| | | | | | | | |
| | | | | Par value | | | | | Fair value | | | | | | | | Fair value |
| | | | | | | | | 31 Dec. 2016 | | | | | | | | 31 Dec. 2015 |
| | | | | | | | | | | | | | | | | | | | | | | | | | | | | | | | | | | | | |
| | | | | 31 Dec. | | | | | | | 31 Dec. | | | | | positive | | | | | negative | | | | | | | | positive | | | | | negative | | |
| | | | 2016 | | | | | | | 2015 | | | | | | | | | | | | | | | | | | | | | | | | | |
| | | | EUR in
millions | | | | | | | EUR in
millions | | | | | EUR in
millions | | | | | EUR in
millions | | | | | | | | EUR in
millions | | | | | EUR in
millions | | |
| | | | | | | | | | | | | | | | |
Interest-related derivatives | | | | 412,338 | | | | | | | | 478,774 | | | | | | 13,692 | | | | | | 17,277 | | | | | | | | 18,162 | | | | | | 20,143 | | |
Currency-related derivatives | | | | 224,014 | | | | | | | | 235,581 | | | | | | 20,993 | | | | | | 4,161 | | | | | | | | 25,345 | | | | | | 4,359 | | |
Credit derivatives | | | | 10 | | | | | | | | 10 | | | | | | 1 | | | | | | 0 | | | | | | | | 0 | | | | | | 0 | | |
Miscellaneous | | | | 0 | | | | | | | | 0 | | | | | | 0 | | | | | | 0 | | | | | | | | 0 | | | | | | 0 | | |
Total | | | | 636,363 | | | | | | | | 714,365 | | | | | | 34,685 | | | | | | 21,438 | | | | | | | | 43,507 | | | | | | 24,502 | | |
Cross-currency swaps are presented under Currency-related derivatives.
Analysis of derivatives by counterparty
| | | | | | | | | | | | | | | | | | | | | | | | | | | | | | | | | | | | | | | | | | |
| | | | | | | | |
| | | | | Par value | | | | | Fair value | | | | | | | Fair value | | |
| | | | | | | | | 31 Dec. 2016 | | | | | | | 31 Dec. 2015 | | |
| | | | | | | | | | | | | | | | | | | | | | | | | | | | | | | | | | | | | | |
| | | | | 31 Dec. | | | | | | | 31 Dec. | | | | | positive | | | | | | | negative | | | | | | | positive | | | | | negative | | |
| | | | 2016 | | | | | | | 2015 | | | | | | | | | | | | | | | | | | | | | | | | | | |
| | | | EUR in
millions | | | | | | | EUR in
millions | | | | | EUR in
millions | | | | | | | EUR in
millions | | | | | | | EUR in
millions | | | | | EUR in
millions | | |
| | | | | | | | | | | | | | | | |
OECD banks | | | | 624,675 | | | | | | | | 705,089 | | | | | | 33,819 | | | | | | | | 21,098 | | | | | | | | 42,773 | | | | | | 24,198 | | |
Non-OECD banks | | | | 824 | | | | | | | | 25 | | | | | | 21 | | | | | | | | 2 | | | | | | | | 0 | | | | | | 3 | | |
Other counterparties | | | | 8,152 | | | | | | | | 6,989 | | | | | | 782 | | | | | | | | 62 | | | | | | | | 734 | | | | | | 16 | | |
Public sector | | | | 2,712 | | | | | | | | 2,262 | | | | | | 64 | | | | | | | | 275 | | | | | | | | 0 | | | | | | 285 | | |
Total | | | | 636,363 | | | | | | | | 714,365 | | | | | | 34,685 | | | | | | | | 21,438 | | | | | | | | 43,507 | | | | | | 24,502 | | |
141
KfW Financial Information 2016 Consolidated financial statements
The analysis includes stand-alone financial and credit derivatives which are presented in the items Derivatives used for hedge accounting and Other derivatives.
The volume of initial differences between the transaction price and model value arising from the use of a valuation technique that makes significant use of market unobservable data which have yet to be amortised over the life of the financial instrument amounts to EUR 93 million (31 Dec. 2015: EUR 82 million). The net gains/losses from derivatives not qualifying for hedge accounting includes amortisation effects in the amount of EUR 9 million (2015: EUR 7 million).
The economic hedge effect of financial derivatives with an aggregate principal amount of EUR 578.8 billion (31 Dec. 2015: EUR 647.1 billion) is presented in accordance with IAS 39; the risk-mitigating impact of the remaining financial derivatives is not reflected in the accounts.
KfW Group did not pledge any collateral (in the form of securities) under derivative transactions that can be resold or repledged at any time without payments being past due, unchanged from 31 December 2015.
However, liquid collateral totalling EUR 2,409 million (31 Dec. 2015: EUR 2,956 million) was provided, which is reported under Loans and advances to banks and customers.
Unchanged from 31 December 2015, KfW Group did not receive any collateral (in the form of securities) under derivative transactions, which can be resold or repledged at any time without payments by the protection seller being past due.
However, provision of liquid collateral totalling EUR 16,976 million (31 Dec. 2015: EUR 20,473 million) was accepted, which is reported under Liabilities to banks and customers.
| | (75) | Additional disclosures on the PROMISE/PROVIDE synthetic securitisation platforms |
KfW Group did not receive any collateral (in the form of securities) under platform transactions that can be resold or repledged at any time without payments being past due by the protection seller, unchanged from 31 December 2015.
Nor was any provision of liquid collateral accepted. As of 31 December 2015, such provision of liquid collateral totalling EUR 20 million had been accepted, which was reported under Liabilities to banks and customers.
142
KfW Financial Information 2016 Consolidated financial statements
(76) Disclosures on repurchase agreements
Disclosures on repo transactions
| | | | | | | | | | | | | | | | | | | | |
| | | | | | | 31 Dec. 2016 | | | | | | 31 Dec. 2015 | | | | | | Change | | |
| | | | | | | EUR in millions | | | | | | EUR in millions | | | | | | EUR in millions | | |
| | | | | | | | | | |
| Carrying amount of securities sold under repo transactions that continue to be recognised in Securities and investments | | | | | | 0 | | | | | | 26 | | | | | | –26 | | |
Liabilities to banks (countervalue) | | | | | | 0 | | | | | | 28 | | | | | | –28 | | |
The fair value of securities sold under repo transactions that continue to be recognised in Securities and investments totals EUR 0 million (31 Dec. 2015: EUR 26 million). The fair value of the corresponding repayment obligations is EUR 0 million (31 Dec. 2015: EUR 28 million).
Unchanged from 31 December 2015, KfW Group did not pledge any collateral (in the form of securities) under repo transactions that can be resold or repledged at any time without payments being past due.
KfW Group did not receive any collateral (in the form of securities) under repo transactions that can be resold or repledged at any time without payments being past due, unchanged from 31 December 2015.
The group neither pledged nor accepted any liquid collateral, unchanged from 31 December 2015.
Disclosures on reverse repo transactions
| | | | | | | | | | | | | | | | | | | | |
| | | | | | | 31 Dec. 2016 | | | | | | 31 Dec. 2015 | | | | | | Change | | |
| | | | | | | EUR in millions | | | | | | EUR in millions | | | | | | EUR in millions | | |
| | | | | | | | | | |
| Loans and advances to banks (countervalue) | | | | | | 9,522 | | | | | | 7,877 | | | | | | 1,645 | | |
Loans and advances to customers (countervalue) | | | | | | 300 | | | | | | 2,345 | | | | | | –2,045 | | |
Total | | | | | | 9,822 | | | | | | 10,222 | | | | | | –400 | | |
Securities purchased under reverse repos are not recognised.
KfW Group did not pledge any collateral (in the form of securities) under reverse repo transactions that could be resold or repledged at any time without payments being past due, unchanged from 31 December 2015.
143
KfW Financial Information 2016 Consolidated financial statements
KfW Group did not receive any collateral (in the form of securities) under reverse repo transactions that can be resold or repledged at any time without payments by the protection seller being past due, unchanged from 31 December 2015.
The group neither pledged nor accepted any liquid collateral, unchanged from 31 December 2015.
(77) Disclosure on offsetting financial instruments
Offsetting agreements within framework agreements between KfW and its business partners
Framework agreements between KfW and its business partners include offsetting agreements relating to OTC derivatives and repo transactions.
One form of netting is close-out netting, which provides for the extinction of all rights and obligations relating to individual transactions under the framework agreement upon termination of said framework agreement by the contractual partner, or upon the latter’s insolvency, with the rights and obligation replaced by a single compensation claim (or obligation) in the amount of the net replacement costs of the terminated individual transactions. This does not represent a present legal claim for offsetting.
Close-out netting is not to be confused with the offsetting of payments in normal business. The same framework agreement provides for the latter case, that payments due on the same day and in the same currency may be offset and a net payment made instead of each individual payment (payment netting). This represents a present legal claim for offsetting.
KfW’s framework agreements relating to OTC derivatives all include close-out netting agreements with the business partners. Payment netting is limited in the agreement to the relevant individual transaction, so that multiple transaction payment netting does not occur. The requirements for offsetting financial assets and financial liabilities are therefore not met for KfW’s OTC derivatives.
KfW’s framework agreements for repo transactions include close-out netting agreements and in some cases also payment netting agreements with the business partners. However, as KfW does not generally perform multiple transaction payment netting with repo transactions either, the requirements for offsetting of financial assets and financial liabilities are not met for KfW’s repo transactions.
144
KfW Financial Information 2016 Consolidated financial statements
In accordance with the collateral agreements concluded for OTC derivatives and repo transactions, the values of the available collateral are used in determining the single compensation claim (or obligation) in close-out netting. Both cash and securities are permitted forms of collateral under the existing collateral agreements between KfW and its business partners. The collateral agreements provide for a transfer of title in the case of securities as collateral. Consequently, the transferred securities are not subject to any selling or pledging restrictions.
Disclosures on financial assets with netting agreements as of 31 December 2016
| | | | | | | | | | | | | | | | | | | | | | | | | | | | | | | | | | | | | | | | | | | | | | | | | | | | | | | | | | | | | | | | |
| | | | | | | | | | Carrying amount of financial assets before offsetting (gross amount) | | | | | | | | | | Netted figure as carrying amount of financial liabilities (gross amount) | | | | | | | | | | Reported financial assets (net amount) | | | | | | | | | | Carrying amount of non-offsetta- ble financial liabilities | | | | | | | | | | Fair value of collateral received | | | | | | | | | | Total net amount | | | | |
| | | | | | | | | | EUR in millions | | | | | | | | | | EUR in millions | | | | | | | | | | EUR in millions | | | | | | | | | | EUR in millions | | | | | | | | | | EUR in millions | | | | | | | | | | EUR in millions | | | | |
| | | | | | | | | | | | | | | | | | | |
| OTC derivatives | | | | | | | | | | 33,876 | | | | | | | | | | 0 | | | | | | | | | | 33,876 | | | | | | | | | | 18,176 | | | | | | | | | | 15,488 | | | | | | | | | | 212 | | | | |
Reverse repos | | | | | | | | | | 9,822 | | | | | | | | | | 0 | | | | | | | | | | 9,822 | | | | | | | | | | 0 | | | | | | | | | | 9,822 | | | | | | | | | | 0 | | | | |
Total | | | | | | | | | | 43,699 | | | | | | | | | | 0 | | | | | | | | | | 43,699 | | | | | | | | | | 18,176 | | | | | | | | | | 25,311 | | | | | | | | | | 212 | | | | |
Disclosures on financial liabilities with netting agreements as of 31 December 2016 | | | | |
| | | | | | | | | | | | | | | | | | | | | | | | | | | | | | | | | | | | | | | | | | | | | | | | | | | | | | | | | | | | | | | | |
| | | | | | | | | | Carrying amount of financial lia- bilities before offsetting (gross amount) | | | | | | | | | | Netted figure as carrying amount of financial assets (gross amount) | | | | | | | | | | Reported financial liabilities (net amount) | | | | | | | | | | Carrying amount of non-offsetta- ble financial assets | | | | | | | | | | Fair value of collateral pledged | | | | | | | | | | Total net amount | | | | |
| | | | | | | | | | EUR in millions | | | | | | | | | | EUR in millions | | | | | | | | | | EUR in millions | | | | | | | | | | EUR in millions | | | | | | | | | | EUR in millions | | | | | | | | | | EUR in millions | | | | |
| | | | | | | | | | | | | | | | | | | |
| OTC derivatives | | | | | | | | | | 21,097 | | | | | | | | | | 0 | | | | | | | | | | 21,097 | | | | | | | | | | 18,176 | | | | | | | | | | 2,400 | | | | | | | | | | 521 | | | | |
Repos | | | | | | | | | | 0 | | | | | | | | | | 0 | | | | | | | | | | 0 | | | | | | | | | | 0 | | | | | | | | | | 0 | | | | | | | | | | 0 | | | | |
Total | | | | | | | | | | 21,097 | | | | | | | | | | 0 | | | | | | | | | | 21,097 | | | | | | | | | | 18,176 | | | | | | | | | | 2,400 | | | | | | | | | | 521 | | | | |
In addition to the net amount, the items Derivatives used for hedge accounting and Other derivatives also include bifurcated embedded derivatives not subject to netting agreements.
Receivables from reverse repo transactions are reported under Loans and advances to banks and customers.
145
KfW Financial Information 2016 Consolidated financial statements
Disclosures on financial assets with netting agreements as of 31 December 2015
| | | | | | | | | | | | | | | | | | | | | | | | | | | | | | | | | | | | | | | | | | | | | | | | | | | | | | | | | | | | | | | | | | | | |
| | | | | | | | | | | | | | Carrying amount of financial assets before offsetting (gross amount) | | | | | | | | | | Netted figure as carrying amount of financial liabilities (gross amount) | | | | | | | | | | Reported financial assets (net amount) | | | | | | | | | | Carrying amount of non-offsetta- ble financial liabilities | | | | | | | | | | Fair value of collateral received | | | | | | | | | | Total net amount | | | | |
| | | | | | | | | | | | | | EUR in millions | | | | | | | | | | EUR in millions | | | | | | | | | | EUR in millions | | | | | | | | | | EUR in millions | | | | | | | | | | EUR in millions | | | | | | | | | | EUR in millions | | | | |
| | | | | | | | | | | | | | | | | | | | |
| OTC derivatives | | | | | | | | | | | | | | 42,807 | | | | | | | | | | 0 | | | | | | | | | | 42,807 | | | | | | | | | | 21,085 | | | | | | | | | | 20,468 | | | | | | | | | | 1,253 | | | | |
Reverse repos | | | | | | | | | | | | | | 10,222 | | | | | | | | | | 0 | | | | | | | | | | 10,222 | | | | | | | | | | 29 | | | | | | | | | | 10,193 | | | | | | | | | | 0 | | | | |
Total | | | | | | | | | | | | | | 53,029 | | | | | | | | | | 0 | | | | | | | | | | 53,029 | | | | | | | | | | 21,114 | | | | | | | | | | 30,662 | | | | | | | | | | 1,253 | | | | |
Disclosures on financial liabilities with netting agreements as of 31 December 2015 | | | | | | | |
| | | | | | | | | | | | | | | | | | | | | | | | | | | | | | | | | | | | | | | | | | | | | | | | | | | | | | | | | | | | | | | | |
| | | | | | | | | | Carrying amount of financial lia- bilities before offsetting (gross amount) | | | | | | | | | | Netted figure as carrying amount of financial assets (gross amount) | | | | | | | | | | Reported financial liabilities (net amount) | | | | | | | | | | Carrying amount of non-offsetta- ble financial assets | | | | | | | | | | Fair value of collateral pledged | | | | | | | | | | Total net amount | | | | |
| | | | | | | | | | EUR in millions | | | | | | | | | | EUR in millions | | | | | | | | | | EUR in millions | | | | | | | | | | EUR in millions | | | | | | | | | | EUR in millions | | | | | | | | | | EUR in millions | | | | |
| | | | | | | | | | | | | | | | | | | |
| OTC derivatives | | | | | | | | | | 24,193 | | | | | | | | | | 0 | | | | | | | | | | 24,193 | | | | | | | | | | 21,085 | | | | | | | | | | 2,701 | | | | | | | | | | 406 | | | | |
Repos | | | | | | | | | | 29 | | | | | | | | | | 0 | | | | | | | | | | 29 | | | | | | | | | | 29 | | | | | | | | | | 0 | | | | | | | | | | 0 | | | | |
Total | | | | | | | | | | 24,222 | | | | | | | | | | 0 | | | | | | | | | | 24,222 | | | | | | | | | | 21,114 | | | | | | | | | | 2,701 | | | | | | | | | | 406 | | | | |
146
KfW Financial Information 2016 Consolidated financial statements
Other notes
(78) Contingent liabilities and irrevocable loan commitments
Analysis of contingent liabilities by class
| | | | | | | | | | | | | | | | | | | | | | |
| | | | | | | 31 Dec. 2016 | | | | | | | | 31 Dec. 2015 | | | | | | Change | | |
| | | | | | | EUR in millions | | | | | | | | EUR in millions | | | | | | EUR in millions | | |
| | | | | | | | | |
| Contingent liabilities from financial guarantees | | | | | | 2,647 | | | | | | | | 3,260 | | | | | | –613 | | |
Contingent liabilities from PROMISE/PROVIDE securitisation platforms | | | | | | 0 | | | | | | | | 792 | | | | | | –792 | | |
Performance guarantees | | | | | | 2 | | | | | | | | 3 | | | | | | –1 | | |
Other contingent liabilities | | | | | | 1,305 | | | | | | | | 1,130 | | | | | | 175 | | |
Total | | | | | | 3,955 | | | | | | | | 5,186 | | | | | | –1,231 | | |
Other contingent liabilities include payment obligations attributable to equity investments which are not fully paid up and do not have to be consolidated. According to IAS 37.92, there is no need for further disclosure of additional contingent liabilities.
Volume of irrevocable loan commitments
| | | | | | | | | | | | | | | | | | | | | | | | |
| | | | | | | 31 Dec. 2016 | | | | | | | | | 31 Dec. 2015 | | | | | Change | | |
| | | | | | | EUR in millions | | | | | | | | | | EUR in millions | | | | | | EUR in millions | | |
Irrevocable loan commitments | | | | | | 81,534 | | | | | | | | | | 62,163 | | | | | | 19,371 | | |
The Irrevocable loan commitments are mainly attributable to the domestic promotional lending business.
(79) Trust activities and administered loans
Analysis of trust activities by class (transactions in KfW’s own name but for the account of third parties)
| | | | | | | | | | | | | | | | | | | | | | | | |
| | | | | | | 31 Dec. 2016 | | | | | | | | | | 31 Dec. 2015 | | | | | | Change | | |
| | | | | | | EUR in millions | | | | | | | | | | EUR in millions | | | | | | EUR in millions | | |
| | | | | | | | | |
| Loans and advances to banks | | | | | | 951 | | | | | | | | | | 1,033 | | | | | | –82 | | |
Loans and advances to customers | | | | | | 12,123 | | | | | | | | | | 12,401 | | | | | | –278 | | |
Securities and investments | | | | | | 3,600 | | | | | | | | | | 3,465 | | | | | | 135 | | |
Assets held in trust | | | | | | 16,674 | | | | | | | | | | 16,898 | | | | | | –225 | | |
Liabilities to banks | | | | | | 0 | | | | | | | | | | 4 | | | | | | –4 | | |
Liabilities to customers | | | | | | 16,673 | | | | | | | | | | 16,895 | | | | | | –221 | | |
Liabilities held in trust | | | | | | 16,674 | | | | | | | | | | 16,898 | | | | | | –225 | | |
EUR 12,114 million (31 Dec. 2015: EUR 12,505 million) of the assets held in trust are attributable to the business sector Promotion of developing countries and emerging economies.
147
KfW Financial Information 2016 Consolidated financial statements
Volume of administered loans granted (loans in the name and for the account of third parties)
| | | | | | | | | | | | | | | | | | | | |
| | | | | | | 31 Dec. 2016 | | | | | | 31 Dec. 2015 | | | | | | Change | | |
| | | | | | | EUR in millions | | | | | | EUR in millions | | | | | | EUR in millions | | |
Administered loans | | | | | | 14,694 | | | | | | 11,405 | | | | | | 3,289 | | |
(80) Leasing transactions as lessee
Disclosures on lessee agreements as of 31 December 2016
| | | | | | | | | | | | | | | | | | | | | | | | | | |
| | | | | | | Due within one year | | | | | | Due in between one and five years | | | | | | Due in more than five years | | | | | | Total | | |
| | | | | | | EUR in millions | | | | | | EUR in millions | | | | | | EUR in millions | | | | | | EUR in millions | | |
| | | | | | | | | | | | | |
| Operating leases | | | | | | | | | | | | | | | | | | | | | | | | | | |
Future minimum leasing payments | | | | | | 13 | | | | | | 38 | | | | | | 24 | | | | | | 75 | | |
Disclosures on lessee agreements as of 31 December 2015 |
| | | | | | | | | | | | | | | | | | | | | | | | | | |
| | | | | | | Due within one year | | | | | | Due in between one and five years | | | | | | Due in more than five years | | | | | | Total | | |
| | | | | | | EUR in millions | | | | | | EUR in millions | | | | | | EUR in millions | | | | | | EUR in millions | | |
| | | | | | | | | | | | | |
| Operating leases | | | | | | | | | | | | | | | | | | | | | | | | | | |
Future minimum leasing payments | | | | | | 11 | | | | | | 45 | | | | | | 41 | | | | | | 96 | | |
(81) Average number of employees during the financial year
| | | | | | | | | | | | | | | | | | | | | | | | | | | | |
| | | | | | | 2016 | | | | | | | | | | 2015 | | | | | | | | | | Change | | |
| | | | | | | | | | |
| Employees (female) | | | | | | 2,892 | | | | | | | | | | 2,840 | | | | | | | | | | 52 | | |
Employees (male) | | | | | | 3,053 | | | | | | | | | | 2,967 | | | | | | | | | | 86 | | |
Total | | | | | | 5,944 | | | | | | | | | | 5,807 | | | | | | | | | | 137 | | |
Staff not covered by collective agreements | | | | | | 4,170 | | | | | | | | | | 4,030 | | | | | | | | | | 140 | | |
Staff covered by collective agreements | | | | | | 1,774 | | | | | | | | | | 1,777 | | | | | | | | | | –3 | | |
The average number of employees includes temporary staff but excludes members of the Executive Board and trainees and was calculated based on the levels at the end of each quarter.
148
KfW Financial Information 2016 Consolidated financial statements
(82) Remuneration report
The remuneration report describes the basic structure of the remuneration plan for members of the Executive Board and Board of Supervisory Directors; it also discloses their remuneration on an individual basis.
Overview of total remuneration of members of the Executive Board and Board of Supervisory Directors
| | | | | | | | | | | | | | | | | | | | |
| | | | | | | 2016 | | | | | | 2015 | | | | | | Change | | |
| | | | | | | EUR in thousands | | | | | | EUR in thousands | | | | | | EUR in thousands | | |
| | | | | | | | | | |
| Members of the Executive Board | | | | | | 4,033.0 | | | | | | 3,945.9 | | | | | | 87.1 | | |
Former members of the Executive Board and their surviving dependants | | | | | | 4,225.9 | | | | | | 4,194.2 | | | | | | 31.7 | | |
Members of the Board of Supervisory Directors | | | | | | 193.0 | | | | | | 191.7 | | | | | | 1.3 | | |
Total | | | | | | 8,451.9 | | | | | | 8,331.8 | | | | | | 120.1 | | |
Remuneration of the Executive Board
The remuneration system for KfW’s Executive Board is aimed at appropriately compensating members of the Executive Board for their duties and responsibilities. Executive Board contracts are drawn up based on the 1992 version of the policy for hiring executive board members at credit institutions of the Federal Government (Grundsätze für die Anstellung der Vorstandsmitglieder bei den Kreditinstituten des Bundes). The Federal Public Corporate Governance Code (Public Corporate Governance Kodex des Bundes – “PCGK”) is taken into account when drawing up contracts. On this basis, each contract is individualised accordingly.
Components of remuneration
The Executive Board members receive fixed monetary compensation paid in equal monthly instalments. The compensation of the Chief Executive Officer is an exception; based on an agreed set of annual targets, he receives a variable end-of-year bonus in addition to his fixed salary. The minimum bonus payment for financial year 2016 was set at EUR 181,946.91. This minimum bonus payment does not apply if KfW’s net income for a financial year is insufficient to ensure allocation to the statutory reserves. The annual targets agreed for financial year 2016 comprise promotional, economic and regulatory targets with a 50% quantitative to 50% qualitative weighting. A cap on the end-of-year bonus has been agreed.
The following table shows total remuneration, broken down into fixed and, where applicable, variable components and other forms of compensation, as well as additions to pension provisions for the individual members of the Executive Board.
149
KfW Financial Information 2016 Consolidated financial statements
Annual remuneration of the Executive Board and additions to pension provisions in financial years 2016 and 20151)
| | | | | | | | | | | | | | | | | | | | | | | | | | | | | | | | | | | | | | | | | | | | | | | | | | |
| | | | | | Salary | | | | Variable compensation | | | | Other compensation | | | | | | Total | | | | | | Additions to pension provisions2) | | | | |
| | | | | | 2016 | | | | 2015 | | | | 2016 | | | | 2015 | | | | 2016 | | | | 2015 | | | | | | 2016 | | | | 2015 | | | | | | 2016 | | | | 2015 | | | | |
| | | | | EUR in thou- sands | | | | EUR in thou- sands | | | | EUR in
thou-
sands | | | | EUR in thou- sands | | | | EUR in thou- sands | | | | EUR in thou- sands | | | | | | EUR in thou- sands | | | | EUR in thou- sands | | | | | | EUR in thou- sands | | | | EUR in thou- sands | | | |
Dr Ulrich Schröder | | | | | | | | | | | | | | | | | | | | | | | | | | | | | | | | | | | | | | | | | | | | | | | | | | |
(Chief Executive Officer) | | | | | | 742.2 | | | | 740.5 | | | | 275.0 | | | | 250.0 | | | | 88.5 | | | | 88.4 | | | | | | 1,105.7 | | | | 1,078.9 | | | | | | 1,549.7 | | | | 707.7 | | | | |
Dr Günther Bräunig | | | | | | 563.6 | | | | 552.63) | | | | 0.0 | | | | 0.0 | | | | 33.3 | | | | 34.9 | | | | | | 596.9 | | | | 587.5 | | | | | | 1,093.0 | | | | –190.8 | | | | |
Dr Ingrid Hengster | | | | | | 522.6 | | | | 521.4 | | | | 0.0 | | | | 0.0 | | | | 34.8 | | | | 40.2 | | | | | | 557.4 | | | | 561.6 | | | | | | 618.8 | | | | 142.2 | | | | |
Dr Norbert Kloppenburg | | | | | | 551.2 | | | | 552.63) | | | | 0.0 | | | | 0.0 | | | | 44.7 | | | | 44.6 | | | | | | 595.9 | | | | 597.2 | | | | | | 1,069.4 | | | | –496.0 | | | | |
Bernd Loewen | | | | | | 583.5 | | | | 582.1 | | | | 0.0 | | | | 0.0 | | | | 37.4 | | | | 34.9 | | | | | | 620.9 | | | | 617.0 | | | | | | 787.8 | | | | –209.9 | | | | |
Dr Stefan Peiss | | | | | | 521.9 | | | | 0.0 | | | | 0.0 | | | | 0.0 | | | | 34.3 | | | | 0.0 | | | | | | 556.2 | | | | 0.0 | | | | | | 595.0 | | | | 0.0 | | | | |
Total | | | | | 3,485.0 | | | | 3,361.94) | | | | 275.0 | | | | 250.0 | | | | 273.0 | | | | 334.04) | | | | | | 4,033.0 | | | | 3,945.94) | | | | | | 5,713.7 | | | | –1,507.24) | | | |
| 1) | Amounts in the table are subject to rounding differences. |
| 2) | The discount rate for pension obligations decreased in 2016 due to the decline in long-term capital market rates from 2.28 % (31 Dec. 2015) to 1.63 % (31 Dec. 2016), which accounted for a majority of the additions to pension provisions. |
| 3) | A remaining payment of EUR 2,626 for an anniversary bonus for 2014 is included in the 2015 salaries. |
| 4) | The totals for financial year 2015 include compensation paid to Dr Edeltraud Leibrock, who stepped down on 30 September 2015, the addition to pension provisions and a one-time payment under a retrospective pension contribution agreement. |
Responsibilities
The Presidial and Nomination Committee has discussed the Executive Board compensation system including contract components since the committee structure was modified in accordance with the applicable section 25 d of the German Banking Act (Kreditwesengesetz – “KWG”) and adopts and regularly reviews it. The Presidial and Nomination Committee is advised on these matters by the Remuneration Committee, which in turn considers the results of certain analyses of the recently established Risk and Credit Committee regarding the incentive effects of the compensation systems. Likewise after consulting with the Remuneration Committee on the matter, the Board of Supervisory Directors decides upon the basic structure of the Executive Board’s compensation system.
The Presidial and Nomination Committee discussed compensation issues on numerous occasions during the reporting year, most recently at its meeting of 7 December 2016.
150
KfW Financial Information 2016 Consolidated financial statements
Fringe benefits
Other compensation largely comprises fringe benefits. Executive Board members are entitled to a company car with a driver for business and personal use. Executive Board members reimburse KfW for using a company car with a driver for private purposes in accordance with applicable tax regulations. They are reimbursed under tax regulations for the cost of maintaining a second home for business reasons.
Executive Board members are insured under a group accident insurance policy. Allowances are provided for health and long-term care insurance. Executive Board members are covered by a directors and officers liability insurance policy, which insures them against the risks of financial loss associated with their actions in their capacity as Executive Board members and by a supplemental legal expenses insurance policy. KfW Executive Board members acting in their management capacity are also protected by a special legal expenses group policy for employees covering criminal activities.
No compensation is paid to members of the Executive Board for assuming executive body functions at group companies.
As with all other executives, Executive Board members may also opt to participate in the deferred compensation programme – a supplemental company pension scheme financed via tax-free salary conversion. Moreover, they are entitled to anniversary bonuses in accordance with KfW’s general company policy.
In addition, the fringe benefits contain the cost of security systems at Executive Board members’ homes; these benefits are not recognised as other compensation but as Non-personnel expenses.
The fringe benefits are subject to taxation as benefits in money’s worth for Executive Board members if they cannot be granted on a tax-free basis or if this is contractually agreed.
There were no loans by KfW to any members of the Executive Board in 2016.
No Executive Board member was granted or promised any benefits by a third party during the past financial year with a view to his position as a member of the KfW Executive Board.
Pension benefits and other benefits in the case of early retirement
In accordance with Article 1 (3) of the KfW Bylaws, the appointment of an Executive Board member should not generally extend beyond reaching the legal age of retirement. The Chief Executive Officer is exempt from this provision; he will be above the statutory retirement age at the end of his period of office, which has been renewed until 31 December 2020. Upon reaching the age of 65 or statutory retirement age and the expiry of their Executive Board contract, Executive Board members are entitled to claim pension payments; they are also entitled to pension benefits if their employment relationship terminates due to permanent disability. Two members of the Executive Board who were first appointed to the Board in 2006 and 2007 respectively and subsequently reappointed also have the option of retiring at their own request at the age of 63. Three of the Executive Board members are also entitled to a contractually granted and grandfathered temporary allowance under certain circumstances.
151
KfW Financial Information 2016 Consolidated financial statements
Pension commitments for Executive Board members as well as their surviving dependants are based on the 1992 version of the Federal Government’s policy for hiring executive board members at credit institutions. The PCGK is taken into account when drawing up the Executive Board contracts.
Executive Board member contracts include a severance pay cap in accordance with the recommendations of the PCGK. In other words, payments to these Executive Board members due to early termination of the Executive Board function without good cause in accordance with Section 626 of the German Civil Code (Bürgerliches Gesetz-buch – “BGB”) should not exceed the equivalent of two years’ salary or compensation including fringe benefits for the remainder of the contract, whichever is lower.
The full benefit entitlement totalled 70 % of the pensionable salary in the reporting year. The pensionable salary was equivalent to 70 % of the last remuneration (49 % of salary). With the exception of the CEO, the retirement benefit entitlement amounted to 70 % of the full entitlement for first-time appointment, with an increase per completed year of service of 1.25 to 3.0 percentage points depending on the contract (from an initial 34.3 % to a maximum of 49 % of the final salary).
The Executive Board contracts contain additional individual provisions, in particular concerning vesting of pension benefits. The newer contracts also include provisions on retrospective pension contributions where pension benefits are not yet vested and the member in question has not been reappointed.
Pension payments to former Executive Board members or their surviving dependants were as follows in 2016 and 2015:
| | | | | | | | | | | | | | | | | | | | | | | | | | | | | | | | | | | | | | | | | | | | | | | | | | |
Pension payments to former Executive Board members or their surviving dependants | |
| |
| | | | | | | | Headcount 2016 | | | | | | | | | EUR in thousands
2016 | | | | | | | | | Headcount 2015 | | | | | | | | | EUR in thousands 2015 | | | |
| | | | | | | | | | | | | |
Former members of the | | | | | | | | | | | | | | | | | | | | | | | | | | | | | | | | | | | | | | | | | | | | | | | | | | |
Executive Board | | | | | | | | | | | 19 | | | | | | | | | | | | 3,421.2 | | | | | | | | | | | | 19 | | | | | | | | | | | 3,374.5 | | | | |
Surviving dependants | | | | | | | | | | | 9 | | | | | | | | | | | | 804.7 | | | | | | | | | | | | 10 | | | | | | | | | | | 819.7 | | | | |
Total | | | | | | | | | | | 28 | | | | | | | | | | | | 4,225.9 | | | | | | | | | | | | 29 | | | | | | | | | | | 4,194.2 | | | | |
Provisions in the amount of EUR 66,182.9 thousand had been set up at the end of financial year 2016 for pension obligations to former members of the Executive Board and their surviving dependants (previous year: EUR 64,931.5 thousand).
No loans were granted to former Executive Board members or their surviving dependants in financial year 2016.
152
KfW Financial Information 2016 Consolidated financial statements
Compensation of members of the Board of Supervisory Directors
The amount of compensation to members of the Board of Supervisory Directors is determined by the supervisory authority in accordance with Article 7 (10) of the KfW Bylaws. With the last revision in May 2010, compensation to members of the Federal Government who are members of the Board of Supervisory Directors pursuant to Article 7 (1) No. 1 and No. 2 of the KfW Law was set at EUR 0.
In the reporting year, compensation for other members of the Board of Supervisory Directors pursuant to Article 7 (1) Nos. 3–7 of the KfW Law amounted to EUR 5,100 p. a.; compensation for membership of a Board of Supervisory Directors committee was a standard amount of EUR 600 p. a. for each member. Committee chairs received no special compensation.
Members who join during the year receive their compensation on a pro rata basis.
A daily allowance (EUR 200 per meeting day) is paid and travel expenses and applicable VAT are reimbursed upon request.
The following table provides details on the compensation paid to the Board of Supervisory Directors in financial year 2016; stated amounts are net amounts in thousands of euros. Travel expenses are reimbursed upon submission of receipts and are not taken into account in the table.
153
KfW Financial Information 2016 Consolidated financial statements
Remuneration of members of the Board of Supervisory Directors for the financial year 2016
| | | | | | | | | | | | | | | | | | | | | | | | | | | | | | | | | | | | | | |
No. | | | | Name | | | | Dates of
membership | | | | | Board of
Supervisory
Directors
membership1) | | | | | Committee
membership1) | | | | | Daily allowance | | | | | Total | | | | |
| | | | | | | | 2016 | | | | | EUR in
thousands | | | | | EUR in
thousands | | | | | EUR in
thousands | | | | | EUR in
thousands | | | | |
1. | | | | Sigmar Gabriel | | | | | 1 Jan. – 31 Dec. | | | | | | 0.0 | | | | | | 0.0 | | | | | | 0.0 | | | | | | 0.0 | | | | | |
2. | | | | Dr Wolfgang Schäuble | | | | | 1 Jan. – 31 Dec. | | | | | | 0.0 | | | | | | 0.0 | | | | | | 0.0 | | | | | | 0.0 | | | | | |
3. | | | | Kerstin Andreae | | | | | 1 Jan. – 31 Dec. | | | | | | 5.1 | | | | | | 0.6 | | | | | | 0.8 | | | | | | 6.5 | | | | | |
4. | | | | Jan Bettink | | | | | 1 Jan. – 31 Dec. | | | | | | 5.1 | | | | | | 1.2 | | | | | | 0.0 | | | | | | 6.3 | | | | | |
5. | | | | Anton F. Börner | | | | | 1 Jan. – 31 Dec. | | | | | | 5.1 | | | | | | 0.6 | | | | | | 0.0 | | | | | | 5.7 | | | | | |
6. | | | | Dr Uwe Brandl | | | | | 1 Jan. – 31 Dec. | | | | | | 5.1 | | | | | | 0.0 | | | | | | 0.2 | | | | | | 5.3 | | | | | |
7. | | | | Hans-Dieter Brenner | | | | | 1 Jan. – 31 Dec. | | | | | | 5.1 | | | | | | 0.6 | | | | | | 1.4 | | | | | | 7.1 | | | | | |
8. | | | | Frank Bsirske | | | | | 1 Jan. – 31 Dec. | | | | | | 5.1 | | | | | | 0.0 | | | | | | 0.0 | | | | | | 5.1 | | | | | |
9. | | | | Alexander Dobrindt | | | | | 1 Jan. – 31 Dec. | | | | | | 0.0 | | | | | | 0.0 | | | | | | 0.0 | | | | | | 0.0 | | | | | |
10. | | | | Georg Fahrenschon | | | | | 1 Jan. – 31 Dec. | | | | | | 5.1 | | | | | | 2.5 | | | | | | 0.0 | | | | | | 7.6 | | | | | |
11. | | | | Robert Feiger | | | | | 1 Jan. – 31 Dec. | | | | | | 5.1 | | | | | | 0.6 | | | | | | 0.8 | | | | | | 6.5 | | | | | |
12. | | | | Klaus-Peter Flosbach | | | | | 1 Jan. – 31 Dec. | | | | | | 5.1 | | | | | | 0.6 | | | | | | 0.6 | | | | | | 6.3 | | | | | |
13. | | | | Christian Görke2) | | | | | 1 Jan. – 31 Dec. | | | | | | 5.1 | | | | | | 0.0 | | | | | | 0.0 | | | | | | 5.1 | | | | | |
14. | | | | Hubertus Heil | | | | | 1 Jan. – 31 Dec. | | | | | | 5.1 | | | | | | 1.8 | | | | | | 0.6 | | | | | | 7.5 | | | | | |
15. | | | | Monika Heinold2) | | | | | 1 Jan. – 31 Dec. | | | | | | 5.1 | | | | | | 0.6 | | | | | | 0.0 | | | | | | 5.7 | | | | | |
16. | | | | Dr Barbara Hendricks | | | | | 1 Jan. – 31 Dec. | | | | | | 0.0 | | | | | | 0.0 | | | | | | 0.0 | | | | | | 0.0 | | | | | |
17. | | | | Reiner Hoffmann | | | | | 1 Jan. – 31 Dec. | | | | | | 5.1 | | | | | | 1.2 | | | | | | 0.2 | | | | | | 6.5 | | | | | |
18. | | | | Gerhard Hofmann | | | | | 1 Jan. – 31 Dec. | | | | | | 5.1 | | | | | | 1.2 | | | | | | 0.4 | | | | | | 6.7 | | | | | |
19. | | | | Bartholomäus Kalb | | | | | 1 Jan. – 31 Dec. | | | | | | 5.1 | | | | | | 0.6 | | | | | | 1.4 | | | | | | 7.1 | | | | | |
20. | | | | Dr Markus Kerber | | | | | 1 Jan. – 31 Dec. | | | | | | 5.1 | | | | | | 1.2 | | | | | | 0.0 | | | | | | 6.3 | | | | | |
21. | | | | Stefan Körzell | | | | | 1 Jan. – 31 Dec. | | | | | | 5.1 | | | | | | 1.2 | | | | | | 0.6 | | | | | | 6.9 | | | | | |
22. | | | | Dr Gesine Lötzsch | | | | | 1 Jan. – 31 Dec. | | | | | | 5.1 | | | | | | 1.2 | | | | | | 0.6 | | | | | | 6.9 | | | | | |
23. | | | | Dr Gerd Müller | | | | | 1 Jan. – 31 Dec. | | | | | | 0.0 | | | | | | 0.0 | | | | | | 0.0 | | | | | | 0.0 | | | | | |
24. | | | | Eckhardt Rehberg | | | | | 1 Jan. – 31 Dec. | | | | | | 5.1 | | | | | | 1.2 | | | | | | 0.4 | | | | | | 6.7 | | | | | |
25. | | | | Joachim Rukwied | | | | | 1 Jan. – 31 Dec. | | | | | | 5.1 | | | | | | 0.6 | | | | | | 0.2 | | | | | | 5.9 | | | | | |
26. | | | | Dr Nils Schmid2) | | | | | 1 Jan. – 31 Dec. | | | | | | 5.1 | | | | | | 0.6 | | | | | | 0.6 | | | | | | 6.3 | | | | | |
27. | | | | Christian Schmidt | | | | | 1 Jan. – 31 Dec. | | | | | | 0.0 | | | | | | 0.0 | | | | | | 0.0 | | | | | | 0.0 | | | | | |
28. | | | | Andreas Schmitz | | | | | 1 Jan. – 31 Dec. | | | | | | 5.1 | | | | | | 2.5 | | | | | | 1.6 | | | | | | 9.2 | | | | | |
29. | | | | Carsten Schneider | | | | | 1 Jan. – 31 Dec. | | | | | | 5.1 | | | | | | 1.2 | | | | | | 0.8 | | | | | | 7.1 | | | | | |
30. | | | | Peter-Jürgen Schneider2) | | | | | 1 Jan. – 31 Dec. | | | | | | 5.1 | | | | | | 1.2 | | | | | | 0.2 | | | | | | 6.5 | | | | | |
31. | | | | Holger Schwannecke | | | | | 1 Jan. – 31 Dec. | | | | | | 5.1 | | | | | | 1.8 | | | | | | 0.0 | | | | | | 6.9 | | | | | |
32. | | | | Dr Markus Söder2) | | | | | 1 Jan. – 31 Dec. | | | | | | 5.1 | | | | | | 1.2 | | | | | | 0.0 | | | | | | 6.3 | | | | | |
33. | | | | Dr Frank-Walter Steinmeier | | | | | 1 Jan. – 31 Dec. | | | | | | 0.0 | | | | | | 0.0 | | | | | | 0.0 | | | | | | 0.0 | | | | | |
34. | | | | Prof. Dr Georg Unland2) | | | | | 1 Jan. – 31 Dec. | | | | | | 5.1 | | | | | | 0.6 | | | | | | 0.0 | | | | | | 5.7 | | | | | |
35. | | | | Dr Norbert Walter-Borjans2) | | | | | 1 Jan. – 31 Dec. | | | | | | 5.1 | | | | | | 0.6 | | | | | | 0.0 | | | | | | 5.7 | | | | | |
36. | | | | Dr Martin Wansleben | | | | | 1 Jan. – 31 Dec. | | | | | | 5.1 | | | | | | 0.6 | | | | | | 0.2 | | | | | | 5.9 | | | | | |
37. | | | | Dr Kai H. Warnecke | | | | | 1 Jan. – 31 Dec. | | | | | | 5.1 | | | | | | 0.0 | | | | | | 0.6 | | | | | | 5.7 | | | | | |
Total | | | | | | | | | | | | | | | 153.0 | | | | | | 27.8 | | | | | | 12.2 | | | | | | 193.0 | | | | | |
| 1) | The amounts had not yet been paid out as of the reporting date 31 December 2016. |
| 2) | Amount governed by state law. |
154
KfW Financial Information 2016 Consolidated financial statements
Remuneration of members of the Board of Supervisory Directors for the financial year 2015
| | | | | | | | | | | | | | | | | | | | | | | | | | | | | | | | | | | | |
No. | | | | Name | | | | Dates of
membership | | | | | Board of
Supervisory
Directors
membership1) | | | | | Committee
membership1) | | | | | Daily allowance | | | | | Total | | | |
| | | | | | | | 2015 | | | | | EUR in
thousands | | | | | EUR in
thousands | | | | | EUR in
thousands | | | | | EUR in
thousands | | | |
1. | | | | Dr Wolfgang Schäuble | | | | | 1 Jan. – 31 Dec. | | | | | | 0.0 | | | | | | 0.0 | | | | | | 0.0 | | | | | | 0.0 | | | |
2. | | | | Sigmar Gabriel | | | | | 1 Jan. – 31 Dec. | | | | | | 0.0 | | | | | | 0.0 | | | | | | 0.0 | | | | | | 0.0 | | | |
3. | | | | Kerstin Andreae | | | | | 1 Jan. – 31 Dec. | | | | | | 5.1 | | | | | | 0.6 | | | | | | 0.6 | | | | | | 6.3 | | | |
4. | | | | Norbert Barthle | | | | | 31 Jan. – 14 Apr. | | | | | | 1.5 | | | | | | 0.4 | | | | | | 0.2 | | | | | | 2.1 | | | |
5. | | | | Jan Bettink | | | | | 1 Jan. – 31 Dec. | | | | | | 5.1 | | | | | | 1.2 | | | | | | 0.0 | | | | | | 6.3 | | | |
6. | | | | Anton F. Börner | | | | | 1 Jan. – 31 Dec. | | | | | | 5.1 | | | | | | 0.6 | | | | | | 0.2 | | | | | | 5.9 | | | |
7. | | | | Hans-Dieter Brenner | | | | | 1 Jan. – 31 Dec. | | | | | | 5.1 | | | | | | 0.6 | | | | | | 0.8 | | | | | | 6.5 | | | |
8. | | | | Frank Bsirske | | | | | 1 Jan. – 31 Dec. | | | | | | 5.1 | | | | | | 0.0 | | | | | | 0.0 | | | | | | 5.1 | | | |
9. | | | | Jens Bullerjahn2) | | | | | 1 Jan. – 31 Dec. | | | | | | 5.1 | | | | | | 0.6 | | | | | | 0.0 | | | | | | 5.7 | | | |
10. | | | | Alexander Dobrindt | | | | | 1 Jan. – 31 Dec. | | | | | | 0.0 | | | | | | 0.0 | | | | | | 0.0 | | | | | | 0.0 | | | |
11. | | | | Georg Fahrenschon | | | | | 1 Jan. – 31 Dec. | | | | | | 5.1 | | | | | | 2.5 | | | | | | 0.0 | | | | | | 7.6 | | | |
12. | | | | Robert Feiger | | | | | 1 Jan. – 31 Dec. | | | | | | 5.1 | | | | | | 0.6 | | | | | | 0.4 | | | | | | 6.1 | | | |
13. | | | | Klaus-Peter Flosbach | | | | | 1 Jan. – 31 Dec. | | | | | | 5.1 | | | | | | 0.6 | | | | | | 0.8 | | | | | | 6.5 | | | |
14. | | | | Hubertus Heil | | | | | 1 Jan. – 31 Dec. | | | | | | 5.1 | | | | | | 1.8 | | | | | | 0.6 | | | | | | 7.5 | | | |
15. | | | | Dr Barbara Hendricks | | | | | 1 Jan. – 31 Dec. | | | | | | 0.0 | | | | | | 0.0 | | | | | | 0.0 | | | | | | 0.0 | | | |
16. | | | | Prof. Dr Hans-Günter Henneke | | | | | 1 Jan. – 31 Dec. | | | | | | 5.1 | | | | | | 0.0 | | | | | | 0.6 | | | | | | 5.7 | | | |
17. | | | | Reiner Hoffmann | | | | | 1 Jan. – 31 Dec. | | | | | | 5.1 | | | | | | 1.2 | | | | | | 0.0 | | | | | | 6.3 | | | |
18. | | | | Gerhard Hofmann | | | | | 1 Jan. – 31 Dec. | | | | | | 5.1 | | | | | | 1.2 | | | | | | 0.2 | | | | | | 6.5 | | | |
19. | | | | Bartholomäus Kalb | | | | | 31 Jan. –31 Dec. | | | | | | 5.1 | | | | | | 0.6 | | | | | | 1.2 | | | | | | 6.9 | | | |
20. | | | | Dr Markus Kerber | | | | | 1 Jan. – 31 Dec. | | | | | | 5.1 | | | | | | 1.2 | | | | | | 0.0 | | | | | | 6.3 | | | |
21. | | | | Stefan Körzell | | | | | 1 Jan. – 31 Dec. | | | | | | 5.1 | | | | | | 1.2 | | | | | | 0.6 | | | | | | 6.9 | | | |
22. | | | | Dr Matthias Kollatz-Ahnen2) | | | | | 6 Feb. – 31 Dec. | | | | | | 4.7 | | | | | | 0.5 | | | | | | 0.0 | | | | | | 5.2 | | | |
23. | | | | Dr Gesine Lötzsch | | | | | 1 Jan. – 31 Dec. | | | | | | 5.1 | | | | | | 1.2 | | | | | | 0.6 | | | | | | 6.9 | | | |
24. | | | | Dr Gerd Müller | | | | | 1 Jan. – 31 Dec. | | | | | | 0.0 | | | | | | 0.0 | | | | | | 0.0 | | | | | | 0.0 | | | |
25. | | | | Eckhardt Rehberg | | | | | 23 Apr. –31 Dec. | | | | | | 3.6 | | | | | | 0.8 | | | | | | 0.2 | | | | | | 4.6 | | | |
26. | | | | Joachim Rukwied | | | | | 1 Jan. – 31 Dec. | | | | | | 5.1 | | | | | | 0.6 | | | | | | 0.8 | | | | | | 6.5 | | | |
27. | | | | Dr Nils Schmid2) | | | | | 1 Jan. – 31 Dec. | | | | | | 5.1 | | | | | | 0.6 | | | | | | 0.2 | | | | | | 5.9 | | | |
28. | | | | Christian Schmidt | | | | | 1 Jan. – 31 Dec. | | | | | | 0.0 | | | | | | 0.0 | | | | | | 0.0 | | | | | | 0.0 | | | |
29. | | | | Andreas Schmitz | | | | | 1 Jan. – 31 Dec. | | | | | | 5.1 | | | | | | 2.5 | | | | | | 1.4 | | | | | | 9.0 | | | |
30. | | | | Carsten Schneider | | | | | 1 Jan. – 31 Dec. | | | | | | 5.1 | | | | | | 1.2 | | | | | | 1.0 | | | | | | 7.3 | | | |
31. | | | | Peter-Jürgen Schneider2) | | | | | 1 Jan. – 31 Dec. | | | | | | 5.1 | | | | | | 0.0 | | | | | | 0.4 | | | | | | 5.5 | | | |
32. | | | | Holger Schwannecke | | | | | 1 Jan. – 31 Dec. | | | | | | 5.1 | | | | | | 1.8 | | | | | | 0.0 | | | | | | 6.9 | | | |
33. | | | | Erwin Sellering2) | | | | | 1 Jan. – 31 Dec. | | | | | | 5.1 | | | | | | 1.2 | | | | | | 0.0 | | | | | | 6.3 | | | |
34. | | | | Dr Markus Söder2) | | | | | 1 Jan. – 31 Dec. | | | | | | 5.1 | | | | | | 1.2 | | | | | | 0.0 | | | | | | 6.3 | | | |
35. | | | | Dr Frank-Walter Steinmeier | | | | | 1 Jan. – 31 Dec. | | | | | | 0.0 | | | | | | 0.0 | | | | | | 0.0 | | | | | | 0.0 | | | |
36. | | | | Dr Norbert Walter-Borjans2) | | | | | 1 Jan. – 31 Dec. | | | | | | 5.1 | | | | | | 0.6 | | | | | | 0.0 | | | | | | 5.7 | | | |
37. | | | | Dr Martin Wansleben | | | | | 1 Jan. – 31 Dec. | | | | | | 5.1 | | | | | | 0.6 | | | | | | 0.0 | | | | | | 5.7 | | | |
38. | | | | Dr Kai H. Warnecke | | | | | 1 Jan. – 31 Dec. | | | | | | 5.1 | | | | | | 0.0 | | | | | | 0.6 | | | | | | 5.7 | | | |
Total | | | | | | | | | | | | | | | 152.6 | | | | | | 27.7 | | | | | | 11.4 | | | | | | 191.7 | | | |
| 1) | The amounts had not yet been paid out as of the reporting date 31 December 2015. |
| 2) | Amount governed by state law. |
155
KfW Financial Information 2016 Consolidated financial statements
There are no pension obligations for members of the Board of Supervisory Directors.
Members of the Board of Supervisory Directors received no compensation in the reporting year for personal services provided.
No direct loans were granted by KfW to members of the Board of Supervisory Directors in the reporting year.
Members of the Board of Supervisory Directors are also covered by a directors and officers liability insurance policy, which insures them against the risks of financial loss associated with their actions in their capacity as Supervisory Directors and by a supplemental legal expenses insurance policy. Currently there are no deductibles agreed. KfW’s Supervisory Directors acting in their capacity as such are also protected by a special legal expenses group policy for employees covering criminal activity and by a group accident insurance policy.
(83) Related party disclosures
In accordance with IAS 24, KfW Group’s related entities include the consolidated subsidiaries, the non-consolidated subsidiaries, joint ventures, associates and the interests held by the Federal Government.
Natural persons considered related parties in accordance with IAS 24 include the members of the Executive Board and of the Board of Supervisory Directors, the Directors of KfW, the managing directors of all subsidiaries included in the consolidated financial statements, the members of the supervisory boards of certain consolidated subsidiaries and their close family members.
KfW is a public-law institution in which the Federal Republic of Germany (Federal Republic) holds an 80 % stake and the Federal States hold a 20 % stake. Any transactions with the Federal Republic and the Federal States in financial year 2016 are covered by the rules and regulations set forth in the KfW Law. This also includes operations in which the Federal Republic of Germany has a state interest and for which the Federal Government has mandated KfW (mandated transactions in accordance with Article 2 (4) of the KfW Law). In addition to mandated transactions, the Federal Republic also has agency agreements with KfW, which primarily govern the individual promotional programmes.
The business relationships between KfW and natural persons considered related parties are primarily determined by the KfW Bylaws and by applying the principles of the Federal Public Corporate Governance Code. The conditions and prices reflect market conditions or are concluded in accordance with KfW’s general conditions for its loan programmes open to the general public.
156
KfW Financial Information 2016 Consolidated financial statements
(84) Auditor’s fees
| | | | | | | | | | | | | | | | | | | | | | | | | | | | | | |
| | | | | | | | | 2016 | | | | | | | | | | 2015 | | | | | | | | | | Change | | |
| | | | | | | | | EUR in thousands | | | | | | | | | | EUR in thousands | | | | | | | | | | EUR in thousands | | |
| | | | | | | | | | |
| Audit | | | | | | | | 3,945 | | | | | | | | | | 3,897 | | | | | | | | | | 48 | | |
Other attestation services | | | | | | | | 470 | | | | | | | | | | 782 | | | | | | | | | | –312 | | |
Tax advisory services | | | | | | | | 13 | | | | | | | | | | 197 | | | | | | | | | | –184 | | |
Total | | | | | | | | 4,427 | | | | | | | | | | 4,876 | | | | | | | | | | –449 | | |
The services provided by the auditor in 2016 with regard to auditing support for the major projects relating directly to accounting were included under auditing services in accordance with IDW HFA 36 n. F. (Disclosure Notes on Auditor’s Fee). The prior-year figures were restated for ease of comparison.
(85) Disclosures on unconsolidated structured entities
KfW Group’s unconsolidated structured entities within the meaning of IFRS 12 relate to the following business sectors:
Structured entities in the business sector Financial markets
KfW makes investments in ABS and ABCP transactions to promote the financing of German SMEs and as part of its liquidity management. The business sector Financial markets also manages an existing portfolio to which no further acquisitions are added. This portfolio currently consists of securities issued since 2001. As a general rule, KfW’s investments amount to a maximum of 10 % of the volume of an individual transaction. In cases of investments for promotional purposes, the proportion of KfW’s investment may be higher, but generally no more than 50 % of the transaction volume.
As of 31 December 2016, the carrying amount of the positions held totalled EUR 4.9 billion (31 Dec. 2015: EUR 4.2 billion).
Structured entities in the business sector Export and project finance
Tailored leasing/financing concepts are structured via property leasing companies, primarily in the “Aviation and Rail” and “Maritime Industries” sector departments. A separate entity is basically created for each transaction, with KfW Group participating as the lender. In the case of some of these business partners, the sponsoring banks act as managers of trust companies, but in the majority of cases, these business partners are set up as separate legal entities. KfW Group provides loans to these companies, generally together with other credit institutions. KfW also has credit relationships with some structured entities as market participants in the commodities financing business, where KfW Group supports these customers with export pre-financing structures.
157
KfW Financial Information 2016 Consolidated financial statements
As of 31 December 2016, the carrying amount of the positions held totalled EUR 4.3 billion (31 Dec. 2015: EUR 4.2 billion).
Structured entities in the business sector Promotion of developing countries and emerging economies
As a finance and advisory institution, DEG provides support within its development mandate in line with its business activity guidelines. DEG’s mandate is to promote the development of the private sector of a) developing countries, b) central and eastern European countries and New Independent States (NIS), and c) other countries approved by its shareholder KfW in agreement with the Federal Government. In certain isolated cases this is undertaken via investments in structured entities in the form of equity investments and loans. In accordance with the applied risk principles, the risk of loss is limited to the volume invested or committed.
As of 31 December 2016, the carrying amount of the positions held totalled EUR 0.2 billion (31 Dec. 2015: EUR 0.2 billion).
The following table shows the carrying amounts of assets relating to unconsolidated structured entities and the maximum possible loss that could result from these exposures.
158
KfW Financial Information 2016 Consolidated financial statements
Maximum risk of loss as of 31 December 2016
| | | | | | | | | | | | | | | | | | | | | | | | | | | | |
| | | | | | | Loans and advances to customers | | | | | | Securities and investments | | | | | | Other assets | | | | | | | | Contingent liabilities; irrevocable loan commit- ments | | |
| | | | | | | EUR in millions | | | | | | EUR in millions | | | | | | EUR in millions | | | | | | | | EUR in millions | | |
| | | | | | | | | | | | | | |
| Carrying amount | | | | | | 3,669 | | | | | | 4,983 | | | | | | 18 | | | | | | | | 857 | | |
Risk and other provisions | | | | | | 25 | | | | | | 0 | | | | | | 0 | | | | | | | | 1 | | |
Max. risk of loss | | | | | | 3,644 | | | | | | 4,983 | | | | | | 18 | | | | | | | | 856 | | |
Maximum risk of loss as of 31 December 2015
| | | | | | | | | | | | | | | | | | | | | | | | | | | | |
| | | | | | | Loans and advances to customers | | | | | | Securities and investments | | | | | | Other assets | | | | | | | | Contingent liabilities; irrevocable loan commit- ments | | |
| | | | | | | EUR in millions | | | | | | EUR in millions | | | | | | EUR in millions | | | | | | | | EUR in millions | | |
| | | | | | | | | | | | | | |
| Carrying amount | | | | | | 4,054 | | | | | | 4,243 | | | | | | 48 | | | | | | | | 389 | | |
Risk and other provisions | | | | | | 23 | | | | | | 1 | | | | | | 0 | | | | | | | | 1 | | |
Max. risk of loss | | | | | | 4,031 | | | | | | 4,243 | | | | | | 48 | | | | | | | | 389 | | |
The maximum risk of loss is equal to the nominal amount for credit lines, (financial) guarantees and other liquidity facilities less the provisions for credit risks recognised in the statement of financial position. The maximum risk of loss relating to KfW Group’s investments is their carrying amount (net). The maximum risk of loss does not include effects from KfW Group’s hedging instruments used to reduce the maximum risk of loss.
No support is provided to structured entities in KfW Group beyond the respective financing.
In exceptional cases, KfW Group acts as the sponsor for structured entities in which it holds shares purely on a trust basis on behalf of the Federal Republic. The risk of these structured entities lies exclusively with the Federal Republic. In such cases, KfW Group is considered as the sponsor of the structured entities because the entities were initiated and/or structured by KfW Group on behalf of the Federal Republic.
159
KfW Financial Information 2016 Consolidated financial statements
(86) Disclosures on shareholdings
Subsidiaries included in the consolidated financial statements
| | | | | | | | | | | | | | | | |
| Name/registered office | | | | | | Capital share | | | | | | Equity (IFRS) | | | | |
| | | | | | | | | | | | | as of 31 Dec. 2016 | | | | |
| | | | | | | % | | | | | | EUR in millions | | | | |
KfW IPEX-Bank GmbH, Frankfurt am Main, Germany | | | | | | 100.0 | | | | | | 3,831 | | | | |
DEG – Deutsche Investitions- und Entwicklungsgesellschaft mbH, Cologne, Germany | | | | | | 100.0 | | | | | | 2,799 | | | | |
KfW Beteiligungsholding GmbH, Bonn, Germany | | | | | | 100.0 | | | | | | 2,550 | | | | |
tbg Technologie-Beteiligungs-Gesellschaft mbH, Bonn, Germany | | | | | | 100.0 | | | | | | 184 | | | | |
Interkonnektor GmbH, Frankfurt am Main, Germany | | | | | | 100.0 | | | | | | 25 | | | | |
Tax consolidation for income tax purposes was established in financial year 2016 between KfW IPEX-Bank GmbH and KfW Beteiligungsholding GmbH with retrospective effect from 1 January 2016. In this context, KfW IPEX-Beteiligungsholding GmbH was merged into KfW Beteiligungsholding GmbH.
Associates included in the consolidated financial statements using the equity method
| | | | | | | | | | | | | | | | | | | | |
| Name/registered office | | | | | | Capital share | | | | | | Equity | | | | | | |
| | | | | | | | | | | | | as of 30 Sept. 2016 | | | | | | | | |
| | | | | | | % | | | | | | EUR in millions | | | | | | |
Microfinance Enhancement Facility S. A., Luxembourg, Luxembourg | | | | | | 19.8 | | | | | | 496 | | | | | | | | |
Green for Growth Fund, Southeast Europe S. A., Luxembourg, Luxembourg | | | | | | 17.6 | | | | | | 311 | | | | | | | | |
AF Eigenkapitalfonds für deutschen Mittelstand GmbH & Co. KG, Munich, Germany | | | | | | 47.5 | | | | | | 193 | | | | | | | | |
coparion GmbH & Co. KG, Cologne, Germany | | | | | | 20.0 | | | | | | 3 | | | | | | | | |
Name/registered office | | | | | | Capital share | | | | | | Equity | | | | | | |
| | | | | | | | | | | | | as of 31 Dec. 2016 | | | | | | | | |
| | | | | | | % | | | | | | EUR in millions | | | | | | |
DC Nordseekabel GmbH und Co. KG, Bayreuth, Germany | | | | | | 50.0 | | | | | | 186 | | | | | | | | |
Microfinance Enhancement Facility S.A. (MEF) has been accounted for using the equity method since 2009. MEF, a KfW investment in a refinancing facility for microfinance institutions, is part of the business sector Promotion of developing countries and emerging economies. Details of the business sectors as well as a summary of financial information can be found on the company’s website (http://www.mef-fund.com/).
160
KfW Financial Information 2016 Consolidated financial statements
Green for Growth Fund, Southeast Europe S.A. (GGF) has been included in the consolidated financial statements using the equity method since 2010. GGF is a fund to promote SME and private household investment in energy efficiency and renewable energy in the Western Balkans and in Turkey (KfW’s investment in GGF is also part of the business sector Promotion of developing countries and emerging economies). Details of GGF’s business sectors as well as a summary of financial information can be found on the company’s website (http://www.ggf.lu).
The business sector Mittelstandsbank (SME Bank) initiated the Eigenkapitalfonds für deutschen Mittelstand (German SME Equity Fund) together with Commerzbank in July 2010, each providing funds of almost EUR 100 million. It is accounted for using the equity method. The fund focuses on small and medium-sized (family) companies with a maximum annual revenue of EUR 500 million. The fund acquires minority interests and provides the company with real equity particularly for the purpose of financing growth.
DC Nordseekabel GmbH und Co. KG (DC Nordseekabel) was accounted for using the equity method, as a joint venture of Interkonnektor GmbH (Nordseekabel-Projekt NordLink in the business sector Export and project finance), for the first time in the financial year 2015. The NordLink project is one of the major projects in the European energy sector and comprises an investment volume of around EUR 1.5 to 2 billion. As it will primarily serve as a conduit for renewably sourced energy, the underwater cable will play an important role in the success of Germany’s energy transition. Norwegian state-owned power grid operator Statnett, KfW and the transmission systems operator TenneT, which is responsible for the German territory of the North Sea, concluded a cooperation agreement in February 2015 to construct an underwater cable between Germany and Norway. The NordLink project will be realised by a syndicate, in which Statnett and DC Nordseekabel each hold a 50 % stake. KfW – via its subsidiary Interkonnektor GmbH – and TenneT each hold a 50 % stake in DC Nordseekabel, which is responsible for construction and obtaining permits in Germany.
coparion GmbH & Co. KG (coparion; business sector Mittelstandsbank (SME Bank)) as an associated company was accounted for using the equity method for the first time in financial year 2016.
coparion, the new co-investment fund of the Federal Ministry for Economic Affairs and Energy (Bundesministerium für Wirtschaft und Energie – “BMWi”), commenced its activities in March 2016. Together with lead private investors, coparion invests venture capital in young technology companies.
Entities not included in the consolidated financial statements
Three subsidiaries, five joint ventures, eleven associated companies, and eight special purpose vehicles (including structured entities) of minor significance to the presentation of the net assets, financial position and results of operations of KfW Group have not been consolidated; instead, they are shown in the statement of financial position under Securities and investments or Loans and advances. These companies account for approximately 0.1 % of KfW Group’s total assets.
161
KfW Financial Information 2016 Consolidated financial statements
List of KfW Group shareholdings as of 31 December 2016
| | | | | | | | | | | | | | | | | | | | | | | | | | | | | | | | | | | | | | | | | | | | | | | | | | | | | | |
| No. | | | | | Name | | | | | | | Place | | | | | | | Capital | | | | | | | CC1) | | | | | | | Exchange rate | | | | | | | Equity in | | | | | | | Net income in |
| | | | | | | | | | | | | | | | | | | | share | | | | | | | | | | | | | | EUR 1.00 | | | | | | | TCU2), 3) | | | | | | | TCU2), 3) |
| | | | | | | | | | | | | | | | | | | | in% | | | | | | | | | | | | | | = CU2) as of | | | | | | | | | | | | | | |
| | | | | | | | | | | | | | | | | | | | | | | | | | | | | | | | | | | | | | 31 Dec. 2016 | | | | | | | | | | | | | | | | |
|
KfW shareholdings |
A. Fully consolidated subsidiaries included in the consolidated financial statements |
1 | | | | | | DEG - Deutsche Investitions- und Entwicklungsgesellschaft mbH | | | | | | | | Cologne, Germany | | | | | | | | 100.0 | | | | | | | | EUR | | | | | | | | 1.0000 | | | | | | | | 2,367,946 | | | | | | | | 96,315 |
2 | | | | | | Interkonnektor GmbH | | | | | | | | Frankfurt am | | | | | | | | | | | | | | | | | | | | | | | | | | | | | | | | | | | | | | | | |
| | | | | | | | | | | | | | Main, Germany | | | | | | | | 100.0 | | | | | | | | EUR | | | | | | | | 1.0000 | | | | | | | | 25,445 | | | | | | | | –1,287 |
3 | | | | | | KfW Beteiligungsholding GmbH | | | | | | | | Bonn, Germany | | | | | | | | 100.0 | | | | | | | | EUR | | | | | | | | 1.0000 | | | | | | | | 1,707,890 | | | | | | | | 100,551 |
4 | | | | | | tbg Technologie- | | | | | | | | | | | | | | | | | | | | | | | | | | | | | | | | | | | | | | | | | | | | | | | | |
| | | | | | | Beteiligungsgesellschaft mbH | | | | | | | | Bonn, Germany | | | | | | | | 100.0 | | | | | | | | EUR | | | | | | | | 1.0000 | | | | | | | | 177,321 | | | | | | | | 8,721 |
B. Joint ventures not included in the consolidated financial statements | | | | | | | | | | | | | | | | | | | | | | | | |
5 | | | | | | Deutsche Energie-Agentur | | | | | | | | | | | | | | | | | | | | | | | | | | | | | | | | | | | | | | | | | | | | | | | | |
| | | | | | GmbH (dena) | | | | | | | | Berlin, Germany | | | | | | | | 26.0 | | | | | | | | EUR | | | | | | | | 1.0000 | | | | | | | | 4,527 | | | | | | | | –1,255 |
6 | | | | | | Finanzierungs- und | | | | | | | | | | | | | | | | | | | | | | | | | | | | | | | | | | | | | | | | | | | | | | | | |
| | | | | | | Beratungsgesellschaft mbH | | | | | | | | Berlin, Germany | | | | | | | | 100.0 | | | | | | | | EUR | | | | | | | | 1.0000 | | | | | | | | 13,728 | | | | | | | | 31 |
C. Other shareholdings (only capital shares totalling at least 20%) |
7 | | | | | | AF Eigenkapitalfonds für deutschen | | | | | | | | Munich, | | | | | | | | | | | | | | | | | | | | | | | | | | | | | | | | | | | | | | | | |
| | | | | | Mittelstand GmbH & Co. KG | | | | | | | | Germany | | | | | | | | 47.5 | | | | | | | | EUR | | | | | | | | 1.0000 | | | | | | | | 148,307 | | | | | | | | 7,584 |
8 | | | | | | Berliner Energieagentur GmbH | | | | | | | | Berlin, Germany | | | | | | | | 25.0 | | | | | | | | EUR | | | | | | | | 1.0000 | | | | | | | | 5,261 | | | | | | | | 446 |
9 | | | | | | eCapital Technologies | | | | | | | | Münster, | | | | | | | | | | | | | | | | | | | | | | | | | | | | | | | | | | | | | | | | |
| | | | | | Fonds II GmbH & Co. KG | | | | | | | | Germany | | | | | | | | 24.8 | | | | | | | | EUR | | | | | | | | 1.0000 | | | | | | | | 21,707 | | | | | | | | –1,193 |
10 | | | | | | Galaxy S. à. r. l. | | | | | | | | Luxembourg, | | | | | | | | | | | | | | | | | | | | | | | | | | | | | | | | | | | | | | | | |
| | | | | | | | | | | | | | | Luxembourg | | | | | | | | 20.0 | | | | | | | | EUR | | | | | | | | 1.0000 | | | | | | | | 7,227 | | | | | | | | –584 |
162
KfW Financial Information 2016 Consolidated financial statements
List of KfW Group shareholdings as of 31 December 2016
| | | | | | | | | | | | | | | | | | | | | | | | | | | | | | | | | | | | | | | | | | | | | | | | | | | | | | | | | | |
| No. | | | | | Name | | | | | | Place | | | | | | | Capital | | | | | | | CC1)
| | | | | | | | Exchange rate | | | | | | | Equity in | | | | | | | Net income in | | | |
| | | | | | | | | | | | | | | | | | | share | | | | | | | | | | | | | | | EUR 1.00 | | | | | | | TCU2), 3) | | | | | | | TCU2), 3) | | | |
| | | | | | | | | | | | | | | | | | | in% | | | | | | | | | | | | | | | = CU2) as of | | | | | | | | | | | | | | | | | |
| | | | | | | | | | | | | | | | | | | | | | | | | | | | | | | | | 31 Dec. 2016 | | | | | | | | | | | | | | | | | |
| | | | | | | | | | | | | |
| Shareholdings of KfW IPEX-Bank GmbH | | | | | | | | | | | | | | | | | | | | | | | | | | | | | | | | | | | | | | |
A. Subsidiaries not included in the consolidated financial statements | | | | | | |
1 | | | | | | Bussard Air Leasing Ltd. | | | | | | Dublin, Ireland | | | | | | | | 100.0 | | | | | | | | USD | | | | | | | | | | 1.0541 | | | | | | | | –2,317 | | | | | | | | 218 | | | | |
2 | | | | | | Sperber Rail Holdings Inc. | | | | | | Wilmington, USA | | | | | | | | 100.0 | | | | | | | | USD | | | | | | | | | | 1.0541 | | | | | | | | 2,445 | | | | | | | | –90 | | | | |
B. Joint ventures not included in the consolidated financial statements | | | | | | |
3 | | | | | | Canas Leasing Ltd. | | | | | | Dublin, Ireland | | | | | | | | 50.0 | | | | | | | | USD | | | | | | | | | | 1.0541 | | | | | | | | 0 | | | | | | | | 0 | | | | |
C. Other shareholdings (only capital shares totalling at least 20%) | | | | | | |
4 | | | | | | 8F Leasing S.A. | | | | | | Findel, | | | | | | | | | | | | | | | | | | | | | | | | | | | | | | | | | | | | | | | | | | | | | | |
| | | | | | | | | | | | | Luxembourg | | | | | | | | 22.2 | | | | | | | | USD | | | | | | | | | | 1.0541 | | | | | | | | 11,785 | | | | | | | | 429 | | | | |
| | | | | | | | | | | | | |
| Shareholdings of tbg Technologie-Beteiligungs-Gesellschaft mbH | | | | | | | | | | | | | | | | | | | | | | | | | | | | | | | | | | | | | | |
A. Subsidiaries not included in the consolidated financial statements | | | | | | |
1 | | | | | | Strategic European Technologies N.V. | | | | | | ‘s-Hertogen- bosch, Netherlands | | | | | | | | 52.0 | | | | | | | | EUR | | | | | | | | | | 1.0000 | | | | | | | | 3,692 | | | | | | | | 9,485 | | | | |
B. Other shareholdings (only capital shares totalling at least 20%) | | | | | | |
2 | | | | | | Aurelia Technologie-Fonds I GmbH & Co. Beteiligungen KG | | | | | | Frankfurt am Main, Germany | | | | | | | | 24.6 | | | | | | | | EUR | | | | | | | | | | 1.0000 | | | | | | | | 4,486 | | | | | | | | –207 | | | | |
3 | | | | | | BioM VC GmbH & Co. Fonds KG | | | | | | Munich, Germany | | | | | | | | 22.3 | | | | | | | | EUR | | | | | | | | | | 1.0000 | | | | | | | | 450 | | | | | | | | –3 | | | | |
4 | | | | | | Bremer Unternehmens- beteiligungsgesellschaft mbH | | | | | | Bremen, Germany | | | | | | | | 20.0 | | | | | | | | EUR | | | | | | | | | | 1.0000 | | | | | | | | 6,937 | | | | | | | | 53 | | | | |
5 | | | | | | Chromatec GmbH | | | | | | Greifswald, | | | | | | | | | | | | | | | | | | | | | | | | | | | | | | | | | | | | | | | | | | | | | | |
| | | | | | | | | | | | Germany | | | | | | | | 24.8 | | | | | | | | EUR | | | | | | | | | | 1.0000 | | | | | | | | 40 | | | | | | | | 5 | | | | |
6 | | | | | | CV Cryptovision GmbH | | | | | | Gelsenkirchen, | | | | | | | | | | | | | | | | | | | | | | | | | | | | | | | | | | | | | | | | | | | | | | |
| | | | | | | | | | | | Germany | | | | | | | | 23.4 | | | | | | | | EUR | | | | | | | | | | 1.0000 | | | | | | | | 2,956 | | | | | | | | 206 | | | | |
7 | | | | | | eCapital New Technologies Fonds AG & Co. Unternehmensbeteiligungs- | | | | | | Münster, | | | | | | | | | | | | | | | | | | | | | | | | | | | | | | | | | | | | | | | | | | | | | | |
| | | | | | gesellschaft KG | | | | | | Germany | | | | | | | | 24.8 | | | | | | | | EUR | | | | | | | | | | 1.0000 | | | | | | | | 623 | | | | | | | | –30 | | | | |
8 | | | | | | FIB Fonds für Innovation und Beschäf- tigung Rheinland-Pfalz UBG mbH | | | | | | Mainz, Germany | | | | | | | | 24.0 | | | | | | | | EUR | | | | | | | | | | 1.0000 | | | | | | | | 4,088 | | | | | | | | 720 | | | | |
9 | | | | | | i42 Informationsmanagement GmbH | | | | | | Mannheim, Germany | | | | | | | | 20.8 | | | | | | | | EUR | | | | | | | | | | 1.0000 | | | | | | | | 31 | | | | | | | | 10 | | | | |
10 | | | | | | KTB Technologie Beteiligungs- | | | | | | Leverkusen, | | | | | | | | | | | | | | | | | | | | | | | | | | | | | | | | | | | | | | | | | | | | | | |
| | | | | | gesellschaft mbH & Co. KG | | | | | | Germany | | | | | | | | 25.0 | | | | | | | | EUR | | | | | | | | | | 1.0000 | | | | | | | | 0 | | | | | | | | –2,320 | | | | |
11 | | | | | | Medizin Forum AG | | | | | | Bad Nauheim, | | | | | | | | | | | | | | | | | | | | | | | | | | | | | | | | | | | | | | | | | | | | | | |
| | | | | | | | | | | | Germany | | | | | | | | 24.9 | | | | | | | | EUR | | | | | | | | | | 1.0000 | | | | | | | | 26 | | | | | | | | 0 | | | | |
12 | | | | | | Premium Bodywear AG | | | | | | Chemnitz, | | | | | | | | | | | | | | | | | | | | | | | | | | | | | | | | | | | | | | | | | | | | | | |
| | | | | | | | | | | | Germany | | | | | | | | 24.0 | | | | | | | | EUR | | | | | | | | | | 1.0000 | | | | | | | | 176 | | | | | | | | –70 | | | | |
13 | | | | | | Saarländische Wagnisfinanzierungs- | | | | | | Saarbrücken, | | | | | | | | | | | | | | | | | | | | | | | | | | | | | | | | | | | | | | | | | | | | | | |
| | | | | | gesellschaft mbH | | | | | | Germany | | | | | | | | 20.4 | | | | | | | | EUR | | | | | | | | | | 1.0000 | | | | | | | | 6,403 | | | | | | | | 92 | | | | |
14 | | | | | | Sachsen LB V.C. GmbH & Co. KG | | | | | | Leipzig, Germany | | | | | | | | 24.8 | | | | | | | | EUR | | | | | | | | | | 1.0000 | | | | | | | | 1,628 | | | | | | | | 337 | | | | |
15 | | | | | | Sepiatec GmbH | | | | | | Berlin, Germany | | | | | | | | 21.9 | | | | | | | | EUR | | | | | | | | | | 1.0000 | | | | | | | | 168 | | | | | | | | –34 | | | | |
16 | | | | | | SHS Gesellschaft für Beteiligungen | | | | | | Tübingen, | | | | | | | | | | | | | | | | | | | | | | | | | | | | | | | | | | | | | | | | | | | | | | |
| | | | | | mbH & Co. Mittelstand KG | | | | | | Germany | | | | | | | | 24.8 | | | | | | | | EUR | | | | | | | | | | 1.0000 | | | | | | | | 4,011 | | | | | | | | 0 | | | | |
17 | | | | | | Technologie Beteiligungsfonds | | | | | | Munich, | | | | | | | | | | | | | | | | | | | | | | | | | | | | | | | | | | | | | | | | | | | | | | |
| | | | | | Bayern GmbH & Co. KG | | | | | | Germany | | | | | | | | 25.0 | | | | | | | | EUR | | | | | | | | | | 1.0000 | | | | | | | | 1,074 | | | | | | | | –269 | | | | |
18 | | | | | | Technologie Beteiligungsfonds | | | | | | Landshut, | | | | | | | | | | | | | | | | | | | | | | | | | | | | | | | | | | | | | | | | | | | | | | |
| | | | | | | Bayern Verwaltungs-GmbH | | | | | | Germany | | | | | | | | 25.0 | | | | | | | | EUR | | | | | | | | | | 1.0000 | | | | | | | | 42 | | | | | | | | 2 | | | | |
163
KfW Financial Information 2016 Consolidated financial statements
List of KfW Group shareholdings as of 31 December 2016
| | | | | | | | | | | | | | | | | | | | | | | | | | | | | | | | | | | | | | | | | | | | | | | | | | | | | | | | |
| No. | | | | | Name | | | | | | Place | | | | | | | Capital | | | | | | | CC 1) | | | | | | | Exchange rate | | | | | | | Equity in | | | | | | | Net income in | | | |
| | | | | | | | | | | | | | | | | | | share | | | | | | | | | | | | | | EUR 1.00 | | | | | | | TCU2), 3) | | | | | | | TCU2), 3) | | | |
| | | | | | | | | | | | | | | | | | | in % | | | | | | | | | | | | | | = CU2) as of | | | | | | | | | | | | | | | | | |
| | | | | | | | | | | | | | | | | | | | | | | | | | | | | | | | 31 Dec. 2016 | | | | | | | | | | | | | | | | | |
| | | | | | | | | |
Shareholdings of tbg Technologie-Beteiligungs-Gesellschaft mbH | | | | | | | | | | | | | | | | | | | | | | | | | |
B. Other shareholdings (only capital shares totalling at least 20%) | | | | |
19 | | | | | | Tübinger Seed Fonds KG | | | | | | Tübingen, | | | | | | | | | | | | | | | | | | | | | | | | | | | | | | | | | | | | | | | | | | | | |
| | | | | | | | | | | | Germany | | | | | | | | 21.9 | | | | | | | | EUR | | | | | | | | 1.0000 | | | | | | | | 631 | | | | | | | | –1 | | | | |
20 | | | | | | Wikon Kommunikationstechnik GmbH | | | | | | Kaiserslautern, Germany | | | | | | | | 20.0 | | | | | | | | EUR | | | | | | | | 1.0000 | | | | | | | | 0 | | | | | | | | 64 | | | | |
| | | | | | | | | | | | |
Shareholdings of KfW Beteiligungsholding GmbH | | | | | | | | | | | | | | | | | | | | | | | | | | | | | | | | | |
A. Fully consolidated subsidiaries included in the consolidated financial statements | | | | |
1 | | | | | | KfW IPEX-Bank GmbH | | | | | | Frankfurt am | | | | | | | | | | | | | | | | | | | | | | | | | | | | | | | | | | | | | | | | | | | | |
| | | | | | | | | | | | | Main, Germany | | | | | | | | 100.0 | | | | | | | | EUR | | | | | | | | 1.0000 | | | | | | | | 3,474,441 | | | | | | | | 0 | | | | |
| | | | | | |
Shareholdings of DEG – Deutsche Investitions- und Entwicklungsgesellschaft mbH | | | | | | | | | | | | | | | | | |
A. Joint ventures not included in the consolidated financial statements | | | | |
1 | | | | | | PCC-DEG Renewables GmbH | | | | | | Duisburg, | | | | | | | | | | | | | | | | | | | | | | | | | | | | | | | | | | | | | | | | | | | | |
| | | | | | | | | | | | | Germany | | | | | | | | 40.0 | | | | | | | | EUR | | | | | | | | 1.0000 | | | | | | | | 16,266 | | | | | | | | –3,085 | | | | |
B. Other shareholdings (only capital shares totalling at least 20%) | | | | |
2 | | | | | | Aavishkaar Frontier Fund | | | | | | Ebene, Mauritius | | | | | | | | 22.2 | | | | | | | | USD | | | | | | | | 1.0541 | | | | | | | | 1,007 | | | | | | | | –1,243 | | | | |
3 | | | | | | Ace Power Pvt. Ltd. | | | | | | Colombo, Sri Lanka | | | | | | | | 26.0 | | | | | | | | LKR | | | | | | | | 157.9865 | | | | | | | | 1,979,800 | | | | | | | | –543,671 | | | | |
4 | | | | | | Acon Latin American Opportunities Fund | | | | | | Toronto, Canada | | | | | | | | 40.0 | | | | | | | | USD | | | | | | | | 1.0541 | | | | | | | | 53,883 | | | | | | | | –12,711 | | | | |
5 | | | | | | Acon Latin American Opportunities Fund IV-A, L.P. | | | | | | Toronto, Canada | | | | | | | | 39.9 | | | | | | | | USD | | | | | | | | 1.0541 | | | | | | | | 27,251 | | | | | | | | 470 | | | | |
6 | | | | | | Acon Retail MXD, L.P. | | | | | | Toronto, Canada | | | | | | | | 100.0 | | | | | | | | USD | | | | | | | | 1.0541 | | | | | | | | 22,554 | | | | | | | | –1,527 | | | | |
7 | | | | | | Adobe Social Mezzanine Fund, L.P. | | | | | | Mexico D.F., Mexico | | | | | | | | 24.8 | | | | | | | | USD | | | | | | | | 1.0541 | | | | | | | | 7,559 | | | | | | | | –769 | | | | |
8 | | | | | | ADP Enterprises W.L.L. | | | | | | Manama, Bahrain | | | | | | | | 23.2 | | | | | | | | BHD | | | | | | | | 0.3977 | | | | | | | | 156,202 | | | | | | | | –29,368 | | | | |
9 | | | | | | Advent Latin American Private Equity Fund III-B L.P. | | | | | | Wilmington, USA | | | | | | | | 100.0 | | | | | | | | USD | | | | | | | | 1.0541 | | | | | | | | 2,368 | | | | | | | | –621 | | | | |
10 | | | | | | Agribusiness Latin America Fund II L.P. | | | | | | Toronto, Canada | | | | | | | | 27.0 | | | | | | | | USD | | | | | | | | 1.0541 | | | | | | | | 04) | | | | | | | | 04) | | | | |
11 | | | | | | Apis Growth 2 Ltd. | | | | | | Ebene, Mauritius | | | | | | | | 28.4 | | | | | | | | USD | | | | | | | | 1.0541 | | | | | | | | 04) | | | | | | | | 04) | | | | |
12 | | | | | | Aqua Agro Fundo de Investimento | | | | | | São Paulo, Brazil | | | | | | | | 30.4 | | | | | | | | BRL | | | | | | | | 3.4326 | | | | | | | | 04) | | | | | | | | 04) | | | | |
164
KfW Financial Information 2016 Consolidated financial statements
List of KfW Group shareholdings as of 31 December 2016
| | | | | | | | | | | | | | | | | | | | | | | | | | | | | | | | | | | | | | | | | | | | | | | | | | | | | | | | |
No. | | | | | | Name | | | | | | | | Place | | | | | | | | Capital | | | | | | | | CC1) | | | | | | | | Exchange rate | | | | | | | | Equity in | | | | | | | | Net income in TCU2), 3) | | |
| | | | | | | | | | | | | | | | | | | | | | share | | | | | | | | | | | | | | | | EUR 1.00 | | | | | | | | TCU2), 3) | | | | | | | | | |
| | | | | | | | | | | | | | | | | | | | | | in % | | | | | | | | | | | | | | | | = CU2) as of | | | | | | | | | | | | | | | | | |
| | | | | | | | | | | | | | | | | | | | | | | | | | | | | | | | | 31 Dec. 2016 | | | | | | | | | | | | | | | | |
|
| Shareholdings of DEG – Deutsche Investitions- und Entwicklungsgesellschaft mbH |
B. Other shareholdings (only capital shares totalling at least 20%) |
13 | | | | | | Asia Insurance 1950 Company Ltd. | | | | | | | | Bangkok, Thailand | | | | | | | | 24.6 | | | | | | | | THB | | | | | | | | 37.7459 | | | | | | | | 314,204 | | | | | | | | 67,309 | | |
14 | | | | | | Banyan Tree Growth Capital LLC | | | | | | | | Port Louis, | | | | | | | | | | | | | | | | | | | | | | | | | | | | | | | | | | | | | | | | | | |
| | | | | | | | | | | | | | Mauritius | | | | | | | | 27.0 | | | | | | | | USD | | | | | | | | 1.0541 | | | | | | | | 91,932 | | | | | | | | –7,077 | | |
15 | | | | | | Berkeley Energy Wind Mauritius Ltd. | | | | | | | | Ebene, Mauritius | | | | | | | | 25.8 | | | | | | | | EUR | | | | | | | | 1.0000 | | | | | | | | 97,043 | | | | | | | | 10,902 | | |
16 | | | | | | Catalyst MENA Clean Energy Fund L.P. | | | | | | | | St. Peter Port, Guernsey | | | | | | | | 23.3 | | | | | | | | USD | | | | | | | | 1.0541 | | | | | | | | 04) | | | | | | | | 04) | | |
17 | | | | | | CGFT Capital Pooling GmbH & Co. KG | | | | | | | | Berlin, Germany | | | | | | | | 40.0 | | | | | | | | EUR | | | | | | | | 1.0000 | | | | | | | | –38 | | | | | | | | 24 | | |
18 | | | | | | CoreCo Central America Fund I L.P. | | | | | | | | Miami, USA | | | | | | | | 22.0 | | | | | | | | USD | | | | | | | | 1.0541 | | | | | | | | 5,461 | | | | | | | | 1,446 | | |
19 | | | | | | Deep Catch Namibia Holdings | | | | | | | | Windhoek, | | | | | | | | | | | | | | | | | | | | | | | | | | | | | | | | | | | | | | | | | | |
| | | | | | (Proprietary) Ltd. | | | | | | | | Namibia | | | | | | | | 30.0 | | | | | | | | NAD | | | | | | | | 14.7902 | | | | | | | | 04) | | | | | | | | 04) | | |
20 | | | | | | Emerald Sri Lanka Fund I Limited | | | | | | | | Port Louis, | | | | | | | | | | | | | | | | | | | | | | | | | | | | | | | | | | | | | | | | | | |
| | | | | | | | | | | | | | Mauritius | | | | | | | | 23.5 | | | | | | | | USD | | | | | | | | 1.0541 | | | | | | | | –492 | | | | | | | | –1,464 | | |
21 | | | | | | Emerging Europe Leasing | | | | | | | | Amsterdam, | | | | | | | | | | | | | | | | | | | | | | | | | | | | | | | | | | | | | | | | | | |
| | | | | | and Finance (EELF) B.V. | | | | | | | | Netherlands | | | | | | | | 25.0 | | | | | | | | EUR | | | | | | | | 1.0000 | | | | | | | | 04) | | | | | | | | 04) | | |
22 | | | | | | EMF NEIF I (A) L.P. | | | | | | | | Southampton, | | | | | | | | | | | | | | | | | | | | | | | | | | | | | | | | | | | | | | | | | | |
| | | | | | | | | | | | | | UK | | | | | | | | 28.1 | | | | | | | | USD | | | | | | | | 1.0541 | | | | | | | | 10,709 | | | | | | | | –14,316 | | |
23 | | | | | | EMX Capital Partners L.P. | | | | | | | | Mexico D.F., | | | | | | | | | | | | | | | | | | | | | | | | | | | | | | | | | | | | | | | | | | |
| | | | | | | | | | | | | | Mexico | | | | | | | | 20.1 | | | | | | | | USD | | | | | | | | 1.0541 | | | | | | | | 24,678 | | | | | | | | –2,616 | | |
24 | | | | | | Equis DFI Feeder, L.P. | | | | | | | | George Town, | | | | | | | | | | | | | | | | | | | | | | | | | | | | | | | | | | | | | | | | | | |
| | | | | | | | | | | | | | Cayman Islands | | | | | | | | 37.0 | | | | | | | | USD | | | | | | | | 1.0541 | | | | | | | | 3,527 | | | | | | | | –1,004 | | |
25 | | | | | | Fundo Mútuo de Investimentos em Empresas Emergentes Stratus Fleet | | | | | | | | São Paulo, Brazil | | | | | | | | 39.7 | | | | | | | | BRL | | | | | | | | 3.4326 | | | | | | | | 25,881 | | | | | | | | –6,823 | | |
26 | | | | | | Global Credit Rating Company Ltd. | | | | | | | | Sandton, Johannesburg, South Africa | | | | | | | | 27.0 | | | | | | | | USD | | | | | | | | 1.0541 | | | | | | | | 708 | | | | | | | | 3,425 | | |
27 | | | | | | Grassland Finance Ltd. | | | | | | | | Hong Kong, | | | | | | | | | | | | | | | | | | | | | | | | | | | | | | | | | | | | | | | | | | |
| | | | | | | | | | | | | | Hong Kong | | | | | | | | 25.0 | | | | | | | | HKD | | | | | | | | 8.1751 | | | | | | | | 448,199 | | | | | | | | –26,371 | | |
28 | | | | | | Kendall Court Mezzanine (Asia) Bristol Merit Fund L.P. | | | | | | | | Cayman Islands | | | | | | | | 24.4 | | | | | | | | USD | | | | | | | | 1.0541 | | | | | | | | 35,579 | | | | | | | | 4,494 | | |
29 | | | | | | Kibele B.V., Amsterdam, Netherlands | | | | | | | | Amsterdam, Netherlands | | | | | | | | 22.3 | | | | | | | | USD | | | | | | | | 1.0541 | | | | | | | | 1,506 | | | | | | | | –24,532 | | |
30 | | | | | | Knauf Gips Buchara OOO | | | | | | | | Bukhara, | | | | | | | | | | | | | | | | | | | | | | | | | | | | | | | | | | | | | | | | | | |
| | | | | | | | | | | | | | Uzbekistan | | | | | | | | 24.9 | | | | | | | | EUR | | | | | | | | 1.0000 | | | | | | | | 135,608,205 | | | | | | | | 23,390,251 | | |
31 | | | | | | Lereko Metier Solafrica Fund I Trust | | | | | | | | Johannesburg, South Africa | | | | | | | | 47.5 | | | | | | | | ZAR | | | | | | | | 14.4570 | | | | | | | | 138,122 | | | | | | | | –1,421 | | |
32 | | | | | | Lereko Metier REIPPP Fund Trust | | | | | | | | Johannesburg, | | | | | | | | | | | | | | | | | | | | | | | | | | | | | | | | | | | | | | | | | | |
| | | | | | | | | | | | | | South Africa | | | | | | | | 32.6 | | | | | | | | ZAR | | | | | | | | 14.4570 | | | | | | | | 8,859 | | | | | | | | –824 | | |
�� 33 | | | | | | Lovcen Banka AD | | | | | | | | Podgorica, | | | | | | | | | | | | | | | | | | | | | | | | | | | | | | | | | | | | | | | | | | |
| | | | | | | | | | | | | | Montenegro | | | | | | | | 28.1 | | | | | | | | EUR | | | | | | | | 1.0000 | | | | | | | | 5,849 | | | | | | | | –1,760 | | |
34 | | | | | | MC II Pasta Ltd. | | | | | | | | Qormi, Malta | | | | | | | | 36.1 | | | | | | | | EUR | | | | | | | | 1.0000 | | | | | | | | 04) | | | | | | | | 04) | | |
35 | | | | | | Medisia Investment Holdings Pte. Ltd. | | | | | | | | Singapore, Singapore | | | | | | | | 32.7 | | | | | | | | USD | | | | | | | | 1.0541 | | | | | | | | 40,050 | | | | | | | | –1,252 | | |
165
KfW Financial Information 2016 Consolidated financial statements
List of KfW Group shareholdings as of 31 December 2016
| | | | | | | | | | | | | | | | | | | | | | | | | | | | | | | | | | | | | | | | | | | | | | | | | | | | | | | | |
No. | | | | | | Name | | | | | | | | Place | | | | | | | | Capital | | | | | | | | CC1) | | | | | | | | Exchange rate | | | | | | | | Equity in | | | | | | | | Net income in TCU2), 3) | | |
| | | | | | | | | | | | | | | | | | | | | | share | | | | | | | | | | | | | | | | EUR 1.00 | | | | | | | | TCU2), 3) | | | | | | | | | |
| | | | | | | | | | | | | | | | | | | | | | in % | | | | | | | | | | | | | | | | = CU2) as of | | | | | | | | | | | | | | | | | |
| | | | | | | | | | | | | | | | | | | | | | | | | | | | | | | | | 31 Dec. 2016 | | | | | | | | | | | | | | | | |
|
| Shareholdings of DEG – Deutsche Investitions- und Entwicklungsgesellschaft mbH |
B. Other shareholdings (only capital shares totalling at least 20%) |
36 | | | | | | Navegar II (Netherlands) B.V. | | | | | | | | Amsterdam, | | | | | | | | | | | | | | | | | | | | | | | | | | | | | | | | | | | | | | | | | | |
| | | | | | | | | | | | | | Netherlands | | | | | | | | 29.2 | | | | | | | | EUR | | | | | | | | 1.0000 | | | | | | | | 45,754 | | | | | | | | 4,692 | | |
37 | | | | | | OAO Bicharagips | | | | | | | | Bukhara, | | | | | | | | | | | | | | | | | | | | | | | | | | | | | | | | | | | | | | | | | | |
| | | | | | | | | | | | | | Uzbekistan | | | | | | | | 25.0 | | | | | | | | UZS | | | | | | | | 3,363.7900 | | | | | | | | 11,739,981 | | | | | | | | 4,906,531 | | |
38 | | | | | | OJSC Tourism Promotion | | | | | | | | Dushanbe, | | | | | | | | | | | | | | | | | | | | | | | | | | | | | | | | | | | | | | | | | | |
| | | | | | Services | | | | | | | | Tajikistan | | | | | | | | 21.0 | | | | | | | | TJS | | | | | | | | 8.3103 | | | | | | | | 29,740 | | | | | | | | –31,134 | | |
39 | | | | | | Open Joint Stock Company | | | | | | | | Rostov-on-Don, | | | | | | | | | | | | | | | | | | | | | | | | | | | | | | | | | | | | | | | | | | |
| | | | | | (Center Invest Bank Group) | | | | | | | | Russ. Federation | | | | | | | | 20.7 | | | | | | | | RUB | | | | | | | | 64.3000 | | | | | | | | 04) | | | | | | | | 04) | | |
40 | | | | | | Orilus Investment Holdings | | | | | | | | Singapore, | | | | | | | | | | | | | | | | | | | | | | | | | | | | | | | | | | | | | | | | | | |
| | | | | | Pte. Ltd. | | | | | | | | Singapore | | | | | | | | 33.0 | | | | | | | | USD | | | | | | | | 1.0541 | | | | | | | | 54,302 | | | | | | | | 6,420 | | |
41 | | | | | | Russia Partners | | | | | | | | Grand Cayman, | | | | | | | | | | | | | | | | | | | | | | | | | | | | | | | | | | | | | | | | | | |
| | | | | | Technology Fund L.P. | | | | | | | | Cayman Islands | | | | | | | | 21.6 | | | | | | | | USD | | | | | | | | 1.0541 | | | | | | | | 102,924 | | | | | | | | 3,125 | | |
42 | | | | | | Stratus Capital Partners B L.P. | | | | | | | | Edinburgh, UK | | | | | | | | | | | | | | | | | | | | | | | | | | | | | | | | | | | | | | | | | | |
| | | | | | | | | | | | | | | | | | | | | | 73.3 | | | | | | | | USD | | | | | | | | 1.0541 | | | | | | | | 4,702 | | | | | | | | –3,665 | | |
43 | | | | | | Takura II Feeder Fund | | | | | | | | Cape Town, | | | | | | | | | | | | | | | | | | | | | | | | | | | | | | | | | | | | | | | | | | |
| | | | | | Partnership | | | | | | | | South Africa | | | | | | | | 25.0 | | | | | | | | USD | | | | | | | | 1.0541 | | | | | | | | 18,708 | | | | | | | | –1,996 | | |
44 | | | | | | The Kibofund II LLC | | | | | | | | Ebene, Mauritius | | | | | | | | 21.7 | | | | | | | | USD | | | | | | | | 1.0541 | | | | | | | | 9,609 | | | | | | | | –1,185 | | |
45 | | | | | | The SEAF Central and Eastern Europe Growth Fund | | | | | | | | Washington, D.C., USA | | | | | | | | 23.9 | | | | | | | | USD | | | | | | | | 1.0541 | | | | | | | | 4,925 | | | | | | | | –747 | | |
46 | | | | | | TOO Isi Gips Inder | | | | | | | | Rajon Inderski, | | | | | | | | | | | | | | | | | | | | | | | | | | | | | | | | | | | | | | | | | | |
| | | | | | | | | | | | | | Kazakhstan | | | | | | | | 40.0 | | | | | | | | EUR | | | | | | | | 1.0000 | | | | | | | | 1,218,172 | | | | | | | | 166,996 | | |
47 | | | | | | TOO Knauf Gips Kaptschagaj | | | | | | | | Kapchagay, | | | | | | | | | | | | | | | | | | | | | | | | | | | | | | | | | | | | | | | | | | |
| | | | | | | | | | | | | | Kazakhstan | | | | | | | | 40.0 | | | | | | | | EUR | | | | | | | | 1.0000 | | | | | | | | 6,985,624 | | | | | | | | 2,752,909 | | |
48 | | | | | | Whitlam Holding Pte. Ltd. | | | | | | | | Singapore, | | | | | | | | | | | | | | | | | | | | | | | | | | | | | | | | | | | | | | | | | | |
| | | | | | | | | | | | | | Singapore | | | | | | | | 38.7 | | | | | | | | USD | | | | | | | | 1.0541 | | | | | | | | 04) | | | | | | | | 04) | | |
49 | | | | | | Worldwide Group Inc. | | | | | | | | Charlestown, | | | | | | | | | | | | | | | | | | | | | | | | | | | | | | | | | | | | | | | | | | |
| | | | | | | | | | | | | | Saint Kitts | | | | | | | | | | | | | | | | | | | | | | | | | | | | | | | | | | | | | | | | | | |
| | | | | | | | | | | | | | | and Nevis | | | | | | | | 32.3 | | | | | | | | USD | | | | | | | | 1.0541 | | | | | | | | 04) | | | | | | | | 04) | | |
| | | | | | | | | | | | | |
| Shareholdings of Interkonnektor GmbH | | | | | | | | | | | | | | | | | | | | | | | | | | | | | | | | | | |
A. Joint ventures included in the consolidated financial statements | | | | |
1 | | | | | | DC Nordseekabel GmbH & | | | | | | | | Bayreuth, | | | | | | | | | | | | | | | | | | | | | | | | | | | | | | | | | | | | | | | | | | |
| | | | | | | Co. KG | | | | | | | | Germany | | | | | | | | 50.0 | | | | | | | | EUR | | | | | | | | 1.0000 | | | | | | | | 186,559 | | | | | | | | 16,440 | | |
B. Joint ventures not included in the consolidated financial statements | | | | |
2 | | | | | | DC Nordseekabel | | | | | | | | Bayreuth, | | | | | | | | | | | | | | | | | | | | | | | | | | | | | | | | | | | | | | | | | | |
| | | | | | Beteiligungs GmbH | | | | | | | | Germany | | | | | | | | 50.0 | | | | | | | | EUR | | | | | | | | 1.0000 | | | | | | | | 50 | | | | | | | | 0 | | |
3 | | | | | | DC Nordseekabel | | | | | | | | Bayreuth, | | | | | | | | | | | | | | | | | | | | | | | | | | | | | | | | | | | | | | | | | | |
| | | | | | | Management GmbH | | | | | | | | Germany | | | | | | | | 50.0 | | | | | | | | EUR | | | | | | | | 1.0000 | | | | | | | | 100 | | | | | | | | 0 | | |
| 2) | CU = currency units in local currency; TCU = thousand currency units in local currency |
| 3) | Financial statements prepared in accordance with local accounting standards. |
| 4) | The company is in the start-up phase; no annual financial statements have been prepared yet. |
The data is based on the most recent annual financial statements available from the associated company (where accessible).
166
KfW Financial Information 2016 Consolidated financial statements
Attestation
Auditor’s report
We have audited the consolidated financial statements prepared by KfW, Frankfurt am Main, comprising the consolidated statement of comprehensive income, consolidated statement of financial position, consolidated statement of changes in equity, consolidated statement of cash flows and the notes to the consolidated financial statements, together with the group management report for the business year from 1 January to 31 December 2016. The preparation of the consolidated financial statements and the group management report in accordance with IFRSs, as adopted by the EU, and the additional requirements of German commercial law pursuant to § 315 a Abs. 1 HGB [Handelsgesetzbuch “German Commercial Code”] and supplementary provisions of the Law concerning KfW (KfW Law) are the responsibility of KfW’s Executive Board. Our responsibility is to express an opinion on the consolidated financial statements and on the group management report based on our audit.
We conducted our audit of the consolidated financial statements in accordance with § 317 HGB [Handelsgesetzbuch „German Commercial Code“] and German generally accepted standards for the audit of financial statements promulgated by the Institut der Wirtschaftsprüfer [Institute of Public Auditors in Germany] (IDW). Those standards require that we plan and perform the audit such that misstatements materially affecting the presentation of the net assets, financial position and results of operations in the consolidated financial statements in accordance with the applicable financial reporting framework and in the group management report are detected with reasonable assurance. Knowledge of the business activities and the economic and legal environment of the Group and expectations as to possible misstatements are taken into account in the determination of audit procedures. The effectiveness of the accounting-related internal control system and the evidence supporting the disclosures in the consolidated financial statements and the group management report are examined primarily on a test basis within the framework of the audit. The audit includes assessing the annual financial statements of those entities included in consolidation, the determination of entities to be included in consolidation, the accounting and consolidation principles used and significant estimates made by management, as well as evaluating the overall presentation of the consolidated financial statements and group management report. We believe that our audit provides a reasonable basis for our opinion.
Our audit has not led to any reservations.
In our opinion, based on the findings of our audit, the consolidated financial statements comply with IFRSs, as adopted by the EU, the additional requirements of German commercial law pursuant to § 315 a Abs. 1 HGB and supplementary provisions of the KfW Law and give a true and fair view of the net assets, financial position and results of operations of the Group in accordance with these requirements. The group management report is consistent with the consolidated financial statements, complies with the German statutory requirements, and as a whole provides a suitable view of the Group’s position and suitably presents the opportunities and risks of future development.
Frankfurt am Main, 28 February 2017
KPMG AG
Wirtschaftsprüfungsgesellschaft
| | | | |

Wiechens | | 
Helke | | |
Wirtschaftsprüfer | | Wirtschaftsprüfer | | |
(German Public Auditor) | | (German Public Auditor) | | |