Exhibit (d)
This description of KfW and the Federal Republic of Germany is dated May 11, 2009 and appears as Exhibit (d) to the Annual Report on Form 18-K of KfW for the fiscal year ended December 31, 2008.
TABLE OF CONTENTS
| | | | | |
| | | Page | |
| | | 2 | |
| | | 2 | |
| | | 4 | |
| | | 4 | |
| | | 6 | |
| | | 10 | |
| | | 10 | |
| | | 10 | |
| | | 10 | |
| | | 11 | |
| | | 11 | |
| | | 13 | |
| | | 14 | |
| | | 14 | |
| | | 15 | |
| | | 21 | |
| | | 24 | |
| | | 27 | |
| | | 36 | |
| | | 37 | |
| | | 40 | |
| | | 40 | |
| | | 41 | |
| | | 53 | |
| | | 73 | |
| | | 82 | |
| | | 159 | |
| | | G-1 | |
| | | G-1 | |
| | | G-1 | |
| | | G-1 | |
| | | G-1 | |
| | | G-2 | |
| | | G-2 | |
| | | G-5 | |
| | | G-6 | |
| | | G-6 | |
| | | G-6 | |
| | | G-8 | |
| | | G-11 | |
| | | G-12 | |
| | | G-12 | |
| | | G-14 | |
| | | G-16 | |
| | | G-20 | |
| | | G-20 | |
| | | G-20 | |
| | | G-20 | |
| | | G-21 | |
| | | G-22 | |
| | | G-22 | |
| | | G-22 | |
| | | G-23 | |
| | | G-24 | |
| | | G-26 | |
| | | G-26 | |
| | | G-28 | |
| | | G-31 | |
| | | G-34 | |
| | | G-34 | |
| | | G-36 | |
| | | G-36 | |
| | | G-41 | |
| | | G-42 | |
1
THIS DOCUMENT (OTHERWISE THAN AS PART OF A PROSPECTUS CONTAINED IN A REGISTRATION STATEMENT FILED UNDER THE U.S. SECURITIES ACT OF 1933) DOES NOT CONSTITUTE AN OFFER TO SELL OR THE SOLICITATION OF AN OFFER TO BUY ANY SECURITIES OF KFW. THE DELIVERY OF THIS DOCUMENT AT ANY TIME DOES NOT IMPLY THAT THE INFORMATION HEREIN IS CORRECT AS OF ANY TIME SUBSEQUENT TO ITS DATE.
PRESENTATION OF FINANCIAL AND OTHER INFORMATION
In this description, references to “€”, “euro” or “EUR” are to the single European currency of the Member States of the European Union participating in the euro and references to “U.S. dollars”, “$” or “USD” are to United States dollars. See “Exchange Rate Information” below for information regarding the rates of conversion of the euro into United States dollars and “The Federal Republic of Germany — General — The European Union and European Integration” for a discussion of the introduction of the euro.
Unless explicitly stated otherwise, financial information relating to KfW Bankengruppe presented herein has been prepared in accordance with International Financial Reporting Standards as adopted by the European Union (“IFRS”).
Amounts in tables may not add up due to rounding differences.
On May 8, 2009, the euro foreign exchange reference rate as published by the European Central Bank was EUR 1.00 = U.S. dollar 1.3425 (EUR 0.7449 per U.S. dollar).
In this document, references to the “Federal Republic” and “Germany” are to the Federal Republic of Germany and references to the “Federal Government” are to the government of the Federal Republic of Germany. The terms “KfW Bankengruppe” and “group” refer to KfW and its consolidated subsidiaries.
EXCHANGE RATE INFORMATION
We file reports with the Securities and Exchange Commission giving financial and economic data expressed in euro.
The following table shows noon buying rates for euro, expressed as U.S. dollars per EUR 1.00, for the periods and dates indicated, as reported by the Federal Reserve Bank of New York (“FRB”). On January 1, 2009, the Federal Reserve Bank of New York discontinued daily publication of noon buying rates. As of this date, noon buying rates are as published on a weekly basis by the Federal Reserve Bank of New York.
| | | | | | | | | | | | | | | | | |
| Year ended December 31, | | Period End | | Average (1) | | High | | Low |
| 2004 | | | 1.3538 | | | | 1.2478 | | | | 1.3625 | | | | 1.1801 | |
| 2005 | | | 1.1842 | | | | 1.2400 | | | | 1.3476 | | | | 1.1667 | |
| 2006 | | | 1.3197 | | | | 1.2661 | | | | 1.3327 | | | | 1.1860 | |
| 2007 | | | 1.4603 | | | | 1.3797 | | | | 1.4862 | | | | 1.2904 | |
| 2008 | | | 1.3919 | | | | 1.4673 | | | | 1.601 | | | | 1.2446 | |
| | | | | | | | | | | | | | | | | |
| | | Period End | | Average (1) | | High | | Low |
| Quarter ended March 31, 2009 | | | 1.3261 | | | | 1.2909 | | | | 1.3946 | | | | 1.2547 | |
| | |
| (1) | | The average of the noon buying rates on the last business day of each month during the relevant period. |
The following table shows the high and low noon buying rates for euro, expressed as U.S. dollars per EUR 1.00, for each month from November 2008 through April 2009, as reported by the Federal Reserve Bank of New York.
| | | | | | | | | |
| | | High | | Low |
2008 | | | | | | | | |
| November | | | 1.3039 | | | | 1.2525 | |
| December | | | 1.4358 | | | | 1.2634 | |
2009 | | | | | | | | |
| January | | | 1.3946 | | | | 1.2804 | |
2
| | | | | | | | | |
| | | High | | Low |
| February | | | 1.3064 | | | | 1.2547 | |
| March | | | 1.3730 | | | | 1.2549 | |
| April | | | 1.3458 | | | | 1.2978 | |
No representation is made that the euro or U.S. dollar amounts referred to herein or referred to in the documents which incorporate this information by reference could have been or could be converted into U.S. dollars or euro, as the case may be, at any particular rate.
There are, except in limited embargo circumstances, no legal restrictions in the Federal Republic of Germany on international capital movements and foreign exchange transactions. However, for statistical purposes only, every individual or corporation residing in the Federal Republic of Germany must report to the Deutsche Bundesbank, the German Central Bank, subject to a number of exceptions, any payment received from or made to an individual or a corporation resident outside of the Federal Republic of Germany if such payment exceeds EUR 12,500 (or the equivalent in a foreign currency).
3
RECENT DEVELOPMENTS
KFW
KfW’s Results for the Three Months Ended March 31, 2009
The following information is based on unaudited financial information prepared in accordance with International Financial Reporting Standards as adopted by the EU (“IFRS”). This information is not necessarily indicative of the figures of KfW Bankengruppe for the full year ending December 31, 2009.
The group’s total assets increased by 5%, or EUR 19.8 billion, from EUR 394.8 billion as of December 31, 2008 to EUR 414.6 billion as of March 31, 2009.
The group’s operating result before valuation amounted to EUR 660 million for the three months ended March 31, 2009, compared with EUR 359 million for the same period in 2008. KfW was able to benefit from the sharp decline in interest rates in the money and capital markets. The group’s operating result before valuation is before risk provisions for lending business, net gains/losses from hedge accounting and other financial instruments at fair value through profit or loss and net gains/losses from securities and investments. The group’s consolidated result for the three months ended March 31, 2009, amounted to EUR 80 million, compared with a loss of EUR 497 million for the same period in 2008, and resulted primarily from the following factors:
| | • | | Increase in risk provisioning of EUR 0.2 billion reflecting the more challenging risk situation as a result of the ongoing financial and economic crisis; |
| |
| | • | | Charges in an amount of EUR 0.2 billion from fair-value accounting for financial assets, resulting from the ongoing crisis in the global financial markets; and |
| |
| | • | | Charges in an amount of EUR 157 million due to effects resulting from the valuation of derivatives used exclusively for hedging purposes in closed risk positions. These effects, which result from the application of the fair value principle under IFRS, do not, in the view of KfW, have an economic impact on KfW. |
Promotional Business Volume
KfW is currently in the process of reorganizing its business areas. The decision-making process with respect to the reorganization is still ongoing.
KfW’s total promotional business volume declined from EUR 14.1 billion during the three months ended March 31, 2008 to EUR 9.2 billion during the three months ended March 31, 2009. This decline principally reflected a decrease in financing commitments in KfW’s domestic promotional business, a decrease in commitments of KfW IPEX-Bank, as well as an absence of asset securitization transactions.
Financing commitments in KfW’s domestic promotional business declined from EUR 9.0 billion during the three months ended March 31, 2008 to EUR 7.5 billion during the first three months ended March 31, 2009. This decrease was principally attributable to a decrease in global funding facilities to Landesförderinstitute as well as reduced demand for loans for construction and purchase of houses and apartments and for financing modernization. There were no new commitments for asset securitization transactions in the three months ended March 31, 2009 compared to the EUR 1.6 billion in the same period of 2008. The absence of securitization commitments was due to continuous weak market conditions for such transactions.
Commitments in KfW’s export and project finance business made by KfW IPEX-Bank during the three months ended March 31, 2009 amounted to EUR 1.0 billion compared with EUR 3.0 billion during the same period of 2008. This significant decrease resulted from the ongoing global financial and economic crisis, which had a dampening effect on demand.
4
Commitments made by KfW in connection with the promotion of developing and transition countries amounted to EUR 834 million during the three months ended March 31, 2009 compared with EUR 560 million during the three months ended March 31, 2008. This growth was mainly due to an increase of Financial Cooperation Promotional Loans commitments, which are funded from KfW’s own funds and do not include interest rate reduction elements funded from the federal budget.
Sources of Funds
The volume of funding raised in the capital markets for the first three months of 2009 was EUR 28.0 billion, of which 45% was raised in U.S. dollars, 40% in euro and the remainder in 10 other currencies.
Capitalization of KfW Bankengruppe as of March 31, 2009
| | | | | |
| | | (EUR in millions) | |
| Borrowings | | | | |
| Short-term funds | | | 41,230 | |
| Bonds and other fixed-income securities | | | 290,493 | |
| Other borrowings | | | 31,555 | |
| Subordinated liabilities (1) | | | 3,247 | |
| | | | |
| Total borrowings | | | 366,526 | |
| | | | | |
| Equity | | | | |
| Paid-in subscribed capital (2) | | | 3,300 | |
| Capital reserve (3) | | | 6,254 | |
| Reserve from the ERP Special Fund | | | 858 | |
| Retained earnings | | | 5,400 | |
| Fund for general banking risks | | | 75 | |
| Revaluation reserve | | | -462 | |
| Balance sheet loss | | | -3,436 | |
| | | | |
| Total equity | | | 11,989 | |
| | | | |
Total capitalization | | | 378,515 | |
| | | | |
| | |
| (1) | | Includes assets transferred from the ERP Special Fund in form of a subordinated loan of EUR 3,247 million. |
| |
| (2) | | KfW’s equity capital, 80% of which is held by the Federal Government and the remaining 20% by the Länder, amounted to EUR 3,750 million as of March 31, 2009, of which EUR 3,300 million has been paid in pro rata by the Federal Government and the Länder. |
| |
| (3) | | Includes equity capital in form of a promotional reserve (Förderrücklage) from the ERP Special Fund of EUR 4,650 million. |
The capitalization of KfW Bankengruppe as of March 31, 2009 is not necessarily indicative of its capitalization to be recorded as of December 31, 2009.
The increase of EUR 170 million in total equity, which totaled EUR 11,989 million as of March 31, 2009 compared to EUR 11,820 million as of December 31, 2008, reflected (1) an increase of EUR 90 million in revaluation reserves due to valuation profits recognized directly in equity relating to available-for-sale financial assets, and (2) KfW Bankengruppe’s consolidated result of EUR 80 million for the three months ended March 31, 2009.
KfW is not subject to the German Banking Act (Kreditwesengesetz) and the German Solvency Regulation (Solvabilitätsverordnung), which require banks to have adequate own funds (Eigenmittel) for the conduct of their business. However, KfW calculates capital ratios prescribed by these rules on a voluntary basis for internal purposes. KfW applies all material rules in calculating these ratios, with slight modifications for KfW’s promotional core business. According to the calculations based on the results for the three months ended March 31, 2009, KfW’s total capital ratio according to section 2(6) of the German Solvency Regulation amounted to 10.1% and its Tier 1 ratio amounted to 7.8% as of March 31, 2009.
5
THE FEDERAL REPUBLIC OF GERMANY
The following economic information regarding the Federal Republic is derived from the public official documents cited below. Certain of the information is preliminary.
Gross Domestic Product (GDP)
Gross Domestic Product
(adjusted for price, seasonal and calendar effects)
| | | | | | | | | |
| | | Percentage change on | | Percentage change on the same |
| Reference period | | previous quarter | | quarter in previous year |
4th quarter 2007 | | | 0.3 | | | | 1.7 | |
1st quarter 2008 | | | 1.5 | | | | 2.9 | |
2nd quarter 2008 | | | -0.5 | | | | 2.0 | |
3rd quarter 2008 | | | -0.5 | | | | 0.8 | |
4th quarter 2008 | | | -2.1 | | | | -1.7 | |
The significant drop in German real GDP by 2.1% in the fourth quarter of 2008 compared with the third quarter was mainly due to the negative development of net exports, as price-adjusted exports experienced a much sharper decline (-7.3%) than imports (-3.6%). The balance of exports and imports thus contributed -2.0 percentage points to the decrease in GDP in the fourth quarter of 2008. Capital formation in machinery and equipment also fell significantly in the fourth quarter of 2008, as domestic enterprises scaled back investment in machinery, equipment and vehicles by 4.9% compared with the third quarter of 2008. Prior to the fourth quarter of 2008, gross fixed capital formation in machinery and equipment had risen for eight consecutive quarters, although the rise in the second and third quarters of 2008 was lower than in previous quarters. Capital formation in construction declined by 1.3% in the fourth quarter of 2008 compared with the third quarter, and final consumption expenditure decreased slightly by 0.1%. Enterprises increased inventories between October and December 2008, which had a positive effect of 0.5 percentage points on the development of GDP.
Price-adjusted GDP declined by 1.6% in the fourth quarter of 2008 as compared with the same quarter of 2007, whereas the first three quarters of 2008 showed positive year-on-year growth rates when compared with the same quarters of 2007. Adjusted for calendar effects, economic performance declined by 1.7%, as the fourth quarter of 2008 included a half working day more than the same quarter of 2007.
For a discussion of the growth rate for 2008 and projections for 2009 and 2010, see “ The Federal Republic of Germany — The Economy — Overview of Key Economic Figures.”
Source: Statistisches Bundesamt, Detailed results on the economic performance in the 4th quarter of 2008, press releases of February 25, 2009 (http://www.destatis.de/jetspeed/portal/cms/Sites/destatis/Internet/EN/press/pr/2009/02/PE09__061__811,templateId=renderPrint.psml).
6
Inflation Rate
Inflation Rate
(based on overall consumer price index)
| | | | | | | | | |
| | | Percentage change on previous | | Percentage change on the same |
| Reference period | | month | | month in previous year |
| March 2008 | | | 0.5 | | | | 3.1 | |
| April 2008 | | | -0.2 | | | | 2.4 | |
| May 2008 | | | 0.6 | | | | 3.0 | |
| June 2008 | | | 0.3 | | | | 3.3 | |
| July 2008 | | | 0.6 | | | | 3.3 | |
| August 2008 | | | -0.3 | | | | 3.1 | |
| September 2008 | | | -0.1 | | | | 2.9 | |
| October 2008 | | | -0.2 | | | | 2.4 | |
| November 2008 | | | -0.5 | | | | 1.4 | |
| December 2008 | | | 0.3 | | | | 1.1 | |
| January 2009 | | | -0.5 | | | | 0.9 | |
| February 2009 | | | 0.6 | | | | 1.0 | |
| March 2009 | | | -0.1 | | | | 0.5 | |
The consumer price index for Germany rose by 0.5% in March 2009 compared to March 2008, representing the lowest inflation rate since July 1999 when inflation also amounted to 0.5%. This low level of year-on-year inflation was mainly due to the strong downward price trend for mineral oil and certain food products, which more than offset price increases for gas, charges for central and remote heating and for electricity. Excluding mineral oil products, the inflation rate in March 2009 would have been 1.7% compared to March 2008. On average, food prices in March 2009 were just 0.2% above the prior year’s level, thereby continuing the declining trend of year-on-year price increases for food since August 2008. However, in March 2009 price increases were observed in particular for vegetables, meat and meat products, and confectionary compared to March 2008. The price of education in March 2009 declined by 5.0% compared to the same month of 2008, mainly due to the introduction of a tuition-free pre-school year in some Länder.
The slight decrease of 0.1% in the overall price index in March 2009 compared with February 2009 was mainly due to decreasing gas and food prices whereas consumers have to pay more for clothing, footwear and electricity.
Source: Statistisches Bundesamt, Consumer prices in March 2009: +0.5% on March 2008, press release of April 9, 2009 (http://www.destatis.de/jetspeed/portal/cms/Sites/destatis/Internet/EN/press/pr/2009/04/PE09__142__611,templateId=renderPrint.psml).
7
Unemployment Rate
Unemployment Rate
(percent of unemployed persons in the total labor force according to the
International Labor Organization (ILO) definition) (1)
| | | | | | | | | |
| Reference period | | Original percentages | | Seasonally adjusted percentages (2) |
| March 2008 | | | 7.8 | | | | 7.4 | |
| April 2008 | | | 7.7 | | | | 7.4 | |
| May 2008 | | | 7.1 | | | | 7.4 | |
| June 2008 | | | 7.5 | | | | 7.3 | |
| July 2008 | | | 7.3 | | | | 7.2 | |
| August 2008 | | | 7.0 | | | | 7.2 | |
| September 2008 | | | 6.5 | | | | 7.1 | |
| October 2008 | | | 6.3 | | | | 7.1 | |
| November 2008 | | | 6.6 | | | | 7.1 | |
| December 2008 | | | 7.2 | | | | 7.2 | |
| January 2009 | | | 7.5 | | | | 7.3 | |
| February 2009 | | | 8.1 | | | | 7.4 | |
| March 2009 | | | 7.8 | | | | 7.6 | |
| | |
| (1) | | Starting with the press release of the Federal Statistical Office dated October 30, 2007, the Federal Statistical Office’s telephone survey “Labour market in Germany”, which had been in use since January 2005 and was discontinued in April 2007, was replaced by the EU-wide harmonized labour force survey as the source of information for, among other things, the monthly ILO unemployment data. While the overall unemployment level according to the new method is higher, the methodological change has not resulted in significant differences in terms of trends. |
| |
| (2) | | As the time series available following the methodological change described in footnote (1) is not long enough to permit for seasonal adjustments, the seasonally adjusted results will for some time be estimated using data of the Federal Employment Agency (Bundesagentur für Arbeit) on the seasonally adjusted monthly number of registered unemployed. A time series of sufficient length for direct seasonal adjustment is expected to be available in 2011 at the earliest, because stable monthly data are available only from January 2007 and the time series should span at least four years. |
The number of employed persons decreased by approximately 46,000, or 0.1%, in March 2009 compared to March 2008. The number of persons in employment compared to the same month a year earlier had last decreased in February 2006. Generally, the number of persons in employment increases in March due to the usual seasonal recovery in spring. In the past three years, employment had increased by an average of 138,000 persons compared to the relevant previous month. In March 2009, this increase was considerably smaller, with an additional 53,000 persons in employment (+0.1%) compared to February 2009. The extension of short-time work is believed to have moderated the negative influence of the current economic situation on the employment trend.
The seasonally adjusted number of unemployed persons in March 2009 increased by approximately 70,000, or 2.2%, compared to March 2008. Compared to February 2009, the seasonally adjusted number of unemployed persons in March 2009 increased by 2.3%.
Sources: Statistisches Bundesamt, March 2009: Fewer persons in employment than a year ealier for the first time since February 2006, press release of April 30, 2009 (http://www.destatis.de/jetspeed/portal/cms/Sites/destatis/Internet/EN/press/pr/2009/04/PE09__165__132,templateId=renderPrint.psml); Statistisches Bundesamt, Notes on the ILO labour market statistics from reference month September 2007 (http://www.destatis.de/jetspeed/portal/cms/Sites/destatis/Internet/EN/Content/Statistics/Arbeitsmarkt/ILOArbeitsmarktstatistik/Hinweise__ILO,
templateId=renderPrint.psml); Statistisches Bundesamt, ILO labour market statistics, Unemployment rates (http://www.destatis.de/jetspeed/portal/cms/Sites/destatis/Internet/EN/Content/Statistics/TimeSeries/EconomicIndicators/LabourMarket/Content100/
arb430a,templateId=renderPrint.psml); Statistisches Bundesamt, ILO labour market statistics, Unemployment rate, Seasonally and calendar adjusted figures (estimation) (http://www.destatis.de/jetspeed/portal/cms/Sites/destatis/Internet/EN/Content/Statistics/TimeSeries/EconomicIndicators/LabourMarket/Content75/
arb422a,templateId=renderPrint.psml).
8
Current Account and Foreign Trade
Current Account and Foreign Trade
| | | | | | | | | |
| | | (balance in EUR billion) |
| Item | | January to March 2009 | | January to March 2008 |
| Foreign trade | | | 26.9 | | | | 51.2 | |
| Services | | | -4.2 | | | | -0.9 | |
| Factor income (net) | | | 12.8 | | | | 14.8 | |
| Current transfers | | | -13.1 | | | | -12.2 | |
| Supplementary trade items | | | -3.0 | | | | -3.3 | |
| | | | | | | | | |
Current account | | | 19.3 | | | | 49.7 | |
| | | | | | | | | |
Source: Statistisches Bundesamt, German exports in March 2009: -15.8% on March 2008, press release of May 8, 2009 (http://www.destatis.de/jetspeed/portal/cms/Sites/destatis/Internet/EN/press/pr/2009/05/PE09__172__51,templateId=renderPrint.psml).
9
KFW
GENERAL
Overview
KfW is a public law institution (Anstalt des öffentlichen Rechts) serving domestic and international public policy objectives of the Federal Government (“Federal Government”) of the Federal Republic of Germany (“Federal Republic”). KfW promotes its financing activities under the umbrella brand name KfW Bankengruppe. It conducts its business in the following four areas, three of which promote their financing activities under the respective brand names noted in italics:
| | o | | KfW Mittelstandsbank (KfW SME Bank) promotes small and medium-sized enterprises (“SMEs”), business founders, start-ups and self-employed professionals; and |
| |
| | o | | KfW Förderbank (KfW Promotional Bank) offers financing for housing, environmental, education and infrastructure projects. |
| | • | | Export and project finance: |
| | o | | KfW IPEX-Bank offers customized financing for exports and project and corporate financing world-wide. KfW IPEX-Bank has been, since January 1, 2008, a legally independent entity wholly-owned by KfW. |
| | • | | Promotion of developing and transition countries: |
| | o | | KfW Entwicklungsbank (KfW Development Bank) is responsible for KfW’s public sector development cooperation activities; and |
| |
| | o | | DEG-Deutsche Investitions- und Entwicklungsgesellschaft (German Investment and Development Company) finances private-sector investments in developing countries. DEG is a legally independent entity that is wholly-owned by KfW. |
| | • | | Shareholdings, treasury and services. |
As of December 31, 2008, KfW held total assets of EUR 394.8 billion, including loans and advances of EUR 313.7 billion. Of the total assets, EUR 247.8 billion related to investment finance, EUR 51.8 billion related to export and project finance and EUR 23.5 billion related to the promotion of developing and transition countries. KfW’s promotional business volume amounted to EUR 70.6 billion in 2008, of which EUR 69.0 billion, or 98%, represented financing commitments and EUR 1.6 billion, or 2%, represented securitization commitments.
KfW’s offices are located at Palmengartenstraße 5-9, 60325 Frankfurt am Main, Federal Republic of Germany. KfW’s telephone number is 011-49-69-74310. KfW also maintains branch offices in Berlin and Bonn, Germany, as well as a liaison office to the European Union in Brussels, Belgium.
Ownership
The Federal Republic holds 80% of KfW’s capital, and the German federal states (each, a “Land” and together, the “Länder”) hold the remaining 20%. Shares in KfW’s capital may not be pledged or transferred to entities other than the Federal Republic or the Länder. Capital contributions have been, and are expected to continue to be, made to KfW in such proportions as to maintain the relative share of capital held by the Federal Republic and the Länder.
10
Legal Status
KfW is organized under the Law Concerning KfW (Gesetz über die Kreditanstalt für Wiederaufbau, or the “KfW Law”) as a public law institution with unlimited duration. As a public law institution serving public policy objectives of the Federal Government, KfW itself is not subject to corporate taxes (although certain of its subsidiaries are) and as a promotional bank does not seek to maximize profits. KfW does, however, seek to maintain an overall level of profitability that allows it to strengthen its equity base in order to support growth in the volume of its business. KfW is prohibited from distributing profits, which are instead allocated to statutory and special reserves. KfW is also prohibited from taking deposits, conducting current account business or dealing in securities for the account of others.
Relationship with the Federal Republic
Guarantee of the Federal Republic
The KfW Law expressly provides that the Federal Republic guarantees all existing and future obligations of KfW in respect of money borrowed, bonds issued and derivative transactions entered into by KfW, as well as obligations of third parties that are expressly guaranteed by KfW (KfW Law, Article 1a). Under this statutory guarantee (the “Guarantee of the Federal Republic”), if KfW fails to make any payment of principal or interest or any other amount required to be paid with respect to securities issued by it when that payment is due and payable, the Federal Republic will be liable at all times for that payment as and when it becomes due and payable. The Federal Republic’s obligation under the Guarantee of the Federal Republic ranks equally, without any preference, with all of its other present and future unsecured and unsubordinated indebtedness. Holders of securities issued by KfW may enforce this obligation directly against the Federal Republic without first having to take legal action against KfW. The Guarantee of the Federal Republic is strictly a matter of statutory law and is not evidenced by any contract or instrument. It may be subject to defenses available to KfW with respect to the obligations covered.
Institutional Liability (Anstaltslast)
KfW is a public law institution (Anstalt des öffentlichen Rechts). Accordingly, under the German administrative law principle of Anstaltslast, the Federal Republic, as the constituting body of KfW, has an obligation to safeguard KfW’s economic basis. Under Anstaltslast, the Federal Republic must keep KfW in a position to pursue its operations and enable it, in the event of financial difficulties, through the allocation of funds or in some other appropriate manner, to meet its obligations when due. Anstaltslast is not a formal guarantee of KfW’s obligations by the Federal Republic, and creditors of KfW do not have a direct claim against the Federal Republic. Nevertheless, the effect of this legal principle is that KfW’s obligations, including the obligations to the holders of securities issued by it, are fully backed by the credit of the Federal Republic. The obligation of the Federal Republic under Anstaltslast would constitute a charge on public funds that, as a legally established obligation, would be payable without the need for any appropriation or any other action by the German Parliament.
Understanding with the European Commission
In order to clarify that the Federal Republic’s responsibility for KfW’s obligations is compatible with prohibitions under European Community (“EC”) law against state aid, the German Federal Ministry of Finance and the European Commissioner for Competition held discussions which were formalized in an understanding reached on March 1, 2002. In the understanding with the European Commission, it was agreed that, in respect of the promotional activities for which KfW is responsible, KfW will continue to benefit from Anstaltslast and the Guarantee of the Federal Republic. The understanding acknowledges that KfW’s role in providing financing for, in particular, small and medium-sized enterprises, risk capital, environmental protection, technology/innovation, infrastructure and housing, as well as its co-operation with developing countries, is promotional and thus compatible with EC rules.
In the area of export and project finance, the understanding with the European Commission required KfW to transfer to a legally independent subsidiary that portion of export finance and domestic and international project finance activities which the European Commission deemed to fall outside the scope of the promotional activities of KfW. The transfer of such activities had to be effected by December 31, 2007 and as from that date KfW may not fund the subsidiary at other than market rates of interest or extend to the subsidiary any benefits of Anstaltslast or the Guarantee of the Federal Republic.
11
KfW continues to be permitted, however, to engage directly in the following promotional export and project finance activities:
| | • | | implementation of international promotional programs, such as the interest-rate subsidized programs CIRR (Commercial Interest Reference Rate) and LASU (Large Aircraft Sector Understanding), which are recognized as promotional activities in accordance with the OECD consensus; |
| |
| | • | | participation in syndicated financing activities outside the European Union (“EU”), the European Economic Area and countries holding the status of official candidate for EU membership, subject to certain conditions, and sole financing activities in countries in which sufficient sources of financing do not exist; and |
| |
| | • | | participation in projects in the interest of the EC that are co-financed by the European Investment Bank or similar European financing institutions. |
The European Commission transformed the understanding into a decision, which the Federal Republic formally accepted. A part of the Promotional Bank Restructuring Act (Förderbankenneustrukturierungsgesetz) implemented the understanding with the European Commission and amended the KfW Law and KfW’s by-laws accordingly.
On January 1, 2008, KfW IPEX-Bank GmbH, a limited liability corporation (Gesellschaft mit beschränkter Haftung) formed as a wholly-owned subsidiary of KfW, commenced operations as a legally independent entity, thus satisfying the requirements set forth in the understanding with the European Commission. KfW IPEX-Bank GmbH conducts those export and project finance activities which the European Commission deemed to fall outside the scope of KfW’s promotional activities directly and on its own behalf. KfW provides funding for KfW IPEX Bank GmbH at market rates based on the ratings of AA- and Aa3 (both with stable outlook) assigned to KfW IPEX-Bank GmbH by Standard and Poor’s Rating Services and Moody’s Investors Service, respectively. The permitted promotional export and project finance activities are conducted by KfW IPEX-Bank GmbH in its own name on behalf of KfW on a trust basis. In accordance with the understanding with the European Commission, KfW IPEX-Bank GmbH obtained a banking license and is subject to the German Banking Act (Kreditwesengesetz) and the corporate tax regime. For more information on KfW’s formation of KfW IPEX-Bank GmbH as a legally independent entity, see “Business — Export and Project Finance (KfW IPEX-Bank) — Understanding with the European Commission.”
Supervision
KfW is generally exempt from the requirements of the German Banking Act. Under the KfW Law, the Federal Ministry of Finance, in consultation with the Federal Ministry of Economics and Technology, supervises KfW and has the power to adopt all measures necessary to safeguard the compliance of KfW’s business operations with applicable laws, KfW’s by-laws and other regulations. Subject to the foregoing, the Federal Ministry of Finance does not have the right to influence business decisions made by KfW’s Managing Board or Board of Supervisory Directors. KfW’s overall activities are supervised by its Board of Supervisory Directors, which consists of seven Federal Ministers, seven appointees of each of the two houses of Parliament, the Bundesrat and the Bundestag, and representatives of various sectors and institutions of the German economy. For more information on the Managing Board and the Board of Supervisory Directors, see “Management and Employees.”
In addition to the annual audit of its financial statements, KfW, as a government-owned entity, is subject to an audit that meets the requirements of the Budgeting and Accounting Act (Haushaltsgrundsätzegesetz). The Budgeting and Accounting Act requires that this audit and the resulting reporting be designed so as to enable the Board of Supervisory Directors, the responsible Federal Ministries, and the Federal Court of Auditors (Bundesrechnungshof) to form their own opinions and to take action as and when required. One of the specific aspects to be covered by this audit and the related reporting is the proper conduct of KfW’s business by its management.
12
Under the terms of the various agreements concluded between KfW and the government authorities sponsoring KfW’s programs, KfW is also required to have an auditor to report on the proper discharge of KfW’s duties and the efficiency and effectiveness of its administration.
Corporate Background
KfW was established in 1948 by the Administration of the Combined Economic Area, the immediate predecessor of the Federal Republic. Originally, KfW’s purpose was to distribute and lend funds of the European Recovery Program (the “ERP,” or “Marshall Plan”). Even today, several of KfW’s programs to promote the German and European economies are supported using funds for subsidizing interest rates from the so-called “ERP Special Fund.” KfW has expanded and internationalized its operations over the past decades. In 1994, following the re-unification of the Federal Republic and the former German Democratic Republic (“GDR”), KfW assumed the operations of the former central bank (Staatsbank) of the GDR, which was located in Berlin.
In September 2001, KfW acquired DEG-Deutsche Investitions- und Entwicklungsgesellschaft mbH (“DEG”) from the Federal Republic. DEG is a limited liability company that acts as the German development finance institution for the promotion of private enterprises in developing countries and countries in transition.
In 2003, Deutsche Ausgleichsbank (“DtA”), which was based in Bonn, merged into KfW. DtA was formed in 1950 as a public law institution and promotional bank particularly active in the area of lending to SMEs and start-up businesses. The merger was accomplished through the Promotional Bank Restructuring Act and was designed to restructure and simplify promotional banking in the Federal Republic and harmonize it with the understanding reached with the European Commission. The Promotional Bank Restructuring Act became effective on August 22, 2003 and implemented the merger of DtA into KfW with retroactive effect as of January 1, 2003. The merger was effected by a transfer of the Federal Republic’s shares in DtA into a special capital reserve of KfW. In connection with the combination of KfW’s and DtA’s SME-related businesses, KfW Mittelstandsbank was created as a new, separately-branded platform for all SME-related financing instruments. In addition, a Mittelstandsrat (SME advisory council) was established at KfW which consults and decides on proposals concerning KfW’s SME-related business, taking into consideration KfW’s overall business plan. The Mittelstandsrat is chaired by the Federal Minister of Economics and Technology and includes other members of the Federal Government.
13
BUSINESS
Introduction
KfW Bankengruppe conducts its business in four principal business areas: investment finance; export and project finance; promotion of developing and transition countries; and shareholdings, treasury and services. In addition to the total assets and loans and advances of KfW Bankengruppe, the following table shows the relative size of each of the three operative business areas (investment finance, export and project finance, and promotion of developing and transition countries) in terms of total assets and total financing commitments for each of the years indicated; no commitments are made in the shareholdings, treasury and services area, given the nature of its business. The table also shows securitization commitments outstanding and new securitization commitments in each year. KfW’s securitization activities are part of its investment finance business.
Total Assets by Business Area and Securitizations
| | | | | | | | | |
| | | As of December 31, |
| | | 2008 | | 2007 |
| | | (EUR in millions) |
| Total assets of KfW Bankengruppe | | | 394,826 | | | | 353,997 | |
of which investment finance | | | 247,797 | | | | 228,934 | |
of which export and project finance | | | 51,757 | | | | 43,710 | |
of which promotion of developing and transition countries | | | 23,524 | | | | 22,726 | |
| | | | | | | | | |
| Loans and advances of KfW Bankengruppe | | | 313,725 | | | | 285,805 | |
| | | | | | | | | |
| Securitization commitments outstanding (1) | | | 45,003 | | | | 75,144 | |
| | |
| (1) | | Aggregate principal amount of outstanding securitization commitments as of December 31, 2008 and 2007, respectively, consisting of commitments in connection with credit-default swaps under KfW’s PROMISE and PROVIDE securitization programs and its variations in the amount of EUR 44,388 million in 2008 and EUR 73,491 million in 2007, as well as irrevocable loan commitments in the amount of EUR 615 million in 2008 and EUR 1,653 million in 2007. |
Promotional Business Volume by Business Area
| | | | | | | | | |
| | | Year ended December 31, |
| | | 2008 | | 2007 |
| | | (EUR in millions) |
| Financing commitments by business area | | | | | | | | |
| Investment finance (1) | | | 46,531 | | | | 46,293 | |
| Export and project finance | | | 17,551 | | | | 16,068 | |
| Promotion of developing and transition countries | | | 4,906 | | | | 4,208 | |
| | | | | | | | | |
| Total financing commitments | | | 68,989 | | | | 66,569 | |
| Securitization commitments (2) | | | 1,578 | | | | 18,956 | |
| | | | | | | | | |
| Advisory services (grants) | | | 37 | | | | — | |
| | | | | | | | | |
Total (3) | | | 70,604 | | | | 85,525 | |
| | | | | | | | | |
| | |
| (1) | | Commitments for 2007 have been adjusted according to a new reporting methodology which was introduced in 2008 with respect to global loans and global funding facilities. Starting in 2008, only amounts drawn down under global loans and global funding facilities as of the reporting date are presented as commitments. Previously, the total contract volume of global loans and global funding facilities as of the reporting date was presented as commitments regardless of the actual amount disbursed in the relevant financial period. As a result, the loan commitments for 2007 set forth in the table above differ from the amounts which KfW disclosed previously for the same period. |
| |
| (2) | | Consists of commitments made by KfW in 2007 in the amount of EUR 18,891 million and first loss pieces retained by the originating banks in the amount of EUR 64.5 million. In 2008, first loss pieces retained by the originating banks are excluded. |
| |
| (3) | | Commitments and grants for advisory services represent the volume of funds committed for loans and other business transactions (with the exception of global loans and global funding facilities) in the relevant year, including amounts to be disbursed in future years, and do not include amounts disbursed in the relevant year pursuant to commitments made in prior years. In the case of global loans and global funding facilities, commitments represent the actual volume of funds disbursed in the relevant year. |
14
Promotional Business Volume by Product
| | | | | | | | | |
| | | Year ended December 31, |
| | | 2008 | | 2007 |
| | | (EUR in millions) |
| Financing commitments | | | 68,989 | | | | 66,569 | |
of which loans (1) | | | 65,600 | | | | 63,629 | |
of which guarantees | | | 1,953 | | | | 1,499 | |
of which grants | | | 1,077 | | | | 996 | |
of which ABS SME Portfolio | | | 360 | | | | 445 | |
| Securitization commitments | | | 1,578 | | | | 18,956 | |
| Advisory services (grants) | | | 37 | | | | — | |
| | | | | | | | | |
Total | | | 70,604 | | | | 85,525 | |
| | | | | | | | | |
| | |
| (1) | | Commitments for 2007 have been adjusted according to a new reporting methodology with respect to global loans and global funding facilities which was introduced in 2008 and is described in footnote (1) to the previous table. As a result, the loan commitments for 2007 set forth in the table above differ from the amounts which KfW disclosed previously for the same period. |
Investment Finance
General
To support the economic and policy objectives of the Federal Government, KfW offers a broad range of financing programs in Germany and elsewhere in Europe, grants funded from the federal budget, and loan securitization programs for banks within its investment finance business area. In 2008, KfW’s principal investment finance activities included the provision of funding to SMEs under its KfW Mittelstandsbank brand and financing for other government policy objectives under its KfW Förderbank brand.
Under the KfW Law, KfW must generally involve banks or other financing institutions when granting financings in its investment finance business. Therefore, KfW involves commercial banks in the handling of its loans by extending loans to commercial banks, which, in turn, on-lend the funds to the ultimate borrowers. By lending to commercial banks, KfW, in principle, insulates itself from credit exposure to the ultimate borrower and gains the benefit of the commercial banks’ knowledge of their customers as well as their administrative and servicing expertise. KfW monitors its exposure to, and the credit standing of, each banking institution to which it lends. In its investment finance business, KfW currently lends to approximately 350 banks.
KfW offers two different models for processing KfW loans to commercial banks. KfW’s traditional and most important model for handling its lending business is based on individual loan applications for each borrower within the framework of specified loan, mezzanine or equity participation programs. Under the other model, KfW extends global loans or global funding facilities to commercial banks or financing institutions.
Individual Loans. KfW explicitly defines detailed formal requirements for each loan it extends to a commercial bank as well as for each loan the commercial bank on-lends to the ultimate borrower under each of its lending programs. Borrowers do not apply directly to KfW, however, and may only apply for a KfW loan through their regular bank or another bank or savings bank of their choice. The intermediate bank appraises the financial and business situation of the applicant, takes collateral for the loan and assumes liability for repayment to KfW. Loans made by commercial banks are normally collateralized by real property or other assets, or are guaranteed by the Federal Republic or by one of the Länder. The processing of individual loans within KfW’s lending programs is characterized by two formally separate loan approvals, first by the intermediate bank and then by KfW, for each borrower. KfW’s loan approval, however, is in most cases based solely on a review of the loan application with respect to compliance with the formal requirements defined for the particular loan program.
Under the traditional pricing model, the commercial banks to which KfW lends are permitted to on-lend the funds at fixed spreads over the applicable interest rate payable to KfW. This fixed-spread pricing model continues to apply in KfW’s loan programs to individuals, which represent the substantial portion of KfW’s lending under KfW Förderbank’s programs, as well as in KfW’s loan programs for start-up financing. However, effective April 1, 2005, KfW replaced the fixed-spread pricing model with a risk-adjusted pricing model for new commitments in many of its loan programs targeted at SMEs and other commercial enterprises.
15
Under the risk-adjusted pricing model, KfW establishes pricing categories based on a combination of the borrower’s creditworthiness and the collateral securing the loan. Under each lending program, KfW sets maximum interest rates for each pricing category. The on-lending banks assess the risk profile of the borrower and the collateral securing the loan to determine the applicable pricing category for each loan and the applicable maximum interest rate for the pricing category. KfW’s role in the pricing process is limited to verifying that banks derive the appropriate maximum interest rate from the ultimate borrower’s creditworthiness and the collateral provided.
As described above, in the traditional SME loan programs offered by KfW, the on-lending banks are liable to KfW and bear the risk of customer default. In recent years, KfW Mittelstandsbank has been reworking and renewing its SME financing programs to increase its support for SMEs. The recent focus has been on enhancing the support under its most important SME loan program (the Unternehmerkredit, or Entrepreneurial Loan, program) in order to encourage on-lending banks to extend loans, especially to SMEs with a higher risk profile, and on complementing its products with a new equity mezzanine program.
Under its Unternehmerkredit program, to which the risk-adjusted pricing model applies, and the special loan program (KfW Sonderprogramm), launched in the beginning of 2009 in connection with the Federal Republic’s first stimulus package (see “— Participation in Government Stimulus Packages” below), KfW offers the option of a partial exemption from liability to on-lending banks. If the on-lending bank applies for an exemption from liability, KfW bears the risk not retained by the bank and the risk margin is shared pro rata between KfW and the bank. In addition, KfW Mittelstandsbank’s mezzanine and equity participation programs and special programs for investments by micro-enterprises are designed so that KfW assumes direct exposure to the credit risk of the ultimate borrower. KfW’s risk under these programs is covered or compensated in different ways: by means of a risk pool funded by risk premiums included in the interest rate charged to the ultimate borrower; or by means of guarantees from the Federal Government or the European Investment Fund.
KfW’s German commercial banking on-lending customers include the 9 German Landesbanken. The Landesbanken are German public law financial institutions that have traditionally focused on the banking business for and in the Land in which they operate. Originally, obligations of the Landesbanken benefited from government credit support (Gewährträgerhaftung). According to a settlement reached with the European Commission in July 2001 relating to state aid to the Landesbanken, however, borrowings by the Landesbanken incurred after the settlement date and maturing after December 31, 2015 and all borrowings incurred after July 19, 2005 no longer benefit from government credit support. KfW’s long-term receivables from on-lending operations involving Landesbanken amounted to EUR 53 billion as of December 31, 2008. Of this amount, EUR 17 billion, or 32%, continues to benefit from Gewährträgerhaftung. Since the settlement, KfW’s credit line management has increased its focus on the individual financial strength of each institution. In addition, most of the loans to the Landesbanken have been, and will continue to be, secured by collateral. Over time, the risk profile of the loans to the Landesbanken will shift further from government risk to a profile comparable to KfW’s other loans to the banking sector.
Global Loans and Global Funding Facilities. Global loans and global funding facilities are extended in the form of lump sums to commercial banks or promotional institutions of the federal states (Landesförderinstitute) in order to facilitate the processing of KfW loans. Global loans and global funding facilities differ from KfW’s individual program loans primarily in terms of simplified processing, the lack of a requirement for formal loan approval by KfW with respect to each individual ultimate borrower, and, in general, a higher degree of flexibility for the on-lending financial institution. As a result, global loans and global funding facilities entail lower administrative costs for both KfW and the on-lending bank or financial institution compared with KfW’s traditional lending programs. KfW offers three different kinds of global loans or global funding facilities, two of which are targeted at Landesförderinstitute.
KfW extends global loans to selected commercial banks in Germany and Europe in the form of a lump sum which the banks break down and grant as individual loans to fund their own financing needs for SMEs, housing projects and municipal infrastructure projects. KfW expects the receiving banks to on-lend these funds within a reasonable period of time. In contrast to KfW’s individual program loans, these global loans offer greater loan structure flexibility, as the mode of repayment may be agreed individually between the bank and its customer and the interest rate may be variable or fixed. The interest rate for the ultimate borrower is composed of KfW’s funding rate to the bank plus an individual risk-adjusted margin. The margin is determined by the ultimate borrower’s creditworthiness, which is evaluated on the basis of the bank’s rating system. The bank and KfW agree on the methodology used to calculate the margin.
16
In the framework of its traditional loan programs, KfW also extends global loans to some Landesförderinstitute. Most of the Landesförderinstitute are independent public law institutions and benefit from explicit guarantees by the respective German federal state (Land). In total, KfW extends global loans to 19 Landesförderinstitute, each of which is responsible for promotional issues within its Land or Länder, as the case may be. Landesförderinstitute use KfW’s global loans to finance specified investments relating to SMEs, housing projects and municipal infrastructure projects in their respective Land within the framework of cooperative loan programs of the Landesförderinstitut and KfW. The conditions of each cooperative loan program must comply with the conditions of the relevant KfW program.
Finally, KfW extends global funding facilities exclusively to Landesförderinstitute for their own promotional funding purposes, thus offering Landesförderinstitute broad flexibility with respect to the use of funds extended in their promotional business without a direct link to any of KfW’s lending programs.
Advisory Services. In its branches in Berlin, Bonn and Frankfurt, KfW maintains advisory centers to inform individuals and enterprises about the various promotional programs of the Federal Government and the Länder governments. For an in-depth analysis of their investment and business plans, entrepreneurs and SMEs may also turn to KfW’s advisory service (KfW-Beratungssprechtage). This service is offered at 50 different locations in Germany in cooperation with other institutions engaged in promoting the economy. Through partial funding of coaching and advisory services, KfW supports individual entrepreneurs in the early start up-phase of their business ventures, as well as SMEs in determining the necessary steps to effect a turnaround in case of a temporary crisis.
Participation in Government Stimulus Packages
In order to stabilize and strengthen the German economy, which has suffered as a result of the ongoing crisis in the global financial markets, the Federal Government is implementing packages of stimulus measures, which provide for the participation of KfW.
Under the Federal Republic’s first package of measures to promote investments, which was approved by the legislature in December 2008, KfW Mittelstandsbank initiated a special loan program (KfW Sonderprogramm) aimed at safeguarding enterprises, primarily small and medium-sized enterprises with an annual turnover of up to EUR 500 million, against a lack of funding from financial institutions. The program includes the offer of a partial exemption from liability to the on-lending banks, similar in concept to the partial exemption from liability offered under the KfW-Unternehmerkredit program. In addition, KfW plans to further extend commitments under KfW Förderbank’s housing investment, environmental investment and municipal infrastructure programs from 2009 to 2011. Under the Federal Republic’s second package of measures to promote investments, which was approved by the legislature in February 2009, the special loan program (KfW Sonderprogramm) was modified so that, among other things, additional loans will also be made available to larger enterprises.
In total, KfW expects to extend commitments of approximately EUR 50 billion until 2011 in connection with the stimulus packages. Additional risks to KfW from commitments made under the stimulus packages are covered by the Federal Government.
Promotional Business Volume
The following table shows KfW’s promotional business volume for investment finance in Germany and elsewhere in Europe for each of the years indicated:
17
Investment Finance Promotional Business Volume
| | | | | | | | | |
| | | Year ended December 31, |
| | | 2008 | | 2007 (1) |
| | | (EUR in millions) |
KfW Mittelstandsbank | | | | | | | | |
| Financing commitments | | | | | | | | |
| Loan commitments | | | 10,844 | | | | 12,049 | |
of which global loans to commercial banks | | | 997 | | | | 2,274 | |
of which global loans to Landesförderinstitute | | | 5,015 | | | | 5,652 | |
| Mezzanine commitments | | | 1,252 | | | | 1,214 | |
| Equity participation commitments | | | 242 | | | | 339 | |
| | | | | | | | | |
| Guarantees (2) | | | 22 | | | | 16 | |
| | | | | | | | | |
| ABS SME Portfolio (3) | | | 360 | | | | 445 | |
| | | | | | | | | |
| Total financing commitments | | | 12,719 | | | | 14,063 | |
| Securitization commitments (4) | | | 1,578 | | | | 10,022 | |
| | | | | | | | | |
| Advisory services (grants) | | | 31 | | | | — | |
| | | | | | | | | |
Total KfW Mittelstandsbank | | | 14,328 | | | | 24,085 | |
| | | | | | | | | |
KfW Förderbank | | | | | | | | |
| Financing commitments | | | | | | | | |
| Housing investment programs | | | 14,829 | | | | 14,917 | |
of which global loans to commercial banks | | | 1,365 | | | | 2,175 | |
of which global loans to Landesförderinstitute | | | 956 | | | | 1,589 | |
| Education programs | | | 1,278 | | | | 1,314 | |
| Municipal infrastructure programs | | | 2,154 | | | | 3,112 | |
of which global loans to commercial banks | | | 19 | | | | 39 | |
of which global loans to Landesförderinstitute | | | 352 | | | | 409 | |
| Environmental investment programs | | | 7,325 | | | | 7,203 | |
Global funding facilities to Landesförderinstitute | | | 8,226 | | | | 5,683 | |
| | | | | | | | | |
| Total financing commitments | | | 33,813 | | | | 32,230 | |
| Securitization commitments (5) | | | — | | | | 8,933 | |
| | | | | | | | | |
| Advisory services (grants) | | | 6 | | | | — | |
| | | | | | | | | |
Total KfW Förderbank | | | 33,819 | | | | 41,163 | |
| | | | | | | | | |
Total investment finance (6) | | | 48,146 | | | | 65,248 | |
| | | | | | | | | |
| | |
| (1) | | Commitments for 2007 have been adjusted according to a new reporting methodology which was introduced in 2008 with respect to global loans and global funding facilities. Starting in 2008, only amounts drawn down under global loans and global funding facilities as of the reporting date are presented as commitments. Previously, the total contract volume of global loans and global funding facilities as of the reporting date was presented as commitments regardless of the actual amount disbursed in the relevant financial period. As a result, the loan commitments of 2007 set forth in the table above differ from the amounts which KfW disclosed previously. |
| |
| (2) | | Represent guarantee commitments issued within the framework of two equity participation programs. |
| |
| (3) | | For information on the ABS SME Portfolio, see “— Securitization Programs — ABS SME Portfolio” below. |
| |
| (4) | | Consists of commitments made by KfW in transactions under the PROMISE program and its variations in the amount of EUR 10,019.9 million in 2007 and first loss pieces in the amount of EUR 2.4 million retained by the originating banks in 2007. The 2008 amount excludes first loss pieces retained by the originating banks. |
| |
| (5) | | Consists of commitments made by KfW in transactions under the PROVIDE program and its variations in the amount of EUR 8,871.3 million in 2007. First loss pieces retained by the originating banks amounted to EUR 62.1 million in 2007. |
| |
| (6) | | Commitments represent the volume of funds committed for loans and other business transactions (with the exception of global loans and global funding facilities) in the relevant year, including amounts to be disbursed in future years, and do not include amounts disbursed in the relevant year pursuant to commitments made in prior years. In the case of global loans and global funding facilities, commitments represent the actual volume of funds disbursed in the relevant year. |
To support the German and European economies, KfW committed EUR 48.1 billion (including securitization commitments) in 2008, compared to EUR 65.2 billion in 2007. The decrease was mainly due to the decrease of securitization commitments under KfW Förderbank’s PROVIDE program and its variations as well as under KfW Mittelstandsbank’s PROMISE program and its variations. By contrast, financing
18
commitments in KfW’s investment finance business area remained relatively stable at EUR 46.5 billion in 2008 compared to EUR 46.3 billion in 2007.
KfW Mittelstandsbank (KfW SME Bank)
KfW Mittelstandsbank promotes SMEs, business founders, start-ups and self-employed professionals. According to the KfW-Mittelstandspanel 2008 survey of SMEs in Germany, there were nearly 3.6 million SMEs (including enterprises with an annual group turnover of up to EUR 500 million) in Germany in 2007. SMEs conducted 52% of the gross investment by the German corporate sector, employed almost two-thirds of the workforce and trained more than three-fourths of apprentices in 2007.
The KfW Mittelstandsbank programs consist of loan programs (including global loans to Landesförderinstitute as well as German and European commercial banks), mezzanine programs and equity participation programs, guarantees, the ABS SME Portfolio, as well as securitization activities conducted principally through the PROMISE program, all of which are described below. In 2008, total commitments under KfW Mittelstandsbank programs amounted to EUR 14.3 billion compared to EUR 24.1 billion in the previous year. Financing commitments decreased from EUR 14.1 billion in 2007 to EUR 12.7 billion in 2008. Securitization commitments under the PROMISE program and its variations, however, decreased substantially from EUR 10.0 billion in 2007 to EUR 1.6 billion in 2008. For more information on the PROMISE program, see “— Securitization Programs — Synthetic Securitization Programs” below.
Loan Programs. Commitments under KfW’s SME loan programs amounted to EUR 10.8 billion in 2008, compared to EUR 12.0 billion in 2007. Commitments for global loans to commercial banks decreased from EUR 2.3 billion in 2007 to EUR 1.0 billion in 2008. As global loans involve a small number of transactions but are large in amount, a slight decrease or increase in the number of transactions can have a relatively high impact on total loan volume under KfW’s SME loan programs.
Among the SME loan programs, the KfW-Unternehmerkredit program is the most important. This program, which was introduced in September 2003, offers financing for a broad range of investments, such as construction and purchases of machinery. Under the KfW-Unternehmerkredit program KfW applies the risk-adjusted rate system and offers the on-lending banks a partial risk-sharing as described above. Commitments under the program remained unchanged in 2008 compared to 2007 at EUR 9.0 billion. KfW also offers several smaller loan programs for special financing purposes, such as micro-finance and acquisition finance. Total commitments under these programs amounted to EUR 342 million in 2008 compared to EUR 376 million in 2007.
Mezzanine Programs. KfW extends mezzanine capital in the form of unsecured subordinated loans, which contain equity-like elements combining characteristics of debt and equity capital. The on-lending bank is not liable to KfW for the subordinated loan. In its mezzanine financing, KfW seeks to tailor the terms and conditions of its lending to each borrower’s risk profile in order to provide a better correlation between yield and risk weighting. As a result, the interest rate of the subordinated loan takes account of both the prevailing rates in the capital markets and the borrower’s credit standing. The borrower’s creditworthiness is first assessed by the on-lending bank. However, as KfW fully assumes the risk of the subordinated loan, it reserves the right to review and, if necessary, to revise the bank’s assessment by applying KfW’s own rating standards. Commitments under KfW Mittelstandsbank’s mezzanine programs increased slightly from EUR 1,214 million in 2007 to EUR 1,252 million in 2008.
Equity Participation Programs. KfW provides loans to equity investors, typically private equity companies and venture capital companies. These investors, in turn, make equity investments in SMEs. In addition, KfW provides new equity for innovative SMEs by direct investment, provided that a private investor provides at least the same amount in equity. KfW extends these loans for equity participations under various programs. In 2008, KfW’s overall commitments in equity participation programs amounted to EUR 242 million compared to EUR 339 million in 2007.
KfW Förderbank (KfW Promotional Bank)
Under its KfW Förderbank programs, KfW provides housing-related loans and grants as well as financing for other government policy objectives, such as municipal infrastructure, environmental protection and education. Most of the loans of KfW Förderbank programs are extended to private individuals. In 2008, financing commitments under KfW Förderbank programs amounted to EUR 33.8 billion compared to EUR 32.2 billion in 2007. This increase in financing commitments was mainly due to a high volume of commitments in the environmental investment programs and an increase of global funding facilities to Landesförderinstitute.
19
Housing Investment Programs. KfW Förderbank’s housing investment programs provide funds for the promotion of home ownership, for repairs and modernization, and for the reduction of CO2 emissions. Some of these programs are subsidized by federal funds.
In terms of loan commitments, the Home Ownership Promotion Program is KfW’s most important housing investment program. Under this program, any individual who purchases or builds housing in Germany for his or her own use may obtain a promotional loan. In 2008, KfW committed EUR 4.6 billion under the Home Ownership Promotion Program, compared to EUR 5.3 billion in 2007, supporting an additional 82,793 owner-occupied houses and apartments. The remaining individual loan programs for housing investments (including global loans to Landesförderinstitute) accounted for an additional EUR 8.8 billion in 2008 compared to EUR 7.5 billion in 2007. In addition, KfW extended global loans to commercial banks for on-lending to private home owners in the amount of EUR 1.4 billion in 2008, compared to EUR 2.2 billion in 2007. As global loans involve a small number of transactions but are large in amount, a slight decrease or increase in the number of transactions can have a relatively high impact on total loan volume under KfW’s housing programs.
Education Programs. Under its various education programs, KfW supports students and employees in advanced occupational training with direct loans. In 2008, KfW’s commitments amounted to EUR 1.3 billion, almost unchanged compared to 2007. Loans under these education programs are guaranteed by the Federal Government.
Municipal Infrastructure Programs. Through KfW’s infrastructure programs, municipalities and municipally-owned enterprises have for many years been offered a range of products to finance investments in the municipal and social infrastructure. KfW’s current infrastructure programs focus on three target areas: municipal investment (loans on-lent through banks to companies that are majority-owned by municipal authorities); social investment (loans on-lent through banks to non-profit organizations); and the KfW Municipal Loan (direct loans to municipalities). In 2008, EUR 2.2 billion in commitments were granted under the municipal infrastructure programs compared with EUR 3.1 billion in 2007.
Environmental Investment Programs. Under its environmental investment programs, KfW finances environmental protection projects, mostly undertaken by private companies. Financing under these programs is provided, in particular, for measures to save energy, to reduce greenhouse gas emissions and to promote the use of renewable energy sources. In addition, financing is provided for investments in the installation of small photovoltaic systems mostly demanded by private individuals. In 2008, KfW commitments under these programs amounted to EUR 7.3 billion compared with EUR 7.2 billion in 2007.
Global Funding Facilities to Landesförderinstitute. In 2008, KfW extended global funding facilities to Landesförderinstitute for the funding of their own promotional activities in the amount of EUR 8.2 billion compared with EUR 5.7 billion in 2007. The increase was driven by significantly higher demand from Landesförderinstitute in particular due to the ongoing crisis in the German and global financial markets at the end of 2008.
Securitization Programs
Synthetic Securitization Programs. In 2000, in order to foster the promotion of SMEs through the support of on-lending German commercial banks by easing the transfer of credit risk on their SME loans to the capital markets, KfW established a synthetic securitization program known as PROMISE (Program for “Mittelstand”-Loan Securitization). Under its KfW Mittelstandsbank brand, KfW has securitized 28 portfolios of commercial loans of German and other European banks comprising approximately 108,000 SME loans in the aggregate amount of EUR 48 billion from 2000 through 2008. In 2008, due to the ongoing weak market conditions for securitizations as a result of the crisis in the global financial markets, the loan volume securitized under the PROMISE program and its variations amounted to EUR 1.6 billion compared to EUR 10.0 billion in 2007.
In 2001, KfW also established PROVIDE, a synthetic securitization program for residential mortgages. Under its KfW Förderbank brand, KfW securitized 40 portfolios of German and other European banks comprising approximately 1.2 million loans in the aggregate amount of EUR 75.9 billion from 2001 through 2007. In 2008, due to the ongoing weak market conditions for securitizations as a result of the crisis in the global financial markets, not a single portfolio was securitized under the PROVIDE program, whereas in 2007, loan portfolios in an aggregate amount of EUR 8.9 billion were securitized under the PROVIDE program.
20
All securitization transactions to date have followed a standardized basic structure whereby KfW acts as intermediary credit-default swap provider between lending commercial banks and mortgage banks and the capital markets. As such, KfW generally enters into a credit-default swap with the originating bank to provide cover for specified credit risks of the assets being securitized. In general, KfW then contractually lays off the risks assumed under the credit-default swap with third parties by (1) entering into further credit-default swaps with highly-rated credit institutions (or, upon provision of highly-rated collateral, other financial institutions) and, in most cases, (2) issuing credit-linked certificates of indebtedness to a special-purpose vehicle (“SPV”) as collateral against the SPV’s obligations under mirroring credit-linked notes (“CLNs”), issued by the SPV to investors.
The proceeds from the sale of CLNs are used by the SPV to purchase the certificates of indebtedness from KfW on the issue date of the CLN. KfW uses the cash proceeds to fulfill its payment obligations under its certificates of indebtedness to the SPV, and, to the extent obligations arise in respect of KfW’s credit-default swap with the originating bank (i.e., any realized losses occurred in the reference portfolio), to pay compensation to the originating bank. In this case, the payment obligations of KfW under the certificates of indebtedness are reduced simultaneously in an amount matching the compensation payments under the credit-default swap with the originating bank.
KfW selectively retained parts of AAA-rated super senior swap tranches in transactions under the PROMISE and PROVIDE programs, which amounted to EUR 1.6 billion as of December 31, 2008.
In 2008, there was no material change with respect to the level of risk that KfW incurred as a result of changes in the ratings of transactions concluded under the PROMISE and PROVIDE platforms.
ABS SME Portfolio. Since December 2005, KfW has operated a promotional program called “ABS-Mittelstandsportfolio” (ABS SME Portfolio). Under this program, KfW invests in tranches of SME loan-portfolios, which were securitized in order to foster the tradability of SME risks. With new investments in six SME securitization transactions in the amount of EUR 360 million in 2008 compared to investments in nine SME securitization transactions in the amount of EUR 445 million in 2007, as of the end of 2008, the outstanding amount of KfW’s ABS SME Portfolio was EUR 951 million. The decrease of new investments in 2008 compared to 2007 was due to the ongoing crisis in the global financial markets.
Export and Project Finance (KfW IPEX-Bank)
Business
KfW IPEX-Bank operates on a worldwide basis, offering project and corporate financing within Germany and abroad, as well as export and trade financing. It offers a full range of financing products with a focus on long-term financing, including structured financing, investment financing, acquisition financing and project financing. Through the 50% stake of KfW-IPEX-Beteiligungsholding GmbH in Movesta Lease and Finance GmbH, KfW IPEX-Bank is also involved in lease finance operations. Another joint venture for lease operations of KfW IPEX-Bank, together with HSH Nordbank, is Railpool Holding GmbH & Co KG, an asset manager in rail transportation. More recently, KfW IPEX-Bank has increasingly offered short-term instruments, such as performance and payment bonds and non-recourse purchase of receivables discounted at market rates.
KfW IPEX-Bank’s principal customers are large corporations with international operations and larger medium-sized companies in basic and manufacturing industries, as well as in the commerce, health, power and energy, environmental protection, telecommunications, shipping, aviation, rail and road, airport and harbors and other industry sectors. Traditionally, loans extended by KfW IPEX-Bank are used for export and project financings. In recent years, KfW IPEX-Bank has increasingly extended loans to finance direct investments by German enterprises and other corporate purposes. KfW IPEX-Bank’s loans are also used to secure sources of raw materials for the German industry and are conditioned upon the delivery of raw materials into the Federal Republic for the term of the loan. In addition, loans serve to co-finance large-scale infrastructure projects in the European transport sector.
21
KfW IPEX-Bank’s loans are generally extended directly to the ultimate borrower, and KfW IPEX-Bank makes a significant portion of its loans at its own risk. KfW IPEX-Bank regularly cooperates with other financial institutions by way of consortia and syndications and intends to expand its syndication activities. In some cases, KfW IPEX-Bank may arrange for commercial banks to assume the risk on portions of loans made by KfW IPEX-Bank through “risk-participations,” for which KfW IPEX-Bank pays a fee to the bank assuming the risk.
From time to time, KfW IPEX-Bank also enters into framework loan agreements with foreign banks, which enable such banks to extend loans to their customers for the purpose of importing equipment from German or other European exporters. Because the amount of individual loans is usually small, the related transaction costs are relatively high. The framework agreements help to reduce these transaction costs.
Loans extended by KfW IPEX-Bank are generally secured by collateral and often benefit from a payment guarantee or other security arrangement. Loans extended to finance direct investments may benefit from an investment guarantee against political risk by the Federal Republic if the host country risk is assessed to be substantial.
A portion of export finance loans extended by KfW IPEX-Bank is guaranteed by the Federal Republic through Euler Hermes Kreditversicherungs-AG, the official German export credit insurer (“HERMES”). HERMES insurance covers up to 95% of KfW IPEX-Bank’s risk, with the result that the portion covered becomes the equivalent of German government risk. HERMES also provides coverage for related deliveries from other, mainly European, countries provided that it does not exceed a certain portion of the total delivery for which an export finance loan was extended. In addition to HERMES insurance, KfW IPEX-Bank frequently obtains a guarantee from a foreign export credit agency or a government instrumentality in the buyer’s country.
For borrowers in other European and Organization for Economic Cooperation and Development (“OECD”) countries where the country risk is not considered high, KfW IPEX-Bank has been increasingly extending loans on the basis of ordinary banking collateral (e.g., mortgages on aircraft or ships) without seeking the benefit of HERMES or similar coverage. In addition, even when HERMES coverage is sought, KfW IPEX-Bank often extends loans on which the insured portion is less than 95%. As of December 31, 2008, KfW IPEX-Bank’s outstanding loans and guarantees outside Germany amounted to EUR 38.0 billion, of which EUR 6.3 billion, or 17%, were export finance loans guaranteed by HERMES.
Understanding with the European Commission
In accordance with the understanding between the European Commission and the German Federal Government reached in March 2002, KfW was required to transfer to a legally independent subsidiary that portion of its export and domestic and international project finance activities which the European Commission deemed to fall outside the scope of the promotional activities of KfW by no later than December 31, 2007. See “General — Relationship with the Federal Republic — Understanding with the European Commission.”
In 2003, KfW started to implement this understanding and set up a separate business unit under the KfW IPEX-Bank brand. Until December 31, 2007 KfW IPEX-Bank was organized as a bank-within-the-bank within KfW and was responsible for all lending activities at purely commercial terms and conditions in competition with other financial institutions. In 2007, KfW finalized the institutional structuring of KfW IPEX-Bank’s activities, completing its preparation for independent compliance with applicable banking law and regulation and the organizational and functional separation of various activities, including treasury, controlling, internal accounting and risk management. In April 2007, KfW IPEX-Bank was registered as a limited liability corporation under German law and a banking license was granted to allow for the preparation of the transfer of a part of the current loan portfolio in export and project finance from KfW to KfW IPEX-Bank GmbH.
As of January 1, 2008, KfW IPEX-Bank GmbH commenced operations as a legally independent entity wholly-owned by KfW. KfW IPEX-Bank GmbH conducts the portion of export and project finance activities which the European Commission deemed to fall outside the scope of KfW’s promotional activities directly and on its own behalf, while it conducts the promotional export and project finance activities in its own name on behalf of KfW on a trust basis. KfW IPEX-Bank GmbH is located in Frankfurt am Main/Germany, and as of December 31, 2008 employed 487 persons (excluding managing directors, but including temporary personnel). KfW IPEX-Bank GmbH is approved as an IRB (internal rating based-advanced) bank under the Basel II rules by the supervisory authorities — the Bundesanstalt für Finanzdienstleistungsaufsicht (Federal Financial Supervisory Authority) and Deutsche Bundesbank (German Central Bank) — and has been assigned ratings of AA- and Aa3 (both with stable outlook) by the international rating agencies Standard and Poor’s Rating Services and Moody’s Investor Service.
22
Commitments
In 2008, total commitments of export and project finance amounted to EUR 17.6 billion compared with EUR 16.1 billion in 2007. This increase was due to particularly high demand for financings in the power sector and manufacturing industries. As of December 31, 2008, KfW IPEX-Bank’s total outstanding loans and guarantees increased to EUR 52.7 billion from EUR 46.3 billion as of December 31, 2007, mainly due to the stronger U.S. dollar. 28% of total commitments in 2008 related to promotional export and project finance activities which KfW IPEX Bank extended on behalf of KfW.
Commitments by Sectors. The following table shows KfW IPEX-Bank’s commitments by economic sector in 2008 and 2007.
| | | | | | | | | |
| | | Year ended December 31, |
| | | 2008 | | 2007 |
| | | (EUR in millions) |
| Shipping | | | 4,179 | | | | 4,802 | |
| Rail and road | | | 2,660 | | | | 2,454 | |
| Manufacturing industries, retail and health | | | 2,636 | | | | 1,810 | |
| Power, renewables, water | | | 2,364 | | | | 1,906 | |
| Basic industries | | | 2,099 | | | | 2,254 | |
| Aviation | | | 955 | | | | 1,213 | |
| Telecommunications, media | | | 909 | | | | 654 | |
| Financial institutions/ Trade and commodity finance (1) | | | 676 | | | | 142 | |
of which for AKA (from ERP Special Fund)(2) | | | 123 | | | | 142 | |
| Airports and harbors, construction industries | | | 640 | | | | 834 | |
| Leveraged finance, mezzanine, equity (1) | | | 433 | | | | — | |
| | | | | | | | | |
Total commitments (3) | | | 17,551 | | | | 16,068 | |
| | | | | | | | | |
| | |
| (1) | | In addition to its core products, in 2008 KfW IPEX Bank began to offer trade finance, mezzanine products and participation in lease finance. |
| |
| (2) | | AKA (Ausfuhrkreditgesellschaft mbH) is a consortium of German banks active in export financing. |
| |
| (3) | | Commitments represent the volume of funds committed for loans and other business transactions (including grants and guarantees) in the relevant year, including amounts to be disbursed in future years, and do not include amounts disbursed in the relevant year pursuant to commitments made in prior years. |
Commitments by Geographic Area. In 2008, KfW IPEX-Bank’s commitments for project and corporate financings within Germany increased to EUR 4.2 billion compared to EUR 3.5 billion in 2007. This increase was primarily due to activities in the shipping and the manufacturing industries. KfW IPEX-Bank’s commitments to other countries increased from EUR 12.6 billion in 2007 to EUR 13.3 billion in 2008, mainly reflecting an increase in financing in the rail and road, basic industries and energy sectors.
KfW IPEX-Bank’s export and project finance business to countries outside Germany includes loans that finance corporate investments in Germany and abroad, loans that finance direct investments by German and other European companies in countries abroad, and loans that finance projects by foreign borrowers which nevertheless serve German or European interests such as projects in natural resources. In 2008, commitments in the amount of EUR 7.2 billion were made in Europe (excluding Germany, but including Russia and Turkey).
Commitments by Products. The following table shows KfW IPEX-Bank’s commitments by product in 2008 and 2007.
23
| | | | | | | | | |
| | | Year ended December 31, |
| | | 2008 | | 2007 |
| | | (EUR in millions) |
| Direct loans | | | 6,080 | | | | 5,204 | |
| Export finance | | | 2,480 | | | | 1,452 | |
| Structured finance | | | 1,942 | | | | 3,244 | |
| Project finance | | | 1,718 | | | | 1,396 | |
| Guarantees | | | 1,664 | | | | 1,139 | |
| Credit lines | | | 1,526 | | | | 1,747 | |
| Lease finance | | | 948 | | | | 775 | |
| Acquisition finance | | | 659 | | | | 772 | |
| Mezzanine and other products | | | 535 | | | | 340 | |
| | | | | | | | | |
Total commitments | | | 17,551 | | | | 16,068 | |
| | | | | | | | | |
In recent years, KfW IPEX-Bank has expanded its product portfolio. In addition to its core products (project finance, structured finance, acquisition finance and corporate finance), it now offers trade finance (including bid and performance bonds and non-recourse purchase of receivables discounted at market rates), mezzanine products, participation in lease finance and derivatives as hedging instrument.
Funding
The funds for KfW IPEX-Bank’s commitments are mainly provided by KfW through borrowings in the capital markets. Since KfW IPEX-Bank commenced operations as a legally independent subsidiary on January 1, 2008, KfW has been providing funding to KfW IPEX-Bank’s international project and export finance business at market rates based on the ratings of AA- and Aa3 assigned to KfW IPEX-Bank by international rating agencies. For those areas of export finance which the European Commissioner has deemed to fall within the scope of the promotional activities of KfW, funds from the ERP Special Fund may also be used for subsidizing interest rates. In 2008, EUR 46 million of loan disbursements were supported by the ERP Special Fund. In connection with the sale of ships, KfW IPEX-Bank extends loans under the CIRR (Commercial Interest Reference Rate) scheme for the shipping industry supported by the federal budget.
The terms of export and project finance loans funded in the capital markets are based on the cost of funds to KfW, plus a margin intended to cover the administrative cost of the loan, the credit risk and a return on the bank’s capital. Because the Federal Republic is a member of the OECD, loans financed with ERP Special Fund funds or under the CIRR scheme for the shipping industry must comply with OECD regulations, which provide for minimum interest rates and maximum credit periods. Margins on these loans are also generally intended to cover all the risks of such loans as well as administrative costs and a return on capital. In addition, KfW IPEX-Bank charges customary banking fees for reserving and providing financing and for handling. Foreign-currency denominated loans are hedged through matched funding or other mechanisms.
Promotion of Developing and Transition Countries
In its promotion of developing and transition countries business, KfW, on behalf of the Federal Republic, provides financial assistance to developing countries and countries in transition, either under its KfW Entwicklungsbank (KfW Development Bank) brand, which promotes mainly public-sector development cooperation activities, or through DEG, which promotes private-sector investments in developing countries.
The following table sets forth KfW’s commitments for its promotion of developing and transition countries business in 2008 and 2007.
24
Promotion of Developing and Transition Countries Commitments
| | | | | | | | | |
| | | Year ended December 31, |
| | | 2008 | | 2007 |
| | | (EUR in millions) |
| KfW Entwicklungsbank | | | | | | | | |
| Loan commitments | | | 2,698 | | | | 2,119 | |
of which federal funds | | | 563 | | | | 408 | |
of which KfW’s funds refinanced in the capital markets | | | 2,135 | | | | 1712 | |
| Grant commitments | | | 882 | | | | 803 | |
| Mandates (1) | | | 101 | | | | 80 | |
| | | | | | | | | |
| Total KfW Entwicklungsbank | | | 3,681 | | | | 3,002 | |
| | | | | | | | | |
| DEG – Deutsche Investitions- und Entwicklungsgesellschaft mbH | | | 1,225 | | | | 1,206 | |
| | | | | | | | | |
Total commitments | | | 4,906 | | | | 4,208 | |
| | | | | | | | | |
| | |
| (1) | | Mandates are grants funded by foreign governmental or supranational entities and distributed using KfW’s expertise and channels. |
KfW Entwicklungsbank (KfW Development Bank)
KfW acts as the Federal Republic’s international development bank, extending loans and disbursing grants mainly to foreign public sector borrowers and recipients. Around 39% of these loans and grants are refinanced from federal budget funds provided to KfW and made according to instructions from the Federal Government. Mandates and both loan commitments for the account of the Federal Republic and grants are funded by federal budget funds and, by their nature, do not appear on KfW’s balance sheet.
KfW extends financial cooperation loans in three ways:
| | • | | Traditional Financial Cooperation Loans that are extended for the account of the Federal Republic; |
| |
| | • | | Financial Cooperation Development Loans (FZ-Entwicklungskredite), in which KfW offers its own funds as an additional source of financing. For these loans, federal budget funds at low interest rates or grant funds are combined with funds from KfW that are refinanced in the capital markets. Almost half of the portion refinanced with KfW funds is guaranteed either by a special guarantee facility of the Federal Republic or by export credit agencies. Interest rates and related terms of Financial Cooperation Development Loans are significantly more favorable to the borrower than market terms and, therefore, meet the requirements for recognition as official development assistance; and |
| |
| | • | | Financial Cooperation Promotional Loans (FZ-Förderkredite), which are funded solely through funds raised by KfW in the capital markets and do not include interest reduction elements from the federal budget. |
Generally, interested foreign governments submit applications for financial cooperation to the Federal Government, which then asks KfW to appraise the proposed projects. In the case of Financial Cooperation Promotional Loans, project sponsors may submit their proposals directly to KfW. KfW maintains a staff of economists, engineers and other specialists to assist in the appraisal and development of projects. KfW receives fees from the Federal Republic for loans and grants extended for the account of the Federal Government and Development Loans, calculated as a percentage of outstanding loans and grants, as far as they are financed out of the federal budget. Based on KfW’s appraisal and its recommendation, the Federal Republic decides whether or not to fund a particular project. Upon a favorable decision and upon determination of the terms and conditions of financing, KfW enters into a loan or grant agreement with the recipient country or, if applicable, the individual agency responsible for the project, in which case the obligations under that agreement would then usually be fully guaranteed by the respective recipient country.
25
Financial cooperation loans and grants are disbursed according to the progress of the relevant project, and KfW monitors the utilization of funds in order to verify compliance with the provisions of the loan or grant agreement.
The following table shows KfW’s commitments under its KfW Entwicklungsbank brand in 2008 and 2007.
KfW Entwicklungsbank Commitments
| | | | | | | | | |
| | | Year ended December 31, |
| | | 2008 | | 2007 |
| | | (EUR in millions) |
| Loan commitments | | | | | | | | |
| Financial Cooperation Loans | | | 351 | | | | 277 | |
| Financial Cooperation Development Loans | | | 1,033 | | | | 579 | |
of which federal funds | | | 213 | | | | 130 | |
| Financial Cooperation Promotional Loans | | | 1,314 | | | | 1,263 | |
| | | | | | | | | |
| Total | | | 2,698 | | | | 2,119 | |
| | | | | | | | | |
| Grant commitments | | | 882 | | | | 803 | |
| Mandates (1) | | | 101 | | | | 80 | |
| | | | | | | | | |
Total commitments | | | 3,681 | | | | 3,002 | |
| | | | | | | | | |
| | |
| (1) | | Mandates are grants funded by governmental or supranational entities and distributed using KfW’s expertise and channels. |
Total commitments of KfW Entwicklungsbank increased by 23% to EUR 3,681 million in 2008 compared with EUR 3,002 million in 2007. This growth was mostly due to an increase of Financial Cooperation Development Loans commitments, which are funded from both federal budget funds and KfW’s own funds.
Consistent with KfW’s policy to increase its own funding of financial cooperation commitments, the share of commitments that were refinanced in the capital markets increased by 25% from EUR 1,712 million in 2007 to EUR 2,135 million in 2008. This amount corresponds to 58% of the total commitments of KfW Entwicklungsbank compared with 57% in 2007.
In 2008, Europe/Caucasus accounted for 33% of financial cooperation financing commitments; Asia, for 30%; sub-Saharan Africa, for 15%; Latin America, for 12%; and Middle East/North Africa, for 10%. Project-tied commitments to finance development projects and programs amounted to EUR 3,578 million in 2008 compared with EUR 2,951 million in 2007. The largest share of financial cooperation funds was committed to financial sector projects, with commitments totaling EUR 1,392 million, or 38% of total commitments (2007: 26%). Commitments for social infrastructure projects added up to EUR 973 million, or 26% (2007: 33%), followed by commitments in the economic infrastructure sector of EUR 966 million, or 26% (2007: 33%). Commitments for non-project-tied aid (i.e., program-based joint financing to support general reforms) and commodity aid (i.e., supply of required commodities such as industrial raw materials not covered by a specific project), amounted to EUR 103 million in 2008 compared with EUR 51 million in 2007.
Cooperation Between KfW Entwicklungsbank and GTZ. The Federal Government currently provides aid to developing countries mainly through two organizations: financial cooperation with developing countries through KfW Entwicklungsbank; and technical cooperation through Deutsche Gesellschaft für Technische Zusammenarbeit GmbH (“GTZ”), a private company owned by the Federal Government. GTZ provides solutions for political, economic, ecological and social development worldwide — frequently in cooperation with KfW. GTZ operates on a non-profit basis, and any surpluses generated by it are channeled back into development projects. According to its 2007 annual report, GTZ had a business volume of EUR 1,057 million, had 1,358 employees in Germany and maintained offices in 66 countries.
The Federal Government is considering coordinating its financial and technical cooperation more closely. In 2006, two studies regarding enhanced cooperation between KfW Entwicklungsbank and GTZ were commissioned. Those studies proposed various models, ranging from closer cooperation within the two existing separate organizations to a combination of the two organizations into a single institution. In general, the studies confirmed that there is a need for structural reform in German development cooperation and recommended that financial and technical cooperation be combined. Any decision as to whether and how to proceed with a reform will be made by the Federal Government. KfW is unable to predict whether, when or in what form the reform will occur.
26
DEG — Deutsche Investitions— und Entwicklungsgesellschaft mbH
DEG, a limited liability corporation, is a legally independent entity founded in 1962 which KfW acquired from the Federal Republic in 2001. DEG is located in Cologne/Germany and in 2008 maintained 12 representative offices in developing or transition countries. In 2008, DEG employed an average of 385 persons compared to 367 in 2007. DEG is fully consolidated in KfW’s consolidated financial statements.
DEG’s activities extend to various countries in Africa, Asia, Latin America, and Central and Eastern Europe. DEG aims to establish and expand private enterprise structures in these countries as a contribution to sustainable growth and lasting improvement in the living conditions of the local population. To this end, DEG provides long-term capital for private enterprises investing in developing countries. In addition, DEG provides both finance and consultancy services in customized packages on a project basis.
DEG pursues four key economic aims in its private sector development policy:
| | • | | promoting direct investment, including with DEG’s own venture capital; |
| |
| | • | | providing long-term debt finance to investment projects; |
| |
| | • | | supporting pioneer investors in new countries and regions; and |
| |
| | • | | strengthening local capital markets through financial sector development. |
DEG conducts its activities in cooperation with commercial banks rather than in competition with them. In its activities, DEG acts in accordance with commercial principles. Accordingly, it does not provide subsidized financing, but instead offers financing solely on commercial terms and conditions. DEG also seeks to mobilize other partners to provide additional capital for investment in its projects.
As an instrumentality serving public policy objectives of the Federal Government, DEG has been granted a favorable tax status under which only part of DEG’s activities are subject to corporate income tax. Like KfW, DEG does not distribute profits but instead re-channels them into new investments.
DEG’s obligations do not benefit from the Guarantee of the Federal Republic or from Anstaltslast, and while DEG’s indebtedness is reflected in KfW’s consolidated balance sheet, its debt represents obligations of DEG and not of KfW. In June 2001, KfW and DEG entered into a refinancing agreement, pursuant to which KfW acts as sole issuer in the capital markets and provides DEG with mid- and long-term capital market funds according to DEG’s capital needs. In addition, internal agreements have been reached concerning the respective fields of business activities, the mutual use of offices abroad, joint public relations activities and joint information technology management.
DEG’s commitments in 2008 amounted to EUR 1,225 million (at own risk), compared with EUR 1,206 million in 2007. These commitments include risk participations by third parties in the amount of EUR 134 million in 2008, compared with EUR 75 million in 2007.
Shareholdings, Treasury and Services
Privatization Initiatives and Other Shareholdings
Privatization Initiatives. In furtherance of the privatization initiatives of the Federal Government, KfW has acquired and sold shares of both Deutsche Telekom AG and Deutsche Post AG in various transactions since 1997. KfW has sold those shares through, among other transactions, German and international public offerings, private placements, block trades, exchangeable bonds and other transactions. Pursuant to an arms-length agreement with the Federal Government, KfW is protected against the market risk of these transactions. The agreement provides that KfW will receive a percentage of any market value increase in the shares acquired and sold, plus a fee for its services.
27
In the case of Deutsche Telekom AG, the number of shares held by KfW remained almost unchanged in 2008. Minor changes resulted from exchanges in connection with the exchangeable bond issued in August 2003 which matured in August 2008. As of December 31, 2008, KfW held 735.6 million shares of Deutsche Telekom AG, which represented a stake of approximately 16.9%. To KfW’s knowledge, the Federal Republic continued to hold a direct stake of approximately 14.8% in Deutsche Telekom AG as of December 31, 2008. In late May 2008, KfW issued exchangeable bonds due in June 2013 in an aggregate principal amount of EUR 3.3 billion, which are exchangeable into ordinary registered shares of Deutsche Telekom AG. Upon an exchange in full of these bonds, KfW’s ownership interest in Deutsche Telekom AG would be reduced by approximately 221 million ordinary registered shares.
In the case of Deutsche Post AG, the number of shares held by KfW remained unchanged in 2008. As of December 31, 2008, KfW held 368.3 million shares of Deutsche Post AG, which represented a stake of approximately 30.5%. To KfW’s knowledge, the Federal Republic holds no more shares in Deutsche Post AG.
The Federal Government may sell further stakes in Deutsche Telekom AG to KfW in 2009. KfW expects its holdings in Deutsche Telekom AG and Deutsche Post AG shares to be reduced in the medium term.
Other Shareholdings. KfW generally holds its subsidiaries and equity participations that are subject to German taxation through its two investment holding companies: KfW Beteiligungsholding GmbH; and KfW IPEX-Beteiligungsholding GmbH.
As of December 31, 2008, the assets of KfW Beteiligungsholding GmbH consisted of a 13.0% stake in Dedalus GmbH & Co. KGaA, which in turn holds a 7.5% economic stake in European Aeronautic Defence Space Company EADS N.V., and a 100% stake each in Finanzierungs- und Beratungsgesellschaft mbH, ASTRA-Grundstücksgesellschaft mbH and tbg Technologie-Beteiligungs-Gesellschaft mbH.
KfW IPEX-Beteiligungsholding GmbH was established in 2005 to become the holding company for KfW IPEX-Bank GmbH’s participations. KfW IPEX-Beteiligungsholding GmbH holds KfW IPEX-Bank GmbH itself, which commenced operations as a legally independent subsidiary of KfW as of January 1, 2008. In addition, KfW IPEX-Beteiligungsholding GmbH holds a 50% share in Movesta Lease and Finance GmbH, which KfW acquired from IKB in 2005.
IKB. At the end of October 2008, KfW sold its stake in IKB Deutsche Industriebank (“IKB”), a financial institution engaged in the provision of medium- and long-term loans, equity and real estate financings and structured financings for SMEs, as well as leasing services, primarily in Germany. At the time of sale, following a capital increase by IKB (described below), KfW held a stake of 90.8% in IKB. Since the end of July 2007, IKB had run into difficulties in connection with the crisis in the U.S. subprime mortgage market (the “subprime crisis”), which resulted in KfW providing substantial support to IKB in both 2007 and 2008 as described below.
Risk Protection for IKB in 2007. At the end of July 2007, it emerged that IKB had significant exposures to risks arising in connection with U.S. subprime mortgage loans. In order to ensure IKB’s liquidity position, KfW, together with several of the German banking associations, committed to protect IKB from certain risks to which it was exposed in connection with the subprime crisis. The banking associations were participating in the risk protection for IKB on a pro rata basis with KfW and their overall commitment was capped at EUR 1.2 billion.
As of December 31, 2007, the risk protection for IKB amounted to EUR 9.3 billion. Taking into account the banking associations’ risk participation of EUR 1.2 billion, KfW’s total exposure in connection with these risk protection measures was reduced by this amount to EUR 8.1 billion, while expected losses for KfW amounted to EUR 6.8 billion, as of December 31, 2007. In addition, KfW recorded a partial write-down of EUR 0.4 billion on its stake in IKB as of December 31, 2007.
Risk Protection for IKB in 2008. In February and March 2008, IKB announced that a reevaluation of its on-balance sheet investments in structured credit portfolios with a principal amount of EUR 5.8 billion (as of March 20, 2008) had resulted in additional valuation losses, which were not covered by the risk protection measures described above.
28
On February 14, 2008, in order to provide for additional risk protection for IKB, the Federal Government mandated KfW in accordance with § 2 paragraph 4 of the KfW Law, which authorizes the Federal Government to direct KfW to take measures in connection with matters in which the Federal Republic has an interest (Zuweisungsgeschäft), to implement capital measures up to an amount of EUR 2.3 billion for the benefit of IKB (the “Mandate”). Under the Mandate, KfW made payments totaling EUR 1,050 million into IKB’s capital reserves (Kapitalrücklage) to bolster IKB’s mandatory core capital (bankaufsichtsrechtliches Kernkapital). KfW also committed to the German Banking Supervisory Authority (Bundesanstalt für Finanzdienstleistungsaufsicht) to ensure a subscription of new IKB shares, either by itself or a third party, in the amount of EUR 1.25 billion, in a planned cash capital increase (Barkapitalerhöhung) of up to approximately EUR 1.5 billion. The German association of private banks (Bundesverband deutscher Banken, or “BdB”) agreed to participate in the additional support measures for IKB implemented by KfW in connection with the Mandate in an amount of EUR 300 million. In addition, the Federal Republic committed to reimburse to KfW up to EUR 1.2 billion for losses incurred by KfW under the Mandate.
In August 2008, in connection with the cash capital increase for IKB approved by IKB’s shareholders’ meeting held on March 27, 2008 (the “IKB Capital Increase”), KfW conditionally agreed to subscribe for a total number of 487,288,757 new IKB shares at EUR 2.56 per share (the “KfW Share Subscription”). The KfW Share Subscription was subject to the condition precedent that the European Commission either determined that the KfW Share Subscription was compatible with applicable state aid rules under the EC Treaty or approved the IKB risk protection and support measures notified to it by the German government, in each case by no later than October 25, 2008. Pending satisfaction of the condition precedent, KfW paid the aggregate subscription price of EUR 1.25 billion for the KfW Share Subscription into a trust account. On October 24, 2008, following clearance by the European Commission on October 21, 2008, the KfW Share Subscription was executed and the IKB Capital Increase registered in the commercial register. Upon registration of the IKB Capital Increase, KfW’s equity interest in IKB increased from 45.5% to 90.8%. KfW’s participation in the IKB Capital Increase represented the last of the capital measures implemented by KfW in connection with the risk protection for IKB under the Mandate.
On August 21, 2008, KfW recorded a risk provision in the amount of EUR 660 million in order to account for the expected aggregate loss resulting from the capital measures under the Mandate (i.e., the payments amounting to EUR 1.05 billion made by KfW into IKB’s capital reserves in February and March 2008, respectively, and the payment of EUR 1.25 billion made by KfW in connection with the KfW Share Subscription). The risk provision took into account the contributions by the Federal Government and the German association of private banks in an aggregate amount of EUR 1.50 billion towards the capital measures under the Mandate as well as the consideration to be received in connection with the sale of KfW’s interest in IKB as described below.
Sale of Interest in IKB. In the light of IKB’s difficulties in connection with the subprime crisis described above, KfW reviewed all strategic options with respect to its equity interest in IKB. Following a resolution by its Board of Supervisory Directors in November 2007, KfW decided to pursue a sale of its stake in IKB and initiated a formal, competitive sale process in January 2008 in the course of which the number of potential buyers was gradually reduced until summer 2008.
On August 21, 2008, KfW entered into an agreement with an affiliate of Lone Star Funds (“Lone Star”), a U.S. private equity group, to sell to Lone Star all of KfW’s shares in IKB (the “Purchase Agreement”). The shares in IKB that were to be purchased by Lone Star included shares held by KfW through KfW Beteiligungsholding GmbH and shares conditionally subscribed for by KfW in the KfW Share Subscription. Completion of the transaction was subject to conditions precedent, including, in particular, approvals by KfW’s Board of Supervisory Directors and by relevant authorities, including the European Commission, which was examining the compatibility of the risk protection measures for IKB and the transaction with state aid rules under the EC Treaty. On October 29, 2008, after the conditions precedent were fulfilled, KfW and Lone Star completed the sale of all of KfW’s shares in IKB. Lone Star acquired 531,314,238 shares, corresponding to 90.8% of IKB’s nominal share capital.
In connection with the transaction, KfW agreed to assume specified portfolio and legal risks, as follows: KfW assumed the risk of a portfolio of structured financial instruments in a nominal amount of EUR 1.61 billion from IKB at a market value of EUR 1.01 billion on August 25, 2008. The Federal Republic agreed to reimburse KfW for up to EUR 600 million in potential losses resulting from these instruments in excess of a first loss amount of EUR 150 million for KfW. KfW also agreed to indemnify IKB, up to agreed amounts, for losses to which IKB may be exposed in connection with certain legal actions against it. In addition, KfW agreed to continue to provide financing on market terms to IKB and IKB-related entities, including by providing senior funding in an amount of EUR 0.6 billion to a special purpose vehicle to which IKB has transferred a part of its remaining structured credit investments in connection with the transaction.
29
Money Market Liquidity Facilities. In February and July 2008, KfW provided two money market liquidity facilities (Geldhandelslinien) in an aggregate amount of up to EUR 3.0 billion to IKB. In connection with the sale of KfW’s interest in IKB to Lone Star, the term of the liquidity facilites was extended until March 31, 2011. Both the initial money market liquidity facilities (Geldhandelslinien) and the term extension of these facilities were effected on market terms. The amounts drawn down under the liquidity facilities are fully collateralized by loans extended by IKB in connection with its commercial business activities.
EADS. On February 9, 2007, KfW, together with 14 other investors, agreed to acquire jointly from DaimlerChrysler group an indirect participation of 7.5% in the issued share capital (the “EADS stake”) of European Aeronautic Defense and Space Company EADS N.V. (“EADS”), a public limited liability corporation (naamlose vennootschap) organized under the laws of the Netherlands. EADS is a European aerospace and defense company, which holds, among other participations, a majority interest in Airbus S.A.S., the European aircraft manufacturer.
The economic interest in the EADS stake is held through Dedalus GmbH & Co. KGaA, a partnership limited by shares (Kommanditgesellschaft auf Aktien, or KGaA) organized under German law, in which KfW Beteiligungsholding GmbH holds an interest of 13%. As a result, KfW is exposed to the economic risk equivalent to holding an equity stake of approximately 0.975% in EADS. The interests of KfW and the 14 other investors in the partnership and the EADS stake are subject to various resale restrictions. KfW and the 14 other investors will benefit from a special dividend distribution. Voting rights in the EADS stake remain with the Daimler group, and neither KfW nor any of the other investors are entitled — either directly or indirectly — to exercise any voting rights attached to the EADS stake.
The investment of KfW Bankengruppe, which was recorded on KfW’s balance sheet in an amount of EUR 92 million as of December 31, 2008, was made under a special mandate of the Federal Government in accordance with § 2 paragraph 4 of the KfW Law.
Treasury and Funding
KfW’s treasury and funding activities in the financial markets comprise all treasury-related activities, including, among others, liquidity management as well as providing short- and long-term funding for KfW Bankengruppe by issuing a broad range of securities and commercial paper.
Sources and Uses of Funds. KfW Bankengruppe’s principal sources of funds are the international financial markets and public funds, with the majority of lending in its three operative business areas being financed from funds raised by KfW in the international financial markets. KfW Bankengruppe’s consolidated balance sheet total as of December 31, 2008 was EUR 394.8 billion. EUR 347.5 billion, or 88% of this amount, was financed through borrowings (i.e., from financial market funds or public funds). In addition, as of December 31, 2008, KfW had EUR 17.6 billion in liabilities held in trust (i.e., for which the Federal Government provides the funding and assumes all risks), which do not appear on KfW’s consolidated balance sheet. In line with the focus on mid-term and long-term loans within its loan portfolio resulting from its promotional business, about 80% of KfW Bankengruppe’s total borrowings outstanding at the end of 2008 had remaining maturities of one year or more.
Financial-Market Funds. KfW raises short-term and long-term funds in the international financial markets through the issuance of bonds and notes (including commercial paper) and by incurring loans against debt certificates (Schuldscheindarlehen). Long-term funding with initial maturities of more than one year (referred to as “capital-market funding” below) has gained importance in recent years as KfW Bankengruppe has increased the volume of its loan portfolio. Short-term borrowings with initial maturities of less than one year in the form of commercial paper (referred to as “money-market funding” below) are of lesser importance to KfW’s financial market activities, as commercial paper issuances are primarily used for purposes of KfW’s liquidity management. The percentage of capital-market funding outstanding of total financial-market funds outstanding was 89% at the end of 2008.
30
All amounts stated in connection with KfW’s capital- and money-market funding transactions or funding volume are, unless stated otherwise, based on net proceeds to KfW, which are calculated as principal amount less price discount and underwriting commissions, if any.
Capital-Market Funding. KfW’s capital-market funding policy pursues a dual aim: to achieve the most favorable terms possible for funds raised in the capital markets; and to minimize, to the extent practicable, the effects of changes in interest rates and foreign exchange rates mainly through interest rate and currency risk hedging instruments and, to a more limited extent, by matching funding liabilities with loan assets. In order to achieve favorable terms for funds raised, KfW maintains an active presence in all major capital markets and utilizes a broad range of funding instruments in various currencies, covering a range of maturities.
KfW’s capital-market funding is based on three pillars: its “benchmark” bond programs (in euro and U.S. dollar); publicly placed bonds outside the benchmark programs; and “private placements,” which is a term KfW uses in the commercial sense to refer to sales to a specific investor or a limited number of investors. In 2008, benchmark bonds accounted for a funding volume of EUR 38.4 billion, or 51% of KfW’s total capital-market funding of EUR 75.3 billion. The two other funding sources accounted for EUR 28.0 billion, or 37%, and EUR 7.7 billion, or 10%, respectively, with the remaining 2% being funded by issuance of credit-linked certificates of indebtedness in connection with securitization transactions and Schuldscheindarlehen. Total capital-market funding, which increased by EUR 10.7 billion in 2008 compared with 2007, was primarily raised by increased funding in euro of EUR 8.8 billion and in U.S. dollar of EUR 8.5 billion. KfW’s core currencies are the euro, the U.S. dollar, the pound sterling and the Japanese yen, which together accounted for 93% of KfW’s total new capital-market funding in 2008. In 2008, KfW’s total new capital-market funding was raised in 22 different currencies and 394 separate capital market transactions.
KfW’s Total New Capital-Market Funding Volume 2008 by Currencies
| | | | | | | | | |
| | | EUR in billions | | % of total |
| Euro (EUR) | | | 34.1 | | | | 45 | |
| U.S. dollar (USD) | | | 25.4 | | | | 34 | |
| Pound sterling (GBP) | | | 9.0 | | | | 12 | |
| Japanese yen (JPY) | | | 1.2 | | | | 2 | |
| Other currencies (e.g., AUD, CAD, CHF, NZD, NOK and BRL) | | | 5.6 | | | | 8 | |
| | | | | | | | | |
Total | | | 75.3 | | | | 100 | |
| | | | | | | | | |
KfW expects the volume of funding to be raised by it in the capital markets in 2009 to amount to approximately EUR 75 billion.
The most important source of capital-market funding for KfW Bankengruppe are bond and note issues by KfW in the international capital markets. As of December 31, 2008, the amount of outstanding bonds and notes issued by KfW totaled EUR 271.6 billion, representing a EUR 30.2 billion increase from EUR 241.4 billion outstanding as of December 31, 2007. The amount of new bonds raised in the capital markets was EUR 74.2 billion in 2008 compared with EUR 62.5 billion in 2007.
In 2008, KfW issued four bonds in a total principal amount of EUR 20 billion under its euro benchmark program and eight new bonds in a total principal amount of USD 28 billion under its U.S. dollar program. Through the end of 2008, the first U.S. dollar benchmark bond in 2008 with a principal amount of USD 5 billion was KfW’s largest U.S. dollar bond issue ever. An additional USD 0.6 billion was raised through KfW’s medium-term note program, which was launched in 2006 and which targets U.S. investors. Besides the benchmark issues, ten additional global bonds (in Norwegian krona, Japanese yen and Swiss francs) were issued and sold by KfW in 2008.
31
KfW’s Benchmark Bond Issues in 2008
| | | | | | | | | | | | | |
| | | Principal amount | | | | | | Interest rate |
| | | in billions | | Initial maturity (in years) | | in % per annum |
| U.S. $-Benchmark I/2008 | | USD 5.0 | | | 3 | | | | 3.250 | |
| U.S. $-Benchmark II/2008 | | USD 4.0 | | | 5 | | | | 3.250 | |
| U.S. $-Benchmark III/2008 | | USD 3.0 | | | 10 | | | | 4.375 | |
| U.S. $-Benchmark IV/2008 | | USD 3.0 | | | 5 | | | | 3.500 | |
| U.S. $-Benchmark V/2008 | | USD 3.0 | | | 10 | | | | 4.500 | |
| U.S. $-Benchmark VI/2008 | | USD 3.0 | | | 3 | | | | 3.750 | |
| U.S. $-Benchmark VII/2008 | | USD 3.0 | | | 5 | | | | 4.000 | |
| U.S. $-Benchmark VIII/2008 | | USD 4.0 | | | 3 | | | | 3.250 | |
| Euro-Benchmark I/2008 | | EUR 5.0 | | | 10 | | | | 4.375 | |
| Euro-Benchmark II/2008 | | EUR 5.0 | | | 3 | | | | 4.000 | |
| Euro-Benchmark III/2008 | | EUR 5.0 | | | 5 | | | | 4.375 | |
| Euro-Benchmark IV/2008 | | EUR 5.0 | | | 3 | | | | 3.375 | |
With respect to outstanding borrowings, Schuldscheindarlehen continue to be KfW’s second most important capital-market funding instrument, with EUR 18.1 billion outstanding as of December 31, 2008, of which EUR 6.0 billion was included on KfW’s consolidated balance sheet in liabilities to banks and EUR 12.1 billion in liabilities to customers. Schuldscheindarlehen are a special instrument of the German capital market, whereby the lending entity, generally a bank, insurance company or public pension fund, receives a certificate evidencing its loan to the borrower and the terms of such loan. Maturities on Schuldscheindarlehen range from one to 30 years, thereby providing a high degree of flexibility to both the borrower and the lender. Transferable only by way of assignment, Schuldscheindarlehen have only limited liquidity in the interbank secondary market.
32
The following table sets forth summary information concerning all of KfW’s bonds and notes, as well as Schuldscheindarlehen, outstanding with an initial maturity of more than one year:
Information on Issues of Funded Debt of KfW Bankengruppe
(as of December 31, 2008)
| | | | | | | | | | | | | | | | | | | | | |
| | | | | | | Average | | | | | | | | | | | | |
| | | | | | | interest | | | | | | Average | | | | | | |
| | | | | | | rate in % | | Year | | | | time to | | Principal amount | | | Principal amount | |
| | | Number of | | Interest | | per annum | | of | | Year of | | maturity | | outstanding | | | outstanding | |
| Currency | | transactions | | type | | (1) (2) | | issue | | maturity | | in years (2) | | in currency | | | in EUR (3) | |
| AUD | | 22 | | FIXED | | 5.94 | | 1999 - 2008 | | 2009 -2028 | | 3.8 | | | 9,413,820,000 | | | | 4,643,296,833 | |
| AUD | | 1 | | FLOATING | | NA | | 2008 | | 2015 | | 6.7 | | | 127,370,000 | | | | 62,824,307 | |
| BGN | | 1 | | FLOATING | | NA | | 2007 | | 2012 | | 3.9 | | | 10,000,000 | | | | 5,112,997 | |
| BRL | | 1 | | FIXED | | 0.0 | | 2006 | | 2017 | | 8.7 | | | 350,000,000 | | | | 108,084,738 | |
| BRL | | 12 | | FLOATING | | NA | | 2005 - 2008 | | 2009 - 2014 | | 1.3 | | | 2,135,000,000 | | | | 659,316,904 | |
| CAD | | 13 | | FIXED | | 4.37 | | 2004 - 2008 | | 2010 - 2037 | | 10.3 | | | 4,494,000,000 | | | | 2,643,840,452 | |
| CAD | | 1 | | FLOATING | | NA | | 2008 | | 2023 | | 14.2 | | | 7,000,000 | | | | 4,118,132 | |
| CHF | | 2 | | FLOATING | | 0.34 | | 2007 - 2008 | | 2010 | | 1.9 | | | 70,000,000 | | | | 47,138,047 | |
| CHF | | 13 | | FIXED | | 2.92 | | 1999 - 2008 | | 2009 - 2037 | | 7.0 | | | 4,900,000,000 | | | | 3,299,663,300 | |
| CZK | | 3 | | FIXED | | 5.23 | | 2002 | | 2009 | | 0.2 | | | 6,000,000,000 | | | | 223,255,814 | |
| DEM | | 1 | | FIXED | | 0.0 | | 1993 | | 2023 | | 14.3 | | | 105,985,000 | | | | 54,189,270 | |
| EGP | | 2 | | FLOATING | | NA | | 2007 | | 2009 - 2012 | | 2.7 | | | 575,000,000 | | | | 74,916,322 | |
| EUR | | 344 | | FLOATING | | 4.27 | | 1997 - 2008 | | 2009 - 2055 | | 17.3 | | | 14,384,653,507 | | | | 14,384,653,507 | |
| EUR | | 326 | | FIXED | | 3.96 | | 1980 - 2008 | | 2009 - 2044 | | 4.8 | | | 140,301,072,829 | | | | 140,301,072,829 | |
| GBP | | 42 | | FLOATING | | 4.75 | | 1999 - 2008 | | 2009 - 2061 | | 27.4 | | | 949,724,104 | | | | 997,085,673 | |
| GBP | | 31 | | FIXED | | 5.26 | | 1999 - 2008 | | 2009 - 2037 | | 7.1 | | | 29,863,980,014 | | | | 31,353,259,857 | |
| GHS | | 1 | | FLOATING | | NA | | 2008 | | 2010 | | 1.3 | | | 20,000,000 | | | | 11,830,469 | |
| HKD | | 1 | | FLOATING | | 2.1 | | 2008 | | 2010 | | 1.9 | | | 100,000,000 | | | | 9,271,450 | |
| HKD | | 8 | | FIXED | | 3.12 | | 2003 - 2008 | | 2009 - 2017 | | 3.0 | | | 2,161,000,000 | | | | 200,356,024 | |
| HUF | | 4 | | FIXED | | 6.5 | | 2005 - 2006 | | 2009 - 2012 | | 1.6 | | | 52,500,000,000 | | | | 196,850,394 | |
| IDR | | 1 | | FLOATING | | 0.0 | | 2007 | | 2012 | | 3.5 | | | 400,000,000,000 | | | | 25,559,105 | |
| ISK | | 8 | | FIXED | | 10.89 | | 2006 - 2008 | | 2009 - 2017 | | 1.0 | | | 39,500,000,000 | | | | 136,206,897 | |
| JPY | | 940 | | FLOATING | | 0.72 | | 1996 - 2008 | | 2011 - 2038 | | 20.3 | | | 1,357,564,000,000 | | | | 10,762,359,283 | |
| JPY | | 41 | | FIXED | | 1.78 | | 1995 - 2008 | | 2009 - 2038 | | 7.2 | | | 773,871,000,000 | | | | 6,135,016,648 | |
| MXN | | 5 | | FIXED | | 8.78 | | 2005 - 2006 | | 2009 - 2011 | | 1.3 | | | 3,806,600,000 | | | | 197,988,801 | |
| MYR | | 2 | | FIXED | | 4.29 | | 2006 - 2007 | | 2013 - 2017 | | 6.2 | | | 805,000,000 | | | | 167,539,398 | |
| NGN | | 2 | | FLOATING | | 0.0 | | 2007 - 2008 | | 2010 - 2011 | | 1.9 | | | 34,700,000,000 | | | | 181,475,864 | |
| NOK | | 2 | | FLOATING | | 5.71 | | 2007 - 2008 | | 2010 | | 1.4 | | | 2,050,000,000 | | | | 210,256,410 | |
| NOK | | 27 | | FIXED | | 5.26 | | 2002 - 2008 | | 2009 - 2036 | | 6.9 | | | 32,160,000,000 | | | | 3,298,461,538 | |
| NZD | | 17 | | FIXED | | 6.69 | | 2004 - 2007 | | 2009 - 2015 | | 1.9 | | | 5,053,000,000 | | | | 2,088,793,353 | |
| PLN | | 1 | | FIXED | | 4.5 | | 2006 | | 2025 | | 16.1 | | | 54,601,250 | | | | 13,145,841 | |
| RON | | 2 | | FIXED | | 9.08 | | 2007 - 2008 | | 2010 - 2014 | | 2.3 | | | 234,000,000 | | | | 58,172,778 | |
| RUB | | 3 | | FIXED | | 6.21 | | 2007 - 2008 | | 2010 - 2012 | | 3.1 | | | 9,000,000,000 | | | | 218,007,412 | |
| SEK | | 2 | | FLOATING | | 3.40 | | 2008 | | 2010 - 2015 | | 4.3 | | | 2,200,000,000 | | | | 202,391,904 | |
| SEK | | 6 | | FIXED | | 4.59 | | 2004 - 2008 | | 2009 - 2020 | | 6.7 | | | 3,850,000,000 | | | | 354,185,833 | |
| THB | | 1 | | FIXED | | 3.87 | | 2007 | | 2010 | | 1.6 | | | 3,000,000,000 | | | | 62,240,664 | |
| TRY | | 14 | | FIXED | | 14.82 | | 2005 - 2008 | | 2009 - 2017 | | 2.6 | | | 1,710,000,000 | | | | 795,793,001 | |
| USD | | 54 | | FLOATING | | 2.31 | | 2004 - 2008 | | 2009 - 2036 | | 4.8 | | | 3,551,117,136 | | | | 2,551,639,819 | |
| USD | | 236 | | FIXED | | 3.92 | | 1993 - 2008 | | 2009 - 2047 | | 6.2 | | | 93,146,470,041 | | | | 66,929,992,126 | |
| ZAR | | 15 | | FIXED | | 8.28 | | 1999 - 2008 | | 2009 - 2015 | | 2.1 | | | 8,888,120,000 | | | | 680,211,530 | |
| | | | | | | | | | | | | | | | | | |
Total | | 2,208 | | | | | | | | | | 6.7 | | | | | | | 294,349,575,524 | |
| | | | | | | | | | | | | | | | | | |
| | |
| (1) | | Interest rate of floating rate note means the applicable interest rate as of December 31, 2008. Floating rate notes for which the interest rate is fixed in arrears are not included in the calculation of the weighted average of the interest rate. |
| |
| (2) | | Averages have been calculated on a capital-weighted basis taking into account the principal amount outstanding in euro. |
| |
| (3) | | Conversion into euro at the spot rate using the European Central Bank reference rates on December 31, 2008. |
33
As a result of various governmental rescue and stimulus packages implemented worldwide in response to the crisis in the global financial markets and the subsequent economic downturn, the supply of bond issuances by sovereigns and issuers benefiting from state guarantees has increased. These changed market conditions have overall led to increased refinancing costs for KfW. KfW takes these increased costs into account in calculations of interest for its promotional loans.
Money-Market Funding. Commercial paper was issued under two commercial paper programs: the multicurrency commercial paper program and the U.S. dollar commercial paper program. The multicurrency commercial paper-program represents the most important source of short term liquidity for KfW. As of December 31, 2008, KfW Bankengruppe’s commercial paper outstanding totaled EUR 30.9 billion compared with EUR 18.9 billion at the end of 2007. This large increase was due to strong demand for KfW’s commercial paper due to its high degree of creditworthiness in the current market environment, which is characterized by the ongoing crisis in the global financial markets.
Public Funds. The proportion of public funds in the group’s borrowings was 4% at the end of 2008. The most important source of public funds for KfW is the budget of the Federal Republic. Total long-term and short-term borrowings from funds provided by the federal budget (excluding loans on a trust basis) amounted to EUR 13.0 billion as of December 31, 2008, including EUR 10.2 billion in borrowings which were transferred from the ERP Special Fund due to its reorganization with effect as of July 1, 2007. The group’s long-term and short-term borrowings from the ERP Special Fund amounted to EUR 227 million as of December 31, 2008. Public funds are made available to the group for use in special categories of investment finance and certain export and project finance transactions with developing countries. Public funds are particularly important in the area of financial cooperation, where KfW under its KfW Entwicklungsbank brand extends loans and disburses grants to foreign public sector borrowers and recipients in developing and transition countries. Public funds constituted approximately 39% of the sources of funding for financial cooperation purposes in 2008.
Liquidity Management and Income Portfolios. As of December 31, 2008, KfW Bankengruppe held financial assets in an amount of EUR 44.2 billion compared with EUR 45.7 billion in 2007. See “Financial Section — Financial Review — Development of KfW Bankengruppe — Development of Assets” for more information concerning financial assets. EUR 38.9 billion, or 88%, of all financial assets was held in the form of negotiable securities for liquidity purposes or for the purpose of investing a portion of KfW’s own funds. The remaining financial assets were securities held as surrogate for loans or as equity investments in the context of KfW’s promotional business (e.g., ABS-Mittelstandsportfolio or DEG’s direct investments) as well as other equity participations held, directly or indirectly, by KfW. They also include securities acquired by KfW in November 2008 in connection with its participation in a consortium of German financial institutions, which, in close cooperation with the Federal Government, the German Central Bank (Deutsche Bundesbank) and the BaFin, implemented liquidity measures to support Hypo Real Estate Group, a private banking group headquartered in Munich, Germany, which had experienced serious liquidity problems as a result of the ongoing crisis in the global financial markets. KfW is participating in these liquidity measures in an amount of less than 0.5% of the total amount of EUR 50 billion. The remaining financial assets include also securities formerly owned by IKB which were transferred to KfW in the course of the IKB rescue. For more information on the impacts of the IKB rescue on KfW, see “Other Shareholdings — IKB” above.
KfW’s holdings in shares of Deutsche Post AG and Deutsche Telekom AG are not included in financial assets, but are presented on KfW’s consolidated balance sheet as loans and advances to customers.
KfW pursues a conservative liquidity management strategy. For this purpose, KfW and its subsidiaries hold financial assets in various securities portfolios. The bulk of securities held in these portfolios are denominated in euro, with the remainder in U.S. dollar. The portfolios are managed either by KfW’s Treasury Department or, to a lesser extent, external portfolio managers. KfW intends to transfer its externally managed portfolios to KfW’s internal portfolio management.
For its liquidity portfolios, which KfW holds as liquidity reserve, KfW purchases money-market assets and short- and medium-term securities of public sector issuers as well as bonds issued by banks and other borrowers of high credit quality. The bulk of euro-denominated bonds included in KfW’s liquidity portfolios is eligible as collateral with the European Central Bank and enables KfW to enter into repurchase agreements in refinancing operations within the European System of Central Banks via the Deutsche Bundesbank. At the end of 2008, KfW held securities in the aggregate amount of EUR 33.0 billion in its liquidity portfolios. For financial reporting purposes, securities denominated in U.S. dollar were converted into euro at the currency exchange rate as of December 31, 2008. In addition to these securities, as of December
34
31, 2008, KfW held money-market assets (overnight and term loans as well as reverse repurchase transactions) for liquidity management purposes in the amount of EUR 12.2 billion.
For purposes of investing a portion of its own funds, KfW owns further portfolios of securities, or income portfolios, denominated in euro, which are managed by external portfolio managers and, to a lesser extent, by KfW. The amount invested in these income portfolios was EUR 5.9 billion as of December 31, 2008.
KfW Bankengruppe’s Securities Portfolios for Liquidity and Investment Purposes
| | | | | |
| | | EUR in billions as of |
| | | December 31, 2008 |
| Liquidity portfolios | | | 33.0 | |
of which managed by external portfolio managers | | | 3.1 | |
| Income portfolios | | | 5.9 | |
of which managed by external portfolio managers | | | 2.4 | |
| | | | | |
Total | | | 38.9 | |
| | | | | |
Other Services
KfW provides services for and on behalf of the Federal Government in connection with activities associated with Germany’s reunification. KfW administers certain claims transferred to the Federal Government under the 1990 Unification Treaty between the Federal Republic and the former GDR, assists the Federal Government in privatization initiatives associated with the reunification, and performs other services in connection with the assets and obligations taken over from the former GDR. In 2008, KfW continued to make progress in resolving the remaining open cases, claims and accounts.
35
CAPITALIZATION
Capitalization of KfW Bankengruppe as of December 31, 2008
| | | | | |
| | | (EUR in millions) |
| Borrowings | | | | |
| Short-term funds | | | 38,206 | |
| Bonds and other fixed-income securities | | | 271,612 | |
| Other borrowings | | | 34,386 | |
| Subordinated liabilities (1) | | | 3,247 | |
| | | | | |
| Total borrowings | | | 347,451 | |
| |
| Equity | | | | |
| Paid-in subscribed capital (2) | | | 3,300 | |
| Capital reserve (3) | | | 6,254 | |
| Reserve from the ERP Special Fund | | | 848 | |
| Retained earnings | | | 5,355 | |
| Fund for general banking risks | | | 50 | |
| Revaluation reserve | | | -551 | |
| Balance sheet loss | | | -3,436 | |
| | | | | |
| Total equity | | | 11,820 | |
| | | | | |
Total capitalization | | | 359,271 | |
| | | | | |
| | |
| (1) | | Includes assets transferred from the ERP Special Fund in form of a subordinated loan of EUR 3,247 million. |
| |
| (2) | | KfW’s equity capital, 80% of which is held by the Federal Government and the remaining 20% by the Länder, amounted to EUR 3,750 million in 2008, of which EUR 3,300 million has been paid in pro rata by the Federal Government and the Länder. |
| |
| (3) | | Includes equity capital in form of a promotional reserve (Förderrücklage) from the ERP Special Fund of EUR 4,650 million. |
36
MANAGEMENT AND EMPLOYEES
The bodies of KfW are the Managing Board (Vorstand) and the Board of Supervisory Directors (Verwaltungsrat).
Managing Board
The Managing Board is responsible for the day-to-day conduct of KfW’s business and the administration of its assets. Members of the Managing Board are full-time employees of KfW and are generally appointed for five-year terms of office by the Board of Supervisory Directors. Reappointment is permitted. Each Managing Director is responsible for certain aspects of KfW’s activities but shares the responsibility for all actions taken by the Board.
The names of the current members of the Managing Board and the dates of their appointments to the Board are set forth below:
| | | | | |
| Name | | Date of Initial Appointment |
| Dr. Ulrich Schröder (Chief executive officer) | | September 1, 2008 | |
| Dr. Günther Bräunig | | October 1, 2006 | |
| Dr. Norbert Kloppenburg | | January 1, 2007 | |
| Wolfgang Kroh | | December 1, 2000 | |
| Dr. Axel Nawrath | | April 1, 2009 | |
In 2000, KfW’s Board of Supervisory Directors has appointed the following new members of KfW’s Managing Board: On January 22, 2009, the Board of Supervisory Directors appointed Dr. Axel Nawrath, State Secretary in the Federal Ministry of Finance, as new member of the Managing Board of KfW. Dr. Nawrath took office on April 1, 2009. On March 26, 2009, the Board of Supervisory Directors appointed Mr. Bernd Loewen as additional new member of the Managing Board of KfW. Mr. Loewen will take office on July 1, 2009. Mr. Loewen is currently serving as member of the management board and head of investment banking of BRE Bank SA, Warsaw/Poland, a subsidiary of Commerzbank AG.
From October 1, 2006 until her resignation from such office on April 7, 2008, Ms. Ingrid Matthäus-Maier acted as official spokeswoman of the Managing Board. She remained a member of the Managing Board until her early retirement on September 30, 2008. From April 7, 2008 to August 31, 2008 Mr. Wolfgang Kroh acted as the provisional official spokesman.
On June 25, 2008 the Board of Supervisory Directors appointed Dr. Ulrich Schröder as Chief Executive Officer of KfW. Dr. Schröder took up his office on September 1, 2008. Dr. Schröder had previously served as chief executive officer of NRW.Bank, the State development bank of North-Rhine-Westphalia.
On September 15, 2008 (the date of Lehman Brothers’ filing of a petition under Chapter 11 of the U.S. Bankruptcy Code), KfW had transferred EUR 319 million to a Lehman affiliate under a currency swap agreement, but that counterparty failed to make its corresponding U.S. dollar payment to KfW on that day in accordance with the agreement. On September 28, 2008, based on the results of the investigation of the circumstances of the currency swap payment, KfW’s Board of Supervisory Directors decided to remove the board members Dr. Peter Fleischer and Detlef Leinberger from office. Their contracts were terminated with immediate effect as of the end of September 2008.
On October 22, 2008, the Office of the Public Prosecutor in Frankfurt am Main announced that it had initiated criminal investigations against members of KfW’s Managing Board for alleged breach of trust (Untreue) in connection with the transfer made by KfW to an affiliate of Lehman Brothers described above. KfW is cooperating fully with the Office of the Public Prosecutor.
On November 1, 2008, Dr. Günther Bräunig resumed his functions as member of KfW’s Managing Board, which he had ceased to perform as from July 29, 2007, due to his temporary appointment as chief executive officer of IKB.
For information on the remuneration of the Managing Board, see Note 72 to the financial statements.
Board of Supervisory Directors
The Board of Supervisory Directors generally has 37 members and consists of the Federal Minister of Finance; the Federal Minister of Economics and Technology; the Federal Minister of Foreign Affairs; the Federal Minister of Food, Agriculture and Consumer Protection; the Federal Minister of Transport, Building and Urban Affairs; the Federal Minister for Economic Cooperation and Development; the Federal Minister for the Environment, Nature Conservation and Nuclear Safety; seven members appointed by the Bundesrat; seven members appointed by the Bundestag; five representatives of commercial banks; two representatives of industry; one representative each of the local municipalities, agriculture, crafts, trade and the housing industry; and four representatives of the trade unions.
37
The representatives of the commercial banks, industry, the local municipalities, agriculture, crafts, trade, the housing industry and the trade unions are appointed by the Federal Government after consultation with their constituencies.
The Federal Minister of Finance and the Federal Minister of Economics and Technology are appointed by the Federal Government as Chairman and Deputy Chairman of the Board of Supervisory Directors on a year-by-year rotating basis, with the former serving as Chairman for the year 2009. The term of office of all Federal Ministers is five years, while the other members of the Board of Supervisory are appointed for three years.
The Board of Supervisory Directors supervises the overall conduct of KfW’s business and the administration of its assets. It may give the Managing Board general or special directives. In particular, the Board of Supervisory Directors approves all loan commitments to a single borrower exceeding EUR 100 million and may reserve the right to approve other transactions or types of transactions. It is not, however, authorized to represent KfW or to commit funds on KfW’s behalf.
The Board of Supervisory Directors has a Credit Committee (Kreditbewilligungsausschuss), which approves all loan commitments to a single borrower in an amount of between EUR 50 million and EUR 100 million.
On February 13, 2008, the Board of Supervisory Directors decided to establish two new committees, an Executive Committee (Präsidialausschuss) and an Audit Committee (Prüfungsausschuss), in order to increase the efficiency of the Board in the performance of its supervisory duties. The corresponding amendments to KfW’s by-laws entered into effect in March 2008.
The Executive Committee is responsible for the handling of legal and administrative matters as well as for business and corporate policy matters of general importance. It may take decisions on the Board of Supervisory Directors’ behalf in urgent matters (Eilentscheidung). The Executive Committee, which is chaired by the Chairman of the Board of Supervisory Directors, replaces the previous Legal and Administrative Committee (Rechts- und Verwaltungsausschuss).
The Audit Committee prepares matters relating to financial reporting and risk management but does not have any decision-making power. It is chaired by a representative of the banking sector.
The current members of the Board of Supervisory Directors are:
| | | |
| Name | | Position |
| Ilse Aigner | | Federal Minister of Food, Agriculture and Consumer Protection |
| Anton F. Börner | | President of the Bundesverband des Deutschen Groß- und Außenhandels e.V.; representative of the wholesale and foreign trade sector |
| Dr. Uwe Brandl | | President of Bayerischer Gemeindetag; representative of the local municipalities |
| Frank Bsirske | | Chairman of ver.di – Vereinigte Dienstleistungsgewerkschaft; representative of the trade unions |
| Prof. Dr. Ingolf Deubel | | Minister of Finance of the State of Rhineland-Palatinate, appointed by the Bundesrat |
| Prof. Dr. Kurt Faltlhauser | | Former Minister of Finance of the Free State of Bavaria, appointed by the Bundesrat |
| Sigmar Gabriel | | Federal Minister for the Environment, Nature Conservation and Nuclear Safety |
| Dr. Karl-Theodor Freiherr zu Guttenberg | | Federal Minister of Economics and Technology; Deputy Chairman in 2009 |
| Heinrich Haasis | | President of the Deutscher Sparkassen- und Giroverband; representative of the savings banks |
| Gerhard P. Hofman | | Member of the Board of Managing Directors of Bundesverband der Deutschen |
38
| | | |
| Name | | Position |
| | | Volks- und Raiffeisenbanken e.V. (BVR); representative of the cooperative banks |
| Peter Jacoby | | Minister of Finance of the State of Saarland, appointed by the Bundesrat |
| Dr. Siegfried Jaschinski | | Chairman of the Board of Managing Directors of Landesbank Baden-Württemberg; representative of the mortgage banks |
| Bartholomäus Kalb | | Member of Parliament, appointed by the Bundestag |
| Prof. Dr.-Ing. Hans-Peter Keitel | | President of the Bundesverband der Deutschen Industrie e.V.; representative of the industry |
| Roland Koch | | Minister President of the State of Hesse, appointed by the Bundesrat |
| Dr. hc Jürgen Koppelin | | Member of Parliament, appointed by the Bundestag |
| Waltraud Lehn | | Member of Parliament, appointed by the Bundestag |
| Dr. Helmut Linssen | | Minister of Finance of the State of Northrhine-Westphalia, appointed by the Bundesrat |
| Dr. Gesine Lötzsch | | Member of Parliament, appointed by the Bundestag |
| Claus Matecki | | Member of the Federal Executive Committee of Deutscher Gewerkschaftsbund; representative of the trade unions |
| Dr. Michael Meister | | Member of Parliament, appointed by the Bundestag |
| Franz-Josef Möllenberg | | Chairman Trade Union for Food and Restaurants; representative of the trade unions |
| Hartmut Möllring | | Minister of Finance of the State of Lower Saxony, appointed by the Bundesrat |
| Matthias Platzeck | | Minister President of the State Brandenburg, appointed by the Bundesrat |
| Alexander Rychter | | Executive Director of Bundesverband Freier Immobilien- und Wohnungsunternehmen e.V.; representative of the housing sector |
| Christine Scheel | | Member of Parliament, appointed by the Bundestag |
| Hanns-Eberhard Schleyer | | Secretary General of the Zentralverband des Deutschen Handwerks; representative of the crafts |
| Andreas Schmitz | | President of the Bundesverband Deutscher Banken e.V.; representative of the commercial banks |
| Michael Sommer | | Chairman of the Deutscher Gewerkschaftsbund; representative of the trade unions |
| Gerhard Sonnleitner | | President of the Deutscher Bauernverband e.V.; representative of the agricultural sector |
| Peer Steinbrück | | Federal Minister of Finance; Chairman in 2009 |
| Dr. Frank-Walter Steinmeier | | Federal Minister of Foreign Affairs |
| Ludwig Stiegler | | Member of Parliament, appointed by the Bundestag |
| Wolfgang Tiefensee | | Federal Minister of Transport, Building and Urban Development |
| Heidemarie Wieczorek-Zeul | | Federal Minister for Economic Cooperation and Development |
See Note 72 to the financial statements for information concerning the remuneration of the Board of Supervisory Directors.
Employees
In 2008, KfW Bankengruppe employed an average of 4,228 persons (excluding Managing Directors and trainees, but including temporary personnel), compared to 4,003 persons in 2007. Approximately 32% of KfW’s staff is covered by collective bargaining agreements. KfW provides employee benefits such as pensions to its employees.
Of KfW Bankengruppe’s staff, approximately 25% is engaged in investment finance, 19% in promotion of developing and transition countries, 11% in export and project finance, and the balance in KfW’s accounting, disbursements, collateral, funding and lending support departments and in general administrative and staff functions.
See Note 71 to the financial statements for more information concerning KfW Bankengruppe’s employees.
39
FINANCIAL SECTION
FINANCIAL STATEMENTS AND AUDITORS
The consolidated financial statements of KfW included in this annual report have been prepared in accordance with International Financial Reporting Standards as adopted by the EU (“IFRS”) and the additional requirements of German commercial law pursuant to § 315a (1) of the German Commercial Code (Handelsgesetzbuch, or HGB) and supplementary provisions of the KfW Law and the by-laws of KfW. IFRS differs in certain significant respects from accounting principles generally accepted and financial reporting practices followed in the United States (“U.S. GAAP”), and, as a result, KfW’s consolidated financial statements included in this annual report may differ substantially from financial statements prepared in accordance with U.S. GAAP.
Pursuant to the KfW Law, the annual financial statements of KfW are examined by a Wirtschaftsprüfer (Certified Public Accountant) who is appointed by the Federal Minister of Finance in consultation with the Board of Supervisory Directors and the Federal Court of Auditors. KfW’s external auditors for the fiscal year 2008 are PricewaterhouseCoopers Aktiengesellschaft Wirtschaftsprüfungsgesellschaft (“PwC”), a member firm of PricewaterhouseCoopers International Limited.
The annual audit is conducted in accordance with German Generally Accepted Auditing Standards (“German GAAS”).
The auditor’s report of PwC for the year ended December 31, 2008, dated March 9, 2009, refers to a group management report (Konzernlagebericht). The examination of, and the auditor’s report upon, this group management report are required under German GAAS. This examination was not made in accordance with U.S. generally accepted auditing standards (“U.S. GAAS”) or U.S. attestation standards. Therefore, PwC does not provide any opinion on the aforementioned examination, on the group management report or on the financial statements included in this annual report in accordance with U.S. GAAS or U.S. attestation standards.
40
FINANCIAL REVIEW
Overview of KfW Bankengruppe
KfW Bankengruppe consists of KfW and seven consolidated subsidiaries.
KfW IPEX-Bank has been included in the group for the first time after being legally separated from KfW as of January 1, 2008. This separation was due to the understanding reached between the Federal Republic of Germany and the European Commission on the concept of legally independent promotional banks in Germany and the Promotional Bank Restructuring Act (Förderbankenneustrukturierungsgesetz). In this context, KfW transferred what had, until then, been part of its operations to a new subsidiary. The separation included business activities in the export and project finance segment, which compete with other financial services companies. This change does not impact the consolidated financial statements.
In addition, five special funds responsible for strategic asset management have been included in the consolidated financial statements in accordance with the requirements of Standing Interpretations Committee (SIC) 12. In connection with the IKB sale, KfW acquired portfolio investments from IKB in the form of structured securities and credit derivatives. These were partially contributed to a newly established special fund, which was included in the group for the first time. The development of the group’s business is largely dependent on the performance of KfW.
Composition of KfW Bankengruppe
| | | | | | | | | |
| | | As of December 31, |
| | | 2008 | | 2007 |
| | | (EUR in millions) |
| Balance sheet total (before consolidation) | | | | | | | | |
| KfW | | | 395,486 | | | | 353,153 | |
| Subsidiaries: | | | | | | | | |
| KfW IPEX-Bank GmbH, Frankfurt am Main/Germany (KfW IPEX-Bank) | | | 28,338 | | | | — | |
| DEG — Deutsche Investitions- und Entwicklungsgesellschaft mbH, Cologne/Germany (DEG) | | | 3,825 | | | | 3,254 | |
| KfW IPEX-Beteiligungsholding GmbH, Frankfurt am Main/Germany | | | 1,887 | | | | 219 | |
| KfW Beteiligungsholding GmbH, Bonn/Germany | | | 747 | | | | 1,107 | |
| tbg Technologie-Beteiligungs-Gesellschaft mbH, Bonn/Germany (tbg) | | | 431 | | | | 600 | |
| Finanzierungs- und Beratungsgesellschaft mbH, Berlin/Germany (FuB) | | | 49 | | | | 48 | |
| KfW International Finance Inc., Delaware/USA (KfW Finance) | | | 0 | | | | 2,782 | |
| Special purpose entities required to be consolidated: | | | | | | | | |
| Special funds | | | 5,912 | | | | 7,417 | |
| Investments accounted for using the equity method: | | | | | | | | |
| Movesta Lease and Finance GmbH, Düsseldorf/Germany (50%) | | | 141 | | | | 193 | |
| Railpool Holding GmbH & Co KG, Munich/Germany (50%) | | | 106 | | | | — | |
| Assets held for sale (IFRS 5): | | | | | | | | |
| IKB Deutsche Industriebank AG, Düsseldorf/Germany | | | — | | | | 63,538 | |
Development of KfW Bankengruppe
In 2008, KfW Bankengruppe’s development was mainly characterized by the following effects:
| | • | | Continued high volume of promotional business; |
| |
| | • | | Positive operating result; |
| |
| | • | | Crisis in the global financial markets and its impact on the group’s earnings; |
| |
| | • | | Continued negative effect on earnings from the risk protection for IKB and the sale of KfW’s interest in IKB. |
41
High Promotional Business Volume
In 2008, the group continued to record a high volume of promotional business, which totaled EUR 70.6 billion. While financing increased by 3.6% to a record-breaking EUR 69.0 billion, the volume of securitization by KfW Mittelstandsbank and KfW Förderbank fell significantly due to the collapse of this market segment.
Total Volume of Promotional Business
| | | | | | | | | |
| | | Year ended December 31, |
| | | 2008 | | 2007 |
| | | (EUR in billions) |
| KfW Mittelstandsbank | | | 14.3 | | | | 24.1 | |
| KfW Förderbank | | | 33.8 | | | | 41.2 | |
| KfW IPEX-Bank | | | 17.6 | | | | 16.1 | |
| KfW Entwicklungsbank | | | 3.7 | | | | 3.0 | |
| DEG | | | 1.2 | | | | 1.2 | |
| | | | | | | | | |
Total | | | 70.6 | | | | 85.5 | |
| | | | | | | | | |
Positive Operating Result
The operating result before valuation for 2008 developed positively with growth of EUR 221 million, or 16%, to EUR 1,579 million despite the increase in interest rate reduction measures.
This result also reflects KfW Bankengruppe’s strong operational position, which, despite difficult underlying conditions, recorded positive growth in net interest income and a further improvement in the cost/income ratio before interest rate reductions. At the same time, this operating result provides a stable basis to continue promotional activities, which remain at a high level.
Impact of the Crisis in the Global Financial Markets
During 2008, the general crisis of confidence in the financial markets caused by the U.S. subprime crisis in the second half of 2007 spread and accelerated further after the Lehman bankruptcy in September 2008. High risk and liquidity premiums, even for creditworthy counterparties, and a contraction in markets for almost all investment classes (including securitization products, but also, for example financial and corporate bonds) led to massive market distortions.
In light of these developments, the International Accounting Standards Board adopted adjustments to central accounting standards on October 13, 2008. Under certain conditions, these allow the reclassification of market-valued financial instruments from the categories
| | • | | financial assets and liabilities held for trading, and |
| |
| | • | | available-for-sale financial assets |
to the category loans and receivables. In KfW Bankengruppe, asset-backed securities in the category available-for-sale financial assets for which there was no longer an active market, were reclassified as loans and receivables with retroactive effect as from July 1, 2008. However, the volume was relatively low with a fair value of EUR 2.8 billion.
Despite the group’s conservative investment policies, the highly negative conditions in global markets resulted in valuation losses totaling EUR 2.0 billion for 2008 on the securities portfolio of approximately EUR 43 billion, which was partially valued using models due to the lack of active markets. Of this amount, EUR 0.5 billion was recorded directly in equity.
In addition, charges that were directly linked to the crisis in the global financial markets relating to the Lehman bankruptcy and to the Iceland moratorium totaled EUR 0.7 billion for 2008, of which EUR 0.3 billion was from securities.
42
Primarily as a result of substantial market distortions, earnings for 2008 were also reduced by EUR 0.6 billion due to effects in connection with the valuation of derivatives resulting from the application of IFRS. KfW uses derivatives solely to hedge risks that arise, in particular, in connection with refinancing. In this respect, KfW operates in closed risk positions as a non-trading book institution. Accordingly, KfW believes that the resulting effects on earnings were not economically reasonable, since they will offset each other again in the future.
Negative Effect on Earnings from Risk Protection for IKB and Sale of KfW’s Interest in IKB
In 2007, the solvency of IKB – in which KfW held a 37.8% interest at that time — was threatened as a result of problems arising in connection with the U.S. subprime crisis. Together with three associations of the German banking industry, KfW had been providing risk protection to IKB since the end of July 2007, which covered both on-balance sheet and off-balance sheet risks.
KfW also implemented additional capitalization measures for the benefit of IKB in 2008 in connection with a mandate by the Federal Government and in accordance with the KfW Law. In addition to the participation in a cash capital increase of IKB in an amount of EUR 1.25 billion, these measures included providing loans with waivers of debts outstanding (Darlehen mit Forderungsverzicht) and agreements on compensation from future profits (Besserungsabrede) in an amount of EUR 1.05 billion (the “IKB loans”).
On August 21, 2008, KfW entered into an agreement with Lone Star Funds for the sale of all IKB shares and the IKB loans. In connection with the transaction, KfW purchased a portfolio of structured financial instruments for a purchase price of EUR 1.0 billion. The Federal Republic agreed to reimburse KfW for up to EUR 600 million resulting from these instruments in excess of a first loss amount of EUR 150 million for KfW. With the sale of the IKB shares to Lone Star, the central aims of the IKB rescue package have been achieved.
Taking into account the loss participation on the part of the Federal Republic and the German banking sector, which amounts to EUR 1.5 billion, the risk protection for IKB provided by KfW and the sale of KfW’s interest in IKB negatively affected results in an amount of EUR 1.2 billion, which includes the charges resulting from the portfolio of structured financial instruments acquired from IKB. The total charges for KfW arising in connection with the rescue of IKB thus total EUR 8.4 billion. The risks still remaining for KfW are limited.
For additional information on the risk protection measures for IKB and the sale of KfW’s interest in IKB, see “Business – Shareholdings, Treasury and Services – Privatization Initiatives and Other Shareholdings – Other Shareholdings – IKB.”
Overview of Developments in 2008
The following key figures provide an overview of the developments in 2008.
KfW Bankengruppe Key Financial Figures
| | | | | | | | | |
| | | As of December 31, |
| | | 2008 | | 2007 |
| | | (EUR in billions) |
| Balance sheet | | | | | | | | |
| Total assets | | | 395 | | | | 354 | |
| Volume of lending | | | 365 | | | | 341 | |
| Contingent liabilities | | | 6 | | | | 6 | |
| Irrevocable loan commitments | | | 35 | | | | 39 | |
| Assets held in trust | | | 18 | | | | 19 | |
| Volume of business | | | 454 | | | | 417 | |
| Equity | | | 12 | | | | 15 | |
| Equity ratio (%) | | | 3.0 | % | | | 4.2 | % |
| | | | | | | | | |
| | | Year ended December 31, |
| | | 2008 | | 2007 |
| | | (EUR in millions, except %) |
| Income statement | | | | | | | | |
| Operating result before valuation | | | 1,579 | | | | 1,357 | |
| Operating result after valuation (1) | | | -2,751 | | | | -6,182 | |
| Consolidated loss | | | -2,657 | | | | -6,168 | |
43
| | | | | | | | | |
| | | Year ended December 31, |
| | | 2008 | | 2007 |
| | | (EUR in millions, except %) |
| Cost/income ratio before interest rate reductions (%) | | | 22.8 | % | | | 23.9 | % |
| Economic key figures | | | | | | | | |
| Consolidated loss before IFRS effects from hedging | | | -2,092 | | | | -6,163 | |
| Change in revaluation reserves recognized directly in equity | | | -460 | | | | -249 | |
| | |
| (1) | | After giving effect to the participation of the Federal Republic and the German banking sector in the IKB measures |
The consolidated total assets of KfW Bankengruppe rose by EUR 40.8 billion, or 11.5%, to EUR 394.8 billion at year-end 2008. Loans and advances (EUR 313.7 billion), in particular, developed positively with an increase in volume of EUR 27.9 billion. Derivatives with a positive fair value increased substantially by EUR 13.0 billion to EUR 21.7 billion as a result of the strong changes in market parameters relevant for valuation. Balance sheet growth was mainly funded by increased capital-market funding. The volume of certificated liabilities of EUR 302.6 billion at year-end 2008 was EUR 42.2 billion higher than at year-end 2007.
The operating result before valuation developed positively, growing by EUR 221 million, or 16%, to EUR 1,579 million in 2008 despite the increase in interest rate reductions.
However, the massive impact of the crisis in the global financial markets and the charges from the IKB sale of KfW’s interest in IKB and the risk protection for IKB resulted in a consolidated loss of EUR 2,657 million for 2008 (previous year: EUR 6,168 million). In addition, valuation losses on securities totaling EUR 460 million for 2008 (previous year: EUR 249 million) were recorded directly in equity.
The consolidated loss for 2008 includes IFRS charges in an amount of EUR 565 million which KfW does not deem economically reasonable. The consolidated loss adjusted for these effects amounts to EUR 2,092 million for 2008.
44
Development of Assets
The group’s core business is lending to banks and customers. 77% of the group’s assets at year-end 2008 were attributable to its lending business.
Distribution of Assets as of December 31, 2008
45
The volume of lending increased by EUR 24.2 billion, or 7%, to EUR 365.0 billion at year-end 2008.
Volume of Lending
| | | | | | | | | | | | | |
| | | As of December 31, | | |
| | | 2008 | | 2007 | | Change |
| | | (EUR in millions) |
| Loans and advances | | | 313,725 | | | | 285,805 | | | | 27,920 | |
| Risk provisions for lending business | | | -7,604 | | | | -7,671 | | | | 67 | |
| | | | | | | | | | | | | |
| Net loans and advances | | | 306,122 | | | | 278,134 | | | | 27,987 | |
| Contingent liabilities from financial guarantees | | | 5,996 | | | | 5,850 | | | | 146 | |
| Irrevocable loan commitments | | | 35,390 | | | | 38,462 | | | | -3,072 | |
| Loans and advances held in trust | | | 17,533 | | | | 18,440 | | | | -908 | |
| | | | | | | | | | | | | |
Total | | | 365,040 | | | | 340,887 | | | | 24,153 | |
| | | | | | | | | | | | | |
The domestic promotional loan business with its “Energy efficient construction and rehabilitation” program family and “Entrepreneurial loan” program contributed to the growth in loans and advances by EUR 27.9 billion to EUR 313.7 billion at year-end 2008. Net loans and advances totaled EUR 306.1 billion, representing 84% of the volume of lending at year-end 2008.
At EUR 6.0 billion at year-end 2008, contingent liabilities from the group’s financial guarantee business remained unchanged compared with the previous year’s level, and continued to account for 2% of the volume of lending. Irrevocable loan commitments declined by EUR 3.1 billion to EUR 35.4 billion as a result of the high level of loans drawn down in 2008. Within assets held in trust, the volume of loans and advances held in trust, which primarily comprises loans promoting developing countries that are financed by budget funds of the Federal Republic declined by 5% year-on-year and amounted to EUR 17.5 billion at year-end 2008.
Other loans and advances to banks and customers, which, in particular, consist of short-term funds, declined by EUR 6.0 billion at year-end 2008 from the previous year’s amount of EUR 20.2 billion.
Bonds and other fixed-income securities decreased by EUR 2.2 billion to EUR 40.1 billion at year-end 2008, whereas the volume of money market securities increased by EUR 2.0 billion to EUR 2.5 billion. In addition, the volume of securities held in the special funds for strategic investment purposes was reduced as a result of increased direct investment by KfW and the reduction of equity investments. The volume totaled EUR 5.6 billion on December 31, 2008. The total amount of securities and investments of EUR 44.2 billion decreased by 3% compared to 2007.
At December 31, 2008, securities and investments included asset-backed securities (“ABS”) with a carrying amount of EUR 5.4 billion held directly by KfW.
Securities and Investments
| | | | | | | | | | | | | |
| | | As of December 31, | | |
| | | 2008 | | 2007 | | Change |
| | | (EUR in millions) |
| Bonds and other fixed-income securities | | | 42,555 | | | | 42,787 | | | | -231 | |
| Shares and other non-fixed income securities | | | 433 | | | | 1,526 | | | | -1,093 | |
| Equity investments | | | 1,230 | | | | 1,205 | | | | 25 | |
| Shares in affiliated entities not included in the consolidated financial statements | | | 2 | | | | 18 | | | | -17 | |
| Investments accounted for using the equity method | | | 8 | | | | 5 | | | | 3 | |
| Shares in held-for-sale affiliated entities | | | 0 | | | | 204 | | | | -204 | |
| | | | | | | | | | | | | |
Total | | | 44,228 | | | | 45,745 | | | | -1,517 | |
| | | | | | | | | | | | | |
The volume of derivatives with positive fair values increased by EUR 13.0 billion to EUR 21.7 billion at year-end 2008. Netting agreements reached with counterparties that also include derivatives with negative fair values as well as collateral agreements reduced the counterparty risk substantially to EUR 1.6 billion. Value adjustments from macro hedging for underlying portfolios of balance sheet assets increased by EUR 6.7 billion from EUR -1.3 billion to EUR 5.5 billion at year-end 2008. This significant increase is due, in particular, to the
46
market parameters relevant for valuation, which changed significantly as a result of the crisis in the global financial markets.
There were only minor changes to the other balance sheet items.
Development of Financial Position
The group finances itself in the international capital markets, including, in particular, by means of benchmark bonds in euros and U.S. dollars, other public bonds and private placements. Funds raised in the form of certificated liabilities continued to play a key role, accounting for 76% of the balance sheet total at year-end 2008.
Funding Structure as of December 31, 2008
47
Borrowings increased by EUR 34.0 billion, or 11%, to EUR 347.5 billion at year-end 2008 and were the main source of funding for the expansion of the volume of business.
Borrowings
| | | | | | | | | | | | | |
| | | As of December 31, | | |
| | | 2008 | | 2007 | | Change |
| | | (EUR in millions) |
| Short-term funds | | | 38,206 | | | | 23,550 | | | | 14,656 | |
| Bonds and other fixed-income securities | | | 271,612 | | | | 241,437 | | | | 30,175 | |
| Other borrowings | | | 34,386 | | | | 44,739 | | | | -10,354 | |
| Subordinated liabilities | | | 3,247 | | | | 3,747 | | | | -500 | |
| | | | | | | | | | | | | |
Total | | | 347,451 | | | | 313,473 | | | | 33,978 | |
| | | | | | | | | | | | | |
Funds raised in the form of issues of medium- and long-term bonds and other fixed-income securities of KfW represented the group’s principal source of funding. In 2008, such funds amounted to EUR 271.6 billion, representing an increase of EUR 30.2 billion and accounting for 78% of borrowings at year-end 2008. Short-term issues of commercial paper rose by EUR 12.0 billion, to EUR 30.9 billion. The total amount of short-term funds raised amounted to EUR 38.2 billion. Other borrowings by KfW, in addition to promissory note loans by banks and customers (Schuldscheindarlehen), which declined by EUR 7.3 billion to EUR 18.1 billion compared with year-end 2007, consisted mainly of liabilities to the Federal Republic.
Subordinated liabilities at year-end 2008 included a subordinated loan totaling EUR 3.25 billion granted by the ERP Special Fund as part of the restructuring of ERP economic promotion program in 2007. The EUR 0.5 billion reduction at year-end 2008 was due to the scheduled redemption of a subordinated loan granted by the Federal Republic.
The volume of derivatives with negative fair values rose by EUR 8.9 billion to EUR 30.1 billion at year-end 2008. This significant increase was primarily due to the strong changes in market parameters that are relevant for valuation as a result of the crisis in the global financial markets.
There were only minor changes to the other balance sheet items.
48
Equity declined by EUR 3.1 billion year-on-year. The equity ratio declined to 3.0% at year-end 2008 compared with 4.2% at year-end 2007.
Equity
| | | | | | | | | | | | | |
| | | As of December 31, | | |
| | | 2008 | | 2007 | | Change |
| | | (EUR in millions) |
| Paid-in subscribed capital | | | 3,300 | | | | 3,300 | | | | 0 | |
| Capital reserve | | | 6,254 | | | | 6,254 | | | | 0 | |
Of which promotional reserves from the ERP Special Fund | | | 4,650 | | | | 4,650 | | | | 0 | |
| Reserve from the ERP Special Fund | | | 848 | | | | 804 | | | | 43 | |
| Retained earnings | | | 5,356 | | | | 5,862 | | | | -507 | |
| Fund for general banking risks | | | 50 | | | | 200 | | | | -150 | |
| Revaluation reserves | | | -551 | | | | -92 | | | | -460 | |
| Balance sheet loss | | | -3,436 | | | | -1,393 | | | | -2,043 | |
| | | | | | | | | | | | | |
Total | | | 11,820 | | | | 14,936 | | | | -3,116 | |
| | | | | | | | | | | | | |
A net total of EUR 0.15 billion was taken from the fund for general banking risks in 2008 in order to cover charges arising in connection with the IKB sale.
Valuation losses recognized directly in equity that related to available-for-sale financial assets and resulted primarily from the crisis in the global financial markets were responsible for a decline in the revaluation reserves of EUR 0.5 billion at year-end 2008.
The balance sheet loss at year-end 2008 increased by the amount of KfW’s unconsolidated net loss of EUR 2.0 billion for 2008. The remaining loss of EUR 0.5 billion reduced retained earnings at year-end 2008.
Development of Earnings Position
The earnings position is characterized by in the positive operating result before valuation. This development was offset by the significant impact of the crisis in the global financial markets and the substantial charges arising in connection with the risk protection for IKB and the sale of KfW’s interest in IKB.
Earnings position
| | | | | | | | | | | | | |
| | | Year ended December 31, | | |
| | | 2008 | | 2007 | | Change |
| | | (EUR in millions) |
| Net interest income | | | 2,006 | | | | 1,755 | | | | 251 | |
Including interest rate reductions | | | 606 | | | | 573 | | | | 33 | |
| Net commission income | | | 218 | | | | 209 | | | | 9 | |
| Administrative expense | | | 646 | | | | 607 | | | | 39 | |
| | | | | | | | | | | | | |
Operating result before valuation | | | 1,579 | | | | 1,357 | | | | 221 | |
| Risk provisions for lending business | | | -2,139 | | | | -6,409 | | | | 4,271 | |
| Net gains/losses from hedge accounting and other financial instruments carried at fair value | | | -1,747 | | | | -1,880 | | | | 132 | |
| Net gains/losses from securities and investments | | | -1,974 | | | | -421 | | | | -1,552 | |
| | | | | | | | | | | | | |
Operating result after valuation | | | -4,281 | | | | -7,353 | | | | 3,072 | |
| Net other operating income | | | 1,536 | | | | 1,189 | | | | 347 | |
| | | | | | | | | | | | | |
Loss from operating activities | | | -2,745 | | | | -6,164 | | | | 3,419 | |
| Taxes on income | | | -89 | | | | 4 | | | | -93 | |
| | | | | | | | | | | | | |
Consolidated loss | | | -2,657 | | | | -6,168 | | | | 3,511 | |
Consolidated loss before IFRS effects from hedging | | | -2,092 | | | | -6,163 | | | | 4,071 | |
The group’s operating result before valuation was EUR 1,579 million for 2008, which was higher than EUR 1,357 million for 2007.
49
Net interest income was the group’s most important source of income and totaled EUR 2,006 million for 2008, which represents an increase of EUR 251 million, or 14.3%, compared to the previous year. It was possible to increase interest rate reductions in the promotional loan business by 5.8% to a current total of EUR 606 million, as promotional activities were continued successfully despite the difficult underlying economic conditions. Effective interest rate management over the course of 2008 in a volatile market environment had a positive impact.
Net commission income increased slightly by 4.3% to EUR 218 million for 2008 compared with EUR 209 million for 2007. Income from credit derivatives and processing fees in the new lending business contributed to this increase. By contrast, business activities in the PROMISE and PROVIDE securitization platforms and the resulting income decreased.
Administrative expense amounted to EUR 646 million for 2008, representing a EUR 39 million, or 6.4%, increase above the comparable amount for 2007. Personnel expense rose slightly by EUR 17 million to EUR 366 million as a result of salary increases due to collective pay agreements and improved performance while employee headcount also increased.
The increase in non-personnel expenses by EUR 22 million to EUR 280 million primarily related to other administrative expenses and was due to factors including increased expenses for third-party services.
The cost/income ratio before interest rate reduction measures improved to 22.8% for 2008 (2007: 23.9%) as a result of stronger growth in operating income.
Expenses for risk provisions for the lending business, excluding the charges relating to IKB and the provisions for individual exposures directly made in connection with the crisis in the global financial markets, increased to EUR 454 million in 2008.
The recognition of portfolio valuation allowances, which primarily stem from KfW’s promotional lending business, had a negative impact in 2008. However, sufficient risk provisions were put in place in 2008 for the risks arising specifically from the spreading financial and economic crisis.
The provision for immediate credit risks was increased during 2008, especially in relation to the export and project finance business area.
The provision for losses on loans and advances and the fund for general banking risks covered all immediate and latent risks and reflect the consistent implementation of KfW Bankengruppe’s conservative risk policies.
The expense for risk provisions from the IKB capital measures and the increase in provisions for the liquidity lines assumed as part of the risk protection for IKB in 2007 together negatively affected the income statement in 2008 in a total amount of EUR 1.3 billion.
In addition, individual impairments recognized in income totaled EUR 0.4 billion in 2008 as a result of the Lehman bankruptcy and the Iceland moratorium.
In 2008, the net gains/losses from hedge accounting and other financial instruments carried at fair value were characterized by the strong market fluctuations caused by the crisis in the global financial markets. These fluctuations had a significant impact on the securities portfolio and on the reporting of economic hedges under IFRS. Additional charges resulted from the portfolio of structured financial instruments assumed as part of the sale of KfW’s interest in IKB in the amount of the first loss of EUR 150 million to be borne by KfW. Gains from covering risk provisions in foreign currency from the risk protection for IKB had a positive impact on the foreign currency result. This line item included negative earnings effects of EUR 565 million for 2008 from hedge accounting and financial instruments carried at fair value in the form of debt instruments issued, including hedging derivatives, resulting from the application of IFRS. In 2007, the effects almost offset each other. The derivatives measured at market values are all components of economically closed positions. However, if the other part of the respective closed position cannot be carried at fair value, or if different methods have been used in the valuation, there are mandatory fluctuations in results that fully offset each other over the term of the transaction. These effects were particularly high in the fourth quarter of 2008 as a result of the extreme developments in valuation factors, which reflect the markets’ volatility.
50
Equity finance business recorded at fair value through profit or loss performed satisfactorily again at EUR 53 million in 2008, following the positive results of EUR 193 million in 2007. In addition to equity investments, this item includes valuation gains and losses on ancillary agreements in equity finance business (risk commissions/profit participations). The decline was due, in large part, to equity investments in developing and emerging countries, the carrying value of which was influenced by the weakening global economy.
Securities recorded at fair value through profit or loss, including fair value accounting for gains and losses on special funds for strategic asset management, negatively affected results in an amount of EUR 1,314 million in 2008. In addition to the profit and loss components realized, this item also includes valuation gains and losses, considered temporary, arising from the current distortions in the financial markets. ABS instruments held directly by KfW and recorded at fair value through profit or loss led to EUR 424 million in charges in 2008.
Net losses from securities and investments in the amount of EUR -1,974 million in 2008 (2007: EUR -421 million) resulted primarily from the complete sale of KfW’s shares in IKB, which also included the shares newly acquired by KfW in connection with the IKB capital increase, in the amount of EUR 1,421 million.
Securities affected by the Lehman bankruptcy and the Iceland moratorium were written down by a total of EUR 0.3 billion in 2008.
Disposals and valuations of securities and equity investments not accounted for at fair value through profit or loss also led to net expenses totaling EUR 316 million for 2008. Of this total, EUR 161 million was due to impairment losses from ABS products and EUR 95 million was due to charges from the equity portfolio.
The changes in the value of securities and investments not recorded in the income statement, which were, in part, determined using valuation models, had a negative effect of EUR 460 million on the revaluation reserves within equity at year-end 2008. Of this total, EUR 32 million was due to ABS products, which were classified as loans and receivables retroactively as of July 1, 2008.
Net other operating income for 2008 primarily reflected income from the participation of the Federal Republic and the German banking sector in the IKB rescue measures in the amount of EUR 1.5 billion.
Taking into account taxes on income, which had a positive effect, the consolidated loss totaled EUR 2,657 million in 2008 as compared with EUR 6,168 million in 2007.
The consolidated loss before IFRS effects from hedging is a further economic key figure based on the consolidated loss for the period in accordance with IFRS. KfW Bankengruppe calculates this figure because the companies included in the group are non-trading book institutions. Derivative financial instruments are entered into for hedging purposes. Under IFRS, the requirements for recognition and valuation of derivatives and hedges nevertheless give rise to temporary effects which are reflected in the income statement. In KfW’s opinion, these effects do not adequately reflect that these hedges are economically effective.
As a result, the following reconciliations were performed by eliminating temporary contributions to income in the amount of EUR 565 million for 2008 as follows:
| | • | | Valuation results from micro and macro hedge accounting – All of the group’s hedges are economically effective and do not give rise to any net gain or loss over the entire period to maturity. |
| |
| | • | | Valuation results from the use of the fair value option to avoid an accounting mismatch in the case of borrowings including related hedging derivatives – These economically effective hedges do not give rise to any net gain or loss over the entire period to maturity. |
| |
| | • | | Valuation results from the fair value accounting of hedges with high economic effectiveness but not qualifying for hedge accounting – These hedges do not give rise to any net gain or loss over the entire period to maturity. |
The adjusted income resulted in a net loss of EUR 2,092 million for 2008.
51
Overall, notwithstanding growth in the operating result before valuation, net loss in 2008 was principally attributable to the significant impact of the crisis in the global financial markets on KfW’s structured securities portfolio and the significant charges arising in connection with the risk protection for IKB and the sale of KfW’s interest in IKB.
52
RISK REPORT
Current Developments
Risk control and monitoring activities during 2008 were mostly characterized by the turbulence on the financial markets. The internal credit ratings of many business partners in the financial sector deteriorated as a result of the negative performance on the international financial markets. The state rescue packages, which were organized largely after the Lehman bankruptcy, and their impact on the international financial sector were on the whole regarded as positive, and have also had a positive impact on internal credit ratings. Even so, risks in the financial sector are significantly higher than in previous years. The effects of the economic and financial crisis are also increasing risks in the corporate sector, which is expected to continue in the near future. As a result, KfW has substantially expanded its risk monitoring activities.
During the course of the financial crisis, and after the transfer of EUR 319 million to an affiliate of Lehman Brothers on the date of Lehman Brothers’ filing of a petition under Chapter 11 of the U.S. Bankruptcy Code, KfW systematically reviewed its risk management and control workflows to assess whether structural action was required. This process focused on further developing group-wide control processes (e.g., for securities and operational risks), and expanding the real-time decision-oriented reporting system. In addition, KfW Bankengruppe is working on increasing its investment control and further developing its early risk warning system. It is also reviewing methods of valuing structured products. Activities with regard to these matters started as projects during the reporting year, and will be continued and implemented in 2009. At the same time, rating methods were reviewed in 2008, and associated validation concepts and infrastructure were also expanded. Additionally, the rating systems underwent vital further development based on the validation results.
Basic Principles and Objectives of Risk Management
KfW Bankengruppe has a statutory promotional mandate, which provides the foundations for its special position and its institutional structure. Sustained promotion is KfW Bankengruppe’s overarching purpose. Measuring and controlling the risks entered into is a key factor in order to optimally employ the available resources to carry out this promotional mandate. As part of its risk management, KfW Bankengruppe seeks to enter into risks only to the extent that they appear viable with regard to the current and anticipated earnings and the probable course of the risks. KfW Bankengruppe’s risk/return management takes into account the special characteristics of a promotional bank. Banking supervisory law requirements, such as the minimum requirements for risk management (MaRisk), constitute important secondary requirements for KfW’s risk management structures and procedures.
In order to establish risk management and controlling competence within the organization of the bank, KfW offers training courses which include a modular program on risk topics. This training program enables employees and management staff from the entire group to acquire orientation knowledge or to deepen their specialized know-how.
Organization of Risk Management and Monitoring
Risk Management Bodies and Functional Aspects of Risk Management
As part of its overall responsibility, KfW’s Managing Board determines the bank’s risk principles and guidelines. KfW’s supervisory bodies – the Board of Supervisory Directors and the Federal Ministries of Finance and of Economics and Technology, which alternate in providing the chairman and deputy chairman of the Board of Supervisory Directors – are informed at least once per quarter of KfW Bankengruppe’s risk situation. The executive committee of the Board of Supervisory Directors is responsible for particularly time-sensitive decisions. The Chairman of the Board of Supervisory Directors decides whether an issue is time-sensitive.
Risk management within KfW Bankengruppe is exercised by closely intertwined decision-making bodies. They are headed by the Risk Management Committee, which is responsible for the entire group’s risk profile. The Risk Management Committee includes all members of the Managing Board along with representatives of KfW’s business areas, some central staff departments and subsidiaries of KfW Bankengruppe.
53
The Risk Management Committee adopts major changes to existing risk principles, drafts new risk principles, and deals with risk strategy, adjustments to global limits and similar topics relating to risk management. The Risk Management Committee also receives information on matters such as the development of lending business, liquidity and limit utilization and the activities resolved in the sub-committees. The Risk Management Committee is headed by the KfW board member in charge of risk controlling. Sub-committees for credit risks, market price risks and for operational risks do preparatory work for the Risk Management Committee. Heads of business areas and divisions are represented on the sub-committees in order to ensure that sub-committee decisions are taken independently.
The Market Price Risk Sub-Committee deals with decision guidelines on subjects relating to market risk, liquidity and asset management, which include reports on the liquidity and funding situation, assessment of currency risks and interest rate risks and discussion of the interest hedging strategy to be pursued in funding. The Credit Risk Sub-Committee deals with credit risk methods and credit portfolio management, for example by taking decisions on the development or enhancement of rating methods and on the design of systems for limit management and collateral assessment and by preparing decisions on global limits and portfolio guidelines for the Risk Management Committee. Several working groups have been established under the sub-committees. The constitutive meeting of the Sub-Committee Operational Risks was held in March 2008. This group body reports quarterly to the Managing Board and the Risk Management Committee on operational risks (OpRisk) and business continuity management. It thus creates transparency and assures the ability to take decisions rapidly for group-wide risks or significant events.
There are various working groups below these bodies. The groups report to the Credit Risk Sub-Committee and prepare decisions as described in the following.
The Trading Activities Working Group deals with issues connected with counterparty default risks arising from trading activities. The central task of the Working Group Trading Activities is to prepare the implementation of group-wide standards and decisions, including supervisory law issues in this context. In addition, this working group is responsible for dealing with questions of how to apply credit risk mitigation techniques that are specific to trading activities.
The Collateral Working Group is the group-wide platform in the area of collateral management for lending business. It is composed of representatives from various business areas and departments. The central functions of the Collateral Working Group are assessment of new valuation procedures and relevant decisions, revision of existing valuation procedures, definition of generally acceptable types of collateral, further development of the acceptability policy and provision of standard texts for collateral agreements. Collateral is examined for acceptability against the criteria set out in the German Solvency Regulation. In most cases, the collateral agreement and the first steps towards the provision of the collateral are the responsibility of the respective credit departments. The collateral and transaction management departments are in charge of the final provision, valuation, ongoing administration, release and realization of collateral. Accepted collateral is revaluated in regular intervals, at least annually, in the course of loan management. Collateral is re-examined on a case-by-case basis in the intensive loan management and problem-loan processing stages and as soon as the bank detects any substantial deterioration in its value.
The Rating Systems Working Group is a central body serving KfW and its subsidiaries which ensures sufficient understanding of all essential aspects of the rating systems, portfolio models and risk indicators including the associated reports for the management. The term “rating system” refers to all methods, procedures, and data collection and processing systems that are applied to evaluate counterparty risks, to map the derived risk assignments to creditworthiness categories or retail pools, or to assign default and loss rate estimates to specific types of assets. The Rating Systems Working Group derives recommendations for measures to develop or enhance rating systems for approval/decision by the management or to take these decisions independently as part of the Rating Systems Working Group’s defined range of competency. These decisions include evaluating and approving reports on validation and further development as well as deriving, planning and coordinating recommendations for measures to enhance rating systems. The Rating Systems Working Group includes representatives of all users of the rating systems, risk management and controlling, and KfW’s Internal Auditing Department.
The Portfolio Management Working Group is headed by the risk management unit and is a communication platform as well as a body for preparing group-wide portfolio management decisions. Its primary objective is to initiate and coordinate measures designed to improve the risk structure.
54
The Country Rating Working Group is the central unit for assessing country risks. It is composed of economists from the regional departments of KfW Entwicklungsbank and representatives of KfW IPEX-Bank, DEG and KfW’s Transaction Management Department. It is chaired by the Risk Management Department. This working group meets quarterly or more often as required. The role of the Country Rating Working Group is to identify, analyse and assess political and economic risks (and rewards) in the global economy and particularly in the countries in which KfW Bankengruppe does or plans to do business. Proposals for risk ratings assigned to developing, transition and emerging countries are made by the departmental regional economists, while proposals for the rating of industrial countries are submitted by the Risk Management Department. Countries are ultimately assigned to risk categories on the basis of discussions conducted within the Country Rating Working Group. If no consensus is reached, a vote of the Risk Management Department is decisive. The Risk Management Department then presents the results of the meetings directly to the Managing Board.
The following chart identifies the group’s main risk management bodies and illustrates the interaction among these bodies and with the group’s business areas and departments.
55
The subsidiaries of KfW Bankengruppe and the organizational units exercise their own control functions within the group-wide risk management system. In these cases, group-wide projects and working groups ensure a coordinated approach — for example, in the rollout of rating instruments to subsidiaries or the management and valuation of collateral.
Responsibility for developing and assuring the quality of the risk management and controlling lies outside the credit departments, with the Risk Management and Controlling Department. A comprehensive risk manual has been prepared for this purpose and is continually updated. The rules and regulations laid out in the risk manual are binding for the entire group and are accessible to all employees. Risk principles (i.e., normative rules for loan and risk management procedures) and portfolio guidelines (e.g., business restrictions and collateral requirements) make up the core of the risk manual. The risk principles and portfolio guidelines serve as the framework for the operating activities of all business areas. The risk manual ensures that uniform procedures are applied throughout the group to identify, measure, control and monitor risks. In addition, group-wide regulations are supplemented in individual business areas by specific rules. The Risk Management and Controlling Department reviews these for conformity with group-wide regulations.
56
Risk Management
The primary task of the Risk Management Department is to ensure KfW Bankengruppe’s risk-bearing capacity. For this purpose, it formulates and regularly reviews KfW Bankengruppe’s risk strategy. The risk strategy builds on the basic business policy and establishes general risk principles and concrete risk policy measures in line with business strategy. A variety of instruments to control credit, market price and operational risks are used to implement the risk strategy. In addition, management measures applied to individual counterparties and portfolios (e.g., second vote for loan approvals, a limit management system and portfolio guidelines) prevent undesired expansion of concentrated risks. Stress tests are conducted to quantify capital requirements to ensure KfW Bankengruppe’s risk-bearing capacity even when cyclical conditions deteriorate substantially. Depending on the market situation, the use of credit derivatives also contributes to improving the risk profile and expanding the range of business options.
Risk Controlling
The Risk Controlling Department is in charge of measuring and reporting all risks of KfW Bankengruppe and analysing KfW Bankengruppe’s risk-bearing capacity. In this regard uniform methods and models are implemented throughout KfW Bankengruppe on an operating level. The department is responsible for the ongoing monitoring of all key risk indicators as part of quality management for the risk indicators used in risk management and controlling, and it also provides professional support for the information systems used in reporting. Risk reporting is in line with regulatory requirements (MaRisk). The Risk Management Committee will be informed once per month of KfW Bankengruppe’s risk situation from the start of 2009. A risk report is issued quarterly to KfW Bankengruppe’s supervisory bodies.
Risk Methods, Instruments and Procedures
The Risk Methods, Instruments and Procedures Department is responsible for providing suitable methods and instruments for group-wide risk analysis and management. The structure of a long-term, sustainable, consistent method and instrument strategy for risk management and controlling is rounded off with regular validations and developments and enhancements of models and methods. The focus is on models to measure, control and price credit risks. The department is also responsible for the coordination and project management of the professional implementation of the requirements placed on instruments and IT systems used in risk management and controlling. In addition, it coordinates the formulation and development of group-wide risk principles as well as the procedure manual for risk management and control.
Internal Auditing
The Internal Auditing Department reports directly to the Managing Board, is not bound by directives from KfW Bankengruppe and works independently of the group’s procedures. It generally audits all of KfW’s processes and activities to identify the risks involved. Internal Auditing determines the audit cycles for individual audit areas based on an annual risk assessment of the audit areas. In so doing, the department takes into account the economic capital requirements of the operations to be audited.
In addition to the promotional business, auditing activities focused on the risk management procedures and methods in 2008. The risk management audits focused on the validation of internal rating systems as well as on the methods and processes for measuring and assessing market price risks and credit risks.
The Internal Auditing Department monitors important projects, particularly the IT development projects, while retaining its independence. As in previous years, in 2008 the Internal Auditing Department monitored the further development of risk measurement procedures by participating with guest status in meetings of decision-making bodies.
KfW’s Internal Auditing Department is also the group auditing department for KfW Bankengruppe. It incorporates the internal auditing departments of the subsidiaries in the group-wide audit reporting.
57
Risk Management Approach of KfW Bankengruppe
The following diagram illustrates KfW Bankengruppe’s risk management process. Risk management within KfW Bankengruppe serves one central purpose: ensuring KfW Bankengruppe’s risk-bearing capacity.
Regulatory Risk-Bearing Capacity
Indicators Under Supervisory Law
| | | | | | | | | |
| | | As of December 31, |
| | | 2008 | | 2007 (1) |
| | | (EUR in millions, except %) |
| Risk position | | | 139,712 | | | | 149,863 | |
| Tier 1 capital | | | 10,860 | | | | 14,132 | |
| Total regulatory capital | | | 14,141 | | | | 17,808 | |
| Tier 1 ratio | | | 7.8 | % | | | 9.4 | % |
| Total capital ratio | | | 10.1 | % | | | 11.9 | % |
| | |
| (1) | | The indicators as of December 2007 were still identified based on Principle I. |
KfW is not subject to the requirements of Sections 10 and/or 10a of the German Banking Act (Kreditwesengesetz/KWG). For internal purposes, the regulatory equity ratios are voluntarily calculated based on the key legal requirements. KfW has been applying the requirements of the German Solvency Regulation in this manner since the beginning of 2008. In-house rating methods are used for large sections of the loan portfolio to calculate the risk exposure (advanced internal rating based approach).
KfW Bankengruppe’s regulatory total capital ratio as of December 31, 2008 totaled 10.1% taking the consolidated loss into account compared with 11.9% as of December 31, 2007. The Tier 1 ratio totaled 7.8% compared with 9.4% as of December 31, 2007.
Economic Risk-Bearing Capacity
An analysis of risk-bearing capacity as part of internal procedures must measure risks and match them against risk-covering potential. Potential financial losses are measured with the aid of two central risk-measuring tools: expected loss; and economic capital, which is a measure to cover unexpected loss.
Expected loss refers to losses that are expected to arise on a statistical average over a number of years. Expected losses, along with other parameters, are important when credit is priced. Expected losses are defined as the product of:
| | • | | the probability of a borrower’s default (probability of default), |
58
| | • | | the expected amount of the loan outstanding at the time of the potential default (exposure at default) and |
| |
| | • | | the (anticipated) loss rate upon default (loss given default). |
The probability of default is estimated for each borrower with the aid of rating methods. The result of the rating measures is an estimate of the probability that a counterparty will be unable to fulfill its obligations within the next 12 months. In particular, collateral has to be evaluated to estimate the magnitude of the likely loss. Expected losses are not backed by capital as they are offset in a means calculation by the risk margins (insurance principle).
The risk potential to be backed by capital is quantified by the Risk Controlling Department with the aid of statistical models. For credit risks, the loss potential is computed using a credit portfolio model and using the risk measure “credit value-at-risk.” The difference between credit value-at-risk and expected loss is referred to as the economic capital requirement.
KfW Bankengruppe takes a similar approach with regard to market price risks. Value-at-risk is also calculated using statistical models. For market price risks, the value-at-risk also represents the economic capital requirement.
The forecast period for both risk categories is one year. The capital requirement for credit and market price risks is aggregated, taking diversification effects into account. The capital requirement for operational risks is calculated using the regulatory standard approach according to the German Solvency Regulation.
In principle, when calculating its overall capital requirements, KfW Bankengruppe takes into account potential additional capital requirements calculated in accordance with conservative standards that may result from stress scenarios for credit and market price risks. To assess the risk-bearing capacity the necessary capital requirement (economic capital requirement) is matched against the economic resources available for risk coverage (available financial resources). KfW does not cover liquidity risk with economic capital, as it is not a loss risk to be covered on the liabilities side but a payment risk to be covered on the assets side.
The following table sets forth the group’s economic capital requirements based on the categories of risk (described above), available financial resources and additional capital requirements for stress scenarios at year-end 2008.
The definition of available financial resources differs from the accounting and regulatory definition of equity, as available financial resources do not include part of the reserves.
59
On this basis, as of December 31, 2008, the economic risk-bearing capacity stands at a confidence level of 99.96%, which is lower than the 99.99% level applied by KfW at year-end 2007. At the 99.96% level, available financial resources cover overall capital requirements. KfW regards the 99.96% level as continuing to reflect a conservative standard, one which is within the range applied by most leading German banks. The 99.96% confidence level is used for economic capital calculation group-wide. Due to the severity of the global financial crisis and the pressure that KfW Bankengruppe has been under as a result of the risk protection for IKB and the sale of KfW’s interest in IKB, potential additional capital requirements for stress scenarios are only covered by available financial resources to a limited extent.
Taking additional equity components and available subordinated liabilities, which amount to a total of approximately EUR 7.3 billion, into account – in line with the treatment of regulatory equity – there would also be risk coverage, including for the additional capital requirements for stress scenarios, for a confidence level of 99.99%.
KfW addresses liquidity and other risks by monitoring appropriate key figures and by regularly controlling the processes of the banking operations.
KfW’s risk management approach is based on state-of-the-art models used in banking practice. However, each model represents a simplification of a complex reality and builds on the assumption that risk parameters observed in the past can be considered representative of the future. Not all possible influential factors and their complex interactions are capable of being identified and modelled for the risk development of a portfolio. This is one reason why KfW carries out stress tests both in the credit risk models and in the market risk models. KfW Bankengruppe works continually to refine its risk models and processes.
Types of Risks
Counterparty Default Risk
KfW Bankengruppe assumes counterparty risks in the context of its promotional mandate. Counterparty default risk is defined as the risk of financial loss that can occur if the borrower or counterparty fails to meet contractual payment obligations. Counterparty default risk also includes country risk which is composed of transfer, conversion and political risks. The main risks in the domestic promotional lending business are in the areas of start-up finance of small- and medium-sized enterprises and equity investments. In addition, KfW assumes risks in the context of export and project finance as well as promotional loans extended under financial cooperation.
Counterparty default risk is measured by estimating the probability of default, the exposure at default and the (anticipated) loss given default.
In identifying the probability of default, KfW Bankengruppe uses internal rating procedures for banks, corporations, small- and medium-sized enterprises, private equity providers, private equity recipients, start-up businesses and countries. These procedures are based on scorecards and follow a uniform and consistent model architecture. For project financings, KfW applies a cash flow-based rating method. The rating procedures aim at forecasting one-year default probability. As a rule, the transaction management departments are responsible for preparing ratings in risk-bearing business. The rating is updated at least once annually, with the exception of business partners with whom only retail business is conducted.
Depicting the default probability on a master scale which is uniform for the entire group ensures comparability of ratings using different rating procedures and issued for various business areas. The master scale consists of 20 different classes that can be summarized in four groups: investment grade (M1-M8); non-investment grade (M9-M15); watch list (M16-M18); and default (M19-M20). The range of default probabilities and the average default probability are defined for each master scale class.
Specific organization regulations, which mainly specify the responsibilities, competencies and control mechanisms associated with a particular rating, apply to each rating procedure. The external ratings are mapped to the KfW master scale to ensure comparability of internal ratings within KfW Bankengruppe with ratings of external rating agencies. Periodic validation and further development of the rating procedures ensure that KfW is able to rapidly respond to changes in overall conditions. The aim is to continuously optimize the selectivity
60
for all rating procedures. Rating instruments and procedures largely meet the minimum requirements of the prevailing regulatory standards (MaRisk/Basel II).
Exposure at default and valuation of collateral are heavily weighted in determining severity of loss. These are then included in the loss given default to reduce risk. In valuating acceptable collateral, the expected net revenue from collateral realization in case of loss is estimated over the entire loan term. This estimate takes into account discounts based, in the case of personal collateral, on the probability of default and the magnitude of loss incurred by the collateral provider. Due to KfW’s business model, personal collateral (most notably guarantees provided by the Federal Republic) is common. For other collateral, the discounts are chiefly attributable to fluctuations in market prices and devaluation resulting from depreciation. The determined value is an important element in estimating loss given default within KfW Bankengruppe. Depending on the availability of data, the various valuation procedures for individual types of collateral are based on internal and external historical data and expert estimates. The valuation parameters are reviewed on a regular basis. For individual collateral this guarantees a reliable valuation of the collateral position. A risk principle for loan collateral regulates uniform management, valuation and recognition of collateral across the group. The risk of default on investments in securities and in derivatives is also limited by the conservative selection of counterparties and by collateral agreements.
KfW Bankengruppe has various portfolio guidelines to limit risks from new business. These guidelines form the basis for the second vote on lending transactions and serve as an orientation guide for loan approvals. They are also designed to ensure adequate quality and risk structure of KfW’s portfolio and take into account the special features of KfW’s promotional business. The guidelines distinguish between types of counterparties and product variants and define conditions under which business transactions generally may be conducted.
Existing higher-risk exposures are divided into a “watch list” and a list for non-performing loans. The watch list serves to identify potential problem loans early and, if necessary, to make preparations for handling of these loans. KfW closely monitors the economic and financial environment of the respective borrower in the case of a potential problem loan. It regularly reviews and documents the economic situation and the collateral provided and formulates proposals for remedial action. In the case of non-performing loans, the units responsible for restructuring are responsible for this process. This guarantees that specialists are involved at an early stage to ensure professional management of problem loans.
Risk Provisioning
KfW Bankengruppe takes appropriate measures to address all identifiable default risks in its lending business by making risk provisions for loans. These risks also include political risks resulting from financing transactions outside Germany. For loans with immediate risk of default (i.e., non-performing loans), KfW sets up individual impairments or provisions for undisbursed portions. These events are identified on the basis of criteria that meet both Basel II and IFRS requirements. Criteria include the identification of considerable financial difficulties on the part of the debtor, payment arrears, concessions made to the debtor owing to its financial situation (for example, in the context of restructuring measures), conspicuous measures undertaken by the debtor to increase its liquidity, and a substantial deterioration in the value of collateral taken. These criteria are further specified in KfW’s risk manual. Individual impairments are determined by means of an impairment procedure. The calculation of individual impairments is also based on an individual assessment of the borrower’s ability to make payments in the future. The calculation takes into account the scope and value of the collateral as well as the political risk. A simplified impairment procedure is performed for small and standardized loans on the basis of homogeneous subportfolios.
Risk provisions for latent risks (i.e., portfolio impairment) are derived from the valuation of loan receivables in the context of annual rating procedures and collateral valuations. Portfolio impairment is recorded for both economic and political risks. The basis for this is the expected loss model described above, which is adjusted for IFRS purposes. Risk provisions for irrevocable loan commitments and financial guarantees are set up using the same method of calculation.
Portfolio impairment also includes a provision for specific risks resulting from the financial market crisis.
61
According to IFRS 7.36, the theoretical maximum exposure to credit risk for KfW Bankengruppe arising from financial instruments is the total loss of the respective risk exposures. This exposure also takes into account contingent liabilities and irrevocable loan commitments. These exposures are reduced by the risk provisions made. Payment arrears on the balance sheet date were reported only in Loans and advances to banks and customers. Individual impairments were also reported under Securities and investments as well as under Contingent liabilities and Irrevocable loan commitments.
The following tables provide an overview of the group’s maximum exposure to credit risk and risk provisioning for financial instruments, the book value of its financial instruments which are past due, but not individually impaired as well as its individually impaired financial instruments.
Maximum Exposure
| | | | | | | | | | | | | | | | | | | | | | | | | | | | | | | | | | | | | | | | | | | | | | | | | |
| | | | | | | | | | | | | | | | | | | Value adjustments | | | Derivatives used | | | | | | | | | | | Contingent | |
| | | | | | | | | | | | | | | | | | | from macro fair | | | for hedge | | | | | | | | | | | liabilities, | |
| | | Loans and advances | | | Loans and advances to | | | value hedge | | | accounting; Other | | | Securities and | | | irrevocable loan | |
| | | to banks | | | customers | | | accounting | | | derivatives | | | investments | | | commitments | |
| | | 2008 | | | 2007 | | | 2008 | | | 2007 | | | 2008 | | | 2007 | | | 2008 | | | 2007 | | | 2008 | | | 2007 | | | 2008 | | | 2007 | |
| | | (EUR in millions) | |
| Book value as equivalent for maximum risk of default | | | 222,935 | | | | 205,253 | | | | 97,366 | | | | 93,081 | | | | 5,451 | | | | 0 | | | | 21,737 | | | | 8,736 | | | | 44,228 | | | | 45,745 | | | | 41,673 | | | | 44,516 | |
| Risk provisions | | | 526 | | | | 485 | | | | 7,077 | | | | 7,186 | | | | 0 | | | | 0 | | | | 0 | | | | 0 | | | | 2 | | | | 1 | | | | 255 | | | | 530 | |
of which neither past due nor impaired | | | 222,454 | | | | 204,490 | | | | 94,797 | | | | 88,301 | | | | 5,451 | | | | 0 | | | | 21,737 | | | | 8,736 | | | | 43,826 | | | | 45,631 | | | | 41,612 | | | | 43,919 | |
of which with conditions renegotiated (in the reporting year)(1) | | | 0 | | | | 7 | | | | 0 | | | | 4 | | | | 0 | | | | 0 | | | | 0 | | | | 0 | | | | 0 | | | | 3 | | | | 0 | | | | 0 | |
| | |
| (1) | | Includes financial instruments that would be overdue or impaired without renegotiation of conditions. |
Book Values of Financial Instruments Past due and not Individually Impaired
| | | | | | | | | | | | | | | | | | | | | | | | | | | | | | | | | |
| | | | | | | | | | | Loans and advances to | | | | | | | | | | | | | | | | | |
| | | Loans and advances to banks | | | customers | | | | | | | | | | | | | | | | | |
| | | 2008 | | | 2007 | | | 2008 | | | 2007 | | | | | | | | | | | | | | | | | |
| | | (EUR in millions) | | | | | | | | | | | | | | | | | |
| Less than 90 days past due | | | 274 | | | | 576 | | | | 810 | | | | 971 | | | | | | | | | | | | | | | | | |
| 90 days and more past due | | | 25 | | | | 41 | | | | 261 | | | | 1,721 | | | | | | | | | | | | | | | | | |
Individually Impaired Financial Instruments
| | | | | | | | | | | | | | | | | | | | | | | | | | | | | | | | | |
| | | | | | | | | | | | | | | | | | | | | | | | | | | Contingent liabilities/ | |
| | | | | | | | | | | Loans and advances to | | | | | | | | | | | Irrevocable loan | |
| | | Loans and advances to banks | | | customers | | | Securities and investments | | | commitments | |
| | | (EUR in millions) | |
| Book value | | | 183 | | | | 145 | | | | 1,497 | | | | 2,088 | | | | 402 | | | | 115 | | | | 60 | | | | 597 | |
| Individual impairments | | | 393 | | | | 71 | | | | 6,151 | | | | 6,858 | | | | 0 | | | | 0 | | | | 180 | | | | 446 | |
At year-end 2008, EUR 2.1 billion (net after deduction of risk provisions) was classified as individually impaired out of EUR 433 billion in financial instruments outstanding at year-end 2008 compared with EUR 2.9 billion out of 397 billion at year-end 2007. Potential losses are conservatively estimated, and individual impairments have been formed in the amount of EUR 6.7 billion at year-end 2008 compared with EUR 7.4 billion at year-end 2007. This includes the provisions formed as part of the risk protection for and sale of KfW’s interest in IKB totaling EUR 5.2 billion at year-end 2008 compared with provisions of EUR 6.2 billion formed as part of the risk provision for IKB at year-end 2007.
62
In addition to provisions for immediate risks of default, KfW Bankengruppe makes provisions for latent risks of default (economic and political risks). Risk provisions for performing business totaled EUR 1.1 billion at year-end 2008 compared with EUR 0.8 billion at year-end 2007. On average, 78% of loans in KfW Bankengruppe’s portfolio for performing loans are collateralized (including recovery).
In 2008, KfW Bankengruppe did not take possession of any asset previously held as collateral.
In 2008, KfW Bankengruppe experienced a strong year-on-year increase in exposure for derivatives with positive fair values. However, netting agreements concluded with the counterparties that also include derivatives with negative fair values and collateral agreements substantially reduced the counterparty risk.
Stress Tests
KfW performs stress tests in order to identify the estimated increase in charges resulting from deterioration in the economic environment. These stress tests are calculated for various scenarios and form the basis for the calculation of additional capital requirements, which quantify the rise in capital requirements in defined crisis scenarios. Taking into account the stress tests for market price risks as well as the German Government’s existing financial markets stabilization measures for banks, additional capital requirements for stress scenarios in an amount of EUR 3.5 billion were calculated as of year-end 2008.
Portfolio Structure
The contribution of individual commitments to risk associated with KfW Bankengruppe’s loan portfolio, which includes loans and securities and investments, is assessed with the aid of an internal portfolio model. Concentrations of individual borrowers or groups of borrowers give rise to the risk of major losses that could jeopardize KfW’s existence. On the basis of the economic capital concept, the Risk Controlling Department measures the risk concentrations by individual borrower, industry and country. Concentrations are measured primarily by the extent to which they require economic capital. This ensures that not only high risk volumes but also unfavorable probabilities of default and undesirable risk correlations are taken into account. The results form the basis for managing the loan portfolio and are included in the limit management system to contain concentration risks. On the basis of the limit management system, KfW Bankengruppe defines global limits which prevent losses that would put the continuity of KfW at risk. These limits are derived from KfW’s risk-bearing capacity in the relevant area. The global limits provide a framework for managing counterparty risks. KfW reduces concentration risks under its risk management and active portfolio management in a targeted manner. To this end, KfW uses credit derivatives (single name credit default swaps) and other instruments to hedge against individual counterparty risks.
Regions. As of December 31, 2008 the Eurozone accounted for 74% of KfW Bankengruppe’s loan portfolio in terms of economic capital compared with 71% as of year-end 2007. Within the Eurozone, the proportion accounted for by Germany increased substantially. This increase was primarily due to the higher capital requirements in the German financial sector.
63
Economic Capital by Region as of December 31, 2008
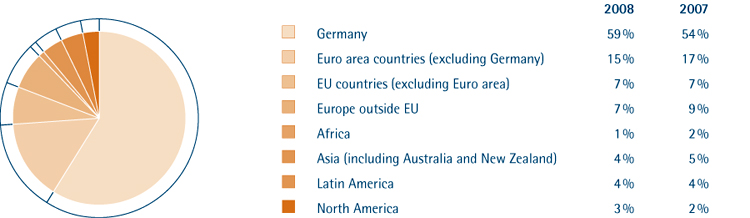
Sectors. The high share of overall capital required for credit risks attributable to the financial industry is due to KfW Bankengruppe’s promotional mandate. By far, the greatest portion of the group’s domestic promotional lending business consists of loans that are on-lent through banks. Reductions in ratings throughout the entire financial industry, some of which were significant, caused further substantial increases in capital requirements in this sector. In terms of the entire portfolio, the increase in capital requirements for the loan portfolio relates almost exclusively to the financial sector (capital requirements in the financial sector were 62% as of year-end 2008 compared with 51% as of year-end 2007). The heavy concentration in the finance sector is also reflected in terms of individual counterparties. As of December 31, 2008 the ten largest borrower units of KfW Bankengruppe, which included only banks, accounted for a total of 35% of the total capital requirements
64
for credit risks, as compared with 24% at year-end 2007. Overall, the concentration of industries and individual counterparties in the loan portfolio has increased as a result of the crisis in the global financial markets.
Economic Capital by Sector as of December 31, 2008
Credit Quality. As credit quality enters into the calculation of the economic capital, it is appropriate, particularly in analyzing the credit quality structure, to examine the distribution of net exposures by credit quality category. Measured by net exposure, at year-end 2008 70% of the group’s portfolio was composed of investment-grade debt (according to internal valuation) as compared with 79% at year-end 2007.
65
The substantial decline is primarily due to the effects in the financial industry described above. At year-end 2008, 2% of the net exposure was categorized as a default/probable loss, the same relative percentage as at year-end 2007, and 4%, compared with 3% at year-end 2007, was assigned to the watch list portfolio (i.e., increased risk of default). Despite the negative changes in ratings, KfW Bankengruppe’s loan portfolio continues to have a very good credit quality structure.
Credit Quality by Net Exposure as of December 31, 2008
Structured Products in KfW Bankengruppe’s Portfolio
According to the recommendations of the Financial Stability Forum, KfW Bankengruppe presents its portfolio of structured products separately in this section, broken down into asset-backed securities (ABS) and the PROMISE and PROVIDE platform securitizations.
Asset-Backed Securities
In addition to KfW’s own holdings of ABS, KfW Bankengruppe’s ABS portfolio includes both ABS investments in special funds and structured securities which KfW acquired from IKB as part of the sale of its shares in IKB (nominal amount: approximately EUR 1.2 billion). Part of the risk from the portfolio of securities assumed from IKB is secured by a guarantee agreement concluded with the Federal Republic in the amount of EUR 600 million.
66
The following tables show the composition of the ABS portfolio by asset class, rating and geographic distribution of the underlyings based on nominal values as of December 31, 2008. The securities had a nominal value of EUR 8.2 billion on the balance sheet date. Taking the mark-to-market valuation of the securities reported at fair value into account, the portfolio had a total value of EUR 6.6 billion as of December 31, 2008.
Nominal Value as of December 31, 2008
| | | | | | | | | | | | | | | | | | | | | | | | | |
| | | CLO | | RMBS | | CDO | | CMBS | | ABS & other | | Total |
| | | (EUR in millions) |
| Investment Grade | | | 2,478 | | | | 1,756 | | | | 564 | | | | 420 | | | | 309 | | | | 5,528 | |
| Non-Investment Grade | | | 138 | | | | 9 | | | | 231 | | | | 1 | | | | 0 | | | | 379 | |
| Watch List | | | 570 | | | | 169 | | | | 531 | | | | 253 | | | | 29 | | | | 1,552 | |
| Default | | | 79 | | | | 46 | | | | 622 | | | | 0 | | | | 0 | | | | 746 | |
| | | | | | | | | | | | | | | | | | | | | | | | | |
| | | | 3,266 | | | | 1,980 | | | | 1,948 | | | | 674 | | | | 338 | | | | 8,205 | |
| | | | | | | | | | | | | | | | | | | | | | | | | |
The impact of the rapid deterioration in the market environment is clearly reflected in the ratings in the ABS portfolio. As the external ratings, according to internal assessment, often provide an overly positive outlook on the securities’ credit quality, ABS investments are subject to strict scrutiny and an internal rating is issued in the event of an increased risk of default. As a result, the proportion of watch list and default securities increased particularly in the second half of 2008. Although there has been a negligible amount of default to date compared to the reductions in market prices, some of which have been extreme, impairments of highly cyclical exposures also increased.
Geographic Breakdown of the Underlying as of December 31, 2008 (Based on Nominal Value)
Platform Business
Banks can transfer synthetic credit risks from SME loan portfolios to the capital market using the PROMISE securitization program. KfW rounds out its offering with its PROVIDE securitization program, which seeks to securitize private loans for residential construction. As of December 31, 2008, the volume of securitization via the PROMISE and PROVIDE platforms totaled EUR 44.4 billion. Of this total, approximately EUR 42.8 billion was securitized through credit default swaps or credit-linked notes. KfW Bankengruppe has retained risks from super senior tranches with respect to the remaining EUR 1.6 billion.
67
The securitization of residential construction loans accounts for about 60% of the securitization volume; the remaining 40% serve to securitize SME loans. Risk in the platform business is primarily impacted by the quality of the securitized portfolios. At present, the risk development of the underlying credit portfolios is stable. On average, the accumulated losses total just 0.08% of the original pool volume.
Risk Protection for, and Sale of KfW’s Interest in, IKB Deutsche Industriebank AG, Düsseldorf
As of December 31, 2008, only the charges from the liquidity lines provided for the Rhineland Funding financing conduit were still part of the original three-pillared IKB risk protection from 2007. In 2008, KfW was fully drawn on under the reverse hedging for the Havenrock I and II special purpose entities and the hedging of the IKB balance sheet assets.
After deduction of the risks borne by the banking associations, losses of approximately EUR 2.1 billion were realized in connection with the risk protection for IKB in 2008, for which provisions had already been made in 2007. Taking into account redemptions and loss realization, receivables in the amount of approximately EUR 5.6 billion due to the purchasing companies of the Rhineland Funding conduit remain outstanding as of December 31, 2008. These receivables have been written down by 93%.
As part of the sale of its interest in IKB, KfW granted IKB collateralized liquidity facilities with a volume of up to EUR 3.0 billion on standard market terms. In addition, KfW assumed the risk of a portfolio of structured financial instruments from IKB at a purchase price of EUR 1.0 billion. The Federal Republic agreed to reimburse KfW for up to EUR 600 million in potential losses resulting from these instruments in excess of a threshold amount of EUR 150 million. As a result of deterioration in ratings in this portfolio, the risk of loss was realized in full in 2008. In addition, KfW provided senior funding in an amount of EUR 0.6 billion to a special purpose vehicle to which IKB has transferred a part of its remaining structured credit investments in connection with the sale of KfW’s interest in IKB to Lone Star.
For additional information regarding the legal risks that KfW has taken over from IKB in connection with the sale of its interest in IKB, see Note 10 to the financial statements. For additional information on the risk protection measures for IKB and the sale of KfW’s interest in IKB, see “Business – Shareholdings, Treasury and Services – Privatization Initiatives and Other Shareholdings – Other Shareholdings – IKB.”
As part of its economic capital concept, KfW has capital available for unexpected losses from the risks arising in connection with the sale.
Market Price Risk
Market price risks result primarily from potential losses that may arise from changes in:
| | • | | interest structure (interest rate risks); |
| |
| | • | | exchange rates (currency risks); and |
| |
| | • | | other market prices (e.g., share prices, raw materials prices). |
KfW and its subsidiaries are not required by the German Commercial Code to keep a trading book; consequently, their market price risks are limited to the banking book.
Interest Rate Risks. The main market risk component for KfW Bankengruppe is interest rate risk. The group assumes limited interest rate risks in order to seize opportunities for returns. Additionally, interest rate risks arise from the special architecture of the domestic lending business with its off-schedule repayment options. KfW takes this into account in its risk management by including the estimated volume of future off-schedule repayments in its funding strategy.
In the identification of interest rate risks in its banking book, KfW uses standard software that integrates all data relevant for risk assessment. The current balances of interest rate maturities (euro, U.S. dollar and British pound) are determined with the aid of this standard software. On this basis, KfW regularly performs value-at-risk calculations to assess its interest risk position. The applied simulation-based method is based on a two-factor Cox-Ingersoll-Ross model. Each of the factors consists of a money-market interest rate and a capital-
68
market interest rate. The parameters required for the model are estimated using past data. The model is used to estimate the distribution of risk positions in the group given possible changes in market interest rates and based on an assumed holding period of three months. The economic capital requirements, as are credit risks, are identified for a period of one year. Periodic stress tests supplement this calculation to estimate possible losses under extreme, standardized market conditions. Apart from a parallel shift in the yield curve, these tests include scenarios such as a twist in the yield curve and an extension of the holding period.
Currency Risks. Foreign currency loans are generally funded in the same currency or secured by appropriate foreign currency hedging instruments. This also applies to individual impairments for which the corresponding replacement assets are provided. In addition, KfW has decided to make portfolio provisions in U.S. dollars to hedge against contingent exchange rate risks from a potential default on existing debt denominated in U.S. dollars. The earnings components generated in U.S. dollars in the year under review were accumulated for this purpose.
Margins and commissions received over time in other currencies are converted into euros without delay to avoid currency risks.
Risks from open currency positions remaining at the balance sheet closing date are measured by a variance/covariance approach in the form of a value-at-risk with a holding period of three months. The required parameters are estimated from past data.
Other Market Price Risks. Other market price risks include share price risks from exchange-traded shares in strategic asset allocation and from investments. These risks also include raw materials price risks from CO2 certificates which KfW Bankengruppe keeps in its own books. Risks from CO2 certificates arise as a result of KfW Bankengruppe’s decision to act as an intermediary between buyers and sellers of CO2 certificates. As a result, KfW keeps certificates in its own books.
Other market price risks are measured using variance/covariance approaches. The assumed holding period when measuring risk is three months, as is the case for all other types of market price risk, with a one-year capitalization period. All of the necessary parameters are calculated using past data.
The Risk Management Committee manages market risks based on the valuation and analysis of interest and currency positions, other market price risks and stress tests for interest rate risks. The objective of this is long-term management of a reasonable market risk position for the bank and the investment of capital resources. The strategy pursued is defined annually as part of KfW Bankengruppe’s business area planning. This strategy is monitored using a global limit system.
In accordance with MaRisk, framework conditions imposed by the Managing Board which are in line with market standards apply for the transaction, processing and settlement of trades.
Volatility of Present Value of Assets Funded by Equity. In 2008, a change was made in calculations for backing for the potential volatility of present value of assets funded by equity. Previously, equity was used in full for these fluctuations, which were caused by changes in interest structures. However, the total risk was overestimated using this approach, as the part of equity which compensates for losses from defaulted loans is not subject to any interest rate risk in economic terms. As a result, calculations were adjusted such that only that portion of equity is subject to the interest rate risk which remains after potential losses from credit defaults have been deducted.
In total, market price risks within KfW Bankengruppe required a total of EUR 1,402 million in economic capital as of December 31, 2008. This position is composed of the following individual risks:
Total Economic Capital for Market Price Risks
| | | | | | | | | |
| | | As of December 31, |
| | | 2008 | | 2007 |
| | | (EUR in millions) |
| Interest rate risks | | | 919 | | | | 1,120 | |
| Currency risks | | | 26 | | | | 51 | |
| Other market price risks | | | 141 | | | | 373 | |
| Volatility of present value of assets funded by equity | | | 316 | | | | 875 | |
| | | | | | | | | |
Market price risk | | | 1,402 | | | | 2,419 | |
| | | | | | | | | |
69
Interest rate risks fell as of December 31, 2008. This was primarily due to activities conducted to reduce risks in the leveraged euro interest rate portfolio.
As of December 31, 2008, there was an open currency position in the balance sheet in the equivalent of EUR 88 million. The main currency was the U.S. dollar, for which there was a passive surplus amounting to USD 115 million. The economic capital for currency risks was EUR 26 million as of December 31, 2008.
With respect to the remaining market risks, required economic capital declined by EUR 232 million as at year-end 2008 compared with year-end 2007. This is primarily due to the reduced number of shares in strategic asset allocation; the remaining holdings were sold in the beginning of 2009.
Liquidity Risk
A variety of instruments and criteria are applied to manage the liquidity position and funding requirements of KfW Bankengruppe. The procedures applied in liquidity management are defined by specific risk guidelines. These guidelines include the definition of risk, objectives for liquidity management, the various instruments used in internal liquidity management and key parameters applied to meet statutory and regulatory requirements.
The group’s risk definition breaks down liquidity risks into institutional and market liquidity risks. Institutional liquidity risks comprise the risk of being unable to meet existing payment obligations at all, in due time and/or in the required amount. Market liquidity risks, in turn, comprise risks associated with the market price losses of assets in the event of a necessary sale and the risk of being unable to raise necessary funds in due time and/or in sufficient volume or of obtaining them only at a disproportionately high funding rate.
The primary objective of liquidity management is to ensure that KfW Bankengruppe is at all times capable of meeting its payment obligations. KfW’s subsidiaries are principally responsible for ensuring and managing their own liquidity and complying with the existing regulatory requirements. KfW, however, is available as a contractual partner for all commercial transactions of its subsidiaries, particularly for their funding. For this reason the liquidity requirements of the subsidiaries are included both in KfW’s funding schedule and in the liquidity maintenance strategy.
The basis for managing the liquidity position and determining the funding requirements within KfW Bankengruppe is a computer-based liquidity management system that evaluates all known current and future payments. Additional expected payment flows (e.g., disbursements under new lending transactions, off-schedule repayments and exercise of termination rights) are added to the known payment flows. On this basis KfW performs liquidity management and planning in daily, monthly and annual intervals. Additional analyses can be performed promptly as required.
KfW also monitors its liquidity position for compliance with the KfW Law, which requires determination of the proportion of short-term to long-term obligations in order to ensure compliance with the 10% threshold. KfW also voluntarily determines key parameters on a monthly basis according to the requirements of the Liquidity Regulation. All key liquidity figures are regularly above the minimum requirements.
To maintain liquidity, KfW holds an adequate supply of money-market instruments and liquid securities that are Category I securities eligible as collateral with the European Central Bank, both for overnight funding and for regular open-market transactions. USD securities are also held as a liquid reserve for USD business. The required liquidity cushion is reviewed regularly and calculated in such a manner that KfW’s operations can continue as planned even if a hypothetical extraordinary market disruption occurs and affects its funding options and the ability to liquidate the assets held. The two key liquidity parameters and mid-term liquidity planning are reported to the Risk Management Committee monthly and long-term planning at least annually. The committee also decides on the measures to be taken when a need for action is determined. Responsibility for monitoring the liquidity situation and prompt reporting currently lies with the Treasury Department. To further improve liquidity risk measurement and control, KfW Bankengruppe will add additional scenarios to its liquidity risk reporting from 2009, and will use a new approach for measuring the minimum amount of the liquidity. In addition, the organizational responsibilities (risk measurement and control) are being revised.
70
The table below shows the contractual payment obligations (principal and interest) of KfW Bankengruppe arising from financial instruments by maturity range.
Contractual Payment Obligations Arising from Financial Instruments by Maturity Range
| | | | | | | | | | | | | | | | | | | | | | | | | |
| | | As of December 31, 2008 (1) |
| | | | | | | 1 to 3 | | 3 months to 1 | | 1 to 5 | | 5 years and | | |
| | | Up to 1 month | | months | | year | | years | | more | | Total |
| | | (EUR in millions) |
| Liabilities to banks and customers | | | 6,505 | | | | 4,126 | | | | 4,230 | | | | 19,097 | | | | 22,764 | | | | 56,723 | |
| Certificated liabilities | | | 9,006 | | | | 5,187 | | | | 39,136 | | | | 159,613 | | | | 128,218 | | | | 341,160 | |
| Net liabilities under derivative financial instruments | | | -390 | | | | 969 | | | | 3,140 | | | | 4,273 | | | | -20,313 | | | | -12,321 | |
| Subordinated liabilities | | | 0 | | | | 0 | | | | 146 | | | | 539 | | | | 3,516 | | | | 4,201 | |
| | | | | | | | | | | | | | | | | | | | | | | | | |
Liabilities under on-balance financial instruments | | | 15,120 | | | | 10,283 | | | | 46,652 | | | | 183,522 | | | | 134,185 | | | | 389,763 | |
| | | | | | | | | | | | | | | | | | | | | | | | | |
| Contingent liabilities | | | 6,283 | | | | 0 | | | | 0 | | | | 0 | | | | 0 | | | | 6,283 | |
| Irrevocable loan commitments | | | 35,390 | | | | 0 | | | | 0 | | | | 0 | | | | 0 | | | | 35,390 | |
| | | | | | | | | | | | | | | | | | | | | | | | | |
Liabilities under off-balance financial instruments | | | 41,673 | | | | 0 | | | | 0 | | | | 0 | | | | 0 | | | | 41,673 | |
| | | | | | | | | | | | | | | | | | | | | | | | | |
Liabilities under financial instruments | | | 56,794 | | | | 10,283 | | | | 46,652 | | | | 183,522 | | | | 134,185 | | | | 431,436 | |
| | | | | | | | | | | | | | | | | | | | | | | | | |
| | | | | | | | | | | | | | | | | | | | | | | | | |
| | | As of December 31, 2007 (1) |
| | | | | | | 1 to 3 | | 3 months to 1 | | 1 to 5 | | 5 years and | | |
| | | Up to 1 month | | months | | year | | years | | more | | Total |
| | | (EUR in millions) |
| Liabilities to banks and customers | | | 5,298 | | | | 7,449 | | | | 6,889 | | | | 21,605 | | | | 37,578 | | | | 78,819 | |
| Certificated liabilities | | | 7,389 | | | | 7,603 | | | | 37,709 | | | | 143,437 | | | | 133,499 | | | | 329,637 | |
| Net liabilities under derivative financial instruments | | | 645 | | | | 1,357 | | | | 2,091 | | | | 3,743 | | | | -8,760 | | | | -924 | |
| Subordinated liabilities | | | 0 | | | | 0 | | | | 666 | | | | 584 | | | | 3,617 | | | | 4,867 | |
| | | | | | | | | | | | | | | | | | | | | | | | | |
Liabilities under on-balance financial instruments | | | 13,332 | | | | 16,409 | | | | 47,355 | | | | 169,369 | | | | 165,934 | | | | 412,399 | |
| | | | | | | | | | | | | | | | | | | | | | | | | |
| Contingent liabilities | | | 6,054 | | | | 0 | | | | 0 | | | | 0 | | | | 0 | | | | 6,054 | |
| Irrevocable loan commitments | | | 38,462 | | | | 0 | | | | 0 | | | | 0 | | | | 0 | | | | 38,462 | |
| | | | | | | | | | | | | | | | | | | | | | | | | |
Liabilities under off-balance financial instruments | | | 44,516 | | | | 0 | | | | 0 | | | | 0 | | | | 0 | | | | 44,516 | |
| | | | | | | | | | | | | | | | | | | | | | | | | |
Liabilities under financial instruments | | | 57,848 | | | | 16,409 | | | | 47,355 | | | | 169,369 | | | | 165,934 | | | | 456,915 | |
| | | | | | | | | | | | | | | | | | | | | | | | | |
| | |
| (1) | | Payment obligations from derivatives are offset against the corresponding payment claims from contracts, and irrevocable loan commitments and contingent liabilities are allocated in a lump sum to the first maturity band. |
Despite the difficult market environment characterized by the crisis in the global financial markets, KfW’s funding situation was not at any time negatively affected. The general uncertainty prevailing in the market prompted many investors to seek out “safe havens,” which has benefited KfW particularly in terms of short-term funding activities through its multicurrency commercial paper program. The program volume was increased to EUR 35 billion in 2008. This met the increased demand from investors for short-term, higher quality securities. In addition, it also allowed a general increase in funding flexibility. For 2008, KfW had capital-market funding needs of approximately EUR 75 billion compared with EUR 65 billion for 2007. The issue of state guarantees to various banks resulted in a new situation for KfW on the long-term capital market. The larger offering of state-guaranteed securities and the increased state issuing activities are currently leading to higher funding costs for KfW. Capital-market funding requirements of around EUR 75 billion have been identified for 2009 based on the continued high level of promotional business and KfW’s participation in the Federal Republic’s economic stimulus packages.
Operational and Other Risks
KfW Bankengruppe defines operational risk as the risk of direct or indirect loss resulting from inadequate or failed internal processes, people and systems or from external events. This definition includes legal risks but does not include strategic risks.
71
Control of operational risks is performed centrally by the Risk Management and Controlling Department. Operational risks are managed by the individual operational departments. Furthermore, the central OpRisk Controlling Department is in charge of operational continuity management, which supports risk management.
In accordance with the definition laid out in the German Solvency Regulation, operational risks in KfW Bankengruppe are integrated into its economic management as part of a holistic management approach. Risk management is based on loss data collection, OpRisk assessments and the identification and monitoring of measures.
Operational risks are quantified and capital requirements are determined using the regulatory standard approach according to the German Solvency Regulation.
Loss data collection has been further optimized. OpRisk assessments continue to be conducted in regular intervals. Both OpRisk instruments are supported by data processing systems specially tailored to the needs of KfW Bankengruppe. The management of measures was successfully implemented in 2008. A technical platform was developed for the MaRisk-compliant monitoring of measures derived from the OpRisk assessments or the ascertainment of losses. This platform supports risk management and was developed and implemented in the first quarter of 2008. Reporting (at present on a quarterly basis) to the departments and KfW’s Managing Board is at the core of the comprehensive management reporting. Monthly reporting is planned. Initial early warning indicators have been surveyed since the third quarter of 2008 and included in the risk management process. At the operative level, operational risks within KfW Bankengruppe are limited by an internal control system. The IT system is under continuous development and business processes are constantly being analyzed and optimized. For risks that may arise from unforeseeable events, KfW has put appropriate contingency plans in place (e.g., for IT system disruptions or inability to use buildings) and has sufficient insurance coverage (e.g., for fire and water damage).
KfW Bankengruppe addresses legal risks by involving its in-house legal department early in the process and by cooperating closely with external legal advisers in Germany and abroad. Contracts may be entered into only on the basis of unambiguous and correctly-documented arrangements. Moreover, current operations are concluded using standard contracts (e.g., ISDA contracts).
A crisis management group has been established for operational continuity management. There are emergency plans for all of KfW Bankengruppe’s critical workflows. These are tested accordingly. In addition, additional emergency workstations have been created for high priority processes at a sufficient distance. Crisis, emergency and early warning procedures have also been defined. A technical solution has already been implemented for the early warning procedures. Preparations are still underway to optimize the technical support for the planning of crisis and emergency procedures.
72
FINANCIAL STATEMENTS OF KFW BANKENGRUPPE
Income Statement
| | | | | | | | | | | | | | | | | |
| | | Note(s) | | 2008 | | 2007 | | Change |
| | | | | | | EUR in | | EUR in | | EUR in |
| | | | | | | millions | | millions | | millions |
| Interest income | | | | (26) | | | 28,677 | | | | 27,578 | | | | 1,100 | |
| Interest expense | | | | (26) | | | 26,671 | | | | 25,823 | | | | 848 | |
| | | | | | | | | | | | | | | | | |
Net interest income | | | | | | | 2,006 | | | | 1,755 | | | | 251 | |
| Risk provisions for lending business | | | (10), (13), | (27) | | | -2,139 | | | | -6,409 | | | | 4,271 | |
| | | | | | | | | | | | | | | | | |
Net interest income after risk provisions | | | | | | | -133 | | | | -4,655 | | | | 4,522 | |
| Commission income | | | | (28) | | | 406 | | | | 388 | | | | 18 | |
| Commission expense | | | | (28) | | | 188 | | | | 178 | | | | 9 | |
| | | | | | | | | | | | | | | | | |
Net commission income | | | | | | | 218 | | | | 209 | | | | 9 | |
| Net gains/losses from hedge accounting | | | (7), | (29) | | | -309 | | | | 73 | | | | -383 | |
| Net gains/losses from other financial instruments at fair value through profit or loss | | | (10), | (30) | | | -1,438 | | | | -1,953 | | | | 515 | |
| Net gains/losses from securities and investments | | | (14), | (31) | | | -1,974 | | | | -421 | | | | -1,552 | |
| Administrative expense | | | | (32) | | | 646 | | | | 607 | | | | 39 | |
| | | | | | | | | | | | | | | | | |
| Net other operating income | | | (10), | (33) | | | 1,536 | | | | 1,189 | | | | 347 | |
| | | | | | | | | | | | | | | | | |
Profit/loss from operating activities | | | | | | | -2,745 | | | | -6,164 | | | | 3,419 | |
| Taxes on income | | | | (34) | | | -89 | | | | 4 | | | | -93 | |
| | | | | | | | | | | | | | | | | |
Consolidated loss | | | | | | | -2,657 | | | | -6,168 | | | | 3,511 | |
| | | | | | | | | | | | | | | | | |
73
Appropriation of consolidated profit/loss
| | | | | | | | | | | | | |
| | | 2008 | | 2007 | | Change |
| | | EUR in | | EUR in | | EUR in |
| | | millions | | millions | | millions |
Consolidated loss | | | -2,657 | | | | -6,168 | | | | 3,511 | |
| Additions to reserves from the ERP Special Fund | | | -43 | | | | -47 | | | | 4 | |
| Additions to/withdrawals from retained earnings | | | 507 | | | | -278 | | | | 785 | |
Additions to/withdrawals from other retained earnings | | | 507 | | | | -278 | | | | 785 | |
| Additions to the fund for general banking risks | | | -50 | | | | -200 | | | | 150 | |
| Reductions of the fund for general banking risks | | | 200 | | | | 5,300 | | | | -5,100 | |
| | | | | | | | | | | | | |
Balance sheet loss | | | -2,043 | | | | -1,393 | | | | -650 | |
| | | | | | | | | | | | | |
KfW’s reserves from the ERP Special Fund are increased on the basis of contractual agreements. KfW’s net loss totalling EUR 2,043 million is recorded in the consolidated financial statements as a balance sheet loss and compounded with the amount carried forward from financial year 2007 of EUR 1,393 million.
A net total of EUR 150 million was taken from the fund for general banking risks in order to cover the charges arising in connection with the IKB sale. Last year the net withdrawal to partially cover charges from the crisis at IKB totalled EUR 5,100 million.
74
Balance Sheet
| | | | | | | | | | | | | | | | | |
| | | | | | | | | | | |
| | | | | | | 31 Dec. | | 31 Dec. | | |
| | | Note(s) | | 2008 | | 2007 | | Change |
| | | | | | | EUR in | | EUR in | | EUR in |
| | | | | | | millions | | millions | | millions |
ASSETS | | | | | | | | | | | | | | | | |
| Cash reserves | | | (37) | | | | 99 | | | | 26 | | | | 72 | |
| Loans and advances to banks | | | (9), (12), (38) | | | | 223,462 | | | | 205,738 | | | | 17,723 | |
| Loans and advances to customers | | | (9), (10), (12), (39) | | | | 104,444 | | | | 100,267 | | | | 4,177 | |
| Risk provisions for lending business | | | (10), (13), (40) | | | | -7,604 | | | | -7,671 | | | | 67 | |
| Value adjustments from macro fair value hedge accounting | | | (7), (41) | | | | 5,451 | | | | -1,295 | | | | 6,745 | |
| Derivatives used for hedge accounting | | | (7), (42) | | | | 13,028 | | | | 5,570 | | | | 7,458 | |
| Other derivatives | | | (8), (9), (43) | | | | 8,709 | | | | 3,166 | | | | 5,543 | |
| Securities and investments | | | (14), (15), (44) | | | | 44,228 | | | | 45,745 | | | | -1,517 | |
| Property, plant and equipment | | | (16), (45) | | | | 871 | | | | 801 | | | | 70 | |
| Intangible assets | | | (17), (46) | | | | 62 | | | | 69 | | | | -8 | |
| Other assets | | | (18), (47) | | | | 2,077 | | | | 1,579 | | | | 497 | |
| | | | | | | | | | | | | | | | | |
Total | | | | | | | 394,826 | | | | 353,997 | | | | 40,829 | |
| | | | | | | | | | | | | | | | | |
| | | | | | | | | | | | | | | | | |
LIABILITIES AND EQUITY | | | | | | | | | | | | | | | | |
| Liabilities to banks | | | (9), (19), (48) | | | | 11,788 | | | | 13,366 | | | | -1,578 | |
| Liabilities to customers | | | (9), (19), (49) | | | | 31,306 | | | | 37,121 | | | | -5,815 | |
| Certificated liabilities | | | (19), (50) | | | | 302,559 | | | | 260,315 | | | | 42,244 | |
| Value adjustments from macro fair value hedge accounting | | | (7), (51) | | | | 13 | | | | -423 | | | | 436 | |
| Derivatives used for hedge accounting | | | (7), (52) | | | | 10,997 | | | | 4,091 | | | | 6,906 | |
| Other derivatives | | | (8), (9), (10), (53) | | | | 19,104 | | | | 17,114 | | | | 1,991 | |
| Provisions | | | (13), (20), (54) | | | | 1,728 | | | | 1,545 | | | | 183 | |
| Other liabilities | | | (18), (55) | | | | 2,264 | | | | 2,185 | | | | 79 | |
| Subordinated liabilities | | | (21), (56) | | | | 3,247 | | | | 3,747 | | | | -500 | |
| Equity | | | (22), (57) | | | | 11,820 | | | | 14,936 | | | | -3,116 | |
| | | | | | | | | | | | | | | | | |
Total | | | | | | | 394,826 | | | | 353,997 | | | | 40,829 | |
| | | | | | | | | | | | | | | | | |
75
Statement of Changes in Equity
Statement of changes in equity in financial year 2008
| | | | | | | | | | | | | | | | | |
| | | | | | | Appropriation of | | | | |
| | | | | | | consolidated | | | | |
| | | As at 1 | | profit/loss from | | Changes in | | As at 31 |
| | | Jan. | | financial year | | revaluation | | Dec. |
| EUR in millions | | 2008 | | 2008 | | reserves | | 2008 |
| Subscribed capital | | | 3,750 | | | | 0 | | | | | | | | 3,750 | |
| less outstanding contributions, not requested | | | -450 | | | | 0 | | | | | | | | -450 | |
| Capital reserve | | | 6,254 | | | | 0 | | | | | | | | 6,254 | |
Promotional reserves from the ERP Special Fund | | | 4,650 | | | | 0 | | | | | | | | 4,650 | |
| Reserve from the ERP Special Fund | | | 804 | | | | 43 | | | | | | | | 848 | |
| Retained earnings | | | 5,862 | | | | -507 | | | | | | | | 5,356 | |
Statutory reserve under Section 10 (2) KfW Law | | | 1,574 | | | | 0 | | | | | | | | 1,574 | |
Special reserve under Section 10 (3) KfW Law | | | 1,893 | | | | 0 | | | | | | | | 1,893 | |
Special reserve less the special loss account from provisioning pursuant to Section 17 (4) of the D-Mark Balance Sheet Law | | | 21 | | | | 0 | | | | | | | | 21 | |
Other retained earnings | | | 2,374 | | | | -507 | | | | | | | | 1,867 | |
| Fund for general banking risks | | | 200 | | | | -150 | | | | | | | | 50 | |
| Revaluation reserves | | | -92 | | | | | | | | -460 | | | | -551 | |
| Balance sheet loss | | | -1,393 | | | | -2,043 | | | | | | | | -3,436 | |
| | | | | | | | | | | | | | | | | |
EQUITY | | | 14,936 | | | | -2,657 | | | | -460 | | | | 11,820 | |
| | | | | | | | | | | | | | | | | |
76
Statement of changes in revaluation reserves in financial year 2008
| | | | | | | | | | | | | | | | | | | | | |
| | | | | | | Shares and | | | | | | Effects | | |
| | | | | | | other non-fixed | | | | | | of | | |
| | | Bonds and other fixed- | | income | | Equity | | deferred | | |
| EUR in millions | | income securities | | securities | | investments | | taxes | | Total |
| As at 1 January 2008 | | | -125 | | | | 34 | | | | -1 | | | | 0 | | | | -92 | |
A. Changes recognised in the income statement | | | | | | | | | | | | | | | | | | | | |
| Decrease due to disposals | | | 33 | | | | 0 | | | | 0 | | | | 0 | | | | 33 | |
| Increase due to disposals | | | 0 | | | | -2 | | | | 0 | | | | 0 | | | | -3 | |
| Decrease due to impairments | | | 244 | | | | 29 | | | | 1 | | | | 0 | | | | 274 | |
| Amortisation after reclassification | | | 23 | | | | 0 | | | | 0 | | | | 0 | | | | 23 | |
| | | | | | | | | | | | | | | | | | | | | |
Total changes recognised in the income statement | | | 299 | | | | 27 | | | | 1 | | | | 0 | | | | 327 | |
B. Changes recognised directly in equity | | | | | | | | | | | | | | | | | | | | |
| Changes in revaluation reserves | | | -731 | | | | -62 | | | | 0 | | | | 4 | | | | -789 | |
| | | | | | | | | | | | | | | | | | | | | |
Total changes recognised directly in equity | | | -731 | | | | -62 | | | | 0 | | | | 4 | | | | -789 | |
| | | | | | | | | | | | | | | | | | | | | |
| Effects of exchange rate changes | | | 1 | | | | 2 | | | | 0 | | | | 0 | | | | 2 | |
| | | | | | | | | | | | | | | | | | | | | |
As at 31 December 2008 | | | -557 | | | | 2 | | | | 0 | | | | 4 | | | | -551 | |
| | | | | | | | | | | | | | | | | | | | | |
77
Statement of changes in equity in financial year 2007
| | | | | | | | | | | | | | | | | | | | | |
| | | | | | | | | | | Appropriation | | | | |
| | | | | | | | | | | of consolidated | | | | |
| | | As at 1 | | | | | | profit/loss from | | Changes in | | As at 31 |
| | | Jan. | | Capital | | financial year | | revaluation | | Dec. |
| EUR in millions | | 2007 | | increases | | 2007 | | reserves | | 2007 |
| Subscribed capital | | | 3,750 | | | | 0 | | | | 0 | | | | | | | | 3,750 | |
| less outstanding contributions, not requested | | | -450 | | | | 0 | | | | 0 | | | | | | | | -450 | |
| Capital reserve | | | 1,604 | | | | 4,650 | | | | 0 | | | | | | | | 6,254 | |
Promotional reserves from the ERP Special Fund | | | 0 | | | | 4,650 | | | | 0 | | | | | | | | 4,650 | |
| Reserve from the ERP Special Fund | | | 757 | | | | 0 | | | | 47 | | | | | | | | 804 | |
| Retained earnings | | | 5,584 | | | | 0 | | | | 278 | | | | | | | | 5,862 | |
Statutory reserve under Section 10 (2) KfW Law | | | 1,574 | | | | 0 | | | | 0 | | | | | | | | 1,574 | |
Special reserve under Section 10 (3) KfW Law | | | 1,893 | | | | 0 | | | | 0 | | | | | | | | 1,893 | |
Special reserve less the special loss account from provisioning pursuant to Section 17 (4) of the D-Mark Balance Sheet Law | | | 21 | | | | 0 | | | | 0 | | | | | | | | 21 | |
Other retained earnings | | | 2,095 | | | | 0 | | | | 278 | | | | | | | | 2,374 | |
| Fund for general banking risks | | | 5,300 | | | | 0 | | | | -5,100 | | | | | | | | 200 | |
| Revaluation reserves | | | 157 | | | | | | | | | | | | -249 | | | | -92 | |
| Balance sheet loss | | | 0 | | | | | | | | -1,393 | | | | | | | | -1,393 | |
| | | | | | | | | | | | | | | | | | | | | |
EQUITY | | | 16,702 | | | | 4,650 | | | | -6,168 | | | | -249 | | | | 14,936 | |
| | | | | | | | | | | | | | | | | | | | | |
78
Statement of changes in revaluation reserves in financial year 2007
| | | | | | | | | | | | | | | | | | | | | |
| | | | | | | | | | | | | | | Investments | | |
| | | | | | | Shares and | | | | | | accounted for | | |
| | | | | | | other non-fixed | | | | | | using the | | |
| | | Bonds and other fixed- | | income | | Equity | | equity | | |
| EUR in millions | | income securities | | securities | | investments | | method | | Total |
| As at 1 January 2007 | | | 86 | | | | 38 | | | | 0 | | | | 33 | | | | 157 | |
A. Changes recognised in the income statement | | | | | | | | | | | | | | | | | | | | |
| Decrease due to disposals | | | 2 | | | | 3 | | | | 0 | | | | 0 | | | | 5 | |
| Increase due to disposals | | | -1 | | | | -3 | | | | 0 | | | | 0 | | | | -4 | |
| Decrease due to impairments | | | 0 | | | | -1 | | | | 0 | | | | 0 | | | | -1 | |
| | | | | | | | | | | | | | | | | | | | | |
Total changes recognised in income statement | | | 1 | | | | -1 | | | | 0 | | | | 0 | | | | 0 | |
B. Changes recognised directly in equity | | | | | | | | | | | | | | | | | | | | |
| Changes in revaluation reserves | | | -211 | | | | -3 | | | | -1 | | | | -33 | | | | -248 | |
| | | | | | | | | | | | | | | | | | | | | |
Total changes recognised directly in equity | | | -211 | | | | -3 | | | | -1 | | | | -33 | | | | -248 | |
| | | | | | | | | | | | | | | | | | | | | |
| Effects of exchange rate changes | | | -1 | | | | 0 | | | | 0 | | | | 0 | | | | -1 | |
| | | | | | | | | | | | | | | | | | | | | |
As at 31 December 2007 | | | -125 | | | | 34 | | | | -1 | | | | 0 | | | | -92 | |
| | | | | | | | | | | | | | | | | | | | | |
79
Cash Flow Statement
EUR in millions
| | | | | | | | | |
| | | 2008 | | 2007 |
| |
Consolidated loss | | | -2,657 | | | | -6,168 | |
| | | | | | | | | |
Non-cash items included in consolidated loss for the period and reconciliation to cash flow from operating activities: | | | | | | | | |
| Depreciation, amortisation and impairment (receivables, property, plant and equipment, securities and investments) and changes in risk provisions for lending business | | | 2,730 | | | | 7,095 | |
| Changes in other provisions | | | 534 | | | | 138 | |
| Profit/loss from the disposal of securities and investments and property, plant and equipment | | | -17 | | | | -3 | |
| Other adjustments (net) | | | 536 | | | | 268 | |
| | | | | | | | | |
Subtotal | | | 1,127 | | | | 1,330 | |
| | | | | | | | | |
Changes in assets and liabilities from operating activities after adjustment for non-cash items: | | | | | | | | |
| Loans and advances to banks | | | -17,722 | | | | -14,515 | |
| Loans and advances to customers | | | -6,984 | | | | -7,722 | |
| Securities and investments (securities) | | | 863 | | | | -4,320 | |
| Other assets relating to operating activities | | | -22,384 | | | | -1,870 | |
| Liabilities to banks | | | 4,331 | | | | -4,623 | |
| Liabilities to customers | | | -11,725 | | | | -4,837 | |
| Certificated liabilities | | | 42,244 | | | | 20,229 | |
| Other liabilities relating to operating activities | | | 9,290 | | | | 6,759 | |
| Interest and dividends received | | | 28,677 | | | | 27,578 | |
| Interest paid | | | -26,671 | | | | -25,823 | |
| Income tax paid | | | -58 | | | | 8 | |
| | | | | | | | | |
Cash flow from operating activities | | | 988 | | | | -7,806 | |
| Cash proceeds from the disposal of: | | | | | | | | |
| Property, plant and equipment | | | 9 | | | | 13 | |
| Cash payments for investment in: | | | | | | | | |
| Securities and investments (equity investments) | | | -307 | | | | -36 | |
| Property, plant and equipment | | | -117 | | | | -89 | |
| Changes from other investing activities | | | 0 | | | | 1 | |
| | | | | | | | | |
Cash flow from investing activities | | | -416 | | | | -110 | |
| Cash proceeds/(payments) from capital increases/(decreases) | | | 0 | | | | 4,650 | |
| Changes from other financing activities | | | -500 | | | | 3,247 | |
| | | | | | | | | |
Cash flow from financing activities | | | -500 | | | | 7,897 | |
| | | | | | | | | |
Cash and cash equivalents as at 31 December 2007 | | | 26 | | | | 26 | |
| Cash flow from operating activities | | | 988 | | | | -7,806 | |
| Cash flow from investing activities | | | -416 | | | | -110 | |
| Cash flow from financing activities | | | -500 | | | | 7,897 | |
| Effects of exchange rate changes | | | 0 | | | | 20 | |
| | | | | | | | | |
Cash and cash equivalents as at 31 December 2008 | | | 99 | | | | 26 | |
| | | | | | | | | |
80
The IAS 7 item cash and cash equivalents reported in the cash flow statement is identical to the balance sheet item cash reserves and thus comprises cash on hand and balances with central banks.
The cash flow statement shows the changes in cash and cash equivalents in the financial year through the cash flows from operating activities, investing activities and financing activities.
Please refer to the comments on liquidity risk in the group management report for information on the KfW Group’s liquidity risk management.
81
NOTES TO FINANCIAL STATEMENTS
Accounting policies
| (1) | | Basis of presentation |
KfW is the promotional bank of the Federal Republic of Germany and was founded in 1948 as a public law institution based in Frankfurt am Main.
The KfW Group includes seven subsidiaries and six special funds (securities funds/Wertpapiersondervermögen) that are fully consolidated. Two jointly controlled entities are accounted for at equity.
The consolidated financial statements as at 31 December 2008 have been prepared, pursuant to Section 315a (1) of the German Commercial Code (Handelsgesetzbuch/HGB), in accordance with the International Financial Reporting Standards (IFRS), as applicable in the European Union (EU), and with the interpretations set out by the International Financial Reporting Interpretations Committee (IFRIC), as mandatory consolidated accounts in accordance with Article 4 of Regulation (EC) No. 1606/2002 (IAS Regulation) of the European Parliament and Council of 19 July 2002, as well as further regulations on the adoption of certain international accounting standards. The standards and interpretations that apply are those that had been published and endorsed by the EU at the point in time at which these financial statements were prepared.
The supplementary provisions of the German Commercial Code that also apply to IFRS consolidated financial statements have been taken into account. The group management report prepared in accordance with Section 315 of the German Commercial Code includes the risk report with the risk-oriented information on financial instruments as set out in IFRS 7, material events after the balance sheet date according to IAS 10 as well as information on capital and capital management as set out in IAS 1.124.
The consolidated financial statements were prepared in accordance with accounting policies that are uniform within the KfW Group and are based on the going concern principle. All companies accounted for at equity prepared their annual financial statements as at 31 December 2008.
The accounting policies were used consistently with the exception of the material changes described below:
| | • | | Newly acquired securities that are to be held to maturity are, on a case-by-case basis, no longer categorised as “available-for-sale financial assets”. Instead, they are carried as “held-to-maturity investments” in line with the purpose of the transaction. |
| |
| | • | | Depending on the product, newly-issued financial liabilities with embedded derivatives requiring separation are no longer categorised using the “fair value option”. Instead, the embedded derivative is carried independently. Measurement of the hedge has a compensatory effect, in line with the purpose of the transaction the basis contract is carried under “other liabilities”. |
| |
| | • | | Use of the possibility to reclassify financial assets according to IAS 39 in the version dated 13 October 2008, retroactively as of 1 July 2008 for asset-backed securities. |
82
The reporting currency and the functional currency of all consolidated entities is the euro. Unless otherwise specified, all amounts are stated in millions of euros (EUR in millions).
As a general rule, assets are carried at (amortised) cost, with the exception of the following financial instruments:
| | • | | derivative financial instruments carried at fair value through profit or loss; |
| |
| | • | | designated financial instruments carried at fair value through profit or loss; |
| |
| | • | | available-for-sale financial assets carried at fair value recognised directly in equity. |
The consolidated financial statements include values which are determined on the basis of judgments and/or estimates and assumptions which are determined to the best possible knowledge and in accordance with the applicable standard. The amounts actually realised in the future can deviate from these estimates. Estimates and assumptions are required, in particular, for calculating risk provisions, recognising and measuring provisions (including pension liabilities), performing the fair value accounting for financial instruments based on valuation models, assessing and measuring impairment of assets, and assessing the utilisation of deferred tax assets. The estimates and assumptions underlying these estimates are reviewed on an ongoing basis and are based, among other things, on historical experience or expected future events that appear likely given the particular circumstances. Insofar as estimates and their underlying assumptions were required, the assumptions made are explained in the notes to the relevant items.
KfW does not expect any deviations from its assumptions or any uncertainties with respect to estimates that could result in a material risk requiring a substantial adjustment to the related assets and liabilities within the next financial year. However, in view of the current uncertainties on the financial markets and the increased use of valuation models in measuring financial instruments at fair value, this cannot be fully excluded.
| (2) | | Assessment of the impact of IFRS/IFRIC to be applied in the future |
Application of IFRS 8, “Operating Segments”, which replaces the former standard on segment reporting, is mandatory from 1 January 2009. There was no voluntary early application. This change is not expected to have any material impact on the bank’s financial position and performance.
Application of the amended IAS 1, “Presentation of Financial Statements”, in the version dated 6 September 2007 is mandatory from 1 January 2009. There was no voluntary early application. This change is not expected to have any material impact on the bank’s financial position and performance.
The changes in IAS 23, “Borrowing Costs”, in the version dated 29 March 2007 and IFRS 2, “Share-based Payment”, in the version dated 17 January 2008, which had already been passed by the EU, are of no relevance for the Group.
IFRIC 13, “Customer Loyalty Programmes”, and IFRIC 14, “IAS 19 — The Limit on a Defined Benefit Asset, Minimum Funding Requirements and their Interaction”, which had already been passed by the EU, are of no relevance for the Group.
83
All significant subsidiaries, jointly controlled entities and associates have been included in the consolidated financial statements.
Affiliated entities are consolidated in accordance with IAS 27 if KfW can exercise control over the company directly or indirectly. They are consolidated for the first time as soon as they can be controlled. Affiliated entities are deconsolidated when control can no longer be exercised.
KfW IPEX-Bank GmbH was included in the Group for the first time after it was legally separated on 1 January 2008. This separation is due to the understanding between the Federal Republic of Germany and the European Commission on the role of legally independent promotional banks in Germany and the Promotional Bank Restructuring Act (Förderbankenneustrukturierungsgesetz). As a result, KfW transferred what had, until then, been a legally dependent part of its operations to a subsidiary. The separation included business activities in the export and project financing segment, which compete with other financial services companies. There was no impact on the consolidated financial statements as a result of this.
Associates and jointly controlled entities are included in accordance with IAS 28/IAS 31 insofar as significant influence or joint control is exercised. The shares in IKB were carried as an asset held for sale according to IFRS 5 until they were sold in October 2008.
Special purpose entities (SPEs) are companies formed to accomplish a narrow, well-defined objective. In accordance with IAS 27/SIC-12, a special purpose entity is consolidated when the substance of the relationship between the reporting enterprise and the SPE indicates that the SPE is controlled by that enterprise.
The structure of the consolidated group is set out in the Notes under “Disclosures on shareholdings”.
| (4) | | Basis of consolidation |
Consolidation involves revaluing the total assets and liabilities of the subsidiaries at the acquisition date, irrespective of the percentage of equity instruments acquired, and incorporating them into the consolidated balance sheet. The resulting adjustments from hidden reserves and obligations are treated in accordance with the applicable standards. If the revaluation procedure results in an excess of acquisition cost, this amount is capitalised as goodwill. At present, no goodwill is recognised.
Any intragroup assets and liabilities are eliminated, as are expenses and revenues from transactions between companies included in the consolidated financial statements. Intragroup profits between consolidated companies are also eliminated.
Associates and jointly controlled entities are accounted for using the equity method.
KfW holds no minority interests.
| (5) | | Financial instruments — recognition and measurement |
A financial instrument is any contract that gives rise to a financial asset of one entity and a financial liability or equity instrument of another entity. The following explanations provide an overview of how the requirements of IAS 39 are implemented.
84
Initial recognition is as at the settlement date for non-derivative financial instruments and as at the trade date for derivatives.
Upon initial recognition, financial instruments must be assigned to one of the following categories. The subsequent valuation depends on this categorisation:
| | a. | | Loans and receivables |
| |
| | b. | | Held-to-maturity investments, |
| |
| | c. | | Financial assets and liabilities at fair value through profit or loss, |
| | a. | | Financial assets and liabilities designated at fair value through profit or loss, fair value option, |
| |
| | b. | | Financial assets and liabilities held for trading, |
| | d. | | Available-for-sale financial assets, or |
| |
| | e. | | Other liabilities. |
The category “loans and receivables” includes non-derivative financial assets with fixed or determinable payments that are not quoted in an active market. These are measured at amortised cost using the effective interest method. For the KfW Group, this primarily relates to the lending business reported under Loans and advances to banks and Loans and advances to customers. In its lending business the KfW Group uses the Basel definition for its selection of default criteria and applies a uniform definition of default group-wide. Default criteria are, in particular, payments overdue for more than 90 days (taking a marginality limit into account) and anticipated non-fulfilment of payment obligations in the face of indicators such as filing for bankruptcy, material adverse change, distressed loan indication, cases of conversion and transfer, debt to equity swaps, deferment/restructuring and disposal of loans or advances at significant loss.
“Held-to-maturity investments” are non-derivative financial assets with fixed or determinable payments and fixed maturity that an entity has the intention and ability to hold to maturity. This valuation category is used for acquisitions in the Group’s securities portfolio on a case-by-case basis. These are carried under Securities and investments, any impairments and reversals of impairment losses are to be recognised in Net gains/losses from securities and investments. Premiums and discounts amortised according to the effective interest rate method are accounted for through profit or loss under Interest income.
For financial assets and liabilities, the “fair value option” can be used irrevocably if
| | • | | the categorisation can resolve or substantially reduce an accounting mismatch resulting from the valuation of financial assets or financial liabilities or the recognition of a loss or a gain as a result of differing accounting policies; |
| |
| | • | | a group of financial assets and/or financial liabilities is managed in accordance with the documented risk management or investment strategy and its performance is assessed on the basis of the fair value and the information is passed on to key personnel; or |
| |
| | • | | a contract contains one or several embedded derivatives which significantly modify the cash flows required by the contract or an analysis is required to determine that the embedded derivative(s) may not be separated. |
“Designated financial assets and liabilities” are measured at fair value through profit or loss. The KfW Group uses the “fair value option” for hedging relationships, structured products, securitisation transactions, equity finance business, and for financial instruments of consolidated performance-based special funds. These financial instruments are reported under Securities and investments, Liabilities to banks and customers and Certificated liabilities. Changes to the fair value are stated under Net gains/losses from other financial instruments at fair value through profit or loss, while interest income/expense is reported under Net interest income.
85
Financial instruments that belong to the category “financial assets and liabilities held for trading” are measured at fair value through profit or loss. This category includes both derivative and non-derivative financial instruments purchased with the intention of generating a short-term profit. The KfW Group does not enter into any transactions with the intention of generating a short-term profit. Derivative transactions concluded exclusively for hedging purposes are allocated to this category if they are not used in hedge accounting according to IAS 39. They are reported under Other derivatives. Changes to the fair value are reported under Net gains/losses from other financial instruments at fair value through profit or loss. Derivatives in hedge accounting are carried under the item of the same name. Changes to the fair value are reported under Net gains/losses from hedge accounting. Interest income/expense from derivatives is reported under Net interest income.
All other financial assets fall under the category “available-for-sale financial assets”. The difference between the fair value and the (amortised) cost is recognised directly in a separate equity item until the asset is sold or an impairment loss has to be recognised in profit or loss. This is the case for debt instruments if there is objective evidence (“trigger”) of impairment with an impact on the expected future cash flows. Specific trigger events are defined depending on the type of financial instrument. Events such as payments overdue for 30 days or more, a deterioration in the internal rating to the non- performing loans category, and a decline in the market price can be considered objective evidence of a possible impairment. Furthermore, an impairment has to be recognised in profit or loss in the case of a significant or prolonged decline below the acquisition cost of equity instruments. The impairment of a debt instrument assigned to this category is reversed through profit or loss if there is no longer any objective evidence for an impairment. Impairments of equity instruments assigned to this category may only be reversed directly in equity. Equity instruments that cannot be reliably measured at fair value are accounted for at cost. Impairments are recognised in profit or loss, while reversals of impairment losses are not considered. Within the KfW Group, the available-for-sale financial assets are reported under Securities and investments. Gains and losses from disposals, impairments to be recognised in profit or loss and the reversal of impairments from debt instruments are reported under Net gains/losses from securities and investments. Premiums and discounts are accounted for through profit or loss at amortised cost under Interest income using the effective interest rate method.
All non-derivative financial liabilities for which the “fair value option” is not applied are categorised as “other liabilities”. These are measured at amortised cost using the effective interest method. For the KfW Group, this category covers borrowings that are reported under Liabilities to banks and customers, Certificated liabilities and Subordinated liabilities.
Financial assets are derecognised as at the settlement date, with the exception of derivatives. Derecognition is performed when the contractual rights relating to the asset have expired, the power of disposal/control has been transferred, or the substantial risks and rewards have been transferred to a third party unrelated to the KfW Group. Financial liabilities are derecognised if the obligations set out in the agreement have been fulfilled or cancelled or have expired.
The amendment to IAS 39 in the version dated 13 October 2008 expanded the possibilities to reclassify financial assets. Accordingly, until 31 October 2008 it was possible to reclassify assets carried as “available-for-sale financial asset”s as “loans and receivables” with retroactive effect as of 1 July 2008 if there was the intention and possibility to hold the respective financial instruments in the foreseeable future or through to final maturity and if the general categorisation criteria for the “loans and receivables” category were fulfilled on the date of reclassification.
86
The KfW Group resolved to use this approach on 31 October 2008 with retroactive effect as of 1 July 2008 for its asset-backed securities for which, as part of the general crisis of confidence in the financial markets, there was no longer an active market when the decision was passed (i.e., no current, regularly occurring market transactions on an arm’s length basis could be observed) and which were to be held through to maturity. The fair value on the date of reclassification is the new acquisition cost of the reclassified financial assets. Amortisation is accounted for through profit or loss under Interest income according to the effective interest method. The difference between the fair value and (amortised) cost which had been recognised directly in equity until the reclassification continues to be carried under equity as a separate equity item. Amortisation using the effective interest method is accounted for through profit or loss under Interest income.
| (6) | | Financial instruments — valuation techniques |
At the KfW Group, initial recognition of financial instruments is at fair value.
Subsequent valuation at amortised cost is based, within the KfW Group, on the fair value upon initial recognition, taking into account any principal repayments and any impairments. The amortisation of premiums and discounts, transaction costs and fees is performed in accordance with the effective interest method on the basis of the contractual cash flows. In its promotional business, only discounts are amortised; this is carried out until the end of the first fixed interest rate period (generally five or ten years).
At the KfW Group, subsequent valuation at fair value is based on the following hierarchy:
1. Active market
The best objective evidence of fair value is provided by published price quotations in an active market. A financial instrument is regarded as quoted in an active market if quoted prices are readily and regularly available and those prices represent current — i.e., traded on the date of conclusion or shortly before — and regularly occurring market transactions on an arm’s length basis. Apart from the traded nominal volumes, the contract sizes and the number of contracts, this assessment takes into account in particular the bid-ask spreads observed, which in the event of a significant expansion point towards an inactive market.
2. No active market — valuation techniques
If the financial instrument is not quoted in an active market, valuation techniques are used. The valuation techniques used include, in particular, the discounted cash flow (DCF) method and option pricing models, as well as a comparison with the fair value of a financial instrument with almost identical characteristics (e.g., multiplier-based models). The valuation techniques take account of all of the parameters that the market participants would include in the pricing process, e.g., market rates, risk-free interest rates, credit spreads or swap curves.
3. No active market — equity instruments
If in exceptional cases it is not possible to reliably determine the fair value of equity instruments that are not quoted in an active market using valuation models, they are measured at cost. The fair value cannot be calculated reliably if the range of reasonable fair value estimates for this instrument is significant and the probabilities of the various estimates cannot be reasonably assessed.
87
As a result of the general crisis of confidence in the financial markets, the Group ascertained, using homogeneous securities portfolios, that the criteria for an active market are also no longer to be regarded as having been fulfilled even in segments that certainly fulfilled these criteria until the crisis broke out. In particular, the market transactions and pricings for financial and corporate bonds and also covered bonds (Pfandbriefe) that could be observed on the market are characterised by very high illiquidity discounts; the criteria for regularly occurring market transactions on an arm’s length basis can thus no longer be regarded as having been fulfilled. As a result, in these cases, according to the valuation hierarchy of IAS 39, valuation methods to determine the fair value are used, which take into account the parameters which can be observed on the market. The valuation methods used thus include, in particular, changes in creditworthiness and risk-free interest rates, however they also take into account the general tightening of the market for financial products due to lower liquidity.
Fair values are determined on the basis of the valuation category for recognition on the balance sheet and for information on financial instruments in the Notes. Fair values from active markets are applied, in particular, for bonds and other fixed-income securities —unless there are no longer any active markets as a result of the financial crisis and thus valuation techniques are used — as well as shares and other non-fixed income securities. However, valuation techniques for non-derivative financial instruments are applied in particular to the products reported under Loans and advances to banks and customers, Liabilities to banks and customers, and Certificated liabilities. Valuation techniques are also applied to OTC derivatives. Equity investments and shares which cannot be reliably measured at fair value are measured at cost.
The fair value for loans to banks and customers is calculated using the discounted cash flow (DCF) method based on the discounting of the risk-adjusted cash flows with the swap curve. The expected loss calculated for the respective reporting date is used to correct the contractual cash flows. The fair value at initial recognition is equivalent to the cost upon acquisition. The customer fee includes operating expenses, the margin, the equity and debt risk premium, and any subsidies. The customer fee remains unchanged for subsequent valuation (constant spread).
The fair value of financial instruments due on demand, such as cash reserves or receivables and liabilities due on demand, is the carrying amount.
In cases in which no prices from liquid markets are available, recognised valuation models and methods are applied. The discounted cash flow (DCF) method is used for securities, swaps, and currency and money market transactions with no embedded options and no complex coupons. Independent options, as well as derivatives with embedded options, triggers, guaranteed interest rates and/or complex coupon agreements, are measured using recognised models (e.g. Hull & White) unless they are listed on a stock exchange. The same applies for credit default swaps.
The aforementioned models are calibrated, if possible, on the basis of observable market data for instruments that are similar in terms of the type of transaction, maturity, and credit quality.
| (7) | | Hedging relationships |
Derivatives are used within the KfW Group for the hedging of interest rate and currency risks. Economic hedging relationships are recognised through hedge accounting and by using the “fair value option”. As a result of the spinning off of embedded derivatives requiring separation for which the valuation is accounted for through profit or loss derivatives subject to hedge accounting also impact the accounts. However, as not all derivatives are subject to hedge accounting or the “fair value option”, some economic hedging derivatives are reflected in the accounts, although their risk-mitigating impact is not reflected in the accounts because the hedged risk associated with the underlying transactions is not recognised in profit or loss under IFRS.
88
Under hedge accounting, i. e. the accounting for hedging instruments (derivatives) and hedged transactions in accordance with special rules, strict requirements apply to the accounting for hedging relationships.
Within the KfW Group, hedge accounting is used solely in the form of fair value hedges to recognise hedging relationships between derivatives and the respective assets/liabilities. The hedging relationship is reported at the individual transaction level in the form of micro fair value hedge accounting, and at portfolio level in the form of macro fair value hedge accounting. The effectiveness of the hedging relationships is verified on a case-by-case basis using the dollar offset method or via a regression analysis.
In micro fair value hedge accounting, interest rate and currency risks from bonds allocated to securities and investments (“available-for-sale financial assets” category) and borrowings (“other liabilities” category) are hedged. The fair values attributable to the hedged risks are reported as an adjustment of the carrying amount of the hedged items with the corresponding gain or loss reported under Net gains/losses from hedge accounting. The hedging instruments are recognised at fair value under Derivatives used for hedge accounting. Changes in the value of these instruments are also reported under Net gains/losses from hedge accounting, leading to a substantial compensation of the earnings effects resulting from the valuation of the hedged items. The fair value of the hedged risks from hedging relationships which no longer fulfil the strict hedge accounting requirements is amortised over the residual term of the original hedging relationship under Net gains/losses from hedge accounting.
In macro fair value hedge accounting, interest rate risks from loan receivables (“loans and receivables” category) and borrowings (“other liabilities” category) are hedged. The fair values attributable to the hedged risks in the hedged portfolios in the “loans and receivables” category are reported under Value adjustments from macro fair value hedge accounting on the assets side. The fair values attributable to the hedged risks in the hedged portfolios in the “other liabilities” category are reported under Value adjustments from macro fair value hedge accounting on the liabilities side. Changes in the fair values of the hedged risks from the hedged portfolios are reported under Net gains/losses from hedge accounting. The hedging instruments are reported at fair value under Derivatives used for hedge accounting. Changes in the value of these instruments are also reported under Net gains/losses from hedge accounting, with the consequence that they almost fully offset the earnings effects from the valuation of the hedged portfolios. The portfolio of underlying transactions is determined each month in the context of a dynamic hedge designation and reversal process. The resultant value adjustment items are amortised over the residual term of the maturity period in Net gains/losses from hedge accounting. Disposals from the hedged portfolios result in a partial reversal of the related value adjustments in Net gains/losses from hedge accounting.
If the strict hedge accounting requirements for the designation of hedging relationships between derivatives and financial assets/liabilities are not fulfilled within the KfW Group, the “fair value option” is used for the non-derivative financial instruments in certain circumstances, in particular for structured products. Based on the product, in the case of some structured financial liabilities the embedded derivatives requiring separation are accounted for independently instead of using the “fair value option”.
Further derivative financial instruments are also used to hedge risks, but their resultant hedge effect is not reflected in the accounts.
89
The fair values of all derivatives not subject to hedge accounting are reported under Other derivatives. Changes in the fair values are recognised in the income statement under Net gains/losses from other financial instruments at fair value through profit or loss.
| (8) | | Treatment of embedded derivatives |
Derivative financial instruments can be part of a hybrid (combined) financial instrument as embedded derivatives. Under certain conditions, they are reported separately from the host contract, similar to stand-alone derivatives. They must be reported separately if the economic characteristics and risks of the embedded derivative are not closely related to the economic characteristics and risks of the host contract. The host contract will be accounted for depending on its categorisation.
The KfW Group enters into contracts with embedded derivatives requiring separation particularly with respect to borrowings. As it makes use of the “fair value option”, KfW reports these hybrid (combined) financial instruments at fair value. In the case of certain products, the embedded derivatives requiring separation are spun off and accounted for separately. Changes in fair value are recorded in Net gains/losses from other financial instruments at fair value through profit or loss under the item Derivatives not qualifying for hedge accounting, where they have a compensatory effect on the valuation of the hedging derivatives.
Supplementary agreements made in the KfW Group’s equity finance business are treated as separate embedded derivatives which are measured at fair value through profit or loss and reported under Other derivatives. The loan receivables are reported under Loans and advances to customers. Changes in fair value are recorded in Net gains/losses from other financial instruments at fair value through profit or loss under the item Derivatives not qualifying for hedge accounting.
Unscheduled termination rights that are granted regularly in promotional loan transactions are not recorded as embedded derivatives requiring separation since the economic characteristics and risks associated with the termination rights are closely related to the economic characteristics and risks of the loans and a premature repayment is made at approximately amortised cost.
The KfW Group enters into credit derivatives as protection seller and protection buyer.
As part of active portfolio management, single name CDSs (credit default swaps) are used to hedge the risks of individual counterparties. These are recognised at fair value under Other derivatives. The changes in value are reported in the income statement under Net gains/losses from other financial instruments at fair value through profit or loss. The current risk premiums are reported under Commission expense.
As part of risk diversification, single name CDSs are also used to acquire the risks of individual counterparties. These are recognised at fair value under Other derivatives. The changes in value are reported in the income statement under Net gains/losses from other financial instruments at fair value through profit or loss. The current risk premiums are reported under Commission income.
90
As part of its promotional loan business, the KfW Group gives commercial banks the opportunity to place their credit risks in the capital market as part of a synthetic securitisation via the two standardised platforms PROMISE (programme for the securitisation of SME loans) and PROVIDE (programme for the securitisation of housing loans). In a first step, the KfW Group assumes the default risks of the reference portfolio via portfolio CDSs, while the risks are simultaneously passed on to third parties via portfolio CDSs/credit-linked notes. These transactions are reported using the “fair value option”. The fair values are reported as receivables or liabilities. Changes to the fair values are recognised under Net gains/losses from other financial instruments at fair value through profit or loss. The current risk premiums are reported under Net commission income.
| (10) | | Risk protection, capital measures and sale of IKB |
IKB was supported by measures protecting it against risks in connection with the US subprime mortgage crisis, various capital measures and additional agreements made as part of its sale to a strategic investor. In addition to KfW, three German banking associations (banking pool) and the Federal Republic of Germany are also participating in the support measures.
As part of the risk protection measures agreed in 2007, KfW assumed all of IKB’s rights and obligations under IKB’s liquidity lines to refinance the special purpose entities of the “Rhineland Funding Capital Corporation, New York/USA” conduit. In addition, credit derivatives were used as a means of assuming IKB’s loss exposures arising from reverse hedges of this conduit up to a maximum of USD 1.5 billion. These were settled in full at their present value during 2008. Furthermore, credit derivatives and financial guarantees were used to back IKB’s risks arising from specified securities portfolios up to a maximum of EUR 1 billion. These were settled in full during the reporting year. The banking pool is participating in the risk protection on a pro-rata basis up to a maximum of EUR 1.2 billion. This was also settled during the reporting year.
The “Rhineland Funding Capital Corporation, New York/USA” conduit was not consolidated by the KfW Group during the reporting year. The provision of liquidity lines did not trigger an obligation for KfW to consolidate the special purpose entities since KfW did not “control” the SPEs within the meaning of SIC-12. KfW did not obtain any power of disposal over the SPEs or over their assets as a result of providing the liquidity lines. KfW served solely as provider of debt capital for the conduit and did not possess any decision-making powers over the assets of the SPEs or over the SPEs themselves. The fully drawn liquidity lines are reported under Loans and advances to customers. Individual impairments were recorded to account for the default risks.
The method and valuation applied to the financial instruments granted as part of risk protection are in line with standard KfW accounting policies. The valuation of receivables resulting from the assumption of the liquidity lines was based on an analysis of the underlying assets. The valuation techniques took into account the hierarchy set out in IAS 39.48A. To the extent available, market values were used for the instruments covered by the risk protection. In all other cases valuation was carried out on the basis of models that took into consideration directly or indirectly observed market prices for similar or substantially identical financial instruments. Valuation was carried out using models only insofar as no prices or market parameters were available for the instruments covered by the risk protection or for substantially identical financial instruments. In such cases the capital losses resulting from the protected financial instruments were calculated using a cash-flow based loss estimate. The financial instruments were differentiated by asset category, rating and, in some cases, year of issue. The values were verified through comparison with quotations by arrangers and/or independent estimates by specialists.
Using this as a basis, KfW recorded individual impairments to account for the receivables resulting from the assumption of the liquidity lines.
91
In addition to the subscription of a convertible bond issued by IKB as part of the risk protection measures with a volume of EUR 54.3 million with subsequent conversion, KfW engaged in additional capital measures with a volume of EUR 2.3 billion for the benefit of IKB based on a mandate by the Federal Government issued in accordance with Section 2 (4) of the KfW Law, subject to the condition precedent of approval by the European Commission. This approval was issued on 21 October 2008. The capital measures included the participation in a cash capital increase by IKB in an amount of EUR 1.25 billion as well as the provision of loans with waivers of debts outstanding and agreements on compensation out of future profits (Besserungsabrede) in an amount of EUR 1.05 billion.
The difference between the volume of the capital measures implemented and the proceeds from the sale realised when the shares in IKB from the cash capital increase and the loans with waivers of debts outstanding and compensation agreements were sold to a strategic investor is carried as a net loss from the sale of available-for-sale assets or under Expense for risk provisions. The loss participation by the Federal Republic of Germany and the Bundesverband deutscher Banken e.V. (German association of private banks) in these capital measures totalling EUR 1.5 billion is recorded under Other operating income.
In addition, KfW granted IKB liquidity facilities on market terms of up to EUR 3 billion which are accounted for and measured according to the uniform group methods which apply to these products (loans and advances).
In connection with the sale of the shares in IKB and the loans with waivers of debts outstanding and compensation agreements, KfW also acquired financial instruments carrying risks from IKB in the form of structured securities and credit derivatives at a purchase price of EUR 1 billion. These financial instruments are accounted for according to uniform group accounting policies for these instruments. KfW’s risk is initially limited to a first loss of EUR 150 million, with the Federal Republic of Germany bearing further risks in an amount of up to EUR 600 million. The guarantee agreement concluded for this purpose is recorded as a credit derivative with a positive market value under Other derivatives in line with the nature of the hedged risks. The changes in value are reported in the income statement under Net gains/losses from other financial instruments at fair value through profit or loss.
In addition, involvement by KfW in refinancing a portfolio of further IKB structured securities which were transferred to a SPE in connection with the acquisition by the strategic investor, was agreed in the form of loans totalling EUR 0.6 billion on market terms with senior redemption. The KfW Group’s accounting is in line with the applicable accounting policies for these products (loans and advances). The provision of refinancing did not trigger a consolidation requirement for the SPE for KfW, because KfW did not have any control over the SPE within the meaning of SIC-12. KfW did not acquire control of the SPE or the assets in the SPE by providing refinancing. KfW served solely as provider of debt capital for the SPE and did not possess any decision-making powers over the assets of the SPE or over the SPE itself.
In addition, KfW agreed to indemnify IKB for certain legal risks in a certain amount. A legal action relevant in this respect was dismissed — not yet legally binding — at the end of December 2008. There were no charges resulting from the legal action under the indemnification agreement in 2008 and no charges are expected in the future.
92
| (11) | | Foreign currency translation |
The functional currency of KfW and its consolidated subsidiaries and special funds is the euro.
Monetary assets and liabilities denominated in foreign currency are converted at the spot rate. Translation is made as at the balance sheet date using the European Central Bank reference rates. Income and expenses are translated strictly at the average monthly rate.
The results from foreign currency translation are recognised in profit or loss under Net gains/losses from other financial instruments at fair value through profit or loss.
| (12) | | Loans and advances to banks and customers |
The KfW Group’s lending business carried at amortised cost is reported under Loans and advances to banks and customers. This item consists primarily of the promotional loan business, in which loans are typically granted to the final borrowers through accredited commercial banks. These assets are reported under Loans and advances to banks insofar as the commercial banks underwrite part of the liability. Promotional on-lending without underwriting of liability by commercial banks is reported under Loans and advances to customers.
Current interest and similar income are recorded under Interest income. Premiums, discounts, processing fees and charges are amortised in Interest income using the effective interest method. Processing fees that do not need to be amortised using the effective interest method are recognised under Commission income.
| (13) | | Risk provisions for lending business |
The overall risk provisions for lending business include the provisions for losses on loans and advances, which are reported separately, as well as the provisions for contingent liabilities and irrevocable loan commitments.
The risks resulting from on balance sheet lending business are accounted for by individual and portfolio impairments recognised in profit or loss.
Individual impairments are recorded for counterparty risks identified in an impairment test of individual loans. The amount of the impairment loss corresponds to the difference between the carrying amount of the loan and the discounted expected future cash flows from interest and redemption payments and from collateral-based cash flows. The recognition of interest income in accordance with the original contractual terms is terminated as at the date on which the first individual impairment is set up. In the subsequent valuation, the effect of interest cost on the present value of anticipated cash flows using the original effective interest rate is identified and carried as interest income (unwinding). The risk provisions are reduced by this amount. Any reversals of individual impairment losses are accounted for through profit or loss.
Smaller and standardised loans are grouped into homogenous subportfolios for portfolio impairment on the basis of the default risks identified. If less impairment than expected is necessary, impairment losses may be reversed through the income statement.
For performing loans not subject to individual impairment, the risk of decreases in value that have already occurred but have not yet been individually identified is addressed by portfolio impairment. Economic risk and transfer risk are taken into account for the calculation. The key parameters are the outstanding loan volume (based on the carrying amount) as at the reporting date, the expected loss given default and one-year probabilities of default (given a LIP [loss identification period] factor of 1). The probabilities of default are provided by credit risk control, as is the loss given default, whereby the latter is adjusted for imputed cost. The underlying assumptions of expected losses are backtested on a regular basis against the actual loss experience.
93
For contingent liabilities and irrevocable loan commitments the individual risks detected are addressed in the form of provisions, with a corresponding effect on the income statement. For irrevocable loan commitments, impairments not yet identified individually are addressed by forming provisions, which are determined based on portfolio models.
Non-recoverable loans, for which no specific provisions were made, are written off directly. Recoveries on loans already written off are recognised as income from risk provisions.
| (14) | | Securities and investments |
Securities and investments include, in particular, securities portfolios. These mainly serve to support KfW’s liquidity status or are used to optimise and stabilise the ability of the KfW Group to fulfil its promotional mandate in the long term.
The Securities and investments item on the balance sheet comprises bonds and other fixed-income securities, shares and other non-fixed income securities, equity investments, and shares in affiliated entities not included in the consolidated financial statements which are held by KfW, its subsidiaries and consolidated special funds.
To ensure uniform accounting treatment for equity investments with and without significant influence, individual group business divisions that provide equity financing as part of their promotional mandate are categorised as venture capital organisations for accounting purposes provided they meet the respective requirements. These equity investments, like all other equity investments, are reported under Securities and investments.
Securities and investments are initially recognised at fair value and subsequently measured depending on their classification either as “financial assets at fair value through profit or loss” or as “available-for-sale financial assets”. Financial instruments with fixed or determinable payments which are not quoted in an active market are categorised as “loans and receivables”. Classification as “held-to-maturity investments” occurs on a case-by-case basis provided that the relevant criteria were fulfilled at the time of acquisition.
When non-listed equity investments are measured at fair value, appropriate allowances are made for illiquidity. For example, when discounted cash flow (DCF) models are used, a discount rate adjusted for a fungibility factor is applied. In cases where the fair value of non-listed equity investments cannot be reliably measured, such assets are carried at cost allowing for impairment losses.
Any changes in the value of “financial assets at fair value through profit or loss” are reported under Net gains/losses from other financial instruments at fair value through profit or loss. Realised gains and losses and impairments from the “available-for-sale financial assets”, “loans and receivables” and “held-to-maturity investments” categories are recognised under Net gains/losses from securities and investments. Unrealised gains from “available-for-sale financial assets” are recognised directly in equity as revaluation reserves. Current interest payments and dividends are reported under Interest income.
94
Associates and jointly controlled entities that are included in the KfW Group are also included under Securities and investments. Their inclusion is based on the equity method insofar as there is significant influence or joint control. Assets held for sale within the meaning of IFRS 5 are also included in this item. These are carried at the lower of their carrying amount or fair value, less disposal costs. Any value adjustments are reported under Net gains/losses from securities and investments.
| (15) | | Repurchase agreements |
The KfW Group enters into repurchase agreements as standardised repos or reverse repos. These are combinations of simultaneous spot and forward transactions on securities with the same counterparty. The terms and modalities of collateralisation and for the use of collateral follow common market practice.
The securities sold under repo transactions (spot sale) continue to be recognised and measured as securities. The repayment obligation is carried as a liability to banks or customers in the amount of the cash inflow. Interest is recorded under Interest expense in accordance with the respective conditions of the repurchase agreements.
A repayment claim is recognised and measured as a loan or advance to banks or customers in the amount of the cash outflow generated by reverse repos. The securities received (spot purchase) are not recognised or measured. Interest is recorded in Interest income in accordance with the respective conditions of the reverse repurchase agreements.
| (16) | | Property, plant and equipment and investment property |
The land and buildings and the plant and equipment reported by the KfW Group are carried at cost less depreciation on a straight-line basis, and impairment is recognised under Administrative expense. An impairment is recognised if the carrying amount of the asset exceeds the recoverable amount, which is the higher of the fair value less the disposal cost or the value in use. The useful life is determined based on expected wear and tear. The KfW Group assumes an estimated useful life of 40 to 50 years for premises, three years for IT systems and five years for other property, plant and equipment. Gains and losses from the sale of property, plant and equipment are reported under Net other operating income.
The KfW Group’s land and buildings are primarily owner-occupied. There is a small volume of rental activity to third parties. These properties are reported as investment property under Property, plant and equipment and measured as such. Every five years an expert opinion determines the fair value of these properties by applying the discounted earnings method unless a significant change in the real estate market becomes detectable beforehand.
Payments in advance and assets under construction are reported under Other property, plant and equipment.
The KfW Group reports purchased and internally generated software at cost less depreciation on a straight-line basis under Intangible assets and its impairment under Administrative expense. The useful life is determined based on expected wear and tear. The KfW Group assumes a useful life of five years.
An impairment is recorded when the carrying amount of an asset exceeds the recoverable amount. A situation in which the asset is not expected to be used as originally planned leads to an impairment recognition.
95
In-house software under development is reported under Other intangible assets.
KfW is a non-taxable entity. Taxes on income for non-exempt subsidiaries and their taxed facilities are determined using tax laws in the country of residence. Current taxes on income as well as expenses and income from the change in deferred taxes are recognised in profit or loss as Taxes on income or directly in equity under Revaluation reserves depending on the underlying transaction. Current and deferred tax assets and liabilities are reported under the items Other assets and Other liabilities. Deferred income tax assets and liabilities are offset insofar as the requirements are met.
Current taxes on income are calculated using currently applicable tax rates.
Deferred tax assets and liabilities arise as a result of differences between carrying values according to IFRS of an asset or a liability and the respective tax bases if these are likely to result in taxable or tax deductible amounts in the future (temporary differences). Deferred tax assets relating to loss carryforwards not yet used are recognised only if there is a sufficient degree of certainty that the respective taxable entity will earn sufficient taxable income in subsequent periods to use the loss carryforward. Deferred tax assets and liabilities are recognised and measured either through profit or loss as Taxes on income or directly in equity under Revaluation reserves, depending on the underlying transaction.
| (19) | | Liabilities to banks and customers and certificated liabilities |
The item Liabilities to banks and customers primarily includes non-current borrowings carried at amortised cost and the KfW Group’s money-market transactions. The item Certificated liabilities contains bonds, notes and money-market instruments issued. For market-making purposes, repurchased own issues are deducted from the liabilities as at the repurchase date.
The “fair value option” is used for structured liabilities. There are no changes in the fair value due to changes in credit risk as KfW is classified in the highest rating classes with stable outlook by the leading international rating agencies. The valuation effects from market-related changes in credit spreads and liquidity spreads generated by the development of demand for the different KfW refinancing instruments are recognised under Net gains/losses from other financial instruments at fair value through profit or loss. In the case of certain products, the embedded derivatives requiring separation are spun off and accounted for separately. Presentation of the different types of borrowed funds is not based on their categorisation or their designation as hedged items. Valuation of the items is based on their respective categorisation.
Current interest is recorded in Interest expense; premiums and discounts are amortised using the effective interest method over the expected life in Interest expense. Changes in the value of liabilities designated at fair value are recorded in profit or loss under Net gains/losses from other financial instruments at fair value through profit or loss. Results from the repurchase of own issues categorised as “other liabilities” are recognised as at the repurchase date under Net other operating income.
The item Provisions includes provisions for pensions and similar commitments, credit risks as well as other obligations of uncertain amount and timing involving a probable outflow of funds.
96
The employees of the KfW Group participate in a company pension plan that pays retirement, long-term disability and survivor benefits. The KfW Group has both defined-benefit pension plans and defined-contribution pension plans. In both cases the benefits depend on the length of service and salary. Apart from employer-financed pension plans there are also plans in place involving contributions by employees.
The pension commitments for defined-benefit plans are calculated by an independent qualified expert in accordance with the projected unit credit method on the basis of group-wide uniform parameters such as age, length of service and salary. The commitments are recognised at present value of the defined-benefit obligations as at the reporting date, taking into consideration actuarial profits and losses to be amortised. The discount factor is based on current market conditions for corporate bonds with a maturity matching that of the obligations. Additional demographic factors (including the Heubeck actuarial tables for 2005 G) and actuarial assumptions (rate of salary increases, rate of pension increases, rate of staff turnover, etc.) are accounted for. No plan assets were defined for the pension obligations of the KfW Group, so the related special regulations do not apply.
The KfW Group recognises net cumulative actuarial gains and losses that exceed 10% of the present value of the defined-benefit obligations (corridor approach). Amounts in excess of the 10% mark are amortised on a straight-line basis over the expected average remaining working life and accounted for through profit or loss in the pension provisions under Administrative expense.
All pension obligations resulting from defined-benefit plans are financed from the recognised pension provisions. There are no fund-financed pension obligations. Allocations to pension provisions distinguish between current service cost, interest expense and other allocations (including past service cost). The interest expense for pension obligations is reported under Other interest expense and other allocations are included in the item Administrative expense.
Under defined-contribution plans employers pay a set amount to an external service provider (such as the Versorgungsverband bundes- und landesgeförderter Unternehmen e.V., the German pension association for entities benefiting from federal and state support). Beyond this employers have no legal or constructive obligation to pay additional amounts if the external service provider does not fulfil its obligations as agreed. Contributions paid to the service provider are reported under the item Administrative expense; no provisions are necessary for defined-contribution plans.
Pension-like obligations include commitments for deferred compensation, early retirement and partial retirement. Actuarial reports are prepared and a provision is set up accordingly for these types of commitments as well. There are no actuarial gains and losses, so that the recognised provision matches the present value of the obligations.
Other provisions are set up primarily for obligations to employees and for audit and consultancy services at the estimated expenditure.
| (21) | | Subordinated liabilities |
This item is used to carry subordinated liabilities to the ERP Special Fund.
Subordinated liabilities are classified as Other liabilities and carried at amortised cost.
97
Deferred interest as well as value adjustments from micro fair value hedge accounting are recognised under Other liabilities.
Current interest expenses are recorded under Interest expense.
The equity structure is determined by the KfW Law and IFRS.
Pursuant to Section 10 (2) and (3) of the KfW Law, KfW’s net income for the period determined in accordance with the German Commercial Code is transferred to reserves and is included in equity under IFRS. In accordance with IFRS, the KfW Group must report the contractually agreed “strengthening” of the reserve from the ERP Special Fund under equity as Appropriation of consolidated profit/loss.
The KfW Group created a fund for general banking risks. Additions to or reductions of the fund are shown under IFRS as appropriation of consolidated profit/loss.
Under IFRS any remaining consolidated net income is allocated to Other retained earnings in the same period.
The revaluation reserves include the valuation results from the category “available-for-sale financial assets” and also deferred taxes recognised directly in equity, depending on the underlying transaction.
| (23) | | Contingent liabilities and irrevocable loan commitments |
The KfW Group’s contingent liabilities result mainly from guarantees (financial guarantee contracts). All contingent liabilities are listed in the Notes at their nominal amounts less provisions.
Irrevocable loan commitments are firm commitments by the KfW Group to grant a loan under contractually agreed terms. These are listed in the Notes at their nominal amounts less provisions.
Assets and liabilities held by the KfW Group in its own name but for third-party accounts are not recognised. This applies in particular to loans granted under German Financial Cooperation to support developing countries; the federal budget both grants the funds and underwrites these loans. The remuneration associated with these transactions is recognised under Commission income.
| (25) | | Leasing transactions |
Leases are classified as operating leases or as finance leases depending on the risks and rewards relating to ownership of an asset. This classification determines their accounting treatment.
The KfW Group enters into both types of leases as a lessee only. Real estate leases are classified as operating leases; the corresponding rental payments are included under Administrative expense.
98
Finance leases are entered into only to a limited extent. The leased assets are capitalised and depreciated over the useful life or lease term, whichever is shorter, in Administrative expense. Liabilities arising from future leasing payments are reported under Other liabilities.
99
Notes to the income statement
(26) Net interest income
Analysis of Net Interest Income by Class
| | | | | | | | | | | | | |
| | | 2008 | | 2007 | | Change |
| | | EUR in | | EUR in | | EUR in |
| | | millions | | millions | | millions |
| Interest and similar income from loans and advances to banks and customers | | | 14,104 | | | | 13,068 | | | | 1,036 | |
| Similar income from financial guarantees | | | 50 | | | | 43 | | | | 7 | |
| Interest income from securities and investments | | | 2,267 | | | | 1,969 | | | | 298 | |
| Interest income from derivatives | | | 12,203 | | | | 12,472 | | | | -269 | |
| Other interest income | | | 53 | | | | 26 | | | | 28 | |
| | | | | | | | | | | | | |
Interest income | | | 28,677 | | | | 27,578 | | | | 1,100 | |
| | | | | | | | | | | | | |
| Interest and similar expense for liabilities to banks/customers | | | 1,807 | | | | 2,127 | | | | -320 | |
| Interest expense for certificated liabilities | | | 11,939 | | | | 11,419 | | | | 520 | |
| Interest expense for subordinated liabilities | | | 163 | | | | 93 | | | | 70 | |
| Interest expense for derivatives | | | 12,570 | | | | 11,948 | | | | 622 | |
| Other interest expense | | | 192 | | | | 236 | | | | -44 | |
| | | | | | | | | | | | | |
Interest expense | | | 26,671 | | | | 25,823 | | | | 848 | |
| | | | | | | | | | | | | |
| | | | | | | | | | | | | |
Total | | | 2,006 | | | | 1,755 | | | | 251 | |
| | | | | | | | | | | | | |
Income from unwinding in the amount of EUR 84 million (previous year: EUR 43 million) is reported under Interest and similar income from loans and advances to banks and customers.
Interest income from derivatives includes the net interest income from derivatives irrespective of whether they are designated for hedge accounting.
100
Analysis of Interest Income from Securities and Investments
| | | | | | | | | | | | | |
| | | 2008 | | 2007 | | Change |
| | | EUR in | | EUR in | | EUR in |
| | | millions | | millions | | millions |
| | | | | | | | | | | | | |
| Interest income from bonds and other fixed-income securities | | | 2,204 | | | | 1,881 | | | | 323 | |
| Income from shares and other non-fixed income securities | | | 32 | | | | 54 | | | | -22 | |
| Income from equity investments | | | 26 | | | | 34 | | | | -8 | |
| Income from shares in affiliated entities not included in the consolidated financial statements | | | 5 | | | | 0 | | | | 5 | |
| | | | | | | | | | | | | |
Total | | | 2,267 | | | | 1,969 | | | | 298 | |
| | | | | | | | | | | | | |
(27) Risk provisions for lending business
Analysis of Risk Provisions by Transaction
| | | | | | | | | | | | | |
| | | 2008 | | 2007 | | Change |
| | | EUR in | | EUR in | | EUR in |
| | | millions | | millions | | millions |
| Impairment charges | | | 1,304 | | | | 6,857 | | | | -5,553 | |
| Direct write-offs | | | 1,087 | | | | 118 | | | | 969 | |
| | | | | | | | | | | | | |
Expense for risk provisions | | | 2,391 | | | | 6,975 | | | | -4,584 | |
| | | | | | | | | | | | | |
| Income from the reversal of impairment losses | | | 184 | | | | 469 | | | | -285 | |
| Income from recoveries of amounts previously written off | | | 68 | | | | 97 | | | | -29 | |
| | | | | | | | | | | | | |
Income from risk provisions | | | 252 | | | | 566 | | | | -314 | |
| | | | | | | | | | | | | |
| | | | | | | | | | | | | |
Total | | | -2,139 | | | | -6,409 | | | | 4,271 | |
| | | | | | | | | | | | | |
The direct write-offs resulted almost entirely from the loans with waivers of debts outstanding and agreements on compensation out of future profits (Besserungsabrede) granted as part of the IKB capitalisation measures in 2008, which were sold to a strategic investor (EUR 1.0 billion). In addition, the impairment charges included additional charges totalling EUR 0.3 billion resulting from the risk protection for IKB.
Last year, this line item included the provisions from KfW’s assumption of the liquidity lines provided for the SPEs of the “Rhineland Funding Capital Corporation, New York/USA” conduit and the provision for the guarantee covering the balance sheet risks of IKB.
101
(28) Net commission income
Analysis of Net Commission Income by Class
| | | | | | | | | | | | | |
| | | 2008 | | 2007 | | Change |
| | | EUR in | | EUR in | | EUR in |
| | | millions | | millions | | millions |
| Commission income from lending business | | | 274 | | | | 266 | | | | 8 | |
| Commission income from credit derivatives | | | 12 | | | | 6 | | | | 6 | |
| Other commission income | | | 119 | | | | 114 | | | | 5 | |
| Income from trust activities | | | 1 | | | | 2 | | | | -1 | |
| | | | | | | | | | | | | |
Commission income | | | 406 | | | | 388 | | | | 18 | |
| | | | | | | | | | | | | |
| Commission expense for lending business | | | 166 | | | | 166 | | | | 0 | |
| Commission expense for credit derivatives | | | 4 | | | | 4 | | | | 0 | |
| Other commission expense | | | 18 | | | | 8 | | | | 9 | |
| | | | | | | | | | | | | |
Commission expense | | | 188 | | | | 178 | | | | 9 | |
| | | | | | | | | | | | | |
| | | | | | | | | | | | | |
Total | | | 218 | | | | 209 | | | | 9 | |
| | | | | | | | | | | | | |
Commission income from lending business also includes current premiums and fees from the securitisation platforms PROMISE and PROVIDE.
Other commission income includes fees for handling German Financial Cooperation with developing and transition countries in the amount of EUR 84 million (previous year: EUR 84 million).
(29) Net gains/losses from hedge accounting
Analysis of Net Gains/Losses from Hedge Accounting by Type of Hedging Relationship
| | | | | | | | | | | | | |
| | | 2008 | | 2007 | | Change |
| | | EUR in | | EUR in | | EUR in |
| | | millions | | millions | | millions |
| Micro fair value hedge accounting | | | -450 | | | | -72 | | | | -378 | |
| Macro fair value hedge accounting | | | 141 | | | | 146 | | | | -5 | |
| | | | | | | | | | | | | |
Total | | | -309 | | | | 73 | | | | -383 | |
| | | | | | | | | | | | | |
102
Analysis of Net Results from Micro Fair Value Hedge Accounting by Hedged Item
| | | | | | | | | | | | | |
| | | 2008 | | 2007 | | Change |
| | | EUR in | | EUR in | | EUR in |
| | | millions | | millions | | millions |
| Hedging of securities and investments | | | 51 | | | | -3 | | | | 54 | |
| Hedging of liabilities to banks/customers | | | -8 | | | | -3 | | | | -5 | |
| Hedging of certificated liabilities | | | -434 | | | | -15 | | | | -419 | |
| Hedging of subordinated liabilities | | | -5 | | | | -3 | | | | -2 | |
| | | | | | | | | | | | | |
Subtotal: Effectiveness of hedges | | | -396 | | | | -24 | | | | -372 | |
| Amortisation of value adjustments | | | -54 | | | | -48 | | | | -6 | |
| | | | | | | | | | | | | |
Total | | | -450 | | | | -72 | | | | -378 | |
| | | | | | | | | | | | | |
| |
| Gross analysis of valuation results from micro fair value hedge accounting: |
| |
| Comparison of Hedged Items and Hedging Instruments in Financial Year 2008 |
| |
| | | | | | | Hedging | | |
| | | Hedged Items | | Instruments | | Effectiveness of hedges |
| | | EUR in | | EUR in | | EUR in |
| | | millions | | millions | | millions |
| Hedging of securities and investments | | | 731 | | | | -680 | | | | 51 | |
| Hedging of liabilities to banks/customers | | | -73 | | | | 65 | | | | -8 | |
| Hedging of certificated liabilities | | | -11,294 | | | | 10,860 | | | | -434 | |
| Hedging of subordinated liabilities | | | -224 | | | | 219 | | | | -5 | |
| | | | | | | | | | | | | |
Total | | | -10,859 | | | | 10,464 | | | | -396 | |
| | | | | | | | | | | | | |
103
Gross analysis of valuation results from micro fair value hedge accounting:
Comparison of Hedged Items and Hedging Instruments in Financial Year 2007
| | | | | | | | | | | | | |
| | | Hedged | | Hedging | | Effectiveness |
| | | Items | | instruments | | of hedges |
| | | EUR in | | EUR in | | EUR in |
| | | millions | | millions | | millions |
| Hedging of securities and investments | | | -107 | | | | 104 | | | | -3 | |
| Hedging of liabilities to banks/customers | | | 57 | | | | -60 | | | | -3 | |
| Hedging of certificated liabilities | | | -280 | | | | 264 | | | | -15 | |
| Hedging of subordinated liabilities | | | 9 | | | | -12 | | | | -3 | |
| | | | | | | | | | | | | |
Total | | | -320 | | | | 296 | | | | -24 | |
| | | | | | | | | | | | | |
Analysis of Net Results from Macro Fair Value Hedge Accounting by Hedged Item and Hedging
Instrument
| | | | | | | | | | | | | |
| | | 2008 | | 2007 | | Change |
| | | EUR in | | EUR in | | EUR in |
| | | millions | | millions | | millions |
| | | | | | | | | | | | | |
| Valuation of the hedged risks in the portfolios of hedged items | | | 6,310 | | | | -1,387 | | | | 7,696 | |
| Valuation of hedging instruments | | | -6,079 | | | | 1,332 | | | | -7,411 | |
| | | | | | | | | | | | | |
Subtotal: Effectiveness of hedges | | | 231 | | | | -55 | | | | 285 | |
| Subsequent valuation of hedging relationships | | | -90 | | | | 201 | | | | -291 | |
| | | | | | | | | | | | | |
Total | | | 141 | | | | 146 | | | | -5 | |
| | | | | | | | | | | | | |
The result from the subsequent valuation of hedging relationships includes the amortisation of the value adjustments from the dynamic hedge designation and reversal process and the pro-rata reversal of value adjustments in the event of disposals from the underlying portfolios as well as the residual term effect of the hedging derivatives.
104
(30) Net gains/losses from other financial instruments at fair value through profit or loss
Analysis of Net Gains/Losses from Other Financial Instruments at Fair Value Through Profit or Loss by Class
| | | | | | | | | | | | | |
| | | 2008 | | 2007 | | Change |
| | | EUR in | | EUR in | | EUR in |
| | | millions | | millions | | millions |
| Securities and investments | | | -1,446 | | | | -237 | | | | -1,209 | |
| | | | | | | | | | | | | |
Assets | | | -1,446 | | | | -237 | | | | -1,209 | |
| | | | | | | | | | | | | |
| Liabilities to banks/customers | | | 751 | | | | 284 | | | | 466 | |
| Certificated liabilities | | | -1,838 | | | | 567 | | | | -2,405 | |
| | | | | | | | | | | | | |
Liabilities | | | -1,088 | | | | 851 | | | | -1,939 | |
| | | | | | | | | | | | | |
| Financial derivatives not qualifying for hedge accounting | | | 1,622 | | | | -590 | | | | 2,212 | |
| Credit derivatives | | | -584 | | | | -1,875 | | | | 1,291 | |
| | | | | | | | | | | | | |
Derivative financial instruments | | | 1,038 | | | | -2,465 | | | | 3,503 | |
| | | | | | | | | | | | | |
| Foreign currency translation | | | 57 | | | | -102 | | | | 160 | |
| | | | | | | | | | | | | |
Total | | | -1,438 | | | | -1,953 | | | | 515 | |
| | | | | | | | | | | | | |
The net gains/losses from liabilities to banks/customers include the result of the credit-linked notes issued under the PROMISE and PROVIDE securitisation platforms. The net gains/losses from credit derivatives include the result from the portfolio CDSs concluded under this item.
The net gains/losses from derivatives not qualifying for hedge accounting are attributable mainly to derivatives in economic hedges which are recognised by using the fair value option for classifying the hedged items. The hedged items include, in particular, borrowings in the form of certificated liabilities and liabilities to banks and customers as well as securities and investments.
In addition, the net gains/losses from financial derivatives that do not qualify for hedge accounting include changes in the value of embedded derivatives from equity finance business which have to be separated. In addition, this item is used to carry results from embedded derivatives that are accounted for separately and which are connected to financial liabilities; the net gains/losses from the valuation of the associated hedging derivatives are thus compensated for.
The results from the portfolio investments that KfW acquired from IKB as part of the sale of the IKB shares to a strategic investor, are limited to the risk of first loss (EUR 150 million) and recorded in Net gains/losses from securities and investments and Net gains/losses from credit derivatives (single name CDSs and portfolio CDSs).
In the previous year, Net gains/losses from credit derivatives included results arising in connection with the risk protection for IKB (assumed credit derivatives).
105
Analysis of Net Gains/Losses from Securities and Investments at Fair Value Through Profit or
Loss by Product Type
| | | | | | | | | | | | | |
| | | 2008 | | 2007 | | Change |
| | | EUR in | | EUR in | | EUR in |
| | | millions | | millions | | millions |
| | | | | | | | | | | | | |
| Bonds and other fixed-income securities | | | -1,121 | | | | -397 | | | | -724 | |
| Shares and other non-fixed income securities | | | -323 | | | | 2 | | | | -326 | |
| Equity investments | | | -2 | | | | 157 | | | | -159 | |
| | | | | | | | | | | | | |
Total | | | -1,446 | | | | -237 | | | | -1,209 | |
| | | | | | | | | | | | | |
Analysis of Net Gains/Losses from Credit Derivatives and Credit-linked Notes from the
Securitisation Platforms PROMISE and PROVIDE at Fair Value through Profit or Loss
| | | | | | | | | | | | | |
| | | 2008 | | 2007 | | Change |
| | | EUR in | | EUR in | | EUR in |
| | | millions | | millions | | millions |
| Single Name CDSs | | | -64 | | | | 14 | | | | -78 | |
| Portfolio CDSs | | | 286 | | | | -1,662 | | | | 1,947 | |
| PROMISE / PROVIDE | | | -3 | | | | 0 | | | | -3 | |
CDSs | | | -806 | | | | -227 | | | | -579 | |
Issued credit-linked notes | | | 804 | | | | 227 | | | | 576 | |
| | | | | | | | | | | | | |
Total | | | 219 | | | | -1,647 | | | | 1,867 | |
| | | | | | | | | | | | | |
Gross Analysis of Results from Economic Hedged Borrowing: Comparison of Hedged Items and
Hedging Instruments
| | | | | | | | | | | | | |
| | | 2008 | | 2007 | | Change |
| | | EUR in | | EUR in | | EUR in |
| | | millions | | millions | | millions |
| Borrowings | | | -1,891 | | | | 624 | | | | -2,515 | |
| Hedging instruments | | | 2,313 | | | | -668 | | | | 2,981 | |
| | | | | | | | | | | | | |
Total (Effectiveness of economic hedges) | | | 422 | | | | -45 | | | | 466 | |
| | | | | | | | | | | | | |
106
(31) Net gains/losses from securities and investments
Analysis of Net Gains/Losses from Securities and Investments by Class
| | | | | | | | | | | | | |
| | | 2008 | | 2007 | | Change |
| | | EUR in | | EUR in | | EUR in |
| | | millions | | millions | | millions |
| Bonds and other fixed-income securities | | | -436 | | | | -19 | | | | -416 | |
| Shares and other non-fixed income securities | | | -25 | | | | 0 | | | | -25 | |
| Equity investments | | | -95 | | | | -48 | | | | -47 | |
| | | | | | | | | | | | | |
Financial instruments | | | -555 | | | | -67 | | | | -489 | |
| Investments accounted for using the equity method | | | 3 | | | | -277 | | | | 280 | |
| Held-for-sale affiliated entities | | | -1,421 | | | | -77 | | | | -1,344 | |
| | | | | | | | | | | | | |
Total | | | -1,974 | | | | -421 | | | | -1,552 | |
| | | | | | | | | | | | | |
The net gains/losses from financial instruments include gains and losses realised from the sale and impairments of securities and investments classified as available-for-sale financial assets or as loans and receivables. Both the net gains/losses from shares and other non-fixed income securities and the net gains/losses from equity investments include income from the disposal of financial assets that were recognised at cost.
The net gains/losses from held-for-sale affiliated entities include expenses from the complete sale of KfW’s interest in IKB, which also includes the shares newly acquired as part of the IKB cash capital increase in 2008.
In the previous year, from the date on which the intention to sell was announced the write-offs on the IKB shares were recorded under assets held for sale (IFRS 5), previously they were recorded in net gains/losses from investments accounted for using the equity method.
107
Disclosures on Impairment of Securities and Investments
| | | | | | | | | | | | | |
| | | 2008 | | 2007 | | Change |
| | | EUR in | | EUR in | | EUR in |
| | | millions | | millions | | millions |
| Securities and investments | | | 562 | | | | 80 | | | | 481 | |
Bonds and other fixed-income securities | | | 405 | | | | 18 | | | | 386 | |
Shares and other non-fixed income securities | | | 32 | | | | 1 | | | | 31 | |
Equity investments | | | 125 | | | | 61 | | | | 64 | |
| | | | | | | | | | | | | |
Total | | | 562 | | | | 80 | | | | 481 | |
| | | | | | | | | | | | | |
Disclosures on the Reversal of Impairment Losses from Securities and Investments
| | | | | | | | | | | | | |
| | | 2008 | | 2007 | | Change |
| | | EUR in | | EUR in | | EUR in |
| | | millions | | millions | | millions |
| Securities and investments | | | 1 | | | | 0 | | | | 1 | |
Bonds and other fixed-income securities | | | 1 | | | | 0 | | | | 1 | |
| | | | | | | | | | | | | |
Total | | | 1 | | | | 0 | | | | 1 | |
| | | | | | | | | | | | | |
108
(32) Administrative expense
Analysis of Administrative Expense
| | | | | | | | | | | | | |
| | | 2008 | | 2007 | | Change |
| | | EUR in | | EUR in | | EUR in |
| | | millions | | millions | | millions |
| Wages and salaries | | | 305 | | | | 276 | | | | 29 | |
| Social security contributions | | | 41 | | | | 41 | | | | 0 | |
| Expense for pension provision and other employee benefits | | | 20 | | | | 32 | | | | -12 | |
| | | | | | | | | | | | | |
Personnel expense | | | 366 | | | | 349 | | | | 17 | |
| | | | | | | | | | | | | |
| Other administrative expense | | | 233 | | | | 216 | | | | 18 | |
| Depreciation and impairment on property, plant and equipment | | | 46 | | | | 42 | | | | 4 | |
| | | | | | | | | | | | | |
Non-personnel expense | | | 280 | | | | 258 | | | | 22 | |
| | | | | | | | | | | | | |
| | | | | | | | | | | | | |
Total | | | 646 | | | | 607 | | | | 39 | |
| | | | | | | | | | | | | |
The non-personnel expense includes EUR 6 million for depreciation and impairment relating to finance leases (previous year: EUR 5 million).
Other administrative expense includes rental expense arising from operating leases in the amount of EUR 14 million (previous year: EUR 11 million).
(33) Net other operating income
Analysis of Net Other Operating Income
| | | | | | | | | | | | | |
| | | 2008 | | 2007 | | Change |
| | | EUR in | | EUR in | | EUR in |
| | | millions | | millions | | millions |
| Other operating income | | | 1,592 | | | | 1,217 | | | | 374 | |
| Other operating expense | | | 56 | | | | 29 | | | | 27 | |
| | | | | | | | | | | | | |
Total | | | 1,536 | | | | 1,189 | | | | 347 | |
| | | | | | | | | | | | | |
Other operating income includes the contributions by the Federal Government and the German banking sector to the IKB capital measures and the risk protection for IKB.
Additional items include rental income including investment property income of EUR 4 million (previous year: EUR 3 million), results from repurchasing own issues and income from the reversal of other provisions.
109
(34) Taxes on income
Analysis of Taxes on Income by Component
| | | | | | | | | | | | | |
| | | 2008 | | 2007 | | Change |
| | | EUR in | | EUR in | | EUR in |
| | | millions | | millions | | millions |
| Current taxes on income | | | 12 | | | | 16 | | | | -4 | |
| Deferred taxes | | | -100 | | | | -12 | | | | -88 | |
| | | | | | | | | | | | | |
Total | | | -89 | | | | 4 | | | | -93 | |
| | | | | | | | | | | | | |
In the reporting year deferred tax assets resulted in earnings of EUR 100 million (previous year: EUR 12 million).
Taxes on income mostly resulted from the first-time inclusion of KfW IPEX-Bank as an independent taxable associate.
The reconciliation presents the relationship between the calculated income tax expense for the financial year and the taxes on income.
Tax Reconciliation
| | | | | | | | | | | | | |
| | | 2008 | | 2007 | | Change |
| | | EUR in | | EUR in | | EUR in |
| | | millions | | millions | | millions |
| Profit/loss from operating activities (before taxes) | | | -2,745 | | | | -6,164 | | | | 3,419 | |
| Group income tax rate (%) | | | 0 | | | | 0 | | | | 0 | |
| | | | | | | | | | | | | |
Calculated income tax expense for 2008 | | | 0 | | | | 0 | | | | 0 | |
| Effects of tax rate differentials within the Group | | | -180 | | | | -178 | | | | -2 | |
| Effect of tax rate changes | | | -62 | | | | 13 | | | | -75 | |
| Effects of previous year taxes recorded in the reporting year | | | -7 | | | | -1 | | | | -6 | |
| Effects of non-deductible taxes on income | | | 3 | | | | 0 | | | | 3 | |
| Effects of non-deductible business expenses | | | 2 | | | | 182 | | | | -180 | |
| Effects of tax-free income | | | -1 | | | | -2 | | | | 1 | |
| Trade tax add-ons | | | 4 | | | | 1 | | | | 3 | |
| Permanent accounting differences | | | -1 | | | | 1 | | | | -2 | |
| Profit/loss distribution recorded under commercial law | | | 0 | | | | 0 | | | | 0 | |
| Effects of changes in recognised deferred tax assets | | | 152 | | | | -7 | | | | 159 | |
| Other effects | | | -2 | | | | -5 | | | | 3 | |
| | | | | | | | | | | | | |
Reported taxes on income | | | -89 | | | | 4 | | | | -93 | |
110
The KfW Group’s applicable income tax rate of zero percent, on which the reconciliation is based, takes into account the tax status of KfW as a non-taxable public-law institution and the major effect of this status on profit/loss from operating activities.
The effects of tax rate differentials result from individual group companies being taxable and the related different tax rates. In the reporting year the tax rates ranged between 0% and 31% (previous year up to 31%).
The effects of tax rate changes result from the separation of a legally dependent part of KfW’s operations to form KfW IPEX-Bank on 1 January 2008 and the related change in tax status.
The effects of changes in recognised deferred tax assets include, in particular, the non-consideration of tax losses recorded during the reporting year and of the surplus assets for deductible temporary differences. This is in line with KfW’s conservative approach.
111
Segment reporting
(35) Segment reporting by business area
Primary segment information in accordance with IAS 14 follows the internal control structure of the business areas of the KfW Group.
The composition of the segments, and their products and services, are shown in the following overview:
Investment finance Germany and Europe
| | • | | Equity financing (incl. tbg — Technologie-Beteiligungs-Gesellschaft mbH) |
| |
| | • | | Corporate investments/industrial pollution control financing |
| |
| | • | | Education and social finance |
| |
| | • | | Infrastructure and home finance |
| |
| | • | | Global loans |
| |
| | • | | Advisory |
| |
| | • | | Loan securitisation |
Export and project finance
| | • | | Promotion of German and European export activities |
| |
| | • | | Financing of direct and other corporate investments |
Promotion of developing and transition countries
| | • | | Promotion of developing and transition countries on behalf of the Federal Republic of Germany (budget funds) with complementary funds raised by KfW in the market |
| |
| | • | | DEG — Deutsche Investitions- und Entwicklungsgesellschaft mbH (private enterprise financing) |
Shareholdings, treasury and services
| | • | | Holding arrangements for the Federal Republic of Germany |
| |
| | • | | Shareholdings |
| |
| | • | | Securities investments |
| |
| | • | | Other services |
The operating business areas are measured on the basis of their profit or loss from operating activities. The individual line items are based on the following methods:
| | • | | The analysis of net interest income was based on the market interest rate method1. The item also includes the imputed return on equity with an analysis based on equity usage. |
| |
| | • | | The allocation of administrative expense is based on the results from activity-based accounting by cost centres2. Administrative expense includes depreciation on property, plant and equipment. |
| |
| | • | | Risk provisions for lending business were determined based on the concept of expected losses (standard risk costs) and allocated accordingly to each segment. |
| |
| | • | | In contrast to former reporting, other contributions to income no longer include the valuation results which were recorded directly under equity in the revaluation reserve. Segment reporting is thus in line with changed internal reporting. Other contributions to |
| | |
| 1 | | Refinancing at matching maturities is assumed for the calculation of interest margins in this method. |
| |
| 2 | | The costs incurred in the organisational units are allocated to the products by means of core services. |
112
| | | | income now include the net gains/losses from hedge accounting, the net gains/losses from the fair value accounting for other financial instruments, the net gains/losses from securities and investments, and net other operating income. |
| |
| | • | | Segment assets include all recognised balance sheet assets less income tax assets plus assets held in trust1. |
| |
| | • | | Contributions to income generated independently of the segments (such as income/loss from interest rate management) are allocated to the group centre. |
The reconciliation/consolidation column includes the adjustments that were necessary to reconcile segment results with comprehensive income. In 2008, this related in particular to the impact of the risk protection for IKB and the sale of KfW’s interest in IKB on income. In addition, it included differences between risk provisions for lending business according to the income statement and standard risk costs.
Segment Reporting by Business Area for Financial Year 2008
| | | | | | | | | | | | | | | | | | | | | | | | | | | | | |
| | | | | | | | | | | Promotion | | | | | | | | |
| | | Investment | | | | | | of developing | | | | | | | | |
| | | finance | | Export and | | and | | Shareholdings, | | | | | | |
| | | Germany and | | project | | transition | | treasury and | | Group | | Reconciliation/ | | KfW |
| EUR in millions | | Europe | | finance | | countries | | services | | centre | | consolidation | | Group |
| Net interest income | | | -158 | | | | 548 | | | | 130 | | | | 232 | | | | 1,079 | | | | 174 | | | | 2,006 | |
| Net commission income | | | 62 | | | | 28 | | | | 97 | | | | 11 | | | | 0 | | | | 21 | | | | 218 | |
| Administrative expense | | | -244 | | | | -129 | | | | -167 | | | | -74 | | | | -24 | | | | -7 | | | | -646 | |
| Risk provisions for lending business (a) | | | -140 | | | | -150 | | | | -71 | | | | -7 | | | | -7 | | | | -1,764 | | | | -2,139 | |
| Other contributions to income (b) | | | -541 | | | | -74 | | | | -10 | | | | -1,400 | | | | -399 | | | | 238 | | | | -2,185 | |
| | | | | | | | | | | | | | | | | | | | | | | | | | | | | |
Profit/loss from operating activities | | | -1,022 | | | | 222 | | | | -21 | | | | -1,237 | | | | 649 | | | | -1,337 | | | | -2,745 | |
| | | | | | | | | | | | | | | | | | | | | | | | | | | | | |
Total assets | | | 247,797 | | | | 51,757 | | | | 23,524 | | | | 56,846 | | | | 31,231 | | | | -16,329 | | | | 394,826 | |
| | |
| (a) | | The business areas are charged standard risk costs. |
| |
| (b) | | Includes the net gains/losses from hedge accounting, the net gains/losses from the fair value accounting for other financial instruments, the net gains/losses from securities and investments, and net other operating income. |
In the Export and project finance business area, other contributions to income include the result attributable to investments accounted for using the equity method totalling EUR 3 million. As of 31 December 2008, the Export and project finance business area’s assets include EUR 8 million from investments accounted for using the equity method.
| | |
| 1 | | Segment liabilities are not shown separately because, on the assumption that assets are fully refinanced, the analysis of segment liabilities to a large extent reflects the analysis of segment assets. |
113
Segment Reporting by Business Area for Financial year 2007
| | | | | | | | | | | | | | | | | | | | | | | | | | | | | |
| | | | | | | | | | | Promotion | | | | | | | | |
| | | Investment | | | | | | of developing | | | | | | | | |
| | | finance | | Export and | | and | | Shareholdings, | | | | | | |
| | | Germany and | | project | | transition | | treasury and | | Group | | Reconciliation/ | | KfW |
| EUR in millions | | Europe | | finance | | countries | | services | | centre | | consolidation | | Group |
| Net interest income | | | -109 | | | | 468 | | | | 119 | | | | 177 | | | | 1,099 | | | | 1 | | | | 1,755 | |
| Net commission income | | | 72 | | | | 26 | | | | 96 | | | | 12 | | | | 0 | | | | 4 | | | | 209 | |
| Administrative expense | | | -246 | | | | -114 | | | | -153 | | | | -69 | | | | -20 | | | | -5 | | | | -607 | |
| Risk provisions for lending business (a) | | | -125 | | | | -135 | | | | -61 | | | | -6 | | | | 0 | | | | -6,081 | | | | -6,409 | |
| Other contributions to income (b) | | | -124 | | | | 3 | | | | 148 | | | | -555 | | | | -64 | | | | -520 | | | | -1,112 | |
| | | | | | | | | | | | | | | | | | | | | | | | | | | | | |
Profit/loss from operating activities | | | -532 | | | | 249 | | | | 147 | | | | -443 | | | | 1,015 | | | | -6,601 | | | | -6,164 | |
| | | | | | | | | | | | | | | | | | | | | | | | | | | | | |
Total assets | | | 228,934 | | | | 43,710 | | | | 22,726 | | | | 63,964 | | | | 10,806 | | | | -16,143 | | | | 353,997 | |
| | |
| (a) | | The business areas are charged standard risk costs. |
| |
| (b) | | Includes the net gains/losses from hedge accounting, the net gains/losses from the fair value accounting for other financial instruments, the net gains/losses from securities and investments, and net other operating income. |
The Shareholdings, treasury and services business area included EUR -279 million, and the Export and project finance business area EUR 1 million, for the result of investments accounted for using the equity method under Other contributions to income. As of 31 December 2007, the Export and project finance business area’s assets included EUR 5 million from investments accounted for using the equity method. Shares in IKB, which were still accounted for using the equity method as at 31 December 2006, were allocated to shares in held-for-sale affiliated entities as at 31 December 2007.
(36) Segment reporting by region
Net interest and commission income and segment assets are allocated on the basis of the clients’ geographical location. The imputed return on equity included in net interest income and income/loss from group interest risk management are allocated to Germany. The remaining assets that are not attributable are also allocated to Germany.
The reconciliation/consolidation column includes the adjustments that were necessary to reconcile segment results with comprehensive income. In 2008 this relates in particular to the impact of the risk protection for IKB and the sale of KfW’s interest in IKB on income.
Segment Reporting by Region for Financial Year 2008
| | | | | | | | | | | | | | | | | | | | | | | | | | | | | | | | | | | | | |
| | | | | | | Euro area | | | | | | | | | | Latin | | | | | | | | | | |
| | | | | | | (excl. | | Rest of | | North | | America/ | | Asia/ | | | | | | Reconciliation/ | | |
| EUR in millions | | Germany | | Germany) | | Europe | | America | | Caribbean | | Australia | | Africa | | consolidation | | KfW Group |
| Net interest income | | | 1,212 | | | | 168 | | | | 161 | | | | 75 | | | | 71 | | | | 110 | | | | 34 | | | | 174 | | | | 2,006 | |
| Net commission income | | | 80 | | | | 9 | | | | 8 | | | | 4 | | | | 10 | | | | 41 | | | | 44 | | | | 21 | | | | 218 | |
| | | | | | | | | | | | | | | | | | | | | | | | | | | | | | | | | | | | | |
Segment income | | | 1,292 | | | | 178 | | | | 169 | | | | 79 | | | | 81 | | | | 152 | | | | 78 | | | | 195 | | | | 2,224 | |
| | | | | | | | | | | | | | | | | | | | | | | | | | | | | | | | | | | | | |
Total assets | | | 284,449 | | | | 42,284 | | | | 33,912 | | | | 15,165 | | | | 6,911 | | | | 21,780 | | | | 6,654 | | | | -16,329 | | | | 394,826 | |
114
Segment Reporting by Region for Financial Year 2007
| | | | | | | | | | | | | | | | | | | | | | | | | | | | | | | | | | | | | |
| | | | | | | Euro area | | | | | | | | | | Latin | | | | | | | | | | |
| | | | | | | (excl. | | Rest of | | North | | America/ | | Asia/ | | | | | | Reconciliation/ | | |
| EUR in millions | | Germany | | Germany) | | Europe | | America | | Caribbean | | Australia | | Africa | | consolidation | | KfW Group |
| Net interest income | | | 1,241 | | | | 121 | | | | 135 | | | | 70 | | | | 73 | | | | 84 | | | | 30 | | | | 1 | | | | 1,755 | |
| Net commission income | | | 75 | | | | 8 | | | | 22 | | | | 2 | | | | 9 | | | | 48 | | | | 41 | | | | 4 | | | | 209 | |
| | | | | | | | | | | | | | | | | | | | | | | | | | | | | | | | | | | | | |
Segment income | | | 1,315 | | | | 129 | | | | 157 | | | | 71 | | | | 83 | | | | 132 | | | | 72 | | | | 5 | | | | 1,964 | |
| | | | | | | | | | | | | | | | | | | | | | | | | | | | | | | | | | | | | |
Total assets | | | 249,707 | | | | 43,178 | | | | 30,091 | | | | 11,558 | | | | 6,286 | | | | 22,664 | | | | 6,656 | | | | -16,143 | | | | 353,997 | |
115
Notes to the balance sheet
(37) Cash reserves
Analysis of Cash Reserves by Class
| | | | | | | | | | | | | |
| | | 31 Dec. 2008 | | 31 Dec. 2007 | | Change |
| | | EUR in | | EUR in | | EUR in |
| | | millions | | millions | | millions |
| Balances with central banks | | | 99 | | | | 26 | | | | 73 | |
(38) Loans and advances to banks
Analysis of Loans and Advances to Banks by Class
| | | | | | | | | | | | | |
| | | 31 Dec. 2008 | | 31 Dec. 2007 | | Change |
| | | EUR in | | EUR in | | EUR in |
| | | millions | | millions | | millions |
| Money-market transactions | | | 5,065 | | | | 11,109 | | | | -6,044 | |
| Loans and advances | | | 210,357 | | | | 187,391 | | | | 22,965 | |
| Promissory note loans | | | 0 | | | | 424 | | | | -424 | |
| Other receivables | | | 8,040 | | | | 6,814 | | | | 1,226 | |
| | | | | | | | | | | | | |
Total | | | 223,462 | | | | 205,738 | | | | 17,723 | |
| | | | | | | | | | | | | |
The receivables from the PROMISE and PROVIDE securitisation platforms are included in Other receivables.
Analysis of Loans and Advances to Banks by Liability Type
| | | | | | | | | | | | | |
| | | 31 Dec. 2008 | | 31 Dec. 2007 | | Change |
| | | EUR in | | EUR in | | EUR in |
| | | millions | | millions | | millions |
| Direct loans to banks | | | 78,002 | | | | 64,161 | | | | 13,841 | |
| On-lent customer loans with full underwriting borne by the on-lending bank | | | 129,627 | | | | 120,304 | | | | 9,323 | |
| On-lent customer loans with partial underwriting borne by the on-lending bank | | | 2,406 | | | | 2,734 | | | | -328 | |
| Direct and on-lent subordinated loans | | | 321 | | | | 192 | | | | 129 | |
| | | | | | | | | | | | | |
Total | | | 210,357 | | | | 187,391 | | | | 22,965 | |
| | | | | | | | | | | | | |
(39) Loans and advances to customers
116
Analysis of Loans and Advances to Customers by Class
| | | | | | | | | | | | | |
| | | 31 Dec. 2008 | | 31 Dec. 2007 | | Change |
| | | EUR in | | EUR in | | EUR in |
| | | millions | | millions | | millions |
| Money-market transactions | | | 100 | | | | 121 | | | | -21 | |
| Loans and advances | | | 103,368 | | | | 98,414 | | | | 4,955 | |
| Promissory note loans | | | 19 | | | | 36 | | | | -17 | |
| Other receivables | | | 957 | | | | 1,696 | | | | -739 | |
| | | | | | | | | | | | | |
Total | | | 104,444 | | | | 100,267 | | | | 4,177 | |
| | | | | | | | | | | | | |
The receivables from the PROMISE and PROVIDE securitisation platforms are included in Other receivables.
Analysis of Loans and Advances to Customers by Liability Type
| | | | | | | | | | | | | |
| | | 31 Dec. 2008 | | 31 Dec. 2007 | | Change |
| | | EUR in | | EUR in | | EUR in |
| | | millions | | millions | | millions |
| Direct loans to customers | | | 95,673 | | | | 90,295 | | | | 5,378 | |
| On-lent customer loans without underwriting borne by the on-lending bank | | | 690 | | | | 660 | | | | 30 | |
| Direct and on-lent subordinated loans | | | 7,006 | | | | 7,459 | | | | -453 | |
| | | | | | | | | | | | | |
Total | | | 103,368 | | | | 98,414 | | | | 4,955 | |
| | | | | | | | | | | | | |
117
(40) Risk provisions for lending business
Analysis of Risk Provisions for Lending Business by Class
| | | | | | | | | | | | | |
| | | 31 Dec. 2008 | | 31 Dec. 2007 | | Change |
| | | EUR in | | EUR in | | EUR in |
| | | millions | | millions | | millions |
| Loans and advances to banks | | | 526 | | | | 485 | | | | 41 | |
| Loans and advances to customers | | | 7,077 | | | | 7,186 | | | | -108 | |
| | | | | | | | | | | | | |
Provisions for losses on loans and advances | | | 7,604 | | | | 7,671 | | | | -67 | |
| Provisions for contingent liabilities and irrevocable loan commitments | | | 255 | | | | 530 | | | | -275 | |
| | | | | | | | | | | | | |
Total | | | 7,859 | | | | 8,201 | | | | -342 | |
| | | | | | | | | | | | | |
Development of Risk Provisions for Lending Business in Financial Year 2008 by Risk Assessment Type
| | | | | | | | | | | | | | | | | | | | | | | | | | | | | |
| | | | | | | Risks assessed | | | | | | | | | | |
| | | Individually | | on | | Country- | | Provisions for | | Provisions | | Provisions | | |
| | | assessed | | portfolio | | specific | | losses on loans | | (individual | | (portfolio | | |
| EUR in millions | | risks | | basis | | risks | | and advances | | risks) | | risks) | | Total |
As of 1 Jan. 2008 | | | 6,929 | | | | 702 | | | | 39 | | | | 7,671 | | | | 530 | | | | 0 | | | | 8,201 | |
| Additions | | | 1,953 | | | | 259 | | | | 18 | | | | 2,230 | | | | 128 | | | | 33 | | | | 2,391 | |
| Write-offs | | | -2,407 | | | | 0 | | | | 0 | | | | -2,407 | | | | -400 | | | | 0 | | | | -2,807 | |
| Reversals | | | -76 | | | | -59 | | | | -13 | | | | -149 | | | | -32 | | | | -3 | | | | -184 | |
| Unwinding | | | -84 | | | | 0 | | | | 0 | | | | -84 | | | | 0 | | | | 0 | | | | -84 | |
| Exchange rate changes | | | 347 | | | | -4 | | | | 1 | | | | 343 | | | | -1 | | | | 0 | | | | 342 | |
| Transfers | | | -118 | | | | 119 | | | | -1 | | | | 0 | | | | -46 | | | | 46 | | | | 0 | |
| | | | | | | | | | | | | | | | | | | | | | | | | | | | | |
As of 31 Dec. 2008 | | | 6,544 | | | | 1,016 | | | | 44 | | | | 7,604 | | | | 180 | | | | 75 | | | | 7,859 | |
| | | | | | | | | | | | | | | | | | | | | | | | | | | | | |
Country-specific risks include risks assessed on a portfolio basis.
In 2008, EUR 183 million (previous year: EUR 92 million) in interest income was not collected for impaired loans.
118
Development of Risk Provisions for Lending Business in Financial Year 2007 by Risk Assessment Type
| | | | | | | | | | | | | | | | | | | | | | | | | |
| | | | | | | Risks | | | | | | | | |
| | | Individually | | assessed | | Country- | | Provisions for | | | | |
| | | assessed | | on | | Specific | | losses on loans | | | | |
| EUR in millions | | risks | | portfolio basis | | risks | | and advances | | Provisions | | Total |
As of 1 Jan. 2007 | | | 1,417 | | | | 501 | | | | 46 | | | | 1,964 | | | | 65 | | | | 2,029 | |
| Additions | | | 6,232 | | | | 254 | | | | 12 | | | | 6,498 | | | | 477 | | | | 6,975 | |
| Write-offs | | | -208 | | | | 0 | | | | 0 | | | | -208 | | | | 0 | | | | -208 | |
| Reversals | | | -396 | | | | -45 | | | | -16 | | | | -457 | | | | -11 | | | | -468 | |
| Unwinding | | | -43 | | | | 0 | | | | 0 | | | | -43 | | | | 0 | | | | -43 | |
| Exchange rate changes | | | -74 | | | | -8 | | | | -3 | | | | -84 | | | | -1 | | | | -85 | |
| Transfers | | | 1 | | | | 0 | | | | 0 | | | | 1 | | | | 0 | | | | 1 | |
| | | | | | | | | | | | | | | | | | | | | | | | | |
As of 31 Dec. 2007 | | | 6,929 | | | | 702 | | | | 39 | | | | 7,671 | | | | 530 | | | | 8,201 | |
| | | | | | | | | | | | | | | | | | | | | | | | | |
(41) Value adjustments from macro fair value hedge accounting
| | | | | | | | | | | | | |
| | | 31 Dec. 2008 | | 31 Dec. 2007 | | Change |
| | | EUR in | | EUR in | | EUR in |
| | | millions | | millions | | millions |
| Value adjustments to assets designated for macro fair value hedge accounting | | | 5,451 | | | | -1,295 | | | | 6,745 | |
The fair values attributable to the hedged risks in the hedged portfolios under the category “loans and receivables” are included in this item.
(42) Derivatives used for hedge accounting
Analysis of Derivatives with Positive Fair Values Designated for Hedge Accounting by Type of Hedging Relationship
| | | | | | | | | | | | | |
| | | 31 Dec. 2008 | | 31 Dec. 2007 | | Change |
| | | EUR in | | EUR in | | EUR in |
| | | millions | | millions | | millions |
| Micro fair value hedge accounting | | | 12,391 | | | | 4,229 | | | | 8,162 | |
| Macro fair value hedge accounting | | | 637 | | | | 1,341 | | | | -704 | |
| | | | | | | | | | | | | |
Total | | | 13,028 | | | | 5,570 | | | | 7,458 | |
| | | | | | | | | | | | | |
119
Analysis of Derivatives with Positive Fair Values Designated for Hedge Accounting by Class
| | | | | | | | | | | | | |
| | | 31 Dec. 2008 | | 31 Dec. 2007 | | Change |
| | | EUR in | | EUR in | | EUR in |
| | | millions | | millions | | millions |
| Interest-related derivatives | | | 11,132 | | | | 3,994 | | | | 7,138 | |
| Currency-related derivatives | | | 1,896 | | | | 1,576 | | | | 320 | |
| | | | | | | | | | | | | |
Total | | | 13,028 | | | | 5,570 | | | | 7,458 | |
| | | | | | | | | | | | | |
Only interest-related derivatives are designated for macro fair value hedge accounting.
Cross-currency swaps are reported under Currency-related derivatives.
(43) Other derivatives
Analysis of Other Derivatives with Positive Fair Values by Class
| | | | | | | | | | | | | |
| | | 31 Dec. 2008 | | 31 Dec. 2007 | | Change |
| | | EUR in | | EUR in | | EUR in |
| | | millions | | millions | | millions |
| Interest-related derivatives | | | 4,265 | | | | 2,042 | | | | 2,223 | |
| Currency-related derivatives | | | 4,034 | | | | 1,065 | | | | 2,969 | |
| Equity/index-related derivatives | | | 5 | | | | 0 | | | | 5 | |
| Credit derivatives | | | 342 | | | | 11 | | | | 331 | |
| Other derivatives | | | 62 | | | | 48 | | | | 14 | |
| | | | | | | | | | | | | |
Total | | | 8,709 | | | | 3,166 | | | | 5,543 | |
| | | | | | | | | | | | | |
Cross-currency swaps are reported under Currency-related derivatives.
120
(44) Securities and investments
Analysis of Securities and Investments by Class
| | | | | | | | | | | | | |
| | | 31 Dec. 2008 | | 31 Dec. 2007 | | Change |
| | | EUR in | | EUR in | | EUR in |
| | | millions | | millions | | millions |
| | | | | | | | | | | | | |
| Bonds and other fixed-income securities | | | 42,555 | | | | 42,787 | | | | -231 | |
| Shares and other non-fixed income securities | | | 433 | | | | 1,526 | | | | -1,093 | |
| Equity investments | | | 1,230 | | | | 1,205 | | | | 25 | |
| Shares in affiliated entities not included in the consolidated financial statements | | | 2 | | | | 18 | | | | -17 | |
| | | | | | | | | | | | | |
Financial instruments, total | | | 44,220 | | | | 45,536 | | | | -1,316 | |
| Investments accounted for using the equity method | | | 8 | | | | 5 | | | | 3 | |
| Held-for-sale affiliated entities | | | 0 | | | | 204 | | | | -204 | |
| | | | | | | | | | | | | |
Total | | | 44,228 | | | | 45,745 | | | | -1,517 | |
| | | | | | | | | | | | | |
In 2007, the shares in held-for-sale affiliated entities included the shares in IKB that were sold to a strategic investor in 2008.
(45) Property, plant and equipment
Analysis of Property, Plant and Equipment by Class
| | | | | | | | | | | | | |
| | | 31 Dec. 2008 | | 31 Dec. 2007 | | Change |
| | | EUR in | | EUR in | | EUR in |
| | | millions | | millions | | millions |
| Land and buildings | | | 605 | | | | 577 | | | | 27 | |
| Plant and equipment | | | 48 | | | | 41 | | | | 7 | |
| Other property, plant and equipment | | | 189 | | | | 154 | | | | 35 | |
| | | | | | | | | | | | | |
Property, plant and equipment for own use | | | 842 | | | | 773 | | | | 69 | |
| Investment property | | | 29 | | | | 29 | | | | 1 | |
| | | | | | | | | | | | | |
Total | | | 871 | | | | 801 | | | | 70 | |
| | | | | | | | | | | | | |
Plant and equipment includes leased assets from finance leases that are required to be capitalised.
Payments in advance and work in progress are presented under Other property, plant and equipment.
The fair value of the investment property is its carrying amount.
121
Development in Property, Plant and Equipment in Financial Year 2008
| | | | | | | | | | | | | |
| | | | | | | Accumulated | | |
| | | Purchase/ | | depreciation/ | | |
| | | production | | impairment | | Net carrying |
| EUR in millions | | cost | | losses | | amount |
| Carrying amount as of 1 Jan. 2008 | | | 1,007 | | | | -206 | | | | 801 | |
| Additions/reversals of impairment losses | | | 105 | | | | 0 | | | | 105 | |
| Disposals | | | -14 | | | | 9 | | | | -5 | |
| Depreciation | | | — | | | | -29 | | | | -29 | |
| Non-scheduled impairment losses | | | — | | | | -1 | | | | -1 | |
| | | | | | | | | | | | | |
Carrying amount as of 31 Dec. 2008 | | | 1,098 | | | | -226 | | | | 871 | |
| | | | | | | | | | | | | |
Development in Property, Plant and Equipment in Financial Year 2007
| | | | | | | | | | | | | |
| | | | | | | Accumulated | | |
| | | Purchase/ | | depreciation/ | | |
| | | production | | impairment | | Net carrying |
| EUR in millions | | cost | | losses | | amount |
| Carrying amount as of 1 Jan. 2007 | | | 979 | | | | -201 | | | | 778 | |
| Additions/reversals of impairment losses | | | 67 | | | | 0 | | | | 67 | |
| Disposals | | | -38 | | | | 26 | | | | -13 | |
| Depreciation | | | — | | | | -29 | | | | -29 | |
| Non-scheduled impairment losses | | | — | | | | -1 | | | | -1 | |
| | | | | | | | | | | | | |
Carrying amount as of 31 Dec. 2007 | | | 1,007 | | | | -206 | | | | 801 | |
| | | | | | | | | | | | | |
122
(46) Intangible assets
Analysis of Intangible Assets by Class
| | | | | | | | | | | | | |
| | | 31 Dec. 2008 | | 31 Dec. 2007 | | Change |
| | | EUR in | | EUR in | | EUR in |
| | | millions | | millions | | millions |
| Software | | | 55 | | | | 33 | | | | 23 | |
Acquired software | | | 7 | | | | 8 | | | | -1 | |
Internally generated software | | | 48 | | | | 25 | | | | 24 | |
| Other intangible assets | | | 6 | | | | 36 | | | | -30 | |
| | | | | | | | | | | | | |
Total | | | 62 | | | | 69 | | | | -8 | |
| | | | | | | | | | | | | |
Other intangible assets include, in particular, software under development.
Development in Intangible Assets in Financial Year 2008
| | | | | | | | | | | | | |
| | | | | | | Accumulated | | |
| | | Purchase/ | | depreciation/ | | |
| | | production | | impairment | | Net carrying |
| EUR in millions | | cost | | losses | | amount |
| Carrying amount as of 1 Jan. 2008 | | | 119 | | | | -50 | | | | 69 | |
| Additions/reversals of impairment losses | | | 13 | | | | 0 | | | | 13 | |
| Disposals | | | -6 | | | | 2 | | | | -4 | |
| Depreciation | | | — | | | | -16 | | | | -16 | |
| Impairment losses | | | — | | | | 0 | | | | 0 | |
| | | | | | | | | | | | | |
Carrying amount as of 31 Dec. 2008 | | | 126 | | | | -64 | | | | 62 | |
| | | | | | | | | | | | | |
Development in Intangible Assets in Financial Year 2007
| | | | | | | | | | | | | |
| | | | | | | Accumulated | | |
| | | Purchase/ | | depreciation/ | | |
| | | production | | impairment | | Net carrying |
| EUR in millions | | cost | | losses | | amount |
| Carrying amount as of 1 Jan. 2007 | | | 98 | | | | -39 | | | | 59 | |
| Additions/reversals of impairment losses | | | 22 | | | | 0 | | | | 22 | |
| Disposals | | | 0 | | | | 0 | | | | 0 | |
| Depreciation | | | — | | | | -11 | | | | -11 | |
| Impairment losses | | | — | | | | 0 | | | | 0 | |
| | | | | | | | | | | | | |
Carrying amount as of 31 Dec. 2007 | | | 119 | | | | -50 | | | | 69 | |
| | | | | | | | | | | | | |
123
(47) Other assets
Analysis of Other Assets by Class
| | | | | | | | | | | | | |
| | | 31 Dec. 2008 | | 31 Dec. 2007 | | Change |
| | | EUR in | | EUR in | | EUR in |
| | | millions | | millions | | millions |
| Other assets and receivables | | | 704 | | | | 226 | | | | 478 | |
| Prepaid expenses and deferred charges | | | 1,125 | | | | 1,305 | | | | -180 | |
| Income tax assets | | | 247 | | | | 48 | | | | 199 | |
| | | | | | | | | | | | | |
Total | | | 2,077 | | | | 1,579 | | | | 497 | |
| | | | | | | | | | | | | |
Analysis of Income Tax Assets by Type
| | | | | | | | | | | | | |
| | | 31 Dec. 2008 | | 31 Dec. 2007 | | Change |
| | | EUR in | | EUR in | | EUR in |
| | | millions | | millions | | millions |
| Current income tax assets | | | 59 | | | | 13 | | | | 46 | |
| Deferred income tax assets | | | 188 | | | | 35 | | | | 152 | |
| | | | | | | | | | | | | |
Total | | | 247 | | | | 48 | | | | 199 | |
| | | | | | | | | | | | | |
The current income tax assets derive from deductible taxes (capital gains tax/solidarity surcharge) and tax receivables from advance tax payments during the reporting year.
Deferred income tax assets mostly result from valuation differences in risk provisions for loans and advances to banks and customers, the formation of provisions for personnel and the valuation of derivatives.
Analysis of Deferred Tax Assets by Balance Sheet Item
| | | | | | | | | | | | | |
| | | 31 Dec. 2008 | | 31 Dec. 2007 | | Change |
| | | EUR in | | EUR in | | EUR in |
| | | millions | | millions | | millions |
| Loans and advances to banks and customers | | | 75 | | | | 4 | | | | 71 | |
| Other derivatives (assets) | | | 11 | | | | 14 | | | | -3 | |
| Securities and investments | | | 11 | | | | 7 | | | | 4 | |
| Property, plant and equipment | | | 2 | | | | 2 | | | | 0 | |
| Intangible assets | | | 23 | | | | 0 | | | | 23 | |
| Liabilities to banks and customers | | | 5 | | | | 0 | | | | 5 | |
| Other derivatives (liabilities) | | | 37 | | | | 0 | | | | 37 | |
| Provisions | | | 18 | | | | 6 | | | | 12 | |
| Other balance sheet items | | | 4 | | | | 3 | | | | 1 | |
| Tax loss carryforwards | | | 2 | | | | 0 | | | | 2 | |
| | | | | | | | | | | | | |
Subtotal | | | 188 | | | | 36 | | | | 152 | |
| Offset against deferred tax liabilities | | | 0 | | | | -1 | | | | 1 | |
| | | | | | | | | | | | | |
Total | | | 188 | | | | 35 | | | | 153 | |
| | | | | | | | | | | | | |
124
The use of existing tax loss carryforwards for the taxable group companies is not sufficiently probable, with the result that it was only possible to carry deferred tax assets to a limited extent.
(48) Liabilities to banks
Analysis of Liabilities to Banks by Class
| | | | | | | | | | | | | |
| | | 31 Dec. 2008 | | 31 Dec. 2007 | | Change |
| | | EUR in | | EUR in | | EUR in |
| | | millions | | millions | | millions |
| Money-market transactions | | | 1,885 | | | | 455 | | | | 1,430 | |
| Promissory note loans | | | 5,968 | | | | 8,941 | | | | -2,973 | |
| Other liabilities | | | 3,936 | | | | 3,971 | | | | -35 | |
| | | | | | | | | | | | | |
Total | | | 11,788 | | | | 13,366 | | | | -1,578 | |
| | | | | | | | | | | | | |
Liabilities from the PROMISE and PROVIDE securitisation platforms are included in Other liabilities.
125
(49) Liabilities to customers
Analysis of Liabilities to Customers by Class
| | | | | | | | | | | | | |
| | | 31 Dec. 2008 | | 31 Dec. 2007 | | Change |
| | | EUR in | | EUR in | | EUR in |
| | | millions | | millions | | millions |
| Money-market transactions | | | 5,374 | | | | 4,217 | | | | 1,158 | |
| Promissory note loans | | | 12,092 | | | | 16,487 | | | | -4,394 | |
| Other liabilities | | | 13,839 | | | | 16,418 | | | | -2,579 | |
| | | | | | | | | | | | | |
Total | | | 31,306 | | | | 37,121 | | | | -5,815 | |
| | | | | | | | | | | | | |
Liabilities from the PROMISE and PROVIDE securitisation platforms are included in Other liabilities. Credit-linked notes issued in this connection are included under Promissory note loans.
(50) Certificated liabilities
Analysis of Certificated Liabilities by Class
| | | | | | | | | | | | | |
| | | 31 Dec. 2008 | | 31 Dec. 2007 | | Change |
| | | EUR in | | EUR in | | EUR in |
| | | millions | | millions | | millions |
| Money-market issues | | | 30,947 | | | | 18,878 | | | | 12,068 | |
| Bonds and notes | | | 271,612 | | | | 241,437 | | | | 30,175 | |
| | | | | | | | | | | | | |
Total | | | 302,559 | | | | 260,315 | | | | 42,244 | |
| | | | | | | | | | | | | |
(51) Value adjustments from macro fair value hedge accounting
| | | | | | | | | | | | | |
| | | 31 Dec. 2008 | | 31 Dec. 2007 | | Change |
| | | EUR in | | EUR in | | EUR in |
| | | millions | | millions | | millions |
| Value adjustments to liabilities under macro fair value hedge accounting | | | 13 | | | | -423 | | | | 436 | |
The fair values attributable to hedged risks in the hedged portfolios in the category “other liabilities” are included in this item.
126
(52) Derivatives used for hedge accounting
Analysis of Derivatives with Negative Fair Values Designated for Hedge Accounting by Type of Hedging Relationship
| | | | | | | | | | | | | |
| | | 31 Dec. 2008 | | 31 Dec. 2007 | | Change |
| | | EUR in | | EUR in | | EUR in |
| | | millions | | millions | | millions |
| Micro fair value hedge accounting | | | 3,745 | | | | 2,410 | | | | 1,335 | |
| Macro fair value hedge accounting | | | 7,251 | | | | 1,680 | | | | 5,571 | |
| | | | | | | | | | | | | |
Total | | | 10,997 | | | | 4,091 | | | | 6,906 | |
| | | | | | | | | | | | | |
Analysis of Derivatives with Negative Fair Values Designated for Hedge Accounting by Class
| | | | | | | | | | | | | |
| | | 31 Dec. 2008 | | 31 Dec. 2007 | | Change |
| | | EUR in | | EUR in | | EUR in |
| | | millions | | millions | | millions |
| Interest-related derivatives | | | 8,402 | | | | 3,340 | | | | 5,061 | |
| Currency-related derivatives | | | 2,595 | | | | 750 | | | | 1,845 | |
| | | | | | | | | | | | | |
Total | | | 10,997 | | | | 4,091 | | | | 6,906 | |
| | | | | | | | | | | | | |
Only interest-related derivatives are designated for macro fair value hedge accounting. Cross-currency swaps are reported under Currency-related derivatives.
(53) Other derivatives
Analysis of Other Derivatives with Negative Fair Values by Class
| | | | | | | | | | | | | |
| | | 31 Dec. 2008 | | 31 Dec. 2007 | | Change |
| | | EUR in | | EUR in | | EUR in |
| | | millions | | millions | | millions |
| Interest-related derivatives | | | 1,522 | | | | 1,153 | | | | 368 | |
| Currency-related derivatives | | | 17,410 | | | | 14,240 | | | | 3,170 | |
| Equity/index-related derivatives | | | 0 | | | | 35 | | | | -35 | |
| Credit derivatives | | | 158 | | | | 1,641 | | | | -1,483 | |
| Other derivatives | | | 14 | | | | 45 | | | | -31 | |
| | | | | | | | | | | | | |
Total | | | 19,104 | | | | 17,114 | | | | 1,991 | |
| | | | | | | | | | | | | |
Cross-currency swaps are presented under Currency-related derivatives.
127
(54) Provisions
Analysis of Provisions by Class
| | | | | | | | | | | | | |
| | | 31 Dec. 2008 | | 31 Dec. 2007 | | Change |
| | | EUR in | | EUR in | | EUR in |
| | | millions | | millions | | millions |
| Provisions for pensions and similar commitments | | | 965 | | | | 933 | | | | 33 | |
| Provisions for credit risks | | | 255 | | | | 530 | | | | -275 | |
| Other provisions | | | 508 | | | | 82 | | | | 426 | |
| | | | | | | | | | | | | |
Total | | | 1,728 | | | | 1,545 | | | | 183 | |
| | | | | | | | | | | | | |
Development in Provisions for Pensions and Similar Commitments in Financial Year 2008
| | | | | | | | | | | | | | | | | |
| | | Pension | | Early | | Partial | | |
| EUR in millions | | obligations | | retirement | | retirement | | Total |
As of 1 Jan. 2008 | | | 919 | | | | 4 | | | | 10 | | | | 933 | |
| Pension benefits paid | | | -32 | | | | -1 | | | | -2 | | | | -35 | |
| Additions | | | 64 | | | | 3 | | | | 1 | | | | 67 | |
Service cost | | | 15 | | | | 3 | | | | 1 | | | | 18 | |
Interest cost | | | 44 | | | | 0 | | | | 0 | | | | 44 | |
Contributions by plan participants | | | 5 | | | | 0 | | | | 0 | | | | 5 | |
| Reversals | | | 0 | | | | 0 | | | | 0 | | | | 0 | |
| | | | | | | | | | | | | | | | |
As of 31 Dec. 2008 | | | 951 | | | | 5 | | | | 9 | | | | 965 | |
| | | | | | | | | | | | | | | | |
The calculation of the pension entitlements which were vested as at the valuation reference date results in actuarial gains to be amortised of EUR 186 million (previous year: EUR 121 million).
The value of the pension commitments calculated based on the projected unit credit method was EUR 771 million (previous year: EUR 769 million) as at 31 December 2008.
128
Development in Provisions for Pensions and Similar Commitments in Financial Year 2007
| | | | | | | | | | | | | | | | | |
| | | Pension | | Early | | Partial | | |
| EUR in millions | | obligations | | retirement | | retirement | | Total |
As of 1 Jan. 2007 | | | 875 | | | | 3 | | | | 11 | | | | 889 | |
| Pension benefits paid | | | -30 | | | | -1 | | | | -2 | | | | -33 | |
| Additions | | | 74 | | | | 1 | | | | 1 | | | | 76 | |
Service cost | | | 27 | | | | 1 | | | | 1 | | | | 29 | |
Interest cost | | | 42 | | | | 0 | | | | 0 | | | | 42 | |
Contributions by plan participants | | | 5 | | | | 0 | | | | 0 | | | | 5 | |
| Reversals | | | 0 | | | | 0 | | | | 0 | | | | 0 | |
| | | | | | | | | | | | | | | | | |
As of 31 Dec. 2007 | | | 919 | | | | 4 | | | | 10 | | | | 933 | |
| | | | | | | | | | | | | | | | | |
The provisions for pensions and similar commitments are calculated on the basis of the 2005 G Heubeck actuarial tables and based on the following actuarial assumptions:
Actuarial Assumptions in % p.a.
| | | | | | | | | |
| | | 31 Dec. 2008 | | 31 Dec. 2007 |
| Technical discount rate | | | 5.70 | % | | | 5.50 | % |
| Rate of salary increases | | | 2.90 | % | | | 3.33 | % |
| Rate of pension increases | | | 2.30 | % | | | 2.30 | % |
Rate of staff turnover1 | | | 2.00 | % | | none |
Development in Other Provisions in Financial Year 2008
| | | | | | | | | | | | | | | | | |
| | | Obligations to | | Other | | | | | | Tax |
| EUR in millions | | employees | | provisions | | Total | | provisions |
As of 1 Jan. 2008 | | | 25 | | | | 57 | | | | 82 | | | | 5 | |
| Additions | | | 8 | | | | 460 | | | | 468 | | | | 3 | |
| Used amounts | | | -10 | | | | -32 | | | | -41 | | | | 0 | |
| Reversals | | | 0 | | | | -1 | | | | -1 | | | | -5 | |
| | | | | | | | | | | | | | | | | |
As of 31 Dec. 2008 | | | 24 | | | | 484 | | | | 508 | | | | 3 | |
| | | | | | | | | | | | | | | | | |
The obligations to employees show other long-term employee benefits including provisions for service anniversaries. Corresponding actuarial reports have been prepared for these obligations.
| | |
| 1 | | The rate of staff turnover is taken into account in the calculations in accordance with an age table. |
129
Development in Other Provisions in Financial Year 2007
| | | | | | | | | | | | | | | | | |
| | | Obligations to | | Other | | | | | | Tax |
| EUR in millions | | employees | | provisions | | Total | | provisions |
Balance as of 1 Jan. 2007 | | | 24 | | | | 18 | | | | 42 | | | | 10 | |
| Additions | | | 7 | | | | 56 | | | | 63 | | | | 5 | |
| Used amounts | | | -5 | | | | -16 | | | | -21 | | | | -6 | |
| Reversals | | | 0 | | | | 0 | | | | -1 | | | | -4 | |
| | | | | | | | | | | | | | | | | |
Balance as of 31 Dec. 2007 | | | 25 | | | | 57 | | | | 82 | | | | 5 | |
| | | | | | | | | | | | | | | | | |
130
(55) Other liabilities
Analysis of Other Liabilities by Class
| | | | | | | | | | | | | |
| | | 31 Dec. 2008 | | 31 Dec. 2007 | | Change |
| | | EUR in | | EUR in | | EUR in |
| | | millions | | millions | | millions |
| Other liabilities | | | 2,161 | | | | 2,123 | | | | 37 | |
| Deferred income | | | 48 | | | | 52 | | | | -4 | |
| Income tax liabilities | | | 55 | | | | 10 | | | | 45 | |
| | | | | | | | | | | | | |
Total | | | 2,264 | | | | 2,185 | | | | 79 | |
| | | | | | | | | | | | | |
Analysis of Income Tax Liabilities by Type
| | | | | | | | | | | | | |
| | | 31 Dec. 2008 | | 31 Dec. 2007 | | Change |
| | | EUR in | | EUR in | | EUR in |
| | | millions | | millions | | millions |
| Current income tax liabilities | | | 2 | | | | 6 | | | | -4 | |
| Deferred income tax liabilities | | | 53 | | | | 4 | | | | 49 | |
| | | | | | | | | | | | | |
Total | | | 55 | | | | 10 | | | | 45 | |
| | | | | | | | | | | | | |
The current income tax liabilities in the reporting year are the result of additions to tax provisions within the KfW Group.
Deferred tax liabilities are mostly due to differences in value resulting from valuing derivatives and securities and investments at fair value.
Analysis of Deferred Tax Liabilities by Balance Sheet Item
| | | | | | | | | | | | | |
| | | 31 Dec. 2008 | | 31 Dec. 2007 | | Change |
| | | EUR in | | EUR in | | EUR in |
| | | millions | | millions | | millions |
| Other derivatives (assets) | | | 37 | | | | 2 | | | | 35 | |
| Securities and investments | | | 15 | | | | 0 | | | | 15 | |
| Provisions | | | 0 | | | | 3 | | | | -3 | |
| Other balance sheet items | | | 1 | | | | 0 | | | | 1 | |
| | | | | | | | | | | | | |
Subtotal | | | 53 | | | | 5 | | | | 48 | |
| Offset against deferred tax assets | | | 0 | | | | -1 | | | | 1 | |
| | | | | | | | | | | | | |
Total | | | 53 | | | | 4 | | | | 49 | |
| | | | | | | | | | | | | |
131
(56) Subordinated liabilities
Analysis of Subordinated Liabilities by Class
| | | | | | | | | | | | | |
| | | 31 Dec. 2008 | | 31 Dec. 2007 | | Change |
| | | EUR in | | EUR in | | EUR in |
| | | millions | | millions | | millions |
| Subordinated liabilities | | | 3,247 | | | | 3,747 | | | | -500 | |
In relation to the acquisition of shares in Deutsche Telekom AG, Bonn, and Deutsche Post AG, Bonn, for the continuing privatisation of these companies, the Federal Government had granted KfW a subordinated loan of EUR 500 million. The loan, which carried an agreed interest rate of 3.9475% p.a. was repaid on schedule on 11 November 2008.
As part of the new legislation governing ERP economic promotion as at 1 July 2007, the ERP Special Fund provided a subordinated loan to KfW in the amount of EUR 3,247 million. The loan consists of three tranches with different fixed interest periods. The period during which capital is tied up in all tranches ends as at 31 December 2017. Interest is charged on the tranches at an initial rate of 4.5% per year.
132
(57) Equity
Analysis of Equity
| | | | | | | | | | | | | |
| | | 31 Dec. 2008 | | 31 Dec. 2007 | | Change |
| | | EUR in | | EUR in | | EUR in |
| | | millions | | millions | | millions |
| Subscribed capital | | | 3,750 | | | | 3,750 | | | | 0 | |
| less outstanding contributions, not requested | | | 450 | | | | 450 | | | | 0 | |
| | | | | | | | | | | | | |
Paid-in subscribed capital | | | 3,300 | | | | 3,300 | | | | 0 | |
| Capital reserve | | | 6,254 | | | | 6,254 | | | | 0 | |
Promotional reserves from the ERP Special Fund | | | 4,650 | | | | 4,650 | | | | 0 | |
| Reserve from the ERP Special Fund | | | 848 | | | | 804 | | | | 43 | |
| Retained earnings | | | 5,356 | | | | 5,862 | | | | -507 | |
Statutory reserve under Section 10 (2) KfW Law | | | 1,574 | | | | 1,574 | | | | 0 | |
Special reserve under Section 10 (3) KfW Law | | | 1,893 | | | | 1,893 | | | | 0 | |
Special reserve less the special loss account from provisioning pursuant to Section 17 (4) of the D- Mark Balance Sheet Law | | | 21 | | | | 21 | | | | 0 | |
Other retained earnings | | | 1,867 | | | | 2,374 | | | | -507 | |
| Fund for general banking risks | | | 50 | | | | 200 | | | | -150 | |
| Revaluation reserves | | | -551 | | | | -92 | | | | -460 | |
| Balance sheet profit/loss | | | -3,436 | | | | -1,393 | | | | -2,043 | |
| | | | | | | | | | | | | |
Total | | | 11,820 | | | | 14,936 | | | | -3,116 | |
| | | | | | | | | | | | | |
133
Equity forms the basis for the available financial resources which are matched against the economic capital requirements derived from internal steering.
For details, please refer to the risk report of the group management report.
Notes on financial instruments
(58) Gains and losses from financial instruments by valuation category
The following tables show an analysis of the results from financial instruments included in the various income statement items organised by valuation category. The result from foreign currency translation is not included.
134
Gains and Losses from Financial Instruments by Valuation Category in Financial Year 2008
| | | | | | | | | | | | | | | | | | | | | | | | | | | | | | | | | |
| | | | | | | | | | | | | | | | | | | Net | | | | | | |
| | | | | | | | | | | | | | | | | | | gains/losses | | Net | | | | |
| | | | | | | | | | | | | | | | | | | from other | | gains/losses | | | | |
| | | | | | | Risk | | | | | | Net | | financial | | from | | | | |
| | | | | | | provisions for | | Net | | gains/losses | | instruments at fair | | securities | | Net other | | |
| | | Net interest | | lending | | commission | | from hedge | | value through | | and | | operating | | |
| | | income | | business | | income | | accounting | | profit or loss | | investments | | income | | Total |
| | | EUR in | | EUR in | | EUR in | | EUR in | | EUR in | | EUR in | | EUR in | | EUR in |
| | | millions | | millions | | millions | | millions | | millions | | millions | | millions | | millions |
| Loans and receivables | | | 14,394 | | | | -2,139 | | | | 54 | | | | 6,751 | | | | | | | | -160 | | | | 1,530 | | | | 20,431 | |
| Held-to-maturity investments | | | 21 | | | | | | | | | | | | | | | | | | | | 0 | | | | | | | | 21 | |
| Other liabilities | | | -12,125 | | | | | | | | 0 | | | | -12,085 | | | | | | | | | | | | 21 | | | | -24,189 | |
| Available-for-sale financial assets | | | 1,607 | | | | | | | | 0 | | | | 730 | | | | | | | | -395 | | | | | | | | 1,942 | |
| Financial assets at fair value through profit or loss | | | 451 | | | | | | | | 219 | | | | | | | | -1,446 | | | | | | | | | | | | -776 | |
| Financial liabilities at fair value through profit or loss | | | -1,930 | | | | | | | | -166 | | | | | | | | -1,894 | | | | | | | | | | | | -3,990 | |
| Derivatives used for hedge accounting | | | 914 | | | | | | | | | | | | 4,295 | | | | | | | | | | | | | | | | 5,209 | |
| Other derivatives | | | -1,281 | | | | | | | | 9 | | | | | | | | 1,845 | | | | | | | | | | | | 573 | |
| | | | | | | | | | | | | | | | | | | | | | | | | | | | | | | | | |
Total | | | 2,051 | | | | -2,139 | | | | 116 | | | | -309 | | | | -1,495 | | | | -555 | | | | 1,551 | | | | -780 | |
| | | | | | | | | | | | | | | | | | | | | | | | | | | | | | | | | |
135
Gains and Losses from Financial Instruments by Valuation Category in Financial Year 2007
| | | | | | | | | | | | | | | | | | | | | | | | | | | | | | | | | |
| | | | | | | | | | | | | | | | | | | Net | | | | | | |
| | | | | | | | | | | | | | | | | | | gains/losses | | Net | | | | |
| | | | | | | | | | | | | | | | | | | from other | | gains/losses | | | | |
| | | | | | | Risk | | | | | | Net | | financial | | from | | | | |
| | | | | | | provisions for | | Net | | gains/losses | | instruments at fair | | securities | | Net other | | |
| | | Net interest | | lending | | commission | | from hedge | | value through | | and | | operating | | |
| | | income | | business | | income | | accounting | | profit or loss | | investments | | income | | Total |
| | | EUR in | | EUR in | | EUR in | | EUR in | | EUR in | | EUR in | | EUR in | | EUR in |
| | | millions | | millions | | millions | | millions | | millions | | millions | | millions | | millions |
| Loans and receivables | | | 13,199 | | | | -6,409 | | | | 42 | | | | -1,512 | | | | | | | | -18 | | | | 1,170 | | | | 6,472 | |
| Other liabilities | | | -11,359 | | | | | | | | 0 | | | | -161 | | | | | | | | | | | | -1 | | | | -11,521 | |
| Available-for-sale financial assets | | | 1,485 | | | | | | | | 0 | | | | -107 | | | | | | | | -48 | | | | | | | | 1,330 | |
| Financial assets at fair value through profit or loss | | | 419 | | | | | | | | 223 | | | | | | | | -237 | | | | | | | | | | | | 405 | |
| Financial liabilities at fair value through profit or loss | | | -2,473 | | | | | | | | -166 | | | | | | | | 624 | | | | | | | | | | | | -2,016 | |
| Derivatives used for hedge accounting | | | -484 | | | | | | | | | | | | 1,853 | | | | | | | | | | | | | | | | 1,369 | |
| Other derivatives | | | 1,008 | | | | | | | | 3 | | | | | | | | -2,237 | | | | | | | | | | | | -1,226 | |
| | | | | | | | | | | | | | | | | | | | | | | | | | | | | | | | | |
Total | | | 1,796 | | | | -6,409 | | | | 102 | | | | 73 | | | | -1,851 | | | | -67 | | | | 1,169 | | | | -5,186 | |
| | | | | | | | | | | | | | | | | | | | | | | | | | | | | | | | | |
136
(59) Balance sheet for financial instruments by valuation category
The following tables show the assets and liabilities from financial instruments included in the different balance sheet items organised by valuation category.
Financial Assets by Valuation Category as of 31 December 2008
| | | | | | | | | | | | | | | | | | | | | | | | | | | | | | | | | | | | | |
| | | | | | | | | | | | | | | Value adjustments | | | | | | | | |
| | | Loans and | | Loans and | | Risk provisions | | from macro | | Derivatives used | | | | | | |
| | | advances to | | advances to | | for lending | | fair value hedge | | for hedge | | Other | | Securities and | | Assets (financial |
| | | banks | | customers | | business | | accounting | | accounting | | derivatives | | investments | | instruments) |
| | | EUR in | | EUR in | | EUR in | | EUR in | | EUR in | | EUR in | | EUR in | | EUR in | | |
| | | millions | | millions | | millions | | millions | | millions | | millions | | millions | | millions | | (in %) |
| Loans and receivables | | | 222,878 | | | | 104,380 | | | | -7,604 | | | | 5,451 | | | | | | | | | | | | 5,290 | | | | 330,396 | | | | 84.3 | % |
| Held-to-maturity investments | | | | | | | | | | | | | | | | | | | | | | | | | | | 937 | | | | 937 | | | | 0.2 | % |
| Available-for-sale financial assets | | | 0 | | | | 0 | | | | | | | | | | | | | | | | | | | | 30,962 | | | | 30,962 | | | | 7.9 | % |
| Financial assets at fair value through profit or loss | | | 583 | | | | 64 | | | | | | | | | | | | | | | | | | | | 7,031 | | | | 7,678 | | | | 2.0 | % |
| Derivatives used for hedge accounting | | | | | | | | | | | | | | | | | | | 13,028 | | | | | | | | | | | | 13,028 | | | | 3.3 | % |
| Other derivatives | | | | | | | | | | | | | | | | | | | | | | | 8,709 | | | | | | | | 8,709 | | | | 2.2 | % |
| | | | | | | | | | | | | | | | | | | | | | | | | | | | | | | | | | | | | |
Total | | | 223,462 | | | | 104,444 | | | | -7,604 | | | | 5,451 | | | | 13,028 | | | | 8,709 | | | | 44,220 | | | | 391,710 | | | | 100.0 | % |
| | | | | | | | | | | | | | | | | | | | | | | | | | | | | | | | | | | | | |
137
Financial Liabilities by Valuation Category as of 31 December 2008
| | | | | | | | | | | | | | | | | | | | | | | | | | | | | | | | | | | | | | | | | |
| | | | | | | | | | | | | | | Value adjustments | | | | | | | | | | |
| | | | | | | | | | | | | | | from macro | | Derivatives used | | | | | | | | |
| | | Liabilities to | | Liabilities to | | Certificated | | fair value hedge | | for hedge | | Other | | Other | | Subordinated | | Liabilities (financial |
| | | banks | | customers | | liabilities | | accounting | | accounting | | derivatives | | liabilities | | liabilities | | instruments) |
| | | EUR in | | EUR in | | EUR in | | EUR in | | EUR in | | EUR in | | EUR in | | EUR in | | EUR in | | |
| | | millions | | millions | | millions | | millions | | millions | | millions | | millions | | millions | | millions | | (in %) |
| Other financial liabilities | | | 10,052 | | | | 24,758 | | | | 271,220 | | | | 13 | | | | | | | | | | | | 214 | | | | 3,247 | | | | 309,503 | | | | 81.6 | % |
| Financial liabilities at fair value through profit or loss | | | 1,736 | | | | 6,548 | | | | 31,339 | | | | | | | | | | | | | | | | | | | | 0 | | | | 39,623 | | | | 10.4 | % |
| Derivatives used for hedge accounting | | | | | | | | | | | | | | | | | | | 10,997 | | | | | | | | | | | | | | | | 10,997 | | | | 2.9 | % |
| Other derivatives | | | | | | | | | | | | | | | | | | | | | | | 19,104 | | | | | | | | | | | | 19,104 | | | | 5.0 | % |
| | | | | | | | | | | | | | | | | | | | | | | | | | | | | | | | | | | | | | | | | |
Total | | | 11,788 | | | | 31,306 | | | | 302,559 | | | | 13 | | | | 10,997 | | | | 19,104 | | | | 214 | | | | 3,247 | | | | 379,228 | | | | 100.00 | % |
| | | | | | | | | | | | | | | | | | | | | | | | | | | | | | | | | | | | | | | | | |
138
Financial Assets by Valuation Category as of 31 December 2007
| | | | | | | | | | | | | | | | | | | | | | | | | | | | | | | | | | | | | |
| | | | | | | | | | | | | | | Value adjustments | | | | | | | | |
| | | Loans and | | Loans and | | Risk provisions | | from macro | | Derivatives used | | | | | | |
| | | advances to | | advances to | | for lending | | fair value hedge | | for hedge | | Other | | Securities and | | Assets (financial |
| | | banks | | customers | | business | | accounting | | accounting | | derivatives | | investments | | instruments) |
| | | EUR in | | EUR in | | EUR in | | EUR in | | EUR in | | EUR in | | EUR in | | EUR in | | |
| | | millions | | millions | | millions | | millions | | millions | | millions | | millions | | millions | | (in %) |
| Loans and receivables | | | 204,685 | | | | 100,131 | | | | -7,671 | | | | -1,295 | | | | | | | | | | | | 2,022 | | | | 297,872 | | | | 84.8 | % |
| Available-for-sale financial assets | | | 0 | | | | 0 | | | | | | | | | | | | | | | | | | | | 34,243 | | | | 34,243 | | | | 9.7 | % |
| Financial assets at fair value through profit or loss | | | 1,053 | | | | 136 | | | | | | | | | | | | | | | | | | | | 9,271 | | | | 10,460 | | | | 3.0 | % |
| Derivatives used for hedge accounting | | | | | | | | | | | | | | | | | | | 5,570 | | | | | | | | | | | | 5,570 | | | | 1.6 | % |
| Other derivatives | | | | | | | | | | | | | | | | | | | | | | | 3,166 | | | | | | | | 3,166 | | | | 0.9 | % |
| | | | | | | | | | | | | | | | | | | | | | | | | | | | | | | | | | | | | |
Total | | | 205,738 | | | | 100,267 | | | | -7,671 | | | | -1,295 | | | | 5,570 | | | | 3,166 | | | | 45,536 | | | | 351,311 | | | | 100.00 | % |
| | | | | | | | | | | | | | | | | | | | | | | | | | | | | | | | | | | | | |
139
Financial Liabilities by Valuation Category as of 31 December 2007
| | | | | | | | | | | | | | | | | | | | | | | | | | | | | | | | | | | | | | | | | |
| | | | | | | | | | | | | | | Value adjustments | | | | | | | | | | |
| | | | | | | | | | | | | | | from macro | | Derivatives used | | | | | | | | |
| | | Liabilities to | | Liabilities to | | Certificated | | fair value hedge | | for hedge | | Other | | Other | | Subordinated | | Liabilities (financial |
| | | banks | | customers | | liabilities | | accounting | | accounting | | derivatives | | liabilities | | liabilities | | instruments) |
| | | EUR in | | EUR in | | EUR in | | EUR in | | EUR in | | EUR in | | EUR in | | EUR in | | EUR in | | |
| | | millions | | millions | | millions | | millions | | millions | | millions | | millions | | millions | | millions | | (in %) |
| Other financial liabilities | | | 12,141 | | | | 26,604 | | | | 226,906 | | | | -423 | | | | | | | | | | | | -10 | | | | 3,747 | | | | 268,964 | | | | 80.2 | % |
| Financial liabilities at fair value through profit or loss | | | 1,226 | | | | 10,518 | | | | 33,409 | | | | | | | | | | | | | | | | | | | | 0 | | | | 45,152 | | | | 13.5 | % |
| Derivatives used for hedge accounting | | | | | | | | | | | | | | | | | | | 4,091 | | | | | | | | | | | | | | | | 4,091 | | | | 1.2 | % |
| Other derivatives | | | | | | | | | | | | | | | | | | | | | | | 17,114 | | | | | | | | | | | | 17,114 | | | | 5.1 | % |
| | | | | | | | | | | | | | | | | | | | | | | | | | | | | | | | | | | | | | | | | |
Total | | | 13,366 | | | | 37,121 | | | | 260,315 | | | | -423 | | | | 4,091 | | | | 17,114 | | | | -10 | | | | 3,747 | | | | 335,320 | | | | 100.00 | % |
| | | | | | | | | | | | | | | | | | | | | | | | | | | | | | | | | | | | | | | | | |
140
(60) Disclosures on the reclassification of financial assets
With retroactive effect as of 1 July 2008, the KfW Group reclassified bonds and other fixed-income securities carried under Securities and investments (asset-backed securities) with a volume of EUR 2,750 million (fair value on the date of the retroactive reclassification) with anticipated interest and capital payments totalling EUR 2,856 million from the valuation category available-for-sale financial assets in the valuation category loans and receivables.
The changes in the fair value of the reclassified financial assets in the reporting period through to the date of the retroactive reclassification in the amount of EUR -55 million were recorded directly in equity in the revaluation reserve, which totalled EUR -106 million on the date of reclassification. The changes in fair value in the previous year that were recorded directly in equity in the revaluation reserve totalled EUR -54 million.
The following table shows the carrying amounts of the reclassified financial assets and their fair values.
| | | | | | | | | |
| | | Carrying amount | | |
| 31 Dec. 2008 | | (balance sheet) | | Fair value |
| EUR in millions | | | 2,450 | | | | 2,256 | |
For the reclassified financial assets a change of EUR -194 million in fair value directly in equity, as well as net gains/losses from securities and investments of EUR -60 million from financial assets would have been recorded.
The net gains/losses from securities and investments include realised gains and losses from the sale and impairment of reclassified financial assets totalling EUR -60 million. Interest income from the reclassified securities is still received unchanged.
141
(61) Disclosures on the valuation methods used for financial instruments carried at fair value
The following tables show the financial instruments carried at fair value according to the valuation methods used.
In the case of bonds and other fixed-income securities, for which no prices were available from active markets at the end of 2008 as a result of the general crisis of confidence in the financial markets, the fair value is determined using valuation models (DCF methods). For this purpose, the risk-free interest rate and the counterparty default risk were identified using market data that can currently be observed, whereas market liquidity was estimated on the basis of market data that can currently be observed for reference bonds. The estimates are continuously reassessed during the valuation processes. This relates to securities with a nominal volume of EUR 31.1 billion which are allocated to the category “Valuation methods based on market data that can be observed (model)”. Structured securities were not valuated on the basis of DCF methods.
Financial Assets Carried at Fair Value as of 31 Dec. 2008
| | | | | | | | | | | | | | | | | |
| | | | | | | Valuation method | | Valuation method | | |
| | | | | | | based on | | based on data that | | |
| | | | | | | observable | | were, in part, not | | |
| | | Quoted market | | market data | | observable on the | | |
| EUR in millions | | price | | (model) | | market | | Total |
| Loans and advances to banks – recorded at fair value through profit or loss | | | 172 | | | | 262 | | | | 150 | | | | 583 | |
| Loans and advances to customers – recorded at fair value through profit or loss | | | 0 | | | | 18 | | | | 46 | | | | 64 | |
| Derivatives used for hedge accounting | | | 0 | | | | 13,028 | | | | 0 | | | | 13,028 | |
| Other derivatives | | | 245 | | | | 8,321 | | | | 142 | | | | 8,709 | |
| Securities and investments – available for sale | | | 1,458 | | | | 29,007 | | | | 497 | | | | 30,962 | |
| Securities and investments – recorded at fair value through profit or loss | | | 3,085 | | | | 3,626 | | | | 320 | | | | 7,031 | |
142
Financial Liabilities Carried at Fair Value as of 31 Dec. 2008
| | | | | | | | | | | | | | | | | |
| | | | | | | | | | | Valuation method | | |
| | | | | | | Valuation | | based on data that | | |
| | | | | | | method based on | | were, in part, not | | |
| | | Quoted market | | observable | | observable on the | | |
| EUR in millions | | price | | market data | | market | | Total |
| Liabilities to banks – recorded at fair value through profit or loss | | | 75 | | | | 1,510 | | | | 152 | | | | 1,736 | |
| Liabilities to customers – recorded at fair value through profit or loss | | | 0 | | | | 6,545 | | | | 2 | | | | 6,548 | |
| Certificated liabilities – recorded at fair value through profit or loss | | | 516 | | | | 30,823 | | | | 0 | | | | 31,339 | |
| Derivatives used for hedge accounting | | | 0 | | | | 10,997 | | | | 0 | | | | 10,997 | |
| Other derivatives | | | 168 | | | | 18,916 | | | | 20 | | | | 19,104 | |
Financial Assets Carried at Fair Value as of 31 Dec. 2007
| | | | | | | | | | | | | | | | | |
| | | | | | | | | | | Valuation method | | |
| | | | | | | Valuation | | based on data that | | |
| | | | | | | method based on | | were, in part, not | | |
| | | Quoted market | | observable market | | observable on the | | |
| EUR in millions | | price | | data | | market | | Total |
| Loans and advances to banks – recorded at fair value through profit or loss | | | 310 | | | | 458 | | | | 285 | | | | 1,053 | |
| Loans and advances to customers – recorded at fair value through profit or loss | | | 0 | | | | 9 | | | | 127 | | | | 136 | |
| Derivatives used for hedge accounting | | | 0 | | | | 5,570 | | | | 0 | | | | 5,570 | |
| Other derivatives | | | 93 | | | | 3,025 | | | | 47 | | | | 3,166 | |
| Securities and investments – available for sale | | | 33,393 | | | | 394 | | | | 456 | | | | 34,243 | |
143
Financial Assets Carried at Fair Value as of 31 Dec. 2007
| | | | | | | | | | | | | | | | | |
| | | | | | | | | | | Valuation method | | |
| | | | | | | Valuation | | based on data that | | |
| | | | | | | method based on | | were, in part, not | | |
| | | Quoted market | | observable market | | observable on the | | |
| EUR in millions | | price | | data | | market | | Total |
| Securities and investments – recorded at fair value through profit or loss | | | 8,767 | | | | 268 | | | | 235 | | | | 9,271 | |
Financial Liabilities Carried at Fair Value as of 31 Dec. 2007
| | | | | | | | | | | | | | | | | |
| | | | | | | | | | | Valuation method | | |
| | | | | | | Valuation | | based on data that | | |
| | | | | | | method based on | | were, in part, not | | |
| | | Quoted market | | observable market | | observable on the | | |
| EUR in millions | | price | | data | | market | | Total |
| Liabilities to banks – recorded at fair value through profit or loss | | | 10 | | | | 930 | | | | 286 | | | | 1,226 | |
| Liabilities to customers – recorded at fair value through profit or loss | | | 0 | | | | 10,401 | | | | 117 | | | | 10,518 | |
| Certificated liabilities – recorded at fair value through profit or loss | | | 18,386 | | | | 15,023 | | | | 0 | | | | 33,409 | |
| Derivatives used for hedge accounting | | | 0 | | | | 4,091 | | | | 0 | | | | 4,091 | |
| Other derivatives | | | 106 | | | | 15,367 | | | | 1,641 | | | | 17,114 | |
144
(62) Fair values of financial instruments
In the following tables, the fair values of financial instruments are compared to their carrying amounts. Existing provisions for losses on loans and advances are deducted from the carrying amounts of loans and advances to banks and customers. The carrying amount of the subordinated liabilities comprises pro-rata interest and value adjustments from micro fair value hedge accounting reported in the item Other liabilities.
Fair Values of Financial Instruments as at 31 December 2008
| | | | | | | | | | | | | |
| | | | | | | Carrying | | |
| | | | | | | amount | | |
| EUR in millions | | Fair value | | (balance sheet) | | Difference |
| Loans and advances to banks | | | 226,709 | | | | 222,935 | | | | 3,773 | |
| Loans and advances to customers | | | 100,894 | | | | 97,366 | | | | 3,527 | |
| Value adjustments from macro fair value hedge accounting | | | — | | | | 5,451 | | | | -5,451 | |
| Derivatives used for hedge accounting | | | 13,028 | | | | 13,028 | | | | 0 | |
| Other derivatives | | | 8,709 | | | | 8,709 | | | | 0 | |
| Securities and investments | | | 43,603 | | | | 44,220 | | | | -617 | |
| | | | | | | | | | | | | |
Assets | | | 392,942 | | | | 391,710 | | | | 1,232 | |
| | | | | | | | | | | | | |
| | | | | | | | | | | | | |
| Liabilities to banks | | | 11,771 | | | | 11,788 | | | | -17 | |
| Liabilities to customers | | | 32,103 | | | | 31,306 | | | | 797 | |
| Certificated liabilities | | | 298,533 | | | | 302,559 | | | | -4,026 | |
| Value adjustments from macro fair value hedge accounting | | | — | | | | 13 | | | | -13 | |
| Derivatives used for hedge accounting | | | 10,997 | | | | 10,997 | | | | 0 | |
| Other derivatives | | | 19,104 | | | | 19,104 | | | | 0 | |
| Subordinated liabilities | | | 3,414 | | | | 3,461 | | | | -47 | |
| | | | | | | | | | | | | |
Liabilities | | | 375,921 | | | | 379,228 | | | | -3,307 | |
| | | | | | | | | | | | | |
Interest-related changes in value are also taken into consideration for calculating the fair value of the financial instruments. Accordingly, when the comparison is made with the carrying amount, it is necessary to take account of the (interest-related) changes in value resulting from the recognition of loans and advances and borrowings in macro fair value hedge accounting.
145
Fair Values of Financial Instruments as at 31 December 2007
| | | | | | | | | | | | | |
| | | | | | | Carrying | | |
| | | | | | | amount | | |
| EUR in millions | | Fair value | | (balance sheet) | | Difference |
| Loans and advances to banks | | | 204,041 | | | | 205,253 | | | | -1,212 | |
| Loans and advances to customers | | | 94,804 | | | | 93,081 | | | | 1,724 | |
| Value adjustments from macro fair value hedge accounting | | | — | | | | -1,295 | | | | 1,295 | |
| Derivatives used for hedge accounting | | | 5,570 | | | | 5,570 | | | | 0 | |
| Other derivatives | | | 3,166 | | | | 3,166 | | | | 0 | |
| Securities and investments | | | 45,484 | | | | 45,536 | | | | -52 | |
| | | | | | | | | | | | | |
Assets | | | 353,065 | | | | 351,311 | | | | 1,754 | |
| | | | | | | | | | | | | |
| | | | | | | | | | | | | |
| Liabilities to banks | | | 13,912 | | | | 13,366 | | | | 546 | |
| Liabilities to customers | | | 37,328 | | | | 37,121 | | | | 206 | |
| Certificated liabilities | | | 260,209 | | | | 260,315 | | | | -106 | |
| Value adjustments from macro fair value hedge accounting | | | — | | | | -423 | | | | 423 | |
| Derivatives used for hedge accounting | | | 4,091 | | | | 4,091 | | | | 0 | |
| Other derivatives | | | 17,114 | | | | 17,114 | | | | 0 | |
| Subordinated liabilities | | | 3,763 | | | | 3,736 | | | | 26 | |
| | | | | | | | | | | | | |
Liabilities | | | 336,415 | | | | 335,320 | | | | 1,095 | |
| | | | | | | | | | | | | |
146
(63) Additional disclosures on liabilities to banks
Disclosures on Liabilities to Banks Designated at Fair Value through Profit or Loss (Fair Value Option)
| | | | | | | | | | | | | |
| | | 31 Dec. 2008 | | 31 Dec. 2007 | | Change |
| | | EUR in | | EUR in | | EUR in |
| | | millions | | millions | | millions |
| Carrying amount | | | 269 | | | | 260 | | | | 9 | |
| Repayment at maturity | | | 1,424 | | | | 1,377 | | | | 47 | |
| | | | | | | | | | | | | |
Difference | | | 1,155 | | | | 1,117 | | | | 38 | |
| | | | | | | | | | | | | |
Of the difference between the repayment amount at maturity and the carrying amount, EUR 1,025 million (previous year: EUR 957 million) is attributable to borrowings for which the repayment amount builds up as a result of the capitalisation over time of interest due.
(64) Additional disclosures on liabilities to customers
Disclosures on Liabilities to Customers Designated at Fair Value through Profit or Loss (Fair Value Option)
| | | | | | | | | | | | | |
| | | 31 Dec. 2008 | | 31 Dec. 2007 | | Change |
| | | EUR in | | EUR in | | EUR in |
| | | millions | | millions | | millions |
| Carrying amount | | | 6,542 | | | | 10,397 | | | | -3,855 | |
| Repayment at maturity | | | 10,212 | | | | 11,470 | | | | -1,258 | |
| | | | | | | | | | | | | |
Difference | | | 3,670 | | | | 1,073 | | | | 2,597 | |
| | | | | | | | | | | | | |
Of the difference between the repayment amount at maturity and the carrying amount, EUR 2,736 million (previous year: EUR 921 million) is attributable to borrowings for which the repayment amount builds up as a result of the capitalisation over time of interest due.
147
(65) Additional disclosures on certificated liabilities
Disclosures on Certificated Liabilities Designated at Fair Value through Profit or Loss (Fair Value Option)
| | | | | | | | | | | | | |
| | | 31 Dec. 2008 | | 31 Dec. 2007 | | Change |
| | | EUR in | | EUR in | | EUR in |
| | | millions | | millions | | millions |
| Carrying amount | | | 31,339 | | | | 33,409 | | | | -2,070 | |
| Repayment at maturity | | | 49,558 | | | | 53,015 | | | | -3,457 | |
| | | | | | | | | | | | | |
Difference | | | 18,219 | | | | 19,606 | | | | -1,387 | |
| | | | | | | | | | | | | |
Of the difference between the repayment amount at maturity and the carrying amount, EUR 17,793 million (previous year: EUR 19,269 million) is attributable to borrowings for which the repayment amount builds up as a result of the capitalisation over time of interest due.
(66) Additional disclosures on derivatives
Analysis of Derivatives by Counterparty
| | | | | | | | | | | | | | | | | | | | | | | | | |
| | | | | | | | | | | Fair value | | Fair value |
| | | Nominal value | | 31 Dec. 2008 | | 31 Dec. 2007 |
| EUR in millions | | 31 Dec. 2008 | | 31 Dec. 2007 | | positive | | negative | | positive | | negative |
| OECD banks | | | 504,224 | | | | 427,549 | | | | 19,070 | | | | 27,436 | | | | 6,967 | | | | 18,913 | |
| Non-OECD banks | | | 62 | | | | 0 | | | | 0 | | | | 9 | | | | 0 | | | | 0 | |
| Other counterparties | | | 54,639 | | | | 75,150 | | | | 2,318 | | | | 2,655 | | | | 1,721 | | | | 2,212 | |
| Public sector | | | 582 | | | | 0 | | | | 291 | | | | 1 | | | | 0 | | | | 0 | |
| | | | | | | | | | | | | | | | | | | | | | | | | |
Total | | | 559,507 | | | | 502,698 | | | | 21,679 | | | | 30,101 | | | | 8,688 | | | | 21,125 | |
| | | | | | | | | | | | | | | | | | | | | | | | | |
The analysis includes stand-alone financial and credit derivatives which are presented in the items Derivatives used for hedge accounting and Other derivatives.
148
(67) Disclosures on repurchase agreements
Disclosures on Repo Transactions
| | | | | | | | | | | | | |
| | | 31 Dec. 2008 | | 31 Dec. 2007 | | Change |
| | | EUR in | | EUR in | | EUR in |
| | | millions | | millions | | millions |
| Carrying amount of securities sold under repo transactions that continue to be recognised in securities and investments | | | 316 | | | | 846 | | | | -531 | |
Liabilities to banks (countervalue) | | | 319 | | | | 838 | | | | -518 | |
The KfW Group does not have any collateral under repo transactions, which can be resold or repledged at any time, without the party furnishing security having defaulted.
In the previous year, the KfW Group received collateral under repo transactions, which can be resold or repledged at any time, without the party furnishing security having defaulted. The fair value of this collateral totalled EUR 17 million. The securities have been neither resold nor repledged.
Disclosures on Reverse Repo Transactions
| | | | | | | | | | | | | |
| | | 31 Dec. 2008 | | 31 Dec. 2007 | | Change |
| | | EUR in | | EUR in | | EUR in |
| | | millions | | millions | | millions |
| Loans and advances to banks (countervalue) | | | 7,052 | | | | 5,724 | | | | 1,328 | |
Securities purchased under reverse repos are not recognised.
The KfW Group has not pledged any collateral under reverse repos which can be resold or repledged at any time, without the party furnishing security having defaulted.
149
Other notes
(68) Contingent liabilities and irrevocable loan commitments
Analysis of Contingent Liabilities by Class
| | | | | | | | | | | | | |
| | | 31 Dec. 2008 | | 31 Dec. 2007 | | Change |
| | | EUR in | | EUR in | | EUR in |
| | | millions | | millions | | millions |
| Contingent liabilities from financial guarantees | | | 5,996 | | | | 5,850 | | | | 146 | |
| Performance guarantees | | | 55 | | | | 48 | | | | 7 | |
| Other contingent liabilities | | | 232 | | | | 156 | | | | 76 | |
| | | | | | | | | | | | | |
Total | | | 6,283 | | | | 6,054 | | | | 230 | |
| | | | | | | | | | | | | |
Other contingent liabilities include payment obligations attributable to investments which are not fully paid up and do not have to be consolidated.
Notional Amount of Irrevocable Loan Commitments
| | | | | | | | | | | | | |
| | | 31 Dec. 2008 | | 31 Dec. 2007 | | Change |
| | | EUR in | | EUR in | | EUR in |
| | | millions | | millions | | millions |
Irrevocable loan commitments | | | 35,390 | | | | 38,462 | | | | -3,072 | |
The irrevocable loan commitments are mainly attributable to domestic promotional lending business.
150
(69) Trust activities and administered loans
Analysis of Trust Activities by Class (Transactions in the Bank’s own Name but for Third Party Accounts)
| | | | | | | | | | | | | |
| | | 31 Dec. 2008 | | 31 Dec. 2007 | | Change |
| | | EUR in | | EUR in | | EUR in |
| | | millions | | millions | | millions |
| Loans and advances to banks | | | 2,054 | | | | 2,262 | | | | -208 | |
| Loans and advances to customers | | | 15,478 | | | | 16,178 | | | | -700 | |
| Securities and investments | | | 48 | | | | 42 | | | | 6 | |
| | | | | | | | | | | | | |
Assets held in trust | | | 17,580 | | | | 18,482 | | | | -902 | |
| Liabilities to banks | | | 98 | | | | 49 | | | | 48 | |
| Liabilities to customers | | | 17,483 | | | | 18,433 | | | | -950 | |
| | | | | | | | | | | | | |
Liabilities held in trust | | | 17,580 | | | | 18,482 | | | | -902 | |
EUR 15,232 million (previous year: EUR 15,956 million) of the assets held in trust are attributable to the promotion of developing and transition countries business area.
Notional Amount of Administered Loans Granted (Loans in the Name and for the Account of Third Parties)
| | | | | | | | | | | | | |
| | | 31 Dec. 2008 | | 31 Dec. 2007 | | Change |
| | | EUR in | | EUR in | | EUR in |
| | | millions | | millions | | millions |
Administered loans | | | 5,142 | | | | 4,280 | | | | 862 | |
151
(70) Leasing transactions as lessee
Disclosures on Lessee Agreements as at 31 December 2008
| | | | | | | | | | | | | | | | | |
| | | Due within | | Due in between one | | Due in more than | | |
| EUR in millions | | one year | | and five years | | five years | | Total |
Finance leases | | | | | | | | | | | | | | | | |
| Future minimum leasing payments | | | 6 | | | | 14 | | | | 0 | | | | 20 | |
| Unearned finance income after remaining maturities | | | 0 | | | | 1 | | | | 0 | | | | 1 | |
| Present value of future minimum leasing payments | | | 6 | | | | 14 | | | | 0 | | | | 20 | |
Operating leases | | | | | | | | | | | | | | | | |
| Future minimum leasing payments | | | 13 | | | | 16 | | | | 0 | | | | 29 | |
Disclosures on Lessee Agreements as at 31 December 2007
| | | | | | | | | | | | | | | | | |
| | | Due within | | Due in between one | | Due in more than | | |
| EUR in millions | | one year | | and five years | | five years | | Total |
Finance leases | | | | | | | | | | | | | | | | |
| Future minimum leasing payments | | | 4 | | | | 5 | | | | 0 | | | | 9 | |
| Present value of future minimum leasing payments | | | 4 | | | | 4 | | | | 0 | | | | 8 | |
Operating leases | | | | | | | | | | | | | | | | |
| Future minimum leasing payments | | | 12 | | | | 13 | | | | 0 | | | | 25 | |
152
(71) Average number of employees during the financial year
| | | | | | | | | | | | | |
| | | 2008 | | 2007 | | Change |
| Employees (female) | | | 2,076 | | | | 1,941 | | | | 135 | |
| Employees (male) | | | 2,152 | | | | 2,062 | | | | 90 | |
| | | | | | | | | | | | | |
Total | | | 4,228 | | | | 4,003 | | | | 225 | |
| | | | | | | | | | | | | |
Staff not covered by collective agreements | | | 2,858 | | | | 2,653 | | | | 205 | |
Staff covered by collective agreements | | | 1,370 | | | | 1,350 | | | | 20 | |
The average number of employees including temporary staff but without trainees is calculated based on the levels at the end of each quarter.
(72) Compensation and loans to members of the Managing Board and Board of Supervisory Directors of KfW
Compensation to Members of the Managing Board and Board of Supervisory Directors
| | | | | | | | | | | | | |
| | | 2008 | | 2007 | | Change |
| | | EUR in | | EUR in | | EUR in |
| | | thousands | | thousands | | thousands |
| Members of the Managing Board | | | 2,653 | | | | 2,935 | | | | -283 | |
| Members of the Board of Supervisory Directors | | | 218 | | | | 204 | | | | 14 | |
| Former members of the Managing Board and their surviving dependents | | | 3,617 | | | | 3,639 | | | | -22 | |
| | | | | | | | | | | | | |
Total | | | 6,487 | | | | 6,778 | | | | -291 | |
| | | | | | | | | | | | | |
The following table provides details on the compensation paid to the Managing Board in financial year 2008:
153
| | | | | | | | | | | | | |
| Annual compensation 2008 | | Monetary | | Other | | |
| EUR in thousands | | compensation | | compensation1) | | Total |
| |
| | | | | | | | | | | | | |
| Dr Ulrich Schröder (CEO) (since 1 Sept. 2008) | | | 239 | | | | 20 | | | | 259 | |
Dr Günther Bräunig 2) | | | 137 | | | | 3 | | | | 140 | |
| Dr Peter Fleischer (until 29 Sept. 2008) | | | 388 | | | | 26 | | | | 414 | |
| Dr Norbert Kloppenburg | | | 470 | | | | 44 | | | | 514 | |
| Wolfgang Kroh | | | 470 | | | | 20 | | | | 490 | |
| Detlef Leinberger (until 29 Sept. 2008) | | | 388 | | | | 27 | | | | 415 | |
| Ingrid Matthäus-Maier (until 30 Sept. 2008) | | | 388 | | | | 34 | | | | 422 | |
| |
| Total | | | 2,478 | | | | 175 | | | | 2,653 | |
| | |
| 1) | | Other compensation mostly comprises the use of company cars and insurance premiums and the taxes and social security payments on these amounts |
| |
| 2) | | Resumption of tasks as an active member of the Managing Board on 1 November 2008 |
The compensation to the members of the Board of Supervisory Directors is composed as follows:
Compensation for the Chairman of the Board of Supervisory Directors: EUR 13 thousand per year (previous year: EUR 13 thousand)
Compensation for the Deputy Chairman: EUR 10 thousand per year (previous year: EUR 10 thousand)
Compensation for the members of the Board of Supervisory Directors: EUR 5 thousand per year (previous year: EUR 5 thousand)
Compensation for membership of the Loan Approval, Executive and Audit Committees: EUR 0.6 thousand per year (previous year: EUR 0.6 thousand)
Members who join during the year receive their compensation on a pro-rata basis.
Provisions in the amount of EUR 41,052 thousand had been set up at the end of the financial year for pension obligations for former members of the Managing Board and their surviving dependents (previous year: EUR 41,311 thousand). The ongoing compensation totalled EUR 3,617 thousand.
The total amount of loans granted to members of the Managing Board was EUR 104 thousand as at year-end (previous year: EUR 187 thousand). Interest rates were between 2% p.a. and 5% p.a.
154
(73) Related party disclosures
The KfW Group’s related parties, in accordance with IAS 24, include as legal persons the consolidated subsidiaries, the non-consolidated affiliated entities, jointly controlled entities and associates.
Natural persons considered related parties in accordance with IAS 24 include the members of the Managing Board and the Directors of KfW (and their close family members), the members of the Board of Supervisory Directors of KfW, and the executive bodies of its consolidated subsidiaries.
KfW is a public law institution in which the Federal Republic of Germany (Federal Government) holds an 80% and the Federal States a 20% stake. Any transactions with the Federal Government and the Federal States in the reporting year are covered by the rules and regulations set forth in the KfW Law.
The business relationships between KfW and its affiliates and other related parties are primarily determined by the rules set out in the KfW Law. The conditions and prices are in line with standard market conditions and are concluded in accordance with KfW’s general conditions for its loan programs open to the general public.
155
(74) Auditor’s fees
| | | | | | | | | | | | | |
| | | 2008 | | 2007 | | Change |
| | | EUR in | | EUR in | | EUR in |
| | | thousands | | thousands | | thousands |
| Audit | | | 2,390 | | | | 1,718 | | | | 672 | |
| Other audit-related and valuation services | | | 1,569 | | | | 1,798 | | | | -229 | |
| Tax advisory services | | | 41 | | | | 5 | | | | 36 | |
| Other services | | | 2,014 | | | | 2,651 | | | | -637 | |
| | | | | | | | | | | | | |
Total | | | 6,014 | | | | 6,172 | | | | -158 | |
| | | | | | | | | | | | | |
(75) Disclosures on shareholdings
Subsidiaries Included in the Consolidated Financial Statements
| | | | | | | | | |
| | | | | | | Equity (IFRS, in EUR |
| | | Capital share | | millions) |
| Name/registered office | | (%) | | as at 31 Dec. 2008 |
| KfW IPEX-Bank GmbH, Frankfurt (www.kfw-ipex-bank.de) | | | 100 | | | | 2,670 | |
| KfW IPEX-Beteiligungsholding GmbH, Frankfurt | | | 100 | | | | 1,874 | |
| DEG — Deutsche Investitions- und Entwicklungsgesellschaft mbH, Cologne (www.deginvest.de) | | | 100 | | | | 1,583 | |
| tbg — Technologie-Beteiligungs-Gesellschaft mbH, Bonn | | | 100 | | | | 388 | |
| KfW Beteiligungsholding GmbH, Bonn | | | 100 | | | | 242 | |
| Finanzierungs- und Beratungsgesellschaft mbH, Berlin | | | 100 | | | | 32 | |
| KfW International Finance Inc., Delaware / USA | | | 100 | | | | 0 | |
KfW IPEX-Bank GmbH was included in the KfW Group for the first time after it was legally separated as of 1 January 2008. This separation is due to the understanding reached between the Federal Republic of Germany and the European Commission on the orientation of legally independent promotional banks in Germany and the German Promotional Bank Restructuring Act (Förderbankenneustrukturierungsgesetz). As a result, KfW contributed what had, until then, been a legally dependent part of its operations to a subsidiary. The separation included business activities in the export and project finance segment, which compete with other financial services companies.
156
Investments Included in the Consolidated Financial Statements Using The Equity Method
| | | | | | | | | |
| | | | | | | Equity (IFRS, in EUR |
| | | | | | | millions) |
| Name/registered office | | Capital share | | as at 31 Dec. 2008 |
| Movesta Lease and Finance GmbH, Düsseldorf | | | 50 | % | | | 16 | |
| Railpool Holding GmbH & Co. KG, Munich | | | 50 | % | | | -7 | |
Movesta Lease and Finance GmbH, Düsseldorf, operates in the field of leasing and the project development and management of real estate and infrastructure financing. Railpool Holding GmbH & Co. KG, Munich, covers all of the key elements in providing leasing for locomotives and other railway vehicles via various operating companies. Details of the areas of operation as well as a summary of financial information can be found on the respective company’s website (www.movesta.de or www.railpool.eu).
Special Funds Included in the Consolidated Financial Statements
| | | | | | | | | |
| | | | | | | Fund volume in EUR |
| | | | | | | millions as at 31 Dec. |
| Name | | Capital share | | 2008 |
| Frankfurt I | | | 100 | % | | | 1,168 | |
| Frankfurt II | | | 100 | % | | | 1,497 | |
| Atlantik | | | 100 | % | | | 523 | |
| München I | | | 100 | % | | | 1,053 | |
| München II | | | 100 | % | | | 1,144 | |
| Cologne | | | 100 | % | | | 288 | |
The investments held in the special security funds are mostly part of KfW Group’s strategic asset management. In connection with the IKB sale, KfW acquired portfolio investments from IKB in the form of structured securities and credit derivatives. These were contributed, in part, to the newly established Cologne special fund.
Affiliated entities not included in the consolidated financial statements
Six affiliated entities, eight associates, and four jointly controlled entities of minor significance to the presentation of the net assets, financial position and profit or loss of the KfW Group have not been consolidated; instead, they are shown in the balance sheet under Securities and investments or Loans and advances to customers and are measured in accordance with the relevant rules. These companies account for 0.1% of KfW Group’s balance sheet total.
157
As part of the risk protection for IKB, KfW has made liquidity lines available to various special purpose entities of the “Rhineland Funding Capital Corporation, New York/USA” conduit. These lines were drawn down successively through to 28 January 2008. The provision of the liquidity lines has not resulted in any obligation for KfW to consolidate the special purpose entities because KfW did not exercise any control over the SPEs within the meaning of SIC 12. KfW did not obtain any power of disposal over the SPEs or over the assets in the SPEs by providing the liquidity lines. The restructuring of the “Rhineland Funding Capital Corporation, New York/USA” conduit that had been scheduled for financial year 2008 did not take place as a result of the large number of contractual partners who had to agree thereto. KfW continued to serve solely as provider of debt capital for the conduit and did not possess any decision-making powers over the assets of the SPEs or over the SPEs themselves.
A full listing of shareholdings has been published in the electronic Federal Gazette (Bundesanzeiger).
158
AUDITOR’S REPORT REPRINT
Based on the final results of our audit we issued the following unqualified auditor’s report dated 9 March 2009:
“Auditor’s Report
We have audited the consolidated financial statements prepared by KfW, Frankfurt am Main, comprising the balance sheet, the income statement, statement of changes in equity, cash flow statement and the notes to the consolidated financial statements, together with the group management report for the business year from 1 January to 31 December 2008. The preparation of the consolidated financial statements and the group management report in accordance with the IFRSs, as adopted by the EU, and the additional requirements of German commercial law pursuant to § (Article) 315a Abs. (paragraph) 1 HGB (“Handelsgesetzbuch”: German Commercial Code) and supplementary provisions of the Law concerning KfW (KfW Law) and By-Laws of KfW are the responsibility of the KfW’s Managing Board. Our responsibility is to express an opinion on the consolidated financial statements and on the group management report based on our audit.
We conducted our audit of the consolidated financial statements in accordance with § 317 HGB and German generally accepted standards for the audit of financial statements promulgated by the Institut der Wirtschaftsprüfer (Institute of Public Auditors in Germany) (IDW). Those standards require that we plan and perform the audit such that misstatements materially affecting the presentation of the net assets, financial position and results of operations in the consolidated financial statements in accordance with the applicable financial reporting framework and in the group management report are detected with reasonable assurance. Knowledge of the business activities and the economic and legal environment of the Group and expectations as to possible misstatements are taken into account in the determination of audit procedures. The effectiveness of the accounting-related internal control system and the evidence supporting the disclosures in the consolidated financial statements and the group management report are examined primarily on a test basis within the framework of the audit. The audit includes assessing the annual financial statements of those entities included in consolidation, the determination of the entities to be included in consolidation, the accounting and consolidation principles used and significant estimates made by the Company’s Managing Board, as well as evaluating the overall presentation of the consolidated financial statements and the group management report. We believe that our audit provides a reasonable basis for our opinion.
Our audit has not led to any reservations.
159
In our opinion based on the findings of our audit the consolidated financial statements comply with the IFRSs as adopted by the EU and the additional requirements of German commercial law pursuant to § 315a Abs. 1 HGB and supplementary provisions of the KfW Law and By-Laws of KfW and give a true and fair view of the net assets, financial position and results of operations of the KfW Group in accordance with these requirements. The group management report is consistent with the consolidated financial statements and as a whole provides a suitable view of the Group’s position and suitably presents the opportunities and risks of future development.”
Frankfurt am Main, 9 March 2009
PricewaterhouseCoopers
Aktiengesellschaft
Wirtschaftsprüfungsgesellschaft
| | | |
| Christoph Theobald | | Peter Flick |
| Wirtschaftsprüfer | | Wirtschaftsprüfer |
| |
| (German Public Auditor) | | (German Public Auditor) |
160
THE FEDERAL REPUBLIC OF GERMANY
GENERAL
Area, Location and Population
The Federal Republic is situated in central Europe and comprises an area of 357,114 km2 (about 138,000 square miles). Its total population was in the range of 82.2 million in 2007. Approximately 16% of the total population is concentrated in metropolitan areas with more than 500,000 inhabitants; the largest of these areas are (in descending order) Berlin, Hamburg, Munich, Cologne, Frankfurt am Main, Stuttgart, Dortmund, Essen, Dusseldorf and Bremen.
Source: Statistisches Bundesamt, Statistisches Jahrbuch 2008, Tables 2.1.1, 2.4, 2.5, and 2.6.
Government
The Federal Republic is a federated republic whose constitution is codified in the Grundgesetz of 1949. The capital of the Federal Republic is Berlin. The Federal Republic consists of 16 federal states (Länder). The Länder have legislative sovereignty over matters not expressly reserved to the legislative, executive and judicial bodies of the Federal Republic.
The Grundgesetz provides for a Federal President (Bundespräsident), two Houses of Parliament (the Bundestag and the Bundesrat, which consists of representatives of the 16 Länder governments), a Chancellor (Bundeskanzler) and a Federal Constitutional Court (Bundesverfassungsgericht). The Chancellor heads the Federal Government (Bundesregierung), consisting of the Chancellor and the Federal Ministers. The Bundespräsident acts as head of state.
General elections for the Bundestag are generally held every four years on the basis of an electoral system of proportional representation. The last general election was held on September 18, 2005. The next general election is scheduled for September 27, 2009.
A political party is not entitled to party representation in the Bundestag unless it receives at least 5% of the votes cast or three direct mandates in a general election. The Chancellor is elected by and is responsible to the Bundestag.
Political Parties
The political parties currently represented in the Bundestag are the Christian Democratic Union (CDU) and its Bavarian sister party, the Christian Social Union (CSU), the Social Democratic Party (SPD), the Free Democratic Party (FDP), the Left-Wing Party (Die Linke., founded in 2007 by the merger of the Left-Wing Party of Democratic Socialism (Linkspartei.PDS) and the party Labor and Social Justice – The Election Alternative (WASG)), and the Greens (Bündnis 90/Die Grünen).
Since 1949, the Federal Republic has been governed by eight Chancellors over 16 electoral periods. The last general elections in September 2005 resulted in a “grand coalition” between the two largest political blocs, the Christian Democrats (CDU/CSU) and the Social Democrats (SPD), led by Chancellor Angela Merkel (CDU).
G-1
The following table shows the results of the five most recent general elections for the Bundestag.
| | | | | | | | | | | | | | | | | | | | | | | | | | | | | | | | | | | | | | | | | |
| | | 2005 | | 2002 | | 1998 | | 1994 | | 1990 |
| | | Elections | | Elections | | Elections | | Elections | | Elections (1) |
| | | % of | | | | | | % of | | | | | | % of | | | | | | % of | | | | | | % of | | |
| | | Votes | | Seats | | Votes | | Seats | | Votes | | Seats | | Votes | | Seats | | Votes | | Seats |
| | | |
| CDU/CSU | | | 35.2 | | | | 226 | | | | 38.5 | | | | 248 | | | | 35.1 | | | | 245 | | | | 41.4 | | | | 294 | | | | 43.8 | | | | 319 | |
| SPD | | | 34.2 | | | | 222 | | | | 38.5 | | | | 251 | | | | 40.9 | | | | 298 | | | | 36.4 | | | | 252 | | | | 33.5 | | | | 239 | |
| FDP | | | 9.8 | | | | 61 | | | | 7.4 | | | | 47 | | | | 6.2 | | | | 43 | | | | 6.9 | | | | 47 | | | | 11.0 | | | | 79 | |
Die Linke. (2) | | | 8.7 | | | | 54 | | | | 4.0 | | | | 2 | | | | 5.1 | | | | 36 | | | | 4.4 | | | | 30 | | | | 2.4 | | | | 17 | |
Bündnis 90/Die Grünen (3) | | | 8.1 | | | | 51 | | | | 8.6 | | | | 55 | | | | 6.7 | | | | 47 | | | | 7.3 | | | | 49 | | | | 5.0 | | | | 8 | |
| Others | | | 3.9 | | | | — | | | | 3.0 | | | | — | | | | 5.9 | | | | — | | | | 3.6 | | | | — | | | | 4.2 | | | | — | |
| | | | | | | | | | | | | | | | | | | | | | | | | | | | | | | | | | | | | | | | | |
Total | | | | | | | 614 | | | | | | | | 603 | | | | | | | | 669 | | | | | | | | 672 | | | | | | | | 662 | |
| | | | | | | | | | | | | | | | | | | | | | | | | | | | | | | | | | | | | | | | | |
| | |
| (1) | | In 1990, Bündnis 90 (East German Grüne) and the PDS were represented in the Bundestag pursuant to special provisions in the Treaty on Unity, relating to the political parties of the eastern Länder. |
| |
| (2) | | Results for the PDS for all elections prior to 2005. |
| |
| (3) | | Includes the results for the West German Grüne party and of Bündnis 90 (East German Grüne) for 1990; includes the results for the combined Bündnis 90/Grüne for 1994 and all subsequent periods. |
Sources: Statistisches Bundesamt, Statistisches Jahrbuch 2005, Tables 4.3 and 4.6; Statistisches Bundesamt, Statistisches Jahrbuch 2008, Tables 4.3 and 4.6.
International Organizations
In addition to the European Union (“EU”), the Federal Republic is a member of various major multilateral institutions, including the United Nations, the International Monetary Fund, the International Bank for Reconstruction and Development and the International Development Association (“World Bank”), the Council of Europe, the Organization for Economic Cooperation and Development (“OECD”), the West European Union (“WEU”), and the North Atlantic Treaty Organization (“NATO”). In addition, the Federal Republic is a signatory to the General Agreement on Tariffs and Trade (“GATT”) and a member of the World Trade Organization (“WTO”). It is also a shareholder of, among others, the European Investment Bank, the European Bank for Reconstruction and Development, and the European Atomic Energy Community.
The European Union and European Integration
The Federal Republic was a founding member of the European Coal and Steel Community (“ECSC”) in 1951, which later developed into the European Union. Today, the Federal Republic is one of 27 member states of the EU (the “Member States”). On May 1, 2004, ten new countries – Cyprus, the Czech Republic, Estonia, Hungary, Latvia, Lithuania, Malta, Poland, Slovakia and Slovenia – became part of the EU, joining its previous members Austria, Belgium, Denmark, Finland, France, Germany, Greece, Ireland, Italy, Luxembourg, the Netherlands, Portugal, Spain, Sweden and the United Kingdom. On January 1, 2007, two additional countries – Bulgaria and Romania – joined the EU. The aggregate population of the Member States is now approximately 497 million. Accession negotiations with Turkey and Croatia started in October 2005. Furthermore, in December 2005, the European Council decided to grant candidate status to the Former Yugoslav Republic of Macedonia.
Sources: Europa.eu, The history of the European Union (http://europa.eu/abc/history/index_en.htm); Europa.eu, 2000-today: A decade of further expansion, The history of the European Union (http://europa.eu/abc/history/2000_today/index_en.htm); Statistical Office of the European Communities, First demographic estimates for 2008, Data in focus 49/2008 (http://epp.eurostat.ec.europa.eu/cache/ITY_OFFPUB/KS-QA-08-049/EN/KS-QA-08-049-EN.PDF); Europa.eu, Enlargement strategy 2007-2008: Summary (http://europa.eu/scadplus/leg/en/lvb/e50027.htm); Enlargement process: Consolidation, Conditions, Communication. Roadmap for the Western Balkans (2005) (http://europa.eu/scadplus/leg/en/lvb/e50021.htm#ROADMAP).
G-2
Economic Integration
From its inception, the EU has had the fundamental objective, like its predecessors, of economic integration of its Member States.Culminating a long process, a single market that provides for the free movement of goods and services, persons and capital among the Member States was established as of January 1, 1993. The integration of the Member States’ economies and the completion of a single market are also promoted by a European competition policy, which aims at creating a level playing field for Member States’ companies, and promoting economic efficiency, and a European consumer policy. In addition, various liberalization and harmonization measures are being implemented, for example in the telecommunications and energy sectors. In the financial sector, the single market has been fostered by providing for the free movement of capital and the freedom to perform banking services throughout the EU under the “European Passport”, which enables financial institutions to provide financial services throughout the common market based on a single license obtained in one Member State. Another important policy area for the EU has been agriculture. Subsidies to this sector make up more than 40% of the EU’s budget. The EU also promotes economic integration with regional aid, which is designed to focus development efforts on certain disadvantaged regions and sections of population of the EU.
The financial framework for the enlarged EU for the period from 2007 until 2013 was formally adopted on May 17, 2006, with an Inter-institutional Agreement (“IIA”) signed by the European Parliament (the “Parliament”), the Council of the European Union (the “Council”) and the European Commission. Among other things, the IIA defines maximum amounts for commitment appropriations, which cover legal commitments made to spend funds over one or more years in certain expenditure categories. Additionally, the IIA defines an annual maximum amount for payment appropriations, which cover payments made to honor the legal commitments entered into during the current financial year and/or earlier financial years. The 2009 EU budget, which was adopted by the Parliament on December 18, 2008, amounts to EUR 133.8 billion in commitment appropriations and EUR 116.1 billion in payment appropriations. The amount of commitment appropriations corresponds to 1.03% of the EU gross national income, while the amount of payment appropriations corresponds to 0.89% of the EU gross national income.
Sources: Europa.eu, The EU at a Glance (http://europa.eu/abc/index_en.htm); Europa.eu, Europe in 12 lessons (http://europa.eu/abc/12lessons/index_en.htm); Europa.eu, What does the EU do? (http://europa.eu/abc/12lessons/lesson_5/index_en.htm); Europe.eu, The single market (http://europa.eu/abc/12lessons/lesson_6/index_en.htm), European Commission, A Financial Framework for the enlarged Union (2007-2013), Financial Programming and Budget (http://ec.europa.eu/budget/prior_future/fin_framework_en.htm); Official Journal of the European Union, Interinstitutional Agreement between the European Parliament, the Council and the Commission on budgetary discipline and sound financial management (2006/C 139/01) (http://eur-lex.europa.eu/LexUriServ/site/en/oj/2006/c_139/c_13920060614en00010017.pdf); European Commission, The current year, Financial Programming and Budget (http://ec.europa.eu/budget/budget_detail/current_year_en.htm).
Monetary Integration
The Federal Republic is a signatory to and has ratified the Treaty on European Union of February 1992 (also known as the “Maastricht Treaty”). The Maastricht Treaty was the basis for the establishment of the European Economic and Monetary Union (“EMU”). The EMU led, in turn, to the adoption of irrevocable conversion rates between the euro and the national currencies of the initial participating Member States on December 31, 1998 and the introduction of the euro as the single European currency in the “euro area” on January 1, 1999. On January 1, 2002, banknotes and coins denominated in euro were introduced as legal tender to replace the national currencies in the 12 Member States forming the euro area at that time (Austria, Belgium, Finland, France, Germany, Greece, Ireland, Italy, Luxembourg, the Netherlands, Portugal and Spain). Slovenia joined the euro area as the thirteenth Member State on January 1, 2007; and Malta and Cyprus followed on January 1, 2008. On January 1, 2009, Slovakia adopted the euro as legal tender. The EMU thus currently comprises 16 Member States.
The European Central Bank (“ECB”) was established on June 1, 1998, as part of the European System of Central Banks (“ESCB”). According to the Maastricht Treaty, the primary objective of the ESCB is to maintain price stability. Without prejudice to the objective of price stability, the ESCB supports the general economic policies of the EU. See “Monetary and Financial System” for more information on the ECB and ESCB. The Eurosystem, consisting of the ECB and the national central banks of those Member States whose currency is the euro, assumed sole responsibility for the monetary policy in the euro area on January 1, 1999.
Sources: Europa.eu, The History of the European Union: 2009 (http://europa.eu/abc/history/2000_today/2009/index_en.htm); Europa.eu, The History of the European Union: 2008 (http://europa.eu/abc/history/2000_today/2008/index_en.htm); Europa.eu, The History of the European Union: 2007 (http://europa.eu/abc/history/2000_today/2007/index_en.htm); Europa.eu, The History of the European Union: 2002 (http://europa.eu/abc/history/2000_today/2002/index_en.htm); Europa.eu, The History of the European Union: 1999 (http://europa.eu/abc/history/1990-1999/1999/index_en.htm); Europa.eu, The History of the European Union: 1998 (http://europa.eu/abc/history/1990-1999/1998/index_en.htm).
G-3
To ensure continuous budgetary discipline in the EMU, the Member States agreed on the main elements of a Stability and Growth Pact (the “Pact”) in 1996. According to the Pact, which was slightly modified in 2005, Member States must pursue a medium-term objective of ensuring the long-term sustainability of public finances and minimizing the risk of any Member State’s government deficit exceeding the reference value of 3% of its gross domestic product (“GDP”) under the Maastricht Treaty.
Under the Maastricht Treaty, implementing regulations and the Pact, a Member State whose general government deficit exceeds the reference value of 3% of its GDP becomes subject to the Excessive Deficit Procedure (“EDP”). The EDP provides that the Economic and Finance Affairs Council (the “Ecofin Council”) decides whether an excessive deficit has been incurred. The Ecofin Council is a meeting of the Council composed of Economics and Finance Ministers of the Member States. If it concludes that there is an excessive deficit, the Ecofin Council, based on recommendations by the European Commission, suggests corrective measures aimed at a deficit reduction and then reviews the corrective measures taken by the Member State. If it determines that such corrective measures are not adequate, the Maastricht Treaty and the Pact provide for a wide range of remedies. For those Member States whose currency is the euro, this process could ultimately lead to the imposition of annual financial penalties of as much as 0.5% of a Member State’s GDP. Financial penalties may not be imposed, however, until the end of a further review period. Furthermore, the Pact provides that the 3% limit may be exceeded without triggering an EDP provided that the deficit is considered to be exceptional and temporary, for example, in the event of a severe economic downturn (i.e., a recession), a longer period of weak growth or an unusual event outside the control of the Member State concerned (e.g., a significant natural disaster or a war having an impact on that Member State) and the deficit ratio remains close to the 3% threshold.
Moreover, in judging whether a deficit is excessive and whether a Member State must implement corrective measures, the Ecofin Council relies on an indicative list of relevant factors that has been agreed upon by the Member States. This list includes, among other factors, the costs of implementing policies according to the Lisbon Agenda, which outlines the EU’s strategy for economic, social and environmental renewal until 2010; high financial contributions aimed at fostering international solidarity and achieving European policy goals, notably European unification; and costs of pension reform.
Due to the ongoing financial crisis and the severe worldwide economic downturn, some Member States (including Spain, France, Ireland, Greece, Malta, Latvia, and the United Kingdom) have already breached the 3% of GDP deficit reference value in 2008. In 2009, the general government deficits of additional Member States are expected to exceed the deficit reference value. According to the addendum to the update of the German stability program submitted to the European Commission in January 2009, Germany is not expected to breach the deficit reference value until 2010. This view was confirmed in the EDP notification table submitted to the European Commission by the Federal Republic in April 2009, according to which the deficit in 2009 is expected to equal 2.9% of nominal GDP. The European Commission is, however, more pessimistic with respect to the short-term prospects of Germany’s public finances. In its regular spring forecast published in early May 2009, the European Commission predicts that Germany’s general government deficit will increase to nearly 4% of GDP in 2009, with a further increase to almost 6% of GDP in 2010.
Notwithstanding the severity of the global economic downturn, in some cases an EDP may nevertheless be initiated, as the Ecofin Council has reinforced its commitment to sound and sustainable public finances. On the other hand, the Ecofin Council has indicated that it intends to take full advantage of the flexibility provided under the Pact and to consider both the impact of the downturn and the fiscal measures taken in response to it. Financial penalties may be imposed if the Member State concerned does not comply with the decisions taken in the EDP to reduce any excessive deficit on its part. For further information on the German deficit, see “Public Finance – Germany’s General Government Deficit/Surplus and the Stability Program.”
Sources: European Council, Dublin European Council 13 and 14 December 1996 Presidency Conclusions (http://europa.eu/rapid/pressReleasesAction.do?reference=DOC/96/8&format=HTML&aged=1&language=EN&gui Language=en); Treaty Establishing the European Community, Article 104 (http://europa.eu/eur-lex/en/treaties/selected/livre223.html#anArt6); Treaty Establishing the European Community, Protocols (http://europa.eu/eur-lex/en/treaties/selected/livre335.html); European Council, Council Regulation (EC) No 1466/97 (http://eur-lex.europa.eu/LexUriServ/site/en/consleg/1997/R/01997R1466-20050727-en.pdf); European Council, Council Regulation (EC) No 1467/97 (http://eurlex.europa.eu/LexUriServ/site/en/consleg/1997/R/01997R1467-20050727-en.pdf); European Commission, Stability and Growth Pact, Economic and Financial Affairs (http://ec.europa.eu/economy_finance/sg_pact_fiscal_policy/fiscal_policy554_en.htm); European Commission, Stability and Growth Pact: Country-specific procedures, Economic and Financial Affairs (http://ec.europa.eu/economy_finance/sg_pact_fiscal_policy/excessive_deficit9109_en.htm); European Commission, Commission assesses Stability and Convergence Programmes of Ireland, Greece, Spain, France,
G-4
Latvia and Malta
(http://europa.eu/rapid/pressReleasesAction.do?reference=IP/09/274&format =HTML&aged=0&language=EN&guiLanguage=en); European Council, Press Release 2919th Council meeting, Economic and Financial Affairs, Brussels, 20 January 2009 (http://www.consilium.europa.eu/uedocs/cms_data/docs/pressdata/en/ecofin/105390.pdf); Bundesministerium der Finanzen, Addendum to the Update of the German Stability Programme (http://ec.europa.eu/economy_finance/publications/publication13915_en.pdf); Eurostat, Government Finance Statistics, EDP Notification Tables, Germany, Reporting of Government Deficits and Debt Levels, Reporting before 1 April 2009 (http://epp.eurostat.ec.europa.eu/portal/page/portal/government_finance_statistics/documents/DE_2009-04.pdf); European Commission, Directorate-General for Economic and Financial Affairs, Economic Forecast, Spring 2009, pp. 58-60 (http://ec.europa.eu/economy_finance/publications/publication15048_en.pdf).
Political Integration
The EU’s three main institutions are the Council (representing the governments of the Member States), the Parliament (elected by and representing the citizens of the Member States) and the European Commission (the executive body of the EU). In order to ensure that the decision-making process within the EU’s institutions continues to work effectively, the European Convention was formed in 2001. Its goal was to draft a European constitution which sets out the powers and responsibilities of the institutions and the decision-making process, thus enabling the EU to cope with its main challenges in the mid-term future, the enlargement of the EU and the increased involvement of EU citizens by introducing more democracy and transparency into the governance of the EU. The European constitution was signed by the heads of state and government and the foreign ministers in October 2004; it was required to be ratified by all Member States as a precondition to its entry into force. After the failure of referendums held in France and the Netherlands for ratification, the European Council in June 2005 decided to enter a period of reflection on the process of reforming the EU institutions. In June 2007, the European Council decided to convene an Intergovernmental Conference to draft a new EU treaty. The treaty, which was signed by the heads of state and government and the foreign ministers in Lisbon on December 13, 2007 (the “Treaty of Lisbon”), largely reflects the institutional reforms embodied in the Constitution, while modifying or leaving out certain controversial topics. As of early May 2009, most Member States had ratified the Treaty of Lisbon. Ireland’s referendum failed in June 2008. Ireland has agreed to hold a second referendum in 2009, once the concerns of Irish voters have been addressed. In Germany, Poland and the Czech Republic, the instrument of ratification still has to be signed by the president.
Sources: Europa.eu, How does the EU work?, Europe in 12 lessons (http://europa.eu/abc/12lessons/lesson_4/index_en.htm); Europa.eu, Institutional Reform of the European Union : Main dates (http://europa.eu/institutional_reform/chronology/index_en.htm); Official Journal of the European Union, 2004/C 310/01 (http://eur-lex.europa.eu/JOHtml.do?uri=OJ:C:2004:310:SOM:EN:HTML); European Council, Declaration by the Heads of State or Government of the Members States of the European Union, 18 June 2005 (http://europa.eu/rapid/pressReleasesAction.do?reference=DOC/05/3&format=HTML&aged=0&language=EN&gui Language=en); European Council, The Brussels European Council – 21 and 22 June 2007 (http://europa.eu/scadplus/constitution/european_council_2007_en.htm); Europa.eu, Treaty of Lisbon: The treaty at a glance (http://europa.eu/lisbon_treaty/glance/index_en.htm); Europa.eu, Treaty of Lisbon: News (http://europa.eu/lisbon_treaty/index_en.htm).
Statistical Disclosure Standards of the International Monetary Fund
The Federal Republic currently meets the Special Data Dissemination Standard (“SDDS”) of the International Monetary Fund (“IMF”) relating to coverage, periodicity and timeliness of economic data. Although subscription by member countries to the SDDS is voluntary, it carries a commitment requiring members to observe the standard and to provide certain information to the IMF about their practices in disseminating economic and financial data.
G-5
THE ECONOMY
Overview
Since 1945, the Federal Republic’s economic system has developed into a social market economy, combining the free initiative of the individual with progressive social principles. The Grundgesetz guarantees freedom of private enterprise and private property, provided that these basic rights are not exercised against the public good. The state mainly has a regulatory function in the market economy, setting the general framework of conditions within which market processes take place. State intervention in price setting is limited to a very small number of industries.
Key Economic Figures
The German economy is one of the world’s largest economies. In 2008, its GDP expressed at current prices was EUR 2,492.0 billion, compared to EUR 2,422.9 billion in 2007, which represents an increase of 2.9%. Real GDP rose by 1.3% compared to 2007, and by 29.0% compared to 1991. This growth in GDP since 1991 has been largely driven by gains in productivity, as real GDP per employee has risen by 23.5% since 1991. In calculating real GDP growth, the Federal Statistical Office uses a chain index based on previous years’ prices. In 2008, GDP per capita at current prices was EUR 30,342, while GDP per employee at current prices was EUR 61,790.
Source: Statistisches Bundesamt, Fachserie 18, Reihe 1.4 – 2008 (March 2009), Tables 2.1.1 and 2.1.4.
As in many advanced economies, the services sector of the Federal Republic has become the largest contributor to GDP. In 2008, financial, renting and business activities accounted for 29.3% (1991: 23.3%), and other public and private service activities accounted for 21.8% (1991: 20.8%) of gross value added, measured at current prices, while the share of trade and transport services, including hotel and restaurant services as well as communication services, has remained constant at 17.9% since 1991. The production sector (excluding construction) generated 25.9% of gross value added compared to 30.6% in 1991. Construction contributed 4.2% (1991: 6.0%) to gross value added, and agriculture, forestry and fishing accounted for 0.9% of gross value added (1991: 1.4%).
Source: Statistisches Bundesamt, Fachserie 18, Reihe 1.4 – 2008 (March 2009), Table 2.2.1.
In 2008, private consumption totaled 56.3% of GDP, gross capital formation amounted to 19.3%, and government consumption equaled 18.1%. Exports and imports of goods and services accounted for 47.2% and 40.9% of GDP at current prices, respectively. The trade balance thus showed a surplus equal to 6.3% of GDP in 2008.
Source: Statistisches Bundesamt, Fachserie 18, Reihe 1.4 – 2008 (March 2009), Table 2.3.1.
In 2008, real GDP grew by 1.3% compared to 2007. This is the weakest annual growth rate in three years and falls slightly short of the long-term average annual growth for the 1992 to 2008 period of 1.5%. Economic growth in 2008 was based solely on domestic demand, with gross fixed capital formation contributing most to GDP growth (0.8 percentage points). Gross fixed capital formation in machinery and equipment rose by 5.9% (compared to 6.9% in 2007), and gross fixed capital formation in construction increased by 3.0%. Final consumption expenditure by general government rose by 2.0% in 2008 upon price adjustment, while final consumption expenditure of households shrank slightly by 0.1%. Net exports reduced economic growth in 2008 by 0.3 percentage points. The negative growth contribution of net exports was due to the comparatively low increase in exports by only 2.7% (compared to 7.5% in 2007), while imports increased by 4.0% on a price-adjusted basis (2007: 5.0%). Nevertheless, both export and imports measured at current prices reached their highest-ever levels (exports: EUR 1,177.1 billion, imports: EUR 1,020.1 billion).
Source: Statistisches Bundesamt, Fachserie 18, Reihe 1.4 – 2008 (March 2009), Tables 2.3.1, 2.3.2 and 2.3.10.
The rate of registered unemployment (as computed under the “national definition” of the Federal Employment Agency) continued its downward trend and decreased from 9.0% in 2007 to 7.8% in 2008. Based on the internationally comparable method of calculation promulgated by the International Labor Organization (ILO), which is referred to as the “ILO definition”, the unemployment rate decreased from 8.3% in 2007 to 7.2% in 2008. This represents the lowest unemployment rate since 1992. For an explanation of the differences between the national definition and the ILO definition, see “Employment and Labor”. Inflation as measured by the percentage increase in the national consumer price index (“CPI”) accelerated from 2.3% in 2007 to 2.6% in 2008. Main drivers of inflation were prices for energy (+9.6%), food (+6.4%) and education (+8.7%), which rose strongly in the first half of 2008. General government debt totaled EUR 1,576.6 billion at year-end 2007 and EUR 1,641.8 billion at year-end 2008.
G-6
Sources: Bundesagentur für Arbeit, Monatsbericht Dezember und das Jahr 2008, Table JZ 01: Arbeitsmarktzahlen 2004 bis 2008, Deutschland; Statistisches Bundesamt, Fachserie 18, Reihe 1.4 – 2008 (March 2009), Table 2.1.11; Statistisches Bundesamt, Fachserie 17, Reihe 7 –Februar 2009 (March 2009), Table 1.1 and 1.2; Statistisches Bundesamt, Consumer prices in 2008:+2.6% on 2007, press release of January 15, 2009 (http://www.destatis.de/jetspeed/portal/cms/Sites/destatis/Internet/EN/press/pr/2009/01/PE09__017__611,templateId=renderPrint.psml); Eurostat, Euro area and EU27 government deficit at 1.9% and 2.3% of GDP respectively, press release of April 22, 2009 (http://epp.eurostat.ec.europa.eu/cache/ITY_PUBLIC/2-22042009-BP/EN/2-22042009-EN-BP.PDF).
The growth prospects of Germany’s export-dependent economy have deteriorated significantly as a result of the severe global recession and the ongoing crisis in the global financial markets. In its spring forecast published in late April 2009, the Federal Government predicted that real GDP in Germany would decline by 6.0% in 2009, compared to a forecasted decline of approximately 21/4% in January 2009. After a significant decrease of economic activity at the beginning of 2009, the economy is expected to stabilize during the course of the year. About three-quarters of the forecasted decline in real GDP for 2009 is expected to be attributable to the negative growth contribution of net exports. Real exports and imports are expected to contract by 18.8 % and 10.6%, respectively, compared to 2008. During the previous upswing in the German economy from 2005 to 2007, net exports had been the most important contributor to growth. Similarly, gross fixed capital formation, which was another key factor for growth in prior years, is projected to shrink markedly by 8.1%. German enterprises are expected to sharply reduce gross fixed capital formation in machinery and equipment by 17.0% as sales prospects slump and the degree of capacity utilization declines rapidly. However, gross fixed capital formation in construction is projected to shrink less severely, by 2.2%, mainly because the Federal Government’s measures to stabilize the economy and foster growth, among other things, provide support for public construction (see “Economic Policy – Stimulus Packages”). Consumption is expected to be the major stabilizing factor in 2009. In particular, government consumption is projected to increase by 2.4% in 2009. Private consumption may also have a stabilizing effect and is expected to decline only marginally by 0.1%. The forecasted decline in the inflation rate, with consumer prices being predicted to increase only slightly by 0.3% in 2009 after 2.6% in 2008, is expected to strengthen the purchasing power of consumers. In addition, private consumption expenditures should benefit from the Federal Government’s stimulus measures, such as the reduction of tax rates and social contributions. However, the growth potential of private consumption is limited by the deteriorating prospects for the labor market. The Federal Government expects unemployment (according to the national definition) to equal 3.72 million persons on average in 2009, which would constitute a rise of 450,000 registered unemployed persons compared to 2008. Employment is forecast to decline by 1.3% in 2009 compared to 2008. The Federal Government projects that Germany will return to a positive real GDP growth rate in 2010 (0.5%). The Federal Government has noted, however, that these economic forecasts are subject to significant risks and uncertainties, which are exceptionally high in the current economic environment.
Sources: Bundesministerium für Wirtschaft und Technologie, Jahreswirtschaftsbericht 2009: Konjunkturgerechte Wachstumspolitik (http://www.bmwi.de/BMWi/Redaktion/PDF/Publikationen/jahreswirtschaftsbericht-2009,property=pdf,bereich=bmwi,sprache=de,rwb=true.pdf); Bundesministerium für Wirtschaft und Technologie, Bundesminister zu Guttenberg: ,,Klare Orientierung in schwierigen Zeiten: Vertrauen stärken – Chancen nutzen“, press release of April 29, 2009 (http://www.bmwi.de/BMWi/Navigation/Presse/pressemitteilungen,did=299660.html); Bundesministerium für Wirtschaft und Technologie, Kommentierte Eckwerte-Tabelle zur Frühjahrsprojektion 2009 der Bundesregierung (http://www.bmwi.de/BMWi/Redaktion/PDF/F/fruehjahrsprojektion-br-kommentierte-eckwerte-tabelle-2009, property=pdf,bereich=bmwi,sprache=de,rwb=true.pdf).
G-7
The following table shows selected key economic figures for the Federal Republic for the past five years.
Key Economic Figures
| | | | | | | | | | | | | | | | | | | | | |
| | | 2008 | | 2007 | | 2006 | | 2005 | | 2004 |
| | | (EUR in billions) |
| GDP – at current prices | | | 2,492.0 | | | | 2,422.9 | | | | 2,321.5 | | | | 2,243.2 | | | | 2,210.9 | |
| (change from previous year in %) | | | 2.9 | | | | 4.4 | | | | 3.5 | | | | 1.5 | | | | 2.2 | |
| GDP – price-adjusted, chain-linked index (2000=100), not adjusted for calendar effects | | | 110.1 | | | | 108.7 | | | | 106.1 | | | | 103.0 | | | | 102.2 | |
| (change from previous year in %) | | | 1.3 | | | | 2.5 | | | | 3.0 | | | | 0.8 | | | | 1.2 | |
| GDP – price-adjusted, chain-linked index (2000=100), adjusted for calendar effects | | | 109.9 | | | | 108.9 | | | | 106.1 | | | | 102.9 | | | | 101.9 | |
| (change from previous year in %) | | | 1.0 | | | | 2.6 | | | | 3.2 | | | | 1.0 | | | | 0.7 | |
| Unemployment rate (ILO definition) (in %) (1) | | | 7.2 | | | | 8.3 | | | | 9.8 | | | | 10.6 | | | | 9.7 | |
| Rate of inflation (year-to-year change in consumer price index (CPI) in %) | | | 2.6 | | | | 2.3 | | | | 1.6 | | | | 1.5 | | | | 1.7 | |
| Balance of payments – current account | | | 164.9 | | | | 191.3 | | | | 150.9 | | | | 114.7 | | | | 102.9 | |
| General government debt (2) | | | 1,641.8 | | | | 1,576.6 | | | | 1,569.0 | | | | 1,521.9 | | | | 1,451.1 | |
| | |
| (1) | | Unemployed persons, available and seeking work. |
| |
| (2) | | Definition according to Maastricht Treaty. |
Sources: Deutsche Bundesbank, Monatsbericht März 2009, Tables IX.1 and XI.2; Statistisches Bundesamt, Fachserie 18, Reihe 1.2 – 4. Vierteljahr 2008 (February 2009), Tables 1.1 and 1.10; Statistisches Bundesamt, Consumer Prices, Consumer price index for Germany (2005=100) – % change on the previous year, last updated on March 10, 2009 (http://www.destatis.de/jetspeed/portal/cms/Sites/destatis/Internet/EN/Content/Statistics/TimeSeries/EconomicIndicators/BasicData/Content100/vpi101j,templateId=renderPrint.psml); Eurostat, Euro area and EU27 government deficit at 1.9% and 2.3% of GDP respectively, press release of April 22, 2009 (http://epp.eurostat.ec.europa.eu/cache/ITY_PUBLIC/2-22042009-BP/EN/2-22042009-EN-BP.PDF).
Economic Policy
General
The Federal Government’s foremost economic policy objectives are to promote economic growth and employment. In addition, the Federal Government aims to modernize the German economy and German society on every level in order to face successfully the challenges resulting from European integration, globalization and the emergence of a knowledge-based economy. The Federal Government believes that achieving these objectives is also necessary to further improve the Federal Republic’s position as a business location that is able to compete globally for capital, ideas and innovation.
In recent years, the Federal Government carried out major structural reforms in order to enhance the flexibility and adaptivity of the German economy and to increase the attractiveness of Germany as a business location. These reforms included a series of measures aimed at modernizing the German social system and labor market designated as “Agenda 2010” as well as reforms of the healthcare system and the pension system (see “Social Security Legislation and Social Policy”). In addition, with effect from January 1, 2008, the reform of corporate and other general business taxation reduced the average overall tax burden on companies in Germany to just below 30%. The same law introduced a flat rate tax of 25%, effective as of January 1, 2009, on all capital gains and proceeds from the sale of private capital assets (for further information see “Public Finance – Tax Structure”). Other important political objectives have been the sustainability of public finances and the modernization of the federal system (Förderalismusreform).
Sources: Bundesregierung, Koalitionsvertrag – Inhalt (http://www.bundesregierung.de/Webs/Breg/DE/Bundesregierung/Koalitionsvertrag/koalitionsvertrag.html ); Bundesregierung, Agenda 2010: Deutschland bewegt sich (http://archiv.bundesregierung.de/artikel/81/557981/attachment/557980_0.pdf); Federal Ministry of Economics and Technology, Annual Economic Report 2009 (January 2009)
G-8
(http://www.bmwi.de/BMWi/Redaktion/PDF/Publikationen/jahreswirtschaftsbericht-2009,property=pdf,bereich=bmwi,sprache=de,rwb=true.pdf).
Stimulus Packages
Since the fall of 2008, the significant deterioration of global economic conditions has been determining the agenda of the Federal Government’s economic policy. The Federal Government has generally decided to accept the negative impact of the adverse economic trend on the public budget and to permit automatic stabilizers, such as cyclical tax shortfalls and rising unemployment compensation, to take full effect. It has, however, also decided to introduce measures aimed at stimulating demand, while simultaneously enhancing long-term growth potential. In total, the Federal Government’s measures to support and stimulate the economy in 2009 and 2010 amount to more than EUR 90 billion, including approximately EUR 8 billion in tax shortfalls in connection with the retroactive reinstatement of the commuter tax allowance (Pendlerpauschale) as a result of a decision of the Federal Constitutional Court. This corresponds to 13/4% of GDP in each of 2009 and 2010. Additional economic impetus in 2009 is expected to result from the increase in statutory retirement pension as from July 1, 2009.
The first series of measures that provides a total stimulus of EUR 31 billion in 2009 and 2010 was adopted between October and December 2008 and includes the “Package of measures to reduce tax burdens, stabilize social insurance contributions and invest in families” and the 15-point program “Securing jobs by strengthening growth.” These measures seek to stimulate private and public investments by reducing tax burdens on private citizens and businesses. To support the labor market, the maximum drawing period for short-time-work benefit was extended from 12 to 18 months. Moreover, in order to prevent a large-scale disruption in credit supply, KfW’s lending programs for small- and medium-sized enterprises have been supplemented by an additional special loan program in an amount of up to EUR 15 billion (KfW Sonderprogramm).
In light of the continuing deterioration of global economic conditions, characterized by a significant decline in demand and production, the implementation of further measures became necessary with a view to stabilizing growth. In February 2009, the legislature adopted an additional package of measures entitled “Pact for employment and stability in Germany” which, in the aggregate, provides for additional charges of approximately EUR 50 billion for the general government budgets for 2009 and 2010. Key measures include: public investments in educational infrastructure and other infrastructure; supplying credit to businesses (including by means of extending the special loan program of KfW established under the first series of measures by up to EUR 25 billion for larger companies); fostering innovation and targeting specific sectors (including the motor vehicle sector, by introducing an environmental bonus for scrapping old vehicles and purchasing new low-emission replacement vehicles in 2009); securing employment and promoting skills; reducing taxes and social contributions; and a commitment to sustainable fiscal policy called the “debt brake” (Schuldenbremse). The debt brake would impose a constitutional limit on net borrowing: under normal economic conditions, the structural deficit of the Federal Government is not to exceed 0.35% of nominal GDP from 2016 onwards and the budgets of the Länder are to be structurally balanced from 2020 onwards. The legal implementation of the debt brake is currently scheduled for July 2009.
Due to the success of the environmental bonus for scrapping old vehicles, in April 2009, the Federal Government proposed to extend this measure and intends to set aside an additional amount of EUR 3.5 billion to this purpose.
For information on government measures to stabilize Germany’s financial system, see “Monetary and Financial System – Policy Response to the Crisis in the Global Financial Markets – Fund for the Stabilization of the Financial Market and other measures to stabilize the Financial Markets.” For information on the federal budget, see “Public Finance.“
Sources: Federal Ministry of Economics and Technology, Annual Economic Report 2009 (January 2009) (http://www.bmwi.de/BMWi/Redaktion/PDF/Publikationen/jahreswirtschaftsbericht-2009,property=pdf,bere ich=bmwi,sprache=de,rwb=true.pdf); Federal Ministry of Economics and Technology, Economic policy (http://www.bmwi.de/English/Navigation/Economy/economic-policy.html); Federal Ministry of Finance, Addendum to the Update of the German Stability Programme (http://ec.europa.eu/economy_finance/publications/publication13915_en.pdf); Federal Ministry of Finance, Schutzschirm für Arbeitsplätze, publication of November 5, 2008 (http://www.bundesfinanzministerium.de/nn_69120/DE/Buergerinnen__und__Buerger/Gesellschaft__und__Zukunft/themenschwerpunkt__konjunkturpakete/073__Schutzschirm__arbeitsplaetze.html#6); Federal Ministry of Finance, Das Richtige tun – Das zweite Konjunkturpaket (http://www.bundesfinanzministerium.de/nn_53848/sid_15E2D2768C66CDEAF02284B62B4AE5C9/DE/Buergerinnen__und__Buerger/Gesellschaft__und__Zukunft/themenschwerpunkt__konjunkturpakete/das__richtige__tun/074__Das__Richtige__tun.html?__nnn=true);
G-9
Bundesgesetzblatt, Gesetz zur Sicherung von Beschäftigung und Stabilität in Deutschland (http://www.bgblportal.de/BGBL/bgbl1f/bgbl109s0416.pdf); Federal Ministry of Finance, Die Schuldenbremse kommt (http://www.bundesfinanzministerium.de/nn_53848/DE/Wirtschaft__und__Verwaltung/Finanz__und__Wirtschaftspolitik/120__Schuldenbremse__kommt.html?__nnn=true); Federal Ministry of Finance, Haushaltsmittel für Umweltprämie werden aufgestockt (http://www.bundesfinanzministerium.de/nn_54/DE/Buergerinnen__und__Buerger/Gesellschaft__und__Zukunft/themenschwerpunkt__konjunkturpakete/Umweltpraemie__aufgestockt.html?__nnn=true).
G-10
Gross Domestic Product
The following tables show the structure of the Federal Republic’s GDP at current prices by use and origin for each of the years indicated along with changes over the respective preceding period.
Structure of GDP – Use
| | | | | | | | | | | | | | | | | | | | | | | | | | | | | | | | | | | | | | |
| | | 2008 | | 2007 | | 2006 | | 2005 | | 2004 | | | 2008 | | 2007 | | 2006 | | 2005 |
| | | (EUR in billions) | | | (change in %) |
| Domestic uses | | | 2,334.9 | | | | 2,251.9 | | | | 2,190.0 | | | | 2,123.7 | | | | 2,098.0 | | | | | 3.7 | | | | 2.8 | | | | 3.1 | | | | 1.2 | |
| Final private consumption | | | 1,402.3 | | | | 1,373.7 | | | | 1,355.1 | | | | 1,324.7 | | | | 1,303.1 | | | | | 2.1 | | | | 1.4 | | | | 2.3 | | | | 1.7 | |
| Final government consumption | | | 452.0 | | | | 435.6 | | | | 425.4 | | | | 420.0 | | | | 415.9 | | | | | 3.8 | | | | 2.4 | | | | 1.3 | | | | 1.0 | |
| Gross fixed capital formation | | | 478.7 | | | | 453.5 | | | | 423.1 | | | | 390.9 | | | | 387.0 | | | | | 5.6 | | | | 7.2 | | | | 8.2 | | | | 1.0 | |
| Machinery and equipment | | | 199.0 | | | | 189.4 | | | | 178.1 | | | | 162.1 | | | | 154.5 | | | | | 5.1 | | | | 6.3 | | | | 9.8 | | | | 4.9 | |
| Construction | | | 251.3 | | | | 236.4 | | | | 218.6 | | | | 203.4 | | | | 207.7 | | | | | 6.3 | | | | 8.1 | | | | 7.5 | | | | -2.1 | |
| Other products | | | 28.4 | | | | 27.7 | | | | 26.4 | | | | 25.4 | | | | 24.8 | | | | | 2.6 | | | | 5.1 | | | | 3.9 | | | | 2.5 | |
Changes in inventories (1) | | | 2.0 | | | | -10.9 | | | | -13.7 | | | | -11.9 | | | | -8.0 | | | | | — | | | | — | | | | — | | | | — | |
Net exports (1) | | | 157.1 | | | | 171.0 | | | | 131.5 | | | | 119.6 | | | | 112.9 | | | | | — | | | | — | | | | — | | | | — | |
| Exports | | | 1,177.1 | | | | 1,137.2 | | | | 1,052.7 | | | | 921.4 | | | | 849.9 | | | | | 3.5 | | | | 8.0 | | | | 14.3 | | | | 8.4 | |
| Imports | | | 1,020.1 | | | | 966.2 | | | | 921.2 | | | | 801.9 | | | | 737.0 | | | | | 5.6 | | | | 4.9 | | | | 14.9 | | | | 8.8 | |
| | | | | | | | | | | | | | | | | | | | | | | | | | | | | | | | | | | | | | |
Gross domestic product | | | 2,492.0 | | | | 2,422.9 | | | | 2,321.5 | | | | 2,243.2 | | | | 2,210.9 | | | | | 2.9 | | | | 4.4 | | | | 3.5 | | | | 1.5 | |
| | | | | | | | | | | | | | | | | | | | | | | | | | | | | | | | | | | | | | |
| |
| |
| (1) Percentage changes are not presented due to the potentially changing signs of these net positions. |
| |
| Source: Statistisches Bundesamt, Fachserie 18, Reihe 1.2 – 4. Vierteljahr 2008 (February 2009), Tables 3.1 and 3.9. |
| |
| Structure of GDP – Origin |
| |
| | | 2008 | | 2007 | | 2006 | | 2005 | | 2004 | | | 2008 | | 2007 | | 2006 | | 2005 |
| | | (EUR in billions) | | | (change in %) |
| Gross value added of all economic sectors | | | 2,235.1 | | | | 2,171.2 | | | | 2,093.3 | | | | 2,024.9 | | | | 1,998.4 | | | | | 2.9 | | | | 3.7 | | | | 3.4 | | | | 1.3 | |
| Agriculture, forestry and fishing | | | 19.6 | | | | 20.0 | | | | 17.9 | | | | 17.3 | | | | 21.9 | | | | | -2.2 | | | | 12.1 | | | | 3.3 | | | | -21.1 | |
| Production sector (excluding construction) | | | 580.0 | | | | 572.1 | | | | 538.8 | | | | 510.5 | | | | 501.6 | | | | | 1.4 | | | | 6.2 | | | | 5.5 | | | | 1.8 | |
| Construction | | | 93.8 | | | | 87.2 | | | | 80.4 | | | | 80.2 | | | | 83.3 | | | | | 7.7 | | | | 8.5 | | | | 0.2 | | | | -3.7 | |
| Trade and transport (1) | | | 399.8 | | | | 382.4 | | | | 374.6 | | | | 357.9 | | | | 353.4 | | | | | 4.6 | | | | 2.1 | | | | 4.7 | | | | 1.3 | |
| Financial, renting and business activities | | | 655.0 | | | | 634.8 | | | | 616.4 | | | | 596.1 | | | | 581.0 | | | | | 3.2 | | | | 3.0 | | | | 3.4 | | | | 2.6 | |
| Other public and private service activities | | | 486.9 | | | | 474.7 | | | | 465.2 | | | | 463.0 | | | | 457.2 | | | | | 2.6 | | | | 2.0 | | | | 0.5 | | | | 1.3 | |
| Taxes on products offset against subsidies on products | | | 256.9 | | | | 251.7 | | | | 228.2 | | | | 218.3 | | | | 212.5 | | | | | 2.1 | | | | 10.3 | | | | 4.5 | | | | 2.7 | |
| | | | | | | | | | | | | | | | | | | | | | | | | | | | | | | | | | | | | | |
Gross domestic product | | | 2,492.0 | | | | 2,422.9 | | | | 2,321.5 | | | | 2,243.2 | | | | 2,210.9 | | | | | 2.9 | | | | 4.4 | | | | 3.5 | | | | 1.5 | |
| | | | | | | | | | | | | | | | | | | | | | | | | | | | | | | | | | | | | | |
| | |
| (1) | | Including hotel and restaurant services as well as communication services. |
Source: Statistisches Bundesamt, Fachserie 18, Reihe 1.2 – 4. Vierteljahr 2008 (February 2009), Tables 1.13 and 2.1.
G-11
Sectors of the Economy
Production Sector
The production sector of the Federal Republic grew rapidly after 1945. The main cause for this development was the transition from a state-controlled economy to a social market economy, in which state intervention is limited to furthering social welfare and creating favorable economic conditions. Following German reunification in 1990, industry in the eastern Länder has undergone a restructuring process. Today, the German production sector is characterized by a balanced mix of small, medium and large enterprises and is almost entirely privately owned. It is geographically concentrated in the western Länder of North-Rhine Westphalia, Baden-Württemberg and Bavaria. The main segments of the production sector relate to the manufacturing of motor vehicles, electrical and optical equipment, machinery and equipment, basic metals and fabricated metal products, as well as chemicals and chemical products. In 2008, the sector’s aggregate contribution to gross value added at current prices was 25.9% (excluding construction) and 30.1% (including construction).
Sources: Volkswirtschaftliche Gesamtrechnung der Länder, Reihe 1 Band 1 (March 2009), Table 2.3; Statistisches Bundesamt, Fachserie 18, Reihe 1.4–2008 (March 2009), Table 2.2.1.
The following table shows the output of the production sector in index form using 2005 as the base year for each of the years indicated.
Output in the Production Sector (1)
(2005 = 100)
| | | | | | | | | | | | | | | | | | | | | |
| | | 2008 (2) | | 2007 | | 2006 | | 2005 | | 2004 |
| | | |
| Production sector, total | | | 111.5 | | | | 111.6 | | | | 105.4 | | | | 99.7 | | | | 96.8 | |
Industry (3) | | | 113.4 | | | | 113.1 | | | | 105.8 | | | | 99.6 | | | | 95.9 | |
of which: | | | | | | | | | | | | | | | | | | | | |
Intermediate goods (4) | | | 114.2 | | | | 114.6 | | | | 107.1 | | | | 99.7 | | | | 96.8 | |
Capital goods (5) | | | 116.8 | | | | 114.9 | | | | 106.0 | | | | 99.6 | | | | 94.8 | |
| Durable goods (6) | | | 104.0 | | | | 108.4 | | | | 107.3 | | | | 99.7 | | | | 99.6 | |
Nondurable goods (7) | | | 104.4 | | | | 105.8 | | | | 101.7 | | | | 99.6 | | | | 95.9 | |
Energy (8) | | | 95.6 | | | | 98.2 | | | | 101.0 | | | | 100.1 | | | | 99.7 | |
| Construction (9) | | | 108.2 | | | | 108.9 | | | | 105.8 | | | | 99.5 | | | | 105.2 | |
| | |
| (1) | | Adjusted for working-day variations. |
| |
| (2) | | Provisional figures. |
| |
| (3) | | Manufacturing sector, unless assigned to the main grouping energy, plus mining and quarrying. |
| |
| (4) | | Including mining and quarrying except energy-producing goods. |
| |
| (5) | | Including manufacture of motor vehicles and components. |
| |
| (6) | | Consumption goods that have a long-term use, such as furniture. |
| |
| (7) | | Consumption goods that have a short-term use, such as food. Including printing and service activities related to printing. |
| |
| (8) | | Electricity, gas, steam and hot water supply, mining and quarrying of energy-producing materials, and especially manufacture of refined petroleum products. |
| |
| (9) | | Comprises the economic classifications “Site preparation” and “Building of complete constructions or parts thereof; civil engineering.” |
Source: Deutsche Bundesbank, Monatsbericht März 2009, Table X.2.
Services Sector
As in most other industrialized countries, the services sector, which comprises trade and transport services (including hotel and restaurant services as well as communications services), financial, renting and business activities as well as other public and private service activities, has expanded rapidly in recent years and is currently the largest contributor to gross value added. In 2008, the sector’s aggregate contribution to gross value added at current prices rose slightly to 69.0%. Within the services sector, the segment of financial, renting and business activities represents the largest segment in terms of contribution to total gross value added, contributing 29.3% in 2008.
Source: Statistisches Bundesamt, Fachserie 18, Reihe 1.4–2008 (March 2009), Tables 2.2.1 and 3.2.1.
Employment and Labor
In 2008, the average unemployment rate according to the national definition was 7.8%, compared to 9.0% in 2007. Under the ILO definition, the average unemployment rate was 7.2% in 2008 compared to 8.3% in 2007. Under both definitions, the average unemployment rate in 2008 reached the lowest level of unemployment since 1992 following a major decline of the unemployment rate which started in 2005.
Effective January 2005, as a result of legislative measures implemented in connection with the so-called Hartz IV labor market reform, former recipients of social assistance who are able to work now receive a new form of unemployment benefits known as Arbeitslosengeld II, which is also paid to those registered as unemployed for more than a year, and, accordingly, are also registered as unemployed. This change accounts for most of the significant increase in the (seasonally adjusted) unemployment rate according to the national definition from 10.9% in December 2004 to 12.1% in March 2005.
G-12
The number of persons resident in Germany who were either employed or self-employed in 2008 was approximately 40.3 million, which represents an increase of 1.4% compared to 2007.
Sources: Bundesagentur für Arbeit, Monatsbericht Dezember und das Jahr 2008, Table JZ 01: Arbeitsmarktzahlen 2004 bis 2008 (http://www.pub.arbeitsagentur.de/hst/services/statistik/000100/html/monat/200812.pdf); Deutschland; Bundesagentur für Arbeit, Monatsbericht Dezember und das Jahr 2006, Table: Arbeitslose und Stellenangebote (saisonbereinigt) (http://www.pub.arbeitsagentur.de/hst/services/statistik/000100/html/monat/200612.pdf); Statistisches Bundesamt, Fachserie 18, Reihe 1.4 – 2008 (March 2009), Table 2.1.11.
The following table shows data with respect to employment and unemployment for each of the years indicated. Persons who are participating in programs such as vocational training, job creation plans or early retirement, which are designed to reduce unemployment, particularly in the eastern Länder, are not included in the unemployment rates shown below, as they are not treated as unemployed.
Employment and Unemployment
| | | | | | | | | | | | | | | | | | | | | |
| | | 2008 | | 2007 | | 2006 | | 2005 | | 2004 |
| | | |
| Employed | | | | | | | | | | | | | | | | | | | | |
| (in thousands)–ILO definition | | | 40,263 | | | | 39,694 | | | | 39,024 | | | | 38,757 | | | | 38,796 | |
| Unemployed | | | | | | | | | | | | | | | | | | | | |
| (in thousands)–ILO definition (1) | | | 3,131 | | | | 3,602 | | | | 4,250 | | | | 4,573 | | | | 4,160 | |
| Unemployment rate | | | | | | | | | | | | | | | | | | | | |
| (in %)–ILO definition | | | 7.2 | | | | 8.3 | | | | 9.8 | | | | 10.6 | | | | 9.7 | |
| Unemployed | | | | | | | | | | | | | | | | | | | | |
| (in thousands)–national definition (2) | | | 3,268 | | | | 3,776 | | | | 4,487 | | | | 4,861 | | | | 4,381 | |
| Unemployment rate | | | | | | | | | | | | | | | | | | | | |
| (in %)–national definition (3) | | | 7.8 | | | | 9.0 | | | | 10.8 | | | | 11.7 | | | | 10.5 | |
| | |
| (1) | | Unemployed persons, available and seeking work. |
| |
| (2) | | Registered unemployed persons, available and seeking work (but including persons working up to 15 hours per week). From 2005, unemployed persons include former recipients of social assistance who are able to work. |
| |
| (3) | | As a percentage of the total work force (excluding armed forces). |
Sources: Bundesagentur für Arbeit, Der Arbeits- und Ausbildungsmarkt in Deutschland: Monatsbericht Dezember und das Jahr 2008, Table Arbeitsmarktzahlen 2004 bis 2008 – Bundesrepublik Deutschland; Statistisches Bundesamt, Fachserie 18, Reihe 1.2 – 4. Vierteljahr 2008 (February 2009), Table 1.10.
Beginning in 1989, the increase in the number of immigrants of German descent from Eastern Europe and of Germans from the former German Democratic Republic (“GDR”) resulted in an accelerated growth of the workforce and contributed, in part, to a subsequent increase in the number of registered unemployed persons. As a result of the fundamental restructuring of the eastern German economy following reunification, a significant number of employees in the eastern Länder lost their jobs. In 2008, under the national definition, the unemployment rate in the eastern Länder was 13.1%, compared to an unemployment rate of 6.4% in the western Länder.
Source: Bundesagentur für Arbeit, Monatsbericht Dezember und das Jahr 2008, Table JZ 02 and Table JZ 03: Arbeitsmarktzahlen 2004 bis 2008 (http://www.pub.arbeitsagentur.de/hst/services/statistik/000100/html/monat/200812.pdf).
In 2008, gross wages and salaries per employee in Germany rose by 2.3%. This increase compares to more moderate rates of wage growth in previous years, which partly reflected high unemployment rates at that time. Unit labor costs, which take into account changes in labor productivity, grew almost as much as gross wages and salaries in 2008 as unemployment fell notably and, as a consequence, labor productivity was stagnant. The following table shows changes in the wage level per employee and unit labor costs per hour worked for each of the years indicated by reference to 2000 figures as reflected in various economic indices.
G-13
Wage Trends and Labor Costs
| | | | | | | | | | | | | | | | | | | | | |
| | | 2008 | | 2007 | | 2006 | | 2005 | | 2004 |
| | | |
| Gross wages and salaries per employee | | | | | | | | | | | | | | | | | | | | |
| EUR | | | 27,754 | | | | 27,125 | | | | 26,705 | | | | 26,469 | | | | 26,399 | |
| Change from previous year in % | | | 2.3 | | | | 1.6 | | | | 0.9 | | | | 0.3 | | | | 0.6 | |
| Unit labor costs per hour worked | | | | | | | | | | | | | | | | | | | | |
| Index (2000=100) | | | 102.0 | | | | 99.9 | | | | 99.5 | | | | 100.8 | | | | 101.5 | |
| Change from previous year in % | | | 2.1 | | | | 0.4 | | | | -1.2 | | | | -0.8 | | | | -0.5 | |
Source: Statistisches Bundesamt, Fachserie 18, Reihe 1.2 – 4. Vierteljahr 2008 (February 2009), Tables 2.17 and 2.20.
Approximately one-fifth of the German work force is organized in unions. The German Trade Union Federation (Deutscher Gewerkschaftsbund) serves as an umbrella organization for eight such unions. Each member union typically covers employees of an entire industry, regardless of the precise type of work done by these employees (the “one union, one industry” principle). As a result, employers usually deal with only one negotiating partner on the labor side in each specific industry.
The unions and employers of each specific industry enter into collective labor agreements (Tarifverträge), typically without government intervention. As a practical matter, the Tarifverträge apply to all employees of a given industry, regardless of whether or not a particular employee is unionized, so long as that employee’s employer is a member of the relevant association of employers, which is typically the case. In the eastern Länder, unions and employers have agreed on Tarifverträge that provide for a gradual increase in wages and salaries with a view to adjusting them over time to the levels paid in the western Länder. Tarifverträge are binding on both unions and employers. Despite their binding character, however, there is a wide range of possibilites to deviate from these agreements that allow for individually adjusted agreements between employer and employee, particularly in the eastern Länder. Over the past years the number of employees in companies which are subject to labor agreements has continuously declined. Many employers in the eastern Länder are no longer members of employers’ associations, in which case wages are individually negotiated, which often results in wage levels that are lower than those provided for by the Tarifverträge.
Several German laws contain provisions that regulate labor disputes. These laws provide, for example, that any strike must be approved by a vote of three-quarters of the members of the competent trade union. As a result, and also due to a comparatively high level of social security, there are relatively few strikes in the Federal Republic compared to other countries.
In February 2009, amendments to the Law on the Posting of Workers (Arbeitnehmerentsendegesetz) and the Law on Minimum Working Conditions (Mindestarbeitsbedingungengesetz) were adopted by the legislature. These amendments increase the possibilities of using minimum wage rules at the industry level, whereas initiatives to introduce a national statutory minimum wage were abandoned.
Source: Bundesministerium für Arbeit und Soziales, Mindestlohn-Gesetze erhalten Zustimmung, Pressemitteilung vom 13. Februar 2009 (http://www.bmas.de/coremedia/generator/31204/2009___02___13___mindestlohngesetze.html).
Social Security Legislation and Social Policy
The comprehensive system of social security legislation and services in effect in the Federal Republic includes health insurance, long-term care insurance, retirement and disability pensions, unemployment benefits, child welfare programs, care for physically and mentally handicapped persons, allowances to orphans and to single persons with dependents, and the provision of general public assistance to needy persons. The majority of the German population is covered by mandatory statutory retirement pension and health insurance. Most of the hospitals and institutions caring for children and handicapped persons are operated by municipalities, churches and charitable institutions.
These social security programs are mainly funded through social security contributions from employers and employees, and a smaller part is funded through direct contributions by the Federal Republic, the Länder, municipalities and other public institutions. The most important part of the social security system — retirement pensions, health insurance and unemployment insurance — is funded primarily through equal contributions by employers and employees.
G-14
The Federal Republic’s statutory retirement insurance system operates on a pay-as-you-go basis, with the contributions from current employers and employees funding payments to current retired persons. Certain persons, including members of certain professions, and civil servants, may either apply for exemption or are automatically exempted from mandatory participation in the statutory retirement pension insurance system. They may instead contribute to private pension schemes or, in the case of civil servants, benefit from special pension schemes for civil servants. The Retirement Funds Act (Altersvermögensgesetz) aims to ensure the long-term viability of the statutory retirement pension insurance system by encouraging insurees to also sign up for designated privately funded or corporate pension schemes, for which certain bonus payments and tax incentives are provided, with a view to offsetting the expected decline of payments from the statutory retirement pension insurance.
Statutory health insurance coverage must be made available to all persons fulfilling the applicable eligibility criteria. Within the statutory health insurance system, insurees may choose among a large number of statutory health insurance providers which have developed historically. Persons whose gross income exceeds certain thresholds as well as civil servants, self-employed persons and members of certain professions may opt out of the statutory system and choose private health insurance coverage. Contributions to the statutory health insurance system are based solely on the insuree’s income situation and are independent of the insuree’s gender, age and medical risk. By contrast, to date, contributions towards private health insurance coverage are mainly calculated based on the insuree’s gender, age, medical risk and the desired level of coverage.
In 2008, social security revenue, as shown in the national accounts, amounted to EUR 486.4 billion, and expenditure was EUR 478.7 billion. The social security budget thus incurred a surplus of EUR 7.7 billion in 2008, the third surplus in a row after five years (2001 to 2005) of deficits.
Source: Statistisches Bundesamt, Fachserie 18, Reihe 1.4–2008 (March 2009), Table 3.4.3.7.
In light of a changing population structure, the Federal Government understands that further structural reforms must be implemented in order to safeguard the sustainability of the social security system in the long term. The restructuring and renewal of the welfare state was part of the previous Federal Government’s “Agenda 2010”. The current Federal Government is continuing this reform policy. Among the more important reforms are the reforms of the health insurance and retirement pension systems.
The health care reform became effective on January 1, 2009. The reform aims at increasing competition within the statutory health insurance system as well as among private health insurance providers. At the heart of the reform is the “health fund” (Gesundheitsfonds). Within the statutory health insurance system, a uniform contribution rate of 15.5% was introduced. The health fund collects the health care contributions and distributes them – adjusted for differences in the risk structures of the insuree pools – in equal amounts per capita among the statutory health insurance providers. An insurance provider may collect additional contributions from the insurees, if necessary, or refund the contributions partially, if possible.
The reform to the statutory retirement pension insurance system consisted of legislation adopted at the end of March 2007 to raise gradually the regular retirement age by two years to the age of 67 between 2012 and 2029. This reform constitutes an important step in meeting the growing financing needs of the statutory retirement pension insurance system required by an aging German population. With this measure, the Federal Government hopes to be able to keep the rate of contribution to the system at below 20% of gross salaries in the long run. In addition, the Federal Government continues to promote private and corporate pension schemes.
Sources: Bundesregierung, Agenda 2010: Deutschland bewegt sich, (http://archiv.bundesregierung.de/artikel/81/557981/attachment/557980_0.pdf); Bundesministerium der Gesundheit, Gesundheitsfonds (http://www.bmg.bund.de/cln_110/sid_5E52F310238A1F6A6983B1911F3502FF/DE/Gesundheit/Gesundheitsfonds/gesundheitsfonds__node.html?__nnn=true); Bundesministerium der Gesundheit, Kabinett beschließt Beitragssatz für die Krankenversicherung 2009, press release of October 29, 2008 (http://www.bmg.bund.de/cln_110/nn_1210508/sid_D06EB396B657F444B8E9C018F15377E0/nsc_true/SharedDocs/Pressemitteilungen/DE/2008/Presse-4-2008/pm-14-11-08.html?__nnn=true); Bundesregierung, Rente mit 67 (http://www.bundesregierung.de/Content/DE/Artikel/2007/03/2007-03-09-rente-mit-67.html); Bundesministerium für Wirtschaft und Technologie, Jahreswirtschaftsbericht 2009: Konjunkturgerechte Wachstumspolitik (http://www.bmwi.de/BMWi/Navigation/Wirtschaft/Wirtschaftspolitik/wirtschaftsfakten,did=286632.html) ..
G-15
International Economic Relations
International economic relations are of major importance to the German economy. In 2008, exports and imports of goods and services amounted to 47.2% and 40.9% of GDP at current prices, respectively. The Federal Republic pursues a liberal foreign trade policy aimed at dismantling tariffs and other barriers to trade.
Source: Statistisches Bundesamt, Fachserie 18, Reihe1.4 – 2008 (March 2009), Table 2.3.13.
Because the Federal Republic’s economy depends on exports, it is particularly vulnerable to trade barriers, such as protective tariffs. The Federal Government thus supports efforts to reduce trade barriers, such as the current negotiations within the framework of the World Trade Organization under the Doha Development Agenda.
Source: Bundesministerium für Wirtschaft und Technologie, Handelspolitik EU / WTO (http://www.bmwi.de/BMWi/Navigation/Aussenwirtschaft/handelspolitik-eu-wto.html).
Balance of Payments
The Federal Republic typically achieves a surplus in the trading of goods. Traditionally, this surplus has been partially offset by deficits in other fields, such as in services, as well as by remittances by foreign employees to their home countries, the Federal Republic’s net payments to the EU and various other payments. In 2008, the current account surplus totaled EUR 164.9 billion, compared to EUR 191.3 billion in 2007. This first significant decrease in the current account since 2000 was caused by the sharp contraction of exports since November 2008 resulting from the global economic downturn.
Sources: Deutsche Bundesbank, Monatsbericht März 2009, Table XI.2.
After appreciating by approximately 85% against the US dollar between June 2001 and July 2008, the euro depreciated considerably relative to the US dollar by approximately 17% between July 2008 and March 2009, breaking a long-term trend towards appreciation. However, a major part of German exports is not directly affected by the variations of the euro/US dollar exchange rate as other EMU countries account for a considerable part of German exports (42% in 2008). According to calculations by Deutsche Bundesbank, applying a broad indicator of Germany’s price competitiveness based on consumer price indices compared to 56 trading partners, Germany’s price competitiveness has been relatively stable since 2003, fluctuating within a range of 6.3% around the average indicator value.
Sources: Deutsche Bundesbank, Monatsbericht März 2002, Tables X.11; Deutsche Bundesbank, Monatsbericht April 2009, Tables XI.3, XI.11 and XI.13; Deutsche Bundesbank, Statistics, Exchange rates, gold prices, Time series YUDM10: Indicator of the German economy’s price competitiveness against 56 trading partners / based on consumer price indices (http://www.bundesbank.de/statistik/statistik_zeitreihen.en.php?func=row&open=devisen&tr=YUDM10).
G-16
The following table shows the Federal Republic’s balance of payments for each of the years indicated.
Balance of Payments (Balances) (1)
| | | | | | | | | | | | | | | | | | | | | |
| | | 2008 | | 2007 | | 2006 | | 2005 | | 2004 |
| | | (EUR in millions) |
| Current account (2) | | | | | | | | | | | | | | | | | | | | |
| Foreign trade (3) | | | 178,507 | | | | 195,348 | | | | 159,048 | | | | 158,179 | | | | 156,096 | |
| Supplementary trade items | | | -12,475 | | | | -9,818 | | | | -13,106 | | | | -14,036 | | | | -16,447 | |
| Services (4) | | | -12,822 | | | | -13,312 | | | | -13,985 | | | | -25,677 | | | | -29,341 | |
| Factor income | | | 44,746 | | | | 50,643 | | | | 46,105 | | | | 24,896 | | | | 20,431 | |
| Current transfers | | | -33,088 | | | | -31,594 | | | | -27,148 | | | | -28,712 | | | | -27,849 | |
| | | | | | | | | | | | | | | | | | | | | |
Total current account | | | 164,868 | | | | 191,267 | | | | 150,913 | | | | 114,650 | | | | 102,889 | |
| Capital transfers and purchases/sales of intangible non-produced assets | | | -90 | | | | 134 | | | | -252 | | | | -1,369 | | | | 435 | |
| Capital account | | | | | | | | | | | | | | | | | | | | |
| Total net German investment abroad (increase/capital exports—negative figure) | | | -241,575 | | | | -695,904 | | | | -472,902 | | | | -399,493 | | | | -269,707 | |
| Total net foreign investment in Germany (increase/capital imports—positive figure) | | | 38,211 | | | | 458,624 | | | | 297,925 | | | | 269,858 | | | | 146,723 | |
| | | | | | | | | | | | | | | | | | | | | |
Total net capital export (5) | | | -203,364 | | | | -237,280 | | | | -174,977 | | | | -129,635 | | | | -122,984 | |
| |
| Balance of unclassifiable transactions | | | 38,585 | | | | 45,879 | | | | 24,316 | | | | 16,354 | | | | 19,660 | |
| | |
| (1) | | Figures are subject to considerable uncertainty owing to changes in the method of data collection in foreign trade. |
| |
| (2) | | Foreign trade and services are recorded on the basis of exports (f.o.b.)/imports (c.i.f.)(i.e., including the freight and insurance costs of imports). |
| |
| (3) | | Special trade according to the official foreign trade statistics. Special trade consists principally of goods that are imported into the Federal Republic for use, consumption, adaptation or processing, as well as goods that are produced, manufactured, adapted or processed in the Federal Republic and are exported. (Source: Statistisches Bundesamt, Statistisches Jahrbuch 2008, page 469). |
| |
| (4) | | Excluding the freight and insurance costs included in the c.i.f. import value. |
| |
| (5) | | Including change of currency reserves. |
Source: Deutsche Bundesbank, Statistisches Beiheft 3 zum Monatsbericht März 2009, Zahlungsbilanzstatistik, Tables I.1 and I.9.a.
Balance of Trade
The following tables show information relating to foreign trade of the Federal Republic for each of the years indicated.
Foreign Trade of Goods
| | | | | | | | | | | | | | | | | | | | | |
| | | 2008 | | 2007 | | 2006 | | 2005 | | 2004 |
| | | | | | | (EUR in millions) | | | | | | | | |
| Exports of goods (f.o.b.) | | | 992,539 | | | | 965,236 | | | | 893,042 | | | | 786,266 | | | | 731,544 | |
| Imports of goods (c.i.f.) | | | 814,033 | | | | 769,887 | | | | 733,994 | | | | 628,087 | | | | 575,448 | |
| | | | | | | | | | | | | | | | | | | | | |
Trade surplus | | | 178,507 | | | | 195,348 | | | | 159,048 | | | | 158,179 | | | | 156,096 | |
| | | | | | | | | | | | | | | | | | | | | |
Source: Deutsche Bundesbank, Statistisches Beiheft 3 zum Monatsbericht März 2009, Zahlungsbilanzstatistik, Table I.1.
The Federal Republic’s principal export goods are motor vehicles, machinery of all kinds, and electrical engineering and chemical products.
The principal import goods are chemical products, motor vehicles, crude petroleum and natural gas, machinery and metals. The Federal Republic has relatively few resources of industrial raw materials. As a result, it largely depends on imports to satisfy its demand for raw materials. This dependence on foreign supplies is particularly significant in the case of metals such as copper, bauxite, manganese, titanium, rock phosphate, tungsten and tin. The Federal Republic currently imports nearly two-thirds of its energy requirements, including
G-17
virtually all of its oil and a significant portion of its natural gas requirements as well as all enriched uranium needed for nuclear energy.
Composition of Exported and Imported Goods
| | | | | | | | | |
| | | 2008 (1) |
| | | Exports | | Imports |
| | | (EUR in billions) |
| Total | | | 994.9 | | | | 818.6 | |
Of which: | | | | | | | | |
| Coal and lignite | | | 0.3 | | | | 4.3 | |
| Crude petroleum and natural gas | | | 3.4 | | | | 82.3 | |
| Food products and beverages | | | 39.9 | | | | 37.9 | |
| Textiles | | | 11.4 | | | | 12.3 | |
| Wearing apparel, products of dressing and dyeing of fur | | | 10.4 | | | | 18.1 | |
| Pulp, paper and paper products | | | 18.0 | | | | 14.1 | |
| Coke, refined petroleum products and nuclear fuel | | | 18.1 | | | | 23.4 | |
| Chemicals and chemical products | | | 138.0 | | | | 94.8 | |
| Basic metals | | | 62.7 | | | | 63.4 | |
| Fabricated metal products, except machinery and equipment | | | 33.3 | | | | 20.1 | |
| Machinery and equipment | | | 146.9 | | | | 58.3 | |
| Office machinery and computers | | | 21.7 | | | | 28.6 | |
| Electrical machinery and apparatus | | | 52.0 | | | | 32.7 | |
| Radio, television and communication equipment, electronic components | | | 32.5 | | | | 41.2 | |
| Medical, precision and optical instruments, watches and clocks | | | 39.9 | | | | 22.6 | |
| Motor vehicles, trailers and semi-trailers | | | 174.1 | | | | 74.0 | |
Source: Statistisches Bundesamt, Imports and exports (special trade) by division of national Product Classification to Production Statistics 2008
(http://www.destatis.de/jetspeed/portal/cms/Sites/destatis/Internet/EN/Content/Statistics/Aussenhandel/Handelswaren/Tabellen/Content75/EinfuhrAusfuhrGueterabteilungen,templateId=renderPrint.psml).
G-18
Foreign Trade (Special Trade) by Groups of Countries and Countries (1)
| | | | | | | | | | | | | |
| | | 2008 | | 2007 | | 2006 |
| | | (EUR in millions) |
| Exports to: | | | | | | | | | | | | |
| Total | | | 992,539 | | | | 965,236 | | | | 893,042 | |
of which: | | | | | | | | | | | | |
| France | | | 96,859 | | | | 91,665 | | | | 85,006 | |
| United States | | | 71,467 | | | | 73,327 | | | | 77,991 | |
| United Kingdom | | | 66,788 | | | | 69,760 | | | | 64,726 | |
| The Netherlands | | | 65,644 | | | | 62,948 | | | | 56,531 | |
| Italy | | | 64,003 | | | | 64,499 | | | | 59,348 | |
| Belgium/Luxembourg | | | 56,629 | | | | 55,397 | | | | 51,141 | |
| Austria | | | 53,841 | | | | 52,813 | | | | 49,512 | |
| Spain | | | 43,704 | | | | 47,631 | | | | 41,775 | |
| Switzerland | | | 38,990 | | | | 36,373 | | | | 34,782 | |
| China (3) | | | 34,096 | | | | 29,902 | | | | 27,478 | |
| Southeast Asia (2) | | | 32,609 | | | | 32,284 | | | | 31,619 | |
| Japan | | | 12,806 | | | | 13,022 | | | | 13,886 | |
| |
| Imports from: | | | | | | | | | | | | |
| Total | | | 814,033 | | | | 769,887 | | | | 733,994 | |
of which: | | | | | | | | | | | | |
| The Netherlands | | | 72,083 | | | | 61,951 | | | | 60,750 | |
| France | | | 66,710 | | | | 62,873 | | | | 62,102 | |
| China (3) | | | 59,378 | | | | 56,417 | | | | 49,958 | |
| United States | | | 46,060 | | | | 45,993 | | | | 49,197 | |
| Italy | | | 45,962 | | | | 44,694 | | | | 41,470 | |
| United Kingdom | | | 44,261 | | | | 41,966 | | | | 40,832 | |
| Belgium/Luxembourg | | | 43,215 | | | | 39,455 | | | | 36,263 | |
| Austria | | | 33,148 | | | | 32,091 | | | | 30,301 | |
| Southeast Asia (2) | | | 32,783 | | | | 35,357 | | | | 36,113 | |
| Switzerland | | | 31,161 | | | | 29,822 | | | | 25,227 | |
| Japan | | | 23,087 | | | | 24,381 | | | | 24,016 | |
| Spain | | | 21,631 | | | | 20,687 | | | | 19,832 | |
| | |
| (1) | | Exports (f.o.b.) by country of destination, imports (c.i.f.) by country of origin. Special trade consists mainly of goods that are imported into the Federal Republic for use, consumption, adaptation or processing, as well as goods that are produced, manufactured, adapted or processed in the Federal Republic and subsequently exported. (Source: Statistisches Bundesamt, Statistisches Jahrbuch 2008, page 469). |
| |
| (2) | | Includes Brunei Darussalam, Hong Kong, Indonesia, Malaysia, Philippines, Singapore, South Korea, Taiwan and Thailand. |
| |
| (3) | | Excludes Hong Kong. |
Source: Deutsche Bundesbank, Monatsbericht März 2009, Table XI.3.
G-19
MONETARY AND FINANCIAL SYSTEM
Background of the European System of Central Banks
The European System of Central Banks (“ESCB”) comprises the European Central Bank (“ECB”) and the national central banks of the 27 Member States of the EU, while the Eurosystem consists of the ECB and the national central banks of the 16 Member States that have adopted the euro as their legal currency.
The Eurosystem is responsible for the single monetary policy for the euro area. Its decision-making bodies are the Governing Council and the Executive Board of the ECB. The national central banks of the Member States that are not part of the Eurosystem are represented in the General Council of the ECB, but have no voting right in the decision-making process, particularly with respect to monetary policy. The Eurosystem’s primary objective is to maintain price stability. It supports the general economic policies of the EU.
The Deutsche Bundesbank - Germany’s national central bank within the ESCB — has the responsibility of implementing the single monetary policy in Germany and continues to perform various other tasks, including acting as the Federal Government’s fiscal agent and playing an important role in banking and financial market supervision, as further described below under the caption “- Financial System.”
Sources: European Central Bank, Annual Report 2004, pages 162-168; European Central Bank, Slovakia joins the Euro area, press release of January 1, 2009
(http://www.ecb.int/press/pr/date/2009/html/pr090101.en.html); Deutsche Bundesbank, Tasks and Organisation
(http://www.bundesbank.de/aufgaben/aufgaben.en.php).
Monetary Policy Instruments of the ESCB
To achieve its operational goals, the ESCB conducts open market operations, offers standing facilities and requires credit institutions to maintain minimum reserves in accounts with the ESCB. Open market operations play an important role in the ESCB’s monetary policy because they steer interest rates and manage the liquidity situation in the market. Available open market operations are reverse transactions, outright transactions, the issuance of debt certificates or foreign exchange swaps, and the collection of fixed-term deposits. Standing facilities are designed to provide or absorb overnight liquidity and the imposition of minimum reserve requirements allows the ESCB to stabilize money market interest rates, create (or enlarge) a structural liquidity shortage and possibly contribute to the control of monetary expansion. While its overall monetary policy instruments remained unchanged, the ESCB changed its liquidity framework quite substantially in response to the crisis in the global financial markets. For further details on these changes, see “- Policy Response to the Crisis in the Global Financial Markets.”
Sources: European Central Bank, Annual Report 1999, pages 48-54; European Central Bank, Implementation of Monetary Policy in the Euro Area, September 2006
(http://www.ecb.int/pub/pdf/other/gendoc2006en.pdf).
Monetary Policy Strategy and Prices
The ECB’s primary goal is to maintain medium-term price stability, which is defined as a year-on-year increase in the Harmonized Index of Consumer Prices for the euro area of less than 2%. However, the ECB has clarified that, within this definition, it aims at an inflation rate close to 2%. This goal indicates the commitment to provide an adequate margin to avoid the risk of deflation. The stability-oriented monetary policy strategy of the Eurosystem used by the ECB to achieve this goal is based on two pillars: (1) analysis and assessment of short- to medium-term risks to price stability (economic analysis); and (2) assessment of medium- to long-term monetary developments (monetary analysis).
Sources: European Central Bank, Monthly Bulletin, January 1999, pages 45-50; European Central Bank, The Monetary Policy of the ECB, 2004, pp. 50ff.
(http://www.ecb.int/pub/pdf/other/monetarypolicy2004en.pdf).
The following table shows price trends in Germany for the periods indicated.
Price Trends
| | | | | | | | | | | | | | | | | | | | | |
| | | 2008 | | 2007 | | 2006 | | 2005 | | 2004 |
| | | | | | | (change from previous year in %) | | | | |
| Harmonized Index of Consumer Prices (HICP) | | | 2.8 | | | | 2.3 | | | | 1.8 | | | | 1.9 | | | | 1.8 | |
| Consumer price index (CPI) | | | 2.6 | | | | 2.3 | | | | 1.6 | | | | 1.5 | | | | 1.7 | |
| Index of producer prices of industrial products sold on the domestic market (1) | | | 5.5 | | | | 1.3 | | | | 5.4 | | | | 4.4 | | | | 1.6 | |
| | |
| (1) | | Excluding value-added tax. |
G-20
Sources: Statistisches Bundesamt, Consumer Prices, Harmonized consumer price index (2005=100) — % change on the previous year, last update 15 January 2009 (http://www.destatis.de/jetspeed/portal/cms/Sites/destatis/Internet/EN/Content/Statistics/TimeSeries/EconomicIndicators/BasicData/Content50/vpi120j.psml); Statistisches Bundesamt, Consumer Prices, Consumer price index for Germany (2005=100) — % change on the previous year, last update 10 March 2009
(http://www.destatis.de/jetspeed/portal/cms/Sites/destatis/Internet/EN/Content/Statistics/TimeSeries/EconomicIndicators/BasicData/Content100/vpi101j,templateId=renderPrint.psml) ; Deutsche Bundesbank, Monatsbericht März 2009, Table X.7; Deutsche Bundesbank, Monatsbericht Februar 2008, Table X.7.
Official Foreign Exchange Reserves
The following table shows the breakdown of the Federal Republic’s official foreign exchange reserves as of the end of the years indicated.
Official Foreign Exchange Reserves of the Federal Republic (1)
| | | | | | | | | | | | | | | | | | | | | |
| | | As of December 31, |
| | | 2008 | | 2007 | | 2006 | | 2005 | | 2004 |
| | | (EUR in millions) |
| Gold | | | 68,194 | | | | 62,433 | | | | 53,114 | | | | 47,924 | | | | 35,495 | |
| Foreign currency balances | | | 27,705 | | | | 27,694 | | | | 28,640 | | | | 33,708 | | | | 29,292 | |
| International Monetary Fund Reserve position and special drawing rights | | | 3,285 | | | | 2,418 | | | | 3,011 | | | | 4,549 | | | | 6,548 | |
| | | | | | | | | | | | | | | | | | | | | |
Total | | | 99,185 | | | | 92,545 | | | | 84,765 | | | | 86,181 | | | | 71,335 | |
| | | | | | | | | | | | | | | | | | | | | |
| | |
| (1) | | External position of the Deutsche Bundesbank in the EMU. Assets and liabilities vis-à-vis all EMU member countries and non-EMU member countries. |
Source: Deutsche Bundesbank, Monatsbericht Februar 2009, Table XI.9.
The Federal Republic’s foreign reserve assets are managed by the Deutsche Bundesbank. The 16 Member States participating in the EMU have transferred foreign reserve assets in an aggregate amount equivalent to approximately EUR 40.1 billion to the ECB, consisting of foreign currency reserves and gold. The ECB manages the foreign reserve assets transferred to it. The foreign reserve assets not transferred to the ECB continue to be held and managed by the national central banks of the 16 participating Member States. In order to ensure consistency within the single monetary and foreign exchange policies of the EMU, the ECB monitors and coordinates market transactions conducted with those assets.
Sources: European Central Bank, Annual Report 1998, page 74; European Central Bank, Annual Report 2008, page 217
(http://www.ecb.int/pub/pdf/annrep/ar2008en.pdf).
G-21
External Positions of Banks
The following table shows the external assets and liabilities of the Deutsche Bundesbank and the banks (monetary financial institutions) of the Federal Republic as of the end of each of the years indicated.
External Financial Assets and Liabilities by Sector
| | | | | | | | | | | | | | | | | | | | | |
| | | 2008 | | 2007 | | 2006 | | 2005 | | 2004 |
| | | | | | | (EUR in billions) | | | | |
| Deutsche Bundesbank | | | | | | | | | | | | | | | | | | | | |
| Assets | | | 230.8 | | | | 179.5 | | | | 104.4 | | | | 130.3 | | | | 93.1 | |
| Liabilities | | | 30.2 | | | | 16.0 | | | | 4.8 | | | | 6.3 | | | | 7.9 | |
| | | | | | | | | | | | | | | | | | | | | |
| Net position | | | 200.6 | | | | 163.5 | | | | 99.6 | | | | 124.0 | | | | 85.2 | |
| Banks | | | | | | | | | | | | | | | | | | | | |
| Loans to foreign banks | | | 1,446.6 | | | | 1,433.5 | | | | 1,266.9 | | | | 1,038.8 | | | | 889.4 | |
| Loans to foreign non-banks | | | 908.4 | | | | 908.3 | | | | 777.0 | | | | 712.0 | | | | 629.5 | |
| Loans from foreign banks | | | 703.3 | | | | 738.9 | | | | 689.7 | | | | 651.7 | | | | 603.3 | |
| Loans from foreign non-banks | | | 286.1 | | | | 303.1 | | | | 310.1 | | | | 316.4 | | | | 311.2 | |
Source: Deutsche Bundesbank, Monatsbericht Februar 2009, Tables IV.4 and XI.9.
Foreign Exchange Rates and Controls
The euro is a freely convertible currency. Since its introduction, the euro has become the second most widely used currency internationally. Currency transactions do not require licenses or other permissions. Capital market transactions are not subject to any license or similar requirements. Gold may be imported and exported freely, subject only to the levy of VAT on some transactions.
The following table shows the annual average exchange rates for selected currencies in relation to the euro for the past five years.
Annual Average Exchange Rates of the euro (1)
| | | | | | | | | | | | | | | | | | | | | |
| | | 2008 | | 2007 | | 2006 | | 2005 | | 2004 |
| U.S. dollars per euro | | | 1.4708 | | | | 1.3705 | | | | 1.2556 | | | | 1.2441 | | | | 1.2439 | |
| Pound sterling per euro | | | 0.79628 | | | | 0.68434 | | | | 0.68173 | | | | 0.68380 | | | | 0.67866 | |
| Japanese yen per euro | | | 152.45 | | | | 161.25 | | | | 146.02 | | | | 136.85 | | | | 134.44 | |
| Swiss franc per euro | | | 1.5874 | | | | 1.6427 | | | | 1.5729 | | | | 1.5483 | | | | 1.5438 | |
| | |
| (1) | | Calculated from daily values. |
Source: Deutsche Bundesbank, Monthly Report February 2009, Table XI.11.
Financial System
As of January 31, 2009, 1,976 monetary financial institutions in Germany reported an aggregate balance sheet total of EUR 7,970.4 billion to the Deutsche Bundesbank. According to the Deutsche Bundesbank’s classification, these institutions included 271 commercial banks (with an aggregate balance sheet total of EUR 2,460.7 billion), 434 savings banks (with an aggregate balance sheet total of EUR 1,058.2 billion) and their 10 regional institutions (including 9 Landesbanken and Deka-Bank Deutsche Girozentrale, the central asset managing institution of the German savings banks and Landesbanken, with an aggregate balance sheet total of EUR 1,578.2 billion), 18 special-purpose credit institutions (with an aggregate balance sheet total of EUR 905.7 billion), 1,197 credit cooperatives (with an aggregate balance sheet total of EUR 666.5 billion) and their two central institutions (with an aggregate balance sheet total of EUR 274.5 billion), 19 mortgage banks (with an aggregate balance sheet total of EUR 837.8 billion) and 25 building and loan associations (with an aggregate balance sheet total of EUR 188.8 billion). Also included in this classification are the 149 subsidiaries and branches of foreign banks located in the Federal Republic, with an aggregate balance sheet total of EUR 891.5 billion.
G-22
The Deutsche Bundesbank also publishes separate data for the five German “big banks” (Großbanken) as a subcategory of commercial banks that operate nationwide. As of January 31, 2009, these five big banks reported an aggregate balance sheet total of EUR 1,482.7 billion. In early 2009, two major transactions within the German financial sector were finalized, in which four of the five big banks participated. On January 12, 2009, Commerzbank AG (“Commerzbank”), Germany’s second largest bank in terms of total assets, announced that it had completed a 100% takeover of Dresdner Bank AG. On February 25, 2009, Deutsche Bank AG, Germany’s largest bank in terms of total assets, announced that it had acquired a stake of 25% plus one share in Deutsche Postbank AG, which provides it with a blocking majority for certain material corporate decisions.
Sources: Deutsche Bundesbank, Monatsbericht März 2009, Table IV.2; Deutsche Bank AG, Deutsche Bank and Deutsche Post close Postbank transaction, press release of February 25, 2009
(http://www.deutsche-bank.de/presse/en/content/press_releases_4380.htm); Commerzbank AG, Commerzbank: Dresdner Bank takeover closed, press release of January 12, 2009
(https://www.commerzbank.de/en/hauptnavigation/presse/archiv_/presse_mitteilungen/2009/quartal_09_01/presse_archiv_detail_09_01_5068.html).
All banks other than the Deutsche Bundesbank and KfW are regulated by the German Banking Act. German commercial banking institutions operate as “universal” banks and are not restricted by law or otherwise from offering a complete range of diverse financial services.
The Financial Supervisory Authority (Bundesanstalt für Finanzdienstleistungsaufsicht, or “BaFin”) is responsible for the integrated supervision of financial services. Its primary objective is to guarantee the proper functioning, stability and integrity of the German financial system. The Financial Supervisory Authority operates exclusively in the public interest. It seeks to ensure the ability of banks, financial services institutions and insurance companies to meet their payment obligations (solvency supervision), and it also enforces standards of professional conduct aimed at preserving investors’ trust in the financial markets (market supervision). In addition, the Financial Supervisory Authority has an investor protection role in that it seeks to prevent unauthorized financial business from being carried out. The Deutsche Bundesbank is closely involved in the ongoing supervision of the banking sector by the Financial Supervisory Authority. A new supervisory guideline, which clarifies the assignment of tasks between the two authorities, entered into force in February 2008. According to these guidelines, the Financial Supervisory Authority is responsible for all supervisory measures, while most of the ongoing operational tasks in banking supervision are assigned to the Deutsche Bundesbank.
In light of the ongoing crisis in the global financial markets, the Federal Government in March 2009 announced its intention to broaden the BaFin’s regulatory competence. Among other things, the BaFin shall be vested with increased powers to set higher liquidity and capital requirements for individual banks, prohibit the distribution of profits of troubled financial institutions, and remove unprofessional or unreliable persons from the supervisory bodies of financial institutions. In addition, more stringent reporting requirements to the BaFin for financial institutions in Germany are planned.
Sources: Bundesministerium der Finanzen, press release of March 22, 2002; Bundesanstalt für Finanzdienstleistungsaufsicht, BaFin, Functions
(http://www.bafin.de/cln_043/nn_721302/EN/BaFin/Functions/functions__node.html?__nnn=true); Deutsche Bundesbank and Bundesanstalt für Finanzdienstleistungsaufsicht, joint press release of November 4, 2002
(http://www.bundesbank.de/download/presse/pressenotizen/2002/20021104bbk1_en.pdf); Bundesanstalt für Finanzdienstleistungsaufsicht, Aufsichtsrichtlinie — Richtlinie zur Durchführung und Qualitätssicherung der laufenden Überwachung der Kredit- und Finanzdienstleistungsinstitute durch die Deutsche Bundesbank (AufsichtsRL), February 21, 2008
(http://www.bafin.de/cln_051/nn_722564/SharedDocs/Aufsichtsrecht/DE/Richtlinien/rl__080221__aufsicht srichtlinie.html); Bundesministerium der Finanzen, Finanzmarktaufsicht wird verbessert, March 25, 2009
(http://www.bundesfinanzministerium.de/nn_54/DE/Wirtschaft__und__Verwaltung/Finanz__und__Wirtschaftspolitik/Entw__Finanzmarktaufsicht__Haupt.html?__nnn=true) ; Bundesministerium der Finanzen, Gesetz zur Stärkung der Finanzmarkt- und Versicherungsaufsicht, draft bill
(http://www.bundesfinanzministerium.de/nn_4328/DE/BMF__Startseite/Aktuelles/Aktuelle__Gesetze/Gesetzentwuerfe__Arbeitsfassungen/Entw__Finanzmarktaufsicht__anl,templateId=raw,property=publicationFile.pdf); Bundesregierung, Aufsicht über die Finanzmärkte verbessern, March 25, 2009
(http://www.bundesregierung.de/nn_1264/Content/DE/Artikel/2009/03/2009-03-25-finanzmarktaufsicht.html).
Securities Market
The Federal Republic’s securities market is among Europe’s largest. Trading in listed securities is not legally or otherwise confined to the stock exchanges. It is estimated, however, that most transactions in equity securities are executed through stock exchanges. By contrast, debt securities, although typically listed, are predominantly traded over-the-counter.
G-23
Highly developed secondary markets, combined with the distribution capabilities of an extensive network of financial institutions, provide the basis for the Federal Republic’s position in the world’s capital markets. Equity and debt issues are generally underwritten and distributed through banking syndicates, which typically include commercial banks as well as certain regional and specialized institutions. The official securities markets of Berlin, Dusseldorf, Frankfurt am Main, Hamburg, Hanover, Munich and Stuttgart, the futures and options exchange Eurex Deutschland and the commodities and commodity derivatives exchange, the Risk Management Exchange and the European Energy Exchange are recognized as regulated markets of the EU according to Article 47 of Directive 2004/39/EC on Markets in Financial Instruments and comply with worldwide accepted regulatory standards.
The most important stock exchange in the Federal Republic is the Frankfurt Stock Exchange, operated by Deutsche Börse AG. The Frankfurt Stock Exchange had a total turnover of EUR 5,354.5 billion in 2008, accounting for 88.3% of the total turnover on German securities exchanges.
Source: Deutsche Börse, Cash Market: Monthly Statistics — February 2009, page 3
(http://deutsche-boerse.com/INTERNET/IP/ip_stats.nsf/(KIR+Monatsstatistik+Kassamarkt+E)/7D4E52BDACB2D5E5C125756F00572A37/$FILE/fwb_monthly.pdf)
Policy Response to the Crisis in the Global Financial Markets
Financial Market Stabilization Fund
In October 2008, the legislature adopted the Law on the Implementation of a Package of Measures to Stabilize the Financial Markets (Finanzmarktstabilisierungsgesetz) (the “Stabilization Law”). On October 20, 2008, the Federal Government established and adopted the implementing rules for the Financial Market Stabilization Fund (Finanzmarktstabilisierungsfonds) (the “Fund”) provided for by the Stabilization Law. The stabilization measures extended by the Fund include Government guarantees of up to a total amount of EUR 400 billion as well as recapitalization measures and risk assumption for troubled assets of up to a total amount of EUR 80 billion to stimulate bank refinancing and to ensure the availability of loans for the economy. In late October 2008, the European Commission approved the Stabilization Law under EU state aid rules.
As of early May 2009, a number of support measures had been implemented under the Stabilization Law, including recapitalization measures for Commerzbank, under which the Fund intends to acquire a 25% plus one share stake in Commerzbank, and the extension of guarantees by the Fund in connection with eight bond issuances by German financial institutions.
On March 20, 2009, the Bundestag approved an amendment to the Stabilization Law (Finanzmarktstabilisierungsergänzungsgesetz). The approval by the Bundesrat followed on April 3, 2009. The amendment aims to improve the effectiveness of stabilization measures. It includes, among other things, as a means of last resort to prevent the failure of systemically relevant financial institutions, a temporary authorization of the Federal Government to nationalize such financial institutions through expropriation of shareholders in return for appropriate compensation. The authorization expires on June 30, 2009. In addition, the amendment extends the maximum term of maturity of guarantees granted by the Fund from 36 months to 60 months.
�� On April 9, 2009, the Federal Republic, acting through the Fund, decided to launch a tender offer for all shares of Hypo Real Estate Holding AG (“HRE”), a troubled German financial institution. As of May 4, 2009, 24:00 hours CET, the expiration time of the tender offer, the Federal Republic held approximately 47.31% of the registered share capital and voting rights of HRE. On this basis, the takeover to stabilize HRE by the Federal Republic is expected to continue swiftly. It is envisaged that an extraordinary general meeting to be held on June 2, 2009, shall approve a capital increase in order to continue the takeover of HRE. The Federal Republic, acting through the Fund, is aiming for a complete takeover of the shares of HRE.
Sources: Gesetz zur Umsetzung eines Maßnahmenpakets zur Stabilisierung des Finanzmarktes (Finanzmarktstabilisierungsgesetz — FMStG), October 17, 2008
(http://www.bundesfinanzministerium.de/nn_82/DE/BMF__Startseite/Aktuelles/Aktuelle__Gesetze/Gesetze__Verordnungen/Finanzmarktstabi.html); Verordnung zur Durchführung des Finanzmarktstabilisierungsfondsgesetzes (Finanzmarktstabilisierungsfonds-Verordnung — FMStFV), October 20, 2008
(http://www.bundesfinanzministerium.de/nn_4312/DE/BMF__Startseite/Aktuelles/Aktuelle__Gesetze/Gesetze__Verordnungen/Finanzmarktstabilisierungsfonds__Verordnung.html ); Bundesregierung beschließt Rechtsverordnung zum Finanzmarktstabilisierungsgesetz, press release of the Federal Ministry of Finance dated November 20, 2008
(http://www.bundesfinanzministerium.de/nn_53532/DE/Presse/Pressemitteilungen/Finanzpolitik/2008/10/20082010__PM53.html ); Stabilisierung der Finanzmärkte, publication of the Federal Ministry of Finance dated November 20, 2008 (http://www.bundesfinanzministerium.de/nn_69116/DE/Wirtschaft__und__Verwaltung/Finanz__und__Wirtschaftspolitik/Finanzpolitik/122__Paket__Finanzmaerkte.html ); Freie Fahrt für den Stabilisierungsfonds - - EU-Kommission genehmigt den deutschen Bankenschirm, joint press release of the Federal Ministry of Economy
G-24
and Technology and the Federal Ministry of Finance dated October 28, 2008
(http://www.bmwi.de/BMWi/Navigation/Presse/pressemitteilungen,did=276582.html); Rettungspaket fürBanken greift, publication of the Federal Ministry of Finance dated November 6, 2008
(http://www.bundesfinanzministerium.de/nn_54/DE/Buergerinnen__und__Buerger/Gesellschaft__und__Zukunft/finanzkrise/074__wirks__Bankenpaket.html?__nnn=true); Maßnahmenpaket zur Stabilisierung derFinanzmärkte, publication of the Federal Ministry of Finance
(http://www.bundesfinanzministerium.de/nn_69116/DE/Wirtschaft__und__Verwaltung/Finanz__und__Wirtschaftspolitik/Finanzpolitik/schaubild/schaubild.html); List of issues guaranteed by Soffin, published by the Financial Market Stabilization Fund
(http://www.soffin.de/leistungen_garantien.en.php?sub=3 ); Bundesministerium der Finanzen, Stärkung der Commerzbank ist wichtig für Deutschland, publication of January 9, 2009
(http://www.bundesfinanzministerium.de/nn_53848/sid_CC6D41EC0E784EF629D76D612B6DBD29/DE/Wirtschaft__und__Verwaltung/Finanz__und__Wirtschaftspolitik/Finanzpolitik/013a__Commerzbank.html?__nnn=true);Bundesregierung, Verstaatlichung von Banken als allerletztes Mittel, press release of March 20, 2009
(http://www.bundesregierung.de/Content/DE/Artikel/2009/02/2009-02-18-ergaenzung-finanzmarktstabilisierungsgesetz.html); Bundesministerium der Finanzen, Bundesregierung beschließt wichtige Ergänzungenzum Finanzmarktstabilisierungsgesetz, press release of February 18, 2009
(http://www.bundesfinanzministerium.de/nn_54090/DE/Presse/Pressemitteilungen/Finanzpolitik/2009/02/20091802__PM7.html); Bundesministerium der Finanzen, Finanzmarktstabilisierungsergänzungsgesetz, draft bill
(http://www.bundesfinanzministerium.de/nn_82/DE/BMF__Startseite/Aktuelles/Aktuelle__Gesetze/Gesetzentwuerfe__Arbeitsfassungen/entw__Finanzmarktstabilisierungsergaenzungsgesetz__anl,templateId=raw,property=publicationFile.pdf); Bundesministerium der Finanzen, Bundesländer stimmen zu, April 3, 2009
(http://www.bundesfinanzministerium.de/nn_54/DE/Wirtschaft__und__Verwaltung/Finanz__und__Wirtschaftspolitik/Foederale__Finanzbeziehungen/116-Finanzmarktstabilisierungsgesetz.html?__nnn=true); SoFFin, Public takeover offer by the Federal Republic of Germany, acting through the Financial Market Stabilization Fund, represented by the Financial Market Stabilization Agency, to the shareholders of Hypo Real Estate Holding AG
(http://w3.cantos.com/09/soffin-904-d71oz/index.php); SoFFin, Federal Republic of Germany acting through the Financial Market Stabilization Fund represented by the Financial Market Stabilization Agency, Notice persuant to § 23 para. 1 sentence 1 no. 2 of the German Securities Acquisition and Takeover Act
(http://w3.cantos.com/09/soffin-904-d71oz/documents/Finale_Bekanntmachung_090507_englisch_.pdf); SoFFin, SoFFin holds 47.31 percent of Hypo Real Estate Holding AG (HRE) after expiration of acceptance period, press release of May 7, 2009 (http://www.soffin.de/presse.en.php?sub=5).
Policy Response by the European Central Bank
In response to the crisis in the global financial markets, the ECB has provided substantial amounts of liquidity to the European financial sector. The provision of liquidity measures have been accompanied by extensive changes in the liquidity framework of the ECB, including an expansion of assets eligible as collateral in the Eurosystem, enhanced open market operations, the provision of US dollar liquidity to Eurosystem counterparties, the provision of euro liquidity to central banks outside the Eurosystem and changes in the ECB standing facility rates corridor. In line with its enhanced liquidity operations, the balance sheet of the ECB grew from EUR 126.0 billion as of December 31, 2007 to EUR 383.9 billion as of December 31, 2008. In addition to these liquidity measures, the ECB lowered its key interest rate from 4.25% in July 2008 to 1.00% in early May 2009 - - the lowest interest rate level since the introduction of the euro in 1999. Also in early May 2009, the ECB decided to implement further measures, including the conduct of liquidity-providing longer-term refinancing operations with a maturity of one year, the acceptance of the European Investment Bank as eligible counterparty in the Eurosystem’s monetary policy operations, and, in principle, the purchase of euro-denominated covered bonds issued in the euro area.
Sources: European Central Bank, key interest rates
(http://www.ecb.int/stats/monetary/rates/html/index.en.html); European Central Bank, Annual Report 2007, p. 210; European Central Bank, Annual Accounts 2008, p. 3; European Central Bank, Specific measures to address liquidity pressures in funding markets, press release of March 11, 2008
(http://www.ecb.int/press/pr/date/2008/html/pr080311.en.html); European Central Bank, Changes in tender procedure and in the standing facility corridor, press release of October 8, 2008
(http://www.ecb.int/press/pr/date/2008/html/pr081008_2.en.html); European Central Bank, Measures to further expand the collateral framework and enhance the provision of liquidity, press release of October 15, 2008
(http://www.ecb.europa.eu/press/pr/date/2008/html/pr081015.en.html); European Central Bank, Magyar Nemzeti Bank and European Central Bank cooperation to support the MNB’s Euro Liquidity Providing Instruments, press release of October 16, 2008
(http://www.ecb.int/press/pr/date/2008/html/pr081016.en.html); European Central Bank, longer-term refinancing operations, press release of May 7, 2009
(http://www.ecb.int/press/pr/date/2009/html/pr090507_2.en.html); European Central Bank, EIB becomes an eligible counterparty in the Eurosystem’s monetary policy operations
G-25
(http://www.ecb.int/press/pr/date/2009/html/pr090507_1.en.html); European Central Bank, Introductory Statement, May 7, 2009 (http://www.ecb.int/press/pressconf/2009/html/is090507.en.html).
Other Measures to Stabilize the Financial Markets
In September 2008, the BaFin prohibited naked short selling (uncovered short selling transactions) in shares of eleven major financial institutions in Germany. Naked short selling is the sale of shares by a person who does not own or does not have a plea-proof claim to transfer of title in shares of the same class at the time of the transaction. The prohibition was originally limited in time until December 31, 2008, but was later extended until May 31, 2009.
Sources: BaFin, BaFin bans short selling — eleven stocks concerned, Decree of September 19, 2008
(http://www.bafin.de/cln_116/nn_720788/SharedDocs/Mitteilungen/EN/2008/pm__080919__leerv__en.html); BaFin, General Decree of BaFin on September 21, 2008
(http://www.bafin.de/cln_116/nn_720788/SharedDocs/Aufsichtsrecht/EN/Verfuegungen/vf__080921__leerverk__en.html); BaFin, General Decree of BaFin
(http://www.bafin.de/cln_116/nn_720788/SharedDocs/Aufsichtsrecht/EN/Verfuegungen/vf__081219__leerverk__verlaeng__en.html); BaFin, Leerverkaufsverbot weiter verlängert
(http://www.bafin.de/cln_116/nn_722758/SharedDocs/Aufsichtsrecht/DE/Verfuegungen/vf__090330__leerverk__verlaenger.html).
PUBLIC FINANCE
Receipts and Expenditures
The Federal Government, each of the Länder governments and each of the municipalities (Gemeinden) have separate budgets. The federal budget is the largest single public budget.
The fiscal year of the Federal Republic is the calendar year. The annual federal budget is passed by an act of Parliament. On the basis of a proposal prepared by the Ministry of Finance, the Federal Government introduces the Federal Budget Bill to the Parliament, generally in the fall of each year. The proposal has to pass through three Bundestag sessions, the budget committee of the Bundestag, and the Bundesrat, which deliberates the proposal twice. The final vote on the proposal is taken by the Bundestag in its third session.
In addition to the federal, Länder and municipal budgets, there are separate budgets for the social security funds and various special funds (Sondervermögen) of the federal administration that are created for specific public purposes. General government, as defined in the national accounts, comprises all these different levels of government activity.
In 2008, total consolidated general government revenue as presented in the national accounts amounted to EUR 1,091.1 billion, with tax revenue of EUR 593.2 billion and social contributions of EUR 407.8 billion.
Source: Statistisches Bundesamt, Fachserie 18, Reihe 1.4 — 2008 (March 2009), Table 3.4.3.2.
In 2008, the value added tax and the taxes on income and wealth as presented in the national accounts amounted to EUR 172.5 billion and EUR 280.5 billion, respectively. In addition to these taxes, the Federal Government, the Länder governments and the municipal authorities each levied special taxes, for example on tobacco, beer and motor vehicles. The joint taxes are distributed among the Federal Government, the Länder governments and municipal authorities, according to a predetermined formula.
Source: Statistisches Bundesamt, Fachserie 18, Reihe 1.4 — 2008 (March 2009), Table 3.4.3.20.
Consolidated general government expenditure in 2008, as presented in the national accounts, amounted to a total of EUR 1,094.4 billion. The most significant consolidated general government expenditures were monetary social benefits (EUR 421.2 billion), social benefits in kind (EUR 185.7 billion) and employee compensation (EUR 171.5 billion). Other significant consolidated general government expenditure included intermediate consumption (EUR 107.2 billion), interest on public debt (EUR 69.0 billion), and gross capital formation (EUR 38.0 billion).
Source: Statistisches Bundesamt, Fachserie 18, Reihe1.4 — 2008 (March 2009), Table 3.4.3.2
G-26
General Government Accounts (1)
| | | | | | | | | | | | | | | | | | | | | |
| | | 2008 | | 2007 | | 2006 | | 2005 | | 2004 |
| | | (EUR in billions) |
Federal Government, Länder governments and municipalities Revenue | | | 707.9 | | | | 687.4 | | | | 638.9 | | | | 603.9 | | | | 580.7 | |
of which: Taxes (2) | | | 593.2 | | | | 576.3 | | | | 530.5 | | | | 493.2 | | | | 481.3 | |
| Expenditure | | | 718.9 | | | | 701.9 | | | | 679.8 | | | | 674.1 | | | | 663.0 | |
| | | | | | | | | | | | | | | | | | | | | |
Balance | | | -11.0 | | | | -14.6 | | | | -40.9 | | | | -70.2 | | | | -82.3 | |
| Social security funds Revenue | | | 486.4 | | | | 477.3 | | | | 471.8 | | | | 466.9 | | | | 466.8 | |
| Expenditure | | | 478.7 | | | | 466.9 | | | | 466.8 | | | | 470.9 | | | | 468.1 | |
| | | | | | | | | | | | | | | | | | | | | |
Balance | | | 7.7 | | | | 10.4 | | | | 5.0 | | | | -4.1 | | | | -1.2 | |
| General Government Revenue | | | 1,091.1 | | | | 1,065.9 | | | | 1,016.4 | | | | 976.2 | | | | 957.7 | |
| Expenditure | | | 1,094.4 | | | | 1,070.1 | | | | 1,052.3 | | | | 1,050.5 | | | | 1,041.2 | |
| | | | | | | | | | | | | | | | | | | | | |
Balance | | | -3.3 | | | | -4.2 | | | | -35.9 | | | | -74.3 | | | | -83.5 | |
| | | | | | | | | | | | | | | | | | | | | |
| | |
| (1) | | Definition according to the national accounts. |
| |
| (2) | | Excluding capital taxes and taxes of domestic sectors to EU. |
Source: Statistisches Bundesamt, Fachserie 18, Reihe 1.4 — 2008 (March 2009), Tables 3.4.3.2, 3.4.3.3 and 3.4.3.7.
Federal Government Accounts (1)
| | | | | | | | | | | | | | | | | | | | | |
| | | 2008 | | 2007 | | 2006 | | 2005 | | 2004 |
| | | | | | | (EUR in billions) | | | | |
| Revenue | | | 327.7 | | | | 317.1 | | | | 293.2 | | | | 277.4 | | | | 261.7 | |
of which: Taxes (2) | | | 295.0 | | | | 287.0 | | | | 263.0 | | | | 248.1 | | | | 240.1 | |
| Expenditure | | | 343.5 | | | | 343.2 | | | | 327.8 | | | | 325.1 | | | | 313.8 | |
| | | | | | | | | | | | | | | | | | | | | |
Balance | | | -15.8 | | | | -26.2 | | | | -34.6 | | | | -47.7 | | | | -52.1 | |
| | | | | | | | | | | | | | | | | | | | | |
| | |
| (1) | | Definition according to the national accounts. |
| |
| (2) | | Excluding taxes of domestic sectors to EU. |
Source: Statistisches Bundesamt, Fachserie 18, Reihe 1.4 — 2008 (March 2009), Table 3.4.3.4.
G-27
General Government Expenditure: Breakdown by Functions (1)
| | | | | | | | | | | | | | | | | | | | | |
| | | 2008 | | 2007 | | 2006 | | 2005 | | 2004 |
| | | | | | | (EUR in billions) | | | | |
| General public services | | | 149.9 | | | | 144.5 | | | | 140.6 | | | | 136.5 | | | | 134.4 | |
| Defense | | | 26.6 | | | | 25.6 | | | | 24.8 | | | | 24.7 | | | | 24.7 | |
| Public order and safety | | | 38.5 | | | | 37.2 | | | | 36.7 | | | | 37.0 | | | | 36.5 | |
| Economic affairs | | | 86.5 | | | | 85.3 | | | | 75.4 | | | | 79.5 | | | | 81.0 | |
| Environmental protection | | | 12.1 | | | | 11.7 | | | | 11.1 | | | | 10.7 | | | | 10.8 | |
| Housing and community amenities. | | | 19.4 | | | | 20.5 | | | | 21.9 | | | | 22.9 | | | | 23.6 | |
| Health | | | 155.2 | | | | 148.7 | | | | 143.4 | | | | 139.7 | | | | 135.4 | |
| Recreation, culture and religion | | | 15.1 | | | | 14.4 | | | | 13.8 | | | | 14.0 | | | | 14.1 | |
| Education | | | 99.8 | | | | 96.5 | | | | 94.9 | | | | 94.5 | | | | 94.3 | |
| Social protection | | | 491.3 | | | | 485.7 | | | | 489.8 | | | | 490.8 | | | | 486.4 | |
| | | | | | | | | | | | | | | | | | | | | |
Total expenditure | | | 1,094.4 | | | | 1,070.1 | | | | 1,052.3 | | | | 1,050.5 | | | | 1,041.2 | |
| | | | | | | | | | | | | | | | | | | | | |
| | |
| (1) | | Definition according to the national accounts. |
Source: Statistisches Bundesamt, Fachserie 18, Reihe 1.4 — 2008 (March 2009), Table 3.4.3.17.
Germany’s General Government Deficit/Surplus and the Stability Program
For purposes of the Member States’ reports to the European Commission under the EDP, the general government or “Maastricht“ deficit/surplus refers to the difference between consolidated public sector revenue and consolidated public sector expenditure and is the balancing item “net borrowing/net lending” of general government as defined in the European System of National Accounts 1995, but including streams of interest payments resulting from swap arrangements and forward-rate agreements. The general government surplus (as defined under the EDP) in the amount of EUR 0.4 billion, or 0.0% of nominal GDP, that was initially reported for 2007, was later revised to a deficit of EUR 4.0 billion, or 0.2% of nominal GDP, respectively, because of a decision by Eurostat requiring that the measures taken by KfW in 2007 in connection with the risk protection for IKB be recorded in the general government accounts. In 2008, the general government deficit was EUR 3.3 billion, or 0.1% of nominal GDP. The debt-to-GDP ratio increased from 65.1% in 2007 to 65.9% in 2008, which is above the EU’s 60% reference value.
Source: Statistisches Bundesamt, Maastricht deficit ratio for 2007 amounting to 0.2%, press release of October 28, 2008
(http://www.destatis.de/jetspeed/portal/cms/Sites/destatis/Internet/EN/press/pr/2008/10/PE08__394__813,templateId=renderPrint.psml); Eurostat, Euro area and EU27 government deficit at 1.9% and 2.3% of GDP respectively, press release of April 22, 2009
(http://epp.eurostat.ec.europa.eu/cache/ITY_PUBLIC/2-22042009-BP/EN/2-22042009-EN-BP.PDF).
The following table shows historical information on the Federal Republic’s general government deficit/surplus and debt as a percentage of GDP.
G-28
The Federal Republic’s Fiscal Maastricht Criteria
| | | | | | | | | | | | | | | | | | | | | |
| | | 2008 (1) | | 2007 | | 2006 | | 2005 | | 2004 |
| | | (as % of GDP) |
| General government deficit (-) / surplus (+) (2) | | | -0.1 | | | | -0.2 | | | | (-1.5 | ) | | | -3.3 | | | | -3.8 | |
| General government gross debt | | | 65.9 | | | | 65.1 | | | | 67.6 | | | | 67.8 | | | | 65.6 | |
| | |
| (1) | | Provisional figures, partly estimated. |
| |
| (2) | | Definition according to the reporting under the EDP: For purposes of the Member States’ reports to the European Commission under the EDP, “general government deficit/surplus” is the balancing item “net borrowing/net lending” of general government as defined in the national accounts, but including streams of interest payments resulting from swap arrangements and forward-rate agreements. |
Source: Deutsche Bundesbank, Monatsbericht März 2009, Table IX.1 ; Eurostat, Euro area and EU27 government deficit at 1.9% and 2.3% of GDP respectively, press release of April 22, 2009
(http://epp.eurostat.ec.europa.eu/cache/ITY_PUBLIC/2-22042009-BP/EN/2-22042009-EN-BP.PDF).
In 2008, economic development of the Federal Republic was characterized by the further intensifying crisis in the global financial markets accompanied by a severe economic downturn over the course of the year. In order to increase the stability of financial markets, the legislature passed the Stabilization Law and the amendment to the Stabilization Law. Furthermore, a number of measures to support macroeconomic demand were adopted. Both the financial market stabilization efforts and the stimulus measures will affect the general government deficit in 2009 and the following years. For more information on these measures, see “The Economy — Economic Policy - Stimulus Packages” and “Monetary and Financial System — Policy Response to the Crisis in the Global Financial Markets — Fund for the Stabilization of the Financial Market”. According to the January 2009 addendum to the update of the German stability program, the deficit is expected to rise to approximately 3% of nominal GDP in 2009 and to approximately 4% in 2010. The deficit forecast for 2009 as presented in the Federal Republic’s January 2009 addendum to the update of the German stability program was calculated based on a forecasted decline in real GDP of 21/4% in 2009. From 2011 onwards, it is expected that the deficit will once again fall below the Maastricht reference value of 3% of nominal GDP. With respect to 2009, this view was confirmed in the EDP notification table submitted by the Federal Republic to the European Commission in April 2009, according to which the deficit in 2009 is expected to be equal to 2.9% of nominal GDP. The European Commission, however, is more pessimistic with respect to both the short-term prospects of Germany’s public finances and the growth outlook. In its spring forecast published in early May 2009, the European Commission predicts that Germany will exceed the 3% threshold for the deficit in 2009, based on its forecast of a decline in real GDP of 5.4% for Germany in the year. In particular, the European Commission expects the deficit ratio to equal almost 4% of GDP in 2009 as a consequence of the economic downturn, with a further increase in the deficit ratio to almost 6% of GDP in 2010. The deficit is forecast to increase as a result of sizeable tax revenue losses and higher expenditure due to automatic stabilizers and the stimulus packages amounting to around 11/2% of GDP for 2009 and 2% of GDP for 2010 according to the European Commission’s estimates. In light of the enormous fiscal burden caused by the various rescue and stimulus packages in the Member States, the Ecofin Council has emphasized its strong commitment to sound public finances and to the Stability and Growth Pact. However, the EcoFin Council has also stated that the flexibility provided by the Pact in order to deal with exceptional macroeconomic situations will be taken into account in appraising the fiscal situation of Member States as well as differences in fiscal latitude.
The Federal Republic’s debt-to-GDP ratio is projected to increase to 681/2% of nominal GDP in 2009 and to 721/2% in 2012 and thus would continue to exceed the relevant EU’s reference value of 60% of nominal GDP according to the January 2009 addendum to the update of the German stability program. According to its spring forecast, the European Commission is projecting even higher debt ratios for Germany, amounting to 73.4% of GDP in 2009 and 78.7% of GDP in 2010.
Sources: Statistisches Bundesamt, Staat schließt 2008 mit einem Defizit von 3,3 Milliarden Euro ab, press release of February 25, 2009
(http://www.destatis.de/jetspeed/portal/cms/Sites/destatis/Internet/DE/Presse/pm/2009/02/PD09__062__813,templateId=renderPrint.psml);
Bundesministerium der Finanzen, Addendum to the Update of the German Stability Program
(http://ec.europa.eu/economy_finance/publications/publication13915_en.pdf); Act on the Implementation of a Package of Measures to Stabilise the Financial Market
(http://www.bundesfinanzministerium.de/nn_4328/DE/BMF__Startseite/Aktuelles/Aktuelle__Gesetze/Gesetze__Verordnungen/Finanzmarktstabi__engl__anl,templateId=raw,property=publicationFile.pdf); - --> Council of the European Union, press release, January 20th, 2009
G-29
(http://www.consilium.europa.eu/uedocs/cms_data/docs/pressdata/en/ecofin/105390.pdf);
Council of the European Union, Draft Key Issues Paper, March 5th, 2009
(http://register.consilium.europa.eu/pdf/en/09/st06/st06784-re01.en09.pdf); Eurostat, Government Finance Statistics, EDP Notification Tables, Germany, Reporting of Government Deficits and Debt Levels, Reporting before 1 April 2009
(http://epp.eurostat.ec.europa.eu/portal/page/portal/government_finance_statistics/documents/DE_2009-04.pdf); European Commission, Directorate-General for Economic and Financial Affairs, Economic Forecast, Spring 2009, pp. 58-60
(http://ec.europa.eu/economy_finance/publications/publication15048_en.pdf).
G-30
General Government Budgetary Prospects (1)
| | | | | | | | | | | | | | | | | | | | | |
| | | 2012 | | 2011 | | 2010 | | 2009 | | 2008 |
| | | | | | | | | | | (% of GDP) | | | | |
| Revenue | | | 43 | | | | 42 | 1/2 | | | 42 | 1/2 | | | 43 | 1/2 | | | 44 | |
| Taxes | | | 23 | | | | 22 | 1/2 | | | 22 | 1/2 | | | 23 | 1/2 | | | 24 | |
| Social contributions | | | 16 | 1/2 | | | 16 | 1/2 | | | 16 | 1/2 | | | 16 | 1/2 | | | 16 | 1/2 |
| Other | | | 3 | 1/2 | | | 3 | 1/2 | | | 3 | 1/2 | | | 3 | 1/2 | | | 3 | 1/2 |
| Expenditure | | | 45 | 1/2 | | | 45 | 1/2 | | | 46 | 1/2 | | | 46 | 1/2 | | | 44 | |
| Intermediate consumption, social transfers in kind, compensation of employees, other taxes on production | | | 19 | 1/2 | | | 19 | 1/2 | | | 19 | 1/2 | | | 19 | 1/2 | | | 18 | 1/2 |
| Social transfers other than in kind | | | 17 | | | | 17 | | | | 17 | 1/2 | | | 17 | 1/2 | | | 17 | |
| Interest expenditure | | | 3 | | | | 3 | | | | 3 | | | | 3 | | | | 3 | |
| Subsidies | | | 1 | | | | 1 | 1/2 | | | 1 | 1/2 | | | 1 | | | | 1 | |
| Gross fixed capital formation | | | 2 | 1/2 | | | 2 | 1/2 | | | 2 | 1/2 | | | 2 | | | | 1 | 1/2 |
| Other | | | 2 | | | | 2 | | | | 2 | 1/2 | | | 3 | | | | 3 | |
| | | | | | | | | | | |
General government deficit (-) / surplus (+) | | | -2 | 1/2 | | | -3 | | | | -4 | | | | -3 | | | | -0 | |
| Federal government | | | -1 | 1/2 | | | -2 | | | | -2 | 1/2 | | | -2 | | | | - | 1/2 |
Länder governments and municipalities | | | -1 | | | | -1 | | | | -1 | | | | - | 1/2 | | | 0 | |
| Social security funds | | | -0 | | | | 0 | | | | - | 1/2 | | | - | 1/2 | | | | 1/2 |
| | | | | | | | | | | | | | | | | | | | | |
General government gross debt | | | 72 | 1/2 | | | 71 | 1/2 | | | 70 | 1/2 | | | 68 | 1/2 | | | 65 | 1/2 |
| | |
| (1) | | Definition according to the reporting under the EDP: for purposes of the Member States’ reports to the European Commission under the EDP, “general government deficit/surplus” is the balancing item “net borrowing/net lending” of general government as defined in the national accounts, but including streams of interest payments resulting from swap arrangements and forward-rate agreements. Accordingly, interest included in the figures set forth in the table above reflects these streams. |
Source: Bundesministerium der Finanzen, Addendum to the Update of the German Stability Programme (January 2009), Tables 5 and 6.
Tax Structure
Income Tax
The Federal Government’s most significant sources of revenue are the various types of income taxes. Income taxation for employees and self-employed persons is based on a progressive tax scale ranging from 14% to 45% subject to the amount of taxable income. Employees pay taxes on their income from employment in the form of wage taxes. Self-employed persons typically pay estimated taxes during the year before filing their annual income tax return. Income generated by partnerships is not subject to tax at partnership level, but at the level of the partners. The partners pay tax on this income according to their individual income tax brackets.
Income generated by corporations is subject to corporate income tax (Körperschaftsteuer) at a flat rate of 15%.
With effect from January 1, 2009, taxation of capital income received by domestic taxpayers (all types of income from capital as well as private shareholders’ net gains from sales of shares in corporations) is designed as a final uniform tax rate of 25% (Abgeltungssteuer), taking into consideration an allowance (Sparerfreibetrag) of EUR 801 (EUR 1,602 for married couples).
In addition to the various types of income tax, a solidarity surcharge of 5.5% is imposed on the applicable tax liability subject to certain allowances.
Sources: Bundesministerium der Justiz, Einkommensteuergesetz
(http://bundesrecht.juris.de/estg/index.html); Bundesministerium der Justiz, Section 43a, Einkommensteuergesetz
(http://bundesrecht.juris.de/estg/__43a.html); Bundesministerium der Justiz, Section 20, Einkommensteuergesetz
(http://bundesrecht.juris.de/estg/__20.html); Bundesministerium der Justiz, Section 32a, Einkommensteuergesetz
(http://bundesrecht.juris.de/estg/__32a.html);Bundesministerium der Justiz, Section 4, Solidaritätszuschlaggesetz
(http://bundesrecht.juris.de/solzg_1995/__4.html); Bundesministerium der Justiz, Körperschaftsteuergesetz
(http://bundesrecht.juris.de/kstg_1977/index.html); Bundesministerium der Justiz, Section 23, Körperschaftsteuergesetz
(http://bundesrecht.juris.de/kstg_1977/__23.html).
G-31
Value-Added Tax and Consumption Taxes
Value-added tax (“VAT”) is a general consumption tax that is imposed on the value of most goods and services. The standard rate applicable to most goods and services is 19%. Certain items that are classified as basic necessities, such as food (except beverages and all turnovers in restaurants) and books, are subject to a reduced rate of 7%.
In addition to the VAT, there are some specific consumption taxes. The most significant specific consumption taxes relate to energy and tobacco.
Sources: Bundesministerium der Justiz, Umsatzsteuergesetz
(http://bundesrecht.juris.de/ustg_1980/index.html); Bundesministerium der Justiz, Umsatzsteuergesetz, Section 12,
(http://bundesrecht.juris.de/ustg_1980/__12.html).
Environmental Tax
The environmental tax regime aims to encourage energy conservation and to lower employers’ and employees’ contributions to the public pension system at the same time, thereby allocating the burden of taxes and contributions more equally among labor, capital and natural resources. Key points of the environmental tax regime are an electricity tax imposed on the consumption of electricity and an energy tax on mineral oil and coal. The electricity tax rate is EUR 20.50 per megawatt-hour. The rates of the energy tax are assessed in accordance with certain environmental criteria.
Sources: Bundesministerium der Justiz, Stromsteuergesetz
(http://bundesrecht.juris.de/stromstg/index.html); Bundesministerium der Justiz, Stromsteuergesetz, Section 3,
(http://bundesrecht.juris.de/stromstg/__3.html);
Bundesministerium der Finanzen, Ökosteuer / Ökologische Steuerreform, Glossary
(http://www.bundesfinanzministerium.de/nn_39840/DE/BMF__Startseite/Service/Glossar/O/001__Oekosteuer-Oekologische_20Steuerreform.html).
Trade Tax
Trade tax (Gewerbesteuer) is levied at the municipal level and is imposed on businesses and their objective earning power. The trade tax rate varies and depends on the municipality that levies the tax. The base for the trade tax is the trade earnings of the business, which equals the gain from the professional undertaking, increased by certain additions and reduced by certain discounts. The trade earnings are multiplied by the basic federal rate (Gewerbesteuermesszahl) to achieve the base amount for the trade tax (Steuermessbetrag), which is then multiplied by the municipal multiplier (Hebesatz). Beyond a required minimum level of 200% municipalities have discretion to fix the municipal tax collection rate, so that trade tax rates may vary.
Sources: Bundesministerium der Justiz, Gewerbesteuergesetz (http://bundesrecht.juris.de/gewstg/index.html).
Recent and Pending Tax Reform Measures
With effect from January 1, 2009, changes relating to the capital gains tax (Kapitalertragsteuer) entered into force. All types of income from capital as well as private shareholders’ net gains from sales of shares in corporations are now subject to a final uniform tax rate of 25% (Abgeltungssteuer) plus solidarity surcharge of 5.5% (described above). Also with effect from January 1, 2009, the annual allowance for investment income (Sparerfreibetrag), which formerly totaled EUR 750 and EUR 1,500 for married couples, respectively, was increased to EUR 801 (EUR 1,602 for married couples), including an allowance for capital income related expenses. Since January 1, 2009, the taxation of private shareholders’ net gains from sales of shares in corporations is no longer based upon a holding period of the shares. Prior to 2009 net gains from sales were tax-exempt if the shares had been held for a minimum period of one year; the same is still true for net gains from sales of shares which were acquired before December 31, 2008.
The Federal Constitutional Court (Bundesverfassungsgericht) decided that the recent reform of the deductibility of commuting expenses (Entfernungspauschale), which came into effect on January 1, 2007, and limited the deductibility of expenses arising in connection with commuting to and from work to the portion that exceeded 20 kilometers, is not in line with the Federal Constitution. The government has had to reinstate the relevant legal provisions. Since reinstatement, all expenses arising in connection with commuting to and from work are again deductible, retroactively effective as of January 1, 2007.
With effect from January 1, 2010, the Citizen Relief Act (Bürgerentlastungsgesetz) will enter into force. The aim of the act is to improve the tax deductibility of contributions to health insurance and to long-term care insurance. Furthermore, as part of the stimulus package, the basic allowance, which was increased to EUR 7,834 in 2009, will be further increased to EUR 8,004 in 2010.
G-32
Sources: Bundesministerium der Justiz, Einkommensteuergesetz
(http://bundesrecht.juris.de/estg/index.html); Bundesministerium der Justiz, Section 43a, Einkommensteuergesetz
(http://bundesrecht.juris.de/estg/__43a.html); Bundesministerium der Justiz, Section 9, Einkommensteuergesetz
(http://bundesrecht.juris.de/estg/__9.html); Bundesministerium der Justiz, Section 20, Einkommensteuergesetz
(http://bundesrecht.juris.de/estg/__20.html); Bundesministerium der Justiz, Section 52a, Einkommensteuergesetz
(http://bundesrecht.juris.de/estg/__52a.html). Bundesministerium der Finanzen, Pendlerpauschale gilt wieder — Millionen Pendler bekommen schnell ihr Geld, press release of Dezember 09, 2008
(http://www.bundesfinanzministerium.de/nn_54270/DE/Presse/Pressemitteilungen/Finanzpolitik/2008/12/20080912__PM65.html); Bundesministerium der Finanzen, Dauerhafte steuerliche Entlastung für alle Kranken- und Pflegeversicherte, press release of February 18, 2009
(http://www.bundesfinanzministerium.de/nn_54270/DE/Presse/Pressemitteilungen/Finanzpolitik/2009/02/20091802__PM8.html); Bundesministerium der Finanzen
(http://www.bundesfinanzministerium.de/nn_82/DE/BMF__Startseite/Aktuelles/Aktuelle__Gesetze/Gesetzentwuerfe__Arbeitsfassungen/Entw__Pflegeversicherung__anl,templateId=raw,property=publicationFile.pdf) ; Bundesgesetzblatt, Gesetz zur Sicherung von Beschäftigung und Stabilität in Deutschland (http://www.bgblportal.de/BGBL/bgbl1f/bgbl109s0416.pdf).
G-33
The following table provides an overview of annual tax revenues of general government divided by categories for each of the years indicated as presented in the national accounts.
Taxes (1)
| | | | | | | | | | | | | | | | | | | | | |
| | | 2008 | | 2007 | | 2006 | | 2005 | | 2004 |
| | | | | | | (EUR in billions) | | | | |
| Current taxes | | | 593.2 | | | | 576.3 | | | | 530.5 | | | | 493.2 | | | | 481.3 | |
| Taxes on production and imports | | | 312.7 | | | | 305.5 | | | | 280.5 | | | | 265.6 | | | | 260.2 | |
of which: Value-added tax | | | 172.5 | | | | 166.5 | | | | 143.8 | | | | 136.9 | | | | 134.8 | |
| Current taxes on income and wealth | | | 280.5 | | | | 270.8 | | | | 250.1 | | | | 227.6 | | | | 221.1 | |
of which: Wage tax | | | 186.5 | | | | 176.2 | | | | 167.1 | | | | 161.9 | | | | 165.3 | |
Assessed income tax | | | 36.4 | | | | 34.8 | | | | 28.6 | | | | 21.6 | | | | 17.4 | |
Non-assessed taxes on earnings | | | 32.4 | | | | 27.3 | | | | 21.9 | | | | 17.8 | | | | 16.4 | |
Corporate tax | | | 17.8 | | | | 25.0 | | | | 25.0 | | | | 18.9 | | | | 15.3 | |
| Capital taxes | | | 4.8 | | | | 4.2 | | | | 3.8 | | | | 4.1 | | | | 4.3 | |
| | | | | | | | | | | | | | | | | | | | | |
Tax revenue of general government | | | 598.0 | | | | 580.5 | | | | 534.3 | | | | 497.3 | | | | 485.6 | |
| Taxes of domestic sectors to EU | | | 8.1 | | | | 7.8 | | | | 7.5 | | | | 6.7 | | | | 6.0 | |
| | | | | | | | | | | | | | | | | | | | | |
Taxes | | | 606.1 | | | | 588.3 | | | | 541.8 | | | | 504.0 | | | | 491.5 | |
| | | | | | | | | | | | | | | | | | | | | |
| | |
| (1) | | Definition according to the national accounts. |
Source: Statistisches Bundesamt, Fachserie 18, Reihe 1.4 — 2008 (March 2009), Table 3.4.3.20.
Government Participations
As of October 2008, the Federal Republic held direct participations in 90 public and private enterprises, and various special funds held participations in 19 (18 without double counting) enterprises. The aggregate nominal capital of the enterprises in which the Federal Republic or the special funds held direct participations of more than 50% amounted to EUR 18.8 billion as of December 31, 2007 compared to EUR 18.2 billions as of December 31, 2006.
Sources: Bundesministerium der Finanzen, Beteiligungsbericht 2007, page 2; Bundesministerium der Finanzen, Beteiligungsbericht 2008, pages 1 and 2.
The following table shows information on the Federal Republic’s significant direct participations (including those held through its “special funds”) as of December 31, 2007.
| | | | | | | | | |
| | | Nominal Capital of | | Participation of the |
| Enterprises | | Enterprise | | Federal Republic |
| | | (EUR in millions) | | (%) |
| Significant majority participations: | | | | | | | | |
| Deutsche Bahn AG | | | 2,150 | | | | 100.0 | |
| KfW | | | 3,750 | | | | 80.0 | |
| | | | | | | | | |
| Significant minority participations exceeding 25%: | | | | | | | | |
| Flughafen München GmbH | | | 307 | | | | 26.0 | |
| | |
| Source: | | Bundesministerium der Finanzen, Beteiligungsbericht 2008, Chapters B and C, pages 27, 57 and 85. |
Debt of the Federal Government
As of December 31, 2008, the Federal Government’s total debt, not including the debt of the Länder governments and the municipalities, amounted to EUR 958.0 billion, compared to EUR 940.0 billion as of December 31, 2007. Since July 1, 1999, the Federal Government has assumed joint liability for the debts of the following special funds: Sinking Fund for Vested Liabilities (Erblastentilgungsfonds) (for former GDR liabilities); the Federal Railway Fund (Bundeseisenbahnvermögen); and the Compensation Fund for Safeguarding the Use of Coal (Ausgleichsfonds Steinkohleneinsatz). In addition, the Federal Government has assumed joint liability for the debt of the Equalization Fund pursuant to the Act Governing the Equalization of Burdens (Ausgleichsfonds nach dem Lastenausgleichsgesetz) and the German Unity Fund (Fonds “Deutscher Einheit”) since January 1, 2005. The aforementioned special funds were allocated to the Federal Government as of July 1999 and January 2005, respectively.
G-34
Source: Deutsche Bundesbank, Monatsbericht März 2009, Table IX.14.
The Federal Government raises funds primarily through the issuance of bonds and notes. Euro-denominated bonds and notes issued by the Federal Republic are evidenced by book entry and no certificates are issued.
In addition to its own direct debt obligations, the Federal Government had outstanding guarantees in an aggregate amount of EUR 217.5 billion as of December 31, 2007. Of this amount, EUR 96.7 billion was outstanding in the form of export credit insurance, which is handled by EULER HERMES on behalf of and for the account of the Federal Government.
Source: Bundesministerium der Finanzen, Finanzbericht 2009, Overview 4, page 336.
For more detailed information regarding the Federal Government’s debt and guarantees, see “Tables and Supplementary Information”.
For information on the Federal Government’s liability as of December 31, 2008 for capital subscriptions to various international financial organizations, see the table entitled “Tables and Supplementary Information — III. Liabilities to International Financial Organizations” below.
G-35
TABLES AND SUPPLEMENTARY INFORMATION
I. DIRECT DEBT OF THE FEDERAL GOVERNMENT
SUMMARY
| | | | | |
| | | Principal Amount |
| | | Outstanding as of |
| | | December 31, 2008 |
| | | (EUR in millions) |
| Federal Bonds | | | 600,468 | |
| Inflation-linked Securities | | | 22,000 | |
| Five-year Federal Notes | | | 171,000 | |
| Federal Treasury Notes | | | 108,000 | |
| Federal Savings Notes | | | 9,649 | |
| Treasury Discount Paper | | | 38,565 | |
| Federal Treasury Financing Paper | | | 2,319 | |
| German Government Day-Bonds | | | 3,174 | |
| Further short-term debt (= 1 year) | | | 8,200 | |
Borrowers’ note loans (Schuldscheindarlehen) | | | 13,341 | |
Of which: | | | | |
| From residents | | | 13,124 | |
| From non-residents | | | 217 | |
| Old debt (1) | | | 4,474 | |
Of which: | | | | |
| Equalization claims | | | 4,124 | |
| Other | | | 40 | |
| Repurchased debt | | | 39,957 | |
Medium-term notes of Treuhandanstalt | | | 51 | |
| | | | | |
Total | | | 941,325 | |
| | | | | |
| | |
| (1) | | Mainly equalization and covering claims of the Deutsche Bundesbank, other banks and insurance companies in connection with the currency reform of 1948. |
Source: Bundesministerium der Finanzen, Übersicht über den Stand der Schuld der Bundesrepublik Deutschland zum 31. Dezember 2008, Bundesanzeiger Nr. 26 of February 18, 2009, page 583.
G-36
DEBT TABLES
1. Federal Bonds (1)
| | | | | | | | | | | | | | | | | |
| | | | | | | | | | | | | | | Principal Amount |
| | | | | | | | | | | | | | | Outstanding as of |
| | | Interest | | Year of | | | | | | December 31, |
| Title | | Rate | | Issue | | Maturity | | 2008 |
| | | (% per annum) | | | | | | | | | | (EUR in millions) |
| 6% Bonds of the Federal Republic of 1986 (II) | | | 6 | | | | 1986 | | | | 2016 | | | | 3,750 | |
| 5.625% Bonds of the Federal Republic of 1986 | | | 5.625 | | | | 1986 | | | | 2016 | | | | 750 | |
| 6.25% Bonds of the Federal Republic of 1994 | | | 6.25 | | | | 1994 | | | | 2024 | | | | 10,250 | |
| 6.5% Bonds of the Federal Republic of 1997 | | | 6.5 | | | | 1997 | | | | 2027 | | | | 11,250 | |
| 5.625% Bonds of the Federal Republic of 1998 | | | 5.625 | | | | 1998 | | | | 2028 | | | | 14,500 | |
| 4.75% Bonds of the Federal Republic of 1998 (II) | | | 4.75 | | | | 1998 | | | | 2028 | | | | 11,250 | |
| 3.75% Bonds of the Federal Republic of 1999 | | | 3.75 | | | | 1999 | | | | 2009 | | | | 14,250 | |
| 4% Bonds of the Federal Republic of 1999 | | | 4 | | | | 1999 | | | | 2009 | | | | 11,250 | |
| 4.5% Bonds of the Federal Republic of 1999 | | | 4.5 | | | | 1999 | | | | 2009 | | | | 20,250 | |
| 5.375% Bonds of the Federal Republic of 1999 | | | 5.375 | | | | 1999 | | | | 2010 | | | | 20,250 | |
| 6.25% Bonds of the Federal Republic of 2000 | | | 6.25 | | | | 2000 | | | | 2030 | | | | 9,250 | |
| 5.5% Bonds of the Federal Republic of 2000 | | | 5.5 | | | | 2000 | | | | 2031 | | | | 17,000 | |
| 5.25% Bonds of the Federal Republic of 2000 (I) | | | 5.25 | | | | 2000 | | | | 2010 | | | | 20,250 | |
| 5.25% Bonds of the Federal Republic of 2000 (II) | | | 5.25 | | | | 2000 | | | | 2011 | | | | 23,250 | |
| 5% Bonds of the Federal Republic of 2001 | | | 5 | | | | 2001 | | | | 2011 | | | | 24,000 | |
| 5% Bonds of the Federal Republic of 2002 (I) | | | 5 | | | | 2002 | | | | 2012 | | | | 25,000 | |
| 5% Bonds of the Federal Republic of 2002 (II) | | | 5 | | | | 2002 | | | | 2012 | | | | 27,000 | |
| 4.5% Bonds of the Federal Republic of 2003 | | | 4.5 | | | | 2003 | | | | 2013 | | | | 24,000 | |
| 3.75% Bonds of the Federal Republic of 2003 | | | 3.75 | | | | 2003 | | | | 2013 | | | | 22,000 | |
| 4.25% Bonds of the Federal Republic of 2003 | | | 4.25 | | | | 2003 | | | | 2014 | | | | 24,000 | |
| 4.75% Bonds of the Federal Republic of 2003 | | | 4.75 | | | | 2003 | | | | 2034 | | | | 20,000 | |
| 4.25% Bonds of the Federal Republic of 2004 | | | 4.25 | | | | 2004 | | | | 2014 | | | | 25,000 | |
| 3.75% Bonds of the Federal Republic of 2004 | | | 3.75 | | | | 2004 | | | | 2015 | | | | 23,000 | |
| 4% Bonds of the Federal Republic of 2005 | | | 4 | | | | 2005 | | | | 2037 | | | | 23,000 | |
| 3.25% Bonds of the Federal Republic of 2005 | | | 3.25 | | | | 2005 | | | | 2015 | | | | 21,000 | |
| 3.5% Bonds of the Federal Republic of 2005 | | | 3.5 | | | | 2005 | | | | 2016 | | | | 23,000 | |
| 3.875% USD-Bonds of the Federal Republic of 2005 | | | 3.875 | | | | 2005 | | | | 2010 | | | | 3,968 | |
| 4% Bonds of the Federal Republic of 2006 | | | 4 | | | | 2006 | | | | 2016 | | | | 23,000 | |
| 3.75% Bonds of the Federal Republic of 2006 | | | 3.75 | | | | 2006 | | | | 2017 | | | | 20,000 | |
| 4.25% Bonds of the Federal Republic of 2007 | | | 4.25 | | | | 2007 | | | | 2039 | | | | 14,000 | |
| 4.25% Bonds of the Federal Republic of 2007 | | | 4.25 | | | | 2007 | | | | 2017 | | | | 19,000 | |
| 4% Bonds of the Federal Republic of 2007 | | | 4 | | | | 2007 | | | | 2018 | | | | 20,000 | |
| | | | | | | | | | | | | | | | | |
| 4.25% Bonds of the Federal Republic of 2008 | | | 4.25 | | | | 2008 | | | | 2018 | | | | 21,000 | |
| | | | | | | | | | | | | | | | | |
| 3.75% Bonds of the Federal Republic of 2008 | | | 3.75 | | | | 2008 | | | | 2019 | | | | 7,000 | |
| | | | | | | | | | | | | | | | | |
| 4.75% Bonds of the Federal Republic of 2008 | | | 4.75 | | | | 2008 | | | | 2040 | | | | 4,000 | |
| | | | | | | | | | | | | | | | | |
Total Federal Bonds | | | | | | | | | | | | | | | 600,468 | |
| | | | | | | | | | | | | | | | | |
| | |
| (1) | | Federal Bonds are evidenced by book entry, and no certificates are issued. Maturities are 10 to 30 years. No redemption prior to maturity; including principal strips. |
G-37
2. Inflation-linked Securities (1)
| | | | | | | | | | | | | | | | | |
| | | | | | | | | | | | | | | Principal Amount |
| | | | | | | | | | | | | | | Outstanding as of |
| | | Interest | | Year of | | | | | | December 31, |
| Title | | Rate | | Issue | | Maturity | | 2008 |
| | | (% per annum) | | | | | | | | | | (EUR in millions) |
| 1.5% Inflation-linked Bonds of the Federal Republic of 2006 | | | 1.5 | | | | 2006 | | | | 2016 | | | | 13,000 | |
| 2.25% Inflation-linked Notes of the Federal Republic of 2007 | | | 2.25 | | | | 2007 | | | | 2013 | | | | 9,000 | |
| | | | | | | | | | | | | | | | | |
Total Inflation-linked Securities | | | | | | | | | | | | | | | 22,000 | |
| | | | | | | | | | | | | | | | | |
| (1) | | Inflation-linked Securities are evidenced by book entry, and no certificates are issued. Maturities are 5 to 10 years. No redemption prior to maturity. |
3. Five-Year Federal Notes (1)
| | | | | | | | | | | | | | | | | |
| | | | | | | | | | | | | | | Principal |
| | | | | | | | | | | | | | | Amount |
| | | | | | | | | | | | | | | Outstanding as of |
| | | Interest | | Year of | | | | | | December 31, |
| Title | | Rate | | Issue | | Maturity | | 2008 |
| | | (% per annum) | | | | | | | | | | (EUR in millions) |
| 3.25% Bonds of 2004-Series 144 | | | 3.25 | | | | 2004 | | | | 2009 | | | | 18,000 | |
| 3.5% Bonds of 2004-Series 145 | | | 3.5 | | | | 2004 | | | | 2009 | | | | 18,000 | |
| 3.25% Bonds of 2005-Series 146 | | | 3.25 | | | | 2005 | | | | 2010 | | | | 17,000 | |
| 2.5% Bonds of 2005-Series 147 | | | 2.5 | | | | 2005 | | | | 2010 | | | | 17,000 | |
| 3.5% Bonds of 2006-Series 148 | | | 3.5 | | | | 2006 | | | | 2011 | | | | 19,000 | |
| 3.5% Bonds of 2006-Series 149 | | | 3.5 | | | | 2006 | | | | 2011 | | | | 17,000 | |
| 4% Bonds of 2007 Series 150 | | | 4 | | | | 2007 | | | | 2012 | | | | 16,000 | |
| 4.25% Bonds of 2007 Series 151 | | | 4.25 | | | | 2007 | | | | 2012 | | | | 16,000 | |
| | | | | | | | | | | | | | | | | |
| 3.5% Bonds of 2008 Series 152 | | | 3.5 | | | | 2008 | | | | 2013 | | | | 17,000 | |
| | | | | | | | | | | | | | | | | |
| 4% Bonds of 2008 Series 153 | | | 4 | | | | 2008 | | | | 2013 | | | | 16,000 | |
| | | | | | | | | | | | | | | | | |
Total Five-Year Federal Notes | | | | | | | | | | | | | | | 171,000 | |
| | | | | | | | | | | | | | | | | |
| | |
| (1) | | Five-Year Federal Notes are evidenced by book entry, and no certificates are issued. Maturities are approximately five years. No redemption prior to maturity. |
4. Federal Treasury Notes (1)
| | | | | | | | | | | | | | | | | |
| | | | | | | | | | | | | | | Principal Amount |
| | | | | | | | | | | | | | | Outstanding as of |
| | | Interest | | Year of | | | | | | December 31, |
| Title | | Rate | | Issue | | Maturity | | 2008 |
| | | (% per annum) | | | | | | | | | | (EUR in millions) |
| 3.75% Notes of 2007 | | | 3.75 | | | | 2007 | | | | 2009 | | | | 15,000 | |
| 4.5% Notes of 2007 | | | 4.5 | | | | 2007 | | | | 2009 | | | | 14,000 | |
| 4% Notes of 2007 | | | 4 | | | | 2007 | | | | 2009 | | | | 13,000 | |
| 4% Notes of 2007(II) | | | 4 | | | | 2007 | | | | 2009 | | | | 14,000 | |
| | | | | | | | | | | | | | | | | |
| 3% Notes of 2008 | | | 3 | | | | 2008 | | | | 2010 | | | | 15,000 | |
| | | | | | | | | | | | | | | | | |
| 4.75% Notes of 2008 | | | 4.75 | | | | 2008 | | | | 2010 | | | | 15,000 | |
| | | | | | | | | | | | | | | | | |
| 4% Notes of 2008 | | | 4 | | | | 2008 | | | | 2010 | | | | 15,000 | |
| | | | | | | | | | | | | | | | | |
| 2.25% Notes of 2008 | | | 2.25 | | | | 2008 | | | | 2010 | | | | 7,000 | |
| | | | | | | | | | | | | | | | | |
Total Federal Treasury Notes | | | | | | | | | | | | | | | 108,000 | |
| | | | | | | | | | | | | | | | | |
| | |
| (1) | | Federal Treasury Notes are evidenced by book-entry, and no certificates are issued. Maturities are two years. No redemption prior to maturity. |
G-38
5. Federal Savings Notes (1)
| | | | | | | | | | | | | | | | | |
| | | | | | | | | | | | | | | Principal Amount |
| | | | | | | | | | | | | | | Outstanding as of |
| | | Interest Rate | | Year of Issue | | Maturity | | December 31, 2008 |
| | | | | | | | | | | | | | | (EUR in millions) |
| Federal Savings Notes | | 1% to 5.75% | | | 2002 to 2008 | | | | 2009 to 2015 | | | | 9,649 | |
| |
| 6. Treasury Discount Paper (2) |
| |
| | | | | | | | | | | | | | | Principal Amount |
| | | | | | | | | | | | | | | Outstanding as of |
| | | Interest Rate (3) | | Year of Issue | | Maturity | | December 31, 2008 |
| | | | | | | | | | | | | | | (EUR in millions) |
| Treasury Discount Paper | | 1.96% to 4.38% | | | 2007 | | | | 2009 | | | | 38,565 | |
| |
| 7. Federal Treasury Financing Paper (4) |
| |
| | | | | | | | | | | | | | | Principal Amount |
| | | | | | | | | | | | | | | Outstanding as of |
| | | Interest Rate (3) | | Year of Issue | | Maturity | | December 31, 2008 |
| | | | | | | | | | | | | | | (EUR in millions) |
| Federal Treasury Financing Paper | | 1.57% to 4.31% | | | 2007 to 2008 | | | | 2009 to 2010 | | | | 2,319 | |
| |
| 8. German Government Day-Bonds |
| |
| | | | | | | | | | | | | | | Principal Amount |
| | | | | | | | | | | | | | | Outstanding as of |
| | | Interest Rate | | Year of Issue | | Maturity | | December 31, 2008 |
| | | | | | | | | | | | | | | (EUR in millions) |
| German Government Day-Bonds | | 2.06% to 4.13% | | | 2008 | | | none | | | 3,174 | |
| |
| 9. Further short-term debt (= 1 year) |
| |
| | | | | | | | | | | | | | | Principal Amount |
| | | | | | | | | | | | | | | Outstanding as of |
| | | Interest Rate | | Year of Issue | | Maturity | | December 31, 2008 |
| | | | | | | | | | | | | | | (EUR in millions) |
| Further short-term debt (= 1 year) | | 1.96% to 4.22% | | | 2008 | | | | 2009 | | | | 8,200 | |
| |
| 10. Borrowers’ note loans(5) |
| |
| | | | | | | | | | | | | | | Principal Amount |
| | | | | | | Year of | | | | | | Outstanding as of |
| | | Interest Rate | | Incurrence | | Maturity | | December 31, 2008 |
| | | | | | | | | | | | | | | (EUR in millions) |
Borrowers’ note loans (Schuldscheindarlehen) | | 2.69% to 7.75% | | | 1954 to 2008 | | | | 2009 to 2037 | | | | 13,341 | |
| | |
| (1) | | Federal Savings Notes are evidenced by book entry and no certificates are issued. Maturities are six or seven years. The bonds are redeemable after one year from the issue date at the option of the holders in installments of EUR 5,113 per holder and month. The terms of the Federal Savings Notes provide for interest rates that increase during the term of the bonds. In addition, the seven-year Federal Savings Notes provide for payment of compounded interest at maturity or upon redemption prior to maturity. |
| |
| (2) | | Treasury Discount Papers are issued at a discount and repaid at par value on the maturity date. No interest payments are made during the term of the paper. It is issued in the form of one global bearer security. Maturities range from one year to two years. No redemption is permitted prior to maturity. |
| |
| (3) | | Reflects annual interest rate paid to the holder by way of the initial issue discount. |
| |
| (4) | | Federal Treasury Financing Papers are issued at a discount and repaid at par value on the maturity date. No interest payments are made during the term of the paper. It is issued in the form of one global bearer security. Maturities range from one year to two years. No redemption is permitted prior to maturity. |
G-39
| (5) | | Borrowers’ not loans (Schuldscheindarlehen) are an instrument of the German capital market where the lending entity, generally an institutional investor, receives a certificate evidencing its loan to the borrower and the term of such loans. The certificate generally authorizes at least three assignments. |
No redemption is permitted prior to maturity.
11. Other Liabilities
| | | | | | | | | | | | | | | | | |
| | | | | | | | | | | | | | | Principal Amount |
| | | | | | | Year of | | | | | | Outstanding as of |
| Title | | Interest Rate | | Incurrence | | Maturity | | December 31, 2008 |
| | | | | | | | | | | | | | | (EUR in millions) |
| Old debt (1) | | 0% to 3% | | Various | | Various | | | 4,124 | |
| Other debt (2) | | Various | | Various | | Various | | | 40 | |
| | |
| (1) | | Includes mainly equalization and covering claims of the Deutsche Bundesbank, other banks and insurance companies in connection with the currency reform of 1948. |
| |
| (2) | | Includes liabilities of the Federal Government to repay amounts received from the Investitionshilfeabgabe, a special duty levied on income, the proceeds of which were to be used to promote investments. |
Source: Bundesministerium der Finanzen, Übersicht über den Stand der Schuld der Bundesrepublik Deutschland zum 31. Dezember 2008, Bundesanzeiger Nr. 26 of February 18, 2009, page 583.
G-40
II. Guarantees By The Federal Government(1)
| | | | | | | | | |
| | | Principal Amount Outstanding |
| | | As of December 31, | | As of December 31, |
| Purpose of Guarantees | | 2006 | | 2007 |
| | | (EUR in millions) |
| Export finance loans (including rescheduled loans)(2) | | | 98,378 | | | | 96,667 | |
| Untied loans; direct foreign investments by German companies; Loans of the European Investment Bank to non-EU borrowers | | | 26,948 | | | | 26,114 | |
| Loans in connection with EU agricultural policy measures | | | 7,500 | | | | 7,500 | |
| Loans to domestic corporations and for projects in areas of Agriculture, fishing and housing construction | | | 46,431 | | | | 44,663 | |
| Contributions to international financing institutions | | | 40,256 | | | | 40,256 | |
| Co-financing of bilateral projects of German financial co-operation | | | 1,030 | | | | 1,052 | |
Successor agencies to Treuhandanstalt | | | 1,239 | | | | 1,239 | |
| | | | | | | | | |
Total guarantees | | | 221,782 | | | | 217,491 | |
| | | | | | | | | |
| | |
| (1) | | Does not include guarantees under the KfW Law with respect to money borrowed, bonds issued and derivative transactions entered into by KfW. For information relating to KfW’s borrowings, see “KfW — Business — Shareholdings, Treasury and Services — Treasury and Funding — Sources and Uses of Funds.” |
| |
| (2) | | Includes export finance loans extended by KfW IPEX-Bank guaranteed by the Federal Republic through Euler Hermes Kreditversicherungs-AG (“HERMES”), the official German export credit insurer. For information relating to loans extended by KfW IPEX-Bank benefiting from HERMES coverage, see “KfW — Business — Export and Project Finance (KfW IPEX-Bank) — Business.” |
Sources: Bundesministerium der Finanzen, Finanzbericht 2008, Overview 4, page 358; Finanzbericht 2009, Overview 4, page 336.
G-41
III. Liabilities to International Financial Organizations
The Federal Republic is obligated to contribute to the capital subscriptions and, in some cases, to the additional financing requirements of certain international organizations in which it participates. Such contributions are in many cases stated initially in 1944 U.S. dollars. One 1944 U.S. dollar is equivalent to one Special Drawing Right (“SDR”), a unit of value established by an amendment in July 1969 to the Articles of Agreement of the International Monetary Fund. From July 1, 1974 to December 31, 1980, the exchange rate between world currencies and the SDR was determined on the basis of a basket of 16 currencies, including the U.S. dollar, which accounted for approximately one-third of the value of the basket. From 1981 to 2000, the exchange rate between world currencies and the SDR was determined on the basis of a basket of five currencies, including the U.S. dollar. The currencies that determine the value of the SDR, the proportion of each of these currencies in the basket, and the financial instruments used in determining the interest rate on the SDR, are reviewed every five years. The adoption of the euro as the common currency for the initial 11 Member States of the European Union called for a change in the composition of the SDR basket. With effect from January 1, 2001, the SDR basket consists of four currencies: U.S. dollar, euro, Japanese yen and pound sterling. The currency weight of the U.S. dollar in the SDR basket initially was 45%, changing on a daily basis as a result of exchange rate fluctuations. On December 31, 2008, SDR 1 equaled EUR 1.10675.
Subscriptions or Commitments by The Federal Republic
to International Financial Organizations
as of December 31, 2008
| | | | | | | | | |
| | | Subscription or | | |
| | | Commitment by the Federal | | Amount |
| Name of organization | | Republic (1) | | Paid In |
| | | (U.S.$ in millions) | | | | |
| International Monetary Fund (2) | | | 20,036.1 | | | | 20,036.1 | |
| International Bank for Reconstruction and Development (3)(4) | | | 8,733.9 | | | | 542.9 | |
| International Development Association (IDA)(3)(4) | | | 20,174.4 | | | | 20,174.4 | |
| International Finance Corporation (IFC)(3)(4) | | | 128.9 | | | | 128.9 | |
| European Investment Bank (5) | | | 37,088.2 | | | | 1,855.87 | |
| African Development Bank (3) | | | 1,380.6 | | | | 138.2 | |
| African Development Fund (3) | | | 2,912.8 | | | | 2,502.1 | |
| Asian Development Bank (3) | | | 2,369.2 | | | | 165.9 | |
| Asian Development Fund (3) | | | 2,036.6 | | | | 1,931.7 | |
| Inter-American Development Bank (3) | | | 1,913.7 | | | | 82.3 | |
| Inter-American Investment Corporation (3) | | | 13.3 | | | | 13.3 | |
| Fund for Special Operations (3) | | | 230.0 | | | | 230.0 | |
| International Fund for Agricultural Development (IFAD)(3) | | | 335.9 | | | | 321.9 | |
| Caribbean Development Bank (3) | | | 50.2 | | | | 11.1 | |
| Special Development Fund of the Caribbean Development Bank (3) | | | 66.9 | | | | 58.04 | |
| European Bank for Reconstruction and Development (EBRD)(3)(5) | | | 2,371.5 | | | | 622.1 | |
| Council of Europe Development Bank (CEB)(3)(5) | | | 765.0 | | | | 84.5 | |
| | |
| (1) | | Subscriptions are in part committed in $, SDR or EUR. SDR or EUR commitments are converted to $ at year-end exchange rates, except that certain SDR commitments are converted at the fixed conversion rate of SDR 1 = $ 1.54027. |
| |
| (2) | | Source: computation provided by the Ministry of Finance based on data provided by the International Monetary Fund. |
| |
| (3) | | Source: computation provided by the Ministry of Finance and the Ministry for Economic Cooperation and Development. |
| |
| | | IFAD as of December 31, 2007. |
| |
| (4) | | Source: IBRD and IDA: Worldbank Annual Report 2008 (June 30, 2008); IFC: Consolidated Financial Statements 2008 (June 30, 2008). The amount does not differentiate between amount subscribed and paid-in. |
| |
| (5) | | Source: computation provided by the Ministry of Finance based on euro exchange rate of the European Central Bank at year-end 2008 of EUR 1 per $ 1.39170. |
G-42