EXHIBIT 13
Business Profile
Founded in 1956, Raven today is an industrial manufacturer with four operating units. The company has divested lower-performing assets, simplified its product bases, and enhanced profitability (cash return on invested capital) and shareholder value–a strategy of “Improve, innovate, grow.”
Operating Unit Products Markets Competitive Strengths Flow Controls c Computerized control c Agriculture OEMs and c Market leader for hardware and software for sprayer manufacturers ag sprayer controls precision farmingc Marine navigation c Strong brand recognition c Leading developer of and distribution network GPS-based control c New Precision Solutions(TM) systems product line c Precision application of pesticides, fertilizer and road de-icers Engineered Films c Rugged reinforced plastic c Manufactured housing c Vertically integrated sheeting and RVs manufacturing capabilities cTemporary grain covers for c Broad product line agriculture c Superior target marketing cTemporary building c High productivity and low-construction enclosures cost structure cPond lining and containment for oil exploration c High-altitude research c NASA c Sole source in US for balloons c Universities scientific balloons c Worldwide reputation for leadership Electronic Systems c Electronics Manufacturing c Primarily industrial OEMs c Advanced manufacturing, Services (EMS) in North America technology cFortune 500 companies c Full-service provider, from that contract their low-engineering and volume, high-mix manufacturing to customer production service c ISO 9001 Aerostar c Military cargo parachutes c US military, homelandc Reputation for innovation c Government service defense and foreign and quality uniforms governments c Best technology c Custom-shaped inflatables c Promotional and advertising markets, including Disney and Macy’s

RAVEN 2004 Annual Report page1
Eleven-Year Financial Summary
| | | | | | | | | | | | | |
| | | For the years ended January 31,
|
Dollars in thousands, except per-share data
| | 2004
| | 2003
| | 2002
|
OPERATIONS FOR THE YEAR | | | | | | | | | | | | |
| Net sales | | | | | | | | | | | | |
| Ongoing operations | | $ | 142,727 | | | $ | 119,589 | | | $ | 112,018 | |
Sold businesses(a) | | | — | | | | 1,314 | | | | 6,497 | |
| Total | | | 142,727 | | | | 120,903 | | | | 118,515 | |
| Gross profit | | | 33,759 | | | | 27,515 | | | | 23,851 | |
| Operating income | | | | | | | | | | | | |
| Ongoing operations | | | 21,981 | | | | 16,861 | | | | 13,788 | |
Sold businesses(a) | | | (355 | ) | | | 204 | | | | (613 | ) |
| Total | | | 21,626 | | | | 17,065 | | | | 13,175 | |
| Income before income taxes | | | 21,716 | | | | 17,254 | | | | 13,565 | |
| Net income | | $ | 13,836 | | | $ | 11,185 | | | $ | 8,847 | |
| Net income % of sales | | | 9.7 | % | | | 9.3 | % | | | 7.5 | % |
| Net income % of beginning equity | | | 23.8 | % | | | 21.5 | % | | | 18.4 | % |
| Cash dividends | | $ | 3,075 | | | $ | 2,563 | | | $ | 2,371 | |
FINANCIAL POSITION | | | | | | | | | | | | |
| Current assets | | $ | 55,710 | | | $ | 49,351 | | | $ | 45,308 | |
| Current liabilities | | | 11,895 | | | | 13,167 | | | | 13,810 | |
| Working capital | | $ | 43,815 | | | $ | 36,184 | | | $ | 31,498 | |
| Current ratio | | | 4.68 | | | | 3.75 | | | | 3.28 | |
| Property, plant and equipment | | $ | 15,950 | | | $ | 16,455 | | | $ | 14,059 | |
| Total assets | | | 79,508 | | | | 72,816 | | | | 67,836 | |
| Long-term debt, less current portion | | | 57 | | | | 151 | | | | 280 | |
| Shareholders’ equity | | $ | 66,471 | | | $ | 58,236 | | | $ | 52,032 | |
| Long-term debt / total capitalization | | | 0.1 | % | | | 0.3 | % | | | 0.5 | % |
| Inventory turnover (CGS / year-end inventory) | | | 6.5 | | | | 4.4 | | | | 5.0 | |
CASH FLOWS PROVIDED BY (USED IN) | | | | | | | | | | | | |
| Operating activities | | $ | 19,732 | | | $ | 12,735 | | | $ | 18,496 | |
| Investing activities | | | (4,352 | ) | | | (9,166 | ) | | | (13,152 | ) |
| Financing activities | | | (6,155 | ) | | | (5,830 | ) | | | (8,539 | ) |
| Increase (decrease) in cash | | | 9,225 | | | | (2,261 | ) | | | (3,195 | ) |
COMMON STOCK DATA | | | | | | | | | | | | |
| Net income per-share — basic | | $ | 1.53 | | | $ | 1.22 | | | $ | 0.95 | |
| Net income per-share — diluted | | | 1.50 | | | | 1.20 | | | | 0.93 | |
| Cash dividends per-share | | | 0.34 | | | | 0.28 | | | | 0.25 | |
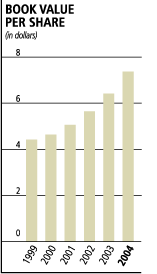
| Book value per-share | | | 7.37 | | | | 6.42 | | | | 5.65 | |
| Stock price range during year | | | | | | | | | | | | |
| High | | $ | 30.45 | | | $ | 18.40 | | | $ | 11.75 | |
| Low | | | 15.12 | | | | 8.75 | | | | 6.04 | |
| Close | | $ | 28.21 | | | $ | 15.81 | | | $ | 11.28 | |
| Shares outstanding, year-end (in thousands) | | | 9,021 | | | | 9,066 | | | | 9,212 | |
| Number of shareholders, year-end | | | 3,560 | | | | 2,781 | | | | 2,387 | |
OTHER DATA | | | | | | | | | | | | |
| Price / earnings ratio | | | 18.8 | | | | 13.2 | | | | 12.1 | |
| Average number of employees | | | 770 | | | | 758 | | | | 838 | |
| Sales per employee | | $ | 185 | | | $ | 160 | | | $ | 141 | |
| Backlog | | $ | 47,120 | | | $ | 42,826 | | | $ | 33,834 | |
All per-share, shares outstanding and market price data reflect the January 2003 two-for-one stock split and the July 2001 three-for-two stock split. All other figures are as reported.
Price / earnings ratio is determined as closing stock price divided by net income per share-diluted.
| (a) | | During the second quarter of fiscal 2003, the company sold its Beta Raven Industrial Controls Division. In fiscal 2001, 2000 and 1996, the company sold its Plastic Tank, Glasstite and Astoria businesses, respectively. |
| |
| (b) | | Includes $2.6 million of business repositioning charges, net of gains on plant sales, primarily in Electronic Systems Division and Aerostar. |
page14 RAVEN2004 Annual Report
| | | | | | | | | | | | | | | | | | | | | | | | | | | | | | | |
For the years ended January 31,
|
2001(g)
| | 2000(g)
| | 1999(g)
| | 1998(g)
| | 1997(g)
| | 1996(g)
| | 1995(g)
| | 1994(g)
|
| |
| |
| $ | 113,360 | | | $ | 107,862 | | | $ | 108,408 | | | $ | 104,489 | | | $ | 101,869 | | | $ | 84,379 | | | $ | 87,458 | | | $ | 88,608 | |
| | 19,498 | | | | 42,523 | | | | 46,798 | | | | 47,679 | | | | 39,576 | | | | 38,010 | | | | 35,889 | | | | 34,279 | |
| | 132,858 | | | | 150,385 | | | | 155,206 | | | | 152,168 | | | | 141,445 | | | | 122,389 | | | | 123,347 | | | | 122,887 | |
| | 21,123 | | | | 24,217 | | | | 24,441 | | | | 24,929 | | | | 25,287 | | | | 22,660 | | | | 23,968 | | | | 23,574 | |
| |
| | 7,417 | (b) | | | 7,971 | | | | 8,220 | | | | 9,555 | | | | 9,321 | | | | 7,692 | | | | 10,470 | | | | 8,054 | |
| | 3,331 | (c) | | | 2,606 | (d) | | | 1,453 | | | | 1,007 | | | | 2,650 | | | | 1,869 | | | | 466 | (f) | | | 2,386 | |
| | 10,748 | | | | 10,577 | | | | 9,673 | | | | 10,562 | | | | 11,971 | | | | 9,561 | | | | 10,936 | | | | 10,440 | |
| | 10,924 | | | | 10,503 | | | | 9,649 | | | | 12,540 | (e) | | | 11,915 | | | | 9,566 | | | | 9,372 | | | | 10,638 | |
| $ | 6,411 | (b)(c) | | $ | 6,762 | (d) | | $ | 6,182 | | | $ | 8,062 | | | $ | 7,688 | | | $ | 6,197 | | | $ | 6,088 | (f) | | $ | 6,954 | |
| | 4.8 | % | | | 4.5 | % | | | 4.0 | % | | | 5.3 | % | | | 5.4 | % | | | 5.1 | % | | | 4.9 | % | | | 5.7 | % |
| | 11.8 | % | | | 10.9 | % | | | 10.0 | % | | | 14.2 | % | | | 15.6 | % | | | 13.6 | % | | | 14.8 | % | | | 19.6 | % |
| $ | 2,399 | | | $ | 2,895 | | | $ | 2,944 | | | $ | 2,709 | | | $ | 2,367 | | | $ | 2,130 | | | $ | 1,843 | | | $ | 1,545 | |
| |
| $ | 51,817 | | | $ | 55,371 | | | $ | 60,279 | | | $ | 57,285 | | | $ | 56,696 | | | $ | 45,695 | | | $ | 43,795 | | | $ | 45,037 | |
| | 13,935 | | | | 14,702 | | | | 15,128 | | | | 17,816 | | | | 20,016 | | | | 14,771 | | | | 15,078 | | | | 16,088 | |
| $ | 37,882 | | | $ | 40,669 | | | $ | 45,151 | | | $ | 39,469 | | | $ | 36,680 | | | $ | 30,924 | | | $ | 28,717 | | | $ | 28,949 | |
| | 3.72 | | | | 3.77 | | | | 3.98 | | | | 3.22 | | | | 2.83 | | | | 3.09 | | | | 2.90 | | | | 2.80 | |
| $ | 11,647 | | | $ | 15,068 | | | $ | 19,563 | | | $ | 19,817 | | | $ | 18,142 | | | $ | 18,069 | | | $ | 18,570 | | | $ | 13,371 | |
| | 65,656 | | | | 74,047 | | | | 83,657 | | | | 82,066 | | | | 80,662 | | | | 67,553 | | | | 65,636 | | | | 60,597 | |
| | 2,013 | | | | 3,024 | | | | 4,572 | | | | 1,128 | | | | 3,181 | | | | 2,816 | | | | 4,179 | | | | 2,539 | |
| $ | 47,989 | | | $ | 54,519 | | | $ | 62,293 | | | $ | 61,563 | | | $ | 56,729 | | | $ | 49,151 | | | $ | 45,526 | | | $ | 41,100 | |
| | 4.0 | % | | | 5.3 | % | | | 6.8 | % | | | 1.8 | % | | | 5.3 | % | | | 5.4 | % | | | 8.4 | % | | | 5.8 | % |
| | 5.9 | | | | 5.2 | | | | 4.9 | | | | 4.8 | | | | 4.5 | | | | 4.1 | | | | 4.4 | | | | 4.4 | |
| |
| $ | 9,441 | | | $ | 10,375 | | | $ | 8,326 | | | $ | 9,274 | | | $ | 7,088 | | | $ | 9,687 | | | $ | 7,452 | | | $ | 11,257 | |
| | 9,752 | | | | 6,323 | | | | (3,127 | ) | | | (4,979 | ) | | | (5,090 | ) | | | (4,158 | ) | | | (10,000 | ) | | | (5,908 | ) |
| | (14,227 | ) | | | (16,326 | ) | | | (2,714 | ) | | | (4,884 | ) | | | (2,363 | ) | | | (4,029 | ) | | | 406 | | | | (2,042 | ) |
| | 4,966 | | | | 372 | | | | 2,485 | | | | (589 | ) | | | (365 | ) | | | 1,500 | | | | (2,142 | ) | | | 3,307 | |
| |
| $ | 0.62 | | | $ | 0.52 | | | $ | 0.43 | | | $ | 0.55 | | | $ | 0.54 | | | $ | 0.44 | | | $ | 0.43 | | | $ | 0.49 | |
| | 0.62 | | | | 0.52 | | | | 0.43 | | | | 0.55 | | | | 0.54 | | | | 0.43 | | | | 0.42 | | | | 0.48 | |
| | 0.23 | | | | 0.22 | | | | 0.21 | | | | 0.19 | | | | 0.17 | | | | 0.15 | | | | 0.13 | | | | 0.11 | |
| | 5.06 | | | | 4.64 | | | | 4.42 | | | | 4.25 | | | | 3.91 | | | | 3.47 | | | | 3.20 | | | | 2.92 | |
| |
| $ | 6.95 | | | $ | 6.08 | | | $ | 7.58 | | | $ | 8.58 | | | $ | 7.83 | | | $ | 6.92 | | | $ | 8.17 | | | $ | 7.83 | |
| | 3.75 | | | | 4.50 | | | | 5.08 | | | | 6.54 | | | | 5.33 | | | | 5.17 | | | | 6.00 | | | | 6.00 | |
| $ | 6.08 | | | $ | 4.79 | | | $ | 5.33 | | | $ | 7.54 | | | $ | 7.50 | | | $ | 6.42 | | | $ | 6.25 | | | $ | 6.67 | |
| | 9,478 | | | | 11,748 | | | | 14,082 | | | | 14,472 | | | | 14,508 | | | | 14,148 | | | | 14,205 | | | | 14,082 | |
| | 2,460 | | | | 2,749 | | | | 3,014 | | | | 3,221 | | | | 3,011 | | | | 3,190 | | | | 3,031 | | | | 3,173 | |
| |
| | 9.8 | | | | 9.2 | | | | 12.4 | | | | 13.7 | | | | 13.9 | | | | 14.9 | | | | 14.9 | | | | 13.9 | |
| | 1,043 | | | | 1,320 | | | | 1,445 | | | | 1,511 | | | | 1,387 | | | | 1,368 | | | | 1,414 | | | | 1,435 | |
| $ | 127 | | | $ | 114 | | | $ | 107 | | | $ | 101 | | | $ | 102 | | | $ | 89 | | | $ | 87 | | | $ | 86 | |
| $ | 38,239 | | | $ | 44,935 | | | $ | 47,431 | | | $ | 47,154 | | | $ | 38,102 | | | $ | 32,539 | | | $ | 29,661 | | | $ | 36,403 | |
| (c) | | Includes the $3.1 million pretax gain ($1.4 million net of tax) on the sale of the company’s Plastic Tank Division. |
| |
| (d) | | Includes the $1.2 million pretax gain ($764,000 net of tax) on the sale of assets of the company’s Glasstite subsidiary. |
| |
| (e) | | Includes the $1.8 million pretax gain ($1.2 million net of tax) on sale of an investment in an affiliate. |
| |
| (f) | | Includes $1.8 million of business repositioning charges at the company’s Beta Raven Industrial Controls Division. |
| |
| (g) | | Amounts for these years are unaudited. |
RAVEN2004 Annual Report page15
Business Segments
| | | | | | | | | | | | | | | | | | | | | | | | | |
| | | For the years ended January 31
|
| Dollars in thousands | | 2004
| | 2003
| | 2002
| | 2001(i)
| | 2000(i)
| | 1999(i)
|
| | | | | | | | | | | | | | | | | | | | | | | | | |
FLOW CONTROLS DIVISION | | | | | | | | | | | | | | | | | | | | | | | | |
| Sales | | $ | 35,059 | | | $ | 28,496 | | | $ | 23,178 | | | $ | 16,758 | | | $ | 13,520 | | | $ | 15,311 | |
| Operating income | | | 8,254 | | | | 6,897 | | | | 5,509 | (b) | | | 3,985 | | | | 2,873 | | | | 2,810 | |
| Assets | | | 19,304 | | | | 21,483 | | | | 20,313 | | | | 9,578 | | | | 7,096 | | | | 8,553 | |
| Capital expenditures | | | 341 | | | | 729 | | | | 677 | | | | 327 | | | | 202 | | | | 501 | |
| Depreciation & amortization | | | 1,004 | | | | 948 | | | | 443 | | | | 353 | | | | 351 | | | | 329 | |
ENGINEERED FILMS DIVISION | | | | | | | | | | | | | | | | | | | | | | | | |
| Sales | | $ | 46,408 | | | $ | 39,975 | | | $ | 40,280 | | | $ | 40,004 | | | $ | 35,889 | | | $ | 32,514 | |
| Operating income | | | 11,701 | | | | 11,447 | | | | 9,886 | | | | 8,810 | | | | 7,464 | | | | 5,836 | |
| Assets | | | 18,108 | | | | 18,507 | | | | 14,847 | | | | 13,031 | | | | 13,472 | | | | 13,177 | |
| Capital expenditures | | | 1,707 | | | | 4,111 | | | | 3,182 | | | | 674 | | | | 792 | | | | 566 | |
| Depreciation & amortization | | | 1,664 | | | | 1,495 | | | | 1,085 | | | | 1,033 | | | | 1,075 | | | | 1,136 | |
ELECTRONIC SYSTEMS DIVISION | | | | | | | | | | | | | | | | | | | | | | | | |
| Sales | | $ | 44,307 | | | $ | 38,589 | | | $ | 32,289 | | | $ | 32,039 | | | $ | 30,176 | | | $ | 24,958 | |
| Operating income (loss) | | | 5,797 | | | | 4,022 | | | | 2,264 | | | | (542 | )(d) | | | 1,632 | | | | 2,322 | |
| Assets | | | 14,975 | | | | 14,528 | | | | 13,910 | | | | 15,359 | | | | 18,846 | | | | 15,591 | |
| Capital expenditures | | | 841 | | | | 395 | | | | 774 | | | | 1,492 | | | | 1,168 | | | | 1,399 | |
| Depreciation & amortization | | | 850 | | | | 978 | | | | 1,101 | | | | 1,089 | | | | 1,032 | | | | 959 | |
AEROSTAR | | | | | | | | | | | | | | | | | | | | | | | | |
| Sales | | $ | 16,953 | | | $ | 12,529 | | | $ | 16,271 | | | $ | 24,559 | | | $ | 28,277 | | | $ | 35,625 | |
| Operating income (loss) | | | 1,954 | (a) | | | (405 | ) | | | 1,278 | (c) | | | 1,583 | | | | 2,092 | | | | 2,724 | |
| Assets | | | 5,589 | | | | 5,769 | | | | 5,994 | | | | 7,361 | | | | 11,307 | | | | 14,446 | |
| Capital expenditures | | | 135 | | | | 539 | | | | 252 | | | | 122 | | | | 117 | | | | 308 | |
| Depreciation & amortization | | | 383 | | | | 354 | | | | 263 | | | | 280 | | | | 372 | | | | 464 | |
SOLD BUSINESSES(g) | | | | | | | | | | | | | | | | | | | | | | | | |
| Sales | | $ | — | | | $ | 1,314 | | | $ | 6,497 | | | $ | 19,498 | | | $ | 42,523 | | | $ | 46,798 | |
| Operating income (loss) | | | (355 | ) | | | 204 | | | | (613 | ) | | | 3,331 | (e) | | | 2,606 | (f) | | | 1,453 | |
| Assets | | | — | | | | — | | | | 1,102 | | | | 4,805 | | | | 13,475 | | | | 22,048 | |
| Capital expenditures | | | — | | | | 7 | | | | 52 | | | | 246 | | | | 1,172 | | | | 1,585 | |
| Depreciation & amortization | | | — | | | | 20 | | | | 76 | | | | 718 | | | | 1,831 | | | | 2,004 | |
REPORTABLE SEGMENTS TOTAL | | | | | | | | | | | | | | | | | | | | | | | | |
| Sales | | $ | 142,727 | | | $ | 120,903 | | | $ | 118,515 | | | $ | 132,858 | | | $ | 150,385 | | | $ | 155,206 | |
| Operating income | | | 27,351 | (a) | | | 22,165 | | | | 18,324 | (b,c ) | | | 17,167 | (d,e) | | | 16,667 | (f) | | | 15,145 | |
| Assets | | | 57,976 | | | | 60,287 | | | | 56,166 | | | | 50,134 | | | | 64,196 | | | | 73,815 | |
| Capital expenditures | | | 3,024 | | | | 5,781 | | | | 4,937 | | | | 2,861 | | | | 3,451 | | | | 4,359 | |
| Depreciation & amortization | | | 3,901 | | | | 3,795 | | | | 2,968 | | | | 3,473 | | | | 4,661 | | | | 4,892 | |
CORPORATE & OTHER(h) | | | | | | | | | | | | | | | | | | | | | | | | |
| Operating (loss) | | $ | (5,725 | ) | | $ | (5,100 | ) | | $ | (5,149 | ) | | $ | (6,419 | ) | | $ | (6,090 | ) | | $ | (5,472 | ) |
| Assets | | | 21,532 | | | | 12,529 | | | | 11,670 | | | | 15,522 | | | | 9,851 | | | | 9,842 | |
| Capital expenditures | | | 306 | | | | 252 | | | | 157 | | | | 229 | | | | 188 | | | | 247 | |
| Depreciation & amortization | | | 244 | | | | 171 | | | | 177 | | | | 194 | | | | 223 | | | | 241 | |
TOTAL COMPANY | | | | | | | | | | | | | | | | | | | | | | | | |
| Sales | | $ | 142,727 | | | $ | 120,903 | | | $ | 118,515 | | | $ | 132,858 | | | $ | 150,385 | | | $ | 155,206 | |
| Operating income | | | 21,626 | (a) | | | 17,065 | | | | 13,175 | (b,c) | | | 10,748 | (b,c) | | | 10,577 | (f) | | | 9,673 | |
| Assets | | | 79,508 | | | | 72,816 | | | | 67,836 | | | | 65,656 | | | | 74,047 | | | | 83,657 | |
| Capital expenditures | | | 3,330 | | | | 6,033 | | | | 5,094 | | | | 3,090 | | | | 3,639 | | | | 4,606 | |
| Depreciation & amortization | | | 4,145 | | | | 3,966 | | | | 3,145 | | | | 3,667 | | | | 4,884 | | | | 5,133 | |
| (a) | | Includes $182,000 of pretax gain on plant sale. |
| |
| (b) | | Includes a $550,000 in-process research and development charge, related to the Starlink acquisition. |
| |
| (c) | | Includes $414,000 of pretax gains on plant sales. |
| |
| (d) | | Includes $1.8 million of business repositioning charges in the Electronic Systems Division and $2.6 million for the total company. |
| |
| (e) | | Includes a $3.1 million pretax gain on the sale of the company’s Plastic Tank Division. |
| |
| (f) | | Includes a $1.2 million pretax gain on the sale of the company’s Glasstite business. |
| |
| (g) | | Operating income for sold businesses includes administrative expenses directly attributable to the sold businesses. |
| |
| (h) | | Operating loss consists of administrative expenses — assets are principally cash, investments, deferred taxes and notes receivable. |
| |
| (i) | | Amounts for 2001, 2000 and 1999 are unaudited. |
page16 RAVEN2004 Annual Report
Financial Review and Analysis
RESULTS OF OPERATIONS
The following table presents comparative financial performance for the past three years:
| | | | | | | | | | | | | | | | | | | | | | | | | | | | | | | | | | | | | |
| | | For the years ended January 31
|
| | | 2004
| | 2003
| | 2002
|
| | | | | | | % | | % | | | | | | % | | % | | | | | | % | | % |
| Dollars in thousands, except per-share data | |
| | Sales
| | Change
| |
| | Sales
| | Change
| |
| | Sales
| | Change
|
| | | | | | | | | | | | | | | | | | | | | | | | | | | | | | | | | | | | | |
| Net sales | | $ | 142,727 | | | | 100.0 | | | | +18.1 | | | $ | 120,903 | | | | 100.0 | | | | + 2.0 | | | $ | 118,515 | | | | 100.0 | | | | –10.8 | |
| Gross profit | | | 33,759 | | | | 23.7 | | | | +22.7 | | | | 27,515 | | | | 22.8 | | | | +15.4 | | | | 23,851 | | | | 20.1 | | | | +12.9 | |
| Operating expenses | | | 11,960 | | | | 8.4 | | | | +12.5 | | | | 10,629 | | | | 8.8 | | | | – 3.7 | | | | 11,043 | | | | 9.3 | | | | –20.5 | |
| Loss (gain) on sale of businesses and assets | | | 173 | | | | | | | | | | | | (179 | ) | | | | | | | | | | | (367 | ) | | | | | | | | |
| Operating income | | | 21,626 | | | | 15.2 | | | | +26.7 | | | | 17,065 | | | | 14.1 | | | | +29.5 | | | | 13,175 | | | | 11.1 | | | | +22.6 | |
| Income before income taxes | | | 21,716 | | | | 15.2 | | | | +25.9 | | | | 17,254 | | | | 14.3 | | | | +27.2 | | | | 13,565 | | | | 11.4 | | | | +24.2 | |
| Income taxes | | | 7,880 | | | | 5.5 | | | | +29.8 | | | | 6,069 | | | | 5.0 | | | | +28.6 | | | | 4,718 | | | | 4.0 | | | | + 4.5 | |
| Net income | | $ | 13,836 | | | | 9.7 | | | | +23.7 | | | $ | 11,185 | | | | 9.3 | | | | +26.4 | | | $ | 8,847 | | | | 7.5 | | | | +38.0 | |
| Net income per-share — diluted | | $ | 1.50 | | | | | | | | +25.0 | | | $ | 1.20 | | | | | | | | +29.0 | | | $ | 0.93 | | | | | | | | +50.0 | |
| Effective income tax rate | | | 36.3 | % | | | | | | | + 3.1 | | | | 35.2 | % | | | | | | | + 1.1 | | | | 34.8 | % | | | | | | | –15.8 | |
EXECUTIVE SUMMARY
Consolidated Operating Results
Company performance reached new highs in fiscal 2004, surpassing fiscal 2003’s record-setting results with $13.8 million in net income and $1.50 of earnings per diluted share. This represents growth in net income and diluted earnings per share of $2.6 million and $0.30, respectively. All the divisions performed better than the prior fiscal year, both at the sales and operating income levels. Sales increased as a result of new product introductions and market share gains. Results for fiscal 2003 were also a record, with net income increasing $2.3 million, to $11.2 million, or $1.20 per diluted share.
During fiscal 2004, the board of directors elected to increase dividends twice, from 7 cents per share to 8 cents effective for the first- and second-quarter payments, and to 9 cents in August for the third and fourth quarters. On March 9, 2004, the quarterly dividend was increased again, to 11 cents per share, helping to meet the 30% dividend payout target the company had previously set. A special dividend of $1.25 per share was also declared, payable in May 2004, which will total approximately $11 million. In fiscal 2003, the company split the stock two-for-one, and increased dividends from 6.5 cents to 7.0 cents per share. Capital expenditures totaled over $3.0 million for fiscal 2004, after spending $6.0 million in fiscal 2003, principally for construction of an extrusion line and additional warehouse space for the Engineered Films segment. Fiscal 2005 capital expenditures are anticipated to exceed $10 million, with over half of that directed towards new extrusion technology and warehouse capacity for Engineered Films.
Management has planned for fiscal 2005 to be another year of double-digit sales and profit growth, with earnings for the first half relatively flat. The flat earnings are anticipated because the Flow Controls segment will not see a repeat of the special chemical-injection systems sale that totaled $6.0 million in the first half of fiscal 2004.
The following discussion highlights the consolidated operating results. Results at the divisional and subsidiary level are more fully explained in the segment discussions that follow. In addition, the company has undertaken divestitures and repositioning activities in the past three fiscal years which are more fully explained under “Divestitures and Repositioning Activities.”
Fiscal 2004 versus fiscal 2003
The company’s net sales of $142.7 million topped fiscal 2003 net sales of $120.9 million by $21.8 million. This 18.1% increase is a result of all the divisions achieving sales growth over fiscal 2003. Operating income grew 26.7% to $21.6 million as a result of increased gross profits in all the divisions. Flow Controls boasted a $6.6 million sales increase to $35.1 million on increased special-order chemical injection system sales and new product sales and its operating income reached $8.3 million. Engineered Films sales of $46.4 million were up 16.1% over fiscal 2003, but material pricing pressures kept operating income relatively flat at $11.7 million. Electronic Systems increased sales 14.8% to $44.3 million while growing operating income to $5.8 million, or 44.1%, from a selective customer base generating new and expanded orders. Aerostar effected a strong turnaround, increasing sales from $12.5 million to $17.0 million, and moving from an operating loss position in fiscal 2003 to operating income
RAVEN2004 Annual Report page17
of $2.0 million in fiscal 2004, largely due to a US Army cargo parachute contract. Fiscal 2003 results also included $1.3 million in net sales and $204,000 of operating income related to operations of Sold Businesses. Fiscal 2004 results include no sales and an operating loss of $355,000 for ongoing environmental and legal liabilities associated with previously sold businesses.
Fiscal 2003 versus fiscal 2002
Net sales of $120.9 million and operating income of $17.1 million represented 2.0% and 29.5% growth over fiscal 2002. Flow Controls had a solid year with a $5.3 million increase in net sales and $1.4 million growth in operating income, principally as a result of the Starlink acquisition. Engineered Films’ sales were flat at $40.0 million, but strong gross profits resulted in a 15.8% increase in operating income to $11.4 million. Electronic Systems had the largest increase in sales, up $6.3 million to $38.6 million while operating income climbed 77.7% to $4.0 million, due in part to the System Integrators acquisition and operating efficiencies. Aerostar’s net sales were negatively impacted by the withdrawal from the cold-weather outer-wear business, declining $3.7 million to $12.5 million, which, along with dropping gross profits, resulted in an operating loss of $405,000 compared to income of $1.3 million for fiscal 2002. Sold businesses’ net sales dropped $5.2 million to $1.3 million and contributed $204,000 of operating income.
FISCAL 2004 PERFORMANCE MEASURES
The company’s net income was 9.7% of net sales for fiscal 2004. In terms of average assets, net income was 18.2%. This highlights the company’s effective use of its assets to generate income. Finally, as a percent of beginning equity for fiscal 2004, net income was 23.8%, underscoring the value generated for shareholders.
| | | | | | | | | | | | | | | | | | | | | | | | | |
| | | 2004
| | 2003
| | 2002
| | 2001
| | 2000
| | 1999
|
| Net income as % of | | | | | | | | | | | | | | | | | | | | | | | | |
| Net sales | | | 9.7 | % | | | 9.3 | % | | | 7.5 | % | | | 4.8 | % | | | 4.5 | % | | | 4.0 | % |
| Average assets | | | 18.2 | % | | | 15.9 | % | | | 13.3 | % | | | 9.2 | % | | | 8.6 | % | | | 7.4 | % |
| Beginning equity | | | 23.8 | % | | | 21.5 | % | | | 18.4 | % | | | 11.8 | % | | | 10.9 | % | | | 10.0 | % |
DIVESTITURES AND OTHER REPOSITIONING ACTIVITIES
Over the past three years, the company has closed and downsized business units that did not provide proper returns on investment.While the company will continue to review the utilization of invested capital, management believes this activity was substantially completed in fiscal 2003.
Fiscal 2004 Activities
Fiscal 2004 divestiture activities were limited to the sale, by the company’s Aerostar subsidiary, of a sewing plant closed in fiscal 2003. The sale of that plant and its related equipment resulted in cash proceeds of $196,000 and a pretax gain of $182,000. This gain was offset by a $355,000 loss from increased liabilities for environmental or legal issues related to previously sold businesses, as estimated by the company and its advisors.
Fiscal 2003 Activities
During fiscal 2003, the former Beta Raven Industrial Controls Division was sold. A pretax gain of $104,000 and $577,000 of cash proceeds were realized on the completion of the disposal of that subsidiary. An Aerostar sewing plant was closed during the third quarter as well. The remainder of the pretax net gain of $179,000 related to the collection of a previously discounted note receivable, net of increased anticipated costs from ongoing environmental and legal liabilities from previously sold businesses.
Fiscal 2002 Activities
In fiscal 2002, the company recorded a net pretax gain of $367,000 related to the sale of its former Sportswear Division warehouse and the closure of its remaining Plastic Tank Division operations in Tacoma, Washington. The company also incurred $249,000 of pretax charges to reposition the Industrial Controls Division of Beta Raven, including the closing of its Alabama plant. This charge was included in cost of goods sold in the Sold Businesses segment.
page18 RAVEN2004 Annual Report
Sold Businesses
Fiscal 2003 net sales from Sold Businesses of $1.3 million were entirely composed of Beta Raven Industrial Controls Division operations. Operating income totaled $204,000 which included $179,000 of gains on asset sales. Net sales from Sold Businesses in fiscal 2002 were $6.5 million with $3.0 million from Beta Raven and $3.5 million from the Plastic Tank Division. Operating losses were $613,000 with $47,000 of losses on asset sales.
RESULTS OF OPERATIONS
SALES AND OPERATING INCOME BY SEGMENT
| | | | | | | | | | | | | | | | | | | | | | | | | |
| | | 2004
| | 2003
| | 2002
|
| | | | | | | % | | | | | | % | | | | | | % |
| Dollars in thousands | | amount
| | change
| | amount
| | change
| | amount
| | change
|
| | | | | | | | | | | | | | | | | | | | | | | | | |
SALES | | | | | | | | | | | | | | | | | | | | | | | | |
| Flow Controls | | $ | 35,059 | | | | +23.0 | | | $ | 28,496 | | | | +22.9 | | | $ | 23,178 | | | | +38.3 | |
| Engineered Films | | | 46,408 | | | | +16.1 | | | | 39,975 | | | | – 0.8 | | | | 40,280 | | | | + 0.7 | |
| Electronic Systems | | | 44,307 | | | | + 14.8 | | | | 38,589 | | | | +19.5 | | | | 32,289 | | | | + 0.8 | |
| Aerostar | | | 16,953 | | | | +35.3 | | | | 12,529 | | | | –23.0 | | | | 16,271 | | | | –33.7 | |
| | | |
| | | | | | | |
| | | | | | | |
| | | | | |
| Total ongoing | | | 142,727 | | | | +19.3 | | | | 119,589 | | | | + 6.8 | | | | 112,018 | | | | – 1.2 | |
| Sold businesses | | | — | | | | | | | | 1,314 | | | | –79.8 | | | | 6,497 | | | | –66.7 | |
| | | |
| | | | | | | |
| | | | | | | |
| | | | | |
| Total | | $ | 142,727 | | | | +18.1 | | | $ | 120,903 | | | | + 2.0 | | | $ | 118,515 | | | | –10.8 | |
| | | |
| | | | | | | |
| | | | | | | |
| | | | | |
| | | | | | | | | | | | | | | | | | | | | | | | | |
| | | 2004
| | 2003
| | 2002
|
| | | | | | | % | | | | | | % | | | | | | % |
| Dollars in thousands | | amount
| | sales
| | amount
| | sales
| | amount
| | sales
|
| | | | | | | | | | | | | | | | | | | | | | | | | |
OPERATING INCOME (LOSS) | | | | | | | | | | | | | | | | | | | | | | | | |
| Flow Controls | | $ | 8,254 | | | | 23.5 | | | $ | 6,897 | | | | 24.2 | | | $ | 5,509 | | | | 23.8 | |
| Engineered Films | | | 11,701 | | | | 25.2 | | | | 11,447 | | | | 28.6 | | | | 9,886 | | | | 24.5 | |
| Electronic Systems | | | 5,797 | | | | 13.1 | | | | 4,022 | | | | 10.4 | | | | 2,264 | | | | 7.0 | |
| Aerostar | | | 1,954 | | | | 11.5 | | | | (405 | ) | | | (3.2 | ) | | | 1,278 | | | | 7.9 | |
| Corporate expenses | | | (5,725 | ) | | | | | | | (5,100 | ) | | | | | | | (5,149 | ) | | | | |
| | | |
| | | | | | | |
| | | | | | | |
| | | | | |
| Total ongoing | | | 21,981 | | | | 15.4 | | | | 16,861 | | | | 14.1 | | | | 13,788 | | | | 12.3 | |
| Sold businesses | | | (355 | ) | | | | | | | 204 | | | | | | | | (613 | ) | | | | |
| | | |
| | | | | | | |
| | | | | | | |
| | | | | |
| Total | | $ | 21,626 | | | | 15.2 | | | $ | 17,065 | | | | 14.1 | | | $ | 13,175 | | | | 11.1 | |
| | | |
| | | | | | | |
| | | | | | | |
| | | | | |
FLOW CONTROLS
The Flow Controls Division (FCD) provides electronic speed and Global Positioning System (GPS)-based, location-compensated application-control products for the agriculture, marine navigation and other niche markets.

Fiscal 2004 versus fiscal 2003
Net sales of $35.1 million grew 23.0% from fiscal 2003 net sales of $28.5 million. Shipments of $6.0 million under a special order for chemical injection systems during the first half of fiscal 2004 were $2.8 million higher than fiscal 2003 shipments. The division’s precision agriculture distribution plan, comprised of new product introductions, improvements on existing products and an expanded customer base, helped drive the remaining growth. Operating income of $8.3 million surpassed fiscal 2003 operating income by $1.4 million. Higher sales levels in turn produced increased gross profits, but were partially offset by a $678,000, or 39.5%, increase in selling expenses. As a percentage of net sales, gross profits were 30.4% as compared to 29.8% for fiscal 2003. Selling expenses rose sharply from personnel and advertising costs associated with the new precision agriculture distribution plan. Additionally, fiscal 2003 bad debt expense was favorable due to the collection of a receivable for which an allowance had previously been established.
Fiscal 2003 versus fiscal 2002
Fiscal 2003 net sales growth of $5.3 million over fiscal 2002 net sales was propelled mainly by the Starlink acquisition and new product sales. The increase also resulted in higher gross profits, which grew $1.4 million, and combined with a slight decrease in expenses, resulted in operating income of $6.9 million. Selling expenses increased with additional advertising, travel and consulting costs, mostly offset by a credit for bad debt expense due to collection. Gross profits as a percentage of net sales for fiscal 2003 were 29.8%. The fiscal 2002 gross profit percentage was 30.5%, negatively impacted 2.4 percentage
RAVEN2004 Annual Report page19
points due to a $550,000 write-off of acquired research and development costs. The margin decline from fiscal 2002 to fiscal 2003 is due to higher fixed costs which increased as a result of the Starlink acquisition, whose operations concentrate heavily on research and development.
Prospects
The division will continue to emphasize its precision agriculture distribution and marketing plans. FCD is committed to continued focus on improving current products, developing new solutions, and broadening the dealer network. Gaining more market share in the precision agriculture arena will be challenging as competition continues to increase and may cause pricing and margin pressures. The lack of a new chemical injection system special order leaves a substantial gap to fill, and will be particularly evident in the first half of fiscal 2005. The improving farm economy in the United States, and continued success of our precision agriculture initiative, may be sufficient to overcome this first-half shortfall by the end of fiscal 2005. The division remains strong and a key component of the company’s overall success.
ENGINEERED FILMS
The Engineered Films Division (EFD) produces rugged reinforced plastic sheeting for industrial, construction, manufactured housing and agriculture applications and high altitude balloons for public and commercial research.

Fiscal 2004 versus fiscal 2003
The division’s net sales exceeded fiscal 2003 net sales by $6.4 million to reach $46.4 million. The current fiscal year saw an upturn in pit-lining, industrial-market sales, and vapor-barrier sales. A new extrusion line added late in fiscal 2003 is operating according to plan, at approximately one-third capacity, and the expanded product offerings account for a large percentage of the overall sales increase.
Research balloon sales dropped $1.1 million (22.7%) while construction sales remained steady and agriculture sales increased. Despite the sales growth, gross profits increased only 3.9%. Combined with a $237,000, or 11.9%, increase in selling expenses, operating income increased only $254,000. Selling expenses grew as a result of additional sales personnel as the division works to expand its new product sales and market penetration. As a percentage of net sales, gross profits declined from 33.7% to 30.1%. This reflects the fluctuation in raw material costs between the years, although the division adjusts selling prices whenever possible to pass along the increases.
Fiscal 2003 versus fiscal 2002
EFD’s fiscal 2003 net sales of $40.0 million were $305,000 below fiscal 2002 net sales. The markets for pit lining were depressed by reduced oil and gas exploration, while landfill and manufactured housing demand were also below fiscal 2002. Research balloon sales increased 8.8%, and combined with continued strength in the industrial and construction markets, helped to offset some of the shortfall. Operating income of $11.4 million grew $1.6 million over fiscal 2002, a result of low raw material costs that helped drive up gross profits. As a percentage of sales, gross profits increased from 29.1% to 33.7% on lower costs. Partially offsetting that growth was a 13.1% increase in selling expenses, or $231,000, due to higher personnel costs and product improvement expenses.
Prospects
EFD continues to develop new products to fully utilize its extrusion capacity. New products typically carry lower gross profit margins during their introduction into the market-place; however, margins should rise as the products mature and capacity is utilized. Volatility in resin prices can also impact gross profit rates. The division expects to see sales increase in the 10% range with operating income rising along with revenues. Management continues to invest in this division with new extrusion technology and warehouse capacity, still in the planning stage, scheduled to come on-line late in fiscal 2005 or early in fiscal 2006.
page20 RAVEN2004 Annual Report
ELECTRONIC SYSTEMS
The Electronic Systems Division (ESD) is a total-solutions provider of electronics manufacturing services, primarily to North American original equipment manufacturers.
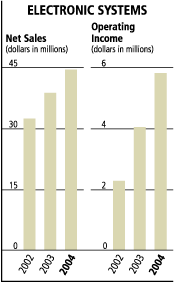
Fiscal 2004 versus fiscal 2003
Division net sales rose 14.8%, or $5.7 million, to $44.3 million over fiscal 2003 net sales. Increased demand for our customers’ products fueled the increase. The division strives to maintain a small but profitable, efficient and selective customer base, and works with these customers to obtain order renewals and new orders as older orders end. Operating income increased $1.8 million over fiscal 2003 operating income of $4.0 million. Gross profit growth was the main contributor, as selling expenses remained relatively flat. Gross profit margins improved from 12.4% in fiscal 2003 to 14.8% in 2004. ESD’s fourth quarter gross profit rate of 13.8% reflected start-up costs related to new customers. The improvement for the full year is a result of production efficiencies and better capacity utilization.
Fiscal 2003 versus fiscal 2002
ESD increased sales 19.5% over fiscal 2002 to reach $38.6 million. Much of the growth is attributable to customers retained from the System Integrators acquisition of December 2001, and sales from the former Beta Raven electronics manufacturing services operations folded into ESD during fiscal 2002. Government contract sales were lower than fiscal 2002, partially offsetting the growth. Operating income for the division reached $4.0 million versus operating income of $2.3 million for fiscal 2002. The growth is attributable to an increase in gross profits, countered by a $126,000 (20.2%) increase in selling expenses.
Selling expenses increased from higher personnel costs. Bad debt expense in fiscal 2002 was favorably impacted by a $92,000 bad debt that was recovered. As a percentage of net sales, gross profits improved from 8.7% to 12.4%. Higher sales, continued focus on improving efficiencies, better utilization rates and a better customer base drove the increase.
Prospects
The division has built solid relationships with its customer base that should continue to provide growth opportunities throughout fiscal 2005. Overall, the division looks for growth in excess of 10% for fiscal 2005, with increases coming from existing accounts and the addition of one or two new customers. Better utilization of capacity and efficiency improvements are expected to increase operating income at a faster pace.

AEROSTAR
The Aerostar segment manufactures military cargo parachutes, government service uniforms and custom-shaped inflatable products.
Fiscal 2004 versus fiscal 2003
Aerostar had a strong turnaround in fiscal 2004, pulling net sales up 35.3% over fiscal 2003 results, to $17.0 million. Shipments under the US Army cargo parachute contract secured in fiscal 2003 increased $6.0 million, offsetting the loss in sales from discontinued outerwear lines and lower advertising-inflatables sales. Operating income of $2.0 million displayed a similarly strong turnaround as compared to a $405,000 loss in fiscal 2003, driven by gross profit increases and selling expense decreases. The restructuring that the subsidiary has undergone in the past three fiscal years has resulted in the elimination of cold-weather outerwear business and a diminished focus on hot-air balloon sales.
RAVEN2004 Annual Report page21
Operating income includes a $182,000 gain on the sale of a sewing plant closed in fiscal 2003. Gross profits increased as a percentage of sales from 4.5% to 15.0%, largely on the strength of the cargo parachute contract and improved margins on other sewn and sealed products. Fiscal 2003 profits were also depressed by $306,000 of inventory obsolescence charges on hot air balloon and apparel operations and start-up costs incurred for parachute manufacturing.
Fiscal 2003 versus fiscal 2002
Fiscal 2003 net sales dropped $3.7 million from the fiscal 2002 net sales level of $16.3 million. The withdrawal from the cold-weather outerwear market was responsible for most of the decline. Hot-air balloon sales were lower and inflatable display purchases were depressed by lower advertising spending by customers. Operating losses reached $405,000, down from an operating income level of $1.3 million in fiscal 2002. A decrease in gross profits drove most of the decline, along with the inclusion in fiscal 2002 operating income of a $414,000 gain on the sale of a building. As a percentage of sales, gross profits declined to 4.5% compared to 11.9% for fiscal 2002. Besides the lower sales levels, inventory obsolescence charges, parachute contract start-up costs and increased product liability costs negatively impacted gross profits.
Prospects
Aerostar has positioned itself for further growth in fiscal 2005. Its current backlog position indicates sales growth in the 10% range. Additional sales growth should improve plant utilization and productivity, driving operating income even higher. New orders secured for parachutes and inflatable military decoys provide a basis for continuing optimism as Aerostar solidifies its product strategy.

EXPENSES, INCOME TAXES AND OTHER
Corporate expenses increased 12.3% over fiscal 2003 to $5.7 million for fiscal 2004. Personnel costs accounted for nearly half of the growth, a result of additional staff and increased compensation and insurance expenses. As a percentage of sales, expenses declined slightly. Expenses were relatively flat in fiscal 2003 as compared to fiscal 2002, declining $49,000. Interest expense increased slightly from $63,000 in fiscal 2003 to $70,000 for fiscal 2004. The company’s main expense was interest on capital leases and deferred acquisition payments from the Starlink and System Integrators acquisitions as no borrowings were made in fiscal 2004. In addition, interest expense was incurred on payments related to a previously accrued tax dispute settlement. Between fiscal 2002 and fiscal 2003, interest expense declined $66,000 due to reduced debt levels from the prepayment of notes. Other income declined from $519,000 for fiscal 2002 to $252,000 and $160,000 in fiscal 2003 and 2004, respectively. The main component of other income is interest income which has suffered from low interest rates despite increased cash and investments, particularly between fiscal 2002 and 2003. Fiscal 2004’s effective income tax rate of 36.3% was higher than the 35.2% effective rate for fiscal 2003 due to state income taxes and higher nondeductible expenses. The impact of graduated rates also declined due to the higher taxable income. Similar factors impacted the growth from 34.8% in fiscal 2002 to 35.2% in fiscal 2003.
LIQUIDITY AND CAPITAL RESOURCES
The following table summarizes cash provided by (used in) the company’s business activities for the past three fiscal years:
| | | | | | | | | | | | | |
| Dollars in thousands | | 2004
| | 2003
| | 2002
|
| | | | | | | | | | | | | |
| Operating activities | | $ | 19,732 | | | $ | 12,735 | | | $ | 18,496 | |
| Investing activities | | | (4,352 | ) | | | (9,166 | ) | | | (13,152 | ) |
| Financing activities | | | (6,155 | ) | | | (5,830 | ) | | | (8,539 | ) |
page22 RAVEN2004 Annual Report
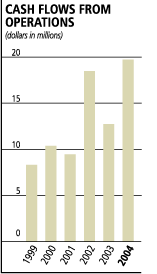
OPERATING ACTIVITIES AND CASH POSITION
Cash flow from operations totaled $19.7 million, a $7.0 million increase over inflows in fiscal 2003. The rise in net income and cash generated from inventory reductions were the main drivers. Flow Controls inventory levels in particular were higher at January 31, 2003, in anticipation of shipments for special order chemical-injection systems shipped in the first half of fiscal 2004. Engineered Films inventories at January 31, 2003, were also higher to take advantage of favorable raw material costs. Accounts receivable increased from January 31, 2003, balances, particularly within Electronic Systems from fourth-quarter shipments and higher sales levels in Engineered Films. Accounts payable shifted from a net cash inflow in fiscal 2003 to a cash use of $1.6 million for fiscal 2004 due to the decline in inventory and through efforts to take advantage of discounts. Fiscal 2003 operating cash flows were $12.7 million as compared to cash flows of $18.5 million for fiscal 2002. Net income was higher, but the growth was offset by a decrease in cash flows from inventory and accounts receivable. Included in fiscal 2002 cash flows was the liquidation of accounts receivable and inventory from the closed Plastic Tank Division. In addition, fiscal 2003 inventory levels were higher in preparation for the chemical-injection systems order and to take advantage of lower material costs.
Cash, cash equivalents and short-term investments totaled $18.4 million at January 31, 2004. This is double the balance of $9.2 million on January 31, 2003, which itself was 22.7% higher than the $7.5 million at January 31, 2002. Increased earnings, minimal capital expenditures and lower inventory levels have generated the growth in available cash. The company expects that cash and short-term investments, combined with continued positive operating cash flows, will continue to be sufficient to fund day-to-day operations and approximately $11 million of special dividends in May 2004.
INVESTING ACTIVITIES
The company used $4.4 million of cash for investing activities in fiscal 2004 versus $9.2 million for fiscal 2003. The company acquired Fluent Systems, LLC for $1.0 million and purchased a formerly leased Engineered Films segment facility for $1.0 million in fiscal 2004. The remaining expenditures represent ongoing capital improvements, partially reduced by proceeds from the sale of an Aerostar sewing plant. Cash used for investing activities in fiscal 2003 decreased $4.0 million as compared to cash used of $13.2 million in fiscal 2002. While no business acquisitions were completed during fiscal 2003 as in fiscal 2002 when Starlink and System Integrators were purchased, the Engineered Films Division completed construction of a $4.4 million extrusion line and additional warehouse space. Short-term investments of $4.0 million were purchased in 2003 with excess cash.
FINANCING ACTIVITIES
Cash used in financing activities of $6.2 million was relatively flat compared to $5.8 million expended in fiscal 2003. The company’s main financing activities continue to be the payment of dividends and the repurchase of company stock. Fiscal 2002 financing activities included $3.0 million in prepayment of a long-term note. The dividend was increased 21.4% over fiscal 2003, and purchases of 144,175 shares at an average price of $21.28 were made during the year. In fiscal 2003, 251,230 shares were repurchased at an average price of $13.23, while 346,618 shares at an average price of $8.22 were repurchased in
RAVEN2004 Annual Report page23
fiscal 2002. On March 9, 2004, the company announced that in addition to a 22% increase in the regular quarterly dividend (from 9 cents to 11 cents per share) a special one-time dividend of $1.25 per share will be paid May 20, 2004. Based on current shares outstanding, the one-time dividend will total approximately $11 million. The company anticipates paying this dividend with existing cash and short-term investments.
No short-term borrowings were made in fiscal 2004. The remaining debt of the company consists of capital leases assumed in the acquisition of Starlink and System Integrators which are scheduled to be repaid by fiscal 2006.
Contractual obligations consist of capital leases and non-cancelable operating leases for facilities and equipment, deferred acquisition payments related to the Starlink, System Integrators and Fluent Systems acquisitions and unconditional purchase obligations primarily for raw materials. The letters of credit have been issued for worker’s compensation insurance obligations that remain from the period of self-insurance (February 1, 2001, and prior). In the event the bank chooses not to renew the line of credit, the letters of credit would cease and alternative methods of support for the insurance obligations would be necessary that would be more expensive and require additional cash outlays. The company believes the chances of such an event are remote. A summary of the obligations and commitments at January 31, 2004, for the next five years is presented in the following table.
| | | | | | | | | | | | | | | | | |
| | | | | | | | | | | FY 2006- | | FY 2008- |
| Dollars in thousands | | Total
| | FY 2005
| | FY 2007
| | FY 2009
|
| | | | | | | | | | | | | | | | | |
| Contractual Obligations: | | | | | | | | | | | | | | | | |
Line of credit(a) | | $ | — | | | $ | — | | | $ | — | | | $ | — | |
| Capital leases | | | 142 | | | | 81 | | | | 61 | | | | — | |
| Deferred acquisition obligations | | | 409 | | | | 409 | | | | — | | | | — | |
| Operating leases | | | 688 | | | | 220 | | | | 331 | | | | 137 | |
| Unconditional purchase obligations | | | 17,464 | | | | 17,464 | | | | — | | | | — | |
| | | |
| | | |
| | | |
| | | |
| |
| | | | 18,703 | | | | 18,174 | | | | 392 | | | | 137 | |
| Other Commercial Commitments: | | | | | | | | | | | | | | | | |
| Letters of credit | | | 1,682 | | | | 1,682 | | | | — | | | | — | |
| | | |
| | | |
| | | |
| | | |
| |
| | | $ | 20,385 | | | $ | 19,856 | | | $ | 392 | | | $ | 137 | |
| | | |
| | | |
| | | |
| | | |
| |
(a) $7.0 million line bears interest at 4.00% and expires July 2004. |

CAPITAL REQUIREMENTS
The company maintains an excellent financial condition and capacity for growth. Management continues to look for opportunities to expand its core businesses through acquisitions or internal growth. The company has the capacity to assume additional financing and will do so if the appropriate strategic opportunity presents itself. Capital expenditures for fiscal 2005 are budgeted to exceed $10 million. Over half of these expenditures will be to support the Engineered Films Division with new extrusion technology and warehouse capacity. Stock repurchases are anticipated to continue as a means to return additional cash to shareholders and increase the leverage of the company’s balance sheet. As noted in the financing section, a one-time dividend of approximately $11 million will also be paid in May 2004. The cash generated from operations and the availability under existing credit facilities is anticipated to be sufficient to fund these initiatives.
page24 RAVEN2004 Annual Report
CRITICAL ACCOUNTING POLICIES AND NEW ACCOUNTING STANDARDS
CRITICAL ACCOUNTING POLICIES
Critical accounting policies for the company are those policies that require the application of judgment when valuing assets and liabilities on the company’s balance sheet. The company, other than utilizing operating leases, does not enter into off balance sheet financing or derivatives. The company’s most difficult accounting decision is determining inventory value at the lower of cost or market. Typically, when a product reaches the end of its life cycle, inventory value declines slowly or the product has alternative uses. Management uses its computerized manufacturing resources planning data to help determine if inventory is slow moving or has become obsolete due to an engineering change. The company closely reviews items that have balances in excess of the prior year’s requirements or that have been dropped from production requirements. Despite these reviews, technological or strategic decisions, made by management or the company’s customers, may result in unexpected excess material. In the Electronic Systems Division, the company typically has recourse to customers for obsolete or excess material. Under terms of the contract, the customers may have to take delivery of the material or compensate the company accordingly. In every operating unit of the company, management must manage obsolete inventory risk. The accounting judgment ultimately made is an evaluation of the success that division management will have in controlling inventory risk and mitigating the impact of obsolescence when it does occur.
Determining the level of the allowance for doubtful accounts, warranty and self-insurance accruals represent management’s best estimate of future events. Historical levels of activity or assistance from advisors may be used in certain circumstances, but knowledge of the current financial climate or the impact of a new product on these accruals always tempers evaluation of the historical data.
The company periodically assesses goodwill and other intangible assets for impairment, at the segment level, using fair value measurement techniques. Estimates of fair value are primarily determined using discounted cash flows, market comparisons and recent transactions. These valuation methodologies use significant estimates and assumptions, which include projected future cash flows, including timing and the risks inherent in future cash flows, perpetual growth rates and determination of appropriate market comparables.
NEW ACCOUNTING STANDARDS
The Financial Accounting Standards Board has released several Staff Positions, Interpretations and revised Standards in the latter portion of fiscal 2004. The company has reviewed the issues covered by these pronouncements, and has determined their impacts to be minimal, and in most cases, not applicable to the company.
CHANGES IN SECURITIES LAWS AND REGULATIONS
The Sarbanes-Oxley Act of 2002 (the “Act”) that became law in July 2002 requires changes in some of the company’s corporate governance and securities disclosure or compliance practices. The company is presently preparing for its required compliance on January 31, 2005, with Section 404 of the Act, and management’s assertions concerning financial reporting controls. This process is time-consuming and costly and involves significant interpretation of proposed requirements. The company believes that while it will be challenging, it will ultimately comply with the requirements.
RAVEN2004 Annual Report page25
Monthly Closing Stock Price and Volume

Quarterly Information (Unaudited)
| | | | | | | | | | | | | | | | | | | | | | | | | | | | | | | | | | | | | | | | | |
| | | | | | | | | | | | | | | | | | | | | | | Net Income | | Common Stock | | |
| Dollars in thousands, | | Net | | Gross | | Operating | | Pretax | | Net | | Per Share(a)(b)
| | Market Price(b)
| | Cash
Dividends |
except per-share data
| | Sales
| | Profit
| | Income
| | Income
| | Income
| | Basic
| | Diluted
| | High
| | Low
| | Per Share(b)
|
FISCAL 2004 | | | | | | | | | | | | | | | | | | | | | | | | | | | | | | | | | | | | | | | | |
First Quarter | | $ | 36,942 | | | $ | 9,437 | | | $ | 6,544 | | | $ | 6,556 | | | $ | 4,183 | | | $ | 0.46 | | | $ | 0.45 | | | $ | 19.00 | | | $ | 15.12 | | | $ | 0.080 | |
Second Quarter | | | 36,110 | | | | 7,811 | | | | 4,937 | | | | 4,976 | | | | 3,163 | | | | 0.35 | | | | 0.34 | | | | 22.00 | | | | 15.80 | | | | 0.080 | |
Third Quarter | | | 36,081 | | | | 9,219 | | | | 6,121 | | | | 6,126 | | | | 3,902 | | | | 0.43 | | | | 0.42 | | | | 27.46 | | | | 21.24 | | | | 0.090 | |
Fourth Quarter | | | 33,594 | | | | 7,292 | | | | 4,024 | | | | 4,058 | | | | 2,588 | | | | 0.29 | | | | 0.28 | | | | 30.45 | | | | 23.77 | | | | 0.090 | |
| | | |
| | | |
| | | |
| | | |
| | | |
| | | |
| | | |
| | | |
| | | |
| | | |
| |
Total Year | | $ | 142,727 | | | $ | 33,759 | | | $ | 21,626 | | | $ | 21,716 | | | $ | 13,836 | | | $ | 1.53 | | | $ | 1.50 | | | $ | 30.45 | | | $ | 15.12 | | | $ | 0.340 | |
| | | |
| | | |
| | | |
| | | |
| | | |
| | | |
| | | |
| | | |
| | | |
| | | |
| |
| FISCAL 2003 | | | | | | | | | | | | | | | | | | | | | | | | | | | | | | | | | | | | | | | | |
| First Quarter | | $ | 30,974 | | | $ | 8,150 | | | $ | 5,304 | | | $ | 5,320 | | | $ | 3,458 | | | $ | 0.38 | | | $ | 0.37 | | | $ | 12.18 | | | $ | 8.75 | | | $ | 0.070 | |
| Second Quarter | | | 29,692 | | | | 5,996 | | | | 3,532 | | | | 3,569 | | | | 2,320 | | | | 0.25 | | | | 0.25 | | | | 14.43 | | | | 10.75 | | | | 0.070 | |
| Third Quarter | | | 31,423 | | | | 7,332 | | | | 4,872 | | | | 4,939 | | | | 3,210 | | | | 0.35 | | | | 0.34 | | | | 14.00 | | | | 11.65 | | | | 0.070 | |
| Fourth Quarter | | | 28,814 | | | | 6,037 | | | | 3,357 | | | | 3,426 | | | | 2,197 | | | | 0.24 | | | | 0.24 | | | | 18.40 | | | | 13.40 | | | | 0.070 | |
| | | |
| | | |
| | | |
| | | |
| | | |
| | | |
| | | |
| | | |
| | | |
| | | |
| |
| Total Year | | $ | 120,903 | | | $ | 27,515 | | | $ | 17,065 | | | $ | 17,254 | | | $ | 11,185 | | | $ | 1.22 | | | $ | 1.20 | | | $ | 18.40 | | | $ | 8.75 | | | $ | 0.280 | |
| | | |
| | | |
| | | |
| | | |
| | | |
| | | |
| | | |
| | | |
| | | |
| | | |
| |
| FISCAL 2002 | | | | | | | | | | | | | | | | | | | | | | | | | | | | | | | | | | | | | | | | |
| First Quarter | | $ | 30,972 | | | $ | 6,239 | | | $ | 3,294 | | | $ | 3,415 | | | $ | 2,209 | | | $ | 0.23 | | | $ | 0.23 | | | $ | 6.42 | | | $ | 6.04 | | | $ | 0.060 | |
| Second Quarter | | | 28,157 | | | | 5,299 | | | | 3,020 | | | | 3,157 | | | | 2,043 | | | | 0.22 | | | | 0.22 | | | | 9.09 | | | | 6.34 | | | | 0.065 | |
| Third Quarter | | | 28,780 | | | | 6,391 | | | | 3,762 | | | | 3,879 | | | | 2,510 | | | | 0.27 | | | | 0.27 | | | | 9.06 | | | | 7.23 | | | | 0.065 | |
| Fourth Quarter | | | 30,606 | | | | 5,922 | | | | 3,099 | | | | 3,114 | | | | 2,085 | | | | 0.23 | | | | 0.22 | | | | 11.75 | | | | 8.55 | | | | 0.065 | |
| | | |
| | | |
| | | |
| | | |
| | | |
| | | |
| | | |
| | | |
| | | |
| | | |
| |
| Total Year | | $ | 118,515 | | | $ | 23,851 | | | $ | 13,175 | | | $ | 13,565 | | | $ | 8,847 | | | $ | 0.95 | | | $ | 0.93 | | | $ | 11.75 | | | $ | 6.04 | | | $ | 0.255 | |
| | | |
| | | |
| | | |
| | | |
| | | |
| | | |
| | | |
| | | |
| | | |
| | | |
| |
| (a) | | Net income per share is computed discretely by quarter and may not add to the full year. |
| |
| (b) | | All per-share and market price data reflect the January 2003 two-for-one stock split and the July 2001 three-for-two stock split. |
page26 RAVEN2004 Annual Report
Consolidated Balance Sheets
| | | | | | | | | | | | | |
| | | As of January 31
|
| Dollars in thousands, except per-share data | | 2004
| | 2003
| | 2002
|
| | | | | | | | | | | | | |
ASSETS | | | | | | | | | | | | |
| Current assets | | | | | | | | | | | | |
| Cash and cash equivalents | | $ | 14,442 | | | $ | 5,217 | | | $ | 7,478 | |
| Short-term investments | | | 4,000 | | | | 4,000 | | | | — | |
| Accounts receivable, net | | | 18,454 | | | | 16,468 | | | | 16,427 | |
| Inventories, net | | | 16,763 | | | | 21,366 | | | | 19,082 | |
| Deferred income taxes | | | 1,313 | | | | 1,493 | | | | 1,927 | |
| Prepaid expenses and other current assets | | | 738 | | | | 807 | | | | 394 | |
| | | |
| | | |
| | | |
| |
| Total current assets | | | 55,710 | | | | 49,351 | | | | 45,308 | |
| Property, plant and equipment, net | | | 15,950 | | | | 16,455 | | | | 14,059 | |
| Goodwill | | | 6,776 | | | | 5,933 | | | | 5,863 | |
| Other assets, net | | | 1,072 | | | | 1,077 | | | | 2,606 | |
| | | |
| | | |
| | | |
| |
| Total assets | | $ | 79,508 | | | $ | 72,816 | | | $ | 67,836 | |
| | | |
| | | |
| | | |
| |
LIABILITIES AND SHAREHOLDERS’ EQUITY | | | | | | | | | | | | |
| Current liabilities | | | | | | | | | | | | |
| Current portion of long-term debt | | $ | 72 | | | $ | 119 | | | $ | 127 | |
| Accounts payable | | | 3,666 | | | | 5,291 | | | | 4,801 | |
| Accrued liabilities | | | 7,784 | | | | 7,157 | | | | 8,179 | |
| Customer advances | | | 373 | | | | 600 | | | | 703 | |
| | | |
| | | |
| | | |
| |
| Total current liabilities | | | 11,895 | | | | 13,167 | | | | 13,810 | |
| Long-term debt, less current portion | | | 57 | | | | 151 | | | | 280 | |
| Other liabilities, primarily compensation and benefits | | | 1,085 | | | | 1,262 | | | | 1,714 | |
| Commitments and contingencies | | | | | | | | | | | | |
| Shareholders’ equity | | | 66,471 | | | | 58,236 | | | | 52,032 | |
| Common shares, par value $1.00 per share | | | | | | | | | | | | |
| Authorized — 100,000,000 | | | | | | | | | | | | |
| Outstanding — 2004: 9,020,544; 2003: 9,066,362; | | | | | | | | | | | | |
| 2002: 9,211,138 (4,605,569 pre-split) | | | | | | | | | | | | |
| | | |
| | | |
| | | |
| |
| Total liabilities and shareholders’ equity | | $ | 79,508 | | | $ | 72,816 | | | $ | 67,836 | |
| | | |
| | | |
| | | |
| |
The accompanying notes are an integral part of the consolidated financial statements.
RAVEN2004 Annual Report page27
Consolidated Statements of Income
| | | | | | | | | | | | | |
| | | For the years ended
January 31
|
Dollars in thousands, except per-share data
| | 2004
| | 2003
| | 2002
|
| | | | | | | | | | | | | |
| Net sales | | $ | 142,727 | | | $ | 120,903 | | | $ | 118,515 | |
| Cost of goods sold | | | 108,968 | | | | 93,388 | | | | 94,664 | |
| | | |
| | | |
| | | |
| |
| Gross profit | | | 33,759 | | | | 27,515 | | | | 23,851 | |
| Selling, general and administrative expenses | | | 11,960 | | | | 10,629 | | | | 11,043 | |
| Loss (gain) on sales of businesses and assets, net | | | 173 | | | | (179 | ) | | | (367 | ) |
| | | |
| | | |
| | | |
| |
| Operating income | | | 21,626 | | | | 17,065 | | | | 13,175 | |
| Interest expense | | | 70 | | | | 63 | | | | 129 | |
| Other income, net | | | (160 | ) | | | (252 | ) | | | (519 | ) |
| | | |
| | | |
| | | |
| |
| Income before income taxes | | | 21,716 | | | | 17,254 | | | | 13,565 | |
| Income taxes | | | 7,880 | | | | 6,069 | | | | 4,718 | |
| | | |
| | | |
| | | |
| |
| Net income | | $ | 13,836 | | | $ | 11,185 | | | $ | 8,847 | |
| | | |
| | | |
| | | |
| |
| Net income per common share | | | | | | | | | | | | |
| — basic | | $ | 1.53 | | | $ | 1.22 | | | $ | 0.95 | |
| | | |
| | | |
| | | |
| |
| — diluted | | $ | 1.50 | | | $ | 1.20 | | | $ | 0.93 | |
| | | |
| | | |
| | | |
| |
The accompanying notes are an integral part of the consolidated financial statements.
page28 RAVEN 2004 Annual Report
Consolidated Statements of Shareholders’ Equity and Comprehensive Income
| | | | | | | | | | | | | | | | | | | | | | | | | |
| | | | | | | | | | | Treasury stock | | | | |
| | | Common | | Paid-in | |
| | Retained | | |
Dollars in thousands, except per-share data
| | Stock
| | Capital
| | Shares
| | Cost
| | Earnings
| | Total
|
| | | | | | | | | | | | | | | | | | | | | | | | | |
| Balance January 31, 2001 | | $ | 5,223 | | | $ | 3,459 | | | | (2,063,807 | ) | | $ | (28,941 | ) | | $ | 68,248 | | | $ | 47,989 | |
| Net and comprehensive income | | | — | | | | — | | | | — | | | | — | | | | 8,847 | | | | 8,847 | |
Cash dividends ($.255 per share)(a) | | | — | | | | — | | | | — | | | | — | | | | (2,371 | ) | | | (2,371 | ) |
| Three-for-two stock split | | | 2,612 | | | | (2,614 | ) | | | (1,031,903 | ) | | | — | | | | — | | | | (2 | ) |
| Purchase of stock | | | — | | | | — | | | | (173,309 | ) | | | (2,848 | ) | | | — | | | | (2,848 | ) |
| Purchase and retirement of stock | | | (70 | ) | | | (1,134 | ) | | | — | | | | — | | | | — | | | | (1,204 | ) |
| Employees’ stock options exercised | | | 110 | | | | 1,378 | | | | — | | | | — | | | | — | | | | 1,488 | |
| Tax benefit from exercise of stock options | | | — | | | | 133 | | | | — | | | | — | | | | — | | | | 133 | |
| | | |
| | | |
| | | |
| | | |
| | | |
| | | |
| |
| Balance January 31, 2002 | | | 7,875 | | | | 1,222 | | | | (3,269,019 | ) | | | (31,789 | ) | | | 74,724 | | | | 52,032 | |
| SFAS 123 adoption adjustment | | | — | | | | 478 | | | | — | | | | — | | | | — | | | | 478 | |
| Net and comprehensive income | | | — | | | | — | | | | — | | | | — | | | | 11,185 | | | | 11,185 | |
Cash dividends ($.280 per share)(a) | | | — | | | | — | | | | — | | | | — | | | | (2,563 | ) | | | (2,563 | ) |
| Two-for-one stock split | | | 7,875 | | | | (1,682 | ) | | | (3,269,019 | ) | | | — | | | | (6,193 | ) | | | — | |
| Purchase of stock | | | — | | | | — | | | | (251,230 | ) | | | (3,324 | ) | | | — | | | | (3,324 | ) |
| Purchase and retirement of stock | | | (70 | ) | | | (835 | ) | | | — | | | | — | | | | — | | | | (905 | ) |
| Employees’ stock options exercised | | | 176 | | | | 917 | | | | — | | | | — | | | | — | | | | 1,093 | |
| Stock compensation expense | | | — | | | | 174 | | | | — | | | | — | | | | — | | | | 174 | |
| Tax benefit from exercise of stock options | | | — | | | | 66 | | | | — | | | | — | | | | — | | | | 66 | |
| | | |
| | | |
| | | |
| | | |
| | | |
| | | |
| |
| Balance January 31, 2003 | | | 15,856 | | | | 340 | | | | (6,789,268 | ) | | | (35,113 | ) | | | 77,153 | | | | 58,236 | |
| Net and comprehensive income | | | — | | | | — | | | | — | | | | — | | | | 13,836 | | | | 13,836 | |
| Cash dividends ($.340 per share) | | | — | | | | — | | | | — | | | | — | | | | (3,075 | ) | | | (3,075 | ) |
| Purchase of stock | | | — | | | | — | | | | (144,175 | ) | | | (3,068 | ) | | | — | | | | (3,068 | ) |
| Purchase and retirement of stock | | | (39 | ) | | | (804 | ) | | | — | | | | — | | | | — | | | | (843 | ) |
| Employees’ stock options exercised | | | 137 | | | | 435 | | | | — | | | | — | | | | — | | | | 572 | |
| Stock compensation expense | | | — | | | | 282 | | | | — | | | | — | | | | — | | | | 282 | |
| Tax benefit from exercise of stock options | | | — | | | | 531 | | | | — | | | | — | | | | — | | | | 531 | |
| | | |
| | | |
| | | |
| | | |
| | | |
| | | |
| |
Balance January 31, 2004 | | $ | 15,954 | | | $ | 784 | | | | (6,933,443 | ) | | $ | (38,181 | ) | | $ | 87,914 | | | $ | 66,471 | |
| | | |
| | | |
| | | |
| | | |
| | | |
| | | |
| |
(a) Reflects the July 2001 three-for-two stock split and January 2003 two-for-one stock split.
The accompanying notes are an integral part of the consolidated financial statements.
RAVEN2004 Annual Report page 29
Consolidated Statements of Cash Flows
| | | | | | | | | | | | | |
| | | For the years ended
January 31
|
| Dollars in thousands | | 2004
| | 2003
| | 2002
|
| | | | | | | | | | | | | |
| Cash flows from operating activities | | | | | | | | | | | | |
| Net income | | $ | 13,836 | | | $ | 11,185 | | | $ | 8,847 | |
| Adjustments to reconcile net income to net cash provided by operating activities: | | | | | | | | | | | | |
| Depreciation | | | 3,674 | | | | 3,541 | | | | 2,975 | |
| Amortization | | | 471 | | | | 425 | | | | 170 | |
| Acquired in-process research and development charge | | | — | | | | — | | | | 550 | |
| Provision for losses on accounts receivable, net of recoveries | | | 67 | | | | (100 | ) | | | 126 | |
| (Gain) loss on sales of businesses and assets | | | 173 | | | | (179 | ) | | | (367 | ) |
| Deferred income taxes | | | 254 | | | | 1,157 | | | | 586 | |
| Stock compensation expense | | | 282 | | | | 174 | | | | 76 | |
| Change in operating assets and liabilities, net of effects from the acquisition and sale of businesses | | | 850 | | | | (3,470 | ) | | | 5,453 | |
| Other operating activities, net | | | 125 | | | | 2 | | | | 80 | |
| | | |
| | | |
| | | |
| |
| Net cash provided by operating activities | | | 19,732 | | | | 12,735 | | | | 18,496 | |
| | | |
| | | |
| | | |
| |
| Cash flows from investing activities | | | | | | | | | | | | |
| Capital expenditures | | | (3,330 | ) | | | (6,033 | ) | | | (5,094 | ) |
| Purchase of short-term investments | | | (4,000 | ) | | | (5,000 | ) | | | — | |
| Sale of short-term investments | | | 4,000 | | | | 1,000 | | | | — | |
| Acquisition of businesses | | | (1,038 | ) | | | (57 | ) | | | (8,735 | ) |
| Sales of businesses and assets, net of cash sold | | | 257 | | | | 927 | | | | 677 | |
| Other investing activities, net | | | (241 | ) | | | (3 | ) | | | — | |
| | | |
| | | |
| | | |
| |
| Net cash used in investing activities | | | (4,352 | ) | | | (9,166 | ) | | | (13,152 | ) |
| | | |
| | | |
| | | |
| |
| Cash flows from financing activities | | | | | | | | | | | | |
| Proceeds from borrowing under line of credit | | | — | | | | 1,025 | | | | 1,470 | |
| Repayment on borrowing under line of credit | | | — | | | | (1,025 | ) | | | (1,470 | ) |
| Long-term debt principal payments | | | (141 | ) | | | (131 | ) | | | (3,602 | ) |
| Net proceeds from exercise of stock options | | | 129 | | | | 188 | | | | 284 | |
| Dividends paid | | | (3,075 | ) | | | (2,563 | ) | | | (2,371 | ) |
| Purchase of treasury stock | | | (3,068 | ) | | | (3,324 | ) | | | (2,848 | ) |
| Other financing activities, net | | | — | | | | — | | | | (2 | ) |
| | | |
| | | |
| | | |
| |
| Net cash used in financing activities | | | (6,155 | ) | | | (5,830 | ) | | | (8,539 | ) |
| | | |
| | | |
| | | |
| |
| Net increase (decrease) in cash and cash equivalents | | | 9,225 | | | | (2,261 | ) | | | (3,195 | ) |
| Cash and cash equivalents at beginning of year | | | 5,217 | | | | 7,478 | | | | 10,673 | |
| | | |
| | | |
| | | |
| |
| Cash and cash equivalents at end of year | | $ | 14,442 | | | $ | 5,217 | | | $ | 7,478 | |
| | | |
| | | |
| | | |
| |
The accompanying notes are an integral part of the consolidated financial statements.
page30 RAVEN2004 Annual Report
Notes to Financial Statements
Note 1. Summary of Significant Accounting Policies
BASIS OF PRESENTATION AND PRINCIPLES OF CONSOLIDATION
The consolidated financial statements include the accounts of Raven Industries, Inc. and its wholly owned subsidiaries (the “company”). The company is an industrial manufacturer providing a variety of products to customers within the industrial, agricultural, construction and military/aerospace markets primarily in North America. The company operates three divisions (Flow Controls, Engineered Films and Electronic Systems) in addition to a wholly owned subsidiary, Aerostar International, Inc. (Aerostar). All significant intercompany balances and transactions have been eliminated in consolidation.
USE OF ESTIMATES
The preparation of the company’s financial statements in conformity with accounting principles generally accepted in the United States of America requires management to make certain estimates and assumptions that affect the reported amounts of assets and liabilities as of the date of the financial statements and the reported amounts of revenues and expenses during the reporting periods. Actual results could differ from these estimates.
CASH AND CASH EQUIVALENTS
The company considers all highly liquid debt instruments with original maturities of three months or less to be cash equivalents. Cash and cash equivalent balances are principally concentrated in checking and savings accounts with Wells Fargo Bank N.A.
SHORT-TERM INVESTMENTS
The investments consist of fully insured certificates of deposit with varying maturities, all less than 12 months from the balance sheet date. Rates on the deposits at January 31, 2004, range from 1.3% to 1.6%.
INVENTORY VALUATION
Inventories are stated at the lower of cost or market, with cost determined on the first-in, first-out basis. Market value encompasses consideration of all business factors including price, contract terms and usefulness.
PROPERTY, PLANT AND EQUIPMENT
Property, plant and equipment are stated at cost and are depreciated over the estimated useful lives of the assets using accelerated methods. The estimated useful lives used for computing depreciation are as follows:
| | | | | |
| Buildings and improvements | | | 7 to 39 years | |
| Machinery and equipment | | | 3 to 7 years | |
Maintenance and repairs are charged to expense in the year incurred and renewals and betterments are capitalized. The cost and related accumulated depreciation of assets sold or disposed of are removed from the accounts and the resulting gain or loss is reflected in operations.
INTANGIBLE ASSETS
Intangible assets, primarily comprised of technologies acquired through acquisition, are recorded at cost net of accumulated amortization. Amortization is computed on a straight-line basis over estimated useful lives ranging from 3 to 20 years. The straight-line method of amortization reflects an appropriate allocation of the cost of the intangible assets to earnings in each reporting period.
GOODWILL
Goodwill related to acquisitions completed prior to June 30, 2001, was previously amortized over lives ranging from 15 to 20 years. As required by Statement of Financial Accounting Standards (SFAS) No. 142, “Goodwill and Other Intangible Assets,” amortization ceased on February 1, 2002, and no goodwill resulting from acquisitions after June 30, 2001, has been amortized. Goodwill is instead evaluated in terms of its fair value at least annually and any impairment recognized at that time.
LONG-LIVED ASSETS
The company periodically assesses the recoverability of long-lived and intangible assets using fair value measurement techniques, where fair value is calculated based upon anticipated future earnings and undiscounted operating cash flows. If the fair value is less than the carrying amount of the asset, an impairment loss is recognized to the extent the carrying value exceeds the fair value of the asset.
RAVEN2004 Annual Report page31
Notes to Financial Statements (continued)
INSURANCE OBLIGATIONS
The company employs deductible insurance policies covering worker’s compensation and general liability costs. Costs are accrued related to the risk retained under these policies based on claims filed and estimates for claims incurred but not reported. In addition, accruals are maintained to cover the company’s partial self-insurance status for worker’s compensation prior to February 1, 2001.
CONTINGENCIES
The company is involved as a defendant in lawsuits, claims or disputes arising in the normal course of business. An estimate of the loss on these matters is charged to operations when it is probable that an asset has been impaired or a liability has been incurred, and the amount of the loss can be reasonably estimated. The settlement of such claims cannot be determined at this time; however, management believes that any liability resulting from these claims will be substantially mitigated by insurance coverage. Accordingly, management does not believe that the ultimate outcome of these matters will be significant to its results of operations, financial position or cash flows.
REVENUE RECOGNITION
The company recognizes revenue and records revenues upon shipment of products. The company sells directly to customers or distributors who incur the expense and commitment for any post-sale obligations beyond stated warranty terms. Any returns, allowances or warranty charges are recognized after shipment of a product. The company does not typically require collateral from its customers. Shipping and handling costs are classified as a cost of goods sold component.
RESEARCH AND DEVELOPMENT
Research and development expenditures of $1.7 million in fiscal 2004, $1.3 million in fiscal 2003, and $1.4 million in fiscal 2002 were charged to cost of goods sold in the year incurred. Expenditures are principally composed of labor and material costs. Fiscal 2002 expenditures include the $550,000 acquired research and development charge related to the acquisition of Starlink.
STOCK-BASED COMPENSATION
In fiscal 2003, the company began recording compensation expense related to its stock-based compensation plan using the fair value method permitted by SFAS No. 123, “Accounting for Stock-Based Compensation” under the modified prospective method outlined by SFAS No. 148, “Accounting for Stock-Based Compensation-Transition and Disclosure.” Fiscal 2002’s compensation expense was measured under the intrinsic value method.
INCOME TAXES
Income tax expense is the tax payable for the period and the change during the period in deferred tax assets and liabilities and reserves. Judgmental reserves are maintained for income tax audits and other tax issues. Deferred income taxes reflect temporary differences between assets and liabilities reported on the company’s balance sheet and their tax bases. These differences are measured using enacted tax laws and statutory tax rates applicable to the periods when the temporary differences will impact taxable income. Deferred tax assets are reduced by a valuation allowance to reflect realizable value, when necessary.
STOCK SPLITS
The company completed a two-for-one stock split effected in the form of a 100% stock dividend on January 15, 2003. Previously, the company completed a three-for-two stock split effected in the form of a 50% stock dividend on July 13, 2001. All per-share information reflects the effect of these stock splits.
NEW ACCOUNTING STANDARDS
The Financial Accounting Standards Board has released several Staff Positions, Interpretations and revised Standards in the latter portion of fiscal 2004. The company has reviewed the issues covered by these pronouncements, and has determined their impacts to be minimal, and in most cases, not applicable to the company.
page32 RAVEN2004 Annual Report
Note 2. Selected Balance Sheet Information
Following are the components of selected balance sheet items:
| | | | | | | | | | | | | |
| | | As of January 31
|
Dollars in thousands
| | 2004
| | 2003
| | 2002
|
| | | | | | | | | | | | | |
| Accounts receivable, net: | | | | | | | | | | | | |
| Trade accounts | | $ | 18,719 | | | $ | 16,708 | | | $ | 16,737 | |
| Allowance for doubtful accounts | | | (265 | ) | | | (240 | ) | | | (310 | ) |
| | | |
| | | |
| | | |
| |
| | | $ | 18,454 | | | $ | 16,468 | | | $ | 16,427 | |
| | | |
| | | |
| | | |
| |
| Inventories, net: | | | | | | | | | | | | |
| Finished goods | | $ | 2,500 | | | $ | 5,290 | | | $ | 4,509 | |
| In process | | | 2,120 | | | | 2,275 | | | | 1,732 | |
| Materials | | | 12,143 | | | | 13,801 | | | | 12,841 | |
| | | |
| | | |
| | | |
| |
| | | $ | 16,763 | | | $ | 21,366 | | | $ | 19,082 | |
| | | |
| | | |
| | | |
| |
| Property, plant and equipment, net: | | | | | | | | | | | | |
| Land | | $ | 1,110 | | | $ | 1,091 | | | $ | 1,091 | |
| Building and improvements | | | 13,049 | | | | 12,154 | | | | 10,614 | |
| Machinery and equipment | | | 32,479 | | | | 32,248 | | | | 29,219 | |
| Accumulated depreciation | | | (30,688 | ) | | | (29,038 | ) | | | (26,865 | ) |
| | | |
| | | |
| | | |
| |
| | | $ | 15,950 | | | $ | 16,455 | | | $ | 14,059 | |
| | | |
| | | |
| | | |
| |
| Other assets, net: | | | | | | | | | | | | |
| Amortizable assets: | | | | | | | | | | | | |
| Purchased technology | | $ | 1,250 | | | $ | 1,080 | | | $ | 1,080 | |
| Other intangibles | | | 1,136 | | | | 884 | | | | 1,116 | |
| Accumulated amortization | | | (1,494 | ) | | | (1,027 | ) | | | (705 | ) |
| | | |
| | | |
| | | |
| |
| | | | 892 | | | | 937 | | | | 1,491 | |
| Deferred income taxes | | | — | | | | 6 | | | | 696 | |
| Deposits | | | 96 | | | | 96 | | | | 112 | |
| Other, net | | | 84 | | | | 38 | | | | 307 | |
| | | |
| | | |
| | | |
| |
| | | $ | 1,072 | | | $ | 1,077 | | | $ | 2,606 | |
| | | |
| | | |
| | | |
| |
| Accrued liabilities: | | | | | | | | | | | | |
| Salaries and benefits | | $ | 1,875 | | | $ | 1,766 | | | $ | 2,109 | |
| Vacation | | | 1,638 | | | | 1,627 | | | | 1,731 | |
| 401(k) contributions | | | 906 | | | | 782 | | | | 825 | |
| Self-insurance obligations | | | 524 | | | | 1,045 | | | | 1,627 | |
| Income taxes | | | 267 | | | | 276 | | | | 144 | |
| Profit sharing | | | 544 | | | | 406 | | | | 284 | |
| Deferred acquisition payments | | | 389 | | | | — | | | | — | |
| Other | | | 1,641 | | | | 1,255 | | | | 1,459 | |
| | | |
| | | |
| | | |
| |
| | | $ | 7,784 | | | $ | 7,157 | | | $ | 8,179 | |
| | | |
| | | |
| | | |
| |
Note 3. Supplemental Cash Flow Information
| | | | | | | | | | | | | |
| | | For the years ended January 31
|
Dollars in thousands
| | 2004
| | 2003
| | 2002
|
| | | | | | | | | | | | | |
| Changes in operating assets and liabilities, net of effects from the purchase and sale of businesses: | | | | | | | | | | | | |
| Accounts receivable | | $ | (2,072 | ) | | $ | (304 | ) | | $ | 4,510 | |
| Inventories | | | 4,603 | | | | (2,671 | ) | | | 1,506 | |
| Prepaid expenses and other assets | | | (16 | ) | | | 15 | | | | 386 | |
| Accounts payable | | | (1,625 | ) | | | 560 | | | | 681 | |
| Accrued and other liabilities | | | 187 | | | | (1,153 | ) | | | (1,299 | ) |
| Customer advances | | | (227 | ) | | | 83 | | | | (331 | ) |
| | | |
| | | |
| | | |
| |
| | | $ | 850 | | | $ | (3,470 | ) | | $ | 5,453 | |
| | | |
| | | |
| | | |
| |
| Cash paid during the year for: | | | | | | | | | | | | |
| Interest | | $ | 50 | | | $ | 44 | | | $ | 149 | |
| Income taxes | | | 7,014 | | | | 4,852 | | | | 3,923 | |
Note 4. Acquisitions
On December 19, 2003, the company acquired substantially all of the assets of Fluent Systems, LLC for $1.0 million in cash and a payment deferred until December 2004, which was valued at $60,000. This start-up company has developed a wireless liquid level monitoring system used with anhydrous ammonia tanks. Of the purchase price, $79,000 was assigned to property, plant and equipment, $195,000 was assigned to intangible assets, $19,000 to current liabilities assumed and $843,000 to goodwill, which is fully deductible for tax purposes. The operation was assigned to the Flow Controls segment.
The company acquired the operating assets and assumed certain liabilities of Starlink, Incorporated and System Integrators, Inc. on December 5, 2001. Starlink provides GPS-based guidance systems for the agriculture and marine markets. The purchase price of Starlink was $7.9 million, including $7.5 million of cash and a $287,000 payment deferred until December 2004. System Integrators is an electronics manufacturing services (EMS) provider and has been combined into the company’s Electronic Systems Division. The adjusted purchase price was $1.2 million including a $61,000 deferred payment due December 2004.
RAVEN2004 Annual Report page33
Notes to Financial Statements (continued)
The results of operations for acquired businesses have been included in the consolidated financial statements since the date of acquisition. Pro forma earnings are not presented due to the immateriality of the acquisitions to the consolidated operations.
Note 5. Divestitures and Other Repositioning Activities
Fiscal 2004 divestiture activities were limited to the sale by the company’s Aerostar subsidiary of a sewing plant closed in fiscal 2003. The sale of that plant and its related equipment resulted in cash proceeds of $196,000 and a pretax gain of $182,000. This gain was offset by a $355,000 loss from increased liabilities for environmental or legal issues related to previously sold operations, as estimated by the company and its advisors. At January 31, 2004, the company had an undiscounted accrual remaining of $228,000 for environmental monitoring and clean-up costs.
During fiscal 2003, the former Beta Raven Industrial Controls Division was sold. A pretax gain of $104,000 and $577,000 of cash proceeds were realized on the completion of the disposal of that subsidiary. An Aerostar sewing plant was closed during the third quarter as well. The remainder of the pretax net gain of $179,000 related to the collection of a previously discounted note receivable, net of increased anticipated costs from ongoing liabilities from previously sold businesses.
In fiscal 2002, the company recorded a net pretax gain of $367,000 related to the sale of its former Sportswear Division warehouse and the closure of its remaining Plastic Tank Division operations in Tacoma, Washington. The company also incurred $249,000 of pretax charges to reposition the Industrial Controls Division of Beta Raven, including the closing of its Alabama plant. This charge was included in cost of goods sold in the Sold Businesses segment.
Note 6. Goodwill and Other Intangibles
Goodwill and other intangibles are accounted for under SFAS No. 142 as adopted February 1, 2002 (first day of fiscal 2003) for all previously acquired or internally developed intangibles and goodwill, and as of June 30, 2001 for any acquisitions completed after that date. Under the Statement, amortization of goodwill and any indefinite-lived intangibles ceased, and are instead tested at least annually, on a fair value basis, for impairment.
Excluding goodwill amortization expense and related taxes, net income and net income per share would have been as follows:
| | | | | | | | | | | | | |
| | | For the years ended January 31
|
Dollars in thousands except per-share amounts
| | 2004
| | 2003
| | 2002
|
| | | | | | | | | | | | | |
| Net Income: | | | | | | | | | | | | |
| As reported | | $ | 13,836 | | | $ | 11,185 | | | $ | 8,847 | |
| Goodwill amortization, net of taxes | | | — | | | | — | | | | 61 | |
| | | |
| | | |
| | | |
| |
| As adjusted | | $ | 13,836 | | | $ | 11,185 | | | $ | 8,908 | |
| | | |
| | | |
| | | |
| |
| Basic net income per-share: | | | | | | | | | | | | |
| As reported | | $ | 1.53 | | | $ | 1.22 | | | $ | 0.95 | |
| Goodwill amortization, net of taxes | | | — | | | | — | | | | 0.01 | |
| | | |
| | | |
| | | |
| |
| As adjusted | | $ | 1.53 | | | $ | 1.22 | | | $ | 0.96 | |
| | | |
| | | |
| | | |
| |
| Diluted net income per-share: | | | | | | | | | | | | |
| As reported | | $ | 1.50 | | | $ | 1.20 | | | $ | 0.93 | |
| Goodwill amortization, net of taxes | | | — | | | | — | | | | 0.01 | |
| | | |
| | | |
| | | |
| |
| As adjusted | | $ | 1.50 | | | $ | 1.20 | | | $ | 0.94 | |
| | | |
| | | |
| | | |
| |
The changes in the carrying amount of goodwill by reporting segment are shown below:
| | | | | | | | | | | | | | | | | |
| | | Flow | | Engineered | | Electronic | | |
Dollars in thousands
| | Controls
| | Films
| | Systems
| | Total
|
| | | | | | | | | | | | | | | | | |
| Balance at January 31, 2001 | | $ | — | | | $ | 642 | | | $ | — | | | $ | 642 | |
| Goodwill acquired during year | | | 4,947 | | | | — | | | | 356 | | | | 5,303 | |
| Amortization | | | — | | | | (82 | ) | | | — | | | | (82 | ) |
| | | |
| | | |
| | | |
| | | |
| |
| Balance at January 31, 2002 | | | 4,947 | | | | 560 | | | | 356 | | | | 5,863 | |
| Purchase price adjustments | | | (7 | ) | | | — | | | | 77 | | | | 70 | |
| | | |
| | | |
| | | |
| | | |
| |
| Balance at January 31, 2003 | | | 4,940 | | | | 560 | | | | 433 | | | | 5,933 | |
| Goodwill acquired during year | | | 843 | | | | — | | | | — | | | | 843 | |
| | | |
| | | |
| | | |
| | | |
| |
| Balance at January 31, 2004 | | $ | 5,783 | | | $ | 560 | | | $ | 433 | | | $ | 6,776 | |
| | | |
| | | |
| | | |
| | | |
| |
Estimated future amortization expense based on the current carrying value of amortizable intangible assets for fiscal periods 2005 through 2009 is $445,000, $145,000, $128,000, $73,000, and $34,000, respectively.
page34 RAVEN2004 Annual Report
Note 7. Employee Retirement Benefits
The company has a 401(k) plan covering substantially all employees and contributed 3% of qualified payroll. The company’s contribution expense was $817,000, $715,000 and $727,000 for fiscal 2004, 2003 and 2002, respectively.
In addition, the company provides postretirement medical and other benefits to senior executive officers and senior managers. The company accounts for these benefits in accordance with SFAS No. 106, “Accounting for Postretirement Benefits Other Than Pensions.” There are no assets held for the plans and any obligations are covered through the company’s operating cash and investments. The liability and expense reflected in the balance sheet and income statement are as follows:
| | | | | | | | | | | | | |
| | | For the years ended
January 31
|
Dollars in thousands
| | 2004
| | 2003
| | 2002
|
| | | | | | | | | | | | | |
| Beginning balance | | $ | 1,102 | | | $ | 969 | | | $ | 654 | |
| Employer expense | | | 316 | | | | 306 | | | | 482 | |
| Retiree benefits paid | | | (206 | ) | | | (173 | ) | | | (167 | ) |
| | | |
| | | |
| | | |
| |
| Ending balance | | | 1,212 | | | | 1,102 | | | | 969 | |
| Current portion | | | (200 | ) | | | (150 | ) | | | (150 | ) |
| | | |
| | | |
| | | |
| |
| Long-term portion | | $ | 1,012 | | | $ | 952 | | | $ | 819 | |
| | | |
| | | |
| | | |
| |
| Discount rate | | | 7.0 | % | | | 8.0 | % | | | 8.0 | % |
| Wage inflation rate | | | 4.0 | % | | | 4.0 | % | | | 4.0 | % |
| Medical inflation rate | | | 7.0 | % | | | 7.0 | % | | | 6.0 | % |
The accumulated benefit obligation based upon the rates noted in the table above was approximately $2.4 million, $2.2 million and $2.3 million at January 31, 2004, 2003 and 2002, respectively. No material fluctuations in retiree benefits are expected in future years.
Note 8. Warranties
Accruals necessary for product warranties are estimated based upon historical warranty costs and average time elapsed between purchase and returns for each division. Any warranty issues that are unusual in nature are accrued individually. Changes in the warranty reserve were as follows:
| | | | | | | | | | | | | |
| | | For the years ended
January 31
|
Dollars in thousands
| | 2004
| | 2003
| | 2002
|
| | | | | | | | | | | | | |
| Beginning balance | | $ | 156 | | | $ | 248 | | | $ | 199 | |
| Accrual for warranties | | | 863 | | | | 584 | | | | 525 | |
| Settlements made (in cash or in kind) | | | (756 | ) | | | (576 | ) | | | (476 | ) |
| Sale of businesses | | | — | | | | (100 | ) | | | — | |
| | | |
| | | |
| | | |
| |
| Ending balance | | $ | 263 | | | $ | 156 | | | $ | 248 | |
| | | |
| | | |
| | | |
| |
Note 9. Income Taxes
The reconciliation of income tax computed at the federal statutory rate to the company’s effective income tax rate is as follows:
| | | | | | | | | | | | | |
| | | For the years ended |
| | | January 31
|
| | | 2004
| | 2003
| | 2002
|
| Tax at U.S. federal statutory rate | | | 35.0 | % | | | 35.0 | % | | | 35.0 | % |
| State and local income taxes, net of U.S. federal benefit | | | 0.9 | | | | 0.4 | | | | 0.2 | |
| Nondeductible stock option expense | | | 0.3 | | | | 0.3 | | | | — | |
| Impact of graduated rates | | | — | | | | (0.6 | ) | | | (0.7 | ) |
| Other, net | | | 0.1 | | | | 0.1 | | | | 0.3 | |
| | | |
| | | |
| | | |
| |
| | | | 36.3 | % | | | 35.2 | % | | | 34.8 | % |
| | | |
| | | |
| | | |
| |
Significant components of the company’s income tax provision are as follows:
| | | | | | | | | | | | | |
| | | For the years ended |
| | | January 31
|
Dollars in thousands
| | 2004
| | 2003
| | 2002
|
| | | | | | | | | | | | | |
| Income taxes: | | | | | | | | | | | | |
| Currently payable | | $ | 7,626 | | | $ | 4,912 | | | $ | 4,132 | |
| Deferred | | | 254 | | | | 1,157 | | | | 586 | |
| | | |
| | | |
| | | |
| |
| | | $ | 7,880 | | | $ | 6,069 | | | $ | 4,718 | |
| | | |
| | | |
| | | |
| |
Significant components of the company’s deferred tax assets and liabilities are as follows:
| | | | | | | | | | | | | |
| | | As of January 31
|
Dollars in thousands
| | 2004
| | 2003
| | 2002
|
| | | | | | | | | | | | | |
| Current deferred tax assets: | | | | | | | | | | | | |
| Accounts receivable | | $ | 93 | | | $ | 84 | | | $ | 109 | |
| Inventory valuation | | | 182 | | | | 194 | | | | 271 | |
| Accrued vacation | | | 532 | | | | 508 | | | | 525 | |
| Insurance obligations | | | 183 | | | | 369 | | | | 549 | |
| Other accrued liabilities | | | 323 | | | | 338 | | | | 473 | |
| | | |
| | | |
| | | |
| |
| | | | 1,313 | | | | 1,493 | | | | 1,927 | |
| | | |
| | | |
| | | |
| |
| Non-current deferred tax assets (liabilities): | | | | | | | | | | | | |
| Accrued compensation and benefits | | | 354 | | | | 333 | | | | 417 | |
| Depreciation and amortization | | | (502 | ) | | | (380 | ) | | | 244 | |
| Other | | | 75 | | | | 53 | | | | 35 | |
| | | |
| | | |
| | | |
| |
| | | | (73 | ) | | | 6 | | | | 696 | |
| | | |
| | | |
| | | |
| |
| Net deferred tax asset | | $ | 1,240 | | | $ | 1,499 | | | $ | 2,623 | |
| | | |
| | | |
| | | |
| |
RAVEN2004 Annual Report page35
Notes to Financial Statements (continued)
Note 10. Financing Arrangements
Raven has an uncollateralized credit agreement providing a line of credit of $7.0 million which expires in July 2004. Letters of credit totaling $1.7 million have been issued under the line, primarily to support self-insured worker’s compensation bonding requirements. No borrowings were outstanding as of January 31, 2004, 2003 or 2002, and $5.3 million was available at January 31, 2004. The credit agreement contains certain restrictive covenants that, among other things, require maintenance of certain levels of net worth and working capital. Borrowings on the credit line bore interest as of January 31, 2004, 2003 and 2002, at 4.00%, 4.25% and 4.75%, respectively. The weighted-average interest rates for borrowing under the short-term credit lines in fiscal 2003 and 2002 were 4.6% and 6.3%. There were no borrowings under the credit line in fiscal 2004.
Wells Fargo Bank N.A. provides the company’s line of credit. One member of the company’s board of directors is also on the board of directors of Wells Fargo & Co., the parent company of Wells Fargo Bank N.A.
In connection with its fiscal 2002 acquisitions, the company assumed $412,000 of capital lease obligations. The capital lease obligations expire through 2006, with annual payments of $72,000 and $57,000 due in fiscal 2005 and 2006. The company believes the fair value of its long-term debt approximates its carrying value based on quoted market prices for similar debt.
The company leases certain transportation, equipment and facilities under operating leases. Total rent and lease expense was $355,000, $446,000 and $575,000 in fiscal 2004, 2003 and 2002, respectively. Future minimum lease payments under non-cancelable operating leases for fiscal periods 2005 to 2008 are $220,000, $177,000, $154,000, and $137,000 with all leases scheduled to expire by fiscal 2008.
Note 11. Stock Options
Senior officers and key employees of the company have been granted options to purchase stock under the company’s 2000 Stock Option and Compensation Plan (“Plan”). The Plan, administered by the board of directors, allows for a fixed cash bonus when options are exercised and may grant either incentive or non-qualified options with terms not to exceed ten years. There are 364,400 shares of the Company’s common stock reserved for issue under the plan at January 31, 2004. Options are granted with exercise prices not less than market value at the date of grant. These stock options vest over a four-year period and expire after five years. Options granted after fiscal 1999 do not include a fixed cash bonus.
Prior to fiscal year 2003, the company accounted for the Plan under the recognition and measurement provisions of APB Opinion No. 25, “Accounting for Stock Issued to Employees,” which utilized the intrinsic value method to recognize compensation expense. Compensation expense related to the Plan’s cash bonus feature was $76,000 in fiscal 2002. Effective February 1, 2002, the company adopted the fair value recognition provisions of SFAS No. 123 “Accounting for Stock-Based Compensation.” Under the modified prospective method of adoption selected by the company pursuant to the provisions of SFAS No. 148, “Accounting for Stock-Based Compensation-Transition and Disclosure,” compensation cost recognized in fiscal year 2003 is the same as that which would have been recognized had the recognition provisions of SFAS No. 123 been applied from its original effective date. Results for the prior years have not been restated. The following table illustrates the effect on net income and net income per share if the fair value based method had been applied to all outstanding and unvested awards in each period.
page36 RAVEN2004 Annual Report
| | | | | | | | | | | | | |
| | | For the years ended January 31 |
| | |
|
Dollars in thousands,
except per-share amounts | | 2004
| | 2003
| | 2002
|
| Net income | | $ | 13,836 | | | $ | 11,185 | | | $ | 8,847 | |
| Add: Stock-based employee compensation expense included in reported net income, net of related tax effects | | | — | | | | — | | | | 50 | |
| Deduct: Total stock-based employee compensation expense determined under fair value based method for all awards, net of related tax effects | | | — | | | | — | | | | (95 | ) |
| | | |
| | | |
| | | |
| |
| Pro forma net income | | $ | 13,836 | | | $ | 11,185 | | | $ | 8,802 | |
| | | |
| | | |
| | | |
| |
| Net income per share: | | | | | | | | | | | | |
| Basic — as reported | | $ | 1.53 | | | $ | 1.22 | | | $ | 0.95 | |
| | | |
| | | |
| | | |
| |
| Basic — pro forma | | $ | 1.53 | | | $ | 1.22 | | | $ | 0.95 | |
| | | |
| | | |
| | | |
| |
| Diluted — as reported | | $ | 1.50 | | | $ | 1.20 | | | $ | 0.93 | |
| | | |
| | | |
| | | |
| |
| Diluted — pro forma | | $ | 1.50 | | | $ | 1.20 | | | $ | 0.93 | |
| | | |
| | | |
| | | |
| |
The fair value of each option grant is estimated on the date of grant using the Black-Scholes option pricing model with the following assumptions: dividend yield of 1.3-4.8%; expected volatility of 26-36%; risk-free interest rate of 3.0-6.2%; and expected lives of 4.5 years. The weighted average grant date fair value of each option granted was $8.22, $3.77 and $2.17 in fiscal 2004, 2003 and 2002, respectively. Compensation expense is recognized ratably over the four-year vesting period. Expense for fiscal years 2004 and 2003 was $282,000 and $174,000, respectively.
Information regarding option activity follows:
| | | | | | | | | | | | | | | | | | | | | | | | | |
| | | For the years ended January 31
|
| | | 2004
| | 2003
| | 2002
|
| | | | | | | weighted | | | | | | weighted | | | | | | weighted |
| | | | | | | average | | | | | | average | | | | | | average |
| | | | | | | exercise | | | | | | exercise | | | | | | exercise |
| | | options
| | price
| | options
| | price
| | options
| | price
|
| Outstanding at beginning of year | | | 436,056 | | | $ | 7.43 | | | | 551,304 | | | $ | 6.09 | | | | 701,250 | | | $ | 5.98 | |
| Granted | | | 64,500 | | | | 27.00 | | | | 76,400 | | | | 14.00 | | | | 88,400 | | | | 8.75 | |
| Exercised | | | (137,218 | ) | | | 5.21 | | | | (176,946 | ) | | | 6.18 | | | | (219,672 | ) | | | 6.77 | |
| Forfeited | | | (1,500 | ) | | | 5.29 | | | | (14,702 | ) | | | 6.27 | | | | (18,674 | ) | | | 6.23 | |
| | | |
| | | |
| | | |
| | | |
| | | |
| | | |
| |
| Outstanding at end of year | | | 361,838 | | | $ | 11.77 | | | | 436,056 | | | $ | 7.43 | | | | 551,304 | | | $ | 6.09 | |
| | | |
| | | |
| | | |
| | | |
| | | |
| | | |
| |
| Options exercisable at year-end | | | 163,304 | | | $ | 7.13 | | | | 207,073 | | | $ | 5.55 | | | | 282,322 | | | $ | 5.83 | |
The following table contains information about stock options outstanding at January 31, 2004:
| | | | | | | | | | | | | | | | | |
| | | | | | | Remaining | | | | |
| | | Exercise | | Contractual | | Number | | Number |
| | | Price
| | Life (Years)
| | Outstanding
| | Exercisable
|
| | | $ | 4.75 | | | | 0.75 | | | | 28,050 | | | | 28,050 | |
| | | | 5.33 | | | | 1.75 | | | | 108,838 | | | | 74,129 | |
| | | | 8.75 | | | | 2.75 | | | | 84,050 | | | | 42,025 | |
| | | | 14.00 | | | | 3.75 | | | | 76,400 | | | | 19,100 | |
| | | | 27.00 | | | | 4.75 | | | | 64,500 | | | | — | |
| | | | | | | | | | | |
| | | |
| |
| | | | | | | | | | | | 361,838 | | | | 163,304 | |
| | | | | | | | | | | |
| | | |
| |
Note 12. Net Income Per Share
Basic net income per share is computed by dividing net income by the weighted-average common shares outstanding. Common shares outstanding represent common shares issued less shares purchased and held in treasury. Share and per-share data in the net income per-share computation have been restated to reflect the January 15, 2003 two-for-one stock split and the July 13, 2001 three-for-two stock split. Diluted net income per-share is computed by dividing net income by the weighted-average common and common equivalent shares outstanding, which includes the shares issuable upon exercise of employee stock options, net of shares assumed purchased with the option proceeds. Certain outstanding options were excluded from the diluted net income per-share calculations because their exercise prices were greater than the average market price of the company’s common stock during those periods. For fiscal 2004, 2003 and 2002, 16,125, 19,100 and 22,100 options, respectively, were excluded from the diluted net income per-share calculation. Details of the computation are presented below.
| | | | | | | | | | | | | |
| | | For the years ended January 31 |
| | |
|
Dollars in thousands,
except per-share amounts | | 2004
| | 2003
| | 2002
|
| Net income | | $ | 13,836 | | | $ | 11,185 | | | $ | 8,847 | |
| | | |
| | | |
| | | |
| |
| Weighted-average common shares outstanding | | | 9,040,856 | | | | 9,151,465 | | | | 9,310,590 | |
| Dilutive impact of stock options | | | 203,934 | | | | 196,360 | | | | 181,004 | |
| | | |
| | | |
| | | |
| |
| Weighted-average common and common-equivalent shares outstanding | | | 9,244,790 | | | | 9,347,825 | | | | 9,491,594 | |
| | | |
| | | |
| | | |
| |
| Net income per common share: | | | | | | | | | | | | |
| — basic | | $ | 1.53 | | | $ | 1.22 | | | $ | 0.95 | |
| | | |
| | | |
| | | |
| |
| — diluted | | $ | 1.50 | | | $ | 1.20 | | | $ | 0.93 | |
| | | |
| | | |
| | | |
| |
RAVEN2004 Annual Report page37
Notes to Financial Statements (continued)
Note 13. Business Segments and Major Customer Information
The company’s reportable segments are defined by their common technologies, production processes and inventories. These segments reflect the organization of the company into three Raven divisions, each with a Divisional Vice President, and one subsidiary. In the second quarter of fiscal 2002, the electronics manufacturing services operation of Beta Raven was combined with the Electronic Systems segment. The Industrial Controls Division of Beta Raven, sold in fiscal 2003, is included under the caption “Sold Businesses.”
The company measures the performance of its segments based on their operating income exclusive of administrative and general expenses. The accounting policies of the operating segment are the same as those described in Note 1, Summary of Significant Accounting Policies. Other income, interest expense and income taxes are not allocated to individual operating segments, and assets not identifiable to an individual segment are included as corporate assets. Segment information is reported consistent with the company’s management reporting structure as required by SFAS No. 131 “Disclosures about Segments of an Enterprise and Related Information.” In fiscal 2003, one customer in the Electronic Systems segment accounted for $12.9 million, or 10.7%, of the company’s consolidated sales, although no customer accounted for more than 10% of accounts receivable. No customers accounted for more than 10% of the company’s consolidated sales or accounts receivable in any of the other years presented.
The company had sales of $9.2 million for the year ended January 31, 2004, to countries outside the United States, primarily to Canada. Sales were included in the Flow Controls, Engineered Films, Electronic Systems and Aerostar segments totaling $3.5 million, $1.1 million, $4.1 million and $492,000, respectively.
Market and segment information is presented on pages 1 and 16 of this annual report.
Note 14. Subsequent Event
The company announced on March 9, 2004, that it would pay a special one-time dividend of $1.25 per share on May 20, 2004. Based on current shares outstanding, the one-time dividend will total approximately $11 million.
Note 15. Quarterly Information (Unaudited)
The company’s quarterly information is presented on page 26.
page38 RAVEN2004 Annual Report
Report of Independent Auditors
To the Board of Directors and Shareholders of Raven Industries, Inc.:
In our opinion, the accompanying consolidated balance sheets and the related consolidated statements of income, of shareholders’ equity and comprehensive income and of cash flows present fairly, in all material respects, the financial position of Raven Industries, Inc. as of January 31, 2004, 2003 and 2002, and the results of its operations and its cash flow for each of the three years in the period ended January 31, 2004, in conformity with accounting principles generally accepted in the United States of America. These financial statements are the responsibility of Raven Industries, Inc.’s management; our responsibility is to express an opinion on these financial statements based on our audits. We conducted our audits of these statements in accordance with auditing standards generally accepted in the United States of America which require that we plan and perform the audit to obtain reasonable assurance about whether the financial statements are free of material misstatement. An audit includes examining, on a test basis, evidence supporting the amounts and disclosures in the financial statements, assessing the accounting principles used and significant estimates made by management, and evaluating the overall presentation. We believe that our audits provide a reasonable basis for our opinion.

Minneapolis Minnesota
March 8, 2004
RAVEN2004 Annual Report page39
Investor Information
Independent Auditors
PricewaterhouseCoopers LLP
Minneapolis, MN
Stock Transfer Agent & Registrar
Wells Fargo Bank, N.A.
161 N. Concord Exchange
P.O. Box 64854
S. St. Paul, MN 55164-0854
Phone: 1-800-468-9716
Form 10-K
Upon written request, Raven Industries, Inc.’s form 10-K for the fiscal year ended January 31, 2004, which has been filed with the Securities and Exchange Commission, is available free of charge.
Direct inquires to:
Raven Industries, Inc.
Attention: Investor Relations
P.O. Box 5107
Sioux Falls, SD 57117-5107
Phone: 605-336-2750
Raven Website
www.ravenind.com
Stock Quotations
Listed on the Nasdaq Stock Market—RAVN
Annual Meeting
May 26, 2004, 9:00 a.m.
Ramkota Inn
Hwy 38 & I-29
Sioux Falls, SD
Raven Industries, Inc. is an Equal Employment Opportunity Employer with an approved affirmative action plan.
Dividend Reinvestment Plan
Raven Industries, Inc. sponsors a Dividend Reinvestment Plan whereby shareholders can purchase additional Raven common stock without the payment of any brokerage commission or fees. For more information on how you can take advantage of this plan, contact your broker, our stock transfer agent or write: Investor Relations; P.O. Box 5107, Sioux Falls, SD 57117-5107
SIC Codes:
3672,3081, 3829
FORWARD-LOOKING STATEMENTS
The Private Securities Litigation Reform Act provides a “safe harbor” for forward-looking statements. Certain information included in this Annual Report and other materials filed or to be filed by the company with the Securities and Exchange Commission (as well as information included in statements made or to be made by the company) contains statements that are forward-looking. Although the company believes that the expectations reflected in such forward-looking statements are based on reasonable assumptions, there is no assurance that such expectations will be achieved. Such assumptions involve important risks and uncertainties that could significantly affect results in the future. These risks and uncertainties include, but are not limited to, those relating to weather conditions, which could affect certain of the company’s primary markets, such as agriculture and construction, or changes in competition, material availability, technology or relationships with the company’s largest customers, any of which could adversely impact any of the company’s product lines. The foregoing list is not exhaustive and the company disclaims any obligation to subsequently revise any forward-looking statements to reflect events or circumstances after the date of such statements.
Design: Creative Design Board, Chicago, IL