ELEVEN-YEAR FINANCIAL SUMMARY
| | | | | | | | | | | | | |
| | | | For the years ended January 31 | | |
| Dollars in thousands except per-share data | | 2007 | | 2006 | | 2005 |
| |
OPERATIONS FOR THE YEAR | | | | | | | | | | | | |
| Net sales | | | | | | | | | | | | |
| Ongoing operations | | $ | 217,529 | | | $ | 204,528 | | | $ | 168,086 | |
Sold businesses(a) | | | — | | | | — | | | | — | |
| Total | | | 217,529 | | | | 204,528 | | | | 168,086 | |
| Gross profit | | | 54,882 | | | | 53,231 | | | | 43,200 | |
| Operating income | | | | | | | | | | | | |
| Ongoing operations | | | 38,302 | | | | 37,363 | | | | 27,862 | |
Sold businesses(a) | | | — | | | | (79 | ) | | | — | |
| Total | | | 38,302 | | | | 37,284 | | | | 27,862 | |
| Income before income taxes | | | 38,835 | | | | 37,494 | | | | 27,955 | |
| Net income | | $ | 25,441 | | | $ | 24,262 | | | $ | 17,891 | |
| Net income as % of sales | | | 11.7 | % | | | 11.9 | % | | | 10.6 | % |
| Net income as % of beginning equity | | | 30.1 | % | | | 36.7 | % | | | 26.9 | % |
| Cash dividends | | $ | 6,507 | | | $ | 5,056 | | | $ | 15,298 | (b) |
FINANCIAL POSITION | | | | | | | | | | | | |
| Current assets | | $ | 73,219 | | | $ | 71,345 | | | $ | 61,592 | |
| Current liabilities | | | 16,464 | | | | 20,050 | | | | 20,950 | |
| Working capital | | $ | 56,755 | | | $ | 51,295 | | | $ | 40,642 | |
| Current ratio | | | 4.45 | | | | 3.56 | | | | 2.94 | |
| Property, plant and equipment | | $ | 36,264 | | | $ | 25,602 | | | $ | 19,964 | |
| Total assets | | | 119,764 | | | | 106,157 | | | | 88,509 | |
| Long-term debt, less current portion | | | — | | | | 9 | | | | — | |
| Shareholders’ equity | | $ | 98,268 | | | $ | 84,389 | | | $ | 66,082 | |
| Long-term debt / total capitalization | | | 0.0 | % | | | 0.0 | % | | | 0.0 | % |
| Inventory turnover (CGS / year-end inventory) | | | 5.8 | | | | 5.4 | | | | 5.4 | |
CASH FLOWS PROVIDED BY (USED IN) | | | | | | | | | | | | |
| Operating activities | | $ | 26,313 | | | $ | 21,189 | | | $ | 18,871 | |
| Investing activities | | | (18,664 | ) | | | (11,435 | ) | | | (7,631 | ) |
| Financing activities | | | (10,277 | ) | | | (6,946 | ) | | | (19,063 | ) |
| Increase (decrease) in cash and cash equivalents | | | (2,626 | ) | | | 2,790 | | | | (7,823 | ) |
COMMON STOCK DATA | | | | | | | | | | | | |
| Net income per share – basic | | $ | 1.41 | | | $ | 1.34 | | | $ | 0.99 | |
| Net income per share – diluted | | | 1.39 | | | | 1.32 | | | | 0.97 | |
| Cash dividends per share | | | 0.36 | | | | 0.28 | | | | 0.85 | (b) |
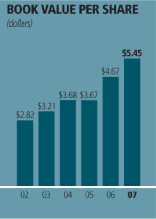
| Book value per share | | | 5.45 | | | | 4.67 | | | | 3.67 | |
| Stock price range during year | | | | | | | | | | | | |
| High | | $ | 42.70 | | | $ | 33.15 | | | $ | 26.94 | |
| Low | | | 25.46 | | | | 16.54 | | | | 13.08 | |
| Close | | $ | 28.43 | | | $ | 31.60 | | | $ | 18.38 | |
| Shares outstanding, year-end (in thousands) | | | 18,039 | | | | 18,072 | | | | 17,999 | |
| Number of shareholders, year-end | | | 8,992 | | | | 9,263 | | | | 6,269 | |
OTHER DATA | | | | | | | | | | | | |
| Price / earnings ratio | | | 20.5 | | | | 23.9 | | | | 18.9 | |
| Average number of employees | | | 884 | | | | 845 | | | | 835 | |
| Sales per employee | | $ | 246 | | | $ | 242 | | | $ | 201 | |
| Backlog | | $ | 44,237 | | | $ | 43,619 | | | $ | 43,646 | |
|
| All per-share, shares outstanding and market price data reflect the October 2004 two-for-one stock split, the January 2003 two-for-one stock split and the July 2001 three-for-two stock split. All other figures are as reported. |
| |
| Price / earnings ratio is determined as closing stock price divided by net income per share – diluted. |
| |
| Book value per share is computed by dividing total shareholders’ equity by the number of common shares and stock units outstanding. |
| |
| (a) In fiscal 2003, 2001, and 2000, the company sold its Beta Raven Industrial Controls, Plastic Tank ,and Glasstite businesses, respectively. |
16
| | | | | | | | | | | | | | | | | | | | | | | | | | | | | | | | | |
| | | | | | |
| |
| | | 2004 | | 2003 | | 2002 | | 2001 | | 2000 | | 1999 | | 1998 | | 1997 |
| |
| | | | | | | | | | | | | | | | | | | | | | | | | | | | | | | | | |
| | | | | | | | | | | | | | | | | | | | | | | | | | | | | | | | | |
| | | $ | 142,727 | | | $ | 119,589 | | | $ | 112,018 | | | $ | 113,360 | | | $ | 107,862 | | | $ | 108,408 | | | $ | 104,489 | | | $ | 101,869 | |
| | | | — | | | | 1,314 | | | | 6,497 | | | | 19,498 | | | | 42,523 | | | | 46,798 | | | | 47,679 | | | | 39,576 | |
| | | | 142,727 | | | | 120,903 | | | | 118,515 | | | | 132,858 | | | | 150,385 | | | | 155,206 | | | | 152,168 | | | | 141,445 | |
| | | | 33,759 | | | | 27,515 | | | | 23,851 | | | | 21,123 | | | | 24,217 | | | | 24,441 | | | | 24,929 | | | | 25,287 | |
| | | | | | | | | | | | | | | | | | | | | | | | | | | | | | | | | |
| | | | 21,981 | | | | 16,861 | | | | 13,788 | | | | 7,417 | (c) | | | 7,971 | | | | 8,220 | | | | 9,555 | | | | 9,321 | |
| | | | (355 | ) | | | 204 | | | | (613 | ) | | | 3,331 | (d) | | | 2,606 | (e) | | | 1,453 | | | | 1,007 | | | | 2,650 | |
| | | | 21,626 | | | | 17,065 | | | | 13,175 | | | | 10,748 | | | | 10,577 | | | | 9,673 | | | | 10,562 | | | | 11,971 | |
| | | | 21,716 | | | | 17,254 | | | | 13,565 | | | | 10,924 | | | | 10,503 | | | | 9,649 | | | | 12,540 | (f) | | | 11,915 | |
| | | $ | 13,836 | | | $ | 11,185 | | | $ | 8,847 | | | $ | 6,411 | (c)(d) | | $ | 6,762 | (e) | | $ | 6,182 | | | $ | 8,062 | | | $ | 7,688 | |
| | | | 9.7 | % | | | 9.3 | % | | | 7.5 | % | | | 4.8 | % | | | 4.5 | % | | | 4.0 | % | | | 5.3 | % | | | 5.4 | % |
| | | | 23.8 | % | | | 21.5 | % | | | 18.4 | % | | | 11.8 | % | | | 10.9 | % | | | 10.0 | % | | | 14.2 | % | | | 15.6 | % |
| | | $ | 3,075 | | | $ | 2,563 | | | $ | 2,371 | | | $ | 2,399 | | | $ | 2,895 | | | $ | 2,944 | | | $ | 2,709 | | | $ | 2,367 | |
| | | | | | | | | | | | | | | | | | | | | | | | | | | | | | | | | |
| | | $ | 55,710 | | | $ | 49,351 | | | $ | 45,308 | | | $ | 51,817 | | | $ | 55,371 | | | $ | 60,279 | | | $ | 57,285 | | | $ | 56,696 | |
| | | | 11,895 | | | | 13,167 | | | | 13,810 | | | | 13,935 | | | | 14,702 | | | | 15,128 | | | | 17,816 | | | | 20,016 | |
| | | $ | 43,815 | | | $ | 36,184 | | | $ | 31,498 | | | $ | 37,882 | | | $ | 40,669 | | | $ | 45,151 | | | $ | 39,469 | | | $ | 36,680 | |
| | | | 4.68 | | | | 3.75 | | | | 3.28 | | | | 3.72 | | | | 3.77 | | | | 3.98 | | | | 3.22 | | | | 2.83 | |
| | | $ | 15,950 | | | $ | 16,455 | | | $ | 14,059 | | | $ | 11,647 | | | $ | 15,068 | | | $ | 19,563 | | | $ | 19,817 | | | $ | 18,142 | |
| | | | 79,508 | | | | 72,816 | | | | 67,836 | | | | 65,656 | | | | 74,047 | | | | 83,657 | | | | 82,066 | | | | 80,662 | |
| | | | 57 | | | | 151 | | | | 280 | | | | 2,013 | | | | 3,024 | | | | 4,572 | | | | 1,128 | | | | 3,181 | |
| | | $ | 66,471 | | | $ | 58,236 | | | $ | 52,032 | | | $ | 47,989 | | | $ | 54,519 | | | $ | 62,293 | | | $ | 61,563 | | | $ | 56,729 | |
| | | | 0.1 | % | | | 0.3 | % | | | 0.5 | % | | | 4.0 | % | | | 5.3 | % | | | 6.8 | % | | | 1.8 | % | | | 5.3 | % |
| | | | 6.5 | | | | 4.4 | | | | 5.0 | | | | 5.9 | | | | 5.2 | | | | 4.9 | | | | 4.8 | | | | 4.5 | |
| | | | | | | | | | | | | | | | | | | | | | | | | | | | | | | | | |
| | | $ | 19,732 | | | $ | 12,735 | | | $ | 18,496 | | | $ | 9,441 | | | $ | 10,375 | | | $ | 8,326 | | | $ | 9,274 | | | $ | 7,088 | |
| | | | (4,352 | ) | | | (9,166 | ) | | | (13,152 | ) | | | 9,752 | | | | 6,323 | | | | (3,127 | ) | | | (4,979 | ) | | | (5,090 | ) |
| | | | (6,155 | ) | | | (5,830 | ) | | | (8,539 | ) | | | (14,227 | ) | | | (16,326 | ) | | | (2,714 | ) | | | (4,884 | ) | | | (2,363 | ) |
| | | | 9,225 | | | | (2,261 | ) | | | (3,195 | ) | | | 4,966 | | | | 372 | | | | 2,485 | | | | (589 | ) | | | (365 | ) |
| | | | | | | | | | | | | | | | | | | | | | | | | | | | | | | | | |
| | | $ | 0.77 | | | $ | 0.61 | | | $ | 0.48 | | | $ | 0.31 | | | $ | 0.26 | | | $ | 0.22 | | | $ | 0.28 | | | $ | 0.27 | |
| | | | 0.75 | | | | 0.60 | | | | 0.47 | | | | 0.31 | | | | 0.26 | | | | 0.22 | | | | 0.28 | | | | 0.27 | |
| | | | 0.17 | | | | 0.14 | | | | 0.13 | | | | 0.12 | | | | 0.11 | | | | 0.10 | | | | 0.09 | | | | 0.08 | |
| | | | 3.68 | | | | 3.21 | | | | 2.82 | | | | 2.53 | | | | 2.32 | | | | 2.21 | | | | 2.13 | | | | 1.96 | |
| | | | | | | | | | | | | | | | | | | | | | | | | | | | | | | | | |
| | | $ | 15.23 | | | $ | 9.20 | | | $ | 5.88 | | | $ | 3.48 | | | $ | 3.04 | | | $ | 3.79 | | | $ | 4.29 | | | $ | 3.92 | |
| | | | 7.56 | | | | 4.38 | | | | 3.02 | | | | 1.88 | | | | 2.25 | | | | 2.54 | | | | 3.27 | | | | 2.67 | |
| | | $ | 14.11 | | | $ | 7.91 | | | $ | 5.64 | | | $ | 3.04 | | | $ | 2.40 | | | $ | 2.67 | | | $ | 3.77 | | | $ | 3.75 | |
| | | | 18,041 | | | | 18,133 | | | | 18,424 | | | | 18,956 | | | | 23,496 | | | | 28,164 | | | | 28,944 | | | | 29,016 | |
| | | | 3,560 | | | | 2,781 | | | | 2,387 | | | | 2,460 | | | | 2,749 | | | | 3,014 | | | | 3,221 | | | | 3,011 | |
| | | | | | | | | | | | | | | | | | | | | | | | | | | | | | | | | |
| | | | 18.8 | | | | 13.2 | | | | 12.1 | | | | 9.8 | | | | 9.2 | | | | 12.4 | | | | 13.7 | | | | 13.9 | |
| | | | 787 | | | | 784 | | | | 858 | | | | 1,082 | | | | 1,369 | | | | 1,507 | | | | 1,573 | | | | 1,454 | |
| | | $ | 181 | | | $ | 154 | | | $ | 138 | | | $ | 123 | | | $ | 110 | | | $ | 103 | | | $ | 97 | | | $ | 97 | |
| | | $ | 47,120 | | | $ | 42,826 | | | $ | 33,834 | | | $ | 38,239 | | | $ | 44,935 | | | $ | 47,431 | | | $ | 47,154 | | | $ | 38,102 | |
| |
| (b) | Includes a special dividend of $.625 per share that was paid during the second quarter of fiscal 2005. |
| |
| (c) | Includes $2.6 million of business repositioning charges, net of gains on plant sales, primarily in Electronic Systems and Aerostar.
|
| |
| (d) | Includes the $3.1 million pretax gain ($1.4 million net of tax) on the sale of the company’s Plastic Tank Division. |
| |
| (e) | Includes the $1.2 million pretax gain ($764,000 net of tax) on the sale of assets of the company’s Glasstite subsidiary. |
| |
| (f) | Includes the $1.8 million pretax gain ($1.2 million net of tax) on the sale of an investment in an affiliate. |
RAVEN2007ANNUALREPORT
17
BUSINESS SEGMENTS
| | | | | | | | | | | | | | | | | | | | | | | | | |
| | | For the years ended January 31 |
| Dollars in thousands | | 2007 | | 2006 | | 2005 | | 2004 | | 2003 | | 2002 |
| | | |
ENGINEERED FILMS DIVISION | | | | | | | | | | | | | | | | | | | | | | | | |
| Sales | | $ | 91,082 | | | $ | 82,794 | | | $ | 58,657 | | | $ | 42,636 | | | $ | 35,096 | | | $ | 35,796 | |
| Operating income | | | 23,440 | | | | 19,907 | | | | 15,739 | | | | 10,563 | | | | 10,030 | | | | 8,257 | |
| Assets | | | 41,988 | | | | 33,512 | | | | 25,181 | | | | 15,941 | | | | 17,244 | | | | 13,691 | |
| Capital expenditures | | | 13,266 | | | | 7,359 | | | | 3,960 | | | | 712 | | | | 4,080 | | | | 3,178 | |
| Depreciation & amortization | | | 2,887 | | | | 2,436 | | | | 1,403 | | | | 1,611 | | | | 1,475 | | | | 1,001 | |
| | | | | | | | | | | | | | | | | | | | | | | | | |
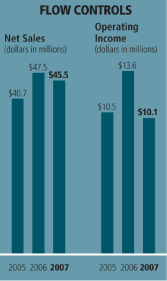
FLOW CONTROLS DIVISION | | | | | | | | | | | | | | | | | | | | | | | | |
| Sales | | $ | 45,515 | | | $ | 47,506 | | | $ | 40,726 | | | $ | 35,059 | | | $ | 28,496 | | | $ | 23,178 | |
| Operating income | | | 10,111 | | | | 13,586 | | | | 10,516 | (b) | | | 8,254 | | | | 6,897 | | | | 5,509 | (d) |
| Assets | | | 27,629 | | | | 30,047 | | | | 23,701 | | | | 19,304 | | | | 21,483 | | | | 20,313 | |
| Capital expenditures | | | 577 | | | | 938 | | | | 1,372 | | | | 341 | | | | 729 | | | | 677 | |
| Depreciation & amortization | | | 1,142 | | | | 1,085 | | | | 876 | | | | 1,004 | | | | 948 | | | | 443 | |
| | | | | | | | | | | | | | | | | | | | | | | | | |
ELECTRONIC SYSTEMS DIVISION | | | | | | | | | | | | | | | | | | | | | | | | |
| Sales | | $ | 66,278 | | | $ | 56,219 | | | $ | 47,049 | | | $ | 44,307 | | | $ | 38,589 | | | $ | 32,289 | |
| Operating income | | | 10,850 | | | | 8,916 | | | | 4,492 | | | | 5,797 | | | | 4,022 | | | | 2,264 | |
| Assets | | | 25,175 | | | | 20,191 | | | | 17,382 | | | | 14,975 | | | | 14,528 | | | | 13,910 | |
| Capital expenditures | | | 1,357 | | | | 1,612 | | | | 1,201 | | | | 841 | | | | 395 | | | | 774 | |
| Depreciation & amortization | | | 1,086 | | | | 871 | | | | 880 | | | | 850 | | | | 978 | | | | 1,101 | |
| | | | | | | | | | | | | | | | | | | | | | | | | |
AEROSTAR | | | | | | | | | | | | | | | | | | | | | | | | |
| Sales | | $ | 14,654 | | | $ | 18,009 | | | $ | 21,654 | | | $ | 20,725 | | | $ | 17,408 | | | $ | 20,755 | |
| Operating income | | | 707 | | | | 2,133 | | | | 3,609 | | | | 3,092 | (c) | | | 1,012 | | | | 2,907 | (e) |
| Assets | | | 8,161 | | | | 6,837 | | | | 7,492 | | | | 7,756 | | | | 7,032 | | | | 7,150 | |
| Capital expenditures | | | 812 | | | | 179 | | | | 542 | | | | 1,130 | | | | 570 | | | | 256 | |
| Depreciation & amortization | | | 375 | | | | 359 | | | | 389 | | | | 436 | | | | 374 | | | | 347 | |
| | | | | | | | | | | | | | | | | | | | | | | | | |
REPORTABLE SEGMENTS TOTAL | | | | | | | | | | | | | | | | | | | | | | | | |
| Sales | | $ | 217,529 | | | $ | 204,528 | | | $ | 168,086 | | | $ | 142,727 | | | $ | 119,589 | | | $ | 112,018 | |
| Operating income | | | 45,108 | | | | 44,542 | | | | 34,356 | (b) | | | 27,706 | (c) | | | 21,961 | | | | 18,937 | (d,e) |
| Assets | | | 102,953 | | | | 90,587 | | | | 73,756 | | | | 57,976 | | | | 60,287 | | | | 55,064 | |
| Capital expenditures | | | 16,012 | | | | 10,088 | | | | 7,075 | | | | 3,024 | | | | 5,774 | | | | 4,885 | |
| Depreciation & amortization | | | 5,490 | | | | 4,751 | | | | 3,548 | | | | 3,901 | | | | 3,775 | | | | 2,892 | |
| | | | | | | | | | | | | | | | | | | | | | | | | |
CORPORATE & OTHER(a) | | | | | | | | | | | | | | | | | | | | | | | | |
| Sales from sold businesses | | $ | — | | | $ | — | | | $ | — | | | $ | — | | | $ | 1,314 | | | $ | 6,497 | |
| Operating income (loss) from sold businesses | | | — | | | | (79 | ) | | | — | | | | (355 | ) | | | 204 | | | | (613 | ) |
| Operating (loss) from administrative expenses | | | (6,806 | ) | | | (7,179 | ) | | | (6,494 | ) | | | (5,725 | ) | | | (5,100 | ) | | | (5,149 | ) |
| Assets | | | 16,811 | | | | 15,570 | | | | 14,753 | | | | 21,532 | | | | 12,529 | | | | 12,772 | |
| Capital expenditures | | | 510 | | | | 270 | | | | 466 | | | | 306 | | | | 259 | | | | 209 | |
| Depreciation & amortization | | | 395 | | | | 400 | | | | 293 | | | | 244 | | | | 191 | | | | 253 | |
| | | | | | | | | | | | | | | | | | | | | | | | | |
TOTAL COMPANY | | | | | | | | | | | | | | | | | | | | | | | | |
| Sales | | $ | 217,529 | | | $ | 204,528 | | | $ | 168,086 | | | $ | 142,727 | | | $ | 120,903 | | | $ | 118,515 | |
| Operating income | | | 38,302 | | | | 37,284 | | | | 27,862 | (b) | | | 21,626 | (c) | | | 17,065 | | | | 13,175 | (d,e) |
| Assets | | | 119,764 | | | | 106,157 | | | | 88,509 | | | | 79,508 | | | | 72,816 | | | | 67,836 | |
| Capital expenditures | | | 16,522 | | | | 10,358 | | | | 7,541 | | | | 3,330 | | | | 6,033 | | | | 5,094 | |
| Depreciation & amortization | | | 5,885 | | | | 5,151 | | | | 3,841 | | | | 4,145 | | | | 3,966 | | | | 3,145 | |
| |
| (a) | Operating income from sold businesses includes administrative expenses directly attributable to the sold businesses. Assets are principally cash, investments, deferred taxes and notes receivable. |
| |
| (b) | Includes a $1.3 million pretax writeoff of assets related to the Fluent Systems product line (see Note 5). |
| |
| (c) | Includes $182,000 of pretax gain on plant sale. |
| |
| (d) | Includes a $550,000 in-process research and development charge related to the Starlink acquisition. |
| |
| (e) | Includes $414,000 of pretax gain on plant sale. |
18
FINANCIAL REVIEW AND ANALYSIS
RESULTS OF OPERATIONS
The following table presents comparative financial performance for the past three years:
| | | | | | | | | | | | | | | | | | | | | | | | | | | | | | | | | | | | | |
| | | For the years ended January 31 |
| | | 2007 | | 2006 | | 2005 |
| Dollars in thousands, | | | | | | % | | % | | | | | | % | | % | | | | | | % | | % |
| except per-share data | | | | | | Sales | | Change | | | | | | Sales | | Change | | | | | | Sales | | Change |
| | | |
| Net sales | | $ | 217,529 | | | | 100.0 | | | | +6.4 | | | $ | 204,528 | | | | 100.0 | | | | +21.7 | | | $ | 168,086 | | | | 100.0 | | | | +17.8 | |
| Gross profit | | | 54,882 | | | | 25.2 | | | | +3.1 | | | | 53,231 | | | | 26.0 | | | | +23.2 | | | | 43,200 | | | | 25.7 | | | | +28.0 | |
| Operating expenses | | | 16,580 | | | | 7.6 | | | | +4.5 | | | | 15,868 | | | | 7.8 | | | | +12.9 | | | | 14,056 | | | | 8.4 | | | | +17.5 | |
| Loss on disposition of businesses & assets | | | — | | | | | | | | | | | | 79 | | | | | | | | | | | | 1,282 | | | | | | | | | |
| Operating income | | | 38,302 | | | | 17.6 | | | | +2.7 | | | | 37,284 | | | | 18.2 | | | | +33.8 | | | | 27,862 | | | | 16.6 | | | | +28.8 | |
| Income before income taxes | | | 38,835 | | | | 17.9 | | | | +3.6 | | | | 37,494 | | | | 18.3 | | | | +34.1 | | | | 27,955 | | | | 16.6 | | | | +28.7 | |
| Income taxes | | | 13,394 | | | | 6.2 | | | | +1.2 | | | | 13,232 | | | | 6.5 | | | | +31.5 | | | | 10,064 | | | | 6.0 | | | | +27.7 | |
| Net income | | $ | 25,441 | | | | 11.7 | | | | +4.9 | | | $ | 24,262 | | | | 11.9 | | | | +35.6 | | | $ | 17,891 | | | | 10.6 | | | | +29.3 | |
| Net income per share – diluted | | $ | 1.39 | | | | | | | | +5.3 | | | $ | 1.32 | | | | | | | | +36.1 | | | $ | 0.97 | | | | | | | | +29.3 | |
| Effective income tax rate | | | 34.5 | % | | | | | | | –2.3 | | | | 35.3 | % | | | | | | | – 1.9 | | | | 36.0 | % | | | | | | | – 0.8 | |
EXECUTIVE SUMMARY
Raven Industries, Inc. is an industrial manufacturer providing a variety of products to customers in the industrial, agricultural, construction and military/aerospace markets, primarily in North America. It operates in four business segments: Engineered Films, Flow Controls, Electronic Systems and Aerostar.
Consolidated Operating Results
The company delivered record sales and profits in fiscal 2007, although growth rates for the current fiscal year were not as high as in the past. Net income climbed to $25.4 million, an increase of $1.2 million, or 4.9%, over last year’s $24.3 million. Earnings per diluted share increased 7 cents over the prior year, reaching $1.39. Fiscal year net sales climbed to $217.5 million, exceeding fiscal 2006 by $13.0 million, or 6.4%. Engineered Films and Electronic Systems posted record sales for the current year, which drove the company’s profit growth.
In fiscal 2007, Raven’s quarterly dividend increased to 9 cents per share, up from 7 cents per share during fiscal 2006. Fiscal 2007 capital spending was $16.5 million. In the past two years, the company has made significant capital investments in its Engineered Films segment. In fiscal 2007, this investment totaled $13.3 million. In fiscal 2006, total company-wide capital expenditures were $10.4 million, of which $7.4 million related to Engineered Films. Raven completed the strategic acquisition of Montgomery Industries, Inc. in its Flow Controls segment at the beginning of fiscal 2006. The company expects that capital spending will fall back to a more normal level in fiscal 2008, with capital investment in the $6 million range.
Management expects another year of record sales and profits in fiscal 2008. A strong turnaround from the company’s Aerostar segment is expected, as parachutes are delivered under a new contract. Flow Controls is also anticipating a rebound in fiscal 2008 as new products are delivered into an improving farm economy. While the additional Engineered Films manufacturing capabilities and capacity are expected to create new opportunities, management believes the lack of disaster film demand combined with higher depreciation charges will reduce its operating income in fiscal 2008. Electronic Systems is expecting growth from its existing customer base.
The following discussion highlights the consolidated operating results. Operating results are more fully explained in the segment discussions that follow.
RAVEN2007ANNUALREPORT
19
FINANCIAL REVIEW AND ANALYSIS(continued)
Fiscal 2007 versus fiscal 2006
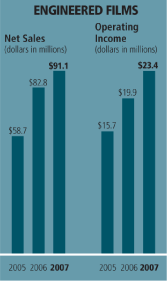
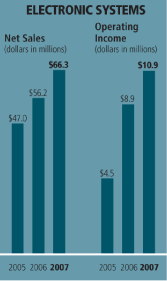
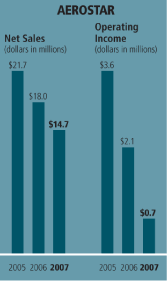
Net sales for the fiscal year ended January 31, 2007, of $217.5 million represented a record for the company, exceeding the prior year by $13.0 million, or 6.4%. The fiscal 2007 sales performance followed a strong fiscal 2006, which recorded a 21.7% increase over fiscal 2005 sales. Engineered Films and Electronic Systems posted record net sales for the fiscal year ended January 31, 2007, while Flow Controls and Aerostar fell short of the previous year’s revenue levels. Engineered Films net sales reached $91.1 million, an increase of $8.3 million compared with the prior fiscal year. Increased demand for pit liners used in oil and gas fields, along with an improvement in construction film sales, led to the 10.0% revenue rise for Engineered Films. This growth was tempered by a decrease in sales of film to the manufactured housing industry and lower disaster film revenue versus one year earlier. Electronic Systems net sales climbed to $66.3 million, which reflected a 17.9%, or $10.1 million, increase over fiscal 2006. Higher product demand from the segment’s largest customer accounted for most of the current year’s revenue increase. Fiscal 2007 Flow Controls net sales of $45.5 million were behind the prior year by $2.0 million, or 4.2%. A weaker agricultural economy, which caused customers to delay equipment buying decisions, contributed to the lack of sales growth in this segment. Aerostar net sales of $14.7 million represented a $3.4 million, or 18.6%, decrease from one year ago, due mainly to lower parachute product deliveries.
Fiscal 2007 operating income of $38.3 million increased $1.0 million, or 2.7%, compared with $37.3 million reported for fiscal 2006, due to strong performances from Engineered Films and Electronic Systems. Operating income growth in these two segments was partially offset by lower operating income levels for Flow Controls and Aerostar. Engineered Films improved operating income by $3.5 million, or 17.7%, as a result of higher sales and favorable raw material pricing. Increased sales and better operational execution on existing customer contracts accounted for the rise in Electronic Systems operating income, which grew $1.9 million, or 21.7%, reaching $10.9 million for the 12-month period. Flow Controls fiscal 2007 operating income of $10.1 million represented a decrease of $3.5 million, or 25.6%, in contrast to one year earlier. Lower sales volume on relatively fixed costs had a negative impact on this segment’s profit for the year. Aerostar reported operating income of $707,000 for the latest year, decreasing $1.4 million, or 66.9%, from the prior year, mostly due to the lack of parachute product shipments.
Fiscal 2006 versus fiscal 2005
Fiscal 2006 net sales reached $204.5 million, 21.7% higher than fiscal 2005, with Engineered Films, Flow Controls, and Electronic Systems recording increases over their fiscal 2005 performance. Engineered Films posted the largest sales gain: $24.1 million or 41.1%, to reach $82.8 million. Fiscal 2006 revenue topped the prior year in all of the Engineered Films markets, reflecting the segment’s additional manufacturing capacity, strong demand for pit liners, and higher selling prices due to increased resin costs. Flow Controls net sales reached $47.5 million, up 16.6% over fiscal 2005. Increased demand for the segment’s standard sprayer control systems and sales of automatic boom height control systems (Autoboom™) boosted revenue for fiscal 2006. Electronic Systems reported a 19.5% increase in annual sales resulting from higher demand from its existing customer base. Aerostar net sales of $18.0 million fell short of fiscal 2005 by $3.6 million, resulting from an expected cargo parachute revenue decrease and lower uniform contract sales.
Operating income of $37.3 million was 33.8% over the $27.9 million reported for fiscal 2005. Improved profits were the result of higher sales from Engineered Films and Flow Controls, and increased manufacturing efficiencies in Electronic Systems. Fiscal 2006 operating income of $19.9 million reported in the Engineered Films segment increased $4.2 million. Fiscal 2006 Flow Controls operating income of $13.6 million was $3.1 million, or 29.2% higher than fiscal 2005, while Electronic Systems operating income of $8.9 million almost doubled from the previous year. Aerostar operating income of $2.1 million fell short of fiscal 2005 by $1.5 million, or 40.9%, and reflected the segment’s lack of a follow-on military parachute order in fiscal 2006.
20
FISCAL 2007 PERFORMANCE MEASURES
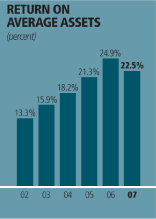
Raven has set goals for achieving higher growth, better returns on invested capital, and increased shareholder value. Fiscal 2007 performance measures fell below the outstanding fiscal 2006 financial returns. Net income was 11.7% of net sales in fiscal 2007, slightly below fiscal 2006’s record of 11.9%. Net income as a percent of average assets was 22.5% as compared to 24.9% in fiscal 2006. As a percent of beginning equity, fiscal 2007 net income was 30.1%, down from fiscal 2006’s 36.7%.
| | | | | | | | | | | | | | | | | | | | | | | | | |
| | | 2007 | | 2006 | | 2005 | | 2004 | | 2003 | | 2002 |
| | | |
| Net income as % of | | | | | | | | | | | | | | | | | | | | | | | | |
| Net sales | | | 11.7 | % | | | 11.9 | % | | | 10.6 | % | | | 9.7 | % | | | 9.3 | % | | | 7.5 | % |
| Average assets | | | 22.5 | % | | | 24.9 | % | | | 21.3 | % | | | 18.2 | % | | | 15.9 | % | | | 13.3 | % |
| Beginning equity | | | 30.1 | % | | | 36.7 | % | | | 26.9 | % | | | 23.8 | % | | | 21.5 | % | | | 18.4 | % |
SEGMENT ANALYSIS
NET SALES AND OPERATING INCOME BY SEGMENT
| | | | | | | | | | | | | | | | | | | | | | | | | |
| | | 2007 | | | 2006 | | | 2005 | |
| | | | | | | % | | | | | | | % | | | | | | | % | |
| Dollars in thousands | | amount | | | change | | | amount | | | change | | | amount | | | change | |
| | | |
NET SALES | | | | | | | | | | | | | | | | | | | | | | | | |
| Engineered Films | | $ | 91,082 | | | | +10.0 | | | $ | 82,794 | | | | +41.1 | | | $ | 58,657 | | | | +37.6 | |
| Flow Controls | | | 45,515 | | | | – 4.2 | | | | 47,506 | | | | +16.6 | | | | 40,726 | | | | +16.2 | |
| Electronic Systems | | | 66,278 | | | | +17.9 | | | | 56,219 | | | | +19.5 | | | | 47,049 | | | | + 6.2 | |
| Aerostar | | | 14,654 | | | | –18.6 | | | | 18,009 | | | | –16.8 | | | | 21,654 | | | | + 4.5 | |
| | | | | | | | | | | | | | | | | | | | | | |
| Total | | $ | 217,529 | | | | + 6.4 | | | $ | 204,528 | | | | +21.7 | | | $ | 168,086 | | | | +17.8 | |
| | | | | | | | | | | | | | | | | | | | | | |
| | | | | | | | | | | | | | | | | | | | | | | | | |
| | | 2007 | | | 2006 | | | 2005 | |
| | | | | | | % | | | | | | | % | | | | | | | % | |
| Dollars in thousands | | amount | | | sales | | | amount | | | sales | | | amount | | | sales | |
| | | |
OPERATING INCOME (LOSS) | | | | | | | | | | | | | | | | | | | | | | | | |
| Engineered Films | | $ | 23,440 | | | | 25.7 | | | $ | 19,907 | | | | 24.0 | | | $ | 15,739 | | | | 26.8 | |
| Flow Controls | | | 10,111 | | | | 22.2 | | | | 13,586 | | | | 28.6 | | | | 10,516 | | | | 25.8 | |
| Electronic Systems | | | 10,850 | | | | 16.4 | | | | 8,916 | | | | 15.9 | | | | 4,492 | | | | 9.5 | |
| Aerostar | | | 707 | | | | 4.8 | | | | 2,133 | | | | 11.8 | | | | 3,609 | | | | 16.7 | |
| Sold businesses | | | — | | | | | | | | (79 | ) | | | | | | | — | | | | | |
| Corporate expenses | | | (6,806 | ) | | | | | | | (7,179 | ) | | | | | | | (6,494 | ) | | | | |
| | | | | | | | | | | | | | | | | | | | | | |
| Total | | $ | 38,302 | | | | 17.6 | | | $ | 37,284 | | | | 18.2 | | | $ | 27,862 | | | | 16.6 | |
| | | | | | | | | | | | | | | | | | | | | | |
ENGINEERED FILMS
Engineered Films produces rugged reinforced plastic sheeting for industrial, construction, manufactured housing and agriculture applications.
Fiscal 2007 versus fiscal 2006
Fiscal 2007 net sales of $91.1 million grew 10.0%, or $8.3 million, from the prior record in fiscal 2006 of $82.8 million. Sales of pit lining and construction films posted significant revenue growth for the current year. Pit lining sales benefited from strong oil and gas drilling activity, while construction film revenues increased due to market-share growth. The growth in these two markets was partially offset by decreased sales activity in the manufactured housing and disaster film markets. Disaster film sales in the current year totaled $9.9 million versus $11.4 million a year ago. A portion of the higher Engineered Films sales level was due to selling price increases. The amount of sales attributable to higher product pricing (and not due to an increase in volume) was estimated to be about 8% of total fiscal 2007 reported sales. Fiscal 2007 fourth quarter sales of $19.7 million fell below the prior year’s fourth-quarter mark, decreasing $6.3 million, or 24.2%. Disaster film sales accounted for the shortfall, with $6.3 million of deliveries made in last year’s fourth quarter compared with no shipments occurring in this year’s fourth quarter.
RAVEN2007ANNUALREPORT
21
FINANCIAL REVIEW AND ANALYSIS(continued)
Fiscal 2007 operating income reached a record $23.4 million, up $3.5 million, or 17.7%, due to higher sales. Favorable resin costs also contributed to the profit growth, resulting in an increase in the segment’s gross profit rate. Gross profit as a percentage of net sales increased from 27.6% reported one year ago to 29.4% for the year ended January 31, 2007. Increased selling expenses, which rose $365,000, or 12.6%, partially offset the profit impact of the segment’s higher sales level and favorable material costs. Fiscal 2007 selling expenses exceeded the prior year’s, because of higher personnel costs and an increased trade show presence to support the segment’s expanded product offerings and manufacturing capabilities.
Fiscal 2006 versus fiscal 2005
Fiscal 2006 revenues of $82.8 million reflected an increase of 41.1% over fiscal 2005. All of Engineered Films market segments achieved higher sales in fiscal 2006, with the pit lining segment posting the largest revenue growth. Engineered Films also reported significant sales growth in its agricultural, industrial and construction markets. Fiscal 2006 disaster film sales of $11.4 million were $2.0 million, or 21.6% higher than fiscal 2005. Additional manufacturing capacity brought online during the latter part of fiscal 2005 and the beginning of fiscal 2006 enabled the segment to fulfill higher customer demand. Increased product pricing from higher raw material prices also positively affected overall sales for fiscal 2006. The increase in the segment’s fiscal 2006 sales resulting from higher product pricing due to increased resin costs was estimated to be 12-16%.
Fiscal 2006 operating income climbed to $19.9 million, increasing 26.5% over the prior year. The positive profit impact of the higher sales level was partially offset by higher resin costs, as reflected in the decrease in gross profit as a percent of net sales to 27.6% for fiscal 2006 versus 31.4% in fiscal 2005. Selling expenses rose 10.5% during fiscal 2006, reaching $2.9 million, mainly due to increased personnel costs to support the segment’s higher sales.
Prospects
The company invested $13.3 million in property, plant and equipment for Engineered Films in fiscal 2007. Management believes that investments in extrusion capacity will allow this segment to expand its product offerings and open new markets. However, most of the new capacity was not yet operational at the beginning of fiscal 2008. Historically, it takes two-to-three years to fully utilize new extrusion capacity. No significant disaster film sales are expected in fiscal 2008 in contrast to $9.9 million shipped in the first three quarters of fiscal 2007. Sales growth of 5-10% in fiscal 2008 is expected to be driven by new products and occur primarily in the fourth quarter. Profits are expected to be lowered by new product introduction costs and approximately $1.6 million of additional depreciation charges. Additional disaster film sales could improve the current outlook.
FLOW CONTROLS
Flow Controls, including Raven Canada and Raven GmbH (Europe), provides electronic and Global Positioning System (GPS) products for precision agriculture, marine navigation and other niche markets.
Fiscal 2007 versus fiscal 2006
Net sales in fiscal 2007 were $45.5 million, decreasing $2.0 million, or 4.2%, from the prior year. An increase in new precision product sales was offset by a decline in shipments of standard sprayer control systems. Sales of these systems decreased due to the prior year’s high level of product deliveries, which resulted from concern over a potential Asian rust infestation in North America. Softness in the U.S. agricultural economy caused customers to take a more conservative approach when making investments, delaying demand for the segment’s products. Weakness in global markets, especially in South America and Australia, prevented Flow Controls international growth initiatives from producing higher revenues. Revenue growth was also hampered by GPS-based agriculture product reliability issues, which were recognized and resolved during fiscal 2007.
22
Fiscal 2007 operating income of $10.1 million fell short of last year’s $13.6 million by $3.5 million, or 25.6%. As a percentage of sales, gross profit declined to 32.1% versus 37.0% for fiscal 2006. Lower sales volume on fixed costs, increased product warranty expense, and higher selling expenses negatively affected operating income for the current fiscal year. Fiscal 2007 selling expenses were $4.5 million, up from the prior year’s $3.9 million by $630,000, or 16.1%. Flow Controls concentrated its sales and marketing efforts this year on international markets. Cost controls put into place in relation to the segment’s domestic selling group were offset by increased selling efforts in Canada and Europe. Fiscal 2007 fourth quarter operating income of $2.1 million was $594,000, or 22.4%, lower than the quarter ended one year earlier, despite a slightly higher sales level. Fourth quarter operating income for the latest year was negatively affected by relatively lower margins on precision agriculture products and higher warranty costs. This impact was reflected in the decrease in gross profit as a percentage of net sales, which fell from 37.1% reported for last year’s fourth quarter to 29.9% for the just-ended three months.
Fiscal 2006 versus fiscal 2005
Fiscal 2006 net sales reached $47.5 million, up 16.6%, or $6.8 million, over fiscal 2005 levels. The segment’s standard sprayer control systems and the acquired Autoboom™ product line accounted for the majority of the sales growth.
Gross profit as a percentage of sales improved slightly to 37.0% from the 36.7% reported for the prior year, reflecting the impact of increased sales on fixed costs. Fiscal 2006 operating income of $13.6 million grew 29.2% compared with the year ended January 31, 2005. Included in fiscal 2005 operating income was a $1.3 million pretax writeoff of assets related to the segment’s Fluent Systems acquisition. Excluding the writeoff, fiscal 2006 operating income would have increased $1.8 million, or 15.2%, reflecting the segment’s higher sales, tempered by increases in product development and distribution investments. Fiscal 2006 selling expenses were $3.9 million, a 25.1% increase over fiscal 2005. Higher selling expenses related to the segment’s U.S . distribution plan, and expenses incurred to leverage Flow Controls product offerings in Canada, contributed to the fiscal 2006 selling expense increase.
Prospects
Management expects sales growth in the coming year as product introductions gain acceptance and the recent improvement in the agricultural economy takes hold and begins to influence customer-buying decisions. Management also believes its past investments in reaching the Canadian and European markets will aid revenue growth next year. The segment is poised to increase its investments in Australia and Brazil if, or when, those economies show signs of improvement. Sales growth in fiscal 2008 is expected to be tempered by more intense competition for the segment’s GPS product offerings within the agricultural market. Fiscal 2008 sales growth for Flow Controls is targeted to reach the 10-15% range. Margins are expected to recover somewhat, as the segment’s new products are performing well, but competitive pricing pressure is expected to restrain margin growth.
RAVEN2007ANNUALREPORT
23
FINANCIAL REVIEW AND ANALYSIS(continued)
ELECTRONIC SYSTEMS
Electronic Systems is a total-solutions provider of electronics manufacturing services, primarily to North American original equipment manufacturers.
Fiscal 2007 versus fiscal 2006
In fiscal 2007, Electronic Systems posted a record $66.3 million of net sales, reflecting a $10.1 million, or 17.9%, increase over fiscal 2006. Net sales for the fourth quarter of the current year of $17.0 million represented a $3.1 million improvement from the quarter ended one year earlier. Sales to existing customers accounted for substantially all of the growth in fiscal 2007, with most of the sales increase due to a higher level of deliveries to the segment’s largest customer.
Operating income for Electronic Systems reached $10.9 million for fiscal 2007, improving $1.9 million, or 21.7%, over fiscal 2006. Fourth quarter operating income of $2.9 million beat last year’s fourth quarter results by $928,000, or 46.4%. Better execution on existing contracts and increased sales accounted for the improvements in operating income for both periods. As a percentage of net sales, gross profit in the latest year increased to 18.0% compared with 17.4% for fiscal 2006, and reflected the operational gains made during the year. Higher personnel costs contributed to the 24.4% increase in selling expenses, which totaled $1.1 million for fiscal 2007.
Fiscal 2006 versus fiscal 2005
Electronic Systems increased sales 19.5%, or $9.2 million, over fiscal 2005 to reach $56.2 million. Fiscal 2006 sales growth came from higher deliveries to long-term customers on existing contracts. Fiscal 2006 operating income of $8.9 million almost doubled from the prior year, reflecting increased sales and better operational execution on current contracts, in contrast to fiscal 2005’s start-up inefficiencies and customer-driven delays. As a percentage of sales, the gross profit rate climbed to 17.4% compared with fiscal 2005’s 11.3%. Fiscal 2006 selling expenses of $885,000 were up 7.5% versus fiscal 2005.
Prospects
Electronic Systems is expected to improve sales by 10-15% in fiscal 2008. An anticipated increase in sales to the segment’s existing customers should drive the revenue growth in the upcoming fiscal year. Electronic Systems will continue to strive for a high level of operational execution to maintain its gross profit rates in the coming year.
AEROSTAR
The Aerostar segment manufactures military parachutes, government service uniforms, custom-shaped inflatable products, and high-altitude balloons for public and commercial research.
Fiscal 2007 versus fiscal 2006
Fiscal 2007 net sales of $14.7 million decreased $3.4 million, or 18.6%, from fiscal 2006. This was primarily due to lower parachute product deliveries, with a decrease in research balloon revenue also creating a sales shortfall compared with the previous year. Partially offsetting these decreases were higher sales of commercial inflatable products during fiscal 2007.
Operating income for the fiscal year of $707,000 was down $1.4 million from fiscal 2006. Increased profits on commercial inflatable products due to higher sales, and the profit impact of a favorable product mix in contract uniform manufacturing, were offset by the lack of parachute product business and lower research balloon profits. The fiscal 2007 gross profit as a percentage of net sales fell 6.5 percentage points, decreasing to 10.4%, because of under-utilized plant capacity. Current year selling expenses of $822,000 decreased $88,000, or 10%, as cost controls were put into place at the beginning of the fiscal year. Fiscal 2007 fourth quarter operating income rebounded for the first time during the year, with $638,000 of operating income in contrast to a fourth quarter loss of $29,000 incurred one year earlier. Favorable profit comparisons were generated in the research balloon, commercial inflatable products, and contract uniform product lines for the quarter ended January 31, 2007. These fourth quarter increases were tempered by parachute start-up losses incurred on the segment’s new military parachute contract, which will begin deliveries in fiscal 2008.
24
Fiscal 2006 versus fiscal 2005
Aerostar net sales of $18.0 million in fiscal 2006 were down from the fiscal 2005’s $21.7 million, with the majority of the decrease due to lower military parachute shipments. New government contracts for parachute products were not obtained in fiscal 2006. Partially offsetting the decline in parachute sales and lower contract uniform deliveries was an increase in research balloon revenue. For the full year, operating income of $2.1 million was $1.5 million behind the prior fiscal year. An increase in research balloon profits due to higher sales was offset by lower parachute product and uniform contract profits. As a percentage of sales, gross profits decreased from 21.1% for fiscal 2005 to 16.9% in fiscal 2006. Selling expenses of $910,000 were down slightly in fiscal 2006, decreasing $40,000 from the prior year.
Prospects
Management expects fiscal 2008 to be a turnaround year for Aerostar, with sales and profits benefiting from the $6.7 million military parachute contract received in fiscal 2007. Deliveries on the new contract are anticipated to begin and be completed during fiscal 2008. Start-up costs under the contract could negatively affect margins early in the year. Revenue growth will also depend on obtaining additional contract uniform and research balloon business. Aerostar sales in the upcoming fiscal year are targeted to increase approximately 50%, due mainly to the increase in parachute revenues. Management believes Aerostar operating margin can reach the 15% range for the full year.
EXPENSES, INCOME TAXES AND OTHER
Corporate expenses of $6.8 million decreased $373,000, or 5.2%, from fiscal 2006. Corporate giving, which was at a high level in fiscal 2006, was reduced in the current fiscal year, and management incentive costs were also lower. Corporate expenses, as a percentage of net sales, have steadily decreased, ranging from 3.1%, 3.5%, and 3.9% for fiscal years 2007, 2006, and 2005, respectively. Fiscal 2008 corporate expenses are expected to rise approximately 10% due primarily to higher compensation expense.
Raven had no outstanding debt as of January 31, 2007. Fiscal 2007 interest expense of $2,000 improved from $35,000 reported in fiscal 2006. Seasonal short-term borrowings of $4.5 million were required during the first quarter of fiscal 2006, but were repaid by April 30, 2005. No short-term borrowings were made in fiscal 2007. Other income of $535,000 in fiscal 2007 grew from $245,000 in fiscal 2006. The main component of other income is interest income, which rose in fiscal 2007 due to higher cash balances and an increase in interest rates received on the company’s cash and short-term investments. Fiscal 2007’s effective income tax rate of 34.5% decreased from fiscal 2006’s effective rate of 35.3% and was lower than the fiscal 2005 rate of 36.0%. This reflected the impact of the U.S. federal tax deduction for income attributable to manufacturing activities, and an increase in the company’s research and development tax credit. The effective tax rate in fiscal 2008 is expected to remain consistent with fiscal 2007, depending on the effects of adopting FASB Interpretation 48,Accounting for Uncertain Tax Positions,or a change in current tax law.

RAVEN2007ANNUALREPORT
25
FINANCIAL REVIEW AND ANALYSIS(continued)
LIQUIDITY AND CAPITAL RESOURCES
The following table summarizes cash provided by (used in) the company’s business activities for the past three fiscal years:
| | | | | | | | | | | | | |
| Dollars in thousands | | 2007 | | 2006 | | 2005 |
| | | |
| Operating activities | | $ | 26,313 | | | $ | 21,189 | | | $ | 18,871 | |
| Investing activities | | | (18,664 | ) | | | (11,435 | ) | | | (7,631 | ) |
| Financing activities | | | (10,277 | ) | | | (6,946 | ) | | | (19,063 | ) |
OPERATING ACTIVITIES AND CASH POSITION
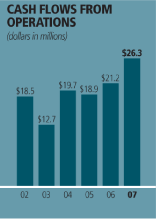
Raven’s cash flow from operations of $66.4 million over the past three years compared with net income of $67.6 million over the same period. Net cash provided by operating activities in fiscal 2007 totaled $26.3 million, a $5.1 million increase compared with operating cash inflows in fiscal 2006. As growth slowed this past fiscal year, the amount of incremental cash required to support working capital requirements decreased. Cash consumed to finance accounts receivable and inventory balances for the year ended January 31, 2007, was $2.4 million versus cash used of $8.2 million during fiscal 2006. Partially offsetting this favorable effect on the current year’s cash provided by operating activities was additional cash consumed to settle the prior year’s accrued liability balances. Accrued liabilities at the end of fiscal 2007 decreased $1.6 million from one year earlier, mainly because of lower accrued employee incentive and profit sharing balances. Net cash provided by operating activities in fiscal 2006 totaled $21.2 million, a $2.3 million increase from operating cash inflows of $18.9 million in fiscal 2005. The cash impact of the company’s strong fiscal 2006 earnings performance and higher accrued liabilities at fiscal 2006 year-end were tempered by higher accounts receivable and inventory levels and a lower accounts payable balance.
Cash, cash equivalents and short-term investments totaled $10.8 million at January 31, 2007, down $626,000 from one year earlier. Raven’s strong operating cash inflows were consumed in the current year by a high level of capital investment in Engineered Films for additional manufacturing equipment and facilities, and an increase in equity returned to the shareholders in the form of cash dividends and stock repurchases. Management expects that cash and short-term investments, combined with continued positive operating cash flows, will continue to be enough to fund day-to-day operations. The company utilized its short-term credit facility to fund the Flow Controls’ Canadian acquisition in February 2005 and to help with short-term seasonal cash needs during the first quarter of fiscal 2006. All of these short-term borrowings were repaid by April 30, 2005.
INVESTING ACTIVITIES
Net cash used in investing activities in fiscal 2007 totaled $18.7 million versus $11.4 million in fiscal 2006. Fiscal 2007 capital expenditures of $16.5 million rose $6.2 million from fiscal 2006, with $13.3 million being invested in Engineered Films for additional manufacturing capacity and facilities. Fiscal 2007 investing activities also included placing an additional $2.0 million of cash into short-term investments to guarantee a certain rate of return. Net cash used in investing activities in fiscal 2006 totaled $11.4 million, up from $7.6 million in fiscal 2005. Fiscal 2006 capital expenditures of $10.4 million rose $2.8 million from fiscal 2005 and included $7.4 million of investment in Engineered Films. In February 2005, Raven acquired substantially all of the assets of Montgomery Industries, Inc. for $2.7 million in cash. A $650,000 investment in an unconsolidated real estate affiliate was sold in fiscal 2006, resulting in no material gain or loss on the sale, and $1.0 million of short-term investments were liquidated.
26
FINANCING ACTIVITIES
Net cash used in financing activities in fiscal 2007 of $10.3 million increased $3.3 million from the $6.9 million used in fiscal 2006. The company’s main financing activities continue to be the payment of dividends and the repurchase of company stock. Raven increased its quarterly dividend on a per-share basis for the 20th consecutive year. Fiscal 2007 quarterly dividend payments of 9 cents per share increased 28.6% from the prior year. Treasury shares purchased during fiscal 2007 totaled $4.2 million, with 146,247 shares bought at an average share price of $28.72. Net cash used in financing activities in fiscal 2006 of $6.9 million decreased $12.1 million from the $19.1 million used in fiscal 2005. The decline was due primarily to the $11.3 million special dividend paid in fiscal 2005. In fiscal 2006, 67,800 treasury share purchases were made at an average price of $24.91, while 186,500 treasury shares were purchased in fiscal 2005 at an average price of $18.87.
No short-term borrowings were required during fiscal 2007. Short-term borrowings on the company’s line of credit facility totaled $4.5 million in fiscal 2006. These borrowings were used for seasonal cash needs and to fund the Montgomery Industries, Inc. acquisition, and were repaid by April 30, 2005.
Contractual obligations consist of non-cancelable operating leases for facilities and equipment, and unconditional purchase obligations primarily for raw materials. Letters of credit have been issued for workers’ compensation insurance obligations that remain from the period of self-insurance (February 1, 2001 and prior). In the event the bank chooses not to renew the company’s line of credit, the letters of credit would cease and alternative methods of support for the insurance obligations would be necessary, would be more expensive, and require additional cash outlays. Management believes the chances of this are remote. A summary of the obligations and commitments at January 31, 2007, and for the next five years is shown below.
| | | | | | | | | | | | | | | | | |
| | | | | | | | | | | FY 2009- | | FY 2011- |
| Dollars in thousands | | Total | | FY 2008 | | FY 2010 | | FY 2012 |
| |
| Contractual Obligations: | | | | | | | | | | | | | | | | |
Line of Credit(a) | | $ | — | | | $ | — | | | $ | — | | | $ | — | |
| Operating leases | | | 305 | | | | 235 | | | | 70 | | | | — | |
| Unconditional purchase obligations | | | 26,329 | | | | 26,329 | | | | — | | | | — | |
| | | |
| | | | 26,634 | | | | 26,564 | | | | 70 | | | | — | |
| | | | | | | | | | | | | | | | | |
| Other Commercial Commitments: | | | | | | | | | | | | | | | | |
| Letters of credit | | | 1,356 | | | | 1,356 | | | | — | | | | — | |
| | | |
| | | $ | 27,990 | | | $ | 27,920 | | | $ | 70 | | | $ | — | |
| | | |
| | |
| (a) | | $8.0 million line bears interest at 8.00% as of January 31, 2007, and expires August 2007. |
| |
| | | The line of credit is reduced by outstanding letters of credit. |
CAPITAL REQUIREMENTS
Raven maintains an excellent financial condition and capacity for growth. Management continues to look for opportunities to expand its core businesses through acquisitions or internal growth. The company has the capacity to assume additional financing and will do so if the appropriate strategic opportunity presents itself. Capital expenditures for fiscal 2008 are expected to be in the $6 million range in contrast to the $16.5 million spent in fiscal 2007. The company intends to return approximately 30% of its earnings to shareholders in the form of dividends. Stock repurchases are anticipated to continue as a means to return additional cash to shareholders and increase balance sheet leverage. Cash generated from operations and the availability of cash under existing credit facilities should be sufficient to fund these initiatives.
RAVEN2007ANNUALREPORT
27
FINANCIAL REVIEW AND ANALYSIS(continued)
CRITICAL ACCOUNTING POLICIES AND NEW ACCOUNTING STANDARDS
CRITICAL ACCOUNTING POLICIES
Critical accounting policies are those that require the application of judgment when valuing assets and liabilities on the company’s balance sheet. These policies are discussed below, because a fluctuation in actual results versus expected results could materially affect Raven’s operating results, and because the policies require significant judgments and estimates to be made. Accounting related to these policies is initially based on best estimates at the time of original entry in the accounting records. Adjustments are periodically recorded when the company’s actual experience differs from the expected experience underlying the estimates. These adjustments could be material if experience were to change significantly in a short period of time. Raven uses derivative financial instruments to manage the economic impact of fluctuations in currency exchange rates on transactions that are denominated in currency other than its functional currency, which is the U.S. dollar. Using these financial instruments has no material effect on the company’s financial condition, results of operations, or cash flows. Raven does not enter into derivatives for trading or speculative purposes.
Inventories
Raven’s most significant accounting judgment is determining inventory value at the lower of cost or market. The company estimates inventory valuation on a quarterly basis. Typically, when a product reaches the end of its life cycle, inventory value declines slowly or the product has alternative uses. Management uses its manufacturing resources planning data to help determine if inventory is slow-moving or has become obsolete due to an engineering change. The company closely reviews items that have balances in excess of the prior year’s requirements or that have been dropped from production requirements. Despite these reviews, technological or strategic decisions, made by management or the company’s customers, may result in unexpected excess material. In Electronic Systems, the company typically has recourse to customers for obsolete or excess material. When Electronic Systems customers authorize inventory purchases, especially with long lead-time items, they are required to take delivery of unused material or compensate the company accordingly. In every operating unit of the company, management must manage obsolete inventory risk. The accounting judgment ultimately made is an evaluation of the success that management will have in controlling inventory risk and mitigating the impact of obsolescence when it does occur.
Warranty
Estimated warranty liability costs are based on historical warranty costs and average time elapsed between purchases and returns for each business segment. Warranty issues that are unusual in nature are accrued for individually.
Allowance for Doubtful Accounts
Determining the level of the allowance for doubtful accounts requires management’s best estimate of the amount of probable credit losses based on historical writeoff experience by segment, and an estimate of the collectibility of any known problem accounts. Factors that are considered beyond historical experience include the length of time the receivables are outstanding, the current business climate, and the customer’s current financial condition.
Revenue Recognition
The company recognizes and records revenue when shipment has occurred because there is persuasive evidence of an arrangement, the sales price is determinable, collectibility is reasonably assured, and sales terms are FOB shipping point. Estimated returns, sales allowances or warranty charges are recognized upon shipment of a product. The company sells directly to customers or distributors that incur the expense and commitment for any post-sale obligations beyond stated warranty terms.
28
Self-insurance Reserves
Raven purchases insurance with deductibles for product liability; general insurance, including aviation product liability; and worker’s compensation. Third-party insurance is carried for what is believed to be the major portion of potential exposure. The company has established accruals for potential uninsured claims, including estimated costs and legal fees. Management considers these accruals adequate, although a substantial change in the number and/or severity of claims would result in materially different amounts.
Goodwill and Long-lived Assets
Management periodically assesses goodwill and other long-lived assets for impairment, or more frequently if events or changes in circumstances indicate that an asset might be impaired, using fair value measurement techniques. For goodwill, the company performs impairment reviews annually by reporting units, which are the company’s reportable segments. The one exception is Aerostar’s high-altitude research balloon operation, which is evaluated independently from Aerostar’s other operations. Estimates of fair value are primarily determined using discounted cash flows, market comparisons and recent transactions. These valuation methodologies use significant estimates and assumptions, which include projected future cash flows, including timing and the risks inherent in future cash flows, perpetual growth rates, and determination of appropriate market comparables.
The company periodically reviews and evaluates the depreciable lives of its long-lived assets. During fiscal 2007, management reviewed the depreciable life of its extrusion equipment in Engineered Films. Management concluded that new extrusion equipment should be depreciated over 12 years to reflect the enhanced technology, flexibility, and production capabilities of this equipment. Extrusion equipment placed in service prior to fiscal 2007 will continue to be depreciated over 7 years.
NEW ACCOUNTING STANDARDS
In September 2006, the Financial Accounting Standards Board (FASB) issued SFAS 157,Fair Value Measurement.The standard provides guidance for using fair value to measure assets and liabilities. SFAS 157 clarifies the principle that fair value should be based on the assumptions market participants would use when pricing an asset or liability and establishes a fair value hierarchy that prioritizes the information used to develop those assumptions. Under the standard, fair value measurements would be separately disclosed by level within the fair value hierarchy. The statement is effective as of the beginning of the company’s 2008 fiscal year. The company does not expect the implementation of SFAS 157 to have a material impact on its consolidated results of operations, financial condition or cash flows.
In October 2006, the FASB issued FASB Interpretation No. 48,Accounting for Uncertainty in Income Taxes(FIN 48). FIN 48 is an interpretation of FASB Statement No. 109,Accounting for Income Taxes, and it seeks to reduce the diversity in practice associated with certain aspects of measurement and recognition in accounting for income taxes. In addition, FIN 48 requires expanded disclosure with respect to the uncertainty in income taxes and is effective as of the beginning of the company’s 2008 fiscal year. The company does not expect the adoption of FIN 48 to have a significant impact on its consolidated results of operations, financial condition or cash flows.
RAVEN2007ANNUALREPORT
29
MONTHLY CLOSING STOCK PRICE AND VOLUME
QUARTERLY INFORMATION (Unaudited)
| | | | | | | | | | | | | | | | | | | | | | | | | | | | | | | | | | | | | | | | | |
| | | | | | | | | | | | | | | | | | | | | | | Net Income | | | Common Stock | | | Cash | |
| Dollars in thousands | | Net | | | Gross | | | Operating | | | Pretax | | | Net | | | Per Share(a) | | | Market Price | | | Dividends | |
| except per-share data | | Sales | | | Profit | | | Income | | | Income | | | Income | | | Basic | | | Diluted | | | High | | | Low | | | Per Share | |
| |
FISCAL 2007 | | | | | | | | | | | | | | | | | | | | | | | | | | | | | | | | | | | | | | | | |
First Quarter | | $ | 58,465 | | | $ | 15,891 | | | $ | 11,477 | | | $ | 11,615 | | | $ | 7,502 | | | $ | 0.41 | | | $ | 0.41 | | | $ | 42.16 | | | $ | 31.22 | | | $ | 0.090 | |
Second Quarter | | | 50,381 | | | | 12,183 | | | | 7,872 | | | | 7,937 | | | | 5,127 | | | | 0.28 | | | | 0.28 | | | | 42.70 | | | | 25.89 | | | | 0.090 | |
Third Quarter | | | 57,435 | | | | 14,480 | | | | 10,540 | | | | 10,713 | | | | 6,968 | | | | 0.39 | | | | 0.38 | | | | 32.64 | | | | 25.89 | | | | 0.090 | |
Fourth Quarter | | | 51,248 | | | | 12,328 | | | | 8,413 | | | | 8,570 | | | | 5,844 | | | | 0.32 | | | | 0.32 | | | | 35.35 | | | | 25.46 | | | | 0.090 | |
| | | | | | | | | | | | | | |
Total Year | | $ | 217,529 | | | $ | 54,882 | | | $ | 38,302 | | | $ | 38,835 | | | $ | 25,441 | | | $ | 1.41 | | | $ | 1.39 | | | $ | 42.70 | | | $ | 25.46 | | | $ | 0.360 | |
| | | | | | | | | | | | | | |
| | | | | | | | | | | | | | | | | | | | | | | | | | | | | | | | | | | | | | | | | |
| FISCAL 2006 | | | | | | | | | | | | | | | | | | | | | | | | | | | | | | | | | | | | | | | | |
| First Quarter | | $ | 50,704 | | | $ | 15,161 | | | $ | 11,136 | | | $ | 11,098 | | | $ | 7,157 | | | $ | 0.40 | | | $ | 0.39 | | | $ | 22.28 | | | $ | 16.54 | | | $ | 0.070 | |
| Second Quarter | | | 45,304 | | | | 10,882 | | | | 7,299 | | | | 7,391 | | | | 4,774 | | | | 0.26 | | | | 0.26 | | | | 27.78 | | | | 18.68 | | | | 0.070 | |
| Third Quarter | | | 54,135 | | | | 14,213 | | | | 10,568 | | | | 10,635 | | | | 6,869 | | | | 0.38 | | | | 0.37 | | | | 31.99 | | | | 21.75 | | | | 0.070 | |
| Fourth Quarter | | | 54,385 | | | | 12,975 | | | | 8,281 | | | | 8,370 | | | | 5,462 | | | | 0.30 | | | | 0.30 | | | | 33.15 | | | | 26.75 | | | | 0.070 | |
| | | | | | | | | | | | | | |
| Total Year | | $ | 204,528 | | | $ | 53,231 | | | $ | 37,284 | | | $ | 37,494 | | | $ | 24,262 | | | $ | 1.34 | | | $ | 1.32 | | | $ | 33.15 | | | $ | 16.54 | | | $ | 0.280 | |
| | | | | | | | | | | | | | |
| | | | | | | | | | | | | | | | | | | | | | | | | | | | | | | | | | | | | | | | | |
| FISCAL 2005 | | | | | | | | | | | | | | | | | | | | | | | | | | | | | | | | | | | | | | | | |
| First Quarter | | $ | 38,408 | | | $ | 11,678 | | | $ | 8,451 | | | $ | 8,475 | | | $ | 5,415 | | | $ | 0.30 | | | $ | 0.29 | | | $ | 17.17 | | | $ | 13.65 | | | $ | 0.055 | |
| Second Quarter | | | 37,077 | | | | 8,759 | | | | 5,651 | | | | 5,677 | | | | 3,642 | | | | 0.20 | | | | 0.20 | | | | 19.43 | | | | 13.08 | | | | 0.680 | (b) |
| Third Quarter | | | 48,597 | | | | 12,962 | | | | 8,099 | (c) | | | 8,115 | (c) | | | 5,194 | (c) | | | 0.29 | | | | 0.28 | | | | 23.89 | | | | 17.41 | | | | 0.055 | |
| Fourth Quarter | | | 44,004 | | | | 9,801 | | | | 5,661 | | | | 5,688 | | | | 3,640 | | | | 0.20 | | | | 0.20 | | | | 26.94 | | | | 17.05 | | | | 0.055 | |
| | | | | | | | | | | | | | |
| Total Year | | $ | 168,086 | | | $ | 43,200 | | | $ | 27,862 | | | $ | 27,955 | | | $ | 17,891 | | | $ | 0.99 | | | $ | 0.97 | | | $ | 26.94 | | | $ | 13.08 | | | $ | 0.845 | |
| | | | | | | | | | | | | | |
| | |
| (a) | | Net income per share is computed discretely by quarter and may not add to the full year. |
| |
| (b) | | A special dividend of $.625 per share was paid during the second quarter of fiscal 2005. |
| |
| (c) | | Includes a pretax $1.3 million ($845,000 net of tax) writeoff of assets related to the Fluent Systems product line (see Note 5). |
30
MANAGEMENT’S REPORT ON INTERNAL CONTROL OVER FINANCIAL REPORTING
Our management is responsible for establishing and maintaining effective internal control over financial reporting as defined in Rule 13a-15(f) of the Securities Exchange Act of 1934. Our internal control over financial reporting is a process designed to provide reasonable assurance regarding the reliability of financial reporting and the preparation of financial statements for external purposes in accordance with generally accepted accounting principles. Our internal control over financial reporting includes those policies and procedures that (i) pertain to the maintenance of records that, in reasonable detail, accurately and fairly reflect the transactions and dispositions of our assets; (ii) provide reasonable assurance that transactions are recorded as necessary to permit preparation of financial statements in accordance with generally accepted accounting principles, and that our receipts and expenditures are being made only in accordance with authorizations of our management and directors; and (iii) provide reasonable assurance regarding prevention or timely detection of unauthorized acquisition, use, or disposition of our assets that could have a material effect on the financial statements.
Because of its inherent limitations, internal control over financial reporting may not prevent or detect misstatements. Also, projections of any evaluation of effectiveness to future periods are subject to the risk that controls may become inadequate because of changes in conditions, or that the degree of compliance with the policies or procedures may deteriorate.
Management has assessed our internal control over financial reporting in relation to criteria described inInternal Control – Integrated Framework,issued by the Committee of Sponsoring Organizations of the Treadway Commission. Based on this assessment using those criteria, we concluded that, as of January 31, 2007, our internal control over financial reporting was effective.
Our management’s assessment of the effectiveness of our internal control over financial reporting as of January 31, 2007, has been audited by PricewaterhouseCoopers LLP, an independent registered public accounting firm, as stated in their report, which appears on page 43 of this Annual Report.
| | | |
| |  |
| Ronald M. Moquist | | Thomas Iacarella |
| President & Chief Executive Officer | | Vice President & Chief Financial Officer |
| | | |
| March 22, 2007 | | |
RAVEN2007ANNUALREPORT
31
CONSOLIDATED BALANCE SHEETS
| | | | | | | | | | | | | |
| | | As of January 31 |
| Dollars in thousands, except share data | | 2007 | | 2006 | | 2005 |
| | | |
ASSETS | | | | | | | | | | | | |
| Current assets | | | | | | | | | | | | |
| Cash and cash equivalents | | $ | 6,783 | | | $ | 9,409 | | | $ | 6,619 | |
| Short-term investments | | | 4,000 | | | | 2,000 | | | | 3,000 | |
| Accounts receivable, net | | | 31,336 | | | | 29,290 | | | | 25,370 | |
| Inventories, net | | | 28,071 | | | | 27,819 | | | | 23,315 | |
| Deferred income taxes | | | 1,761 | | | | 1,746 | | | | 1,465 | |
| Prepaid expenses and other current assets | | | 1,268 | | | | 1,081 | | | | 1,823 | |
| | | |
| Total current assets | | | 73,219 | | | | 71,345 | | | | 61,592 | |
| Property, plant and equipment, net | | | 36,264 | | | | 25,602 | | | | 19,964 | |
| Goodwill | | | 6,604 | | | | 6,401 | | | | 5,933 | |
| Other assets, net | | | 3,677 | | | | 2,809 | | | | 1,020 | |
| | | |
Total assets | | $ | 119,764 | | | $ | 106,157 | | | $ | 88,509 | |
| | | |
| | | | | | | | | | | | | |
LIABILITIES AND SHAREHOLDERS’ EQUITY | | | | | | | | | | | | |
| Current liabilities | | | | | | | | | | | | |
| Accounts payable | | $ | 6,093 | | | $ | 8,179 | | | $ | 10,322 | |
| Accrued liabilities | | | 9,579 | | | | 11,154 | | | | 9,773 | |
| Customer advances | | | 792 | | | | 717 | | | | 855 | |
| | | |
| Total current liabilities | | | 16,464 | | | | 20,050 | | | | 20,950 | |
| | | | | | | | | | | | | |
| Other liabilities, primarily compensation and benefits | | | 5,032 | | | | 1,718 | | | | 1,477 | |
| | | | | | | | | | | | | |
| Commitments and contingencies | | | | | | | | | | | | |
| | | | | | | | | | | | | |
| Shareholders’ equity | | | 98,268 | | | | 84,389 | | | | 66,082 | |
| Common shares, par value $1.00 per share Authorized – 100,000,000 Outstanding – 2007: 18,039,223; 2006: 18,072,369; 2005: 17,999,468 | | | | | | | | | | | | |
| | | |
Total liabilities and shareholders’ equity | | $ | 119,764 | | | $ | 106,157 | | | $ | 88,509 | |
| | | |
The accompanying notes are an integral part of the consolidated financial statements.
32
CONSOLIDATED STATEMENTS OF INCOME
| | | | | | | | | | | | | |
| | | For the years ended January 31 |
| Dollars in thousands, except per-share data | | 2007 | | 2006 | | 2005 |
| | | |
| Net sales | | $ | 217,529 | | | $ | 204,528 | | | $ | 168,086 | |
| Cost of goods sold | | | 162,647 | | | | 151,297 | | | | 124,886 | |
| | | |
| �� | | | | | | | | | | | | |
| Gross profit | | | 54,882 | | | | 53,231 | | | | 43,200 | |
| | | | | | | | | | | | | |
| Selling, general and administrative expenses | | | 16,580 | | | | 15,868 | | | | 14,056 | |
| Loss on disposition of businesses and assets, net | | | — | | | | 79 | | | | 1,282 | |
| | | |
| | | | | | | | | | | | | |
| Operating income | | | 38,302 | | | | 37,284 | | | | 27,862 | |
| | | | | | | | | | | | | |
| Interest expense | | | 2 | | | | 35 | | | | 35 | |
| Interest income and other, net | | | (535 | ) | | | (245 | ) | | | (128 | ) |
| | | |
| Income before income taxes | | | 38,835 | | | | 37,494 | | | | 27,955 | |
| | | | | | | | | | | | | |
| Income taxes | | | 13,394 | | | | 13,232 | | | | 10,064 | |
| | | |
| | | | | | | | | | | | | |
| Net income | | $ | 25,441 | | | $ | 24,262 | | | $ | 17,891 | |
| | | |
| | | | | | | | | | | | | |
| Net income per common share: | | | | | | | | | | | | |
| – Basic | | $ | 1.41 | | | $ | 1.34 | | | $ | 0.99 | |
| | | |
| – Diluted | | $ | 1.39 | | | $ | 1.32 | | | $ | 0.97 | |
| | | |
The accompanying notes are an integral part of the consolidated financial statements.
RAVEN2007ANNUALREPORT
33
CONSOLIDATED STATEMENTS OF SHAREHOLDERS’ EQUITY AND COMPREHENSIVE INCOME
| | | | | | | | | | | | | | | | | | | | | | | | | | | | | |
| | | | | | | | | | | | | | | | | | | | | | | Accumulated | | |
| | | | | | | | | | | | | | | | | | | | | | | Other | | |
| | | $1 Par | | | | | | | | | | | | | | | | | | Comprehensive | | |
| | | Common | | Paid-in | | Treasury stock | | Retained | | Income | | |
| Dollars in thousands, except per-share data | | Stock | | Capital | | Shares | | Cost | | Earnings | | (Loss) | | Total |
| | | |
| | | | | | | | | | | | | | | | | | | | | | | | | | | | | |
| Balance January 31, 2004 | | $ | 15,954 | | | $ | 784 | | | | (6,933,443 | ) | | $ | (38,181 | ) | | $ | 87,914 | | | $ | — | | | $ | 66,471 | |
| | | | | | | | | | | | | | | | | | | | | | | | | | | | | |
| Net and comprehensive income | | | — | | | | — | | | | — | | | | — | | | | 17,891 | | | | — | | | | 17,891 | |
| Cash dividends ($.220 per share) | | | — | | | | — | | | | — | | | | — | | | | (3,971 | ) | | | — | | | | (3,971 | ) |
| Cash dividend – Special ($.625 per share) | | | — | | | | — | | | | — | | | | — | | | | (11,327 | ) | | | — | | | | (11,327 | ) |
| Two-for-one stock split | | | 15,954 | | | | (411 | ) | | | (6,933,443 | ) | | | — | | | | (15,543 | ) | | | — | | | | — | |
| Purchase of stock | | | — | | | | — | | | | (186,500 | ) | | | (3,519 | ) | | | — | | | | — | | | | (3,519 | ) |
| Purchase and retirement of stock | | | (40 | ) | | | (646 | ) | | | — | | | | — | | | | — | | | | — | | | | (686 | ) |
| Employees’ stock options exercised | | | 185 | | | | 327 | | | | — | | | | — | | | | — | | | | — | | | | 512 | |
| Share-based compensation | | | — | | | | 309 | | | | — | | | | — | | | | — | | | | — | | | | 309 | |
| Tax benefit from exercise of stock options | | | — | | | | 402 | | | | — | | | | — | | | | — | | | | — | | | | 402 | |
| | | |
| Balance January 31, 2005 | | | 32,053 | | | | 765 | | | | (14,053,386 | ) | | | (41,700 | ) | | | 74,964 | | | | — | | | | 66,082 | |
| | | | | | | | | | | | | | | | | | | | | | | | | | | | | |
| Net income | | | — | | | | — | | | | — | | | | — | | | | 24,262 | | | | — | | | | 24,262 | |
| Foreign currency translation | | | — | | | | — | | | | — | | | | — | | | | — | | | | 13 | | | | 13 | |
| | | | | | | | | | | | | | | | | | | | | | | | | | | | | |
| Total comprehensive income | | | | | | | | | | | | | | | | | | | | | | | | | | | 24,275 | |
| | | | | | | | | | | | | | | | | | | | | | | | | | | | | |
| Cash dividends ($.280 per share) | | | — | | | | — | | | | — | | | | — | | | | (5,056 | ) | | | — | | | | (5,056 | ) |
| Purchase of stock | | | — | | | | — | | | | (67,800 | ) | | | (1,689 | ) | | | — | | | | — | | | | (1,689 | ) |
| Purchase and retirement of stock | | | (27 | ) | | | (689 | ) | | | — | | | | — | | | | — | | | | — | | | | (716 | ) |
| Employees’ stock options exercised | | | 168 | | | | 410 | | | | — | | | | — | | | | — | | | | — | | | | 578 | |
| Share-based compensation | | | — | | | | 485 | | | | — | | | | — | | | | — | | | | — | | | | 485 | |
| Tax benefit from exercise of stock options | | | — | | | | 430 | | | | — | | | | — | | | | — | | | | — | | | | 430 | |
| | | |
| Balance January 31, 2006 | | | 32,194 | | | | 1,401 | | | | (14,121,186 | ) | | | (43,389 | ) | | | 94,170 | | | | 13 | | | | 84,389 | |
| | | | | | | | | | | | | | | | | | | | | | | | | | | | | |
| Net income | | | — | | | | — | | | | — | | | | — | | | | 25,441 | | | | — | | | | 25,441 | |
| Foreign currency translation | | | — | | | | — | | | | — | | | | — | | | | — | | | | (21 | ) | | | (21 | ) |
| | | | | | | | | | | | | | | | | | | | | | | | | | | | | |
| Total comprehensive income | | | | | | | | | | | | | | | | | | | | | | | | | | | 25,420 | |
| | | | | | | | | | | | | | | | | | | | | | | | | | | | | |
| Adoption of SFAS No. 158, net of tax | | | — | | | | — | | | | — | | | | — | | | | — | | | | (1,885 | ) | | | (1,885 | ) |
| Dividends ($.360 per share) | | | — | | | | 1 | | | | — | | | | — | | | | (6,508 | ) | | | — | | | | (6,507 | ) |
| Purchase of stock | | | — | | | | — | | | | (146,247 | ) | | | (4,201 | ) | | | — | | | | — | | | | (4,201 | ) |
| Purchase and retirement of stock | | | (28 | ) | | | (854 | ) | | | — | | | | — | | | | — | | | | — | | | | (882 | ) |
| Employees’ stock options exercised | | | 141 | | | | 718 | | | | — | | | | — | | | | — | | | | — | | | | 859 | |
| Share-based compensation | | | — | | | | 605 | | | | — | | | | — | | | | — | | | | — | | | | 605 | |
| Tax benefit from exercise of stock options | | | — | | | | 470 | | | | — | | | | — | | | | — | | | | — | | | | 470 | |
| | | |
Balance January 31, 2007 | | $ | 32,307 | | | $ | 2,341 | | | | (14,267,433 | ) | | $ | (47,590 | ) | | $ | 113,103 | | | $ | (1,893 | ) | | $ | 98,268 | |
| | | |
The accompanying notes are an integral part of the consolidated financial statements.
34
CONSOLIDATED STATEMENTS OF CASH FLOWS
| | | | | | | | | | | | | |
| | | For the years ended January 31 |
| Dollars in thousands | | 2007 | | 2006 | | 2005 |
| | | |
| Cash flows from operating activities: | | | | | | | | | | | | |
| Net income | | $ | 25,441 | | | $ | 24,262 | | | $ | 17,891 | |
| Adjustments to reconcile net income to net cash provided by operating activities: | | | | | | | | | | | | |
| Depreciation | | | 5,445 | | | | 4,684 | | | | 3,410 | |
| Amortization of intangible assets | | | 440 | | | | 467 | | | | 431 | |
| Provision for losses on accounts receivable, net of recoveries | | | 40 | | | | 78 | | | | 34 | |
| Loss on disposition of businesses and assets | | | — | | | | 79 | | | | 1,282 | |
| Deferred income taxes | | | (293 | ) | | | (809 | ) | | | (31 | ) |
| Share-based compensation expense | | | 605 | | | | 485 | | | | 309 | |
| Change in operating assets and liabilities, net of effects from acquisition and disposition of businesses and assets | | | (5,380 | ) | | | (8,086 | ) | | | (4,669 | ) |
| Other operating activities, net | | | 15 | | | | 29 | | | | 214 | |
| | | |
| Net cash provided by operating activities | | | 26,313 | | | | 21,189 | | | | 18,871 | |
| | | |
| | | | | | | | | | | | | |
| Cash flows from investing activities: | | | | | | | | | | | | |
| Capital expenditures | | | (16,522 | ) | | | (10,358 | ) | | | (7,541 | ) |
| Purchase of short-term investments | | | (6,000 | ) | | | (4,500 | ) | | | (3,000 | ) |
| Sale of short-term investments | | | 4,000 | | | | 5,500 | | | | 4,000 | |
| Acquisition of businesses | | | (203 | ) | | | (2,828 | ) | | | (414 | ) |
| Sale of (investment in) unconsolidated affiliate | | | — | | | | 650 | | | | (650 | ) |
| Other investing activities, net | | | 61 | | | | 101 | | | | (26 | ) |
| | | |
| Net cash used in investing activities | | | (18,664 | ) | | | (11,435 | ) | | | (7,631 | ) |
| | | |
| | | | | | | | | | | | | |
| Cash flows from financing activities: | | | | | | | | | | | | |
| Proceeds from borrowing under line of credit | | | — | | | | 4,500 | | | | — | |
| Repayment of borrowing under line of credit | | | — | | | | (4,500 | ) | | | — | |
| Dividends paid | | | (6,507 | ) | | | (5,056 | ) | | | (15,298 | ) |
| Purchases of treasury stock | | | (4,201 | ) | | | (1,689 | ) | | | (3,519 | ) |
| Excess tax benefit on stock option exercises | | | 470 | | | | — | | | | — | |
| Other financing activities, net | | | (39 | ) | | | (201 | ) | | | (246 | ) |
| | | |
| Net cash used in financing activities | | | (10,277 | ) | | | (6,946 | ) | | | (19,063 | ) |
| | | |
| | | | | | | | | | | | | |
| Effect of exchange rate changes on cash | | | 2 | | | | (18 | ) | | | — | |
| | | |
| | | | | | | | | | | | | |
| Net (decrease) increase in cash and cash equivalents | | | (2,626 | ) | | | 2,790 | | | | (7,823 | ) |
| Cash and cash equivalents at beginning of year | | | 9,409 | | | | 6,619 | | | | 14,442 | |
| | | |
| Cash and cash equivalents at end of year | | $ | 6,783 | | | $ | 9,409 | | | $ | 6,619 | |
| | | |
The accompanying notes are an integral part of the consolidated financial statements.
RAVEN2007ANNUALREPORT
35
NOTES TO FINANCIAL STATEMENTS
Note 1. Summary of Significant Accounting Policies
BASIS OF PRESENTATION AND PRINCIPLES OF CONSOLIDATION
The consolidated financial statements include the accounts of Raven Industries, Inc. and its wholly owned subsidiaries (the company). The company is an industrial manufacturer providing a variety of products to customers within the industrial, agricultural, construction and military/aerospace markets primarily in North America. The company operates three divisions (Flow Controls, Engineered Films and Electronic Systems) in addition to three wholly owned subsidiaries: Aerostar International, Inc. (Aerostar); Raven Industries Canada, Inc. (Raven Canada); and Raven Industries GmbH (Raven GmbH). All significant intercompany balances and transactions have been eliminated in consolidation.
USE OF ESTIMATES
The preparation of the company’s financial statements in conformity with accounting principles generally accepted in the United States of America requires management to make certain estimates and assumptions that affect the reported amounts of assets and liabilities as of the date of the financial statements and the reported amounts of revenues and expenses during the reporting periods. Actual results could differ from these estimates.
FOREIGN CURRENCY
The company’s subsidiaries that operate outside the United States use their local currency as the functional currency. The functional currency is translated into U.S. dollars for balance sheet accounts using the period-end exchange rates, and average exchange rates for the statement of income. Adjustments resulting from financial statement translations are included as cumulative translation adjustments in accumulated other comprehensive income (loss) within shareholders’ equity. Foreign currency transaction gains or losses are recognized in the period incurred and are included in interest income and other, net in the Consolidated Statements of Income.
CASH AND CASH EQUIVALENTS
The company considers all highly liquid debt instruments with original maturities of three months or less to be cash equivalents. Cash and cash equivalent balances are principally concentrated in checking and sweep accounts with Wells Fargo Bank.
SHORT-TERM INVESTMENTS
The company has invested $4.0 million in certificates of deposit and U.S. Treasury Bills with rates ranging from 5.00% to 5.25%. The investments have varying maturity dates, all of which are less than 12 months from the balance sheet date.
ACCOUNTS RECEIVABLE AND ALLOWANCE FOR DOUBTFUL ACCOUNTS
Trade accounts receivable are recorded at the invoiced amount and do not bear interest. The allowance for doubtful accounts is the company’s best estimate of the amount of probable credit losses based on historical writeoff experience by segment and an estimate of the collectibility of any known problem accounts.
INVENTORY VALUATION
Inventories are stated at the lower of cost or market, with cost determined on the first-in, first-out basis. Market value encompasses consideration of all business factors including price, contract terms and usefulness.
PROPERTY, PLANT AND EQUIPMENT
Property, plant and equipment are stated at cost and are depreciated over the estimated useful lives of the assets using accelerated methods. The estimated useful lives used for computing depreciation are as follows:
| | | | | |
| Building and improvements | | 15 - 39 years |
| Manufacturing equipment by segment | | | | |
| Flow Controls | | 3 - 5 years |
| Engineered Films | | 5 - 12 years |
| Electronic Systems | | 3 - 5 years |
| Aerostar | | 3 - 5 years |
| Furniture, fixtures, office equipment and other | | 3 - 7 years |
Maintenance and repairs are charged to expense in the year incurred and renewals and betterments are capitalized. The cost and related accumulated depreciation of assets sold or disposed of are removed from the accounts, and the resulting gain or loss is reflected in operations.
INTANGIBLE ASSETS
Intangible assets, primarily comprised of technologies acquired through acquisition, are recorded at cost and are presented net of accumulated amortization. Amortization is computed on a straight-line basis over estimated useful lives ranging from 3 to 20 years. The straight-line method of amortization reflects an appropriate allocation of the cost of the intangible assets to earnings in each reporting period.
GOODWILL
The company recognizes the excess cost of an acquired entity over the net amount assigned to assets acquired and liabilities assumed as goodwill. Goodwill is tested for impairment on an annual basis during the fourth quarter, and between annual tests whenever there is an impairment indicated. Fair values are estimated based on discounted cash flows and are compared with the corresponding carrying value of the related asset.
36
LONG-LIVED ASSETS
The company periodically assesses the recoverability of long-lived and intangible assets using fair value measurement techniques, where fair value is calculated based upon anticipated future earnings and undiscounted operating cash flows. If the fair value is less than the carrying amount of the asset, an impairment loss is recognized to the extent the carrying value exceeds the fair value of the asset.
INSURANCE OBLIGATIONS
The company employs insurance policies covering workers’ compensation and general liability costs. Liabilities are accrued related to claims filed and estimates for claims incurred but not reported. To the extent these obligations will be reimbursed by insurance, the expected reimbursement is included as a component of other current assets.
CONTINGENCIES
The company is involved as a defendant in lawsuits, claims or disputes arising in the normal course of business. An estimate of the loss on these matters is charged to operations when it is probable that an asset has been impaired or a liability has been incurred, and the amount of the loss can be reasonably estimated. The settlement of such claims cannot be determined at this time; however, management believes that any liability resulting from these claims will be substantially mitigated by insurance coverage. Accordingly, management does not believe that the ultimate outcome of these matters will be significant to its results of operations, financial position or cash flows.
REVENUE RECOGNITION
The company recognizes revenue upon shipment of products. The company sells directly to customers or distributors who incur the expense and commitment for any post-sale obligations beyond stated warranty terms. Estimated returns, sales allowances or warranty charges are recognized upon shipment of a product. Shipping and handling costs are classified as a component of cost of goods sold.
WARRANTIES
Accruals necessary for product warranties are estimated based upon historical warranty costs and average time elapsed between purchases and returns for each division. Additional accruals are made for any significant, discrete warranty issues.
RESEARCH AND DEVELOPMENT
Research and development expenditures of $2.6 million in fiscal 2007, $2.5 million in fiscal 2006, and $2.0 million in fiscal 2005 were charged to cost of goods sold in the year incurred. Expenditures are principally composed of labor and material costs.
SHARE-BASED COMPENSATION
In fiscal 2003, the company began recording compensation expense related to its share-based compensation plans using the fair value method permitted by SFAS No. 123,Accounting for Stock-Based Compensation. On February 1,2006, the company adopted SFAS No. 123(R),Share-Based Payment. SFAS No. 123(R) requires that the cash retained as a result of the tax deductibility of employee share-based awards be presented as a component of cash flows from financing activities in the consolidated statement of cash flows. In prior periods, the company reported these amounts as a component of cash flows from operating activities. The adoption of SFAS No. 123(R) has had no other effect on consolidated results of operations, financial condition, or cash flows.
INCOME TAXES
Deferred income taxes reflect temporary differences between assets and liabilities reported on the company’s balance sheet and their tax bases. These differences are measured using enacted tax laws and statutory tax rates applicable to the periods when the temporary differences will affect taxable income. Deferred tax assets are reduced by a valuation allowance to reflect realizable value, when necessary. Judgmental reserves are maintained for income tax audits and other tax issues.
NEW ACCOUNTING STANDARDS
In September 2006, the Financial Accounting Standards Board (FASB) issued SFAS 157,Fair Value Measurement.The standard provides guidance for using fair value to measure assets and liabilities. SFAS 157 clarifies the principle that fair value should be based on the assumptions market participants would use when pricing an asset or liability and establishes a fair value hierarchy that prioritizes the information used to develop those assumptions. Under the standard, fair value measurements would be separately disclosed by level within the fair value hierarchy. The statement is effective as of the beginning of the company’s 2008 fiscal year. The company does not expect the implementation of SFAS 157 to have a material impact on its consolidated results of operations, financial condition or cash flows.
In October 2006, the FASB issued FASB Interpretation No. 48,Accounting for Uncertainty in Income Taxes (FIN 48). FIN 48 is an interpretation of FASB Statement No. 109,Accounting for Income Taxes, and it seeks to reduce the diversity in practice associated with certain aspects of measurement and recognition in accounting for income taxes. In addition, FIN 48 requires expanded disclosure with respect to the uncertainty in income taxes and is effective as of the beginning of the company’s 2008 fiscal year. The company does not expect the adoption of FIN 48 to have a significant impact on its consolidated results of operations, financial condition or cash flows.
RAVEN2007ANNUALREPORT
37
NOTES TO FINANCIAL STATEMENTS(continued)
Note 2. Selected Balance Sheet Information
Following are the components of selected balance sheet items:
| | | | | | | | | | | | | |
| | | As of January 31 |
| Dollars in thousands | | 2007 | | 2006 | | 2005 |
| | | |
| Accounts receivable, net: | | | | | | | | | | | | |
| Trade accounts | | $ | 31,594 | | | $ | 29,547 | | | $ | 25,635 | |
| Allowance for doubtful accounts | | | (258 | ) | | | (257 | ) | | | (265 | ) |
| | | |
| | | $ | 31,336 | | | $ | 29,290 | | | $ | 25,370 | |
| | | |
| | | | | | | | | | | | | |
| Inventories, net: | | | | | | | | | | | | |
| Finished goods | | $ | 3,750 | | | $ | 3,504 | | | $ | 3,538 | |
| In process | | | 2,612 | | | | 3,652 | | | | 2,820 | |
| Materials | | | 21,709 | | | | 20,663 | | | | 16,957 | |
| | | |
| | | $ | 28,071 | | | $ | 27,819 | | | $ | 23,315 | |
| | | |
| | | | | | | | | | | | | |
| Property, plant and equipment, net: | | | | | | | | | | | | |
| Land | | $ | 1,227 | | | $ | 1,084 | | | $ | 1,084 | |
| Buildings and improvements | | | 21,494 | | | | 16,662 | | | | 15,184 | |
| Machinery and equipment | | | 52,552 | | | | 43,256 | | | | 36,486 | |
| Accumulated depreciation | | | (39,009 | ) | | | (35,400 | ) | | | (32,790 | ) |
| | | |
| | | $ | 36,264 | | | $ | 25,602 | | | $ | 19,964 | |
| | | |
| | | | | | | | | | | | | |
| Other assets, net: | | | | | | | | | | | | |
| Amortizable assets: | | | | | | | | | | | | |
| Purchased technology | | $ | 3,380 | | | $ | 3,380 | | | $ | 1,080 | |
| Other intangibles | | | 1,305 | | | | 1,265 | | | | 946 | |
| Accumulated amortization | | | (2,729 | ) | | | (2,300 | ) | | | (1,831 | ) |
| | | |
| | | | 1,956 | | | | 2,345 | | | | 195 | |
| | | | | | | | | | | | | |
| Investment in unconsolidated affiliate | | | — | | | | — | | | | 650 | |
| Deferred income taxes | | | 1,607 | | | | 318 | | | | — | |
| Other, net | | | 114 | | | | 146 | | | | 175 | |
| | | |
| | | $ | 3,677 | | | $ | 2,809 | | | $ | 1,020 | |
| | | |
| | | | | | | | | | | | | |
| Accrued liabilities: | | | | | | | | | | | | |
| Salaries and benefits | | $ | 1,722 | | | $ | 2,167 | | | $ | 1,992 | |
| Vacation | | | 2,212 | | | | 2,119 | | | | 1,852 | |
| 401(k) contributions | | | 1,109 | | | | 1,049 | | | | 980 | |
| Insurance obligations | | | 1,743 | | | | 1,632 | | | | 1,541 | |
| Income taxes | | | 265 | | | | 808 | | | | 567 | |
| Profit sharing | | | 553 | | | | 1,168 | | | | 900 | |
| Warranty | | | 397 | | | | 569 | | | | 452 | |
| Other | | | 1,578 | | | | 1,642 | | | | 1,489 | |
| | | |
| | | $ | 9,579 | | | $ | 11,154 | | | $ | 9,773 | |
| | | |
Note 3. Supplemental Cash Flow Information
| | | | | | | | | | | | | |
| | | For the years ended January 31 |
| Dollars in thousands | | 2007 | | 2006 | | 2005 |
| | | |
| Changes in operating assets and liabilities, net of effects from acquisition and disposition of businesses and assets: | | | | | | | | | | | | |
| Accounts receivable | | $ | (2,097 | ) | | $ | (3,821 | ) | | $ | (6,950 | ) |
| Inventories | | | (262 | ) | | | (4,356 | ) | | | (6,704 | ) |
| Prepaid expenses and other assets | | | (284 | ) | | | (103 | ) | | | 150 | |
| Accounts payable | | | (1,770 | ) | | | (2,688 | ) | | | 6,576 | |
| Accrued and other liabilities | | | (1,045 | ) | | | 3,021 | | | | 1,777 | |
| Customer advances | | | 78 | | | | (139 | ) | | | 482 | |
| | | |
| | | $ | (5,380 | ) | | $ | (8,086 | ) | | $ | (4,669 | ) |
| | | |
| | | | | | | | | | | | | |
| Cash paid during the year for: | | | | | | | | | | | | |
| Interest | | $ | 2 | | | $ | 35 | | | $ | 77 | |
| Income taxes | | $ | 13,759 | | | $ | 12,806 | | | $ | 9,596 | |
Note 4. Montgomery Industries Acquisition
On February 17, 2005, the company acquired substantially all of the assets of Montgomery Industries, Inc., a privately held Canadian corporation, for $2.7 million in cash plus the assumption of certain liabilities and a quarterly payment of 6 percent on future sales of Montgomery products up to a maximum payment of $1.825 million. Montgomery developed and sold an automatic boom height control system under the name “Autoboom™” for agricultural sprayers designed to successfully maintain optimum boom height in uneven terrain without compromising the speed with which the sprayer can be operated. Of the purchase price, $289,000 was allocated to current assets; $82,000 was allocated to property, plant and equipment; $2.560 million was allocated to amortizable intangible assets (amortized over approximately seven years); $539,000 to current liabilities assumed; and $285,000 to goodwill, which is deductible for tax purposes.
For the years ended January 31, 2007 and 2006, the earn-out on the sales of Montgomery products was $203,000 and $183,000, respectively, which was recorded as an increase in goodwill.
The operation is a component of the Flow Controls segment. The results of operations for the acquired business have been included in the consolidated financial statements since the date of acquisition. Pro forma earnings are not presented due to the immateriality of the effect of the acquisition to the company’s consolidated operations.
Note 5. Divestitures and Other Repositioning Activities
A $79,000 pretax loss was incurred during fiscal 2006 from increased liabilities for environmental issues related to the company’s fiscal 2000 sale of its Glasstite subsidiary. At January 31, 2007, the company had an undiscounted accrual remaining of $109,000 for environmental monitoring and clean-up costs of sold operations.
In the third quarter of fiscal 2005, the Flow Controls business segment decided to abandon its Fluent Systems product line, incurring a $1.3 million pretax writeoff of inventory, equipment, intangible assets and goodwill.
38
Note 6. Goodwill and Other Intangibles
Goodwill
The changes in the carrying amount of goodwill by reporting segment are shown below:
| | | | | | | | | | | | | | | | | | | | | |
| | | Flow | | Engineered | | Electronic | | | | |
| Dollars in thousands | | Controls | | Films | | Systems | | Aerostar | | Total |
| | | |
| Balance at January 31, 2004 | | $ | 5,783 | | | $ | 96 | | | $ | 433 | | | $ | 464 | | | $ | 6,776 | |
| Adjustment | | | 5 | | | | — | | | | — | | | | — | | | | 5 | |
| Writeoff of Fluent Systems | | | (848 | ) | | | — | | | | — | | | | — | | | | (848 | ) |
| | | |
| Balance at January 31, 2005 | | | 4,940 | | | | 96 | | | | 433 | | | | 464 | | | | 5,933 | |
| Goodwill acquired during the year | | | 285 | | | | — | | | | — | | | | — | | | | 285 | |
| Acquisition earn-outs | | | 183 | | | | — | | | | — | | | | — | | | | 183 | |
| | | |
| Balance at January 31, 2006 | | | 5,408 | | | | 96 | | | | 433 | | | | 464 | | | | 6,401 | |
| Acquisition earn-outs | | | 203 | | | | — | | | | — | | | | — | | | | 203 | |
| | | |
Balance at January 31, 2007 | | $ | 5,611 | | | $ | 96 | | | $ | 433 | | | $ | 464 | | | $ | 6,604 | |
| | | |
Intangible Assets
Estimated future amortization expense based on the current carrying value of amortizable intangible assets for fiscal periods 2008 through 2012 is $391,000, $379,000, $377,000, $357,000, and $352,000, respectively.
Note 7. Employee Retirement Benefits
The company has a 401(k) plan covering substantially all employees and contributed 3% of qualified payroll. The company’s contribution expense was $935,000, $892,000, and $836,000 for fiscal 2007, 2006 and 2005, respectively.
In addition, the company provides postretirement medical and other benefits to senior executive officers and senior managers. There are no assets held for the plans and any obligations are covered through the company’s operating cash and investments. The company accounts for these benefits in accordance with SFAS No. 106,Accounting for Postretirement Benefits Other Than Pensions.At January 31, 2007, the company adopted SFAS No. 158,Employers’ Accounting for Defined Pension and Other Postretirement Plans.This statement requires the company to fully recognize the liability for its postretirement benefits through changes in accumulated other comprehensive income.
The incremental effect of applying SFAS No. 158 on the following balance sheet items is as follows:
| | | | | | | | | | | | | |
| | | Impact of SFAS No. 158 |
| Dollars in thousands | | Before | | Adjustment | | After |
| | | |
| Non-current deferred tax assets | | $ | 592 | | | $ | 1,015 | | | $ | 1,607 | |
| Total assets | | | 118,749 | | | | 1,015 | | | | 119,764 | |
| Other liabilities | | | 2,132 | | | | 2,900 | | | | 5,032 | |
| Accumulated other comprehensive income (loss) | | | (8 | ) | | | (1,885 | ) | | | (1,893 | ) |
| Total shareholders’ equity | | | 100,153 | | | | (1,885 | ) | | | 98,268 | |
The accumulated benefit obligation for these benefits is shown below:
| | | | | | | | | | | | | |
| | | For the years ended January 31 |
| Dollars in thousands | | 2007 | | 2006 | | 2005 |
| | | |
| Benefit obligation at beginning of year | | $ | 4,928 | | | $ | 2,722 | | | $ | 2,607 | |
| Service cost | | | 84 | | | | 80 | | | | 58 | |
| Interest cost | | | 278 | | | | 259 | | | | 186 | |
| Actuarial loss | | | 89 | | | | 2,014 | | | | 27 | |
| Retiree benefits paid | | | (166 | ) | | | (147 | ) | | | (156 | ) |
| | | |
| Benefit obligation at end of year | | | 5,213 | | | | 4,928 | | | | 2,722 | |
| Less: unrecognized actuarial losses | | | — | | | | (3,045 | ) | | | (1,275 | ) |
| | | |
| Ending liability balance | | $ | 5,213 | | | $ | 1,883 | | | $ | 1,447 | |
| | | |
The liability and expense reflected in the balance sheet and income statement are as follows:
| | | | | | | | | | | | | |
| | | For the years ended January 31 |
| Dollars in thousands | | 2007 | | 2006 | | 2005 |
| | | |
| Beginning liability balance | | $ | 1,883 | | | $ | 1,447 | | | $ | 1,212 | |
| Employer expense | | | 596 | | | | 583 | | | | 391 | |
| Initial effect of adopting SFAS No. 158 | | | 2,900 | | | | — | | | | — | |
| Retiree benefits paid | | | (166 | ) | | | (147 | ) | | | (156 | ) |
| | | |
| Ending liability balance | | | 5,213 | | | | 1,883 | | | | 1,447 | |
| Current portion | | | (181 | ) | | | (174 | ) | | | (180 | ) |
| | | |
| Long-term portion | | $ | 5,032 | | | $ | 1,709 | | | $ | 1,267 | |
| | | |
| Assumptions used: | | | | | | | | | | | | |
| Discount rate | | | 6.00 | % | | | 5.75 | % | | | 7.00 | % |
| Wage inflation rate | | | 4.00 | % | | | 4.00 | % | | | 4.00 | % |
The discount rate is based on matching rates of return on high-quality fixed-income investments with the timing and amount of expected benefit payments. No material fluctuations in retiree benefit payments are expected in future years.
The assumed health care cost trend rate for fiscal 2007 was 9.64% as compared to 9.39% and 7.00% assumed for fiscal 2006 and 2005. The impact of a one-percentage-point change in assumed health care rates would not be significant to the company’s income statement and would affect the ending liability balance by approximately $800,000. The rate to which the fiscal 2007 health care cost trend rate is assumed to decline to is 4.5%, which is the ultimate trend rate. The fiscal year that the rate reaches the ultimate trend rate is expected to be fiscal 2027.
RAVEN2007ANNUALREPORT
39
NOTES TO FINANCIAL STATEMENTS(continued)
Note 8. Warranties
Changes in the warranty accrual were as follows:
| | | | | | | | | | | | | |
| | | As of January 31 |
| Dollars in thousands | | 2007 | | 2006 | | 2005 |
| | | |
| Beginning balance | | $ | 569 | | | $ | 452 | | | $ | 263 | |
| Accrual for warranties | | | 1,317 | | | | 958 | | | | 932 | |
| Settlements made (in cash or in kind) | | | (1,489 | ) | | | (841 | ) | | | (743 | ) |
| | | |
| Ending balance | | $ | 397 | | | $ | 569 | | | $ | 452 | |
| | | |
Note 9. Income Taxes
The reconciliation of income tax computed at the federal statutory rate to the company’s effective income tax rate is as follows:
| | | | | | | | | | | | | |
| | | For the years ended January 31 |
| Dollars in thousands | | 2007 | | 2006 | | 2005 |
| | | |
| Tax at U.S. federal statutory rate | | | 35.0 | % | | | 35.0 | % | | | 35.0 | % |
| State and local income taxes, net of U.S. federal benefit | | | 1.1 | | | | 1.1 | | | | 0.9 | |
| Tax benefit on qualified production activities | | | (1.0 | ) | | | (1.0 | ) | | | — | |
| Tax credit for research activities | | | (0.5 | ) | | | (0.1 | ) | | | — | |
| Other, net | | | (0.1 | ) | | | 0.3 | | | | 0.1 | |
| | | |
| | | | 34.5 | % | | | 35.3 | % | | | 36.0 | % |
| | | |
Significant components of the company’s income tax provision are as follows:
| | | | | | | | | | | | | |
| | | For the years ended January 31 |
| Dollars in thousands | | 2007 | | 2006 | | 2005 |
| | | |
| Income taxes: | | | | | | | | | | | | |
| Currently payable | | $ | 13,687 | | | $ | 14,041 | | | $ | 10,095 | |
| Deferred | | | (293 | ) | | | (809 | ) | | | (31 | ) |
| | | |
| | | $ | 13,394 | | | $ | 13,232 | | | $ | 10,064 | |
| | | |
Significant components of the company’s deferred tax assets and liabilities are as follows:
| | | | | | | | | | | | | |
| | | As of January 31 |
| Dollars in thousands | | 2007 | | 2006 | | 2005 |
| | | |
| Current deferred tax assets: | | | | | | | | | | | | |
| Accounts receivable | | $ | 91 | | | $ | 88 | | | $ | 93 | |
| Inventories | | | 212 | | | | 220 | | | | 237 | |
| Accrued vacation | | | 711 | | | | 680 | | | | 591 | |
| Insurance obligations | | | 357 | | | | 282 | | | | 161 | |
| Other accrued liabilities | | | 390 | | | | 476 | | | | 383 | |
| | | |
| | | | 1,761 | | | | 1,746 | | | | 1,465 | |
| | | |
| | | | | | | | | | | | | |
| Non-current deferred tax assets (liabilities): | | | | | | | | | | | | |
| Postretirement and other employee benefits | | | 1,758 | | | | 598 | | | | 443 | |
| Depreciation and amortization | | | (405 | ) | | | (439 | ) | | | (771 | ) |
Net operating loss carryforward(a) | | | 82 | | | | — | | | | — | |
| Other | | | 172 | | | | 159 | | | | 118 | |
| | | |
| | | | 1,607 | | | | 318 | | | | (210 | ) |
| | | |
| Net deferred tax asset | | $ | 3,368 | | | $ | 2,064 | | | $ | 1,255 | |
| | | |
| | |
| (a) | | The company’s Canadian operation incurred a $210,000 net operating loss that, if unused, will expire in 2017. |
Note 10. Financing Arrangements
The company has an uncollateralized credit agreement providing a line of credit of $8.0 million with a maturity date of August 1, 2007, bearing interest at 0.25% under the prime rate. Letters of credit totaling $1.3 million have been issued under the line, primarily to support self-insured workers’ compensation bonding requirements. No borrowings were outstanding as of January 31, 2007, 2006 or 2005, and $6.7 million was available at January 31, 2007. Borrowings on the credit line bore interest as of January 31, 2007, 2006 and 2005 at 8.00%, 7.25%, and 5.25%, respectively. The weighted-average interest rate for borrowing under the short-term credit line in fiscal 2006 was 5.63%. There were no borrowings under the credit line in fiscal years 2007 or 2005.
Wells Fargo Bank, N.A. provides the company’s line of credit and holds the company’s cash and cash equivalents. One member of the company’s board of directors is also on the board of directors of Wells Fargo & Co., the parent company of Wells Fargo Bank, N.A.
The company leases certain vehicles, equipment and facilities under operating leases. Total rent and lease expense was $351,000, $381,000, and $305,000 in fiscal 2007, 2006 and 2005, respectively. Future minimum lease payments under non-cancelable operating leases for fiscal periods 2008 to 2010 are $235,000, $64,000, and $6,000 with all leases scheduled to expire by fiscal 2010.
Note 11. Share-based Compensation
At January 31, 2007, the company had two share-based compensation plans, which are described below. The compensation cost for these plans was $605,000, $485,000, and $309,000 in fiscal 2007, 2006, and 2005, respectively. The related income tax benefit recorded in the income statement was $57,000, $58,000, and $38,000 for fiscal 2007, 2006, and 2005, respectively. Compensation cost capitalized as part of inventory at January 31, 2007, 2006, and 2005 was $40,000, $63,000 and $40,000, respectively.
2000 Stock Option and Compensation Plan
The company’s 2000 Stock Option and Compensation Plan, approved by the shareholders, is administered by the Personnel and Compensation Committee of the Board of Directors and allows for either incentive or non-qualified options with terms not to exceed 10 years. There are 511,875 shares of the company’s common stock reserved for future option grants under the plan at January 31, 2007. Options are granted with exercise prices not less than market value at the date of grant. The stock options vest over a four-year period and expire after five years. Options contain retirement and change in control provisions which may accelerate the vesting period. The fair value of each option grant is estimated on the date of grant using the Black-Scholes option pricing model.
40
The company uses historical data to estimate option exercise and employee termination within the valuation model.
The fair value of each option grant is estimated on the date of grant using the Black-Scholes option pricing model with the following weighted average assumptions by grant year.
| | | | | | | | | | | | | |
| | | For the years ended January 31 |
| | | 2007 | | 2006 | | 2005 |
| | | |
| Risk-free interest rate | | | 4.45 | % | | | 4.36 | % | | | 3.51 | % |
| Expected dividend yield | | | 1.29 | % | | | 0.90 | % | | | 1.07 | % |
| Expected volatility factor | | | 38.97 | % | | | 39.25 | % | | | 34.92 | % |
| Expected option term (in years) | | | 4.25 | | | | 4.25 | | | | 4.50 | |
| Weighted average grant date fair value | | $ | 9.51 | | | $ | 10.90 | | | $ | 5.91 | |
Information regarding option activity for the year ended January 31, 2007 is as follows:
| | | | | | | | | | | | | | | | | |
| | | | | | | | | | | | | | | Weighted | |
| | | | | | | | | | | | | | | average | |
| | | | | | | Weighted | | | Aggregate | | | remaining | |
| | | | | | | average | | | intrinsic | | | contractual | |
| | | Number | | | exercise | | | value | | | term | |
| | | of options | | | price | | | (in 000’s) | | | (years) | |
| | | |
| Outstanding at beginning of year | | | 519,414 | | | $ | 14.05 | | | | | | | | | |
| Granted | | | 83,700 | | | | 28.01 | | | | | | | | | |
| Exercised | | | (140,989 | ) | | | 6.10 | | | | | | | | | |
| Forfeited | | | (15,075 | ) | | | 22.37 | | | | | | | | | |
| | | | | | | | | | | | | | | | |
| Outstanding at end of year | | | 447,050 | | | $ | 18.89 | | | $ | 4,455 | | | | 2.55 | |
| | | | | | | | | | | | | | | | |
| Options exercisable at end of year | | | 245,700 | | | $ | 13.24 | | | $ | 3,780 | | | | 1.61 | |
The intrinsic value of a stock award is the amount by which the fair value of the underlying stock exceeds the exercise price of the award. The total intrinsic value of options exercised was $3.7 million, $3.6 million and $2.7 million during the years ended January 31, 2007, 2006 and 2005, respectively. As of January 31, 2007, the total compensation cost for non-vested awards not yet recognized in the company’s statements of income was $1.3 million, net of the effect of estimated forfeitures. This amount is expected to be recognized over a weighted average period of 2.58 years.
Deferred Stock Compensation Plan for Directors
On May 23, 2006, the company’s stockholders approved the Deferred Stock Compensation Plan for Directors of Raven Industries, Inc. Under the plan, a stock unit is the right to receive one share of the company’s common stock as deferred compensation, to be distributed from an account established in the name of the non-employee director by the company. Stock units have the same value as a share of common stock but cannot be sold. Stock units are a component of the company’s equity. The plan reserves 50,000 common shares for the conversion of stock units into common stock after directors retire from the Board. The plan is administered by the Governance Committee of the Board of Directors.
Stock units granted under this plan vest immediately and are expensed at the date of grant. Stock units are also accumulated if a director elects to defer the annual retainer paid for board service. When dividends are paid on the company’s common shares, stock units are added to the director’s balances and a corresponding amount is removed from retained earnings. The intrinsic value of a stock unit is the fair value of the underlying shares.
Information regarding outstanding stock units for the year ended January 31, 2007 is as follows:
| | | | | | | | | |
| | | | | | | Weighted | |
| | | Number | | | average | |
| | | of units | | | price | |
| | | |
| Outstanding at beginning of year | | | — | | | $ | — | |
| Granted | | | 3,743 | | | | 32.06 | |
| Deferred retainers | | | 1,040 | | | | 32.06 | |
| Dividends | | | 45 | | | | 28.65 | |
| Converted into common shares | | | — | | | | — | |
| | | | | | | | |
| Outstanding at end of year | | | 4,828 | | | $ | 28.43 | |
| | | | | | | | |
Note 12. Net Income Per Share
Basic net income per share is computed by dividing net income by the weighted-average common shares and stock units outstanding. Diluted net income per share is computed by dividing net income by the weighted-average common and common equivalent shares outstanding (which includes the shares issuable upon exercise of employee stock options net of shares assumed purchased with the option proceeds) and stock units outstanding. Certain outstanding options were excluded from the diluted net income per-share calculations because their effect would have been anti-dilutive, as their exercise prices were greater than the average market price of the company’s common stock during those periods. For fiscal 2007, 2006, and 2005, 96,075, 19,125, and 21,650 options, respectively, were excluded from the diluted net income per-share calculation. Details of the computation are presented below.
| | | | | | | | | | | | | |
| | | For the years ended January 31 |
| | | 2007 | | 2006 | | 2005 |
| | | |
| Numerator: | | | | | | | | | | | | |
Net income (in thousands) | | $ | 25,441 | | | $ | 24,262 | | | $ | 17,891 | |
| | | |
| | | | | | | | | | | | | |
| Denominator: | | | | | | | | | | | | |
| Weighted average common shares outstanding | | | 18,082,606 | | | | 18,055,439 | | | | 18,066,223 | |
| Weighted average stock units outstanding | | | 3,602 | | | | — | | | | — | |
| | | |
| Denominator for basic calculation | | | 18,086,208 | | | | 18,055,439 | | | | 18,066,223 | |
| | | |
| | | | | | | | | | | | | |
| Weighted average common shares outstanding | | | 18,082,606 | | | | 18,055,439 | | | | 18,066,223 | |
| Weighted average stock units outstanding | | | 3,602 | | | | — | | | | — | |
| Dilutive impact of stock options | | | 186,705 | | | | 259,104 | | | | 344,104 | |
| | | |
| Denominator for diluted calculation | | | 18,272,913 | | | | 18,314,543 | | | | 18,410,327 | |
| | | |
| Net income per share – basic | | $ | 1.41 | | | $ | 1.34 | | | $ | 0.99 | |
| Net income per share – diluted | | $ | 1.39 | | | $ | 1.32 | | | $ | 0.97 | |
RAVEN2007ANNUALREPORT
41
NOTES TO FINANCIAL STATEMENTS(continued)
Note 13. Business Segments and Major Customer Information
The company’s reportable segments are defined by their common technologies, production processes and inventories. These segments reflect the organization of the company into the three Raven divisions, each with a Divisional Vice President, and its Aerostar subsidiary. Raven Canada and Raven GmbH are consolidated with the Flow Controls Division.
Engineered Films produces rugged reinforced plastic sheeting for industrial, construction, manufactured housing and agriculture applications. Flow Controls, including Raven Canada and Raven GmbH, provides electronic and Global Positioning System (GPS) products for the precision agriculture, marine navigation and other niche markets. Electronic Systems is a total-solutions provider of electronics manufacturing services. Aerostar manufactures military parachutes, government service uniforms, custom-shaped inflatable products and high-altitude balloons for government and commercial research.
The company measures the performance of its segments based on their operating income exclusive of administrative and general expenses. The accounting policies of the operating segments are the same as those described in Note 1, Summary of Significant Accounting Policies. Other income, interest expense and income taxes are not allocated to individual operating segments, and assets not identifiable to an individual segment are included as corporate assets. Segment information is reported consistent with the company’s management reporting structure as required by SFAS No. 131,Disclosures about Segments of an Enterprise and Related Information.
Business segment information is as follows:
| | | | | | | | | | | | | |
| | | For the years ended January 31 |
| Dollars in thousands | | 2007 | | 2006 | | 2005 |
| | | |
ENGINEERED FILMS DIVISION | | | | | | | | | | | | |
| Sales | | $ | 91,082 | | | $ | 82,794 | | | $ | 58,657 | |
| Operating income | | | 23,440 | | | | 19,907 | | | | 15,739 | |
| Assets | | | 41,988 | | | | 33,512 | | | | 25,181 | |
| Capital expenditures | | | 13,266 | | | | 7,359 | | | | 3,960 | |
| Depreciation & amortization | | | 2,887 | | | | 2,436 | | | | 1,403 | |
| | | | | | | | | | | | | |
FLOW CONTROLS DIVISION | | | | | | | | | | | | |
| Sales | | $ | 45,515 | | | $ | 47,506 | | | $ | 40,726 | |
| Operating income | | | 10,111 | | | | 13,586 | | | | 10,516 | (b) |
| Assets | | | 27,629 | | | | 30,047 | | | | 23,701 | |
| Capital expenditures | | | 577 | | | | 938 | | | | 1,372 | |
| Depreciation & amortization | | | 1,142 | | | | 1,085 | | | | 876 | |
| | | | | | | | | | | | | |
ELECTRONIC SYSTEMS DIVISION | | | | | | | | | | | | |
| Sales | | $ | 66,278 | | | $ | 56,219 | | | $ | 47,049 | |
| Operating income | | | 10,850 | | | | 8,916 | | | | 4,492 | |
| Assets | | | 25,175 | | | | 20,191 | | | | 17,382 | |
| Capital expenditures | | | 1,357 | | | | 1,612 | | | | 1,201 | |
| Depreciation & amortization | | | 1,086 | | | | 871 | | | | 880 | |
| | | | | | | | | | | | | |
AEROSTAR | | | | | | | | | | | | |
| Sales | | $ | 14,654 | | | $ | 18,009 | | | $ | 21,654 | |
| Operating income | | | 707 | | | | 2,133 | | | | 3,609 | |
| Assets | | | 8,161 | | | | 6,837 | | | | 7,492 | |
| Capital expenditures | | | 812 | | | | 179 | | | | 542 | |
| Depreciation & amortization | | | 375 | | | | 359 | | | | 389 | |
| | | | | | | | | | | | | |
REPORTABLE SEGMENTS TOTAL | | | | | | | | | | | | |
| Sales | | $ | 217,529 | | | $ | 204,528 | | | $ | 168,086 | |
| Operating income | | | 45,108 | | | | 44,542 | | | | 34,356 | (b) |
| Assets | | | 102,953 | | | | 90,587 | | | | 73,756 | |
| Capital expenditures | | | 16,012 | | | | 10,088 | | | | 7,075 | |
| Depreciation & amortization | | | 5,490 | | | | 4,751 | | | | 3,548 | |
| | | | | | | | | | | | | |
CORPORATE & OTHER(a) | | | | | | | | | | | | |
| Operating (loss) from sold business | | $ | — | | | $ | (79 | ) | | $ | — | |
| Operating (loss) from administrative expenses | | | (6,806 | ) | | | (7,179 | ) | | | (6,494 | ) |
| Assets | | | 16,811 | | | | 15,570 | | | | 14,753 | |
| Capital expenditures | | | 510 | | | | 270 | | | | 466 | |
| Depreciation & amortization | | | 395 | | | | 400 | | | | 293 | |
| | | | | | | | | | | | | |
TOTAL COMPANY | | | | | | | | | | | | |
| Sales | | $ | 217,529 | | | $ | 204,528 | | | $ | 168,086 | |
| Operating income | | | 38,302 | | | | 37,284 | | | | 27,862 | (b) |
| Assets | | | 119,764 | | | | 106,157 | | | | 88,509 | |
| Capital expenditures | | | 16,522 | | | | 10,358 | | | | 7,541 | |
| Depreciation & amortization | | | 5,885 | | | | 5,151 | | | | 3,841 | |
| | |
| (a) | | Assets are principally cash, investments, deferred taxes and notes receivable. |
| |
| (b) | | Includes a $1.3 million pretax writeoff of assets related to the Fluent Systems product line (see Note 5). |
Sales to a customer of the Electronic Systems segment accounted for 10% of consolidated sales in fiscal 2007 and 14% of the company’s consolidated accounts receivable at January 31, 2007. No customer accounted for more than 10% of the company’s consolidated sales or accounts receivable in fiscal 2006 or 2005.
Sales to countries outside the United States, primarily to Canada, are as follows:
| | | | | | | | | | | | | |
| | | For the years ended January 31 |
| Dollars in thousands | | 2007 | | 2006 | | 2005 |
| | | |
| Flow Controls | | $ | 7,100 | | | $ | 6,700 | | | $ | 5,000 | |
| Engineered Films | | | 2,000 | | | | 1,300 | | | | 600 | |
| Electronic Systems | | | 8,700 | | | | 8,000 | | | | 4,900 | |
| Aerostar | | | 900 | | | | 800 | | | | 500 | |
| | | |
| Total foreign sales | | $ | 18,700 | | | $ | 16,800 | | | $ | 11,000 | |
| | | |
Note 14. Quarterly Information (Unaudited)
The company’s quarterly information is presented on page 30.
42
REPORT OF INDEPENDENT REGISTERED PUBLIC ACCOUNTING FIRM
To the Board of Directors and Shareholders of Raven Industries, Inc:
We have completed integrated audits of Raven Industries, Inc.’s consolidated financial statements and of its internal control over financial reporting as of January 31, 2007, in accordance with the standards of the Public Company Accounting Oversight Board (United States). Our opinions, based on our audits, are presented below.
Consolidated financial statements
In our opinion, the accompanying consolidated balance sheets and the related consolidated statements of income, of shareholders’ equity and comprehensive income and of cash flows present fairly, in all material respects, the financial position of Raven Industries, Inc. and its subsidiaries at January 31, 2007, 2006 and 2005, and the results of their operations and their cash flows for each of the three years in the period ended January 31, 2007 in conformity with accounting principles generally accepted in the United States of America. These financial statements are the responsibility of the Company’s management. Our responsibility is to express an opinion on these financial statements based on our audits. We conducted our audits of these statements in accordance with the standards of the Public Company Accounting Oversight Board (United States). Those standards require that we plan and perform the audit to obtain reasonable assurance about whether the financial statements are free of material misstatement. An audit of financial statements includes examining, on a test basis, evidence supporting the amounts and disclosures in the financial statements, assessing the accounting principles used and significant estimates made by management, and evaluating the overall financial statement presentation. We believe that our audits provide a reasonable basis for our opinion.
As described in Note 7 to the consolidated financial statements, effective January 31, 2007, the Company adopted the provisions of Financial Accounting Standards Board Statement No. 158,Employers’ Accounting for Defined Benefit Pension and Other Postretirement Plans.
Internal control over financial reporting
Also, in our opinion, management’s assessment, included in Management’s Report on Internal Control over Financial Reporting appearing on page 31 of the 2007 Annual Report to Shareholders, that the Company maintained effective internal control over financial reporting as of January 31, 2007 based on criteria established inInternal Control — Integrated Framework issued by the Committee of Sponsoring Organizations of the Treadway Commission (COSO), is fairly stated, in all material respects, based on those criteria. Furthermore, in our opinion, the Company maintained, in all material respects, effective internal control over financial reporting as of January 31, 2007, based on criteria established inInternal Control — Integrated Framework issued by the COSO. The Company’s management is responsible for maintaining effective internal control over financial reporting and for its assessment of the effectiveness of internal control over financial reporting. Our responsibility is to express opinions on management’s assessment and on the effectiveness of the Company’s internal control over financial reporting based on our audit. We conducted our audit of internal control over financial reporting in accordance with the standards of the Public Company Accounting Oversight Board (United States). Those standards require that we plan and perform the audit to obtain reasonable assurance about whether effective internal control over financial reporting was maintained in all material respects. An audit of internal control over financial reporting includes obtaining an understanding of internal control over financial reporting, evaluating management’s assessment, testing and evaluating the design and operating effectiveness of internal control, and performing such other procedures as we consider necessary in the circumstances. We believe that our audit provides a reasonable basis for our opinions.
A company’s internal control over financial reporting is a process designed to provide reasonable assurance regarding the reliability of financial reporting and the preparation of financial statements for external purposes in accordance with generally accepted accounting principles. A company’s internal control over financial reporting includes those policies and procedures that (i) pertain to the maintenance of records that, in reasonable detail, accurately and fairly reflect the transactions and dispositions of the assets of the company; (ii) provide reasonable assurance that transactions are recorded as necessary to permit preparation of financial statements in accordance with generally accepted accounting principles, and that receipts and expenditures of the company are being made only in accordance with authorizations of management and directors of the company; and (iii) provide reasonable assurance regarding prevention or timely detection of unauthorized acquisition, use, or disposition of the company’s assets that could have a material effect on the financial statements.
Because of its inherent limitations, internal control over financial reporting may not prevent or detect misstatements. Also, projections of any evaluation of effectiveness to future periods are subject to the risk that controls may become inadequate because of changes in conditions, or that the degree of compliance with the policies or procedures may deteriorate.
PricewaterhouseCoopers LLP
Minneapolis, Minnesota
March 22, 2007
RAVEN2007ANNUALREPORT
43
INVESTOR INFORMATION
Annual Meeting
May 22, 2007, 9:00 a.m.
Ramkota Hotel and Conference Center
3200 W. Maple Avenue
Sioux Falls, SD
Dividend Reinvestment Plan
Raven Industries, Inc. sponsors a Dividend Reinvestment Plan so shareholders can purchase additional Raven common stock without paying any brokerage commission or fees. For more information on how you can take advantage of this plan, contact your broker, our stock transfer agent or write to our Investor Relations Department.
Dividend Policy
Our policy is to return about 30% of the company’s earnings to shareholders as a dividend. Each year our board of directors reviews Raven’s dividend. Fiscal 2007 represented the 20th-consecutive year we raised our annual dividend: a 29% increase to 36 cents per share.
Raven Web Site
www.ravenind.com
Stock Quotations
Listed on the Nasdaq Stock Market—RAVN
Independent Registered Public
Accounting Firm
PricewaterhouseCoopers LLP
Minneapolis, MN
Stock Transfer Agent & Registrar
Wells Fargo Bank, N.A.
161 N. Concord Exchange
P.O. Box 64854
South St. Paul, MN 55164-0854
Phone: 1-800-468-9716
Form 10-K
Upon written request, Raven Industries, Inc.’s Form 10-K for the fiscal year ended January 31, 2007, which has been filed with the Securities and Exchange Commission, is available free of charge.
Affirmative Action Plan
Raven Industries, Inc. and Aerostar International, Inc. are Equal Employment Opportunity Employers with approved affirmative action plans.
Direct inquires to:
Raven Industries, Inc.
Attention: Investor Relations
P.O. Box 5107
Sioux Falls, SD 57117-5107
Phone: 605-336-2750
| | | |
| | This graph compares the returns investors would have earned from stock price increases and dividend reinvestment if they purchased $100 of Raven stock or the same amount in one of these two indices on January 31, 2002. Their investment in Raven would have reached $561.83, versus $187.23 for the S&P 1500 Industrial Machinery Index and $176.56 in the Russell 2000 Index. |
FORWARD-LOOKING STATEMENTS
Certain statements contained in this report are “forward-looking statements” within the meaning of Section 27A of the Securities Act of 1933, as amended, and Section 21E of the Securities Exchange Act of 1934, as amended, including statements regarding the expectations, beliefs, intentions or strategies regarding the future. Without limiting the foregoing, the words “anticipates,” “believes,” “expects,” “intends,” “may,” “plans” and similar expressions are intended to identify forward-looking statements. The Company intends that all forward-looking statements be subject to the safe harbor provisions of the Private Securities Litigation Reform Act. Although the Company believes that the expectations reflected in such forward-looking statements are based on reasonable assumptions, there is no assurance that such assumptions are correct or that these expectations will be achieved. Such assumptions involve important risks and uncertainties that could significantly affect results in the future. These risks and uncertainties include, but are not limited to, those relating to weather conditions, which could affect certain of the Company’s primary markets, such as agriculture and construction, or changes in competition, raw material availability, technology or relationships with the Company’s largest customers, any of which could adversely impact any of the Company’s product lines, as well as other risks described in the Company’s 10-K under Item 1A. The foregoing list is not exhaustive and the company disclaims any obligation to subsequently revise any forward-looking statements to reflect events or circumstances after the date of such statements.