UNITED STATES
SECURITIES AND EXCHANGE COMMISSION
Washington, D.C. 20549
FORM N-CSR
CERTIFIED SHAREHOLDER REPORT OF REGISTERED MANAGEMENT
INVESTMENT COMPANIES
| Investment Company Act file number: | 811-05336 | |
| Exact name of registrant as specified in charter: | Prudential Institutional | |
| Liquidity Portfolio, Inc. | ||
| Address of principal executive offices: | Gateway Center 3, | |
| 100 Mulberry Street, | ||
| Newark, New Jersey 07102 | ||
| Name and address of agent for service: | Deborah A. Docs | |
| Gateway Center 3, | ||
| 100 Mulberry Street, | ||
| Newark, New Jersey 07102 | ||
| Registrant’s telephone number, including area code: | 973-367-7521 | |
| Date of fiscal year end: | 3/31/2006 | |
| Date of reporting period: | 3/31/2006 | |
Item 1 – Reports to Stockholders
ANNUAL REPORT
MARCH 31, 2006
PRUDENTIAL
INSTITUTIONAL LIQUIDITY PORTFOLIO, INC./
INSTITUTIONAL MONEY MARKET SERIES
FUND TYPE
Money market
OBJECTIVE
High current income consistent with the
preservation of principal and liquidity

This report is not authorized for distribution to prospective investors unless preceded or accompanied by a current prospectus.
The views expressed in this report and information about the Series’ portfolio holdings are for the period covered by this report and are subject to change thereafter.
| Prudential Financial and the Rock logo are registered service marks of The Prudential Insurance Company of America, Newark, NJ, and its affiliates. |
|

Your Series’ Performance
Series objective
The investment objective of the Prudential Institutional Liquidity Portfolio, Inc. (PILP)/Institutional Money Market Series is high current income consistent with the preservation of principal and liquidity. There can be no assurance that the Series will achieve its investment objective.
Yields will fluctuate from time to time, and past performance does not guarantee future results. Current performance may be lower or higher than the past performance data quoted. The investment return and principal value will fluctuate, and shares, when sold, may be worth more or less than the original cost. For the most recent month-end performance update, visit our website at www.prudential.com.
| Series Facts as of 3/31/06 | |||||||||||
| 7-Day Current Yield† | Net Asset Value (NAV) | Weighted Avg. Maturity (WAM) | Net Assets (Millions) | ||||||||
PILP Class A* | 4.55 | % | $ | 1.00 | 37 Days | $ | 473.0 | ||||
PILP Class I** | 4.60 | % | $ | 1.00 | 37 Days | $ | 978.5 | ||||
iMoneyNet, Inc. Prime Institutional Universe Average*** | 4.34 | % | N/A | 39 Days | N/A | ||||||
| † | The 7-Day Current Yields for Class A and Class I are net of expense reimbursements, management and distribution fee waivers. Without such expense reimbursements, management and distribution fee waivers, the yields would have been lower. |
| * | Class A shares are subject to distribution and service (12b-1) fees. |
| ** | Class I shares are not subject to 12b-1 fees. |
| *** | iMoneyNet, Inc. reports a 7-day current yield and WAM on Tuesdays. This is the data of all funds in the iMoneyNet, Inc. Prime Institutional Universe Average category as of March 28, 2006, the closest date to the end of the Series’ current reporting period. |
An investment in the Series is not insured or guaranteed by the Federal Deposit Insurance Corporation or any other government agency. Although the Series seeks to preserve the value of your investment at $1 per share, it is possible to lose money by investing in the Series.
| Prudential Institutional Liquidity Portfolio, Inc./Institutional Money Market Series | 1 |
Your Series’ Performance (continued)
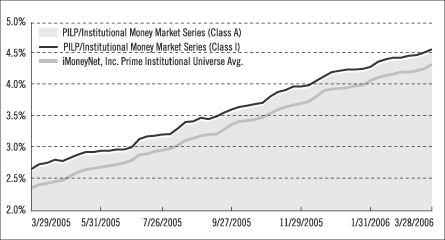
Institutional Money Market Fund Yield Comparison
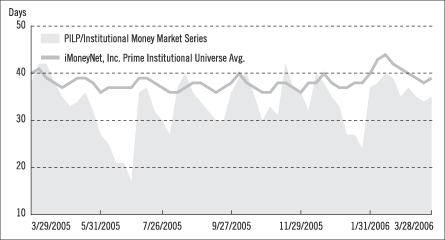
Weighted Average Maturity Comparison
Yields will fluctuate from time to time, and past performance does not guarantee future results. Yields would have been lower without expense reimbursements, management and distribution fee waivers. Current performance may be lower or higher than the past performance data quoted. The investment return will fluctuate, and although the Series seeks to preserve the net asset value at $1 per share, principal value may fluctuate, and shares, when sold, may be worth more or less than the original cost. For the most recent month-end performance update, visit our website at www.prudential.com.
| 2 | Visit our website at www.prudential.com |
Past performance does not guarantee future results. The graphs portray weekly 7-day current yields and weekly WAMs respectively for the PILP/Institutional Money Market Series and the iMoneyNet, Inc. Prime Institutional Universe Average every Tuesday from March 29, 2005, to March 28, 2006, the closest dates to the beginning and end of the Series’ current reporting period. The data portrayed for the Series at the end of the reporting period in the graphs may not match the data portrayed in the Series Facts table as of March 31, 2006.
An investment in the Series is not insured or guaranteed by the Federal Deposit Insurance Corporation or any other government agency. Although the Series seeks to preserve the value of your investment at $1 per share, it is possible to lose money by investing in the Series.
| Prudential Institutional Liquidity Portfolio, Inc./Institutional Money Market Series | 3 |
Investment Subadvisor’s Report
Prudential Investment Management, Inc.
March toward higher U.S. short-term interest rates continued
The investment environment for money market securities improved during the Series’ fiscal year that began April 1, 2005, as their yields continued to rise. The trend toward higher yields reflected an ongoing campaign by the Federal Reserve (the Fed) to shift from an accommodative to a more neutral monetary policy by gradually increasing short-term interest rates. Our strategy aimed to take advantage of investment opportunities created by the rise in short-term rates. This helped the Series’ Class A and Class I shares provide competitive yields during the 12-month reporting period.
By the time the Series’ fiscal year began, the latest round of short-term rate hikes were well underway. The target for the federal funds rate had already been increased seven times in quarter-point increments, from 1.00% to 2.75%. During the reporting period, the benchmark rate was raised eight more times in quarter-point increments, from 2.75% to 4.75%. Despite a slower rate of economic growth in late 2005, the Fed continued to focus on removing monetary accommodation. The economic slowdown proved to be temporary as the economy rebounded sharply in the first quarter of 2006.
Timing of Fed meetings a key factor in our strategy
The timing of Fed policymakers’ regularly scheduled meetings that occur in roughly six-week intervals continued to play a key role in our strategy. When adding to the Series’ diversified portfolio of high-quality short-term debt securities, we often purchased commercial paper and certificates of deposit that matured around the time of the next Fed meeting. This allowed us to reinvest the proceeds in higher-yielding instruments that became available after the target for the federal funds rate was raised. If we believed that money market yields adequately reflected fair relative value beyond the timing of the next Fed meeting, we went out further on the yield curve.
Investing primarily in money market issues that came due in three months or less tended to position the Series’ weighted average maturity (WAM) shorter than that of its competitive average as measured by iMoneyNet, Inc. In January 2006, however, we began to invest in attractively priced securities that would mature in approximately nine months on the view that the latest cycle of short-term rate hikes would wind down in coming months. These purchases positioned the Series’ WAM more in line with that of its competitive average.
Increased exposure to adjustable-rate securities aided Series
In the rising-interest-rate environment, there was strong investor demand for adjustable-rate securities. We increased the Series’ holdings of these securities, particularly those with coupons based on one- or three-month London interbank offered rates. These securities enhanced the Series’ yields as their coupon rates reset to progressively higher levels, reflecting the trend toward higher short-term rates.
| 4 | Visit our website at www.prudential.com |
Fees and Expenses (Unaudited)
As a shareholder of a fund, you incur two types of costs: (1) transaction costs, including sales charges (loads) on purchase payments and redemptions, as applicable, and (2) ongoing costs, including management fees, distribution and/or service (12b-1) fees, and other Series expenses, as applicable. This example is intended to help you understand your ongoing costs (in dollars) of investing in the Series and to compare these costs with the ongoing costs of investing in other mutual funds.
The example is based on an investment of $1,000 invested on October 1, 2005, at the beginning of the period, and held through the six-month period ended March 31, 2006.
The Series’ transfer agent may charge additional fees to holders of certain accounts that are not included in the expenses shown in the table on the following page. These fees apply to Individual Retirement Accounts (IRAs) and Section 403(b) accounts. As of the close of the six-month period covered by the table, IRA fees included an annual maintenance fee of $15 per account (subject to a maximum annual maintenance fee of $25 for all accounts held by the same shareholder). Section 403(b) accounts are charged an annual $25 fiduciary maintenance fee. Some of the fees may vary in amount, or may be waived, based on your total account balance or the number of JennisonDryden or Strategic Partners Funds, including the Series, that you own. You should consider the additional fees that were charged to your Series account over the six-month period when you estimate the total ongoing expenses paid over the period and the impact of these fees on your ending account value, as these additional expenses are not reflected in the information provided in the expense table. Additional fees have the effect of reducing investment returns.
Actual Expenses
The first line for each share class in the table on the following page provides information about actual account values and actual expenses. You may use the information on this line, together with the amount you invested, to estimate the expenses that you paid over the period. Simply divide your account value by $1,000 (for example, an $8,600 account value ÷ $1,000 = 8.6), then multiply the result by the number on the first line under the heading “Expenses Paid During the Six-Month Period” to estimate the expenses you paid on your account during this period.
Hypothetical Example for Comparison Purposes
The second line for each share class in the table on the following page provides information about hypothetical account values and hypothetical expenses based on the Series’ actual expense ratio and an assumed rate of return of 5% per year before
| Prudential Institutional Liquidity Portfolio, Inc./Institutional Money Market Series | 5 |
Fees and Expenses (continued)
expenses, which is not the Series’ actual return. The hypothetical account values and expenses may not be used to estimate the actual ending account balance or expenses you paid for the period. You may use this information to compare the ongoing costs of investing in the Series and other funds. To do so, compare this 5% hypothetical example with the 5% hypothetical examples that appear in the shareholder reports of the other funds.
Please note that the expenses shown in the table are meant to highlight your ongoing costs only, and do not reflect any transactional costs such as sales charges (loads). Therefore the second line for each share class in the table is useful in comparing ongoing costs only, and will not help you determine the relative total costs of owning different funds. In addition, if these transactional costs were included, your costs would have been higher.
| Prudential Institutional Liquidity Portfolio, Inc./ Institutional Money Market Series | Beginning Account Value October 1, 2005 | Ending Account March 31, 2006 | Annualized Expense Ratio Based on the Six-Month Period* | Expenses Paid During the Six- Month Period** | ||||||||||
| Class A | Actual | $ | 1,000.00 | $ | 1,020.20 | 0.20 | % | $ | 1.01 | |||||
| Hypothetical | $ | 1,000.00 | $ | 1,023.93 | 0.20 | % | $ | 1.01 | ||||||
| Class I | Actual | $ | 1,000.00 | $ | 1,020.50 | 0.15 | % | $ | 0.76 | |||||
| Hypothetical | $ | 1,000.00 | $ | 1,024.18 | 0.15 | % | $ | 0.76 | ||||||
* Net of expense reimbursements, management and distribution fee waivers.
** Series expenses (net of fee waivers or subsidies, if any) for each share class are equal to the annualized expense ratio for each share class (provided in the table), multiplied by the average account value over the period, multiplied by the 182 days in the six-month period ended March 31, 2006, and divided by the 365 days in the Series’ fiscal year ending March 31, 2006 (to reflect the six-month period).
| 6 | Visit our website at www.prudential.com |
Portfolio of Investments
as of March 31, 2006
| Principal Amount (000) | Description | Value (Note 1) | ||||
| CERTIFICATES OF DEPOSIT 24.2% | ||||||
Bank of New York (The) | ||||||
| $ | 40,000 | 4.97%, 3/1/07(c) | $ | 40,064,020 | ||
| 10,000 | 4.55%, 10/27/06 | 10,000,000 | ||||
| 3,000 | Barclays Bank PLC New York | 2,999,104 | ||||
| 33,000 | BNP Paribas | 33,000,000 | ||||
| 25,850 | Branch Banking & Trust | 25,849,019 | ||||
| 25,000 | Credit Suisse | 25,000,000 | ||||
| 35,000 | First Tennessee Bank NA | 35,000,000 | ||||
| 25,000 | Royal Bank of Scotland PLC | 25,000,000 | ||||
| 30,000 | Societe Generale New York | 30,000,162 | ||||
SunTrust Bank | ||||||
| 30,000 | 4.69%, 5/12/06(b) | 29,999,722 | ||||
| 20,000 | 4.64%, 2/9/07(c) | 19,998,314 | ||||
| 50,000 | Toronto Dominion Bank | 50,000,000 | ||||
| 25,000 | Wells Fargo Bank NA | 25,000,000 | ||||
| 351,910,341 | ||||||
| COMMERCIAL PAPER 20.6% | ||||||
| 50,000 | Citigroup Funding | 49,754,875 | ||||
Falcon Asset Securitization Corp., 144A | ||||||
| 15,000 | 4.84%, 4/17/06(d) | 14,968,667 | ||||
| 36,500 | 4.85%, 4/28/06(d) | 36,369,421 | ||||
| 15,000 | Long Lane Master Trust, 144A | 14,962,475 | ||||
| 16,000 | Nyala Funding LLC, 144A | 15,907,111 | ||||
| 30,000 | PB Finance Delaware, Inc. | 29,896,433 | ||||
| 15,000 | Prudential PLC, 144A | 14,925,346 | ||||
See Notes to Financial Statements.
| Prudential Institutional Liquidity Portfolio, Inc./Institutional Money Market Series | 7 |
Portfolio of Investments
as of March 31, 2006 Cont’d.
| Principal Amount (000) | Description | Value (Note 1) | ||||
| $ | 70,000 | Sheffield Receivables, 144A | $ | 69,815,667 | ||
Tulip Funding Corp., 144A | ||||||
| 40,000 | 4.85%, 4/28/06(d) | 39,856,600 | ||||
| 13,000 | 4.36%, 5/2/06(d) | 12,949,838 | ||||
| 299,406,433 | ||||||
| OTHER CORPORATE OBLIGATIONS 34.1% | ||||||
| 6,500 | American Express Credit Corp. | 6,501,623 | ||||
| 46,000 | American Express Credit Corp., MTN | 46,008,338 | ||||
| 8,000 | Bank One NA, MTN | 8,004,630 | ||||
GE Capital Assurance Co. | ||||||
| 23,000 | 4.874%, 7/24/06(c)(g)(h) | 23,000,000 | ||||
| 31,500 | GE Capital Corp. | 31,500,000 | ||||
| 25,000 | Goldman Sachs Group, Inc. (The), MTN | 25,005,811 | ||||
| 22,000 | HSBC Finance Corp., MTN | 22,000,000 | ||||
| 35,000 | HSBC USA, Inc. | 35,000,000 | ||||
| 50,000 | Irish Life & Permanent PLC, MTN, 144A | 49,998,333 | ||||
| 55,000 | Merrill Lynch & Co., Inc., MTN | 54,999,999 | ||||
MetLife Insurance Co. | ||||||
| 10,000 | 4.75%, 2/1/07(c)(g)(h) | 10,000,000 | ||||
| 46,000 | Morgan Stanley Group, Inc., MTN | 46,000,000 | ||||
| 15,000 | National City Bank, Inc., MTN | 14,999,655 | ||||
| 43,800 | Nordea Bank AB, 144A | 43,799,816 | ||||
Pacific Life Insurance Co. | ||||||
| 11,000 | 5.037%, 4/13/07(c)(g)(h) | 11,000,000 | ||||
See Notes to Financial Statements.
| 8 | Visit our website at www.prudential.com |
| Principal Amount (000) | Description | Value (Note 1) | |||||
| $ | 36,000 | Skandinaviska Enskilda Banken AB, 144A | $ | 36,000,000 | |||
Travelers Insurance Co. | |||||||
| 5,000 | 4.761%, 7/7/06(c)(g)(h) | 5,000,000 | |||||
| 25,000 | 4.87%, 2/23/07(c)(g)(h) | 25,000,000 | |||||
| 493,818,205 | |||||||
| LOAN PARTICIPATIONS 4.5% | |||||||
Cargill Global Fund PLC | |||||||
| 10,000 | 4.82%, 5/10/06(h) | 10,000,000 | |||||
| 20,000 | 4.80%, 5/12/06(h) | 20,000,000 | |||||
Cargill Inc. | |||||||
| 10,000 | 4.80%, 5/11/06(h) | 10,000,000 | |||||
| 10,000 | 4.82%, 5/15/06(h) | 10,000,000 | |||||
| 15,000 | Countrywide Home Loans, Inc. | 15,000,000 | |||||
| 65,000,000 | |||||||
| TIME DEPOSIT 5.0% | |||||||
| 73,000 | State Street Bank & Trust Co. | 73,000,000 | |||||
| REPURCHASE AGREEMENTS 1.9% | |||||||
| 27,412 | Credit Suisse First Boston, | 27,412,000 | |||||
| Shares | |||||||
| MONEY MARKET MUTUAL FUND 10.4% | |||||||
| 150,506,273 | Dryden Core Investment Fund - Taxable Money Market Series(f) | 150,506,273 | |||||
Total Investments 100.7% | 1,461,053,252 | ||||||
Liabilities in excess of other assets (0.7%) | (9,529,732 | ) | |||||
Net Assets 100% | $ | 1,451,523,520 | |||||
See Notes to Financial Statements.
| Prudential Institutional Liquidity Portfolio, Inc./Institutional Money Market Series | 9 |
Portfolio of Investments
as of March 31, 2006 Cont’d.
144A—Security was purchased pursuant to Rule 144A under the Securities Act of 1933 and may not be resold subject to that rule except to qualified institutional buyers. Unless otherwise noted, 144A securities are deemed to be liquid.
MTN—Medium Term Note.
| (a) | The cost of securities for federal income tax purposes is substantially the same as for financial reporting purposes. |
| (b) | Variable rate instrument. The maturity date presented for these instruments is the next date on which the rate of interest is adjusted. |
| (c) | Floating Rate Security. The interest rate shown reflects the rate in effect at March 31, 2006. |
| (d) | Rate quoted represents yield-to-maturity as of purchase date. |
| (e) | Repurchase agreements are collateralized by United States Treasury or federal agency obligations. |
| (f) | Prudential Investments LLC, the manager of the Series, also serves as manager of the Dryden Core Investment Fund - Taxable Money Market Series. |
| (g) | Private placement, restricted as to resale and does not have a readily available market. The aggregate cost of such securities is $74,000,000. The aggregate value of $74,000,000 is 5.1% of net assets. |
| (h) | Indicates a security that has been deemed illiquid. |
The industry classification of portfolio holdings and liabilities in excess of other assets shown as a percentage of net assets as of March 31, 2006 were as follows:
Commercial Banks | 39.8 | % | |
Financial Services | 25.5 | ||
Mutual Fund | 10.4 | ||
Security Brokers & Dealers | 8.7 | ||
Asset Backed Securities | 8.3 | ||
Life Insurance | 6.1 | ||
Repurchase Agreement | 1.9 | ||
| 100.7 | |||
Liabilities in excess of other assets | (0.7 | ) | |
| 100.0 | % | ||
See Notes to Financial Statements.
| 10 | Visit our website at www.prudential.com |
Statement of Assets and Liabilities
as of March 31, 2006
Assets | |||
Investments, at amortized cost which approximates market value: | |||
Unaffiliated investments | $ | 1,310,546,979 | |
Affiliated investments | 150,506,273 | ||
Cash | 284,947 | ||
Dividends and interest receivable | 4,977,302 | ||
Prepaid expenses | 39,890 | ||
Receivable for Series shares sold | 30,000 | ||
Total assets | 1,466,385,391 | ||
Liabilities | |||
Payable for investments purchased | 12,949,838 | ||
Dividends payable | 1,567,315 | ||
Accrued expenses | 122,621 | ||
Management fee payable | 120,265 | ||
Transfer agent fee payable | 61,337 | ||
Deferred directors’ fees | 21,246 | ||
Distribution fee payable | 19,249 | ||
Total liabilities | 14,861,871 | ||
Net Assets | $ | 1,451,523,520 | |
Net assets were comprised of: | |||
Common stock, at par | $ | 1,451,524 | |
Paid-in capital in excess of par | 1,450,071,996 | ||
Net assets, March 31, 2006 | $ | 1,451,523,520 | |
Class A | |||
Net asset value, offering price and redemption price per share | |||
($472,992,832 ÷ 472,992,832 shares of $.001 par value common stock issued and outstanding) | $1.00 | ||
Class I | |||
Net asset value, offering price and redemption price per share | |||
($978,530,688 ÷ 978,530,688 shares of $.001 par value common stock issued and outstanding) | $1.00 | ||
See Notes to Financial Statements.
| Prudential Institutional Liquidity Portfolio, Inc./Institutional Money Market Series | 11 |
Statement of Operations
Year Ended March 31, 2006
Net Investment Income | ||||
Income | ||||
Unaffiliated interest income | $ | 49,011,527 | ||
Affiliated dividend income | 5,964,532 | |||
Total income | 54,976,059 | |||
Expenses | ||||
Management fee | 2,901,875 | |||
Distribution fee—Class A | 387,614 | |||
Transfer agent’s fees and expenses (including affiliated expense of $242,000) | 254,000 | |||
Custodian’s fees and expenses | 184,000 | |||
Registration fees | 60,000 | |||
Directors’ fees | 40,000 | |||
Insurance expenses | 38,000 | |||
Legal fees and expenses | 35,000 | |||
Reports to shareholders | 32,000 | |||
Audit fee | 16,000 | |||
Miscellaneous expenses | 18,962 | |||
Total expenses | 3,967,451 | |||
Less: Expense Subsidy (Note 4) | (677,625 | ) | ||
Management fee waiver (Note 2) | (725,469 | ) | ||
Distribution fee waiver (Note 2) | (226,108 | ) | ||
Net expenses | 2,338,249 | |||
Net investment income | 52,637,810 | |||
Realized Gain On Investments | ||||
Net realized gain on investment transactions | 35,580 | |||
Net Increase In Net Assets Resulting From Operations | $ | 52,673,390 | ||
See Notes to Financial Statements.
| 12 | Visit our website at www.prudential.com |
Statement of Changes in Net Assets
| Year Ended March 31, | ||||||||
| 2006 | 2005 | |||||||
Increase (Decrease) In Net Assets | ||||||||
Operations | ||||||||
Net investment income | $ | 52,637,810 | $ | 28,538,290 | ||||
Net realized gain on investment transactions | 35,580 | 344 | ||||||
Net increase in net assets resulting from operations | 52,673,390 | 28,538,634 | ||||||
Dividends and distributions (Note 1) | ||||||||
Class A | (12,001,503 | ) | (4,895,545 | ) | ||||
Class I | (40,671,887 | ) | (23,643,089 | ) | ||||
| (52,673,390 | ) | (28,538,634 | ) | |||||
Series share transactions (Net of conversions) (Note 6) | ||||||||
Net proceeds from shares sold | 8,938,927,650 | 9,221,538,047 | ||||||
Net asset value of shares issued in reinvestment of | 47,891,381 | 24,442,275 | ||||||
Cost of shares reacquired | (9,184,596,616 | ) | (9,888,425,801 | ) | ||||
Net decrease in net assets from Series share transactions | (197,777,585 | ) | (642,445,479 | ) | ||||
Total decrease | (197,777,585 | ) | (642,445,479 | ) | ||||
Net Assets | ||||||||
Beginning of year | 1,649,301,105 | 2,291,746,584 | ||||||
End of year | $ | 1,451,523,520 | $ | 1,649,301,105 | ||||
See Notes to Financial Statements.
| Prudential Institutional Liquidity Portfolio, Inc./Institutional Money Market Series | 13 |
Notes to Financial Statements
Prudential Institutional Liquidity Portfolio, Inc. (the “Fund”) is registered under the Investment Company Act of 1940 as an open-end, management investment company. The Fund consists of two series—the Institutional Money Market Series (the “Series”) and the Liquid Assets Series. The Liquid Assets Series has not yet commenced operations. The investment objective of the Series is high current income consistent with the preservation of principal and liquidity. The Series invests primarily in money market instruments maturing in 13 months or less whose ratings are within the 2 highest ratings categories by a nationally recognized statistical rating organization or, if not rated, are of comparable quality. The ability of the issuers of the securities held by the Series to meet their obligations may be affected by economic developments in a specific industry or region.
Note 1. Accounting Policies
The following is a summary of significant accounting policies followed by the Fund and the Series in the preparation of its financial statements.
Securities Valuation: Portfolio securities of the Series are valued at amortized cost, which approximates market value. The amortized cost method involves valuing a security at its cost on the date of purchase and thereafter assuming a constant amortization to maturity of any discount or premium. If the amortized cost method is determined not to represent fair value, the fair value shall be determined by or under the direction of the Board of Directors.
Investments in mutual funds are valued at their net asset value as of the close of the New York Stock Exchange on the date of valuation.
The Series may hold up to 10% of its net assets in illiquid securities, including those that are restricted as to disposition under securities law (“restricted securities”). Restricted securities, sometimes referred to as private placements, are valued pursuant to the valuation procedures noted above.
Repurchase Agreements: In connection with transactions in repurchase agreements with U.S. financial institutions, it is the Series’ policy that its custodian or designated sub custodians, as the case may be under triparty repurchase agreements, take possession of the underlying collateral securities, the value of which exceeds the principal amount of the repurchase transaction, including accrued interest. To the extent that any repurchase agreement exceeds one business day, the value of collateral is marked-to-market on a daily basis to ensure adequacy of the collateral. If
| 14 | Visit our website at www.prudential.com |
the seller defaults and the value of the collateral declines or if bankruptcy proceedings are commenced with respect to the seller of the security, realization of the collateral by the Series may be delayed or limited.
Securities Transactions and Net Investment Income: Securities transactions are recorded on the trade date. Realized gains or losses on sales of securities are calculated on the identified cost basis. Interest income, including amortization of premium and accretion of discount on debt securities, as required, is recorded on the accrual basis. Expenses are recorded on the accrual basis.
Net investment income or loss (other than distribution fees, which are charged directly to the respective classes) and realized gains or losses are allocated daily to each class of shares based upon the relative proportion of net assets of each class at the beginning of the day.
Federal Income Taxes: For federal income tax purposes, each series in the Fund is treated as a separate taxpaying entity. It is the Series’ policy to continue to meet the requirements of the Internal Revenue Code applicable to regulated investment companies and to distribute all of its taxable net investment income and capital gains, if any, to its shareholders. Therefore, no federal income tax provision is required.
Dividends and Distributions: The Series declares daily dividends from net investment income and net realized short-term capital gains or losses. Payment of dividends is made monthly. Dividends and distributions are determined in accordance with federal income tax regulations, which may differ from generally accepted accounting principles.
Estimates: The preparation of the financial statements requires management to make estimates and assumptions that affect the reported amounts and disclosures in the financial statements. Actual results could differ from those estimates.
Note 2. Agreements
The Fund has a management agreement with Prudential Investments LLC (“PI”). Pursuant to this agreement, PI has responsibility for all investment advisory services and supervises the subadvisor’s performance of such services. PI has entered into a subadvisory agreement with Prudential Investment Management, Inc. (“PIM”). The subadvisory agreement provides that PIM will furnish investment advisory services in connection with the management of the Series. In connection therewith, PIM is obligated to keep certain books and records of the Series. PI continues to have responsibility for all investment advisory services pursuant to the management agreement and supervises PIM’s
| Prudential Institutional Liquidity Portfolio, Inc./Institutional Money Market Series | 15 |
Notes to Financial Statements
Cont’d
performance of such services. PI pays for the services of PIM, the cost of compensation of officers of the Series, occupancy and certain clerical and bookkeeping costs of the Series. The Series bears all other costs and expenses.
The management fee paid to PI is accrued daily and payable monthly, at an annual rate of .20 of 1% of the average daily net assets of the Series. PI has contractually agreed to waive a portion (.05 of 1% of the Series’ average daily net assets) of its management fee, which amounted to $725,469 ($.0005 per share) for the year ended March 31, 2006. The Series is not required to reimburse PI for such waiver.
The Series has a distribution agreement with Prudential Investment Management Services LLC (“PIMS”), which acts as the distributor of the Series’ Class A and Class I shares. The Series compensates PIMS for distributing and servicing the Series’ Class A shares, pursuant to the plan of distribution at an annual rate of .12 of 1% of the Series’ average daily net assets of the Class A shares. PIMS has contractually agreed to waive a portion (.07 of 1% of the Series’ average daily net assets of the Class A shares) of the distribution fee, which amounted to $226,108 ($.0007 per Class A share) for the year ended March 31, 2006. The Series is not required to reimburse PIMS for such waiver. The Class A distribution fee is accrued daily and payable monthly. No distribution or service fees are paid to PIMS as distributor of the Class I shares of the Series.
PI, PIM and PIMS are indirect, wholly-owned subsidiaries of Prudential Financial, Inc. (“Prudential”).
Note 3. Other Transactions with Affiliates
Prudential Mutual Fund Services LLC (“PMFS”), an affiliate of PI and an indirect, wholly-owned subsidiary of Prudential, serves as the Fund’s transfer agent. Transfer agent’s fees and expenses in the Statement of Operations include certain out-of-pocket expenses paid to nonaffiliates, where applicable.
The Series invests in the Taxable Money Market Series (the “Portfolio”), a portfolio of the Dryden Core Investment Fund, pursuant to an exemptive order received from the Securities and Exchange Commission. The Portfolio is a money market mutual fund registered under the Investment Company Act of 1940, as amended, and managed by PI.
| 16 | Visit our website at www.prudential.com |
Note 4. Expense Subsidy
PI has contractually agreed to subsidize operating expenses so that total Series operating expenses do not exceed .20% and .15% of the average daily net assets of the Class A and Class I shares, respectively. For the year ended March 31, 2006, such reimbursement amounted to $677,625 ($.0005 per share for Class A and I shares; 0.05% of average net assets).
Note 5. Distributions and Tax Information
Distributions to shareholders, which are determined in accordance with federal income tax regulations and which may differ from generally accepted accounting principles, are recorded on the ex-dividend date. In order to present undistributed net investment income, accumulated net realized capital gains and paid-in capital on the Statement of Assets and Liabilities that more closely represent their tax character, certain adjustments have been made to undistributed net investment income and accumulated net realized gains on investments. For the year ended March 31, 2006, the adjustment was to decrease accumulated net realized gains and increase undistributed net investment income by $35,580 for distribution of realized gains. Net investment income, net realized gains and net assets were not affected by this change.
For the year ended March 31, 2006 and March 31, 2005, the tax character of dividends paid, as reflected in the Statement of Changes in Net Assets, of $52,673,390 and $28,538,634, respectively, was ordinary income for federal income tax purposes.
As of March 31, 2006, the accumulated undistributed earnings on a tax basis were $1,588,561 of taxable ordinary income (includes a timing difference of $1,567,315 for dividends payable).
Note 6. Capital
The Series offers Class A and Class I shares. Class A shareholders of the Series who satisfy the minimum purchase requirements to purchase Class I shares will have their Class A shares exchanged for Class I shares on a quarterly basis.
There are 10 billion authorized shares of common stock, $.001 par value per share, divided into 5 billion authorized Class A shares and 5 billion authorized Class I shares.
As of March 31, 2006 Prudential owned 12,985,305 Class A shares and 222,700,370 Class I shares.
| Prudential Institutional Liquidity Portfolio, Inc./Institutional Money Market Series | 17 |
Notes to Financial Statements
Cont’d
Class A | Share and Dollar Amounts | ||
Year ended March 31, 2006: | |||
Shares sold | 913,740,581 | ||
Shares issued in reinvestment of dividends and distributions | 10,968,903 | ||
Shares reacquired | (671,432,063 | ) | |
Net increase (decrease) in shares outstanding before conversion | 253,277,421 | ||
Shares reacquired upon conversion into Class I | (48,845,225 | ) | |
Net increase (decrease) in shares outstanding | 204,432,196 | ||
Year ended March 31, 2005: | |||
Shares sold | 588,101,637 | ||
Shares issued in reinvestment of dividends and distributions | 4,590,980 | ||
Shares reacquired | (596,171,573 | ) | |
Net increase (decrease) in shares outstanding before conversion | (3,478,956 | ) | |
Shares reacquired upon conversion into Class I | (59,722,306 | ) | |
Net increase (decrease) in shares outstanding | (63,201,262 | ) | |
Class I | |||
Year ended March 31, 2006: | |||
Shares sold | 8,025,187,069 | ||
Shares issued in reinvestment of dividends and distributions | 36,922,478 | ||
Shares reacquired | (8,513,164,553 | ) | |
Net increase (decrease) in shares outstanding before conversion | (451,055,005 | ) | |
Shares issued upon conversion from Class A | 48,845,225 | ||
Net increase (decrease) in shares outstanding | (402,209,781 | ) | |
Year ended March 31, 2005: | |||
Shares sold | 8,633,436,410 | ||
Shares issued in reinvestment of dividends and distributions | 19,851,295 | ||
Shares reacquired | (9,292,254,228 | ) | |
Net increase (decrease) in shares outstanding before conversion | (638,966,523 | ) | |
Shares issued upon conversion from Class A | 59,722,306 | ||
Net increase (decrease) in shares outstanding | (579,244,217 | ) | |
| 18 | Visit our website at www.prudential.com |
ANNUAL REPORT
MARCH 31, 2006
PRUDENTIAL
INSTITUTIONAL MONEY MARKET SERIES
FINANCIAL HIGHLIGHTS
Financial Highlights
| Class A | ||||
| Year Ended March 31, 2006 | ||||
Per Share Operating Performance: | ||||
Net Asset Value, Beginning Of Year | $ | 1.00 | ||
Net investment income and net realized gains(b) | .036 | |||
Dividends and distributions to shareholders | (.036 | ) | ||
Net asset value, end of year | $ | 1.00 | ||
Total Return(a): | 3.63 | % | ||
Ratios/Supplemental Data: | ||||
Net assets, end of year (000) | $ | 472,993 | ||
Average net assets (000) | $ | 323,012 | ||
Ratios to average net assets: | ||||
Expenses, including distribution and service (12b-1) fees(b) | .20 | % | ||
Expenses, excluding distribution and service (12b-1) fees(c) | .15 | % | ||
Net investment income(b) | 3.71 | % | ||
| (a) | Total return is calculated assuming a purchase of shares on the first day and a sale on the last day of each year reported, and includes reinvestment of dividends and distributions. |
| (b) | Net of management and distribution fee waiver and expense subsidy (Notes 2 and 4). |
| (c) | Net of management fee waiver and expense subsidy (Notes 2 and 4). |
See Notes to Financial Statements.
| 20 | Visit our website at www.prudential.com |
| Class A | ||||||||||||||
| Year Ended March 31, | ||||||||||||||
| 2005 | 2004 | 2003 | 2002 | |||||||||||
| $ | 1.00 | $ | 1.00 | $ | 1.00 | $ | 1.00 | |||||||
| .016 | .010 | .016 | .031 | |||||||||||
| (.016 | ) | (.010 | ) | (.016 | ) | (.031 | ) | |||||||
| $ | 1.00 | $ | 1.00 | $ | 1.00 | $ | 1.00 | |||||||
| 1.55 | % | 1.04 | % | 1.61 | % | 3.34 | % | |||||||
| $ | 268,561 | $ | 331,762 | $ | 439,783 | $ | 433,001 | |||||||
| $ | 317,021 | $ | 383,687 | $ | 402,953 | $ | 468,805 | |||||||
| .20 | % | .20 | % | .20 | % | .20 | % | |||||||
| .15 | % | .15 | % | .15 | % | .15 | % | |||||||
| 1.54 | % | 1.03 | % | 1.58 | % | 3.23 | % | |||||||
See Notes to Financial Statements.
| Prudential Institutional Liquidity Portfolio, Inc./Institutional Money Market Series | 21 |
Financial Highlights
Cont’d
| Class I | ||||
| Year Ended March 31, 2006 | ||||
Per Share Operating Performance: | ||||
Net Asset Value, Beginning Of Year | $ | 1.00 | ||
Net investment income and net realized gains(b) | .037 | |||
Dividends and distributions to shareholders | (.037 | ) | ||
Net asset value, end of year | $ | 1.00 | ||
Total Return(a): | 3.68 | % | ||
Ratios/Supplemental Data: | ||||
Net assets, end of year (000) | $ | 978,531 | ||
Average net assets (000) | $ | 1,127,926 | ||
Ratios to average net assets: | ||||
Expenses, including distribution and service (12b-1) fees(b) | .15 | % | ||
Expenses, excluding distribution and service (12b-1) fees(b) | .15 | % | ||
Net investment income(b) | 3.60 | % | ||
| (a) | Total return is calculated assuming a purchase of shares on the first day and a sale on the last day of each year reported, and includes reinvestment of dividends and distributions. |
| (b) | Net of management fee waiver and expense subsidy (Notes 2 and 4). |
See Notes to Financial Statements.
| 22 | Visit our website at www.prudential.com |
| Class I | ||||||||||||||
| Year Ended March 31, | ||||||||||||||
| 2005 | 2004 | 2003 | 2002 | |||||||||||
| $ | 1.00 | $ | 1.00 | $ | 1.00 | $ | 1.00 | |||||||
| .016 | .011 | .016 | .032 | |||||||||||
| (.016 | ) | (.011 | ) | (.016 | ) | (.032 | ) | |||||||
| $ | 1.00 | $ | 1.00 | $ | 1.00 | $ | 1.00 | |||||||
| 1.60 | % | 1.09 | % | 1.66 | % | 3.39 | % | |||||||
| $ | 1,380,740 | $ | 1,959,985 | $ | 1,713,905 | $ | 3,704,670 | |||||||
| $ | 1,547,937 | $ | 1,688,851 | $ | 2,982,413 | $ | 3,729,340 | |||||||
| .15 | % | .15 | % | .15 | % | .15 | % | |||||||
| .15 | % | .15 | % | .15 | % | .15 | % | |||||||
| 1.53 | % | 1.07 | % | 1.69 | % | 3.05 | % | |||||||
See Notes to Financial Statements.
| Prudential Institutional Liquidity Portfolio, Inc./Institutional Money Market Series | 23 |
Report of Independent Registered Public Accounting Firm
To the Board of Directors and Shareholders of
Prudential Institutional Liquidity Portfolio, Inc—Institutional Money Market Series:
We have audited the accompanying statements of assets and liabilities of Prudential Institutional Liquidity Portfolio, Inc–Institutional Money Market Series (the “Series”), including the portfolio of investments as of March 31, 2006, and the related statements of operations for the year then ended, and statement of changes in net assets for each of the years in the two-year period then ended and financial highlights for each of the years in the three-year period then ended. These financial statements and financial highlights are the responsibility of the Series’ management. Our responsibility is to express an opinion on these financial statements and the financial highlights based on our audits. The financial highlights for the periods presented prior to April 1, 2003, were audited by other auditors, whose report dated May 15, 2003, expressed an unqualified opinion thereon.
We conducted our audits in accordance with the Public Company Accounting Oversight Board (United States). Those standards require that we plan and perform the audit to obtain reasonable assurance about whether the financial statements and financial highlights are free of material misstatement. An audit includes examining, on a test basis, evidence supporting the amounts and disclosures in the financial statements and financial highlights. Our procedures included confirmation of securities owned as of March 31, 2006, by correspondence with the custodian and brokers or by other appropriate audit procedures when replies from brokers were not received. An audit also includes assessing the accounting principles used and significant estimates made by management, as well as evaluating the overall financial statement presentation. We believe that our audits provide a reasonable basis for our opinion.
In our opinion, the financial statements and financial highlights referred to above present fairly, in all material respects, the financial position of the Series as of March 31, 2006, and the results of its operations for the year then ended, and the changes in its net assets for each of the years in the two-year period then ended and financial highlights for each of the years in the three-year period then ended, in conformity with U.S. generally accepted accounting principles.

New York, New York
May 26, 2006
| 24 | Visit our website at www.prudential.com |
Federal Income Tax Information
(Unaudited)
We are required by the Internal Revenue Code to advise you within 60 days of the Fund’s fiscal year end (March 31, 2006) as to the federal status of dividends paid by the Fund during such fiscal year. Accordingly, we are advising you that in the fiscal year ended March 31, 2006, dividends were paid of $0.036 per share and $0.037 per share (representing net investment income for Class A and Class I shares; respectively), which are taxable as ordinary income.
The Fund intends to designate 100% of the ordinary income dividends as qualified interest income under the American Jobs Creation Act of 2004.
In January 2007, you will be advised on IRS Form 1099 DIV or substitute 1099 DIV as to the federal tax status of the distributions received by you in calendar year 2006.
| Prudential Institutional Liquidity Portfolio, Inc./Institutional Money Market Series | 25 |
Management of the Fund
(Unaudited)
Information pertaining to the Directors of the Fund is set forth below. Directors who are not deemed to be “interested persons” of the Fund, as defined in the Investment Company Act of 1940 (the 1940 Act), are referred to as “Independent Directors.” Directors who are deemed to be “interested persons” of the Fund are referred to as “Interested Directors.” “Fund Complex”† consists of the Fund and any other investment companies managed by PI.
Independent Directors(2)
Linda W. Bynoe (53), Director since 2005(3) Oversees 82 portfolios in Fund complex
Principal occupations (last 5 years): President and Chief Executive Officer (since March 1995) of Telemat, Ltd. (management consulting); formerly Vice President at Morgan Stanley & Co.
Other Directorships held: Director of Simon Property Group, Inc. (real estate investment trust) (since May 2003); Anixter International (communication products distributor) (since January 2006) and Director of Northern Trust Corporation (since April 2006).
David E.A. Carson (71), Director since 2003(3) Oversees 86 portfolios in Fund complex
Principal occupations (last 5 years): Formerly Director (January 2000 to May 2000), Chairman (January 1999 to December 1999), Chairman and Chief Executive Officer (January 1998 to December 1998) and President, Chairman and Chief Executive Officer (1983-1997) of People’s Bank.
Robert E. La Blanc (72), Director since 1996(3) Oversees 85 portfolios in Fund complex
Principal occupations (last 5 years): President (since 1981) of Robert E. La Blanc Associates, Inc. (telecommunications).
Other Directorships held:(4) Director of Chartered Semiconductor Manufacturing, Ltd. (since 1998); Computer Associates International, Inc. (software company) (since 2002); FiberNet Telecom Group, Inc. (telecom company) (since 2003).
Douglas H. McCorkindale (66), Director since 2003(3) Oversees 85 portfolios in Fund complex
Principal occupations (last 5 years): Chairman (since February 2001) of Gannett Co. Inc. (publishing and media); formerly Chief Executive Officer (June 2000-July 2005) President (September 1997-July 2005) and Vice Chairman (March 1984-May 2000) of Gannett Co., Inc.
Other Directorships held:(4) Director of Gannett Co. Inc., Director of Continental Airlines, Inc. (since May 1993); Director of Lockheed Martin Corp. (aerospace and defense) (since May 2001).
Richard A. Redeker (62), Director since 2003(3) Oversees 85 portfolios in Fund complex
Principal occupations (last 5 years): Management Consultant; Director (since 2001) and Chairman of the Board (since 2006) of Invesmart, Inc. and Director of Penn Tank Lines, Inc. (since 1999).
Robin B. Smith (66), Director since 1987(3) Oversees 85 portfolios in Fund complex
Principal occupations (last 5 years): Chairman of the Board (since January 2003) of Publishers Clearing House (direct marketing); formerly Chairman and Chief Executive Officer (August 1996-January 2003) of Publishers Clearing House.
Other Directorships held:(4) Director of BellSouth Corporation (since 1992).
| 26 | Visit our website at www.prudential.com |
Stephen G. Stoneburn (62), Director since 1996(3) Oversees 85 portfolios in Fund complex
Principal occupations (last 5 years): President and Chief Executive Officer (since June 1996) of Quadrant Media Corp. (a publishing company); formerly President (June 1995-June 1996) of Argus Integrated Media, Inc.; Senior Vice President and Managing Director (January 1993-1995) of Cowles Business Media and Senior Vice President of Fairchild Publications, Inc. (1975-1989).
Clay T. Whitehead (67), Director since 1999(3) Oversees 85 portfolios in Fund complex
Principal occupations (last 5 years): President (since 1983) of YCO (new business development firm).
Interested Directors(1)
Judy A. Rice (58), President since 2003 and Director since 2000(3) Oversees 81 portfolios in Fund complex
Principal occupations (last 5 years): President, Chief Executive Officer, Chief Operating Officer and Officer-In-Charge (since February 2003) of Prudential Investments LLC; Vice President (since February 1999) of Prudential Investment Management Services LLC; President, Chief Executive Officer and Officer-In-Charge (since April 2003) of Prudential Mutual Fund Services LLC; Director (since May 2003) and Executive Vice President (since June 2005) of American Skandia Investment Services, Inc.; formerly Executive Vice President (September 1999-February 2003) of Prudential Investments LLC; Member of Board of Governors of the Money Management Institute.
Robert F. Gunia (59), Vice President and Director since 1996(3) Oversees 158 portfolios in Fund complex
Principal occupations (last 5 years): Chief Administrative Officer (since September 1999) and Executive Vice President (since December 1996) of Prudential Investments LLC; President (since April 1999) of Prudential Investment Management Services LLC; Executive Vice President (since March 1999) and Treasurer (since May 2000) of Prudential Mutual Fund Services LLC.
Other Directorships held:(4) Vice President and Director (since May 1989) and Treasurer (since 1999) of The Asia Pacific Fund, Inc.
Information pertaining to the Officers of the Fund who are not also Directors is set forth below.
Officers(2)
Kathryn L. Quirk (53), Chief Legal Officer since 2005(3)
Principal occupations (last 5 years): Vice President and Corporate Counsel (since September 2004) of Prudential; Executive Vice President, Chief Legal Officer and Secretary (since July 2005) of Prudential Investments LLC and Prudential Mutual Fund Services LLC; formerly Managing Director, General Counsel, Chief Compliance Officer, Chief Risk Officer and Corporate Secretary (1997-2002) of Zurich Scudder Investments, Inc.
Deborah A. Docs (48), Secretary since 2005(3)
Principal occupations (last 5 years): Vice President and Corporate Counsel (since January 2001) of Prudential; Vice President (since December 1996) and Assistant Secretary (since March 1999) of PI; formerly Vice President and Assistant Secretary (May 2003-June 2005) of American Skandia Investment Services, Inc.
Jonathan D. Shain (47), Assistant Secretary since 2005(3)
Principal occupations (last 5 years): Vice President and Corporate Counsel (since August 1998) of Prudential; Vice President and Assistant Secretary (since May 2001) of PI; Vice President and Assistant Secretary (since February 2001) of PMFS; formerly Vice President and Assistant Secretary (May 2003-June 2005) of American Skandia Investment Services, Inc.
| Prudential Institutional Liquidity Portfolio, Inc./Institutional Money Market Series | 27 |
Claudia DiGiacomo (31), Assistant Secretary since 2005(3)
Principal occupations (last 5 years): Vice President and Corporate Counsel (since January 2005) of Prudential; Vice President and Assistant Secretary of PI (since December 2005); Associate at Sidley Austin Brown & Wood LLP (1999-2004).
Helene Gurian (52), Acting Anti-Money Laundering Compliance Officer since 2006(3)
Principal occupations (last 5 years): Vice President, Prudential (since July 1997); Vice President, Compliance (July 1997-January 2001); Vice President, Compliance and Risk Officer, Retail Distribution (January 2001-May 2002); Vice President, Corporate Investigations (May 2002-present) responsible for supervision of Prudential’s fraud investigations, anti-money laundering program and high technology investigation unit.
Lee D. Augsburger (46), Chief Compliance Officer since 2004(3)
Principal occupations (last 5 years): Senior Vice President and Chief Compliance Officer (since April 2003) of PI; Vice President (since November 2000) and Chief Compliance Officer (since October 2000) of Prudential Investment Management, Inc.; Chief Compliance Officer and Senior Vice President (since May 2003) of American Skandia Investment Services, Inc.
Grace C. Torres (46), Treasurer and Principal Financial and Accounting Officer since 1997(3)
Principal occupations (last 5 years): Assistant Treasurer (since March 1999) and Senior Vice President (since September 1999) of PI; Assistant Treasurer (since May 2003) and Vice President (since June 2005) of American Skandia Investment Services, Inc.; Senior Vice President and Assistant Treasurer (since May 2003) of American Skandia Advisory Services, Inc.; formerly Senior Vice President (May 2003-June 2005) of American Skandia Investment Services, Inc.
John P. Schwartz (35), Assistant Secretary since 2006(3)
Principal occupations (last 5 years): Vice President and Corporate Counsel (since April 2005) of Prudential; Vice President and Assistant Secretary (since December 2005) of PI; Associate at Sidley, Austin Brown & Wood LLP (1997-2005).
M. Sadiq Peshimam (42), Assistant Treasurer since 2006(3)
Principal occupations (last 5 years): Vice President (since 2005) and Director (since 2000) within Prudential Mutual Fund Administration.
Jack Benintende (42), Assistant Treasurer since 2006(3)
Principal occupations (last 5 years): Vice President (since June 2000) within Prudential Mutual Fund Administration; formerly senior manager within the investment management practice of PricewaterhouseCoopers LLP (May 1994 through June 2000).
| 28 | Visit our website at www.prudential.com |
| † | The Fund Complex consists of all investment companies managed by PI. The Funds for which PI serves as manager include Jennison Dryden Mutual Funds, Strategic Partners Funds, The Prudential Variable Contract Accounts 2, 10, 11. The Target Portfolio Trust, The Prudential Series Fund, American Skandia Trust, and Prudential’s Gibraltar Fund, Inc. |
| (1) | “Interested” Director, as defined in the 1940 Act, by reason of employment with the Manager (Prudential Investments LLC or PI), the Subadviser (Prudential Investment Management, Inc. or PIM) or the Distributor (Prudential Investment Management Services LLC or PIMS). |
| (2) | Unless otherwise noted, the address of the Directors and Officers is c/o: Prudential Investments LLC, Gateway Center Three, 100 Mulberry Street, Newark, NJ 07102. |
| (3) | There is no set term of office for Directors and Officers. The Independent Directors have adopted a retirement policy, which calls for the retirement of Directors on December 31 of the year in which they reach the age of 75. The table shows the individuals length of service as Director and/or Officer. |
| (4) | This includes only directorships of companies required to register, or file reports with the SEC under the Securities and Exchange Act of 1934 (that is, “public companies”) or other investment companies registered under the 1940 Act. |
Additional Information about the Fund’s Directors is included in the Fund’s Statement of Additional Information which is available without charge, upon request, by calling (800) 521-7466 or (732) 482-7555 (Calling from outside the U.S.)
| Prudential Institutional Liquidity Portfolio, Inc./Institutional Money Market Series | 29 |
| n MAIL | n TELEPHONE | n WEBSITE | ||
Gateway Center Three 100 Mulberry Street Newark, NJ 07102 | (800) 521-7466 | www.prudential.com |
| PROXY VOTING |
| The Board of Directors of PILP has delegated to the Series’ investment subadvisor the responsibility for voting any proxies and maintaining proxy recordkeeping with respect to the Series. A description of these proxy voting policies and procedures is available without charge, upon request, by calling (800) 225-1852 or by visiting the Securities and Exchange Commission’s website at www.sec.gov. Information regarding how the Series voted proxies relating to portfolio securities during the most recent 12-month period ended June 30 is available on the Series’ website and on the Commission’s website. |
| DIRECTORS |
| Linda W. Bynoe • David E.A. Carson • Robert F. Gunia • Robert E. La Blanc • Douglas H. McCorkindale • Richard A. Redeker • Judy A. Rice • Robin B. Smith • Stephen G. Stoneburn • Clay T. Whitehead |
| OFFICERS |
| Judy A. Rice, President • Robert F. Gunia, Vice President • Grace C. Torres, Treasurer and Principal Financial and Accounting Officer • Jack Benintende, Assistant Treasurer • M. Sadiq Peshimam, Assistant Treasurer • Kathryn L. Quirk, Chief Legal Officer • Deborah A. Docs, Secretary • Jonathan D. Shain, Assistant Secretary • Claudia DiGiacomo, Assistant Secretary • John P. Schwartz, Assistant Secretary • Helene Gurian, Acting Anti-Money Laundering Compliance Officer • Lee D. Augsburger, Chief Compliance Officer |
| MANAGER | Prudential Investments LLC | Gateway Center Three 100 Mulberry Street Newark, NJ 07102 | ||
| INVESTMENT SUBADVISOR | Prudential Investment Management, Inc. | Gateway Center Two 100 Mulberry Street Newark, NJ 07102 | ||
| DISTRIBUTOR | Prudential Investment Management Services LLC | Gateway Center Three 100 Mulberry Street Newark, NJ 07102 | ||
| CUSTODIAN | The Bank of New York | One Wall Street New York, NY 10286 | ||
| TRANSFER AGENT | Prudential Mutual Fund Services LLC | PO Box 8098 Philadelphia, PA 19176 | ||
| INDEPENDENT REGISTERED PUBLIC ACCOUNTING FIRM | KPMG LLP | 345 Park Avenue New York, NY 10154 | ||
| FUND COUNSEL | Sullivan & Cromwell LLP | 125 Broad Street New York, NY 10004 | ||
| An investor should consider the investment objectives, risks, charges, and expenses of the Series carefully before investing. The prospectus for the Series contains this and other information about the Series. An investor may obtain a prospectus by visiting our website at www.prudential.com or by calling (800) 225-1852. The prospectus should be read carefully before investing. |
E-DELIVERY To receive your mutual fund documents on-line, go to www.icsdelivery.com/prudential/funds |
| SHAREHOLDER COMMUNICATIONS WITH DIRECTORS |
| Shareholders of the Series can communicate directly with the Board of Directors by writing to the Chair of the Board, Prudential Institutional Liquidity Portfolio, Inc./Institutional Money Market Series, PO Box 13964, Philadelphia, PA 19176. Shareholders can communicate directly with an individual Director by writing to the same address. Communications are not screened before being delivered to the addressee. |
| AVAILABILITY OF PORTFOLIO SCHEDULE |
| The Series files its complete schedule of portfolio holdings with the Securities and Exchange Commission for the first and third quarters of each fiscal year on Form N-Q. The Series’ Forms N-Q are available on the Commission’s website at www.sec.gov. The Series’ Forms N-Q may also be reviewed and copied at the Commission’s Public Reference Room in Washington, D.C. Information on the operation and location of the Public Reference Room may be obtained by calling (800) SEC-0330 (732-0330). The Series’ schedule of portfolio holdings is also available on the Series’ website as of the end of each fiscal quarter. |
| The Series’ Statement of Additional Information contains additional information about the Series’ Directors and is available without charge, upon request, by calling (800) 225-1852. |
Mutual Funds:
| ARE NOT INSURED BY THE FDIC OR ANY FEDERAL GOVERNMENT AGENCY | MAY LOSE VALUE | ARE NOT A DEPOSIT OF OR GUARANTEED BY ANY BANK OR ANY BANK AFFILIATE |

| PILP/Institutional Money Market Series | ||||||||
| Share Class | Class A | Class I | ||||||
NASDAQ | PIMXX | PLPXX | ||||||
CUSIP | 744350109 | 744350604 | ||||||
MF137E IFS-A118940 Ed. 05/2006
Item 2 – Code of Ethics — See Exhibit (a)
As of the end of the period covered by this report, the registrant has adopted a code of ethics (the “Section 406 Standards for Investment Companies – Ethical Standards for Principal Executive and Financial Officers”) that applies to the registrant’s Principal Executive Officer and Principal Financial Officer; the registrant’s Principal Financial Officer also serves as the Principal Accounting Officer.
The registrant hereby undertakes to provide any person, without charge, upon request, a copy of the code of ethics. To request a copy of the code of ethics, contact the registrant 973-367-7521, and ask for a copy of the Section 406 Standards for Investment Companies - Ethical Standards for Principal Executive and Financial Officers.
Item 3 – Audit Committee Financial Expert –
The registrant’s Board has determined that Mr. David Carson, member of the Board’s Audit Committee is an “audit committee financial expert,” and that he is “independent,” for purposes of this Item.
Item 4 – Principal Accountant Fees and Services –
(a) Audit Fees
For the fiscal years ended March 31, 2006 and March 31, 2005, KPMG LLP (“KPMG”), the Registrant’s principal accountant, billed the Registrant $15,400 and $15,400, respectively, for professional services rendered for the audit of the Registrant’s annual financial statements or services that are normally provided in connection with statutory and regulatory filings.
(b) Audit-Related Fees
None.
(c) Tax Fees
None.
(d) All Other Fees
None.
(e) (1) Audit Committee Pre-Approval Policies and Procedures
THE PRUDENTIAL MUTUAL FUNDS
AUDIT COMMITTEE POLICY
on
Pre-Approval of Services Provided by the Independent Accountants
The Audit Committee of each Prudential Mutual Fund is charged with the responsibility to monitor the independence of the Fund’s independent accountants. As part of this responsibility, the Audit Committee must pre-approve any independent accounting firm’s engagement to render audit and/or permissible non-audit services, as required by law. In evaluating a proposed engagement of the independent accountants, the Audit Committee will assess the effect that the engagement might reasonably be expected to have on the accountant’s independence. The Committee’s evaluation will be based on:
| • | a review of the nature of the professional services expected to be provided, |
| • | a review of the safeguards put into place by the accounting firm to safeguard independence, and |
| • | periodic meetings with the accounting firm. |
Policy for Audit and Non-Audit Services Provided to the Funds
On an annual basis, the scope of audits for each Fund, audit fees and expenses, and audit-related and non-audit services (and fees proposed in respect thereof) proposed to be performed by the Fund’s independent accountants will be presented by the Treasurer and the independent accountants to the Audit Committee for review and, as appropriate, approval prior to the initiation of such services. Such presentation shall be accompanied by confirmation by both the Treasurer and the independent accountants that the proposed services will not adversely affect the independence of the independent accountants. Proposed services shall be described in sufficient detail to enable the Audit Committee to assess the appropriateness of such services and fees, and the compatibility of the provision of such services with the auditor’s independence. The Committee shall receive periodic reports on the progress of the audit and other services which are approved by the Committee or by the Committee Chair pursuant to authority delegated in this Policy.
The categories of services enumerated under “Audit Services”, “Audit-related Services”, and “Tax Services” are intended to provide guidance to the Treasurer and the independent accountants as to those categories of services which the Committee believes are generally consistent with the independence of the independent accountants and which the Committee (or the Committee Chair) would expect upon the presentation of specific proposals to pre-approve. The enumerated categories are not intended as an exclusive list of audit, audit-related or tax services which the Committee (or the Committee Chair) would consider for pre-approval.
Audit Services
The following categories of audit services are considered to be consistent with the role of the Fund’s independent accountants:
| • | Annual Fund financial statement audits |
| • | Seed audits (related to new product filings, as required) |
| • | SEC and regulatory filings and consents |
Audit-related Services
The following categories of audit-related services are considered to be consistent with the role of the Fund’s independent accountants:
| • | Accounting consultations |
| • | Fund merger support services |
| • | Agreed Upon Procedure Reports |
| • | Attestation Reports |
| • | Other Internal Control Reports |
Individual audit-related services that fall within one of these categories and are not presented to the Audit Committee as part of the annual pre-approval process will be subject to pre-approval by the Committee Chair (or any other Committee member on whom this responsibility has been delegated) so long as the estimated fee for those services does not exceed $50,000.
Tax Services
The following categories of tax services are considered to be consistent with the role of the Fund’s independent accountants:
| • | Tax compliance services related to the filing or amendment of the following: |
| • | Federal, state and local income tax compliance; and, |
| • | Sales and use tax compliance |
| • | Timely RIC qualification reviews |
| • | Tax distribution analysis and planning |
| • | Tax authority examination services |
| • | Tax appeals support services |
| • | Accounting methods studies |
| • | Fund merger support services |
| • | Tax consulting services and related projects |
Individual tax services that fall within one of these categories and are not presented to the Audit Committee as part of the annual pre-approval process will be subject to pre-approval by the Committee Chair (or any other Committee member on whom this responsibility has been delegated) so long as the estimated fee for those services does not exceed $50,000.
Other Non-audit Services
Certain non-audit services that the independent accountants are legally permitted to render will be subject to pre-approval by the Committee or by one or more Committee members to whom the Committee has delegated this authority and who will report to the full Committee any pre-approval decisions made pursuant to this Policy. Non-audit services presented for pre-approval pursuant to this paragraph will be accompanied by a confirmation from both the Treasurer and the independent accountants that the proposed services will not adversely affect the independence of the independent accountants.
Proscribed Services
The Fund’s independent accountants will not render services in the following categories of non-audit services:
| • | Bookkeeping or other services related to the accounting records or financial statements of the Fund |
| • | Financial information systems design and implementation |
| • | Appraisal or valuation services, fairness opinions, or contribution-in-kind reports |
| • | Actuarial services |
| • | Internal audit outsourcing services |
| • | Management functions or human resources |
| • | Broker or dealer, investment adviser, or investment banking services |
| • | Legal services and expert services unrelated to the audit |
| • | Any other service that the Public Company Accounting Oversight Board determines, by regulation, is impermissible. |
Pre-approval of Non-Audit Services Provided to Other Entities Within the Prudential Fund Complex
Certain non-audit services provided to Prudential Investments LLC or any of its affiliates that also provide ongoing services to the Prudential Mutual Funds will be subject to pre-approval by the Audit Committee. The only non-audit services provided to these entities that will require pre-approval are those related directly to the operations and financial reporting of the Funds. Individual projects that are not presented to the Audit Committee as part of the annual pre-approval process, will be subject to pre-approval by the Committee Chair (or any other Committee member on whom this responsibility has been delegated) so long as the estimated fee for those services does not exceed $50,000. Services presented for pre-approval pursuant to this paragraph will be accompanied by a confirmation from both the Treasurer and the independent accountants that the proposed services will not adversely affect the independence of the independent accountants.
Although the Audit Committee will not pre-approve all services provided to Prudential Investments LLC and its affiliates, the Committee will receive an annual report from the Fund’s independent accounting firm showing the aggregate fees for all services provided to Prudential Investments and its affiliates.
(e) (2) Percentage of services referred to in 4(b)- (4)(d) that were approved by the audit committee –
Not applicable.
(f) Percentage of hours expended attributable to work performed by other than full time employees of principal accountant if greater than 50%.
Not applicable.
(g) Non-Audit Fees
Not applicable to Registrant for the fiscal years 2006 and 2005. The aggregate non-audit fees billed by KPMG for services rendered to the registrant’s investment adviser and any entity controlling, controlled by, or under common control with the investment adviser that provides ongoing services to the registrant for the fiscal years 2006 and 2005 was $51,000 and $33,500, respectively.
(h) Principal Accountants Independence
Not applicable as KPMG has not provided non-audit services to the registrant’s investment adviser and any entity controlling, controlled by, or under common control with the investment adviser that provides ongoing services to the registrant that were not pre-approved pursuant to Rule 2-01(c)(7)(ii) of Regulation S-X.
Item 5 – Audit Committee of Listed Registrants – Not applicable.
Item 6 – Schedule of Investments – The schedule is included as part of the report to shareholders filed under Item 1 of this Form.
Item 7 – Disclosure of Proxy Voting Policies and Procedures for Closed-End Management Investment Companies – Not applicable.
Item 8 – Portfolio Managers of Closed-End Management Investment Companies – Not applicable.
Item 9 – Purchases of Equity Securities by Closed-End Management Investment Company and Affiliated Purchasers – Not applicable.
Item 10 – Submission of Matters to a Vote of Security Holders – Not applicable.
Item 11 – Controls and Procedures
| (a) | It is the conclusion of the registrant’s principal executive officer and principal financial officer that the effectiveness of the registrant’s current disclosure controls and procedures (such disclosure controls and procedures having been evaluated within 90 days of the date of this filing) provide reasonable assurance that the information required to be disclosed by the registrant has been recorded, processed, summarized and reported within the time period specified in the Commission’s rules and forms and that the information required to be disclosed by the registrant has been accumulated and communicated to the registrant’s principal executive officer and principal financial officer in order to allow timely decisions regarding required disclosure. |
| (b) | There has been no significant change in the registrant’s internal control over financial reporting that occurred during the registrant’s most recent fiscal quarter of the period covered by this report that has materially affected, or is likely to materially affect, the registrant’s internal control over financial reporting. |
Item 12 – Exhibits
| (a) | (1) Code of Ethics – Attached hereto as Exhibit EX-99.CODE-ETH |
(2) Certifications pursuant to Section 302 of the Sarbanes-Oxley Act – Attached hereto as Exhibit EX-99.CERT.
(3) Any written solicitation to purchase securities under Rule 23c-1. – Not applicable.
| (b) | Certifications pursuant to Section 906 of the Sarbanes-Oxley Act – Attached hereto as Exhibit EX-99.906CERT. |
SIGNATURES
Pursuant to the requirements of the Securities Exchange Act of 1934 and the Investment Company Act of 1940, the registrant has duly caused this report to be signed on its behalf by the undersigned, thereunto duly authorized.
| (Registrant) | Prudential Institutional Liquidity Portfolio, Inc. | |
| By (Signature and Title)* | /s/ Deborah A. Docs | |
| Deborah A. Docs | ||
| Secretary | ||
| Date | May 30, 2006 | |
Pursuant to the requirements of the Securities Exchange Act of 1934 and the Investment Company Act of 1940, this report has been signed below by the following persons on behalf of the registrant and in the capacities and on the dates indicated.
| By (Signature and Title)* | /s/ Judy A. Rice | |
| Judy A. Rice | ||
| President and Principal Executive Officer | ||
| Date | May 30, 2006 | |
| By (Signature and Title)* | /s/ Grace C. Torres | |
| Grace C. Torres | ||
| Treasurer and Principal Financial Officer | ||
| Date | May 30, 2006 | |
| * | Print the name and title of each signing officer under his or her signature. |