A NO-LOAD
MUTUAL FUND
ANNUAL REPORT
Dated September 30, 2020
Dear Shareholders,
We are pleased to present the Annual Report of Concorde Funds, Inc. for the fiscal year ended September 30, 2020.
Concorde Wealth Management Fund
Concorde Wealth Management Fund (the “Fund”), managed by Concorde Investment Management, produced a net return of 17.5% for the six months ended September 30, 2020 and 3.54% for the fiscal year ending that same date. This compared to the various equity, fixed income and blended indices below. The Fund continued to transition to the new balanced objective that became effective during late summer 2016. The Fund also began adding in the private equity and semi-private equity holdings that were part of our goal with the reorganization. Asset allocations as of September 30, 2020 were approximately 56.6% equities, including 6.3% in private equity, 26.5% in fixed income and cash equivalents and 15.9% in defensive/non-equity market correlated securities.
| | Six Months Ended | | Annualized | Annualized |
| | September 30, 2020 | 1 Year Ended | 5 Years Ended | 10 Years Ended |
| | (Unaudited) | September 30, 2020 | September 30, 2020 | September 30, 2020 |
| Concorde Wealth Management Fund | 17.50% | 3.54% | 6.00% | 6.61% |
| Concorde Wealth Management | | | | |
| Blended Index | 10.69% | 1.62% | 5.56% | 6.28% |
| Bloomberg Barclays U.S. Aggregate | | | | |
| Bond Index | 3.53% | 6.98% | 4.18% | 3.64% |
| Russell 1000 Value Index | 20.68% | -5.03% | 7.66% | 9.95% |
Note: The Concorde Wealth Management Blended Index consists of 45% equities represented by the Russell 1000 Value Index, 45% bonds represented by the Barclays Intermediate Aggregate Bond Index, 5% short-term investments represented by Bank of America Merrill Lynch 1-3 Year Treasuries, and 5% commodities represented by Barclays U.S. Treasury Inflation Protection Security. The Russell 1000 Value Index measures the performance of those Russell 1000 companies with lower price-to-book ratios and lower forecasted growth values. The Barclays Aggregate Bond Index measures the investment grade, U.S. dollar denominated, fixed-rate taxable bond market, including Treasuries, government-related and corporate securities, mortgage-backed securities (agency fixed-rate and hybrid adjustable rate mortgage pass throughs), asset backed securities, and commercial mortgage backed securities.
Open End Funds
Cohen & Steers Institutional Realty Shares, Inc. and Morgan Stanley Global Fixed Income Opportunities Fund were the two open end funds held at fiscal year end. Cohen & Steers Institutional Realty Shares, Inc. focuses on domestic publicly held real estate investments, primarily REITS. The security was purchased in mid-August and has contributed a small total return loss of less than 1%. The Morgan Stanley Global Fixed Income Opportunities Fund has a global, flexible credit mandate and is actively managed to produce modest income and volatility with a goal of adding appreciation over time. Morgan Stanley Global Fixed Income Opportunities Fund had a positive return of over 3% for the year despite the credit market selloff in March and April. In fact, this fund has already recovered the first quarter decline at September 30. 2020 and is up around 2% for the calendar year to date. This fund is distributing monthly dividends at an annual rate of approximately 2.75%.
Closed End Funds
The PIMCO Flexible Credit Income Fund detracted from performance with a total return of -1.40% for the fiscal year ended September 30, 2020. Many assets held by the fund dropped in value significantly in March as economic and liquidity concerns had a large impact on credit markets. There has been a significant recovery in the subsequent months, but many holdings are still priced lower than in February. The PIMCO Flexible Credit Income Fund continues to pay a dividend which equates to approximately 9.10% as of September 30, 2020. The quarterly distribution rate was modestly increased late in 2019 and has been maintained for the June and September 2020 quarters despite the economic turmoil, reflecting the quality of the portfolio.
As of September 30, 2020, Pioneer ILS Interval Fund delivered a positive return net of all fees and expenses for the month, year-to-date and for the past twelve months of 1.39%, 5.53% and 4.77%, respectively. The majority of the calendar year return stream in the insurance linked securities marketplace has tended to occur in the second half of the year driven by seasonality. In years with limited loss, historically around 60-70% of the annual return has come from the second half of the year. The economic and insurable losses from a hurricane are highly correlated with the landfall location. Of the eight hurricanes that have occurred this season only three have been the focus of the reinsurance industry based on location, event characteristics and possible losses. Those events are hurricanes Isaias, Laura and Sally and the losses for reinsurers should be minimal.
U.S. Government Obligations
The Fund reduced the overall allocation to U.S. government obligations during the fiscal year as yields were driven lower to levels that reduced their investment appeal even serving as a high-quality and stable cushion in the portfolio. A large gain was recognized in the U.S. Treasury Note 2.250% due 11/15/24 in March and smaller gains were established in the 2.625% and 1.875% Treasury Notes. Low single digit positive returns were realized by the two remaining holdings at fiscal year end. Some of the allocation previously committed to Treasury Notes has been shifted to very short term corporate and asset backed security focused exchange traded funds managed by PIMCO and JP Morgan Chase.
Corporate Bonds
Overall, the primarily short-term corporate bonds held were a contributor to positive returns as our emphasis on quality provided stability and income during the volatile second half of the fiscal year. Total returns approximated 4% for the group despite the sharp selloff in March and April in most credit markets. Individually the holdings in Discover Financial Services, Fiserv, Inc., Ford Motor Credit Co. LLC and CVS Health Corp. generated the best total returns at 5% or higher. We were able to purchase new positions or add to existing positions of several corporates at attractive prices during market weakness including JP Morgan Chase & Co. 4.625%, AerCap Ireland Capital DAC / AerCap Global Aviation Trust 3.300%, Freeport-McMoRan, Inc. 3.550% and U.S. Bancorp 5.125%. During the fiscal year we sold our total position in the EQM Midstream Partners LP 4.750%, JP Morgan Chase & Co. 4.625%, Hanesbrands, Inc. 144A 4.625% and Wells Fargo & Co. 3.450% issues.
Sector and Stock Performance Discussion
In this discussion we will highlight sectors and individual holdings which either enhanced or detracted from performance for the Fund during the year ended September 30, 2020.
Health Care
The sole holding listed in Health Care, Encompass Health Corp., rose around 4% for the fiscal year as the rehabilitation and home health businesses provided steady revenues. Johnson & Johnson and AbbVie, Inc., although listed in the manufacturing sector, are primarily involved in health industry businesses and both contributed positively to fund performance.
Manufacturing
This group includes companies across several industry groups including health, chemicals, energy, housing, and aerospace. DuPont de Nemours, Inc. and Exxon Mobil Corp. detracted from results with negative returns, although DuPont de Nemours, Inc. has risen significantly from lows reached in late March. Fortune Brands Home & Security, Inc., a long term holding, rose over 50% as their product lines further recovered from the 2018 housing slowdown and have now gotten a boost from the firming single family housing market during the current lifestyle emphasis change of the last six months. Hanesbrands, Inc. delivered a slightly above Fund performance contribution of 7% as the domestic basics business has stabilized and the balance sheet continues to improve. The Hershey Company had a modest single digit loss although revenues remained firm as consumer staples stocks were already priced fully entering the recent turmoil. Northrop Grumman Corp. and The Boeing Co. were both purchased during the March/April selloff and Northrop Grumman Corp. has risen around 4% and The Boeing Co. is higher by over 35% from our average purchase price. Both have businesses which are being impacted in the short run by current weak conditions, but we believe they represent good value for a multi-year time frame.
Mining, Quarrying and Oil & Gas Extraction
Franco-Nevada Corp., primarily a mineral rights owner with an emphasis on precious metals and energy, enhanced Fund performance with a gain of over 50% as gold and silver rights were recognized by the market as those commodity prices rose. Pioneer Natural Resources Co. and Schlumberger Ltd., market leaders in their oil and gas sectors, were each purchased earlier this year during market weakness. Schlumberger Ltd. stock has struggled and detracted from performance as global energy service revenues have not rebounded. The stock of Pioneer Natural Resources Co. has risen over 25% from our purchase as oil prices have stabilized, however the outlook still remains uncertain for pricing and production increases.
Professional, Scientific and Technical Services
Vivendi SA, a new Fund holding in late 2019, rose over 15% from average cost as the growth and stability of the Universal Music Group business, 90% owned by Vivendi SA, was recognized as a positive performer by the market during the dramatic drop in global growth this spring. We added to the position during the market drop in March.
Real Estate & Rental & Leasing
The Howard Hughes Corporation, the only non-REIT real estate-oriented holding in the Fund, detracted from performance with a loss for the period of over 50%, although rallying 14% since March 31, 2020. Despite the uncertainty of commercial real estate valuations and residential development potential in Hawaii and Texas over the next several years, we believe an adjusted net asset value for company assets well exceeds current market value.
Retail Trade
The three holdings in this sector contributed significantly to the Fund for the year as Amazon.com, Inc. and Lowe’s Companies, Inc. had gains of approximately 80% and 53%, respectively, and The TJX Companies, Inc. was about flat for the year. All three business models should do very well over the next several years during a recovery from the pandemic induced shutdowns and change in shopping logistics and consumer preferences. All of these businesses are also in excellent financial position to both compete and expand where opportunities present themselves.
Transportation and Warehousing
Two of the three positions in this sector were purchased during the market selloff in March and April as we saw value for quality businesses that will be hurt short term but should recover well over time as their market positions and financial strength position them for recovery. Southwest Airlines Co. is already adjusting strategy to attack competitors and Kansas City Southern has been the subject of buyout discussions with two large private investment groups. Union Pacific Corp., one of the Fund’s largest long-term holdings had a 24% gain for the fiscal year. Subsequent to the fiscal year end we sold this position based on an extended valuation, but will monitor for another purchase opportunity as Union Pacific Corp. still maintains a great North American market position.
Utilities
Kinder Morgan, Inc., the large energy infrastructure business with some utility like attributes, was a detractor from Fund performance as total return including dividends was down 36% for the year. The company is in good financial condition to withstand the latest energy industry weakness and modestly increased their dividend earlier this year.
Position Changes – Common Stocks
During the second half of the fiscal year the following common stocks were either totally eliminated or added as new holdings. Eliminations: Brookfield Asset Management, Aon PLC, and Valero Energy. New purchases: First Industrial Realty Trust, Inc., Kansas City Southern, Martin Marietta Materials, Inc., and Northrop Grumman Corp.
REITS
The three REIT holdings in the Fund at fiscal year-end detracted from performance as a group, although individual results were varied. VEREIT, Inc. contributed the worst individual total return at around -29.90%. The negative performance was a result of some leaseholders, specifically in the restaurant and retail sectors, being forced to delay rent payments as a result of lockdown activity. VEREIT, Inc. did reduce the quarterly dividend by 50% but that overstates the current shortfall in receipts and cash flow availability. Recent months have seen meaningful recoveries. For example, rents received for August and September were reported at 94% and 95%. First Industrial Realty Trust, Inc. is a new purchase as of July and provided a modest positive total return by fiscal year-end. First Industrial Realty Trust, Inc. is benefitting from many trends that should continue over the next several years and has assets concentrated in what we believe to be stronger growth regions that may also benefit from increases in domestic manufacturing resulting from supply chain reshoring. Medical Properties Trust, Inc. detracted from overall performance with a mid-single digit total return loss and many tenants have only seen modest damage from the reduction in elective medical activity over the previous six months.
Private Funds
The four private equity investments held in the Fund at September 30, 2020 are Partners Group Private Equity (Master Fund) LLC – Class I (“Partners Group”), LLR Equity Partners V, L.P. (“LLR V”), LRVHealth, L.P. (“LRVHealth”), and Moran Tice 20:20 Fund, L.P. (“Moran Tice”).
Partners Group is a $2.5 billion fund diversified by strategy, region, and industry. Partners Group started operations in 2010 and has an 8+ year track record, quarterly tender offers, establishes a new net asset value monthly so that it is able to track performance, has no capital calls, and has immediate exposure to a mature portfolio. Partners Group is 67% allocated towards North America, 25% to Europe, and 6% to Asia-Pacific region. The Fund has invested $500,000 in Partners Group and the investment had a return of 2.3% for the six months ended September 30, 2020.
LLR Partners, Inc. is a lower middle market private equity firm committed to creating long-term value by growing portfolio companies. They invest in a targeted set of industries, with a focus on technology and services businesses. Founded in 1999 and with more than $3 billion raised across five funds, LLR Partners, Inc. is a flexible provider of capital for growth, recapitalizations and buyouts. LLR V is a $1 billion fund that the Fund has committed $1 million to invest. The Fund has had 74% of its commitment called and the investment returned 7.9% net internal rate of return and a 1.1x net multiple of capital. We were notified of an additional 10% call on September 30, 2020. These types of investments take longer to perform given the nature of the portfolio. LLR V has 21 investments. The COVID-19 pandemic continues to represent a significant risk to the LLR V portfolio. LLR V determined its investment valuations as of June 30, 2020 using information available through the date the valuations were completed, including assumptions about future performance. Given the uncertainties around the ongoing economic fallout from COVID-19, the future value of LLR V’s investments may change significantly. LLR V’s portfolio, including proceeds realized to date, is valued at $1,054.8 million as of June 30, 2020, compared to capital invested of $872.2 million.
The Fund has a third commitment to a health care related venture firm called LRVHealth. LRVHealth is an “Inside Healthcare” venture capital platform that was established in 2000 by an experienced team of healthcare investors, operators and advisors. LRVHealth’s investors include leading provider, payer, and vendor organizations who collaborate to identify, invest in, and adopt innovative solutions to the industry’s most pressing needs. The Fund has committed $500,000 to LRVHealth and has had 20% of the capital called thus far and is too early in the life of the fund to report any meaningful results.
Moran Tice is a new investment and is related to the investment theory of a dislocated price between small gold miners and the price of gold itself. In additional to our defensive positioning in the Sprott Physical Gold Trust, this position, which is less than 1% of the Fund’s assets, is to take advantage of the underpricing of gold as it relates to deficit spending and specifically the additional price dislocation between small and large precious metal miners.
Thank you for your continued support. We will continue to strive for the highest professional standards of performance and stewardship in the management of the Fund.
Best regards,
| |  |
| | |
| | Gregory B. Wood |
| | Treasurer |
| | Concorde Investment Management |
| | |
| |  |
| | |
| | Gary B. Wood |
| | President |
| | Concorde Investment Management |
| | |
| |  |
| | |
| | John A. Stetter |
| | Secretary |
| | Concorde Investment Management |
| | |
Concorde Wealth Management Fund
Performance Comparison
Change in Value of $10,000 Investment (Unaudited)
| AVERAGE ANNUAL TOTAL RETURN | |
| 1 Year | 3.54% | | |
| 3 Years | 4.64% | | |
| 5 Years | 6.00% | | |
| 10 Years | 6.61% | | |
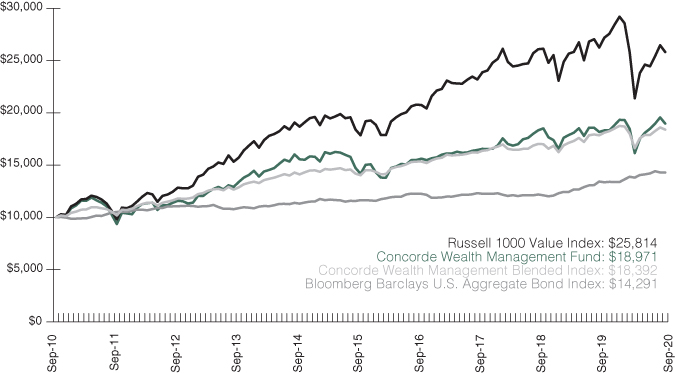
| NOTE: | The chart illustrates the performance of a hypothetical $10,000 investment made in the Fund on September 30, 2010. Returns reflect the reinvestment of dividends and capital gain distributions. The performance data and graph do not reflect the deduction of taxes that a shareholder may pay on dividends, capital gain distributions or redemption of Fund shares. Past performance is not predictive of future performances. |
| | |
| | The Concorde Wealth Management Blended Index consists of 45% equities represented by the Russell 1000 Value Index, 45% bonds represented by the Bloomberg Barclays Intermediate Aggregate Bond Index, 5% short-term investments represented by Bank of America Merrill Lynch 1-3 Year U.S. Treasuries, and 5% commodities represented by Bloomberg Barclays U.S. Treasury Inflation Protection Security. The Russell 1000 Value Index measures the performance of those Russell 1000 companies with lower price-to-book rations and lower forecasted growth values. The Bloomberg Barclays U.S. Aggregate Bond Index measures the investment grade, U.S. dollar denominated, fixed-rate taxable bond market, including Treasuries, government-related and corporate securities, MBS (agency fixed-rate and hybrid ARM pass throughs), ABS, and CMBS. |
| | |
| | For periods prior to July 23, 2016, information shows herein for the Fund is that of the Concorde Value Fund, the “Predecessor Fund” (see Note 1 in the accompanying notes to these financial statements). |
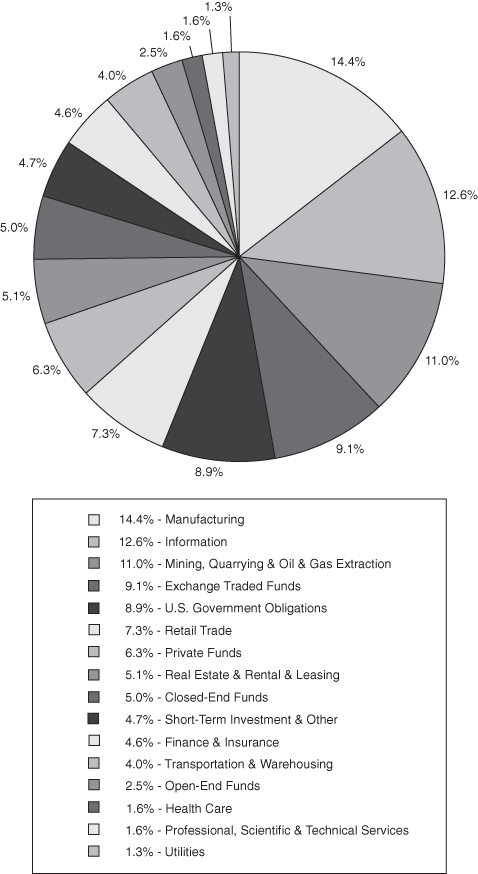
CONCORDE WEALTH MANAGEMENT FUND
PORTFOLIO HOLDINGS BY SECTOR
September 30, 2020 (Unaudited)
The portfolio’s holdings and allocations are subject to change. The percentages are of net assets as of September 30, 2020.
CONCORDE WEALTH MANAGEMENT FUND
SCHEDULE OF INVESTMENTS IN SECURITIES
September 30, 2020
| | | Shares or | | | Fair | | | Percent of | |
| | | Principal Amount | | | Value | | | Net Assets | |
| COMMON STOCKS - 51.02% | | | | | | | | | |
FINANCE & INSURANCE | | | | | | | | | |
JPMorgan Chase & Co. | | | 4,000 | | | $ | 385,080 | | | | 1.49 | % |
| | | | | | | | | | | | | |
HEALTH CARE | | | | | | | | | | | | |
Encompass Health Corp. | | | 6,500 | | | | 422,370 | | | | 1.63 | |
| | | | | | | | | | | | | |
INFORMATION | | | | | | | | | | | | |
Comcast Corp. - Class A | | | 9,800 | | | | 453,348 | | | | 1.75 | |
Discovery, Inc. - Class C (a) | | | 18,000 | | | | 352,800 | | | | 1.36 | |
Lumen Technologies, Inc. | | | 39,000 | | | | 393,510 | | | | 1.52 | |
Microsoft Corp. | | | 6,100 | | | | 1,283,013 | | | | 4.95 | |
The Walt Disney Co. | | | 4,600 | | | | 570,768 | | | | 2.20 | |
| | | | | | | | 3,053,439 | | | | 11.78 | |
MANUFACTURING | | | | | | | | | | | | |
AbbVie Inc. | | | 4,500 | | | | 394,155 | | | | 1.52 | |
DuPont de Nemours, Inc. | | | 9,000 | | | | 499,320 | | | | 1.93 | |
Exxon Mobil Corp. | | | 6,400 | | | | 219,712 | | | | 0.85 | |
Fortune Brands Home & Security, Inc. | | | 8,500 | | | | 735,420 | | | | 2.84 | |
Hanesbrands Inc. | | | 33,000 | | | | 519,750 | | | | 2.00 | |
Johnson & Johnson | | | 2,500 | | | | 372,200 | | | | 1.43 | |
Northrop Grumman Corp. | | | 800 | | | | 252,392 | | | | 0.97 | |
The Boeing Co. | | | 2,300 | | | | 380,098 | | | | 1.47 | |
The Hershey Co. | | | 2,590 | | | | 371,251 | | | | 1.43 | |
| | | | | | | | 3,744,298 | | | | 14.44 | |
MINING, QUARRYING & OIL & GAS EXTRACTION | | | | | | | | | | | | |
Franco-Nevada Corp. (b) | | | 5,600 | | | | 781,648 | | | | 3.02 | |
Pioneer Natural Resources Co. | | | 4,750 | | | | 408,452 | | | | 1.57 | |
Martin Marietta Materials, Inc. | | | 1,100 | | | | 258,896 | | | | 1.00 | |
Schlumberger Ltd. (b) | | | 11,200 | | | | 174,272 | | | | 0.67 | |
| | | | | | | | 1,623,268 | | | | 6.26 | |
PROFESSIONAL, SCIENTIFIC & TECHNICAL SERVICES | | | | | | | | | | | | |
Vivendi SA - ADR (b) | | | 15,000 | | | | 418,050 | | | | 1.61 | |
| | | | | | | | | | | | | |
REAL ESTATE & RENTAL & LEASING | | | | | | | | | | | | |
The Howard Hughes Corp. (a) | | | 7,500 | | | | 432,000 | | | | 1.67 | |
The accompanying notes are an integral part of these financial statements.
CONCORDE WEALTH MANAGEMENT FUND
SCHEDULE OF INVESTMENTS IN SECURITIES (continued)
September 30, 2020
| | | Shares or | | | Fair | | | Percent of | |
| | | Principal Amount | | | Value | | | Net Assets | |
| COMMON STOCKS (continued) | | | | | | | | | |
RETAIL TRADE | | | | | | | | | |
Amazon.com, Inc. (a) | | | 220 | | | $ | 692,720 | | | | 2.67 | % |
Lowe’s Companies, Inc. | | | 4,000 | | | | 663,440 | | | | 2.56 | |
The TJX Companies, Inc. | | | 7,500 | | | | 417,375 | | | | 1.61 | |
| | | | | | | | 1,773,535 | | | | 6.84 | |
TRANSPORTATION & WAREHOUSING | | | | | | | | | | | | |
Kansas City Southern | | | 1,600 | | | | 289,328 | | | | 1.11 | |
Southwest Airlines Co. | | | 8,700 | | | | 326,250 | | | | 1.26 | |
Union Pacific Corp. | | | 2,200 | | | | 433,114 | | | | 1.67 | |
| | | | | | | | 1,048,692 | | | | 4.04 | |
UTILITIES | | | | | | | | | | | | |
Kinder Morgan, Inc. | | | 26,500 | | | | 326,745 | | | | 1.26 | |
TOTAL COMMON STOCKS (Cost $9,134,945) | | | | | | | 13,227,477 | | | | 51.02 | |
| | | | | | | | | | | | | |
| EXCHANGE TRADED FUNDS - 9.13% | | | | | | | | | | | | |
JPMorgan Ultra-Short Income ETF | | | 14,500 | | | | 736,528 | | | | 2.84 | |
PIMCO Enhanced Short Maturity Active | | | | | | | | | | | | |
Exchange-Traded Fund | | | 5,000 | | | | 509,800 | | | | 1.97 | |
Sprott Physical Gold Trust (a)(b) | | | 74,500 | | | | 1,121,225 | | | | 4.32 | |
TOTAL EXCHANGE TRADED FUNDS | | | | | | | | | | | | |
(Cost $1,999,236) | | | | | | | 2,367,553 | | | | 9.13 | |
| | | | | | | | | | | | | |
| CLOSED-END FUNDS - 5.00% | | | | | | | | | | | | |
PIMCO Flexible Credit Income Fund - | | | | | | | | | | | | |
Institutional Class (e) | | | 47,619 | | | | 411,908 | | | | 1.59 | |
Pioneer ILS Interval Fund (e) | | | 101,112 | | | | 883,721 | | | | 3.41 | |
TOTAL CLOSED-END FUNDS (Cost $1,500,000) | | | | | | | 1,295,629 | | | | 5.00 | |
| | | | | | | | | | | | | |
| OPEN-END FUNDS - 2.48% | | | | | | | | | | | | |
Cohen & Steers Institutional Realty Shares | | | 6,629 | | | | 266,619 | | | | 1.03 | |
Morgan Stanley Global Fixed Income Opportunities Fund - | | | | | | | | | | | | |
Institutional Class | | | 65,259 | | | | 375,889 | | | | 1.45 | |
TOTAL OPEN-END FUNDS (Cost $630,000) | | | | | | | 642,508 | | | | 2.48 | |
The accompanying notes are an integral part of these financial statements.
CONCORDE WEALTH MANAGEMENT FUND
SCHEDULE OF INVESTMENTS IN SECURITIES (continued)
September 30, 2020
| | | Shares or | | | Fair | | | Percent of | |
| | | Principal Amount | | | Value | | | Net Assets | |
| PRIVATE FUNDS - 6.29% | | | | | | | | | |
LLR Equity Partners V, L.P. (d)(e) | | | 740,000 | | | $ | 731,446 | | | | 2.82 | % |
LRVHealth, L.P. (a)(d)(e) | | | 100,000 | | | | 79,981 | | | | 0.31 | |
Moran Tice 20:20 Fund, L.P. (a)(d)(e) | | | 250,000 | | | | 234,863 | | | | 0.91 | |
Partners Group Private Equity | | | | | | | | | | | | |
(Master Fund) LLC - Class I (d)(e) | | | 89,425 | | | | 584,318 | | | | 2.25 | |
TOTAL PRIVATE FUNDS (Cost $1,536,609) | | | | | | | 1,630,608 | | | | 6.29 | |
| | | | | | | | | | | | | |
| REITS - 3.47% | | | | | | | | | | | | |
REAL ESTATE & RENTAL & LEASING | | | | | | | | | | | | |
First Industrial Realty Trust, Inc. | | | 5,500 | | | | 218,900 | | | | 0.84 | |
Medical Properties Trust, Inc. | | | 22,000 | | | | 387,860 | | | | 1.50 | |
VEREIT, Inc. | | | 45,000 | | | | 292,500 | | | | 1.13 | |
TOTAL REITS (Cost $780,308) | | | | | | | 899,260 | | | | 3.47 | |
| | | | | | | | | | | | | |
| ROYALTY TRUST - 4.18% | | | | | | | | | | | | |
MINING, QUARRYING & OIL & GAS EXTRACTION | | | | | | | | | | | | |
Texas Pacific Land Trust | | | 2,400 | | | | 1,083,744 | | | | 4.18 | |
TOTAL ROYALTY TRUST (Cost $332,446) | | | | | | | 1,083,744 | | | | 4.18 | |
| | | | | | | | | | | | | |
| CORPORATE BONDS - 4.92% | | | | | | | | | | | | |
FINANCE & INSURANCE | | | | | | | | | | | | |
AerCap Ireland Capital DAC / AerCap Global Aviation | | | | | | | | | | | | |
Trust - Class B, 3.300%, 01/23/2023 (b) | | | 100,000 | | | | 100,358 | | | | 0.39 | |
Discover Financial Services, 3.850%, 11/21/2022 | | | 200,000 | | | | 213,279 | | | | 0.82 | |
Ford Motor Credit Co. LLC, 3.550%, 05/20/2021 | | | 150,000 | | | | 149,454 | | | | 0.58 | |
JPMorgan Chase & Co., 3.616% to 10/01/2020 then | | | | | | | | | | | | |
3 Month LIBOR USD + 3.320%, Perpetual (f) | | | 175,000 | | | | 161,910 | | | | 0.62 | |
U.S. Bancorp, 5.125% to 01/15/2021 then 3 Month LIBOR USD | | | | | | | | | | | | |
+ 3.486%, Perpetual (f) | | | 180,000 | | | | 179,325 | | | | 0.69 | |
| | | |
| | | | 804,326 | | | | 3.10 | |
INFORMATION | | | | | | | | | | | | |
Fiserv, Inc., 3.500%, 10/01/2022 | | | 200,000 | | | | 210,901 | | | | 0.82 | |
| | | | | | | | | | | | | |
MINING, QUARRYING & OIL & GAS EXTRACTION | | | | | | | | | | | | |
Freeport-McMoRan Inc., 3.550%, 03/01/2022 | | | 150,000 | | | | 152,583 | | | | 0.59 | |
The accompanying notes are an integral part of these financial statements.
CONCORDE WEALTH MANAGEMENT FUND
SCHEDULE OF INVESTMENTS IN SECURITIES (continued)
September 30, 2020
| | | Shares or | | | Fair | | | Percent of | |
| | | Principal Amount | | | Value | | | Net Assets | |
| CORPORATE BONDS (Continued) | | | | | | | | | |
RETAIL TRADE | | | | | | | | | |
CVS Health Corp., 3.700%, 03/09/2023 | | | 100,000 | | | $ | 107,159 | | | | 0.41 | % |
TOTAL CORPORATE BONDS (Cost $1,249,542) | | | | | | | 1,274,969 | | | | 4.92 | |
| | | | | | | | | | | | | |
| U.S. GOVERNMENT OBLIGATIONS - 8.91% | | | | | | | | | | | | |
United States Treasury Notes | | | | | | | | | | | | |
1.875%, 01/31/2022 | | | 1,600,000 | | | | 1,637,250 | | | | 6.31 | |
2.250%, 08/15/2027 | | | 600,000 | | | | 673,102 | | | | 2.60 | |
TOTAL U.S. GOVERNMENT OBLIGATIONS | | | | | | | | | | | | |
(Cost $2,278,525) | | | | | | | 2,310,352 | | | | 8.91 | |
| | | | | | | | | | | | | |
| SHORT-TERM INVESTMENT - 4.67% | | | | | | | | | | | | |
MONEY MARKET FUND | | | | | | | | | | | | |
Morgan Stanley Institutional Liquidity Funds - | | | | | | | | | | | | |
Government Portfolio, 0.02% (c) | | | 1,211,554 | | | | 1,211,554 | | | | 4.67 | |
TOTAL SHORT-TERM INVESTMENT (Cost $1,211,554) | | | | | | | 1,211,554 | | | | 4.67 | |
| | | | | | | | | | | | | |
Total Investments (Cost $20,653,165) - 100.07% | | | | | | | 25,943,654 | | | | 100.07 | |
Liabilities in Excess of Other Assets - (0.07)% | | | | | | | (18,633 | ) | | | (0.07 | ) |
TOTAL NET ASSETS - 100.00% | | | | | | $ | 25,925,021 | | | | 100.00 | % |
______________
ADR American Depository Receipt
REIT Real Estate Investment Trust
| (a) | Presently non-income producing. |
| (b) | Foreign issued security listed directly on a U.S. securities exchange. |
| (c) | This security has a fluctuating yield; rate disclosed is the 7-day yield as of September 30, 2020. |
| (d) | Securities for which market quotations are not readily available are valued at fair value determined by the Advisor. Such values are approved on a quarterly basis by the Board of Directors. |
| (e) | Restricted securities may be subject to restrictions on disposition imposed by the issuer. At September 30, 2020, restricted securities represented 11.29% of net assets of the Fund. |
| (f) | Variable rate security; rate disclosed is the current rate as of September 30, 2020. |
The accompanying notes are an integral part of these financial statements.
CONCORDE WEALTH MANAGEMENT FUND
STATEMENT OF ASSETS AND LIABILITIES
September 30, 2020
| ASSETS | | | |
| Investments in securities, at fair value (cost $20,653,165) | | $ | 25,943,654 | |
| Dividends and interest receivable | | | 52,236 | |
| Prepaid expenses | | | 8,737 | |
| TOTAL ASSETS | | | 26,004,627 | |
| LIABILITIES | | | | |
| Investment advisory fee payable | | | 17,195 | |
| Accrued audit fees | | | 27,000 | |
| Accrued directors fees and expenses | | | 551 | |
| Accrued other expenses | | | 34,860 | |
| TOTAL LIABILITIES | | | 79,606 | |
| NET ASSETS | | $ | 25,925,021 | |
| Composition of Net Assets: | | | | |
| Net capital paid in on shares of capital stock | | $ | 20,464,347 | |
| Total distributable earnings | | | 5,460,674 | |
| NET ASSETS | | $ | 25,925,021 | |
Capital shares outstanding | | | 1,642,183 | |
Net asset value, offering price and redemption price per share | | $ | 15.79 | |
The accompanying notes are an integral part of these financial statements.
CONCORDE WEALTH MANAGEMENT FUND
STATEMENT OF OPERATIONS
For the Year Ended September 30, 2020
| Investment Income | | | |
| Dividends (net of foreign withholding taxes and issuance fees of $3,424) | | $ | 478,516 | |
| Interest | | | 144,779 | |
| Total investment income | | | 623,295 | |
| Expenses | | | | |
| Investment advisory fees (Note 6) | | | 203,886 | |
| Professional fees | | | 56,090 | |
| Administration fees (Note 7) | | | 47,683 | |
| Sub-transfer agent fees (Note 7) | | | 30,361 | |
| Fund accounting fees (Note 7) | | | 25,468 | |
| Transfer agent fees (Note 7) | | | 16,291 | |
| Printing, postage and delivery | | | 15,028 | |
| Insurance expense | | | 7,360 | |
| Custody fees (Note 7) | | | 6,366 | |
| Directors fees and expenses | | | 2,718 | |
| Federal and state registration fees | | | 1,440 | |
| Other expenses | | | 14,626 | |
| Total expenses | | | 427,317 | |
| NET INVESTMENT INCOME | | | 195,978 | |
| REALIZED AND UNREALIZED GAIN (LOSS) | | | | |
| Net realized gain from: | | | | |
| Investments | | | 220,039 | |
| Options written | | | 18,114 | |
| Capital gain distributions from investment companies | | | 19,635 | |
| | | | 257,788 | |
| Net increase in unrealized appreciation on: | | | | |
| Investments | | | 403,358 | |
| NET REALIZED AND UNREALIZED GAIN | | | 661,146 | |
| NET INCREASE IN NET ASSETS RESULTING FROM OPERATIONS | | $ | 857,124 | |
The accompanying notes are an integral part of these financial statements.
CONCORDE WEALTH MANAGEMENT FUND
STATEMENTS OF CHANGES IN NET ASSETS
| | | Year Ended | | | Year Ended | |
| | | Sep. 30, 2020 | | | Sep. 30, 2019 | |
| INCREASE (DECREASE) IN NET ASSETS FROM OPERATIONS | | | | | | |
| Net investment income | | $ | 195,978 | | | $ | 150,865 | |
| Net realized gains from investments, options written and | | | | | | | | |
| capital gain distributions from investment companies | | | 257,788 | | | | 625,441 | |
| Unrealized appreciation on investments | | | 403,358 | | | | (978,186 | ) |
| Net increase (decrease) in net assets resulting from operations | | | 857,124 | | | | (201,880 | ) |
| DISTRIBUTIONS TO SHAREHOLDERS | | | (564,224 | ) | | | (1,114,431 | ) |
| CAPITAL SHARE TRANSACTIONS | | | | | | | | |
| Proceeds from shares sold | | | 1,117,253 | | | | 2,134,516 | |
| Dividends reinvested | | | 564,224 | | | | 1,114,431 | |
Cost of shares redeemed
| | | (1,505,916
| )
| | | (2,099,260
| )
|
| Net increase in net assets derived from capital share transactions | | | 175,561 | | | | 1,149,687 | |
| Total increase (decrease) in net assets | | | 468,461 | | | | (166,624 | ) |
| NET ASSETS | | | | | | | | |
| Beginning of year | | | 25,456,560 | | | | 25,623,184 | |
| End of year | | $ | 25,925,021 | | | $ | 25,456,560 | |
| CHANGES IN SHARES OUTSTANDING | | | | | | | | |
| Shares sold | | | 70,708 | | | | 140,595 | |
| Shares issued in reinvestment of distributions | | | 35,089 | | | | 76,070 | |
| Shares redeemed | | | (97,855 | ) | | | (136,428 | ) |
| Net increase | | | 7,942 | | | | 80,237 | |
The accompanying notes are an integral part of these financial statements.
CONCORDE WEALTH MANAGEMENT FUND
FINANCIAL HIGHLIGHTS
| | | Year Ended September 30, | |
| | | 2020 | | | 2019 | | | 2018 | | | 2017 | | | 2016(1) | |
| PER SHARE OPERATING | | | | | | | | | | | | | | | |
| PERFORMANCE: | | | | | | | | | | | | | | | |
(for a share of capital stock outstanding | | | | | | | | | | | | | | | |
throughout the year): | | | | | | | | | | | | | | | |
Net asset value, beginning of year | | $ | 15.58 | | | $ | 16.49 | | | $ | 15.13 | | | $ | 14.29 | | | $ | 13.79 | |
Income (loss) from investment operations: | | | | | | | | | | | | | | | | | | | | |
Net investment income (loss)(2) | | | 0.12 | | | | 0.09 | | | | 0.06 | | | | (0.04 | ) | | | (0.06 | ) |
| Net realized and unrealized gain (loss) | | | | | | | | | | | | | | | | | | | | |
| on investment transactions | | | 0.44 | | | | (0.29 | ) | | | 1.67 | | | | 0.91 | | | | 1.40 | |
| Total from investment operations | | | 0.56 | | | | (0.20 | ) | | | 1.73 | | | | 0.87 | | | | 1.34 | |
Less distributions from: | | | | | | | | | | | | | | | | | | | | |
| Net investment income | | | (0.22 | ) | | | (0.06 | ) | | | — | | | | — | | | | — | |
| Net realized gains | | | (0.13 | ) | | | (0.65 | ) | | | (0.37 | ) | | | (0.03 | ) | | | (0.84 | ) |
| Total distributions | | | (0.35 | ) | | | (0.71 | ) | | | (0.37 | ) | | | (0.03 | ) | | | (0.84 | ) |
Net asset value, end of year | | $ | 15.79 | | | $ | 15.58 | | | $ | 16.49 | | | $ | 15.13 | | | $ | 14.29 | |
| TOTAL RETURN | | | 3.54 | % | | | (0.91 | )% | | | 11.75 | % | | | 6.07 | % | | | 10.12 | % |
| RATIOS/SUPPLEMENTAL DATA: | | | | | | | | | | | | | | | | | | | | |
Net assets, end of year (in thousands) | | $ | 25,925 | | | $ | 25,457 | | | $ | 25,623 | | | $ | 20,591 | | | $ | 17,982 | |
Ratio of expenses to average net assets | | | 1.68 | % | | | 1.68 | % | | | 1.70 | % | | | 1.83 | % | | | 2.48 | % |
Ratio of net investment income (loss) | | | | | | | | | | | | | | | | | | | | |
to average net assets | | | 0.77 | % | | | 0.60 | % | | | 0.39 | % | | | (0.25 | )% | | | (0.44 | )% |
Portfolio turnover rate | | | 36 | % | | | 24 | % | | | 20 | % | | | 40 | % | | | 28 | % |
______________
(1) | For periods prior to July 23, 2016, financial and other information shown herein for the Fund is that of the Concorde Value Fund, the “Predecessor Fund” (See Note 1 in the accompanying notes to financial statements). |
(2) | Based on average shares outstanding during the year. |
The accompanying notes are an integral part of these financial highlights.
CONCORDE WEALTH MANAGEMENT FUND
NOTES TO FINANCIAL STATEMENTS
Note 1 – Nature of Business and Reorganization and Summary of Significant Accounting Policies
NATURE OF BUSINESS AND REORGANIZATION
Concorde Wealth Management Fund (the “Fund”), is a diversified separate series of Concorde Funds, Inc. (the “Company”). Each series of the Company is organized as a class of common stock under the Company’s articles of incorporation. The Company was incorporated in the state of Texas in September of 1987, and is registered under the Investment Company Act of 1940, as amended, as an open-end management investment company. Each capital share in the Fund represents an equal, proportionate interest in the net assets of the Fund with each other capital share in such series and no interest in any other series. The Company may establish multiple series, each of which would be organized as a class of common stock under the Company’s articles of incorporation. The Company presently has no series other than the Fund.
The primary investment objective of the Fund is to seek total return, from both appreciation of value and generation of current income, within the context of preservation of capital. The Fund is subject to various investment restrictions as set forth in the Statement of Additional Information.
On July 22, 2016, the shareholders of the Concorde Value Fund, a diversified former separate series of the Company, (the “Predecessor Fund”), approved a Plan of Acquisition and Liquidation (the “Reorganization”) between the Fund and the Predecessor Fund. Pursuant to the Reorganization, the Fund acquired all of the assets and liabilities of the Predecessor Fund in exchange for shares of the Fund after the close of business on July 22, 2016. The Fund issued 681,656 shares in exchange for the net assets of the Predecessor Fund valued at $9,666,396. The Fund had no assets, liabilities, shares issued or operations prior to the Reorganization. As a result of the Reorganization, the Predecessor Fund ceased to operate and its shareholders became shareholders of the Fund. The primary investment objective of the Predecessor Fund was to produce long-term growth of capital. As a result of the Reorganization, the Fund is the accounting successor of the Predecessor Fund. For periods prior to July 23, 2016, financial and other information shown herein for the Fund is that of the Predecessor Fund.
SIGNIFICANT ACCOUNTING POLICIES
The following is a summary of significant accounting policies followed by the Fund. These policies are in conformity with accounting principles generally accepted in the United States of America (“U.S. GAAP”). The Fund follows the investment company accounting and reporting guidance of the Financial Accounting Standards Board (“FASB”) Accounting Standards Codification (“ASC”) Topic 946, Financial Services – Investment Companies.
VALUATION OF SECURITIES
All investments in securities are recorded at their estimated fair value, as described in Note 2.
FEDERAL INCOME TAXES
The Company’s policy is to continue to comply with the requirements of the Internal Revenue Code that are applicable to regulated investment companies and to distribute all its taxable income
CONCORDE WEALTH MANAGEMENT FUND
NOTES TO FINANCIAL STATEMENTS
Note 1 – Nature of Business and Reorganization and Summary of Significant Accounting Policies (continued)
to its shareholders. The Company also intends to distribute sufficient net investment income and net capital gains, if any, so that it will not be subject to excise tax on undistributed income and gains. Therefore, no federal income tax or excise provision is required.
Net investment income (loss), net realized gains (losses) and the cost of investments in securities may differ for financial statement and income tax purposes. The character of distributions from net investment income or net realized gains may differ from their ultimate characterization for income tax purposes. Also, due to the timing of dividend distributions, the year in which amounts are distributed may differ from the year that the income or realized gains were recorded by the Fund. Permanent book and tax basis differences, if any, result in reclassifications to certain components of net assets. Current year permanent differences relate to adjustments to the tax basis of investments in partnerships. For the year ended September 30, 2020, the Fund decreased undistributed net investment income by $73,015 and increased accumulated net realized gains by $73,015, for a $0 net change to total distributable earnings. These reclassifications have no effect on net assets, results of operations or net asset value (“NAV”) per share.
Management has reviewed all open tax years and major tax jurisdictions and concluded that no liability for unrecognized tax benefits should be recorded related to uncertain tax positions taken on returns filed or expected to be taken on a tax return. The tax returns of the Company for the prior three years are open for examination.
SECURITY TRANSACTIONS AND RELATED INCOME
Security transactions are accounted for on the trade date, the day securities are purchased or sold. Realized gains and losses from securities transactions are reported on the specific identification basis. Dividend income is recognized on the ex-dividend date, and interest income is recognized on an accrual basis. Discounts and premiums on securities purchased are accreted and amortized over the lives of the respective securities. Withholding taxes on foreign dividends have been provided for in accordance with the Fund’s understanding of the applicable country’s tax rules and rates.
DIVIDENDS AND DISTRIBUTIONS TO SHAREHOLDERS
Distributions to shareholders are determined in accordance with Federal income tax regulations and recorded on the ex-dividend date. The Fund intends to distribute all of its net investment income, if any, as dividends to its shareholders on an annual basis. The Fund intends to distribute all of its capital gains, if any, as dividends to its shareholders on an annual basis. Distributions from net investment income and capital gains are generally declared and paid annually in December. The treatment for financial reporting purposes of distributions made to shareholders during the year from net investment income or capital gains may differ from their ultimate treatment for Federal income tax purposes. These differences are caused primarily by differences in the timing of the recognition of certain components of income, expense or realized capital gain for Federal income tax purposes.
CONCORDE WEALTH MANAGEMENT FUND
NOTES TO FINANCIAL STATEMENTS
Note 1 – Nature of Business and Reorganization and Summary of Significant Accounting Policies (continued)
Where such differences are permanent in nature, they are reclassified in the components of net assets based on their ultimate characterization for federal income tax purposes. Any such reclassifications will have no effect on net assets, results of operations or NAV per share.
USE OF ESTIMATES
The preparation of financial statements in conformity with U.S. GAAP requires management to make estimates and assumptions that affect the reported amounts of assets and liabilities and disclosure of contingent assets and liabilities at the date of the financial statements and the reported amounts of increases and decreases in net assets from operations during the reporting period. Actual results could differ from those estimates.
OPTION WRITING
To generate additional income or hedge against a possible decline in the value of securities it holds, the Fund may write covered call options and write put options. When the Fund writes an option, an amount equal to the premium received by the Fund is recorded as a liability and subsequently adjusted to the current fair value of the option written. Premiums received from writing options that expire unexercised are treated by the Fund on the expiration date as realized gains from options written. The difference between the premium and amount paid on effecting a closing purchase transaction, including brokerage commissions, is also treated as a realized gain or, if the premium is less than the amount paid for the closing purchase transaction, as a realized loss. If a call option is exercised, the premium is added to the proceeds from the sale of the underlying security in determining whether the Fund has realized a gain or loss. If a put option is exercised, the premium reduces the cost basis of the securities purchased by the Fund. The Fund as writer of an option bears the market risk of an unfavorable change in the price of the security underlying the written option.
The objective, as stated above, is to hedge against a possible decline in the value of securities it holds or to generate additional income when certain securities are locked in a trading range. With regards to hedging against a possible decline, the Fund may sell covered calls with strike prices below the price of a security at the time of writing the call. Regarding additional income, the Fund may sell calls on certain securities that are within a trading range, generally selling calls on securities where the strike prices are above the fair value price of the subject security.
NEW ACCOUNTING PRONOUNCEMENTS AND RULE ISSUANCES
In August 2018, the Financial Accounting Standards Board issued Accounting Standards Update 2018-13 “Changes to the Disclosure Requirements for Fair Value Measurement” which modifies disclosure requirements for fair value measurements. The guidance is effective for fiscal years beginning after December 15, 2019 and for interim periods within those fiscal years. Due to the permissibility of early adoption, management evaluated the impact of these changes and adopted the disclosure framework.
CONCORDE WEALTH MANAGEMENT FUND
NOTES TO FINANCIAL STATEMENTS
Note 1 – Nature of Business and Reorganization and Summary of Significant Accounting Policies (continued)
COMMITMENTS
On February 23, 2018, the Fund executed an agreement to invest in LLR Equity Partners V, L.P., a limited partnership. The capital commitment of this investment is $1,000,000. The remaining commitment as of September 30, 2020, is $260,000 and distributions subject to recall total $34,211.
On March 15, 2019, the Fund executed an agreement to invest in LRVHealth, L.P., a limited partnership. The capital commitment of this investment is $500,000. The remaining commitment as of September 30, 2020, is $400,000.
Note 2 – Securities Valuation
The Company’s Board of Directors (the “Board”) has adopted methods for valuing securities and other derivative instruments including in circumstances in which market quotes are not readily available, and has delegated authority to the Company’s investment advisor, Concorde Financial Corporation d/b/a Concorde Investment Management (“Concorde” or the “Advisor”) to apply those methods in making fair value determinations. All fair value determinations made by the Advisor are subject to oversight by the Board.
The Fund utilizes various methods to measure the fair value of most of its investments on a recurring basis. FASB ASC Topic 820, Fair Value Measurements and Disclosures (“ASC 820”) defines fair value, establishes a hierarchy that prioritizes inputs to valuation techniques used to measure fair value in accordance with U.S. GAAP and requires disclosure about fair value measurements. Under ASC 820, various inputs are used in determining the value of the Fund’s investments. The three levels of inputs are as follows:
| | Level 1 - | Unadjusted quoted prices in active markets for identical assets or liabilities that the Fund has the ability to access at the date of measurement. |
| | | |
| | Level 2 - | Observable inputs other than quoted prices included in Level 1 that are observable for the asset or liability, either directly or indirectly. These inputs may include quoted prices for the identical instrument on an inactive market, prices for similar instruments in active markets, interest rates, credit risk, yield curves, default rates and similar data. |
| | | |
| | Level 3 - | Model derived valuations in which one or more significant inputs or significant value drivers are unobservable. Unobservable inputs are those inputs that reflect the Fund’s own assumptions that market participants would use in valuing the asset or liability at the measurement date and would be based on the best available information. |
The availability of observable inputs can vary from security to security and is affected by a wide variety of factors, including, for example, the type of security, whether the security is new and not yet established in the marketplace, the liquidity of markets, and other characteristics particular to the security. To the extent that valuation is based on models or inputs that are less observable or unobservable in the market, the determination of fair value requires more judgment. Accordingly, the degree of judgment exercised in determining fair value is greatest for instruments categorized in Level 3.
CONCORDE WEALTH MANAGEMENT FUND
NOTES TO FINANCIAL STATEMENTS
Note 2 – Securities Valuation (continued)
The inputs used to measure fair value may fall into different levels of the fair value hierarchy. In such cases, for disclosure purposes, the level in the fair value hierarchy within which the fair value measurement falls in its entirety is determined based on the lowest level input that is significant to the fair value measurement in its entirety.
Following is a description of the valuation techniques applied to the Fund’s major categories of assets and liabilities measured at fair value on a recurring basis.
Equity Securities – Equity securities, usually common stocks, foreign issued common stocks, exchange traded funds (“ETFs”), real estate investment trusts (“REITs”), royalty trusts, master limited partnerships and preferred stocks traded on a national securities exchange are valued at the last sale price on the exchange on which such securities are traded, as of the close of business on the day the securities are being valued or, lacking any reported sales, at the mean between the last available bid and asked price. To the extent these securities are actively traded and valuation adjustments are not applied, they are categorized in Level 1 of the fair value hierarchy.
Mutual Funds – Mutual funds, including open and closed-end funds, are generally priced at the ending NAV provided by the service agent of the mutual funds and are categorized in Level 1 of the fair value hierarchy.
Investment Funds – Investment funds that are private funds can be difficult to value, particularly to the extent that their underlying investments are not publicly traded. In the event a private fund does not report a value to the Fund on a timely basis, the Advisor, acting under the Board’s supervision and pursuant to policies implemented by the Board, will determine the fair value of the Fund’s investment based on the most recent NAV reported by the private fund, as well as any other relevant information available at the time the Fund values its investments. It is anticipated that fair value, portfolio holdings and other value information of the private funds could be available on no more than a semi-annual basis, with up to a 90 day lag. Following procedures adopted by the Board, in the absence of specific transaction activity in a particular investment fund, the Advisor will consider whether it is appropriate, in light of all relevant circumstances, to value the Fund’s investment at the NAV reported by the private fund at the time of valuation or to adjust the value to reflect a premium or discount. Certain investment funds may include adjustments made subsequent to period end related to subsequent valuation information obtained. Therefore, the net assets and NAV reflected for financial statement purposes may differ from the reported NAV of the Fund as of September 30, 2020. Investment funds are categorized in Level 3 of the fair value hierarchy unless measured at fair value using the NAV per share (or its equivalent), in which case, practical expedient is used for private funds and are not categorized in the fair value hierarchy.
Debt Securities – Bonds, notes, and U.S. government obligations are valued at an evaluated bid price obtained from an independent pricing service that uses a matrix pricing method or other analytical models. Demand notes are valued at amortized cost, which approximates fair value. These securities will generally be categorized in Level 2 of the fair value hierarchy.
CONCORDE WEALTH MANAGEMENT FUND
NOTES TO FINANCIAL STATEMENTS
Note 2 – Securities Valuation (continued)
Short-Term Securities – Short-term equity investments, including money market funds, are valued in the manner specified above for equity securities. Fixed income securities with maturities of less than 60 days when acquired, or which subsequently are within 60 days of maturity, are valued by an independent pricing service that uses a matrix pricing method or other analytical models. Short-term securities are generally classified in Level 1 or Level 2 of the fair value hierarchy depending on the inputs used and market activity levels for specific securities.
Derivative Instruments – Listed derivatives, including options, rights, and warrants that are actively traded are valued based on quoted prices from the exchange. If there is no such reported sale on the valuation date, the mean between the highest bid and lowest asked quotations at the close of the exchanges will be used. These securities will generally be categorized in Level 1 of the fair value hierarchy.
All other assets of the Fund are valued in such manner as the Board in good faith deems appropriate to reflect their fair value.
As a general matter, the fair value of the Fund’s interest in investment funds that are private funds (“Non-Traded Funds”), will represent the amount that the Fund could reasonably expect to receive from the Non-Traded Fund if the Fund’s interest was redeemed at the time of valuation, based on information reasonably available at the time the valuation is made and that the Fund believes to be reliable. Investments in Non-Traded Funds are recorded at fair value, using the Non-Traded Fund’s net asset value as a practical expedient. Based on guidance provided by FASB, investments for which fair value is measured using the NAV practical expedient are not required to be categorized in the fair value hierarchy. In the event a Non-Traded Fund does not report a value to the Fund on a timely basis, the Advisor, acting under the Board’s supervision and pursuant to policies implemented by the Board, will determine the fair value of the Fund’s investment based on the most recent value reported by the Non-Traded Fund, as well as any other relevant information available at the time the Fund values its investments. Following procedures adopted by the Board, in the absence of specific transaction activity in a particular investment fund, the Advisor will consider whether it is appropriate, in light of all relevant circumstances, to value the Fund’s investment at the NAV reported by the Non-Traded Fund at the time of valuation or to adjust the value to reflect a fair value.
Securities for which market quotations are not readily available or if the closing price does not represent fair value, are valued at fair value as determined in good faith following procedures approved by the Board. Factors used in determining fair value vary by investment type and may include: trading volume of security and markets, value of other like securities and news events with direct bearing to security or market. Depending on the relative significance of the valuation inputs, these securities may be categorized in either Level 2 or Level 3 of the fair value hierarchy.
Certain restricted securities may be considered illiquid. Restricted securities are often purchased in private placement transactions, are not registered under the Securities Act of 1933, may have contractual restrictions on resale, and may be valued under methods approved by the Board as
CONCORDE WEALTH MANAGEMENT FUND
NOTES TO FINANCIAL STATEMENTS
Note 2 – Securities Valuation (continued)
reflecting fair value. Certain restricted securities eligible for resale to qualified institutional investors, including Rule 144A securities, are not subject to the limitation on the Funds’ investments in illiquid securities if they are determined to be liquid in accordance with procedures adopted by the Board.
Additional information on each illiquid restricted security held by the Fund on September 30, 2020 is as follows:
| | |
| Initial | | | | | | | | | | | % of | |
| | | | Acquisition | | | | | | | | | | | Net | |
| | Security | | Date | | Shares | | | Cost | | | Fair Value | | | Assets | |
| | Partners Group Private Equity | | | | | | | | | | | | | | |
| | (Master Fund) LLC – Class I | | December 1, 2017 | | | 89,425 | | | $ | 500,000 | | | $ | 584,318 | | | | 2.25 | % |
| | LLR Equity Partners V, L.P. | | March 14, 2018 | | | 740,000 | | | | 686,609 | | | | 731,446 | | | | 2.82 | |
| | PIMCO Flexible Credit Income | | | | | | | | | | | | | | | | | | |
| | Fund – Institutional Class | | March 15, 2018 | | | 47,619 | | | | 500,000 | | | | 411,908 | | | | 1.59 | |
| | Pioneer ILS Interval Fund | | August 27, 2018 | | | 101,112 | | | | 1,000,000 | | | | 883,721 | | | | 3.41 | |
| | LRVHealth, L.P. | | July 16, 2019 | | | 100,000 | | | | 100,000 | | | | 79,981 | | | | 0.31 | |
| | Moran Tice 20:20 Fund, L.P. | | July 31, 2020 | | | 250,000 | | | | 250,000 | | | | 234,863 | | | | 0.91 | |
| | | | | | | | | | $ | 3,036,609 | | | $ | 2,926,237 | | | | 11.29 | % |
CONCORDE WEALTH MANAGEMENT FUND
NOTES TO FINANCIAL STATEMENTS
Note 2 – Securities Valuation (continued)
The following table summarizes the inputs used to value the Fund’s investments measured at fair value as of September 30, 2020.
| | | Practical | | | | | | | | | | | | Total | |
Categories | | Expedient* | | | Level 1 | | | Level 2 | | | Level 3 | | | Fair Value | |
| Common Stocks | | | | | | | | | | | | | | | |
Finance & Insurance | | $ | — | | | $ | 385,080 | | | $ | — | | | $ | — | | | $ | 385,080 | |
Health Care | | | — | | | | 422,370 | | | | — | | | | — | | | | 422,370 | |
Information | | | — | | | | 3,053,439 | | | | — | | | | — | | | | 3,053,439 | |
Manufacturing | | | — | | | | 3,744,298 | | | | — | | | | — | | | | 3,744,298 | |
Mining, Quarrying | | | | | | | | | | | | | | | | | | | | |
& Oil & Gas Extraction | | | — | | | | 1,623,268 | | | | — | | | | — | | | | 1,623,268 | |
Professional, Scientific | | | | | | | | | | | | | | | | | | | | |
& Technical Services | | | — | | | | 418,050 | | | | — | | | | — | | | | 418,050 | |
Real Estate & Rental & Leasing | | | — | | | | 432,000 | | | | — | | | | — | | | | 432,000 | |
Retail Trade | | | — | | | | 1,773,535 | | | | — | | | | — | | | | 1,773,535 | |
Transportation & Warehousing | | | — | | | | 1,048,692 | | | | — | | | | — | | | | 1,048,692 | |
Utilities | | | — | | | | 326,745 | | | | — | | | | — | | | | 326,745 | |
| Total Common Stocks | | | — | | | | 13,227,477 | | | | — | | | | — | | | | 13,227,477 | |
| Exchange Traded Funds | | | — | | | | 2,367,553 | | | | — | | | | — | | | | 2,367,553 | |
| Closed-End Funds | | | — | | | | 1,295,629 | | | | — | | | | — | | | | 1,295,629 | |
| Open-End Funds | | | — | | | | 642,508 | | | | — | | | | — | | | | 642,508 | |
| Private Funds | | 1,630,608 | ^ | | | — | | | | — | | | | — | | | | 1,630,608 | |
| REITs | | | | | | | | | | | | | | | | | | | | |
Real Estate & Rental & Leasing | | | — | | | | 899,260 | | | | — | | | | — | | | | 899,260 | |
| Total REITs | | | — | | | | 899,260 | | | | — | | | | — | | | | 899,260 | |
| Royalty Trust | | | | | | | | | | | | | | | | | | | | |
Mining, Quarrying & | | | | | | | | | | | | | | | | | | | | |
Oil & Gas Extraction | | | — | | | | 1,083,744 | | | | — | | | | — | | �� | | 1,083,744 | |
| Total Royalty Trust | | | — | | | | 1,083,744 | | | | — | | | | — | | | | 1,083,744 | |
| Corporate Bonds | | | | | | | | | | | | | | | | | | | | |
Finance & Insurance | | | — | | | | — | | | | 804,326 | | | | — | | | | 804,326 | |
Information | | | — | | | | — | | | | 210,901 | | | | — | | | | 210,901 | |
Mining, Quarrying & | | | | | | | | | | | | | | | | | | | | |
Oil & Gas Extraction | | | — | | | | — | | | | 152,583 | | | | — | | | | 152,583 | |
Retail Trade | | | — | | | | — | | | | 107,159 | | | | — | | | | 107,159 | |
| Total Corporate Bonds | | | — | | | | — | | | | 1,274,969 | | | | — | | | | 1,274,969 | |
| U.S. Government | | | | | | | | | | | | | | | | | | | | |
| Obligations | | | — | | | | — | | | | 2,310,352 | | | | — | | | | 2,310,352 | |
| Short-Term Investment | | | — | | | | 1,211,554 | | | | — | | | | — | | | | 1,211,554 | |
| Total Investments | | $ | 1,630,608 | | | $ | 20,727,725 | | | $ | 3,585,321 | | | $ | — | | | $ | 25,943,654 | |
| * | Certain investments that are measured at fair value using the net asset value per share (or its equivalent) practical expedient have not been categorized in the fair value hierarchy. The fair value amounts presented in this table are intended to permit reconciliation of the fair value hierarchy to the amounts present in the schedule of investments |
CONCORDE WEALTH MANAGEMENT FUND
NOTES TO FINANCIAL STATEMENTS
Note 2 – Securities Valuation (continued)
| | | Withdrawals | Redemption | Investment | Investment | Lock Up |
| | ^Security | Permitted | Notice Period | Objective | Strategy | Period |
| | Partners Group | Not | Not | Capital | Globally diversified portfolio | None |
| | Private Equity | Applicable(1) | Applicable | Appreciation | of private equity investments | |
| | (Master Fund) | | | | | |
| | LLC – Class I | | | | | |
| | | | | | | |
| | LLR Equity | No | Not | Capital | Diversified portfolio of | Not |
| | Partners V, L.P. | | Applicable | Appreciation | equity investments in | Applicable |
| | | | | | lower middle market growth | |
| | | | | | companies primarily focused | |
| | | | | | on software and services | |
| | | | | | | |
| | LRVHealth, L.P. | No | Not | Capital | Non-diversified portfolio of | Not |
| | | | Applicable | Appreciation | insurance-linked securities | Applicable |
| | | | | | | |
| | Moran Tice 20:20 | Yes | 30 days | Value | Diversified portfolio of | None |
| | Fund L.P. | | | | investments the Investment | |
| | | | | | Manager believes will be | |
| | | | | | influenced by macro-economic | |
| | | | | | trends and/or event-driven situations. | |
| | (1) | Up to 5% of the Fund’s net asset value per quarter via tender offer. The tender offer is subject to board approval and not a guarantee of future liquidity. A 2% early repurchase fee will be imposed for repurchases made within one year of investment. |
Level 3 Reconciliation Disclosure
The following is a reconciliation of Level 3 assets for which significant unobservable inputs were used to determine fair value:
Private Fund, at Fair Value
| |
| Balance as of September 30, 2019 | | $ | 56,878 | | |
| Purchases | | | 25,000 | | |
| Sales | | | — | | |
| Realized gain/(loss) | | | — | | |
| Change in unrealized appreciation/(depreciation) | | | (1,897 | ) | |
| Transfers in and/or out of Level 3 | | | (79,981 | ) | |
| Balance as of September 30, 2020 | | $ | — | | |
The Fund held no Level 3 investments as of September 30, 2020.
Note 3 – Derivative Instruments
The average monthly value outstanding of options written during the year ended September 30, 2020 for the Fund was $4,578.
The Fund did not hold any derivatives as of September 30, 2020.
CONCORDE WEALTH MANAGEMENT FUND
NOTES TO FINANCIAL STATEMENTS
Note 3 – Derivative Instruments (continued)
The following is a summary of the effect of derivative instruments on the Fund’s Statement of Operations for the year ended September 30, 2020:
| | | Change in Unrealized |
Equity Risk Contracts | Realized Gain (Loss) | Appreciation (Depreciation) |
| Options Written | $18,114 | $— |
Note 4 – Investment Transactions
Purchases and sales of investment securities, excluding U.S. government obligations and short-term investments, for the Fund during the year ended September 30, 2020, were $8,661,525 and $6,010,500, respectively.
Purchases and sales/maturities of long-term U.S. government obligations for the Fund during the year ended September 30, 2020 were $673,148 and $2,827,463, respectively.
Note 5 – Principal Risks
The Fund in the normal course of business makes investments in financial instruments and derivatives where the risk of potential loss exists due to changes in the market (market risk), or failure or inability of the counterparty to a transaction to perform (credit and counterparty risk). See below for a detailed description of select principal risks.
American Depositary Receipts (“ADRs”) and Global Depository Receipts (“GDRs”) Risk. ADRs and GDRs may be subject to some of the same risks as direct investment in foreign companies, which includes international trade, currency, political, regulatory and diplomatic risks. In a sponsored ADR arrangement, the foreign issuer assumes the obligation to pay some or all of the depositary’s transaction fees. Under an unsponsored ADR arrangement, the foreign issuer assumes no obligations and the depositary’s transaction fees are paid directly by the ADR holders. Because unsponsored ADR arrangements are organized independently and without the cooperation of the issuer of the underlying securities, available information concerning the foreign issuer may not be as current as for sponsored ADRs and voting rights with respect to the deposited securities are not passed through. GDRs can involve currency risk since, unlike ADRs, they may not be U.S. dollar-denominated.
Convertible Securities Risk. A convertible security is a fixed-income security (a debt instrument or a preferred stock) which may be converted at a stated price within a specified period of time into a certain quantity of the common stock of the same or a different issuer. Convertible securities are senior to common stock in an issuer’s capital structure, but they are subordinated to any senior debt securities. While providing a fixed-income stream (generally higher in yield than the income derivable from common stock but lower than that afforded by a similar non-convertible security), a convertible security also gives an investor the opportunity, through its conversion feature, to participate in the capital appreciation of the issuing company depending upon a market price advance in the convertible security’s underlying common stock.
CONCORDE WEALTH MANAGEMENT FUND
NOTES TO FINANCIAL STATEMENTS
Note 5 – Principal Risks (continued)
Counterparty Risk. When the Fund enters into an investment contract, such as a derivative or a repurchase agreement, the Fund is exposed to the risk that the other party may be unable or unwilling to fulfill its obligations, which could adversely impact the value of the Fund.
Credit Risk. Credit risk is the risk that the issuer of a bond will fail to make payments when due or default completely. If the issuer of the bond experiences an actual or anticipated deterioration in credit quality, the price of the bond may be negatively impacted. The degree of credit risk depends on the financial condition of the issuer and the terms of the bond.
COVID-19 Risk. The global outbreak of COVID-19 (commonly referred to as “coronavirus”) has disrupted economic markets and the prolonged economic impact is uncertain. The ultimate economic fallout from the pandemic, and the long-term impact on economies, markets, industries and individual issuers, are not known. The operational and financial performance of the issuers of securities in which the Funds invest depends on future developments, including the duration and spread of the outbreak, and such uncertainty may in turn adversely affect the value and liquidity of the Fund’s investments, impair the Funds’ ability to satisfy redemption requests, and negatively impact the Fund’s performance.
Debt/Fixed Income Securities Risk. An increase in interest rates typically causes a fall in the value of the debt securities in which the Fund may invest. The value of your investment in the Fund may change in response to changes in the credit ratings of the Fund’s portfolio of debt securities. Interest rates in the United States are at, or near, historic lows, which may increase the Fund’s exposure to risks associated with rising interest rates. Moreover, rising interest rates or lack of market participants may lead to decreased liquidity in the bond and loan markets, making it more difficult for the Fund to sell its holdings at a time when the Fund’s manager might wish to sell. Lower rated securities (“junk bonds”) are generally subject to greater risk of loss of your money than higher rated securities. Debt securities are also subject to prepayment risk when interest rates decrease. Prepayment risk is the risk that the borrower will prepay some or all of the principal owed to the issuer. If prepayment occurs, the Fund may have to replace the security by investing the proceeds in a less attractive security.
Emerging Markets Risk. The Fund may invest in emerging markets, which may carry more risk than investing in developed foreign markets. Risks associated with investing in emerging markets include limited information about companies in these countries, greater political and economic uncertainties compared to developed foreign markets, underdeveloped securities markets and legal systems, potentially high inflation rates, and the influence of foreign governments over the private sector.
Equity and General Market Risk. Equities, such as common stocks, or other equity related investments are susceptible to general stock market fluctuations and to volatile increases and decreases in value. The stock market may experience declines or stocks in the Fund’s portfolio may not meet the financial expectations of the Fund or other market participants. The Fund’s NAV and investment return will fluctuate based upon changes in the value of its portfolio securities.
CONCORDE WEALTH MANAGEMENT FUND
NOTES TO FINANCIAL STATEMENTS
Note 5 – Principal Risks (continued)
Exchange Traded Fund Risk. ETFs may trade at a discount to the aggregate value of the underlying securities and although expense ratios for ETFs are generally low, frequent trading of ETFs by the Fund can generate brokerage expenses. Shareholders of the Fund will indirectly be subject to the fees and expenses of the individual ETFs in which the Fund invests, in addition to the Fund’s own fees and expenses.
Foreign Securities Risk. The Fund may invest in foreign securities and, if so, it will be subject to risks associated with foreign markets, such as adverse political, currency, social and economic developments; accounting standards or governmental supervision that are not consistent with that to which U.S. companies are subject; limited information about foreign companies; less liquidity in foreign markets; and less protection.
High Yield Risk. The Fund’s investment program permits it to invest in non-investment grade debt obligations, sometimes referred to as junk bonds (hereinafter referred to as “lower-quality securities”). Lower-quality securities are those securities that are rated lower than investment grade and unrated securities believed by Concorde to be of comparable quality. Although these securities generally offer higher yields than investment grade securities with similar maturities, lower-quality securities involve greater risks, including the possibility of default or bankruptcy. In general, they are regarded to be more speculative with respect to the issuer’s capacity to pay interest and repay principal.
Investments in Other Investment Companies Risk. Shareholders of the Fund will indirectly be subject to the fees and expenses of the other investment companies in which the Fund invests and these fees and expenses are in addition to the fees and expenses that Fund shareholders directly bear in connection with the Fund’s own operations. In addition, shareholders will be exposed to the investment risks associated with investments in other investment companies.
Liquidity Risk. Certain securities held by the Fund may be difficult (or impossible) to sell at the time and at the price the Fund would like. As a result, the Fund may have to hold these securities longer than it would like and may forego other investment opportunities. There is the possibility that the Fund may lose money or be prevented from realizing capital gains if it cannot sell a security at a particular time and price.
Private Funds Risk. The sale or transfer of investments in private funds may be limited or prohibited by contract or law. Private funds are generally fair valued in good faith following procedures approved by the Board as they are not traded frequently. The Fund may be required to hold such positions for several years, if not longer, regardless of valuation, which may cause the Fund to be less liquid.
Private Placement Risk. The Fund may invest in privately issued securities of domestic common and preferred stock, convertible debt securities, ADRs and REITs, including those which may be resold only in accordance with Rule 144A under the Securities Act of 1933, as amended. Privately issued securities are restricted securities that are not publicly traded. Delay or difficulty in selling such securities may result in a loss to the Fund.
CONCORDE WEALTH MANAGEMENT FUND
NOTES TO FINANCIAL STATEMENTS
Note 5 – Principal Risks (continued)
Real Estate Investment Trust and Real Estate Risk. The value of the Fund’s investments in REITS may change in response to changes in the real estate market such as declines in the value of real estate, lack of available capital or financing opportunities, and increases in property taxes or operating costs.
Royalty Trust Risk. Royalty trusts are subject to cash-flow fluctuations and revenue decreases due to a sustained decline in demand for crude oil, natural gas and refined petroleum products, risks related to economic conditions, higher taxes or other regulatory actions that increase costs for royalty trusts. Furthermore, royalty trusts do not guarantee minimum distributions or even return of capital. If the assets underlying a royalty trust do not perform as expected, the royalty trust may reduce or even eliminate distributions. The declaration of such distributions generally depends upon various factors, including operating performance and financial condition of the royalty trust and general economic conditions.
Security Selection Risk. The Advisor may misjudge the risk and/or return potential of a security. This misjudgment can result in a loss or a significant deviation relative to its benchmarks.
Smaller and Medium Capitalization Company Risk. Securities of smaller and medium-sized companies may be more volatile and more difficult to liquidate during market downturns than securities of larger companies. Additionally, the price of smaller companies may decline more in response to selling pressures.
Style Risk. The Advisor generally follows an investing style that favors value investments. The value investing style may, over time, go in and out of favor. At time when the value investing style is out of favor, the Fund may underperform other funds that use different investing styles. Investors should be prepared to tolerate volatility in Fund returns.
Note 6 – Investment Advisory Fees and Transactions with Affiliate
The Company has an Investment Advisory Agreement with Concorde to act as the Fund’s investment advisor. The Advisor provides the Fund with investment management and advisory services consistent with the Fund’s investment objectives, policies and restrictions, supervises the purchase and sale of investment transactions and administers the business and administrative operations of the Fund. For such services, for the year ended September 30, 2020, Concorde received an annual fee of 0.80% of the Fund’s average daily net assets, computed daily and paid on a monthly basis. The investment advisory fee was $203,886 for the year ended September 30, 2020, of which $17,195 was payable at September 30, 2020. Certain officers and directors of the Company are also officers and directors of Concorde.
Note 7 – Service Organizations
U.S. Bancorp Fund Services, LLC, doing business as U.S. Bank Global Fund Services (“Fund Services”), provides the Fund with administrative, fund accounting, and transfer agent services. U.S. Bank, N.A., (“USB”) an affiliate of Fund Services, serves as the Fund’s custodian. Fees incurred by the Fund to Fund Services and USB during the year ended September 30, 2020, were $89,442 and $6,366, respectively, of which $15,868 and $1,024, respectively, were payable at September 30, 2020.
CONCORDE WEALTH MANAGEMENT FUND
NOTES TO FINANCIAL STATEMENTS
Note 7 – Service Organizations (continued)
The Company has an administrative agreement with National Financial Services, LLC (“NFS”). The agreement provides for monthly payments by the Fund to NFS for providing certain shareholder services (sub-transfer agent fees). Sub-transfer agent fees incurred by the Fund to NFS for the year ended September 30, 2020 were $30,361, of which $2,228 was payable at September 30, 2020.
Note 8 – Federal Tax Information
At September 30, 2020, the Fund’s investments and components of total distributable earnings on a tax basis were as follows:
| Federal Tax Cost of Investments | | $ | 20,940,979 | |
| Gross Tax Unrealized Appreciation | | $ | 6,275,270 | |
| Gross Tax Unrealized Depreciation | | | (1,272,595 | ) |
| Net Tax Unrealized Appreciation | | | 5,002,675 | |
| Undistributed Ordinary Income | | | 169,606 | |
| Undistributed Long-Term Gains | | | 288,393 | |
| Total Distributable Earnings | | $ | 5,460,674 | |
The difference between book-basis and tax-basis net unrealized appreciation is primarily attributable to the realization for tax purposes of unrealized gains on an investment in a passive foreign investment company and adjustments to the tax basis of investments in partnerships.
At September 30, 2020, the Fund had no tax basis capital loss carryovers to offset future capital gains. The Fund did not utilize a capital loss carryover during the year ended September 30, 2020. The Fund had no late year loss deferrals and no post-October loss.
The tax character of distributions paid during the years ended September 30, 2020 and September 30, 2019 was as follows:
| | | September 30, 2020 | | | September 30, 2019 | |
Ordinary income(1) | | $ | 367,746 | | | $ | 94,085 | |
| Long-term capital gain | | | 196,478 | | | | 1,020,346 | |
| | | $ | 564,224 | | | $ | 1,114,431 | |
| | (1) | Ordinary income includes short-term capital gains. |
Note 9 – Subsequent Events
Management has evaluated the Fund’s events and transactions that occurred subsequent to September 30, 2020, through the date of issuance of the Fund’s financial statements. There were no events or transactions that occurred during this period that materially impacted the amounts or disclosures in the Fund’s financial statements.
REPORT OF INDEPENDENT REGISTERED PUBLIC ACCOUNTING FIRM
To the Shareholders and Board of Directors of Concorde Funds, Inc.
Opinion on the Financial Statements
We have audited the accompanying statement of assets and liabilities of Concorde Wealth Management Fund, a series of Concorde Funds, Inc. (Company), including the schedule of investments in securities, as of September 30, 2020, the related statement of operations for the year then ended, the statements of changes in net assets for each of the two years in the period then ended, and the related notes (collectively referred to as the “financial statements”) and the financial highlights for each of the five years in the period then ended. In our opinion, the financial statements and financial highlights present fairly, in all material respects, the financial position of the Company as of September 30, 2020, the results of its operations for the year then ended, the changes in net assets for each of the two years in the period then ended, and the financial highlights for each of the five years in the period then ended, in conformity with accounting principles generally accepted in the United States of America.
Basis for Opinion
These financial statements and financial highlights are the responsibility of the Company’s management. Our responsibility is to express an opinion on the Company’s financial statements and financial highlights based on our audits. We are a public accounting firm registered with the Public Company Accounting Oversight Board (United States) (PCAOB) and are required to be independent with respect to the Company in accordance with the U.S. federal securities laws and the applicable rules and regulations of the Securities and Exchange Commission and the PCAOB.
We conducted our audits in accordance with the standards of the PCAOB. Those standards require that we plan and perform the audit to obtain reasonable assurance about whether the financial statements and financial highlights are free of material misstatement whether due to error or fraud. The Company is not required to have, nor were we engaged to perform, an audit of its internal control over financial reporting. As part of our audits, we are required to obtain an understanding of internal control over financial reporting but not for the purpose of expressing an opinion on the effectiveness of the Company’s internal control over financial reporting. Accordingly, we express no such opinion.
Our audits included performing procedures to assess the risks of material misstatement of the financial statements and financial highlights, whether due to error or fraud, and performing procedures that respond to those risks. Such procedures included examining, on a test basis, evidence regarding the amounts and disclosures in the financial statements and financial highlights. Our procedures included confirmation of securities owned as of September 30, 2020, by correspondence with the custodian. Our audits also included evaluating the accounting principles used and significant estimates made by management, as well as evaluating the overall presentation of the financial statements and financial highlights. We believe that our audits provide a reasonable basis for our opinion.
| |  |
| | |
| | BRAD A. KINDER, CPA |
We have served as the auditor of Concorde Funds, Inc. since 2002.
Flower Mound, Texas
November 23, 2020
BOARD APPROVAL OF CONTINUATION OF INVESTMENT ADVISORY AGREEMENT
(Unaudited)
At its meeting held on June 11, 2020, the Board of Directors (the “Board”) of Concorde Funds, Inc. (the “Company”), including all the Directors who are not “interested persons” (as defined in the Investment Company Act of 1940), considered and then voted to approve the renewal of the investment advisory agreement (the “Advisory Agreement”) between Concorde Financial Corporation (the “Advisor”) and the Company, on behalf of the Concorde Wealth Management Fund (the “Fund”). In connection with its approval of the continuation of the Advisory Agreement, the Board reviewed and discussed the specific services provided by the Advisor. The Board considered the following factors, among others:
The Advisor:
| | 1) | Provides daily investment management for the Fund. In providing investment management, the Advisor oversees the trading of securities and the rebalancing of the portfolio. |
| | | |
| | 2) | Retains the services of the Fund’s Chief Compliance Officer and makes all reasonable efforts to insure that the Fund is in compliance with the securities laws. |
| | | |
| | 3) | Provides responsive customer and shareholder servicing which consists of responding to shareholder inquiries received, including specific mutual fund account information, in addition to calls directed to the transfer agent call center. |
| | | |
| | 4) | Oversees distribution of the Fund through third-party broker/dealers and independent financial institutions. |
| | | |
| | 5) | Oversees third party service providers that support the Fund in providing fund accounting, fund administration, transfer agency and custodial services. |
The Board also: (i) compared the performance of the Fund to benchmark indices over various periods of time and concluded that the performance of the Fund, particularly on a risk-adjusted basis, warranted the continuation of the Advisory Agreement; (ii) compared the expense ratios of funds similar in asset size and investment objective to those of the Fund and concluded the expenses of the Fund were reasonable and warranted continuation of the Advisory Agreement; (iii) considered the fees charged by the Advisor to those of funds similar in asset size and investment objective to the Fund and concluded the advisory fees of the Fund were reasonable and warranted continuation of the Advisory Agreement; and (iv) considered the profitability of the Advisor with respect to the Fund, and concluded that the profits were reasonable and not excessive when compared to profitability guidelines set forth in relevant court cases.
The Board then discussed economies of scale and breakpoints and determined that the Fund, managed by the Advisor, has not yet significantly grown in size, nor has the marketplace demonstrated significant rapid potential growth to any extent, that would warrant the need for breakpoints.
BOARD APPROVAL OF CONTINUATION OF INVESTMENT ADVISORY AGREEMENT
(Unaudited) (continued)
The Board reviewed the Fund’s expense ratios and comparable expense ratios for similar funds. The Board used data from Morningstar, as presented in the materials provided to the Board, showing funds classified by Morningstar as similar in nature to the Fund. The Board determined that the total expense ratio of the Fund falls within a reasonable range of the ratios of other funds in the peer group presented to the Board. The Board also referenced the Advisor’s Form ADV and the executed Investment Advisory Agreement and determined that the terms of the Agreement are reasonable, and that the Advisor has the resources to service the Fund well.
All of the factors discussed by the Board were considered as a whole, and were considered separately by the Directors who are not “interested persons” of the Fund, meeting in executive session both before and after their general session with the other Director and management of the Fund. The factors were viewed in their totality by the Board, with no single factor being the principal or determinative factor in the Board’s determination of whether to approve the continuation of the Advisory Agreement. The Board recognized that the management and fee arrangements for the Fund are the result of years of review and discussion between the Directors and the Advisor, that certain aspects of such arrangements may receive greater scrutiny in some years than in others and that the Directors’ conclusions may be based, in part, on their consideration of these same arrangements and information received during the course of the year and in prior years.
After further discussion, the Directors, including all of the Directors who are not “interested persons,” as defined by the 1940 Act, unanimously approved the continuation of the Advisory Agreement.
REVIEW OF LIQUIDITY RISK MANAGEMENT PROGRAM (Unaudited)
Pursuant to Rule 22e-4 under the Investment Company Act of 1940, the Company and the Advisor have jointly adopted a Liquidity Risk Management Program (the “Program”) to govern the Fund’s approach to managing liquidity risk. Rule 22e-4 seeks to promote effective liquidity risk management, thereby reducing (but not eliminating) the risk that a fund will be unable to meet its redemption obligations and mitigating dilution of the interests of fund shareholders.
At a recent meeting of the Board of Directors of the Fund, the Directors received a report by the Program Administrator pertaining to the operation, adequacy, and effectiveness of implementation of the Program for the twelve-month period ended June 30, 2020. The report concluded that the Program is reasonably designed to assess and manage the Fund’s liquidity risk and has operated adequately and effectively to manage such risk. The report reflected that there were no liquidity events that impacted the Fund’s ability to timely meet redemptions without dilution to existing shareholders. The report further noted that no material changes have been made to the Program since its implementation.
There can be no assurance that the Program will achieve its objectives in the future. Please refer to the prospectus for more information regarding the Fund’s exposure to liquidity risk and other principal risks to which an investment in the Fund may be subject.
ADDITIONAL INFORMATION (Unaudited)
PROXY VOTING POLICIES AND PROCEDURES
For a description of the policies and procedures that the Fund uses to determine how to vote proxies relating to the portfolio securities, please call (972) 701-5400 and request a Statement of Additional Information. One will be mailed to you free of charge. The Statement of Additional Information is also available on the website of the Securities and Exchange Commission (“SEC”) at http://www.sec.gov.
PROXY VOTING RECORDS
Information on how the Fund voted proxies relating to portfolio securities during the twelve-month period ended June 30, 2020 is available without charge, upon request, by calling (972) 701-5400. Furthermore, you can obtain the Fund’s proxy voting records on the SEC’s website at http://www.sec.gov.
QUARTERLY PORTFOLIO HOLDINGS INFORMATION
The Fund files its complete schedule of portfolio holdings with the SEC for the first and third fiscal quarters as an exhibit to its report on Form N-PORT. The Fund’s Form N-PORT is available without charge, upon request, by calling (972) 701-5400. Furthermore, you can obtain the Fund's complete schedule of portfolio holdings on the SEC’s website at http://www.sec.gov.
HOUSEHOLD DELIVERY OF SHAREHOLDER DOCUMENTS
In an effort to decrease costs, the Fund intends to reduce the number of duplicate prospectuses and Annual and Semi-Annual Reports you receive by sending only one copy of each to those addresses shared by two or more accounts and to shareholders we reasonably believe are from the same family or household. Once implemented, if you would like to discontinue householding for your accounts, please call toll-free at 1-800-294-1699 to request individual copies of these documents. Once the Fund receives notice to stop householding, we will begin sending individual copies thirty days after receiving your request. This policy does not apply to account statements.
FEDERAL TAX DISTRIBUTION INFORMATION
The Fund has designated 80.80% of the dividends declared from net investment income during the year ended September 30, 2020, as qualified dividend income under the Jobs Growth and Tax Reconciliation Act of 2003. Additionally, for corporate shareholders, the percent of ordinary income distributions qualifying for the corporate dividends received deduction for the fiscal year ended September 30, 2020 was 48.37%.
FUND EXPENSES (Unaudited)
As a shareholder of the Fund, you incur two types of costs: (1) transaction costs and exchange fees; and (2) ongoing costs, including management fees and other Fund expenses. This Example is intended to help you understand your ongoing costs (in dollars) of investing in the Fund and to compare these costs with the ongoing costs of investing in other mutual Funds.
The Example is based on an investment of $1,000 invested at the beginning of the period and held for the entire six month period ended September 30, 2020.
Actual Expenses
The first line of the table below provides information about actual account values and actual expenses. You may use the information in this line, together with the amount you invested, to estimate the expenses that you paid over the period. Simply divide your account value by $1,000 (for example, an $8,600 account value divided by $1,000 = 8.6), then multiply the result by the number in the first line under the heading entitled “Expenses Paid During Period” to estimate the expenses you paid on your account during this period.
Hypothetical Example for Comparison Purposes
The second line of the table below provides information about hypothetical account values and hypothetical expenses based on the Fund’s actual expense ratio and an assumed rate of return of 5% per year before expenses, which is not the Fund’s actual return. The hypothetical account values and expenses may not be used to estimate the actual ending account balance or expenses you paid for the period. You may use this information to compare the ongoing costs of investing in the Fund and other Funds. To do so, compare this 5% hypothetical example with the 5% hypothetical examples that appear in the shareholder reports of the other Funds.
Please note that the expenses shown in the table are meant to highlight your ongoing costs only and do not reflect any transactional costs or exchange fees. While the Fund does not currently assess sales charges, redemption or exchange fees, some other funds do, and those costs will not be reflected in their expense tables. Therefore, the second line of the table is useful in comparing ongoing costs only, and will not help you determine the relative total costs of owning different mutual funds. In addition, if transaction costs were included, your costs would have been higher.
| | Beginning Account | Ending Account | Expenses Paid During Period* – |
| | Value – 4/1/20 | Value – 9/30/20 | Six Months Ended 9/30/20 |
| Actual | $1,000.00 | $1,175.00 | $9.19 |
Hypothetical | | | |
(5% return before expenses) | $1,000.00 | $1,016.55 | $8.52 |
______________
| * | Expenses are equal to the Fund’s annualized expense ratio of 1.69%, multiplied by the average account value over the period, multiplied by 183/366 (to reflect the one-half year period ended September 30, 2020). |
DIRECTORS AND OFFICERS (Unaudited)
DIRECTORS AND OFFICERS
The Fund’s Statement of Additional Information includes additional information about the Fund’s Officers and Directors and is available, without charge, upon request by calling (972) 701-5400.
| | | | | # of | |
| | | | | Portfolios | Other |
| | | | | in Fund | Directorships |
| | Position(s) | Term of Office | | Complex | Held by |
| Name, Address | Held with | and Length | Principal Occupation(s) | Overseen | Director During |
and Year of Birth | the Fund | of Time Served | During Past 5 Years | by Director | Past 5 Years |
| | | | | | |
| “Disinterested Persons” | | | | | |
| | | | | | |
William Marcy, Ph.D., P.E. | Chairman | Indefinite, | Executive Director of the Murdough | 1 | None. |
Born: 1942 | (Since 2019) | until | Center for Engineering Professionalism | | |
Address: | and | successor | and the National Institute for | | |
8383 Preston Center Plaza | Director | elected | Engineering Ethics, Texas Tech | | |
Suite 360 | (Since 2006) | | University. He is a former Provost and | | |
Dallas, Texas 75225 | | | Senior Vice President for Academic | | |
| | | | Affairs, Texas Tech University. | | |
| | | | | | |
Harold E. Schneider | Director | Indefinite, | A private investor in real estate, | 1 | None. |
Born: 1950 | | until | equity and oil and gas investments. | | |
Address: | | successor | | | |
8383 Preston Center Plaza | | elected | | | |
Suite 360 | | Since 2019 | | | |
Dallas, Texas 75225 | | | | | |
| | | | | | |
| “Interested Persons” | | | | | |
| | | | | | |
Gary B. Wood, Ph.D.*, ** | President | One-year term | President, Secretary, Treasurer and | 1 | None. |
Born: 1949 | and | (as President) | a director of the Advisor and Concorde | | |
Address: | Director | Indefinite, | Capital Corporation, an exempt reporting | | |
8383 Preston Center Plaza | | until | advisor to funds affiliated with the Advisor. | | |
Suite 360 | | successor | He is also Chairman of the Board and | | |
Dallas, Texas 75225 | | elected | Interim CEO of International Hospital | | |
| | | (as Director) | Corporation Holding, NV and its | | |
| | | Since 1987 | subsidiaries, which owns, develops and | | |
| | Treasurer | (1987 – 2014) | manages private healthcare facilities in | | |
| | | | Mexico, Central America and Brazil. | | |
| | | | | | |
John A. Stetter | Secretary | One-year term | Vice President and Portfolio Manager | N/A | N/A |
Born: 1955 | | Since 1998 | for the Advisor. | | |
Address: | | | | | |
8383 Preston Center Plaza | | | | | |
Suite 360 | | | | | |
Dallas, Texas 75225 | | | | | |
DIRECTORS AND OFFICERS (Unaudited) (continued)
| | | | | # of | |
| | | | | Portfolios | Other |
| | | | | in Fund | Directorships |
| | Position(s) | Term of Office | | Complex | Held by |
| Name, Address | Held with | and Length | Principal Occupation(s) | Overseen | Director During |
and Year of Birth | the Fund | of Time Served | During Past 5 Years | by Director | Past 5 Years |
| | | | | | |
Gregory B. Wood** | Treasurer | One-year term | Vice President and Director | N/A | N/A |
Born: 1979 | and Chief | (as Treasurer) | of the Advisor and Concorde | | |
Address: | Compliance | Since 2014; | Capital Corporation since 2014. | | |
8383 Preston Center Plaza | Officer | (as Chief | Commercial banking underwriter | | |
Suite 360 | | Compliance | at JPMorgan Chase & Co., Inc. | | |
Dallas, Texas 75225 | | Officer) | (2010 – 2014). | | |
| | | Since 2015 | | | |
____________________
| * | Dr. Wood is a director who is an “interested person” of the Fund as that term is defined in the 1940 Act, due to the position he holds with the Advisor. |
| ** | Dr. Wood and Gregory Wood are father and son, respectively. |
CONCORDE FUNDS, INC.
PRIVACY POLICY
We collect the following nonpublic personal information about you:
| | • | Information we receive from you or in applications or other forms, correspondence, or conversations, including, but not limited to, your name, address, phone number, social security number, assets, income and date of birth; and |
| | | |
| | • | Information about your transactions with us, our affiliates, or others, including, but not limited to, your account number and balance, payments history, parties to transactions, cost basis information, and other financial information. |
We do not disclose any nonpublic personal information about our current or former shareholders to nonaffiliated third parties, except as permitted by law. For example, we are permitted by law to disclose all the information we collect, as described above, to our transfer agent and sub-transfer agent to process your transactions. Furthermore, we restrict access to your nonpublic personal information to those persons who require such information to provide products and services to you. We maintain physical, electronic, and procedural safeguards that comply with federal standards to guard your nonpublic personal information.
In the event that you hold shares of the Fund through a financial intermediary, including, but not limited to, a broker-dealer, bank or trust company, the privacy policy of your financial intermediary would govern how your nonpublic personal information would be shared with nonaffiliated third parties.
INVESTMENT ADVISOR
Concorde Investment Management
8383 Preston Center Plaza
Suite 360
Dallas, Texas 75225
OFFICERS
Gary B. Wood, Ph.D.
President
Gregory B. Wood
Treasurer
John A. Stetter
Secretary
DIRECTORS
William Marcy, P.E., Ph.D.
Harold E. Schneider
Gary B. Wood, Ph.D.
CUSTODIAN
U.S. Bank, N.A.
Custody Operations
1555 North RiverCenter Drive, Suite 302
Milwaukee, Wisconsin 53212
TRANSFER AGENT AND
DIVIDEND DISBURSING AGENT
U.S. Bancorp Fund Services, LLC
doing business as
U.S. Bank Global Fund Services
Mutual Fund Services, 3rd Floor
615 East Michigan Street
Milwaukee, Wisconsin 53202
INDEPENDENT REGISTERED
PUBLIC ACCOUNTING FIRM
Brad A. Kinder, CPA
815 Parker Square
Flower Mound, Texas 75028
LEGAL COUNSEL
Foley & Lardner LLP
777 East Wisconsin Avenue
Milwaukee, Wisconsin 53202
TELEPHONE
(972) 701-5400
(Fund information)
(800) 294-1699
(Shareholder account information)

Item 2. Code of Ethics.
The registrant has adopted an amended and restated code of ethics that applies to the registrant’s principal executive officer and principal financial officer. The registrant has not made any amendments to its code of ethics during the period covered by this report. The registrant has not granted any waivers from any provisions of the code of ethics during the period covered by this report. The registrant undertakes to provide to any person without charge, upon request, a copy of its code of ethics by mail when they call the registrant at 1-800-294-1699.
A copy of the registrant’s Code of Ethics, as amended, is filed herewith.
Item 3. Audit Committee Financial Expert.
The Registrant’s Board of Directors has determined that it does not have an audit committee financial expert serving on its audit committee. At this time, the registrant believes that the experience provided by each member of the Audit Committee together, and taken as a whole, offers the registrant adequate oversight for the registrant’s level of financial complexity.
Item 4. Principal Accountant Fees and Services.
The registrant has engaged its principal accountant to perform audit services, audit-related services, tax services and other services during the past two fiscal years. “Audit services” refer to performing an audit of the registrant's annual financial statements or services that are normally provided by the accountant in connection with statutory and regulatory filings or engagements for those fiscal years. “Audit-related services” refer to the assurance and related services by the principal accountant that are reasonably related to the performance of the audit. “Tax services” refer to professional services rendered by the principal accountant for tax compliance, tax advice, and tax planning. There were no “other services” provided by the principal accountant. The following table details the aggregate fees billed or expected to be billed for each of the last two fiscal years for audit fees, audit-related fees, tax fees and other fees by the principal accountant.
| | FYE 09/30/2020 | FYE 09/30/2019 |
Audit Fees | $26,000 | $25,000 |
Audit-Related Fees | None | None |
Tax Fees | $2,000 | $1,500 |
All Other Fees | None | None |
The audit committee has adopted pre-approval policies and procedures that require the audit committee to pre‑approve all audit and non‑audit services of the registrant, including services provided to any entity affiliated with the registrant.
The percentage of fees billed by Brad A. Kinder, CPA applicable to non-audit services pursuant to waiver of pre-approval requirement were as follows:
| | FYE 09/30/2020 | FYE 09/30/2019 |
Audit-Related Fees | 0% | 0% |
Tax Fees | 0% | 0% |
All Other Fees | 0% | 0% |
All of the principal accountant’s hours spent on auditing the registrant’s financial statements were attributed to work performed by full‑time permanent employees of the principal accountant.
The following table indicates the non-audit fees billed or expected to be billed by the registrant’s accountant for services to the registrant and to the registrant’s investment adviser (and any other controlling entity, etc.—not sub-adviser) for the last two years. The audit committee of the Board of Directors has considered whether the provision of non-audit services that were rendered to the registrant's investment adviser is compatible with maintaining the principal accountant's independence and has concluded that the provision of such non-audit services by the accountant has not compromised the accountant’s independence.
Non-Audit Related Fees | FYE 09/30/2020 | FYE 09/30/2019 |
Registrant | None | None |
Registrant’s Investment Adviser | $4,000 | $4,000 |
Item 5. Audit Committee of Listed Registrants.
(a) | Not applicable to registrants who are not listed issuers (as defined in Rule 10A-3 under the Securities Exchange Act of 1934). |
Item 6. Investments.
(a) | Schedule of Investments is included as part of the report to shareholders filed under Item 1 of this Form. |
Item 7. Disclosure of Proxy Voting Policies and Procedures for Closed-End Management Investment Companies.
Not applicable to open-end investment companies.
Item 8. Portfolio Managers of Closed-End Management Investment Companies.
Not applicable to open-end investment companies.
Item 9. Purchases of Equity Securities by Closed‑End Management Investment Company and Affiliated Purchasers.
Not applicable to open-end investment companies.
Item 10. Submission of Matters to a Vote of Security Holders.
There were no material changes to the procedures by which shareholders may recommend nominees to the Registrant’s Board of Directors.
Item 11. Controls and Procedures.
(a) | The Registrant’s President and Treasurer have reviewed the Registrant's disclosure controls and procedures (as defined in Rule 30a-3(c) under the Investment Company Act of 1940 (the “Act”)) as of a date within 90 days of the filing of this report, as required by Rule 30a-3(b) under the Act and Rules 13a-15(b) or 15d‑15(b) under the Securities Exchange Act of 1934. Based on their review, such officers have concluded that the disclosure controls and procedures are effective in ensuring that information required to be disclosed in this report is appropriately recorded, processed, summarized and reported and made known to them by others within the Registrant and by the Registrant’s service provider. |
(b) | There were no changes in the Registrant's internal control over financial reporting (as defined in Rule 30a-3(d) under the Act) that occurred during the period covered by this report that have materially affected, or are reasonably likely to materially affect, the Registrant's internal control over financial reporting. |
Item 12. Disclosure of Securities Lending Activities for Closed-End Management Investment Companies
Not applicable to open-end investment companies.
Item 13. Exhibits.
(3) Any written solicitation to purchase securities under Rule 23c‑1 under the Act sent or given during the period covered by the report by or on behalf of the registrant to 10 or more persons. Not applicable to open-end investment companies.
(4)Change in the registrant’s independent public accountant. There was no change in the registrant’s independent public accountant for the period covered by this report.
SIGNATURES
Pursuant to the requirements of the Securities Exchange Act of 1934 and the Investment Company Act of 1940, the registrant has duly caused this report to be signed on its behalf by the undersigned, thereunto duly authorized.
(Registrant) Concorde Funds, Inc.
By (Signature and Title)* /s/ Gary B. Wood
Gary B. Wood, President/Principal Executive Officer
Date December 8, 2020
Pursuant to the requirements of the Securities Exchange Act of 1934 and the Investment Company Act of 1940, this report has been signed below by the following persons on behalf of the registrant and in the capacities and on the dates indicated.
By (Signature and Title)* /s/Gary B. Wood
Gary B. Wood, President/Principal Executive Officer
Date December 8, 2020
By (Signature and Title)* /s/Gregory B. Wood
Gregory B. Wood, Treasurer/Principal Financial Officer
Date December 7, 2020
* Print the name and title of each signing officer under his or her signature.