UNITED STATES
SECURITIES AND EXCHANGE COMMISSION
Washington, D.C. 20549
Form N-CSR
CERTIFIED SHAREHOLDER REPORT OF REGISTERED
MANAGEMENT INVESTMENT COMPANIES
Investment Company Act File Number 811-5344
William Blair Funds
(Exact name of registrant as specified in charter)
| 150 North Riverside Plaza, Chicago, IL | | 60606 |
| (Address of principal executive offices) | | (Zip Code) |
Stephanie G. Braming, Principal Executive Officer
William Blair Funds
150 North Riverside Plaza, Chicago, IL 60606
(Name and address of agent for service)
Registrant’s telephone number, including area code: 312-236-1600
Date of fiscal year end: October 31
Date of reporting period: October 31, 2021
Item 1. October 31, 2021 Annual Report transmitted to shareholders.

| | Small Cap Value Fund
October 31, 2021 |
William Blair Funds Annual Report | |
The views expressed in the commentary for each Fund reflect those of the portfolio management team only through the end of the period of the report as stated on the cover. The portfolio management team’s views are subject to change at any time based on market and other conditions and should not be construed as a recommendation. Statements involving predictions, assessments, analyses, or outlook for individual securities, industries, market sectors, and/or markets involve risks and uncertainties, and there is no guarantee they will come to pass.
This report is submitted for the general information of the shareholders of William Blair Funds. It is not authorized for distribution to prospective Fund investors unless accompanied or preceded by the Fund’s prospectus. Please carefully consider a Fund’s investment objectives, risks, charges, and expenses before investing. This and other information is contained in the Fund’s prospectus, which you may obtain by calling 1-800-742-7272. Read it carefully before you invest or send money.
| October 31, 2021 | William Blair Funds | 1 |
U.S. Value Market Review and Outlook
Since November 2020, when the positive results of two effective COVID-19 vaccines were announced, a rebounding economy and corporate earnings that trounced expectations fueled a powerful stock market rally, particularly in small cap value shares. In recent months, however, the surge in the delta variant of the virus, rising inflation and a sag in consumer confidence have led many investors and companies to reduce their expectations for near term earnings growth. Despite this abrupt reversal in sentiment in recent months, the economically sensitive Russell 2000® Value index surged +64.30% for the 12-month period ended October 31, 2021.
Supply chain constraints, which earlier in the recovery seemed limited to semiconductors, have broadened out to affect other areas of the economy, including the availability of labor despite still elevated unemployment. At the same time, rising inflation, at first believed temporary due to the abrupt restarting of the economy post pandemic, is beginning to look more persistent. While we still believe the economy is on solid footing, these headwinds are likely to impede margins and earnings growth over the next few quarters and could lead to negative revisions to both. Less clear is the extent to which this is already reflected in stock valuations.
Late in September, the Federal Reserve signaled that it is ready to begin tapering its massive bond buying program of the last few years. The bond market responded with an increase in treasury yields and a steepening of the yield curve. We are optimistic that this is the first step to a more “normal” interest rate regime.
Events in Washington D.C. are also likely to come to the forefront in the next few months as a deeply divided Congress needs to raise the federal debt ceiling and the Democratic party attempts to push through over $3 trillion in new fiscal stimulus. The former is almost certain to get done, but the scope and tax implications of the latter remain to be seen. In the meantime, however, we will continue to manage the portfolio with our time tested investment philosophy and process seeking to identify what we believe are quality small cap companies whose share prices are temporarily trading at a discount to our assessment of their true intrinsic value.
| 2 | Annual Report | October 31, 2021 |

William V. Heaphy, CFA 
Gary J. Merwitz | Small Cap Value Fund The Small Cap Value Fund seeks long-term capital appreciation. AN OVERVIEW FROM THE PORTFOLIO MANAGERS The William Blair Small Cap Value Fund (Class I)(1) (the “Fund”) posted a 55.32% increase, net of fees, for the fiscal year ended October 31, 2021. By comparison, the Fund’s benchmark index, the Russell 2000® Value Index (the “Index”), increased 64.30%. The Fund’s relative performance was impacted by the combination of stock selection and style headwinds during the year given its higher quality bias. The Index’s torrid performance this fiscal year can be attributed, in part, to heavy flows into passively managed exchange traded funds. This wave of money created a rising tide that lifted all ships, resulting in a short-term headwind for active stock pickers like ourselves that employ a disciplined approach to valuation and quality. Notably, shares of companies with the lowest returns on equity, the highest financial leverage and those losing money all outperformed. This dynamic explains some, but not all, of the Fund’s shortfall in the fiscal year. The Fund’s Financial holdings provided the greatest lift to relative performance for the rolling one-year period. Our bank stocks were particularly strong, gaining 79% compared to the 61% return for the Index peers. Despite the pandemic inflicted damage to the economy, it was our thesis that credit metrics at most banks would hold up better than expected with the continuing steepening of the yield curve providing a favorable backdrop. Further to rising interest rates, the Fund also benefitted from our underweights in both the bond proxy industry groups of Utilities and REITs. We see rates continuing to rise. Inflation expectations are currently 3%, the highest since the financial crisis in 2008. If this persists, the current yield of just 1.6% on the U.S. 10-year Treasury is likely to move higher. At the same time, at 12.5 times expected earnings next year (P/E) and 1.5 times tangible book value, bank valuations are in line to somewhat below long-term averages even as EPS estimates have risen as the yield curve has steepened. For this reason, we are maintaining our current weighting of regional banks in line with the Index. The largest detractors for the rolling one-year period were concentrated in the red-hot Consumer Discretionary & Communication Services industries which have been a headwind to relative performance. Going into the beginning of the year we were quite positive on retailers, which continued to benefit from a further opening of the economy post the pandemic and also maintained a healthy overweight to the consumer. As the delta variant surged during the summer months and inflation proved to be more persistent than expected, consumer confidence sagged along with investors’ appetite for Consumer Discretionary shares in the most recent quarter. Measured against a diversified index like the Russell 2000® Value, rarely does relative performance suffer greatly from the lack of exposure to any one security. Unfortunately, the surge in the “meme” stocks of GameStop Corp. and AMC Entertainment Holdings for the rolling one-year has been a substantial headwind to relative performance. Even with their reversal in performance late in the fiscal year, GameStop advanced over 1,900% and AMC was up over 1,300% for the fiscal year. With $10 billion in debt, projected negative cash flow of $1 billion and a challenged business model even prior to pandemic induced shutdown, AMC is not a company that meets our investment criteria. Please refer to the U.S. Value Market Review and Outlook relating to the Fund on page 2. |
| (1) | On July 16, 2021, the Fund acquired the assets and assumed the liabilities of the ICM Small Company Portfolio (the “Predecessor Fund”) in a reorganization. The Predecessor Fund’s (Institutional Class shares) performance and financial history has been adopted by Class I shares of the Fund following the reorganization. Accordingly, performance prior to the date of the reorganization reflects that of the Predecessor Fund. |
| October 31, 2021 | William Blair Funds | 3 |
Small Cap Value Fund
Performance Highlights (Unaudited)
| Average Annual Total Returns through 10/31/2021 |
| | | | 1 Year | | | | 3 Year | | | | 5 Year | | | | 10 Year | | | | Since
Inception |
| Class N (a) | | | — | % | | | — | % | | | — | % | | | — | % | | | 4.17 | % |
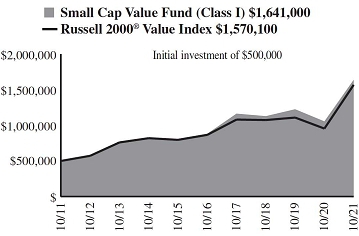
| Class I (a) | | | 55.32 | | | | 13.24 | | | | 13.21 | | | | 12.62 | | | | — | |
| Class R6 (a) | | | — | | | | — | | | | — | | | | — | | | | 4.26 | |
| Russell 2000® Value Index | | | 64.30 | | | | 13.44 | | | | 12.61 | | | | 12.12 | | | | 6.83 | |
| (a) | On July 16, 2021, the Fund acquired the assets and assumed the liabilities of the ICM Small Company Portfolio (the “Predecessor Fund”) in a reorganization. The Predecessor Fund’s (Institutional Class shares) performance and financial history has been adopted by Class I shares of the Fund following the reorganization. Accordingly, Class I’s performance prior to the date of the reorganization reflects that of the Predecessor Fund. Since inception performance for each of Class N & Class R6 is for the period from July 17, 2021 (Commencement of Operations) to October 31, 2021. |
Performance cited represents past performance. Past performance does not guarantee future results and current performance may be lower or higher than the data quoted. Results shown are average annual total returns, which assume reinvestment of dividends and capital gains. Investment returns and principal will fluctuate and you may have a gain or loss when you sell shares. For the most current month-end performance information, please call 1-800-742-7272, or visit our Web site at www.williamblairfunds.com. Investing in smaller companies involves special risks, including higher volatility and lower liquidity. Smaller capitalization stocks are also more sensitive to purchase/sale transactions and changes in the issuer’s financial condition. From time to time, the investment adviser may waive fees or reimburse expenses for the Fund. Without these waivers/reimbursements, performance would be lower. Class N shares are not subject to a sales load. Class I shares are not subject to a sales load or distribution (Rule 12b-1) fees. Class R6 shares are not subject to a sales load, distribution (Rule 12b-1) fees, or sub-transfer agent fees.
The performance highlights and graph presented above do not reflect the deduction of taxes that a shareholder would pay on fund distributions or the redemption of fund shares.
The Russell 2000® Value Index consists of small-capitalization companies with below average price-to-book ratios and forecasted growth rates.
This report identifies the Fund’s investments on October 31, 2021. These holdings are subject to change. Not all stocks in the Fund performed the same, nor is there any guarantee that these stocks will perform as well in the future. Market forecasts provided in this report may not necessarily come to pass.
Sector Diversification (Unaudited)

The sector diversification shown is based on the total long-term securities.
| 4 | Annual Report | October 31, 2021 |
Small Cap Value Fund
Portfolio of Investments, October 31, 2021 (all dollar amounts in thousands)
| | Issuer | | Shares | | | Value | |
| | | | | | | | | | |
| | Common Stocks | | | | | | | | |
| | Financials—23.4% | | | | | | | | |
| | Ameris Bancorp | | | 413,813 | | | $ | 21,680 | |
| | Argo Group International Holdings, Ltd.† | | | 452,828 | | | | 24,951 | |
| | Atlantic Union Bankshares Corporation | | | 418,703 | | | | 15,019 | |
| | Banc of California, Inc. | | | 1,134,063 | | | | 23,055 | |
| | Berkshire Hills Bancorp, Inc. | | | 733,714 | | | | 19,920 | |
| | Compass Diversified Holdings | | | 740,435 | | | | 22,102 | |
| | ConnectOne Bancorp, Inc. | | | 914,028 | | | | 30,830 | |
| | Dime Community Bancshares, Inc. | | | 647,684 | | | | 23,109 | |
| | Eastern Bankshares, Inc. | | | 966,687 | | | | 20,078 | |
| | Enterprise Financial Services Corporation | | | 427,174 | | | | 20,086 | |
| | First Bancorp | | | 406,394 | | | | 19,678 | |
| | First Merchants Corporation | | | 391,774 | | | | 16,290 | |
| | MGIC Investment Corporation | | | 1,437,005 | | | | 23,222 | |
| | Pacific Premier Bancorp, Inc. | | | 529,496 | | | | 22,233 | |
| | Pinnacle Financial Partners, Inc. | | | 97,578 | | | | 9,423 | |
| | PJT Partners, Inc. | | | 304,511 | | | | 24,906 | |
| * | PRA Group, Inc. | | | 582,481 | | | | 24,977 | |
| | Sandy Spring Bancorp, Inc. | | | 390,197 | | | | 18,519 | |
| | Seacoast Banking Corporation of Florida | | | 593,080 | | | | 21,606 | |
| | Simmons First National Corporation | | | 705,723 | | | | 21,094 | |
| * | Texas Capital Bancshares, Inc. | | | 392,970 | | | | 23,814 | |
| | Veritex Holdings, Inc. | | | 628,514 | | | | 25,738 | |
| | | | | | | | | 472,330 | |
| | Industrials—19.5% | | | | | | | | |
| | ABM Industries, Inc. | | | 365,483 | | | | 16,085 | |
| | Albany International Corporation | | | 263,683 | | | | 21,266 | |
| | Astec Industries, Inc. | | | 234,644 | | | | 12,525 | |
| * | CBIZ, Inc. | | | 610,070 | | | | 22,396 | |
| | Deluxe Corporation | | | 531,989 | | | | 18,976 | |
| * | Dycom Industries, Inc. | | | 225,653 | | | | 17,921 | |
| | GrafTech International, Ltd. | | | 1,871,821 | | | | 20,029 | |
| | Granite Construction, Inc. | | | 478,512 | | | | 17,762 | |
| * | Great Lakes Dredge & Dock Corporation | | | 1,339,236 | | | | 20,383 | |
| * | Harsco Corporation | | | 926,256 | | | | 15,839 | |
| | Herman Miller, Inc. | | | 476,955 | | | | 18,563 | |
| | Hillenbrand, Inc. | | | 460,563 | | | | 20,937 | |
| * | Hub Group, Inc. | | | 307,032 | | | | 24,124 | |
| | ICF International, Inc. | | | 225,934 | | | | 22,704 | |
| | Kaman Corporation | | | 475,757 | | | | 17,027 | |
| * | KAR Auction Services, Inc. | | | 1,301,721 | | | | 19,096 | |
| | Marten Transport, Ltd. | | | 939,973 | | | | 15,632 | |
| | Matson, Inc. | | | 186,833 | | | | 15,559 | |
| | Regal Beloit Corporation | | | 151,302 | | | | 23,048 | |
| * | SP Plus Corporation | | | 482,759 | | | | 15,569 | |
| | Werner Enterprises, Inc. | | | 427,504 | | | | 19,375 | |
| | | | | | | | | 394,816 | |
| | Information Technology—14.0% | | | | | | | | |
| | AudioCodes, Ltd.† | | | 345,383 | | | | 12,240 | |
| | Belden, Inc. | | | 527,567 | | | | 31,765 | |
| | Benchmark Electronics, Inc. | | | 585,832 | | | | 13,656 | |
| * | Cognyte Software, Ltd.† | | | 454,810 | | | | 9,055 | |
| * | Conduent, Inc. | | | 3,345,084 | | | | 22,579 | |
| | CSG Systems International, Inc. | | | 409,704 | | | | 20,506 | |
| | Issuer | | Shares | | | Value | |
| | | | | | | | | | |
| | Common Stocks—(continued) | | | | | | | | |
| | Information Technology—(continued) | | | | | | | | |
| * | Knowles Corporation | | | 1,037,156 | | | $ | 21,614 | |
| | Kulicke & Soffa Industries, Inc. | | | 363,030 | | | | 20,693 | |
| | Methode Electronics, Inc. | | | 528,087 | | | | 22,217 | |
| * | NETGEAR, Inc. | | | 530,923 | | | | 15,306 | |
| * | NetScout Systems, Inc. | | | 696,261 | | | | 18,841 | |
| | Progress Software Corporation | | | 503,545 | | | | 25,887 | |
| * | Tower Semiconductor, Ltd.† | | | 828,272 | | | | 26,397 | |
| * | Verint Systems, Inc. | | | 454,720 | | | | 21,190 | |
| | | | | | | | | 281,946 | |
| | Consumer Discretionary—11.5% | | | | | | | | |
| | Cracker Barrel Old Country Store, Inc. | | | 136,022 | | | | 18,114 | |
| * | Designer Brands, Inc. | | | 1,751,627 | | | | 23,699 | |
| * | El Pollo Loco Holdings, Inc. | | | 800,117 | | | | 11,762 | |
| | Group 1 Automotive, Inc. | | | 81,754 | | | | 14,699 | |
| | Oxford Industries, Inc. | | | 304,644 | | | | 28,247 | |
| | Standard Motor Products, Inc. | | | 516,925 | | | | 24,761 | |
| * | Taylor Morrison Home Corporation | | | 828,719 | | | | 25,301 | |
| * | Tri Pointe Homes, Inc. | | | 1,408,910 | | | | 34,082 | |
| * | Universal Electronics, Inc. | | | 332,563 | | | | 13,695 | |
| * | Urban Outfitters, Inc. | | | 517,036 | | | | 16,509 | |
| | Winnebago Industries, Inc. | | | 307,287 | | | | 20,800 | |
| | | | | | | | | 231,669 | |
| | Real Estate—7.5% | | | | | | | | |
| | Brandywine Realty Trust | | | 1,009,373 | | | | 13,374 | |
| | CatchMark Timber Trust, Inc. | | | 1,264,031 | | | | 10,820 | |
| | Empire State Realty Trust, Inc. | | | 1,468,596 | | | | 14,216 | |
| | Four Corners Property Trust, Inc. | | | 566,626 | | | | 16,432 | |
| | Kite Realty Group Trust | | | 1,225,748 | | | | 24,883 | |
| | Pebblebrook Hotel Trust | | | 576,496 | | | | 12,948 | |
| | Physicians Realty Trust | | | 807,606 | | | | 15,353 | |
| | Retail Opportunity Investments Corporation | | | 421,449 | | | | 7,489 | |
| * | Sunstone Hotel Investors, Inc. | | | 1,323,380 | | | | 16,330 | |
| | UMH Properties, Inc. | | | 859,180 | | | | 20,569 | |
| | | | | | | | | 152,414 | |
| | Health Care—6.1% | | | | | | | | |
| * | ANI Pharmaceuticals, Inc. | | | 179,797 | | | | 6,721 | |
| * | Hanger, Inc. | | | 701,956 | | | | 13,113 | |
| * | Lantheus Holdings, Inc. | | | 1,237,647 | | | | 28,949 | |
| * | ModivCare, Inc. | | | 130,448 | | | | 21,233 | |
| * | NextGen Healthcare, Inc. | | | 549,635 | | | | 9,047 | |
| * | NuVasive, Inc. | | | 146,731 | | | | 7,830 | |
| | Owens & Minor, Inc. | | | 541,123 | | | | 19,415 | |
| | The Ensign Group, Inc. | | | 214,325 | | | | 16,719 | |
| | | | | | | | | 123,027 | |
| | Materials—5.6% | | | | | | | | |
| | Greif, Inc. | | | 317,588 | | | | 20,542 | |
| | Kaiser Aluminum Corporation | | | 178,126 | | | | 17,303 | |
| | Materion Corporation | | | 280,431 | | | | 20,241 | |
| | Minerals Technologies, Inc. | | | 251,031 | | | | 17,808 | |
| | Myers Industries, Inc. | | | 736,005 | | | | 15,147 | |
| * | Orion Engineered Carbons S.A.† | | | 1,200,141 | | | | 22,563 | |
| | | | | | | | | 113,604 | |
See accompanying Notes to Financial Statements.
| October 31, 2021 | William Blair Funds | 5 |
Small Cap Value Fund
Portfolio of Investments, October 31, 2021 (all dollar amounts in thousands)
| | Issuer | | Shares or
Principal
Amount | | | Value | |
| | |
| | Common Stocks—(continued) | | | | | | | | |
| | Consumer Staples—4.7% | | | | | | | | |
| | Cal-Maine Foods, Inc. | | | 526,325 | | | $ | 18,979 | |
| * | Central Garden & Pet Co. | | | 389,571 | | | | 17,998 | |
| | Edgewell Personal Care Co. | | | 493,994 | | | | 17,285 | |
| * | Landec Corporation | | | 195,741 | | | | 1,903 | |
| | Spectrum Brands Holdings, Inc. | | | 235,416 | | | | 22,070 | |
| * | TreeHouse Foods, Inc. | | | 464,691 | | | | 16,794 | |
| | | | | | | | | 95,029 | |
| | Energy—2.9% | | | | | | | | |
| * | Dril-Quip, Inc. | | | 491,161 | | | | 11,572 | |
| * | Earthstone Energy, Inc. | | | 836,000 | | | | 8,485 | |
| * | Expro Group Holdings N.V.† | | | 542,840 | | | | 9,310 | |
| | Matador Resources Co. | | | 703,664 | | | | 29,448 | |
| | | | | | | | | 58,815 | |
| | Communication Services—1.9% | | | | | | | | |
| | John Wiley & Sons, Inc. | | | 423,046 | | | | 22,916 | |
| | Telephone and Data Systems, Inc. | | | 841,243 | | | | 15,765 | |
| | | | | | | | | 38,681 | |
| | Utilities—1.6% | | | | | | | | |
| | NorthWestern Corporation | | | 303,155 | | | | 17,237 | |
| | Spire, Inc. | | | 234,058 | | | | 14,690 | |
| | | | | | | | | 31,927 | |
| | Total Common Stocks—98.7%
(cost $1,586,338) | | | | | | | 1,994,258 | |
| | |
| | Repurchase Agreement | | | | | | | | |
| | Fixed Income Clearing Corporation, 0.000% dated 10/29/21, due 11/1/21, repurchase price $30,377, collateralized by U.S. Treasury Bond, 1.125% - 3.875%, due 5/15/40 - 8/15/40, valued at $30,985 | | | $30,377 | | | | 30,377 | |
| | Total Repurchase Agreement—1.5%
(cost $30,377) | | | | | | | 30,377 | |
| | Total Investments—100.2%
(cost $1,616,715) | | | | | | | 2,024,635 | |
| | Liabilities, plus cash and other assets—(0.2)% | | | | | | | (4,408 | ) |
| | Net assets—100.0% | | | | | | $ | 2,020,227 | |
† = U.S. listed foreign security
* = Non-income producing security
See accompanying Notes to Financial Statements.
| 6 | Annual Report | October 31, 2021 |
Statement of Assets and Liabilities
As of October 31, 2021 (dollar amounts in thousands)
| | | Small Cap
Value
Fund | |
| Assets | | | | |
| Investments in securities, at cost | | $ | 1,616,715 | |
| Investments in securities, at value | | $ | 2,024,635 | |
| Receivable for securities sold | | | 1,417 | |
| Receivable for fund shares sold | | | 893 | |
| Dividend and interest receivable | | | 529 | |
| Total assets | | | 2,027,474 | |
| Liabilities | | | | |
| Payable for securities purchased | | | 4,878 | |
| Payable for fund shares redeemed | | | 452 | |
| Management fee payable | | | 1,323 | |
| Distribution fee payable | | | 2 | |
| Trustee fee payable | | | 4 | |
| Other payables and accrued expenses | | | 588 | |
| Total liabilities | | | 7,247 | |
| Net assets | | $ | 2,020,227 | |
| Capital | | | | |
| Composition of net assets | | | | |
| Paid in capital | | $ | 1,532,554 | |
| Total distributable earnings | | | 487,673 | |
| Net assets | | $ | 2,020,227 | |
| | | | | |
| Class N shares | | | | |
| Net assets | | $ | 9,805 | |
| Shares outstanding | | | 292,806 | |
| Net asset value per share | | $ | 33.49 | |
| Class I shares | | | | |
| Net assets | | $ | 1,143,150 | |
| Shares outstanding | | | 34,108,199 | |
| Net asset value per share | | $ | 33.52 | |
| Class R6 shares | | | | |
| Net assets | | $ | 867,272 | |
| Shares outstanding | | | 25,869,230 | |
| Net asset value per share | | $ | 33.53 | |
See accompanying Notes to Financial Statements.
| October 31, 2021 | William Blair Funds | 7 |
Statement of Operations
For the Year Ended October 31, 2021 (all amounts in thousands)
| | | Small Cap
Value
Fund | |
| Investment income | | | | |
| Dividends | | $ | 26,013 | |
| Less foreign tax withheld | | | (14 | ) |
| Interest | | | 2 | |
| Total income | | | 26,001 | |
| Expenses | | | | |
| Investment advisory fees | | | 13,395 | |
| Distribution fees | | | 7 | |
| Administration fees | | | 524 | |
| Custodian fees | | | 85 | |
| Transfer agent fees | | | 95 | |
| Sub-transfer agent fees | | | | |
| Class N (a) | | | 4 | |
| Class I | | | 1,690 | |
| Professional fees | | | 88 | |
| Registration fees | | | 51 | |
| Shareholder reporting fees | | | 44 | |
| Trustee fees | | | 33 | |
| Other expenses | | | 38 | |
| Total expenses before expense limitation | | | 16,054 | |
| Expenses waived or reimbursed by the Adviser | | | | |
| Class N (a) | | | (1 | ) |
| Class I | | | — | |
| Class R6 (a) | | | — | |
| Total expenses waived or reimbursed by the Adviser | | | (1 | ) |
| Net expenses | | | 16,053 | |
| Net investment income | | | 9,948 | |
| Realized and unrealized gain | | | | |
| Net realized gain on transactions from: | | | | |
| Investments in securities | | | 239,708 | |
| Total net realized gain | | | 239,708 | |
| Change in net unrealized appreciation of: | | | | |
| Investments in securities | | | 449,268 | |
| Change in net unrealized appreciation | | | 449,268 | |
| Net increase in net assets resulting from operations | | $ | 698,924 | |
| (a) | For the period from July 17, 2021 (Commencement of Operations) to October 31, 2021. |
See accompanying Notes to Financial Statements.
| 8 | Annual Report | October 31, 2021 |
Statements of Changes in Net Assets
For the Years Ended October 31, 2021 and 2020 (all amounts in thousands)
| | | Small Cap
Value Fund | |
| | | 2021 | | | 2020 | |
| Operations | | | | | | | | |
| Net investment income | | $ | 9,948 | | | $ | 3,431 | |
| Net realized gain on investments | | | 239,708 | | | | 5,972 | |
| Change in net unrealized appreciation (depreciation) on investments | | | 449,268 | | | | (116,875 | ) |
| Net increase (decrease) in net assets resulting from operations | | | 698,924 | | | | (107,472 | ) |
| Distributions to shareholders from | | | | | | | | |
| Class N (a) | | | — | | | | — | |
| Class I | | | (184,473 | ) | | | (41,314 | ) |
| Class R6 (a) | | | — | | | | — | |
| Total distributions | | | (184,473 | ) | | | (41,314 | ) |
| Capital stock transactions | | | | | | | | |
| Proceeds from sale of shares | | | 1,256,445 | | | | 484,278 | |
| Shares issued in connection with reorganization - See Note 1(b) | | | 45,734 | | | | — | |
| Shares issued in reinvestment of income dividends and capital gain distributions | | | 181,788 | | | | 40,801 | |
| Less cost of shares redeemed | | | (1,159,600 | ) | | | (103,715 | ) |
| Net increase in net assets resulting from capital share transactions | | | 324,367 | | | | 421,364 | |
| Increase in net assets | | | 838,818 | | | | 272,578 | |
| Net assets | | | | | | | | |
| Beginning of period | | | 1,181,409 | | | | 908,831 | |
| End of period | | $ | 2,020,227 | | | $ | 1,181,409 | |
| (a) | For the period from July 17, 2021 (Commencement of Operations) to October 31, 2021. |
See accompanying Notes to Financial Statements.
| October 31, 2021 | William Blair Funds | 9 |
Notes to Financial Statements
(1) Organization
(a) Description of the Trust
William Blair Funds (the “Trust”) is a Delaware statutory trust registered under the Investment Company Act of 1940, as amended (the “1940 Act”), as an open-end management investment company. As of the date of this report, the Trust has twenty-one funds available for sale. The financial statements herein are those of the Small Cap Value Fund (the “Fund”). The investment objective of the Fund is long-term capital appreciation.
(b) Reorganization
In connection with William Blair Investment Management, LLC’s (the “Adviser”) acquisition of Investment Counselors of Maryland, LLC (“ICM”), the Board of Trustees of the Trust and the Board of Trustees of The Advisors’ Inner Circle Fund (“AIC”) approved a reorganization of the ICM Small Company Portfolio (“Predecessor Fund”), a series of AIC advised by ICM, into the Fund (the “Reorganization”), pursuant to which the Fund acquired all assets and assumed all liabilities of the Predecessor Fund in exchange for Class I shares of the Fund. The tax-free reorganization occurred on July 16, 2021. The Fund is the surviving entity for legal and tax purposes and has maintained a tax year end of December 31. The Predecessor Fund is the accounting survivor for financial reporting purposes. As a result, the statement of changes in net assets and Class I financial highlights for the periods prior to the merger date reflect the operations of the Predecessor Fund. The performance and accounting history for Class N and Class R6 shares of the reorganized Fund began effective July 17, 2021. The Adviser serves as the Trust’s investment adviser, and William Blair & Company, L.L.C. (“WBC” or the “Distributor”), an affiliate of the Adviser, serves as the Trust’s principal underwriter and distributor. Effective July 17, 2021, the reorganized Fund is managed by William V. Heaphy, CFA, and Gary J. Merwitz, former employees of ICM, who are now employees of the Adviser.
The following is a summary of shares outstanding, net assets, net asset value per share and unrealized appreciation (depreciation) immediately before and after the tax-free reorganization (dollar amounts are in thousands):
| | | Before
Reorganization | | After
Reorganization |
| | | Small Cap
Value Fund | | ICM Small
Company Portfolio | | Small Cap
Value Fund |
| Class N | | | | | | | | | | | | | | | |
| Shares outstanding | | | | 317,775 | (a) | | | | N/A | | | | | 317,775 | |
| Net assets | | | $ | 10,216 | | | | | N/A | | | | $ | 10,216 | |
| Net asset value | | | $ | 32.15 | (a) | | | | N/A | | | | $ | 32.15 | |
| Class I / Institutional Class | | | | | | | | | | | | | | | |
| Shares outstanding | | | | 760,891 | (b) | | | | 59,609,442 | | | | | 60,370,333 | |
| Net assets | | | $ | 24,461 | | | | $ | 1,916,342 | | | | $ | 1,940,803 | |
| Net asset value | | | $ | 32.15 | (b) | | | $ | 32.15 | | | | $ | 32.15 | |
| Class R6 | | | | | | | | | | | | | | | |
| Shares outstanding | | | | 343,951 | (c) | | | | N/A | | | | | 343,951 | |
| Net assets | | | $ | 11,057 | | | | | N/A | | | | $ | 11,057 | |
| Net asset value | | | $ | 32.15 | (c) | | | | N/A | | | | $ | 32.15 | |
| Total | | | | | | | | | | | | | | | |
| Net assets | | | $ | 45,734 | | | | $ | 1,916,342 | | | | $ | 1,962,076 | |
| Cost of long-term investments | | | $ | 46,200 | | | | $ | 1,499,746 | | | | $ | 1,545,946 | |
| Unrealized appreciation (depreciation) | | | $ | (834 | ) | | | $ | 398,015 | | | | $ | 397,181 | |
| (a) | Reflects a 0.454985-for-1 stock split which occurred immediately prior to the reorganizaton on July 16, 2021. |
| (b) | Reflects a 0.474218-for-1 stock split which occurred immediately prior to the reorganizaton on July 16, 2021. |
| (c) | Reflects a 0.473845-for-1 stock split which occurred immediately prior to the reorganizaton on July 16, 2021. |
Assuming the reorganization had been completed on November 1, 2020, the Fund’s results of operations for the year ended October 31, 2021 would have been as follows (in thousands):
| Net investment income | | $ | 10,239 | |
| Net realized and unrealized gain (loss) on investments | | | 706,989 | |
| Net increase in net assets resulting from operations | | $ | 717,228 | |
| 10 | Annual Report | October 31, 2021 |
Notes to Financial Statements
Because the combined investment portfolios have been managed as a single portfolio since the reorganization was completed, it is not practical to separate the amounts of revenue and earnings to the Fund that have been included in its statement of operations since the reorganization.
For financial reporting purposes, assets received and shares issued by the Fund were recorded at fair value; however, the cost basis of the investments from the Predecessor Fund was carried forward to align ongoing reporting of the Fund’s realized and unrealized gains and losses with amounts distributable to shareholders for tax purposes.
(c) Share Classes
The Fund is comprised of Class N, Class I and Class R6 shares. The number of shares authorized for each share class is unlimited. All share classes of the Fund have equal rights with respect to voting, subject to class specific arrangements.
Class N shares are available to the general public, either directly through the Trust’s distributor or through a select number of financial intermediaries. Class N shares are sold without any sales load and carry an annual 12b-1 distribution fee at a fixed rate of 0.25% of average daily net assets, as discussed in Note 4(b) – Transactions with Affiliates – Underwriting and Distribution Services Agreements, and a sub-transfer agent fee that is not a fixed rate and varies by class, as discussed below.
Class I shares are available to certain retirement and deferred compensation plans, clients of certain financial intermediaries, and asset-based fee advisory clients of William Blair. The minimum initial investment for a Class I account is $500,000, subject to certain exceptions. Class I shares do not carry any sales load or distribution fees and generally have lower ongoing expenses than Class N shares. Class I shares have a sub-transfer agent fee that is not a fixed rate and varies by class, as discussed below.
Class R6 shares are available to certain retirement and deferred compensation plans, clients of certain financial intermediaries, asset-based fee advisory clients of William Blair, and additional types of investors, provided that neither the investor nor the financial intermediary requires the Fund to make any type of servicing or administrative payment. The minimum initial investment for a Class R6 account is $1 million, subject to certain exceptions. Class R6 shares do not carry any sales load, distribution fees or sub-transfer agent fees. Class R6 shares generally have lower ongoing expenses than Class N and Class I shares.
Sub-transfer agent fees: For Class N and Class I shares, the Fund may reimburse WBC for fees paid to intermediaries such as banks, broker-dealers, financial advisers or other financial institutions for sub-administration, sub-transfer agency and other services provided to investors whose shares of record are held in omnibus, other group accounts, retirement plans or accounts traded through registered securities clearing agents. These fees may vary based on, for example, the nature of services provided, but generally range up to 0.15% of the assets of the class serviced or maintained by the intermediary or up to $15 per sub-account maintained by the intermediary, depending on the method by which the intermediary charges for the services.
(2) Significant Accounting Policies
The following is a summary of the Trust’s significant accounting policies in effect during the periods covered by the financial statements, which are in accordance with U.S. generally accepted accounting principles (“US GAAP”), which includes the accounting and reporting guidelines under Accounting Standards Topic 946, Financial Services—Investment Companies.
(a) Investment income and transactions
Investment income, realized and unrealized gains and losses, and certain Fund level expenses and expense reductions, if any, are allocated based on the relative net assets of each class, except for certain class-specific expenses, which are charged directly to the appropriate class. Differences in class expenses may result in the payment of different per share dividends by class.
Dividend income is recorded on the ex-dividend date.
Interest income is recorded on an accrual basis.
For financial reporting purposes, security and shareholder transactions are recorded on trade date in accordance with US GAAP. Realized gains and losses from securities transactions are recognized on a specifically identified cost basis.
| October 31, 2021 | William Blair Funds | 11 |
Notes to Financial Statements
Awards from class action litigation may be recorded as a reduction of cost. If the Fund no longer owns the applicable securities, the proceeds are recorded as realized gains.
(b) Share Valuation and Distributions to Shareholders
For the period from November 1, 2020 to July 16, 2021, the Predecessor Fund distributed its net investment income quarterly, and distributed its net realized gains at least annually. In connection with the Reorganization, the Predecessor Fund also distributed all of its net realized gains on July 13, 2021.
Effective July 17, 2021, the distributions from net investment income, if any, are declared and paid at least annually. Capital gain distributions, if any, will continue to be declared and paid at least annually in December and/or January.
Distributions payable to shareholders are recorded on the ex-dividend date.
(c) Investment in REITs
With respect to the Fund, dividend income is recorded based on the income included in distributions received from the REIT investments using published REIT reclassifications including some management estimates when actual amounts are not available. Distributions received in excess of this estimated amount are recorded as a reduction of the cost of investments or reclassified to capital gains. The actual amounts of income, return of capital, and capital gains are only determined by each REIT after its fiscal year-end, and may differ from the estimated amounts.
(d) Master Limited Partnerships
The Fund may invest in master limited partnerships (“MLP”). MLPs are limited partnerships or limited liability companies, whose partnership units or limited liability interests are listed and traded on a U.S. securities exchange, and are treated as publicly traded partnerships for federal income tax purposes. To qualify to be treated as a partnership for tax purposes, an MLP must receive at least 90% of its income from qualifying sources as set forth in Section 7704(d) of the Code. These qualifying sources include activities such as the exploration, development, mining, production, processing, refining, transportation, storage and marketing of mineral or natural resources. MLPs generally have two classes of owners, the general partner and limited partners. MLPs that are formed as limited liability companies generally have two analogous classes of owners, the managing member and the members. For purposes of this section, references to general partners also apply to managing members and references to limited partners also apply to members. The general partner is typically owned by a major energy company, an investment fund, the direct management of the MLP or is an entity owned by one or more of such parties. The general partner may be structured as a private or publicly traded corporation or other entity. The general partner typically controls the operations and management of the MLP through an equity interest of as much as 2% in the MLP plus, in many cases, ownership of common units and subordinated units. Limited partners own the remainder of the MLP through ownership of common units and have a limited role in the MLP’s operations and management.
(e) Income Taxes
The Fund intends to comply with the provisions of Subchapter M of the Internal Revenue Code of 1986, as amended (the “Code”), in order to qualify as regulated investment companies. The Fund intends to make the requisite distributions of income and capital gains to its shareholders sufficient to relieve it from all, or substantially all, federal income and excise taxes. No provision for federal income and excise taxes has been made.
Management evaluates tax positions taken or expected to be taken in the course of preparing the Fund’s tax returns to determine whether it is “more likely than not” that each tax position would be sustained upon examination by a taxing authority based on the technical merits of the positions. Tax positions not deemed to meet the “more likely than not” threshold would be recorded as a tax benefit or expense in the current year. Management has evaluated all of the uncertain tax positions of the Fund and has determined that no liability is required to be recorded in the financial statements.
The statute of limitations on the Fund’s tax returns for the prior three years remains open and the returns are subject to examination.
Adjustments to the cost of investments for tax purposes may be due to the deferred loss associated with current and prior year wash sales and income recognition from investments in real estate investment trusts and partnerships. The cost of investments for
| 12 | Annual Report | October 31, 2021 |
Notes to Financial Statements
federal income tax purposes and related gross unrealized appreciation (depreciation) and net unrealized appreciation at October 31, 2021, were as follows (in thousands):
Cost of
Investments | | | Gross
Unrealized
Appreciation | | | Gross
Unrealized
Depreciation | | | Net
Unrealized
Appreciation | |
| | $1,615,847 | | | | $454,223 | | | | $45,435 | | | | $408,788 | |
In addition, the Fund may periodically record reclassifications among certain capital accounts to reflect differences between financial reporting and income tax basis distributions. The reclassifications were reported in order to reflect the tax treatment for certain permanent differences that exist between income tax regulations and US GAAP. The reclassifications generally relate to the tax treatment of income recognition from investments in real estate investment trusts and partnerships, utilization of earnings and profits distributed to shareholders on redemption of shares, and adjustments related to the reorganization. These reclassifications have no impact on the net asset values or the net assets of the Fund. Accordingly, at October 31, 2021, the following reclassifications were recorded (in thousands):
| | Paid in CapitaI | | | | Total Distributable
Earnings | |
| | $(7,569) | | | | $7,569 | |
The timing and characterization of certain income and capital gain distributions are determined annually in accordance with federal income tax regulations that may differ from US GAAP. As a result, net investment income or loss and net realized gain or loss for a reporting period may differ from the amount distributed during such period.
Distributions from net realized gains for book purposes may include short-term capital gains, which are included as ordinary income for tax purposes. The tax character of distributions paid to the Predecessor Fund’s Institutional Class shareholders during fiscal years 2021 and 2020 was as follows (in thousands):
| | | | | Ordinary
Income | | | | Long-Term
Capital Gains | | | | Total | |
| | 2021 | | | | $76,786 | | | | $107,687 | | | | $184,473 | |
| | 2020 | | | | 4,004 | | | | 37,310 | | | | 41,314 | |
As of October 31, 2021, the components of distributable earnings on a tax basis were as follows (in thousands):
| | Undistributed
Ordinary Income | | | | Undistributed Long-
Term Capital Gain | | | | Net Unrealized
Appreciation | | | | Total | |
| $14,421 | | | | $64,464 | | | | $408,788 | | | | $487,673 | |
As of October 31, 2021, the Fund has no unused capital loss carryforwards available for federal income tax purposes to be applied against future capital gains. The Fund utilized $13,368 (in thousands) of preexisting capital loss carryforwards in 2021.
(f) Repurchase Agreements
In a repurchase agreement, a Fund buys a security at one price and at the time of sale, the seller agrees to repurchase the security at a mutually agreed upon time and price (usually within seven days). The repurchase agreement thereby determines the yield during the purchaser’s holding period, while the seller’s obligation to repurchase is secured by the value of the underlying collateral. The Adviser monitors, on an ongoing basis, the value of the underlying collateral to ensure that the value always equals or exceeds the repurchase price plus accrued interest. Repurchase agreements may involve certain risks in the event of a default or insolvency of the other party to the agreement, including possible delays or restrictions upon a Fund’s ability to dispose of the underlying collateral. The risk to a Fund is limited to the ability of the seller to pay the agreed upon sum on the delivery date. In the event of default, a repurchase agreement provides that a Fund is entitled to sell the underlying collateral. The loss, if any, to a Fund will be the difference between the proceeds from the sale and the repurchase price. However, if bankruptcy proceedings are commenced with respect to the seller of the security, disposition of the collateral by the Fund may be delayed or limited. The Fund has a master repurchase agreement which allows the Fund to offset amounts owed to a counterparty with amounts owed from the same counterparty, including any collateral, in the event the counterparty defaults. The Fund’s outstanding repurchase agreements, if any, and related collateral, are shown on the Fund’s Portfolio of Investments. Although no definitive creditworthiness criteria are used, the Adviser reviews the creditworthiness of the banks and non-bank dealers with which a fund enters into repurchase agreements to evaluate those risks. A fund may, for tax purposes, deem repurchase agreements collateralized by U.S. Government securities to be investments in U.S. Government securities.
| October 31, 2021 | William Blair Funds | 13 |
Notes to Financial Statements
(g) Use of Estimates
The preparation of financial statements in conformity with US GAAP requires management to make estimates and assumptions that affect the amounts reported in the financial statements. Actual results may differ from those estimates.
(h) Indemnification
In the normal course of business, the Fund has entered into contracts in which the Fund agrees to indemnify the other party or parties against various potential costs or liabilities. The Fund’s maximum exposure under these arrangements is unknown. No claim has been made for indemnification pursuant to any such agreement of the Fund.
(3) Valuation
(a) Investment Valuation
The value of U.S. equity securities, including exchange-traded funds, is determined by valuing securities traded on national securities markets or in the over-the-counter markets at the last sale price or, if applicable, the official closing price or, in the absence of a recent sale on the date of determination, at the mean between the last reported bid and ask prices.
Repurchase agreements are valued at cost, which approximates fair value.
Securities, and other assets, for which a market price is not available or is deemed unreliable (e.g., securities affected by unusual or extraordinary events, such as natural disasters or securities affected by market or economic events, such as bankruptcy filings), or the value of which is affected by a significant valuation event, are valued at a fair value as determined in good faith by, or under the direction of, the Board of Trustees and in accordance with the Valuation Procedures approved by the Board of Trustees. The value of these fair valued securities may be different from the last sale price (or the mean between the last reported bid and ask prices), and there is no guarantee that a fair valued security will be sold at the price at which a Fund is carrying the security.
(b) Fair Value Measurements
Fair value is defined as the price that a Fund would receive upon selling a security in an orderly transaction to an independent buyer in the principal or most advantageous market for the investment. Various inputs are used in determining the value of a Fund’s investments. A three-tier hierarchy of inputs is used to classify fair value measurements for disclosure purposes. The three-tier hierarchy of inputs is summarized in the three broad levels listed below:
| | • | Level 1—Quoted prices (unadjusted) in active markets for an identical security. |
| | | |
| | • | Level 2—Prices determined using other significant observable inputs. Observable inputs are inputs that other market participants would use in pricing a security. These may include quoted prices for similar securities, interest rates, prepayment speeds, credit risk, and others. |
| | | |
| | • | Level 3—Prices determined using significant unobservable inputs. In situations where quoted prices or observable inputs are unavailable (for example, when there is little or no market activity for an investment), unobservable inputs may be used. Unobservable inputs reflect the Fund’s own assumptions about the factors market participants would use in pricing an investment, and are based on the best information available. |
The inputs or methodology used for valuing an investment are not necessarily an indication of the risk associated with investing in those securities.
A description of the valuation methodologies applied to the Fund’s major categories of assets and liabilities measured at fair value on a recurring basis is as follows:
Exchange-Traded Securities
Securities traded on a national securities exchange (or reported on the NASDAQ national market), including exchange-traded funds, are stated at the last reported sales price on the day of valuation. Other securities traded in the over-the-counter market and listed securities for which no sale was reported on that date are stated at the mean between the last reported bid and ask prices. To the extent these securities are actively traded and valuation adjustments are not applied, they are categorized as Level 1 of the fair value hierarchy. Securities traded on inactive markets or valued by reference to similar instruments are generally categorized as Level 2 of the fair value hierarchy.
| 14 | Annual Report | October 31, 2021 |
Notes to Financial Statements
Repurchase Agreements
Repurchase agreements are valued at cost, which approximates fair value. Repurchase agreements are categorized as Level 2 of the fair value hierarchy.
As of October 31, 2021, the value of investments in securities, segregated by their hierarchical input levels used in determining fair value and by security class are shown below (in thousands):
| Investments in securities | | Small Cap
Value | |
| Level 1—Quoted prices | | | | |
| Common Stocks | | $ | 1,994,258 | |
| Level 2—Other significant observable inputs | | | | |
| Repurchase Agreements | | | 30,377 | |
| Level 3—Significant unobservable inputs | | | | |
| None | | | — | |
| Total investments in securities | | $ | 2,024,635 | |
See Portfolio of Investments for Sector Classification.
(4) Transactions with Affiliates
(a) Management and Expense Limitation Agreements
For the period from November 1, 2020 to July 16, 2021, the Predecessor Fund had an investment advisory agreement with ICM for investment advisory services at a fee calculated at an annual rate of 0.70% of the Predecessor Fund’s average daily net assets.
Effective July 17, 2021, the Fund has a management agreement with the Adviser for investment management, clerical, bookkeeping and administrative services. The Fund pays the Adviser an annual management fee, which is accrued daily and paid monthly, at a rate of 0.75% of the Fund’s average daily net assets.
Effective July 17, 2021, the Fund also has an Amended and Restated Expense Limitation Agreement with the Adviser. Under the terms of the agreement, the Adviser will waive its management fee and/or reimburse the Fund for certain operating expenses, subject to certain excluded expenses, in excess of the agreed upon rate through April 30, 2023. Excluded expenses include interest expenses, taxes, brokerage commissions, acquired fund fees and expenses, dividend and interest expenses on short sales, other investment related costs and extraordinary expenses, such as litigation and other expenses not incurred in the ordinary course of the Fund’s business. The amount the Adviser owes the Fund as of the reporting date is recorded as Receivable from Adviser in the Statement of Assets and Liabilities. The Adviser reimburses the Fund, as applicable, on a monthly basis. The Adviser will waive fees and/or reimburse expenses to the extent that the total operating expenses for the stated class of the Fund, subject to certain excluded expenses, exceed the following rates (as a percentage of average daily net assets):
| Class N | | | Class I | | | Class R6 | |
| | 1.15% | | | | 0.89% | | | | 0.85% | |
The fee waivers and/or expense reimbursements received by each class are reported in the Statement of Operations.
(b) Underwriting and Distribution Services Agreements
For the period from November 1, 2020 to July 16, 2021, the Predecessor Fund and the SEI Investments Distribution Co. were parties to a Distribution Agreement. SEI Investments Distribution Co. received no fees under the agreement.
Effective July 17, 2021, pursuant to separate Underwriting and Distribution Agreements, WBC is the principal underwriter and distributor for the continuous offering of shares of the Trust and acts as agent of the Trust in the sale of its shares. The Underwriting Agreement provides that the Distributor will use its best efforts to distribute the Trust’s shares. The Distributor is not compensated under the Underwriting Agreement.
Effective July 17, 2021, the Fund has a Distribution Agreement with WBC for distribution services to the Fund’s Class N shares. The Fund pays WBC an annual fee, payable monthly, of 0.25% of its average daily net assets of Class N shares. Pursuant to the Distribution Agreement, WBC enters into related selling group agreements with various firms at various rates for sales of the Fund’s Class N shares.
| October 31, 2021 | William Blair Funds | 15 |
Notes to Financial Statements
(c) Administration Agreement
For the period from November 1, 2020 to July 16, 2021, the Predecessor Fund and SEI Investments Global Funds Services were parties to an Administration Agreement, under which SEI Investments Global Funds Services provided administrative services to the Predecessor Fund. For these services, SEI Investments Global Funds Services was paid an asset-based fee, which varied depending on the number of share classes and the average daily net assets of the Predecessor Fund. For the period from November 1, 2020 to July 16, 2021, the Predecessor Fund paid $524 (in thousands) for these services.
For the period from November 1, 2020 to July 16, 2021, the Predecessor Fund’s Chief Compliance Officer was an employee of SEI Investments Global Funds Services. The Predecessor Fund paid $6 (in thousands) for these services.
(5) Investment Transactions
For the year ended October 31, 2021, the Fund made purchases of $774,832 (in thousands) and had sales of $648,014 (in thousands) of investment securities other than long-term U.S. Government and short-term securities. There were no purchases or sales of long-term U.S. Government securities.
(6) Fund Share Transactions
The following tables summarize the activity in capital shares of the Fund for the years ended October 31, 2021 and 2020 (dollar amounts in thousands):
| | | 2021 | |
| | | Dollars | | | Shares | |
| | | Sales | | Issued in
Reorga-
nization | | Reinvest | | Redemptions | | | Total | | | Sales | | | Issued in
Reorga-
nization | | | Reinvest | | | Redemptions | | | Total | |
| Class N (a) | | $ | 715 | | | $ | 10,216 | | | $ | — | | | $ | 1,521 | | | $ | 9,410 | | | | 21,895 | | | | 317,775 | | | | — | | | | 46,864 | | | | 292,806 | |
| Class I | | | 398,983 | | | | 24,461 | | | | 181,788 | | | | 1,146,946 | | | | (541,714 | ) | | | 12,568,399 | | | | 760,891 | | | | 5,519,000 | | | | 34,394,651 | | | | (15,546,361 | ) |
| Class R6 (a) | | | 856,747 | | | | 11,057 | | | | — | | | | 11,133 | | | | 856,671 | | | | 25,855,620 | | | | 343,951 | | | | — | | | | 330,341 | | | | 25,869,230 | |
| | | $ | 1,256,445 | | | $ | 45,734 | | | $ | 181,788 | | | $ | 1,159,600 | | | $ | 324,367 | | | | | | | | | | | | | | | | | | | | | |
| | | | | | | | | | | | | | | | | | | | | | | | | | | | | | | | | | | | | | | | | |
| | | | | | | | | | | 2020 | |
| | | | | | | | | | | Dollars | | | | Shares | |
| | | | | | | | | | | Sales | | | Reinvest | | Redemptions | | | Total | | | Sales | | | Reinvest | | | Redemptions | | | Total | |
| Class I | | | | | | | | | | $484,278 | | | | $40,801 | | | | $103,715 | | | | $421,364 | | | | 21,049,717 | | | | 1,428,054 | | | | 4,338,309 | | | | 18,139,462 | |
| (a) | For the period from July 17, 2021 (Commencement of Operations) to October 31, 2021. |
(7) Subsequent Events
The Fund has made an election to change its fiscal year end from October 31 to December 31.
The Fund declared its annual income dividend and capital gains distribution on December 16, 2021 in the amounts of $5,707 and $72,895, respectively (in thousands). Shareholders as of record date December 15, 2021 were paid on December 17, 2021.
The Fund has evaluated subsequent events through the date of issuance of the Fund’s financial statements and have determined there are no other impacts to the Fund’s financial statements.
| 16 | Annual Report | October 31, 2021 |
Financial Highlights — For a share outstanding throughout each period
Small Cap Value Fund
| | | Class N | |
| | | Period Ended
October 31, | |
| | | 2021 (a) | |
| Net asset value, beginning of year | | | $ | 32.15 | |
| Income from investment operations: | | | | | |
| Net investment income | | | | 0.05 | |
| Net realized and unrealized gain on investments | | | | 1.29 | |
| Total from investment operations | | | | 1.34 | |
| Less distributions from: | | | | | |
| Net investment income | | | | — | |
| Net realized gain | | | | — | |
| Total distributions | | | | — | |
| Net asset value, end of year | | | $ | 33.49 | |
| Total return (%)* | | | | 4.17 | |
| Ratios to average daily net assets (%)**: | | | | | |
| Expenses, before waivers and reimbursements | | | | 1.17 | |
| Expenses, net of waivers and reimbursements | | | | 1.15 | |
| Net investment income, before waivers and reimbursements | | | | 0.51 | |
| Net investment income, net of waivers and reimbursements | | | | 0.53 | |
| Class N net assets at the end of the year (in thousands) | | | $ | 9,805 | |
| Portfolio turnover rate (%) | | | | 35 | |
| | | Class I | |
| | | Years Ended October 31, | |
| | | 2021 | | | 2020 | | | 2019 | | | 2018 | | | 2017 | |
| Net asset value, beginning of year | | $ | 23.79 | | | $ | 28.84 | | | $ | 31.53 | | | $ | 35.04 | | | $ | 27.27 | |
| Income from investment operations: | | | | | | | | | | | | | | | | | | | | |
| Net investment income | | | 0.18 | | | | 0.09 | | | | 0.18 | | | | 0.06 | | | | 0.06 | |
| Net realized and unrealized gain (loss) on investments | | | 12.91 | | | | (3.89 | ) | | | 1.59 | | | | (1.00 | ) | | | 8.61 | |
| Total from investment operations | | | 13.09 | | | | (3.80 | ) | | | 1.77 | | | | (0.94 | ) | | | 8.67 | |
| Less distributions from: | | | | | | | | | | | | | | | | | | | | |
| Net investment income | | | 0.11 | | | | 0.07 | | | | 0.15 | | | | 0.09 | | | | 0.03 | |
| Net realized gain | | | 3.25 | | | | 1.18 | | | | 4.31 | | | | 2.48 | | | | 0.87 | |
| Total distributions | | | 3.36 | | | | 1.25 | | | | 4.46 | | | | 2.57 | | | | 0.90 | |
| Net asset value, end of year | | $ | 33.52 | | | $ | 23.79 | | | $ | 28.84 | | | $ | 31.53 | | | $ | 35.04 | |
| Total return (%) | | | 55.32 | | | | (13.91 | ) | | | 8.60 | | | | (3.06 | ) | | | 32.07 | |
| Ratios to average daily net assets (%): | | | | | | | | | | | | | | | | | | | | |
| Expenses | | | 0.86 | | | | 0.89 | | | | 0.93 | | | | 0.93 | | | | 0.95 | |
| Net investment income | | | 0.52 | | | | 0.37 | | | | 0.63 | | | | 0.16 | | | | 0.17 | |
| Class I net assets at the end of the year (in thousands) | | $ | 1,143,150 | | | $ | 1,181,409 | | | $ | 908,831 | | | $ | 738,558 | | | $ | 768,329 | |
| Portfolio turnover rate (%) | | | 35 | | | | 27 | | | | 31 | | | | 31 | | | | 30 | |
| (a) | For the period from July 17, 2021 (Commencement of Operations) to October 31, 2021. |
| * | Rates are not annualized for periods less than a year. |
| ** | Rates are annualized for periods less than a year. |
Note: Net investment income per share is based on the average shares outstanding during the respective period.
Performance cited represents past performance. Past performance does not guarantee future results and current performance may be lower or higher than the data quoted. Results shown are annual returns, which assume reinvestment of dividends and capital gains. Investment returns and principal will fluctuate and you may have a gain or loss when you sell shares. For the most current month-end performance information, please call 1-800-742-7272 or visit our Web site at www.williamblairfunds.com.
| October 31, 2021 | William Blair Funds | 17 |
Financial Highlights — For a share outstanding throughout each period
Small Cap Value Fund
| | | Class R6 | |
| | | Period Ended
October 31, | |
| | | 2021(a) | |
| Net asset value, beginning of year | | | $ | 32.15 | |
| Income from investment operations: | | | | | |
| Net investment income | | | | 0.06 | |
| Net realized and unrealized gain on investments | | | | 1.32 | |
| Total from investment operations | | | | 1.38 | |
| Less distributions from: | | | | | |
| Net investment income | | | | — | |
| Net realized gain | | | | — | |
| Total distributions | | | | — | |
| Net asset value, end of year | | | $ | 33.53 | |
| Total return (%)* | | | | 4.26 | |
| Ratios to average daily net assets (%)**: | | | | | |
| Expenses | | | | 0.78 | |
| Net investment income | | | | 0.64 | |
| Class R6 net assets at the end of the year (in thousands) | | | $ | 867,272 | |
| Portfolio turnover rate (%) | | | | 35 | |
| (a) | For the period from July 17, 2021 (Commencement of Operations) to October 31, 2021. |
| * | Rates are not annualized for periods less than a year. |
| ** | Rates are annualized for periods less than a year. |
Note: Net investment income per share is based on the average shares outstanding during the period.
Performance cited represents past performance. Past performance does not guarantee future results and current performance may be lower or higher than the data quoted. Results shown are annual returns, which assume reinvestment of dividends and capital gains. Investment returns and principal will fluctuate and you may have a gain or loss when you sell shares. For the most current month-end performance information, please call 1-800-742-7272 or visit our Web site at www.williamblairfunds.com.
| 18 | Annual Report | October 31, 2021 |
REPORT OF INDEPENDENT REGISTERED PUBLIC ACCOUNTING FIRM
To the Shareholders and the Board of Trustees of William Blair Funds
Opinion on the Financial Statements
We have audited the accompanying statement of assets and liabilities of the William Blair Small Cap Value Fund (the “Fund”) (one of the funds constituting William Blair Funds (the “Trust”)), including the portfolio of investments, as of October 31, 2021, and the related statements of operations and changes in net assets, and the financial highlights for the year ended October 31, 2021 and the related notes (collectively referred to as the “financial statements”). In our opinion, the financial statements present fairly, in all material respects, the financial position of the Fund (one of the funds constituting William Blair Funds) at October 31, 2021, and the results of its operations, the changes in net assets, and its financial highlights for the year ended October 31, 2021, in conformity with U.S. generally accepted accounting principles.
The statement of changes in net assets for the year ended October 31, 2020 and the financial highlights for each of the four years in the period ended October 31, 2020 for the Fund were audited by other auditors whose report dated December 21, 2020, expressed an unqualified opinion on the statement of changes in net assets and the financial highlights.
Basis for Opinion
These financial statements are the responsibility of the Trust’s management. Our responsibility is to express an opinion on the Fund’s financial statements based on our audit. We are a public accounting firm registered with the Public Company Accounting Oversight Board (United States) (“PCAOB”) and are required to be independent with respect to the Trust in accordance with the U.S. federal securities laws and the applicable rules and regulations of the Securities and Exchange Commission and the PCAOB.
We conducted our audit in accordance with the standards of the PCAOB. Those standards require that we plan and perform the audit to obtain reasonable assurance about whether the financial statements are free of material misstatement, whether due to error or fraud. The Trust is not required to have, nor were we engaged to perform, an audit of the Trust’s internal control over financial reporting. As part of our audit, we are required to obtain an understanding of internal control over financial reporting but not for the purpose of expressing an opinion on the effectiveness of the Trust’s internal control over financial reporting. Accordingly, we express no such opinion.
Our audit included performing procedures to assess the risks of material misstatement of the financial statements, whether due to error or fraud, and performing procedures that respond to those risks. Such procedures included examining, on a test basis, evidence regarding the amounts and disclosures in the financial statements. Our procedures included confirmation of securities owned as of October 31, 2021, by correspondence with the custodian and brokers or by other appropriate auditing procedures where replies from brokers were not received. Our audits also included evaluating the accounting principles used and significant estimates made by management, as well as evaluating the overall presentation of the financial statements. We believe that our audit provides a reasonable basis for our opinion.

We have served as the auditor of one or more William Blair investment companies since 1989.
Chicago, Illinois
December 28, 2021
| October 31, 2021 | William Blair Funds | 19 |
Trustees and Officers (Unaudited).† The trustees and officers of the William Blair Funds, their year of birth, their principal occupations during the last five years, their affiliations, if any, with William Blair, and other significant affiliations are set forth below. The address of each officer and trustee is 150 North Riverside Plaza, Chicago, Illinois 60606.
| Name and Year of Birth | | Position(s)
Held with
Trust | | Term of
Office(1) and
Length of
Time
Served | | Principal
Occupation(s)
During Past 5 Years | | Number of
Portfolios
in Trust
Complex
Overseen
by Trustee* | | Other Directorships
Held by Trustee
During Past 5 Years** |
| Interested Trustees | | | | | | | | | | |
| Stephanie G. | | | | | | | | | | |
Braming, CFA,
1970(2) | | Chairman of the Board and President, previously Senior Vice President | | Chairman of the Board and President since 2018, and Senior Vice President 2014 to 2018 | | Global Head of Investment Management since 2017, portfolio manager (2014 to 2017) and Partner, William Blair | | 21 | | Chairman, William Blair SICAV |
Cissie Citardi,
1975(2) | | Trustee | | Since 2021 | | General Counsel and Partner (since 2021) and Deputy General Counsel (2020), William Blair; formerly, General Counsel, PineBridge Investments, LLC | | 21 | | Director, William Blair SICAV |
| Non-Interested Trustees | | | | | | | | | | |
Vann A. Avedisian,
1964 | | Trustee | | Since 2012 | | Co-founder and Partner, Newbond Holdings (real estate operations) (since 2021); formerly, Principal, Highgate Holdings (hotel investments) (2009-2021); formerly, co-founder and Managing Director, Oxford Capital Partners Inc. (1994 to 2006) | | 21 | | Potbelly Sandwich Works (2001 to 2015 and since 2021) |
Kathleen T. Barr,
1955 | | Trustee | | Since 2013 | | Retired; Chairman of the Governing Council, Independent Directors Council (since 2020); formerly, President, Productive Capital Management, Inc. (registered investment adviser to public entities) and Owner, KT Barr Consulting, LLC (mutual fund and investment management consulting) (2010 to 2013); prior thereto, Chief Administrative Officer, Senior Vice President and Senior Managing Director of Allegiant Asset Management Company (merged with PNC Capital Advisors, LLC in 2009) (2004 to 2010) | | 21 | | Muzinich BDC, Inc. (since 2019); Board of Governors, Investment Company Institute (since 2019); Professionally Managed Portfolios (since 2018) |
| † | William Blair Investment Management, LLC and William Blair & Company, L.L.C. are collectively referred to in this section as “William Blair”, each of which is a wholly owned subsidiary of WBC Holdings, L.P., which is wholly owned by certain William Blair employees (employee owners are referred to as ‘partners’). |
| | |
| * | The number shown does not include four additional series of the Trust that are in existence, but not currently offered to the public. |
| | |
| ** | Includes directorships of public companies and other registered investment companies held during the past five years. |
| 20 | Annual Report | October 31, 2021 |
| Name and Year of Birth | | Position(s)
Held with
Trust | | Term of
Office(1) and
Length of
Time
Served | | Principal
Occupation(s)
During Past 5 Years | | Number of
Portfolios
in Trust
Complex
Overseen
by Trustee* | | Other Directorships
Held by Trustee
During Past 5 Years** |
Daniel N. Leib,
1966(3) | | Trustee | | Since 2016 | | Chief Executive Officer, Donnelley Financial Solutions, Inc. (since 2016); formerly, Executive Vice President and Chief Financial Officer (2011 to 2016) and Group Chief Financial Officer (2009 to 2011), R.R. Donnelley & Sons Company | | 21 | | Donnelley Financial Solutions, Inc. (since 2016) |
Dorri C. McWhorter,
1973 | | Trustee | | Since 2019 | | President and Chief Executive Officer, YMCA of Metropolitan Chicago (since 2021); formerly, Chief Executive Officer, YWCA Metropolitan Chicago (2013 to 2021); Partner, Crowe LLP (2008 to 2013)(4) | | 21 | | Skyway Concession Company, LLC (since 2018); Illinois CPA Society (since 2017); Lifeway Foods, Inc. (since 2020); American Institute of Certified Public Accountants (2013 to 2016); Chicago Finance Exchange (2009 to 2017) |
Thomas J. Skelly,
1951 | | Trustee | | Since 2007 | | Advisory Board Member for various U.S. companies (since 2005); formerly, Managing Partner of various divisions at Accenture (1994 to 2004) | | 21 | | Mutual Trust Financial Group (provider of insurance and investment products) |
Steven R. Zenz,
1954 | | Trustee | | Since 2018 | | Consultant, Steven R. Zenz Consulting LLC (merger and acquisition transactions and SEC reporting and filings) (since 2011); formerly, Partner, KPMG LLP (1987 to 2010)(5) | | 21 | | Engine Media Holdings, Inc. (media group supporting esports, news streaming and gaming) (2020 to 2021); Frankly Inc. (technology products/ services for media industry) (2016 to its 2020 acquisition by Engine Media Holdings); Insignia Systems, Inc. (in-store advertising services for consumer packaged goods manufacturers) (2013 to 2019) |
| (1) | Each Trustee serves until the election and qualification of a successor, or until death, resignation or retirement, or removal as provided in the Trust’s Declaration of Trust. Retirement for Independent Trustees occurs no later than at the conclusion of the calendar year that occurs after the earlier of (a) the Independent Trustee’s 75th birthday or (b) the 17th anniversary of the date that the Independent Trustee became a member of the Board of Trustees. |
| (2) | Mses. Braming and Citardi are interested persons of the Trust because they are partners of William Blair, and with respect to Ms. Braming also due to her position as an officer of the Trust. |
| (3) | The Trust and William Blair use Donnelley Financial Solutions, Inc. (“DFS’’) for financial printing and other services. DFS is a public company. The Trust and William Blair in the aggregate paid DFS approximately $188,000 and $214,000 in 2019 and 2020, respectively, for the services provided. DFS’s revenue was approximately $900 million in 2019 and $895 million in 2020. Mr. Leib, as the Chief Executive Officer of DFS, is not directly involved in any of the services provided to the Trust or William Blair and his compensation is not materially affected by the fees DFS receives from the Trust and William Blair. |
| (4) | As a former partner of the audit firm Crowe LLP (formerly, Crowe Horwath LLP), Ms. McWhorter received distributions of her capital in the firm over time and those distributions were completed in March 2021. The Trust and William Blair made no payments to Crowe LLP over the past three years. |
| (5) | The Trust engages KPMG to provide foreign tax services in Taiwan. KPMG does not provide audit or audit-related services to the Trust. Mr. Zenz is a former partner of KPMG and receives pension/retirement funds from KPMG. |
| October 31, 2021 | William Blair Funds | 21 |
| Name and Year of Birth | | Position(s) Held
with Trust | | Term of Office
and Length of
Time Served(1) | | Principal Occupation(s)
During Past 5 Years |
| Officers | | | | | | |
Alaina Anderson, CFA,
1975 | | Senior Vice President | | Since 2021 | | Partner, William Blair |
| | | | | | | |
Marcelo Assalin, CFA,
1973 | | Senior Vice President | | Since 2020 | | Associate, William Blair (since 2020); formerly, NN Investment Partners (2013- 2020) |
| | | | | | | |
Thomas Clarke,
1968 | | Senior Vice President | | Since 2011 | | Partner, William Blair |
| | | | | | | |
Daniel Crowe, CFA,
1972 | | Senior Vice President | | Since 2016 | | Partner, William Blair |
| | | | | | | |
Robert J. Duwa, CFA,
1967 | | Senior Vice President | | Since 2019 | | Partner, William Blair |
| | | | | | | |
Simon Fennell,
1969 | | Senior Vice President | | Since 2013 | | Partner, William Blair |
| | | | | | | |
Andrew G. Flynn, CFA,
1961 | | Senior Vice President | | Since 2013 | | Partner, William Blair |
| | | | | | | |
David C. Fording, CFA,
1967 | | Senior Vice President | | Since 2006 | | Partner, William Blair |
| | | | | | | |
James S. Golan, CFA,
1961 | | Senior Vice President | | Since 2005 | | Partner, William Blair |
| | | | | | | |
William V. Heaphy, CFA,
1967 | | Senior Vice President | | Since 2021 | | Associate, William Blair (since 2021); formerly, Principal, Investment Counselors of Maryland, LLC (1994-2021) |
| | | | | | | |
James E. Jones, CFA,
1977 | | Senior Vice President | | Since 2019 | | Partner, William Blair |
| | | | | | | |
Kenneth J. McAtamney,
1966 | | Senior Vice President | | Since 2008 | | Partner, William Blair |
| | | | | | | |
Todd M. McClone, CFA,
1968 | | Senior Vice President | | Since 2005 | | Partner, William Blair |
| | | | | | | |
John C. Murphy, CFA,
1969 | | Senior Vice President | | Since 2014 | | Partner, William Blair |
| | | | | | | |
D.J. Neiman, CFA,
1975 | | Senior Vice President | | Since 2021 | | Partner, William Blair |
| | | | | | | |
Casey K. Preyss, CFA,
1976 | | Senior Vice President | | Since 2015 | | Partner, William Blair |
| | | | | | | |
David P. Ricci, CFA,
1958 | | Senior Vice President | | Since 2006 | | Partner, William Blair |
| | | | | | | |
Lisa D. Rusch,
1970 | | Senior Vice President Vice President | | Since 2020 2018-2020 | | Partner, William Blair (since 2020); formerly, Associate, William Blair |
| | | | | | | |
Hugo Scott-Gall,
1971 | | Senior Vice President | | Since 2021 | | Partner, William Blair (since 2018); formerly, Managing Director, Goldman Sachs (1998-2018) |
| | | | | | | |
Ward D. Sexton, CFA,
1974 | | Senior Vice President | | Since 2016 | | Partner, William Blair |
| 22 | Annual Report | October 31, 2021 |
| Name and Year of Birth | | Position(s) Held
with Trust | | Term of Office
and Length of
Time Served(1) | | Principal Occupation(s)
During Past 5 Years |
| | | | | | | |
Brian D. Singer, CFA,
1960 | | Senior Vice President | | Since 2011 | | Partner, William Blair |
| | | | | | | |
Mark C. Thompson, CFA,
1976 | | Senior Vice President | | Since 2020 | | Partner, William Blair |
| | | | | | | |
Vivian Lin Thurston, CFA,
1972 | | Senior Vice President | | Since 2021 | | Partner, William Blair |
| | | | | | | |
Dan Zelazny,
1971 | | Senior Vice President | | Since 2019 | | Associate, William Blair (since 2019); formerly, Managing Director, AQR Capital Management (2011-2019) |
| | | | | | | |
Ruta Ziverte,
1973 | | Senior Vice President | | Since 2020 | | Partner, William Blair (since 2021); formerly, Associate, William Blair (2019-2021), Oppenheimer Funds (2015-2019) |
| | | | | | | |
Kathleen M. Lynch, CFA,
1971 | | Vice President | | Since 2020 | | Associate, William Blair |
| | | | | | | |
Vesta Marks, CFA, CAIA,
1978 | | Vice President | | Since 2021 | | Associate, William Blair (since 2021); formerly, Managing Director, Tortoise Capital Advisors (2018-2021), Palmer Square Capital Management LLC (2015-2018) |
| | | | | | | |
Gary J. Merwitz,
1970 | | Vice President | | Since 2021 | | Associate, William Blair (since 2021); formerly, Principal, Investment Counselors of Maryland, LLC (2004-2021) |
| | | | | | | |
Marco Ruijer, CFA,
1975 | | Vice President | | Since 2020 | | Associate, William Blair (since 2020); formerly, NN Investment Partners (2013-2020) |
| | | | | | | |
John M. Raczek,
1970 | | Treasurer Assistant Treasurer | | Since 2019 2010-2019 | | Associate, William Blair |
| | | | | | | |
Andrew T. Pfau,
1970 | | Secretary | | Since 2009 | | Associate, William Blair |
| | | | | | | |
David M. Cihak,
1982 | | Assistant Treasurer | | Since 2019 | | Associate, William Blair |
| | | | | | | |
Walter R. Randall, Jr.,
1960 | | Chief Compliance Officer and Assistant Secretary | | Since 2009 | | Associate, William Blair |
| | | | | | | |
Robert J. Toner,
1967 | | Assistant Secretary | | Since 2016 | | Associate, William Blair |
| (1) | The Trust’s officers, except the Chief Compliance Officer, are elected annually by the Board of Trustees. The Trust’s Chief Compliance Officer is designated by the Board of Trustees and may only be removed by action of the Board of Trustees, including a majority of independent trustees. Length of Time Served for all officers indicates the year the individual became an officer of the Trust. |
The Statement of Additional Information for the William Blair Funds includes additional information about the trustees and is available without charge by calling 1-800-635-2886 (in Massachusetts 1-800-635-2840) or by writing the Fund.
| October 31, 2021 | William Blair Funds | 23 |
(Unaudited)
Proxy Voting
A description of the policies and procedures that the Fund uses to determine how to vote proxies relating to portfolio securities and information regarding how the Fund voted proxies relating to portfolio securities for the most recent 12-month period ended June 30 are available without charge, upon request, by calling 1-800-635-2886 (in Massachusetts 1-800-635-2840) and on the SEC’s website at http://www.sec.gov.
Quarterly Portfolio Schedules
The Fund files its complete schedule of portfolio holdings with the SEC for the first and third fiscal quarters of each fiscal year (quarters ended January 31 and July 31) on Form N-PORT. The Fund’s Form N-PORT is available on the SEC’s website at http://www.sec.gov.
Change in Independent Registered Public Accounting Firm
As the result of the reorganization of the ICM Small Company Portfolio (the “Predecessor Fund”), a series of The Advisors’ Inner Circle Fund, into the William Blair Small Cap Value Fund (the “Fund”), a series of William Blair Funds (the “Trust”), on July 16, 2021, BBD, LLP (“BBD”) resigned as the independent registered public accounting firm, effective July 16, 2021. The Trust’s Board of Trustees approved the reorganization resulting in the appointment of Ernst & Young LLP (“EY”) as the independent registered public accounting firm of the Fund for the fiscal year ended October 31, 2021.
BBD’s reports on the Predecessor Fund’s financial statements for the fiscal years ended October 31, 2019 and October 31, 2020 contained no adverse opinion or disclaimer of opinion nor were they qualified or modified as to uncertainty, audit scope or accounting principle.
During the fiscal years ended October 31, 2019 and October 31, 2020 and during the subsequent interim period through July 16, 2021: (i) there were no disagreements with BBD on any matter of accounting principles or practices, financial statement disclosure or auditing scope or procedure, which disagreements, if not resolved to the satisfaction of BBD, would have caused BBD to make reference to the subject matter of the disagreements in connection with its reports on the Predecessor Fund’s financial statements for such periods; and (ii) there were no “reportable events” of the kind described in Item 304(a)(1)(v) of Regulation S-K under the Securities Exchange Act of 1934, as amended.
During the Predecessor Fund’s fiscal years ended October 31, 2019 and October 31, 2020, and the subsequent interim period through July 16, 2021, neither the Trust, nor anyone on its behalf, consulted with EY on items which: (i) concerned the application of accounting principles to a specified transaction, either completed or proposed, or the type of audit opinion that might be rendered on the Fund’s financial statements (except consultations in EY’s capacity as the Fund’s existing independent registered public accounting firm); or (ii) concerned the subject of a disagreement (as described in paragraph (a)(1)(iv) of Item 304 of Regulation S-K) or reportable events (as described in paragraph (a)(1)(v) of said Item 304).
Additional Federal Income Tax Information
Under Section 852(b)(3)(C) of the Code, the Fund hereby designates $109,086 (in thousands) as capital gain dividends for the fiscal year ended October 31, 2021.
| 24 | Annual Report | October 31, 2021 |
Useful Information About Your Report (Unaudited)
Please refer to this information when reviewing the Expense Example for the Fund.
Expense Example
As a shareholder of the Fund, you incur two types of costs: (1) transaction costs and (2) ongoing costs, including management fees, distribution (12b-1) fees (for Class N shares, as applicable), and other Fund expenses. The example is intended to help you understand your ongoing costs (in dollars) of investing in the Fund and to compare these costs with the ongoing costs of investing in other mutual funds. To do so, compare the Fund’s 5% hypothetical example with the 5% hypothetical examples that appear in the shareholder reports of other funds. The example is based on an investment of $1,000 invested at the beginning of the period and held for the entire six-month period from May 1, 2021 to October 31, 2021.
Actual Expenses
In each example, the first line for each share class in the table provides information about the actual account values and actual expenses. These expenses reflect the effect of any expense cap applicable to the share class during the period. Without this expense cap, the costs shown in the table would have been higher. You may use the information in this line, together with the amount you invested, to estimate the expenses that you paid over the period. Simply divide your account value by $1,000 (example, an $8,600 account value divided by $1,000 = 8.6), then multiply the result by the number in the first line under the heading entitled “Expenses Paid During the Period” to estimate the expenses you paid on your account during the period.
Hypothetical Example for Comparison Purposes
In each example, the second line for each share class in the table provides information about hypothetical account values and hypothetical expenses based on the Fund’s actual expense ratio and an assumed rate of return of 5% per year before expenses. This is not the Fund’s actual return. The hypothetical account values and expenses may not be used to estimate your actual ending account balance or the expenses you paid for the period. You may use this information to compare the ongoing costs of investing in the Fund to the costs of investing in other funds. To do so, compare this 5% hypothetical example with the 5% hypothetical examples that appear in the shareholder reports of other funds.
Please note that the expenses shown in both examples are meant to highlight your ongoing costs only and do not reflect any transactional costs or account type fees, such as IRA administration fees. These fees are discussed in the prospectus. Therefore, the second line of each share class in the table is useful in comparing ongoing costs only and will not help you determine the relative costs of owning different funds. In addition, if these transactional costs or account fees were included, your costs would have been higher.
| October 31, 2021 | William Blair Funds | 25 |
| Fund Expenses (Unaudited) |
| Expense Example | Beginning
Account Value
5/1/2021 | | Ending
Account Value
10/31/2021 | | Expenses Paid
During
the Period (a) | | Annualized
Expense Ratio |
| Small Cap Value Fund | | | | | | | |
| Class N-actual return (b) | $1,000.00 | | $ | 1,041.70 | | | $3.44 | | 1.15 |
| Class N-hypothetical 5% return (6 month return) | $1,000.00 | | $ | 1,044.20 | | | $5.93 | | 1.15 |
| Class I-actual return | $1,000.00 | | $ | 997.10 | | | $4.33 | | 0.86 |
| Class I-hypothetical 5% return | $1,000.00 | | $ | 1,045.66 | | | $4.43 | | 0.86 |
| Class R6-actual return (b) | $1,000.00 | | $ | 1,042.70 | | | $2.34 | | 0.78 |
| Class R6-hypothetical 5% return (6 month return) | $1,000.00 | | $ | 1,046.07 | | | $4.02 | | 0.78 |
| (a) | Expenses are equal to the annualized expense ratio, multiplied by the average account value over the period, multiplied by the number of days in the period, 184 and divided by 365 (to reflect the one-half year period). |
| (b) | For the period July 17, 2021 (Commencement of Operations) to October 31, 2021. |
| 26 | Annual Report | October 31, 2021 |
| | BOARD OF TRUSTEES |
| | Vann A. Avedisian
Co-founder and Partner, Newbond Holdings
Kathleen T. Barr
Retired Senior Managing Director, PNC Capital Advisors, LLC
Stephanie G. Braming, CFA, Chairman and President
Partner, William Blair
Cissie Citardi
Partner, William Blair
Daniel N. Leib
Chief Executive Officer, Donnelley Financial Solutions, Inc.
Dorri C. McWhorter
President and Chief Executive Officer, YMCA of Metropolitan Chicago
Thomas J. Skelly
Retired Managing Partner, Accenture
Steven R. Zenz
Retired Partner, KPMG LLP |
| | Officers |
| | Alaina Anderson, CFA, Senior Vice President Marcelo Assalin, CFA, Senior Vice President Thomas Clarke, Senior Vice President Daniel Crowe, CFA, Senior Vice President Robert J. Duwa, CFA, Senior Vice President Simon Fennell, Senior Vice President Andrew G. Flynn, CFA, Senior Vice President David C. Fording, CFA, Senior Vice President James S. Golan, CFA, Senior Vice President William V. Heaphy, CFA, Senior Vice President James E. Jones, CFA, Senior Vice President Kenneth J. McAtamney, Senior Vice President Todd M. McClone, CFA, Senior Vice President John C. Murphy, CFA, Senior Vice President D.J. Neiman, CFA, Senior Vice President Casey K. Preyss, CFA, Senior Vice President David P. Ricci, CFA, Senior Vice President Lisa D. Rusch, Senior Vice President Hugo Scott-Gall, Senior Vice President Ward D. Sexton, CFA, Senior Vice President Brian D. Singer, CFA, Senior Vice President Mark C. Thompson, CFA, Senior Vice President Vivian Lin Thurston, CFA, Senior Vice President Dan Zelazny, Senior Vice President Ruta Ziverte, Senior Vice President Kathleen M. Lynch, CFA, Vice President Vesta Marks, CFA, CAIA, Vice President Gary J. Merwitz, Vice President Marco Ruijer, CFA, Vice President John M. Raczek, Treasurer Andrew T. Pfau, Secretary David M. Cihak, Assistant Treasurer Walter R. Randall, Jr., Chief Compliance Officer and Assistant Secretary Robert J. Toner, Assistant Secretary Investment Adviser William Blair Investment Management, LLC Distributor William Blair & Company, L.L.C. Independent Registered Public Accounting Firm Ernst & Young LLP Transfer Agent DST Asset Manager Solutions, Inc. For customer assistance, call 1-800-635-2886 P.O. Box 219137 Kansas City, Missouri 64121-9137 |
| October 31, 2021 | William Blair Funds | 27 |
| U.S. EQUITY | |
| Small Cap Value Fund | |
| | | | | ©William Blair & Company, L.L.C., distributor | |
 | | +1 800 742 7272
williamblairfunds.com | | 150 North Riverside Plaza
Chicago, Illinois 60606 | 00103188 |
| | | | | | |
(a) As of the end of the period covered by this report, the Registrant has adopted a code of ethics (the “Code”) that applies to its principal executive officer and principal financial officer (the “Covered Officers”).
(b) No disclosures are required pursuant to this Item 2(b).
(c) During the period covered by the report, the Registrant did not make any amendment to a provision of the Code.
(d) During the period covered by the report, the Registrant did not grant any waivers, including implicit waivers, from the provisions of the Code.
(e) Not applicable.
(f) A copy of the Code is filed as Exhibit 13(a)(1) to this Form N-CSR.
| Item 3. | Audit Committee Financial Expert |
The Registrant’s Board of Trustees has determined that the Registrant has at least one “audit committee financial expert” (as defined in Item 3 of Form N-CSR) serving on its Audit Committee. Mr. Daniel N. Leib, the Registrant’s audit committee financial expert, is “independent” for purposes of Item 3 to Form N-CSR.
An “audit committee financial expert” is not an “expert” for any purpose, including for purposes of Section 11 of the Securities Act of 1933, as a result of being designated as an “audit committee financial expert.” Further, the designation of a person as an “audit committee financial expert” does not mean that the person has any greater duties, obligations, or liability than those imposed on the person without the “audit committee financial expert” designation. Similarly, the designation of a person as an “audit committee financial expert” does not affect the duties, obligations, or liability of any other member of the audit committee or Board of Trustees.
| Item 4. | Principal Accountant Fees and Services |
Audit Fees
For the fiscal years ended October 31, 2020 and 2021, William Blair Small Cap Value Fund’s (the “Fund”) principal accountant (i.e., BBD, LLP for 2020 and Ernst & Young LLP for 2021) billed the Fund $18,000 and $53,000, respectively, for professional services rendered for the audit of the Fund’s annual financial statements or services that are normally provided in connection with statutory and regulatory filings.
Audit-Related Fees
For the fiscal years ended October 31, 2020 and 2021, the Fund’s principal accountant billed the Fund $0 and $0, respectively, for assurance and related services that are reasonably related to the performance of the audit of the Fund’s financial statements and that are not reported above. For the fiscal years ended October 31, 2020 and 2021, the Fund’s principal accountant provided no audit-related services to the Fund’s investment adviser, or any of its control affiliates, that were for engagements directly related to the Fund’s operations and financial reporting.
Tax Fees
For the fiscal years ended October 31, 2020 and 2021, the Fund’s principal accountant billed the Fund $0 and $0, respectively, for professional services rendered for tax compliance, tax advice and tax planning. Such services consisted of preparation of tax returns, year-end distribution review, qualifying dividend income analysis and review of year-end tax reporting. For the fiscal years ended October 31, 2020 and 2021, the Fund’s principal accountant did not bill the Fund’s investment adviser or any of its control affiliates for any services that were for engagements directly related to the Fund’s operations and financial reporting.
All Other Fees
For the fiscal years ended October 31, 2020 and 2021, the Fund’s principal accountant did not bill the Fund for products and services other than the services reported above. For the fiscal year ended October 31, 2020 and 2021, the Fund’s principal accountant provided no other services to the Fund’s investment adviser or any of its control affiliates that were for engagements directly related to the Fund’s operations and financial reporting.
Audit Committee Pre-Approval Policies and Procedures
Pursuant to the William Blair Funds’ Audit Committee Charter (the “Charter”), the Audit Committee is responsible for pre-approving any engagement of the principal accountant to provide non-prohibited services to William Blair Funds, including the fees and other compensation to be paid to the principal accountant, to the extent required by Rule 2-01(c)(7) of Regulation S-X. Pursuant to the Charter, the Audit Committee is also responsible for pre-approving any engagement of the principal accountant, including the fees and other compensation to be paid to the principal accountant, to provide non-audit services to the William Blair Funds’ investment adviser (or any entity controlling, controlled by, or under common control with the adviser that provides ongoing services to William Blair Funds), if the engagement relates directly to the operations and financial reporting of the William Blair Funds, to the extent required by Rule 2-01(c)(7) of Regulation S-X. The Chair of the Audit Committee may grant the pre-approval referenced above for non-prohibited and non-audit services. All such delegated pre-approvals will be presented to the Audit Committee no later than the next Audit Committee meeting. None of the Audit-Related and Tax Services billed by the principal accountant for the fiscal year ended October 31, 2021 discussed above were approved by the Audit Committee pursuant to a waiver of these Pre-Approval Policies and Procedures.
Non-Audit Fees
For the fiscal years ended October 31, 2020 and 2021, the Fund’s principal accountant billed the Fund $0 and $0, respectively, in non-audit fees (tax services). For the same periods, the Fund’s principal accountant billed the Fund’s investment adviser and its control affiliates $0 and $0, respectively, in non-audit fees.
| Item 5. | Audit Committee of Listed Registrants |
Not applicable to this Registrant, insofar as the Registrant is not a listed company.
| Item 6. | Schedule of Investments |
See Schedule of Investments in Item 1.
| Item 7. | Disclosure of Proxy Voting Policies and Procedures for Closed-End Management Investment Companies |
Not applicable to this Registrant, insofar as the Registrant is not a closed-end management investment company.
| Item 8. | Portfolio Managers of Closed-End Management Investment Companies |
Not applicable to this Registrant, insofar as the Registrant is not a closed-end management investment company.
| Item 9. | Purchase of Equity Securities by Closed-End Management Investment Companies and Affiliated Purchasers |
Not applicable to this Registrant, insofar as the Registrant is not a closed-end management investment company.
| Item 10. | Submission of Matters to a Vote of Security Holders |
There have been no material changes to the procedures by which shareholders may recommend nominees to the Registrant’s Board of Trustees since the Registrant last provided disclosure in response to this item.
Controls and Procedures
(a) The Registrant’s principal executive and principal financial officers, or persons performing similar functions, have concluded that the Registrant’s Disclosure Controls and Procedures (as defined in Rule 30a-3(c) under the Investment Company Act of 1940, as amended (the “1940 Act”) (17 CFR 270.30a-3(c)) are effective, as of a date within 90 days of the filing date of this report that includes the disclosure required by this paragraph, based on their evaluation of these controls and procedures required by Rule 30a-3 (b) under the 1940 Act (17 CFR 270.30a-3(b) and Rules 13a-15(b) or 15d-15(b) under the Securities Exchange Act of 1934, as amended to date (17 CFR 240.13a-15(b) or 240.15d-15(b)).
(b) There were no changes in the Registrant’s internal control over financial reporting (as defined in Rule 30a-3(d) under the 1940 Act (17 CFR 270.30a-3(d)) that occurred during the period covered by this report that has materially affected, or is reasonably likely to materially affect, the Registrant’s internal control over financial reporting.
| Item 12. | Disclosure of Securities Lending Activities for Closed-End Management Investment Companies |
Not applicable to this Registrant, insofar as the Registrant is not a closed-end management investment company.
13. (a) (1) Code of Ethics required by Item 2 is filed as an exhibit hereto.
13. (a) (2) (1)
Certification of Principal Executive Officer Required by Rule 30a-2(a) of the Investment Company Act of 1940 is filed as an exhibit hereto.
13. (a) (2) (2)
Certification of Principal Financial Officer Required by Rule 30a-2(a) of the Investment Company Act of 1940 is filed as an exhibit hereto.
13. (a) (3)
Not applicable to this Registrant.
13. (a) (4) (1)
Change in Registrant’s Independent Public Accountant (Disclosure Pursuant to Item 4.01 of Form 8-K under the Exchange Act) is filed as an exhibit hereto.
13. (a) (4) (2)
Letter from former accountant pursuant to Item 304(a) under Regulation S-K is filed as an exhibit hereto.
13. (b)
Certifications of the Principal Executive Officer and Principal Financial Officer of the issuer as required by Rule 30a-2(b) of the Investment Company Act of 1940 are filed as exhibits hereto.
SIGNATURES
Pursuant to the requirements of the Securities Exchange Act of 1934 and the Investment Company Act of 1940, the Registrant has duly caused this report to be signed on its behalf by the undersigned, thereunto duly authorized.
| | | William Blair Funds |
| | |
| | | /s/ Stephanie G. Braming |
| By: | | Stephanie G. Braming |
| | | President (Principal Executive Officer) |
Date: December 28, 2021
Pursuant to the requirements of the Securities Exchange Act of 1934 and the Investment Company Act of 1940, this report has been signed below by the following persons on behalf of the Registrant and in the capacities and on the dates indicated.
| | | /s/ Stephanie G. Braming |
| By: | | Stephanie G. Braming |
| | | President (Principal Executive Officer) |
Date: December 28, 2021
| | | /s/ John M. Raczek |
| By: | | John M. Raczek |
| | | Treasurer (Principal Financial Officer) |
Date: December 28, 2021