| | |
| UNITED STATES
SECURITIES AND EXCHANGE COMMISSION |
| | |
| CERTIFIED SHAREHOLDER REPORT OF REGISTERED
MANAGEMENT INVESTMENT COMPANIES
|
| | |
| Investment Company Act file number: | (811-05346) |
| | |
| Exact name of registrant as specified in charter: | Putnam Variable Trust |
| | |
| Address of principal executive offices: | One Post Office Square, Boston, Massachusetts 02109 |
| | |
| Name and address of agent for service: | Robert T. Burns, Vice President
One Post Office Square
Boston, Massachusetts 02109 |
| | |
| Copy to: | Bryan Chegwidden, Esq.
Ropes & Gray LLP
1211 Avenue of the Americas
New York, New York 10036 |
| | |
| Registrant’s telephone number, including area code: | (617) 292-1000 |
| | |
| Date of fiscal year end: | December 31, 2015 |
| | |
| Date of reporting period: | January 1, 2015 – June 30, 2015 |
| | |
|
Item 1. Report to Stockholders: | |
| | |
| The following is a copy of the report transmitted to stockholders pursuant to Rule 30e-1 under the Investment Company Act of 1940: | |
Message from the Trustees
Dear Shareholder:
Looking back on the first half of 2015, we can highlight some transitions in the financial markets. The U.S. economy has rallied from a brief dip during the first quarter, and bond yields have risen on a sustained basis in recent months. Firmer data on employment growth, wage gains, and consumer prices underscore this progress.
The Federal Reserve is monitoring these and other indicators as it considers raising interest rates, an action it has not taken since 2006. Higher interest rates can pose a risk to fixed-income investments, while also having a less direct impact on stocks by adding to business financing costs, among other effects.
Through mid-2015, U.S. stock market averages have continued near record-high levels. Although gains have been modest this year, the U.S. market has been more placid than China’s market, in which a dizzying advance gave way to a sharp pullback in June, and European markets that were caught up in Greece’s debt crisis. Global market conditions, we believe, call for a well-crafted and flexible strategy.
With the possibility that markets could move in different directions from here, it might be a prudent time to consult your financial advisor and determine whether any adjustments or additions to your portfolio are warranted.
In the following pages, your portfolio manager provides a perspective for your consideration. Putnam’s disciplined fundamental research promotes a culture of thinking proactively about risks. We share with Putnam’s managers a deep conviction that an active, research-driven approach can play a valuable role in your portfolio.
As always, thank you for investing with Putnam. We would also like to extend our thanks to Charles Curtis, who has retired from the Board of Trustees, for his many years of dedicated service.
Performance summary (as of 6/30/15)
Investment objective
Long-term capital appreciation
Net asset value June 30, 2015
| |
| Class IA: $20.19 | Class IB: $20.12 |
|
Total return at net asset value
| | | |
| | | | MSCI EAFE Growth |
| (as of 6/30/15) | Class IA shares* | Class IB shares† | Index (ND) |
|
| 6 months | 7.34% | 7.19% | 6.91% |
|
| 1 year | –3.86 | –4.14 | –1.33 |
|
| 5 years | 61.49 | 59.50 | 61.71 |
| Annualized | 10.06 | 9.79 | 10.09 |
|
| 10 years | 83.69 | 79.18 | 75.71 |
| Annualized | 6.27 | 6.01 | 5.80 |
|
| Life | 156.19 | 145.88 | 113.29 |
| Annualized | 5.22 | 4.99 | 4.20 |
|
For a portion of the periods, the fund had expense limitations, without which returns would have been lower.
* Class inception date: January 2, 1997.
† Class inception date: April 30, 1998.
The MSCI EAFE Growth Index (ND) is an unmanaged index that measures the performance in 20 countries within Europe, Australasia, and the Far East with a greater-than-average growth orientation.
Data represent past performance. Past performance does not guarantee future results. More recent returns may be less or more than those shown. Investment return and principal value will fluctuate, and you may have a gain or a loss when you sell your shares. Performance information does not reflect any deduction for taxes a shareholder may owe on fund distributions or on the redemption of fund shares. All total return figures are at net asset value and exclude contract charges and expenses, which are added to the variable annuity contracts to determine total return at unit value. Had these charges and expenses been reflected, performance would have been lower. Performance of class IB shares before their inception is derived from the historical performance of class IA shares, adjusted to reflect the higher operating expenses applicable to such shares. For more recent performance, contact your variable annuity provider who can provide you with performance that reflects the charges and expenses at your contract level.
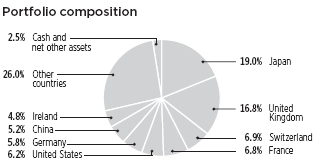
Allocations are shown as a percentage of the fund’s net assets. Cash and net other assets, if any, represent the market value weights of cash, derivatives, short-term securities, and other unclassified assets in the portfolio. Summary information may differ from the information in the portfolio schedule notes included in the financial statements due to the inclusion of derivative securities, any interest accruals, and the exclusion of as-of trades, if any. Holdings and allocations may vary over time.
|
| Putnam VT International Growth Fund 1 |
Report from your fund’s manager
What was the market environment like for international growth stocks during the six-month reporting period ended June 30, 2015, and how did the portfolio fare?
The market generally performed well, particularly in Europe and Japan. Companies in these countries benefited from lower currencies — which made exporters’ goods and services more competitive — and from their respective governments’ commitments to monetary and fiscal reform.
For the period overall, the fund edged ahead of the benchmark, the MSCI EAFE Growth Index [ND], largely as a result of our stock selection decisions across a range of sectors. Bright spots included technology, consumer staples, and communication services stocks, while areas that didn’t live up to our expectations included select financial and basic-materials stocks.
In Europe, Greece’s debt crisis dominated headlines for much of the period. How did this affect the fund?
As the Greek debt crisis unfolded during the second calendar quarter, the market suffered through numerous large swings in sentiment regarding the likely outcome, with entirely new lists of “possible outcomes” appearing (and then fading away) on almost a weekly basis. The fund had no direct exposure to Greek stocks, so it was essentially immune to the large decline in the Greek market. While the rapid shifts in sentiment about Greece also impacted performance of the other main European markets, the portfolio’s European exposure was geared more toward northern European-focused stocks and stocks that were more leveraged to the economic recovery in the United States. Thus, Greece’s indirect impact on the fund was also minimal.
Late in the period, China’s stock market experienced a swift and dramatic decline. What caused this development, and was the fund exposed to this pullback?
In China, the stock market began to decline in early June. This correction worsened through period-end, at which point we witnessed what seemed to us like a dangerously awkward market intervention by Chinese policymakers. The fund had very little exposure to this event, though the portfolio does have positions in Hong Kong-listed stocks — some of which experienced volatility proceeding from the mainland Chinese market.
Leading up to the selloff, the Chinese government was vocal about the merits of stock investing. Many investors took this as a recommendation for accumulating wealth and began to trade on margin, which, as a general rule, carries substantial investment risks. The government encouraged stock investing as part of its efforts to stimulate the overall economy, but the government does not appear to have considered the attendant risks in this plan.
In a sense, this was somewhat similar to the secondary impacts of the QE [quantitative easing] programs by U.S. and European central banks, which pushed assets out of low-interest-rate areas like Treasuries and into other higher-yielding assets, including stock and bond markets. However, the explicit attempt by the Chinese authorities to convince investors to put money in the stock market was, in our view, a significantly riskier move involving a higher level of market distortion. When the Chinese market downturn intensified shortly after period-end, the government felt its credibility was at stake, and thus imposed a variety of top-down controls to halt the market’s nosedive, including placing restrictions on large investors preventing them from selling their shares. We think that this increased intervention further undermines the government’s credibility in terms of allowing markets to find their own level, and thus increases the long-term risk associated with investing.
What factors drove Japanese stocks during the period?
Momentum has been building for better corporate governance in Japan. This momentum, plus the yen’s general weakness relative to the U.S. dollar since 2014 — which has been especially positive for Japanese exporters — aided Japanese stocks’ results during the six-month period ended June 30, 2015. We found that Japanese companies, relative to all major stock markets, had the fastest earnings growth over the past year.
The major change in corporate governance concerns the way the Japanese government has put its weight behind policies that are intended to provide stronger incentives for companies to improve their profitability. For decades, Japanese companies tended to prioritize being good stewards to their own corporate family over producing profits. This entailed keeping bloated balance sheets, maintaining non-core businesses, and placing little emphasis on creating long-term value for shareholders. Now, the government and other relevant Japanese institutions appear to have embraced measures that put pressure on Japanese companies to raise ROE, or return on equity, which we believe should lead to higher profits and more efficient asset allocation.
What are your expectations for non-U.S. developed markets?
With respect to Japan, we are positive about the near-term prospects for exporters, and we think the corporate governance changes are promising for a variety of Japanese stocks. Over the longer term, however, the Japanese economy gives us cause for concern. Japan has a very high debt-to-GDP ratio; continued budget deficits; and a developing problem with its shrinking work-force, which is expected to contract by a half to a full percentage point per year over the next decade. So while we believe that investing in Japan’s markets at the moment offers ample opportunities to seek sources of unanticipated growth, Japan’s economy on a longer time horizon raises difficult questions.
We believe that Europe, by contrast, should remain a comparative bright spot for investors. With the Greek situation likely resolved (at least temporarily), and most major countries in Europe showing signs of at least some economic recovery, the macro environment is increasingly conducive to profit expansion, in our view. In addition,
|
| 2 Putnam VT International Growth Fund |
the benefits of the euro’s depreciation relative to the dollar over the past 12 months do not appear to be reflected in analysts’ expectations for European corporate earnings, in our view. Finally, we think the impact of the downturn in Europe, in terms of reducing the number of competitors in many industries, and forcing management teams to adopt more profit-focused plans — or causing recalcitrant management teams to be replaced with more profit-focused teams — has created significant opportunity for margin expansion at a number of European companies over the next few years.
As always, while we remain cognizant of global macroeconomic conditions, we continue to focus on our best ideas and to let our fundamental stock-selection process drive the fund’s performance.
The views expressed in this report are exclusively those of Putnam Management and are subject to change. They are not meant as investment advice. Please note that the holdings discussed in this report may not have been held by the fund for the entire period. Portfolio composition is subject to review in accordance with the fund’s investment strategy and may vary in the future.
Consider these risks before investing: International investing involves currency, economic, and political risks. Emerging-market securities carry illiquidity and volatility risks. Investments in small and/or midsize companies increase the risk of greater price fluctuations. Growth stocks may be more susceptible to earnings disappointments, and the market may not favor growth-style investing. Stock prices may fall or fail to rise over time for several reasons, including general financial market conditions and factors related to a specific company or industry. Risks associated with derivatives include increased investment exposure (which may be considered leverage) and, in the case of over-the-counter instruments, the potential inability to terminate or sell derivatives positions and the potential failure of the other party to the instrument to meet its obligations. You can lose money by investing in the fund.
Your fund’s manager

Portfolio Manager Jeffrey B. Sacknowitz, CFA, joined Putnam in 1999 and has been in the investment industry since 1993.
Your fund’s manager may also manage other accounts advised by Putnam Management or an affiliate, including retail mutual fund counterparts to the funds in Putnam Variable Trust.
|
| Putnam VT International Growth Fund 3 |
Understanding your fund’s expenses
As an investor in a variable annuity product that invests in a registered investment company, you pay ongoing expenses, such as management fees, distribution fees (12b-1 fees), and other expenses. In the most recent six-month period, your fund’s expenses were limited; had expenses not been limited, they would have been higher. Using the following information, you can estimate how these expenses affect your investment and compare them with the expenses of other funds. You may also pay one-time transaction expenses, which are not shown in this section and would result in higher total expenses. Charges and expenses at the insurance company separate account level are not reflected. For more information, see your fund’s prospectus or talk to your financial representative.
Review your fund’s expenses
The two left-hand columns of the Expense per $1,000 table show the expenses you would have paid on a $1,000 investment in your fund from January 1, 2015, to June 30, 2015. They also show how much a $1,000 investment would be worth at the close of the period, assuming actual returns and expenses. To estimate the ongoing expenses you paid over the period, divide your account value by $1,000, then multiply the result by the number in the first line for the class of shares you own.
Compare your fund’s expenses with those of other funds
The two right-hand columns of the Expense per $1,000 table show your fund’s expenses based on a $1,000 investment, assuming a hypothetical 5% annualized return. You can use this information to compare the ongoing expenses (but not transaction expenses or total costs) of investing in the fund with those of other funds. All shareholder reports of mutual funds and funds serving as variable annuity vehicles will provide this information to help you make this comparison. Please note that you cannot use this information to estimate your actual ending account balance and expenses paid during the period.
Expense ratios
| | |
| | Class IA | Class IB |
|
| Net expenses for the fiscal year ended 12/31/14*† | 1.19% | 1.44% |
|
| Total annual operating expenses for the fiscal year | | |
| ended 12/31/14* | 1.24% | 1.49% |
|
| Annualized expense ratio for the six-month period | | |
| ended 6/30/15 | 1.19% | 1.44% |
|
Fiscal-year expense information in this table is taken from the most recent prospectus, is subject to change, and may differ from that shown for the annualized expense ratio and in the financial highlights of this report.
Expenses are shown as a percentage of average net assets.
*Restated to reflect current fees.
†Reflects Putnam Management’s contractual obligation to limit expenses through 4/30/16.
Expense per $1,000
| | | | |
| | Expenses and value for a | Expenses and value for a |
| | $1,000 investment, assuming | $1,000 investment, assuming a |
| | actual returns for the 6 months | hypothetical 5% annualized return |
| | ended 6/30/15 | | for the 6 months ended 6/30/15 |
|
| | Class IA | Class IB | Class IA | Class IB |
|
| Expenses paid | | | | |
| per $1,000*† | $6.12 | $7.40 | $5.96 | $7.20 |
|
| Ending value | | | | |
| (after expenses) | $1,073.40 | $1,071.90 | $1,018.89 | $1,017.65 |
|
*Expenses for each share class are calculated using the fund’s annualized expense ratio for each class, which represents the ongoing expenses as a percentage of average net assets for the six months ended June 30, 2015. The expense ratio may differ for each share class.
†Expenses based on actual returns are calculated by multiplying the expense ratio by the average account value for the period; then multiplying the result by the number of days in the period; and then dividing that result by the number of days in the year. Expenses based on a hypothetical 5% return are calculated by multiplying the expense ratio by the average account value for the six-month period; then multiplying the result by the number of days in the six-month period; and then dividing that result by the number of days in the year.
|
| 4 Putnam VT International Growth Fund |
The fund’s portfolio 6/30/15 (Unaudited)
| | |
| COMMON STOCKS (96.1%)* | Shares | Value |
|
| Aerospace and defense (0.9%) | | |
| Airbus Group SE (France) | 3,594 | $233,194 |
|
| Bombardier, Inc. Class B (Canada) | 118,100 | 212,750 |
|
| | | 445,944 |
| Airlines (0.7%) | | |
| International Consolidated Airlines Group SA | | |
| (Spain) † | 40,587 | 315,482 |
|
| | | 315,482 |
| Auto components (2.0%) | | |
| Bridgestone Corp. (Japan) | 10,700 | 395,835 |
|
| Toyo Tire & Rubber Co., Ltd. (Japan) | 10,400 | 219,922 |
|
| Toyota Industries Corp. (Japan) | 5,900 | 336,495 |
|
| | | 952,252 |
| Automobiles (3.1%) | | |
| Fiat Chrysler Automobiles NV (United Kingdom) † | 17,502 | 256,389 |
|
| Tata Motors, Ltd. (India) | 48,690 | 331,953 |
|
| Toyota Motor Corp. (Japan) | 7,700 | 516,102 |
|
| Yamaha Motor Co., Ltd. (Japan) | 17,300 | 378,413 |
|
| | | 1,482,857 |
| Banks (6.2%) | | |
| Axis Bank, Ltd. (India) | 28,006 | 245,822 |
|
| Bank of Ireland (Ireland) † | 934,893 | 377,300 |
|
| Credicorp, Ltd. (Peru) | 2,000 | 277,840 |
|
| Dubai Islamic Bank PJSC (United Arab Emirates) | 97,949 | 182,409 |
|
| Grupo Financiero Banorte SAB de CV (Mexico) | 51,700 | 284,264 |
|
| Metro Bank PLC (acquired 1/15/14, | | |
| cost $170,396) (Private) (United Kingdom) † ΔΔ F | 8,005 | 189,768 |
|
| Natixis SA (France) | 49,233 | 354,298 |
|
| Permanent TSB Group Holdings PLC (Ireland) † | 98,915 | 517,412 |
|
| Sumitomo Mitsui Financial Group, Inc. (Japan) | 4,300 | 191,802 |
|
| Virgin Money Holdings UK PLC (United Kingdom) † | 46,411 | 321,227 |
|
| | | 2,942,142 |
| Beverages (1.4%) | | |
| Anheuser-Busch InBev NV (Belgium) | 3,679 | 440,915 |
|
| Britvic PLC (United Kingdom) | 18,723 | 211,078 |
|
| | | 651,993 |
| Biotechnology (2.3%) | | |
| Celgene Corp. † | 2,300 | 266,191 |
|
| China Biologic Products, Inc. (China) † S | 2,200 | 253,352 |
|
| Gilead Sciences, Inc. | 2,500 | 292,700 |
|
| Grifols SA ADR (Spain) | 8,380 | 259,529 |
|
| | | 1,071,772 |
| Building products (2.0%) | | |
| Assa Abloy AB Class B (Sweden) | 20,499 | 386,001 |
|
| Compagnie De Saint-Gobain (France) | 6,862 | 308,069 |
|
| LIXIL Group Corp. (Japan) | 13,800 | 274,004 |
|
| | | 968,074 |
| Capital markets (1.2%) | | |
| KKR & Co. LP | 11,327 | 258,822 |
|
| UBS Group AG (Switzerland) | 14,847 | 314,900 |
|
| | | 573,722 |
| Chemicals (2.4%) | | |
| Akzo Nobel NV (Netherlands) | 2,891 | 210,367 |
|
| Monsanto Co. | 1,600 | 170,544 |
|
| Symrise AG (Germany) | 7,511 | 466,160 |
|
| Syngenta AG (Switzerland) | 662 | 269,063 |
|
| | | 1,116,134 |
| Commercial services and supplies (3.0%) | | |
| Kaba Holding AG Class B (Switzerland) | 466 | 277,372 |
|
| Regus PLC (United Kingdom) | 165,576 | 679,541 |
|
| | |
| COMMON STOCKS (96.1%)* cont. | Shares | Value |
|
| Commercial services and supplies cont. | | |
| Sohgo Security Services Co., Ltd. (Japan) | 6,600 | $260,473 |
|
| Tyco International PLC | 4,900 | 188,552 |
|
| | | 1,405,938 |
| Communications equipment (0.6%) | | |
| Alcatel-Lucent (France) † | 78,603 | 286,377 |
|
| | | 286,377 |
| Construction and engineering (1.0%) | | |
| IRB Infrastructure Developers, Ltd. (India) | 50,633 | 185,620 |
|
| Mota-Engil Africa NV (Angola) † | 6,352 | 47,800 |
|
| Mota-Engil SGPS SA (Portugal) S | 85,496 | 217,509 |
|
| | | 450,929 |
| Containers and packaging (0.6%) | | |
| Smurfit Kappa Group PLC (Ireland) | 9,540 | 262,807 |
|
| | | 262,807 |
| Diversified financial services (1.9%) | | |
| Challenger, Ltd. (Australia) | 111,278 | 576,956 |
|
| Eurazeo SA (France) S | 5,240 | 346,712 |
|
| | | 923,668 |
| Diversified telecommunication services (2.7%) | | |
| Cellnex Telecom SAU 144A (Spain) † | 9,213 | 155,864 |
|
| Com Hem Holding AB (Sweden) | 51,120 | 473,901 |
|
| Iliad SA (France) | 641 | 142,102 |
|
| Telecom Italia SpA RSP (Italy) | 475,878 | 485,702 |
|
| | | 1,257,569 |
| Electrical equipment (0.3%) | | |
| Jiangnan Group, Ltd. (China) | 482,000 | 138,664 |
|
| | | 138,664 |
| Electronic equipment, instruments, and components (2.9%) | |
| Japan Display, Inc. (Japan) † | 67,300 | 253,506 |
|
| Jenoptik AG (Germany) | 11,735 | 141,555 |
|
| Murata Manufacturing Co., Ltd. (Japan) | 4,100 | 715,578 |
|
| Sophos Group PLC 144A (United Kingdom) † | 12,646 | 46,496 |
|
| Wasion Group Holdings, Ltd. (Hong Kong) | 126,000 | 194,408 |
|
| | | 1,351,543 |
| Energy equipment and services (0.7%) | | |
| Ezion Holdings, Ltd. (Singapore) S | 414,560 | 315,495 |
|
| | | 315,495 |
| Food products (5.1%) | | |
| Associated British Foods PLC (United Kingdom) | 13,052 | 588,783 |
|
| Barry Callebaut AG (Switzerland) | 419 | 477,282 |
|
| Kerry Group PLC Class A (Ireland) | 6,735 | 499,241 |
|
| Nestle SA (Switzerland) | 7,760 | 560,244 |
|
| WH Group, Ltd. 144A (Hong Kong) † | 430,827 | 293,460 |
|
| | | 2,419,010 |
| Gas utilities (1.0%) | | |
| Tokyo Gas Co., Ltd. (Japan) | 90,000 | 478,000 |
|
| | | 478,000 |
| Health-care equipment and supplies (0.4%) | | |
| Sartorius AG (Preference) (Germany) | 932 | 173,260 |
|
| | | 173,260 |
| Hotels, restaurants, and leisure (3.1%) | | |
| Accor SA (France) | 3,515 | 177,399 |
|
| Compass Group PLC (United Kingdom) | 45,368 | 750,625 |
|
| Dalata Hotel Group PLC (Ireland) † | 43,475 | 174,485 |
|
| Melco Crown Entertainment, Ltd. ADR | | |
| (Hong Kong) S | 7,200 | 141,336 |
|
| Thomas Cook Group PLC (United Kingdom) † | 111,559 | 239,793 |
|
| | | 1,483,638 |
| Household durables (1.1%) | | |
| Panasonic Corp. (Japan) | 15,286 | 210,021 |
|
| Skyworth Digital Holdings, Ltd. (China) | 358,000 | 318,672 |
|
| | | 528,693 |
|
| Putnam VT International Growth Fund 5 |
| | |
| COMMON STOCKS (96.1%)* cont. | Shares | Value |
|
| Household products (1.3%) | | |
| Henkel AG & Co. KGaA (Preference) (Germany) | 5,343 | $599,238 |
|
| | | 599,238 |
| Independent power and renewable electricity producers (0.4%) | |
| China Resources Power Holdings Co., Ltd. (China) | 72,000 | 201,095 |
|
| | | 201,095 |
| Industrial conglomerates (1.0%) | | |
| Rheinmetall AG (Germany) | 6,051 | 306,840 |
|
| Siemens AG (Germany) | 1,808 | 182,114 |
|
| | | 488,954 |
| Insurance (4.6%) | | |
| Admiral Group PLC (United Kingdom) | 11,427 | 249,031 |
|
| AIA Group, Ltd. (Hong Kong) | 130,200 | 852,430 |
|
| Prudential PLC (United Kingdom) | 34,085 | 820,747 |
|
| St James’s Place PLC (United Kingdom) | 19,604 | 279,073 |
|
| | | 2,201,281 |
| Internet and catalog retail (0.9%) | | |
| Ctrip.com International, Ltd. ADR (China) † | 2,500 | 181,550 |
|
| Delivery Hero Holding GmbH (acquired 6/12/15, | | |
| cost $177,146) (Private) (Germany) † ΔΔ F | 23 | 157,937 |
|
| FabFurnish GmbH (acquired 8/2/13, | | |
| cost $1) (Private) (Brazil) † ΔΔ F | 1 | 1 |
|
| Global Fashion Holding SA (acquired 8/2/13, | | |
| cost $65,824) (Private) (Brazil) † ΔΔ F | 1,554 | 40,381 |
|
| New Bigfoot Other Assets GmbH (acquired 8/2/13, | | |
| cost $1) (Private) (Brazil) † ΔΔ F | 1 | 1 |
|
| New Middle East Other Assets GmbH (acquired | | |
| 8/2/13, cost $1) (Private) (Brazil) † ΔΔ F | 1 | 1 |
|
| Zalando SE (Germany) † | 2,054 | 68,594 |
|
| | | 448,465 |
| Internet software and services (1.6%) | | |
| Alibaba Group Holding, Ltd. ADR (China) † S | 3,331 | 274,041 |
|
| Pandora Media, Inc. † | 8,300 | 128,982 |
|
| Tencent Holdings, Ltd. (China) | 17,000 | 339,274 |
|
| | | 742,297 |
| Machinery (0.6%) | | |
| JTEKT Corp (Japan) | 16,200 | 306,832 |
|
| | | 306,832 |
| Media (3.9%) | | |
| Atresmedia Corporacion de Medios de Comunicacion | | |
| SA (Spain) | 13,446 | 208,365 |
|
| Global Mediacom Tbk PT (Indonesia) | 1,473,300 | 129,290 |
|
| Mediaset SpA (Italy) | 42,077 | 202,274 |
|
| Nippon Television Holdings, Inc. (Japan) | 9,800 | 173,363 |
|
| Numericable-SFR (France) † | 6,304 | 334,147 |
|
| ProSiebenSat.1 Media AG (Germany) | 3,335 | 164,708 |
|
| Quebecor, Inc. Class B (Canada) | 10,600 | 264,958 |
|
| WPP PLC (United Kingdom) | 17,630 | 395,018 |
|
| | | 1,872,123 |
| Metals and mining (0.5%) | | |
| BHP Billiton, Ltd. (Australia) | 10,884 | 227,154 |
|
| | | 227,154 |
| Multi-utilities (1.0%) | | |
| Veolia Environnement SA (France) | 22,804 | 464,987 |
|
| | | 464,987 |
| Oil, gas, and consumable fuels (1.8%) | | |
| BG Group PLC (United Kingdom) | 13,402 | 223,108 |
|
| Genel Energy PLC (United Kingdom) † | 34,015 | 270,972 |
|
| Total SA (France) | 6,938 | 337,006 |
|
| | | 831,086 |
| Personal products (1.5%) | | |
| Coty, Inc. Class A † | 13,400 | 428,398 |
|
| Shiseido Co., Ltd. (Japan) | 12,900 | 292,815 |
|
| | | 721,213 |
| | |
| COMMON STOCKS (96.1%)* cont. | Shares | Value |
|
| Pharmaceuticals (11.8%) | | |
| Allergan PLC † | 1,600 | $485,536 |
|
| Astellas Pharma, Inc. (Japan) | 50,500 | 720,250 |
|
| AstraZeneca PLC (United Kingdom) | 7,578 | 478,540 |
|
| Bayer AG (Germany) | 2,575 | 360,421 |
|
| Bristol-Myers Squibb Co. | 3,100 | 206,274 |
|
| Hua Han Bio-Pharmaceutical Holdings, Ltd. | | |
| (China) S | 1,110,000 | 207,636 |
|
| Novartis AG (Switzerland) | 13,684 | 1,348,714 |
|
| Sanofi (France) | 2,215 | 217,899 |
|
| Shionogi & Co., Ltd. (Japan) | 8,100 | 314,046 |
|
| Shire PLC (United Kingdom) | 8,950 | 716,494 |
|
| STADA Arzneimittel AG (Germany) | 4,251 | 143,385 |
|
| UCB SA (Belgium) | 5,768 | 414,057 |
|
| | | 5,613,252 |
| Real estate investment trusts (REITs) (2.0%) | | |
| Emlak Konut Gayrimenkul Yatirim Ortakligi AS | | |
| (Turkey) | 256,135 | 263,771 |
|
| Hibernia REIT PLC (Ireland) | 330,532 | 464,302 |
|
| Japan Hotel REIT Investment Corp (Japan) | 321 | 213,764 |
|
| | | 941,837 |
| Real estate management and development (2.7%) | | |
| DAMAC Properties Dubai Co. PJSC (United Arab | | |
| Emirates) † | 198,025 | 166,059 |
|
| Foxtons Group PLC (United Kingdom) | 94,675 | 352,408 |
|
| Kennedy-Wilson Holdings, Inc. | 11,310 | 278,113 |
|
| Oberoi Realty, Ltd. (India) | 49,825 | 212,899 |
|
| Sumitomo Realty & Development Co., Ltd. (Japan) | 8,000 | 280,655 |
|
| | | 1,290,134 |
| Road and rail (0.3%) | | |
| Keisei Electric Railway Co., Ltd. (Japan) | 13,000 | 154,659 |
|
| | | 154,659 |
| Semiconductors and semiconductor equipment (1.8%) | | |
| Silergy Corp. (Taiwan) | 31,768 | 326,385 |
|
| Sumco Corp. (Japan) | 24,100 | 301,878 |
|
| Taiwan Semiconductor Manufacturing Co., Ltd. | | |
| (Taiwan) | 52,000 | 236,789 |
|
| | | 865,052 |
| Software (1.3%) | | |
| Nintendo Co., Ltd. (Japan) | 2,300 | 384,696 |
|
| TiVo, Inc. † | 24,600 | 249,444 |
|
| | | 634,140 |
| Specialty retail (0.7%) | | |
| Sports Direct International PLC (United Kingdom) † | 30,402 | 343,221 |
|
| | | 343,221 |
| Technology hardware, storage, and peripherals (1.5%) | | |
| Casetek Holdings, Ltd. (Taiwan) | 31,000 | 191,901 |
|
| Lenovo Group, Ltd. (China) | 142,000 | 196,745 |
|
| Samsung Electronics Co., Ltd. (South Korea) | 277 | 314,883 |
|
| | | 703,529 |
| Textiles, apparel, and luxury goods (1.7%) | | |
| Luxottica Group SpA (Italy) | 6,600 | 438,905 |
|
| Moncler SpA (Italy) | 19,552 | 362,275 |
|
| | | 801,180 |
| Thrifts and mortgage finance (0.8%) | | |
| Dewan Housing Finance Corp., Ltd. (India) | 41,436 | 273,908 |
|
| Home Capital Group, Inc. (Canada) | 3,200 | 110,886 |
|
| | | 384,794 |
| Tobacco (0.9%) | | |
| Japan Tobacco, Inc. (Japan) | 12,100 | 431,115 |
|
| | | 431,115 |
| Trading companies and distributors (2.1%) | | |
| Mitsubishi Corp. (Japan) | 20,200 | 444,322 |
|
| Wolseley PLC (United Kingdom) | 8,429 | 538,106 |
|
| | | 982,428 |
|
| 6 Putnam VT International Growth Fund |
| | | | |
| COMMON STOCKS (96.1%)* cont. | | Shares | Value |
|
| Transportation infrastructure (1.1%) | | | |
| Aena SA (Spain) † | | | 1,795 | $187,588 |
|
| Sumitomo Warehouse Co., Ltd. (The) (Japan) | | 58,000 | 324,157 |
|
| | | | | 511,745 |
| Water utilities (0.2%) | | | | |
| Sound Global, Ltd. (China) † F S | | 127,000 | 102,049 |
|
| | | | | 102,049 |
| Wireless telecommunication services (1.5%) | | |
| Bharti Infratel, Ltd. (India) | | 35,704 | 250,623 |
|
| KDDI Corp. (Japan) | | | 18,900 | 456,188 |
|
| | | | | 706,811 |
| | | | | |
| Total common stocks (cost $40,948,594) | | | $45,566,634 |
| |
| INVESTMENT COMPANIES (0.9%)* | | Shares | Value |
|
| Market Vectors Russia ETF (Russia) S | | 16,000 | $292,480 |
|
| Market Vectors Vietnam ETF (Vietnam) | | 6,000 | 111,840 |
|
| Total investment companies (cost $415,005) | | $404,320 |
| |
| WARRANTS (0.5%)* † | Expiration date | Strike price | Warrants | Value |
|
| Wuliangye Yibin Co., | | | | |
| Ltd. 144A (China) | 4/15/16 | $0.00 | 48,400 | $247,425 |
|
| Total warrants (cost $196,884) | | | $247,425 |
| |
| SHORT-TERM INVESTMENTS (5.6%)* | Principal amount/shares | Value |
|
| Putnam Cash Collateral Pool, LLC 0.24% d | Shares | 1,513,360 | $1,513,360 |
|
| Putnam Short Term Investment Fund 0.10% L | Shares | 988,687 | 988,687 |
|
| U.S. Treasury Bills 0.00%, November 5, 2015 Δ | $115,000 | 114,992 |
|
| U.S. Treasury Bills 0.02%, August 13, 2015 Δ | | 15,000 | 15,000 |
|
| Total short-term investments (cost $2,632,047) | | $2,632,039 |
| | | |
| Total investments (cost $44,192,530) | | | $48,850,418 |
| |
| Key to holding’s abbreviations |
| ADR | American Depository Receipts: represents ownership of foreign securities on deposit with a custodian bank |
| | |
| ETF | Exchange Traded Fund |
| | |
| PJSC | Public Joint Stock Company |
Notes to the fund’s portfolio
Unless noted otherwise, the notes to the fund’s portfolio are for the close of the fund’s reporting period, which ran from January 1, 2015 through June 30, 2015 (the reporting period). Within the following notes to the portfolio, references to “ASC 820” represent Accounting Standards Codification 820 Fair Value Measurements and Disclosures and references to “OTC”, if any, represent over-the-counter.
* Percentages indicated are based on net assets of $47,406,261.
† This security is non-income-producing.
ΔΔ This security is restricted with regard to public resale. The total fair value of this security and any other restricted securities (excluding 144A securities), if any, held at the close of the reporting period was $388,089, or 0.8% of net assets.
Δ This security, in part or in entirety, was pledged and segregated with the custodian for collateral on certain derivative contracts at the close of the reporting period.
d Affiliated company. See Note 1 to the financial statements regarding securities lending. The rate quoted in the security description is the annualized 7-day yield of the fund at the close of the reporting period.
F This security is valued at fair value following procedures approved by the Trustees. Securities may be classified as Level 2 or Level 3 for ASC 820 based on the securities’ valuation inputs (Note 1).
L Affiliated company (Note 1). The rate quoted in the security description is the annualized 7-day yield of the fund at the close of the reporting period.
S Security on loan, in part or in entirety, at the close of the reporting period (Note 1).
At the close of the reporting period, the fund maintained liquid assets totaling $145,277 to cover certain derivative contracts and the settlement of certain securities.
Unless otherwise noted, the rates quoted in Short-term investments security descriptions represent the weighted average yield to maturity. Debt obligations are considered secured unless otherwise indicated.
144A after the name of an issuer represents securities exempt from registration under Rule 144A under the Securities Act of 1933, as amended. These securities may be resold in transactions exempt from registration, normally to qualified institutional buyers.
The dates shown on debt obligations are the original maturity dates.
Distribution of investments by country of risk at the close of the reporting period, excluding collateral received, if any (as a percentage of Portfolio Value):
| | | | |
| Japan | 19.1% | | Australia | 1.7% |
| |
|
| United Kingdom | 16.8 | | Taiwan | 1.6 |
| |
|
| United States | 8.6 | | Canada | 1.2 |
| |
|
| Switzerland | 6.9 | | United Arab Emirates | 0.7 |
| |
|
| France | 6.8 | | Singapore | 0.7 |
| |
|
| Germany | 5.8 | | South Korea | 0.7 |
| |
|
| China | 5.2 | | Russia | 0.6 |
| |
|
| Ireland | 4.8 | | Mexico | 0.6 |
| |
|
| India | 3.2 | | Peru | 0.6 |
| |
|
| Italy | 3.1 | | Turkey | 0.6 |
| |
|
| Hong Kong | 3.1 | | Portugal | 0.5 |
| |
|
| Spain | 2.4 | | Other | 1.1 |
| |
|
| Sweden | 1.8 | | Total | 100.0% |
| | |
| Belgium | 1.8 | | | |
| | |
| | | | | | |
| FORWARD CURRENCY CONTRACTS at 6/30/15 (aggregate face value $44,030,242) (Unaudited) | | | Unrealized |
| | | Contract | Delivery | | Aggregate | appreciation/ |
| Counterparty | Currency | type | date | Value | face value | (depreciation) |
|
| Bank of America N.A. | | | | | | |
|
| | Australian Dollar | Sell | 7/15/15 | $744,777 | $733,407 | $(11,370) |
|
| | British Pound | Buy | 9/16/15 | 287,695 | 276,497 | 11,198 |
|
| | Euro | Buy | 9/16/15 | 2,191,442 | 2,156,308 | 35,134 |
|
| | Japanese Yen | Sell | 8/19/15 | 282,212 | 287,892 | 5,680 |
|
| Barclays Bank PLC | | | | | | |
|
| | Canadian Dollar | Buy | 7/15/15 | 253,039 | 249,678 | 3,361 |
|
| | Euro | Buy | 9/16/15 | 732,006 | 742,895 | (10,889) |
|
| | Hong Kong Dollar | Sell | 8/19/15 | 291,346 | 291,197 | (149) |
|
| | Japanese Yen | Sell | 8/19/15 | 743,124 | 758,884 | 15,760 |
|
|
| Putnam VT International Growth Fund 7 |
| | | | | | |
| FORWARD CURRENCY CONTRACTS at 6/30/15 (aggregate face value $44,030,242) (Unaudited) cont. | | | Unrealized |
| | | Contract | Delivery | | Aggregate | appreciation/ |
| Counterparty | Currency | type | date | Value | face value | (depreciation) |
|
| Barclays Bank PLC cont. | | | | | | |
|
| | Singapore Dollar | Buy | 8/19/15 | $89,329 | $90,603 | $(1,274) |
|
| | Swiss Franc | Sell | 9/16/15 | 1,395,090 | 1,380,993 | (14,097) |
|
| Citibank, N.A. | | | | | | |
|
| | British Pound | Buy | 9/16/15 | 1,586,567 | 1,539,879 | 46,688 |
|
| | Canadian Dollar | Sell | 7/15/15 | 399,611 | 394,289 | (5,322) |
|
| | Danish Krone | Buy | 9/16/15 | 1,316,245 | 1,312,639 | 3,606 |
|
| | Euro | Sell | 9/16/15 | 779,661 | 766,399 | (13,262) |
|
| | Japanese Yen | Buy | 8/19/15 | 471,537 | 475,735 | (4,198) |
|
| Credit Suisse International | | | | | | |
|
| | Australian Dollar | Buy | 7/15/15 | 18,426 | 10,342 | 8,084 |
|
| | British Pound | Sell | 9/16/15 | 2,438,662 | 2,367,155 | (71,507) |
|
| | Canadian Dollar | Sell | 7/15/15 | 1,558,339 | 1,537,362 | (20,977) |
|
| | Euro | Buy | 9/16/15 | 217,626 | 214,134 | 3,492 |
|
| | Japanese Yen | Sell | 8/19/15 | 671,747 | 686,067 | 14,320 |
|
| | Norwegian Krone | Buy | 9/16/15 | 387,980 | 390,772 | (2,792) |
|
| | Swedish Krona | Sell | 9/16/15 | 132,479 | 130,453 | (2,026) |
|
| | Swiss Franc | Sell | 9/16/15 | 276,765 | 273,933 | (2,832) |
|
| Deutsche Bank AG | | | | | | |
|
| | Australian Dollar | Sell | 7/15/15 | 128,524 | 126,414 | (2,110) |
|
| | British Pound | Buy | 9/16/15 | 484,152 | 483,559 | 593 |
|
| | Canadian Dollar | Buy | 7/15/15 | 626,954 | 618,293 | 8,661 |
|
| | Euro | Buy | 9/16/15 | 896,398 | 877,275 | 19,123 |
|
| Goldman Sachs International | | | | | | |
|
| | British Pound | Sell | 9/16/15 | 201,481 | 201,726 | 245 |
|
| | Euro | Sell | 9/16/15 | 1,187,571 | 1,168,067 | (19,504) |
|
| HSBC Bank USA, National Association | | | | | | |
|
| | Australian Dollar | Buy | 7/15/15 | 868,829 | 854,111 | 14,718 |
|
| | British Pound | Buy | 9/16/15 | 873,295 | 847,546 | 25,749 |
|
| | Euro | Buy | 9/16/15 | 727,765 | 715,595 | 12,170 |
|
| | Japanese Yen | Sell | 8/19/15 | 140,081 | 138,266 | (1,815) |
|
| JPMorgan Chase Bank N.A. | | | | | | |
|
| | Australian Dollar | Buy | 7/15/15 | 1,249,159 | 1,228,944 | 20,215 |
|
| | British Pound | Buy | 9/16/15 | 1,284,424 | 1,246,475 | 37,949 |
|
| | Euro | Sell | 9/16/15 | 4,625,845 | 4,553,260 | (72,585) |
|
| | Japanese Yen | Buy | 8/19/15 | 631,587 | 649,528 | (17,941) |
|
| | Norwegian Krone | Buy | 9/16/15 | 2,636 | 2,649 | (13) |
|
| | Singapore Dollar | Buy | 8/19/15 | 212,639 | 215,620 | (2,981) |
|
| | South Korean Won | Sell | 8/19/15 | 344,191 | 354,109 | 9,918 |
|
| | Swedish Krona | Buy | 9/16/15 | 680,447 | 670,070 | 10,377 |
|
| | Swiss Franc | Buy | 9/16/15 | 1,458,274 | 1,436,292 | 21,982 |
|
| State Street Bank and Trust Co. | | | | | | |
|
| | Australian Dollar | Buy | 7/15/15 | 800,443 | 785,855 | 14,588 |
|
| | British Pound | Buy | 9/16/15 | 76,478 | 74,233 | 2,245 |
|
| | Euro | Buy | 9/16/15 | 173,208 | 178,570 | (5,362) |
|
| | Hong Kong Dollar | Buy | 8/19/15 | 151,407 | 151,435 | (28) |
|
| | Israeli Shekel | Buy | 7/15/15 | 206,423 | 205,688 | 735 |
|
| | Japanese Yen | Sell | 8/19/15 | 434,426 | 443,674 | 9,248 |
|
| | Swedish Krona | Sell | 9/16/15 | 353,882 | 348,523 | (5,359) |
|
| | Swiss Franc | Sell | 9/16/15 | 194,165 | 192,198 | (1,967) |
|
|
| 8 Putnam VT International Growth Fund |
| | | | | | |
| FORWARD CURRENCY CONTRACTS at 6/30/15 (aggregate face value $44,030,242) (Unaudited) cont. | | | Unrealized |
| | | Contract | Delivery | | Aggregate | appreciation/ |
| Counterparty | Currency | type | date | Value | face value | (depreciation) |
|
| UBS AG | | | | | | |
|
| | Australian Dollar | Sell | 7/15/15 | $723,266 | $711,549 | $(11,717) |
|
| | British Pound | Sell | 9/16/15 | 1,933,624 | 1,876,514 | (57,110) |
|
| | Canadian Dollar | Buy | 7/15/15 | 839,968 | 828,587 | 11,381 |
|
| | Euro | Buy | 9/16/15 | 523,531 | 522,577 | 954 |
|
| | Japanese Yen | Buy | 8/19/15 | 329,018 | 323,288 | 5,730 |
|
| | Swiss Franc | Buy | 9/16/15 | 102,768 | 91,536 | 11,232 |
|
| WestPac Banking Corp. | | | | | | |
|
| | Australian Dollar | Sell | 7/15/15 | 1,283,545 | 1,262,701 | (20,844) |
|
| | British Pound | Sell | 9/16/15 | 316,905 | 307,656 | (9,249) |
|
| | Euro | Buy | 9/16/15 | 2,307,398 | 2,270,346 | 37,052 |
|
| Total | | | | | | $32,908 |
ASC 820 establishes a three-level hierarchy for disclosure of fair value measurements. The valuation hierarchy is based upon the transparency of inputs to the valuation of the fund’s investments. The three levels are defined as follows:
Level 1: Valuations based on quoted prices for identical securities in active markets.
Level 2: Valuations based on quoted prices in markets that are not active or for which all significant inputs are observable, either directly or indirectly.
Level 3: Valuations based on inputs that are unobservable and significant to the fair value measurement.
The following is a summary of the inputs used to value the fund’s net assets as of the close of the reporting period:
| | | |
| | | Valuation inputs | |
|
| Investments in securities: | Level 1 | Level 2 | Level 3 |
|
| Common stocks*: | | | |
|
| Consumer discretionary | $7,714,108 | $— | $198,321 |
|
| Consumer staples | 4,822,569 | — | — |
|
| Energy | 1,146,581 | — | — |
|
| Financials | 9,067,810 | — | 189,768 |
|
| Health care | 6,858,284 | — | — |
|
| Industrials | 6,169,649 | — | — |
|
| Information technology | 4,582,938 | — | — |
|
| Materials | 1,606,095 | — | — |
|
| Telecommunication services | 1,964,380 | — | — |
|
| Utilities | 1,144,082 | 102,049 | — |
|
| Total common stocks | 45,076,496 | 102,049 | 388,089 |
|
| Investment companies | 404,320 | — | — |
|
| Warrants | — | 247,425 | — |
|
| Short-term investments | 988,687 | 1,643,352 | — |
|
| Totals by level | $46,469,503 | $1,992,826 | $388,089 |
|
| |
| | | Valuation inputs | |
|
| Other financial instruments: | Level 1 | Level 2 | Level 3 |
|
| Forward currency contracts | $— | $32,908 | $— |
|
| Totals by level | $— | $32,908 | $— |
|
* Common stock classifications are presented at the sector level, which may differ from the fund’s portfolio presentation.
During the reporting period, transfers within the fair value hierarchy, if any, (other than certain transfers involving non-U.S. equity securities as described in Note 1) did not represent, in the aggregate, more than 1% of the fund’s net assets measured as of the end of the period.
At the start and close of the reporting period, Level 3 investments in securities represented less than 1% of the fund’s net assets and were not considered a significant portion of the fund’s portfolio.
| |
| The accompanying notes are an integral part of these financial statements. | |
| | Putnam VT International Growth Fund 9 |
Statement of assets and liabilities
6/30/15 (Unaudited)
| |
| Assets | |
|
| Investment in securities, at value, including $1,338,464 of securities on loan (Note 1): | |
|
| Unaffiliated issuers (identified cost $41,690,483) | $46,348,371 |
|
| Affiliated issuers (identified cost $2,502,047) (Notes 1 and 5) | 2,502,047 |
|
| Cash | 39 |
|
| Foreign currency (cost $30,989) (Note 1) | 30,783 |
|
| Dividends, interest and other receivables | 107,984 |
|
| Receivable for shares of the fund sold | 24,708 |
|
| Receivable for investments sold | 240,423 |
|
| Unrealized appreciation on forward currency contracts (Note 1) | 422,188 |
|
| Total assets | 49,676,543 |
| |
| Liabilities | |
|
| Payable for investments purchased | 193,872 |
|
| Payable for shares of the fund repurchased | 17,043 |
|
| Payable for compensation of Manager (Note 2) | 30,791 |
|
| Payable for custodian fees (Note 2) | 12,934 |
|
| Payable for investor servicing fees (Note 2) | 4,216 |
|
| Payable for Trustee compensation and expenses (Note 2) | 70,172 |
|
| Payable for administrative services (Note 2) | 150 |
|
| Payable for distribution fees (Note 2) | 3,111 |
|
| Collateral on securities loaned, at value (Note 1) | 1,513,360 |
|
| Unrealized depreciation on forward currency contracts (Note 1) | 389,280 |
|
| Other accrued expenses | 35,353 |
|
| Total liabilities | 2,270,282 |
| Net assets | $47,406,261 |
| |
| Represented by | |
|
| Paid-in capital (Unlimited shares authorized) (Notes 1 and 4) | $76,121,359 |
|
| Undistributed net investment income (Note 1) | 356,999 |
|
| Accumulated net realized loss on investments and foreign currency transactions (Note 1) | (33,762,521) |
|
| Net unrealized appreciation of investments and assets and liabilities in foreign currencies | 4,690,424 |
|
| Total — Representing net assets applicable to capital shares outstanding | $47,406,261 |
| |
| Computation of net asset value Class IA | |
|
| Net assets | $32,597,208 |
|
| Number of shares outstanding | 1,614,693 |
|
| Net asset value, offering price and redemption price per share (net assets divided by number of shares outstanding) | $20.19 |
|
| Computation of net asset value Class IB | |
|
| Net assets | $14,809,053 |
|
| Number of shares outstanding | 735,988 |
|
| Net asset value, offering price and redemption price per share (net assets divided by number of shares outstanding) | $20.12 |
|
The accompanying notes are an integral part of these financial statements.
|
| 10 Putnam VT International Growth Fund |
Statement of operations
Six months ended 6/30/15 (Unaudited)
| |
| Investment income | |
|
| Dividends (net of foreign tax of $49,377) | $505,105 |
|
| Interest (including interest income of $224 from investments in affiliated issuers) (Note 5) | 266 |
|
| Securities lending (Note 1) | 16,058 |
|
| Total investment income | 521,429 |
| |
| Expenses | |
|
| Compensation of Manager (Note 2) | 218,815 |
|
| Investor servicing fees (Note 2) | 16,843 |
|
| Custodian fees (Note 2) | 16,920 |
|
| Trustee compensation and expenses (Note 2) | 1,374 |
|
| Distribution fees (Note 2) | 18,705 |
|
| Administrative services (Note 2) | 484 |
|
| Auditing and tax fees | 39,297 |
|
| Other | 14,507 |
|
| Fees waived and reimbursed by Manager (Note 2) | (24,198) |
|
| Total expenses | 302,747 |
| Expense reduction (Note 2) | (4,183) |
|
| Net expenses | 298,564 |
| | |
| Net investment income | 222,865 |
| Net realized gain on investments (Notes 1 and 3) | 2,165,778 |
|
| Net realized loss on foreign currency transactions (Note 1) | (177,546) |
|
| Net unrealized appreciation of assets and liabilities in foreign currencies during the period | 219,987 |
|
| Net unrealized appreciation of investments during the period | 925,239 |
|
| Net gain on investments | 3,133,458 |
| | |
| Net increase in net assets resulting from operations | $3,356,323 |
Statement of changes in net assets
| | |
| | Six months ended | Year ended |
| | 6/30/15* | 12/31/14 |
|
| Increase (decrease) in net assets | | |
|
| Operations: | | |
|
| Net investment income | $222,865 | $456,665 |
|
| Net realized gain on investments and foreign currency transactions | 1,988,232 | 5,540,913 |
|
| Net unrealized appreciation (depreciation) of investments and assets and liabilities in foreign currencies | 1,145,226 | (8,994,635) |
|
| Net increase (decrease) in net assets resulting from operations | 3,356,323 | (2,997,057) |
|
| Distributions to shareholders (Note 1): | | |
|
| From ordinary income | | |
|
| Net investment income | | |
|
| Class IA | — | (118,772) |
|
| Class IB | — | (9,647) |
|
| Decrease from capital share transactions (Note 4) | (2,794,760) | (8,866,742) |
|
| Total increase (decrease) in net assets | $561,563 | $(11,992,218) |
|
| Net assets: | | |
|
| Beginning of period | 46,844,698 | 58,836,916 |
|
| End of period (including undistributed net investment income of $356,999 and $134,134, respectively) | $47,406,261 | $46,844,698 |
|
* Unaudited.
| |
| The accompanying notes are an integral part of these financial statements. | |
| | Putnam VT International Growth Fund 11 |
Financial highlights (For a common share outstanding throughout the period)
| | | | | | | | | | | | | |
| | | | | | LESS | | | | | | | | |
| INVESTMENT OPERATIONS: | | | | | DISTRIBUTIONS: | | | | RATIOS AND SUPPLEMENTAL DATA: | |
|
| Period ended | Net asset value, beginning of period | Net investment income (loss)a | Net realized and unrealized gain (loss) on investments | Total from investment operations | From net investment income | Total distributions | Non-recurring reimbursements | Net asset value, end of period | Total return at net asset value (%)b,c | Net assets, end of period (in thousands) | Ratio of expenses to average net assets (%)c,d,e | Ratio of net investment income (loss) to average net assets (%)e | Portfolio turnover (%) |
|
| Class IA | | | | | | | | | | | | | |
|
| 6/30/15† | $18.81 | .10 | 1.28 | 1.38 | — | — | — | $20.19 | 7.34* | $32,597 | .59 * | .50 * | 44* |
|
| 12/31/14 | 20.05 | .19 | (1.37) | (1.18) | (.06) | (.06) | — | 18.81 | (5.90) | 32,259 | 1.22 | .93 | 98 |
|
| 12/31/13 | 16.56 | .13 | 3.59 | 3.72 | (.23) | (.23) | — | 20.05 | 22.70 | 40,518 | 1.24 | .73 | 125 |
|
| 12/31/12 | 13.89 | .16 | 2.77 | 2.93 | (.26) | (.26) | — | 16.56 | 21.24 | 38,600 | 1.24 | 1.08 | 114 |
|
| 12/31/11 | 17.28 | .19 | (3.15) | (2.96) | (.43) | (.43) | —f | 13.89 | (17.65) | 38,885 | 1.24 | 1.14 | 112 |
|
| 12/31/10 | 15.84 | .13 | 1.80 | 1.93 | (.49) | (.49) | — | 17.28 | 12.48 | 54,528 | 1.23 | .84 | 148 |
|
| Class IB | | | | | | | | | | | | | |
|
| 6/30/15† | $18.77 | .08 | 1.27 | 1.35 | — | — | — | $20.12 | 7.19 * | $14,809 | .71* | .38 * | 44* |
|
| 12/31/14 | 20.01 | .13 | (1.36) | (1.23) | (.01) | (.01) | — | 18.77 | (6.15) | 14,585 | 1.47 | .67 | 98 |
|
| 12/31/13 | 16.53 | .09 | 3.58 | 3.67 | (.19) | (.19) | — | 20.01 | 22.37 | 18,318 | 1.49 | .49 | 125 |
|
| 12/31/12 | 13.85 | .13 | 2.77 | 2.90 | (.22) | (.22) | — | 16.53 | 21.01 | 17,549 | 1.49 | .83 | 114 |
|
| 12/31/11 | 17.24 | .15 | (3.15) | (3.00) | (.39) | (.39) | — f | 13.85 | (17.90) | 17,359 | 1.49 | .90 | 112 |
|
| 12/31/10 | 15.80 | .09 | 1.79 | 1.88 | (.44) | (.44) | — | 17.24 | 12.20 | 24,757 | 1.48 | .61 | 148 |
|
* Not annualized.
† Unaudited.
a Per share net investment income (loss) has been determined on the basis of the weighted average number of shares outstanding during the period.
b Total return assumes dividend reinvestment.
c The charges and expenses at the insurance company separate account level are not reflected.
d Includes amounts paid through expense offset and brokerage/service arrangements, if any (Note 2). Also excludes acquired fund fees and expenses, if any.
e Reflects an involuntary contractual expense limitation in effect during the period. As a result of such limitation, the expenses of each class reflect a reduction of the following amounts:
| |
| | Percentage of |
| | average net assets |
|
| 6/30/15 | 0.05% |
|
| 12/31/14 | 0.05 |
|
| 12/31/13 | 0.03 |
|
| 12/31/12 | 0.05 |
|
| 12/31/11 | 0.02 |
|
| 12/31/10 | 0.01 |
|
f Reflects a non-recurring reimbursement related to restitution amounts in connection with a distribution plan approved by the Securities and Exchange Commission (the SEC) which amounted to less than $0.01 per share outstanding on July 21, 2011. Also reflects a non-recurring reimbursement related to short-term trading related lawsuits, which amounted to less than $0.01 per share outstanding on May 11, 2011.
The accompanying notes are an integral part of these financial statements.
|
| 12 Putnam VT International Growth Fund |
Notes to financial statements 6/30/15 (Unaudited)
Within the following Notes to financial statements, references to “State Street” represent State Street Bank and Trust Company, references to “the SEC” represent the Securities and Exchange Commission, references to “Putnam Management” represent Putnam Investment Management, LLC, the fund’s manager, an indirect wholly-owned subsidiary of Putnam Investments, LLC and references to “OTC”, if any, represent over-the-counter. Unless otherwise noted, the “reporting period” represents the period from January 1, 2015 through June 30, 2015.
Putnam VT International Growth Fund (the fund) is a diversified series of Putnam Variable Trust (the Trust), a Massachusetts business trust registered under the Investment Company Act of 1940, as amended, as an open-end management investment company. The goal of the fund is to seek long-term capital appreciation by investing mainly in common stocks of companies of any size in established and emerging markets outside the United States. The fund invests mainly in growth stocks, which are issued by companies whose earnings are expected to grow faster than those of similar firms and whose business growth and other characteristics may lead to an increase in stock price. Putnam Management may consider, among other factors, a company’s valuation, financial strength, growth potential, competitive position in its industry, projected future earnings, cash flows and dividends when deciding whether to buy or sell investments.
The fund offers class IA and class IB shares of beneficial interest. Class IA shares are offered at net asset value and are not subject to a distribution fee. Class IB shares are offered at net asset value and pay an ongoing distribution fee, which is identified in Note 2.
In the normal course of business, the fund enters into contracts that may include agreements to indemnify another party under given circumstances. The fund’s maximum exposure under these arrangements is unknown as this would involve future claims that may be, but have not yet been, made against the fund. However, the fund’s management team expects the risk of material loss to be remote.
Note 1 — Significant accounting policies
The following is a summary of significant accounting policies consistently followed by the fund in the preparation of its financial statements. The preparation of financial statements is in conformity with accounting principles generally accepted in the United States of America and requires management to make estimates and assumptions that affect the reported amounts of assets and liabilities in the financial statements and the reported amounts of increases and decreases in net assets from operations. Actual results could differ from those estimates. Subsequent events after the Statement of assets and liabilities date through the date that the financial statements were issued have been evaluated in the preparation of the financial statements.
Investment income, realized and unrealized gains and losses and expenses of the fund are borne pro-rata based on the relative net assets of each class to the total net assets of the fund, except that each class bears expenses unique to that class (including the distribution fees applicable to such classes). Each class votes as a class only with respect to its own distribution plan or other matters on which a class vote is required by law or determined by the Trustees. If the fund were liquidated, shares of each class would receive their pro-rata share of the net assets of the fund. In addition, the Trustees declare separate dividends on each class of shares.
Security valuation Portfolio securities and other investments are valued using policies and procedures adopted by the Board of Trustees. The Trustees have formed a Pricing Committee to oversee the implementation of these procedures and have delegated responsibility for valuing the fund’s assets in accordance with these procedures to Putnam Management. Putnam Management has established an internal Valuation Committee that is responsible for making fair value determinations, evaluating the effectiveness of the pricing policies of the fund and reporting to the Pricing Committee.
Investments for which market quotations are readily available are valued at the last reported sales price on their principal exchange, or official closing price for certain markets, and are classified as Level 1 securities under Accounting Standards Codification 820 Fair Value Measurements and Disclosures (ASC 820). If no sales are reported, as in the case of some securities that are traded OTC, a security is valued at its last reported bid price and is generally categorized as a Level 2 security.
Investments in open-end investment companies (excluding exchange-traded funds), if any, which can be classified as Level 1 or Level 2 securities, are valued based on their net asset value. The net asset value of such investment companies equals the total value of their assets less their liabilities and divided by the number of their outstanding shares.
Market quotations are not considered to be readily available for certain debt obligations and other investments; such investments are valued on the basis of valuations furnished by an independent pricing service approved by the Trustees or dealers selected by Putnam Management. Such services or dealers determine valuations for normal institutional-size trading units of such securities using methods based on market transactions for comparable securities and various relationships, generally recognized by institutional traders, between securities (which consider such factors as security prices, yields, maturities and ratings). These securities will generally be categorized as Level 2. Short-term securities with remaining maturities of 60 days or less may be valued at amortized cost, which approximates fair value, and are classified as Level 2 securities.
Many securities markets and exchanges outside the U.S. close prior to the close of the New York Stock Exchange and therefore the closing prices for securities in such markets or on such exchanges may not fully reflect events that occur after such close but before the close of the New York Stock Exchange. Accordingly, on certain days, the fund will fair value foreign equity securities taking into account multiple factors including movements in the U.S. securities markets, currency valuations and comparisons to the valuation of American Depository Receipts, exchange-traded funds and futures contracts. These securities, which would generally be classified as Level 1 securities, will be transferred to Level 2 of the fair value hierarchy when they are valued at fair value. The number of days on which fair value prices will be used will depend on market activity and it is possible that fair value prices will be used by the fund to a significant extent. Securities quoted in foreign currencies, if any, are translated into U.S. dollars at the current exchange rate.
To the extent a pricing service or dealer is unable to value a security or provides a valuation that Putnam Management does not believe accurately reflects the security’s fair value, the security will be valued at fair value by Putnam Management in accordance with policies and procedures approved by the Trustees. Certain investments, including certain restricted and illiquid securities and derivatives, are also valued at fair value following procedures approved by the Trustees. These valuations consider such factors as significant market or specific security events such as interest rate or credit quality changes, various relationships with other securities, discount rates, U.S. Treasury, U.S. swap and credit yields, index levels, convexity exposures, recovery rates, sales and other multiples and resale restrictions. These securities are classified as Level 2 or as Level 3 depending on the priority of the significant inputs.
To assess the continuing appropriateness of fair valuations, the Valuation Committee reviews and affirms the reasonableness of such valuations on a regular basis after considering all relevant information that is reasonably available. Such valuations and procedures are reviewed periodically by the Trustees. The fair value of securities is generally determined as the amount that the fund could reasonably expect to realize from an orderly disposition of such securities over a reasonable period of time. By its nature, a fair value price is a good faith estimate of the value of a security in a current sale and does not reflect an actual market price, which may be different by a material amount.
Security transactions and related investment income Security transactions are recorded on the trade date (the date the order to buy or sell is executed). Gains or losses on securities sold are determined on the identified cost basis.
Interest income, net of any applicable withholding taxes, is recorded on the accrual basis. Dividend income, net of any applicable withholding taxes, is recognized on the ex-dividend date except that certain dividends from foreign securities, if any, are recognized as soon as the fund is informed of the ex-dividend date. Non-cash dividends, if any, are recorded at the fair value of the securities received. Dividends representing a return of capital or capital gains, if any, are reflected as a reduction of cost and/or as a realized gain.
All premiums/discounts are amortized/accreted on a yield-to-maturity basis.
Foreign currency translation The accounting records of the fund are maintained in U.S. dollars. The fair value of foreign securities, currency holdings, and other assets and liabilities is recorded in the books and records of the fund after translation to U.S. dollars based on the exchange rates on that day. The cost
|
| Putnam VT International Growth Fund 13 |
of each security is determined using historical exchange rates. Income and withholding taxes are translated at prevailing exchange rates when earned or incurred. The fund does not isolate that portion of realized or unrealized gains or losses resulting from changes in the foreign exchange rate on investments from fluctuations arising from changes in the market prices of the securities. Such gains and losses are included with the net realized and unrealized gain or loss on investments. Net realized gains and losses on foreign currency transactions represent net realized exchange gains or losses on closed forward currency contracts, disposition of foreign currencies, currency gains and losses realized between the trade and settlement dates on securities transactions and the difference between the amount of investment income and foreign withholding taxes recorded on the fund’s books and the U.S. dollar equivalent amounts actually received or paid. Net unrealized appreciation and depreciation of assets and liabilities in foreign currencies arise from changes in the value of open forward currency contracts and assets and liabilities other than investments at the period end, resulting from changes in the exchange rate.
Options contracts The fund uses options contracts to hedge against changes in values of securities it owns, owned or expects to own.
The potential risk to the fund is that the change in value of options contracts may not correspond to the change in value of the hedged instruments. In addition, losses may arise from changes in the value of the underlying instruments if there is an illiquid secondary market for the contracts, if interest or exchange rates move unexpectedly or if the counterparty to the contract is unable to perform. Realized gains and losses on purchased options are included in realized gains and losses on investment securities. If a written call option is exercised, the premium originally received is recorded as an addition to sales proceeds. If a written put option is exercised, the premium originally received is recorded as a reduction to the cost of investments.
Exchange-traded options are valued at the last sale price or, if no sales are reported, the last bid price for purchased options and the last ask price for written options. OTC traded options are valued using prices supplied by dealers.
Options on swaps are similar to options on securities except that the premium paid or received is to buy or grant the right to enter into a previously agreed upon interest rate or credit default contract. Forward premium swap option contracts include premiums that have extended settlement dates. The delayed settlement of the premiums is factored into the daily valuation of the option contracts. In the case of interest rate cap and floor contracts, in return for a premium, ongoing payments between two parties are based on interest rates exceeding a specified rate, in the case of a cap contract, or falling below a specified rate in the case of a floor contract.
Written option contracts outstanding at period end, if any, are listed after the fund’s portfolio.
Forward currency contracts The fund buys and sells forward currency contracts, which are agreements between two parties to buy and sell currencies at a set price on a future date. These contracts are used to hedge foreign exchange risk.
The U.S. dollar value of forward currency contracts is determined using current forward currency exchange rates supplied by a quotation service. The fair value of the contract will fluctuate with changes in currency exchange rates. The contract is marked to market daily and the change in fair value is recorded as an unrealized gain or loss. The fund records a realized gain or loss equal to the difference between the value of the contract at the time it was opened and the value at the time it was closed when the contract matures or by delivery of the currency. The fund could be exposed to risk if the value of the currency changes unfavorably, if the counterparties to the contracts are unable to meet the terms of their contracts or if the fund is unable to enter into a closing position. Risks may exceed amounts recognized on the Statement of assets and liabilities.
Forward currency contracts outstanding at period end, if any, are listed after the fund’s portfolio.
Master agreements The fund is a party to ISDA (International Swaps and Derivatives Association, Inc.) Master Agreements (Master Agreements) with certain counterparties that govern OTC derivative and foreign exchange contracts entered into from time to time. The Master Agreements may contain provisions regarding, among other things, the parties’ general obligations, representations, agreements, collateral requirements, events of default and early termination. With respect to certain counterparties, in accordance with the terms of the Master Agreements, collateral posted to the fund is held in
a segregated account by the fund’s custodian and, with respect to those amounts which can be sold or repledged, is presented in the fund’s portfolio.
Collateral pledged by the fund is segregated by the fund’s custodian and identified in the fund’s portfolio. Collateral can be in the form of cash or debt securities issued by the U.S. Government or related agencies or other securities as agreed to by the fund and the applicable counterparty. Collateral requirements are determined based on the fund’s net position with each counterparty.
Termination events applicable to the fund may occur upon a decline in the fund’s net assets below a specified threshold over a certain period of time. Termination events applicable to counterparties may occur upon a decline in the counterparty’s long-term and short-term credit ratings below a specified level. In each case, upon occurrence, the other party may elect to terminate early and cause settlement of all derivative and foreign exchange contracts outstanding, including the payment of any losses and costs resulting from such early termination, as reasonably determined by the terminating party. Any decision by one or more of the fund’s counterparties to elect early termination could impact the fund’s future derivative activity.
At the close of the reporting period, the fund had a net liability position of $140,315 on open derivative contracts subject to the Master Agreements. Collateral posted by the fund at period end for these agreements totaled $129,989 and may include amounts related to unsettled agreements.
Securities lending The fund may lend securities, through its agent, to qualified borrowers in order to earn additional income. The loans are collateralized by cash in an amount at least equal to the fair value of the securities loaned. The fair value of securities loaned is determined daily and any additional required collateral is allocated to the fund on the next business day. The risk of borrower default will be borne by the fund’s agent; the fund will bear the risk of loss with respect to the investment of the cash collateral. Income from securities lending is included in investment income on the Statement of operations. Cash collateral is invested in Putnam Cash Collateral Pool, LLC, a limited liability company managed by an affiliate of Putnam Management. Investments in Putnam Cash Collateral Pool, LLC are valued at its closing net asset value each business day. There are no management fees charged to Putnam Cash Collateral Pool, LLC. At the close of the reporting period, the fund received cash collateral of $1,513,360 and the value of securities loaned amounted to $1,492,657. Certain of these securities were sold prior to the close of the reporting period and are included in Receivable for investments sold on the Statement of assets and liabilities.
Interfund lending The fund, along with other Putnam funds, may participate in an interfund lending program pursuant to an exemptive order issued by the SEC. This program allows the fund to borrow from or lend to other Putnam funds that permit such transactions. Interfund lending transactions are subject to each fund’s investment policies and borrowing and lending limits. Interest earned or paid on the interfund lending transaction will be based on the average of certain current market rates. During the reporting period, the fund did not utilize the program.
Lines of credit The fund participates, along with other Putnam funds, in a $392.5 million unsecured committed line of credit and a $235.5 million unsecured uncommitted line of credit, both provided by State Street. Borrowings may be made for temporary or emergency purposes, including the funding of shareholder redemption requests and trade settlements. Interest is charged to the fund based on the fund’s borrowing at a rate equal to the Federal Funds rate plus 1.25% for the committed line of credit and the Federal Funds rate plus 1.30% for the uncommitted line of credit. A closing fee equal to 0.04% of the committed line of credit and 0.04% of the uncommitted line of credit has been paid by the participating funds. In addition, a commitment fee of 0.11% per annum on any unutilized portion of the committed line of credit is allocated to the participating funds based on their relative net assets and paid quarterly. During the reporting period, the fund had no borrowings against these arrangements.
Federal taxes It is the policy of the fund to distribute all of its taxable income within the prescribed time period and otherwise comply with the provisions of the Internal Revenue Code of 1986, as amended (the Code), applicable to regulated investment companies.
The fund is subject to the provisions of Accounting Standards Codification 740 Income Taxes (ASC 740). ASC 740 sets forth a minimum threshold for financial statement recognition of the benefit of a tax position taken or expected to be taken in a tax return. The fund did not have a liability to record for any unrecognized tax benefits in the accompanying financial statements. No
|
| 14 Putnam VT International Growth Fund |
provision has been made for federal taxes on income, capital gains or unrealized appreciation on securities held nor for excise tax on income and capital gains. Each of the fund’s federal tax returns for the prior three fiscal years remains subject to examination by the Internal Revenue Service.
The fund may also be subject to taxes imposed by governments of countries in which it invests. Such taxes are generally based on either income or gains earned or repatriated. The fund accrues and applies such taxes to net investment income, net realized gains and net unrealized gains as income and/or capital gains are earned. In some cases, the fund may be entitled to reclaim all or a portion of such taxes, and such reclaim amounts, if any, are reflected as an asset on the fund’s books. In many cases, however, the fund may not receive such amounts for an extended period of time, depending on the country of investment.
At December 31, 2014, the fund had a capital loss carryover of $35,670,124 available to the extent allowed by the Code to offset future net capital gain, if any. The amounts of the carryovers and the expiration dates are:
| | | |
| Loss carryover |
|
| Short-term | Long-term | Total | Expiration |
|
| $35,670,124 | N/A | $35,670,124 | 12/31/16 |
|
Under the Regulated Investment Company Modernization Act of 2010, the fund will be permitted to carry forward capital losses incurred in taxable years beginning after December 22, 2010 for an unlimited period. However, any losses incurred will be required to be utilized prior to the losses incurred in pre-enactment tax years. As a result of this ordering rule, pre-enactment capital loss carryforwards may be more likely to expire unused. Additionally, post-enactment capital losses that are carried forward will retain their character as either short-term or long-term capital losses rather than being considered all short-term as under previous law.
The aggregate identified cost on a tax basis is $44,270,497, resulting in gross unrealized appreciation and depreciation of $6,914,626 and $2,334,705, respectively, or net unrealized appreciation of $4,579,921.
Distributions to shareholders Distributions to shareholders from net investment income are recorded by the fund on the ex-dividend date. Distributions from capital gains, if any, are recorded on the ex-dividend date and paid at least annually. The amount and character of income and gains to be distributed are determined in accordance with income tax regulations, which may differ from generally accepted accounting principles. Dividend sources are estimated at the time of declaration. Actual results may vary. Any non-taxable return of capital cannot be determined until final tax calculations are completed after the end of the fund’s fiscal year. Reclassifications are made to the fund’s capital accounts to reflect income and gains available for distribution (or available capital loss carryovers) under income tax regulations.
Expenses of the Trust Expenses directly charged or attributable to any fund will be paid from the assets of that fund. Generally, expenses of the Trust will be allocated among and charged to the assets of each fund on a basis that the Trustees deem fair and equitable, which may be based on the relative assets of each fund or the nature of the services performed and relative applicability to each fund.
Beneficial interest At the close of the reporting period, insurance companies or their separate accounts were record owners of all but a de minimis number of the shares of the fund. Approximately 40.1% of the fund is owned by accounts of one insurance company.
Note 2 — Management fee, administrative services and other transactions
The fund pays Putnam Management a management fee (based on the fund’s average net assets and computed and paid monthly) at annual rates that may vary based on the average of the aggregate net assets of most open-end funds, as defined in the fund’s management contract, sponsored by Putnam Management. Such annual rates may vary as follows:
| |
| 1.080% | of the first $5 billion, |
| 1.030% | of the next $5 billion, |
| 0.980% | of the next $10 billion, |
| 0.930% | of the next $10 billion, |
| 0.880% | of the next $50 billion, |
| 0.860% | of the next $50 billion, |
| 0.850% | of the next $100 billion and |
| 0.845% | of any excess thereafter. |
Putnam Management has contractually agreed, through April 30, 2017, to waive fees or reimburse the fund’s expenses to the extent necessary to limit the cumulative expenses of the fund, exclusive of brokerage, interest, taxes, investment-related expenses, extraordinary expenses, acquired fund fees and expenses and payments under the fund’s investor servicing contract, investment management contract and distribution plans, on a fiscal year-to-date basis to an annual rate of 0.20% of the fund’s average net assets over such fiscal year-to-date period. During the reporting period, the fund’s expenses were reduced by $24,198 as a result of this limit.
Putnam Investments Limited (PIL), an affiliate of Putnam Management, is authorized by the Trustees to manage a separate portion of the assets of the fund as determined by Putnam Management from time to time. Putnam Management pays a quarterly sub-management fee to PIL for its services at an annual rate of 0.35% of the average net assets of the portion of the fund managed by PIL.
The Putnam Advisory Company, LLC (PAC), an affiliate of Putnam Management, is authorized by the Trustees to manage a separate portion of the assets of the fund, as designated from time to time by Putnam Management or PIL. Putnam Management or PIL, as applicable, pays a quarterly sub-advisory fee to PAC for its services at the annual rate of 0.35% of the average net assets of the portion of the fund’s assets for which PAC is engaged as sub-adviser.
The fund reimburses Putnam Management an allocated amount for the compensation and related expenses of certain officers of the fund and their staff who provide administrative services to the fund. The aggregate amount of all such reimbursements is determined annually by the Trustees.
Custodial functions for the fund’s assets are provided by State Street. Custody fees are based on the fund’s asset level, the number of its security holdings and transaction volumes.
Putnam Investor Services, Inc., an affiliate of Putnam Management, provides investor servicing agent functions to the fund. Putnam Investor Services, Inc. was paid a monthly fee for investor servicing at an annual rate of 0.07% (0.10% prior to January 1, 2015) of the fund’s average daily net assets. During the reporting period, the expenses for each class of shares related to investor servicing fees were as follows:
| |
| Class IA | $11,565 |
| Class IB | 5,278 |
|
| Total | $16,843 |
The fund has entered into expense offset arrangements with Putnam Investor Services, Inc. and State Street whereby Putnam Investor Services, Inc.’s and State Street’s fees are reduced by credits allowed on cash balances. The fund also reduced expenses through brokerage/service arrangements. For the reporting period, the fund’s expenses were not reduced under the expense offset arrangements and were reduced by $4,183 under the brokerage/ service arrangements.
Each Independent Trustee of the fund receives an annual Trustee fee, of which $27, as a quarterly retainer, has been allocated to the fund, and an additional fee for each Trustees meeting attended. Trustees also are reimbursed for expenses they incur relating to their services as Trustees.
The fund has adopted a Trustee Fee Deferral Plan (the Deferral Plan) which allows the Trustees to defer the receipt of all or a portion of Trustees fees payable on or after July 1, 1995. The deferred fees remain invested in certain Putnam funds until distribution in accordance with the Deferral Plan.
The fund has adopted an unfunded noncontributory defined benefit pension plan (the Pension Plan) covering all Trustees of the fund who have served as a Trustee for at least five years and were first elected prior to 2004. Benefits under the Pension Plan are equal to 50% of the Trustee’s average annual attendance and retainer fees for the three years ended December 31, 2005. The retirement benefit is payable during a Trustee’s lifetime, beginning the year following retirement, for the number of years of service through December 31, 2006. Pension expense for the fund is included in Trustee compensation and expenses in the Statement of operations. Accrued pension liability is included in Payable for Trustee compensation and expenses in the Statement of assets and liabilities. The Trustees have terminated the Pension Plan with respect to any Trustee first elected after 2003.
The fund has adopted a distribution plan (the Plan) with respect to its class IB shares pursuant to Rule 12b-1 under the Investment Company Act of 1940. The purpose of the Plan is to compensate Putnam Retail Management Limited Partnership, an indirect wholly-owned subsidiary of Putnam Investments, LLC, for services provided and expenses incurred in distributing shares of the fund.
|
| Putnam VT International Growth Fund 15 |
The Plan provides for payment by the fund to Putnam Retail Management Limited Partnership at an annual rate of up to 0.35% of the average net assets attributable to the fund’s class IB shares. The Trustees have approved payment by the fund at an annual rate of 0.25% of the average net assets attributable to the fund’s class IB shares. During the reporting period, the class specific expenses related to distribution fees were as follows:
Note 3 — Purchases and sales of securities
During the reporting period, the cost of purchases and the proceeds from sales, excluding short-term investments, were as follows:
| | |
| | Cost of purchases | Proceeds from sales |
|
| Investments in securities (Long-term) | $20,609,500 | $23,386,998 |
|
| U.S. government securities (Long-term) | — | — |
|
| Total | $20,609,500 | $23,386,998 |
|
Note 4 — Capital shares
At the close of the reporting period, there were an unlimited number of shares of beneficial interest authorized. Subscriptions and redemptions are presented at the omnibus level. Transactions in capital shares were as follows:
| | | | | | | | |
| | | Class IA shares | | | Class IB shares | |
| | Six months ended 6/30/15 | Year ended 12/31/14 | Six months ended 6/30/15 | Year ended 12/31/14 |
| |
|
| | Shares | Amount | Shares | Amount | Shares | Amount | Shares | Amount |
|
| Shares sold | 48,602 | $987,077 | 30,125 | $594,560 | 16,724 | $324,851 | 23,889 | $474,608 |
|
| Shares issued in connection with | | | | | | | | |
| reinvestment of distributions | — | — | 5,900 | 118,772 | — | — | 479 | 9,647 |
|
| | 48,602 | 987,077 | 36,025 | 713,332 | 16,724 | 324,851 | 24,368 | 484,255 |
|
| Shares repurchased | (149,042) | (2,955,657) | (341,270) | (6,828,481) | (57,791) | (1,151,031) | (162,589) | (3,235,848) |
|
| Net decrease | (100,440) | $(1,968,580) | (305,245) | $(6,115,149) | (41,067) | $(826,180) | (138,221) | $(2,751,593) |
|
Note 5 — Affiliated transactions
Transactions during the reporting period with Putnam Short Term Investment Fund, which is under common ownership and control, were as follows:
| | | | | |
| | Fair value at the beginning of | | | | Fair value at the end of the |
| Name of affiliate | the reporting period | Purchase cost | Sale proceeds | Investment income | reporting period |
|
| Putnam Short Term Investment Fund* | $806,295 | $6,850,384 | $6,667,992 | $224 | $988,687 |
|
| Total | $806,295 | $6,850,384 | $6,667,992 | $224 | $988,687 |
|
* Management fees charged to Putnam Short Term Investment Fund have been waived by Putnam Management.
Note 6 — Market, credit and other risks
In the normal course of business, the fund trades financial instruments and enters into financial transactions where risk of potential loss exists due to changes in the market (market risk) or failure of the contracting party to the transaction to perform (credit risk). The fund may be exposed to additional credit risk that an institution or other entity with which the fund has unsettled or open transactions will default. Investments in foreign securities involve certain risks, including those related to economic instability, unfavorable political developments, and currency fluctuations.
Note 7 — Summary of derivative activity
The volume of activity for the reporting period for any derivative type that was held during the period is listed below and was as follows based on an average of the holdings at the end of each fiscal quarter:
| |
| Purchased equity option contracts (contract amount) | $—* |
|
| Forward currency contracts (contract amount) | $51,300,000 |
|
| Warrants (number of warrants) | 21,000 |
|
* For the reporting period there were no holdings at the end of each fiscal quarter and the transactions were considered minimal.
The following is a summary of the fair value of derivative instruments as of the close of the reporting period:
Fair value of derivative instruments as of the close of the reporting period
| | | | |
| | Asset derivatives | Liability derivatives |
|
| Derivatives not accounted | | | | |
| for as hedging instruments | Statement of assets and | | Statement of assets and | |
| under ASC 815 | liabilities location | Fair value | liabilities location | Fair value |
|
| Foreign exchange contracts | Receivables | $422,188 | Payables | $389,280 |
|
| Equity contracts | Investments | 247,425 | Payables | — |
|
| Total | | $669,613 | | $389,280 |
|
|
| 16 Putnam VT International Growth Fund |
The following is a summary of realized and change in unrealized gains or losses of derivative instruments on the Statement of operations for the reporting period (see Note 1):
Amount of realized gain or (loss) on derivatives recognized in net gain or (loss) on investments
| | | |
| Derivatives not accounted for as hedging | | Forward currency | |
| instruments under ASC 815 | Options | contracts | Total |
|
| Foreign exchange contracts | $— | $(172,563) | $(172,563) |
|
| Equity contracts | (8,942) | — | $(8,942) |
|
| Total | $(8,942) | $(172,563) | $(181,505) |
|
Change in unrealized appreciation or (depreciation) on derivatives recognized in net gain or (loss) on investments
| | | |
| Derivatives not accounted for as hedging | | Forward currency | |
| instruments under ASC 815 | Warrants | contracts | Total |
|
| Foreign exchange contracts | $— | $218,787 | $218,787 |
|
| Equity contracts | 50,541 | — | $50,541 |
|
| Total | $50,541 | $218,787 | $269,328 |
|
|
| Putnam VT International Growth Fund 17 |
Note 8 — Offsetting of financial and derivative assets and liabilities
The following table summarizes any derivatives, repurchase agreements and reverse repurchase agreements, at the end of the reporting period, that are subject to an enforceable master netting agreement or similar agreement. For securities lending transactions or borrowing transactions associated with securities sold short, if any, see Note 1. For financial reporting purposes, the fund does not offset financial assets and financial liabilities that are subject to the master netting agreements in the Statement of assets and liabilities.
| | | | | | | | | | | | |
| | Bank of America N.A. | Barclays Bank PLC | Citibank, N.A. | Credit Suisse International | Deutsche Bank AG | Goldman Sachs International | HSBC Bank USA, National Association | JPMorgan Chase Bank N. A. | State Street Bank and Trust Co. | UBS AG | WestPac Banking Corp. | Total |
|
| Assets: | | | | | | | | | | | | |
|
| Forward currency contracts# | $52,012 | $19,121 | $50,294 | $25,896 | $28,377 | $245 | $52,637 | $100,441 | $26,816 | $29,297 | $37,052 | $422,188 |
|
| Total Assets | $52,012 | $19,121 | $50,294 | $25,896 | $28,377 | $245 | $52,637 | $100,441 | $26,816 | $29,297 | $37,052 | $422,188 |
|
| Liabilities: | | | | | | | | | | | | |
|
| Forward currency contracts# | 11,370 | 26,409 | 22,782 | 100,134 | 2,110 | 19,504 | 1,815 | 93,520 | 12,716 | 68,827 | 30,093 | 389,280 |
|
| Total Liabilities | $11,370 | $26,409 | $22,782 | $100,134 | $2,110 | $19,504 | $1,815 | $93,520 | $12,716 | $68,827 | $30,093 | $389,280 |
|
| Total Financial and Derivative Net Assets | $40,642 | $(7,288) | $27,512 | $(74,238) | $26,267 | $(19,259) | $50,822 | $6,921 | $14,100 | $(39,530) | $6,959 | $32,908 |
|
| Total collateral received (pledged)† ## | $— | $— | $— | $(74,238) | $— | $— | $— | $— | $— | $— | $— | |
|
| Net amount | $40,642 | $(7,288) | $27,512 | $— | $26,267 | $(19,259) | $50,822 | $6,921 | $14,100 | $(39,530) | $6,959 | |
|
†Additional collateral may be required from certain brokers based on individual agreements.
#Covered by master netting agreement (Note 1).
##Any over-collateralization of total financial and derivative net assets is not shown. Collateral may include amounts related to unsettled agreements.
| |
| 18 Putnam VT International Growth Fund | Putnam VT International Growth Fund 19 |
Trustee approval of management contract
General conclusions
The Board of Trustees of The Putnam Funds oversees the management of each fund and, as required by law, determines annually whether to approve the continuance of your fund’s management contract with Putnam Investment Management, LLC (“Putnam Management”), the sub-management contract with respect to your fund between Putnam Management and its affiliate, Putnam Investments Limited (“PIL”), and the sub-advisory contract among Putnam Management, PIL, and another affiliate, The Putnam Advisory Company (“PAC”). The Board, with the assistance of its Contract Committee, requests and evaluates all information it deems reasonably necessary under the circumstances in connection with its annual contract review. The Contract Committee consists solely of Trustees who are not “interested persons” (as this term is defined in the Investment Company Act of 1940, as amended (the “1940 Act”)) of The Putnam Funds (“Independent Trustees”).
At the outset of the review process, members of the Board’s independent staff and independent legal counsel met with representatives of Putnam Management to review the annual contract review materials furnished to the Contract Committee during the course of the previous year’s review and to discuss possible changes in these materials that might be necessary or desirable for the coming year. Following these discussions and in consultation with the Contract Committee, the Independent Trustees’ independent legal counsel requested that Putnam Management and its affiliates furnish specified information, together with any additional information that Putnam Management considered relevant, to the Contract Committee. Over the course of several months ending in June 2015, the Contract Committee met on a number of occasions with representatives of Putnam Management, and separately in executive session, to consider the information that Putnam Management provided, as well as supplemental information provided in response to additional requests made by the Contract Committee. Throughout this process, the Contract Committee was assisted by the members of the Board’s independent staff and by independent legal counsel for The Putnam Funds and the Independent Trustees.
In May 2015, the Contract Committee met in executive session to discuss and consider its recommendations with respect to the continuance of the contracts. At the Trustees’ June 19, 2015 meeting, the Contract Committee met in executive session with the other Independent Trustees to review a summary of the key financial, performance and other data that the Contract Committee considered in the course of its review. The Contract Committee then presented its written report, which summarized the key factors that the Committee had considered and set forth its recommendations. The Contract Committee then recommended, and the Independent Trustees approved, the continuance of your fund’s management, sub-management and sub-advisory contracts, effective July 1, 2015. (Because PIL and PAC are affiliates of Putnam Management and Putnam Management remains fully responsible for all services provided by PIL and PAC, the Trustees have not attempted to evaluate PIL or PAC as separate entities, and all subsequent references to Putnam Management below should be deemed to include reference to PIL and PAC as necessary or appropriate in the context.) The Independent Trustees’ approval was based on the following conclusions:
• That the fee schedule in effect for your fund represented reasonable compensation in light of the nature and quality of the services being provided to the fund, the fees paid by competitive funds, the costs incurred by Putnam Management in providing services to the fund, and the continued application of certain reductions and waivers noted below; and
• That the fee schedule in effect for your fund represented an appropriate sharing between fund shareholders and Putnam Management of such economies of scale as may exist in the management of the fund at current asset levels.
These conclusions were based on a comprehensive consideration of all information provided to the Trustees and were not the result of any single factor. Some of the factors that figured particularly in the Trustees’ deliberations and how the Trustees considered these factors are described below, although individual Trustees may have evaluated the information presented differently, giving different weights to various factors. It is also important to recognize that the management arrangements for your fund and the other Putnam funds are the result of many years of review and discussion between the Independent Trustees and Putnam Management, that some aspects of the arrangements may receive greater scrutiny in some years than others, and that the Trustees’ conclusions may be based, in part, on their consideration of fee arrangements in previous years. For example, with some minor exceptions, the funds’ current fee arrangements were implemented at the beginning of 2010 following extensive review by the Contract Committee and discussions with representatives of Putnam Management, as well as approval by shareholders.
Management fee schedules and total expenses
The Trustees reviewed the management fee schedules in effect for all Putnam funds, including fee levels and breakpoints. The Trustees also reviewed the total expenses of each Putnam fund, recognizing that in most cases management fees represented the major, but not the sole, determinant of total costs to shareholders.
In reviewing fees and expenses, the Trustees generally focus their attention on material changes in circumstances — for example, changes in assets under management, changes in a fund’s investment style, changes in Putnam Management’s operating costs or profitability, or changes in competitive practices in the mutual fund industry — that suggest that consideration of fee changes might be warranted. The Trustees concluded that the circumstances did not warrant changes to the management fee structure of your fund.
Under its management contract, your fund has the benefit of breakpoints in its management fee schedule that provide shareholders with economies of scale in the form of reduced fee levels as assets under management in the Putnam family of funds increase. The Trustees concluded that the fee schedule in effect for your fund represented an appropriate sharing of economies of scale between fund shareholders and Putnam Management.
As in the past, the Trustees also focused on the competitiveness of each fund’s total expense ratio. In order to support the effort to have fund expenses meet competitive standards, the Trustees and Putnam Management have implemented certain expense limitations. These expense limitations were: (i) a contractual expense limitation applicable to all retail open-end funds of 32 basis points on investor servicing fees and expenses and (ii) a contractual expense limitation applicable to your fund and all but two of the other open-end funds of 20 basis points on so-called “other expenses” (i.e., all expenses exclusive of management fees, distribution fees, investor servicing
|
| 20 Putnam VT International Growth Fund |
fees, investment-related expenses, interest, taxes, brokerage commissions, acquired fund fees and expenses and extraordinary expenses). These expense limitations attempt to maintain competitive expense levels for funds with large numbers of small shareholder accounts and funds with relatively small net assets. Most funds had sufficiently low expenses that these expense limitations were not operative. However, in the case of your fund, the second of the expense limitations was operative during its fiscal year ending in 2014. Putnam Management’s support for these expense limitation arrangements was an important factor in the Trustees’ decision to approve the continuance of your fund’s management, sub-management and sub-advisory contracts.
The Trustees reviewed comparative fee and expense information for a custom group of competitive funds selected by Lipper Inc. (“Lipper”). This comparative information included your fund’s percentile ranking for effective management fees and total expenses (excluding any applicable 12b-1 fee), which provides a general indication of your fund’s relative standing. In the custom peer group, your fund ranked in the fourth quintile in effective management fees (determined for your fund and the other funds in the custom peer group based on fund asset size and the applicable contractual management fee schedule) and in the fifth quintile in total expenses (excluding any applicable 12b-1 fees) as of December 31, 2014 (the first quintile representing the least expensive funds and the fifth quintile the most expensive funds). The fee and expense data reported by Lipper as of December 31, 2014 reflected the most recent fiscal year-end data available in Lipper’s database at that time.
In connection with their review of fund management fees and total expenses, the Trustees also reviewed the costs of the services provided and the profits realized by Putnam Management and its affiliates from their contractual relationships with the funds. This information included trends in revenues, expenses and profitability of Putnam Management and its affiliates relating to the investment management, investor servicing and distribution services provided to the funds. In this regard, the Trustees also reviewed an analysis of Putnam Management’s revenues, expenses and profitability, allocated on a fund-by-fund basis, with respect to the funds’ management, distribution, and investor servicing contracts. For each fund, the analysis presented information about revenues, expenses and profitability for each of the agreements separately and for the agreements taken together on a combined basis. The Trustees concluded that, at current asset levels, the fee schedules in place represented reasonable compensation for the services being provided and represented an appropriate sharing of such economies of scale as may exist in the management of the Putnam funds at that time.
The information examined by the Trustees as part of their annual contract review for the Putnam funds has included for many years information regarding fees charged by Putnam Management and its affiliates to institutional clients such as defined benefit pension plans, college endowments, and the like. This information included comparisons of those fees with fees charged to the Putnam funds, as well as an assessment of the differences in the services provided to these different types of clients. The Trustees observed that the differences in fee rates between institutional clients and mutual funds are by no means uniform when examined by individual asset sectors, suggesting that differences in the pricing of investment management services to these types of clients may reflect historical competitive forces operating in separate markets. The Trustees considered the fact that in many cases fee rates across different asset classes are higher on average for mutual funds than for institutional clients, as well as the differences between the services that Putnam Management provides to the Putnam funds and those that it provides to its institutional clients. The Trustees did not rely on these comparisons to any significant extent in concluding that the management fees paid by your fund are reasonable.
Investment performance
The quality of the investment process provided by Putnam Management represented a major factor in the Trustees’ evaluation of the quality of services provided by Putnam Management under your fund’s management contract. The Trustees were assisted in their review of the Putnam funds’ investment process and performance by the work of the investment oversight committees of the Trustees, which meet on a regular basis with the funds’ portfolio teams and with the Chief Investment Officer and other senior members of Putnam Management’s Investment Division throughout the year. The Trustees concluded that Putnam Management generally provides a high-quality investment process — based on the experience and skills of the individuals assigned to the management of fund portfolios, the resources made available to them, and in general Putnam Management’s ability to attract and retain high-quality personnel — but also recognized that this does not guarantee favorable investment results for every fund in every time period.
The Trustees considered that 2014 was a year of strong competitive performance for many of the Putnam funds, with generally strong results for the U.S. equity, money market and global asset allocation funds, but relatively mixed results for the international and global equity and fixed income funds. They noted that the longer-term performance of the Putnam funds continued to be strong, exemplified by the fact that the Putnam funds were recognized by Barron’s as the sixth-best performing mutual fund complex for the five-year period ended December 31, 2014. They also noted, however, the disappointing investment performance of some funds for periods ended December 31, 2014 and considered information provided by Putnam Management regarding the factors contributing to the underperformance and actions being taken to improve the performance of these particular funds. The Trustees indicated their intention to continue to monitor performance trends to assess the effectiveness of these efforts and to evaluate whether additional actions to address areas of underperformance are warranted.
For purposes of evaluating investment performance, the Trustees generally focus on competitive industry rankings for the one-year, three-year and five-year periods. For a number of Putnam funds with relatively unique investment mandates for which meaningful competitive performance rankings are not considered to be available, the Trustees evaluated performance based on comparisons of fund returns with the returns of selected investment benchmarks. In the case of your fund, the Trustees considered that its class IA share cumulative total return performance at net asset value was in the following quartiles of its Lipper peer group (Lipper VP (Underlying Funds) — International Multi-Cap Growth Funds) for the one-year, three-year and five-year periods ended December 31, 2014 (the first quartile representing the best-performing funds and the fourth quartile the worst-performing funds):
| | |
| One-year period | Three-year period | Five-year period |
|
| 4th | 2nd | 3rd |
|
Over the one-year, three-year and five-year periods ended December 31, 2014, there were 76, 72 and 66 funds, respectively, in your fund’s Lipper peer group. (When considering performance
|
| Putnam VT International Growth Fund 21 |
information, shareholders should be mindful that past performance is not a guarantee of future results.) The Trustees expressed concern about your fund’s fourth quartile performance over the one-year period ended December 31, 2014 and considered the circumstances that may have contributed to this disappointing performance. The Trustees considered Putnam Management’s view that the fund’s underperformance over the one-year period was due in significant part to the fund’s overweight position in the energy sector and its underweight position in Japan, Switzerland and the health care sector, as well as unfavorable security selection in Japan, Russia, Switzerland and the financials and consumer discretionary sectors.
The Trustees observed that Putnam Management remained confident in the portfolio manager and his investment process. The Trustees also considered Putnam Management’s continued efforts to support fund performance through initiatives including structuring compensation for portfolio managers and research analysts to enhance accountability for fund performance, emphasizing accountability in the portfolio management process, and affirming its commitment to a fundamental-driven approach to investing. The Trustees noted further that Putnam Management continued to strengthen its fundamental research capabilities by adding new investment personnel.
As a general matter, the Trustees believe that cooperative efforts between the Trustees and Putnam Management represent the most effective way to address investment performance issues that may arise from time to time. The Trustees noted that investors in the Putnam funds have, in effect, placed their trust in the Putnam organization, under the oversight of the funds’ Trustees, to make appropriate decisions regarding the management of the funds. Based on past responsiveness of Putnam Management to Trustee concerns about investment performance, the Trustees concluded that it is preferable to seek change within Putnam Management to address performance shortcomings. In the Trustees’ view, the alternative of engaging a new investment adviser for an underperforming fund would entail significant disruptions and would not likely provide any greater assurance of improved investment performance.
Brokerage and soft-dollar allocations; investor servicing
The Trustees considered various potential benefits that Putnam Management may receive in connection with the services it provides under the management contract with your fund. These include benefits related to brokerage allocation and the use of soft dollars, whereby a portion of the commissions paid by a fund for brokerage may be used to acquire research services that are expected to be useful to Putnam Management in managing the assets of the fund and of other clients. Subject to policies established by the Trustees, soft dollars generated by these means are used primarily to acquire brokerage and research services that enhance Putnam Management’s investment capabilities and supplement Putnam Management’s internal research efforts. However, the Trustees noted that a portion of available soft dollars continues to be used to pay fund expenses. The Trustees indicated their continued intent to monitor regulatory and industry developments in this area with the assistance of their Brokerage Committee and also indicated their continued intent to monitor the allocation of the Putnam funds’ brokerage in order to ensure that the principle of seeking best price and execution remains paramount in the portfolio trading process.
Putnam Management may also receive benefits from payments that the funds make to Putnam Management’s affiliates for investor or distribution services. In conjunction with the annual review of your fund’s management, sub-management and sub-advisory contracts, the Trustees reviewed your fund’s investor servicing agreement with Putnam Investor Services, Inc. (“PSERV”) and its distributor’s contracts and distribution plans with Putnam Retail Management Limited Partnership (“PRM”), both of which are affiliates of Putnam Management. The Trustees concluded that the fees payable by the funds to PSERV and PRM, as applicable, for such services are reasonable in relation to the nature and quality of such services, the fees paid by competitive funds, and the costs incurred by PSERV and PRM, as applicable, in providing such services.
|
| 22 Putnam VT International Growth Fund |
|
| This page intentionally left blank. |
|
| Putnam VT International Growth Fund 23 |
|
| This page intentionally left blank. |
|
| 24 Putnam VT International Growth Fund |
Other important information
Proxy voting
Putnam is committed to managing our mutual funds in the best interests of our shareholders. The Putnam funds’ proxy voting guidelines and procedures, as well as information regarding how your fund voted proxies relating to portfolio securities during the 12-month period ended June 30, 2015, are available in the Individual Investors section of putnam.com and on the SEC’s website, www.sec.gov. If you have questions about finding forms on the SEC’s website, you may call the SEC at 1-800-SEC-0330. You may also obtain the Putnam funds’ proxy voting guidelines and procedures at no charge by calling Putnam’s Shareholder Services at 1-800-225-1581.
Fund portfolio holdings
Each Putnam VT fund will file a complete schedule of its portfolio holdings with the SEC for the first and third quarters of each fiscal year on Form N-Q. Shareholders may obtain the fund’s Form N-Q on the SEC’s website at www.sec.gov. In addition, the fund’s Form N-Q may be reviewed and copied at the SEC’s Public Reference Room in Washington, D.C. You may call the SEC at 1-800-SEC-0330 for information about the SEC’s website or the operation of the Public Reference Room.
| | |
| Fund information | | |
| |
| Investment Manager | Investor Servicing Agent | Trustees |
| Putnam Investment Management, LLC | Putnam Investor Services, Inc. | Jameson A. Baxter, Chair |
| One Post Office Square | Mailing address: | Liaquat Ahamed |
| Boston, MA 02109 | P.O. Box 8383 | Ravi Akhoury |
| | Boston, MA 02266-8383 | Barbara M. Baumann |
| Investment Sub-Manager | 1-800-225-1581 | Robert J. Darretta |
| Putnam Investments Limited | | Katinka Domotorffy |
| 57–59 St James’s Street | Custodian | John A. Hill |
| London, England SW1A 1LD | State Street Bank and Trust Company | Paul L. Joskow |
| | | Kenneth R. Leibler |
| Investment Sub-Advisor | Legal Counsel | Robert E. Patterson |
| The Putnam Advisory Company, LLC | Ropes & Gray LLP | George Putnam, III |
| One Post Office Square | | Robert L. Reynolds |
| Boston, MA 02109 | | W. Thomas Stephens |
| | | |
| Marketing Services | | |
| Putnam Retail Management | | |
| One Post Office Square | | |
| Boston, MA 02109 | | |
The fund’s Statement of Additional Information contains additional information about the fund’s Trustees and is available without charge upon request by calling 1-800-225-1581.
|
| Putnam VT International Growth Fund 25 |
| | |
| | | |
| This report has been prepared for the shareholders | | H514 |
| of Putnam VT International Growth Fund. | VTSA010 295641 8/15 |
| |
| Item 3. Audit Committee Financial Expert: |
| |
| Item 4. Principal Accountant Fees and Services: |
| |
| Item 5. Audit Committee of Listed Registrants |
| |
| Item 6. Schedule of Investments: |
| |
| The registrant’s schedule of investments in unaffiliated issuers is included in the report to shareholders in Item 1 above. |
| |
| Item 7. Disclosure of Proxy Voting Policies and Procedures For Closed-End Management Investment Companies: |
| |
| Item 8. Portfolio Managers of Closed-End Investment Companies |
| |
| Item 9. Purchases of Equity Securities by Closed-End Management Investment Companies and Affiliated Purchasers: |
| |
| Item 10. Submission of Matters to a Vote of Security Holders: |
| |
| Item 11. Controls and Procedures: |
| |
| (a) The registrant’s principal executive officer and principal financial officer have concluded, based on their evaluation of the effectiveness of the design and operation of the registrant’s disclosure controls and procedures as of a date within 90 days of the filing date of this report, that the design and operation of such procedures are generally effective to provide reasonable assurance that information required to be disclosed by the registrant in this report is recorded, processed, summarized and reported within the time periods specified in the Commission’s rules and forms. |
| |
| (b) Changes in internal control over financial reporting: Not applicable |
| |
| (a)(2) Separate certifications for the principal executive officer and principal financial officer of the registrant as required by Rule 30a-2(a) under the Investment Company Act of 1940, as amended, are filed herewith. |
| |
| (b) The certifications required by Rule 30a-2(b) under the Investment Company Act of 1940, as amended, are filed herewith. |
| |
| By (Signature and Title): |
| |
| /s/ Janet C. Smith
Janet C. Smith
Principal Accounting Officer
|
| |
| Pursuant to the requirements of the Securities Exchange Act of 1934 and the Investment Company Act of 1940, this report has been signed below by the following persons on behalf of the registrant and in the capacities and on the dates indicated. |
| |
| By (Signature and Title): |
| |
| /s/ Jonathan S. Horwitz
Jonathan S. Horwitz
Principal Executive Officer
|
| |
| By (Signature and Title): |
| |
| /s/ Steven D. Krichmar
Steven D. Krichmar
Principal Financial Officer
|