| | |
| UNITED STATES
SECURITIES AND EXCHANGE COMMISSION |
| | |
| CERTIFIED SHAREHOLDER REPORT OF REGISTERED
MANAGEMENT INVESTMENT COMPANIES
|
| | |
| Investment Company Act file number: | (811-05346) |
| | |
| Exact name of registrant as specified in charter: | Putnam Variable Trust |
| | |
| Address of principal executive offices: | 100 Federal Street, Boston, Massachusetts 02110 |
| | |
| Name and address of agent for service: | Robert T. Burns, Vice President
100 Federal Street
Boston, Massachusetts 02110 |
| | |
| Copy to: | Bryan Chegwidden, Esq.
Ropes & Gray LLP
1211 Avenue of the Americas
New York, New York 10036 |
| | |
| Registrant’s telephone number, including area code: | (617) 292-1000 |
| | |
| Date of fiscal year end: | December 31, 2018 |
| | |
| Date of reporting period : | January 1, 2018 — December 31, 2018 |
| | |
|
Item 1. Report to Stockholders: | |
| | |
| The following is a copy of the report transmitted to stockholders pursuant to Rule 30e-1 under the Investment Company Act of 1940: | |
Message from the Trustees
February 14, 2019
Dear Shareholder:
Global financial markets encountered challenges in the final months of 2018. December was difficult for stock markets worldwide, and most major indexes finished the year with losses. Among the issues that contributed to the downturn were uncertainty about monetary policy, a slowing Chinese economy, and the U.S.–China trade dispute. Fixed-income markets were less volatile than stocks, and higher quality bonds benefited from a flight to safety amid the turmoil.
Although no one can predict the direction of the markets in the months ahead, Putnam’s experienced investment professionals actively seek to position their fund portfolios for all types of conditions. They take a research-intensive approach to investing that includes risk management strategies designed to serve investors through changing markets. In all environments, we believe investors should remain focused on time-tested approaches: maintain a well-diversified portfolio, think about long-term goals, and speak regularly with a financial advisor.
Thank you for investing with Putnam.
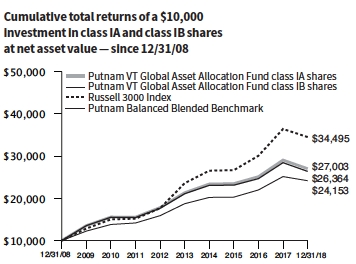
Performance summary(as of 12/31/18)
Investment objective
Long-term return consistent with preservation of capital
| |
| Net asset valueDecember 31, 2018 |
| | |
| Class IA: $15.17 | Class IB: $15.35 |
| | | | |
| Total return at net asset value | | |
| | | | | Putnam |
| | | | | Balanced |
| (as of | Class IA | Class IB | Russell 3000 | Blended |
| 12/31/18) | shares* | shares† | Index | Benchmark |
| 1 year | –7.02% | –7.26% | –5.24% | –3.90% |
| 5 years | 26.69 | 25.12 | 46.34 | 29.07 |
| Annualized | 4.84 | 4.58 | 7.91 | 5.24 |
| 10 years | 170.03 | 163.64 | 244.95 | 141.53 |
| Annualized | 10.44 | 10.18 | 13.18 | 9.22 |
| Life | 805.85 | 758.31 | 1,861.27 | — |
| Annualized | 7.39 | 7.20 | 10.11 | — |
For a portion of the periods, the fund had expense limitations, without which returns would have been lower.
* Class inception date: February 1, 1988.
† Class inception date: April 30, 1998.
The Russell 3000 Index is an unmanaged index of the 3,000 largest U.S. companies.
Frank Russell Company is the source and owner of the trademarks, service marks, and copyrights related to the Russell Indexes. Russell® is a trademark of Frank Russell Company.
The Putnam Balanced Blended Benchmark is an unmanaged index administered by Putnam Investment Management, LLC, 50% of which is the Russell 3000 Index, 35% of which is the Bloomberg Barclays U.S. Aggregate Bond Index, 10% of which is the MSCI EAFE Index (ND), and 5% of which is the JPMorgan Developed High Yield Index.
Data represent past performance. Past performance does not guarantee future results. More recent returns may be less or more than those shown. Investment return and principal value will fluctuate, and you may have a gain or a loss when you sell your shares. Performance information does not reflect any deduction for taxes a shareholder may owe on fund distributions or on the redemption of fund shares. All total return figures are at net asset value and exclude contract charges and expenses, which are added to the variable annuity contracts to determine total return at unit value. Had these charges and expenses been reflected, performance would have been lower.
Performance of class IB shares before their inception is derived from the historical performance of class IA shares, adjusted to reflect the higher operating expenses applicable to such shares. For more recent performance, contact your variable annuity provider who can provide you with performance that reflects the charges and expenses at your contract level.
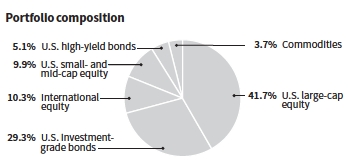
Allocations are shown as a percentage of the fund’s net assets. Cash and net other assets, if any, represent the market value weights of cash, derivatives, short-term securities, and other unclassified assets in the portfolio. Summary information may differ from the portfolio schedule included in the financial statements due to the inclusion of derivative securities, any interest accruals, the exclusion of as-of trades, if any, the use of different classifications of securities for presentation purposes, and rounding. Holdings and allocations may vary over time.
| |
| Putnam VT Global Asset Allocation Fund1 |
Report from your fund’s manager
How was the investment environment for the 12-month reporting period ended December 31, 2018?
Global markets were marked by a series of ups and downs during the 12-month period. Falling stock prices, a strong U.S. dollar, weakening global growth, rising interest rates, and concerns about President Donald Trump’s trade and economic policies set investors on edge. The MSCI World Index, a broad global equity index composed of large and mid-cap stocks, finished the period down 8.71%, and the S&P 500 Index dropped 4.38%. Volatility also increased across many financial markets.
Treasury yields moved higher on the short end of the yield curve and lower on the intermediate and long end. The widely watched spread between two- and 10-year Treasury yields narrowed following the U.S. Federal Reserve’s interest-rate hikes in 2018. The decline in long-term yields is a sign that bond investors expect the economy to slow. The Fed raised its benchmark rate to a range of 2.25% to 2.50% in December, rounding out four rate hikes in 2018. As a result, the U.S. dollar appreciated against many global currencies. However, the European Central Bank left rates unchanged in 2018 and ended its multi-trillion bond-buying program in December.
Economic indicators deteriorated globally, including in China and the eurozone. But the U.S. economy held steady; the economy grew at a 3.5% annual rate in the third quarter of 2018 after expanding 4.2% in the second quarter, buoyed by government spending and tax cuts. Markets in Europe struggled due to political concerns, including Brexit. An escalation in the U.S.–China trade dispute also rattled global financial markets and businesses.
How did the fund perform?
For the 12-month period, the fund’s class IA shares declined 7.02%. The custom Putnam Balanced Blended Benchmark fell 3.90%, and the all-stock benchmark, the Russell 3000 Index, dropped 5.24%.
What strategies affected performance?
Negative performance was primarily the result of poor asset class returns for the period. Our dynamic allocation decisions, particularly in equities and commodities, detracted from results. In equities, we increased our allocation in the fourth quarter, anticipating a market bounce that didn’t materialize before the end of 2018. The commodities sector struggled during the dramatic sell-off in crude oil prices. This occurred when the U.S. government granted waivers from sanctions to some of the biggest buyers of oil exports from Iran.
Our active implementation decisions and security selections also detracted from performance. They were driven by our quantitative strategies in U.S. large-cap and international developed equity markets. Our team analyzes stock market history to identify characteristics of stocks [factors] that have excess risk-adjusted returns. Despite a strong long-term relationship between these factors and positive stock performance, the strategies underperformed.
The fund used futures to manage exposure to the markets, hedge prepayment and interest-rate risks, gain exposure to interest rates, and equitize cash.
What is your outlook for 2019?
We believe that economic growth in the United States is likely to slow this year. Fed Chair Jerome Powell said in January 2019 that low inflation would allow the Fed to be “patient” in deciding whether to continue raising interest rates. A peak in global growth momentum, mounting trade risks, and a more restrictive Fed could lead to higher market volatility, in our view. We expect bond yields to continue to drift higher in 2019 as interest-rate normalization continues globally.
Although we believe that stock and bond market volatility are likely to persist in 2019, we increased our exposure to equity, inflation [commodities], and credit risks, looking to take advantage of any short-term market weakness. The portfolio has an overweight in U.S. equities and commodities. We are neutral on high-yield credit and slightly underweight in interest-rate-sensitive fixed-income assets. For U.S. stocks, valuations are more appealing, and companies may return to buying back their own shares, in our view. We are constructive on commodities. In terms of credit, we recently upgraded our position due to positive indications from our quantitative model. We believe fundamentals are also better in this sector following third-quarter 2018 earnings reports.
The views expressed in this report are exclusively those of Putnam Management and are subject to change. They are not meant as investment advice. Please note that the holdings discussed in this report may not have been held by the fund for the entire period. Portfolio composition is subject to review in accordance with the fund’s investment strategy and may vary in the future.
Consider these risks before investing:Allocation of assets among asset classes may hurt performance. The value of investments in the fund’s portfolio may fall or fail to rise over extended periods of time for a variety of reasons, including general economic, political or financial market conditions, investor sentiment and market perceptions, government actions, geopolitical events or changes, and factors related to a specific issuer, asset class, geography, industry, or sector. These and other factors may also lead to increased volatility and reduced liquidity in the fund’s portfolio holdings. International investing involves currency, economic, and political risks. Emerging-market securities carry illiquidity and volatility risks. Investments in small and/or midsize companies increase the risk of greater price fluctuations. Growth stocks may be more susceptible to earnings disappointments, and value stocks may fail to rebound. Funds that invest in government securities are not guaranteed. Mortgage-backed investments, unlike traditional debt investments, are also subject to prepayment risk, which means that they may increase in value less than other bonds when interest rates decline and decline in value more than other bonds when interest rates rise. Bond investments are subject to interest-rate risk (the risk of bond prices falling if interest rates rise) and credit risk (the risk of an issuer defaulting on interest or principal payments). Default risk is generally higher for non-qualified mortgages. Interest-rate risk is greater for longer-term bonds, and credit risk is greater for below-investment-grade bonds. Unlike bonds, funds that invest in bonds have fees and expenses. The use of derivatives may increase these risks by increasing investment exposure (which may be considered leverage) or, in the case of over-the-counter instruments, because of the potential inability to terminate or sell
| |
| 2Putnam VT Global Asset Allocation Fund |
derivatives positions and the potential failure of the other party to the instrument to meet its obligations. You can lose money by investing in the fund.
Your fund’s managers

Portfolio ManagerJames A. Fetchis Co-Head of Global Asset Allocation. He has been in the investment industry since he joined Putnam in 1994.
Robert J. Schoen and Jason R. Vaillancourt, CFA, are also Portfolio Managers of the fund.
Your fund’s managers also manage other accounts advised by Putnam Management or an affiliate, including retail mutual fund counterparts to the funds in Putnam Variable Trust.
ABOUT DERIVATIVES
Derivatives are an increasingly common type of investment instrument, the performance of which isderivedfrom an underlying security, index, currency, or other area of the capital markets. Derivatives employed by the fund’s managers generally serve one of two main purposes: to implement a strategy that may be difficult or more expensive to invest in through traditional securities, or to hedge unwanted risk associated with a particular position.
For example, the fund’s managers might use currency forward contracts to capitalize on an anticipated change in exchange rates between two currencies. This approach would require a significantly smaller outlay of capital than purchasing traditional bonds denominated in the underlying currencies. In another example, the managers may identify a bond that they believe is undervalued relative to its risk of default but may seek to reduce the interest-rate risk of that bond by using interest-rate swaps, a derivative through which two parties “swap” payments based on the movement of certain rates. In other examples, the managers may use options and futures contracts to hedge against a variety of risks by establishing a combination of long and short exposures to specific equity markets or sectors.
Like any other investment, derivatives may not appreciate in value and may lose money. Derivatives may amplify traditional investment risks through the creation of leverage and may be less liquid than traditional securities. And because derivatives typically represent contractual agreements between two financial institutions, derivatives entail “counterparty risk,” which is the risk that the other party is unable or unwilling to pay. Putnam monitors the counterparty risks we assume. For example, Putnam often enters into collateral agreements that require the counterparties to post collateral on a regular basis to cover their obligations to the fund. Counterparty risk for exchange-traded futures and centrally cleared swaps is mitigated by the daily exchange of margin and other safeguards against default through their respective clearinghouses.
| |
| Putnam VT Global Asset Allocation Fund3 |
Understanding your fund’s expenses
As an investor in a variable annuity product that invests in a registered investment company, you pay ongoing expenses, such as management fees, distribution fees (12b-1 fees), and other expenses. Using the following information, you can estimate how these expenses affect your investment and compare them with the expenses of other funds. You may also pay one-time transaction expenses, which are not shown in this section and would result in higher total expenses. Charges and expenses at the insurance company separate account level are not reflected. For more information, see your fund’s prospectus or talk to your financial representative.
Review your fund’s expenses
The two left-hand columns of the Expenses per $1,000 table show the expenses you would have paid on a $1,000 investment in your fund from 7/1/18 to 12/31/18. They also show how much a $1,000 investment would be worth at the close of the period,assuming actual returns and expenses. To estimate the ongoing expenses you paid over the period, divide your account value by $1,000, then multiply the result by the number in the first line for the class of shares you own.
Compare your fund’s expenses with those of other funds
The two right-hand columns of the Expenses per $1,000 table show your fund’s expenses based on a $1,000 investment,assuming a hypothetical 5% annualized return. You can use this information to compare the ongoing expenses (but not transaction expenses or total costs) of investing in the fund with those of other funds. All shareholder reports of mutual funds and funds serving as variable annuity vehicles will provide this information to help you make this comparison. Please note that you cannot use this information to estimate your actual ending account balance and expenses paid during the period.
| | |
| Expense ratios | | |
| | Class IA | Class IB |
| Total annual operating expenses for the fiscal | | |
| year ended 12/31/17 | 0.86% | 1.11% |
| Annualized expense ratio for the six-month | | |
| period ended 12/31/18* | 0.86% | 1.11% |
Fiscal-year expense information in this table is taken from the most recent prospectus, is subject to change, and may differ from that shown for the annualized expense ratio and in the financial highlights of this report.
Expenses are shown as a percentage of average net assets.
*For the fund’s most recent fiscal half year; may differ from expense ratios based on one-year data in the financial highlights.
| | | | | |
| Expenses per $1,000 | | | | |
| | | | | Expenses and value for a |
| | Expenses and value for a | | $1,000 investment, assuming |
| | $1,000 investment, assuming | | a hypothetical 5% annualized |
| | actual returns for the | | return for the 6 months |
| | 6 months ended 12/31/18 | | ended 12/31/18 | |
| | Class IA | Class IB | | Class IA | Class IB |
| Expenses paid | | | | | |
| per $1,000*† | $4.19 | $5.40 | | $4.38 | $5.65 |
| Ending value | | | | | |
| (after | | | | | |
| expenses) | $930.70 | $929.70 | | $1,020.87 | $1,019.61 |
*Expenses for each share class are calculated using the fund’s annualized expense ratio for each class, which represents the ongoing expenses as a percentage of average net assets for the six months ended 12/31/18. The expense ratio may differ for each share class.
†Expenses based on actual returns are calculated by multiplying the expense ratio by the average account value for the period; then multiplying the result by the number of days in the period; and then dividing that result by the number of days in the year. Expenses based on a hypothetical 5% return are calculated by multiplying the expense ratio by the average account value for the six-month period; then multiplying the result by the number of days in the six-month period; and then dividing that result by the number of days in the year.
| |
| 4Putnam VT Global Asset Allocation Fund |
Report of Independent Registered Public Accounting Firm
To the Trustees of Putnam Variable Trust
and Shareholders of Putnam VT Global Asset Allocation Fund
Opinion on the Financial Statements
We have audited the accompanying statement of assets and liabilities, including the fund’s portfolio, of Putnam VT Global Asset Allocation Fund (one of the funds constituting Putnam Variable Trust, referred to hereafter as the “Fund”) as of December 31, 2018, the related statement of operations for the year ended December 31, 2018, the statement of changes in net assets for each of the two years in the period ended December 31, 2018, including the related notes, and the financial highlights for each of the five years in the period ended December 31, 2018 (collectively referred to as the “financial statements”). In our opinion, the financial statements present fairly, in all material respects, the financial position of the Fund as of December 31, 2018, the results of its operations for the year then ended, the changes in its net assets for each of the two years in the period ended December 31, 2018 and the financial highlights for each of the five years in the period ended December 31, 2018 in conformity with accounting principles generally accepted in the United States of America.
Basis for Opinion
These financial statements are the responsibility of the Fund’s management. Our responsibility is to express an opinion on the Fund’s financial statements based on our audits. We are a public accounting firm registered with the Public Company Accounting Oversight Board (United States) (“PCAOB”) and are required to be independent with respect to the Fund in accordance with the U.S. federal securities laws and the applicable rules and regulations of the Securities and Exchange Commission and the PCAOB.
We conducted our audits of these financial statements in accordance with the standards of the PCAOB. Those standards require that we plan and perform the audit to obtain reasonable assurance about whether the financial statements are free of material misstatement, whether due to error or fraud.
Our audits included performing procedures to assess the risks of material misstatement of the financial statements, whether due to error or fraud, and performing procedures that respond to those risks. Such procedures included examining, on a test basis, evidence regarding the amounts and disclosures in the financial statements. Our audits also included evaluating the accounting principles used and significant estimates made by management, as well as evaluating the overall presentation of the financial statements. Our procedures included confirmation of securities owned as of December 31, 2018 by correspondence with the custodian, transfer agent and brokers; when replies were not received from brokers, we performed other auditing procedures. We believe that our audits provide a reasonable basis for our opinion.
PricewaterhouseCoopers LLP
Boston, Massachusetts
February 14, 2019
We have served as the auditor of one or more investment companies in the Putnam Investments family of mutual funds since at least 1957. We have not been able to determine the specific year we began serving as auditor.
| | |
| | Putnam VT Global Asset Allocation Fund5 |
The fund’s portfolio12/31/18
| | |
| COMMON STOCKS (56.1%)* | Shares | Value |
| Basic materials (2.0%) | | |
| Anglo American PLC (United Kingdom) | 4,445 | $99,023 |
| ArcelorMittal SA (France) | 2,854 | 59,317 |
| Arkema SA (France) | 640 | 54,967 |
| BASF SE (Germany) | 1,650 | 114,185 |
| BlueScope Steel, Ltd. (Australia) | 8,168 | 63,045 |
| Boliden AB (Sweden) | 804 | 17,415 |
| Celanese Corp. | 1,382 | 124,339 |
| CIMIC Group, Ltd. (Australia) | 1,124 | 34,364 |
| Covestro AG (Germany) | 1,218 | 60,259 |
| Evonik Industries AG (Germany) | 868 | 21,680 |
| Freeport-McMoRan, Inc. (Indonesia) | 28,115 | 289,866 |
| Glencore PLC (United Kingdom) | 4,914 | 18,248 |
| HOCHTIEF AG (Germany) | 280 | 37,759 |
| Huntsman Corp. | 6,733 | 129,880 |
| Kajima Corp. (Japan) | 2,300 | 30,831 |
| LyondellBasell Industries NV Class A | 5,102 | 424,282 |
| Mitsubishi Chemical Holdings Corp. (Japan) | 3,400 | 25,579 |
| Mitsubishi Gas Chemical Co., Inc. (Japan) | 1,400 | 20,915 |
| Packaging Corp. of America | 1,810 | 151,063 |
| Rio Tinto PLC (United Kingdom) | 3,635 | 172,817 |
| Shimizu Corp. (Japan) | 2,700 | 22,189 |
| Sika AG (Switzerland) | 99 | 12,550 |
| South32, Ltd. (Australia) | 18,890 | 44,567 |
| Steel Dynamics, Inc. | 2,806 | 84,292 |
| Sumitomo Chemical Co., Ltd. (Japan) | 10,200 | 49,882 |
| Taisei Corp. (Japan) | 2,600 | 110,539 |
| UPM-Kymmene OYJ (Finland) | 3,316 | 84,155 |
| Westlake Chemical Corp. | 1,084 | 71,728 |
| Weyerhaeuser Co.R | 4,225 | 92,359 |
| | | 2,522,095 |
| Capital goods (3.9%) | | |
| ACS Actividades de Construccion y Servicios | | |
| SA (Spain) | 2,531 | 98,103 |
| Allison Transmission Holdings, Inc. | 3,752 | 164,750 |
| Berry Plastics Group, Inc. † | 2,680 | 127,380 |
| Boeing Co. (The) | 4,274 | 1,378,365 |
| Cummins, Inc. | 2,475 | 330,759 |
| Curtiss-Wright Corp. | 287 | 29,308 |
| Faurecia SA (France) | 1,915 | 72,559 |
| HD Supply Holdings, Inc. † | 2,587 | 97,064 |
| Hitachi, Ltd. (Japan) | 4,900 | 130,251 |
| Honeywell International, Inc. | 3,364 | 444,452 |
| Ingersoll-Rand PLC | 3,336 | 304,343 |
| Lockheed Martin Corp. | 2,071 | 542,271 |
| Pentair PLC | 2,514 | 94,979 |
| Raytheon Co. | 1,710 | 262,229 |
| Republic Services, Inc. | 1,711 | 123,346 |
| Resideo Technologies, Inc. † | 4,776 | 98,147 |
| Safran SA (France) | 48 | 5,797 |
| Sandvik AB (Sweden) | 8,600 | 122,601 |
| Teledyne Technologies, Inc. † | 203 | 42,035 |
| Tervita Corp. (Canada) † | 16 | 74 |
| Waste Management, Inc. | 3,538 | 314,847 |
| | | 4,783,660 |
| | |
| COMMON STOCKS (56.1%)*cont. | Shares | Value |
| Communication services (1.9%) | | |
| BT Group PLC (United Kingdom) | 33,894 | $102,862 |
| Deutsche Telekom AG (Germany) | 6,478 | 109,997 |
| Eutelsat Communications SA (France) | 846 | 16,677 |
| Hikari Tsushin, Inc. (Japan) | 100 | 15,731 |
| HKT Trust & HKT, Ltd. (Units) (Hong Kong) | 13,000 | 18,717 |
| Juniper Networks, Inc. | 4,491 | 120,853 |
| KDDI Corp. (Japan) | 3,500 | 83,405 |
| Nippon Telegraph & Telephone Corp. (Japan) | 1,300 | 52,931 |
| NTT DoCoMo, Inc. (Japan) | 2,700 | 60,628 |
| Swisscom AG (Switzerland) | 72 | 34,407 |
| Telenor ASA (Norway) | 5,534 | 107,205 |
| Telephone & Data Systems, Inc. | 1,968 | 64,039 |
| Telstra Corp., Ltd. (Australia) | 26,126 | 52,443 |
| Verizon Communications, Inc. | 25,819 | 1,451,544 |
| | | 2,291,439 |
| Communications equipment (1.1%) | | |
| Avaya Holdings Corp. † | 573 | 8,348 |
| Cisco Systems, Inc. | 32,188 | 1,394,706 |
| | | 1,403,054 |
| Computers (2.3%) | | |
| Amadeus IT Holding SA Class A (Spain) | 1,598 | 111,392 |
| Apple, Inc. | 9,254 | 1,459,726 |
| Aspen Technology, Inc. † | 1,095 | 89,987 |
| CDW Corp. of Delaware | 1,477 | 119,711 |
| Citrix Systems, Inc. | 2,317 | 237,400 |
| Dell Technologies, Inc. Class C † | 1,618 | 79,089 |
| Fortinet, Inc. † | 4,364 | 307,357 |
| Fujitsu, Ltd. (Japan) | 500 | 31,345 |
| NetApp, Inc. | 5,270 | 314,461 |
| Synopsys, Inc. † | 1,661 | 139,923 |
| | | 2,890,391 |
| Conglomerates (0.4%) | | |
| AMETEK, Inc. | 1,984 | 134,317 |
| Marubeni Corp. (Japan) | 15,300 | 106,470 |
| Mitsubishi Corp. (Japan) | 2,900 | 79,149 |
| Mitsui & Co., Ltd. (Japan) | 7,300 | 113,137 |
| | | 433,073 |
| Consumer cyclicals (6.6%) | | |
| ABC-Mart, Inc. (Japan) | 400 | 22,154 |
| Amazon.com, Inc. † | 696 | 1,045,371 |
| Aristocrat Leisure, Ltd. (Australia) | 1,689 | 25,795 |
| Automatic Data Processing, Inc. | 3,685 | 483,177 |
| Berkeley Group Holdings PLC (The) (United Kingdom) | 483 | 21,418 |
| Booking Holdings, Inc. † | 269 | 463,331 |
| Booz Allen Hamilton Holding Corp. | 2,421 | 109,114 |
| Caesars Entertainment Corp. † | 630 | 4,277 |
| Capri Holdings, Ltd. † | 4,269 | 161,880 |
| CK Hutchison Holdings, Ltd. (Hong Kong) | 4,500 | 43,003 |
| CoStar Group, Inc. † | 381 | 128,527 |
| Crown, Ltd. (Australia) | 4,555 | 38,049 |
| Extended Stay America, Inc. (Units) | 4,050 | 62,775 |
| Fast Retailing Co., Ltd. (Japan) | 100 | 51,154 |
| Fiat Chrysler Automobiles NV (Italy) † | 3,597 | 52,266 |
| Galaxy Entertainment Group, Ltd. (Hong Kong) | 6,000 | 37,660 |
| Genting Bhd (Singapore) | 64,300 | 46,030 |
| Hermes International (France) | 232 | 128,867 |
| Hilton Worldwide Holdings, Inc. | 3,297 | 236,725 |
| Home Depot, Inc. (The) | 8,271 | 1,421,123 |
| |
| 6Putnam VT Global Asset Allocation Fund |
| | |
| COMMON STOCKS (56.1%)*cont. | Shares | Value |
| Consumer cyclicalscont. | | |
| Industria de Diseno Textil SA (Inditex) (Spain) | 1,159 | $29,679 |
| KAR Auction Services, Inc. | 2,074 | 98,971 |
| Kering SA (France) | 67 | 31,597 |
| Las Vegas Sands Corp. | 2,315 | 120,496 |
| Liberty SiriusXM Group Class A † | 1,285 | 47,288 |
| Lowe’s Cos., Inc. | 8,656 | 799,468 |
| Mitsubishi Motors Corp. (Japan) | 2,400 | 13,250 |
| Moncler SpA (Italy) | 531 | 17,601 |
| Namco Bandai Holdings, Inc. (Japan) | 700 | 31,232 |
| Next PLC (United Kingdom) | 579 | 29,453 |
| Nintendo Co., Ltd. (Japan) | 300 | 79,263 |
| Omnicom Group, Inc. | 4,127 | 302,261 |
| Pearson PLC (United Kingdom) | 5,490 | 65,665 |
| Peugeot SA (France) | 6,033 | 128,880 |
| ProSiebenSat.1 Media SE (Germany) | 2,122 | 37,806 |
| Randstad Holding NV (Netherlands) | 648 | 29,765 |
| Ross Stores, Inc. | 5,460 | 454,272 |
| RTL Group SA (Belgium) | 283 | 15,142 |
| ServiceMaster Global Holdings, Inc. † | 1,317 | 48,387 |
| Sony Corp. (Japan) | 3,100 | 149,286 |
| Suzuki Motor Corp. (Japan) | 400 | 20,240 |
| Tapestry, Inc. | 820 | 27,675 |
| Taylor Wimpey PLC (United Kingdom) | 34,490 | 59,897 |
| Total System Services, Inc. | 1,869 | 151,931 |
| Toyota Motor Corp. (Japan) | 1,700 | 98,737 |
| TUI AG (Germany) | 5,570 | 79,905 |
| Twenty-First Century Fox, Inc. | 6,350 | 303,403 |
| Volkswagen AG (Preference) (Germany) | 220 | 35,017 |
| Volvo AB (Sweden) | 10,205 | 133,507 |
| Wolters Kluwer NV (Netherlands) | 1,462 | 86,535 |
| Wyndham Destinations, Inc. | 1,923 | 68,920 |
| | | 8,178,225 |
| Consumer staples (5.5%) | | |
| Ashtead Group PLC (United Kingdom) | 4,258 | 88,844 |
| Associated British Foods PLC (United Kingdom) | 2,381 | 62,001 |
| Carlsberg A/S Class B (Denmark) | 614 | 65,258 |
| Coca-Cola Amatil, Ltd. (Australia) | 2,856 | 16,474 |
| Coca-Cola Co. (The) | 21,809 | 1,032,656 |
| Coca-Cola European Partners PLC (United Kingdom) | 2,652 | 121,594 |
| Coles Group, Ltd. (Australia) † | 751 | 6,210 |
| Colruyt SA (Belgium) | 497 | 35,442 |
| Darden Restaurants, Inc. | 2,381 | 237,767 |
| Hershey Co. (The) | 2,154 | 230,866 |
| Imperial Brands PLC (United Kingdom) | 4,675 | 141,640 |
| J Sainsbury PLC (United Kingdom) | 10,930 | 36,918 |
| Koninklijke Ahold Delhaize NV (Netherlands) | 5,611 | 141,916 |
| L’Oreal SA (France) | 546 | 125,867 |
| Marine Harvest ASA (Norway) | 1,303 | 27,532 |
| Molson Coors Brewing Co. Class B | 3,278 | 184,092 |
| Mondelez International, Inc. Class A | 11,995 | 480,160 |
| Nestle SA (Switzerland) | 1,413 | 114,719 |
| PepsiCo, Inc. | 8,353 | 922,839 |
| Pigeon Corp. (Japan) | 200 | 8,636 |
| Pola Orbis Holdings, Inc. (Japan) | 800 | 21,432 |
| Procter & Gamble Co. (The) | 4,253 | 390,936 |
| Reckitt Benckiser Group PLC (United Kingdom) | 1,088 | 83,386 |
| Starbucks Corp. | 17,213 | 1,108,517 |
| | |
| COMMON STOCKS (56.1%)*cont. | Shares | Value |
| Consumer staplescont. | | |
| Swedish Match AB (Sweden) | 1,064 | $41,910 |
| Sysco Corp. | 5,999 | 375,897 |
| Unilever PLC (United Kingdom) | 405 | 21,209 |
| Walgreens Boots Alliance, Inc. | 9,406 | 642,712 |
| Wesfarmers, Ltd. (Australia) | 751 | 17,055 |
| WH Group, Ltd. (Hong Kong) | 15,500 | 11,819 |
| | | 6,796,304 |
| Electronics (1.6%) | | |
| Agilent Technologies, Inc. | 5,073 | 342,225 |
| Brother Industries, Ltd. (Japan) | 800 | 11,743 |
| Hoya Corp. (Japan) | 2,200 | 134,469 |
| Intel Corp. | 11,153 | 523,410 |
| NXP Semiconductors NV | 6,691 | 490,316 |
| Rockwell Automation, Inc. | 1,442 | 216,992 |
| Texas Instruments, Inc. | 2,599 | 245,606 |
| | | 1,964,761 |
| Energy (2.9%) | | |
| BP PLC (United Kingdom) | 11,319 | 71,552 |
| Chevron Corp. | 11,315 | 1,230,959 |
| ConocoPhillips | 11,332 | 706,550 |
| Equinor ASA (Norway) | 5,890 | 125,171 |
| Exxon Mobil Corp. | 1,310 | 89,329 |
| Halcon Resources Corp. † | 899 | 1,528 |
| JX Holdings, Inc. (Japan) | 1,500 | 7,862 |
| MWO Holdings, LLC (Units)F | 15 | 507 |
| Nine Point EnergyF | 107 | 1,545 |
| OMV AG (Austria) | 1,051 | 46,060 |
| PBF Energy, Inc. Class A | 3,555 | 116,142 |
| Phillips 66 | 4,583 | 394,825 |
| Royal Dutch Shell PLC Class B (United Kingdom) | 3,666 | 109,341 |
| TOTAL SA (France) | 4,176 | 220,955 |
| Valero Energy Corp. | 5,457 | 409,111 |
| | | 3,531,437 |
| Financials (9.9%) | | |
| 3i Group PLC (United Kingdom) | 6,658 | 65,633 |
| ABN AMRO Group NV GDR (Netherlands) | 4,712 | 110,891 |
| Aegon NV (Netherlands) | 1,655 | 7,735 |
| Aflac, Inc. | 5,419 | 246,890 |
| AGNC Investment Corp.R | 9,938 | 174,313 |
| Allianz SE (Germany) | 970 | 194,647 |
| Allstate Corp. (The) | 1,973 | 163,029 |
| American Financial Group, Inc. | 600 | 54,318 |
| American Homes 4 RentR | 3,427 | 68,026 |
| Ameriprise Financial, Inc. | 2,200 | 229,614 |
| Annaly Capital Management, Inc.R | 12,434 | 122,102 |
| Apartment Investment & Management Co. Class AR | 1,611 | 70,691 |
| Apple Hospitality REIT, Inc.R | 2,769 | 39,486 |
| Athene Holding, Ltd. Class A † | 2,097 | 83,524 |
| AvalonBay Communities, Inc.R | 864 | 150,379 |
| Aviva PLC (United Kingdom) | 22,428 | 107,343 |
| Bank Leumi Le-Israel BM (Israel) | 5,263 | 31,810 |
| Berkshire Hathaway, Inc. Class B † | 358 | 73,096 |
| Brixmor Property Group, Inc.R | 6,019 | 88,419 |
| Broadridge Financial Solutions, Inc. | 1,936 | 186,340 |
| Brookfield Property REIT, Inc. Class AR | 1,709 | 27,515 |
| Capital One Financial Corp. | 4,113 | 310,902 |
| CBRE Group, Inc. Class A † | 2,893 | 115,836 |
| Cheung Kong Property Holdings, Ltd. (Hong Kong) | 17,500 | 127,256 |
| |
| Putnam VT Global Asset Allocation Fund7 |
| | |
| COMMON STOCKS (56.1%)*cont. | Shares | Value |
| Financialscont. | | |
| Citigroup, Inc. | 21,015 | $1,094,041 |
| Citizens Financial Group, Inc. | 8,429 | 250,594 |
| Comerica, Inc. | 3,075 | 211,222 |
| Daiwa Securities Group, Inc. (Japan) | 1,700 | 8,668 |
| Deutsche Boerse AG (Germany) | 279 | 33,549 |
| Discover Financial Services | 3,788 | 223,416 |
| DNB ASA (Norway) | 865 | 13,821 |
| Douglas Emmett, Inc.R | 1,217 | 41,536 |
| Duke Realty Corp.R | 3,727 | 96,529 |
| E*Trade Financial Corp. | 6,828 | 299,613 |
| East West Bancorp, Inc. | 1,332 | 57,982 |
| Equity Lifestyle Properties, Inc.R | 569 | 55,267 |
| Gaming and Leisure Properties, Inc.R | 1,859 | 60,064 |
| Goldman Sachs Group, Inc. (The) | 1,309 | 218,668 |
| Hang Seng Bank, Ltd. (Hong Kong) | 4,800 | 107,210 |
| Hartford Financial Services Group, Inc. (The) | 4,904 | 217,983 |
| Healthcare Trust of America, Inc. Class AR | 2,924 | 74,006 |
| Henderson Land Development Co., Ltd. (Hong Kong) | 9,000 | 44,616 |
| Highwoods Properties, Inc.R | 1,282 | 49,601 |
| HSBC Holdings PLC (United Kingdom) | 2,429 | 20,028 |
| Hudson Pacific Properties, Inc.R | 1,436 | 41,730 |
| Jones Lang LaSalle, Inc. | 531 | 67,225 |
| JPMorgan Chase & Co. | 16,804 | 1,640,406 |
| KBC Groep NV (Belgium) | 394 | 25,587 |
| Kerry Properties, Ltd. (Hong Kong) | 2,500 | 8,494 |
| Legal & General Group PLC (United Kingdom) | 43,507 | 128,099 |
| Liberty Property TrustR | 1,416 | 59,302 |
| Lincoln National Corp. | 3,142 | 161,216 |
| Lloyds Banking Group PLC (United Kingdom) | 143,183 | 94,627 |
| London Stock Exchange Group PLC (United Kingdom) | 574 | 29,718 |
| Macquarie Group, Ltd. (Australia) | 1,726 | 132,074 |
| Medical Properties Trust, Inc.R | 4,502 | 72,392 |
| MetLife, Inc. | 12,562 | 515,796 |
| Mirvac Group (Australia)R | 16,721 | 26,381 |
| Mitsubishi UFJ Lease & Finance Co., Ltd. (Japan) | 3,900 | 18,687 |
| Mizuho Financial Group, Inc. (Japan) | 89,400 | 139,336 |
| Morgan Stanley | 12,336 | 489,122 |
| New Residential Investment Corp.R | 7,738 | 109,957 |
| ORIX Corp. (Japan) | 8,600 | 124,955 |
| Paramount Group, Inc.R | 2,630 | 33,033 |
| Partners Group Holding AG (Switzerland) | 200 | 121,274 |
| Persimmon PLC (United Kingdom) | 4,365 | 107,378 |
| Popular, Inc. (Puerto Rico) | 1,154 | 54,492 |
| Principal Financial Group, Inc. | 2,047 | 90,416 |
| Prudential Financial, Inc. | 3,859 | 314,701 |
| Reinsurance Group of America, Inc. | 508 | 71,237 |
| Resona Holdings, Inc. (Japan) | 24,600 | 117,675 |
| Scentre Group (Australia)R | 21,278 | 58,445 |
| Schroders PLC (United Kingdom) | 1,082 | 33,692 |
| Senior Housing Properties TrustR | 2,296 | 26,909 |
| SL Green Realty Corp.R | 1,477 | 116,801 |
| Spirit Realty Capital, Inc.R | 2,313 | 81,533 |
| Stockland (Units) (Australia)R | 17,181 | 42,624 |
| STORE Capital Corp.R | 3,159 | 89,431 |
| Sumitomo Mitsui Financial Group, Inc. (Japan) | 4,300 | 141,800 |
| Sumitomo Mitsui Trust Holdings, Inc. (Japan) | 1,100 | 40,039 |
| | |
| COMMON STOCKS (56.1%)*cont. | Shares | Value |
| Financialscont. | | |
| Sun Hung Kai Properties, Ltd. (Hong Kong) | 3,500 | $49,626 |
| Swedbank AB Class A (Sweden) | 5,485 | 122,381 |
| Swire Properties, Ltd. (Hong Kong) | 2,800 | 9,784 |
| Synchrony Financial | 9,429 | 221,204 |
| Synovus Financial Corp. | 2,755 | 88,132 |
| TCF Financial Corp. | 1,975 | 38,493 |
| Unum Group | 3,660 | 107,531 |
| VICI Properties, Inc.R | 5,994 | 112,567 |
| Weingarten Realty InvestorsR | 1,319 | 32,724 |
| Wintrust Financial Corp. | 571 | 37,966 |
| | | 12,275,201 |
| Health care (7.8%) | | |
| AbbVie, Inc. | 3,536 | 325,984 |
| Advanz Pharma Corp. (Canada) † | 52 | 977 |
| Alfresa Holdings Corp. (Japan) | 1,800 | 46,568 |
| Allergan PLC | 1,006 | 134,462 |
| Amgen, Inc. | 4,236 | 824,622 |
| Astellas Pharma, Inc. (Japan) | 9,000 | 114,535 |
| Baxter International, Inc. | 4,626 | 304,483 |
| Bayer AG (Germany) | 386 | 26,783 |
| Biogen, Inc. † | 715 | 215,158 |
| Bristol-Myers Squibb Co. | 3,503 | 182,086 |
| Celgene Corp. † | 1,669 | 106,966 |
| Centene Corp. † | 2,178 | 251,123 |
| Charles River Laboratories International, Inc. † | 438 | 49,573 |
| Cigna Corp. | 2,400 | 455,808 |
| Eli Lilly & Co. | 5,750 | 665,390 |
| Encompass Health Corp. | 952 | 58,738 |
| Gilead Sciences, Inc. | 4,269 | 267,026 |
| GlaxoSmithKline PLC (United Kingdom) | 10,825 | 205,749 |
| HCA Healthcare, Inc. | 3,206 | 398,987 |
| Hill-Rom Holdings, Inc. | 793 | 70,220 |
| Humana, Inc. | 546 | 156,418 |
| Ipsen SA (France) | 71 | 9,180 |
| Johnson & Johnson | 6,039 | 779,333 |
| Koninklijke Philips NV (Netherlands) | 830 | 29,414 |
| Masimo Corp. † | 840 | 90,191 |
| McKesson Corp. | 2,703 | 298,600 |
| Medipal Holdings Corp. (Japan) | 1,500 | 32,448 |
| Medtronic PLC | 8,462 | 769,704 |
| Merck & Co., Inc. | 8,939 | 683,029 |
| Novartis AG (Switzerland) | 1,948 | 166,558 |
| Novo Nordisk A/S Class B (Denmark) | 1,369 | 62,583 |
| Pfizer, Inc. | 10,170 | 443,921 |
| ResMed, Inc. | 1,192 | 135,733 |
| Roche Holding AG (Switzerland) | 1,084 | 268,436 |
| Sanofi (France) | 1,155 | 100,124 |
| Sartorius Stedim Biotech (France) | 312 | 31,225 |
| Shionogi & Co., Ltd. (Japan) | 2,100 | 119,078 |
| Shire PLC (United Kingdom) | 260 | 15,145 |
| Siemens Healthineers AG (Germany) † | 640 | 26,798 |
| Straumann Holding AG (Switzerland) | 50 | 31,438 |
| UCB SA (Belgium) | 783 | 63,965 |
| UnitedHealth Group, Inc. | 1,204 | 299,940 |
| Vertex Pharmaceuticals, Inc. † | 925 | 153,282 |
| Waters Corp. † | 256 | 48,294 |
| Zoetis, Inc. | 1,317 | 112,656 |
| | | 9,632,731 |
| |
| 8Putnam VT Global Asset Allocation Fund |
| | |
| COMMON STOCKS (56.1%)*cont. | Shares | Value |
| Semiconductor (0.2%) | | |
| KLA-Tencor Corp. | 3,014 | $269,723 |
| | | 269,723 |
| Software (3.1%) | | |
| Adobe, Inc. † | 3,671 | 830,527 |
| Black Knight, Inc. † | 1,372 | 61,822 |
| Cadence Design Systems, Inc. † | 3,336 | 145,049 |
| Electronic Arts, Inc. † | 1,869 | 147,483 |
| F5 Networks, Inc. † | 1,396 | 226,194 |
| Intuit, Inc. | 2,697 | 530,904 |
| Microsoft Corp. | 9,773 | 992,644 |
| NTT Data Corp. (Japan) | 7,500 | 81,941 |
| Oracle Corp. | 18,907 | 853,651 |
| | | 3,870,215 |
| Technology (—%) | | |
| SoftBank Group Corp. (Japan) | 700 | 46,140 |
| | | 46,140 |
| Technology services (3.8%) | | |
| Alphabet, Inc. Class A † | 2,281 | 2,383,554 |
| Capgemini SE (France) | 602 | 59,870 |
| Cognizant Technology Solutions Corp. Class A | 4,818 | 305,847 |
| Dun & Bradstreet Corp. (The) | 909 | 129,751 |
| Facebook, Inc. Class A † | 4,644 | 608,782 |
| IBM Corp. | 9,386 | 1,066,907 |
| Zebra Technologies Corp. Class A † | 712 | 113,372 |
| | | 4,668,083 |
| Transportation (1.2%) | | |
| Aena SME SA (Spain) | 612 | 95,188 |
| Central Japan Railway Co. (Japan) | 700 | 148,742 |
| Delta Air Lines, Inc. | 9,514 | 474,749 |
| Deutsche Lufthansa AG (Germany) | 692 | 15,619 |
| Deutsche Post AG (Germany) | 972 | 26,628 |
| International Consolidated Airlines Group SA | | |
| (Spain) | 15,666 | 124,209 |
| Japan Airlines Co., Ltd. (Japan) | 2,300 | 81,464 |
| SG Holdings Co., Ltd. (Japan) | 1,100 | 28,849 |
| United Continental Holdings, Inc. † | 4,821 | 403,662 |
| Yangzijiang Shipbuilding Holdings, Ltd. (China) | 42,000 | 38,184 |
| | | 1,437,294 |
| Utilities and power (1.9%) | | |
| AES Corp. | 9,887 | 142,966 |
| AGL Energy, Ltd. (Australia) | 408 | 5,904 |
| Ameren Corp. | 2,555 | 166,663 |
| CenterPoint Energy, Inc. | 6,928 | 195,577 |
| CLP Holdings, Ltd. (Hong Kong) | 5,000 | 56,364 |
| Endesa SA (Spain) | 4,179 | 96,384 |
| Enel SpA (Italy) | 16,108 | 93,091 |
| Eni SpA (Italy) | 9,179 | 144,585 |
| Evergy, Inc. | 1,894 | 107,522 |
| Exelon Corp. | 9,369 | 422,542 |
| Kansai Electric Power Co., Inc. (The) (Japan) | 400 | 6,006 |
| NRG Energy, Inc. | 6,110 | 241,956 |
| OGE Energy Corp. | 2,696 | 105,656 |
| Pinnacle West Capital Corp. | 1,750 | 149,100 |
| Public Service Enterprise Group, Inc. | 5,573 | 290,075 |
| RWE AG (Germany) | 816 | 17,731 |
| Texas Competitive Electric Holdings Co., LLC/TCEH | | |
| Finance, Inc. (Rights) | 1,923 | 1,346 |
| UGI Corp. | 2,847 | 151,887 |
| | | 2,395,355 |
| | | |
| Total common stocks (cost $66,884,095) | | $69,389,181 |
| | |
| CORPORATE BONDS | | |
| AND NOTES (16.1%)* | Principal amount | Value |
| |
| Basic materials (0.9%) | | |
| Allegheny Technologies, Inc. sr. unsec. | | |
| unsub. notes 7.875%, 8/15/23 | $10,000 | $10,200 |
| Allegheny Technologies, Inc. sr. unsec. | | |
| unsub. notes 5.95%, 1/15/21 | 10,000 | 9,800 |
| ArcelorMittal SA sr. unsec. unsub. notes 7.00%, | | |
| 10/15/39 (France) | 10,000 | 10,536 |
| Beacon Escrow Corp. 144A sr. unsec. notes | | |
| 4.875%, 11/1/25 | 10,000 | 8,788 |
| Beacon Roofing Supply, Inc. company | | |
| guaranty sr. unsec. unsub. notes 6.375%, 10/1/23 | 10,000 | 9,900 |
| Big River Steel, LLC/BRS Finance Corp. 144A | | |
| company guaranty sr. notes 7.25%, 9/1/25 | 20,000 | 19,850 |
| BMC East, LLC 144A company | | |
| guaranty sr. notes 5.50%, 10/1/24 | 20,000 | 18,650 |
| Boise Cascade Co. 144A company | | |
| guaranty sr. unsec. notes 5.625%, 9/1/24 | 25,000 | 23,438 |
| Builders FirstSource, Inc. 144A company | | |
| guaranty sr. unsub. notes 5.625%, 9/1/24 | 15,000 | 13,913 |
| BWAY Holding Co. 144A sr. notes 5.50%, 4/15/24 | 15,000 | 14,100 |
| BWAY Holding Co. 144A sr. unsec. notes 7.25%, | | |
| 4/15/25 | 30,000 | 26,925 |
| Celanese US Holdings, LLC company | | |
| guaranty sr. unsec. unsub. notes 4.625%, | | |
| 11/15/22 (Germany) | 15,000 | 15,298 |
| CF Industries, Inc. company guaranty sr. unsec. | | |
| bonds 4.95%, 6/1/43 | 15,000 | 11,625 |
| CF Industries, Inc. 144A company | | |
| guaranty sr. notes 4.50%, 12/1/26 | 38,000 | 37,138 |
| Chemours Co. (The) company guaranty sr. unsec. | | |
| notes 5.375%, 5/15/27 | 10,000 | 9,000 |
| Chemours Co. (The) company guaranty sr. unsec. | | |
| unsub. notes 7.00%, 5/15/25 | 10,000 | 10,075 |
| Chemours Co. (The) company guaranty sr. unsec. | | |
| unsub. notes 6.625%, 5/15/23 | 5,000 | 5,050 |
| Compass Minerals International, Inc. 144A company | | |
| guaranty sr. unsec. notes 4.875%, 7/15/24 | 25,000 | 22,500 |
| Cornerstone Chemical Co. 144A company | | |
| guaranty sr. notes 6.75%, 8/15/24 | 5,000 | 4,388 |
| CPG Merger Sub, LLC 144A company | | |
| guaranty sr. unsec. notes 8.00%, 10/1/21 | 7,000 | 6,790 |
| Dow Chemical Co. (The) 144A sr. unsec. | | |
| notes 4.80%, 11/30/28 | 5,000 | 5,087 |
| Flex Acquisition Co., Inc. 144A sr. unsec. | | |
| notes 6.875%, 1/15/25 | 10,000 | 8,900 |
| Freeport-McMoRan, Inc. company | | |
| guaranty sr. unsec. notes 6.875%, 2/15/23 | | |
| (Indonesia) | 20,000 | 20,625 |
| Freeport-McMoRan, Inc. company | | |
| guaranty sr. unsec. unsub. notes 5.45%, 3/15/43 | | |
| (Indonesia) | 5,000 | 3,806 |
| GCP Applied Technologies, Inc. 144A sr. unsec. | | |
| notes 5.50%, 4/15/26 | 30,000 | 29,250 |
| Glencore Funding, LLC 144A company | | |
| guaranty sr. unsec. unsub. notes 4.625%, 4/29/24 | 19,000 | 18,834 |
| Glencore Funding, LLC 144A company | | |
| guaranty sr. unsec. unsub. notes 4.00%, 4/16/25 | 43,000 | 40,480 |
| HudBay Minerals, Inc. 144A company | | |
| guaranty sr. unsec. notes 7.625%, 1/15/25 | | |
| (Canada) | 10,000 | 9,775 |
| Huntsman International, LLC company | | |
| guaranty sr. unsec. unsub. notes 4.875%, 11/15/20 | 20,000 | 20,050 |
| |
| Putnam VT Global Asset Allocation Fund9 |
| | |
| CORPORATE BONDS | | |
| AND NOTES (16.1%)*cont. | Principal amount | Value |
| Basic materialscont. | | |
| Ingevity Corp. 144A sr. unsec. notes 4.50%, 2/1/26 | $15,000 | $13,575 |
| International Flavors & Fragrances, Inc. | | |
| sr. unsec. notes 4.45%, 9/26/28 | 27,000 | 27,398 |
| International Paper Co. sr. unsec. | | |
| unsub. notes 3.00%, 2/15/27 | 30,000 | 27,308 |
| Joseph T Ryerson & Son, Inc. 144A | | |
| sr. notes 11.00%, 5/15/22 | 10,000 | 10,075 |
| Kraton Polymers, LLC/Kraton Polymers | | |
| Capital Corp. 144A company guaranty sr. unsec. | | |
| notes 7.00%, 4/15/25 | 10,000 | 9,200 |
| Louisiana-Pacific Corp. company | | |
| guaranty sr. unsec. unsub. notes 4.875%, 9/15/24 | 10,000 | 9,650 |
| Mercer International, Inc. company | | |
| guaranty sr. unsec. notes 7.75%, 12/1/22 | | |
| (Canada) | 4,000 | 4,120 |
| Mercer International, Inc. sr. unsec. | | |
| notes 6.50%, 2/1/24 (Canada) | 10,000 | 9,775 |
| Mercer International, Inc. sr. unsec. | | |
| notes 5.50%, 1/15/26 (Canada) | 5,000 | 4,475 |
| Methanex Corp. sr. unsec. unsub. notes 3.25%, | | |
| 12/15/19 (Canada) | 6,000 | 5,956 |
| New Gold, Inc. 144A company guaranty sr. unsec. | | |
| unsub. notes 6.25%, 11/15/22 (Canada) | 5,000 | 4,188 |
| Novelis Corp. 144A company guaranty sr. unsec. | | |
| bonds 5.875%, 9/30/26 | 25,000 | 22,125 |
| Novelis Corp. 144A company guaranty sr. unsec. | | |
| notes 6.25%, 8/15/24 | 10,000 | 9,400 |
| Nutrien, Ltd. sr. unsec. bonds 5.25%, 1/15/45 | | |
| (Canada) | 20,000 | 20,047 |
| Nutrien, Ltd. sr. unsec. bonds 4.125%, 3/15/35 | | |
| (Canada) | 25,000 | 22,759 |
| Packaging Corp. of America sr. unsec. | | |
| unsub. notes 4.50%, 11/1/23 | 45,000 | 46,034 |
| Pisces Midco, Inc. 144A sr. notes 8.00%, 4/15/26 | 15,000 | 13,650 |
| Platform Specialty Products Corp. 144A sr. unsec. | | |
| notes 6.50%, 2/1/22 | 5,000 | 5,000 |
| PQ Corp. 144A company guaranty sr. unsec. | | |
| notes 5.75%, 12/15/25 | 15,000 | 13,894 |
| Sherwin-Williams Co. (The) sr. unsec. | | |
| unsub. bonds 3.45%, 6/1/27 | 35,000 | 32,626 |
| Sherwin-Williams Co. (The) sr. unsec. | | |
| unsub. notes 2.75%, 6/1/22 | 15,000 | 14,520 |
| Smurfit Kappa Treasury Funding DAC company | | |
| guaranty sr. unsec. unsub. notes 7.50%, 11/20/25 | | |
| (Ireland) | 15,000 | 17,438 |
| Steel Dynamics, Inc. company guaranty sr. unsec. | | |
| notes 5.00%, 12/15/26 | 5,000 | 4,738 |
| Steel Dynamics, Inc. company guaranty sr. unsec. | | |
| notes 4.125%, 9/15/25 | 5,000 | 4,594 |
| Steel Dynamics, Inc. company guaranty sr. unsec. | | |
| unsub. notes 5.50%, 10/1/24 | 20,000 | 19,800 |
| Steel Dynamics, Inc. company guaranty sr. unsec. | | |
| unsub. notes 5.25%, 4/15/23 | 3,000 | 2,959 |
| Teck Resources, Ltd. company guaranty sr. unsec. | | |
| unsub. notes 3.75%, 2/1/23 (Canada) | 5,000 | 4,763 |
| Teck Resources, Ltd. 144A company | | |
| guaranty sr. unsec. notes 8.50%, 6/1/24 (Canada) | 5,000 | 5,413 |
| TMS International Corp. 144A sr. unsec. | | |
| notes 7.25%, 8/15/25 | 15,000 | 14,025 |
| TopBuild Corp. 144A company guaranty sr. unsec. | | |
| notes 5.625%, 5/1/26 | 15,000 | 13,725 |
| | |
| CORPORATE BONDS | | |
| AND NOTES (16.1%)*cont. | Principal amount | Value |
| |
| Basic materialscont. | | |
| Tronox Finance PLC 144A company | | |
| guaranty sr. unsec. notes 5.75%, 10/1/25 | | |
| (United Kingdom) | $5,000 | $4,050 |
| U.S. Concrete, Inc. company guaranty sr. unsec. | | |
| unsub. notes 6.375%, 6/1/24 | 18,000 | 16,560 |
| Univar USA, Inc. 144A company guaranty sr. unsec. | | |
| notes 6.75%, 7/15/23 | 10,000 | 9,900 |
| USG Corp. 144A company guaranty sr. unsec. | | |
| bonds 4.875%, 6/1/27 | 20,000 | 20,150 |
| USG Corp. 144A company guaranty sr. unsec. | | |
| notes 5.50%, 3/1/25 | 10,000 | 10,075 |
| Vodafone Group PLC 144A sr. unsec. notes 7.875%, | | |
| 7/15/26 | 10,000 | 9,000 |
| Westlake Chemical Corp. company | | |
| guaranty sr. unsec. unsub. bonds 4.375%, | | |
| 11/15/47 | 53,000 | 44,414 |
| Westlake Chemical Corp. company | | |
| guaranty sr. unsec. unsub. notes 3.60%, 8/15/26 | 22,000 | 20,171 |
| WestRock MWV, LLC company guaranty sr. unsec. | | |
| unsub. notes 8.20%, 1/15/30 | 30,000 | 38,088 |
| WestRock MWV, LLC company guaranty sr. unsec. | | |
| unsub. notes 7.95%, 2/15/31 | 10,000 | 12,770 |
| Weyerhaeuser Co. sr. unsec. unsub. notes 7.375%, | | |
| 3/15/32R | 34,000 | 41,576 |
| WR Grace & Co.- Conn. 144A company | | |
| guaranty sr. unsec. notes 5.625%, 10/1/24 | 10,000 | 9,950 |
| Zekelman Industries, Inc. 144A company | | |
| guaranty sr. notes 9.875%, 6/15/23 | 15,000 | 15,788 |
| | | 1,110,493 |
| Capital goods (0.7%) | | |
| Allison Transmission, Inc. 144A company | | |
| guaranty sr. unsec. notes 4.75%, 10/1/27 | 20,000 | 17,800 |
| American Axle & Manufacturing, Inc. company | | |
| guaranty sr. unsec. notes 7.75%, 11/15/19 | 9,000 | 9,158 |
| ATS Automation Tooling Systems, Inc. 144A | | |
| sr. unsec. notes 6.50%, 6/15/23 (Canada) | 10,000 | 10,238 |
| Berry Global, Inc. company guaranty notes 5.50%, | | |
| 5/15/22 | 10,000 | 9,950 |
| Berry Global, Inc. company | | |
| guaranty unsub. notes 5.125%, 7/15/23 | 10,000 | 9,891 |
| Berry Global, Inc. 144A notes 4.50%, 2/15/26 | 5,000 | 4,575 |
| Bombardier, Inc. 144A sr. unsec. notes 8.75%, | | |
| 12/1/21 (Canada) | 5,000 | 5,138 |
| Bombardier, Inc. 144A sr. unsec. notes 7.50%, | | |
| 12/1/24 (Canada) | 25,000 | 23,563 |
| Briggs & Stratton Corp. company | | |
| guaranty sr. unsec. notes 6.875%, 12/15/20 | 45,000 | 45,731 |
| Covanta Holding Corp. sr. unsec. notes 6.00%, | | |
| 1/1/27 | 5,000 | 4,475 |
| Crown Americas, LLC/Crown Americas Capital Corp. | | |
| VI 144A company guaranty sr. unsec. notes 4.75%, | | |
| 2/1/26 | 5,000 | 4,713 |
| Crown Cork & Seal Co., Inc. company | | |
| guaranty sr. unsec. bonds 7.375%, 12/15/26 | 10,000 | 10,650 |
| Gates Global, LLC/Gates Global Co. 144A company | | |
| guaranty sr. unsec. notes 6.00%, 7/15/22 | 14,000 | 13,598 |
| General Dynamics Corp. company | | |
| guaranty sr. unsec. unsub. notes 2.25%, 11/15/22 | 30,000 | 28,906 |
| GFL Environmental, Inc. 144A sr. unsec. | | |
| notes 5.375%, 3/1/23 (Canada) | 5,000 | 4,400 |
| Great Lakes Dredge & Dock Corp. company | | |
| guaranty sr. unsec. notes 8.00%, 5/15/22 | 20,000 | 20,325 |
| |
| 10Putnam VT Global Asset Allocation Fund |
| | |
| CORPORATE BONDS | | |
| AND NOTES (16.1%)*cont. | Principal amount | Value |
| Capital goodscont. | | |
| Honeywell International, Inc. sr. unsec. | | |
| bonds 3.812%, 11/21/47 | $55,000 | $52,211 |
| Hulk Finance Corp. 144A sr. unsec. notes 7.00%, | | |
| 6/1/26 (Canada) | 20,000 | 17,400 |
| Johnson Controls International PLC sr. unsec. | | |
| bonds 4.95%, 7/2/64 | 65,000 | 60,413 |
| Johnson Controls International PLC sr. unsec. | | |
| unsub. bonds 4.50%, 2/15/47 | 14,000 | 12,953 |
| L3 Technologies, Inc. company guaranty sr. unsec. | | |
| bonds 3.85%, 12/15/26 | 35,000 | 33,882 |
| L3 Technologies, Inc. company guaranty sr. unsec. | | |
| notes 4.40%, 6/15/28 | 21,000 | 20,995 |
| MasTec, Inc. company guaranty sr. unsec. | | |
| unsub. notes 4.875%, 3/15/23 | 10,000 | 9,700 |
| Northrop Grumman Corp. sr. unsec. | | |
| unsub. notes 3.25%, 1/15/28 | 60,000 | 55,980 |
| Oshkosh Corp. company guaranty sr. unsec. | | |
| sub. notes 5.375%, 3/1/25 | 25,000 | 24,938 |
| Oshkosh Corp. sr. unsec. sub. notes 4.60%, 5/15/28 | 21,000 | 20,659 |
| Park-Ohio Industries, Inc. company | | |
| guaranty sr. unsec. notes 6.625%, 4/15/27 | 10,000 | 9,500 |
| Raytheon Co. sr. unsec. notes 4.875%, 10/15/40 | 20,000 | 22,339 |
| Raytheon Co. sr. unsec. unsub. notes 2.50%, | | |
| 12/15/22 | 50,000 | 48,725 |
| RBS Global, Inc./Rexnord, LLC 144A sr. unsec. | | |
| notes 4.875%, 12/15/25 | 20,000 | 18,150 |
| Republic Services, Inc. sr. unsec. notes 3.95%, | | |
| 5/15/28 | 50,000 | 50,032 |
| Resideo Funding, Inc. 144A company | | |
| guaranty sr. unsec. notes 6.125%, 11/1/26 | 10,000 | 9,850 |
| Stevens Holding Co, Inc. 144A company | | |
| guaranty sr. unsec. notes 6.125%, 10/1/26 | 20,000 | 19,700 |
| Tennant Co. company guaranty sr. unsec. | | |
| unsub. notes 5.625%, 5/1/25 | 10,000 | 9,425 |
| Titan Acquisition, Ltd./Titan Co-Borrower, LLC | | |
| 144A sr. unsec. notes 7.75%, 4/15/26 (Canada) | 15,000 | 12,825 |
| TransDigm, Inc. company guaranty sr. unsec. | | |
| sub. notes 6.50%, 5/15/25 | 5,000 | 4,775 |
| TransDigm, Inc. company guaranty sr. unsec. | | |
| sub. notes 6.375%, 6/15/26 | 20,000 | 18,600 |
| TransDigm, Inc. company guaranty sr. unsec. | | |
| unsub. notes 6.50%, 7/15/24 | 8,000 | 7,780 |
| Trident Merger Sub, Inc. 144A sr. unsec. | | |
| notes 6.625%, 11/1/25 | 10,000 | 8,900 |
| United Technologies Corp. sr. unsec. | | |
| unsub. notes 1.90%, 5/4/20 | 105,000 | 103,040 |
| Vertiv Group Corp. 144A sr. unsec. notes 9.25%, | | |
| 10/15/24 | 10,000 | 9,200 |
| Vertiv Intermediate Holding Corp. 144A sr. unsec. | | |
| notes 12.00%, 2/15/22 ‡‡ | 5,000 | 4,600 |
| Wabash National Corp. 144A company | | |
| guaranty sr. unsec. notes 5.50%, 10/1/25 | 20,000 | 17,125 |
| Waste Management, Inc. company | | |
| guaranty sr. unsec. unsub. notes 4.75%, 6/30/20 | 12,000 | 12,280 |
| | | 919,088 |
| Communication services (1.4%) | | |
| American Tower Corp. sr. unsec. bonds 3.125%, | | |
| 1/15/27R | 11,000 | 9,958 |
| American Tower Corp. sr. unsec. | | |
| unsub. bonds 3.55%, 7/15/27R | 100,000 | 93,811 |
| AT&T, Inc. sr. unsec. notes 4.10%, 2/15/28 | 160,000 | 153,852 |
| AT&T, Inc. sr. unsec. unsub. notes 4.75%, 5/15/46 | 77,000 | 68,368 |
| | |
| CORPORATE BONDS | | |
| AND NOTES (16.1%)*cont. | Principal amount | Value |
| Communication servicescont. | | |
| Cablevision Systems Corp. sr. unsec. | | |
| unsub. notes 8.00%, 4/15/20 | $7,000 | $7,088 |
| CCO Holdings, LLC/CCO Holdings Capital Corp. 144A | | |
| company guaranty sr. unsec. bonds 5.50%, 5/1/26 | 15,000 | 14,419 |
| CCO Holdings, LLC/CCO Holdings Capital Corp. 144A | | |
| company guaranty sr. unsec. notes 5.875%, 4/1/24 | 25,000 | 24,875 |
| CCO Holdings, LLC/CCO Holdings Capital Corp. 144A | | |
| sr. unsec. notes 5.75%, 2/15/26 | 30,000 | 29,400 |
| CCO Holdings, LLC/CCO Holdings Capital Corp. 144A | | |
| sr. unsec. unsub. notes 5.125%, 5/1/23 | 5,000 | 4,863 |
| Charter Communications Operating, LLC/Charter | | |
| Communications Operating Capital Corp. company | | |
| guaranty sr. sub. bonds 6.484%, 10/23/45 | 5,000 | 5,140 |
| Charter Communications Operating, LLC/Charter | | |
| Communications Operating Capital Corp. company | | |
| guaranty sr. sub. notes 4.908%, 7/23/25 | 4,000 | 3,977 |
| Charter Communications Operating, LLC/Charter | | |
| Communications Operating Capital Corp. company | | |
| guaranty sr. sub. bonds 5.375%, 5/1/47 | 31,000 | 28,091 |
| Comcast Corp. company guaranty sr. unsec. | | |
| unsub. bonds 3.969%, 11/1/47 | 92,000 | 82,234 |
| Comcast Corp. company guaranty sr. unsec. | | |
| unsub. notes 6.50%, 11/15/35 | 17,000 | 20,127 |
| CommScope Technologies Finance, LLC 144A | | |
| sr. unsec. notes 6.00%, 6/15/25 | 25,000 | 22,750 |
| CommScope Technologies, LLC 144A company | | |
| guaranty sr. unsec. unsub. notes 5.00%, 3/15/27 | 10,000 | 8,100 |
| Cox Communications, Inc. 144A sr. unsec. | | |
| bonds 3.50%, 8/15/27 | 25,000 | 23,049 |
| Crown Castle International Corp. sr. unsec. | | |
| bonds 3.80%, 2/15/28R | 25,000 | 23,657 |
| Crown Castle International Corp. sr. unsec. | | |
| bonds 3.65%, 9/1/27R | 34,000 | 31,519 |
| Crown Castle International Corp. sr. unsec. | | |
| notes 4.875%, 4/15/22R | 7,000 | 7,203 |
| Crown Castle International Corp. sr. unsec. | | |
| notes 3.15%, 7/15/23R | 25,000 | 24,032 |
| Crown Castle International Corp. sr. unsec. | | |
| unsub. bonds 3.70%, 6/15/26R | 35,000 | 33,113 |
| CSC Holdings, LLC sr. unsec. unsub. bonds 5.25%, | | |
| 6/1/24 | 63,000 | 57,724 |
| CSC Holdings, LLC sr. unsec. unsub. notes 6.75%, | | |
| 11/15/21 | 43,000 | 44,290 |
| Deutsche Telekom International Finance BV company | | |
| guaranty sr. unsec. unsub. bonds 8.75%, 6/15/30 | | |
| (Netherlands) | 73,000 | 95,212 |
| DISH DBS Corp. company guaranty sr. unsec. | | |
| unsub. notes 5.875%, 11/15/24 | 35,000 | 28,175 |
| Equinix, Inc. sr. unsec. notes 5.375%, 5/15/27R | 20,000 | 19,550 |
| Equinix, Inc. sr. unsec. unsub. notes 5.875%, | | |
| 1/15/26R | 5,000 | 5,038 |
| Frontier Communications Corp. sr. unsec. | | |
| notes 11.00%, 9/15/25 | 10,000 | 6,225 |
| Frontier Communications Corp. sr. unsec. | | |
| notes 10.50%, 9/15/22 | 15,000 | 10,425 |
| Frontier Communications Corp. 144A company | | |
| guaranty notes 8.50%, 4/1/26 | 15,000 | 13,125 |
| Intelsat Connect Finance SA 144A company | | |
| guaranty sr. unsec. notes 9.50%, 2/15/23 | | |
| (Luxembourg) | 25,000 | 21,500 |
| Intelsat Jackson Holdings SA 144A sr. unsec. | | |
| notes 9.75%, 7/15/25 (Bermuda) | 25,000 | 25,063 |
| |
| Putnam VT Global Asset Allocation Fund11 |
| | |
| CORPORATE BONDS | | |
| AND NOTES (16.1%)*cont. | Principal amount | Value |
| Communication servicescont. | | |
| Koninklijke KPN NV sr. unsec. | | |
| unsub. bonds 8.375%, 10/1/30 (Netherlands) | $30,000 | $38,835 |
| NBCUniversal Media, LLC company | | |
| guaranty sr. unsec. unsub. notes 5.15%, 4/30/20 | 100,000 | 102,662 |
| Quebecor Media, Inc. sr. unsec. | | |
| unsub. notes 5.75%, 1/15/23 (Canada) | 3,000 | 3,015 |
| Rogers Communications, Inc. company | | |
| guaranty sr. unsec. unsub. notes 4.50%, 3/15/43 | | |
| (Canada) | 85,000 | 83,876 |
| Sprint Capital Corp. company guaranty sr. unsec. | | |
| unsub. notes 6.875%, 11/15/28 | 45,000 | 42,525 |
| Sprint Communications, Inc. sr. unsec. | | |
| notes 7.00%, 8/15/20 | 5,000 | 5,113 |
| Sprint Corp. company guaranty sr. unsec. | | |
| sub. notes 7.875%, 9/15/23 | 48,000 | 49,260 |
| Sprint Corp. company guaranty sr. unsec. | | |
| sub. notes 7.25%, 9/15/21 | 17,000 | 17,400 |
| T-Mobile USA, Inc. company guaranty sr. unsec. | | |
| notes 6.375%, 3/1/25 | 10,000 | 10,100 |
| T-Mobile USA, Inc. company guaranty sr. unsec. | | |
| notes 6.00%, 3/1/23 | 5,000 | 5,024 |
| T-Mobile USA, Inc. company guaranty sr. unsec. | | |
| notes 5.375%, 4/15/27 | 25,000 | 24,125 |
| T-Mobile USA, Inc. company guaranty sr. unsec. | | |
| notes 4.00%, 4/15/22 | 5,000 | 4,875 |
| T-Mobile USA, Inc. company guaranty sr. unsec. | | |
| unsub. bonds 4.75%, 2/1/28 | 15,000 | 13,575 |
| T-Mobile USA, Inc. company guaranty sr. unsec. | | |
| unsub. notes 4.50%, 2/1/26 | 5,000 | 4,588 |
| TCI Communications, Inc. sr. unsec. | | |
| unsub. notes 7.125%, 2/15/28 | 65,000 | 79,566 |
| Verizon Communications, Inc. sr. unsec. | | |
| unsub. notes 4.40%, 11/1/34 | 65,000 | 62,646 |
| Verizon Communications, Inc. sr. unsec. | | |
| unsub. notes 4.329%, 9/21/28 | 90,000 | 90,370 |
| Videotron, Ltd. company guaranty sr. unsec. | | |
| unsub. notes 5.00%, 7/15/22 (Canada) | 20,000 | 20,000 |
| Videotron, Ltd./Videotron Ltee. 144A sr. unsec. | | |
| notes 5.125%, 4/15/27 (Canada) | 25,000 | 23,625 |
| Vodafone Group PLC sr. unsec. | | |
| unsub. notes 4.375%, 5/30/28 (United Kingdom) | 17,000 | 16,491 |
| | | 1,743,624 |
| Consumer cyclicals (2.1%) | | |
| 21st Century Fox America, Inc. company | | |
| guaranty sr. unsec. unsub. notes 7.75%, 12/1/45 | 150,000 | 220,230 |
| Alimentation Couche-Tard, Inc. 144A company | | |
| guaranty sr. unsec. notes 3.55%, 7/26/27 | | |
| (Canada) | 20,000 | 18,633 |
| Amazon.com, Inc. sr. unsec. notes 3.15%, 8/22/27 | 90,000 | 86,893 |
| Amazon.com, Inc. sr. unsec. unsub. notes 3.30%, | | |
| 12/5/21 | 75,000 | 75,918 |
| AMC Entertainment Holdings, Inc. company | | |
| guaranty sr. unsec. notes 6.125%, 5/15/27 | 15,000 | 12,825 |
| AMC Entertainment Holdings, Inc. company | | |
| guaranty sr. unsec. sub. notes 5.875%, 11/15/26 | 10,000 | 8,575 |
| AMC Entertainment Holdings, Inc. company | | |
| guaranty sr. unsec. sub. notes 5.75%, 6/15/25 | 10,000 | 8,800 |
| American Builders & Contractors Supply Co., Inc. | | |
| 144A company guaranty sr. unsec. notes 5.875%, | | |
| 5/15/26 | 5,000 | 4,738 |
| American Builders & Contractors Supply Co., Inc. | | |
| 144A sr. unsec. notes 5.75%, 12/15/23 | 10,000 | 9,900 |
| | |
| CORPORATE BONDS | | |
| AND NOTES (16.1%)*cont. | Principal amount | Value |
| Consumer cyclicalscont. | | |
| Autonation, Inc. company guaranty sr. unsec. | | |
| unsub. notes 5.50%, 2/1/20 | $64,000 | $65,334 |
| BMW US Capital, LLC 144A company | | |
| guaranty sr. unsec. notes 3.95%, 8/14/28 | 35,000 | 34,126 |
| BMW US Capital, LLC 144A company | | |
| guaranty sr. unsec. notes 3.40%, 8/13/21 | 10,000 | 9,959 |
| BMW US Capital, LLC 144A company | | |
| guaranty sr. unsec. notes 2.80%, 4/11/26 | 16,000 | 14,667 |
| BMW US Capital, LLC 144A company | | |
| guaranty sr. unsec. notes 2.00%, 4/11/21 | 40,000 | 38,796 |
| Boyd Gaming Corp. company guaranty sr. unsec. | | |
| notes 6.00%, 8/15/26 | 5,000 | 4,675 |
| Boyd Gaming Corp. company guaranty sr. unsec. | | |
| sub. notes 6.875%, 5/15/23 | 10,000 | 10,100 |
| Boyd Gaming Corp. company guaranty sr. unsec. | | |
| unsub. notes 6.375%, 4/1/26 | 10,000 | 9,675 |
| Brookfield Residential | | |
| Properties, Inc./Brookfield Residential US Corp. | | |
| 144A company guaranty sr. unsec. notes 6.125%, | | |
| 7/1/22 (Canada) | 5,000 | 4,738 |
| Carriage Services, Inc. 144A sr. unsec. | | |
| notes 6.625%, 6/1/26 | 10,000 | 9,800 |
| CBS Corp. company guaranty sr. unsec. | | |
| unsub. bonds 2.90%, 1/15/27 | 22,000 | 19,507 |
| CBS Corp. company guaranty sr. unsec. | | |
| unsub. notes 4.60%, 1/15/45 | 24,000 | 21,319 |
| CBS Corp. company guaranty sr. unsec. | | |
| unsub. notes 4.00%, 1/15/26 | 12,000 | 11,626 |
| CBS Radio, Inc. 144A company guaranty sr. unsec. | | |
| notes 7.25%, 11/1/24 | 30,000 | 27,900 |
| Cinemark USA, Inc. company guaranty sr. unsec. | | |
| sub. notes 4.875%, 6/1/23 | 19,000 | 18,240 |
| Clear Channel Worldwide Holdings, Inc. company | | |
| guaranty sr. unsec. unsub. notes 6.50%, 11/15/22 | 29,000 | 29,000 |
| Constellation Merger Sub, Inc. 144A sr. unsec. | | |
| notes 8.50%, 9/15/25 | 30,000 | 26,925 |
| CRC Escrow Issuer, LLC/CRC Finco, Inc. 144A | | |
| company guaranty sr. unsec. notes 5.25%, | | |
| 10/15/25 | 20,000 | 17,200 |
| Diamond Resorts International, Inc. 144A | | |
| sr. notes 7.75%, 9/1/23 | 10,000 | 9,600 |
| Dollar General Corp. sr. unsec. sub. notes 3.25%, | | |
| 4/15/23 | 65,000 | 63,510 |
| Ecolab, Inc. sr. unsec. notes 4.35%, 12/8/21 | 40,000 | 41,096 |
| Ecolab, Inc. sr. unsec. unsub. notes 3.25%, | | |
| 12/1/27 | 70,000 | 67,567 |
| Eldorado Resorts, Inc. company | | |
| guaranty sr. unsec. unsub. notes 7.00%, 8/1/23 | 5,000 | 5,138 |
| Ford Motor Co. sr. unsec. unsub. notes 4.346%, | | |
| 12/8/26 | 59,000 | 52,558 |
| Gartner, Inc. 144A company guaranty sr. unsec. | | |
| notes 5.125%, 4/1/25 | 10,000 | 9,706 |
| General Motors Financial Co., Inc. company | | |
| guaranty sr. unsec. notes 4.00%, 10/6/26 | 76,000 | 68,234 |
| General Motors Financial Co., Inc. company | | |
| guaranty sr. unsec. unsub. notes 4.30%, 7/13/25 | 22,000 | 20,848 |
| General Motors Financial Co., Inc. company | | |
| guaranty sr. unsec. unsub. notes 4.00%, 1/15/25 | 10,000 | 9,354 |
| Gray Escrow, Inc. 144A sr. unsec. notes 7.00%, | | |
| 5/15/27 | 20,000 | 19,463 |
| Gray Television, Inc. 144A company | | |
| guaranty sr. unsec. notes 5.875%, 7/15/26 | 10,000 | 9,323 |
| |
| 12Putnam VT Global Asset Allocation Fund |
| | |
| CORPORATE BONDS | | |
| AND NOTES (16.1%)*cont. | Principal amount | Value |
| Consumer cyclicalscont. | | |
| Hanesbrands, Inc. 144A company | | |
| guaranty sr. unsec. unsub. notes 4.625%, 5/15/24 | $10,000 | $9,375 |
| Hilton Worldwide Finance, LLC/Hilton Worldwide | | |
| Finance Corp. company guaranty sr. unsec. | | |
| notes 4.875%, 4/1/27 | 75,000 | 70,313 |
| Howard Hughes Corp. (The) 144A sr. unsec. | | |
| notes 5.375%, 3/15/25 | 25,000 | 23,500 |
| Hyatt Hotels Corp. sr. unsec. unsub. notes 4.85%, | | |
| 3/15/26 | 55,000 | 56,319 |
| iHeartCommunications, Inc. company | | |
| guaranty sr. notes 9.00%, | | |
| 12/15/19 (In default) † | 20,000 | 13,400 |
| IHS Markit, Ltd. sr. unsec. sub. bonds 4.75%, | | |
| 8/1/28 (United Kingdom) | 5,000 | 4,881 |
| IHS Markit, Ltd. 144A company | | |
| guaranty notes 4.75%, 2/15/25 (United Kingdom) | 50,000 | 49,376 |
| IHS Markit, Ltd. 144A company guaranty sr. unsec. | | |
| notes 4.00%, 3/1/26 (United Kingdom) | 5,000 | 4,688 |
| Interpublic Group of Cos., Inc. (The) sr. unsec. | | |
| sub. bonds 4.65%, 10/1/28 | 80,000 | 78,956 |
| Iron Mountain, Inc. 144A company | | |
| guaranty sr. unsec. bonds 5.25%, 3/15/28R | 5,000 | 4,413 |
| Iron Mountain, Inc. 144A company | | |
| guaranty sr. unsec. notes 4.875%, 9/15/27R | 20,000 | 17,400 |
| Jack Ohio Finance, LLC/Jack Ohio Finance 1 Corp. | | |
| 144A company guaranty notes 10.25%, 11/15/22 | 25,000 | 26,500 |
| Jack Ohio Finance, LLC/Jack Ohio Finance 1 Corp. | | |
| 144A company guaranty sr. notes 6.75%, 11/15/21 | 20,000 | 20,200 |
| Jacobs Entertainment, Inc. 144A notes 7.875%, | | |
| 2/1/24 | 5,000 | 5,150 |
| Jeld-Wen, Inc. 144A company guaranty sr. unsec. | | |
| notes 4.875%, 12/15/27 | 10,000 | 8,450 |
| Jeld-Wen, Inc. 144A company guaranty sr. unsec. | | |
| notes 4.625%, 12/15/25 | 10,000 | 8,750 |
| Lear Corp. sr. unsec. unsub. bonds 3.80%, 9/15/27 | 51,000 | 46,587 |
| Lennar Corp. company guaranty sr. unsec. | | |
| sub. notes 5.875%, 11/15/24 | 5,000 | 5,000 |
| Lions Gate Capital Holdings, LLC 144A company | | |
| guaranty sr. unsec. notes 5.875%, 11/1/24 | 15,000 | 14,813 |
| Live Nation Entertainment, Inc. 144A company | | |
| guaranty sr. unsec. notes 4.875%, 11/1/24 | 5,000 | 4,750 |
| Live Nation Entertainment, Inc. 144A company | | |
| guaranty sr. unsec. sub. notes 5.625%, 3/15/26 | 15,000 | 14,663 |
| Mattamy Group Corp. 144A sr. unsec. notes 6.875%, | | |
| 12/15/23 (Canada) | 10,000 | 9,338 |
| Mattamy Group Corp. 144A sr. unsec. notes 6.50%, | | |
| 10/1/25 (Canada) | 5,000 | 4,544 |
| Meredith Corp. 144A sr. unsec. notes 6.875%, | | |
| 2/1/26 | 20,000 | 19,550 |
| MGM Resorts International company | | |
| guaranty sr. unsec. notes 6.75%, 10/1/20 | 35,000 | 35,963 |
| MGM Resorts International company | | |
| guaranty sr. unsec. unsub. notes 8.625%, 2/1/19 | 10,000 | 10,013 |
| MGM Resorts International company | | |
| guaranty sr. unsec. unsub. notes 6.625%, | | |
| 12/15/21 | 15,000 | 15,356 |
| Navistar International Corp. 144A sr. unsec. | | |
| notes 6.625%, 11/1/25 | 25,000 | 24,125 |
| Neiman Marcus Group, LLC (The) company | | |
| guaranty sr. notes 7.125%, 6/1/28 | 5,000 | 3,450 |
| | |
| CORPORATE BONDS | | |
| AND NOTES (16.1%)*cont. | Principal amount | Value |
| |
| Consumer cyclicalscont. | | |
| Neiman Marcus Group, Ltd. 144A company | | |
| guaranty sr. unsec. sub. notes 8.75%, | | |
| 10/15/21 ‡‡ | $10,972 | $4,608 |
| Neiman Marcus Group, Ltd. 144A company | | |
| guaranty sr. unsec. sub. notes 8.00%, 10/15/21 | 10,000 | 4,125 |
| Nexstar Broadcasting, Inc. 144A company | | |
| guaranty sr. unsec. notes 5.625%, 8/1/24 | 30,000 | 28,050 |
| Nielsen Co. Luxembourg SARL (The) 144A company | | |
| guaranty sr. unsec. notes 5.00%, 2/1/25 | | |
| (Luxembourg) | 5,000 | 4,675 |
| Nielsen Finance, LLC/Nielsen Finance Co. 144A | | |
| company guaranty sr. unsec. sub. notes 5.00%, | | |
| 4/15/22 | 20,000 | 19,100 |
| Omnicom Group, Inc. company guaranty sr. unsec. | | |
| unsub. notes 3.60%, 4/15/26 | 76,000 | 72,737 |
| Outfront Media Capital, LLC/Outfront Media | | |
| Capital Corp. company guaranty sr. unsec. | | |
| sub. notes 5.875%, 3/15/25 | 15,000 | 14,738 |
| Penn National Gaming, Inc. 144A sr. unsec. | | |
| notes 5.625%, 1/15/27 | 10,000 | 8,950 |
| Penske Automotive Group, Inc. company | | |
| guaranty sr. unsec. sub. notes 5.75%, 10/1/22 | 14,000 | 13,965 |
| Penske Automotive Group, Inc. company | | |
| guaranty sr. unsec. sub. notes 5.50%, 5/15/26 | 15,000 | 13,950 |
| Penske Automotive Group, Inc. company | | |
| guaranty sr. unsec. sub. notes 5.375%, 12/1/24 | 10,000 | 9,363 |
| PetSmart, Inc. 144A sr. unsec. notes 7.125%, | | |
| 3/15/23 | 5,000 | 2,913 |
| PulteGroup, Inc. company guaranty sr. unsec. | | |
| unsub. notes 7.875%, 6/15/32 | 20,000 | 20,700 |
| PulteGroup, Inc. company guaranty sr. unsec. | | |
| unsub. notes 5.50%, 3/1/26 | 25,000 | 24,063 |
| Refinitiv US Holdings, Inc. 144A company | | |
| guaranty sr. notes 6.25%, 5/15/26 | 10,000 | 9,650 |
| Rivers Pittsburgh Borrower LP/Rivers Pittsburgh | | |
| Finance Corp. 144A sr. notes 6.125%, 8/15/21 | 20,000 | 19,400 |
| S&P Global, Inc. company guaranty sr. unsec. | | |
| unsub. notes 2.95%, 1/22/27 | 22,000 | 20,695 |
| Sabre GLBL, Inc. 144A company | | |
| guaranty sr. notes 5.375%, 4/15/23 | 15,000 | 14,925 |
| Scientific Games International, Inc. company | | |
| guaranty sr. unsec. notes 10.00%, 12/1/22 | 50,000 | 50,750 |
| Sinclair Television Group, Inc. 144A company | | |
| guaranty sr. unsec. sub. notes 5.625%, 8/1/24 | 20,000 | 18,750 |
| Sirius XM Radio, Inc. 144A company | | |
| guaranty sr. unsec. sub. notes 6.00%, 7/15/24 | 10,000 | 10,025 |
| Sirius XM Radio, Inc. 144A sr. unsec. | | |
| bonds 5.00%, 8/1/27 | 70,000 | 63,963 |
| Six Flags Entertainment Corp. 144A company | | |
| guaranty sr. unsec. bonds 5.50%, 4/15/27 | 20,000 | 18,850 |
| Six Flags Entertainment Corp. 144A company | | |
| guaranty sr. unsec. unsub. notes 4.875%, 7/31/24 | 25,000 | 23,563 |
| Spectrum Brands, Inc. company guaranty sr. unsec. | | |
| notes 5.75%, 7/15/25 | 10,000 | 9,497 |
| Spectrum Brands, Inc. company guaranty sr. unsec. | | |
| unsub. notes 6.125%, 12/15/24 | 10,000 | 9,625 |
| Standard Industries, Inc. 144A sr. unsec. | | |
| notes 5.375%, 11/15/24 | 25,000 | 23,469 |
| Standard Industries, Inc. 144A sr. unsec. | | |
| notes 5.00%, 2/15/27 | 35,000 | 30,625 |
| |
| Putnam VT Global Asset Allocation Fund13 |
| | |
| CORPORATE BONDS | | |
| AND NOTES (16.1%)*cont. | Principal amount | Value |
| Consumer cyclicalscont. | | |
| SugarHouse HSP Gaming Prop. Mezz LP/SugarHouse | | |
| HSP Gaming Finance Corp. 144A company | | |
| guaranty sr. unsub. notes 5.875%, 5/15/25 | $10,000 | $9,350 |
| Townsquare Media, Inc. 144A company | | |
| guaranty sr. unsec. notes 6.50%, 4/1/23 | 5,000 | 4,600 |
| TRI Pointe Group, Inc./TRI Pointe Homes, Inc. | | |
| company guaranty sr. unsec. unsub. notes 5.875%, | | |
| 6/15/24 | 10,000 | 8,925 |
| Tribune Media Co. company guaranty sr. unsec. | | |
| notes 5.875%, 7/15/22 | 10,000 | 10,050 |
| Univision Communications, Inc. 144A company | | |
| guaranty sr. sub. notes 5.125%, 2/15/25 | 15,000 | 13,163 |
| Viacom, Inc. sr. unsec. unsub. notes 4.50%, 3/1/21 | 70,000 | 71,027 |
| Walt Disney Co. (The) sr. unsec. notes 2.75%, | | |
| 8/16/21 | 30,000 | 29,704 |
| Warner Media, LLC company guaranty sr. unsec. | | |
| unsub. bonds 2.95%, 7/15/26 | 41,000 | 36,655 |
| Weekley Homes, LLC/Weekley Finance Corp. | | |
| sr. unsec. notes 6.00%, 2/1/23 | 10,000 | 9,350 |
| Werner FinCo LP/Werner FinCo, Inc. 144A company | | |
| guaranty sr. unsec. notes 8.75%, 7/15/25 | 20,000 | 17,850 |
| WMG Acquisition Corp. 144A company | | |
| guaranty sr. notes 5.00%, 8/1/23 | 10,000 | 9,725 |
| WMG Acquisition Corp. 144A company | | |
| guaranty sr. unsec. notes 5.50%, 4/15/26 | 5,000 | 4,775 |
| Wolverine World Wide, Inc. 144A company | | |
| guaranty sr. unsec. bonds 5.00%, 9/1/26 | 10,000 | 9,250 |
| Wyndham Hotels & Resorts, Inc. 144A company | | |
| guaranty sr. unsec. notes 5.375%, 4/15/26 | 10,000 | 9,600 |
| Wynn Las Vegas, LLC/Wynn Las Vegas Capital Corp. | | |
| 144A company guaranty sr. unsec. | | |
| sub. notes 5.25%, 5/15/27 | 25,000 | 22,000 |
| | | 2,638,067 |
| Consumer staples (0.7%) | | |
| 1011778 BC ULC/New Red Finance, Inc. 144A company | | |
| guaranty notes 5.00%, 10/15/25 (Canada) | 15,000 | 13,650 |
| 1011778 BC ULC/New Red Finance, Inc. 144A company | | |
| guaranty sr. notes 4.625%, 1/15/22 (Canada) | 5,000 | 4,825 |
| 1011778 BC ULC/New Red Finance, Inc. 144A company | | |
| guaranty sr. sub. notes 4.25%, 5/15/24 (Canada) | 15,000 | 13,800 |
| Altria Group, Inc. company guaranty sr. unsec. | | |
| notes 9.25%, 8/6/19 | 2,000 | 2,067 |
| Anheuser-Busch Cos., LLC/Anheuser-Busch InBev | | |
| Worldwide, Inc. 144A company guaranty sr. unsec. | | |
| unsub. notes 3.65%, 2/1/26 | 35,000 | 33,094 |
| Anheuser-Busch InBev Worldwide, Inc. company | | |
| guaranty sr. unsec. unsub. notes 2.50%, 7/15/22 | 60,000 | 57,287 |
| Ascend Learning, LLC 144A sr. unsec. | | |
| notes 6.875%, 8/1/25 | 15,000 | 14,363 |
| Brand Energy & Infrastructure Services, Inc. 144A | | |
| sr. unsec. notes 8.50%, 7/15/25 | 20,000 | 17,050 |
| CEC Entertainment, Inc. company | | |
| guaranty sr. unsec. sub. notes 8.00%, 2/15/22 | 20,000 | 17,500 |
| CVS Pass-Through Trust sr. notes 6.036%, 12/10/28 | 3,063 | 3,269 |
| CVS Pass-Through Trust 144A sr. mtge. | | |
| notes 4.704%, 1/10/36 | 42,824 | 42,214 |
| Dean Foods Co. 144A company guaranty sr. unsec. | | |
| notes 6.50%, 3/15/23 | 20,000 | 16,100 |
| Diageo Investment Corp. company | | |
| guaranty sr. unsec. notes 8.00%, 9/15/22 | 40,000 | 46,254 |
| ERAC USA Finance, LLC 144A company | | |
| guaranty sr. unsec. notes 7.00%, 10/15/37 | 50,000 | 62,164 |
| | |
| CORPORATE BONDS | | |
| AND NOTES (16.1%)*cont. | Principal amount | Value |
| Consumer staplescont. | | |
| ERAC USA Finance, LLC 144A company | | |
| guaranty sr. unsec. notes 5.625%, 3/15/42 | $60,000 | $65,597 |
| Fresh Market, Inc. (The) 144A company | | |
| guaranty sr. notes 9.75%, 5/1/23 | 10,000 | 7,200 |
| Golden Nugget, Inc. 144A company | | |
| guaranty sr. unsec. sub. notes 8.75%, 10/1/25 | 15,000 | 14,400 |
| Golden Nugget, Inc. 144A sr. unsec. notes 6.75%, | | |
| 10/15/24 | 15,000 | 14,138 |
| Itron, Inc. 144A company guaranty sr. unsec. | | |
| notes 5.00%, 1/15/26 | 20,000 | 18,300 |
| KFC Holding Co./Pizza Hut Holdings, LLC/Taco Bell | | |
| of America, LLC 144A company guaranty sr. unsec. | | |
| notes 5.25%, 6/1/26 | 15,000 | 14,513 |
| KFC Holding Co./Pizza Hut Holdings, LLC/Taco Bell | | |
| of America, LLC 144A company guaranty sr. unsec. | | |
| notes 5.00%, 6/1/24 | 15,000 | 14,475 |
| KFC Holding Co./Pizza Hut Holdings, LLC/Taco Bell | | |
| of America, LLC 144A company guaranty sr. unsec. | | |
| notes 4.75%, 6/1/27 | 10,000 | 9,300 |
| Kraft Heinz Co. (The) company guaranty sr. unsec. | | |
| bonds 4.375%, 6/1/46 | 70,000 | 57,668 |
| Kraft Heinz Co. (The) company guaranty sr. unsec. | | |
| FRN (BBA LIBOR USD 3 Month + 0.82%), 3.438%, | | |
| 8/10/22 | 10,000 | 9,756 |
| Lamb Weston Holdings, Inc. 144A company | | |
| guaranty sr. unsec. unsub. notes 4.875%, 11/1/26 | 37,000 | 35,520 |
| Lamb Weston Holdings, Inc. 144A company | | |
| guaranty sr. unsec. unsub. notes 4.625%, 11/1/24 | 5,000 | 4,863 |
| Maple Escrow Subsidiary, Inc. 144A company | | |
| guaranty sr. unsec. notes 4.597%, 5/25/28 | 76,000 | 75,060 |
| Match Group, Inc. 144A sr. unsec. bonds 5.00%, | | |
| 12/15/27 | 15,000 | 13,763 |
| Netflix, Inc. sr. unsec. notes 4.875%, 4/15/28 | 10,000 | 9,125 |
| Netflix, Inc. 144A sr. unsec. bonds 6.375%, | | |
| 5/15/29 | 5,000 | 4,931 |
| Netflix, Inc. 144A sr. unsec. | | |
| unsub. bonds 5.875%, 11/15/28 | 5,000 | 4,859 |
| Newell Brands, Inc. sr. unsec. | | |
| unsub. notes 4.20%, 4/1/26 | 36,000 | 35,183 |
| Rite Aid Corp. 144A company guaranty sr. unsec. | | |
| unsub. notes 6.125%, 4/1/23 | 15,000 | 11,850 |
| Walgreens Boots Alliance, Inc. sr. unsec. | | |
| unsub. notes 3.30%, 11/18/21 | 60,000 | 59,649 |
| | | 823,787 |
| Energy (1.9%) | | |
| Alta Mesa Holdings LP/Alta Mesa Finance | | |
| Services Corp. company guaranty sr. unsec. | | |
| notes 7.875%, 12/15/24 | 35,000 | 21,700 |
| Anadarko Petroleum Corp. sr. unsec. | | |
| unsub. bonds 6.95%, 6/15/19 | 30,000 | 30,418 |
| Antero Resources Corp. company | | |
| guaranty sr. unsec. notes 5.625%, 6/1/23 | 5,000 | 4,750 |
| Antero Resources Corp. company | | |
| guaranty sr. unsec. sub. notes 5.375%, 11/1/21 | 13,000 | 12,545 |
| Antero Resources Corp. company | | |
| guaranty sr. unsec. sub. notes 5.125%, 12/1/22 | 8,000 | 7,520 |
| Apache Corp. sr. unsec. unsub. notes 3.25%, | | |
| 4/15/22 | 35,000 | 34,280 |
| Apergy Corp. company guaranty sr. unsec. | | |
| notes 6.375%, 5/1/26 | 15,000 | 14,550 |
| |
| 14Putnam VT Global Asset Allocation Fund |
| | |
| CORPORATE BONDS | | |
| AND NOTES (16.1%)*cont. | Principal amount | Value |
| Energycont. | | |
| Ascent Resources Utica Holdings, LLC/ARU | | |
| Finance Corp. 144A sr. unsec. notes 10.00%, | | |
| 4/1/22 | $6,000 | $6,137 |
| Ascent Resources Utica Holdings, LLC/ARU | | |
| Finance Corp. 144A sr. unsec. notes 7.00%, | | |
| 11/1/26 | 5,000 | 4,525 |
| Baytex Energy Corp. 144A company | | |
| guaranty sr. unsec. sub. notes 5.625%, 6/1/24 | | |
| (Canada) | 5,000 | 4,325 |
| BP Capital Markets America, Inc. company | | |
| guaranty sr. unsec. notes 3.119%, 5/4/26 | 70,000 | 65,823 |
| BP Capital Markets PLC company | | |
| guaranty sr. unsec. unsub. notes 3.279%, 9/19/27 | | |
| (United Kingdom) | 35,000 | 33,313 |
| BP Capital Markets PLC company | | |
| guaranty sr. unsec. unsub. notes 2.161%, 9/19/19 | | |
| (United Kingdom) | 20,000 | 19,822 |
| California Resources Corp. company | | |
| guaranty sr. unsec. sub. notes 5.00%, 1/15/20 | 10,000 | 8,800 |
| California Resources Corp. 144A company | | |
| guaranty notes 8.00%, 12/15/22 | 11,000 | 7,453 |
| Cheniere Corpus Christi Holdings, LLC company | | |
| guaranty sr. notes 5.875%, 3/31/25 | 25,000 | 24,875 |
| Cheniere Corpus Christi Holdings, LLC company | | |
| guaranty sr. notes 5.125%, 6/30/27 | 40,000 | 37,762 |
| Chesapeake Energy Corp. company | | |
| guaranty sr. unsec. notes 8.00%, 6/15/27 | 5,000 | 4,200 |
| Chesapeake Energy Corp. company | | |
| guaranty sr. unsec. notes 8.00%, 1/15/25 | 50,000 | 44,125 |
| Chevron Corp. sr. unsec. unsub. notes 1.561%, | | |
| 5/16/19 | 54,000 | 53,708 |
| Comstock Escrow Corp. 144A sr. unsec. | | |
| notes 9.75%, 8/15/26 | 15,000 | 12,675 |
| Concho Resources, Inc. company | | |
| guaranty sr. unsec. notes 3.75%, 10/1/27 | 44,000 | 41,420 |
| Continental Resources, Inc. company | | |
| guaranty sr. unsec. bonds 4.90%, 6/1/44 | 10,000 | 8,851 |
| Continental Resources, Inc. company | | |
| guaranty sr. unsec. notes 3.80%, 6/1/24 | 10,000 | 9,467 |
| Covey Park Energy, LLC/Covey Park Finance Corp. | | |
| 144A company guaranty sr. unsec. notes 7.50%, | | |
| 5/15/25 | 20,000 | 17,200 |
| CrownRock LP/CrownRock Finance, Inc. 144A | | |
| sr. unsec. notes 5.625%, 10/15/25 | 15,000 | 13,500 |
| DCP Midstream Operating LP company | | |
| guaranty sr. unsec. unsub. notes 5.375%, 7/15/25 | 5,000 | 4,888 |
| DCP Midstream Operating LP 144A company | | |
| guaranty sr. unsec. unsub. bonds 6.75%, 9/15/37 | 5,000 | 4,925 |
| Denbury Resources, Inc. company | | |
| guaranty sr. unsec. sub. notes 6.375%, 8/15/21 | 10,000 | 7,275 |
| Denbury Resources, Inc. 144A company | | |
| guaranty notes 9.00%, 5/15/21 | 12,000 | 11,160 |
| Denbury Resources, Inc. 144A notes 7.50%, 2/15/24 | 10,000 | 8,050 |
| Diamondback Energy, Inc. company | | |
| guaranty sr. unsec. unsub. notes 5.375%, 5/31/25 | 20,000 | 19,500 |
| Diamondback Energy, Inc. company | | |
| guaranty sr. unsec. unsub. notes 4.75%, 11/1/24 | 5,000 | 4,825 |
| Endeavor Energy Resources LP/EER Finance, Inc. | | |
| 144A sr. unsec. bonds 5.75%, 1/30/28 | 20,000 | 20,400 |
| Endeavor Energy Resources LP/EER Finance, Inc. | | |
| 144A sr. unsec. notes 5.50%, 1/30/26 | 5,000 | 5,088 |
| | |
| CORPORATE BONDS | | |
| AND NOTES (16.1%)*cont. | Principal amount | Value |
| Energycont. | | |
| Energy Transfer Partners LP jr. unsec. sub. FRB | | |
| Ser. B, 6.625%, perpetual maturity | $96,000 | $79,200 |
| Energy Transfer Partners LP sr. unsec. | | |
| unsub. bonds 6.125%, 12/15/45 | 8,000 | 7,824 |
| Energy Transfer Partners LP sr. unsec. | | |
| unsub. notes 6.50%, 2/1/42 | 13,000 | 13,068 |
| Energy Transfer Partners LP sr. unsec. | | |
| unsub. notes 5.20%, 2/1/22 | 25,000 | 25,575 |
| Ensco PLC sr. unsec. notes 7.75%, 2/1/26 | | |
| (United Kingdom) | 10,000 | 7,400 |
| EOG Resources, Inc. sr. unsec. | | |
| unsub. notes 2.625%, 3/15/23 | 50,000 | 48,035 |
| EP Energy, LLC/Everest Acquisition Finance, Inc. | | |
| company guaranty sr. unsec. sub. notes 9.375%, | | |
| 5/1/20 | 5,000 | 3,750 |
| EP Energy, LLC/Everest Acquisition Finance, Inc. | | |
| 144A company guaranty notes 9.375%, 5/1/24 | 12,000 | 5,340 |
| EP Energy, LLC/Everest Acquisition Finance, Inc. | | |
| 144A company guaranty notes 8.00%, 2/15/25 | 10,000 | 4,125 |
| EP Energy, LLC/Everest Acquisition Finance, Inc. | | |
| 144A company guaranty sr. notes 8.00%, 11/29/24 | 10,000 | 7,450 |
| EP Energy, LLC/Everest Acquisition Finance, Inc. | | |
| 144A company guaranty sr. notes 7.75%, 5/15/26 | 10,000 | 8,850 |
| EQT Corp. sr. unsec. unsub. notes 3.90%, 10/1/27 | 21,000 | 18,104 |
| Equinor ASA company guaranty sr. unsec. | | |
| notes 5.10%, 8/17/40 (Norway) | 40,000 | 44,031 |
| Exxon Mobil Corp. sr. unsec. unsub. notes 2.222%, | | |
| 3/1/21 | 115,000 | 113,344 |
| FTS International, Inc. company | | |
| guaranty sr. notes 6.25%, 5/1/22 | 5,000 | 4,425 |
| Hess Corp. sr. unsec. unsub. notes 7.30%, 8/15/31 | 30,000 | 32,461 |
| Hess Infrastructure Partners LP/Hess | | |
| Infrastructure Partners Finance Corp. 144A | | |
| sr. unsec. notes 5.625%, 2/15/26 | 20,000 | 19,350 |
| Holly Energy Partners LP/Holly Energy | | |
| Finance Corp. 144A company guaranty sr. unsec. | | |
| notes 6.00%, 8/1/24 | 25,000 | 24,250 |
| Indigo Natural Resources, LLC 144A sr. unsec. | | |
| notes 6.875%, 2/15/26 | 15,000 | 12,900 |
| Jagged Peak Energy, LLC 144A company | | |
| guaranty sr. unsec. notes 5.875%, 5/1/26 | 15,000 | 13,950 |
| Marathon Petroleum Corp. sr. unsec. | | |
| unsub. notes 6.50%, 3/1/41 | 25,000 | 26,968 |
| MEG Energy Corp. 144A company guaranty sr. unsec. | | |
| notes 6.375%, 1/30/23 (Canada) | 5,000 | 4,725 |
| MEG Energy Corp. 144A notes 6.50%, 1/15/25 | | |
| (Canada) | 20,000 | 20,300 |
| Motiva Enterprises, LLC 144A sr. unsec. | | |
| notes 5.75%, 1/15/20 | 16,000 | 16,280 |
| Nabors Industries, Inc. company | | |
| guaranty sr. unsec. notes 5.75%, 2/1/25 | 20,000 | 15,141 |
| Newfield Exploration Co. sr. unsec. | | |
| unsub. notes 5.75%, 1/30/22 | 25,000 | 25,313 |
| Newfield Exploration Co. sr. unsec. | | |
| unsub. notes 5.375%, 1/1/26 | 10,000 | 9,800 |
| Nine Energy Service, Inc. 144A sr. unsec. | | |
| notes 8.75%, 11/1/23 | 5,000 | 4,750 |
| Noble Holding International, Ltd. company | | |
| guaranty sr. unsec. unsub. notes 7.75%, 1/15/24 | 10,000 | 7,575 |
| Noble Holding International, Ltd. 144A company | | |
| guaranty sr. unsec. notes 7.875%, 2/1/26 | 5,000 | 4,263 |
| |
| Putnam VT Global Asset Allocation Fund15 |
| | |
| CORPORATE BONDS | | |
| AND NOTES (16.1%)*cont. | Principal amount | Value |
| Energycont. | | |
| Oasis Petroleum, Inc. company guaranty sr. unsec. | | |
| sub. notes 6.875%, 1/15/23 | $5,000 | $4,650 |
| Oasis Petroleum, Inc. company guaranty sr. unsec. | | |
| unsub. notes 6.875%, 3/15/22 | 19,000 | 17,908 |
| Oasis Petroleum, Inc. 144A sr. unsec. | | |
| notes 6.25%, 5/1/26 | 10,000 | 8,450 |
| Petrobras Global Finance BV company | | |
| guaranty sr. unsec. unsub. bonds 7.375%, 1/17/27 | | |
| (Brazil) | 64,000 | 65,760 |
| Petrobras Global Finance BV company | | |
| guaranty sr. unsec. unsub. bonds 7.25%, 3/17/44 | | |
| (Brazil) | 9,000 | 8,865 |
| Petrobras Global Finance BV company | | |
| guaranty sr. unsec. unsub. notes 6.25%, 3/17/24 | | |
| (Brazil) | 161,000 | 163,013 |
| Petrobras Global Finance BV company | | |
| guaranty sr. unsec. unsub. notes 6.125%, 1/17/22 | | |
| (Brazil) | 9,000 | 9,214 |
| Petrobras Global Finance BV company | | |
| guaranty sr. unsec. unsub. notes 5.999%, 1/27/28 | | |
| (Brazil) | 23,000 | 21,620 |
| Petrobras Global Finance BV company | | |
| guaranty sr. unsec. unsub. notes 5.299%, 1/27/25 | | |
| (Brazil) | 4,000 | 3,820 |
| Petroleos de Venezuela SA 144A company | | |
| guaranty sr. unsec. notes 6.00%, 11/15/26 | | |
| (Venezuela) (In default) † | 40,000 | 5,900 |
| Petroleos Mexicanos company guaranty sr. unsec. | | |
| unsub. notes 6.375%, 1/23/45 (Mexico) | 62,000 | 49,894 |
| Petroleos Mexicanos company guaranty sr. unsec. | | |
| unsub. notes 4.875%, 1/18/24 (Mexico) | 80,000 | 74,560 |
| Precision Drilling Corp. 144A company | | |
| guaranty sr. unsec. notes 7.125%, 1/15/26 | | |
| (Canada) | 10,000 | 8,600 |
| Range Resources Corp. company guaranty sr. unsec. | | |
| sub. notes 5.75%, 6/1/21 | 15,000 | 14,513 |
| Regency Energy Partners LP/Regency Energy | | |
| Finance Corp. company guaranty sr. unsec. | | |
| unsub. notes 4.50%, 11/1/23 | 9,000 | 9,003 |
| Sabine Pass Liquefaction, LLC sr. notes 5.00%, | | |
| 3/15/27 | 12,000 | 12,040 |
| SESI, LLC company guaranty sr. unsec. | | |
| notes 7.75%, 9/15/24 | 15,000 | 11,925 |
| SESI, LLC company guaranty sr. unsec. | | |
| unsub. notes 7.125%, 12/15/21 | 5,000 | 4,250 |
| Seventy Seven Energy, Inc. escrow sr. unsec. | | |
| notes 6.50%, 7/15/22F | 5,000 | 1 |
| Seventy Seven Operating, LLC escrow company | | |
| guaranty sr. unsec. unsub. notes 6.625%, | | |
| 11/15/19F | 20,000 | 2 |
| Shell International Finance BV company | | |
| guaranty sr. unsec. unsub. notes 2.875%, 5/10/26 | | |
| (Netherlands) | 70,000 | 67,141 |
| Shell International Finance BV company | | |
| guaranty sr. unsec. unsub. notes 2.125%, 5/11/20 | | |
| (Netherlands) | 110,000 | 108,888 |
| SM Energy Co. sr. unsec. notes 6.625%, 1/15/27 | 5,000 | 4,425 |
| SM Energy Co. sr. unsec. sub. notes 5.00%, 1/15/24 | 10,000 | 8,700 |
| SM Energy Co. sr. unsec. unsub. notes 6.75%, | | |
| 9/15/26 | 10,000 | 8,950 |
| SM Energy Co. sr. unsec. unsub. notes 6.125%, | | |
| 11/15/22 | 4,000 | 3,780 |
| | |
| CORPORATE BONDS | | |
| AND NOTES (16.1%)*cont. | Principal amount | Value |
| Energycont. | | |
| Spectra Energy Partners LP sr. unsec. | | |
| notes 3.375%, 10/15/26 | $38,000 | $35,545 |
| Statoil ASA company guaranty sr. unsec. | | |
| unsub. notes 2.90%, 11/8/20 (Norway) | 30,000 | 29,889 |
| Tallgrass Energy Partners LP/Tallgrass Energy | | |
| Finance Corp. 144A company guaranty sr. unsec. | | |
| bonds 5.50%, 1/15/28 | 10,000 | 9,600 |
| Targa Resources Partners LP/Targa Resources | | |
| Partners Finance Corp. company | | |
| guaranty sr. unsec. notes 5.375%, 2/1/27 | 10,000 | 9,375 |
| Targa Resources Partners LP/Targa Resources | | |
| Partners Finance Corp. company | | |
| guaranty sr. unsec. unsub. notes 5.00%, 1/15/28 | 40,000 | 36,200 |
| Total Capital International SA company | | |
| guaranty sr. unsec. unsub. notes 2.75%, 6/19/21 | | |
| (France) | 115,000 | 114,163 |
| Transcanada Trust company guaranty jr. unsec. | | |
| sub. FRB 5.30%, 3/15/77 (Canada) | 15,000 | 12,947 |
| Transocean Pontus, Ltd. 144A company | | |
| guaranty sr. notes 6.125%, 8/1/25 | | |
| (Cayman Islands) | 10,000 | 9,650 |
| Transocean, Inc. company guaranty sr. unsec. | | |
| unsub. bonds 7.50%, 4/15/31 | 5,000 | 3,788 |
| Transocean, Inc. 144A company guaranty sr. unsec. | | |
| notes 9.00%, 7/15/23 | 5,000 | 4,975 |
| Trinidad Drilling, Ltd. 144A company | | |
| guaranty sr. unsec. notes 6.625%, 2/15/25 | | |
| (Canada) | 20,000 | 20,170 |
| USA Compression Partners LP/USA Compression | | |
| Finance Corp. 144A sr. unsec. notes 6.875%, | | |
| 4/1/26 | 10,000 | 9,600 |
| Vermilion Energy, Inc. 144A company | | |
| guaranty sr. unsec. notes 5.625%, 3/15/25 | | |
| (Canada) | 5,000 | 4,688 |
| Weatherford International, Ltd. company | | |
| guaranty sr. unsec. sub. notes 9.875%, 2/15/24 | 10,000 | 6,100 |
| Weatherford International, Ltd. company | | |
| guaranty sr. unsec. unsub. notes 8.25%, 6/15/23 | 5,000 | 3,000 |
| Whiting Petroleum Corp. sr. unsec. notes 6.625%, | | |
| 1/15/26 | 10,000 | 8,575 |
| Williams Cos., Inc. (The) sr. unsec. | | |
| unsub. notes 8.75%, 3/15/32 | 5,000 | 6,505 |
| Williams Cos., Inc. (The) sr. unsec. | | |
| unsub. notes 7.75%, 6/15/31 | 1,000 | 1,208 |
| Williams Partners LP sr. unsec. sub. notes 4.30%, | | |
| 3/4/24 | 28,000 | 27,703 |
| WPX Energy, Inc. sr. unsec. notes 8.25%, 8/1/23 | 10,000 | 10,450 |
| WPX Energy, Inc. sr. unsec. notes 5.75%, 6/1/26 | 10,000 | 9,050 |
| WPX Energy, Inc. sr. unsec. unsub. notes 6.00%, | | |
| 1/15/22 | 4,000 | 3,890 |
| | | 2,331,345 |
| Financials (4.0%) | | |
| AIG Global Funding 144A sr. notes 2.15%, 7/2/20 | 30,000 | 29,555 |
| Air Lease Corp. sr. unsec. notes 2.50%, 3/1/21 | 50,000 | 48,743 |
| Air Lease Corp. sr. unsec. sub. bonds 4.625%, | | |
| 10/1/28 | 41,000 | 38,726 |
| Alliance Data Systems Corp. 144A company | | |
| guaranty sr. unsec. notes 5.375%, 8/1/22 | 15,000 | 14,625 |
| Alliant Holdings Intermediate, LLC 144A | | |
| sr. unsec. notes 8.25%, 8/1/23 | 10,000 | 9,850 |
| Ally Financial, Inc. company guaranty sr. unsec. | | |
| notes 8.00%, 11/1/31 | 29,000 | 32,190 |
| |
| 16Putnam VT Global Asset Allocation Fund |
| | |
| CORPORATE BONDS | | |
| AND NOTES (16.1%)*cont. | Principal amount | Value |
| Financialscont. | | |
| Ally Financial, Inc. company guaranty sr. unsec. | | |
| unsub. notes 8.00%, 3/15/20 | $13,000 | $13,455 |
| Ally Financial, Inc. sub. unsec. notes 5.75%, | | |
| 11/20/25 | 40,000 | 39,800 |
| American International Group, Inc. jr. unsec. | | |
| sub. FRB 8.175%, 5/15/58 | 48,000 | 54,720 |
| Bank of America Corp. jr. unsec. sub. FRN | | |
| Ser. AA, 6.10%, perpetual maturity | 46,000 | 45,540 |
| Bank of America Corp. jr. unsec. sub. FRN Ser. Z, | | |
| 6.50%, perpetual maturity | 5,000 | 5,063 |
| Bank of America Corp. unsec. sub. notes 6.11%, | | |
| 1/29/37 | 195,000 | 215,931 |
| Bank of Montreal sr. unsec. unsub. notes Ser. D, | | |
| 3.10%, 4/13/21 (Canada) | 30,000 | 29,985 |
| Bank of Montreal unsec. sub. FRN 3.803%, 12/15/32 | | |
| (Canada) | 3,000 | 2,778 |
| Berkshire Hathaway Finance Corp. company | | |
| guaranty sr. unsec. notes 4.30%, 5/15/43 | 29,000 | 29,087 |
| Berkshire Hathaway Finance Corp. company | | |
| guaranty sr. unsec. unsub. notes 4.25%, 1/15/21 | 94,000 | 96,417 |
| Camden Property Trust sr. unsec. | | |
| unsub. notes 4.875%, 6/15/23R | 65,000 | 68,121 |
| Cantor Fitzgerald LP 144A unsec. bonds 7.875%, | | |
| 10/15/19 | 30,000 | 30,883 |
| Cantor Fitzgerald LP 144A unsec. notes 6.50%, | | |
| 6/17/22 | 20,000 | 21,206 |
| CBRE Services, Inc. company guaranty sr. unsec. | | |
| notes 5.25%, 3/15/25 | 5,000 | 5,209 |
| CIT Group, Inc. sr. unsec. sub. notes 5.00%, | | |
| 8/1/23 | 10,000 | 9,800 |
| CIT Group, Inc. sr. unsec. unsub. notes 5.25%, | | |
| 3/7/25 | 13,000 | 12,708 |
| CIT Group, Inc. sr. unsec. unsub. notes 5.00%, | | |
| 8/15/22 | 2,000 | 1,973 |
| Citigroup, Inc. sr. unsec. FRB 3.668%, 7/24/28 | 35,000 | 33,042 |
| Citigroup, Inc. sr. unsec. notes 2.65%, 10/26/20 | 58,000 | 57,229 |
| Citigroup, Inc. sr. unsec. unsub. FRB 3.887%, | | |
| 1/10/28 | 235,000 | 226,754 |
| Citigroup, Inc. unsec. sub. bonds 4.75%, 5/18/46 | 10,000 | 9,245 |
| Citigroup, Inc. unsec. sub. bonds 4.45%, 9/29/27 | 46,000 | 44,335 |
| CNG Holdings, Inc. 144A sr. notes 9.375%, 5/15/20 | 20,000 | 18,700 |
| CNO Financial Group, Inc. sr. unsec. | | |
| unsub. notes 5.25%, 5/30/25 | 20,000 | 19,050 |
| Commonwealth Bank of Australia 144A sr. unsec. | | |
| notes 3.15%, 9/19/27 (Australia) | 75,000 | 70,971 |
| Commonwealth Bank of Australia 144A unsec. | | |
| notes 2.20%, 11/9/20 (Australia) | 147,000 | 144,051 |
| Cooperatieve Rabobank UA company | | |
| guaranty sr. unsec. unsub. bonds Ser. MTN, | | |
| 5.25%, 5/24/41 (Netherlands) | 40,000 | 44,061 |
| Credit Acceptance Corp. company | | |
| guaranty sr. unsec. notes 7.375%, 3/15/23 | 5,000 | 5,100 |
| Credit Acceptance Corp. company | | |
| guaranty sr. unsec. notes 6.125%, 2/15/21 | 8,000 | 7,980 |
| Digital Realty Trust LP company | | |
| guaranty sr. unsec. bonds 4.45%, 7/15/28R | 28,000 | 27,880 |
| Digital Realty Trust LP company | | |
| guaranty sr. unsec. notes 3.40%, 10/1/20R | 30,000 | 29,904 |
| ESH Hospitality, Inc. 144A company | | |
| guaranty sr. unsec. notes 5.25%, 5/1/25R | 15,000 | 13,950 |
| | |
| CORPORATE BONDS | | |
| AND NOTES (16.1%)*cont. | Principal amount | Value |
| Financialscont. | | |
| Fairfax Financial Holdings, Ltd. 144A sr. unsec. | | |
| notes 4.85%, 4/17/28 (Canada) | $65,000 | $62,457 |
| Fairfax US, Inc. 144A company guaranty sr. unsec. | | |
| notes 4.875%, 8/13/24 | 30,000 | 29,960 |
| Fifth Third Bancorp jr. unsec. sub. FRB 5.10%, | | |
| perpetual maturity | 16,000 | 13,900 |
| Five Corners Funding Trust 144A sr. unsec. | | |
| bonds 4.419%, 11/15/23 | 135,000 | 138,427 |
| Freedom Mortgage Corp. 144A sr. unsec. | | |
| notes 8.25%, 4/15/25 | 15,000 | 12,825 |
| Freedom Mortgage Corp. 144A sr. unsec. | | |
| notes 8.125%, 11/15/24 | 10,000 | 8,575 |
| GLP Capital LP/GLP Financing II, Inc. company | | |
| guaranty sr. unsec. notes 5.25%, 6/1/25 | 10,000 | 9,925 |
| GLP Capital LP/GLP Financing II, Inc. company | | |
| guaranty sr. unsec. unsub. notes 5.375%, 4/15/26 | 20,000 | 19,780 |
| goeasy, Ltd. 144A company guaranty sr. unsec. | | |
| notes 7.875%, 11/1/22 (Canada) | 5,000 | 5,063 |
| Goldman Sachs Group, Inc. (The) sr. unsec. FRB | | |
| 4.223%, 5/1/29 | 107,000 | 102,976 |
| Goldman Sachs Group, Inc. (The) sr. unsec. | | |
| unsub. notes 2.60%, 12/27/20 | 163,000 | 159,949 |
| Goldman Sachs Group, Inc. (The) sr. unsec. | | |
| unsub. notes 2.55%, 10/23/19 | 107,000 | 106,324 |
| Goldman Sachs Group, Inc. (The) unsec. | | |
| sub. notes 6.75%, 10/1/37 | 24,000 | 27,214 |
| Hartford Financial Services Group, Inc. (The) | | |
| sr. unsec. unsub. notes 5.125%, 4/15/22 | 35,000 | 36,492 |
| Hospitality Properties Trust sr. unsec. | | |
| notes 4.375%, 2/15/30R | 50,000 | 45,778 |
| Hospitality Properties Trust sr. unsec. | | |
| unsub. notes 4.50%, 3/15/25R | 3,000 | 2,922 |
| HUB International, Ltd. 144A sr. unsec. | | |
| notes 7.00%, 5/1/26 | 20,000 | 18,050 |
| Huntington Bancshares, Inc. unsec. notes 4.35%, | | |
| 2/4/23 | 40,000 | 40,306 |
| Icahn Enterprises LP/Icahn Enterprises | | |
| Finance Corp. company guaranty sr. unsec. | | |
| notes 6.75%, 2/1/24 | 10,000 | 9,900 |
| Icahn Enterprises LP/Icahn Enterprises | | |
| Finance Corp. company guaranty sr. unsec. | | |
| notes 6.25%, 2/1/22 | 10,000 | 9,875 |
| Icahn Enterprises LP/Icahn Enterprises | | |
| Finance Corp. company guaranty sr. unsec. | | |
| notes 6.00%, 8/1/20 | 10,000 | 9,988 |
| Icahn Enterprises LP/Icahn Enterprises | | |
| Finance Corp. company guaranty sr. unsec. | | |
| notes 5.875%, 2/1/22 | 17,000 | 16,660 |
| ING Bank NV 144A unsec. sub. notes 5.80%, 9/25/23 | | |
| (Netherlands) | 200,000 | 209,117 |
| International Lease Finance Corp. sr. unsec. | | |
| unsub. notes 5.875%, 8/15/22 | 14,000 | 14,438 |
| iStar, Inc. sr. unsec. notes 6.00%, 4/1/22R | 5,000 | 4,838 |
| iStar, Inc. sr. unsec. unsub. notes 5.25%, | | |
| 9/15/22R | 5,000 | 4,675 |
| JPMorgan Chase & Co. jr. unsec. bonds 6.10%, | | |
| perpetual maturity | 21,000 | 20,869 |
| JPMorgan Chase & Co. jr. unsec. sub. FRB Ser. Z, | | |
| 5.30%, perpetual maturity | 80,000 | 79,001 |
| JPMorgan Chase & Co. sr. unsec. unsub. FRB | | |
| 3.964%, 11/15/48 | 300,000 | 265,549 |
| |
| Putnam VT Global Asset Allocation Fund17 |
| | |
| CORPORATE BONDS | | |
| AND NOTES (16.1%)*cont. | Principal amount | Value |
| Financialscont. | | |
| KKR Group Finance Co. III, LLC 144A company | | |
| guaranty sr. unsec. unsub. bonds 5.125%, 6/1/44 | $30,000 | $29,550 |
| Liberty Mutual Group, Inc. 144A company | | |
| guaranty jr. unsec. sub. bonds 7.80%, 3/15/37 | 26,000 | 28,340 |
| LPL Holdings, Inc. 144A company | | |
| guaranty sr. unsec. notes 5.75%, 9/15/25 | 20,000 | 18,750 |
| Macquarie Bank, Ltd. 144A sr. unsec. notes 2.85%, | | |
| 7/29/20 (Australia) | 40,000 | 39,632 |
| MGM Growth Properties Operating Partnership | | |
| LP/MGP Finance Co-Issuer, Inc. company | | |
| guaranty sr. unsec. notes 5.625%, 5/1/24R | 5,000 | 4,950 |
| MGM Growth Properties Operating Partnership | | |
| LP/MGP Finance Co-Issuer, Inc. company | | |
| guaranty sr. unsec. notes 4.50%, 1/15/28R | 5,000 | 4,375 |
| Mid-America Apartments LP sr. unsec. notes 4.30%, | | |
| 10/15/23R | 45,000 | 45,912 |
| Mitsubishi UFJ Financial Group, Inc. sr. unsec. | | |
| notes 3.535%, 7/26/21 (Japan) | 40,000 | 40,146 |
| Morgan Stanley sr. unsec. unsub. notes 4.375%, | | |
| 1/22/47 | 40,000 | 37,858 |
| Morgan Stanley sr. unsec. unsub. notes 3.625%, | | |
| 1/20/27 | 185,000 | 175,824 |
| Morgan Stanley sr. unsec. unsub. notes 2.65%, | | |
| 1/27/20 | 45,000 | 44,662 |
| Nationstar Mortgage, LLC/Nationstar Capital Corp. | | |
| company guaranty sr. unsec. unsub. notes 6.50%, | | |
| 7/1/21 | 15,000 | 14,625 |
| Neuberger Berman Group, LLC/Neuberger Berman | | |
| Finance Corp. 144A sr. unsec. notes 4.875%, | | |
| 4/15/45 | 30,000 | 26,471 |
| OneAmerica Financial Partners, Inc. 144A | | |
| sr. unsec. notes 7.00%, 10/15/33 | 78,000 | 92,890 |
| Peachtree Corners Funding Trust 144A company | | |
| guaranty sr. unsec. unsub. bonds 3.976%, 2/15/25 | 105,000 | 101,852 |
| Provident Funding Associates LP/PFG Finance Corp. | | |
| 144A sr. unsec. notes 6.375%, 6/15/25 | 15,000 | 13,500 |
| Prudential Financial, Inc. jr. unsec. sub. FRN | | |
| 5.625%, 6/15/43 | 25,000 | 24,656 |
| Prudential Financial, Inc. jr. unsec. sub. FRN | | |
| 5.20%, 3/15/44 | 54,000 | 50,625 |
| Regions Financial Corp. sr. unsec. | | |
| unsub. notes 2.75%, 8/14/22 | 45,000 | 43,443 |
| Royal Bank of Canada unsec. sub. notes Ser. GMTN, | | |
| 4.65%, 1/27/26 (Canada) | 45,000 | 46,323 |
| Springleaf Finance Corp. company | | |
| guaranty sr. unsec. sub. notes 7.125%, 3/15/26 | 5,000 | 4,463 |
| Springleaf Finance Corp. company | | |
| guaranty sr. unsec. unsub. notes 6.875%, 3/15/25 | 10,000 | 8,950 |
| Springleaf Finance Corp. company | | |
| guaranty sr. unsec. unsub. notes 6.125%, 5/15/22 | 10,000 | 9,697 |
| Springleaf Finance Corp. sr. unsec. | | |
| unsub. notes 5.25%, 12/15/19 | 5,000 | 5,012 |
| Starwood Property Trust, Inc. sr. unsec. | | |
| notes 4.75%, 3/15/25R | 15,000 | 13,500 |
| Swiss Re Treasury US Corp. 144A company | | |
| guaranty sr. unsec. notes 4.25%, 12/6/42 | 90,000 | 87,698 |
| TMX Finance, LLC/TitleMax Finance Corp. 144A | | |
| sr. notes 11.125%, 4/1/23 | 10,000 | 8,047 |
| Toronto-Dominion Bank (The) unsec. sub. FRB | | |
| 3.625%, 9/15/31 (Canada) | 58,000 | 54,922 |
| | |
| CORPORATE BONDS | | |
| AND NOTES (16.1%)*cont. | Principal amount | Value |
| Financialscont. | | |
| Travelport Corporate Finance PLC 144A | | |
| company guaranty sr. notes 6.00%, 3/15/26 | | |
| (United Kingdom) | $20,000 | $20,200 |
| UBS Group Funding (Switzerland) AG 144A | | |
| company guaranty sr. unsec. unsub. notes | | |
| 2.65%, 2/1/22 (Switzerland) | 200,000 | 193,575 |
| USIS Merger Sub, Inc. 144A sr. unsec. | | |
| notes 6.875%, 5/1/25 | 20,000 | 18,362 |
| VEREIT Operating Partnership LP company | | |
| guaranty sr. unsec. notes 4.60%, 2/6/24R | 35,000 | 35,385 |
| Vnesheconombank Via VEB Finance PLC 144A | | |
| sr. unsec. unsub. notes 6.80%, 11/22/25 (Russia) | 100,000 | 102,063 |
| Wand Merger Corp. 144A sr. unsec. notes 9.125%, | | |
| 7/15/26 | 5,000 | 4,850 |
| Wand Merger Corp. 144A sr. unsec. notes 8.125%, | | |
| 7/15/23 | 10,000 | 9,775 |
| Wells Fargo & Co. jr. unsec. sub. FRB Ser. U, | | |
| 5.875%, perpetual maturity | 8,000 | 7,900 |
| Wells Fargo & Co. sr. unsec. notes Ser. GMTN, | | |
| 2.60%, 7/22/20 | 80,000 | 79,225 |
| Westpac Banking Corp. sr. unsec. | | |
| unsub. notes 4.875%, 11/19/19 (Australia) | 80,000 | 81,308 |
| Westpac Banking Corp. sr. unsec. | | |
| unsub. notes 2.15%, 3/6/20 (Australia) | 135,000 | 133,552 |
| WeWork Cos, Inc. 144A company guaranty sr. unsec. | | |
| notes 7.875%, 5/1/25 | 20,000 | 17,750 |
| WP Carey, Inc. sr. unsec. unsub. notes 4.60%, | | |
| 4/1/24R | 30,000 | 30,289 |
| | | 4,905,357 |
| Health care (1.5%) | | |
| Air Medical Merger Sub Corp. 144A sr. unsec. | | |
| notes 6.375%, 5/15/23 | 40,000 | 33,400 |
| Allergan Funding SCS company guaranty sr. unsec. | | |
| notes 3.45%, 3/15/22 (Luxembourg) | 26,000 | 25,585 |
| Allergan Funding SCS company guaranty sr. unsec. | | |
| unsub. notes 3.80%, 3/15/25 (Luxembourg) | 15,000 | 14,643 |
| Amgen, Inc. sr. unsec. notes 3.45%, 10/1/20 | 125,000 | 125,395 |
| ASP AMC Merger Sub, Inc. 144A sr. unsec. | | |
| notes 8.00%, 5/15/25 | 15,000 | 7,950 |
| AstraZeneca PLC sr. unsec. unsub. notes 6.45%, | | |
| 9/15/37 (United Kingdom) | 36,000 | 43,023 |
| Bausch Health Cos., Inc. 144A company | | |
| guaranty sr. notes 5.50%, 11/1/25 | 5,000 | 4,663 |
| Bausch Health Cos., Inc. 144A company | | |
| guaranty sr. unsec. notes 9.00%, 12/15/25 | 10,000 | 9,950 |
| Bausch Health Cos., Inc. 144A company | | |
| guaranty sr. unsec. notes 6.125%, 4/15/25 | 40,000 | 34,900 |
| Bausch Health Cos., Inc. 144A company | | |
| guaranty sr. unsec. notes 5.875%, 5/15/23 | 8,000 | 7,400 |
| Bausch Health Cos., Inc. 144A company | | |
| guaranty sr. unsub. notes 7.00%, 3/15/24 | 15,000 | 15,150 |
| Bausch Health Cos., Inc. 144A company | | |
| guaranty sr. unsub. notes 6.50%, 3/15/22 | 5,000 | 5,025 |
| Becton Dickinson and Co. (BD) sr. unsec. | | |
| unsub. bonds 4.669%, 6/6/47 | 59,000 | 55,493 |
| Becton Dickinson and Co. (BD) sr. unsec. | | |
| unsub. bonds 3.70%, 6/6/27 | 51,000 | 48,238 |
| BioScrip, Inc. company guaranty sr. unsec. | | |
| notes 8.875%, 2/15/21 | 15,000 | 13,988 |
| Centene Corp. sr. unsec. unsub. notes 6.125%, | | |
| 2/15/24 | 15,000 | 15,356 |
| |
| 18Putnam VT Global Asset Allocation Fund |
| | |
| CORPORATE BONDS | | |
| AND NOTES (16.1%)*cont. | Principal amount | Value |
| Health carecont. | | |
| Centene Corp. sr. unsec. unsub. notes 4.75%, | | |
| 5/15/22 | $20,000 | $19,750 |
| Centene Escrow I Corp. 144A sr. unsec. | | |
| notes 5.375%, 6/1/26 | 5,000 | 4,863 |
| CHS/Community Health Systems, Inc. company | | |
| guaranty sr. notes 6.25%, 3/31/23 | 30,000 | 27,264 |
| CHS/Community Health Systems, Inc. company | | |
| guaranty sr. unsec. notes 6.875%, 2/1/22 | 29,000 | 13,195 |
| CHS/Community Health Systems, Inc. 144A company | | |
| guaranty sub. notes 8.125%, 6/30/24 | 23,000 | 16,790 |
| Cigna Corp. 144A sr. unsub. notes 3.75%, 7/15/23 | 75,000 | 74,750 |
| Cigna Holding Co. sr. unsec. unsub. notes 4.50%, | | |
| 3/15/21 | 80,000 | 81,743 |
| CVS Health Corp. sr. unsec. notes 4.75%, 12/1/22 | 40,000 | 41,271 |
| CVS Health Corp. sr. unsec. unsub. notes 4.78%, | | |
| 3/25/38 | 116,000 | 111,158 |
| Elanco Animal Health, Inc. 144A sr. unsec. | | |
| notes 4.90%, 8/28/28 | 80,000 | 81,406 |
| Endo Finance, LLC/Endo Finco, Inc. 144A company | | |
| guaranty sr. unsec. unsub. notes 5.375%, 1/15/23 | 20,000 | 15,100 |
| HCA, Inc. company guaranty sr. bonds 5.25%, | | |
| 6/15/26 | 15,000 | 14,888 |
| HCA, Inc. company guaranty sr. notes 6.50%, | | |
| 2/15/20 | 27,000 | 27,675 |
| HCA, Inc. company guaranty sr. sub. bonds 5.50%, | | |
| 6/15/47 | 40,000 | 37,901 |
| HCA, Inc. company guaranty sr. unsec. | | |
| unsub. notes 7.50%, 2/15/22 | 4,000 | 4,240 |
| Jaguar Holding Co. II/Pharmaceutical Product | | |
| Development, LLC 144A company | | |
| guaranty sr. unsec. notes 6.375%, 8/1/23 | 15,000 | 14,355 |
| Kinetic Concepts, Inc./KCI USA, Inc. 144A company | | |
| guaranty sub. notes 12.50%, 11/1/21 | 5,000 | 5,350 |
| Mallinckrodt International Finance | | |
| SA/Mallinckrodt CB, LLC 144A company | | |
| guaranty sr. unsec. unsub. notes 5.50%, 4/15/25 | | |
| (Luxembourg) | 10,000 | 6,925 |
| Merck & Co., Inc. sr. unsec. unsub. notes 3.70%, | | |
| 2/10/45 | 50,000 | 48,021 |
| Molina Healthcare, Inc. company | | |
| guaranty sr. unsec. notes 5.375%, 11/15/22 | 10,000 | 9,650 |
| Molina Healthcare, Inc. 144A company | | |
| guaranty sr. unsec. notes 4.875%, 6/15/25 | 5,000 | 4,563 |
| Novartis Capital Corp. company | | |
| guaranty sr. unsec. unsub. bonds 4.00%, 11/20/45 | 80,000 | 80,203 |
| Omega Healthcare Investors, Inc. company | | |
| guaranty sr. unsec. notes 4.50%, 4/1/27R | 75,000 | 71,719 |
| Omega Healthcare Investors, Inc. company | | |
| guaranty sr. unsec. unsub. notes 4.95%, 4/1/24 R | 11,000 | 11,163 |
| Ortho-Clinical Diagnostics, Inc./Ortho-Clinical | | |
| Diagnostics SA 144A sr. unsec. notes 6.625%, | | |
| 5/15/22 | 23,000 | 20,700 |
| Pfizer, Inc. sr. unsec. unsub. notes 3.00%, | | |
| 12/15/26 | 40,000 | 38,622 |
| Pfizer, Inc. sr. unsec. unsub. notes 1.70%, | | |
| 12/15/19 | 55,000 | 54,469 |
| Service Corp. International sr. unsec. | | |
| notes 5.375%, 1/15/22 | 14,000 | 14,035 |
| Service Corp. International sr. unsec. | | |
| notes 4.625%, 12/15/27 | 15,000 | 14,100 |
| Service Corp. International sr. unsec. | | |
| unsub. notes 5.375%, 5/15/24 | 33,000 | 32,670 |
| | |
| CORPORATE BONDS | | |
| AND NOTES (16.1%)*cont. | Principal amount | Value |
| Health carecont. | | |
| Shire Acquisitions Investments Ireland DAC | | |
| company guaranty sr. unsec. unsub. notes 3.20%, | | |
| 9/23/26 (Ireland) | $46,000 | $41,717 |
| Shire Acquisitions Investments Ireland DAC | | |
| company guaranty sr. unsec. unsub. notes 2.875%, | | |
| 9/23/23 (Ireland) | 40,000 | 37,813 |
| Sotera Health Holdings, LLC 144A sr. unsec. | | |
| notes 6.50%, 5/15/23 | 10,000 | 9,575 |
| Tenet Healthcare Corp. company | | |
| guaranty sr. sub. notes 6.00%, 10/1/20 | 20,000 | 20,250 |
| Tenet Healthcare Corp. sr. unsec. notes 8.125%, | | |
| 4/1/22 | 5,000 | 5,013 |
| UnitedHealth Group, Inc. sr. unsec. | | |
| unsub. notes 3.95%, 10/15/42 | 90,000 | 86,161 |
| UnitedHealth Group, Inc. sr. unsec. | | |
| unsub. notes 2.75%, 2/15/23 | 90,000 | 88,137 |
| Valeant Pharmaceuticals International, Inc. 144A | | |
| company guaranty sr. unsec. notes 9.25%, 4/1/26 | 15,000 | 15,000 |
| Valeant Pharmaceuticals International, Inc. 144A | | |
| sr. unsec. notes 8.50%, 1/31/27 | 10,000 | 9,675 |
| WellCare Health Plans, Inc. sr. unsec. | | |
| notes 5.25%, 4/1/25 | 5,000 | 4,813 |
| WellCare Health Plans, Inc. 144A sr. unsec. | | |
| notes 5.375%, 8/15/26 | 5,000 | 4,825 |
| Zoetis, Inc. sr. unsec. notes 3.90%, 8/20/28 | 35,000 | 34,290 |
| | | 1,815,967 |
| Technology (1.6%) | | |
| Alphabet, Inc. sr. unsec. notes 3.625%, 5/19/21 | 120,000 | 122,412 |
| Alphabet, Inc. sr. unsec. notes 1.998%, 8/15/26 | 35,000 | 31,818 |
| Analog Devices, Inc. sr. unsec. | | |
| unsub. notes 2.85%, 3/12/20 | 60,000 | 59,789 |
| Apple, Inc. sr. unsec. notes 3.45%, 5/6/24 | 40,000 | 40,230 |
| Apple, Inc. sr. unsec. notes 2.10%, 5/6/19 | 130,000 | 129,728 |
| Apple, Inc. sr. unsec. unsub. notes 4.375%, | | |
| 5/13/45 | 80,000 | 81,245 |
| Apple, Inc. sr. unsec. unsub. notes 3.85%, 5/4/43 | 27,000 | 25,568 |
| Apple, Inc. sr. unsec. unsub. notes 2.00%, 5/6/20 | 30,000 | 29,716 |
| Avaya, Inc. 144A escrow notes 7.00%, 4/1/19 | 34,000 | — |
| Banff Merger Sub, Inc. 144A sr. unsec. | | |
| notes 9.75%, 9/1/26 | 15,000 | 13,725 |
| Broadcom Corp./Broadcom Cayman Finance, Ltd. | | |
| company guaranty sr. unsec. unsub. notes 3.875%, | | |
| 1/15/27 | 35,000 | 31,399 |
| Broadcom Corp./Broadcom Cayman Finance, Ltd. | | |
| company guaranty sr. unsec. unsub. notes 3.50%, | | |
| 1/15/28 | 90,000 | 77,977 |
| Cisco Systems, Inc. sr. unsec. | | |
| unsub. notes 2.50%, 9/20/26 | 35,000 | 32,626 |
| Cisco Systems, Inc. sr. unsec. | | |
| unsub. notes 2.20%, 2/28/21 | 75,000 | 74,006 |
| Diamond 1 Finance Corp./Diamond 2 Finance Corp. | | |
| 144A company guaranty sr. notes 6.02%, 6/15/26 | 83,000 | 83,375 |
| Diamond 1 Finance Corp./Diamond 2 Finance Corp. | | |
| 144A company guaranty sr. unsec. notes 7.125%, | | |
| 6/15/24 | 15,000 | 15,263 |
| Diamond 1 Finance Corp./Diamond 2 Finance Corp. | | |
| 144A sr. bonds 8.35%, 7/15/46 | 10,000 | 10,828 |
| Energizer Gamma Acquisition, Inc. 144A company | | |
| guaranty sr. unsec. notes 6.375%, 7/15/26 | 5,000 | 4,588 |
| Fidelity National Information Services, Inc. | | |
| sr. unsec. sub. notes Ser. 10Y, 4.25%, 5/15/28 | 20,000 | 19,868 |
| |
| Putnam VT Global Asset Allocation Fund19 |
| | |
| CORPORATE BONDS | | |
| AND NOTES (16.1%)*cont. | Principal amount | Value |
| Technologycont. | | |
| Fidelity National Information Services, Inc. | | |
| sr. unsec. unsub. notes 5.00%, 10/15/25 | $9,000 | $9,362 |
| First Data Corp. 144A notes 5.75%, 1/15/24 | 30,000 | 29,250 |
| First Data Corp. 144A sr. notes 5.375%, 8/15/23 | 15,000 | 14,738 |
| Fiserv, Inc. sr. unsec. sub. bonds 4.20%, 10/1/28 | 55,000 | 54,890 |
| IBM Corp. sr. unsec. unsub. notes 1.875%, 8/1/22 | 140,000 | 132,089 |
| Inception Merger Sub, Inc./Rackspace | | |
| Hosting, Inc. 144A sr. unsec. notes 8.625%, | | |
| 11/15/24 | 24,000 | 18,720 |
| Infor Software Parent, LLC/Infor Software | | |
| Parent, Inc. 144A company guaranty sr. unsec. | | |
| notes 7.125%, 5/1/21 ‡‡ | 20,000 | 19,450 |
| Infor US, Inc. company guaranty sr. unsec. | | |
| notes 6.50%, 5/15/22 | 15,000 | 14,507 |
| Infor US, Inc. 144A company | | |
| guaranty sr. notes 5.75%, 8/15/20 | 3,000 | 3,009 |
| Legrand France SA sr. unsec. unsub. notes 8.50%, | | |
| 2/15/25 (France) | 66,000 | 81,600 |
| Microchip Technology, Inc. 144A company | | |
| guaranty sr. notes 4.333%, 6/1/23 | 44,000 | 42,797 |
| Microsoft Corp. sr. unsec. unsub. notes 5.30%, | | |
| 2/8/41 | 25,000 | 29,535 |
| Microsoft Corp. sr. unsec. unsub. notes 3.70%, | | |
| 8/8/46 | 100,000 | 95,798 |
| Microsoft Corp. sr. unsec. unsub. notes 1.55%, | | |
| 8/8/21 | 80,000 | 77,717 |
| Oracle Corp. sr. unsec. unsub. notes 5.375%, | | |
| 7/15/40 | 35,000 | 38,674 |
| Oracle Corp. sr. unsec. unsub. notes 2.65%, | | |
| 7/15/26 | 10,000 | 9,268 |
| Oracle Corp. sr. unsec. unsub. notes 2.50%, | | |
| 10/15/22 | 80,000 | 77,792 |
| Oracle Corp. sr. unsec. unsub. notes 2.25%, | | |
| 10/8/19 | 95,000 | 94,551 |
| Plantronics, Inc. 144A company | | |
| guaranty sr. unsec. notes 5.50%, 5/31/23 | 20,000 | 18,600 |
| Qorvo, Inc. 144A sr. unsec. notes 5.50%, 7/15/26 | 5,000 | 4,775 |
| Salesforce.com, Inc. sr. unsec. | | |
| unsub. notes 3.70%, 4/11/28 | 60,000 | 60,317 |
| Solera, LLC / Solera Finance, Inc. 144A | | |
| sr. unsec. notes 10.50%, 3/1/24 | 35,000 | 37,275 |
| Tempo Acquisition, LLC/Tempo Acquisition | | |
| Finance Corp. 144A sr. unsec. notes 6.75%, | | |
| 6/1/25 | 25,000 | 23,125 |
| TTM Technologies, Inc. 144A company | | |
| guaranty sr. unsec. notes 5.625%, 10/1/25 | 20,000 | 18,600 |
| VMware, Inc. sr. unsec. notes 3.90%, 8/21/27 | 15,000 | 13,305 |
| Western Digital Corp. company guaranty sr. unsec. | | |
| notes 4.75%, 2/15/26 | 70,000 | 60,726 |
| | | 1,964,631 |
| Transportation (0.2%) | | |
| CSX Corp. sr. unsec. unsub. notes 4.10%, 3/15/44 | 70,000 | 64,913 |
| Delta Air Lines, Inc. sr. notes Ser. A, 7.75%, | | |
| 12/17/19 | 17,247 | 17,812 |
| FedEx Corp. company guaranty sr. unsec. | | |
| unsub. notes 2.625%, 8/1/22 | 15,000 | 14,581 |
| Penske Truck Leasing Co. LP/PTL Finance Corp. | | |
| 144A sr. unsec. bonds 3.40%, 11/15/26 | 16,000 | 14,953 |
| Penske Truck Leasing Co. LP/PTL Finance Corp. | | |
| 144A sr. unsec. notes 3.90%, 2/1/24 | 20,000 | 19,736 |
| | |
| CORPORATE BONDS | | |
| AND NOTES (16.1%)*cont. | Principal amount | Value |
| Transportationcont. | | |
| United Airlines, Inc. Pass-Through Trust | | |
| pass-through certificates Ser. 07-1, Class A, | | |
| 6.636%, 7/2/22 | $8,512 | $8,860 |
| United Airlines, Inc. Pass-Through Trust | | |
| pass-through certificates Ser. 14-2, Class A, | | |
| 3.75%, 9/3/26 | 37,320 | 36,857 |
| Watco Cos., LLC/Watco Finance Corp. 144A | | |
| company guaranty sr. unsec. notes 6.375%, 4/1/23 | 24,000 | 24,060 |
| | | 201,772 |
| Utilities and power (1.1%) | | |
| AES Corp./Virginia (The) sr. unsec. notes 5.50%, | | |
| 4/15/25 | 35,000 | 34,738 |
| AES Corp./Virginia (The) sr. unsec. notes 4.875%, | | |
| 5/15/23 | 7,000 | 6,843 |
| AES Corp./Virginia (The) sr. unsec. notes 4.50%, | | |
| 3/15/23 | 5,000 | 4,875 |
| AES Corp./Virginia (The) sr. unsec. | | |
| unsub. bonds 5.125%, 9/1/27 | 25,000 | 24,000 |
| American Electric Power Co., Inc. sr. unsec. | | |
| unsub. notes Ser. J, 4.30%, 12/1/28 | 55,000 | 55,887 |
| American Transmission Systems, Inc. 144A | | |
| sr. unsec. unsub. bonds 5.00%, 9/1/44 | 50,000 | 53,405 |
| Arizona Public Services Co. sr. unsec. | | |
| notes 4.50%, 4/1/42 | 15,000 | 15,303 |
| Berkshire Hathaway Energy Co. sr. unsec. | | |
| unsub. bonds 6.125%, 4/1/36 | 39,000 | 46,684 |
| Calpine Corp. sr. unsec. sub. notes 5.75%, 1/15/25 | 25,000 | 22,875 |
| Calpine Corp. 144A company | | |
| guaranty sr. notes 5.25%, 6/1/26 | 10,000 | 9,125 |
| Calpine Corp. 144A company | | |
| guaranty sr. sub. notes 5.875%, 1/15/24 | 3,000 | 2,940 |
| Colorado Interstate Gas Co., LLC company | | |
| guaranty sr. unsec. notes 6.85%, 6/15/37 | 8,000 | 8,630 |
| Commonwealth Edison Co. 1st mtge. bonds 5.90%, | | |
| 3/15/36 | 28,000 | 33,012 |
| Consolidated Edison Co. of New York, Inc. | | |
| sr. unsec. unsub. notes 4.20%, 3/15/42 | 45,000 | 43,844 |
| Duke Energy Corp. sr. unsec. notes 3.15%, 8/15/27 | 55,000 | 51,343 |
| Dynegy, Inc. company guaranty sr. unsec. | | |
| unsub. notes 7.625%, 11/1/24 | 20,000 | 21,100 |
| Dynegy, Inc. 144A company guaranty sr. unsec. | | |
| notes 8.125%, 1/30/26 | 10,000 | 10,800 |
| Electricite de France (EDF) 144A sr. unsec. | | |
| notes 6.50%, 1/26/19 (France) | 60,000 | 60,119 |
| Emera US Finance LP company guaranty sr. unsec. | | |
| notes 3.55%, 6/15/26 | 11,000 | 10,431 |
| Enbridge, Inc. sr. unsec. unsub. bonds 4.25%, | | |
| 12/1/26 (Canada) | 38,000 | 37,576 |
| Energy Transfer LP sr. sub. notes 5.875%, 1/15/24 | 48,000 | 48,841 |
| Energy Transfer LP sr. sub. notes 5.50%, 6/1/27 | 5,000 | 4,875 |
| Enterprise Products Operating, LLC company | | |
| guaranty sr. unsec. unsub. bonds 4.25%, 2/15/48 | 85,000 | 75,342 |
| FirstEnergy Transmission, LLC 144A sr. unsec. | | |
| unsub. notes 5.45%, 7/15/44 | 33,000 | 35,850 |
| GenOn Energy, Inc. sr. unsec. notes 9.875%, | | |
| 10/15/20 | 18,000 | 6,889 |
| GenOn Energy, Inc./NRG Americas, Inc. company | | |
| guaranty sub. FRN (BBA LIBOR USD 3 Month | | |
| + 6.50%), 9.392%, 12/1/23 | 3,902 | 3,824 |
| IPALCO Enterprises, Inc. sr. sub. notes 3.70%, | | |
| 9/1/24 | 10,000 | 9,735 |
| |
| 20Putnam VT Global Asset Allocation Fund |
| | |
| CORPORATE BONDS | | |
| AND NOTES (16.1%)*cont. | Principal amount | Value |
| Utilities and powercont. | | |
| Kinder Morgan Energy Partners LP company | | |
| guaranty sr. unsec. notes 5.40%, 9/1/44 | $10,000 | $9,559 |
| Kinder Morgan Energy Partners LP company | | |
| guaranty sr. unsec. notes 3.50%, 3/1/21 | 80,000 | 79,792 |
| Kinder Morgan Energy Partners LP company | | |
| guaranty sr. unsec. unsub. notes 3.45%, 2/15/23 | 25,000 | 24,395 |
| Kinder Morgan, Inc. company guaranty sr. unsec. | | |
| unsub. notes 3.15%, 1/15/23 | 105,000 | 102,032 |
| Kinder Morgan, Inc./DE company guaranty | | |
| sr. unsec. notes Ser. GMTN, 7.75%, 1/15/32 | 17,000 | 20,349 |
| MidAmerican Funding, LLC sr. bonds 6.927%, 3/1/29 | 50,000 | 62,534 |
| Nevada Power Co. mtge. notes 7.125%, 3/15/19 | 40,000 | 40,305 |
| NextEra Energy Capital Holdings, Inc. company | | |
| guaranty jr. unsec. sub. FRB 4.80%, 12/1/77 | 20,000 | 16,675 |
| NRG Energy, Inc. company guaranty sr. unsec. | | |
| notes 7.25%, 5/15/26 | 10,000 | 10,413 |
| NRG Energy, Inc. company guaranty sr. unsec. | | |
| notes 6.625%, 1/15/27 | 20,000 | 20,150 |
| NRG Energy, Inc. company guaranty sr. unsec. | | |
| notes 5.75%, 1/15/28 | 5,000 | 4,800 |
| NSTAR Electric Co. sr. unsec. | | |
| unsub. notes 2.375%, 10/15/22 (Canada) | 75,000 | 72,443 |
| Oncor Electric Delivery Co., LLC sr. notes 4.10%, | | |
| 6/1/22 | 25,000 | 25,609 |
| Oncor Electric Delivery Co., LLC sr. notes 3.75%, | | |
| 4/1/45 | 75,000 | 71,193 |
| PPL Capital Funding, Inc. company | | |
| guaranty sr. unsec. unsub. notes 4.20%, 6/15/22 | 60,000 | 60,554 |
| Public Service Electric & Gas Co. | | |
| sr. notes Ser. MTN, 5.50%, 3/1/40 | 25,000 | 29,797 |
| Texas Competitive Electric Holdings Co. , LLC/TCEH | | |
| Finance, Inc. escrow company | | |
| guaranty sr. notes 11.50%, 10/1/20F | 13,000 | 39 |
| Vistra Operations Co., LLC 144A sr. unsec. | | |
| notes 5.50%, 9/1/26 | 15,000 | 14,438 |
| | | 1,403,963 |
| | |
| Total corporate bonds and notes (cost $20,386,760) | $19,858,094 |
| | |
| U.S. GOVERNMENT AND AGENCY | | |
| MORTGAGE OBLIGATIONS (11.7%)* | Principal amount | Value |
| U.S. Government Guaranteed Mortgage Obligations (3.2%) | |
| Government National Mortgage Association | | |
| Pass-Through Certificates | | |
| 6.50%, with due dates from 5/20/37 to 11/20/39 | $270,314 | $306,270 |
| 3.50%, with due dates from 8/20/47 to 11/20/47 | 3,620,964 | 3,648,971 |
| | | 3,955,241 |
| U.S. Government Agency Mortgage Obligations (8.5%) | |
| Federal Home Loan Mortgage Corporation | | |
| Pass-Through Certificates 4.00%, 5/1/48 | 1,435,340 | 1,463,935 |
| Federal National Mortgage Association | | |
| Pass-Through Certificates | | |
| 6.00%, TBA, 1/1/49 | 1,000,000 | 1,075,156 |
| 4.50%, TBA, 1/1/49 | 1,000,000 | 1,035,156 |
| 4.00%, with due dates from 8/1/47 to 1/1/57 | 899,412 | 918,401 |
| 3.50%, with due dates from 12/1/47 to 1/1/48 | 3,933,667 | 3,933,821 |
| 3.00%, with due dates from 12/1/31 to 5/1/46 | 2,051,698 | 2,034,397 |
| | | 10,460,866 |
| Total U.S. government and agency mortgage | | |
| obligations (cost $14,695,649) | | $14,416,107 |
| | |
| MORTGAGE-BACKED | | |
| SECURITIES (1.7%)* | Principal amount | Value |
| Agency collateralized mortgage obligations (0.3%) | |
| Federal Home Loan Mortgage Corporation | | |
| IFB Ser. 3408, Class EK, ((-4.024 x 1 Month US | | |
| LIBOR) + 25.79%), 15.914%, 4/15/37 | $9,667 | $13,897 |
| IFB Ser. 3072, Class SM, ((-3.667 x 1 Month US | | |
| LIBOR) + 23.80%), 14.795%, 11/15/35 | 13,514 | 18,977 |
| IFB Ser. 3249, Class PS, ((-3.3 x 1 Month US | | |
| LIBOR) + 22.28%), 14.173%, 12/15/36 | 10,219 | 13,093 |
| IFB Ser. 3065, Class DC, ((-3 x 1 Month US LIBOR) | | |
| + 19.86%), 12.495%, 3/15/35 | 26,557 | 33,255 |
| IFB Ser. 2990, Class LB, ((-2.556 x 1 Month US | | |
| LIBOR) + 16.95%), 10.671%, 6/15/34 | 15,347 | 17,381 |
| IFB Ser. 3829, Class AS, IO, ((-1 x 1 Month US | | |
| LIBOR) + 6.95%), 4.495%, 3/15/41 | 73,624 | 11,903 |
| Federal National Mortgage Association | | |
| IFB Ser. 06-8, Class HP, ((-3.667 x 1 Month US | | |
| LIBOR) + 24.57%), 15.377%, 3/25/36 | 17,979 | 26,196 |
| IFB Ser. 07-53, Class SP, ((-3.667 x 1 Month US | | |
| LIBOR) + 24.20%), 15.01%, 6/25/37 | 16,400 | 22,668 |
| IFB Ser. 05-75, Class GS, ((-3 x 1 Month US | | |
| LIBOR) + 20.25%), 12.731%, 8/25/35 | 6,534 | 8,125 |
| Connecticut Avenue Securities FRB Ser. 16-C02, | | |
| Class 1M2, (1 Month US LIBOR + 6.00%), 8.506%, | | |
| 9/25/28 | 20,000 | 22,792 |
| Connecticut Avenue Securities FRB Ser. 14-C04, | | |
| Class 1M2, (1 Month US LIBOR + 4.90%), 7.406%, | | |
| 11/25/24 | 7,845 | 8,752 |
| Connecticut Avenue Securities FRB Ser. 14-C03, | | |
| Class 2M2, (1 Month US LIBOR + 2.90%), 5.406%, | | |
| 7/25/24 | 15,686 | 16,361 |
| Connecticut Avenue Securities FRB Ser. 14-C02, | | |
| Class 1M2, (1 Month US LIBOR + 2.60%), 5.106%, | | |
| 5/25/24 | 16,000 | 16,749 |
| Connecticut Avenue Securities FRB Ser. 16-C05, | | |
| Class 2M1, (1 Month US LIBOR + 1.35%), 3.856%, | | |
| 1/25/29 | 5,647 | 5,654 |
| IFB Ser. 18-86, Class DS, IO, ((-1 x 1 Month US | | |
| LIBOR) + 6.10%), 3.594%, 12/25/48 | 232,748 | 33,603 |
| Ser. 06-46, Class OC, PO, zero %, 6/25/36 | 4,552 | 3,746 |
| Government National Mortgage Association | | |
| Ser. 10-9, Class UI, IO, 5.00%, 1/20/40 | 61,565 | 13,569 |
| IFB Ser. 13-99, Class AS, IO, ((-1 x 1 Month US | | |
| LIBOR) + 6.05%), 3.58%, 6/20/43 | 92,834 | 16,878 |
| Ser. 16-123, Class LI, IO, 3.50%, 3/20/44 | 125,008 | 13,726 |
| Ser. 13-14, IO, 3.50%, 12/20/42 | 266,394 | 37,253 |
| Ser. 12-141, Class WI, IO, 3.50%, 11/20/41 | 252,713 | 29,310 |
| Ser. 16-H16, Class EI, IO, 2.209%, 6/20/66W | 191,228 | 21,150 |
| Ser. 15-H26, Class DI, IO, 2.118%, 10/20/65W | 257,197 | 24,532 |
| | | 429,570 |
| Commercial mortgage-backed securities (0.8%) | | |
| Banc of America Commercial Mortgage Trust FRB | | |
| Ser. 07-1, Class XW, IO, 0.211%, 1/15/49W | 216,476 | 253 |
| Banc of America Commercial Mortgage Trust 144A | | |
| FRB Ser. 04-4, Class XC, IO, 0.324%, 7/10/42W | 3,790 | — |
| FRB Ser. 07-5, Class XW, IO, zero %, 2/10/51W | 329,484 | 3 |
| Banc of America Merrill Lynch Commercial | | |
| Mortgage, Inc. 144A FRB Ser. 04-5, Class XC, IO, | | |
| 0.441%, 11/10/41W | 51,722 | 126 |
| Bear Stearns Commercial Mortgage Securities Trust | | |
| FRB Ser. 04-PR3I, Class X1, IO, zero %, 2/11/41 W | 2,424 | — |
| Bear Stearns Commercial Mortgage Securities Trust | | |
| 144A FRB Ser. 06-PW14, Class X1, IO, 0.314%, | | |
| 12/11/38W | 36,042 | 370 |
| |
| Putnam VT Global Asset Allocation Fund21 |
| | |
| MORTGAGE-BACKED | | |
| SECURITIES (1.7%)*cont. | Principal amount | Value |
| Commercial mortgage-backed securitiescont. | | |
| Capmark Mortgage Securities, Inc. FRB Ser. 97-C1, | | |
| Class X, IO, 1.352%, 7/15/29W | $4,908 | $68 |
| CD Commercial Mortgage Trust 144A FRB | | |
| Ser. 07-CD4, Class XW, IO, 0.752%, 12/11/49W | 4,199 | — |
| Citigroup Commercial Mortgage Trust 144A | | |
| FRB Ser. 12-GC8, Class XA, IO, 1.80%, 9/10/45W | 338,470 | 17,826 |
| FRB Ser. 06-C5, Class XC, IO, 0.495%, 10/15/49W | 602,091 | 6 |
| COMM Mortgage Trust | | |
| FRB Ser. 12-LC4, Class C, 5.539%, 12/10/44W | 61,000 | 60,697 |
| FRB Ser. 14-CR17, Class C, 4.737%, 5/10/47W | 26,000 | 25,898 |
| Ser. 13-CR11, Class AM, 4.715%, 8/10/50W | 20,000 | 21,068 |
| FRB Ser. 14-UBS6, Class C, 4.465%, 12/10/47W | 36,000 | 35,076 |
| Ser. 13-CR13, Class AM, 4.449%, 11/10/46W | 85,000 | 88,530 |
| Ser. 12-CR2, Class AM, 3.791%, 8/15/45 | 30,000 | 30,119 |
| FRB Ser. 14-CR18, Class XA, IO, 1.147%, 7/15/47 W | 254,911 | 9,281 |
| FRB Ser. 14-CR16, Class XA, IO, 1.127%, 4/10/47 W | 187,866 | 8,170 |
| FRB Ser. 14-CR20, Class XA, IO, 1.124%, 11/10/47 W | 325,317 | 14,496 |
| FRB Ser. 13-CR11, Class XA, IO, 1.095%, 8/10/50 W | 540,807 | 20,686 |
| FRB Ser. 14-CR17, Class XA, IO, 1.078%, 5/10/47 W | 689,727 | 29,963 |
| FRB Ser. 14-UBS6, Class XA, IO, 0.954%, 12/10/47 W | 932,986 | 36,614 |
| FRB Ser. 14-LC17, Class XA, IO, 0.892%, 10/10/47 W | 698,946 | 19,565 |
| COMM Mortgage Trust 144A FRB Ser. 06-C8, | | |
| Class XS, IO, 0.44%, 12/10/46W | 313,745 | 3 |
| Credit Suisse Commercial Mortgage Trust 144A FRB | | |
| Ser. 07-C2, Class AX, IO, 0.04%, 1/15/49W | 674,127 | 7 |
| CSMC Trust FRB Ser. 16-NXSR, Class C, 4.362%, | | |
| 12/15/49W | 70,000 | 68,443 |
| GE Commercial Mortgage Corp. Trust 144A FRB | | |
| Ser. 07-C1, Class XC, IO, 0.087%, 12/10/49W | 1,563,450 | 1,425 |
| GMAC Commercial Mortgage Securities, Inc. Trust | | |
| 144A FRB Ser. 05-C1, Class X1, IO, 0.982%, | | |
| 5/10/43W | 15,496 | — |
| GS Mortgage Securities Corp. II FRB Ser. 15-GC30, | | |
| Class XA, IO, 0.859%, 5/10/50W | 457,910 | 16,805 |
| GS Mortgage Securities Trust FRB Ser. 14-GC22, | | |
| Class C, 4.689%, 6/10/47W | 19,000 | 19,016 |
| GS Mortgage Securities Trust 144A FRB | | |
| Ser. 06-GG8, Class X, IO, 0.871%, 11/10/39W | 1,036,108 | 16,211 |
| JPMBB Commercial Mortgage Securities Trust | | |
| FRB Ser. 13-C15, Class C, 5.199%, 11/15/45W | 30,000 | 30,728 |
| FRB Ser. 14-C22, Class C, 4.558%, 9/15/47W | 23,000 | 22,388 |
| JPMorgan Chase Commercial Mortgage Securities | | |
| Trust | | |
| Ser. 12-C6, Class AS, 4.117%, 5/15/45 | 16,000 | 16,216 |
| FRB Ser. 06-LDP8, Class X, IO, 0.285%, 5/15/45W | 205,366 | 256 |
| FRB Ser. 07-LDPX, Class X, IO, 0.142%, 1/15/49W | 560,812 | 6 |
| JPMorgan Chase Commercial Mortgage Securities | | |
| Trust 144A FRB Ser. 05-CB12, Class X1, IO, | | |
| 0.361%, 9/12/37W | 181,408 | 195 |
| LB-UBS Commercial Mortgage Trust 144A | | |
| FRB Ser. 06-C6, Class XCL, IO, 0.685%, 9/15/39W | 401,438 | 5,469 |
| FRB Ser. 05-C5, Class XCL, IO, 0.507%, 9/15/40W | 211,661 | 1,064 |
| FRB Ser. 05-C7, Class XCL, IO, 0.317%, 11/15/40 W | 52,273 | 102 |
| Merrill Lynch Mortgage Trust 144A | | |
| FRB Ser. 04-KEY2, Class XC, IO, 0.904%, 8/12/39 W | 14,575 | — |
| FRB Ser. 05-MCP1, Class XC, IO, 0.001%, 6/12/43 W | 53,987 | 1 |
| Mezz Cap Commercial Mortgage Trust 144A | | |
| FRB Ser. 05-C3, Class X, IO, 6.722%, 5/15/44W | 577 | 73 |
| FRB Ser. 06-C4, Class X, IO, 6.235%, 7/15/45W | 13,665 | 404 |
| | |
| MORTGAGE-BACKED | | |
| SECURITIES (1.7%)*cont. | Principal amount | Value |
| Commercial mortgage-backed securitiescont. | | |
| Morgan Stanley Bank of America Merrill Lynch Trust | | |
| Ser. 14-C18, Class C, 4.489%, 10/15/47W | $25,000 | $24,749 |
| FRB Ser. 14-C17, Class XA, IO, 1.19%, 8/15/47W | 283,563 | 10,340 |
| FRB Ser. 13-C12, Class XA, IO, 0.617%, 10/15/46 W | 466,907 | 11,296 |
| UBS-Barclays Commercial Mortgage Trust 144A | | |
| FRB Ser. 12-C3, Class C, 5.031%, 8/10/49W | 50,000 | 50,776 |
| FRB Ser. 12-C4, Class XA, IO, 1.64%, 12/10/45W | 204,655 | 10,131 |
| Wachovia Bank Commercial Mortgage Trust | | |
| FRB Ser. 05-C21, Class D, 5.226%, 10/15/44W | 11,692 | 11,538 |
| FRB Ser. 07-C34, IO, 0.107%, 5/15/46W | 218,746 | 71 |
| Wachovia Bank Commercial Mortgage Trust 144A FRB | | |
| Ser. 06-C26, Class XC, IO, 0.045%, 6/15/45W | 2,144 | — |
| Wells Fargo Commercial Mortgage Trust | | |
| FRB Ser. 13-LC12, Class AS, 4.287%, 7/15/46W | 19,000 | 19,528 |
| FRB Ser. 13-LC12, Class C, 4.287%, 7/15/46W | 24,000 | 22,992 |
| WF-RBS Commercial Mortgage Trust | | |
| Ser. 13-C12, Class AS, 3.56%, 3/15/48 | 33,000 | 32,966 |
| Ser. 13-C11, Class AS, 3.311%, 3/15/45 | 12,000 | 11,856 |
| WF-RBS Commercial Mortgage Trust 144A | | |
| FRB Ser. 11-C3, Class D, 5.683%, 3/15/44W | 32,000 | 28,309 |
| FRB Ser. 11-C2, Class D, 5.652%, 2/15/44W | 25,000 | 24,920 |
| FRB Ser. 13-C15, Class D, 4.473%, 8/15/46W | 43,000 | 36,968 |
| FRB Ser. 12-C9, Class XA, IO, 1.885%, 11/15/45W | 221,308 | 12,947 |
| FRB Ser. 11-C5, Class XA, IO, 1.736%, 11/15/44W | 282,088 | 10,504 |
| FRB Ser. 12-C10, Class XA, IO, 1.565%, 12/15/45 W | 320,039 | 15,758 |
| | | 953,276 |
| Residential mortgage-backed securities (non-agency) (0.6%) | |
| Citigroup Mortgage Loan Trust, Inc. FRB | | |
| Ser. 05-2, Class 1A2A, 4.538%, 5/25/35W | 30,184 | 30,816 |
| Countrywide Alternative Loan Trust | | |
| FRB Ser. 06-OA7, Class 1A2, (1 Month US LIBOR | | |
| + 0.94%), 3.097%, 6/25/46 | 115,338 | 105,918 |
| FRB Ser. 06-OA10, Class 4A1, (1 Month US LIBOR | | |
| + 0.19%), 2.696%, 8/25/46 | 127,628 | 108,579 |
| FRB Ser. 05-27, Class 1A1, 2.393%, 8/25/35W | 35,349 | 30,340 |
| Federal National Mortgage Association | | |
| Connecticut Avenue Securities FRB Ser. 16-C03, | | |
| Class 2M2, (1 Month US LIBOR + 5.90%), 8.406%, | | |
| 10/25/28 | 19,703 | 22,284 |
| Connecticut Avenue Securities FRB Ser. 15-C04, | | |
| Class 1M2, (1 Month US LIBOR + 5.70%), 8.206%, | | |
| 4/25/28 | 25,600 | 28,819 |
| Connecticut Avenue Securities FRB Ser. 15-C04, | | |
| Class 2M2, (1 Month US LIBOR + 5.55%), 8.056%, | | |
| 4/25/28 | 81,128 | 90,370 |
| Connecticut Avenue Securities FRB Ser. 15-C03, | | |
| Class 2M2, (1 Month US LIBOR + 5.00%), 7.506%, | | |
| 7/25/25 | 6,878 | 7,519 |
| Connecticut Avenue Securities FRB Ser. 15-C01, | | |
| Class 1M2, (1 Month US LIBOR + 4.30%), 6.806%, | | |
| 2/25/25 | 18,891 | 20,394 |
| Connecticut Avenue Securities FRB Ser. 15-C02, | | |
| Class 1M2, (1 Month US LIBOR + 4.00%), 6.506%, | | |
| 5/25/25 | 13,165 | 14,187 |
| Long Beach Mortgage Loan Trust FRB Ser. 04-1, | | |
| Class A2, (1 Month US LIBOR + 0.80%), 3.306%, | | |
| 2/25/34 | 26,157 | 25,413 |
| Merrill Lynch Mortgage Investors Trust FRB | | |
| Ser. 05-A2, Class A2, 3.677%, 2/25/35W | 10,325 | 10,624 |
| |
| 22Putnam VT Global Asset Allocation Fund |
| | |
| MORTGAGE-BACKED | | |
| SECURITIES (1.7%)*cont. | Principal amount | Value |
| Residential mortgage-backed securities (non-agency)cont. | |
| New Century Home Equity Loan Trust FRB Ser. 03-4, | | |
| Class M1, (1 Month US LIBOR + 1.13%), 3.631%, | | |
| 10/25/33 | $62,493 | $62,398 |
| Park Place Securities, Inc. Asset-Backed | | |
| Pass-Through Certificates FRB Ser. 04-WCW2, | | |
| Class M3, (1 Month US LIBOR + 1.05%), 3.556%, | | |
| 10/25/34 | 30,000 | 29,536 |
| Structured Asset Investment Loan Trust FRB | | |
| Ser. 04-10, Class A10, (1 Month US LIBOR | | |
| + 0.90%), 3.406%, 11/25/34 | 33,386 | 33,280 |
| Structured Asset Mortgage Investments II Trust | | |
| FRB Ser. 07-AR7, Class 1A1, (1 Month US LIBOR | | |
| + 0.85%), 3.356%, 5/25/47 | 39,744 | 33,111 |
| WaMu Mortgage Pass-Through Certificates Trust | | |
| FRB Ser. 05-AR12, Class 1A8, 4.038%, 10/25/35W | 38,874 | 37,878 |
| FRB Ser. 05-AR9, Class A1C3, (1 Month US LIBOR | | |
| + 0.96%), 3.466%, 7/25/45 | 45,549 | 44,128 |
| FRB Ser. 05-AR13, Class A1C3, (1 Month US LIBOR | | |
| + 0.49%), 2.996%, 10/25/45 | 18,882 | 17,947 |
| Wells Fargo Mortgage Backed Securities Trust FRB | | |
| Ser. 06-AR2, Class 1A1, 4.595%, 3/25/36W | 17,895 | 17,716 |
| | | 771,257 |
| | |
| Total mortgage-backed securities (cost $2,100,530) | $2,154,103 |
| | |
| COMMODITY LINKED NOTES (1.2%)* ††† | Principal amount | Value |
| Goldman Sachs International 144A notes zero %, | |
| 2019 (Indexed to the S&P GSCI Excess Return | |
| Index multiplied by 3) | $1,533,000 | $1,534,237 |
| Total commodity Linked Notes (cost $1,533,000) | $1,534,237 |
| |
| ASSET-BACKED SECURITIES (0.5%)* | Principal amount | Value |
| |
| loanDepot Station Place Agency Securitization | |
| Trust 144A FRB Ser. 17-LD1, Class A, (1 Month US | |
| LIBOR + 0.80%), 3.306%, 11/25/50 | $62,000 | $62,000 |
| Station Place Securitization Trust 144A | | |
| FRB Ser. 18-1, Class A, (1 Month US LIBOR | | |
| + 0.90%), 3.215%, 4/24/19 | 162,000 | 162,000 |
| FRB Ser. 18-5, Class A, (1 Month US LIBOR | | |
| + 0.70%), 3.015%, 9/24/19 | 72,000 | 72,000 |
| FRB Ser. 18-3, Class A, (1 Month US LIBOR | | |
| + 0.70%), 3.015%, 7/24/19 | 128,000 | 128,000 |
| FRB Ser. 18-8, Class A, (1 Month US LIBOR | | |
| + 0.70%), 2.982%, 2/24/20 | 90,000 | 90,000 |
| Towd Point Asset Trust 144A FRB Ser. 18-SL1, | |
| Class A, (1 Month US LIBOR + 0.60%), 3.106%, | | |
| 1/25/46 | 85,787 | 85,014 |
| Total asset-backed securities (cost $599,442) | $599,014 |
| |
| FOREIGN GOVERNMENT AND AGENCY | | |
| BONDS AND NOTES (0.4%)* | Principal amount | Value |
| |
| Argentina (Republic of) sr. unsec. | | |
| unsub. notes 7.50%, 4/22/26 (Argentina) | $150,000 | $120,375 |
| Buenos Aires (Province of) 144A sr. unsec. | | |
| unsub. bonds 7.875%, 6/15/27 (Argentina) | 165,000 | 117,975 |
| Indonesia (Republic of) sr. unsec. | | |
| unsub. notes Ser. REGS, 5.875%, 1/15/24 | | |
| (Indonesia) | 200,000 | 212,750 |
| Mexico (Government of) sr. unsec. bonds 5.55%, | |
| 1/21/45 (Mexico) | 23,000 | 23,251 |
| Venezuela (Republic of) sr. unsec. notes 9.00%, | |
| 5/7/23 (Venezuela) (In default) † | 23,000 | 5,089 |
| | |
| FOREIGN GOVERNMENT AND AGENCY | | |
| BONDS AND NOTES (0.4%)*cont. | Principal amount | Value |
| |
| Venezuela (Republic of) sr. unsec. | | |
| unsub. notes 8.25%, 10/13/24 | | |
| (Venezuela) (In default) † | $36,000 | $8,280 |
| Total foreign government and agency bonds | | |
| and notes (cost $586,947) | | $487,720 |
| |
| SENIOR LOANS (0.2%)*c | Principal amount | Value |
| Avaya, Inc. bank term loan FRN Ser. B, (BBA LIBOR | | |
| USD 3 Month + 4.25%), 6.701%, 12/15/24 | $19,788 | $19,107 |
| California Resources Corp. bank term loan FRN | | |
| (BBA LIBOR USD 3 Month + 4.75%), 7.037%, | | |
| 11/17/22 | 20,000 | 18,600 |
| CPG International, Inc. bank term loan FRN (BBA | | |
| LIBOR USD 3 Month + 3.75%), 6.633%, 5/5/24 | 4,663 | 4,453 |
| Forterra Finance, LLC bank term loan FRN (BBA | | |
| LIBOR USD 3 Month + 3.00%), 5.522%, 10/25/23 | 9,887 | 8,809 |
| FTS International, Inc. bank term loan FRN | | |
| Ser. B, (BBA LIBOR USD 3 Month + 4.75%), 7.272%, | | |
| 4/16/21 | 4,027 | 3,967 |
| Gates Global, LLC bank term loan FRN Ser. B, (BBA | | |
| LIBOR USD 3 Month + 2.75%), 5.272%, 3/31/24 | 13,803 | 13,087 |
| Jo-Ann Stores, LLC bank term loan FRN (BBA LIBOR | | |
| USD 3 Month + 9.25%), 11.604%, 5/21/24 | 15,000 | 14,475 |
| KCA Deutag Alpha, Ltd. bank term loan FRN Ser. B, | | |
| (BBA LIBOR USD 3 Month + 6.75%), 9.021%, 3/21/23 | 3,956 | 3,224 |
| Keane Group Holdings, LLC bank term loan FRN | | |
| Ser. B, (BBA LIBOR USD 3 Month + 3.75%), 6.313%, | | |
| 5/25/25 | 13 | 12 |
| Navistar, Inc. bank term loan FRN Ser. B, (BBA | | |
| LIBOR USD 3 Month + 3.50%), 5.89%, 11/6/24 | 34,738 | 33,261 |
| Neiman Marcus Group, Ltd., Inc. bank term loan | | |
| FRN (BBA LIBOR USD 3 Month + 3.25%), 5.63%, | | |
| 10/25/20 | 18,721 | 15,843 |
| Rackspace Hosting, Inc. bank term loan FRN (BBA | | |
| LIBOR USD 3 Month + 3.00%), 5.582%, 11/3/23 | 4,962 | 4,339 |
| Revlon Consumer Products Corp. bank term loan FRN | | |
| Ser. B, (BBA LIBOR USD 3 Month + 3.50%), 6.207%, | | |
| 9/7/23 | 9,524 | 6,703 |
| Robertshaw Holdings Corp. bank term loan FRN (BBA | | |
| LIBOR USD 3 Month + 8.00%), 10.563%, 2/28/26 | 10,000 | 9,100 |
| Robertshaw Holdings Corp. bank term loan FRN (BBA | | |
| LIBOR USD 3 Month + 3.50%), 6.063%, 2/28/25 | 9,925 | 8,933 |
| Titan Acquisition, Ltd. (United Kingdom) bank | | |
| term loan FRN Ser. B, (BBA LIBOR USD 3 Month | | |
| + 3.00%), 5.522%, 3/28/25 | 24,813 | 22,812 |
| Total senior loans (cost $199,488) | | $186,725 |
| | | | |
| PURCHASED OPTIONS | | | | |
| OUTSTANDING (—%)* | Expiration | Notional | Contract | |
| Counterparty | date/strike price | amount | amount | Value |
| Bank of America N.A. | | | | |
| GBP/USD (Call) | Jun-19/$1.34 | 1,037,843 | GBP 814,250 | $17,288 |
| Citibank, N.A. | | | | |
| USD/JPY (Put) | Jan-19/JPY 108.00 | $2,124,400 | $2,124,400 | 10,469 |
| Goldman Sachs International | | | |
| USD/CNH (Call) | Apr-19/CNH 7.00 | 1,135,300 | 1,135,300 | 6,009 |
| JPMorgan Chase Bank N.A. | | | |
| EUR/NOK (Put) | Mar-19/NOK 9.80 | 505,161 | EUR 440,900 | 4,043 |
| Total purchased options outstanding (cost $47,314) | $37,809 |
| |
| Putnam VT Global Asset Allocation Fund23 |
| | |
| PREFERRED STOCKS (—%)* | Shares | Value |
| GMAC Capital Trust I Ser. 2, $1.91 cum. ARP | $680 | $17,238 |
| Total preferred stocks (cost $17,000) | | $17,238 |
| |
| CONVERTIBLE PREFERRED STOCKS (—%)* | Shares | Value |
| EPR Properties Ser. C, $1.438 cv. pfd.R | 575 | $15,333 |
| Nine Point Energy 6.75% cv. pfd. | 1 | 1,176 |
| Total convertible preferred stocks (cost $11,501) | | $16,509 |
| | |
| CONVERTIBLE BONDS AND NOTES (—%)* | Principal amount | Value |
| DISH Network Corp. cv. sr. unsec. notes | | |
| 3.375%, 8/15/26 | $5,000 | $4,038 |
| Total convertible bonds and notes (cost $4,653) | $4,038 |
| | | | |
| | Expiration | | | |
| WARRANTS (—%)* † | date | Strike price | Warrants | Value |
| Halcon Resources Corp. | 9/9/20 | $14.04 | 244 | $5 |
| Total warrants (cost $—) | | | | $5 |
| |
| | | Principal amount/ | |
| SHORT-TERM INVESTMENTS (13.6%)* | | shares | Value |
| Putnam Short Term Investment | | | |
| Fund 2.58%L | | Shares | 16,270,462 | $16,270,462 |
| U.S. Treasury Bills 2.543%, 6/13/19 § | | $3,000 | 2,967 |
| U.S. Treasury Bills 2.471%, 6/27/19 # | | 1,001 | 988 |
| U.S. Treasury Bills 2.419%, 2/19/19 # § | | 3,000 | 2,990 |
| U.S. Treasury Bills 2.407%, 3/14/19 # § | | 125,999 | 125,408 |
| U.S. Treasury Bills 2.381%, 3/7/19 # | | 11,999 | 11,950 |
| U.S. Treasury Bills 2.376%, 2/14/19 # | | 62,000 | 61,822 |
| U.S. Treasury Bills 2.294%, 1/24/19 § | | 46,000 | 45,935 |
| U.S. Treasury Bills 2.297%, 1/17/19 # § | | 86,000 | 85,918 |
| U.S. Treasury Bills 2.271%, 1/10/19 # § | | 168,000 | 167,917 |
| Total short-term investments (cost $16,776,336) | | $16,776,357 |
| | | | |
| Total investments (cost $123,842,715) | | | $125,477,137 |
| |
| Key to holding’s currency abbreviations |
| |
| CNH | Chinese Yuan (Offshore) | |
| EUR | Euro |
| GBP | British Pound |
| JPY | Japanese Yen |
| NOK | Norwegian Krone |
| USD/$ | United States Dollar |
| |
| Key to holding’s abbreviations |
| | |
| ARP | Adjustable Rate Preferred Stock: the rate shown is the current interest | |
| | rate at the close of the reporting period |
| DAC | Designated Activity Company | |
| FRB | Floating Rate Bonds: the rate shown is the current interest rate at the | |
| | close of the reporting period. Rates may be subject to a cap or floor. |
| | For certain securities, the rate may represent a fixed rate currently in |
| | place at the close of the reporting period. |
| FRN | Floating Rate Notes: the rate shown is the current interest rate or | |
| | yield at the close of the reporting period. Rates may be subject to a |
| | cap or floor. For certain securities, the rate may represent a fixed rate |
| | currently in place at the close of the reporting period. |
| GDR | Global Depository Receipts: represents ownership of foreign | |
| | securities on deposit with a custodian bank |
| IFB | Inverse Floating Rate Bonds, which are securities that pay interest | |
| | rates that vary inversely to changes in the market interest rates. As |
| | interest rates rise, inverse floaters produce less current income. The |
| | rate shown is the current interest rate at the close of the reporting |
| | period. Rates may be subject to a cap or floor. |
| IO | Interest Only |
| PO | Principal Only |
| TBA | To Be Announced Commitments | |
Notes to the fund’s portfolio
Unless noted otherwise, the notes to the fund’s portfolio are for the close of the fund’s reporting period, which ran from January 1, 2018 through December 31, 2018 (the reporting period). Within the following notes to the portfolio, references to “Putnam Management” represent Putnam Investment Management, LLC, the fund’s manager, an indirect wholly-owned subsidiary of Putnam Investments, LLC and references to “ASC 820” represent Accounting Standards Codification 820Fair Value Measurements and Disclosures.
* Percentages indicated are based on net assets of $123,619,987.
†††The value of the commodity linked notes, which are marked to market daily, may be based on a multiple of the performance of the index. The multiple (or leverage) will increase the volatility of the note’s value relative to the change in the underlying index.
† This security is non-income-producing.
‡‡ Income may be received in cash or additional securities at the discretion of the issuer. The rate shown in parenthesis is the rate paid in kind, if applicable.
# This security, in part or in entirety, was pledged and segregated with the broker to cover margin requirements for futures contracts at the close of the reporting period. Collateral at period end totaled $407,981 and is included in Investments in securities on the Statement of assets and liabilities (Notes 1 and 9).
§ This security, in part or in entirety, was pledged and segregated with the custodian for collateral on the initial margin on certain centrally cleared derivative contracts at the close of the reporting period. Collateral at period end totaled $97,837 and is included in Investments in securities on the Statement of assets and liabilities (Notes 1 and 9).
cSenior loans are exempt from registration under the Securities Act of 1933, as amended, but contain certain restrictions on resale and cannot be sold publicly.These loans pay interest at rates which adjust periodically. The interest rates shown for senior loans are the current interest rates at the close of the reporting period. Senior loans are also subject to mandatory and/or optional prepayment which cannot be predicted. As a result, the remaining maturity may be substantially less than the stated maturity shown (Notes 1 and 7).
FThis security is valued by Putnam Management at fair value following procedures approved by the Trustees. Securities are classified as Level 3 for ASC 820 based on the securities’ valuation inputs. At the close of the reporting period, fair value pricing was also used for certain foreign securities in the portfolio (Note 1).
LAffiliated company (Note 5). The rate quoted in the security description is the annualized 7-day yield of the fund at the close of the reporting period.
RReal Estate Investment Trust.
WThe rate shown represents the weighted average coupon associated with the underlying mortgage pools. Rates may be subject to a cap or floor.
At the close of the reporting period, the fund maintained liquid assets totaling $5,524,207 to cover certain derivative contracts and delayed delivery securities.
Unless otherwise noted, the rates quoted in Short-term investments security descriptions represent the weighted average yield to maturity.
Debt obligations are considered secured unless otherwise indicated.
144A after the name of an issuer represents securities exempt from registration under Rule 144A of the Securities Act of 1933, as amended. These securities may be resold in transactions exempt from registration, normally to qualified institutional buyers.
See Note 1 to the financial statements regarding TBA commitments.
The dates shown on debt obligations are the original maturity dates.
| |
| 24Putnam VT Global Asset Allocation Fund |
| | | | | | |
| FORWARD CURRENCY CONTRACTS at 12/31/18 (aggregate face value $13,588,711) | | | | Unrealized |
| | | Contract | Delivery | | Aggregate | appreciation/ |
| Counterparty | Currency | type* | date | Value | face value | (depreciation) |
| Bank of America N.A. | | | | | | |
| | Australian Dollar | Buy | 1/16/19 | $144,784 | $152,218 | $(7,434) |
| | Brazilian Real | Buy | 1/3/19 | 132,465 | 133,733 | (1,268) |
| | Brazilian Real | Sell | 1/3/19 | 132,465 | 131,220 | (1,245) |
| | British Pound | Buy | 3/20/19 | 124,225 | 124,589 | (364) |
| | Canadian Dollar | Buy | 1/16/19 | 272,076 | 282,478 | (10,402) |
| | Euro | Buy | 3/20/19 | 556,508 | 552,508 | 4,000 |
| | Hong Kong Dollar | Sell | 2/20/19 | 222,257 | 222,308 | 51 |
| | Japanese Yen | Buy | 2/20/19 | 12,241 | 11,290 | 951 |
| | New Zealand Dollar | Sell | 1/16/19 | 120,910 | 120,968 | 58 |
| | South Korean Won | Buy | 2/20/19 | 134,716 | 135,104 | (388) |
| | South Korean Won | Sell | 2/20/19 | 135,614 | 132,766 | (2,848) |
| Barclays Bank PLC | | | | | | |
| | Australian Dollar | Buy | 1/16/19 | 138,513 | 141,705 | (3,192) |
| | British Pound | Sell | 3/20/19 | 1,023 | 1,025 | 2 |
| | Canadian Dollar | Buy | 1/16/19 | 129,040 | 133,719 | (4,679) |
| | Euro | Sell | 3/20/19 | 135,841 | 134,800 | (1,041) |
| | Singapore Dollar | Buy | 2/20/19 | 1,689 | 1,552 | 137 |
| Citibank, N.A. | | | | | | |
| | Australian Dollar | Buy | 1/16/19 | 138,584 | 141,428 | (2,844) |
| | Canadian Dollar | Sell | 1/16/19 | 28,871 | 40,731 | 11,860 |
| | Danish Krone | Buy | 3/20/19 | 136,707 | 136,160 | 547 |
| | Euro | Sell | 3/20/19 | 26,638 | 26,465 | (173) |
| | Japanese Yen | Sell | 2/20/19 | 72,430 | 70,083 | (2,347) |
| | Norwegian Krone | Sell | 3/20/19 | 61,435 | 60,706 | (729) |
| | South Korean Won | Buy | 2/20/19 | 1,813 | 649 | 1,164 |
| Credit Suisse International | | | | | | |
| | Australian Dollar | Buy | 1/16/19 | 446,187 | 454,917 | (8,730) |
| | Canadian Dollar | Buy | 1/16/19 | 132,850 | 145,642 | (12,792) |
| | Euro | Sell | 3/20/19 | 202,954 | 201,790 | (1,164) |
| | Japanese Yen | Sell | 2/20/19 | 70,883 | 68,795 | (2,088) |
| | New Zealand Dollar | Sell | 1/16/19 | 144,206 | 142,163 | (2,043) |
| Goldman Sachs International | | | | | | |
| | Australian Dollar | Sell | 1/16/19 | 420,261 | 432,491 | 12,230 |
| | Brazilian Real | Buy | 1/3/19 | 132,465 | 133,918 | (1,453) |
| | Brazilian Real | Sell | 1/3/19 | 132,465 | 132,439 | (26) |
| | Brazilian Real | Buy | 4/2/19 | 131,595 | 131,567 | 28 |
| | Brazilian Real | Sell | 4/2/19 | 131,595 | 130,430 | (1,165) |
| | Canadian Dollar | Sell | 1/16/19 | 88,371 | 92,955 | 4,584 |
| | Euro | Sell | 3/20/19 | 253,346 | 252,258 | (1,088) |
| | New Taiwan Dollar | Buy | 2/20/19 | 133,857 | 134,269 | (412) |
| | New Taiwan Dollar | Sell | 2/20/19 | 134,360 | 133,605 | (755) |
| | New Zealand Dollar | Buy | 1/16/19 | 885,175 | 904,566 | (19,391) |
| | Norwegian Krone | Buy | 3/20/19 | 827,074 | 845,254 | (18,180) |
| | South African Rand | Buy | 1/16/19 | 1,735 | 9,404 | (7,669) |
| | Swedish Krona | Sell | 3/20/19 | 202,358 | 199,598 | (2,760) |
| HSBC Bank USA, National Association | | | | | | |
| | Australian Dollar | Sell | 1/16/19 | 34,945 | 24,792 | (10,153) |
| | British Pound | Buy | 3/20/19 | 236,935 | 236,067 | 868 |
| | Canadian Dollar | Sell | 1/16/19 | 81,336 | 79,235 | (2,101) |
| | Chinese Yuan (Offshore) | Buy | 2/20/19 | 161,004 | 160,564 | 440 |
| | Euro | Sell | 3/20/19 | 162,132 | 160,549 | (1,583) |
| | Japanese Yen | Sell | 2/20/19 | 141,465 | 138,217 | (3,248) |
| |
| Putnam VT Global Asset Allocation Fund25 |
| | | | | | |
| FORWARD CURRENCY CONTRACTS at 12/31/18 (aggregate face value $13,588,711)cont. | | | | Unrealized |
| | | Contract | Delivery | | Aggregate | appreciation/ |
| Counterparty | Currency | type* | date | Value | face value | (depreciation) |
| HSBC Bank USA, National Associationcont. | | | | | |
| | Mexican Peso | Sell | 1/16/19 | $2,905 | $1,910 | $(995) |
| | New Zealand Dollar | Buy | 1/16/19 | 244,842 | 241,289 | 3,553 |
| | Norwegian Krone | Buy | 3/20/19 | 129,763 | 135,741 | (5,978) |
| | Swedish Krona | Sell | 3/20/19 | 65,799 | 64,368 | (1,431) |
| JPMorgan Chase Bank N.A. | | | | | | |
| | Australian Dollar | Buy | 1/16/19 | 115,264 | 116,851 | (1,587) |
| | British Pound | Buy | 3/20/19 | 47,848 | 51,086 | (3,238) |
| | Canadian Dollar | Sell | 1/16/19 | 298,161 | 308,494 | 10,333 |
| | Euro | Sell | 3/20/19 | 66,190 | 65,296 | (894) |
| | Japanese Yen | Buy | 2/20/19 | 123,394 | 122,538 | 856 |
| | New Zealand Dollar | Buy | 1/16/19 | 25,109 | 22,886 | 2,223 |
| | Norwegian Krone | Sell | 3/20/19 | 26,644 | 24,107 | (2,537) |
| | Singapore Dollar | Buy | 2/20/19 | 67,719 | 68,257 | (538) |
| | Swedish Krona | Sell | 3/20/19 | 77,765 | 78,113 | 348 |
| | Swiss Franc | Buy | 3/20/19 | 297,061 | 294,308 | 2,753 |
| NatWest Markets PLC | | | | | | |
| | Australian Dollar | Buy | 1/16/19 | 175,502 | 180,720 | (5,218) |
| | Canadian Dollar | Sell | 1/16/19 | 3,883 | 5,752 | 1,869 |
| | Euro | Buy | 3/20/19 | 251,847 | 250,945 | 902 |
| | Japanese Yen | Buy | 2/20/19 | 53,939 | 55,491 | (1,552) |
| | New Zealand Dollar | Sell | 1/16/19 | 266,862 | 266,922 | 60 |
| | Norwegian Krone | Buy | 3/20/19 | 133,976 | 138,984 | (5,008) |
| | Swedish Krona | Sell | 3/20/19 | 31,458 | 31,145 | (313) |
| State Street Bank and Trust Co. | | | | | | |
| | Australian Dollar | Buy | 1/16/19 | 144,009 | 148,941 | (4,932) |
| | Canadian Dollar | Sell | 1/16/19 | 443,909 | 457,076 | 13,167 |
| | Euro | Sell | 3/20/19 | 347,213 | 344,853 | (2,360) |
| | Japanese Yen | Buy | 2/20/19 | 41,552 | 42,579 | (1,027) |
| | New Zealand Dollar | Sell | 1/16/19 | 281,295 | 277,988 | (3,307) |
| | Norwegian Krone | Sell | 3/20/19 | 9,493 | 1,139 | (8,354) |
| | Swedish Krona | Sell | 3/20/19 | 243,261 | 241,902 | (1,359) |
| UBS AG | | | | | | |
| | Australian Dollar | Sell | 1/16/19 | 79,473 | 82,907 | 3,434 |
| | British Pound | Sell | 3/20/19 | 139,193 | 139,450 | 257 |
| | Canadian Dollar | Buy | 1/16/19 | 63,311 | 64,429 | (1,118) |
| | Euro | Sell | 3/20/19 | 220,482 | 218,924 | (1,558) |
| | New Zealand Dollar | Sell | 1/16/19 | 180,795 | 181,527 | 732 |
| | Norwegian Krone | Buy | 3/20/19 | 217,065 | 221,811 | (4,746) |
| WestPac Banking Corp. | | | | | | |
| | Australian Dollar | Sell | 1/16/19 | 130,411 | 133,511 | 3,100 |
| | Canadian Dollar | Sell | 1/16/19 | 248,117 | 251,921 | 3,804 |
| | New Zealand Dollar | Sell | 1/16/19 | 23,766 | 20,860 | (2,906) |
| Unrealized appreciation | | | | | | 84,311 |
| Unrealized (depreciation) | | | | | | (196,711) |
| Total | | | | | | $(112,400) |
* The exchange currency for all contracts listed is the United States Dollar.
| |
| 26Putnam VT Global Asset Allocation Fund |
| | | | | |
| FUTURES | | | | | |
| CONTRACTS | Number | | | | Unrealized |
| OUTSTANDING | of | Notional | | Expiration | appreciation/ |
| at 12/31/18 | contracts | amount | Value | date | (depreciation) |
| Russell 2000 | | | | | |
| Index E-Mini | | | | | |
| (Long) | 71 | $4,787,383 | $4,788,950 | Mar-19 | $(306,129) |
| S&P 500 Index | | | | | |
| E-Mini (Long) | 30 | 3,760,275 | 3,757,800 | Mar-19 | (215,907) |
| S&P 500 Index | | | | | |
| E-Mini (Short) | 36 | 4,512,330 | 4,509,360 | Mar-19 | 259,141 |
| Tokyo Price Index | | | | | |
| (Long) | 11 | 1,499,474 | 1,498,882 | Mar-19 | (80,484) |
| U.S. Treasury | | | | | |
| Bond 30 yr (Long) | 8 | 1,168,000 | 1,168,000 | Mar-19 | 52,797 |
| U.S. Treasury | | | | | |
| Bond Ultra 30 yr | | | | | |
| (Long) | 17 | 2,731,156 | 2,731,156 | Mar-19 | 150,685 |
| U.S. Treasury | | | | | |
| Note 2 yr (Long) | 27 | 5,732,438 | 5,732,438 | Mar-19 | 35,087 |
| U.S. Treasury | | | | | |
| Note 2 yr (Short) | 26 | 5,520,125 | 5,520,125 | Mar-19 | (34,099) |
| U.S. Treasury | | | | | |
| Note 5 yr (Long) | 56 | 6,422,500 | 6,422,500 | Mar-19 | 96,247 |
| | | | |
| FUTURES | | | | |
| CONTRACTS | Number | | | Unrealized |
| OUTSTANDING | of | Notional | | Expiration | appreciation/ |
| at 12/31/18cont. | contracts | amount | Value | date | (depreciation) |
| U.S. Treasury | | | | |
| Note 10 yr (Long) | 18 | $2,196,281 | $2,196,281 | Mar-19 | $48,339 |
| U.S. Treasury | | | | |
| Note 10 yr (Short) | 44 | 5,368,688 | 5,368,688 | Mar-19 | (118,339) |
| Unrealized appreciation | | | 642,296 |
| Unrealized (depreciation) | | | (754,958) |
| Total | | | | $(112,662) |
| | | | | |
| WRITTEN OPTIONS OUTSTANDING at 12/31/18 (premiums $19,019) | |
| | Expiration | Notional | | Contract | |
| Counterparty | date/strike price | amount | | amount | Value |
| Bank of America N.A. | | | | |
| GBP/USD (Call) | Jun-19/$1.44 | 1,556,733 | GBP | $1,221,350 | $5,685 |
| Citibank, N.A. | | | | | |
| USD/JPY (Put) | Jan-19/JPY 105.00 | $2,124,400 | | $2,124,400 | 2,717 |
| Goldman Sachs International | | | | |
| USD/CNH (Call) | Apr-19/CNH 7.20 | 1,135,300 | | 1,135,300 | 2,132 |
| JPMorgan Chase Bank N.A. | | | | |
| EUR/NOK (Put) | Mar-19/NOK 9.60 | 757,799 | EUR | 661,400 | 2,192 |
| Total | | | | | $12,726 |
| | | | | | | |
| TBA SALE COMMITMENTS OUTSTANDING at 12/31/18 | | | Principal | Settlement | |
| (proceeds receivable $954,219) | | | | | amount | date | Value |
| Federal National Mortgage Association, 3.00%, 1/1/49 | | | $1,000,000 | 1/14/19 | $975,469 |
| Total | | | | | | | $975,469 |
| | | | |
| CENTRALLY CLEARED INTEREST RATE SWAP CONTRACTS OUTSTANDING at 12/31/18 | | | |
| | | Upfront | | | | | Unrealized |
| | | premium | Termination | Payments | Payments | | appreciation/ |
| Notional amount | Value | received (paid) | date | made by fund | received by fund | (depreciation) |
| $151,900 | $3,593E | $(3,196) | 3/18/49 | 3 month USD-LIBOR-BBA — | 2.95% — Semiannually | $397 |
| | | | | Quarterly | | | |
| 32,900 | 778E | 692 | 3/18/49 | 2.95% — Semiannually | 3 month USD-LIBOR- | (86) |
| | | | | | BBA — Quarterly | |
| 286,000 | 3,352E | (1,888) | 3/18/29 | 3 month USD-LIBOR-BBA — | 2.85% — Semiannually | 1,465 |
| | | | | Quarterly | | | |
| 748,300 | 8,772E | 4,908 | 3/18/29 | 2.85% — Semiannually | 3 month USD-LIBOR- | (3,863) |
| | | | | | BBA — Quarterly | |
| 1,759,400 | 18,681E | (11,848) | 3/18/24 | 3 month USD-LIBOR-BBA — | 2.80% — Semiannually | 6,834 |
| | | | | Quarterly | | | |
| 2,617,400 | 27,792E | 17,513 | 3/18/24 | 2.80% — Semiannually | 3 month USD-LIBOR- | (10,279) |
| | | | | | BBA — Quarterly | |
| 3,446,100 | 8,377E | (6,302) | 3/18/21 | 3 month USD-LIBOR-BBA — | 2.75% — Semiannually | 2,074 |
| | | | | Quarterly | | | |
| 4,042,100 | 9,826E | 7,425 | 3/18/21 | 2.75% — Semiannually | 3 month USD-LIBOR- | (2,401) |
| | | | | | BBA — Quarterly | |
| 20,000 | 129 | — | 12/31/28 | 3 month USD-LIBOR-BBA — | 2.7845% — Semiannually | 129 |
| | | | | Quarterly | | | |
| Total | | $7,304 | | | | | $(5,730) |
EExtended effective date.
| |
| Putnam VT Global Asset Allocation Fund27 |
| | | | | | |
| OTC TOTAL RETURN SWAP CONTRACTS OUTSTANDING at 12/31/18 | | | | |
| | | Upfront | | Payments | Total return | Unrealized |
| Swap counterparty/ | | premium | Termination | received (paid) | received by | appreciation/ |
| Notional amount | Value | received (paid) | date | by fund | or paid by fund | (depreciation) |
| Barclays Bank PLC | | | | | | |
| $19,367 | $19,431 | $— | 1/12/40 | 4.50% (1 month USD- | Synthetic MBX Index | $82 |
| | | | | LIBOR) — Monthly | 4.50% 30 year Fannie Mae | |
| | | | | | pools — Monthly | |
| 136,637 | 137,342 | — | 1/12/41 | 5.00% (1 month USD- | Synthetic MBX Index | 861 |
| | | | | LIBOR) — Monthly | 5.00% 30 year Fannie Mae | |
| | | | | | pools — Monthly | |
| 36,569 | 36,590 | — | 1/12/40 | 5.00% (1 month USD- | Synthetic MBX Index | 64 |
| | | | | LIBOR) — Monthly | 5.00% 30 year Fannie Mae | |
| | | | | | pools — Monthly | |
| 22,016 | 22,211 | — | 1/12/38 | (6.50%) 1 month USD- | Synthetic MBX Index | (232) |
| | | | | LIBOR — Monthly | 6.50% 30 year Fannie Mae | |
| | | | | | pools — Monthly | |
| 2,768 | 2,649 | — | 1/12/43 | 3.50% (1 month USD- | Synthetic TRS Index | (97) |
| | | | | LIBOR) — Monthly | 3.50% 30 year Fannie Mae | |
| | | | | | pools — Monthly | |
| 18,974 | 18,104 | — | 1/12/41 | 4.00% (1 month USD- | Synthetic TRS Index | (709) |
| | | | | LIBOR) — Monthly | 4.00% 30 year Fannie Mae | |
| | | | | | pools — Monthly | |
| 15,370 | 14,665 | — | 1/12/41 | 4.00% (1 month USD- | Synthetic TRS Index | (575) |
| | | | | LIBOR) — Monthly | 4.00% 30 year Fannie Mae | |
| | | | | | pools — Monthly | |
| 1,745 | 1,650 | — | 1/12/42 | 4.00% (1 month USD- | Synthetic TRS Index | (81) |
| | | | | LIBOR) — Monthly | 4.00% 30 year Fannie Mae | |
| | | | | | pools — Monthly | |
| 6,416 | 6,043 | — | 1/12/41 | (5.00%) 1 month USD- | Synthetic TRS Index | 311 |
| | | | | LIBOR — Monthly | 5.00% 30 year Fannie Mae | |
| | | | | | pools — Monthly | |
| Citibank, N.A. | | | | | | |
| 6,592,745 | 6,254,375 | — | 11/26/19 | (3 month USD-LIBOR- | A basket (CGPUTQL2) | (339,592) |
| | | | | BBA plus 0.34%) — | of common stocks — | |
| | | | | Quarterly | Quarterly* | |
| 5,571,499 | 5,273,265 | — | 11/26/19 | 3 month USD-LIBOR- | Russell 1000 Total Return | 306,809 |
| | | | | BBA plus 0.25% — | Index — Quarterly | |
| | | | | Quarterly | | |
| 4,963 | 4,988 | — | 1/12/41 | 5.00% (1 month USD- | Synthetic MBX Index | 31 |
| | | | | LIBOR) — Monthly | 5.00% 30 year Fannie Mae | |
| | | | | | pools — Monthly | |
| Credit Suisse International | | | | | | |
| 130,163 | 130,202 | — | 1/12/41 | 4.50% (1 month USD- | Synthetic MBX Index | 159 |
| | | | | LIBOR) — Monthly | 4.50% 30 year Ginnie Mae II | |
| | | | | | pools — Monthly | |
| 7,301 | 6,839 | — | 1/12/45 | 3.50% (1 month USD- | Synthetic TRS Index | (407) |
| | | | | LIBOR) — Monthly | 3.50% 30 year Fannie Mae | |
| | | | | | pools — Monthly | |
| 27,136 | 25,891 | — | 1/12/41 | (4.00%) 1 month USD- | Synthetic TRS Index | 1,015 |
| | | | | LIBOR — Monthly | 4.00% 30 year Fannie Mae | |
| | | | | | pools — Monthly | |
| Goldman Sachs International | | | | | | |
| 4,309 | 4,075 | — | 1/12/42 | 4.00% (1 month USD- | Synthetic TRS Index | (200) |
| | | | | LIBOR) — Monthly | 4.00% 30 year Fannie Mae | |
| | | | | | pools — Monthly | |
| 4,309 | 4,075 | — | 1/12/42 | 4.00% (1 month USD- | Synthetic TRS Index | (200) |
| | | | | LIBOR) — Monthly | 4.00% 30 year Fannie Mae | |
| | | | | | pools — Monthly | |
| |
| 28Putnam VT Global Asset Allocation Fund |
| | | | | | |
| OTC TOTAL RETURN SWAP CONTRACTS OUTSTANDING at 12/31/18cont. | | | |
| | | Upfront | | Payments | Total return | Unrealized |
| Swap counterparty/ | | premium | Termination | received (paid) | received by | appreciation/ |
| Notional amount | Value | received (paid) | date | by fund | or paid by fund | (depreciation) |
| JPMorgan Securities LLC | | | | | | |
| $7,209 | $6,878 | $— | 1/12/41 | (4.00%) 1 month USD- | Synthetic TRS Index | $270 |
| | | | | LIBOR — Monthly | 4.00% 30 year Fannie Mae | |
| | | | | | pools — Monthly | |
| 10,364 | 9,800 | — | 1/12/42 | (4.00%) 1 month USD- | Synthetic TRS Index | 480 |
| | | | | LIBOR — Monthly | 4.00% 30 year Fannie Mae | |
| | | | | | pools — Monthly | |
| Upfront premium received | | — | | Unrealized appreciation | | 310,082 |
| Upfront premium (paid) | | — | | Unrealized (depreciation) | | (342,093) |
| Total | | $— | | Total | | $(32,011) |
* The 50 largest components, and any individual component greater than 1% of basket value, are shown below.
| | | | |
| A BASKET (CGPUTQL2) OF COMMON STOCKS | | | | |
| | | | | Percentage |
| Common stocks | Sector | Shares | Value | value |
| JPMorgan Chase & Co. | Financials | 1,737 | $169,540 | 2.71% |
| Alphabet, Inc. Class A | Communication Services | 149 | 155,950 | 2.49% |
| Starbucks Corp. | Consumer Discretionary | 1,845 | 118,836 | 1.90% |
| Texas Instruments, Inc. | Information Technology | 1,192 | 112,650 | 1.80% |
| Apple, Inc. | Information Technology | 713 | 112,424 | 1.80% |
| Microsoft Corp. | Information Technology | 1,104 | 112,101 | 1.79% |
| Coca-Cola Co. (The) | Consumer Staples | 2,315 | 109,604 | 1.75% |
| TJX Cos., Inc. (The) | Consumer Discretionary | 2,447 | 109,461 | 1.75% |
| Intuit, Inc. | Information Technology | 551 | 108,458 | 1.73% |
| Automatic Data Processing, Inc. | Information Technology | 814 | 106,754 | 1.71% |
| Exelon Corp. | Utilities | 2,341 | 105,557 | 1.69% |
| Mondelez International, Inc. Class A | Consumer Staples | 2,621 | 104,903 | 1.68% |
| Walt Disney Co. (The) | Communication Services | 942 | 103,251 | 1.65% |
| Humana, Inc. | Health Care | 358 | 102,480 | 1.64% |
| American Electric Power Co., Inc. | Utilities | 1,365 | 102,008 | 1.63% |
| Lowe’s Cos., Inc. | Consumer Discretionary | 1,096 | 101,196 | 1.62% |
| Cognizant Technology Solutions Corp. Class A | Information Technology | 1,479 | 93,903 | 1.50% |
| Raytheon Co. | Industrials | 607 | 93,128 | 1.49% |
| Exxon Mobil Corp. | Energy | 1,340 | 91,357 | 1.46% |
| Occidental Petroleum Corp. | Energy | 1,488 | 91,352 | 1.46% |
| Northrop Grumman Corp. | Industrials | 363 | 88,999 | 1.42% |
| Honeywell International, Inc. | Industrials | 658 | 86,895 | 1.39% |
| Johnson & Johnson | Health Care | 662 | 85,387 | 1.37% |
| Omnicom Group, Inc. | Communication Services | 1,152 | 84,378 | 1.35% |
| Centene Corp. | Health Care | 731 | 84,259 | 1.35% |
| American Express Co. | Financials | 870 | 82,938 | 1.33% |
| Norfolk Southern Corp. | Industrials | 528 | 79,014 | 1.26% |
| Pfizer, Inc. | Health Care | 1,790 | 78,139 | 1.25% |
| Citrix Systems, Inc. | Information Technology | 742 | 76,056 | 1.22% |
| Verizon Communications, Inc. | Communication Services | 1,346 | 75,696 | 1.21% |
| Comerica, Inc. | Financials | 1,100 | 75,542 | 1.21% |
| Amazon.com, Inc. | Consumer Discretionary | 49 | 74,061 | 1.18% |
| Cisco Systems, Inc. | Information Technology | 1,670 | 72,365 | 1.16% |
| F5 Networks, Inc. | Information Technology | 439 | 71,200 | 1.14% |
| Fidelity National Information Services, Inc. | Information Technology | 693 | 71,083 | 1.14% |
| Merck & Co., Inc. | Health Care | 866 | 66,197 | 1.06% |
| Allstate Corp. (The) | Financials | 799 | 66,042 | 1.06% |
| VICI Properties, Inc. | Real Estate | 3,429 | 64,393 | 1.03% |
| Baxter International, Inc. | Health Care | 961 | 63,246 | 1.01% |
| AutoZone, Inc. | Consumer Discretionary | 74 | 62,198 | 0.99% |
| Sysco Corp. | Consumer Staples | 990 | 62,040 | 0.99% |
| |
| Putnam VT Global Asset Allocation Fund29 |
| | | | |
| A BASKET (CGPUTQL2) OF COMMON STOCKScont. | | | | |
| | | | | Percentage |
| Common stocks | Sector | Shares | Value | value |
| Marathon Petroleum Corp. | Energy | 1,035 | $61,067 | 0.98% |
| Ross Stores, Inc. | Consumer Discretionary | 723 | 60,120 | 0.96% |
| AGNC Investment Corp. | Financials | 3,324 | 58,301 | 0.93% |
| Waste Management, Inc. | Industrials | 640 | 56,930 | 0.91% |
| UnitedHealth Group, Inc. | Health Care | 216 | 53,873 | 0.86% |
| NXP Semiconductors NV | Information Technology | 731 | 53,604 | 0.86% |
| Juniper Networks, Inc. | Information Technology | 1,981 | 53,301 | 0.85% |
| Equity Residential Trust | Real Estate | 801 | 52,856 | 0.85% |
| Amgen, Inc. | Health Care | 264 | 51,362 | 0.82% |
| | | | | | | |
| OTC CREDIT DEFAULT CONTRACTS OUTSTANDING — PROTECTION SOLD at 12/31/18 | | | | |
| | | Upfront | | | | | |
| | | premium | | | Termi- | | Unrealized |
| Swap counterparty/ | | received | Notional | | nation | Payments | appreciation/ |
| Referenced debt* | Rating*** | (paid)** | amount | Value | date | received by fund | (depreciation) |
| Bank of America N.A. | | | | | | | |
| CMBX NA BBB–.6 Index | BBB–/P | $273 | $4,000 | $645 | 5/11/63 | 300 bp — Monthly | $(369) |
| CMBX NA BBB–.6 Index | BBB–/P | 482 | 8,000 | 1,290 | 5/11/63 | 300 bp — Monthly | (804) |
| CMBX NA BBB–.6 Index | BBB–/P | 926 | 15,000 | 2,420 | 5/11/63 | 300 bp — Monthly | (1,485) |
| CMBX NA BBB–.6 Index | BBB–/P | 912 | 16,000 | 2,581 | 5/11/63 | 300 bp — Monthly | (1,659) |
| Citigroup Global Markets, Inc. | | | | | | | |
| CMBX NA BB.6 Index | BB/P | 2,215 | 9,000 | 2,530 | 5/11/63 | 500 bp — Monthly | (306) |
| CMBX NA BB.7 Index | BB/P | 514 | 4,000 | 728 | 1/17/47 | 500 bp — Monthly | (210) |
| Credit Suisse International | | | | | | | |
| CMBX NA A.6 Index | A/P | 158 | 7,000 | 305 | 5/11/63 | 200 bp — Monthly | (144) |
| CMBX NA A.6 Index | A/P | 369 | 19,000 | 828 | 5/11/63 | 200 bp — Monthly | (452) |
| CMBX NA A.6 Index | A/P | 1,015 | 20,000 | 872 | 5/11/63 | 200 bp — Monthly | 151 |
| CMBX NA A.7 Index | A-/P | 37 | 1,000 | 21 | 1/17/47 | 200 bp — Monthly | 16 |
| CMBX NA A.7 Index | A-/P | 291 | 7,000 | 148 | 1/17/47 | 200 bp — Monthly | 146 |
| CMBX NA BBB–.6 Index | BBB–/P | 435 | 4,000 | 645 | 5/11/63 | 300 bp — Monthly | (208) |
| CMBX NA BBB–.6 Index | BBB–/P | 19,994 | 187,000 | 30,163 | 5/11/63 | 300 bp — Monthly | (10,060) |
| CMBX NA BBB–.7 Index | BBB–/P | 1,379 | 21,000 | 1,787 | 1/17/47 | 300 bp — Monthly | (396) |
| CMBX NA BBB–.7 Index | BBB–/P | 2,371 | 30,000 | 2,553 | 1/17/47 | 300 bp — Monthly | (164) |
| Goldman Sachs International | | | | | | | |
| CMBX NA A.6 Index | A/P | 61 | 2,000 | 87 | 5/11/63 | 200 bp — Monthly | (25) |
| CMBX NA A.6 Index | A/P | 263 | 4,000 | 174 | 5/11/63 | 200 bp — Monthly | 90 |
| CMBX NA A.6 Index | A/P | 354 | 7,000 | 305 | 5/11/63 | 200 bp — Monthly | 52 |
| CMBX NA A.6 Index | A/P | 456 | 9,000 | 392 | 5/11/63 | 200 bp — Monthly | 67 |
| CMBX NA A.6 Index | A/P | 468 | 9,000 | 392 | 5/11/63 | 200 bp — Monthly | 79 |
| CMBX NA A.6 Index | A/P | 560 | 11,000 | 480 | 5/11/63 | 200 bp — Monthly | 84 |
| CMBX NA A.6 Index | A/P | 433 | 14,000 | 610 | 5/11/63 | 200 bp — Monthly | (172) |
| CMBX NA A.6 Index | A/P | 753 | 24,000 | 1,046 | 5/11/63 | 200 bp — Monthly | (284) |
| CMBX NA A.6 Index | A/P | 602 | 26,000 | 1,134 | 5/11/63 | 200 bp — Monthly | (522) |
| CMBX NA A.6 Index | A/P | 1,868 | 31,000 | 1,352 | 5/11/63 | 200 bp — Monthly | 529 |
| CMBX NA A.6 Index | A/P | 3,382 | 55,000 | 2,398 | 5/11/63 | 200 bp — Monthly | 1,005 |
| CMBX NA BBB–.6 Index | BBB–/P | 79 | 1,000 | 161 | 5/11/63 | 300 bp — Monthly | (82) |
| CMBX NA BBB–.6 Index | BBB–/P | 156 | 3,000 | 484 | 5/11/63 | 300 bp — Monthly | (326) |
| CMBX NA BBB–.6 Index | BBB–/P | 325 | 3,000 | 484 | 5/11/63 | 300 bp — Monthly | (157) |
| CMBX NA BBB–.6 Index | BBB–/P | 204 | 3,000 | 484 | 5/11/63 | 300 bp — Monthly | (278) |
| CMBX NA BBB–.6 Index | BBB–/P | 244 | 5,000 | 807 | 5/11/63 | 300 bp — Monthly | (560) |
| CMBX NA BBB–.6 Index | BBB–/P | 248 | 5,000 | 807 | 5/11/63 | 300 bp — Monthly | (556) |
| CMBX NA BBB–.6 Index | BBB–/P | 772 | 7,000 | 1,129 | 5/11/63 | 300 bp — Monthly | (353) |
| CMBX NA BBB–.6 Index | BBB–/P | 604 | 7,000 | 1,129 | 5/11/63 | 300 bp — Monthly | (521) |
| CMBX NA BBB–.6 Index | BBB–/P | 919 | 19,000 | 3,065 | 5/11/63 | 300 bp — Monthly | (2,134) |
| CMBX NA BBB–.6 Index | BBB–/P | 2,679 | 22,000 | 3,549 | 5/11/63 | 300 bp — Monthly | (857) |
| CMBX NA BBB–.6 Index | BBB–/P | 4,033 | 43,000 | 6,936 | 5/11/63 | 300 bp — Monthly | (2,878) |
| |
| 30Putnam VT Global Asset Allocation Fund |
| | | | | | | |
| OTC CREDIT DEFAULT CONTRACTS OUTSTANDING — PROTECTION SOLD at 12/31/18cont. | | | | |
| | | Upfront | | | | | |
| | | premium | | | Termi- | | Unrealized |
| Swap counterparty/ | | received | Notional | | nation | Payments | appreciation/ |
| Referenced debt* | Rating*** | (paid)** | amount | Value | date | received by fund | (depreciation) |
| Goldman Sachs Internationalcont. | | | | | | |
| CMBX NA BBB–.6 Index | BBB–/P | $3,608 | $48,000 | $7,742 | 5/11/63 | 300 bp — Monthly | $(4,106) |
| CMBX NA BBB–.7 Index | BBB–/P | 887 | 12,000 | 1,021 | 1/17/47 | 300 bp — Monthly | (127) |
| JPMorgan Securities LLC | | | | | | | |
| CMBX NA BB.6 Index | BB/P | 636 | 3,000 | 843 | 5/11/63 | 500 bp — Monthly | (205) |
| CMBX NA BB.6 Index | BB/P | 635 | 3,000 | 843 | 5/11/63 | 500 bp — Monthly | (205) |
| CMBX NA A.6 Index | A/P | 51 | 1,000 | 44 | 5/11/63 | 200 bp — Monthly | 8 |
| CMBX NA A.6 Index | A/P | 86 | 5,000 | 218 | 5/11/63 | 200 bp — Monthly | (130) |
| CMBX NA A.6 Index | A/P | 319 | 7,000 | 305 | 5/11/63 | 200 bp — Monthly | 16 |
| CMBX NA A.6 Index | A/P | 406 | 8,000 | 349 | 5/11/63 | 200 bp — Monthly | 60 |
| CMBX NA A.6 Index | A/P | 234 | 10,000 | 436 | 5/11/63 | 200 bp — Monthly | (199) |
| CMBX NA A.6 Index | A/P | 234 | 10,000 | 436 | 5/11/63 | 200 bp — Monthly | (199) |
| CMBX NA A.6 Index | A/P | 557 | 17,000 | 741 | 5/11/63 | 200 bp — Monthly | (178) |
| CMBX NA A.6 Index | A/P | 726 | 24,000 | 1,046 | 5/11/63 | 200 bp — Monthly | (311) |
| CMBX NA A.6 Index | A/P | 704 | 25,000 | 1,090 | 5/11/63 | 200 bp — Monthly | (377) |
| CMBX NA A.6 Index | A/P | 1,707 | 29,000 | 1,264 | 5/11/63 | 200 bp — Monthly | 453 |
| CMBX NA A.6 Index | A/P | 1,501 | 33,000 | 1,439 | 5/11/63 | 200 bp — Monthly | 75 |
| CMBX NA A.6 Index | A/P | 2,902 | 60,000 | 2,616 | 5/11/63 | 200 bp — Monthly | 309 |
| CMBX NA A.6 Index | A/P | 7,051 | 117,000 | 5,101 | 5/11/63 | 200 bp — Monthly | 1,995 |
| CMBX NA BBB–.6 Index | BBB–/P | 311 | 2,000 | 323 | 5/11/63 | 300 bp — Monthly | (11) |
| CMBX NA BBB–.6 Index | BBB–/P | 339 | 3,000 | 484 | 5/11/63 | 300 bp — Monthly | (143) |
| CMBX NA BBB–.6 Index | BBB–/P | 423 | 3,000 | 484 | 5/11/63 | 300 bp — Monthly | (59) |
| CMBX NA BBB–.6 Index | BBB–/P | 336 | 3,000 | 484 | 5/11/63 | 300 bp — Monthly | (146) |
| CMBX NA BBB–.6 Index | BBB–/P | 550 | 5,000 | 807 | 5/11/63 | 300 bp — Monthly | (253) |
| CMBX NA BBB–.6 Index | BBB–/P | 567 | 5,000 | 807 | 5/11/63 | 300 bp — Monthly | (236) |
| CMBX NA BBB–.6 Index | BBB–/P | 664 | 7,000 | 1,129 | 5/11/63 | 300 bp — Monthly | (461) |
| CMBX NA BBB–.6 Index | BBB–/P | 2,111 | 12,000 | 1,936 | 5/11/63 | 300 bp — Monthly | 183 |
| CMBX NA BBB–.6 Index | BBB–/P | 11,137 | 93,000 | 15,001 | 5/11/63 | 300 bp — Monthly | (3,809) |
| CMBX NA BBB–.7 Index | BBB–/P | 1,692 | 14,000 | 1,191 | 1/17/47 | 300 bp — Monthly | 509 |
| Merrill Lynch International | | | | | | | |
| CMBX NA BBB–.6 Index | BBB–/P | 224 | 2,000 | 323 | 5/11/63 | 300 bp — Monthly | (97) |
| Morgan Stanley & Co. International PLC | | | | | | |
| CMBX NA BBB–.6 Index | BBB–/P | 968 | 7,000 | 1,129 | 5/11/63 | 300 bp — Monthly | (157) |
| CMBX NA A.6 Index | A/P | 243 | 18,000 | 785 | 5/11/63 | 200 bp — Monthly | (534) |
| CMBX NA BB.6 Index | BB/P | 737 | 3,000 | 843 | 5/11/63 | 500 bp — Monthly | (104) |
| CMBX NA BB.6 Index | BB/P | 1,478 | 6,000 | 1,687 | 5/11/63 | 500 bp — Monthly | (202) |
| CMBX NA BBB–.6 Index | BBB–/P | 969 | 8,000 | 1,290 | 5/11/63 | 300 bp — Monthly | (316) |
| Upfront premium received | | 95,827 | Unrealized appreciation | | | 5,827 |
| Upfront premium (paid) | | — | Unrealized (depreciation) | | | (38,527) |
| Total | | $95,827 | Total | | | | $(32,700) |
* Payments related to the referenced debt are made upon a credit default event.
** Upfront premium is based on the difference between the original spread on issue and the market spread on day of execution.
*** Ratings for an underlying index represent the average of the ratings of all the securities included in that index. The Moody’s, Standard & Poor’s or Fitch ratings are believed to be the most recent ratings available at December 31, 2018. Securities rated by Fitch are indicated by “/F.” Securities rated by Putnam are indicated by “/P.” The Putnam rating categories are comparable to the Standard & Poor’s classifications.
| |
| Putnam VT Global Asset Allocation Fund31 |
| | | | | | |
| OTC CREDIT DEFAULT CONTRACTS OUTSTANDING — PROTECTION PURCHASED at 12/31/18 | | | | |
| | Upfront | | | | | |
| | premium | | | Termi- | Payments | Unrealized |
| Swap counterparty/ | received | Notional | | nation | (paid) | appreciation/ |
| Referenced debt* | (paid)** | amount | Value | date | by fund | (depreciation) |
| Citigroup Global Markets, Inc. | | | | | | |
| CMBX NA BB.7 Index | $(490) | $3,000 | $546 | 1/17/47 | (500 bp) — Monthly | $53 |
| CMBX NA BB.7 Index | (471) | 3,000 | 546 | 1/17/47 | (500 bp) — Monthly | 72 |
| CMBX NA BB.7 Index | (605) | 3,000 | 546 | 1/17/47 | (500 bp) — Monthly | (62) |
| CMBX NA BB.9 Index | (616) | 4,000 | 765 | 9/17/58 | (500 bp) — Monthly | 145 |
| CMBX NA BB.9 Index | (619) | 4,000 | 765 | 9/17/58 | (500 bp) — Monthly | 142 |
| CMBX NA BB.9 Index | (616) | 4,000 | 765 | 9/17/58 | (500 bp) — Monthly | 145 |
| CMBX NA BB.9 Index | (313) | 2,000 | 382 | 9/17/58 | (500 bp) — Monthly | 67 |
| Credit Suisse International | | | | | | |
| CMBX NA BB.7 Index | (883) | 50,000 | 14,055 | 5/11/63 | (500 bp) — Monthly | 13,124 |
| CMBX NA BB.7 Index | (2,796) | 17,000 | 3,094 | 1/17/47 | (500 bp) — Monthly | 281 |
| CMBX NA BB.7 Index | (1,291) | 7,000 | 1,274 | 1/17/47 | (500 bp) — Monthly | (24) |
| CMBX NA BB.9 Index | (1,117) | 7,000 | 1,338 | 9/17/58 | (500 bp) — Monthly | 214 |
| CMBX NA BB.9 Index | (308) | 2,000 | 382 | 9/17/58 | (500 bp) — Monthly | 72 |
| CMBX NA BB.9 Index | (156) | 1,000 | 191 | 9/17/58 | (500 bp) — Monthly | 34 |
| Goldman Sachs International | | | | | | |
| CMBX NA BB.6 Index | (1,739) | 17,000 | 4,779 | 5/11/63 | (500 bp) — Monthly | 3,023 |
| CMBX NA BB.7 Index | (303) | 2,000 | 364 | 1/17/47 | (500 bp) — Monthly | 59 |
| CMBX NA BB.7 Index | (2,234) | 11,000 | 2,002 | 1/17/47 | (500 bp) — Monthly | (242) |
| CMBX NA BB.7 Index | (983) | 6,000 | 1,092 | 1/17/47 | (500 bp) — Monthly | 103 |
| JPMorgan Securities LLC | | | | | | |
| CMBX NA BB.7 Index | (479) | 3,000 | 546 | 1/17/47 | (500 bp) — Monthly | 64 |
| CMBX NA BB.7 Index | (480) | 3,000 | 546 | 1/17/47 | (500 bp) — Monthly | 64 |
| CMBX NA BB.7 Index | (388) | 2,000 | 364 | 1/17/47 | (500 bp) — Monthly | (26) |
| CMBX NA A.7 Index | (169) | 8,000 | 169 | 1/17/47 | (200 bp) — Monthly | (3) |
| CMBX NA BB.6 Index | (141) | 1,000 | 281 | 5/11/63 | (500 bp) — Monthly | 140 |
| CMBX NA BB.7 Index | (1,027) | 6,000 | 1,092 | 1/17/47 | (500 bp) — Monthly | 59 |
| CMBX NA BB.7 Index | (626) | 4,000 | 728 | 1/17/47 | (500 bp) — Monthly | 98 |
| CMBX NA BB.7 Index | (720) | 4,000 | 728 | 1/17/47 | (500 bp) — Monthly | 4 |
| CMBX NA BB.7 Index | (584) | 3,000 | 546 | 1/17/47 | (500 bp) — Monthly | (41) |
| CMBX NA BB.7 Index | (471) | 3,000 | 546 | 1/17/47 | (500 bp) — Monthly | 72 |
| CMBX NA BB.7 Index | (487) | 3,000 | 546 | 1/17/47 | (500 bp) — Monthly | 56 |
| CMBX NA BB.7 Index | (397) | 2,000 | 364 | 1/17/47 | (500 bp) — Monthly | (35) |
| CMBX NA BB.7 Index | (197) | 1,000 | 182 | 1/17/47 | (500 bp) — Monthly | (16) |
| CMBX NA BBB–.7 Index | (1,207) | 18,000 | 1,532 | 1/17/47 | (300 bp) — Monthly | 314 |
| CMBX NA BBB–.7 Index | (411) | 7,000 | 596 | 1/17/47 | (300 bp) — Monthly | 181 |
| CMBX NA BBB–.7 Index | (294) | 4,000 | 340 | 1/17/47 | (300 bp) — Monthly | 44 |
| CMBX NA BBB–.7 Index | (294) | 4,000 | 340 | 1/17/47 | (300 bp) — Monthly | 44 |
| CMBX NA BBB–.7 Index | (181) | 2,000 | 170 | 1/17/47 | (300 bp) — Monthly | (12) |
| Merrill Lynch International | | | | | | |
| CMBX NA BB.7 Index | (1,908) | 11,000 | 2,002 | 1/17/47 | (500 bp) — Monthly | 83 |
| CMBX NA BB.9 Index | (626) | 4,000 | 765 | 9/17/58 | (500 bp) — Monthly | 135 |
| CMBX NA BBB–.7 Index | (328) | 4,000 | 340 | 1/17/47 | (300 bp) — Monthly | 10 |
| Morgan Stanley & Co. International PLC | | | | | | |
| CMBX NA BBB–.7 Index | (408) | 4,000 | 340 | 1/17/47 | (300 bp) — Monthly | (69) |
| CMBX NA BB.7 Index | (1,207) | 6,000 | 1,092 | 1/17/47 | (500 bp) — Monthly | (120) |
| CMBX NA BB.7 Index | (964) | 5,000 | 910 | 1/17/47 | (500 bp) — Monthly | (59) |
| CMBX NA BB.7 Index | (1,006) | 5,000 | 910 | 1/17/47 | (500 bp) — Monthly | (103) |
| Upfront premium received | — | | Unrealized appreciation | 18,902 |
| Upfront premium (paid) | (30,540) | | Unrealized (depreciation) | (812) |
| Total | $(30,540) | | Total | | | $18,090 |
* Payments related to the referenced debt are made upon a credit default event.
** Upfront premium is based on the difference between the original spread on issue and the market spread on day of execution.
| |
| 32Putnam VT Global Asset Allocation Fund |
| | | | | | | |
| CENTRALLY CLEARED CREDIT DEFAULT CONTRACTS OUTSTANDING — PROTECTION SOLD at 12/31/18 | | | |
| | | Upfront | | | | | |
| | | premium | | | Termi- | Payments | Unrealized |
| | | received | Notional | | nation | received | appreciation/ |
| Referenced debt* | Rating*** | (paid)** | amount | Value | date | by fund | (depreciation) |
| NA HY Series 31 Index | B+/P | $(42,108) | $586,000 | $11,681 | 12/20/23 | 500 bp — | $(29,450) |
| | | | | | | Quarterly | |
| NA IG Series 31 Index | BBB+/P | (40,625) | 2,310,000 | 12,823 | 12/20/23 | 100 bp — | (27,033) |
| | | | | | | Quarterly | |
| Total | | $(82,733) | | | | | $(56,483) |
* Payments related to the referenced debt are made upon a credit default event.
** Upfront premium is based on the difference between the original spread on issue and the market spread on day of execution.
*** Ratings are presented for credit default contracts in which the fund has sold protection on the underlying referenced debt. Ratings for an underlying index represent the average of the ratings of all the securities included in that index. The Moody’s, Standard & Poor’s or Fitch ratings are believed to be the most recent ratings available at December 31, 2018. Securities rated by Fitch are indicated by “/F.” Securities rated by Putnam are indicated by “/P.” The Putnam rating categories are comparable to the Standard & Poor’s classifications.
| | | | | | |
| CENTRALLY CLEARED CREDIT DEFAULT CONTRACTS OUTSTANDING — PROTECTION PURCHASED at 12/31/18 | | |
| |
| | Upfront | | | | | |
| | premium | | | Termi- | Payments | Unrealized |
| | received | Notional | | nation | (paid) | appreciation/ |
| Referenced debt* | (paid)** | amount | Value | date | by fund | (depreciation) |
| NA HY Series 31 Index | $8,257 | $115,000 | $2,292 | 12/20/23 | (500 bp) — Quarterly | $5,773 |
| |
| Total | $8,257 | | | | | $5,773 |
* Payments related to the referenced debt are made upon a credit default event.
** Upfront premium is based on the difference between the original spread on issue and the market spread on day of execution.
| |
| Putnam VT Global Asset Allocation Fund33 |
ASC 820 establishes a three-level hierarchy for disclosure of fair value measurements. The valuation hierarchy is based upon the transparency of inputs to the valuation of the fund’s investments. The three levels are defined as follows:
Level 1: Valuations based on quoted prices for identical securities in active markets.
Level 2: Valuations based on quoted prices in markets that are not active or for which all significant inputs are observable, either directly or indirectly.
Level 3: Valuations based on inputs that are unobservable and significant to the fair value measurement.
The following is a summary of the inputs used to value the fund’s net assets as of the close of the reporting period:
| | | |
| | | Valuation inputs |
| Investments in securities: | Level 1 | Level 2 | Level 3 |
| Common stocks*: | | | |
| Basic materials | $2,120,184 | $401,911 | $— |
| Capital goods | 4,653,409 | 130,251 | — |
| Communication services | 2,007,584 | 283,855 | — |
| Conglomerates | 134,317 | 298,756 | — |
| Consumer cyclicals | 7,522,372 | 655,853 | — |
| Consumer staples | 6,720,888 | 75,416 | — |
| Energy | 3,521,523 | 7,862 | 2,052 |
| Financials | 11,045,721 | 1,229,480 | — |
| Health care | 9,320,102 | 312,629 | — |
| Technology | 14,806,729 | 305,638 | — |
| Transportation | 1,140,055 | 297,239 | — |
| Utilities and power | 2,325,735 | 69,620 | — |
| Total common stocks | 65,318,619 | 4,068,510 | 2,052 |
| Asset-backed securities | — | 509,014 | 90,000 |
| Commodity linked notes | — | 1,534,237 | — |
| Convertible bonds and notes | — | 4,038 | — |
| Convertible preferred stocks | — | 16,509 | — |
| Corporate bonds and notes | — | 19,858,052 | 42 |
| Foreign government and agency bonds and notes | — | 487,720 | — |
| Mortgage-backed securities | — | 2,154,103 | — |
| Preferred stocks | 17,238 | — | — |
| Purchased options outstanding | — | 37,809 | — |
| Senior loans | — | 186,725 | — |
| U.S. government and agency mortgage obligations | — | 14,416,107 | — |
| Warrants | 5 | — | — |
| Short-term investments | 16,270,462 | 505,895 | — |
| Totals by level | $81,606,324 | $43,778,719 | $92,094 |
| |
| | | Valuation inputs |
| Other financial instruments: | Level 1 | Level 2 | Level 3 |
| Forward currency contracts | $— | $(112,400) | $— |
| Futures contracts | (112,662) | — | — |
| Written options outstanding | — | (12,726) | — |
| TBA sale commitments | — | (975,469) | — |
| Interest rate swap contracts | — | (13,034) | — |
| Total return swap contracts | — | (32,011) | — |
| Credit default contracts | — | (56,131) | — |
| Totals by level | $(112,662) | $(1,201,771) | $— |
* Common stock classifications are presented at the sector level, which may differ from the fund’s portfolio presentation.
At the start and close of the reporting period, Level 3 investments in securities represented less than 1% of the fund’s net assets and were not considered a significant portion of the fund’s portfolio.
The accompanying notes are an integral part of these financial statements.
| |
| 34Putnam VT Global Asset Allocation Fund |
Statement of assets and liabilities
12/31/18
| |
| Assets | |
| Investment in securities, at value, (Note 1): | |
| Unaffiliated issuers (identified cost $107,572,253) | $109,206,675 |
| Affiliated issuers (identified cost $16,270,462) (Notes 1 and 5) | 16,270,462 |
| Cash | 2,000 |
| Foreign currency (cost $42,695) (Note 1) | 42,226 |
| Dividends, interest and other receivables | 522,051 |
| Foreign tax reclaim | 29,511 |
| Receivable for shares of the fund sold | 28,744 |
| Receivable for investments sold | 1,851,714 |
| Receivable for sales of TBA securities (Note 1) | 955,302 |
| Receivable for variation margin on futures contracts (Note 1) | 96,227 |
| Unrealized appreciation on forward currency contracts (Note 1) | 84,311 |
| Unrealized appreciation on OTC swap contracts (Note 1) | 334,811 |
| Premium paid on OTC swap contracts (Note 1) | 30,540 |
| Receivable for variation margin on centrally cleared swap contracts (Note 1) | 2,007 |
| Total assets | 129,456,581 |
| |
| Liabilities | |
| Payable for investments purchased | 1,548,351 |
| Payable for purchases of TBA securities (Note 1) | 2,103,479 |
| Payable for shares of the fund repurchased | 70,464 |
| Payable for compensation of Manager (Note 2) | 63,493 |
| Payable for custodian fees (Note 2) | 52,030 |
| Payable for investor servicing fees (Note 2) | 15,009 |
| Payable for Trustee compensation and expenses (Note 2) | 120,946 |
| Payable for administrative services (Note 2) | 1,339 |
| Payable for distribution fees (Note 2) | 7,996 |
| Payable for variation margin on futures contracts (Note 1) | 56,525 |
| Payable for variation margin on centrally cleared swap contracts (Note 1) | 751 |
| Unrealized depreciation on OTC swap contracts (Note 1) | 381,432 |
| Premium received on OTC swap contracts (Note 1) | 95,827 |
| Unrealized depreciation on forward currency contracts (Note 1) | 196,711 |
| Written options outstanding, at value (premiums $19,019) (Note 1) | 12,726 |
| TBA sale commitments, at value (proceeds receivable $954,219) (Note 1) | 975,469 |
| Other accrued expenses | 134,046 |
| Total liabilities | 5,836,594 |
| | |
| Net assets | $123,619,987 |
| |
| Represented by | |
| Paid-in capital (Unlimited shares authorized) (Notes 1 and 4) | $117,161,553 |
| Total distributable earnings (Note 1) | 6,458,434 |
| Total — Representing net assets applicable to capital shares outstanding | $123,619,987 |
| |
| Computation of net asset value Class IA | |
| Net assets | $86,731,082 |
| Number of shares outstanding | 5,718,392 |
| Net asset value, offering price and redemption price per share (net assets divided by number of shares outstanding) | $15.17 |
| | |
| Computation of net asset value Class IB | |
| Net assets | $36,888,905 |
| Number of shares outstanding | 2,403,252 |
| Net asset value, offering price and redemption price per share (net assets divided by number of shares outstanding) | $15.35 |
The accompanying notes are an integral part of these financial statements.
| |
| Putnam VT Global Asset Allocation Fund35 |
Statement of operations
Year ended 12/31/18
| |
| Investment income | |
| Interest (including interest income of $411,468 from investments in affiliated issuers) (Note 5) | $2,103,911 |
| Dividends (net of foreign tax of $49,695) | 1,876,624 |
| Securities lending (net of expenses) (Notes 1 and 5) | 3,337 |
| Total investment income | 3,983,872 |
| |
| Expenses | |
| Compensation of Manager (Note 2) | 837,176 |
| Investor servicing fees (Note 2) | 99,047 |
| Custodian fees (Note 2) | 76,308 |
| Trustee compensation and expenses (Note 2) | 7,011 |
| Distribution fees (Note 2) | 106,379 |
| Administrative services (Note 2) | 3,971 |
| Auditing and tax fees | 123,235 |
| Other | 58,088 |
| Total expenses | 1,311,215 |
| | |
| Expense reduction (Note 2) | (1,031) |
| Net expenses | 1,310,184 |
| | |
| Net investment income | 2,673,688 |
| | |
| Realized and unrealized gain (loss) | |
| Net realized gain (loss) on: | |
| Securities from unaffiliated issuers (Notes 1 and 3) | 5,526,594 |
| Foreign currency transactions (Note 1) | (8,239) |
| Forward currency contracts (Note 1) | (381,887) |
| Futures contracts (Note 1) | (1,324,239) |
| Swap contracts (Note 1) | 51,413 |
| Written options (Note 1) | 94,338 |
| Total net realized gain | 3,957,980 |
| Change in net unrealized appreciation (depreciation) on: | |
| Securities from unaffiliated issuers and TBA sale commitments | (15,807,197) |
| Assets and liabilities in foreign currencies | (1,705) |
| Forward currency contracts | 16,969 |
| Futures contracts | (144,249) |
| Swap contracts | (151,846) |
| Written options | (24,775) |
| Total change in net unrealized depreciation | (16,112,803) |
| Net loss on investments | (12,154,823) |
| Net decrease in net assets resulting from operations | $(9,481,135) |
The accompanying notes are an integral part of these financial statements.
| |
| 36Putnam VT Global Asset Allocation Fund |
Statement of changes in net assets
| | |
| | Year ended | Year ended |
| | 12/31/18 | 12/31/17 |
| Increase (decrease) in net assets | | |
| Operations: | | |
| Net investment income | $2,673,688 | $2,646,656 |
| Net realized gain on investments and foreign currency transactions | 3,957,980 | 11,504,010 |
| Net unrealized appreciation (depreciation) of investments and assets and liabilities in foreign currencies | (16,112,803) | 7,214,239 |
| Net increase (decrease) in net assets resulting from operations | (9,481,135) | 21,364,905 |
| Distributions to shareholders (Note 1): | | |
| From ordinary income | | |
| Net investment income | | |
| Class IA | (2,150,736) | (1,788,913) |
| Class IB | (809,885) | (637,380) |
| Net realized short-term gain on investments | | |
| Class IA | (2,463,608) | (30,116) |
| Class IB | (1,051,162) | (12,498) |
| From net realized long-term gain on investments | | |
| Class IA | (5,338,493) | (3,613,966) |
| Class IB | (2,277,805) | (1,499,718) |
| Increase in capital from settlement payments (Note 4) | — | 1,025 |
| Decrease from capital share transactions (Note 4) | (4,333,820) | (6,804,288) |
| Total increase (decrease) in net assets | (27,906,644) | 6,979,051 |
| Net assets: | | |
| Beginning of year | 151,526,631 | 144,547,580 |
| End of year(Note 1) | $123,619,987 | $151,526,631 |
The accompanying notes are an integral part of these financial statements.
| |
| Putnam VT Global Asset Allocation Fund37 |
Financial highlights(For a common share outstanding throughout the period)
| | | | | | | | | | | | | | |
| INVESTMENT OPERATIONS: | | | | LESS DISTRIBUTIONS: | | | | RATIOS AND SUPPLEMENTAL DATA: |
| Period ended | Net asset
value,
beginning
of period | Net
investment
income
(loss)a | Net realized
and unrealized
gain (loss)
on investments | Total from
investment
operations | From net
investment
income | From net
realized
gain on
investments | Total distributions | Non-recurring reimbursements | Net asset
value, end
of period | Total return
at net
asset
value (%)b,c | Net assets,
end of
period (in
thousands) | Ratio of
expenses to
average
net assets
(%)b,d | Ratio of net
investment
income
(loss) to
average net
assets (%) | Portfolio
turnover (%) e |
| Class IA | | | | | | | | | | | | | | |
| 12/31/18 | $18.14 | .33 | (1.53) | (1.20) | (.38) | (1.39) | (1.77) | — | $15.17 | (7.02) | $86,731 | .85 | 1.97 | 132 |
| 12/31/17 | 16.55 | .32 | 2.18 | 2.50 | (.30) | (.61) | (.91) | —f | 18.14 | 15.67 | 104,826 | .86 | 1.87 | 208 |
| 12/31/16 | 17.06 | .27 | .81 | 1.08 | (.38) | (1.21) | (1.59) | — | 16.55 | 6.98 | 103,689 | .87g,h | 1.66g,h | 384 |
| 12/31/15 | 19.21 | .27 | (.11) | .16 | (.48) | (1.83) | (2.31) | — | 17.06 | .42 | 112,027 | .86 | 1.51 | 339 |
| 12/31/14 | 18.77 | .32 | 1.40 | 1.72 | (.51) | (.77) | (1.28) | — | 19.21 | 9.66 | 131,554 | .87 | 1.73 | 339 |
| Class IB | | | | | | | | | | | | | | |
| 12/31/18 | $18.33 | .29 | (1.54) | (1.25) | (.34) | (1.39) | (1.73) | — | $15.35 | (7.26) | $36,889 | 1.10 | 1.71 | 132 |
| 12/31/17 | 16.72 | .28 | 2.20 | 2.48 | (.26) | (.61) | (.87) | —f | 18.33 | 15.34 | 46,701 | 1.11 | 1.61 | 208 |
| 12/31/16 | 17.21 | .23 | .82 | 1.05 | (.33) | (1.21) | (1.54) | — | 16.72 | 6.71 | 40,859 | 1.12g,h | 1.41g,h | 384 |
| 12/31/15 | 19.35 | .23 | (.12) | .11 | (.42) | (1.83) | (2.25) | — | 17.21 | .17 | 44,091 | 1.11 | 1.26 | 339 |
| 12/31/14 | 18.88 | .28 | 1.41 | 1.69 | (.45) | (.77) | (1.22) | — | 19.35 | 9.42 | 51,339 | 1.12 | 1.48 | 339 |
aPer share net investment income (loss) has been determined on the basis of weighted average number of shares outstanding during the period.
bThe charges and expenses at the insurance company separate account level are not reflected.
cTotal return assumes dividend reinvestment.
dIncludes amounts paid through expense offset and/or brokerage/service arrangements, if any (Note 2). Also excludes acquired fund fees and expenses, if any.
ePortfolio turnover includes TBA purchase and sale commitments.
fReflects a non-recurring reimbursement pursuant to a settlement between the Securities and Exchange Commission (the SEC) and Countrywide Financial which amounted to less than $0.01 per share outstanding on November 29, 2017.
gReflects an involuntary contractual expense limitation in effect during the period. As a result of such limitation, the expenses of each class reflect a reduction of the following amounts:
| | | |
| | Percentage of average | | |
| | net assets | | |
| December 31, 2016 | 0.02% | | |
hReflects a voluntary waiver of certain fund expenses in effect during the period. As a result of such waivers, the expenses of each class reflect a reduction of less than 0.01% as a percentage of average net assets.
The accompanying notes are an integral part of these financial statements.
| |
| 38Putnam VT Global Asset Allocation Fund |
Notes to financial statements12/31/18
Within the following Notes to financial statements, references to “State Street” represent State Street Bank and Trust Company, references to “the SEC” represent the Securities and Exchange Commission, references to “Putnam Management” represent Putnam Investment Management, LLC, the fund’s manager, an indirect wholly-owned subsidiary of Putnam Investments, LLC and references to “OTC”, if any, represent over-the-counter. Unless otherwise noted, the “reporting period” represents the period from January 1, 2018 through December 31, 2018.
Putnam VT Global Asset Allocation Fund (the fund) is a diversified series of Putnam Variable Trust (the Trust), a Massachusetts business trust registered under the Investment Company Act of 1940, as amended, as an open-end management investment company. The goal of the fund is to seek long-term return consistent with preservation of capital. The fund invests a majority of its assets in a diversified portfolio of equity securities (growth or value stocks or both) of both U.S. and foreign companies of any size. Putnam Management may consider, among other factors, a company’s valuation, financial strength, growth potential, competitive position in its industry, projected future earnings, cash flows and dividends when deciding whether to buy or sell equity investments. The fund also invests in a diversified portfolio of fixed-income investments, including both U.S. and foreign government obligations, corporate obligations and securitized debt instruments (such as mortgage-backed investments). Putnam Management may consider, among other factors, credit, interest rate and prepayment risks, as well as general market conditions, when deciding whether to buy or sell fixed-income investments. Putnam Management may also select other investments that do not fall within these asset classes. Putnam Management may also use to a significant extent derivatives, such as futures, options, certain foreign currency transactions, warrants and swap contracts, for both hedging and non-hedging purposes.
The fund offers class IA and class IB shares of beneficial interest. Class IA shares are offered at net asset value and are not subject to a distribution fee. Class IB shares are offered at net asset value and pay an ongoing distribution fee, which is identified in Note 2.
In the normal course of business, the fund enters into contracts that may include agreements to indemnify another party under given circumstances. The fund’s maximum exposure under these arrangements is unknown as this would involve future claims that may be, but have not yet been, made against the fund. However, the fund’s management team expects the risk of material loss to be remote.
The fund has entered into contractual arrangements with an investment adviser, administrator, distributor, shareholder servicing agent and custodian, who each provide services to the fund. Unless expressly stated otherwise, shareholders are not parties to, or intended beneficiaries of these contractual arrangements, and these contractual arrangements are not intended to create any shareholder right to enforce them against the service providers or to seek any remedy under them against the service providers, either directly or on behalf of the fund.
Under the fund’s Amended and Restated Agreement and Declaration of Trust, any claims asserted against or on behalf of the Putnam Funds, including claims against Trustees and Officers, must be brought in state and federal courts located within the Commonwealth of Massachusetts.
Note 1 — Significant accounting policies
The following is a summary of significant accounting policies consistently followed by the fund in the preparation of its financial statements. The preparation of financial statements is in conformity with accounting principles generally accepted in the United States of America and requires management to make estimates and assumptions that affect the reported amounts of assets and liabilities in the financial statements and the reported amounts of increases and decreases in net assets from operations. Actual results could differ from those estimates. Subsequent events after the Statement of assets and liabilities date through the date that the financial statements were issued have been evaluated in the preparation of the financial statements.
Investment income, realized and unrealized gains and losses and expenses of the fund are borne pro-rata based on the relative net assets of each class to the total net assets of the fund, except that each class bears expenses unique to that class (including the distribution fees applicable to such classes). Each class votes as a class only with respect to its own distribution plan or other matters on which a class vote is required by law or determined by the Trustees. If the fund were liquidated, shares of each class would receive their pro-rata share of the net assets of the fund. In addition, the Trustees declare separate dividends on each class of shares.
Security valuationPortfolio securities and other investments are valued using policies and procedures adopted by the Board of Trustees. The Trustees have formed a Pricing Committee to oversee the implementation of these procedures and have delegated responsibility for valuing the fund’s assets in accordance with these procedures to Putnam Management. Putnam Management has established an internal Valuation Committee that is responsible for making fair value determinations, evaluating the effectiveness of the pricing policies of the fund and reporting to the Pricing Committee.
Investments for which market quotations are readily available are valued at the last reported sales price on their principal exchange, or official closing price for certain markets, and are classified as Level 1 securities under Accounting Standards Codification 820Fair Value Measurements and Disclosures(ASC 820). If no sales are reported, as in the case of some securities that are traded OTC, a security is valued at its last reported bid price and is generally categorized as a Level 2 security.
Investments in open-end investment companies (excluding exchange-traded funds), if any, which can be classified as Level 1 or Level 2 securities, are valued based on their net asset value. The net asset value of such investment companies equals the total value of their assets less their liabilities and divided by the number of their outstanding shares.
Market quotations are not considered to be readily available for certain debt obligations (including short-term investments with remaining maturities of 60 days or less) and other investments; such investments are valued on the basis of valuations furnished by an independent pricing service approved by the Trustees or dealers selected by Putnam Management. Such services or dealers determine valuations for normal institutional-size trading units of such securities using methods based on market transactions for comparable securities and various relationships, generally recognized by institutional traders, between securities (which consider such factors as security prices, yields, maturities and ratings). These securities will generally be categorized as Level 2.
Many securities markets and exchanges outside the U.S. close prior to the scheduled close of the New York Stock Exchange and therefore the closing prices for securities in such markets or on such exchanges may not fully reflect events that occur after such close but before the scheduled close of the New York Stock Exchange. Accordingly, on certain days, the fund will fair value certain foreign equity securities taking into account multiple factors including movements in the U.S. securities markets, currency valuations and comparisons to the valuation of American Depository Receipts, exchange-traded funds and futures contracts. The foreign equity securities, which would generally be classified as Level 1 securities, will be transferred to Level 2 of the fair value hierarchy when they are valued at fair value. The number of days on which fair value prices will be used will depend on market activity and it is possible that fair value prices will be used by the fund to a significant extent. At the close of the reporting period, fair value pricing was used for certain foreign securities in the portfolio. Securities quoted in foreign currencies, if any, are translated into U.S. dollars at the current exchange rate.
To the extent a pricing service or dealer is unable to value a security or provides a valuation that Putnam Management does not believe accurately reflects the security’s fair value, the security will be valued at fair value by Putnam Management in accordance with policies and procedures approved by the Trustees. Certain investments, including certain restricted and illiquid securities and derivatives, are also valued at fair value following procedures approved by the Trustees. These valuations consider such factors as significant market or specific security events such as interest rate or credit quality changes, various relationships with other securities, discount rates, U.S. Treasury, U.S. swap and credit yields, index levels, convexity exposures, recovery rates, sales and other multiples and resale restrictions. These securities are classified as Level 2 or as Level 3 depending on the priority of the significant inputs.
To assess the continuing appropriateness of fair valuations, the Valuation Committee reviews and affirms the reasonableness of such valuations on a regular basis after considering all relevant information that is reasonably available. Such valuations and procedures are reviewed periodically by the Trustees. Certain securities may be valued on the basis of a price provided by a single source. The fair value of securities is generally determined as the amount that the fund could reasonably expect to realize from an orderly disposition of such securities over a reasonable period of time. By its nature, a fair value price is a good faith estimate of the value of a security in a current sale and does not reflect an actual market price, which may be different by a material amount.
| |
| Putnam VT Global Asset Allocation Fund39 |
Security transactions and related investment incomeSecurity transactions are recorded on the trade date (the date the order to buy or sell is executed). Gains or losses on securities sold are determined on the identified cost basis.
Interest income, net of any applicable withholding taxes, is recorded on the accrual basis. Dividend income, net of any applicable withholding taxes, is recognized on the ex-dividend date except that certain dividends from foreign securities, if any, are recognized as soon as the fund is informed of the ex-dividend date. Non-cash dividends, if any, are recorded at the fair value of the securities received. Dividends representing a return of capital or capital gains, if any, are reflected as a reduction of cost and/or as a realized gain.
All premiums/discounts are amortized/accreted on a yield-to-maturity basis.
Securities purchased or sold on a delayed delivery basis may be settled at a future date beyond customary settlement time; interest income is accrued based on the terms of the securities. Losses may arise due to changes in the fair value of the underlying securities or if the counterparty does not perform under the contract.
Stripped securitiesThe fund may invest in stripped securities which represent a participation in securities that may be structured in classes with rights to receive different portions of the interest and principal. Interest-only securities receive all of the interest and principal-only securities receive all of the principal. If the interest-only securities experience greater than anticipated prepayments of principal, the fund may fail to recoup fully its initial investment in these securities. Conversely, principal-only securities increase in value if prepayments are greater than anticipated and decline if prepayments are slower than anticipated. The fair value of these securities is highly sensitive to changes in interest rates.
Foreign currency translationThe accounting records of the fund are maintained in U.S. dollars. The fair value of foreign securities, currency holdings, and other assets and liabilities is recorded in the books and records of the fund after translation to U.S. dollars based on the exchange rates on that day. The cost of each security is determined using historical exchange rates. Income and withholding taxes are translated at prevailing exchange rates when earned or incurred. The fund does not isolate that portion of realized or unrealized gains or losses resulting from changes in the foreign exchange rate on investments from fluctuations arising from changes in the market prices of the securities. Such gains and losses are included with the net realized and unrealized gain or loss on investments. Net realized gains and losses on foreign currency transactions represent net realized exchange gains or losses on disposition of foreign currencies, currency gains and losses realized between the trade and settlement dates on securities transactions and the difference between the amount of investment income and foreign withholding taxes recorded on the fund’s books and the U.S. dollar equivalent amounts actually received or paid. Net unrealized appreciation and depreciation of assets and liabilities in foreign currencies arise from changes in the value of assets and liabilities other than investments at the period end, resulting from changes in the exchange rate.
Options contractsThe fund uses options contracts to hedge duration and convexity, to isolate prepayment risk, to gain exposure to interest rates, to hedge against changes in values of securities it owns, owned or expects to own, to hedge prepayment risk, to generate additional income for the portfolio, to enhance returns on securities owned, to enhance the return on a security owned, to gain exposure to securities and to manage downside risks.
The potential risk to the fund is that the change in value of options contracts may not correspond to the change in value of the hedged instruments. In addition, losses may arise from changes in the value of the underlying instruments if there is an illiquid secondary market for the contracts, if interest or exchange rates move unexpectedly or if the counterparty to the contract is unable to perform. Realized gains and losses on purchased options are included in realized gains and losses on investment securities. If a written call option is exercised, the premium originally received is recorded as an addition to sales proceeds. If a written put option is exercised, the premium originally received is recorded as a reduction to the cost of investments.
Exchange-traded options are valued at the last sale price or, if no sales are reported, the last bid price for purchased options and the last ask price for written options. OTC traded options are valued using prices supplied by dealers.
Options on swaps are similar to options on securities except that the premium paid or received is to buy or grant the right to enter into a previously agreed upon interest rate or credit default contract. Forward premium swap option contracts include premiums that have extended settlement dates. The delayed settlement of the premiums is factored into the daily valuation of the option contracts. In the case of interest rate cap and floor contracts, in return for a premium, ongoing payments between two parties are based on interest rates exceeding a specifiedrate, in the case of a cap contract, or falling below a specified rate in the case of a floor contract.
Written option contracts outstanding at period end, if any, are listed after the fund’s portfolio.
Futures contractsThe fund uses futures contracts to manage exposure to market risk, to hedge prepayment risk, to hedge interest rate risk, to gain exposure to interest rates and to equitize cash.
The potential risk to the fund is that the change in value of futures contracts may not correspond to the change in value of the hedged instruments. In addition, losses may arise from changes in the value of the underlying instruments, if there is an illiquid secondary market for the contracts, if interest or exchange rates move unexpectedly or if the counterparty to the contract is unable to perform. With futures, there is minimal counterparty credit risk to the fund since futures are exchange traded and the exchange’s clearinghouse, as counterparty to all exchange traded futures, guarantees the futures against default. Risks may exceed amounts recognized on the Statement of assets and liabilities. When the contract is closed, the fund records a realized gain or loss equal to the difference between the value of the contract at the time it was opened and the value at the time it was closed.
Futures contracts are valued at the quoted daily settlement prices established by the exchange on which they trade. The fund and the broker agree to exchange an amount of cash equal to the daily fluctuation in the value of the futures contract. Such receipts or payments are known as “variation margin.” Futures contracts outstanding at period end, if any, are listed after the fund’s portfolio.
Forward currency contractsThe fund buys and sells forward currency contracts, which are agreements between two parties to buy and sell currencies at a set price on a future date. These contracts are used to hedge foreign exchange risk and to gain exposure to currencies.
The U.S. dollar value of forward currency contracts is determined using current forward currency exchange rates supplied by a quotation service. The fair value of the contract will fluctuate with changes in currency exchange rates. The contract is marked to market daily and the change in fair value is recorded as an unrealized gain or loss. The fund records a realized gain or loss equal to the difference between the value of the contract at the time it was opened and the value at the time it was closed when the contract matures or by delivery of the currency. The fund could be exposed to risk if the value of the currency changes unfavorably, if the counterparties to the contracts are unable to meet the terms of their contracts or if the fund is unable to enter into a closing position. Risks may exceed amounts recognized on the Statement of assets and liabilities.
Forward currency contracts outstanding at period end, if any, are listed after the fund’s portfolio.
Interest rate swap contractsThe fund entered into OTC and/or centrally cleared interest rate swap contracts, which are arrangements between two parties to exchange cash flows based on a notional principal amount, to hedge interest rate risk, to gain exposure on interest rates and to hedge prepayment risk.
An OTC and centrally cleared interest rate swap can be purchased or sold with an upfront premium. For OTC interest rate swap contracts, an upfront payment received by the fund is recorded as a liability on the fund’s books. An upfront payment made by the fund is recorded as an asset on the fund’s books. OTC and centrally cleared interest rate swap contracts are marked to market daily based upon quotations from an independent pricing service or market makers. Any change is recorded as an unrealized gain or loss on OTC interest rate swaps. Daily fluctuations in the value of centrally cleared interest rate swaps are settled through a central clearing agent and are recorded in variation margin on the Statement of assets and liabilities and recorded as unrealized gain or loss. Payments, including upfront premiums, received or made are recorded as realized gains or losses at the reset date or the closing of the contract. Certain OTC and centrally cleared interest rate swap contracts may include extended effective dates. Payments related to these swap contracts are accrued based on the terms of the contract.
The fund could be exposed to credit or market risk due to unfavorable changes in the fluctuation of interest rates or if the counterparty defaults, in the case of OTC interest rate contracts, or the central clearing agency or a clearing member defaults, in the case of centrally cleared interest rate swap contracts, on its respective obligation to perform under the contract. The fund’s maximum risk of loss from counterparty risk or central clearing risk is the fair value of the contract. This risk may be mitigated for OTC interest rate swap contracts by having a master netting arrangement between the fund and the counterparty and for centrally cleared interest rate swap contracts through the daily exchange of variation
| |
| 40Putnam VT Global Asset Allocation Fund |
margin. There is minimal counterparty risk with respect to centrally cleared interest rate swap contracts due to the clearinghouse guarantee fund and other resources that are available in the event of a clearing member default. Risk of loss may exceed amounts recognized on the Statement of assets and liabilities.
OTC and centrally cleared interest rate swap contracts outstanding, including their respective notional amounts at period end, if any, are listed after the fund’s portfolio.
Total return swap contractsThe fund entered into OTC and/or centrally cleared total return swap contracts, which are arrangements to exchange a market-linked return for a periodic payment, both based on a notional principal amount, to hedge sector exposure, to manage exposure to specific sectors or industries, to manage exposure to specific securities, to gain exposure to a basket of securities, to gain exposure to specific markets or countries and to gain exposure to specific sectors or industries.
To the extent that the total return of the security, index or other financial measure underlying the transaction exceeds or falls short of the offsetting interest rate obligation, the fund will receive a payment from or make a payment to the coun-terparty. OTC and/or centrally cleared total return swap contracts are marked to market daily based upon quotations from an independent pricing service or market maker. Any change is recorded as an unrealized gain or loss on OTC total return swaps. Daily fluctuations in the value of centrally cleared total return swaps are settled through a central clearing agent and are recorded in variation margin on the Statement of assets and liabilities and recorded as unrealized gain or loss. Payments received or made are recorded as realized gains or losses. Certain OTC and/or centrally cleared total return swap contracts may include extended effective dates. Payments related to these swap contracts are accrued based on the terms of the contract. The fund could be exposed to credit or market risk due to unfavorable changes in the fluctuation of interest rates or in the price of the underlying security or index, the possibility that there is no liquid market for these agreements or that the counterparty may default on its obligation to perform. The fund’s maximum risk of loss from counterparty risk or central clearing risk is the fair value of the contract. This risk may be mitigated for OTC total return swap contracts by having a master netting arrangement between the fund and the counterparty and for centrally cleared total return swap contracts through the daily exchange of variation margin. There is minimal counterparty risk with respect to centrally cleared total return swap contracts due to the clearinghouse guarantee fund and other resources that are available in the event of a clearing member default. Risk of loss may exceed amounts recognized on the Statement of assets and liabilities.
OTC and/or centrally cleared total return swap contracts outstanding, including their respective notional amounts at period end, if any, are listed after the fund’s portfolio.
Credit default contractsThe fund entered into OTC and/or centrally cleared credit default contracts to hedge credit risk, to hedge market risk, to specific sectors and to gain exposure on individual names and/or baskets of securities.
In OTC and centrally cleared credit default contracts, the protection buyer typically makes a periodic stream of payments to a counterparty, the protection seller, in exchange for the right to receive a contingent payment upon the occurrence of a credit event on the reference obligation or all other equally ranked obligations of the reference entity. Credit events are contract specific but may include bankruptcy, failure to pay, restructuring and obligation acceleration. For OTC credit default contracts, an upfront payment received by the fund is recorded as a liability on the fund’s books. An upfront payment made by the fund is recorded as an asset on the fund’s books. Centrally cleared credit default contracts provide the same rights to the protection buyer and seller except the payments between parties, including upfront premiums, are settled through a central clearing agent through variation margin payments. Upfront and periodic payments received or paid by the fund for OTC and centrally cleared credit default contracts are recorded as realized gains or losses at the reset date or close of the contract. The OTC and centrally cleared credit default contracts are marked to market daily based upon quotations from an independent pricing service or market makers. Any change in value of OTC credit default contracts is recorded as an unrealized gain or loss. Daily fluctuations in the value of centrally cleared credit default contracts are recorded in variation margin on the Statement of assets and liabilities and recorded as unrealized gain or loss. Upon the occurrence of a credit event, the difference between the par value and fair value of the reference obligation, net of any proportional amount of the upfront payment, is recorded as a realized gain or loss.
In addition to bearing the risk that the credit event will occur, the fund could be exposed to market risk due to unfavorable changes in interest rates or in the price of the underlying security or index or the possibility that the fund may be unableto close out its position at the same time or at the same price as if it had purchased the underlying reference obligations. In certain circumstances, the fund may enter into offsetting OTC and centrally cleared credit default contracts which would mitigate its risk of loss. Risks of loss may exceed amounts recognized on the Statement of assets and liabilities. The fund’s maximum risk of loss from coun-terparty risk, either as the protection seller or as the protection buyer, is the fair value of the contract. This risk may be mitigated for OTC credit default contracts by having a master netting arrangement between the fund and the counterparty and for centrally cleared credit default contracts through the daily exchange of variation margin. Counterparty risk is further mitigated with respect to centrally cleared credit default swap contracts due to the clearinghouse guarantee fund and other resources that are available in the event of a clearing member default. Where the fund is a seller of protection, the maximum potential amount of future payments the fund may be required to make is equal to the notional amount.
OTC and centrally cleared credit default contracts outstanding, including their respective notional amounts at period end, if any, are listed after the fund’s portfolio.
TBA commitmentsThe fund may enter into TBA (to be announced) commitments to purchase securities for a fixed unit price at a future date beyond customary settlement time. Although the unit price and par amount have been established, the actual securities have not been specified. However, it is anticipated that the amount of the commitments will not significantly differ from the principal amount. The fund holds, and maintains until settlement date, cash or high-grade debt obligations in an amount sufficient to meet the purchase price, or the fund may enter into offsetting contracts for the forward sale of other securities it owns. Income on the securities will not be earned until settlement date.
The fund may also enter into TBA sale commitments to hedge its portfolio positions, to sell mortgage-backed securities it owns under delayed delivery arrangements or to take a short position in mortgage-backed securities. Proceeds of TBA sale commitments are not received until the contractual settlement date. During the time a TBA sale commitment is outstanding, either equivalent deliverable securities or an offsetting TBA purchase commitment deliverable on or before the sale commitment date are held as “cover” for the transaction, or other liquid assets in an amount equal to the notional value of the TBA sale commitment are segregated. If the TBA sale commitment is closed through the acquisition of an offsetting TBA purchase commitment, the fund realizes a gain or loss. If the fund delivers securities under the commitment, the fund realizes a gain or a loss from the sale of the securities based upon the unit price established at the date the commitment was entered into.
TBA commitments, which are accounted for as purchase and sale transactions, may be considered securities themselves, and involve a risk of loss due to changes in the value of the security prior to the settlement date as well as the risk that the counterparty to the transaction will not perform its obligations. Counterparty risk is mitigated by having a master agreement between the fund and the counterparty.
Unsettled TBA commitments are valued at their fair value according to the procedures described under “Security valuation” above. The contract is marked to market daily and the change in fair value is recorded by the fund as an unrealized gain or loss. Based on market circumstances, Putnam Management will determine whether to take delivery of the underlying securities or to dispose of the TBA commitments prior to settlement.
TBA purchase commitments outstanding at period end, if any, are listed within the fund’s portfolio and TBA sale commitments outstanding at period end, if any, are listed after the fund’s portfolio.
Master agreementsThe fund is a party to ISDA (International Swaps and Derivatives Association, Inc.) Master Agreements that govern OTC derivative and foreign exchange contracts and Master Securities Forward Transaction Agreements that govern transactions involving mortgage-backed and other asset-backed securities that may result in delayed delivery (Master Agreements) with certain counterparties entered into from time to time. The Master Agreements may contain provisions regarding, among other things, the parties’ general obligations, representations, agreements, collateral requirements, events of default and early termination. With respect to certain counterparties, in accordance with the terms of the Master Agreements, collateral posted to the fund is held in a segregated account by the fund’s custodian and, with respect to those amounts which can be sold or repledged, are presented in the fund’s portfolio.
Collateral pledged by the fund is segregated by the fund’s custodian and identified in the fund’s portfolio. Collateral can be in the form of cash or debt securities issued by the U.S. Government or related agencies or other securities as agreed to by the fund and the applicable counterparty. Collateral requirements are determined based on the fund’s net position with each counterparty.
| |
| Putnam VT Global Asset Allocation Fund41 |
With respect to ISDA Master Agreements, termination events applicable to the fund may occur upon a decline in the fund’s net assets below a specified threshold over a certain period of time. Termination events applicable to counterparties may occur upon a decline in the counterparty’s long-term or short-term credit ratings below a specified level. In each case, upon occurrence, the other party may elect to terminate early and cause settlement of all derivative and foreign exchange contracts outstanding, including the payment of any losses and costs resulting from such early termination, as reasonably determined by the terminating party. Any decision by one or more of the fund’s counterparties to elect early termination could impact the fund’s future derivative activity.
At the close of the reporting period, the fund had a net liability position of $216,609 on open derivative contracts subject to the Master Agreements.There was no collateral posted by the fund at period end for these agreements.
Securities lendingThe fund may lend securities, through its agent, to qualified borrowers in order to earn additional income. The loans are collateralized by cash in an amount at least equal to the fair value of the securities loaned. The fair value of securities loaned is determined daily and any additional required collateral is allocated to the fund on the next business day. The remaining maturities of the securities lending transactions are considered overnight and continuous. The risk of borrower default will be borne by the fund’s agent; the fund will bear the risk of loss with respect to the investment of the cash collateral. Income from securities lending, net of expenses, is included in investment income on the Statement of operations. Cash collateral is invested in Putnam Cash Collateral Pool, LLC, a limited liability company managed by an affiliate of Putnam Management. Investments in Putnam Cash Collateral Pool, LLC are valued at its closing net asset value each business day. There are no management fees charged to Putnam Cash Collateral Pool, LLC. At the close of the reporting period, the fund had no securities out on loan.
Interfund lendingThe fund, along with other Putnam funds, may participate in an interfund lending program pursuant to an exemptive order issued by the SEC. This program allows the fund to borrow from or lend to other Putnam funds that permit such transactions. Interfund lending transactions are subject to each fund’s investment policies and borrowing and lending limits. Interest earned or paid on the interfund lending transaction will be based on the average of certain current market rates. During the reporting period, the fund did not utilize the program.
Lines of creditThe fund participates, along with other Putnam funds, in a $317.5 million unsecured committed line of credit and a $235.5 million unsecured uncommitted line of credit, both provided by State Street. Borrowings may be made for temporary or emergency purposes, including the funding of shareholder redemption requests and trade settlements. Interest is charged to the fund based on the fund’s borrowing at a rate equal to 1.25% plus the higher of (1) the Federal Funds rate and (2) the overnight LIBOR for the committed line of credit and the Federal Funds rate plus 1.30% for the uncommitted line of credit. A closing fee equal to 0.04% of the committed line of credit and 0.04% of the uncommitted line of credit has been paid by the participating funds. In addition, a commitment fee of 0.21% per annum on any unutilized portion of the committed line of credit is allocated to the participating funds based on their relative net assets and paid quarterly. During the reporting period, the fund had no borrowings against these arrangements.
Federal taxesIt is the policy of the fund to distribute all of its taxable income within the prescribed time period and otherwise comply with the provisions of the Internal Revenue Code of 1986, as amended (the Code), applicable to regulated investment companies.
The fund is subject to the provisions of Accounting Standards Codification 740Income Taxes(ASC 740). ASC 740 sets forth a minimum threshold for financial statement recognition of the benefit of a tax position taken or expected to be taken in a tax return. The fund did not have a liability to record for any unrecognized tax benefits in the accompanying financial statements. No provision has been made for federal taxes on income, capital gains or unrealized appreciation on securities held nor for excise tax on income and capital gains. Each of the fund’s federal tax returns for the prior three fiscal years remains subject to examination by the Internal Revenue Service.
The fund may also be subject to taxes imposed by governments of countries in which it invests. Such taxes are generally based on either income or gains earned or repatriated. The fund accrues and applies such taxes to net investment income, net realized gains and net unrealized gains as income and/or capital gains are earned. In some cases, the fund may be entitled to reclaim all or a portion of such taxes, and such reclaim amounts, if any, are reflected as an asset on the fund’s books. In many cases, however, the fund may not receive such amounts for an extended period of time, depending on the country of investment.
Distributions to shareholdersDistributions to shareholders from net investment income are recorded by the fund on the ex-dividend date. Distributions from capital gains, if any, are recorded on the ex-dividend date and paid at least annually. The amount and character of income and gains to be distributed are determined in accordance with income tax regulations, which may differ from generally accepted accounting principles. These differences include temporary and/or permanent differences from losses on wash sale transactions, from foreign currency gains and losses, from nontaxable dividends, from income on swap contracts, from interest-only securities and from a redesignation of taxable distributions. Reclassifications are made to the fund’s capital accounts to reflect income and gains available for distribution (or available capital loss carryovers) under income tax regulations. At the close of the reporting period, the fund reclassified $351,719 to decrease undistributed net investment income, $644 to increase paid-in capital and $351,075 to increase accumulated net realized gain.
Tax cost of investments includes adjustments to net unrealized appreciation (depreciation) which may not necessarily be final tax cost basis adjustments, but closely approximate the tax basis unrealized gains and losses that may be realized and distributed to shareholders. The tax basis components of distributable earnings and the federal tax cost as of the close of the reporting period were as follows:
| |
| Unrealized appreciation | $8,537,581 |
| Unrealized depreciation | (7,876,970) |
| Net unrealized appreciation | 660,611 |
| Undistributed ordinary income | 1,913,871 |
| Undistributed long-term gain | 3,894,941 |
| Cost for federal income tax purposes | $123,502,094 |
For the fiscal year ended December 31, 2017, the fund had undistributed net investment income of $2,750,912.
Expenses of the TrustExpenses directly charged or attributable to any fund will be paid from the assets of that fund. Generally, expenses of the Trust will be allocated among and charged to the assets of each fund on a basis that the Trustees deem fair and equitable, which may be based on the relative assets of each fund or the nature of the services performed and relative applicability to each fund.
Beneficial interestAt the close of the reporting period, insurance companies or their separate accounts were record owners of all but a de minimis number of the shares of the fund. Approximately 41.8% of the fund is owned by accounts of one insurance company.
Note 2 — Management fee, administrative services and other transactions
The fund pays Putnam Management a management fee (based on the fund’s average net assets and computed and paid monthly) at annual rates that may vary based on the average of the aggregate net assets of all open-end mutual funds sponsored by Putnam Management (excluding net assets of funds that are invested in, or that are invested in by, other Putnam funds to the extent necessary to avoid “double counting” of those assets). Such annual rates may vary as follows:
| |
| 0.750% | of the first $5 billion, |
| 0.700% | of the next $5 billion, |
| 0.650% | of the next $10 billion, |
| 0.600% | of the next $10 billion, |
| 0.550% | of the next $50 billion, |
| 0.530% | of the next $50 billion, |
| 0.520% | of the next $100 billion and |
| 0.515% | of any excess thereafter. |
For the reporting period, the management fee represented an effective rate (excluding the impact from any expense waivers in effect) of 0.591% of the fund’s average net assets.
Putnam Management has contractually agreed, through April 30, 2020, to waive fees and/or reimburse the fund’s expenses to the extent necessary to limit the cumulative expenses of the fund, exclusive of brokerage, interest, taxes, investment-related expenses, extraordinary expenses, acquired fund fees and expenses and payments under the fund’s investor servicing contract, investment management contract and distribution plan, on a fiscal year-to-date basis to an annual rate of 0.20% of the fund’s average net assets over such fiscal year-to-date period. During the reporting period, the fund’s expenses were not reduced as a result of this limit.
Putnam Investments Limited (PIL), an affiliate of Putnam Management, is authorized by the Trustees to manage a separate portion of the assets of the fund as determined by Putnam Management from time to time. PIL did not manage
| |
| 42Putnam VT Global Asset Allocation Fund |
any portion of the assets of the fund during the reporting period. If Putnam Management were to engage the services of PIL, Putnam Management would pay a quarterly sub-management fee to PIL for its services at an annual rate of 0.35% of the average net assets of the portion of the fund managed by PIL.
The Putnam Advisory Company, LLC (PAC), an affiliate of Putnam Management, is authorized by the Trustees to manage a separate portion of the assets of the fund, as designated from time to time by Putnam Management or PIL. PAC did not manage any portion of the assets of the fund during the reporting period. If Putnam Management or PIL were to engage the services of PAC, Putnam Management or PIL, as applicable, would pay a quarterly sub-advisory fee to PAC for its services at the annual rate of 0.35% of the average net assets of the portion of the fund’s assets for which PAC is engaged as sub-adviser.
The fund reimburses Putnam Management an allocated amount for the compensation and related expenses of certain officers of the fund and their staff who provide administrative services to the fund. The aggregate amount of all such reimbursements is determined annually by the Trustees.
Custodial functions for the fund’s assets are provided by State Street. Custody fees are based on the fund’s asset level, the number of its security holdings and transaction volumes.
Putnam Investor Services, Inc., an affiliate of Putnam Management, provides investor servicing agent functions to the fund. Putnam Investor Services, Inc. was paid a monthly fee for investor servicing at an annual rate of 0.07% of the fund’s average daily net assets. During the reporting period, the expenses for each class of shares related to investor servicing fees were as follows:
| |
| Class IA | $69,251 |
| Class IB | 29,796 |
| Total | $99,047 |
The fund has entered into expense offset arrangements with Putnam Investor Services, Inc. and State Street whereby Putnam Investor Services, Inc.’s and State Street’s fees are reduced by credits allowed on cash balances. The fund also reduced expenses through brokerage/service arrangements. For the reporting period, the fund’s expenses were reduced by $539 under the expense offset arrangements and by $492 under the brokerage/service arrangements.
Each Independent Trustee of the fund receives an annual Trustee fee, of which $100 as a quarterly retainer, has been allocated to the fund, and an additional fee for each Trustees meeting attended. Trustees also are reimbursed for expenses they incur relating to their services as Trustees.
The fund has adopted a Trustee Fee Deferral Plan (the Deferral Plan) which allows the Trustees to defer the receipt of all or a portion of Trustees fees payable on or after July 1, 1995. The deferred fees remain invested in certain Putnam funds until distribution in accordance with the Deferral Plan.
The fund has adopted an unfunded noncontributory defined benefit pension plan (the Pension Plan) covering all Trustees of the fund who have served as a Trustee for at least five years and were first elected prior to 2004. Benefits under the Pension Plan are equal to 50% of the Trustee’s average annual attendance and retainer fees for the three years ended December 31, 2005. The retirement benefit is payable during a Trustee’s lifetime, beginning the year following retirement, for the number of years of service through December 31, 2006. Pension expense for the fund is included in Trustee compensation and expenses in the Statement of operations. Accrued pension liability is included in Payable for Trustee compensation and expenses in the Statement of assets and liabilities. The Trustees have terminated the Pension Plan with respect to any Trustee first elected after 2003.
The fund has adopted a distribution plan (the Plan) with respect to its class IB shares pursuant to Rule 12b–1 under the Investment Company Act of 1940. The purpose of the Plan is to compensate Putnam Retail Management Limited Partnership, an indirect wholly-owned subsidiary of Putnam Investments, LLC, for services provided and expenses incurred in distributing shares of the fund. The Plan provides for payment by the fund to Putnam Retail Management Limited Partnership at an annual rate of up to 0.35% of the average net assets attributable to the fund’s class IB shares. The Trustees have approved payment by the fund at an annual rate of 0.25% of the average net assets attributable to the fund’s class IB shares. The expenses related to distribution fees during the reporting period are included in Distribution fees in the Statement of operations.
Note 3 — Purchases and sales of securities
During the reporting period, the cost of purchases and the proceeds from sales, excluding short-term investments, were as follows:
| | |
| | Cost of | Proceeds |
| | purchases | from sales |
| Investments in securities, including | | |
| TBA commitments | | |
| (Long-term) | $161,213,042 | $174,406,087 |
| U.S. government securities | | |
| (Long-term) | — | — |
| Total | $161,213,042 | $174,406,087 |
The fund may purchase or sell investments from or to other Putnam funds in the ordinary course of business, which can reduce the fund’s transaction costs, at prices determined in accordance with SEC requirements and policies approved by the Trustees. During the reporting period, purchases or sales of long-term securities from or to other Putnam funds, if any, did not represent more than 5% of the fund’s total cost of purchases and/or total proceeds from sales.
Note 4 — Capital shares
At the close of the reporting period, there were an unlimited number of shares of beneficial interest authorized. Subscriptions and redemptions are presented at the omnibus level. Transactions in capital shares were as follows:
| | | | | | | | |
| | | Class IA shares | | | Class IB shares | |
| | Year ended 12/31/18 | Year ended 12/31/17 | Year ended 12/31/18 | Year ended 12/31/17 |
| | Shares | Amount | Shares | Amount | Shares | Amount | Shares | Amount |
| Shares sold | 87,202 | $1,505,186 | 87,499 | $1,489,223 | 206,459 | $3,573,585 | 408,541 | $7,090,944 |
| Shares issued in connection with | | | | | | | | |
| reinvestment of distributions | 627,543 | 9,952,837 | 332,904 | 5,432,995 | 257,391 | 4,138,852 | 130,121 | 2,149,596 |
| | 714,745 | 11,458,023 | 420,403 | 6,922,218 | 463,850 | 7,712,437 | 538,662 | 9,240,540 |
| Shares repurchased | (774,594) | (13,022,557) | (906,555) | (15,464,493) | (607,821) | (10,481,723) | (435,552) | (7,502,553) |
| Net increase (decrease) | (59,849) | $(1,564,534) | (486,152) | $(8,542,275) | (143,971) | $(2,769,286) | 103,110 | $1,737,987 |
| |
| Putnam VT Global Asset Allocation Fund43 |
Note 5 — Affiliated transactions
Transactions during the reporting period with any company which is under common ownership or control were as follows:
| | | | | |
| | | | | | Shares outstanding |
| | Fair value as of | | | | and fair value as of |
| Name of affiliate | 12/31/17 | Purchase cost | Sale proceeds | Investment income | 12/31/18 |
| Short-term investments | | | | | |
| Putnam Cash Collateral Pool, LLC* | $1,312,325 | $6,857,899 | $8,170,224 | $9,441 | $— |
| Putnam Short Term Investment | | | | | |
| Fund** | 21,843,002 | 29,400,907 | 34,973,447 | 411,468 | 16,270,462 |
| Total Short-term investments | $23,155,327 | $36,258,806 | $43,143,671 | $420,909 | $16,270,462 |
*No management fees are charged to Putnam Cash Collateral Pool, LLC (Note 1). Investment income shown is included in securities lending income on the Statement of operations. There were no realized or unrealized gains or losses during the period.
**Management fees charged to Putnam Short Term Investment Fund have been waived by Putnam Management. There were no realized or unrealized gains or losses during the period.
Note 6 — Market, credit and other risks
In the normal course of business, the fund trades financial instruments and enters into financial transactions where risk of potential loss exists due to changes in the market (market risk) or failure of the contracting party to the transaction to perform (credit risk). The fund may be exposed to additional credit risk that an institution or other entity with which the fund has unsettled or open transactions will default. Investments in foreign securities involve certain risks, including those related to economic instability, unfavorable political developments, and currency fluctuations. The fund may invest a significant portion of its assets in securitized debt instruments, including mortgage-backed and asset-backed investments. The yields and values of these investments are sensitive to changes in interest rates, the rate of principal payments on the underlying assets and the market’s perception of the issuers. The market for these investments may be volatile and limited, which may make them difficult to buy or sell.
Note 7 — Senior loan commitments
Senior loans are purchased or sold on a when-issued or delayed delivery basis and may be settled a month or more after the trade date, which from time to time can delay the actual investment of available cash balances; interest income is accrued based on the terms of the securities. Senior loans can be acquired through an agent, by assignment from another holder of the loan, or as a participation interest in another holder’s portion of the loan. When the fund invests in a loan or participation, the fund is subject to the risk that an intermediate participant between the fund and the borrower will fail to meet its obligations to the fund, in addition to the risk that the borrower under the loan may default on its obligations.
Note 8 — Summary of derivative activity
The volume of activity for the reporting period for any derivative type that was held during the period is listed below and was based on an average of the holdings at the end of each fiscal quarter:
| |
| Purchased currency options (contract amount) | $2,200,000 |
| Written currency options (contract amount) | $1,900,000 |
| Written swap option contracts (contract amount) | $17,000 |
| Futures contracts (number of contracts) | 300 |
| Forward currency contracts (contract amount) | $35,200,000 |
| Centrally cleared interest rate swap contracts (notional) | $14,300,000 |
| OTC total return swap contracts (notional) | $14,300,000 |
| OTC credit default contracts (notional) | $1,600,000 |
| Centrally cleared credit default contracts (notional) | $5,900,000 |
| Warrants (number of warrants) | 200 |
| |
| 44Putnam VT Global Asset Allocation Fund |
The following is a summary of the fair value of derivative instruments as of the close of the reporting period:
Fair value of derivative instruments as of the close of the reporting period
| | | | |
| | Asset derivatives | Liability derivatives |
| Derivatives not accounted for as hedging | Statement of assets and | | Statement of assets and | |
| instruments under ASC 815 | liabilities location | Fair value | liabilities location | Fair value |
| | | | Payables, | |
| | Receivables, Net | | Net assets — | |
| | assets — Unrealized | | Unrealized | |
| Credit contracts | appreciation | $74,880* | depreciation | $131,011* |
| | Investments, | | | |
| Foreign exchange contracts | Receivables | 122,120 | Payables | 209,437 |
| | Investments, | | Payables, | |
| | Receivables, Net | | Net assets — | |
| | assets — Unrealized | | Unrealized | |
| Equity contracts | appreciation | 565,955* | depreciation | 942,112* |
| | | | Payables, | |
| | Receivables, Net | | Net assets — | |
| | assets — Unrealized | | Unrealized | |
| Interest rate contracts | appreciation | 420,561* | depreciation | 202,106* |
| Total | | $1,183,516 | | $1,484,666 |
*Includes cumulative appreciation/depreciation of futures contracts and/or centrally cleared swaps as reported in the fund’s portfolio. Only current day’s variation margin is reported within the Statement of assets and liabilities.
The following is a summary of realized and change in unrealized gains or losses of derivative instruments in the Statement of operations for the reporting period (Note 1):
| | | | | | |
| Amount of realized gain or (loss) on derivatives recognized in net gain or (loss) on investments | | | |
| | | | | Forward | | |
| Derivatives not accounted for as hedging | | | | currency | | |
| instruments under ASC 815 | Warrants | Options | Futures | contracts | Swaps | Total |
| Credit contracts | $— | $— | $— | $— | $4,762 | $4,762 |
| Foreign exchange contracts | — | (33,871) | — | (381,887) | — | $(415,758) |
| Equity contracts | — | — | (758,937) | — | 106,819 | $(652,118) |
| Interest rate contracts | — | 36,377 | (565,302) | — | (60,168) | $(589,093) |
| Total | $— | $2,506 | $(1,324,239) | $(381,887) | $51,413 | $(1,652,207) |
| | | | | | |
| Change in unrealized appreciation or (depreciation) on derivatives recognized in net gain or (loss) on investments | | |
| | | | | Forward | | |
| Derivatives not accounted for as hedging | | | | currency | | |
| instruments under ASC 815 | Warrants | Options | Futures | contracts | Swaps | Total |
| Credit contracts | $— | $— | $— | $— | $(65,906) | $(65,906) |
| Foreign exchange contracts | — | 1,986 | — | 16,969 | — | $18,955 |
| Equity contracts | (168) | — | (425,734) | — | (82,059) | $(507,961) |
| Interest rate contracts | — | (36,383) | 281,485 | — | (3,881) | $241,221 |
| Total | $(168) | $(34,397) | $(144,249) | $16,969 | $(151,846) | $(313,691) |
| |
| Putnam VT Global Asset Allocation Fund45 |
Note 9 — Offsetting of financial and derivative assets and liabilities
The following table summarizes any derivatives, repurchase agreements and reverse repurchase agreements, at the end of the reporting period, that are subject to an enforceable master netting agreement or similar agreement. For securities lending transactions or borrowing transactions associated with securities sold short, if any, see Note 1. For financial reporting purposes, the fund does not offset financial assets and financial liabilities that are subject to the master netting agreements in the Statement of assets and liabilities.
| | | | | | | | | | | | | | | | | | |
| | Bank of
America N.A. | Barclays
Bank PLC | Barclays
Capital,
Inc.
(clearing
broker) | Citibank,
N.A. | Citigroup
Global
Markets, Inc. | Credit
Suisse International | Goldman
Sachs International | HSBC Bank
USA, National Association | JPMorgan
Chase
Bank N.A. | JPMorgan Securities
LLC | Merrill
Lynch International | Merrill
Lynch,
Pierce,
Fenner &
Smith, Inc. | Morgan
Stanley &
Co.
International
PLC | NatWest
Markets PLC | State
Street
Bank and
Trust Co. | UBS AG | WestPac Banking
Corp. | Total |
| Assets: | | | | | | | | | | | | | | | | | | |
| Centrally cleared interest rate | | | | | | | | | | | | | | | | | | |
| swap contracts§ | $— | $— | $851 | $— | $— | $— | $— | $— | $— | $— | $— | $— | $— | $— | $— | $— | $— | $851 |
| OTC Total return | | | | | | | | | | | | | | | | | | |
| swap contracts*# | — | 1,318 | — | 306,840 | — | 1,174 | — | — | — | 750 | — | — | — | — | — | — | — | 310,082 |
| OTC Credit default contracts — | | | | | | | | | | | | | | | | | | |
| protection sold*# | — | — | — | — | — | — | — | — | — | — | — | — | — | — | — | — | — | — |
| OTC Credit default contracts — | | | | | | | | | | | | | | | | | | |
| protection purchased*# | — | — | — | — | 4,292 | 20,252 | 8,202 | — | — | 9,560 | 3,090 | — | 3,234 | — | — | — | — | 48,630 |
| Centrally cleared credit | | | | | | | | | | | | | | | | | | |
| default contracts§ | — | — | 1,156 | — | — | — | — | — | — | — | — | — | — | — | — | — | — | 1,156 |
| Futures contracts§ | — | — | — | — | — | — | — | — | — | — | — | 96,227 | — | — | — | — | — | 96,227 |
| Forward currency contracts# | 5,060 | 139 | — | 13,571 | — | — | 16,842 | 4,861 | 16,513 | — | — | — | — | 2,831 | 13,167 | 4,423 | 6,904 | 84,311 |
| Purchased options**# | 17,288 | — | — | 10,469 | — | — | 6,009 | — | 4,043 | — | — | — | — | — | — | — | — | 37,809 |
| Total Assets | $22,348 | $1,457 | $2,007 | $330,880 | $4,292 | $21,426 | $31,053 | $4,861 | $20,556 | $10,310 | $3,090 | $96,227 | $3,234 | $2,831 | $13,167 | $4,423 | $6,904 | $579,066 |
| Liabilities: | | | | | | | | | | | | | | | | | | |
| Centrally cleared interest rate | | | | | | | | | | | | | | | | | | |
| swap contracts§ | — | — | 751 | — | — | — | — | — | — | — | — | — | — | — | — | — | — | 751 |
| OTC Total return | | | | | | | | | | | | | | | | | | |
| swap contracts*# | — | 1,694 | — | 339,592 | — | 407 | 400 | — | — | — | — | — | — | — | — | — | — | 342,093 |
| OTC Credit default contracts — | | | | | | | | | | | | | | | | | | |
| protection sold*# | 6,910 | — | — | — | 3,245 | 37,160 | 35,990 | — | — | 39,193 | 321 | — | 5,708 | — | — | — | — | 128,527 |
| OTC Credit default contracts — | | | | | | | | | | | | | | | | | | |
| protection purchased*# | — | — | — | — | — | — | — | — | — | — | — | — | — | — | — | — | — | — |
| Centrally cleared credit | | | | | | | | | | | | | | | | | | |
| default contracts§ | — | — | — | — | — | — | — | — | — | — | — | — | — | — | — | — | — | — |
| Futures contracts§ | — | — | — | — | — | — | — | — | — | — | — | 56,525 | — | — | — | — | — | 56,525 |
| Forward currency contracts# | 23,949 | 8,912 | — | 6,093 | — | 26,817 | 52,899 | 25,489 | 8,794 | — | — | — | — | 12,091 | 21,339 | 7,422 | 2,906 | 196,711 |
| Written options# | 5,685 | — | — | 2,717 | — | — | 2,132 | — | 2,192 | — | — | — | — | — | — | — | — | 12,726 |
| Total Liabilities | $36,544 | $10,606 | $751 | $348,402 | $3,245 | $64,384 | $91,421 | $25,489 | $10,986 | $39,193 | $321 | $56,525 | $5,708 | $12,091 | $21,339 | $7,422 | $2,906 | $737,333 |
| Total Financial and Derivative | | | | | | | | | | | | | | | | | | |
| Net Assets | $(14,196) | $(9,149) | $1,256 | $(17,522) | $1,047 | $(42,958) | $(60,368) | $(20,628) | $9,570 | $(28,883) | $2,769 | $39,702 | $(2,474) | $(9,260) | $(8,172) | $(2,999) | $3,998 | $(158,267) |
| Total collateral received | | | | | | | | | | | | | | | | | | |
| (pledged)†## | $— | $— | $— | $— | $— | $— | $— | $— | $— | $— | $— | $— | $— | $— | $— | $— | $— | |
| Net amount | $(14,196) | $(9,149) | $1,256 | $(17,522) | $1,047 | $(42,958) | $(60,368) | $(20,628) | $9,570 | $(28,883) | $2,769 | $39,702 | $(2,474) | $(9,260) | $(8,172) | $(2,999) | $3,998 | |
| Controlled collateral received | | | | | | | | | | | | | | | | | | |
| (including TBA commitments)** | $— | $— | $— | $— | $— | $— | $— | $— | $— | $— | $— | $— | $— | $— | $— | $— | $— | $— |
| Uncontrolled collateral received | $— | $— | $— | $— | $— | $— | $— | $— | $— | $— | $— | $— | $— | $— | $— | $— | $— | $— |
| Collateral (pledged) (including | | | | | | | | | | | | | | | | | | |
| TBA commitments)** | $— | $— | $— | $— | $— | $— | $— | $— | $— | $— | $— | $— | $— | $— | $— | $— | $— | $— |
*Excludes premiums, if any. Included in unrealized appreciation and depreciation on OTC swap contracts on the Statement of assets and liabilities.
**Included with Investments in securities on the Statement of assets and liabilities.
†Additional collateral may be required from certain brokers based on individual agreements.
#Covered by master netting agreement (Note 1).
##Any over-collateralization of total financial and derivative net assets is not shown. Collateral may include amounts related to unsettled agreements.
§Includes current day’s variation margin only as reported on the Statement of assets and liabilities, which is not collateralized. Cumulative appreciation/ (depreciation) for futures contracts and centrally cleared swap contracts is represented in the tables listed after the fund’s portfolio. Collateral pledged for initial margin on futures contracts and centrally cleared swap contracts, which is not included in the table above, amounted to $407,981 and $97,837, respectively.
| | |
| 46 Putnam VT Global Asset Allocation Fund | Putnam VT Global Asset Allocation Fund47 |
Note 10 — New accounting pronouncements
In March 2017, the Financial Accounting Standards Board issued Accounting Standards Update (ASU) No. 2017–08,Receivables—Nonrefundable Fees and Other Costs(Subtopic 310–20):Premium Amortization on Purchased Callable Debt Securities.The amendments in the ASU shorten the amortization period for certain callable debt securities held at a premium, to be amortized to the earliest call date. The ASU is effective for fiscal years and interim periods within those fiscal years beginning after December 15, 2018. Management is currently evaluating the impact, if any, of applying this provision.
Federal tax information(Unaudited)
Pursuant to §852 of the Internal Revenue Code, as amended, the fund hereby designates $4,376,561 as a capital gain dividend with respect to the taxable year ended December 31, 2018, or, if subsequently determined to be different, the net capital gain of such year.
The fund designated 19.29% of ordinary income distributions as qualifying for the dividends received deduction for corporations.
| |
| 48Putnam VT Global Asset Allocation Fund |
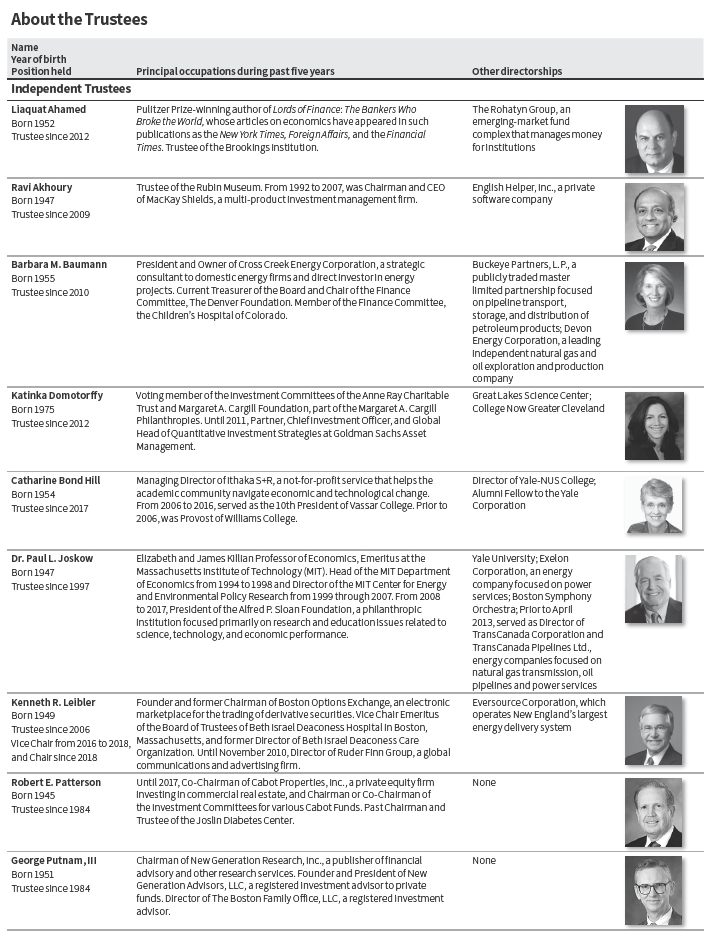
| | |
| | Putnam VT Global Asset Allocation Fund49 |
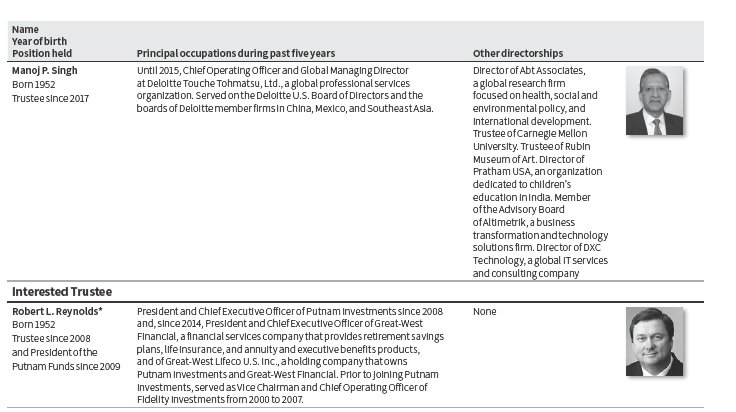
*Mr. Reynolds is an “interested person” (as defined in the Investment Company Act of 1940) of the fund and Putnam Investments. He is President and Chief Executive Officer of Putnam Investments, as well as the President of your fund and each of the other Putnam funds.
The address of each Trustee is 100 Federal Street, Boston, MA 02110.
As of December 31, 2018, there were 99 Putnam funds. All Trustees serve as Trustees of all Putnam funds.
Each Trustee serves for an indefinite term, until his or her resignation, retirement at age 75, removal, or death.
Officers
In addition to Robert L. Reynolds, the other officers of the fund are shown below:
| | |
| Jonathan S. Horwitz(Born 1955) | Michael J. Higgins(Born 1976) | Mark C. Trenchard(Born 1962) |
| Executive Vice President, Principal Executive | Vice President, Treasurer, and Clerk | Vice President and BSA Compliance Officer |
| Officer, and Compliance Liaison | Since 2010 | Since 2002 |
| Since 2004 | | Director of Operational Compliance, |
| | Janet C. Smith(Born 1965) | Putnam Investments and Putnam |
| Robert T. Burns(Born 1961) | Vice President, Principal Financial Officer, | Retail Management |
| Vice President and Chief Legal Officer | Principal Accounting Officer, and Assistant | |
| Since 2011 | Treasurer | Nancy E. Florek(Born 1957) |
| General Counsel, Putnam Investments, Putnam | Since 2007 | Vice President, Director of Proxy Voting and |
| Management, and Putnam Retail Management | Head of Fund Administration Services, | Corporate Governance, Assistant Clerk, and |
| | Putnam Investments and Putnam Management | Assistant Treasurer |
| James F. Clark(Born 1974) | | Since 2000 |
| Vice President and Chief Compliance Officer | Susan G. Malloy(Born 1957) | |
| Since 2016 | Vice President and Assistant Treasurer | Denere P. Poulack(Born 1968) |
| Chief Compliance Officer, Putnam Investments | Since 2007 | Assistant Vice President, Assistant Clerk, |
| and Putnam Management | Head of Accounting, Middle Office, & Control | and Assistant Treasurer |
| | Services, Putnam Investments and | Since 2004 |
| | Putnam Management | |
The principal occupations of the officers for the past five years have been with the employers as shown above, although in some cases they have held different positions with such employers. The address of each officer is 100 Federal Street, Boston, MA 02110.
| |
| 50Putnam VT Global Asset Allocation Fund |
|
| This page intentionally left blank. |
| |
| Putnam VT Global Asset Allocation Fund51 |
|
| This page intentionally left blank. |
| |
| 52Putnam VT Global Asset Allocation Fund |
Other important information
Proxy voting
Putnam is committed to managing our mutual funds in the best interests of our shareholders. The Putnam funds’ proxy voting guidelines and procedures, as well as information regarding how your fund voted proxies relating to portfolio securities during the 12-month period ended June 30, 2018, are available in the Individual Investors section of putnam.com and on the Securities and Exchange Commission’s (SEC) website, www.sec.gov. If you have questions about finding forms on the SEC’s website, you may call the SEC at 1-800-SEC-0330. You may also obtain the Putnam funds’ proxy voting guidelines and procedures at no charge by calling Putnam’s Shareholder Services at 1-800-225-1581.
Fund portfolio holdings
Each Putnam VT fund will file a complete schedule of its portfolio holdings with the SEC for the first and third quarters of each fiscal year on Form N-Q.Shareholders may obtain the fund’s Form N-Q on the SEC’s website at www.sec.gov.
| | |
| Fund information | | |
| |
| Investment Manager | Investor Servicing Agent | Trustees |
| Putnam Investment Management, LLC | Putnam Investments | Kenneth R. Leibler, Chair |
| 100 Federal Street | Mailing address: | Liaquat Ahamed |
| Boston, MA 02110 | P.O. Box 219697 | Ravi Akhoury |
| | Kansas City, MO 64121-9697 | Barbara M. Baumann |
| Investment Sub-Advisors | 1-800-225-1581 | Katinka Domotorffy |
| Putnam Investments Limited | | Catharine Bond Hill |
| 16 St James’s Street | Custodian | Paul L. Joskow |
| London, England SW1A 1ER | State Street Bank and Trust Company | Robert E. Patterson |
| | | George Putnam, III |
| The Putnam Advisory Company, LLC | Legal Counsel | Robert L. Reynolds |
| 100 Federal Street | Ropes & Gray LLP | Manoj P. Singh |
| Boston, MA 02110 | | |
| | Independent Registered | |
| Marketing Services | Public Accounting Firm | |
| Putnam Retail Management | PricewaterhouseCoopers LLP | |
| 100 Federal Street | | |
| Boston, MA 02110 | | |
The fund’s Statement of Additional Information contains additional information about the fund’s Trustees and is available without charge upon request by calling 1-800-225-1581.
| |
| Putnam VT Global Asset Allocation Fund53 |
| |
| | |
| This report has been prepared for the shareholders | H505 |
| of Putnam VT Global Asset Allocation Fund. | VTAN062 315008 2/19 |
| |
| (a) The fund’s principal executive, financial and accounting officers are employees of Putnam Investment Management, LLC, the Fund’s investment manager. As such they are subject to a comprehensive Code of Ethics adopted and administered by Putnam Investments which is designed to protect the interests of the firm and its clients. The Fund has adopted a Code of Ethics which incorporates the Code of Ethics of Putnam Investments with respect to all of its officers and Trustees who are employees of Putnam Investment Management, LLC. For this reason, the Fund has not adopted a separate code of ethics governing its principal executive, financial and accounting officers. |
| |
| (c) In February 2018, the Code of Ethics of Putnam Investments was amended. The key changes to the Code of Ethics are as follows: (i) Prohibition of investing in public coin offerings or token offerings, (ii) Removal of monetary fines as available sanctions for violations of the Code of Ethics, and (iii) Expanded definition of “Immediate Family Member”. |
| |
| Item 3. Audit Committee Financial Expert: |
| |
| The Funds’ Audit, Compliance and Distributions Committee is comprised solely of Trustees who are “independent” (as such term has been defined by the Securities and Exchange Commission (“SEC”) in regulations implementing Section 407 of the Sarbanes-Oxley Act (the “Regulations”)). The Trustees believe that each of the members of the Audit, Compliance and Distributions Committee also possess a combination of knowledge and experience with respect to financial accounting matters, as well as other attributes, that qualify them for service on the Committee. In addition, the Trustees have determined that each of Mr. Patterson, Ms. Baumann and Mr. Singh qualifies as an “audit committee financial expert” (as such term has been defined by the Regulations) based on their review of his or her pertinent experience and education. The SEC has stated, and the funds’ amended and restated agreement and Declaration of Trust provides, that the designation or identification of a person as an audit committee financial expert pursuant to this Item 3 of Form N-CSR does not impose on such person any duties, obligations or liability that are greater than the duties, obligations and liability imposed on such person as a member of the Audit, Compliance and Distribution Committee and the Board of Trustees in the absence of such designation or identification. |
| |
| Item 4. Principal Accountant Fees and Services: |
| |
| The following table presents fees billed in each of the last two fiscal years for services rendered to the fund by the fund’s independent auditor: |
| | | | | |
| Fiscal year ended | Audit Fees | Audit-Related Fees | Tax Fees | All Other Fees |
|
|
| | | | | |
| December 31, 2018 | $102,085 | $370* | $17,286 | $ — |
| December 31, 2017 | $108,307 | $ — | $19,727 | $205 |
| * | Fees billed to the fund for services relating to a review of certain trading activity that was the subject of a settlement between Putnam Investment Management, LLC and the Securities and Exchange Commission. |
| |
| For the fiscal years ended December 31, 2018 and December 31, 2017, the fund’s independent auditor billed aggregate non-audit fees in the amounts of $634,138 and $402,462 respectively, to the fund, Putnam Management and any entity controlling, controlled by or under common control with Putnam Management that provides ongoing services to the fund. |
| |
| Audit Fees represent fees billed for the fund’s last two fiscal years relating to the audit and review of the financial statements included in annual reports and registration statements, and other services that are normally provided in connection with statutory and regulatory filings or engagements. |
| |
| Audit-Related Fees represent fees billed in the fund’s last two fiscal years for services traditionally performed by the fund’s auditor, including accounting consultation for proposed transactions or concerning financial accounting and reporting standards and other audit or attest services not required by statute or regulation. |
| |
| Tax Fees represent fees billed in the fund’s last two fiscal years for tax compliance, tax planning and tax advice services. Tax planning and tax advice services include assistance with tax audits, employee benefit plans and requests for rulings or technical advice from taxing authorities. |
| |
| All Other Fees represent fees billed for services relating to an analysis of fund profitability |
| |
| Pre-Approval Policies of the Audit, Compliance and Distributions Committee. The Audit, Compliance and Distributions Committee of the Putnam funds has determined that, as a matter of policy, all work performed for the funds by the funds’ independent auditors will be pre-approved by the Committee itself and thus will generally not be subject to pre-approval procedures. |
| |
| The Audit, Compliance and Distributions Committee also has adopted a policy to pre-approve the engagement by Putnam Management and certain of its affiliates of the funds’ independent auditors, even in circumstances where pre-approval is not required by applicable law. Any such requests by Putnam Management or certain of its affiliates are typically submitted in writing to the Committee and explain, among other things, the nature of the proposed engagement, the estimated fees, and why this work should be performed by that particular audit firm as opposed to another one. In reviewing such requests, the Committee considers, among other things, whether the provision of such services by the audit firm are compatible with the independence of the audit firm. |
| |
| The following table presents fees billed by the fund’s independent auditor for services required to be approved pursuant to paragraph (c)(7)(ii) of Rule 2-01 of Regulation S-X. |
| | | | | |
| Fiscal year ended | Audit-Related Fees | Tax Fees | All Other Fees | Total Non-Audit Fees |
|
|
| | | | | |
| December 31, 2018 | $ — | $616,482 | $ — | $ — |
| | | | | |
| December 31, 2017 | $ — | $382,530 | $ — | $ — |
| |
| Item 5. Audit Committee of Listed Registrants |
| |
|
Item 6. Schedule of Investments: |
| |
| The registrant’s schedule of investments in unaffiliated issuers is included in the report to shareholders in Item 1 above. |
| |
| Item 7. Disclosure of Proxy Voting Policies and Procedures For Closed-End Management Investment Companies: |
| |
|
Item 8. Portfolio Managers of Closed-End Investment Companies |
| |
|
Item 9. Purchases of Equity Securities by Closed-End Management Investment Companies and Affiliated Purchasers: |
| |
|
Item 10. Submission of Matters to a Vote of Security Holders: |
| |
|
Item 11. Controls and Procedures: |
| |
| (a) The registrant’s principal executive officer and principal financial officer have concluded, based on their evaluation of the effectiveness of the design and operation of the registrant’s disclosure controls and procedures as of a date within 90 days of the filing date of this report, that the design and operation of such procedures are generally effective to provide reasonable assurance that information required to be disclosed by the registrant in this report is recorded, processed, summarized and reported within the time periods specified in the Commission’s rules and forms. |
| |
| (b) Changes in internal control over financial reporting: Not applicable |
| |
| (a)(1) The Code of Ethics of The Putnam Funds, which incorporates the Code of Ethics of Putnam Investments, is filed herewith. |
| |
| (a)(2) Separate certifications for the principal executive officer and principal financial officer of the registrant as required by Rule 30a-2(a) under the Investment Company Act of 1940, as amended, are filed herewith. |
| |
| (b) The certifications required by Rule 30a-2(b) under the Investment Company Act of 1940, as amended, are filed herewith. |
| |
| Pursuant to the requirements of the Securities Exchange Act of 1934 and the Investment Company Act of 1940, the registrant has duly caused this report to be signed on its behalf by the undersigned, thereunto duly authorized. |
| |
| By (Signature and Title): |
| |
| /s/ Janet C. Smith
Janet C. Smith
Principal Accounting Officer
|
| |
| Pursuant to the requirements of the Securities Exchange Act of 1934 and the Investment Company Act of 1940, this report has been signed below by the following persons on behalf of the registrant and in the capacities and on the dates indicated. |
| |
| By (Signature and Title): |
| |
| /s/ Jonathan S. Horwitz
Jonathan S. Horwitz
Principal Executive Officer
|
| |
| By (Signature and Title): |
| |
| /s/ Janet C. Smith
Janet C. Smith
Principal Financial Officer
|