| | |
| UNITED STATES
SECURITIES AND EXCHANGE COMMISSION |
| | |
| CERTIFIED SHAREHOLDER REPORT OF REGISTERED
MANAGEMENT INVESTMENT COMPANIES
|
| | |
| Investment Company Act file number: | (811-05346) |
| | |
| Exact name of registrant as specified in charter: | Putnam Variable Trust |
| | |
| Address of principal executive offices: | 100 Federal Street, Boston, Massachusetts 02110 |
| | |
| Name and address of agent for service: | Robert T. Burns, Vice President
100 Federal Street
Boston, Massachusetts 02110 |
| | |
| Copy to: | Bryan Chegwidden, Esq.
Ropes & Gray LLP
1211 Avenue of the Americas
New York, New York 10036 |
| | |
| Registrant's telephone number, including area code: | (617) 292-1000 |
| | |
| Date of fiscal year end: | December 31, 2020 |
| | |
| Date of reporting period: | January 1, 2020 — December 31, 2020 |
| | |
|
Item 1. Report to Stockholders: | |
| | |
| The following is a copy of the report transmitted to stockholders pursuant to Rule 30e-1 under the Investment Company Act of 1940: | |
Message from the Trustees
February 10, 2021
Dear Shareholder:
The world welcomed 2021 with high hopes for improvement in the global economy and public health. Although COVID-19 infections have reached new levels, distribution of vaccines is underway, boosting optimism about a return to normal in the not-too-distant future. In the United States, new proposals to rebuild the economy are anticipated from the Biden administration. The stock and bond markets started the year in good shape, indicating that investors are willing to look beyond current challenges and see the potential for renewed economic growth.
Putnam continues to employ active strategies that seek superior investment performance for you and your fellow shareholders. Putnam’s portfolio managers and analysts take a research-intensive approach that includes risk management strategies designed to serve you through changing conditions.
As always, thank you for investing with Putnam.

Performance summary (as of 12/31/20)
Investment objective
Balanced investment composed of a well-diversified portfolio of stocks and bonds which produce both capital growth and current income
Net asset value December 31, 2020
| |
| Class IA: $14.13 | Class IB: $14.05 |
Total return at net asset value
| | | | | |
| | | | | George | | |
| | | | | Putnam | | | Bloomberg |
| | | | | Blended | | S&P 500 | | Barclays |
| | | | | Index | | Index | | U.S. |
| | | | | (primary | | (secondary | | Aggregate |
| (as of | | Class IA | | Class IB | | bench- | | bench- | | Bond |
| 12/31/20) | | shares* | | shares* | | mark) | | mark) | | Index |
| 1 year | 15.61% | 15.32% | 15.68% | 18.40% | 7.51% |
| 5 years | 74.60 | 72.35 | 71.04 | 103.04 | 24.24 |
| Annualized | 11.79 | 11.50 | 11.33 | 15.22 | 4.44 |
| 10 years | 163.64 | 157.32 | 164.62 | 267.00 | 45.76 |
| Annualized | 10.18 | 9.91 | 10.22 | 13.88 | 3.84 |
| Life | 245.75 | 227.92 | 372.59 | 419.06 | 202.94 |
| Annualized | 5.63 | 5.38 | 7.09 | 7.54 | 5.01 |
For a portion of the periods, the fund had expense limitations, without which returns would have been lower.
* Class inception date: April 30, 1998.
Source: Bloomberg Index Services Limited
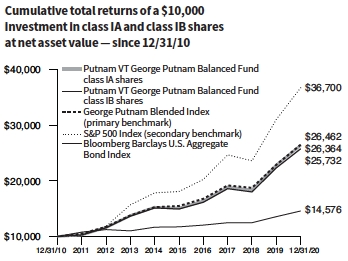
The George Putnam Blended Index is an unmanaged index administered by Putnam Management, 60% of which is based on the S&P 500 Index and 40% of which is based on the Bloomberg Barclays U.S. Aggregate Bond Index. The S&P 500 Index is an unmanaged index of large U.S. company stocks. The Bloomberg Barclays U.S. Aggregate Bond Index is an unmanaged index of U.S. investment-grade fixed-income securities.
Source: Bloomberg Index Services Limited.
BLOOMBERG® is a trademark and service mark of Bloomberg Finance L.P. and its affiliates (collectively “Bloomberg”). BARCLAYS® is a trademark and service mark of Barclays Bank Plc (collectively with its affiliates, “Barclays”), used under license. Bloomberg or Bloomberg’s licensors, including Barclays, own all proprietary rights in the Bloomberg Barclays Indices. Neither Bloomberg nor Barclays approves or endorses this material, or guarantees the accuracy of completeness of any information herein, or makes any warranty, express or limited, as to the results to be obtained therefrom and, to the maximum extent allowed by law, neither shall have any liability or responsibility for injury or damages arising in connection therewith.
Data represent past performance. Past performance does not guarantee future results. More recent returns may be less or more than those shown. Investment return and principal value will fluctuate, and you may have a gain or a loss when you sell your shares. Performance information does not reflect any deduction for taxes a shareholder may owe on fund distributions or on the redemption of fund shares. All total return figures are at net asset value and exclude contract charges and expenses, which are added to the variable annuity contracts to determine total return at unit value. Had these charges and expenses been reflected, performance would have been lower. For more recent performance, contact your variable annuity provider who can provide you with performance that reflects the charges and expenses at your contract level.
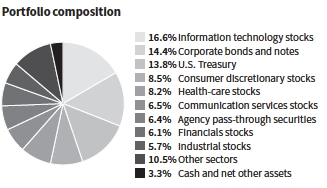
Allocations are shown as a percentage of the fund’s net assets. Cash and net other assets, if any, represent the market value weights of cash, derivatives, short-term securities, and other unclassified assets in the portfolio. Summary information may differ from the portfolio schedule included in the financial statements due to the inclusion of derivative securities, any interest accruals, the exclusion of as-of trades, if any, the use of different classifications of securities for presentation purposes, and rounding. Holdings and allocations may vary over time.
| |
| Putnam VT George Putnam Balanced Fund 1 |
Report from your fund’s managers
Can you describe the investing environment for the 12-month reporting period?
After a relatively calm start to 2020, the COVID-19 pandemic sent shockwaves across financial markets. A collapse in oil prices further rattled investors. Major stock indexes tumbled to record lows in the month of March. Massive amounts of fiscal and monetary support from global governments and central banks helped calm investors’ nerves. By the end of March, the U.S. Federal Reserve [the Fed] cut interest rates to near zero and increased its asset purchases. U.S. Congress approved a historic $2 trillion in stimulus. Stock markets rallied in the second and third quarters of 2020. Corporate credit — both investment-grade and high-yield — advanced and spreads tightened, mirroring the strength seen across equity markets.
In September, a resurgence in COVID-19 cases contributed to bouts of market volatility. When Joe Biden was declared U.S. President-elect in November, markets snapped back. In December, the first approved COVID-19 vaccines began distribution, and a $900 billion federal stimulus bill was passed in Washington. Stocks finished the period up 18.40%, as measured by the S&P 500 Index. The yield on the 10-year U.S. Treasury note ended the period at 0.91%, down from 1.92% at the start of the period. The Bloomberg Barclays U.S. Aggregate Bond Index*, a measure of investment-grade bonds, returned 7.51% for the reporting period.
How did Putnam VT George Putnam Balanced Fund perform during the period?
For the 12-month reporting period, the fund’s class IA shares returned 15.61%, which was nearly the same as its primary benchmark, the George Putnam Blended Index, which returned 15.68%. This custom index is composed of 40% the Bloomberg Barclays U.S. Aggregate Bond Index and 60% the S&P 500 Index. The fund underperformed its secondary benchmark, the S&P 500 Index.
How did the portfolio’s bond allocations perform during the period?
The bond portion of the fund underperformed the Bloomberg Barclays U.S. Aggregate Bond Index by roughly 48 basis points. Our allocations to corporate bonds, which represented 14.4% of total assets, contributed to overall performance. Bonds issued by companies in the industrials sector were beneficial to results. Relative to the Bloomberg Barclays U.S. Aggregate Bond Index, an overweight position in the independent energy and wireless sectors also contributed positively to results. Underweight exposure to the railroads and food sub-sectors, along with an overweight position in wirelines, detracted the most from performance.
How did the portfolio’s stock holdings perform during the period?
Activision Blizzard, the U.S. video gaming company, was the portfolio’s top stock contributor. Sales of Activision’s multiplayer virtual games soared as consumers sought at-home entertainment under lockdowns. Nvidia, a U.S. semiconductor chip designer, also was a top performer, benefiting from strong quarterly earnings and strategic merger and acquisition activity. NXP Semiconductors N.V., a Dutch American semiconductor company, also aided results. NXP saw a rebound in global demand for its core business in the third quarter of 2020.
Top detractors included an underweight position relative to the S&P 500 Index in Apple, which performed well over the period. Certain energy holdings, including BP and Cenovus Energy, were a drag on performance due to global demand disruptions and a collapse in oil prices.
As the fund begins a new fiscal year, what is your outlook?
We have a constructive outlook across asset classes for 2021. For U.S. investment-grade corporate bond markets, we have a positive outlook on fundamentals and technicals, which together support a neutral view on valuation. In our view, balance sheets are healthy with leverage at or near its peak, and liquidity metrics are strong following record issuance in 2020. Potential risks include delays in vaccine distribution and an uptick in M&A activity, which could increase leverage, in our view. As companies adapt to the post-pandemic environment, we would expect new investment opportunities to unfold. We use a rigorous research process to select stocks and bond issuers that we believe can add value to the portfolio over the long term.
The views expressed in this report are exclusively those of Putnam Management and are subject to change. They are not meant as investment advice. Please note that the holdings discussed in this report may not have been held by the fund for the entire period. Portfolio composition is subject to review in accordance with the fund’s investment strategy and may vary in the future.
*Source: Bloomberg Index Services Limited. BLOOMBERG® is a trademark and service mark of Bloomberg Finance L.P. and its affiliates (collectively “Bloomberg”). BARCLAYS® is a trademark and service mark of Barclays Bank Plc (collectively with its affiliates, “Barclays”), used under license. Bloomberg or Bloomberg’s licensors, including Barclays, own all proprietary rights in the Bloomberg Barclays Indices. Neither Bloomberg nor Barclays approves or endorses this material, or guarantees the accuracy of completeness of any information herein, or makes any warranty, express or limited, as to the results to be obtained therefrom and, to the maximum extent allowed by law, neither shall have any liability or responsibility for injury or damages arising in connection therewith.
Consider these risks before investing: The value of investments in the fund’s portfolio may fall or fail to rise over extended periods of time for a variety of reasons, including general economic, political, or financial market conditions; investor sentiment and market perceptions; government actions; geopolitical events or changes; and factors related to a specific issuer, asset class, geography, industry, or sector. These and other factors may lead to increased volatility and reduced liquidity in the fund’s portfolio holdings. Growth stocks may be more susceptible to earnings disappointments, and value stocks may fail to rebound. Bond investments are subject to interest-rate risk (the risk of bond prices falling if interest rates rise) and credit risk (the risk of an issuer defaulting on interest or principal payments). Interest-rate risk is generally greater for longer-term bonds, and credit risk is generally greater for below-investment-grade bonds. Risks associated with derivatives include increased investment exposure (which may be considered leverage) and, in the case of over-the-counter instruments,
| |
| 2 Putnam VT George Putnam Balanced Fund |
the potential inability to terminate or sell derivatives positions and the potential failure of the other party to the instrument to meet its obligations. Our investment techniques, analyses, and judgments may not produce the outcome we intend. The investments we select for the fund may not perform as well as other securities that we do not select for the fund. We, or the fund’s other service providers, may experience disruptions or operating errors that could have a negative effect on the fund. You can lose money by investing in the fund.

Your fund’s managers also manage other accounts advised by Putnam Management or an affiliate, including retail mutual fund counterparts to the funds in Putnam Variable Trust.
| |
| Putnam VT George Putnam Balanced Fund 3 |
Understanding your fund’s expenses
As an investor in a variable annuity product that invests in a registered investment company, you pay ongoing expenses, such as management fees, distribution fees (12b-1 fees), and other expenses. Using the following information, you can estimate how these expenses affect your investment and compare them with the expenses of other funds. You may also pay one-time transaction expenses, which are not shown in this section and would result in higher total expenses. Charges and expenses at the insurance company separate account level are not reflected. For more information, see your fund’s prospectus or talk to your financial representative.
Review your fund’s expenses
The two left-hand columns of the Expenses per $1,000 table show the expenses you would have paid on a $1,000 investment in your fund from 7/1/20 to 12/31/20. They also show how much a $1,000 investment would be worth at the close of the period, assuming actual returns and expenses. To estimate the ongoing expenses you paid over the period, divide your account value by $1,000, then multiply the result by the number in the first line for the class of shares you own.
Compare your fund’s expenses with those of other funds
The two right-hand columns of the Expenses per $1,000 table show your fund’s expenses based on a $1,000 investment, assuming a hypothetical 5% annualized return. You can use this information to compare the ongoing expenses (but not transaction expenses or total costs) of investing in the fund with those of other funds. All shareholder reports of mutual funds and funds serving as variable annuity vehicles will provide this information to help you make this comparison. Please note that you cannot use this information to estimate your actual ending account balance and expenses paid during the period.
Expense ratios
| | |
| | Class IA | Class IB |
| Total annual operating expenses for the fiscal | | |
| year ended 12/31/19 | 0.69% | 0.94% |
| Annualized expense ratio for the six-month | | |
| period ended 12/31/20* | 0.67% | 0.92% |
Fiscal year expense information in this table is taken from the most recent prospectus, is subject to change, and may differ from that shown for the annualized expense ratio and in the financial highlights of this report.
Expenses are shown as a percentage of average net assets.
*For the fund’s most recent fiscal half year; may differ from expense ratios based on one-year data in the financial highlights.
Expenses per $1,000
| | | | |
| | | | Expenses and value for a |
| | Expenses and value for a | $1,000 investment, assuming |
| | $1,000 investment, assuming | a hypothetical 5% annualized |
| | actual returns for the | return for the 6 months |
| | 6 months ended 12/31/20 | ended 12/31/20 | |
| | Class IA | Class IB | Class IA | Class IB |
| Expenses paid | | | | |
| per $1,000*† | $3.61 | $4.95 | $3.40 | $4.67 |
| Ending value | | | | |
| (after | | | | |
| expenses) | $1,143.20 | $1,141.30 | $1,021.77 | $1,020.51 |
*Expenses for each share class are calculated using the fund’s annualized expense ratio for each class, which represents the ongoing expenses as a percentage of average net assets for the six months ended 12/31/20. The expense ratio may differ for each share class.
†Expenses based on actual returns are calculated by multiplying the expense ratio by the average account value for the period; then multiplying the result by the number of days in the period; and then dividing that result by the number of days in the year. Expenses based on a hypothetical 5% return are calculated by multiplying the expense ratio by the average account value for the six-month period; then multiplying the result by the number of days in the six-month period; and then dividing that result by the number of days in the year.
| |
| 4 Putnam VT George Putnam Balanced Fund |
Report of Independent Registered Public Accounting Firm
To the Board of Trustees of Putnam Variable Trust and Shareholders of
Putnam VT George Putnam Balanced Fund:
Opinion on the Financial Statements
We have audited the accompanying statement of assets and liabilities, including the fund’s portfolio, of Putnam VT George Putnam Balanced Fund (one of the funds constituting Putnam Variable Trust, referred to hereafter as the “Fund”) as of December 31, 2020, the related statement of operations for the year ended December 31, 2020, the statement of changes in net assets for each of the two years in the period ended December 31, 2020, including the related notes, and the financial highlights for each of the five years in the period ended December 31, 2020 (collectively referred to as the “financial statements”). In our opinion, the financial statements present fairly, in all material respects, the financial position of the Fund as of December 31, 2020, the results of its operations for the year then ended, the changes in its net assets for each of the two years in the period ended December 31, 2020 and the financial highlights for each of the five years in the period ended December 31, 2020 in conformity with accounting principles generally accepted in the United States of America.
Basis for Opinion
These financial statements are the responsibility of the Fund’s management. Our responsibility is to express an opinion on the Fund’s financial statements based on our audits. We are a public accounting firm registered with the Public Company Accounting Oversight Board (United States) (“PCAOB”) and are required to be independent with respect to the Fund in accordance with the U.S. federal securities laws and the applicable rules and regulations of the Securities and Exchange Commission and the PCAOB.
We conducted our audits of these financial statements in accordance with the standards of the PCAOB. Those standards require that we plan and perform the audit to obtain reasonable assurance about whether the financial statements are free of material misstatement, whether due to error or fraud.
Our audits included performing procedures to assess the risks of material misstatement of the financial statements, whether due to error or fraud, and performing procedures that respond to those risks. Such procedures included examining, on a test basis, evidence regarding the amounts and disclosures in the financial statements. Our audits also included evaluating the accounting principles used and significant estimates made by management, as well as evaluating the overall presentation of the financial statements. Our procedures included confirmation of securities owned as of December 31, 2020 by correspondence with the custodian, transfer agent and brokers; when replies were not received from brokers, we performed other auditing procedures. We believe that our audits provide a reasonable basis for our opinion.
PricewaterhouseCoopers LLP
Boston, Massachusetts
February 10, 2021
We have served as the auditor of one or more investment companies in the Putnam Investments family of mutual funds since at least 1957. We have not been able to determine the specific year we began serving as auditor.
| |
| Putnam VT George Putnam Balanced Fund 5 |
The fund’s portfolio 12/31/20
| | |
| COMMON STOCKS (61.4%)* | Shares | Value |
| | | |
| Automotive (1.4%) | | |
| Fisker, Inc. † | 24,857 | $364,155 |
| General Motors Co. | 6,093 | 253,713 |
| Tesla, Inc. † | 2,988 | 2,108,542 |
| United Rentals, Inc. † | 1,756 | 407,234 |
| | | 3,133,644 |
| Basic materials (1.7%) | | |
| Albemarle Corp. | 726 | 107,100 |
| Anglo American PLC (United Kingdom) | 16,925 | 563,726 |
| Corteva, Inc. | 5,808 | 224,886 |
| Dow, Inc. | 5,395 | 299,423 |
| DuPont de Nemours, Inc. S | 2,250 | 159,998 |
| Eastman Chemical Co. | 1,791 | 179,601 |
| Fortune Brands Home & Security, Inc. | 6,676 | 572,267 |
| Freeport-McMoRan, Inc. (Indonesia) | 16,464 | 428,393 |
| Newmont Corp. | 7,115 | 426,117 |
| Packaging Corp. of America | 1,058 | 145,909 |
| Sherwin-Williams Co. (The) | 891 | 654,805 |
| Summit Materials, Inc. Class A † | 4,686 | 94,095 |
| | | 3,856,320 |
| Capital goods (3.4%) | | |
| Avery Dennison Corp. | 1,760 | 272,994 |
| Ball Corp. | 2,605 | 242,734 |
| Boeing Co. (The) | 1,178 | 252,163 |
| Deere & Co. | 1,749 | 470,568 |
| Eaton Corp. PLC | 9,076 | 1,090,391 |
| Emerson Electric Co. | 6,942 | 557,929 |
| General Dynamics Corp. | 2,651 | 394,522 |
| Honeywell International, Inc. | 4,937 | 1,050,100 |
| Johnson Controls International PLC | 16,383 | 763,284 |
| Northrop Grumman Corp. | 1,814 | 552,762 |
| Otis Worldwide Corp. | 9,257 | 625,310 |
| Pentair PLC | 3,830 | 203,335 |
| Raytheon Technologies Corp. | 17,503 | 1,251,640 |
| | | 7,727,732 |
| Commercial and consumer services (3.1%) | | |
| Aramark | 8,496 | 326,926 |
| Booking Holdings, Inc. † | 400 | 890,908 |
| CoStar Group, Inc. † | 523 | 483,398 |
| Ecolab, Inc. | 805 | 174,170 |
| Mastercard, Inc. Class A | 6,343 | 2,264,070 |
| PayPal Holdings, Inc. † | 12,358 | 2,894,244 |
| | | 7,033,716 |
| Communication services (1.7%) | | |
| Charter Communications, Inc. Class A † | 3,180 | 2,103,729 |
| T-Mobile US, Inc. † | 12,090 | 1,630,337 |
| | | 3,734,066 |
| Computers (2.8%) | | |
| Apple, Inc. | 46,546 | 6,176,189 |
| | | 6,176,189 |
| Conglomerates (0.6%) | | |
| Danaher Corp. | 4,153 | 922,547 |
| General Electric Co. | 33,628 | 363,182 |
| | | 1,285,729 |
| Consumer staples (3.8%) | | |
| Airbnb, Inc. Class A † | 175 | 25,690 |
| Altria Group, Inc. | 14,295 | 586,095 |
| Bunge, Ltd. | 998 | 65,449 |
| Chipotle Mexican Grill, Inc. † | 433 | 600,445 |
| | |
| COMMON STOCKS (61.4%)* cont. | Shares | Value |
| | | |
| Consumer staples cont. | | |
| Coca-Cola Co. (The) | 19,642 | $1,077,167 |
| Costco Wholesale Corp. | 1,659 | 625,078 |
| McCormick & Co., Inc. (non-voting shares) | 6,419 | 613,656 |
| Molson Coors Beverage Co. Class B | 5,570 | 251,708 |
| PepsiCo, Inc. | 13,535 | 2,007,241 |
| Procter & Gamble Co. (The) | 18,584 | 2,585,778 |
| | | 8,438,307 |
| Electronics (4.2%) | | |
| Advanced Micro Devices, Inc. † | 16,502 | 1,513,391 |
| Monolithic Power Systems, Inc. | 4,048 | 1,482,499 |
| NXP Semiconductors NV | 14,619 | 2,324,567 |
| Qualcomm, Inc. | 10,837 | 1,650,909 |
| Texas Instruments, Inc. | 11,227 | 1,842,688 |
| Vontier Corp. † | 17,910 | 598,194 |
| | | 9,412,248 |
| Energy (1.1%) | | |
| Cairn Energy PLC (United Kingdom) † | 38,175 | 109,834 |
| Cenovus Energy, Inc. (Canada) | 150,429 | 915,881 |
| ONEOK, Inc. | 2,582 | 99,097 |
| Phillips 66 | 3,254 | 227,585 |
| Royal Dutch Shell PLC Class A (United Kingdom) | 23,944 | 425,087 |
| TOTAL SA (France) | 11,243 | 485,002 |
| Williams Cos., Inc. (The) | 6,024 | 120,781 |
| | | 2,383,267 |
| Financials (7.7%) | | |
| AIA Group, Ltd. (Hong Kong) | 30,600 | 376,921 |
| American International Group, Inc. | 27,538 | 1,042,589 |
| Assured Guaranty, Ltd. | 29,656 | 933,867 |
| AXA SA (France) | 33,159 | 795,513 |
| Berkshire Hathaway, Inc. Class B † | 4,320 | 1,001,678 |
| Boston Properties, Inc. R | 2,950 | 278,864 |
| Charles Schwab Corp. (The) | 16,498 | 875,054 |
| Citigroup, Inc. | 39,917 | 2,461,282 |
| Gaming and Leisure Properties, Inc. R | 33,699 | 1,428,838 |
| Goldman Sachs Group, Inc. (The) | 7,409 | 1,953,827 |
| Intercontinental Exchange, Inc. | 5,922 | 682,747 |
| KKR & Co., Inc. Class A | 22,667 | 917,787 |
| Morgan Stanley | 13,097 | 897,537 |
| Prudential PLC (United Kingdom) | 54,596 | 1,007,746 |
| Quilter PLC (United Kingdom) | 259,512 | 545,656 |
| Visa, Inc. Class A | 9,263 | 2,026,096 |
| Yellow Cake PLC 144A (United Kingdom) † | 9,584 | 32,670 |
| | | 17,258,672 |
| Gaming and lottery (0.1%) | | |
| Penn National Gaming, Inc. † | 3,726 | 321,815 |
| | | 321,815 |
| Health care (7.8%) | | |
| Abbott Laboratories | 8,899 | 974,352 |
| AbbVie, Inc. | 17,351 | 1,859,160 |
| Alexion Pharmaceuticals, Inc. † | 891 | 139,210 |
| Amgen, Inc. | 3,035 | 697,807 |
| Avantor, Inc. † | 14,831 | 417,493 |
| Bio-Rad Laboratories, Inc. Class A † | 732 | 426,712 |
| Biogen, Inc. † | 1,905 | 466,458 |
| Boston Scientific Corp. † | 14,274 | 513,150 |
| Bristol-Myers Squibb Co. | 12,012 | 745,104 |
| Cigna Corp. | 4,713 | 981,152 |
| Cooper Cos., Inc. (The) | 1,201 | 436,347 |
| DexCom, Inc. † | 1,070 | 395,600 |
| |
| 6 Putnam VT George Putnam Balanced Fund |
| | |
| COMMON STOCKS (61.4%)* cont. | Shares | Value |
| | | |
| Health care cont. | | |
| Edwards Lifesciences Corp. † | 5,051 | $460,803 |
| Eli Lilly and Co. | 5,711 | 964,245 |
| Humana, Inc. | 780 | 320,011 |
| Innoviva, Inc. † | 15,809 | 195,874 |
| Johnson & Johnson | 8,269 | 1,301,375 |
| Medtronic PLC | 8,598 | 1,007,170 |
| Merck & Co., Inc. | 9,304 | 761,067 |
| Pfizer, Inc. | 17,059 | 627,942 |
| Regeneron Pharmaceuticals, Inc. † | 979 | 472,965 |
| Thermo Fisher Scientific, Inc. | 1,801 | 838,870 |
| UnitedHealth Group, Inc. | 4,612 | 1,617,336 |
| Viatris, Inc. † | 2,116 | 39,654 |
| Zimmer Biomet Holdings, Inc. | 3,452 | 531,919 |
| Zoetis, Inc. | 2,741 | 453,636 |
| | | 17,645,412 |
| Lodging/Tourism (0.4%) | | |
| Hilton Worldwide Holdings, Inc. | 5,543 | 616,714 |
| Wynn Resorts, Ltd. | 2,711 | 305,882 |
| | | 922,596 |
| Publishing (0.3%) | | |
| Thomson Reuters Corp. (Canada) S | 7,729 | 632,928 |
| | | 632,928 |
| Retail (6.3%) | | |
| Advance Auto Parts, Inc. | 1,056 | 166,331 |
| Amazon.com, Inc. † | 2,075 | 6,758,130 |
| BJ’s Wholesale Club Holdings, Inc. † | 3,751 | 139,837 |
| Burlington Stores, Inc. † | 87 | 22,755 |
| CarMax, Inc. † S | 4,902 | 463,043 |
| Dollar General Corp. | 2,817 | 592,415 |
| Home Depot, Inc. (The) | 8,450 | 2,244,489 |
| NIKE, Inc. Class B | 5,999 | 848,679 |
| Target Corp. | 5,857 | 1,033,936 |
| TJX Cos., Inc. (The) | 7,132 | 487,044 |
| Walmart, Inc. | 10,459 | 1,507,665 |
| | | 14,264,324 |
| Software (6.1%) | | |
| Activision Blizzard, Inc. | 26,145 | 2,427,563 |
| Adobe, Inc. † | 4,838 | 2,419,581 |
| Microsoft Corp. | 35,253 | 7,840,972 |
| Sea, Ltd. ADR (Thailand) † | 5,397 | 1,074,273 |
| | | 13,762,389 |
| Technology services (5.1%) | | |
| Alphabet, Inc. Class A † | 2,717 | 4,761,923 |
| Facebook, Inc. Class A † | 9,615 | 2,626,433 |
| Fidelity National Information Services, Inc. | 11,718 | 1,657,628 |
| Fiserv, Inc. † | 20,901 | 2,379,788 |
| | | 11,425,772 |
| Textiles (0.1%) | | |
| Levi Strauss & Co. Class A | 12,478 | 250,558 |
| | | 250,558 |
| Toys (0.2%) | | |
| Hasbro, Inc. | 4,339 | 405,870 |
| | | 405,870 |
| Transportation (1.4%) | | |
| CSX Corp. | 4,686 | 425,255 |
| FedEx Corp. | 875 | 227,168 |
| Southwest Airlines Co. | 9,811 | 457,291 |
| Union Pacific Corp. | 10,164 | 2,116,348 |
| | | 3,226,062 |
| Utilities and power (2.1%) | | |
| Ameren Corp. | 5,490 | 428,549 |
| Exelon Corp. | 22,547 | 951,934 |
| | |
| COMMON STOCKS (61.4%)* cont. | Shares | Value |
| | | |
| Utilities and power cont. | | |
| NextEra Energy, Inc. | 14,971 | $1,155,013 |
| NRG Energy, Inc. | 49,155 | 1,845,770 |
| Southern Co. (The) | 6,290 | 386,395 |
| | | 4,767,661 |
| | | |
| Total common stocks (cost $104,381,636) | | $138,065,277 |
| | | |
| U.S. GOVERNMENT AND AGENCY | | | |
| MORTGAGE OBLIGATIONS (6.8%)* | Principal amount | Value |
| | |
| U.S. Government Guaranteed Mortgage Obligations (1.3%) | |
| Government National Mortgage Association | | |
| Pass-Through Certificates | | | |
| 4.50%, 3/20/49 | | $707,095 | $781,338 |
| 3.50%, TBA, 1/1/51 | | 1,000,000 | 1,059,844 |
| 3.50%, 11/20/47 | | 541,472 | 600,893 |
| 3.00%, 7/20/46 | | 563,525 | 593,329 |
| | | | 3,035,404 |
| U.S. Government Agency Mortgage Obligations (5.5%) | |
| Federal National Mortgage Association | | | |
| Pass-Through Certificates | | | |
| 5.50%, with due dates from 7/1/33 to 11/1/38 | 107,364 | 125,214 |
| 5.00%, 8/1/33 | | 44,917 | 50,972 |
| 4.50%, 2/1/49 | | 1,321,507 | 1,477,042 |
| 4.00%, with due dates from 4/1/49 to 5/1/49 | 1,809,085 | 1,934,636 |
| 3.50%, with due dates from 11/1/49 to 12/1/49 | 1,753,240 | 1,852,520 |
| 3.00%, 6/1/46 | | 546,110 | 589,151 |
| 2.50%, 10/1/50 | | 991,117 | 1,049,968 |
| 2.00%, 10/1/50 | | 2,965,026 | 3,082,497 |
| Uniform Mortgage-Backed Securities 4.50%, TBA, | | |
| 1/1/51 | | 2,000,000 | 2,167,500 |
| | | | 12,329,500 |
| Total U.S. government and agency mortgage | | |
| obligations (cost $15,012,428) | | | $15,364,904 |
| | |
| U.S. TREASURY OBLIGATIONS (13.8%)* | Principal amount | Value |
| | | |
| U.S. Treasury Bonds | | |
| 3.00%, 2/15/47 | $1,250,000 | $1,635,112 |
| 2.75%, 8/15/42 # | 3,200,000 | 3,965,976 |
| 1.25%, 5/15/50 | 1,480,000 | 1,342,638 |
| U.S. Treasury Notes | | |
| 2.75%, 2/15/24 | 1,380,000 | 1,490,778 |
| 2.375%, 8/15/24 | 1,230,000 | 1,325,505 |
| 2.125%, 12/31/22 | 3,160,000 | 3,285,364 |
| 2.00%, 2/15/22 | 2,340,000 | 2,389,099 |
| 1.75%, 9/30/22 | 1,860,000 | 1,912,530 |
| 1.75%, 6/30/22 | 2,430,000 | 2,488,900 |
| 1.625%, 2/15/26 | 1,030,000 | 1,095,313 |
| 1.625%, 10/31/23 | 2,750,000 | 2,864,535 |
| 1.50%, 2/15/30 | 1,020,000 | 1,079,088 |
| 1.50%, 3/31/23 | 3,670,000 | 3,781,524 |
| 1.125%, 2/28/25 | 2,240,000 | 2,319,013 |
| Total U.S. treasury obligations (cost $29,919,500) | $30,975,375 |
| | |
| CORPORATE BONDS AND NOTES (14.3%)* | Principal amount | Value |
| |
| Basic materials (0.7%) | | |
| Celanese US Holdings, LLC company guaranty | |
| sr. unsec. notes 3.50%, 5/8/24 (Germany) | $45,000 | $48,731 |
| Celanese US Holdings, LLC company | | |
| guaranty sr. unsec. unsub. notes 4.625%, | | |
| 11/15/22 (Germany) | 71,000 | 76,188 |
| CF Industries, Inc. 144A company | | |
| guaranty sr. notes 4.50%, 12/1/26 | 180,000 | 213,256 |
| |
| Putnam VT George Putnam Balanced Fund 7 |
| | | |
| CORPORATE BONDS | | | |
| AND NOTES (14.3%)* cont. | Principal amount | Value |
| | | | |
| Basic materials cont. | | | |
| Georgia-Pacific, LLC 144A sr. unsec. | | | |
| sub. notes 2.10%, 4/30/27 | | $200,000 | $211,151 |
| Glencore Finance Canada, Ltd. 144A company | | |
| guaranty sr. unsec. unsub. notes 6.00%, | | | |
| 11/15/41 (Canada) | | 5,000 | 6,336 |
| Glencore Funding, LLC 144A company | | | |
| guaranty sr. unsec. notes 1.625%, 9/1/25 | 76,000 | 77,948 |
| Glencore Funding, LLC 144A company | | | |
| guaranty sr. unsec. unsub. notes 4.625%, 4/29/24 | 98,000 | 109,445 |
| Glencore Funding, LLC 144A company | | | |
| guaranty sr. unsec. unsub. notes 4.00%, 4/16/25 | 59,000 | 66,020 |
| International Flavors & Fragrances, Inc. | | | |
| sr. unsec. notes 4.45%, 9/26/28 | | 80,000 | 94,704 |
| International Paper Co. sr. unsec. notes | | | |
| 8.70%, 6/15/38 | | 10,000 | 16,837 |
| Nutrien, Ltd. sr. unsec. notes 2.95%, | | | |
| 5/13/30 (Canada) | | 170,000 | 186,955 |
| Nutrition & Biosciences, Inc. 144A sr. unsec. | | |
| bonds 3.468%, 12/1/50 | | 27,000 | 29,329 |
| Nutrition & Biosciences, Inc. 144A sr. unsec. | | |
| bonds 2.30%, 11/1/30 | | 48,000 | 49,441 |
| Sherwin-Williams Co. (The) sr. unsec. | | | |
| unsub. bonds 3.45%, 6/1/27 | | 87,000 | 98,287 |
| WestRock MWV, LLC company guaranty sr. unsec. | | |
| unsub. notes 8.20%, 1/15/30 | | 140,000 | 199,512 |
| WestRock MWV, LLC company guaranty sr. unsec. | | |
| unsub. notes 7.95%, 2/15/31 | | 10,000 | 14,278 |
| Weyerhaeuser Co. sr. unsec. unsub. notes | | |
| 7.375%, 3/15/32 R | | 82,000 | 122,967 |
| | | | 1,621,385 |
| Capital goods (0.5%) | | | |
| Boeing Co. (The) sr. unsec. notes 4.875%, 5/1/25 | 90,000 | 102,592 |
| Johnson Controls International PLC sr. unsec. | | |
| unsub. bonds 4.50%, 2/15/47 | | 125,000 | 164,296 |
| L3Harris Technologies, Inc. sr. unsec. | | | |
| bonds 1.80%, 1/15/31 | | 90,000 | 91,363 |
| L3Harris Technologies, Inc. sr. unsec. | | | |
| notes 3.85%, 12/15/26 | | 100,000 | 115,552 |
| L3Harris Technologies, Inc. sr. unsec. | | | |
| sub. notes 4.40%, 6/15/28 | | 68,000 | 81,537 |
| Northrop Grumman Corp. sr. unsec. | | | |
| unsub. notes 3.25%, 1/15/28 | | 210,000 | 237,471 |
| Oshkosh Corp. sr. unsec. sub. notes 4.60%, 5/15/28 | 99,000 | 116,855 |
| Oshkosh Corp. sr. unsec. unsub. notes | | | |
| 3.10%, 3/1/30 | | 21,000 | 22,904 |
| Otis Worldwide Corp. sr. unsec. notes | | | |
| 2.565%, 2/15/30 | | 90,000 | 96,645 |
| Waste Connections, Inc. sr. unsec. | | | |
| sub. bonds 3.50%, 5/1/29 | | 130,000 | 148,284 |
| | | | 1,177,499 |
| Communication services (1.9%) | | | |
| American Tower Corp. sr. unsec. notes | | | |
| 2.90%, 1/15/30 R | | 130,000 | 141,703 |
| American Tower Corp. sr. unsec. sub. notes | | |
| 2.75%, 1/15/27 R | | 66,000 | 71,605 |
| American Tower Corp. sr. unsec. | | | |
| unsub. bonds 3.375%, 10/15/26 R | | 59,000 | 66,278 |
| AT&T, Inc. company guaranty sr. unsec. | | | |
| unsub. notes 2.30%, 6/1/27 | | 205,000 | 218,640 |
| AT&T, Inc. sr. unsec. bonds 4.30%, 2/15/30 | 124,000 | 148,123 |
| AT&T, Inc. sr. unsec. unsub. bonds 3.30%, 2/1/52 | 300,000 | 297,580 |
| | | |
| CORPORATE BONDS | | | |
| AND NOTES (14.3%)* cont. | Principal amount | Value |
| | | | |
| Communication services cont. | | | |
| AT&T, Inc. sr. unsec. unsub. notes 4.75%, 5/15/46 | $12,000 | $14,802 |
| AT&T, Inc. 144A sr. unsec. unsub. bonds | | | |
| 2.55%, 12/1/33 | | 213,000 | 218,354 |
| CC Holdings GS V, LLC/Crown Castle GS III Corp. | | |
| company guaranty sr. notes 3.849%, 4/15/23 | 30,000 | 32,198 |
| Charter Communications Operating, LLC/Charter | | |
| Communications Operating Capital Corp. company | | |
| guaranty sr. bonds 2.80%, 4/1/31 | | 44,000 | 46,538 |
| Charter Communications Operating, LLC/Charter | | |
| Communications Operating Capital Corp. company | | |
| guaranty sr. notes 3.75%, 2/15/28 | | 55,000 | 61,668 |
| Charter Communications Operating, LLC/Charter | | |
| Communications Operating Capital Corp. company | | |
| guaranty sr. sub. bonds 6.484%, 10/23/45 | 111,000 | 157,005 |
| Charter Communications Operating, LLC/Charter | | |
| Communications Operating Capital Corp. | | |
| sr. bonds 3.70%, 4/1/51 | | 5,000 | 5,192 |
| Charter Communications Operating, LLC/Charter | | |
| Communications Operating Capital Corp. company | | |
| guaranty sr. sub. bonds 5.375%, 5/1/47 | | 74,000 | 92,360 |
| Comcast Cable Communications Holdings, Inc. | | |
| company guaranty sr. unsec. notes | | | |
| 9.455%, 11/15/22 | | 25,000 | 29,258 |
| Comcast Corp. company guaranty sr. unsec. | | |
| unsub. bonds 3.999%, 11/1/49 | | 127,000 | 160,324 |
| Comcast Corp. company guaranty sr. unsec. | | |
| unsub. notes 6.50%, 11/15/35 | | 27,000 | 41,737 |
| Comcast Corp. company guaranty sr. unsec. | | |
| unsub. notes 3.15%, 3/1/26 | | 133,000 | 148,490 |
| Comcast Corp. sr. unsec. bonds 3.45%, 2/1/50 | 201,000 | 237,193 |
| Cox Communications, Inc. 144A company | | |
| guaranty sr. unsec. bonds 2.95%, 10/1/50 | 101,000 | 103,264 |
| Cox Communications, Inc. 144A sr. unsec. | | |
| bonds 3.50%, 8/15/27 | | 73,000 | 82,528 |
| Cox Communications, Inc. 144A sr. unsec. | | |
| notes 3.35%, 9/15/26 | | 76,000 | 85,396 |
| Crown Castle International Corp. sr. unsec. | | |
| bonds 3.80%, 2/15/28 R | | 134,000 | 154,439 |
| Crown Castle International Corp. sr. unsec. | | |
| bonds 3.65%, 9/1/27 R | | 66,000 | 74,513 |
| Crown Castle International Corp. sr. unsec. | | |
| notes 4.75%, 5/15/47 R | | 30,000 | 38,544 |
| Crown Castle International Corp. sr. unsec. | | |
| sub. bonds 2.25%, 1/15/31 | | 130,000 | 134,854 |
| Equinix, Inc. sr. unsec. sub. notes | | | |
| 3.20%, 11/18/29 R | | 194,000 | 212,967 |
| Rogers Communications, Inc. company | | | |
| guaranty sr. unsec. bonds 8.75%, 5/1/32 (Canada) | 10,000 | 15,357 |
| Rogers Communications, Inc. company | | | |
| guaranty sr. unsec. unsub. notes 4.50%, | | | |
| 3/15/43 (Canada) | | 35,000 | 44,367 |
| Sprint Spectrum Co., LLC/Sprint Spectrum Co. | | |
| II, LLC/Sprint Spectrum Co. III, LLC 144A | | | |
| company guaranty sr. notes 3.36%, 9/20/21 | 37,500 | 37,853 |
| T-Mobile USA, Inc. 144A company | | | |
| guaranty sr. notes 3.875%, 4/15/30 | | 96,000 | 111,187 |
| T-Mobile USA, Inc. 144A company | | | |
| guaranty sr. notes 3.75%, 4/15/27 | | 229,000 | 260,785 |
| Verizon Communications, Inc. sr. unsec. | | | |
| notes 3.15%, 3/22/30 | | 140,000 | 156,998 |
| |
| 8 Putnam VT George Putnam Balanced Fund |
| | | |
| CORPORATE BONDS | | | |
| AND NOTES (14.3%)* cont. | Principal amount | Value |
| | | | |
| Communication services cont. | | | |
| Verizon Communications, Inc. sr. unsec. | | | |
| unsub. notes 4.329%, 9/21/28 | | $392,000 | $472,058 |
| Videotron, Ltd./Videotron Ltee. 144A sr. unsec. | | |
| notes 5.125%, 4/15/27 (Canada) | | 80,000 | 84,900 |
| | | | 4,259,058 |
| Consumer cyclicals (1.5%) | | | |
| Alimentation Couche-Tard, Inc. 144A company | | |
| guaranty sr. unsec. notes 3.55%, | | | |
| 7/26/27 (Canada) | | 120,000 | 135,000 |
| Alimentation Couche-Tard, Inc. 144A sr. unsec. | | |
| notes 2.95%, 1/25/30 (Canada) | | 131,000 | 143,159 |
| Amazon.com, Inc. sr. unsec. notes 4.05%, 8/22/47 | 125,000 | 165,056 |
| Amazon.com, Inc. sr. unsec. notes 3.15%, 8/22/27 | 98,000 | 111,579 |
| Amazon.com, Inc. sr. unsec. unsub. notes | | |
| 1.50%, 6/3/30 | | 90,000 | 91,531 |
| Autonation, Inc. company guaranty sr. unsec. | | |
| notes 4.50%, 10/1/25 | | 24,000 | 26,677 |
| BMW US Capital, LLC 144A company | | | |
| guaranty sr. unsec. notes 3.95%, 8/14/28 | 77,000 | 89,748 |
| BMW US Capital, LLC 144A company | | | |
| guaranty sr. unsec. notes 3.40%, 8/13/21 | 45,000 | 45,838 |
| Discovery Communications, LLC company | | |
| guaranty sr. unsec. unsub. notes 3.625%, 5/15/30 | 62,000 | 71,021 |
| Dollar General Corp. sr. unsec. sub. notes | | |
| 3.25%, 4/15/23 | | 60,000 | 63,486 |
| Ecolab, Inc. sr. unsec. unsub. notes | | | |
| 3.25%, 12/1/27 | | 122,000 | 138,450 |
| Fox Corp. sr. unsec. notes Ser. WI, 4.03%, 1/25/24 | 55,000 | 60,574 |
| Fox Corp. sr. unsec. unsub. notes 3.05%, 4/7/25 | 55,000 | 60,016 |
| General Motors Financial Co., Inc. company | | |
| guaranty sr. unsec. notes 4.00%, 10/6/26 | 40,000 | 45,035 |
| General Motors Financial Co., Inc. company | | |
| guaranty sr. unsec. unsub. notes 4.30%, 7/13/25 | 47,000 | 52,693 |
| Global Payments, Inc. sr. unsec. notes | | | |
| 2.90%, 5/15/30 | | 117,000 | 127,398 |
| Hilton Worldwide Finance, LLC/Hilton Worldwide | | |
| Finance Corp. company guaranty sr. unsec. | | |
| notes 4.875%, 4/1/27 | | 92,000 | 97,375 |
| IHS Markit, Ltd. 144A company | | | |
| guaranty notes 4.75%, 2/15/25 (United Kingdom) | 160,000 | 183,600 |
| IHS Markit, Ltd. 144A company guaranty sr. unsec. | | |
| notes 4.00%, 3/1/26 (United Kingdom) | | 67,000 | 76,548 |
| Interpublic Group of Cos., Inc. (The) sr. unsec. | | |
| sub. bonds 4.65%, 10/1/28 | | 197,000 | 237,937 |
| Marriott International, Inc. sr. unsec. | | | |
| notes Ser. EE, 5.75%, 5/1/25 | | 40,000 | 46,788 |
| Moody’s Corp. sr. unsec. bonds 2.55%, 8/18/60 | 80,000 | 74,909 |
| Omnicom Group, Inc. company guaranty sr. unsec. | | |
| unsub. notes 3.60%, 4/15/26 | | 42,000 | 47,926 |
| Omnicom Group, Inc. sr. unsec. sub. notes | | |
| 2.45%, 4/30/30 | | 185,000 | 196,487 |
| QVC, Inc. company guaranty sr. notes 4.85%, 4/1/24 | 50,000 | 53,875 |
| S&P Global, Inc. company guaranty sr. unsec. | | |
| bonds 2.50%, 12/1/29 | | 175,000 | 190,871 |
| S&P Global, Inc. company guaranty sr. unsec. | | |
| notes 1.25%, 8/15/30 | | 56,000 | 55,207 |
| Sirius XM Radio, Inc. 144A sr. unsec. | | | |
| bonds 5.00%, 8/1/27 | | 150,000 | 158,250 |
| Standard Industries, Inc. 144A sr. unsec. | | | |
| notes 5.00%, 2/15/27 | | 145,000 | 151,525 |
| | | |
| CORPORATE BONDS | | | |
| AND NOTES (14.3%)* cont. | Principal amount | Value |
| | | | |
| Consumer cyclicals cont. | | | |
| ViacomCBS, Inc. company guaranty sr. unsec. | | |
| bonds 4.20%, 6/1/29 | | $60,000 | $71,773 |
| ViacomCBS, Inc. company guaranty sr. unsec. | | |
| unsub. bonds 2.90%, 1/15/27 | | 48,000 | 52,671 |
| ViacomCBS, Inc. company guaranty sr. unsec. | | |
| unsub. notes 4.00%, 1/15/26 | | 17,000 | 19,457 |
| Walt Disney Co. (The) company guaranty sr. unsec. | | |
| notes 7.75%, 1/20/24 | | 137,000 | 165,053 |
| | | | 3,307,513 |
| Consumer staples (0.8%) | | | |
| Anheuser-Busch Cos., LLC/Anheuser-Busch InBev | | |
| Worldwide, Inc. company guaranty sr. unsec. | | |
| unsub. notes 3.65%, 2/1/26 | | 17,000 | 19,216 |
| Anheuser-Busch InBev Worldwide, Inc. company | | |
| guaranty sr. unsec. unsub. bonds 5.55%, 1/23/49 | 151,000 | 214,703 |
| Anheuser-Busch InBev Worldwide, Inc. company | | |
| guaranty sr. unsec. unsub. notes 4.75%, 1/23/29 | 112,000 | 138,308 |
| Anheuser-Busch InBev Worldwide, Inc. company | | |
| guaranty sr. unsec. unsub. notes 4.15%, 1/23/25 | 39,000 | 44,409 |
| Ashtead Capital, Inc. 144A notes 4.375%, 8/15/27 | 200,000 | 211,250 |
| CVS Pass-Through Trust 144A sr. mtge. | | | |
| notes 7.507%, 1/10/32 | | 119,385 | 146,762 |
| ERAC USA Finance, LLC 144A company | | | |
| guaranty sr. unsec. notes 7.00%, 10/15/37 | 150,000 | 232,643 |
| ERAC USA Finance, LLC 144A company | | | |
| guaranty sr. unsec. notes 5.625%, 3/15/42 | 87,000 | 122,173 |
| Keurig Dr Pepper, Inc. company | | | |
| guaranty sr. unsec. bonds 3.20%, 5/1/30 | 41,000 | 46,421 |
| Keurig Dr Pepper, Inc. company | | | |
| guaranty sr. unsec. unsub. notes 4.597%, 5/25/28 | 80,000 | 97,368 |
| Keurig Dr Pepper, Inc. company | | | |
| guaranty sr. unsec. unsub. notes 4.417%, 5/25/25 | 64,000 | 73,788 |
| Keurig Dr Pepper, Inc. company | | | |
| guaranty sr. unsec. unsub. notes 4.057%, 5/25/23 | 49,000 | 53,239 |
| Kraft Heinz Co. (The) 144A company | | | |
| guaranty sr. unsec. notes 3.875%, 5/15/27 | 29,000 | 31,244 |
| Lamb Weston Holdings, Inc. 144A company | | |
| guaranty sr. unsec. unsub. notes 4.875%, 11/1/26 | 120,000 | 125,436 |
| Mondelez International Holdings Netherlands BV | | |
| 144A company guaranty sr. unsec. | | | |
| unsub. notes 2.00%, 10/28/21 (Netherlands) | 200,000 | 202,468 |
| | | | 1,759,428 |
| Energy (0.7%) | | | |
| BP Capital Markets America, Inc. company | | |
| guaranty sr. unsec. notes 3.119%, 5/4/26 | 80,000 | 88,573 |
| BP Capital Markets America, Inc. company | | |
| guaranty sr. unsec. unsub. notes 3.937%, 9/21/28 | 88,000 | 103,311 |
| Cheniere Corpus Christi Holdings, LLC company | | |
| guaranty sr. notes 5.125%, 6/30/27 | | 170,000 | 201,106 |
| Concho Resources, Inc. company | | | |
| guaranty sr. unsec. notes 3.75%, 10/1/27 | 130,000 | 148,579 |
| Diamondback Energy, Inc. company | | | |
| guaranty sr. unsec. notes 3.25%, 12/1/26 | 105,000 | 112,107 |
| Energy Transfer Operating LP jr. unsec. sub. FRB | | |
| Ser. B, 6.625%, perpetual maturity | | 257,000 | 217,165 |
| Energy Transfer Operating LP sr. unsec. | | | |
| unsub. notes 7.60%, 2/1/24 | | 30,000 | 34,663 |
| Energy Transfer Operating LP sr. unsec. | | | |
| unsub. notes 6.50%, 2/1/42 | | 20,000 | 24,400 |
| Energy Transfer Operating LP sr. unsec. | | | |
| unsub. notes 5.20%, 2/1/22 | | 40,000 | 41,450 |
| |
| Putnam VT George Putnam Balanced Fund 9 |
| | | |
| CORPORATE BONDS | | | |
| AND NOTES (14.3%)* cont. | Principal amount | Value |
| | | | |
| Energy cont. | | | |
| Equinor ASA company guaranty sr. unsec. | | |
| notes 5.10%, 8/17/40 (Norway) | | $80,000 | $111,933 |
| Marathon Petroleum Corp. sr. unsec. | | | |
| unsub. notes 6.50%, 3/1/41 | | 25,000 | 33,565 |
| Sabine Pass Liquefaction, LLC sr. bonds | | | |
| 4.20%, 3/15/28 | | 24,000 | 27,519 |
| Sabine Pass Liquefaction, LLC sr. notes | | | |
| 5.00%, 3/15/27 | | 105,000 | 123,802 |
| Sunoco Logistics Partners Operations LP company | | |
| guaranty sr. unsec. unsub. notes 5.95%, 12/1/25 | 25,000 | 29,492 |
| Targa Resources Partners LP/Targa Resources | | |
| Partners Finance Corp. company | | | |
| guaranty sr. unsec. unsub. notes 5.00%, 1/15/28 | 65,000 | 68,611 |
| Transcanada Trust company guaranty jr. unsec. | | |
| sub. FRB 5.30%, 3/15/77 (Canada) | | 135,000 | 143,100 |
| | | | 1,509,376 |
| Financials (4.3%) | | | |
| Air Lease Corp. sr. unsec. sub. bonds | | | |
| 4.625%, 10/1/28 | | 27,000 | 31,016 |
| Air Lease Corp. sr. unsec. sub. notes | | | |
| 3.25%, 10/1/29 | | 32,000 | 33,819 |
| Air Lease Corp. sr. unsec. unsub. notes | | | |
| 3.00%, 9/15/23 | | 115,000 | 120,905 |
| American International Group, Inc. jr. unsec. | | |
| sub. FRB 8.175%, 5/15/58 | | 14,000 | 20,512 |
| Aon PLC company guaranty sr. unsec. | | | |
| unsub. notes 4.25%, 12/12/42 | | 220,000 | 265,857 |
| Ares Capital Corp. sr. unsec. sub. notes | | | |
| 3.875%, 1/15/26 | | 205,000 | 222,134 |
| Australia & New Zealand Banking Group, Ltd. 144A | | |
| unsec. sub. FRB 2.57%, 11/25/35 (Australia) | 200,000 | 203,125 |
| Bank of America Corp. jr. unsec. | | | |
| sub. bonds Ser. JJ, 5.125%, perpetual maturity | 95,000 | 100,453 |
| Bank of America Corp. jr. unsec. sub. FRN | | |
| Ser. AA, 6.10%, perpetual maturity | | 32,000 | 36,240 |
| Bank of America Corp. sr. unsec. FRN Ser. MTN, | | |
| 2.496%, 2/13/31 | | 75,000 | 79,655 |
| Bank of America Corp. unsec. sub. notes | | |
| 6.11%, 1/29/37 | | 150,000 | 218,091 |
| Bank of Montreal unsec. sub. FRN 3.803%, | | |
| 12/15/32 (Canada) | | 45,000 | 51,007 |
| Bank of Nova Scotia (The) sr. unsec. notes 2.00%, | | |
| 11/15/22 (Canada) | | 400,000 | 413,070 |
| Berkshire Hathaway Finance Corp. company | | |
| guaranty sr. unsec. bonds 2.85%, 10/15/50 | 30,000 | 32,129 |
| Berkshire Hathaway Finance Corp. company | | |
| guaranty sr. unsec. notes 4.30%, 5/15/43 | 83,000 | 109,504 |
| BGC Partners, Inc. sr. unsec. notes | | | |
| 5.125%, 5/27/21 | | 10,000 | 10,068 |
| BPCE SA 144A unsec. sub. notes 5.15%, | | | |
| 7/21/24 (France) | | 200,000 | 225,823 |
| Cantor Fitzgerald LP 144A unsec. notes | | | |
| 6.50%, 6/17/22 | | 89,000 | 96,163 |
| Capital One Financial Corp. unsec. | | | |
| sub. notes 4.20%, 10/29/25 | | 63,000 | 71,928 |
| CBRE Services, Inc. company guaranty sr. unsec. | | |
| unsub. notes 4.875%, 3/1/26 | | 55,000 | 64,983 |
| CIT Group, Inc. sr. unsec. unsub. notes | | | |
| 5.25%, 3/7/25 | | 240,000 | 272,400 |
| Citigroup, Inc. sr. unsec. FRB 3.668%, 7/24/28 | 10,000 | 11,357 |
| Citigroup, Inc. unsec. sub. bonds 4.75%, 5/18/46 | 270,000 | 360,725 |
| | | |
| CORPORATE BONDS | | | |
| AND NOTES (14.3%)* cont. | Principal amount | Value |
| | | | |
| Financials cont. | | | |
| Citigroup, Inc. unsec. sub. bonds 4.45%, 9/29/27 | $264,000 | $312,084 |
| CNO Financial Group, Inc. sr. unsec. | | | |
| unsub. notes 5.25%, 5/30/25 | | 28,000 | 32,502 |
| Credit Suisse AG sr. unsec. notes 1.00%, 5/5/23 | 400,000 | 406,051 |
| Credit Suisse Group AG 144A sr. unsec. FRN | | |
| 2.193%, 6/5/26 (Switzerland) | | 250,000 | 260,583 |
| Digital Realty Trust LP company | | | |
| guaranty sr. unsec. bonds 4.45%, 7/15/28 R | 185,000 | 222,432 |
| Fairfax Financial Holdings, Ltd. sr. unsec. | | |
| notes 4.85%, 4/17/28 (Canada) | | 145,000 | 162,286 |
| Fairfax US, Inc. 144A company guaranty sr. unsec. | | |
| notes 4.875%, 8/13/24 | | 40,000 | 43,885 |
| Fifth Third Bancorp jr. unsec. sub. FRB 5.10%, | | |
| perpetual maturity | | 29,000 | 29,425 |
| Goldman Sachs Group, Inc. (The) sr. unsec. FRB | | |
| 4.223%, 5/1/29 | | 97,000 | 115,077 |
| Goldman Sachs Group, Inc. (The) sr. unsec. | | |
| unsub. notes 3.85%, 1/26/27 | | 192,000 | 219,109 |
| Goldman Sachs Group, Inc. (The) sr. unsec. | | |
| unsub. notes 2.60%, 2/7/30 | | 85,000 | 90,900 |
| ING Bank NV 144A unsec. sub. notes 5.80%, | | |
| 9/25/23 (Netherlands) | | 200,000 | 227,362 |
| Intercontinental Exchange, Inc. sr. unsec. | | |
| bonds 2.65%, 9/15/40 | | 127,000 | 130,343 |
| Intercontinental Exchange, Inc. sr. unsec. | | |
| bonds 1.85%, 9/15/32 | | 63,000 | 63,543 |
| JPMorgan Chase & Co. jr. unsec. bonds 6.10%, | | |
| perpetual maturity | | 26,000 | 28,516 |
| JPMorgan Chase & Co. jr. unsec. sub. FRB Ser. HH, | | |
| 4.60%, perpetual maturity | | 146,000 | 150,745 |
| JPMorgan Chase & Co. jr. unsec. sub. FRB Ser. W, | | |
| (BBA LIBOR USD 3 Month + 1.00%), 1.221%, 5/15/47 | 87,000 | 71,340 |
| JPMorgan Chase & Co. sr. unsec. unsub. FRB | | |
| 3.964%, 11/15/48 | | 185,000 | 232,828 |
| JPMorgan Chase & Co. unsec. sub. FRB | | | |
| 2.956%, 5/13/31 | | 363,000 | 398,063 |
| KKR Group Finance Co. VI, LLC 144A company | | |
| guaranty sr. unsec. bonds 3.75%, 7/1/29 | 25,000 | 29,090 |
| Marsh & McLennan Cos., Inc. sr. unsec. | | | |
| sub. notes 4.375%, 3/15/29 | | 185,000 | 225,242 |
| Massachusetts Mutual Life Insurance Co. 144A | | |
| unsec. sub. bonds 3.729%, 10/15/70 | | 175,000 | 192,063 |
| MetLife Capital Trust IV 144A jr. unsec. | | | |
| sub. notes 7.875%, 12/15/37 | | 400,000 | 564,000 |
| Morgan Stanley unsec. sub. notes Ser. GMTN, | | |
| 4.35%, 9/8/26 | | 450,000 | 530,545 |
| Neuberger Berman Group, LLC/Neuberger Berman | | |
| Finance Corp. 144A sr. unsec. notes | | | |
| 4.875%, 4/15/45 | | 40,000 | 45,359 |
| Prologis LP sr. unsec. unsub. notes | | | |
| 2.25%, 4/15/30 R | | 62,000 | 66,438 |
| Prologis LP sr. unsec. unsub. notes | | | |
| 2.125%, 4/15/27 R | | 26,000 | 27,899 |
| Prudential Financial, Inc. jr. unsec. sub. FRN | | |
| 5.625%, 6/15/43 | | 15,000 | 16,069 |
| Prudential Financial, Inc. jr. unsec. sub. FRN | | |
| 5.20%, 3/15/44 | | 173,000 | 186,408 |
| Prudential Financial, Inc. sr. unsec. | | | |
| notes 6.625%, 6/21/40 | | 35,000 | 54,102 |
| Royal Bank of Canada unsec. sub. notes Ser. GMTN, | | |
| 4.65%, 1/27/26 (Canada) | | 35,000 | 41,319 |
| |
| 10 Putnam VT George Putnam Balanced Fund |
| | | |
| CORPORATE BONDS | | | |
| AND NOTES (14.3%)* cont. | Principal amount | Value |
| | | | |
| Financials cont. | | | |
| Societe Generale SA 144A jr. unsec. | | | |
| sub. notes 5.375%, 11/18/50 (France) | | $205,000 | $217,113 |
| Teachers Insurance & Annuity Association | | |
| of America 144A unsec. sub. notes 6.85%, 12/16/39 | 40,000 | 62,920 |
| Toronto-Dominion Bank (The) unsec. sub. FRB | | |
| 3.625%, 9/15/31 (Canada) | | 78,000 | 88,398 |
| Truist Financial Corp. jr. unsec. sub. FRB | | | |
| Ser. N, 4.80%, 12/31/99 | | 75,000 | 79,217 |
| U.S. Bancorp unsec. sub. notes 3.00%, 7/30/29 | 230,000 | 256,888 |
| UBS AG unsec. sub. notes 5.125%, | | | |
| 5/15/24 (Switzerland) | | 360,000 | 395,809 |
| Wells Fargo & Co. jr. unsec. sub. FRB Ser. U, | | |
| 5.875%, perpetual maturity | | 65,000 | 73,206 |
| Westpac Banking Corp. unsec. sub. bonds 4.421%, | | |
| 7/24/39 (Australia) | | 85,000 | 108,515 |
| Westpac Banking Corp. unsec. sub. bonds 2.963%, | | |
| 11/16/40 (Australia) | | 79,000 | 84,125 |
| Willis Towers Watson PLC company | | | |
| guaranty sr. unsec. unsub. notes 5.75%, 3/15/21 | 110,000 | 111,108 |
| | | | 9,703,871 |
| Health care (1.5%) | | | |
| AbbVie, Inc. sr. unsec. notes 3.20%, 11/21/29 | 320,000 | 358,623 |
| Amgen, Inc. sr. unsec. bonds 4.663%, 6/15/51 | 83,000 | 113,216 |
| Amgen, Inc. sr. unsec. unsub. notes 2.60%, 8/19/26 | 33,000 | 36,027 |
| Becton Dickinson and Co. sr. unsec. notes | | |
| 2.823%, 5/20/30 | | 110,000 | 120,900 |
| Bristol-Myers Squibb Co. sr. unsec. notes | | |
| 2.75%, 2/15/23 | | 400,000 | 419,740 |
| Bristol-Myers Squibb Co. sr. unsec. | | | |
| sub. notes 3.40%, 7/26/29 | | 295,000 | 343,427 |
| Cigna Corp. company guaranty sr. unsec. | | |
| unsub. notes 3.75%, 7/15/23 | | 217,000 | 234,592 |
| CVS Health Corp. sr. unsec. unsub. notes | | |
| 4.78%, 3/25/38 | | 38,000 | 48,145 |
| CVS Pass-Through Trust 144A sr. mtge. | | | |
| notes 4.704%, 1/10/36 | | 11,819 | 13,409 |
| DH Europe Finance II Sarl company | | | |
| guaranty sr. unsec. bonds 3.40%, 11/15/49 | | |
| (Luxembourg) | | 185,000 | 219,009 |
| DH Europe Finance II Sarl company | | | |
| guaranty sr. unsec. notes 2.60%, | | | |
| 11/15/29 (Luxembourg) | | 80,000 | 87,492 |
| HCA, Inc. company guaranty sr. bonds 5.25%, 6/15/26 | 67,000 | 79,295 |
| HCA, Inc. company guaranty sr. notes 4.125%, 6/15/29 | 65,000 | 75,405 |
| HCA, Inc. company guaranty sr. sub. bonds | | |
| 5.50%, 6/15/47 | | 35,000 | 46,750 |
| HCA, Inc. company guaranty sr. sub. notes | | |
| 5.00%, 3/15/24 | | 10,000 | 11,250 |
| Service Corp. International sr. unsec. | | | |
| notes 4.625%, 12/15/27 | | 30,000 | 31,950 |
| Service Corp. International sr. unsec. | | | |
| notes 3.375%, 8/15/30 | | 20,000 | 20,804 |
| UnitedHealth Group, Inc. sr. unsec. | | | |
| unsub. notes 2.00%, 5/15/30 | | 211,000 | 223,805 |
| Viatris, Inc. 144A company guaranty sr. unsec. | | |
| bonds 4.00%, 6/22/50 | | 380,000 | 435,361 |
| Viatris, Inc. 144A company guaranty sr. unsec. | | |
| notes 2.30%, 6/22/27 | | 75,000 | 79,847 |
| Zoetis, Inc. sr. unsec. notes 3.90%, 8/20/28 | 150,000 | 176,716 |
| Zoetis, Inc. sr. unsec. sub. notes 3.00%, 9/12/27 | 90,000 | 100,709 |
| | | | 3,276,472 |
| | | |
| CORPORATE BONDS | | | |
| AND NOTES (14.3%)* cont. | Principal amount | Value |
| | | | |
| Technology (1.4%) | | | |
| Alphabet, Inc. sr. unsec. bonds 2.25%, 8/15/60 | $160,000 | $154,715 |
| Alphabet, Inc. sr. unsec. notes 1.998%, 8/15/26 | 84,000 | 90,067 |
| Apple, Inc. sr. unsec. unsub. notes 4.375%, 5/13/45 | 150,000 | 205,570 |
| Broadcom, Inc. company guaranty sr. unsec. | | |
| bonds 4.15%, 11/15/30 | | 358,000 | 414,479 |
| Cisco Systems, Inc. sr. unsec. | | | |
| unsub. notes 3.625%, 3/4/24 | | 400,000 | 439,781 |
| Diamond 1 Finance Corp./Diamond 2 Finance Corp. | | |
| 144A sr. bonds 8.35%, 7/15/46 | | 28,000 | 42,359 |
| Fidelity National Information Services, Inc. | | |
| sr. unsec. notes 3.00%, 8/15/26 | | 68,000 | 75,664 |
| Fidelity National Information Services, Inc. | | |
| sr. unsec. sub. notes Ser. 10Y, 4.25%, 5/15/28 | 58,000 | 69,036 |
| Fiserv, Inc. sr. unsec. bonds 3.50%, 7/1/29 | 85,000 | 97,058 |
| Fiserv, Inc. sr. unsec. sub. bonds 4.20%, 10/1/28 | 154,000 | 183,614 |
| Microchip Technology, Inc. company | | | |
| guaranty sr. notes 4.333%, 6/1/23 | | 140,000 | 151,552 |
| Microsoft Corp. sr. unsec. unsub. bonds | | | |
| 2.40%, 8/8/26 | | 66,000 | 72,005 |
| Microsoft Corp. sr. unsec. unsub. notes | | | |
| 3.70%, 8/8/46 | | 371,000 | 470,422 |
| Oracle Corp. sr. unsec. unsub. notes | | | |
| 2.65%, 7/15/26 | | 154,000 | 169,236 |
| Salesforce.com, Inc. sr. unsec. | | | |
| unsub. notes 3.70%, 4/11/28 | | 245,000 | 289,080 |
| ServiceNow, Inc. sr. unsec. notes 1.40%, 9/1/30 | 200,000 | 195,107 |
| | | | 3,119,745 |
| Transportation (—%) | | | |
| Penske Truck Leasing Co. LP/PTL Finance Corp. | | |
| 144A sr. unsec. bonds 3.40%, 11/15/26 | | 86,000 | 95,627 |
| | | | 95,627 |
| Utilities and power (1.0%) | | | |
| AES Corp. (The) 144A sr. unsec. bonds | | | |
| 2.45%, 1/15/31 | | 135,000 | 136,821 |
| American Electric Power Co., Inc. sr. unsec. | | |
| unsub. notes Ser. J, 4.30%, 12/1/28 | | 66,000 | 78,882 |
| Appalachian Power Co. sr. unsec. | | | |
| unsub. notes Ser. L, 5.80%, 10/1/35 | | 60,000 | 82,920 |
| Commonwealth Edison Co. sr. mtge. bonds | | |
| 5.875%, 2/1/33 | | 15,000 | 20,512 |
| Consolidated Edison Co. of New York, Inc. | | |
| sr. unsec. unsub. notes 4.20%, 3/15/42 | | 40,000 | 48,510 |
| Duke Energy Ohio, Inc. sr. bonds 3.65%, 2/1/29 | 130,000 | 150,611 |
| El Paso Natural Gas Co., LLC company | | | |
| guaranty sr. unsec. unsub. notes 8.375%, 6/15/32 | 75,000 | 105,618 |
| Enbridge, Inc. sr. unsec. unsub. bonds 4.25%, | | |
| 12/1/26 (Canada) | | 42,000 | 48,895 |
| Enterprise Products Operating, LLC company | | |
| guaranty sr. unsec. notes 2.80%, 1/31/30 | 230,000 | 249,278 |
| Enterprise Products Operating, LLC company | | |
| guaranty sr. unsec. unsub. bonds 4.25%, 2/15/48 | 65,000 | 75,799 |
| IPALCO Enterprises, Inc. sr. sub. notes | | | |
| 3.70%, 9/1/24 | | 35,000 | 38,149 |
| IPALCO Enterprises, Inc. 144A sr. bonds | | | |
| 4.25%, 5/1/30 | | 106,000 | 122,370 |
| Kinder Morgan Energy Partners LP company | | |
| guaranty sr. unsec. notes 5.40%, 9/1/44 | | 16,000 | 19,586 |
| Kinder Morgan Energy Partners LP company | | |
| guaranty sr. unsec. notes 3.50%, 3/1/21 | | 40,000 | 40,003 |
| Kinder Morgan, Inc. company guaranty sr. unsec. | | |
| unsub. notes 3.15%, 1/15/23 | | 75,000 | 78,878 |
| |
| Putnam VT George Putnam Balanced Fund 11 |
| | | |
| CORPORATE BONDS | | | |
| AND NOTES (14.3%)* cont. | Principal amount | Value |
| | | | |
| Utilities and power cont. | | | |
| NRG Energy, Inc. 144A company | | | |
| guaranty sr. bonds 4.45%, 6/15/29 | | $161,000 | $186,703 |
| NRG Energy, Inc. 144A company | | | |
| guaranty sr. notes 3.75%, 6/15/24 | | 80,000 | 87,132 |
| Oncor Electric Delivery Co., LLC sr. notes | | |
| 5.75%, 3/15/29 | | 55,000 | 72,532 |
| Pacific Gas and Electric Co. notes 2.10%, 8/1/27 | 30,000 | 30,529 |
| Pacific Gas and Electric Co. sr. notes 3.30%, 3/15/27 | 55,000 | 58,913 |
| PacifiCorp sr. bonds 2.70%, 9/15/30 | | 86,000 | 94,516 |
| Vistra Operations Co., LLC 144A company | | |
| guaranty sr. notes 4.30%, 7/15/29 | | 58,000 | 65,831 |
| Vistra Operations Co., LLC 144A company | | |
| guaranty sr. notes 3.55%, 7/15/24 | | 67,000 | 72,557 |
| WEC Energy Group, Inc. jr. unsec. sub. FRN | | |
| Ser. A, (BBA LIBOR USD 3 Month + 2.11%), | | |
| 2.334%, 5/15/67 | | 300,000 | 255,000 |
| | | | 2,220,545 |
| | |
| Total corporate bonds and notes (cost $28,938,614) | $32,050,519 |
| | |
| MORTGAGE-BACKED SECURITIES (0.5%)* Principal amount | Value |
| | | |
| Citigroup Commercial Mortgage Trust | | |
| Ser. 14-GC21, Class C, 4.78%, 5/10/47 W | $124,000 | $119,544 |
| Ser. 14-GC21, Class AS, 4.026%, 5/10/47 | 93,000 | 101,112 |
| COMM Mortgage Trust | | |
| Ser. 13-CR13, Class AM, 4.449%, 11/10/46 W | 100,000 | 108,768 |
| FRB Ser. 14-UBS6, Class C, 4.446%, 12/10/47 W | 20,000 | 19,498 |
| Federal National Mortgage Association Connecticut | | |
| Avenue Securities FRB Ser. 17-C01, Class 1EB1, | | |
| (1 Month US LIBOR + 1.25%), 1.398%, 7/25/29 | 30,000 | 30,547 |
| FIRSTPLUS Home Loan Owner Trust Ser. 97-3, | | |
| Class B1, 7.79%, 11/10/23 (In default) † | 14,822 | 1 |
| GS Mortgage Securities Trust FRB Ser. 14-GC22, | | |
| Class C, 4.692%, 6/10/47 W | 159,000 | 155,764 |
| LSTAR Commercial Mortgage Trust 144A FRB | | |
| Ser. 15-3, Class AS, 3.185%, 4/20/48 W | 155,711 | 153,862 |
| Morgan Stanley Capital I Trust 144A FRB | | |
| Ser. 12-C4, Class D, 5.419%, 3/15/45 W | 217,000 | 138,922 |
| TIAA Real Estate CDO, Ltd. 144A Ser. 03-1A, | | |
| Class E, 8.00%, 12/28/38 (In default) † | 220,229 | 2 |
| Wells Fargo Commercial Mortgage Trust | | |
| Ser. 17-C39, Class A5, 3.418%, 9/15/50 | 85,000 | 96,378 |
| WF-RBS Commercial Mortgage Trust Ser. 13-UBS1, | | |
| Class AS, 4.306%, 3/15/46 W | 101,000 | 107,904 |
| WF-RBS Commercial Mortgage Trust 144A FRB | | |
| Ser. 11-C3, Class D, 5.642%, 3/15/44 W | 82,000 | 49,967 |
| Total mortgage-backed securities (cost $1,310,826) | $1,082,269 |
| | |
| CONVERTIBLE PREFERRED STOCKS (0.1%)* | Shares | Value |
| | | |
| KKR & Co., Inc. $3.00 cv. pfd. | 4,126 | $238,689 |
| Total convertible preferred stocks (cost $206,300) | | $238,689 |
| | |
| MUNICIPAL BONDS AND NOTES (0.1%)* | Principal amount | Value |
| | | |
| CA State G.O. Bonds, (Build America Bonds), | | |
| 7.50%, 4/1/34 | $30,000 | $50,048 |
| North TX, Tollway Auth. Rev. Bonds, (Build | | |
| America Bonds), 6.718%, 1/1/49 | 55,000 | 95,519 |
| OH State U. Rev. Bonds, (Build America Bonds), | |
| 4.91%, 6/1/40 | 40,000 | 55,437 |
| Total municipal bonds and notes (cost $125,161) | $201,004 |
| | |
| SHORT-TERM INVESTMENTS (4.5%)* | Shares | Value |
| | | |
| Putnam Cash Collateral Pool, LLC 0.14% d | 1,105,040 | $1,105,040 |
| Putnam Short Term Investment Fund | | |
| Class P 0.17% L | 9,054,597 | 9,054,597 |
| Total short-term investments (cost $10,159,637) | | $10,159,637 |
| | | |
| Total investments (cost $190,054,102) | | $228,137,674 |
Key to holding’s abbreviations
| |
| ADR | American Depository Receipts: represents ownership of foreign |
| securities on deposit with a custodian bank |
| FRB | Floating Rate Bonds: the rate shown is the current interest rate at |
| the close of the reporting period. Rates may be subject to a cap |
| or floor. For certain securities, the rate may represent a fixed rate |
| currently in place at the close of the reporting period. |
| FRN | Floating Rate Notes: the rate shown is the current interest rate or |
| yield at the close of the reporting period. Rates may be subject to |
| a cap or floor. For certain securities, the rate may represent a fixed |
| rate currently in place at the close of the reporting period. |
| GMTN | Global Medium Term Notes |
| G.O. Bonds | General Obligation Bonds |
| MTN | Medium Term Notes |
| TBA | To Be Announced Commitments |
Notes to the fund’s portfolio
Unless noted otherwise, the notes to the fund’s portfolio are for the close of the fund’s reporting period, which ran from January 1, 2020 through December 31, 2020 (the reporting period). Within the following notes to the portfolio, references to “Putnam Management” represent Putnam Investment Management, LLC, the fund’s manager, an indirect wholly-owned subsidiary of Putnam Investments, LLC and references to “ASC 820” represent Accounting Standards Codification 820 Fair Value Measurements and Disclosures.
* Percentages indicated are based on net assets of $224,849,659.
† This security is non-income-producing.
# This security, in part or in entirety, was pledged and segregated with the broker to cover margin requirements for futures contracts at the close of the reporting period. Collateral at period end totaled $108,730 and is included in Investments in securities on the Statement of assets and liabilities (Notes 1 and 8).
d Affiliated company. See Notes 1 and 5 to the financial statements regarding securities lending. The rate quoted in the security description is the annualized 7-day yield of the fund at the close of the reporting period.
L Affiliated company (Note 5). The rate quoted in the security description is the annualized 7-day yield of the fund at the close of the reporting period.
R Real Estate Investment Trust.
S Security on loan, in part or in entirety, at the close of the reporting period (Note 1).
W The rate shown represents the weighted average coupon associated with the underlying mortgage pools. Rates may be subject to a cap or floor.
At the close of the reporting period, the fund maintained liquid assets totaling $4,389,870 to cover certain derivative contracts and delayed delivery securities.
Debt obligations are considered secured unless otherwise indicated.
144A after the name of an issuer represents securities exempt from registration under Rule 144A of the Securities Act of 1933, as amended. These securities may be resold in transactions exempt from registration, normally to qualified institutional buyers.
See Note 1 to the financial statements regarding TBA commitments.
The dates shown on debt obligations are the original maturity dates.
| |
| 12 Putnam VT George Putnam Balanced Fund |
| | | | | | |
| FORWARD CURRENCY CONTRACTS at 12/31/20 (aggregate face value $12,900,461) | | | | Unrealized |
| | | Contract | Delivery | | Aggregate | appreciation/ |
| Counterparty | Currency | type* | date | Value | face value | (depreciation) |
| Bank of America N.A. | | | | | | |
| | British Pound | Sell | 3/17/21 | $61,839 | $60,914 | $(925) |
| Barclays Bank PLC | | | | | | |
| | British Pound | Sell | 3/17/21 | 1,829,032 | 1,801,384 | (27,648) |
| | Canadian Dollar | Sell | 1/20/21 | 433,924 | 416,550 | (17,374) |
| | Euro | Sell | 3/17/21 | 503,282 | 500,916 | (2,366) |
| Citibank, N.A. | | | | | | |
| | British Pound | Buy | 3/17/21 | 615,788 | 606,614 | 9,174 |
| | Canadian Dollar | Sell | 1/20/21 | 295,254 | 283,432 | (11,822) |
| | Euro | Sell | 3/17/21 | 503,526 | 501,154 | (2,372) |
| Goldman Sachs International | | | | | | |
| | British Pound | Sell | 3/17/21 | 1,795,650 | 1,768,751 | (26,899) |
| | Canadian Dollar | Buy | 1/20/21 | 349,936 | 335,961 | 13,975 |
| HSBC Bank USA, National Association | | | | | | |
| | British Pound | Buy | 3/17/21 | 373,906 | 368,300 | 5,606 |
| | Euro | Sell | 3/17/21 | 367,213 | 365,561 | (1,652) |
| JPMorgan Chase Bank N.A. | | | | | | |
| | British Pound | Buy | 3/17/21 | 683,236 | 673,020 | 10,216 |
| | Canadian Dollar | Sell | 1/20/21 | 403,755 | 387,604 | (16,151) |
| State Street Bank and Trust Co. | | | | | | |
| | British Pound | Buy | 3/17/21 | 453,804 | 447,030 | 6,774 |
| | Canadian Dollar | Sell | 1/20/21 | 1,216,057 | 1,194,863 | (21,194) |
| | Hong Kong Dollar | Sell | 2/17/21 | 326,991 | 326,905 | (86) |
| UBS AG | | | | | | |
| | British Pound | Buy | 3/17/21 | 567,904 | 559,497 | 8,407 |
| | Canadian Dollar | Buy | 1/20/21 | 355,200 | 341,054 | 14,146 |
| | Euro | Buy | 3/17/21 | 94,220 | 93,778 | 442 |
| WestPac Banking Corp. | | | | | | |
| | British Pound | Sell | 3/17/21 | 1,450,611 | 1,423,501 | (27,110) |
| | Canadian Dollar | Buy | 1/20/21 | 360,386 | 349,894 | 10,492 |
| | Euro | Buy | 3/17/21 | 94,220 | 93,778 | 442 |
| Unrealized appreciation | | | | | | 79,674 |
| Unrealized (depreciation) | | | | | | (155,599) |
| Total | | | | | | $(75,925) |
* The exchange currency for all contracts listed is the United States Dollar.
| | | | | |
| | | | | | Unrealized |
| | Number of | Notional | | Expiration | appreciation/ |
| FUTURES CONTRACTS OUTSTANDING at 12/31/20 | contracts | amount | Value | date | (depreciation) |
| S&P 500 Index E-Mini (Long) | 7 | $1,314,625 | $1,312,080 | Mar-21 | $28,248 |
| Unrealized appreciation | | | | | 28,248 |
| Unrealized (depreciation) | | | | | — |
| Total | | | | | $28,248 |
| | | | | |
| TBA SALE COMMITMENTS OUTSTANDING at 12/31/20 | | | Principal | Settlement | |
| (proceeds receivable $1,070,156) | | | amount | date | Value |
| Government National Mortgage Association, 4.50%, 1/1/51 | | | $1,000,000 | 1/21/21 | $1,073,125 |
| Total | | | | | $1,073,125 |
| |
| Putnam VT George Putnam Balanced Fund 13 |
ASC 820 establishes a three-level hierarchy for disclosure of fair value measurements. The valuation hierarchy is based upon the transparency of inputs to the valuation of the fund’s investments. The three levels are defined as follows:
Level 1: Valuations based on quoted prices for identical securities in active markets.
Level 2: Valuations based on quoted prices in markets that are not active or for which all significant inputs are observable, either directly or indirectly.
Level 3: Valuations based on inputs that are unobservable and significant to the fair value measurement.
The following is a summary of the inputs used to value the fund’s net assets as of the close of the reporting period:
| | | |
| | | Valuation inputs | |
| Investments in securities: | Level 1 | Level 2 | Level 3 |
| Common stocks*: | | | |
| Basic materials | $3,292,594 | $563,726 | $— |
| Capital goods | 7,727,732 | — | — |
| Communication services | 3,734,066 | — | — |
| Conglomerates | 1,285,729 | — | — |
| Consumer cyclicals | 26,965,451 | — | — |
| Consumer staples | 8,438,307 | — | — |
| Energy | 1,363,344 | 1,019,923 | — |
| Financials | 14,500,166 | 2,758,506 | — |
| Health care | 17,645,412 | — | — |
| Technology | 40,776,598 | — | — |
| Transportation | 3,226,062 | — | — |
| Utilities and power | 4,767,661 | — | — |
| Total common stocks | 133,723,122 | 4,342,155 | — |
| Convertible preferred stocks | — | 238,689 | — |
| Corporate bonds and notes | — | 32,050,519 | — |
| Mortgage-backed securities | — | 1,082,269 | — |
| Municipal bonds and notes | — | 201,004 | — |
| U.S. government and agency mortgage obligations | — | 15,364,904 | — |
| U.S. treasury obligations | — | 30,975,375 | — |
| Short-term investments | 9,054,597 | 1,105,040 | — |
| Totals by level | $142,777,719 | $85,359,955 | $— |
| |
| | | Valuation inputs | |
| Other financial instruments: | Level 1 | Level 2 | Level 3 |
| Forward currency contracts | $— | $(75,925) | $— |
| Futures contracts | 28,248 | — | — |
| TBA sale commitments | — | (1,073,125) | — |
| Totals by level | $28,248 | $(1,149,050) | $— |
* Common stock classifications are presented at the sector level, which may differ from the fund’s portfolio presentation.
At the start and close of the reporting period, Level 3 investments in securities represented less than 1% of the fund’s net assets and were not considered a significant portion of the fund’s portfolio.
The accompanying notes are an integral part of these financial statements.
| |
| 14 Putnam VT George Putnam Balanced Fund |
Statement of assets and liabilities
12/31/20
| |
| Assets | |
| Investment in securities, at value, including $1,081,940 of securities on loan (Notes 1 and 8): | |
| Unaffiliated issuers (identified cost $179,894,465) | $217,978,037 |
| Affiliated issuers (identified cost $10,159,637) (Notes 1 and 5) | 10,159,637 |
| Foreign currency (cost $152) (Note 1) | 154 |
| Dividends, interest and other receivables | 598,055 |
| Receivable for shares of the fund sold | 923,038 |
| Receivable for investments sold | 238,849 |
| Receivable for sales of TBA securities (Note 1) | 1,072,656 |
| Receivable for variation margin on futures contracts (Note 1) | 8,562 |
| Unrealized appreciation on forward currency contracts (Note 1) | 79,674 |
| Total assets | 231,058,662 |
| |
| Liabilities | |
| Payable to custodian | 17 |
| Payable for investments purchased | 237,385 |
| Payable for purchases of TBA securities (Note 1) | 3,223,476 |
| Payable for shares of the fund repurchased | 40,140 |
| Payable for compensation of Manager (Note 2) | 96,152 |
| Payable for custodian fees (Note 2) | 39,014 |
| Payable for investor servicing fees (Note 2) | 25,440 |
| Payable for Trustee compensation and expenses (Note 2) | 88,680 |
| Payable for administrative services (Note 2) | 2,494 |
| Payable for distribution fees (Note 2) | 32,166 |
| Unrealized depreciation on forward currency contracts (Note 1) | 155,599 |
| TBA sale commitments, at value (proceeds receivable $1,070,156) (Note 1) | 1,073,125 |
| Collateral on securities loaned, at value (Note 1) | 1,105,040 |
| Other accrued expenses | 90,275 |
| Total liabilities | 6,209,003 |
| | |
| Net assets | $224,849,659 |
| |
| Represented by | |
| Paid-in capital (Unlimited shares authorized) (Notes 1 and 4) | $171,784,704 |
| Total distributable earnings (Note 1) | 53,064,955 |
| Total — Representing net assets applicable to capital shares outstanding | $224,849,659 |
| | |
| Computation of net asset value Class IA | |
| Net assets | $69,648,107 |
| Number of shares outstanding | 4,929,472 |
| Net asset value, offering price and redemption price per share (net assets divided by number of shares outstanding) | $14.13 |
| | |
| Computation of net asset value Class IB | |
| Net assets | $155,201,552 |
| Number of shares outstanding | 11,042,598 |
| Net asset value, offering price and redemption price per share (net assets divided by number of shares outstanding) | $14.05 |
The accompanying notes are an integral part of these financial statements.
| |
| Putnam VT George Putnam Balanced Fund 15 |
Statement of operations
Year ended 12/31/20
| |
| Investment income | |
| Dividends (net of foreign tax of $13,148) | $1,858,496 |
| Interest (including interest income of $52,790 from investments in affiliated issuers) (Note 5) | 1,822,629 |
| Securities lending (net of expenses) (Notes 1 and 5) | 4,524 |
| Total investment income | 3,685,649 |
| |
| Expenses | |
| Compensation of Manager (Note 2) | 1,021,425 |
| Investor servicing fees (Note 2) | 138,127 |
| Custodian fees (Note 2) | 46,791 |
| Trustee compensation and expenses (Note 2) | 9,058 |
| Distribution fees (Note 2) | 329,899 |
| Administrative services (Note 2) | 5,831 |
| Other | 121,171 |
| Total expenses | 1,672,302 |
| | |
| Expense reduction (Note 2) | (181) |
| Net expenses | 1,672,121 |
| | |
| Net investment income | 2,013,528 |
| | |
| Realized and unrealized gain (loss) | |
| Net realized gain (loss) on: | |
| Securities from unaffiliated issuers (Notes 1 and 3) | 13,112,211 |
| Foreign currency transactions (Note 1) | (7,112) |
| Forward currency contracts (Note 1) | 16,065 |
| Futures contracts (Note 1) | 382,126 |
| Total net realized gain | 13,503,290 |
| Change in net unrealized appreciation (depreciation) on: | |
| Securities from unaffiliated issuers and TBA sale commitments | 14,665,239 |
| Assets and liabilities in foreign currencies | 569 |
| Forward currency contracts | 65,314 |
| Futures contracts | 27,936 |
| Total change in net unrealized appreciation | 14,759,058 |
| | |
| Net gain on investments | 28,262,348 |
| | |
| Net increase in net assets resulting from operations | $30,275,876 |
The accompanying notes are an integral part of these financial statements.
| |
| 16 Putnam VT George Putnam Balanced Fund |
Statement of changes in net assets
| | |
| | Year ended | Year ended |
| | 12/31/20 | 12/31/19 |
| Increase in net assets | | |
| Operations: | | |
| Net investment income | $2,013,528 | $2,414,196 |
| Net realized gain on investments and foreign currency transactions | 13,503,290 | 10,626,018 |
| Change in net unrealized appreciation of investments and assets and liabilities in foreign currencies | 14,759,058 | 21,713,763 |
| Net increase in net assets resulting from operations | 30,275,876 | 34,753,977 |
| Distributions to shareholders (Note 1): | | |
| From ordinary income | | |
| Net investment income | | |
| Class IA | (892,032) | (988,751) |
| Class IB | (1,442,300) | (1,332,556) |
| Net realized short-term gain on investments | | |
| Class IA | (1,494,889) | (465,007) |
| Class IB | (2,856,503) | (719,277) |
| From net realized long-term gain on investments | | |
| Class IA | (2,136,955) | (2,383,772) |
| Class IB | (4,083,395) | (3,687,241) |
| Increase from capital share transactions (Note 4) | 18,140,559 | 28,808,050 |
| Total increase in net assets | 35,510,361 | 53,985,423 |
| Net assets: | | |
| Beginning of year | 189,339,298 | 135,353,875 |
| End of year | $224,849,659 | $189,339,298 |
The accompanying notes are an integral part of these financial statements.
| |
| Putnam VT George Putnam Balanced Fund 17 |
Financial highlights (For a common share outstanding throughout the period)
| | | | | | | | | | | | | |
| INVESTMENT OPERATIONS: | | | | | LESS DISTRIBUTIONS: | | | RATIOS AND SUPPLEMENTAL DATA: |
| Period ended | Net asset value, beginning of period | Net investment income (loss)a | Net realized and unrealized gain (loss) on investments | Total from investment operations | From net investment income | From net realized gain on investments | Total distributions | Net asset value, end of period | Total return at net asset value (%)b,c | Net assets, end of period (in thousands) | Ratio of expenses to average net assets (%)b,d | Ratio of net investment income (loss) to average net assets (%) | Portfolio turnover (%)e |
| Class IA | | | | | | | | | | | | | |
| 12/31/20 | $13.26 | .15 | 1.64 | 1.79 | (.18) | (.74) | (.92) | $14.13 | 15.61 | $69,648 | .68 | 1.20 | 113 |
| 12/31/19 | 11.38 | .20 | 2.46 | 2.66 | (.20) | (.58) | (.78) | 13.26 | 24.35 | 66,059 | .69 | 1.62 | 128 |
| 12/31/18 | 11.82 | .19 | (.52) | (.33) | (.11) | — | (.11) | 11.38 | (2.82) | 56,636 | .71 | 1.56 | 264 |
| 12/31/17 | 10.44 | .15 | 1.43 | 1.58 | (.20) | — | (.20) | 11.82 | 15.29 | 65,849 | .72 | 1.39 | 191 |
| 12/31/16 | 9.83 | .16 | .65 | .81 | (.20) | — | (.20) | 10.44 | 8.40 | 64,354 | .73f | 1.65f | 216 |
| Class IB | | | | | | | | | | | | | |
| 12/31/20 | $13.19 | .12 | 1.63 | 1.75 | (.15) | (.74) | (.89) | $14.05 | 15.32 | $155,202 | .93 | .93 | 113 |
| 12/31/19 | 11.33 | .17 | 2.45 | 2.62 | (.18) | (.58) | (.76) | 13.19 | 24.00 | 123,280 | .94 | 1.36 | 128 |
| 12/31/18 | 11.78 | .16 | (.53) | (.37) | (.08) | — | (.08) | 11.33 | (3.14) | 78,718 | .96 | 1.31 | 264 |
| 12/31/17 | 10.40 | .13 | 1.42 | 1.55 | (.17) | — | (.17) | 11.78 | 15.08 | 77,464 | .97 | 1.14 | 191 |
| 12/31/16 | 9.79 | .14 | .64 | .78 | (.17) | — | (.17) | 10.40 | 8.12 | 60,405 | .98f | 1.40f | 216 |
a Per share net investment income (loss) has been determined on the basis of the weighted average number of shares outstanding during the period.
b The charges and expenses at the insurance company separate account level are not reflected.
c Total return assumes dividend reinvestment.
d Includes amounts paid through expense offset arrangements and/or brokerage/service arrangements, if any (Note 2). Also excludes acquired fund fees and expenses, if any.
e Portfolio turnover includes TBA purchase and sale commitments.
f Reflects a voluntary waiver of certain fund expenses in effect during the period. As a result of such waiver, the expenses of each class reflect a reduction of less than .01% as a percentage of average net assets per share for each class (Note 2).
The accompanying notes are an integral part of these financial statements.
| |
| 18 Putnam VT George Putnam Balanced Fund |
Notes to financial statements 12/31/20
Within the following Notes to financial statements, references to “State Street” represent State Street Bank and Trust Company, references to “the SEC” represent the Securities and Exchange Commission, references to “Putnam Management” represent Putnam Investment Management, LLC, the fund’s manager, an indirect wholly-owned subsidiary of Putnam Investments, LLC and references to “OTC”, if any, represent over-the-counter. Unless otherwise noted, the “reporting period” represents the period from January 1, 2020 through December 31, 2020.
Putnam VT George Putnam Balanced Fund (the fund) is a diversified series of Putnam Variable Trust (the Trust), a Massachusetts business trust registered under the Investment Company Act of 1940, as amended, as an open-end management investment company. The goal of the fund is to provide a balanced investment composed of a well-diversified portfolio of stocks and bonds which produce both capital growth and current income. The fund invests mainly in a combination of bonds and common stocks (growth or value stocks or both) of large U.S. companies, with a greater focus on common stocks. For example, the fund may purchase stocks of companies with stock prices that reflect a value lower than that which Putnam Management places on the company. Putnam Management may also consider other factors that Putnam Management believes will cause the stock price to rise. The fund buys bonds of governments and private companies that are mostly investment-grade in quality with intermediate- to long-term maturities (three years or longer). Putnam Management may consider, among other factors, a company’s valuation, financial strength, growth potential, competitive position in its industry, projected future earnings, cash flows and dividends when deciding whether to buy or sell equity investments, and, among other factors, credit, interest rate and prepayment risks, as well as general market conditions, when deciding whether to buy or sell fixed-income investments. Putnam Management may also use derivatives, such as futures, options, warrants and swap contracts, for both hedging and non-hedging purposes.
The fund offers class IA and class IB shares of beneficial interest. Class IA shares are offered at net asset value and are not subject to a distribution fee. Class IB shares are offered at net asset value and pay an ongoing distribution fee, which is identified in Note 2.
In the normal course of business, the fund enters into contracts that may include agreements to indemnify another party under given circumstances. The fund’s maximum exposure under these arrangements is unknown as this would involve future claims that may be, but have not yet been, made against the fund. However, the fund’s management team expects the risk of material loss to be remote.
The fund has entered into contractual arrangements with an investment adviser, administrator, distributor, shareholder servicing agent and custodian, who each provide services to the fund. Unless expressly stated otherwise, shareholders are not parties to, or intended beneficiaries of these contractual arrangements, and these contractual arrangements are not intended to create any shareholder right to enforce them against the service providers or to seek any remedy under them against the service providers, either directly or on behalf of the fund.
Under the fund’s Amended and Restated Agreement and Declaration of Trust, any claims asserted against or on behalf of the Putnam Funds, including claims against Trustees and Officers, must be brought in state and federal courts located within the Commonwealth of Massachusetts.
Note 1 — Significant accounting policies
The following is a summary of significant accounting policies consistently followed by the fund in the preparation of its financial statements. The preparation of financial statements is in conformity with accounting principles generally accepted in the United States of America and requires management to make estimates and assumptions that affect the reported amounts of assets and liabilities in the financial statements and the reported amounts of increases and decreases in net assets from operations. Actual results could differ from those estimates. Subsequent events after the Statement of assets and liabilities date through the date that the financial statements were issued have been evaluated in the preparation of the financial statements.
Investment income, realized and unrealized gains and losses and expenses of the fund are borne pro-rata based on the relative net assets of each class to the total net assets of the fund, except that each class bears expenses unique to that class (including the distribution fees applicable to such classes). Each class votes as a class only with respect to its own distribution plan or other matters on which a class vote is required by law or determined by the Trustees. If the fund were liquidated, shares of each class would receive their pro-rata share of the net assets of the fund. In addition, the Trustees declare separate dividends on each class of shares.
Security valuation Portfolio securities and other investments are valued using policies and procedures adopted by the Board of Trustees. The Trustees have formed a Pricing Committee to oversee the implementation of these procedures and have delegated responsibility for valuing the fund’s assets in accordance with these procedures to Putnam Management. Putnam Management has established an internal Valuation Committee that is responsible for making fair value determinations, evaluating the effectiveness of the pricing policies of the fund and reporting to the Pricing Committee.
Investments for which market quotations are readily available are valued at the last reported sales price on their principal exchange, or official closing price for certain markets, and are classified as Level 1 securities under Accounting Standards Codification 820 Fair Value Measurements and Disclosures (ASC 820). If no sales are reported, as in the case of some securities that are traded OTC, a security is valued at its last reported bid price and is generally categorized as a Level 2 security.
Investments in open-end investment companies (excluding exchange-traded funds), if any, which can be classified as Level 1 or Level 2 securities, are valued based on their net asset value. The net asset value of such investment companies equals the total value of their assets less their liabilities and divided by the number of their outstanding shares.
Market quotations are not considered to be readily available for certain debt obligations (including short-term investments with remaining maturities of 60 days or less) and other investments; such investments are valued on the basis of valuations furnished by an independent pricing service approved by the Trustees or dealers selected by Putnam Management. Such services or dealers determine valuations for normal institutional-size trading units of such securities using methods based on market transactions for comparable securities and various relationships, generally recognized by institutional traders, between securities (which consider such factors as security prices, yields, maturities and ratings). These securities will generally be categorized as Level 2.
Many securities markets and exchanges outside the U.S. close prior to the scheduled close of the New York Stock Exchange and therefore the closing prices for securities in such markets or on such exchanges may not fully reflect events that occur after such close but before the scheduled close of the New York Stock Exchange. Accordingly, on certain days, the fund will fair value certain foreign equity securities taking into account multiple factors including movements in the U.S. securities markets, currency valuations and comparisons to the valuation of American Depository Receipts, exchange-traded funds and futures contracts. The foreign equity securities, which would generally be classified as Level 1 securities, will be transferred to Level 2 of the fair value hierarchy when they are valued at fair value. The number of days on which fair value prices will be used will depend on market activity and it is possible that fair value prices will be used by the fund to a significant extent. At the close of the reporting period, fair value pricing was used for certain foreign securities in the portfolio. Securities quoted in foreign currencies, if any, are translated into U.S. dollars at the current exchange rate.
To the extent a pricing service or dealer is unable to value a security or provides a valuation that Putnam Management does not believe accurately reflects the security’s fair value, the security will be valued at fair value by Putnam Management in accordance with policies and procedures approved by the Trustees. Certain investments, including certain restricted and illiquid securities and derivatives, are also valued at fair value following procedures approved by the Trustees. These valuations consider such factors as significant market or specific security events such as interest rate or credit quality changes, various relationships with other securities, discount rates, U.S. Treasury, U.S. swap and credit yields, index levels, convexity exposures, recovery rates, sales and other multiples and resale restrictions. These securities are classified as Level 2 or as Level 3 depending on the priority of the significant inputs.
To assess the continuing appropriateness of fair valuations, the Valuation Committee reviews and affirms the reasonableness of such valuations on a regular basis after considering all relevant information that is reasonably available. Such valuations and procedures are reviewed periodically by the Trustees. Certain securities may be valued on the basis of a price provided by a single source. The fair value of securities is generally determined as the amount that the fund could reasonably expect to realize from an orderly disposition of such securities over a reasonable period of time. By its nature, a fair value price is a good faith estimate of
| |
| Putnam VT George Putnam Balanced Fund 19 |
the value of a security in a current sale and does not reflect an actual market price, which may be different by a material amount.
Security transactions and related investment income Security transactions are recorded on the trade date (the date the order to buy or sell is executed). Gains or losses on securities sold are determined on the identified cost basis.
Interest income, net of any applicable withholding taxes, if any, and including amortization and accretion of premiums and discounts on debt securities, is recorded on the accrual basis. Dividend income, net of any applicable withholding taxes, is recognized on the ex-dividend date except that certain dividends from foreign securities, if any, are recognized as soon as the fund is informed of the ex-dividend date. Non-cash dividends, if any, are recorded at the fair value of the securities received. Dividends representing a return of capital or capital gains, if any, are reflected as a reduction of cost and/or as a realized gain.
Foreign currency translation The accounting records of the fund are maintained in U.S. dollars. The fair value of foreign securities, currency holdings, and other assets and liabilities is recorded in the books and records of the fund after translation to U.S. dollars based on the exchange rates on that day. The cost of each security is determined using historical exchange rates. Income and withholding taxes are translated at prevailing exchange rates when earned or incurred. The fund does not isolate that portion of realized or unrealized gains or losses resulting from changes in the foreign exchange rate on investments from fluctuations arising from changes in the market prices of the securities. Such gains and losses are included with the net realized and unrealized gain or loss on investments. Net realized gains and losses on foreign currency transactions represent net realized exchange gains or losses on disposition of foreign currencies, currency gains and losses realized between the trade and settlement dates on securities transactions and the difference between the amount of investment income and foreign withholding taxes recorded on the fund’s books and the U.S. dollar equivalent amounts actually received or paid. Net unrealized appreciation and depreciation of assets and liabilities in foreign currencies arise from changes in the value of assets and liabilities other than investments at the period end, resulting from changes in the exchange rate.
Futures contracts The fund uses futures contracts to equitize cash.
The potential risk to the fund is that the change in value of futures contracts may not correspond to the change in value of the hedged instruments. In addition, losses may arise from changes in the value of the underlying instruments, if there is an illiquid secondary market for the contracts, if interest or exchange rates move unexpectedly or if the counterparty to the contract is unable to perform. With futures, there is minimal counterparty credit risk to the fund since futures are exchange traded and the exchange’s clearinghouse, as counterparty to all exchange traded futures, guarantees the futures against default. Risks may exceed amounts recognized on the Statement of assets and liabilities. When the contract is closed, the fund records a realized gain or loss equal to the difference between the value of the contract at the time it was opened and the value at the time it was closed.
Futures contracts are valued at the quoted daily settlement prices established by the exchange on which they trade. The fund and the broker agree to exchange an amount of cash equal to the daily fluctuation in the value of the futures contract. Such receipts or payments are known as “variation margin.”
Futures contracts outstanding at period end, if any, are listed after the fund’s portfolio.
Forward currency contracts The fund buys and sells forward currency contracts, which are agreements between two parties to buy and sell currencies at a set price on a future date. These contracts are used to hedge foreign exchange risk.
The U.S. dollar value of forward currency contracts is determined using current forward currency exchange rates supplied by a quotation service. The fair value of the contract will fluctuate with changes in currency exchange rates. The contract is marked to market daily and the change in fair value is recorded as an unrealized gain or loss. The fund records a realized gain or loss equal to the difference between the value of the contract at the time it was opened and the value at the time it was closed when the contract matures or by delivery of the currency. The fund could be exposed to risk if the value of the currency changes unfavorably, if the counterparties to the contracts are unable to meet the terms of their contracts or if the fund is unable to enter into a closing position. Risks may exceed amounts recognized on the Statement of assets and liabilities.
Forward currency contracts outstanding at period end, if any, are listed after the fund’s portfolio.
TBA commitments The fund may enter into TBA (to be announced) commitments to purchase securities for a fixed unit price at a future date beyond customary settlement time. Although the unit price and par amount have been established, the actual securities have not been specified. However, it is anticipated that the amount of the commitments will not significantly differ from the principal amount. The fund holds, and maintains until settlement date, cash or high-grade debt obligations in an amount sufficient to meet the purchase price, or the fund may enter into offsetting contracts for the forward sale of other securities it owns. Income on the securities will not be earned until settlement date.
The fund may also enter into TBA sale commitments to hedge its portfolio positions, to sell mortgage-backed securities it owns under delayed delivery arrangements or to take a short position in mortgage-backed securities. Proceeds of TBA sale commitments are not received until the contractual settlement date. During the time a TBA sale commitment is outstanding, either equivalent deliverable securities or an offsetting TBA purchase commitment deliverable on or before the sale commitment date are held as “cover” for the transaction, or other liquid assets in an amount equal to the notional value of the TBA sale commitment are segregated. If the TBA sale commitment is closed through the acquisition of an offsetting TBA purchase commitment, the fund realizes a gain or loss. If the fund delivers securities under the commitment, the fund realizes a gain or a loss from the sale of the securities based upon the unit price established at the date the commitment was entered into.
TBA commitments, which are accounted for as purchase and sale transactions, may be considered securities themselves, and involve a risk of loss due to changes in the value of the security prior to the settlement date as well as the risk that the counterparty to the transaction will not perform its obligations. Counterparty risk is mitigated by having a master agreement between the fund and the counterparty.
Unsettled TBA commitments are valued at their fair value according to the procedures described under “Security valuation” above. The contract is marked to market daily and the change in fair value is recorded by the fund as an unrealized gain or loss. Based on market circumstances, Putnam Management will determine whether to take delivery of the underlying securities or to dispose of the TBA commitments prior to settlement.
TBA purchase commitments outstanding at period end, if any, are listed within the fund’s portfolio and TBA sale commitments outstanding at period end, if any, are listed after the fund’s portfolio.
Master agreements The fund is a party to ISDA (International Swaps and Derivatives Association, Inc.) Master Agreements that govern OTC derivative and foreign exchange contracts and Master Securities Forward Transaction Agreements that govern transactions involving mortgage-backed and other asset-backed securities that may result in delayed delivery (Master Agreements) with certain counterparties entered into from time to time. The Master Agreements may contain provisions regarding, among other things, the parties’ general obligations, representations, agreements, collateral requirements, events of default and early termination. With respect to certain counterparties, in accordance with the terms of the Master Agreements, collateral pledged to the fund is held in a segregated account by the fund’s custodian and, with respect to those amounts which can be sold or repledged, are presented in the fund’s portfolio.
Collateral pledged by the fund is segregated by the fund’s custodian and identified in the fund’s portfolio. Collateral can be in the form of cash or debt securities issued by the U.S. Government or related agencies or other securities as agreed to by the fund and the applicable counterparty. Collateral requirements are determined based on the fund’s net position with each counterparty.
With respect to ISDA Master Agreements, termination events applicable to the fund may occur upon a decline in the fund’s net assets below a specified threshold over a certain period of time. Termination events applicable to counterparties may occur upon a decline in the counterparty’s long-term or short-term credit ratings below a specified level. In each case, upon occurrence, the other party may elect to terminate early and cause settlement of all derivative and foreign exchange contracts outstanding, including the payment of any losses and costs resulting from such early termination, as reasonably determined by the terminating party. Any decision by one or more of the fund’s counterparties to elect early termination could impact the fund’s future derivative activity.
At the close of the reporting period, the fund had a net liability position of $102,874 on open derivative contracts subject to the Master Agreements. There was no collateral pledged by the fund at period end for these agreements.
Securities lending The fund may lend securities, through its agent, to qualified borrowers in order to earn additional income. The loans are collateralized by cash in an amount at least equal to the fair value of the securities loaned. The fair value of securities loaned is determined daily and any additional required collateral is allocated to the fund on the next business day. The remaining maturities of the securities lending transactions are considered overnight and continuous. The risk
| |
| 20 Putnam VT George Putnam Balanced Fund |
of borrower default will be borne by the fund’s agent; the fund will bear the risk of loss with respect to the investment of the cash collateral. Income from securities lending, net of expenses, is included in investment income on the Statement of operations. Cash collateral is invested in Putnam Cash Collateral Pool, LLC, a limited liability company managed by an affiliate of Putnam Management. Investments in Putnam Cash Collateral Pool, LLC are valued at its closing net asset value each business day. There are no management fees charged to Putnam Cash Collateral Pool, LLC. At the close of the reporting period, the fund received cash collateral of $1,105,040 and the value of securities loaned amounted to $1,081,940.
Interfund lending The fund, along with other Putnam funds, may participate in an interfund lending program pursuant to an exemptive order issued by the SEC. This program allows the fund to borrow from or lend to other Putnam funds that permit such transactions. Interfund lending transactions are subject to each fund’s investment policies and borrowing and lending limits. Interest earned or paid on the interfund lending transaction will be based on the average of certain current market rates. During the reporting period, the fund did not utilize the program.
Lines of credit The fund participates, along with other Putnam funds, in a $317.5 million unsecured committed line of credit and a $235.5 million unsecured uncommitted line of credit, both provided by State Street. Borrowings may be made for temporary or emergency purposes, including the funding of shareholder redemption requests and trade settlements. Interest is charged to the fund based on the fund’s borrowing at a rate equal to 1.25% plus the higher of (1) the Federal Funds rate and (2) the Overnight Bank Funding Rate (overnight LIBOR prior to October 16, 2020) for the committed line of credit and 1.30% plus the higher of (1) the Federal Funds rate and (2) the Overnight Bank Funding Rate (1.30% prior to October 16, 2020) for the uncommitted line of credit. A closing fee equal to 0.04% of the committed line of credit and 0.04% of the uncommitted line of credit has been paid by the participating funds. In addition, a commitment fee of 0.21% per annum on any unutilized portion of the committed line of credit is allocated to the participating funds based on their relative net assets and paid quarterly. During the reporting period, the fund had no borrowings against these arrangements.
Federal taxes It is the policy of the fund to distribute all of its taxable income within the prescribed time period and otherwise comply with the provisions of the Internal Revenue Code of 1986, as amended (the Code), applicable to regulated investment companies.
The fund is subject to the provisions of Accounting Standards Codification 740 Income Taxes (ASC 740). ASC 740 sets forth a minimum threshold for financial statement recognition of the benefit of a tax position taken or expected to be taken in a tax return. The fund did not have a liability to record for any unrecognized tax benefits in the accompanying financial statements. No provision has been made for federal taxes on income, capital gains or unrealized appreciation on securities held nor for excise tax on income and capital gains. Each of the fund’s federal tax returns for the prior three fiscal years remains subject to examination by the Internal Revenue Service.
The fund may also be subject to taxes imposed by governments of countries in which it invests. Such taxes are generally based on either income or gains earned or repatriated. The fund accrues and applies such taxes to net investment income, net realized gains and net unrealized gains as income and/or capital gains are earned. In some cases, the fund may be entitled to reclaim all or a portion of such taxes, and such reclaim amounts, if any, are reflected as an asset on the fund’s books. In many cases, however, the fund may not receive such amounts for an extended period of time, depending on the country of investment.
Distributions to shareholders Distributions to shareholders from net investment income are recorded by the fund on the ex-dividend date. Distributions from capital gains, if any, are recorded on the ex-dividend date and paid at least annually. The amount and character of income and gains to be distributed are determined in accordance with income tax regulations, which may differ from generally accepted accounting principles. These differences include temporary and/or permanent differences from losses on wash sale transactions, from interest only securities and from partnership income. Reclassifications are made to the fund’s capital accounts to reflect income and gains available for distribution (or available capital loss carryovers) under income tax regulations. At the close of the reporting period, the fund reclassified $107,567 to decrease undistributed net investment income, $87 to decrease paid-in capital and $107,654 to increase accumulated net realized gain.
Tax cost of investments includes adjustments to net unrealized appreciation (depreciation) which may not necessarily be final tax cost basis adjustments, but closely approximate the tax basis unrealized gains and losses that may be realized and distributed to shareholders. The tax basis components of distributable earnings and the federal tax cost as of the close of the reporting period were as follows:
| |
| Unrealized appreciation | $41,034,927 |
| Unrealized depreciation | (3,329,805) |
| Net unrealized appreciation | 37,705,122 |
| Undistributed ordinary income | 1,842,345 |
| Undistributed short-term gain | 4,565,605 |
| Undistributed long-term gain | 8,951,251 |
| Cost for federal income tax purposes | $189,311,750 |
Expenses of the Trust Expenses directly charged or attributable to any fund will be paid from the assets of that fund. Generally, expenses of the Trust will be allocated among and charged to the assets of each fund on a basis that the Trustees deem fair and equitable, which may be based on the relative assets of each fund or the nature of the services performed and relative applicability to each fund.
Beneficial interest At the close of the reporting period, insurance companies or their separate accounts were record owners of all but a de minimis number of the shares of the fund. Approximately 39.9% of the fund is owned by accounts of one insurance company.
Note 2 — Management fee, administrative services and other transactions
The fund pays Putnam Management a management fee (based on the fund’s average net assets and computed and paid monthly) at annual rates that may vary based on the average of the aggregate net assets of all open-end mutual funds sponsored by Putnam Management (excluding net assets of funds that are invested in, or that are invested in by, other Putnam funds to the extent necessary to avoid “double counting” of those assets). Such annual rates may vary as follows:
| |
| 0.680% | of the first $5 billion, |
| 0.630% | of the next $5 billion, |
| 0.580% | of the next $10 billion, |
| 0.530% | of the next $10 billion, |
| 0.480% | of the next $50 billion, |
| 0.460% | of the next $50 billion, |
| 0.450% | of the next $100 billion and |
| 0.445% | of any excess thereafter. |
For the reporting period, the management fee represented an effective rate (excluding the impact from any expense waivers in effect) of 0.518% of the fund’s average net assets.
Putnam Management has contractually agreed, through April 30, 2022, to waive fees and/or reimburse the fund’s expenses to the extent necessary to limit the cumulative expenses of the fund, exclusive of brokerage, interest, taxes, investment-related expenses, extraordinary expenses, acquired fund fees and expenses and payments under the fund’s investor servicing contract, investment management contract and distribution plan, on a fiscal year-to-date basis to an annual rate of 0.20% of the fund’s average net assets over such fiscal year-to-date period. During the reporting period, the fund’s expenses were not reduced as a result of this limit.
Putnam Investments Limited (PIL), an affiliate of Putnam Management, is authorized by the Trustees to manage a separate portion of the assets of the fund as determined by Putnam Management from time to time. PIL did not manage any portion of the assets of the fund during the reporting period. If Putnam Management were to engage the services of PIL, Putnam Management would pay a quarterly sub-management fee to PIL for its services at an annual rate of 0.40% of the average net assets of the portion of the fund managed by PIL.
The fund reimburses Putnam Management an allocated amount for the compensation and related expenses of certain officers of the fund and their staff who provide administrative services to the fund. The aggregate amount of all such reimbursements is determined annually by the Trustees.
Custodial functions for the fund’s assets are provided by State Street. Custody fees are based on the fund’s asset level, the number of its security holdings and transaction volumes.
Putnam Investor Services, Inc., an affiliate of Putnam Management, provides investor servicing agent functions to the fund. Putnam Investor Services, Inc. was paid a monthly fee for investor servicing at an annual rate of 0.07% of the fund’s average daily net assets. During the reporting period, the expenses for each class of shares related to investor servicing fees were as follows:
| |
| Class IA | $45,766 |
| Class IB | 92,361 |
| Total | $138,127 |
| |
| Putnam VT George Putnam Balanced Fund 21 |
The fund has entered into expense offset arrangements with Putnam Investor Services, Inc. and State Street whereby Putnam Investor Services, Inc.’s and State Street’s fees are reduced by credits allowed on cash balances. For the reporting period, the fund’s expenses were reduced by $181 under the expense offset arrangements.
Each Independent Trustee of the fund receives an annual Trustee fee, of which $144, as a quarterly retainer, has been allocated to the fund, and an additional fee for each Trustees meeting attended. Trustees also are reimbursed for expenses they incur relating to their services as Trustees.
The fund has adopted a Trustee Fee Deferral Plan (the Deferral Plan) which allows the Trustees to defer the receipt of all or a portion of Trustees fees payable on or after July 1, 1995. The deferred fees remain invested in certain Putnam funds until distribution in accordance with the Deferral Plan.
The fund has adopted an unfunded noncontributory defined benefit pension plan (the Pension Plan) covering all Trustees of the fund who have served as a Trustee for at least five years and were first elected prior to 2004. Benefits under the Pension Plan are equal to 50% of the Trustee’s average annual attendance and retainer fees for the three years ended December 31, 2005. The retirement benefit is payable during a Trustee’s lifetime, beginning the year following retirement, for the number of years of service through December 31, 2006. Pension expense for the fund is included in Trustee compensation and expenses in the Statement of operations. Accrued pension liability is included in Payable for Trustee compensation and expenses in the Statement of assets and liabilities. The Trustees have terminated the Pension Plan with respect to any Trustee first elected after 2003.
The fund has adopted a distribution plan (the Plan) with respect to its class IB shares pursuant to Rule 12b–1 under the Investment Company Act of 1940.
The purpose of the Plan is to compensate Putnam Retail Management Limited Partnership, an indirect wholly-owned subsidiary of Putnam Investments, LLC, for services provided and expenses incurred in distributing shares of the fund. The Plan provides for payment by the fund to Putnam Retail Management Limited Partnership at an annual rate of up to 0.35% of the average net assets attributable to the fund’s class IB shares. The Trustees have approved payment by the fund at an annual rate of 0.25% of the average net assets attributable to the fund’s class IB shares. The expenses related to distribution fees during the reporting period are included in Distribution fees in the Statement of operations.
Note 3 — Purchases and sales of securities
During the reporting period, the cost of purchases and the proceeds from sales, excluding short-term investments, were as follows:
| | |
| | Cost of | Proceeds |
| | purchases | from sales |
| Investments in securities, including | | |
| TBA commitments (Long-term) | $205,461,739 | $201,265,525 |
| U.S. government securities | | |
| (Long-term) | 15,743,387 | 14,835,293 |
| Total | $221,205,126 | $216,100,818 |
The fund may purchase or sell investments from or to other Putnam funds in the ordinary course of business, which can reduce the fund’s transaction costs, at prices determined in accordance with SEC requirements and policies approved by the Trustees. During the reporting period, purchases or sales of long-term securities from or to other Putnam funds, if any, did not represent more than 5% of the fund’s total cost of purchases and/or total proceeds from sales.
Note 4 — Capital shares
At the close of the reporting period, there were an unlimited number of shares of beneficial interest authorized. Subscriptions and redemptions are presented at the omnibus level. Transactions in capital shares were as follows:
| | | | | | | | |
| | | Class IA shares | | | Class IB shares | |
| | Year ended 12/31/20 | Year ended 12/31/19 | Year ended 12/31/20 | Year ended 12/31/19 |
| | Shares | Amount | Shares | Amount | Shares | Amount | Shares | Amount |
| Shares sold | 232,522 | $2,963,149 | 292,555 | $3,602,301 | 2,515,895 | $31,161,588 | 3,293,284 | $40,358,876 |
| Shares issued in connection with | | | | | | | | |
| reinvestment of distributions | 416,180 | 4,523,875 | 328,837 | 3,837,530 | 773,980 | 8,382,198 | 493,472 | 5,739,074 |
| | 648,702 | 7,487,024 | 621,392 | 7,439,831 | 3,289,875 | 39,543,786 | 3,786,756 | 46,097,950 |
| Shares repurchased | (702,744) | (9,067,791) | (615,111) | (7,574,811) | (1,592,393) | (19,822,460) | (1,388,536) | (17,154,920) |
| Net increase (decrease) | (54,042) | $(1,580,767) | 6,281 | $(134,980) | 1,697,482 | $19,721,326 | 2,398,220 | $28,943,030 |
Note 5 — Affiliated transactions
Transactions during the reporting period with any company which is under common ownership or control were as follows:
| | | | | |
| | | | | | Shares outstanding |
| | Fair value as of | | | | and fair value as of |
| Name of affiliate | 12/31/19 | Purchase cost | Sale proceeds | Investment income | 12/31/20 |
| Short-term investments | | | | | |
| Putnam Cash Collateral Pool, LLC* | $1,590,125 | $29,467,226 | $29,952,311 | $12,505 | $1,105,040 |
| Putnam Short Term Investment | | | | | |
| Fund** | 8,072,114 | 56,328,358 | 55,345,875 | 52,790 | 9,054,597 |
| Total Short-term investments | $9,662,239 | $85,795,584 | $85,298,186 | $65,295 | $10,159,637 |
*No management fees are charged to Putnam Cash Collateral Pool, LLC (Note 1). Investment income shown is included in securities lending income on the Statement of operations. There were no realized or unrealized gains or losses during the period.
**Management fees charged to Putnam Short Term Investment Fund have been waived by Putnam Management. There were no realized or unrealized gains or losses during the period.
Note 6 — Market, credit and other risks
In the normal course of business, the fund trades financial instruments and enters into financial transactions where risk of potential loss exists due to changes in the market (market risk) or failure of the contracting party to the transaction to perform (credit risk). The fund may be exposed to additional credit risk that an institution or other entity with which the fund has unsettled or open transactions will default. Investments in foreign securities involve certain risks, including those related to economic instability, unfavorable political developments, and currency fluctuations.
The fund may invest a significant portion of its assets in securitized debt instruments, including mortgage-backed and asset-backed investments. The yields and values of these investments are sensitive to changes in interest rates, the rate of principal payments on the underlying assets and the market’s perception of the issuers. The market for these investments may be volatile and limited, which may make them difficult to buy or sell.
| |
| 22 Putnam VT George Putnam Balanced Fund |
On July 27, 2017, the United Kingdom’s Financial Conduct Authority (“FCA”), which regulates LIBOR, announced a desire to phase out the use of LIBOR by the end of 2021. LIBOR has historically been a common benchmark interest rate index used to make adjustments to variable-rate loans. It is used throughout global banking and financial industries to determine interest rates for a variety of financial instruments and borrowing arrangements. The transition process might lead to increased volatility and illiquidity in markets that currently rely on LIBOR to determine interest rates. It could also lead to a reduction in the value of some LIBOR-based investments and reduce the effectiveness of new hedges placed against existing LIBOR-based investments. While some LIBOR-based instruments may contemplate a scenario where LIBOR is no longer available by providing for an alternative rate-setting methodology, not all may have such provisions and there may be significant uncertainty regarding the effectiveness of any such alternative methodologies. Since the usefulness of LIBOR as a benchmark could deteriorate during the transition period, these effects could occur prior to the end of 2021.
Beginning in January 2020, global financial markets have experienced, and may continue to experience, significant volatility resulting from the spread of a virus known as COVID–19. The outbreak of COVID–19 has resulted in travel and border restrictions, quarantines, supply chain disruptions, lower consumer demand, and general market uncertainty. The effects of COVID–19 have adversely affected, and may continue to adversely affect, the global economy, the economies of certain nations, and individual issuers, all of which may negatively impact the fund’s performance.
Note 7 — Summary of derivative activity
The volume of activity for the reporting period for any derivative type that was held during the period is listed below and was based on an average of the holdings at the end of each fiscal quarter:
| |
| Futures contracts (number of contracts) | 7 |
| Forward currency contracts (contract amount) | $11,600,000 |
The following is a summary of the fair value of derivative instruments as of the close of the reporting period:
Fair value of derivative instruments as of the close of the reporting period
| | | | |
| | Asset derivatives | Liability derivatives |
| Derivatives not accounted for as hedging | Statement of assets and | | Statement of assets and | |
| instruments under ASC 815 | liabilities location | Fair value | liabilities location | Fair value |
| Foreign exchange contracts | Receivables | $79,674 | Payables | $155,599 |
| Equity contracts | Receivables | 28,248* | Payables | — |
| Total | | $107,922 | | $155,599 |
*Includes cumulative appreciation/depreciation of futures contracts as reported in the fund’s portfolio. Only current day’s variation margin is reported within the Statement of assets and liabilities.
The following is a summary of realized and change in unrealized gains or losses of derivative instruments in the Statement of operations for the reporting period (Note 1):
Amount of realized gain or (loss) on derivatives recognized in net gain or (loss) on investments
| | | |
| Derivatives not accounted for as hedging | | | |
| instruments under ASC 815 | Futures | Forward currency contracts | Total |
| Foreign exchange contracts | $— | $16,065 | $16,065 |
| Equity contracts | 382,126 | — | 382,126 |
| Total | $382,126 | $16,065 | $398,191 |
Change in unrealized appreciation or (depreciation) on derivatives recognized in net gain or (loss) on investments
| | | |
| Derivatives not accounted for as hedging | | | |
| instruments under ASC 815 | Futures | Forward currency contracts | Total |
| Foreign exchange contracts | $ | $65,314 | $65,314 |
| Equity contracts | 27,936 | — | 27,936 |
| Total | $27,936 | $65,314 | $93,250 |
| |
| Putnam VT George Putnam Balanced Fund 23 |
Note 8 — Offsetting of financial and derivative assets and liabilities
The following table summarizes any derivatives, repurchase agreements and reverse repurchase agreements, at the end of the reporting period, that are subject to an enforceable master netting agreement or similar agreement. For securities lending transactions or borrowing transactions associated with securities sold short, if any, see Note 1. For financial reporting purposes, the fund does not offset financial assets and financial liabilities that are subject to the master netting agreements in the Statement of assets and liabilities.
| | | | | | | | | | | |
| | | | BofA | | Goldman | HSBC Bank | JPMorgan | State Street | | WestPac | |
| | Bank of | Barclays | Securities, | | Sachs | USA, National | Chase Bank | Bank and | | Banking | |
| | America N.A. | Bank PLC | Inc. | Citibank, N.A. | International | Association | N.A. | Trust Co. | UBS AG | Corp. | Total |
| Assets: | | | | | | | | | | | |
| Futures contracts§ | $— | $— | $8,562 | $— | $— | $— | $— | $— | $— | $— | $8,562 |
| Forward currency contracts# | — | — | — | 9,174 | 13,975 | 5,606 | 10,216 | 6,774 | 22,995 | 10,934 | 79,674 |
| Total Assets | $— | $— | $8,562 | $9,174 | $13,975 | $5,606 | $10,216 | $6,774 | $22,995 | $10,934 | $88,236 |
| Liabilities: | | | | | | | | | | | |
| Futures contracts§ | — | — | — | — | — | — | — | — | — | — | — |
| Forward currency contracts# | 925 | 47,388 | — | 14,194 | 26,899 | 1,652 | 16,151 | 21,280 | — | 27,110 | 155,599 |
| Total Liabilities | $925 | $47,388 | $— | $14,194 | $26,899 | $1,652 | $16,151 | $21,280 | $— | $27,110 | $155,599 |
| Total Financial and | | | | | | | | | | | |
| Derivative Net Assets | $(925) | $(47,388) | $8,562 | $(5,020) | $(12,924) | $3,954 | $(5,935) | $(14,506) | $22,995 | $(16,176) | $(67,363) |
| Total collateral | | | | | | | | | | | |
| received (pledged)†## | $— | $— | $— | $— | $— | $— | $— | $— | $— | $— | |
| Net amount | $(925) | $(47,388) | $8,562 | $(5,020) | $(12,924) | $3,954 | $(5,935) | $(14,506) | $22,995 | $(16,176) | |
| Controlled collateral received | | | | | | | | | | | |
| (including TBA commitments)** | $— | $— | $— | $— | $— | $— | $— | $— | $— | $— | $— |
| Uncontrolled collateral received | $— | $— | $— | $— | $— | $— | $— | $— | $— | $— | $— |
| Collateral (pledged) (including | | | | | | | | | | | |
| TBA commitments)** | $— | $— | $— | $— | $— | $— | $— | $— | $— | $— | $— |
** Included with Investments in securities on the Statement of assets and liabilities.
† Additional collateral may be required from certain brokers based on individual agreements.
# Covered by master netting agreement (Note 1).
## Any over-collateralization of total financial and derivative net assets is not shown. Collateral may include amounts related to unsettled agreements.
§ Includes current day’s variation margin only as reported on the Statement of assets and liabilities, which is not collateralized. Cumulative appreciation/(depreciation) for futures contracts and centrally cleared swap contracts is represented in the tables listed after the fund’s portfolio. Collateral pledged for initial margin on futures contracts, which is not included in the table above, amounted to $108,730.
Note 9 — New accounting pronouncements
In March 2020, the Financial Accounting Standards Board (FASB) issued Accounting Standards Update (ASU) ASU 2020–04, Reference Rate Reform (Topic 848) — Facilitation of the Effects of Reference Rate Reform on Financial Reporting. The amendments in ASU 2020–04 provide optional temporary financial reporting relief from the effect of certain types of contract modifications due to the planned discontinuation of LIBOR and other interbank-offered based reference rates as of the end of 2021. ASU 2020–04 is effective for certain reference rate-related contract modifications that occur during the period March 12, 2020 through December 31, 2022. Management is currently evaluating the impact, if any, of applying this provision.
Federal tax information (Unaudited)
Pursuant to §852 of the Internal Revenue Code, as amended, the fund hereby designates $9,932,395 as a capital gain dividend with respect to the taxable year ended December 31, 2020, or, if subsequently determined to be different, the net capital gain of such year.
The fund designated 22.66% of ordinary income distributions as qualifying for the dividends received deduction for corporations.
| |
| 24 Putnam VT George Putnam Balanced Fund |

| | |
| Putnam VT George Putnam Balanced Fund 25 |
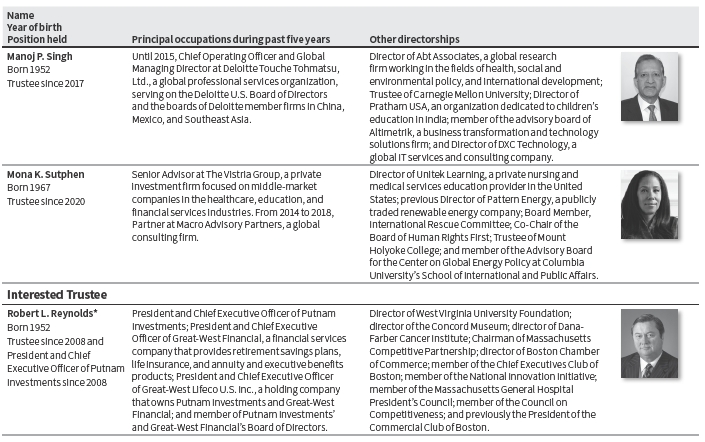
*Mr. Reynolds is an “interested person” (as defined in the Investment Company Act of 1940) of the fund and Putnam Investments. He is President and Chief Executive Officer of Putnam Investments, as well as the President of your fund and each of the other Putnam funds.
The address of each Trustee is 100 Federal Street, Boston, MA 02110.
As of December 31, 2020, there were 97 Putnam funds. All Trustees serve as Trustees of all Putnam funds.
Each Trustee serves for an indefinite term, until his or her resignation, retirement at age 75, removal, or death.
Officers
In addition to Robert L. Reynolds, the other officers of the fund are shown below:
| | |
| Robert T. Burns (Born 1961) | Michael J. Higgins (Born 1976) | Denere P. Poulack (Born 1968) |
| Vice President and Chief Legal Officer | Vice President, Treasurer, and Clerk | Assistant Vice President, Assistant Clerk, and |
| Since 2011 | Since 2010 | Assistant Treasurer |
| General Counsel, Putnam Investments, Putnam | | Since 2004 |
| Management, and Putnam Retail Management | Jonathan S. Horwitz (Born 1955) | |
| | Executive Vice President, Principal Executive | Janet C. Smith (Born 1965) |
| James F. Clark (Born 1974) | Officer, and Compliance Liaison | Vice President, Principal Financial |
| Vice President and Chief Compliance Officer | Since 2004 | Officer, Principal Accounting Officer, and |
| Since 2016 | | Assistant Treasurer |
| Chief Compliance Officer and Chief Risk Officer, | Richard T. Kircher (Born 1962) | Since 2007 |
| Putnam Investments and Chief Compliance | Vice President and BSA Compliance Officer | Head of Fund Administration Services, Putnam |
| Officer, Putnam Management | Since 2019 | Investments and Putnam Management |
| Assistant Director, Operational Compliance, | |
| Nancy E. Florek (Born 1957) | Putnam Investments and Putnam | Mark C. Trenchard (Born 1962) |
| Vice President, Director of Proxy Voting and | Retail Management | Vice President |
| Corporate Governance, Assistant Clerk, and | | Since 2002 |
| Assistant Treasurer | Susan G. Malloy (Born 1957) | Director of Operational Compliance, Putnam |
| Since 2000 | Vice President and Assistant Treasurer | Investments and Putnam Retail Management |
| | Since 2007 | |
| Head of Accounting and Middle Office Services, | |
| Putnam Investments and Putnam Management | |
The principal occupations of the officers for the past five years have been with the employers as shown above, although in some cases they have held different positions with such employers. The address of each officer is 100 Federal Street, Boston, MA 02110.
| |
| 26 Putnam VT George Putnam Balanced Fund |
|
| This page intentionally left blank. |
| |
| Putnam VT George Putnam Balanced Fund 27 |
|
| This page intentionally left blank. |
| |
| 28 Putnam VT George Putnam Balanced Fund |
Other important information
Proxy voting
Putnam is committed to managing our mutual funds in the best interests of our shareholders. The Putnam funds’ proxy voting guidelines and procedures, as well as information regarding how your fund voted proxies relating to portfolio securities during the 12-month period ended June 30, 2020, are available in the Individual Investors section of putnam.com and on the Securities and Exchange Commission’s (SEC) website at www.sec.gov. If you have questions about finding forms on the SEC’s website, you may call the SEC at 1-800-SEC-0330. You may also obtain the Putnam funds’ proxy voting guidelines and procedures at no charge by calling Putnam’s Shareholder Services at 1-800-225-1581.
Fund portfolio holdings
The fund will file a complete schedule of its portfolio holdings with the SEC for the first and third quarters of each fiscal year on Form N-PORT within 60 days of the end of such fiscal quarter. Shareholders may obtain the fund’s Form N-PORT from the SEC’s website at www.sec.gov.
Prior to its use of Form N-PORT, the fund filed its complete schedule of its portfolio holdings with the SEC on Form N-Q, which is available online at www.sec.gov.
Fund information
| | |
| Investment Manager | Investor Servicing Agent | Trustees |
| Putnam Investment Management, LLC | Putnam Investments | Kenneth R. Leibler, Chair |
| 100 Federal Street | Mailing address: | Liaquat Ahamed |
| Boston, MA 02110 | P.O. Box 219697 | Ravi Akhoury |
| | Kansas City, MO 64121-9697 | Barbara M. Baumann |
| Investment Sub-Advisor | 1-800-225-1581 | Katinka Domotorffy |
| Putnam Investments Limited | | Catharine Bond Hill |
| 16 St James’s Street | Custodian | Paul L. Joskow |
| London, England SW1A 1ER | State Street Bank and Trust Company | George Putnam, III |
| | | Robert L. Reynolds |
| Marketing Services | Legal Counsel | Manoj P. Singh |
| Putnam Retail Management | Ropes & Gray LLP | Mona K. Sutphen |
| 100 Federal Street | | |
| Boston, MA 02110 | Independent Registered | |
| Public Accounting Firm | |
| | PricewaterhouseCoopers LLP | |
The fund’s Statement of Additional Information contains additional information about the fund’s Trustees and is available without charge upon request by calling 1-800-225-1581.
| |
| Putnam VT George Putnam Balanced Fund 29 |
| |
| This report has been prepared for the shareholders | |
| of Putnam VT George Putnam Balanced Fund. | VTAN021 324347 2/21 |
| |
| (a) The fund's principal executive, financial and accounting officers are employees of Putnam Investment Management, LLC, the Fund's investment manager. As such they are subject to a comprehensive Code of Ethics adopted and administered by Putnam Investments which is designed to protect the interests of the firm and its clients. The Fund has adopted a Code of Ethics which incorporates the Code of Ethics of Putnam Investments with respect to all of its officers and Trustees who are employees of Putnam Investment Management, LLC. For this reason, the Fund has not adopted a separate code of ethics governing its principal executive, financial and accounting officers. |
| |
| Item 3. Audit Committee Financial Expert: |
| |
| The Funds' Audit, Compliance and Risk Committee is comprised solely of Trustees who are “independent” (as such term has been defined by the Securities and Exchange Commission (“SEC”) in regulations implementing Section 407 of the Sarbanes-Oxley Act (the “Regulations”)). The Trustees believe that each member of the Audit, Compliance and Risk Committee also possesses a combination of knowledge and experience with respect to financial accounting matters, as well as other attributes, that qualifies him or her for service on the Committee. In addition, the Trustees have determined that each of Dr. Hill, Dr. Joskow, and Mr. Singh qualifies as an “audit committee financial expert” (as such term has been defined by the Regulations) based on their review of his or her pertinent experience and education; in the case of Dr. Joskow, including his experience serving on the audit committees of several public companies and institutions and his education and experience as an economist who studies companies and industries, routinely using public company financial statements in his research. The SEC has stated, and the funds' amended and restated agreement and Declaration of Trust provides, that the designation or identification of a person as an audit committee financial expert pursuant to this Item 3 of Form N-CSR does not impose on such person any duties, obligations or liability that are greater than the duties, obligations and liability imposed on such person as a member of the Audit, Compliance and Risk Committee and the Board of Trustees in the absence of such designation or identification. |
| |
| Item 4. Principal Accountant Fees and Services: |
| |
| The following table presents fees billed in each of the last two fiscal years for services rendered to the fund by the fund's independent auditor: |
| | | | | |
| Fiscal year ended | Audit Fees | Audit-Related Fees | Tax Fees | All Other Fees |
|
|
| | | | | |
| December 31, 2020 | $65,610 | $ — | $8,078 | $ — |
| December 31, 2019 | $71,963 | $ — | $9,491 | $ — |
| |
| For the fiscal years ended December 31, 2020 and December 31, 2019, the fund's independent auditor billed aggregate non-audit fees in the amounts of $621,772 and $167,166 respectively, to the fund, Putnam Management and any entity controlling, controlled by or under common control with Putnam Management that provides ongoing services to the fund. |
| |
| Audit Fees represent fees billed for the fund's last two fiscal years relating to the audit and review of the financial statements included in annual reports and registration statements, and other services that are normally provided in connection with statutory and regulatory filings or engagements. |
| |
| Audit-Related Fees represent fees billed in the fund's last two fiscal years for services traditionally performed by the fund's auditor, including accounting consultation for proposed transactions or concerning financial accounting and reporting standards and other audit or attest services not required by statute or regulation. |
| |
| Tax Fees represent fees billed in the fund's last two fiscal years for tax compliance, tax planning and tax advice services. Tax planning and tax advice services include assistance with tax audits, employee benefit plans and requests for rulings or technical advice from taxing authorities. |
| |
| Pre-Approval Policies of the Audit, Compliance and Risk Committee. The Audit, Compliance and Risk Committee of the Putnam funds has determined that, as a matter of policy, all work performed for the funds by the funds' independent auditors will be pre-approved by the Committee itself and thus will generally not be subject to pre-approval procedures. |
| |
| The Audit, Compliance and Risk Committee also has adopted a policy to pre-approve the engagement by Putnam Management and certain of its affiliates of the funds' independent auditors, even in circumstances where pre-approval is not required by applicable law. Any such requests by Putnam Management or certain of its affiliates are typically submitted in writing to the Committee and explain, among other things, the nature of the proposed engagement, the estimated fees, and why this work should be performed by that particular audit firm as opposed to another one. In reviewing such requests, the Committee considers, among other things, whether the provision of such services by the audit firm are compatible with the independence of the audit firm. |
| |
| The following table presents fees billed by the fund's independent auditor for services required to be approved pursuant to paragraph (c)(7)(ii) of Rule 2–01 of Regulation S-X. |
| | | | | |
| Fiscal year ended | Audit-Related Fees | Tax Fees | All Other Fees | Total Non-Audit Fees |
|
|
| December 31, 2020 | $ — | $613,694 | $ — | $ — |
| December 31, 2019 | $ — | $157,575 | $ — | $ — |
| |
| Item 5. Audit Committee of Listed Registrants |
| |
| Item 6. Schedule of Investments: |
| |
| The registrant's schedule of investments in unaffiliated issuers is included in the report to shareholders in Item 1 above. |
| |
| Item 7. Disclosure of Proxy Voting Policies and Procedures For Closed-End Management Investment Companies: |
| |
| Item 8. Portfolio Managers of Closed-End Investment Companies |
| |
| Item 9. Purchases of Equity Securities by Closed-End Management Investment Companies and Affiliated Purchasers: |
| |
| Item 10. Submission of Matters to a Vote of Security Holders: |
| |
| Item 11. Controls and Procedures: |
| |
| (a) The registrant's principal executive officer and principal financial officer have concluded, based on their evaluation of the effectiveness of the design and operation of the registrant's disclosure controls and procedures as of a date within 180 days of the filing date of this report, that the design and operation of such procedures are generally effective to provide reasonable assurance that information required to be disclosed by the registrant in this report is recorded, processed, summarized and reported within the time periods specified in the Commission's rules and forms. |
| |
| (b) Changes in internal control over financial reporting: Not applicable |
| |
| Item 12. Disclosures of Securities Lending Activities for Closed-End Management Investment Companies: |
| |
| (a)(1) The Code of Ethics of The Putnam Funds, which incorporates the Code of Ethics of Putnam Investments, is filed herewith. |
| |
| Pursuant to the requirements of the Securities Exchange Act of 1934 and the Investment Company Act of 1940, the registrant has duly caused this report to be signed on its behalf by the undersigned, thereunto duly authorized. |
| |
| By (Signature and Title): |
| |
| /s/ Janet C. Smith
Janet C. Smith
Principal Accounting Officer
|
| |
| Pursuant to the requirements of the Securities Exchange Act of 1934 and the Investment Company Act of 1940, this report has been signed below by the following persons on behalf of the registrant and in the capacities and on the dates indicated. |
| |
| By (Signature and Title): |
| |
| /s/ Jonathan S. Horwitz
Jonathan S. Horwitz
Principal Executive Officer
|
| |
| By (Signature and Title): |
| |
| /s/ Janet C. Smith
Janet C. Smith
Principal Financial Officer
|