| | |
| UNITED STATES
SECURITIES AND EXCHANGE COMMISSION |
| | |
| CERTIFIED SHAREHOLDER REPORT OF REGISTERED
MANAGEMENT INVESTMENT COMPANIES
|
| | |
| Investment Company Act file number: | (811-05346) |
| | |
| Exact name of registrant as specified in charter: | Putnam Variable Trust |
| | |
| Address of principal executive offices: | 100 Federal Street, Boston, Massachusetts 02110 |
| | |
| Name and address of agent for service: | Robert T. Burns, Vice President
100 Federal Street
Boston, Massachusetts 02110 |
| | |
| Copy to: | Bryan Chegwidden, Esq.
Ropes & Gray LLP
1211 Avenue of the Americas
New York, New York 10036 |
| | |
| Registrant's telephone number, including area code: | (617) 292-1000 |
| | |
| Date of fiscal year end: | December 31, 2020 |
| | |
| Date of reporting period: | January 1, 2020 — December 31, 2020 |
| | |
|
Item 1. Report to Stockholders: | |
| | |
| The following is a copy of the report transmitted to stockholders pursuant to Rule 30e-1 under the Investment Company Act of 1940: | |
Message from the Trustees
February 12, 2021
Dear Shareholder:
The world welcomed 2021 with high hopes for improvement in the global economy and public health. Although COVID-19 infections have reached new levels, distribution of vaccines is underway, boosting optimism about a return to normal in the not-too-distant future. In the United States, new proposals to rebuild the economy are anticipated from the Biden administration. The stock and bond markets started the year in good shape, indicating that investors are willing to look beyond current challenges and see the potential for renewed economic growth.
Putnam continues to employ active strategies that seek superior investment performance for you and your fellow shareholders. Putnam’s portfolio managers and analysts take a research-intensive approach that includes risk management strategies designed to serve you through changing conditions.
As always, thank you for investing with Putnam.
Performance summary (as of 12/31/20)
Investment objective
Long-term return consistent with preservation of capital
Net asset value December 31, 2020
| |
| Class IA: $18.21 | Class IB: $18.47 |
Total return at net asset value
| | | | |
| | | | | Putnam |
| | | | | Balanced |
| (as of | Class IA | Class IB | Russell 3000 | Blended |
| 12/31/20) | shares* | shares† | Index | Benchmark |
| 1 year | 12.58% | 12.31% | 20.89% | 14.80% |
| 5 years | 52.08 | 50.16 | 104.95 | 66.04 |
| Annualized | 8.75 | 8.47 | 15.43 | 10.67 |
| 10 years | 129.41 | 123.65 | 264.07 | 143.99 |
| Annualized | 8.66 | 8.38 | 13.79 | 9.33 |
| Life | 1,097.45 | 1,029.09 | 3,006.38 | — |
| Annualized | 7.84 | 7.64 | 11.00 | — |
For a portion of the periods, the fund had expense limitations, without which returns would have been lower.
* Class inception date: February 1, 1988.
† Class inception date: April 30, 1998.
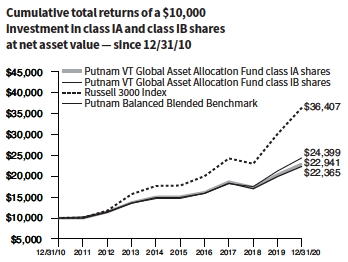
The Russell 3000 Index is an unmanaged index of the 3,000 largest U.S. companies.
Frank Russell Company is the source and owner of the trademarks, service marks, and copyrights related to the Russell Indexes. Russell® is a trademark of Frank Russell Company.
The Putnam Balanced Blended Benchmark is an unmanaged index administered by Putnam Investment Management, LLC, 50% of which is the Russell 3000 Index, 35% of which is the Bloomberg Barclays U.S. Aggregate Bond Index, 10% of which is the MSCI EAFE Index (ND), and 5% of which is the JPMorgan Developed High Yield Index.
Source: Bloomberg Index Services Limited.
BLOOMBERG® is a trademark and service mark of Bloomberg Finance L.P. and its affiliates (collectively “Bloomberg”). BARCLAYS® is a trademark and service mark of Barclays Bank Plc (collectively with its affiliates, “Barclays”), used under license. Bloomberg or Bloomberg’s licensors, including Barclays, own all proprietary rights in the Bloomberg Barclays Indices. Neither Bloomberg nor Barclays approves or endorses this material, or guarantees the accuracy of completeness of any information herein, or makes any warranty, express or limited, as to the results to be obtained therefrom and, to the maximum extent allowed by law, neither shall have any liability or responsibility for injury or damages arising in connection therewith.
Data represent past performance. Past performance does not guarantee future results. More recent returns may be less or more than those shown. Investment return and principal value will fluctuate, and you may have a gain or a loss when you sell your shares. Performance information does not reflect any deduction for taxes a shareholder may owe on fund distributions or on the redemption of fund shares. All total return figures are at net asset value and exclude contract charges and expenses, which are added to the variable annuity contracts to determine total return at unit value. Had these charges and expenses been reflected, performance would have been lower. Performance of class IB shares before their inception is derived from the historical performance of class IA shares, adjusted to reflect the higher operating expenses applicable to such shares. For more recent performance, contact your variable annuity provider who can provide you with performance that reflects the charges and expenses at your contract level.
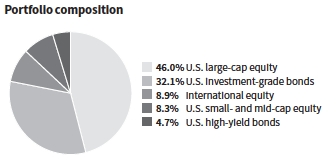
Allocations are shown as a percentage of the fund’s net assets. Cash and net other assets, if any, represent the market value weights of cash, derivatives, short-term securities, and other unclassified assets in the portfolio. Summary information may differ from the portfolio schedule included in the financial statements due to the inclusion of derivative securities, any interest accruals, the exclusion of as-of trades, if any, the use of different classifications of securities for presentation purposes, and rounding. Holdings and allocations may vary over time.
| |
| Putnam VT Global Asset Allocation Fund | 1 |
Report from your fund’s managers
How was the investment environment for the 12-month reporting period?
After a relatively calm start to 2020, investor sentiment sharply reversed course. As COVID-19 spread from a threat to a pandemic, global shutdowns fueled historic levels of volatility. From late February to early March, the S&P 500 Index, a broad measure of stocks, lost over 30% of its value. A collapse in oil prices further eroded investor confidence.
Worldwide fiscal and monetary aid from governments and central banks, respectively, helped reduce the severity of a global recession. In mid-March, the U.S. Federal Reserve [the Fed] cut interest rates to near zero and unleashed a torrent of bond-buying programs, and Congress approved a $2 trillion emergency relief package. The promise of more government support and positive news on potential COVID-19 vaccines contributed to stock market rallies from April through August.
In September, volatility returned. A rise in new COVID-19 cases in Europe and the United States cautioned investors. Uncertainty surrounding the U.S. presidential election and delays in finalizing the next stimulus package also led to periodic sell-offs. In the fourth quarter, stocks rallied, fueled by the approval of the world’s first COVID-19 vaccines, signs of economic recovery, and the U.S. election results. The S&P 500 Index returned 18.40% for the 12-month reporting period. Emerging-market stocks, as measured by the MSCI Emerging Markets Index [ND], rose 18.31% for the period. Non-U.S. stocks in developed markets, as measured by the MSCI EAFE Index [ND], returned 7.82% for the reporting period.
In fixed income, developed-market government-bond yields declined in late February. As the pandemic shook investor confidence, credit spreads widened. From March through period-end, the Fed purchased billions in corporate bonds and exchange-traded funds. Liquidity improved, and spreads tightened. Corporate credit markets advanced, mirroring the strength seen across equity markets. The Bloomberg Barclays U.S. Aggregate Bond Index, a measure of investment-grade corporate bonds, rose 7.51% for the 12-month reporting period. The Bloomberg Barclays U.S. Corporate High Yield Index, a measure of high-yield bonds, increased 7.11%. The yield on the 10-year U.S. Treasury note declined to 0.91% as of December 31, 2020, compared with 1.92% at the start of the period.
How did Putnam VT Global Asset Allocation Fund perform?
For the 12-month period, the fund’s class IA shares returned 12.58%. The custom Putnam Balanced Blended Benchmark rose 14.80% and the all-stock benchmark, the Russell 3000 Index, rallied 20.89%. The Putnam Balanced Blended Benchmark is composed of 50% the Russell 3000 Index, 35% the Bloomberg Barclays U.S. Aggregate Bond Index, 10% the MSCI EAFE Index [ND], and 5% the JPMorgan Developed High Yield Index.
What strategies affected performance?
Tactical asset allocation decisions had a positive impact on performance. In the first quarter, we shifted to a relative underweight position to equity risk at the start of 2020, which proved beneficial as COVID-19 fears sent equity markets in a tailspin in March 2020.
For our fixed income allocations, the fund had an underweight position relative to credit risk and a slightly overweight position to interest-rate risk in the first quarter. These allocation decisions aided results, especially during the height of market volatility. Some of these allocation gains were reduced in the second quarter as markets rebounded. By then, our positioning had moved closer to neutral, which limited losses and helped protect first-quarter gains. During the third quarter, positions remained relatively close to the custom benchmark. Our slight underweight position to equity risk resulted in a small loss, which was offset by our slight overweight position to credit risk. In the fourth quarter, we experienced allocation gains, driven by our modest overweight position to equity risk. Our modest underweight position to rate risk and a modest overweight position to credit risk were slightly additive in the fourth quarter.
Active implementation and security selection detracted over the reporting period, driven largely by our U.S. large-cap equity strategy. Our team analyzes stock market history to identify characteristics of stocks [factors] that have excess risk-adjusted returns. Despite a strong long-term relationship between these factors and positive stock performance, the strategies underperformed over the reporting period. We experienced slight selection weakness in opportunistic fixed income.
How did the fund use derivatives?
We used futures to help manage the fund’s exposure to market risk, gain exposure to interest rates, equitize cash, and hedge prepayment and interest-rate risks.
What is your near-term outlook for the markets?
While rising virus infections could lead to weaker-than-expected economic activity in the coming months, the vaccine progress to-date has reduced the chances of much slower growth in 2021, in our view. The financial markets are now pinning hope on widespread vaccinations by the middle of 2021.
As we enter 2021, we are mildly bullish on equities but tactically wary of overextended sentiment and additional virus-related setbacks. We believe credit markets, supported by the Fed’s promise to maintain quantitative easing, will continue to recover. With interest rates steadied at near zero and asset purchases becoming the main stimulus tool, the Fed indicated it would not lift rates before the labor market recovers. Rising COVID-19 cases across the globe may be a risk to growth over the next few months. We believe this will continue to create challenges for consumers, businesses, and policy makers.
The views expressed in this report are exclusively those of Putnam Management and are subject to change. They are not meant as investment advice. Please note that the holdings discussed in this report may not have been held by the fund for the entire period. Portfolio composition is subject to review in accordance with the fund’s investment strategy and may vary in the future.
Consider these risks before investing: Allocation of assets among asset classes may hurt performance. The value of investments in the fund’s portfolio may fall or fail to rise over extended periods of time for a variety of reasons, including general economic, political, or financial market conditions; investor sentiment and market perceptions; government actions; geopolitical events or changes; and factors
| |
| 2 | Putnam VT Global Asset Allocation Fund |
related to a specific issuer, asset class, geography, industry, or sector. These and other factors may lead to increased volatility and reduced liquidity in the fund’s portfolio holdings. International investing involves currency, economic, and political risks. Emerging-market securities carry illiquidity and volatility risks. Investments in small and/or midsize companies increase the risk of greater price fluctuations. Growth stocks may be more susceptible to earnings disappointments, and value stocks may fail to rebound. Funds that invest in government securities are not guaranteed. Mortgage-backed investments, unlike traditional debt investments, are also subject to prepayment risk, which means that they may increase in value less than other bonds when interest rates decline and decline in value more than other bonds when interest rates rise. Bond investments are subject to interest-rate risk (the risk of bond prices falling if interest rates rise) and credit risk (the risk of an issuer defaulting on interest or principal payments). Default risk is generally higher for non-qualified mortgages. Interest-rate risk is generally greater for longer-term bonds, and credit risk is generally greater for below-investment-grade bonds. Unlike bonds, funds that invest in bonds have fees and expenses. The use of derivatives may increase these risks by increasing investment exposure (which may be considered leverage) or, in the case of over-the-counter instruments, because of the potential inability to terminate or sell derivatives positions and the potential failure of the other party to the instrument to meet its obligations. Our investment techniques, analyses, and judgments may not produce the outcome we intend. The investments we select for the fund may not perform as well as other securities that we do not select for the fund. We, or the fund’s other service providers, may experience disruptions or operating errors that could have a negative effect on the fund. You can lose money by investing in the fund.

Your fund’s managers

Portfolio Manager James A. Fetch is Co-Head of Global Asset Allocation. He has been in the investment industry since he joined Putnam in 1994.
Brett S. Goldstein, CFA, Robert J. Schoen, and Jason R. Vaillancourt, CFA, also are Portfolio Managers of the fund.
Your fund’s managers also manage other accounts advised by Putnam Management or an affiliate, including retail mutual fund counterparts to the funds in Putnam Variable Trust.
ABOUT DERIVATIVES
Derivatives are an increasingly common type of investment instrument, the performance of which is derived from an underlying security, index, currency, or other area of the capital markets. Derivatives employed by the fund’s managers generally serve one of two main purposes: to implement a strategy that may be difficult or more expensive to invest in through traditional securities, or to hedge unwanted risk associated with a particular position.
For example, the fund’s managers might use currency forward contracts to capitalize on an anticipated change in exchange rates between two currencies. This approach would require a significantly smaller outlay of capital than purchasing traditional bonds denominated in the underlying currencies. In another example, the managers may identify a bond that they believe is undervalued relative to its risk of default but may seek to reduce the interest-rate risk of that bond by using interest-rate swaps, a derivative through which two parties “swap” payments based on the movement of certain rates. In other examples, the managers may use options and futures contracts to hedge against a variety of risks by establishing a combination of long and short exposures to specific equity markets or sectors.
Like any other investment, derivatives may not appreciate in value and may lose money. Derivatives may amplify traditional investment risks through the creation of leverage and may be less liquid than traditional securities. And because derivatives typically represent contractual agreements between two financial institutions, derivatives entail “counterparty risk,” which is the risk that the other party is unable or unwilling to pay. Putnam monitors the counterparty risks we assume. For example, Putnam often enters into collateral agreements that require the counterparties to post collateral on a regular basis to cover their obligations to the fund. Counterparty risk for exchange-traded futures and centrally cleared swaps is mitigated by the daily exchange of margin and other safeguards against default through their respective clearinghouses.
| |
| Putnam VT Global Asset Allocation Fund | 3 |
Understanding your fund’s expenses
As an investor in a variable annuity product that invests in a registered investment company, you pay ongoing expenses, such as management fees, distribution fees (12b-1 fees), and other expenses. Using the following information, you can estimate how these expenses affect your investment and compare them with the expenses of other funds. You may also pay one-time transaction expenses, which are not shown in this section and would result in higher total expenses. Charges and expenses at the insurance company separate account level are not reflected. For more information, see your fund’s prospectus or talk to your financial representative.
Review your fund’s expenses
The two left-hand columns of the Expenses per $1,000 table show the expenses you would have paid on a $1,000 investment in your fund from 7/1/20 to 12/31/20. They also show how much a $1,000 investment would be worth at the close of the period, assuming actual returns and expenses. To estimate the ongoing expenses you paid over the period, divide your account value by $1,000, then multiply the result by the number in the first line for the class of shares you own.
Compare your fund’s expenses with those of other funds
The two right-hand columns of the Expenses per $1,000 table show your fund’s expenses based on a $1,000 investment, assuming a hypothetical 5% annualized return. You can use this information to compare the ongoing expenses (but not transaction expenses or total costs) of investing in the fund with those of other funds. All shareholder reports of mutual funds and funds serving as variable annuity vehicles will provide this information to help you make this comparison. Please note that you cannot use this information to estimate your actual ending account balance and expenses paid during the period.
Expense ratios
| | |
| | Class IA | Class IB |
| Net expenses for the fiscal year ended | | |
| 12/31/19* | 0.87% | 1.12% |
| Total annual operating expenses for the fiscal | | |
| year ended 12/31/19 | 0.88% | 1.13% |
| Annualized expense ratio for the six-month | | |
| period ended 12/31/20† | 0.87% | 1.12% |
Fiscal year expense information in this table is taken from the most recent prospectus, is subject to change, and may differ from that shown for the annualized expense ratio and in the financial highlights of this report.
Expenses are shown as a percentage of average net assets.
*Reflects Putnam Management’s contractual obligation to limit certain fund expenses through 4/30/21.
†For the fund’s most recent fiscal half year; may differ from expense ratios based on one-year data in the financial highlights
Expenses per $1,000
| | | | | | | | |
| | | | | | | Expenses and value for a |
| | | Expenses and value for a | $1,000 investment, assuming |
| | | $1,000 investment, assuming | a hypothetical 5% annualized |
| | | actual returns for the | return for the 6 months |
| | | 6 months ended 12/31/20 | ended 12/31/20 |
| | | Class IA | | Class IB | | Class IA | | Class IB |
| Expenses paid | | | | | | | | |
| per $1,000*† | | $4.69 | | $6.03 | | $4.42 | | $5.69 |
| Ending value | | | | | | | | |
| (after | | | | | | | | |
| expenses) | | $1,143.10 | | $1,142.20 | | $1,020.76 | | $1,019.51 |
*Expenses for each share class are calculated using the fund’s annualized expense ratio for each class, which represents the ongoing expenses as a percentage of average net assets for the six months ended 12/31/20. The expense ratio may differ for each share class.
†Expenses based on actual returns are calculated by multiplying the expense ratio by the average account value for the period; then multiplying the result by the number of days in the period; and then dividing that result by the number of days in the year. Expenses based on a hypothetical 5% return are calculated by multiplying the expense ratio by the average account value for the six-month period; then multiplying the result by the number of days in the six-month period; and then dividing that result by the number of days in the year.
| |
| 4 | Putnam VT Global Asset Allocation Fund |
Report of Independent Registered Public Accounting Firm
To the Board of Trustees of Putnam Variable Trust and Shareholders of
Putnam VT Global Asset Allocation Fund:
Opinion on the Financial Statements
We have audited the accompanying statement of assets and liabilities, including the fund’s portfolio, of Putnam VT Global Asset Allocation Fund (one of the funds constituting Putnam Variable Trust, referred to hereafter as the “Fund”) as of December 31, 2020, the related statement of operations for the year ended December 31, 2020, the statement of changes in net assets for each of the two years in the period ended December 31, 2020, including the related notes, and the financial highlights for each of the five years in the period ended December 31, 2020 (collectively referred to as the “financial statements”). In our opinion, the financial statements present fairly, in all material respects, the financial position of the Fund as of December 31, 2020, the results of its operations for the year then ended, the changes in its net assets for each of the two years in the period ended December 31, 2020 and the financial highlights for each of the five years in the period ended December 31, 2020 in conformity with accounting principles generally accepted in the United States of America.
Basis for Opinion
These financial statements are the responsibility of the Fund’s management. Our responsibility is to express an opinion on the Fund’s financial statements based on our audits. We are a public accounting firm registered with the Public Company Accounting Oversight Board (United States) (“PCAOB”) and are required to be independent with respect to the Fund in accordance with the U.S. federal securities laws and the applicable rules and regulations of the Securities and Exchange Commission and the PCAOB.
We conducted our audits of these financial statements in accordance with the standards of the PCAOB. Those standards require that we plan and perform the audit to obtain reasonable assurance about whether the financial statements are free of material misstatement, whether due to error or fraud.
Our audits included performing procedures to assess the risks of material misstatement of the financial statements, whether due to error or fraud, and performing procedures that respond to those risks. Such procedures included examining, on a test basis, evidence regarding the amounts and disclosures in the financial statements. Our audits also included evaluating the accounting principles used and significant estimates made by management, as well as evaluating the overall presentation of the financial statements. Our procedures included confirmation of securities owned as of December 31, 2020 by correspondence with the custodian, transfer agent, agent banks and brokers; when replies were not received from brokers, we performed other auditing procedures. We believe that our audits provide a reasonable basis for our opinion.
PricewaterhouseCoopers LLP
Boston, Massachusetts
February 12, 2021
We have served as the auditor of one or more investment companies in the Putnam Investments family of mutual funds since at least 1957. We have not been able to determine the specific year we began serving as auditor.
| |
| Putnam VT Global Asset Allocation Fund | 5 |
The fund’s portfolio 12/31/20
| | |
| COMMON STOCKS (63.6%)* | Shares | Value |
| Basic materials (1.6%) | | |
| Anglo American PLC (United Kingdom) | 3,063 | $102,020 |
| AptarGroup, Inc. | 781 | 106,911 |
| Ashland Global Holdings, Inc. | 880 | 69,696 |
| Axalta Coating Systems, Ltd. † | 3,574 | 102,038 |
| BHP Billiton, Ltd. (Australia) | 1,167 | 38,020 |
| BHP Group PLC (United Kingdom) | 2,329 | 61,378 |
| Celanese Corp. | 587 | 76,275 |
| Chemours Co. (The) | 2,258 | 55,976 |
| Compagnie De Saint-Gobain (France) † | 2,094 | 96,016 |
| Covestro AG (Germany) | 1,644 | 101,406 |
| CRH PLC (Ireland) | 1,766 | 74,653 |
| DuPont de Nemours, Inc. S | 1,888 | 134,256 |
| Eastman Chemical Co. | 1,919 | 192,437 |
| Eiffage SA (France) † | 466 | 45,045 |
| Fortescue Metals Group, Ltd. (Australia) | 5,022 | 90,799 |
| ICL Group, Ltd. (Israel) | 5,034 | 25,693 |
| Koninklijke DSM NV (Netherlands) | 209 | 36,004 |
| LafargeHolcim, Ltd. (Switzerland) | 1,566 | 85,938 |
| NewMarket Corp. | 87 | 34,651 |
| Nitto Denko Corp. (Japan) | 500 | 44,897 |
| PPG Industries, Inc. | 669 | 96,483 |
| Reliance Steel & Aluminum Co. | 694 | 83,107 |
| Rio Tinto PLC (United Kingdom) | 1,995 | 149,274 |
| Sherwin-Williams Co. (The) | 56 | 41,155 |
| Shin-Etsu Chemical Co., Ltd. (Japan) | 500 | 87,532 |
| | | 2,031,660 |
| Capital goods (4.5%) | | |
| ACS Actividades de Construccion y Servicios SA (Spain) 731 | 24,270 |
| AGCO Corp. | 428 | 44,123 |
| Airbus SE (France) † | 131 | 14,390 |
| Allison Transmission Holdings, Inc. | 2,368 | 102,132 |
| Atlas Copco AB Class A (Sweden) | 932 | 47,663 |
| Avery Dennison Corp. | 1,361 | 211,105 |
| Berry Global Group, Inc. † | 2,270 | 127,551 |
| Crown Holdings, Inc. † | 1,239 | 124,148 |
| Cummins, Inc. | 2,154 | 489,173 |
| Daikin Industries, Ltd. (Japan) | 500 | 111,358 |
| Deere & Co. | 1,311 | 352,725 |
| Dover Corp. | 1,260 | 159,075 |
| Faurecia SA (France) † | 925 | 47,421 |
| Gentex Corp. | 2,608 | 88,489 |
| Hitachi, Ltd. (Japan) | 2,300 | 90,757 |
| Honeywell International, Inc. | 3,786 | 805,282 |
| Johnson Controls International PLC | 6,380 | 297,244 |
| Koito Manufacturing Co., Ltd. (Japan) | 700 | 47,609 |
| Legrand SA (France) | 1,223 | 109,157 |
| Lockheed Martin Corp. | 2,846 | 1,010,273 |
| Northrop Grumman Corp. | 627 | 191,059 |
| Obayashi Corp. (Japan) | 3,200 | 27,721 |
| Otis Worldwide Corp. | 4,116 | 278,036 |
| Quanta Services, Inc. | 3,132 | 225,567 |
| Republic Services, Inc. | 1,452 | 139,828 |
| Sandvik AB (Sweden) † | 5,163 | 126,206 |
| Silgan Holdings, Inc. | 1,402 | 51,986 |
| Stanley Electric Co., Ltd. (Japan) | 900 | 29,043 |
| | |
| COMMON STOCKS (63.6%)* cont. | Shares | Value |
| Capital goods cont. | | |
| Teledyne Technologies, Inc. † | 314 | $123,082 |
| Tervita Corp. (Canada) † | 16 | 36 |
| Waste Management, Inc. | 2,228 | 262,748 |
| | | 5,759,257 |
| Communication services (3.0%) | | |
| AT&T, Inc. | 9,640 | 277,246 |
| BT Group PLC (United Kingdom) | 12,879 | 23,312 |
| Charter Communications, Inc. Class A † | 396 | 261,974 |
| Comcast Corp. Class A | 13,140 | 688,536 |
| Crown Castle International Corp. R | 2,354 | 374,733 |
| Deutsche Telekom AG (Germany) | 7,601 | 138,906 |
| Equinix, Inc. R | 474 | 338,521 |
| Hikari Tsushin, Inc. (Japan) | 100 | 23,383 |
| KDDI Corp. (Japan) | 3,600 | 106,911 |
| Koninklijke KPN NV (Netherlands) | 21,364 | 64,771 |
| Nippon Telegraph & Telephone Corp. (Japan) | 2,500 | 64,103 |
| Verizon Communications, Inc. | 23,707 | 1,392,786 |
| | | 3,755,182 |
| Communications equipment (0.9%) | | |
| Cisco Systems, Inc. | 25,178 | 1,126,716 |
| | | 1,126,716 |
| Computers (5.5%) | | |
| Apple, Inc. | 37,422 | 4,965,525 |
| BigCommerce Holdings, Inc. Ser. 1 † S | 3,385 | 217,148 |
| Check Point Software Technologies, Ltd. (Israel) † | 100 | 13,291 |
| Fortinet, Inc. † | 3,121 | 463,562 |
| Fujitsu, Ltd. (Japan) | 300 | 43,429 |
| Logitech International SA (Switzerland) | 582 | 56,447 |
| ServiceNow, Inc. † | 1,382 | 760,694 |
| Synopsys, Inc. † | 1,598 | 414,266 |
| | | 6,934,362 |
| Conglomerates (0.2%) | | |
| AMETEK, Inc. | 1,815 | 219,506 |
| | | 219,506 |
| Consumer cyclicals (7.0%) | | |
| Adecco Group AG (Switzerland) | 961 | 64,437 |
| Amazon.com, Inc. † | 1,045 | 3,403,492 |
| Berkeley Group Holdings PLC (The) (United Kingdom) | 483 | 31,352 |
| Best Buy Co., Inc. | 4,508 | 449,853 |
| Booz Allen Hamilton Holding Corp. | 2,420 | 210,976 |
| Brambles, Ltd. (Australia) | 6,650 | 54,482 |
| Brunswick Corp. | 1,756 | 133,877 |
| Casey’s General Stores, Inc. | 563 | 100,563 |
| Cintas Corp. | 220 | 77,761 |
| CK Hutchison Holdings, Ltd. (Hong Kong) | 5,000 | 34,916 |
| Clear Channel Outdoor Holdings, Inc. † | 502 | 828 |
| Compagnie Generale des Etablissements Michelin | | |
| SCA (France) | 235 | 30,160 |
| Daito Trust Construction Co., Ltd. (Japan) | 300 | 28,059 |
| Daiwa House Industry Co., Ltd. (Japan) | 2,400 | 71,639 |
| Discovery, Inc. Class A † S | 2,993 | 90,059 |
| Ferrari NV (Italy) | 47 | 10,868 |
| Fiat Chrysler Automobiles NV (Italy) † | 6,923 | 123,797 |
| Ford Motor Co. | 30,892 | 271,541 |
| Galaxy Entertainment Group, Ltd. (Hong Kong) | 3,000 | 23,334 |
| Genting Bhd (Singapore) | 30,100 | 19,327 |
| Hermes International (France) | 124 | 133,344 |
| Hilton Worldwide Holdings, Inc. | 2,989 | 332,556 |
| iHeartMedia, Inc. Class A † | 214 | 2,778 |
| Industria de Diseno Textil SA (Inditex) (Spain) | 3,651 | 116,255 |
| |
| 6 | Putnam VT Global Asset Allocation Fund |
| | |
| COMMON STOCKS (63.6%)* cont. | Shares | Value |
| Consumer cyclicals cont. | | |
| Kering SA (France) | 98 | $71,246 |
| Knorr-Bremse AG (Germany) | 591 | 80,509 |
| Lennar Corp. Class A | 3,277 | 249,806 |
| Lowe’s Cos., Inc. | 2,875 | 461,466 |
| Moody’s Corp. | 364 | 105,647 |
| Nintendo Co., Ltd. (Japan) | 300 | 191,457 |
| Nitori Holdings Co., Ltd. (Japan) | 200 | 41,929 |
| Pandora A/S (Denmark) | 481 | 53,737 |
| Peugeot SA (France) † | 4,528 | 123,918 |
| Polaris, Inc. | 1,502 | 143,111 |
| Porsche Automobil Holding SE | | |
| (Preference) (Germany) | 819 | 56,453 |
| PulteGroup, Inc. | 1,257 | 54,202 |
| Ryohin Keikaku Co., Ltd. (Japan) | 1,000 | 20,429 |
| Scotts Miracle-Gro Co. (The) | 299 | 59,543 |
| Sony Corp. (Japan) | 1,600 | 160,870 |
| Spectrum Brands Holdings, Inc. | 741 | 58,524 |
| Target Corp. | 2,516 | 444,149 |
| Taylor Wimpey PLC (United Kingdom) † | 15,618 | 35,508 |
| Tempur Sealy International, Inc. † | 4,051 | 109,377 |
| TransUnion | 355 | 35,223 |
| Volkswagen AG (Preference) (Germany) | 275 | 51,235 |
| Volvo AB (Sweden) † | 5,161 | 121,450 |
| Walmart, Inc. | 441 | 63,570 |
| Wesfarmers, Ltd. (Australia) | 3,425 | 133,182 |
| Wolters Kluwer NV (Netherlands) | 598 | 50,473 |
| | | 8,793,268 |
| Consumer staples (5.4%) | | |
| Altria Group, Inc. | 10,626 | 435,666 |
| Associated British Foods PLC (United Kingdom) | 1,499 | 46,443 |
| Auto Trader Group PLC (United Kingdom) | 3,468 | 28,284 |
| British American Tobacco PLC (United Kingdom) | 1,543 | 57,392 |
| Campbell Soup Co. | 794 | 38,390 |
| Carlsberg A/S Class B (Denmark) | 633 | 101,481 |
| Coca-Cola Co. (The) | 14,949 | 819,803 |
| Coca-Cola European Partners PLC (United Kingdom) | 500 | 24,915 |
| Coca-Cola HBC AG (Switzerland) | 1,401 | 45,566 |
| Coles Group, Ltd. (Australia) | 2,450 | 34,280 |
| Constellation Brands, Inc. Class A | 530 | 116,097 |
| Costco Wholesale Corp. | 138 | 51,996 |
| Ferguson PLC (United Kingdom) | 1,026 | 124,773 |
| Hershey Co. (The) | 1,732 | 263,836 |
| Imperial Brands PLC (United Kingdom) | 524 | 11,010 |
| ITOCHU Corp. (Japan) | 4,600 | 132,486 |
| Kobe Bussan Co., Ltd. (Japan) | 300 | 9,260 |
| Koninklijke Ahold Delhaize NV (Netherlands) | 3,145 | 88,815 |
| L’Oreal SA (France) | 402 | 152,743 |
| McDonald’s Corp. | 3,018 | 647,602 |
| Mondelez International, Inc. Class A | 6,368 | 372,337 |
| Nestle SA (Switzerland) | 1,730 | 203,671 |
| NH Foods, Ltd. (Japan) | 700 | 30,812 |
| PepsiCo, Inc. | 5,340 | 791,922 |
| Procter & Gamble Co. (The) | 10,190 | 1,417,837 |
| Sundrug Co., Ltd. (Japan) | 800 | 31,926 |
| Sysco Corp. | 1,041 | 77,305 |
| Unilever PLC (United Kingdom) | 612 | 36,841 |
| WH Group, Ltd. (Hong Kong) | 78,500 | 65,823 |
| | |
| COMMON STOCKS (63.6%)* cont. | Shares | Value |
| Consumer staples cont. | | |
| Wilmar International, Ltd. (Singapore) | 13,400 | $47,184 |
| Woolworths Group, Ltd. (Australia) | 2,600 | 78,854 |
| Yum! Brands, Inc. | 3,422 | 371,492 |
| | | 6,756,842 |
| Electronics (2.8%) | | |
| Arrow Electronics, Inc. † | 756 | 73,559 |
| Brother Industries, Ltd. (Japan) | 1,500 | 30,966 |
| Garmin, Ltd. | 1,252 | 149,814 |
| Hoya Corp. (Japan) | 1,000 | 138,229 |
| NVIDIA Corp. | 2,345 | 1,224,559 |
| Otsuka Corp. (Japan) | 900 | 47,424 |
| Qualcomm, Inc. | 8,896 | 1,355,217 |
| Rockwell Automation, Inc. | 1,526 | 382,736 |
| SMC Corp. (Japan) | 100 | 61,072 |
| TDK Corp. (Japan) | 100 | 15,083 |
| Trimble Inc. † | 582 | 38,860 |
| | | 3,517,519 |
| Energy (1.2%) | | |
| Baker Hughes a GE Co. | 5,343 | 111,402 |
| Chevron Corp. | 3,853 | 325,386 |
| Equinor ASA (Norway) | 6,810 | 112,996 |
| Halliburton Co. | 26,215 | 495,464 |
| MWO Holdings, LLC (Units) F | 15 | 38 |
| Oasis Petroleum, Inc. † | 196 | 7,264 |
| Royal Dutch Shell PLC Class B (United Kingdom) | 10,808 | 186,204 |
| Santos, Ltd. (Australia) | 2,586 | 12,506 |
| Schlumberger, Ltd. | 12,227 | 266,915 |
| TOTAL SA (France) | 1,174 | 50,644 |
| | | 1,568,819 |
| Financials (9.2%) | | |
| 3i Group PLC (United Kingdom) | 4,351 | 69,514 |
| Aflac, Inc. | 7,694 | 342,152 |
| AGNC Investment Corp. R | 12,039 | 187,808 |
| Alliance Data Systems Corp. | 2,273 | 168,429 |
| Allianz SE (Germany) | 685 | 167,600 |
| Allstate Corp. (The) | 4,446 | 488,749 |
| Ally Financial, Inc. | 8,420 | 300,257 |
| American Financial Group, Inc. | 511 | 44,774 |
| Ameriprise Financial, Inc. | 1,825 | 354,652 |
| Apartment Income REIT Corp. † R | 1,330 | 51,085 |
| Apartment Investment and Management Co. Class A R | 1,330 | 7,022 |
| AvalonBay Communities, Inc. R | 736 | 118,076 |
| Aviva PLC (United Kingdom) | 21,137 | 94,803 |
| Banco Bilbao Vizcaya Argenta (Spain) | 21,294 | 104,385 |
| Bank Leumi Le-Israel BM (Israel) | 8,531 | 50,354 |
| BOC Hong Kong Holdings, Ltd. (Hong Kong) | 11,000 | 33,429 |
| Boston Properties, Inc. R | 779 | 73,639 |
| Capital One Financial Corp. | 442 | 43,692 |
| CBRE Group, Inc. Class A † | 3,360 | 210,739 |
| Citigroup, Inc. | 16,391 | 1,010,669 |
| CK Asset Holdings, Ltd. (Hong Kong) | 16,000 | 82,297 |
| Cousins Properties, Inc. R | 2,061 | 69,044 |
| Credit Agricole SA (France) † | 6,259 | 79,035 |
| DBS Group Holdings, Ltd. (Singapore) | 4,500 | 85,117 |
| Deutsche Boerse AG (Germany) | 405 | 68,757 |
| Direct Line Insurance Group PLC (United Kingdom) | 11,055 | 48,055 |
| Discover Financial Services | 3,206 | 290,239 |
| DNB ASA (Norway) † | 1,307 | 25,733 |
| |
| Putnam VT Global Asset Allocation Fund | 7 |
| | |
| COMMON STOCKS (63.6%)* cont. | Shares | Value |
| Financials cont. | | |
| Duke Realty Corp. R | 3,156 | $126,145 |
| Equitable Holdings, Inc. | 7,281 | 186,321 |
| Equity Commonwealth R | 1,552 | 42,339 |
| Equity Lifestyle Properties, Inc. R | 916 | 58,038 |
| Fidelity National Financial, Inc. | 1,706 | 66,688 |
| Gaming and Leisure Properties, Inc. R | 1,855 | 78,652 |
| Gjensidige Forsikring ASA (Norway) | 1,036 | 23,125 |
| Goldman Sachs Group, Inc. (The) | 1,111 | 292,982 |
| Goodman Group (Australia) R | 8,057 | 117,530 |
| Hargreaves Lansdown PLC (United Kingdom) | 857 | 17,891 |
| Henderson Land Development Co., Ltd. (Hong Kong) | 7,900 | 30,842 |
| Invitation Homes, Inc. R | 4,492 | 133,412 |
| Israel Discount Bank, Ltd. Class A (Israel) | 8,154 | 31,458 |
| Jones Lang LaSalle, Inc. † | 310 | 45,995 |
| JPMorgan Chase & Co. | 13,266 | 1,685,711 |
| Lamar Advertising Co. Class A R | 1,206 | 100,363 |
| Lincoln National Corp. | 4,496 | 226,194 |
| LPL Financial Holdings, Inc. | 656 | 68,368 |
| Magellan Financial Group, Ltd. (Australia) | 725 | 30,182 |
| MetLife, Inc. | 13,804 | 648,098 |
| MGIC Investment Corp. | 4,992 | 62,650 |
| Morgan Stanley | 8,097 | 554,887 |
| Nomura Holdings, Inc. (Japan) | 10,900 | 57,701 |
| OneMain Holdings, Inc. | 839 | 40,406 |
| Partners Group Holding AG (Switzerland) | 95 | 110,969 |
| Persimmon PLC (United Kingdom) | 783 | 29,659 |
| Popular, Inc. (Puerto Rico) | 982 | 55,306 |
| Principal Financial Group, Inc. | 3,154 | 156,470 |
| Reinsurance Group of America, Inc. | 513 | 59,457 |
| SEI Investments Co. | 1,116 | 64,137 |
| Simon Property Group, Inc. R | 7,856 | 669,960 |
| Singapore Exchange, Ltd. (Singapore) | 5,500 | 38,710 |
| Skandinaviska Enskilda Banken AB (Sweden) † | 8,392 | 86,148 |
| SLM Corp. | 8,958 | 110,990 |
| Sumitomo Mitsui Financial Group, Inc. (Japan) | 3,600 | 111,395 |
| Sumitomo Mitsui Trust Holdings, Inc. (Japan) | 1,500 | 46,511 |
| Sun Hung Kai Properties, Ltd. (Hong Kong) | 3,000 | 38,731 |
| Swedbank AB Class A (Sweden) † | 3,154 | 55,454 |
| Swiss Life Holding AG (Switzerland) | 51 | 23,741 |
| Synchrony Financial | 11,243 | 390,245 |
| Unum Group | 4,979 | 114,218 |
| Zurich Insurance Group AG (Switzerland) | 87 | 36,874 |
| | | 11,595,058 |
| Health care (7.8%) | | |
| 10x Genomics, Inc. Class A † | 582 | 82,411 |
| Abbott Laboratories | 5,708 | 624,969 |
| AbbVie, Inc. | 2,954 | 316,521 |
| ABIOMED, Inc. † | 751 | 243,474 |
| Advanz Pharma Corp., Ltd. (Canada) † | 52 | 229 |
| Alkermes PLC † | 3,024 | 60,329 |
| Amgen, Inc. | 824 | 189,454 |
| Astellas Pharma, Inc. (Japan) | 800 | 12,368 |
| AstraZeneca PLC (United Kingdom) | 469 | 46,857 |
| Bristol-Myers Squibb Co. | 5,121 | 317,656 |
| Cardinal Health, Inc. | 4,418 | 236,628 |
| Chugai Pharmaceutical Co., Ltd. (Japan) | 600 | 32,033 |
| Cigna Corp. | 158 | 32,892 |
| | |
| COMMON STOCKS (63.6%)* cont. | Shares | Value |
| Health care cont. | | |
| Edwards Lifesciences Corp. † | 6,463 | $589,619 |
| Eli Lilly and Co. | 3,307 | 558,354 |
| Fisher & Paykel Healthcare Corp., Ltd. | | |
| (New Zealand) | 841 | 19,971 |
| Galapagos NV (Belgium) † | 120 | 11,808 |
| GlaxoSmithKline PLC (United Kingdom) | 2,914 | 53,393 |
| Hikma Pharmaceuticals PLC (United Kingdom) | 1,471 | 50,671 |
| Hologic, Inc. † | 4,498 | 327,589 |
| Humana, Inc. S | 1,396 | 572,737 |
| Jazz Pharmaceuticals PLC † | 1,182 | 195,089 |
| Johnson & Johnson | 5,560 | 875,033 |
| Kobayashi Pharmaceutical Co., Ltd. (Japan) | 200 | 24,450 |
| Laboratory Corp. of America Holdings † | 964 | 196,222 |
| M3, Inc. (Japan) | 500 | 47,294 |
| Medtronic PLC | 8,055 | 943,563 |
| Merck & Co., Inc. | 7,901 | 646,302 |
| Moderna, Inc. † | 744 | 77,726 |
| Neurocrine Biosciences, Inc. † | 395 | 37,861 |
| Novartis AG (Switzerland) | 2,520 | 238,016 |
| Novo Nordisk A/S Class B (Denmark) | 2,432 | 170,107 |
| Ono Pharmaceutical Co., Ltd. (Japan) | 1,700 | 51,233 |
| Pfizer, Inc. | 6,984 | 257,081 |
| Regeneron Pharmaceuticals, Inc. † | 345 | 166,673 |
| Roche Holding AG (Switzerland) | 688 | 240,049 |
| Sarepta Therapeutics, Inc. † | 623 | 106,215 |
| Sartorius Stedim Biotech (France) | 167 | 59,522 |
| Shionogi & Co., Ltd. (Japan) | 1,300 | 71,060 |
| Sonic Healthcare, Ltd. (Australia) | 2,230 | 55,395 |
| Sonova Holding AG (Switzerland) | 39 | 10,040 |
| Suzuken Co., Ltd. (Japan) | 700 | 25,320 |
| Thermo Fisher Scientific, Inc. | 477 | 222,177 |
| Vertex Pharmaceuticals, Inc. † | 937 | 221,451 |
| Zimmer Biomet Holdings, Inc. | 2,938 | 452,716 |
| Zoetis, Inc. | 189 | 31,280 |
| | | 9,801,838 |
| Semiconductor (0.1%) | | |
| ASML Holding NV (Netherlands) | 56 | 27,063 |
| Lasertec Corp. (Japan) | 400 | 47,053 |
| Tokyo Electron, Ltd. (Japan) | 200 | 74,597 |
| | | 148,713 |
| Software (6.2%) | | |
| Activision Blizzard, Inc. | 7,560 | 701,946 |
| Adobe, Inc. † | 2,710 | 1,355,325 |
| Amdocs, Ltd. | 1,914 | 135,760 |
| Autodesk, Inc. † | 2,518 | 768,846 |
| Cadence Design Systems, Inc. † | 3,079 | 420,068 |
| Intuit, Inc. | 3,135 | 1,190,830 |
| Microsoft Corp. | 10,621 | 2,362,323 |
| Nexon Co., Ltd. (Japan) | 2,200 | 67,755 |
| Oracle Corp. | 2,554 | 165,218 |
| Take-Two Interactive Software, Inc. † | 186 | 38,649 |
| Veeva Systems, Inc. Class A † | 2,130 | 579,893 |
| | | 7,786,613 |
| Technology (0.1%) | | |
| CACI International, Inc. Class A † | 310 | 77,292 |
| | | 77,292 |
| Technology services (5.2%) | | |
| Alphabet, Inc. Class A † | 1,765 | 3,093,410 |
| Capgemini SE (France) | 211 | 32,720 |
| |
| 8 | Putnam VT Global Asset Allocation Fund |
| | |
| COMMON STOCKS (63.6%)* cont. | Shares | Value |
| Technology services cont. | | |
| Cognizant Technology Solutions Corp. Class A | 4,338 | $355,499 |
| DocuSign, Inc. † | 1,984 | 441,043 |
| eBay, Inc. | 17,541 | 881,435 |
| Facebook, Inc. Class A † | 1,287 | 351,557 |
| Fair Isaac Corp. † | 432 | 220,769 |
| GoDaddy, Inc. Class A † | 4,027 | 334,040 |
| IBM Corp. | 493 | 62,059 |
| Itochu Techno-Solutions Corp. (Japan) | 1,400 | 49,844 |
| Kakaku.com, Inc. (Japan) | 700 | 19,220 |
| Leidos Holdings, Inc. | 2,566 | 269,738 |
| Nomura Research Institute, Ltd. (Japan) | 2,800 | 100,047 |
| Palo Alto Networks, Inc. † | 124 | 44,068 |
| Pinterest, Inc. Class A † | 5,131 | 338,133 |
| | | 6,593,582 |
| Transportation (0.9%) | | |
| A. P. Moeller-Maersck A/S (Denmark) | 15 | 33,449 |
| Aena SME SA (Spain) † | 269 | 46,972 |
| Aurizon Holdings, Ltd. (Australia) | 21,888 | 65,872 |
| Delta Air Lines, Inc. | 3,477 | 139,810 |
| Deutsche Post AG (Germany) | 2,663 | 131,786 |
| Expeditors International of Washington, Inc. | 1,912 | 181,850 |
| Nippon Express Co., Ltd. (Japan) | 300 | 20,184 |
| Old Dominion Freight Line, Inc. | 1,926 | 375,917 |
| Union Pacific Corp. | 441 | 91,825 |
| Yamato Holdings Co., Ltd. (Japan) | 1,300 | 33,207 |
| Yangzijiang Shipbuilding Holdings, Ltd. (China) | 33,200 | 24,013 |
| | | 1,144,885 |
| Utilities and power (2.0%) | | |
| AES Corp. (The) | 2,732 | 64,202 |
| AGL Energy, Ltd. (Australia) | 4,857 | 44,784 |
| American Electric Power Co., Inc. | 4,786 | 398,530 |
| CLP Holdings, Ltd. (Hong Kong) | 3,000 | 27,772 |
| E.ON SE (Germany) | 2,795 | 30,955 |
| Enel SpA (Italy) | 9,528 | 96,217 |
| Eni SpA (Italy) | 4,148 | 42,937 |
| Entergy Corp. | 1,572 | 156,948 |
| Exelon Corp. | 9,316 | 393,322 |
| NRG Energy, Inc. | 5,202 | 195,335 |
| Pinnacle West Capital Corp. | 1,482 | 118,486 |
| Public Service Enterprise Group, Inc. | 3,800 | 221,540 |
| Snam SpA (Italy) | 8,633 | 48,479 |
| Southern Co. (The) | 9,208 | 565,647 |
| Texas Competitive Electric Holdings Co., LLC/TCEH | | |
| Finance, Inc. (Rights) | 1,923 | 1,923 |
| Tokyo Gas Co., Ltd. (Japan) | 1,600 | 37,194 |
| Vistra Energy Corp. | 6,254 | 122,954 |
| | | 2,567,225 |
| Total common stocks (cost $55,958,176) | | $80,178,337 |
| |
| U.S. GOVERNMENT AND AGENCY | | |
| MORTGAGE OBLIGATIONS (20.8%)* | Principal amount | Value |
| U.S. Government Guaranteed Mortgage Obligations (4.3%) | |
| Government National Mortgage Association | | |
| Pass-Through Certificates | | |
| 6.50%, with due dates from 5/20/37 to 11/20/39 | $173,103 | $206,665 |
| 3.00%, TBA, 1/1/51 | 3,000,000 | 3,137,109 |
| 3.00%, with due dates from 7/20/50 to 10/20/50 | 1,970,277 | 2,075,438 |
| | | 5,419,212 |
| | |
| U.S. GOVERNMENT AND AGENCY | | |
| MORTGAGE OBLIGATIONS (20.8%)* cont. | Principal amount | Value |
| U.S. Government Agency Mortgage Obligations (16.5%) | |
| Federal Home Loan Mortgage Corporation | | |
| Pass-Through Certificates 3.00%, 1/1/48 | $1,442,615 | $1,513,484 |
| Federal National Mortgage Association | | |
| Pass-Through Certificates | | |
| 4.00%, 1/1/57 | 59,646 | 66,908 |
| 4.00%, 1/1/49 | 308,538 | 328,939 |
| 3.00%, with due dates from 4/1/46 to 11/1/48 | 953,013 | 1,002,980 |
| Uniform Mortgage-Backed Securities | | |
| 6.00%, TBA, 1/1/51 | 1,000,000 | 1,123,281 |
| 4.50%, TBA, 1/1/51 | 1,000,000 | 1,083,750 |
| 3.50%, TBA, 1/1/51 | 2,000,000 | 2,114,688 |
| 2.50%, TBA, 2/1/51 | 3,000,000 | 3,157,149 |
| 2.50%, TBA, 1/1/51 | 4,000,000 | 4,216,875 |
| 2.50%, TBA, 1/1/36 | 1,000,000 | 1,043,125 |
| 2.00%, TBA, 2/1/51 | 2,000,000 | 2,074,922 |
| 2.00%, TBA, 1/1/51 | 3,000,000 | 3,117,188 |
| | | 20,843,289 |
| Total U.S. government and agency mortgage | | |
| obligations (cost $26,002,077) | | $26,262,501 |
| |
| CORPORATE BONDS AND NOTES (15.8%)* | Principal amount | Value |
| Basic materials (0.8%) | | |
| Allegheny Technologies, Inc. sr. unsec. | | |
| unsub. notes 7.875%, 8/15/23 | $10,000 | $10,913 |
| ArcelorMittal SA sr. unsec. unsub. notes 7.25%, | | |
| 10/15/39 (France) | 10,000 | 13,800 |
| Beacon Roofing Supply, Inc. 144A company | | |
| guaranty sr. notes 4.50%, 11/15/26 | 5,000 | 5,238 |
| Beacon Roofing Supply, Inc. 144A company | | |
| guaranty sr. unsec. notes 4.875%, 11/1/25 | 10,000 | 10,238 |
| Big River Steel, LLC/BRS Finance Corp. 144A | | |
| sr. notes 6.625%, 1/31/29 | 10,000 | 10,800 |
| BMC East, LLC 144A company | | |
| guaranty sr. notes 5.50%, 10/1/24 | 20,000 | 20,550 |
| Boise Cascade Co. 144A company | | |
| guaranty sr. unsec. notes 4.875%, 7/1/30 | 10,000 | 10,825 |
| Builders FirstSource, Inc. 144A sr. notes 6.75%, 6/1/27 | 9,000 | 9,762 |
| BWAY Holding Co. 144A sr. unsec. notes 7.25%, 4/15/25 | 10,000 | 10,100 |
| Celanese US Holdings, LLC company | | |
| guaranty sr. unsec. notes 3.50%, 5/8/24 (Germany) | 11,000 | 11,912 |
| CF Industries, Inc. company guaranty sr. unsec. | | |
| bonds 4.95%, 6/1/43 | 15,000 | 18,375 |
| CF Industries, Inc. 144A company | | |
| guaranty sr. notes 4.50%, 12/1/26 | 56,000 | 66,347 |
| Clearwater Paper Corp. 144A company | | |
| guaranty sr. unsec. notes 4.75%, 8/15/28 | 5,000 | 5,175 |
| Compass Minerals International, Inc. 144A company | |
| guaranty sr. unsec. notes 6.75%, 12/1/27 | 15,000 | 16,238 |
| Compass Minerals International, Inc. 144A company | |
| guaranty sr. unsec. notes 4.875%, 7/15/24 | 30,000 | 31,200 |
| Core & Main LP 144A sr. unsec. notes 6.125%, 8/15/25 | 5,000 | 5,169 |
| CP Atlas Buyer, Inc. 144A sr. unsec. notes | | |
| 7.00%, 12/1/28 | 5,000 | 5,200 |
| Freeport-McMoRan, Inc. company guaranty sr. | | |
| unsec. bonds 4.625%, 8/1/30 (Indonesia) | 5,000 | 5,488 |
| Freeport-McMoRan, Inc. company guaranty sr. | | |
| unsec. notes 4.375%, 8/1/28 (Indonesia) | 10,000 | 10,625 |
| GCP Applied Technologies, Inc. 144A sr. unsec. | | |
| notes 5.50%, 4/15/26 | 25,000 | 25,750 |
| |
| Putnam VT Global Asset Allocation Fund | 9 |
| | |
| CORPORATE BONDS | | |
| AND NOTES (15.8%)* cont. | Principal amount | Value |
| Basic materials cont. | | |
| Georgia-Pacific, LLC 144A sr. unsec. | | |
| sub. notes 2.10%, 4/30/27 | $10,000 | $10,558 |
| Glencore Funding, LLC 144A company | | |
| guaranty sr. unsec. notes 1.625%, 9/1/25 | 4,000 | 4,103 |
| Glencore Funding, LLC 144A company | | |
| guaranty sr. unsec. unsub. notes 4.625%, 4/29/24 | 6,000 | 6,701 |
| Glencore Funding, LLC 144A company | | |
| guaranty sr. unsec. unsub. notes 4.00%, 4/16/25 | 37,000 | 41,402 |
| GrafTech Finance, Inc. 144A company | | |
| guaranty sr. notes 4.625%, 12/15/28 | 5,000 | 5,056 |
| Graphic Packaging International, LLC 144A company | | |
| guaranty sr. unsec. notes 3.50%, 3/1/29 | 5,000 | 5,113 |
| Greif, Inc. 144A company guaranty sr. unsec. | | |
| notes 6.50%, 3/1/27 | 10,000 | 10,575 |
| HudBay Minerals, Inc. 144A company guaranty sr. | | |
| unsec. notes 7.625%, 1/15/25 (Canada) | 10,000 | 10,388 |
| HudBay Minerals, Inc. 144A company guaranty sr. | | |
| unsec. notes 6.125%, 4/1/29 (Canada) | 5,000 | 5,388 |
| Ingevity Corp. 144A company guaranty sr. unsec. | | |
| notes 3.875%, 11/1/28 | 10,000 | 10,025 |
| Intelligent Packaging Holdco Issuer LP 144A | | |
| sr. unsec. notes 9.00%, 1/15/26 (Canada) ‡‡ | 10,000 | 9,900 |
| Intelligent Packaging, Ltd., | | |
| Finco, Inc./Intelligent Packaging Ltd Co-Issuer, | | |
| LL 144A sr. notes 6.00%, 9/15/28 (Canada) | 5,000 | 5,138 |
| International Flavors & Fragrances, Inc. | | |
| sr. unsec. notes 4.45%, 9/26/28 | 23,000 | 27,227 |
| Kraton Polymers, LLC 144A company | | |
| guaranty sr. unsec. notes 4.25%, 12/15/25 | 5,000 | 5,101 |
| Louisiana-Pacific Corp. company | | |
| guaranty sr. unsec. unsub. notes 4.875%, 9/15/24 | 5,000 | 5,125 |
| Mauser Packaging Solutions Holding Co. 144A | | |
| sr. notes 8.50%, 4/15/24 | 5,000 | 5,225 |
| Mauser Packaging Solutions Holding Co. 144A | | |
| sr. notes 5.50%, 4/15/24 | 10,000 | 10,197 |
| Mercer International, Inc. sr. unsec. | | |
| notes 6.50%, 2/1/24 (Canada) | 10,000 | 10,138 |
| Mercer International, Inc. sr. unsec. | | |
| notes 5.50%, 1/15/26 (Canada) | 10,000 | 10,181 |
| Novelis Corp. 144A company guaranty sr. unsec. | | |
| bonds 5.875%, 9/30/26 | 25,000 | 26,125 |
| Novelis Corp. 144A company guaranty sr. unsec. | | |
| notes 4.75%, 1/30/30 | 25,000 | 26,934 |
| Nutrien, Ltd. sr. unsec. bonds 5.25%, | | |
| 1/15/45 (Canada) | 20,000 | 27,240 |
| Nutrien, Ltd. sr. unsec. bonds 4.125%, | | |
| 3/15/35 (Canada) | 25,000 | 29,772 |
| Nutrien, Ltd. sr. unsec. sub. bonds 4.20%, | | |
| 4/1/29 (Canada) | 24,000 | 28,697 |
| Nutrition & Biosciences, Inc. 144A sr. unsec. | | |
| bonds 3.468%, 12/1/50 | 7,000 | 7,604 |
| Nutrition & Biosciences, Inc. 144A sr. unsec. | | |
| bonds 2.30%, 11/1/30 | 19,000 | 19,570 |
| Packaging Corp. of America sr. unsec. | | |
| unsub. notes 4.50%, 11/1/23 | 45,000 | 49,507 |
| Sherwin-Williams Co. (The) sr. unsec. | | |
| unsub. bonds 3.45%, 6/1/27 | 35,000 | 39,541 |
| Smurfit Kappa Treasury Funding DAC company | | |
| guaranty sr. unsec. unsub. notes 7.50%, 11/20/25 | | |
| (Ireland) | 15,000 | 18,394 |
| | |
| CORPORATE BONDS | | |
| AND NOTES (15.8%)* cont. | Principal amount | Value |
| Basic materials cont. | | |
| TMS International Holding Corp. 144A sr. unsec. | | |
| notes 7.25%, 8/15/25 | $10,000 | $10,150 |
| TopBuild Corp. 144A company guaranty sr. unsec. | | |
| notes 5.625%, 5/1/26 | 10,000 | 10,363 |
| Tronox Finance PLC 144A company | | |
| guaranty sr. unsec. notes 5.75%, 10/1/25 | | |
| (United Kingdom) | 10,000 | 10,375 |
| U.S. Concrete, Inc. company guaranty sr. unsec. | | |
| unsub. notes 6.375%, 6/1/24 | 4,000 | 4,100 |
| U.S. Concrete, Inc. 144A company | | |
| guaranty sr. unsec. notes 5.125%, 3/1/29 | 5,000 | 5,150 |
| Univar Solutions USA, Inc. 144A company | | |
| guaranty sr. unsec. notes 5.125%, 12/1/27 | 20,000 | 21,125 |
| W.R. Grace & Co.-Conn. 144A company | | |
| guaranty sr. unsec. notes 5.625%, 10/1/24 | 10,000 | 10,788 |
| W.R. Grace & Co.-Conn. 144A company | | |
| guaranty sr. unsec. notes 4.875%, 6/15/27 | 10,000 | 10,605 |
| WestRock MWV, LLC company guaranty sr. unsec. | | |
| unsub. notes 8.20%, 1/15/30 | 30,000 | 42,753 |
| WestRock MWV, LLC company guaranty sr. unsec. | | |
| unsub. notes 7.95%, 2/15/31 | 10,000 | 14,278 |
| Weyerhaeuser Co. sr. unsec. unsub. notes | | |
| 7.375%, 3/15/32 R | 39,000 | 58,484 |
| | | 972,801 |
| Capital goods (0.8%) | | |
| Allison Transmission, Inc. 144A company | | |
| guaranty sr. unsec. bonds 3.75%, 1/30/31 | 5,000 | 5,116 |
| Allison Transmission, Inc. 144A company | | |
| guaranty sr. unsec. notes 4.75%, 10/1/27 | 20,000 | 21,050 |
| American Axle & Manufacturing, Inc. company | | |
| guaranty sr. unsec. notes 6.875%, 7/1/28 | 10,000 | 10,775 |
| American Axle & Manufacturing, Inc. company | | |
| guaranty sr. unsec. unsub. notes 6.25%, 4/1/25 | 5,000 | 5,175 |
| Amsted Industries, Inc. 144A company | | |
| guaranty sr. unsec. sub. notes 5.625%, 7/1/27 | 10,000 | 10,625 |
| Amsted Industries, Inc. 144A sr. unsec. | | |
| bonds 4.625%, 5/15/30 | 5,000 | 5,238 |
| ATS Automation Tooling Systems, Inc. 144A | | |
| sr. unsec. notes 4.125%, 12/15/28 (Canada) | 5,000 | 5,088 |
| Berry Global, Inc. company | | |
| guaranty unsub. notes 5.125%, 7/15/23 | 5,000 | 5,063 |
| Berry Global, Inc. 144A company | | |
| guaranty notes 5.625%, 7/15/27 | 5,000 | 5,377 |
| Berry Global, Inc. 144A notes 4.50%, 2/15/26 | 5,000 | 5,113 |
| Bombardier, Inc. 144A sr. unsec. notes 7.875%, | | |
| 4/15/27 (Canada) | 10,000 | 9,194 |
| Bombardier, Inc. 144A sr. unsec. notes 7.50%, | | |
| 12/1/24 (Canada) | 5,000 | 4,796 |
| Clarios Global LP 144A company | | |
| guaranty sr. notes 6.75%, 5/15/25 | 10,000 | 10,775 |
| Clean Harbors, Inc. 144A sr. unsec. bonds | | |
| 5.125%, 7/15/29 | 5,000 | 5,463 |
| Clean Harbors, Inc. 144A sr. unsec. notes | | |
| 4.875%, 7/15/27 | 10,000 | 10,433 |
| Crown Americas, LLC/Crown Americas Capital Corp. | | |
| VI company guaranty sr. unsec. notes 4.75%, 2/1/26 | 5,000 | 5,188 |
| Crown Cork & Seal Co., Inc. company | | |
| guaranty sr. unsec. bonds 7.375%, 12/15/26 | 10,000 | 12,175 |
| General Dynamics Corp. company | | |
| guaranty sr. unsec. unsub. notes 2.25%, 11/15/22 | 30,000 | 30,968 |
| GFL Environmental, Inc. 144A company | | |
| guaranty sr. notes 3.50%, 9/1/28 (Canada) | 5,000 | 5,100 |
| |
| 10 | Putnam VT Global Asset Allocation Fund |
| | |
| CORPORATE BONDS | | |
| AND NOTES (15.8%)* cont. | Principal amount | Value |
| Capital goods cont. | | |
| GFL Environmental, Inc. 144A company | | |
| guaranty sr. unsec. notes 4.00%, 8/1/28 (Canada) | $5,000 | $5,038 |
| GFL Environmental, Inc. 144A sr. notes 5.125%, | | |
| 12/15/26 (Canada) | 10,000 | 10,638 |
| GFL Environmental, Inc. 144A sr. unsec. | | |
| notes 8.50%, 5/1/27 (Canada) | 6,000 | 6,660 |
| Great Lakes Dredge & Dock Corp. company | | |
| guaranty sr. unsec. notes 8.00%, 5/15/22 | 20,000 | 20,512 |
| Honeywell International, Inc. sr. unsec. | | |
| bonds 3.812%, 11/21/47 | 55,000 | 70,407 |
| Husky III Holding, Ltd. 144A sr. unsec. | | |
| notes 13.00%, 2/15/25 (Canada) ‡‡ | 15,000 | 16,313 |
| Johnson Controls International PLC sr. unsec. | | |
| bonds 4.95%, 7/2/64 | 65,000 | 88,496 |
| Johnson Controls International PLC sr. unsec. | | |
| unsub. bonds 4.50%, 2/15/47 | 6,000 | 7,886 |
| L3Harris Technologies, Inc. sr. unsec. | | |
| bonds 1.80%, 1/15/31 | 5,000 | 5,076 |
| L3Harris Technologies, Inc. sr. unsec. | | |
| notes 3.85%, 12/15/26 | 24,000 | 27,732 |
| L3Harris Technologies, Inc. sr. unsec. | | |
| sub. notes 4.40%, 6/15/28 | 25,000 | 29,977 |
| MasTec, Inc. 144A company guaranty sr. unsec. | | |
| notes 4.50%, 8/15/28 | 10,000 | 10,500 |
| Northrop Grumman Corp. sr. unsec. | | |
| unsub. notes 3.25%, 1/15/28 | 60,000 | 67,849 |
| Oshkosh Corp. sr. unsec. sub. notes 4.60%, 5/15/28 | 9,000 | 10,623 |
| Oshkosh Corp. sr. unsec. unsub. notes 3.10%, 3/1/30 | 2,000 | 2,181 |
| Otis Worldwide Corp. sr. unsec. notes | | |
| 2.565%, 2/15/30 | 15,000 | 16,107 |
| Owens-Brockway Glass Container, Inc. 144A company | | |
| guaranty sr. unsec. notes 6.625%, 5/13/27 | 5,000 | 5,413 |
| Panther BF Aggregator 2 LP/Panther | | |
| Finance Co., Inc. 144A company | | |
| guaranty sr. notes 6.25%, 5/15/26 | 5,000 | 5,363 |
| Panther BF Aggregator 2 LP/Panther | | |
| Finance Co., Inc. 144A company | | |
| guaranty sr. unsec. notes 8.50%, 5/15/27 | 10,000 | 10,864 |
| Park-Ohio Industries, Inc. company | | |
| guaranty sr. unsec. notes 6.625%, 4/15/27 | 15,000 | 15,525 |
| Raytheon Technologies Corp. sr. unsec. | | |
| bonds 4.875%, 10/15/40 (acquired 6/8/20, | | |
| cost $24,532) ∆∆ | 20,000 | 26,052 |
| Raytheon Technologies Corp. sr. unsec. | | |
| notes 2.50%, 12/15/22 (acquired 6/8/20, | | |
| cost $51,539) ∆∆ | 50,000 | 51,768 |
| Raytheon Technologies Corp. sr. unsec. | | |
| unsub. notes 4.125%, 11/16/28 | 5,000 | 5,961 |
| RBS Global, Inc./Rexnord, LLC 144A sr. unsec. | | |
| notes 4.875%, 12/15/25 | 15,000 | 15,281 |
| Staples, Inc. 144A sr. notes 7.50%, 4/15/26 | 25,000 | 26,107 |
| Stevens Holding Co, Inc. 144A company | | |
| guaranty sr. unsec. notes 6.125%, 10/1/26 | 20,000 | 21,600 |
| Tennant Co. company guaranty sr. unsec. | | |
| unsub. notes 5.625%, 5/1/25 | 10,000 | 10,413 |
| TransDigm, Inc. company guaranty sr. unsec. | | |
| sub. notes 6.50%, 5/15/25 | 5,000 | 5,138 |
| TransDigm, Inc. company guaranty sr. unsec. | | |
| sub. notes 6.375%, 6/15/26 | 10,000 | 10,350 |
| TransDigm, Inc. company guaranty sr. unsec. | | |
| sub. notes 5.50%, 11/15/27 | 15,000 | 15,770 |
| | |
| CORPORATE BONDS | | |
| AND NOTES (15.8%)* cont. | Principal amount | Value |
| Capital goods cont. | | |
| TransDigm, Inc. company guaranty sr. unsec. | | |
| unsub. notes 6.50%, 7/15/24 | $8,000 | $8,142 |
| TransDigm, Inc. 144A company | | |
| guaranty sr. notes 6.25%, 3/15/26 | 50,000 | 53,250 |
| Waste Connections, Inc. sr. unsec. | | |
| sub. bonds 3.50%, 5/1/29 | 30,000 | 34,219 |
| Waste Pro USA, Inc. 144A sr. unsec. notes | | |
| 5.50%, 2/15/26 | 20,000 | 20,450 |
| WESCO Distribution, Inc. 144A company | | |
| guaranty sr. unsec. unsub. notes 7.25%, 6/15/28 | 10,000 | 11,373 |
| WESCO Distribution, Inc. 144A company | | |
| guaranty sr. unsec. unsub. notes 7.125%, 6/15/25 | 5,000 | 5,499 |
| | | 927,245 |
| Communication services (2.0%) | | |
| American Tower Corp. sr. unsec. bonds | | |
| 3.125%, 1/15/27 R | 14,000 | 15,445 |
| American Tower Corp. sr. unsec. sub. notes | | |
| 2.75%, 1/15/27 R | 100,000 | 108,492 |
| AT&T, Inc. sr. unsec. bonds 4.30%, 2/15/30 | 28,000 | 33,447 |
| AT&T, Inc. sr. unsec. unsub. bonds 4.35%, 3/1/29 | 7,000 | 8,349 |
| AT&T, Inc. sr. unsec. unsub. notes 4.75%, 5/15/46 | 77,000 | 94,980 |
| AT&T, Inc. 144A sr. unsec. bonds 3.55%, 9/15/55 | 61,000 | 60,793 |
| AT&T, Inc. 144A sr. unsec. unsub. bonds | | |
| 2.55%, 12/1/33 | 187,000 | 191,701 |
| CCO Holdings, LLC/CCO Holdings Capital Corp. 144A | | |
| company guaranty sr. unsec. bonds 5.50%, 5/1/26 | 15,000 | 15,544 |
| CCO Holdings, LLC/CCO Holdings Capital Corp. 144A | | |
| sr. unsec. bonds 5.375%, 6/1/29 | 40,000 | 43,850 |
| CCO Holdings, LLC/CCO Holdings Capital Corp. 144A | | |
| sr. unsec. bonds 4.50%, 5/1/32 | 10,000 | 10,677 |
| CCO Holdings, LLC/CCO Holdings Capital Corp. 144A | | |
| sr. unsec. bonds 4.50%, 8/15/30 | 5,000 | 5,306 |
| CCO Holdings, LLC/CCO Holdings Capital Corp. 144A | | |
| sr. unsec. notes 5.75%, 2/15/26 | 10,000 | 10,319 |
| Charter Communications Operating, LLC/Charter | | |
| Communications Operating Capital Corp. company | | |
| guaranty sr. notes 3.75%, 2/15/28 | 2,000 | 2,242 |
| Charter Communications Operating, LLC/Charter | | |
| Communications Operating Capital Corp. company | | |
| guaranty sr. sub. bonds 6.484%, 10/23/45 | 3,000 | 4,243 |
| Charter Communications Operating, LLC/Charter | | |
| Communications Operating Capital Corp. company | | |
| guaranty sr. sub. bonds 4.80%, 3/1/50 | 10,000 | 11,944 |
| Charter Communications Operating, LLC/Charter | | |
| Communications Operating Capital Corp. | | |
| sr. bonds 3.70%, 4/1/51 | 110,000 | 114,230 |
| Charter Communications Operating, LLC/Charter | | |
| Communications Operating Capital Corp. company | | |
| guaranty sr. sub. bonds 5.375%, 5/1/47 | 44,000 | 54,917 |
| Comcast Cable Communications Holdings, Inc. | | |
| company guaranty sr. unsec. notes 9.455%, 11/15/22 | 67,000 | 78,411 |
| Comcast Corp. company guaranty sr. unsec. | | |
| unsub. bonds 3.999%, 11/1/49 | 7,000 | 8,837 |
| Comcast Corp. company guaranty sr. unsec. | | |
| unsub. bonds 3.969%, 11/1/47 | 92,000 | 114,822 |
| Comcast Corp. company guaranty sr. unsec. | | |
| unsub. notes 6.50%, 11/15/35 | 17,000 | 26,279 |
| Comcast Corp. sr. unsec. bonds 3.45%, 2/1/50 | 19,000 | 22,421 |
| CommScope Technologies, LLC 144A company | | |
| guaranty sr. unsec. notes 6.00%, 6/15/25 | 8,000 | 8,180 |
| Cox Communications, Inc. 144A company | | |
| guaranty sr. unsec. bonds 2.95%, 10/1/50 | 32,000 | 32,718 |
| |
| Putnam VT Global Asset Allocation Fund | 11 |
| | |
| CORPORATE BONDS | | |
| AND NOTES (15.8%)* cont. | Principal amount | Value |
| Communication services cont. | | |
| Cox Communications, Inc. 144A sr. unsec. | | |
| bonds 3.50%, 8/15/27 | $25,000 | $28,263 |
| Crown Castle International Corp. sr. unsec. | | |
| bonds 3.80%, 2/15/28 R | 25,000 | 28,813 |
| Crown Castle International Corp. sr. unsec. | | |
| bonds 3.65%, 9/1/27 R | 34,000 | 38,386 |
| Crown Castle International Corp. sr. unsec. | | |
| unsub. bonds 3.70%, 6/15/26 R | 35,000 | 39,454 |
| CSC Holdings, LLC sr. unsec. unsub. bonds | | |
| 5.25%, 6/1/24 | 63,000 | 68,191 |
| CSC Holdings, LLC sr. unsec. unsub. notes | | |
| 6.75%, 11/15/21 | 33,000 | 34,320 |
| Deutsche Telekom International Finance BV company | | |
| guaranty sr. unsec. unsub. bonds 8.75%, 6/15/30 | | |
| (Netherlands) | 73,000 | 115,499 |
| DISH DBS Corp. company guaranty sr. unsec. | | |
| unsub. notes 5.875%, 11/15/24 | 35,000 | 36,699 |
| Equinix, Inc. sr. unsec. notes 5.375%, 5/15/27 R | 5,000 | 5,450 |
| Equinix, Inc. sr. unsec. sub. notes 3.20%, 11/18/29 R | 25,000 | 27,444 |
| Equinix, Inc. sr. unsec. sub. notes 2.90%, 11/18/26 R | 80,000 | 87,493 |
| Frontier Communications Corp. sr. unsec. | | |
| notes 10.50%, 9/15/22 (In default) † | 20,000 | 10,400 |
| Frontier Communications Corp. 144A company | | |
| guaranty sr. notes 5.875%, 10/15/27 | 5,000 | 5,406 |
| Frontier Communications Corp. 144A notes | | |
| 6.75%, 5/1/29 | 10,000 | 10,700 |
| Intelsat Jackson Holdings SA 144A sr. unsec. | | |
| notes 9.75%, 7/15/25 (Luxembourg) (In default) † | 25,000 | 17,875 |
| Level 3 Financing, Inc. 144A company | | |
| guaranty sr. unsec. notes 4.625%, 9/15/27 | 30,000 | 31,333 |
| Level 3 Financing, Inc. 144A company | | |
| guaranty sr. unsec. notes 4.25%, 7/1/28 | 10,000 | 10,275 |
| Level 3 Financing, Inc. 144A company | | |
| guaranty sr. unsec. unsub. notes 3.625%, 1/15/29 | 5,000 | 4,988 |
| Quebecor Media, Inc. sr. unsec. | | |
| unsub. notes 5.75%, 1/15/23 (Canada) | 3,000 | 3,236 |
| Rogers Communications, Inc. company | | |
| guaranty sr. unsec. unsub. notes 4.50%, | | |
| 3/15/43 (Canada) | 85,000 | 107,749 |
| Sprint Capital Corp. company guaranty sr. unsec. | | |
| unsub. notes 6.875%, 11/15/28 | 45,000 | 59,332 |
| Sprint Corp. company guaranty sr. unsec. | | |
| notes 7.625%, 3/1/26 | 10,000 | 12,412 |
| Sprint Corp. company guaranty sr. unsec. | | |
| sub. notes 7.875%, 9/15/23 | 38,000 | 43,996 |
| Sprint Corp. company guaranty sr. unsec. | | |
| sub. notes 7.25%, 9/15/21 | 17,000 | 17,689 |
| T-Mobile USA, Inc. company guaranty sr. unsec. | | |
| notes 6.00%, 3/1/23 | 5,000 | 5,006 |
| T-Mobile USA, Inc. company guaranty sr. unsec. | | |
| notes 5.375%, 4/15/27 | 15,000 | 16,180 |
| T-Mobile USA, Inc. company guaranty sr. unsec. | | |
| notes 4.00%, 4/15/22 | 5,000 | 5,156 |
| T-Mobile USA, Inc. company guaranty sr. unsec. | | |
| unsub. bonds 4.75%, 2/1/28 | 25,000 | 26,872 |
| T-Mobile USA, Inc. company guaranty sr. unsec. | | |
| unsub. notes 4.50%, 2/1/26 | 5,000 | 5,112 |
| T-Mobile USA, Inc. 144A company | | |
| guaranty sr. notes 3.875%, 4/15/30 | 22,000 | 25,481 |
| T-Mobile USA, Inc. 144A company | | |
| guaranty sr. notes 3.75%, 4/15/27 | 73,000 | 83,133 |
| | |
| CORPORATE BONDS | | |
| AND NOTES (15.8%)* cont. | Principal amount | Value |
| Communication services cont. | | |
| T-Mobile USA, Inc. 144A company | | |
| guaranty sr. sub. bonds 2.25%, 11/15/31 | $60,000 | $61,580 |
| TCI Communications, Inc. sr. unsec. | | |
| unsub. notes 7.125%, 2/15/28 | 65,000 | 90,026 |
| Verizon Communications, Inc. sr. unsec. | | |
| unsub. bonds 5.25%, 3/16/37 | 30,000 | 40,656 |
| Verizon Communications, Inc. sr. unsec. | | |
| unsub. notes 4.40%, 11/1/34 | 65,000 | 81,171 |
| Verizon Communications, Inc. sr. unsec. | | |
| unsub. notes 4.329%, 9/21/28 | 139,000 | 167,388 |
| Videotron, Ltd. company guaranty sr. unsec. | | |
| unsub. notes 5.00%, 7/15/22 (Canada) | 20,000 | 21,000 |
| Videotron, Ltd./Videotron Ltee. 144A sr. unsec. | | |
| notes 5.125%, 4/15/27 (Canada) | 21,000 | 22,287 |
| Zayo Group Holdings, Inc. 144A sr. unsec. | | |
| notes 6.125%, 3/1/28 | 5,000 | 5,288 |
| | | 2,579,886 |
| Consumer cyclicals (2.1%) | | |
| Alimentation Couche-Tard, Inc. 144A company | | |
| guaranty sr. unsec. notes 3.55%, 7/26/27 | | |
| (Canada) | 25,000 | 28,125 |
| Alimentation Couche-Tard, Inc. 144A sr. unsec. | | |
| notes 2.95%, 1/25/30 (Canada) | 14,000 | 15,299 |
| Amazon.com, Inc. sr. unsec. notes 3.15%, 8/22/27 | 90,000 | 102,471 |
| Amazon.com, Inc. sr. unsec. unsub. notes | | |
| 3.30%, 12/5/21 | 75,000 | 76,728 |
| American Builders & Contractors Supply Co., Inc. | | |
| 144A company guaranty sr. unsec. notes | | |
| 5.875%, 5/15/26 | 5,000 | 5,181 |
| American Builders & Contractors Supply Co., Inc. | | |
| 144A sr. notes 4.00%, 1/15/28 | 5,000 | 5,175 |
| BMW US Capital, LLC 144A company | | |
| guaranty sr. unsec. notes 3.95%, 8/14/28 | 35,000 | 40,794 |
| BMW US Capital, LLC 144A company | | |
| guaranty sr. unsec. notes 3.40%, 8/13/21 | 10,000 | 10,186 |
| BMW US Capital, LLC 144A company | | |
| guaranty sr. unsec. notes 2.00%, 4/11/21 | 40,000 | 40,121 |
| Boyd Gaming Corp. company guaranty sr. unsec. | | |
| notes 6.00%, 8/15/26 | 5,000 | 5,188 |
| Boyd Gaming Corp. company guaranty sr. unsec. | | |
| notes 4.75%, 12/1/27 | 5,000 | 5,194 |
| Boyd Gaming Corp. company guaranty sr. unsec. | | |
| unsub. notes 6.375%, 4/1/26 | 10,000 | 10,388 |
| Boyd Gaming Corp. 144A sr. unsec. notes | | |
| 8.625%, 6/1/25 | 5,000 | 5,561 |
| Brookfield Residential | | |
| Properties, Inc./Brookfield Residential US Corp. | | |
| 144A company guaranty sr. unsec. notes 6.25%, | | |
| 9/15/27 (Canada) | 10,000 | 10,638 |
| Carnival Corp. 144A sr. notes 11.50%, 4/1/23 | 5,000 | 5,784 |
| Carriage Services, Inc. 144A sr. unsec. | | |
| notes 6.625%, 6/1/26 | 15,000 | 16,031 |
| Cinemark USA, Inc. company guaranty sr. unsec. | | |
| sub. notes 4.875%, 6/1/23 | 19,000 | 18,050 |
| Clear Channel Outdoor Holdings, Inc. 144A company | | |
| guaranty sr. notes 5.125%, 8/15/27 | 10,000 | 10,100 |
| Clear Channel Worldwide Holdings, Inc. company | | |
| guaranty sr. unsec. notes 9.25%, 2/15/24 | 8,000 | 8,100 |
| Constellation Merger Sub, Inc. 144A sr. unsec. | | |
| notes 8.50%, 9/15/25 | 15,000 | 13,950 |
| Cornerstone Building Brands, Inc. 144A company | | |
| guaranty sr. unsec. sub. notes 8.00%, 4/15/26 | 3,000 | 3,143 |
| |
| 12 | Putnam VT Global Asset Allocation Fund |
| | |
| CORPORATE BONDS | | |
| AND NOTES (15.8%)* cont. | Principal amount | Value |
| Consumer cyclicals cont. | | |
| CRC Escrow Issuer, LLC/CRC Finco, Inc. 144A | | |
| company guaranty sr. unsec. notes 5.25%, 10/15/25 | $20,000 | $20,200 |
| Diamond Sports Group, LLC/Diamond Sports | | |
| Finance Co. 144A sr. notes 5.375%, 8/15/26 | 15,000 | 12,188 |
| Diamond Sports Group, LLC/Diamond Sports | | |
| Finance Co. 144A sr. unsec. notes 6.625%, 8/15/27 | 25,000 | 15,125 |
| Discovery Communications, LLC company | | |
| guaranty sr. unsec. unsub. notes 3.625%, 5/15/30 | 10,000 | 11,455 |
| Dollar General Corp. sr. unsec. sub. notes | | |
| 3.25%, 4/15/23 | 65,000 | 68,776 |
| Ecolab, Inc. sr. unsec. unsub. notes 3.25%, 12/1/27 | 70,000 | 79,438 |
| Entercom Media Corp. 144A company | | |
| guaranty notes 6.50%, 5/1/27 | 10,000 | 10,163 |
| Entercom Media Corp. 144A company | | |
| guaranty sr. unsec. notes 7.25%, 11/1/24 | 15,000 | 14,963 |
| Ford Motor Co. sr. unsec. unsub. notes | | |
| 9.00%, 4/22/25 | 5,000 | 6,130 |
| Gap, Inc. (The) 144A sr. notes 8.625%, 5/15/25 | 5,000 | 5,576 |
| Gap, Inc. (The) 144A sr. notes 8.375%, 5/15/23 | 10,000 | 11,338 |
| Gartner, Inc. 144A company guaranty sr. unsec. | | |
| bonds 3.75%, 10/1/30 | 5,000 | 5,269 |
| General Motors Co. sr. unsec. notes 6.125%, 10/1/25 | 10,000 | 12,130 |
| General Motors Financial Co., Inc. company | | |
| guaranty sr. unsec. notes 4.00%, 10/6/26 | 79,000 | 88,943 |
| General Motors Financial Co., Inc. company | | |
| guaranty sr. unsec. unsub. notes 4.30%, 7/13/25 | 22,000 | 24,665 |
| General Motors Financial Co., Inc. company | | |
| guaranty sr. unsec. unsub. notes 4.00%, 1/15/25 | 10,000 | 11,007 |
| Global Payments, Inc. sr. unsec. notes | | |
| 2.90%, 5/15/30 | 21,000 | 22,866 |
| Global Payments, Inc. sr. unsec. | | |
| unsub. notes 4.00%, 6/1/23 | 55,000 | 59,481 |
| Gray Television, Inc. 144A company | | |
| guaranty sr. unsec. notes 4.75%, 10/15/30 | 5,000 | 5,094 |
| Gray Television, Inc. 144A sr. unsec. | | |
| notes 7.00%, 5/15/27 | 20,000 | 21,900 |
| GW B-CR Security Corp. 144A sr. unsec. | | |
| notes 9.50%, 11/1/27 (Canada) | 8,000 | 8,860 |
| Hanesbrands, Inc. 144A company | | |
| guaranty sr. unsec. notes 5.375%, 5/15/25 | 5,000 | 5,290 |
| Hanesbrands, Inc. 144A company | | |
| guaranty sr. unsec. unsub. notes 4.625%, 5/15/24 | 10,000 | 10,475 |
| Hilton Worldwide Finance, LLC/Hilton Worldwide | | |
| Finance Corp. company guaranty sr. unsec. | | |
| notes 4.875%, 4/1/27 | 21,000 | 22,227 |
| Howard Hughes Corp. (The) 144A sr. unsec. | | |
| notes 5.375%, 3/15/25 | 15,000 | 15,469 |
| Hyatt Hotels Corp. sr. unsec. unsub. notes | | |
| 4.85%, 3/15/26 | 47,000 | 52,466 |
| iHeartCommunications, Inc. company | | |
| guaranty sr. notes 6.375%, 5/1/26 | 41,208 | 44,093 |
| iHeartCommunications, Inc. company | | |
| guaranty sr. unsec. notes 8.375%, 5/1/27 | 17,189 | 18,349 |
| IHS Markit, Ltd. sr. unsec. sub. bonds 4.75%, | | |
| 8/1/28 (United Kingdom) | 5,000 | 6,144 |
| IHS Markit, Ltd. 144A company | | |
| guaranty notes 4.75%, 2/15/25 (United Kingdom) | 70,000 | 80,326 |
| IHS Markit, Ltd. 144A company guaranty sr. unsec. | | |
| notes 4.00%, 3/1/26 (United Kingdom) | 5,000 | 5,713 |
| Interpublic Group of Cos., Inc. (The) sr. unsec. | | |
| sub. bonds 4.65%, 10/1/28 | 86,000 | 103,871 |
| | |
| CORPORATE BONDS | | |
| AND NOTES (15.8%)* cont. | Principal amount | Value |
| Consumer cyclicals cont. | | |
| Iron Mountain, Inc. 144A company | | |
| guaranty sr. unsec. bonds 5.25%, 3/15/28 R | $5,000 | $5,276 |
| Iron Mountain, Inc. 144A company | | |
| guaranty sr. unsec. notes 4.875%, 9/15/27 R | 20,000 | 20,900 |
| JELD-WEN, Inc. 144A company guaranty sr. unsec. | | |
| notes 4.875%, 12/15/27 | 10,000 | 10,575 |
| JELD-WEN, Inc. 144A company guaranty sr. unsec. | | |
| notes 4.625%, 12/15/25 | 10,000 | 10,205 |
| JELD-WEN, Inc. 144A sr. notes 6.25%, 5/15/25 | 5,000 | 5,375 |
| L Brands, Inc. company guaranty sr. unsec. | | |
| bonds 6.75%, perpetual maturity | 5,000 | 5,571 |
| L Brands, Inc. company guaranty sr. unsec. | | |
| notes 7.50%, perpetual maturity | 15,000 | 16,613 |
| L Brands, Inc. 144A company | | |
| guaranty sr. notes 6.875%, 7/1/25 | 5,000 | 5,429 |
| L Brands, Inc. 144A company guaranty sr. unsec. | | |
| unsub. bonds 6.625%, 10/1/30 | 5,000 | 5,563 |
| LBM Acquisition, LLC 144A company | | |
| guaranty sr. unsec. notes 6.25%, 1/15/29 | 5,000 | 5,163 |
| Lennar Corp. company guaranty sr. unsec. | | |
| sub. notes 5.875%, 11/15/24 | 5,000 | 5,775 |
| Levi Strauss & Co. sr. unsec. unsub. notes | | |
| 5.00%, 5/1/25 | 5,000 | 5,125 |
| Lions Gate Capital Holdings, LLC 144A company | | |
| guaranty sr. unsec. notes 5.875%, 11/1/24 | 10,000 | 10,150 |
| Lions Gate Capital Holdings, LLC 144A sr. unsec. | | |
| notes 6.375%, 2/1/24 | 10,000 | 10,250 |
| Live Nation Entertainment, Inc. 144A company | | |
| guaranty sr. unsec. notes 4.875%, 11/1/24 | 5,000 | 5,063 |
| Live Nation Entertainment, Inc. 144A company | | |
| guaranty sr. unsec. sub. notes 5.625%, 3/15/26 | 10,000 | 10,275 |
| Live Nation Entertainment, Inc. 144A | | |
| sr. notes 6.50%, 5/15/27 | 5,000 | 5,593 |
| Macy’s, Inc. 144A company guaranty sr. unsec. | | |
| notes 8.375%, 6/15/25 | 5,000 | 5,553 |
| Marriott International, Inc. sr. unsec. | | |
| bonds 4.625%, 6/15/30 | 11,000 | 12,908 |
| Marriott International, Inc. sr. unsec. | | |
| notes Ser. EE, 5.75%, 5/1/25 | 8,000 | 9,358 |
| Masonite International Corp. 144A company | | |
| guaranty sr. unsec. notes 5.375%, 2/1/28 | 5,000 | 5,369 |
| Mattamy Group Corp. 144A sr. unsec. notes 5.25%, | | |
| 12/15/27 (Canada) | 15,000 | 15,863 |
| Mattamy Group Corp. 144A sr. unsec. notes 4.625%, | | |
| 3/1/30 (Canada) | 10,000 | 10,600 |
| Mattel, Inc. 144A company guaranty sr. unsec. | | |
| notes 5.875%, 12/15/27 | 15,000 | 16,669 |
| Meredith Corp. company guaranty sr. unsec. | | |
| notes 6.875%, 2/1/26 | 25,000 | 24,500 |
| Meredith Corp. 144A company guaranty sr. unsec. | | |
| notes 6.50%, 7/1/25 | 10,000 | 10,650 |
| Moody’s Corp. sr. unsec. bonds 2.55%, 8/18/60 | 20,000 | 18,727 |
| MPH Acquisition Holdings, LLC 144A company | | |
| guaranty sr. unsec. notes 5.75%, 11/1/28 | 5,000 | 4,914 |
| Navistar International Corp. 144A sr. unsec. | | |
| notes 6.625%, 11/1/25 | 20,000 | 20,953 |
| Nexstar Broadcasting, Inc. 144A sr. unsec. | | |
| notes 4.75%, 11/1/28 | 5,000 | 5,231 |
| Nexstar Escrow, Inc. 144A sr. unsec. | | |
| notes 5.625%, 7/15/27 | 15,000 | 16,069 |
| |
| Putnam VT Global Asset Allocation Fund | 13 |
| | |
| CORPORATE BONDS | | |
| AND NOTES (15.8%)* cont. | Principal amount | Value |
| Consumer cyclicals cont. | | |
| Nielsen Co. Luxembourg SARL (The) 144A company | | |
| guaranty sr. unsec. notes 5.00%, 2/1/25 | | |
| (Luxembourg) | $15,000 | $15,394 |
| Nielsen Finance, LLC/Nielsen Finance Co. 144A | | |
| company guaranty sr. unsec. notes 5.625%, 10/1/28 | 10,000 | 10,866 |
| Nielsen Finance, LLC/Nielsen Finance Co. 144A | | |
| company guaranty sr. unsec. sub. notes 5.00%, 4/15/22 7,000 | 7,018 |
| Nordstrom, Inc. 144A sr. notes 8.75%, 5/15/25 | 10,000 | 11,201 |
| Omnicom Group, Inc. company guaranty sr. unsec. | | |
| unsub. notes 3.60%, 4/15/26 | 65,000 | 74,171 |
| Outfront Media Capital, LLC/Outfront Media | | |
| Capital Corp. 144A company guaranty sr. unsec. | | |
| notes 6.25%, 6/15/25 | 10,000 | 10,550 |
| Penn National Gaming, Inc. 144A sr. unsec. | | |
| notes 5.625%, 1/15/27 | 10,000 | 10,438 |
| PM General Purchaser, LLC 144A sr. notes | | |
| 9.50%, 10/1/28 | 15,000 | 16,613 |
| Prime Security Services Borrower, LLC/Prime | | |
| Finance, Inc. 144A company | | |
| guaranty sr. notes 3.375%, 8/31/27 | 5,000 | 4,963 |
| Prime Security Services Borrower, LLC/Prime | | |
| Finance, Inc. 144A notes 6.25%, 1/15/28 | 10,000 | 10,736 |
| PulteGroup, Inc. company guaranty sr. unsec. | | |
| unsub. notes 7.875%, 6/15/32 | 20,000 | 29,925 |
| PulteGroup, Inc. company guaranty sr. unsec. | | |
| unsub. notes 5.50%, 3/1/26 | 64,000 | 76,155 |
| Refinitiv US Holdings, Inc. 144A company | | |
| guaranty sr. notes 6.25%, 5/15/26 | 10,000 | 10,675 |
| S&P Global, Inc. company guaranty sr. unsec. | | |
| bonds 2.50%, 12/1/29 | 30,000 | 32,721 |
| S&P Global, Inc. company guaranty sr. unsec. | | |
| notes 1.25%, 8/15/30 | 9,000 | 8,873 |
| Sabre GLBL, Inc. 144A company | | |
| guaranty sr. notes 9.25%, 4/15/25 | 15,000 | 17,850 |
| Scientific Games International, Inc. 144A company | | |
| guaranty sr. unsec. notes 7.25%, 11/15/29 | 15,000 | 16,463 |
| Scientific Games International, Inc. 144A | | |
| sr. unsec. notes 7.00%, 5/15/28 | 5,000 | 5,376 |
| Scotts Miracle-Gro, Co. (The) company | | |
| guaranty sr. unsec. notes 4.50%, 10/15/29 | 15,000 | 16,163 |
| Scripps Escrow II, Inc. 144A sr. notes 3.875%, 1/15/29 | 5,000 | 5,196 |
| Scripps Escrow II, Inc. 144A sr. unsec. | | |
| bonds 5.375%, 1/15/31 | 5,000 | 5,213 |
| Shift4 Payments, LLC/Shift4 Payments Finance | | |
| Sub, Inc. 144A company guaranty sr. unsec. | | |
| notes 4.625%, 11/1/26 | 10,000 | 10,400 |
| Sinclair Television Group, Inc. 144A company | | |
| guaranty sr. unsec. bonds 5.50%, 3/1/30 | 10,000 | 10,400 |
| Sinclair Television Group, Inc. 144A | | |
| sr. bonds 4.125%, 12/1/30 | 5,000 | 5,116 |
| Sirius XM Radio, Inc. 144A sr. unsec. | | |
| bonds 5.50%, 7/1/29 | 5,000 | 5,502 |
| Sirius XM Radio, Inc. 144A sr. unsec. | | |
| bonds 5.00%, 8/1/27 | 25,000 | 26,375 |
| Six Flags Entertainment Corp. 144A company | | |
| guaranty sr. unsec. bonds 5.50%, 4/15/27 | 10,000 | 10,288 |
| Six Flags Theme Parks, Inc. 144A company | | |
| guaranty sr. notes 7.00%, 7/1/25 | 10,000 | 10,800 |
| Spectrum Brands, Inc. company guaranty sr. unsec. | | |
| unsub. notes 6.125%, 12/15/24 | 10,000 | 10,213 |
| | |
| CORPORATE BONDS | | |
| AND NOTES (15.8%)* cont. | Principal amount | Value |
| Consumer cyclicals cont. | | |
| Spectrum Brands, Inc. 144A company | | |
| guaranty sr. unsec. bonds 5.00%, 10/1/29 | $5,000 | $5,370 |
| Standard Industries, Inc. 144A sr. unsec. | | |
| bonds 3.375%, 1/15/31 | 10,000 | 10,050 |
| Standard Industries, Inc. 144A sr. unsec. | | |
| notes 5.00%, 2/15/27 | 49,000 | 51,205 |
| Station Casinos, LLC 144A sr. unsec. notes | | |
| 4.50%, 2/15/28 | 10,000 | 10,075 |
| SugarHouse HSP Gaming Prop. Mezz LP/SugarHouse | |
| HSP Gaming Finance Corp. 144A company | | |
| guaranty sr. unsub. notes 5.875%, 5/15/25 | 10,000 | 9,675 |
| Taylor Morrison Communities, Inc. 144A sr. unsec. | |
| notes 5.75%, 1/15/28 | 5,000 | 5,663 |
| Terrier Media Buyer, Inc. 144A company | | |
| guaranty sr. unsec. notes 8.875%, 12/15/27 | 20,000 | 22,050 |
| Townsquare Media, Inc. 144A company | | |
| guaranty sr. unsec. notes 6.50%, 4/1/23 | 20,000 | 20,352 |
| Townsquare Media, Inc. 144A sr. notes | | |
| 6.875%, 2/1/26 ## | 15,000 | 15,710 |
| TRI Pointe Group, Inc. sr. unsec. notes | | |
| 5.70%, 6/15/28 | 5,000 | 5,645 |
| TRI Pointe Group, Inc./TRI Pointe Homes, Inc. | |
| company guaranty sr. unsec. unsub. notes | | |
| 5.875%, 6/15/24 | 5,000 | 5,458 |
| TWDC Enterprises 18 Corp. sr. unsec. notes | | |
| 2.75%, 8/16/21 | 30,000 | 30,438 |
| Univision Communications, Inc. 144A company | |
| guaranty sr. notes 9.50%, 5/1/25 | 5,000 | 5,563 |
| Univision Communications, Inc. 144A company | |
| guaranty sr. notes 6.625%, 6/1/27 | 10,000 | 10,741 |
| Univision Communications, Inc. 144A company | |
| guaranty sr. sub. notes 5.125%, 2/15/25 | 5,000 | 5,038 |
| Valvoline, Inc. company guaranty sr. unsec. | | |
| notes 4.375%, 8/15/25 | 5,000 | 5,164 |
| Valvoline, Inc. 144A company guaranty sr. unsec. | |
| unsub. notes 4.25%, 2/15/30 | 5,000 | 5,300 |
| ViacomCBS, Inc. company guaranty sr. unsec. | |
| bonds 4.20%, 6/1/29 | 38,000 | 45,456 |
| ViacomCBS, Inc. company guaranty sr. unsec. | |
| unsub. bonds 2.90%, 1/15/27 | 22,000 | 24,141 |
| ViacomCBS, Inc. company guaranty sr. unsec. | |
| unsub. notes 4.00%, 1/15/26 | 12,000 | 13,734 |
| Walt Disney Co. (The) company guaranty sr. unsec. | |
| bonds 7.75%, 12/1/45 | 40,000 | 71,775 |
| Werner FinCo LP/Werner FinCo, Inc. 144A company | |
| guaranty sr. unsec. notes 8.75%, 7/15/25 | 20,000 | 21,200 |
| White Cap Buyer, LLC 144A sr. unsec. | | |
| notes 6.875%, 10/15/28 | 10,000 | 10,663 |
| WMG Acquisition Corp. 144A company | | |
| guaranty sr. bonds 3.00%, 2/15/31 | 5,000 | 4,900 |
| WMG Acquisition Corp. 144A company | | |
| guaranty sr. unsec. notes 5.50%, 4/15/26 | 5,000 | 5,181 |
| Wolverine World Wide, Inc. 144A company | | |
| guaranty sr. unsec. bonds 5.00%, 9/1/26 | 10,000 | 10,200 |
| Wolverine World Wide, Inc. 144A company | | |
| guaranty sr. unsec. notes 6.375%, 5/15/25 | 5,000 | 5,325 |
| Wynn Las Vegas, LLC/Wynn Las Vegas Capital Corp. | |
| 144A company guaranty sr. unsec. | | |
| sub. notes 5.25%, 5/15/27 | 15,000 | 15,461 |
| |
| 14 | Putnam VT Global Asset Allocation Fund |
| | |
| CORPORATE BONDS | | |
| AND NOTES (15.8%)* cont. | Principal amount | Value |
| Consumer cyclicals cont. | | |
| Wynn Resorts Finance, LLC/Wynn Resorts | | |
| Capital Corp. 144A sr. unsec. bonds 5.125%, 10/1/29 | $15,000 | $15,713 |
| Wynn Resorts Finance, LLC/Wynn Resorts | | |
| Capital Corp. 144A sr. unsec. notes 7.75%, 4/15/25 | 5,000 | 5,419 |
| | | 2,594,781 |
| Consumer staples (0.8%) | | |
| 1011778 BC ULC/New Red Finance, Inc. 144A | | |
| bonds 4.00%, 10/15/30 (Canada) | 5,000 | 5,067 |
| 1011778 BC ULC/New Red Finance, Inc. 144A company | | |
| guaranty notes 4.375%, 1/15/28 (Canada) | 5,000 | 5,150 |
| 1011778 BC ULC/New Red Finance, Inc. 144A company | | |
| guaranty sr. notes 3.875%, 1/15/28 (Canada) | 10,000 | 10,175 |
| Albertsons Cos., Inc./Safeway, Inc./New | | |
| Albertsons LP/Albertsons, LLC 144A company | | |
| guaranty sr. unsec. notes 4.875%, 2/15/30 | 5,000 | 5,509 |
| Albertsons Cos., Inc./Safeway, Inc./New | | |
| Albertsons LP/Albertsons, LLC 144A company | | |
| guaranty sr. unsec. notes 4.625%, 1/15/27 | 35,000 | 37,231 |
| Albertsons Cos., LLC/Safeway, Inc./New Albertsons | | |
| LP/Albertsons, LLC 144A company | | |
| guaranty sr. unsec. notes 7.50%, 3/15/26 | 10,000 | 11,191 |
| Anheuser-Busch Cos., LLC/Anheuser-Busch InBev | | |
| Worldwide, Inc. company guaranty sr. unsec. | | |
| unsub. notes 3.65%, 2/1/26 | 35,000 | 39,563 |
| Anheuser-Busch InBev Worldwide, Inc. company | | |
| guaranty sr. unsec. unsub. bonds 5.55%, 1/23/49 | 13,000 | 18,484 |
| Anheuser-Busch InBev Worldwide, Inc. company | | |
| guaranty sr. unsec. unsub. notes 4.75%, 1/23/29 | 15,000 | 18,523 |
| Anheuser-Busch InBev Worldwide, Inc. company | | |
| guaranty sr. unsec. unsub. notes 4.15%, 1/23/25 | 13,000 | 14,803 |
| Ascend Learning, LLC 144A sr. unsec. | | |
| notes 6.875%, 8/1/25 | 15,000 | 15,413 |
| Ascend Learning, LLC 144A sr. unsec. | | |
| notes 6.875%, 8/1/25 | 5,000 | 5,144 |
| Avient Corp. 144A sr. unsec. notes 5.75%, 5/15/25 | 5,000 | 5,313 |
| Brand Energy & Infrastructure Services, Inc. 144A | | |
| sr. unsec. notes 8.50%, 7/15/25 | 10,000 | 10,213 |
| CVS Pass-Through Trust sr. notes 6.036%, 12/10/28 | 2,581 | 2,993 |
| ERAC USA Finance, LLC 144A company | | |
| guaranty sr. unsec. notes 7.00%, 10/15/37 | 50,000 | 77,548 |
| ERAC USA Finance, LLC 144A company | | |
| guaranty sr. unsec. notes 5.625%, 3/15/42 | 60,000 | 84,257 |
| Fresh Market, Inc. (The) 144A company | | |
| guaranty sr. notes 9.75%, 5/1/23 | 20,000 | 20,600 |
| Go Daddy Operating Co, LLC/GD Finance Co., Inc. | | |
| 144A company guaranty sr. unsec. notes | | |
| 5.25%, 12/1/27 | 5,000 | 5,263 |
| Golden Nugget, Inc. 144A company | | |
| guaranty sr. unsec. sub. notes 8.75%, 10/1/25 | 10,000 | 10,275 |
| Golden Nugget, Inc. 144A sr. unsec. notes | | |
| 6.75%, 10/15/24 | 20,000 | 19,856 |
| IRB Holding Corp. 144A company | | |
| guaranty sr. notes 7.00%, 6/15/25 | 5,000 | 5,463 |
| Itron, Inc. 144A company guaranty sr. unsec. | | |
| notes 5.00%, 1/15/26 | 10,000 | 10,213 |
| Keurig Dr Pepper, Inc. company | | |
| guaranty sr. unsec. unsub. notes 4.597%, 5/25/28 | 31,000 | 37,730 |
| Keurig Dr Pepper, Inc. company | | |
| guaranty sr. unsec. unsub. notes 4.417%, 5/25/25 | 14,000 | 16,141 |
| Keurig Dr Pepper, Inc. company | | |
| guaranty sr. unsec. unsub. notes 4.057%, 5/25/23 | 8,000 | 8,692 |
| | |
| CORPORATE BONDS | | |
| AND NOTES (15.8%)* cont. | Principal amount | Value |
| Consumer staples cont. | | |
| KFC Holding Co./Pizza Hut Holdings, LLC/Taco Bell | | |
| of America, LLC 144A company guaranty sr. unsec. | | |
| notes 5.25%, 6/1/26 | $15,000 | $15,563 |
| KFC Holding Co./Pizza Hut Holdings, LLC/Taco Bell | | |
| of America, LLC 144A company guaranty sr. unsec. | | |
| notes 4.75%, 6/1/27 | 10,000 | 10,560 |
| Kraft Heinz Co. (The) company guaranty sr. unsec. | | |
| notes 5.00%, 7/15/35 | 15,000 | 18,184 |
| Kraft Heinz Co. (The) company guaranty sr. unsec. | | |
| notes 3.00%, 6/1/26 | 35,000 | 36,549 |
| Kraft Heinz Co. (The) 144A company | | |
| guaranty sr. unsec. notes 3.875%, 5/15/27 | 3,000 | 3,232 |
| Lamb Weston Holdings, Inc. 144A company | | |
| guaranty sr. unsec. notes 4.875%, 5/15/28 | 10,000 | 11,163 |
| Lamb Weston Holdings, Inc. 144A company | | |
| guaranty sr. unsec. unsub. notes 4.875%, 11/1/26 | 31,000 | 32,405 |
| Lamb Weston Holdings, Inc. 144A company | | |
| guaranty sr. unsec. unsub. notes 4.625%, 11/1/24 | 5,000 | 5,213 |
| Match Group, Inc. 144A sr. unsec. bonds | | |
| 5.00%, 12/15/27 | 13,000 | 13,817 |
| Match Group, Inc. 144A sr. unsec. | | |
| unsub. notes 4.625%, 6/1/28 | 25,000 | 26,204 |
| Nestle Holdings, Inc. 144A company | | |
| guaranty sr. unsec. notes 0.375%, 1/15/24 | 150,000 | 150,151 |
| Netflix, Inc. sr. unsec. notes 6.375%, 5/15/29 | 5,000 | 6,175 |
| Netflix, Inc. sr. unsec. notes 4.875%, 4/15/28 | 10,000 | 11,277 |
| Netflix, Inc. sr. unsec. unsub. notes 5.875%, 11/15/28 | 20,000 | 23,975 |
| Netflix, Inc. 144A sr. unsec. bonds 5.375%, 11/15/29 | 25,000 | 29,469 |
| Netflix, Inc. 144A sr. unsec. bonds 4.875%, 6/15/30 | 5,000 | 5,750 |
| Newell Brands, Inc. sr. unsec. notes 4.875%, 6/1/25 | 5,000 | 5,502 |
| Newell Brands, Inc. sr. unsec. | | |
| unsub. notes 4.70%, 4/1/26 | 10,000 | 11,015 |
| Rite Aid Corp. 144A company | | |
| guaranty sr. notes 8.00%, 11/15/26 | 8,000 | 8,560 |
| Rite Aid Corp. 144A company guaranty sr. unsec. | | |
| sub. notes 7.50%, 7/1/25 | 5,000 | 5,219 |
| TripAdvisor, Inc. 144A company | | |
| guaranty sr. unsec. notes 7.00%, 7/15/25 | 10,000 | 10,800 |
| Yum! Brands, Inc. sr. unsec. sub. bonds | | |
| 3.625%, 3/15/31 | 5,000 | 5,054 |
| Yum! Brands, Inc. 144A sr. unsec. bonds | | |
| 4.75%, 1/15/30 | 5,000 | 5,483 |
| | | 952,130 |
| Energy (1.4%) | | |
| Antero Resources Corp. company | | |
| guaranty sr. unsec. sub. notes 5.125%, 12/1/22 | 6,000 | 5,985 |
| Antero Resources Corp. 144A company | | |
| guaranty sr. unsec. notes 8.375%, 7/15/26 | 5,000 | 5,103 |
| Apache Corp. sr. unsec. unsub. notes 5.10%, 9/1/40 | 10,000 | 10,663 |
| Apache Corp. sr. unsec. unsub. notes | | |
| 4.875%, 11/15/27 | 5,000 | 5,300 |
| Apache Corp. sr. unsec. unsub. notes | | |
| 4.375%, 10/15/28 | 10,000 | 10,410 |
| Ascent Resources Utica Holdings, LLC/ARU | | |
| Finance Corp. 144A sr. unsec. notes 10.00%, 4/1/22 | 11,000 | 11,220 |
| Baytex Energy Corp. 144A company | | |
| guaranty sr. unsec. sub. notes 5.625%, 6/1/24 | | |
| (Canada) | 5,000 | 3,440 |
| BP Capital Markets America, Inc. company | | |
| guaranty sr. unsec. notes 3.119%, 5/4/26 | 70,000 | 77,501 |
| |
| Putnam VT Global Asset Allocation Fund | 15 |
| | |
| CORPORATE BONDS | | |
| AND NOTES (15.8%)* cont. | Principal amount | Value |
| Energy cont. | | |
| BP Capital Markets PLC company | | |
| guaranty sr. unsec. unsub. notes 3.279%, 9/19/27 | | |
| (United Kingdom) | $35,000 | $39,299 |
| Cenovus Energy, Inc. sr. unsec. bonds 6.75%, | | |
| 11/15/39 (Canada) | 10,000 | 13,013 |
| ChampionX corp. company guaranty sr. unsec. | | |
| notes 6.375%, 5/1/26 | 15,000 | 15,150 |
| Cheniere Corpus Christi Holdings, LLC company | | |
| guaranty sr. notes 5.125%, 6/30/27 | 35,000 | 41,404 |
| Comstock Escrow Corp. company guaranty sr. unsec. | | |
| sub. notes 9.75%, 8/15/26 | 5,000 | 5,375 |
| Comstock Resources, Inc. company | | |
| guaranty sr. unsec. sub. notes 9.75%, 8/15/26 | 10,000 | 10,775 |
| Comstock Resources, Inc. 144A company | | |
| guaranty sr. unsec. notes 7.50%, 5/15/25 | 10,000 | 10,246 |
| Concho Resources, Inc. company | | |
| guaranty sr. unsec. notes 3.75%, 10/1/27 | 46,000 | 52,574 |
| Continental Resources, Inc. company | | |
| guaranty sr. unsec. notes 4.375%, 1/15/28 | 10,000 | 10,252 |
| Continental Resources, Inc. company | | |
| guaranty sr. unsec. unsub. notes 4.50%, 4/15/23 | 10,000 | 10,311 |
| Continental Resources, Inc. 144A company | | |
| guaranty sr. unsec. bonds 5.75%, 1/15/31 | 5,000 | 5,550 |
| DCP Midstream Operating LP company | | |
| guaranty sr. unsec. notes 5.625%, 7/15/27 | 5,000 | 5,538 |
| DCP Midstream Operating LP 144A company | | |
| guaranty sr. unsec. unsub. bonds 6.75%, 9/15/37 | 15,000 | 16,575 |
| Devon Energy Corp. sr. unsec. unsub. bonds | | |
| 7.95%, 4/15/32 | 5,000 | 7,013 |
| Devon Energy Corp. sr. unsec. | | |
| unsub. bonds 7.875%, 9/30/31 | 5,000 | 6,935 |
| Devon Energy Corp. sr. unsec. unsub. bonds | | |
| 5.60%, 7/15/41 | 5,000 | 6,115 |
| Diamondback Energy, Inc. company | | |
| guaranty sr. unsec. notes 3.25%, 12/1/26 | 15,000 | 16,015 |
| Diamondback Energy, Inc. company | | |
| guaranty sr. unsec. unsub. notes 5.375%, 5/31/25 | 5,000 | 5,205 |
| Diamondback Energy, Inc. sr. unsec. notes | | |
| 4.75%, 5/31/25 | 5,000 | 5,629 |
| Double Eagle III Midco 1 LLC/Double Eagle | | |
| Finance Corp. 144A sr. unsec. notes 7.75%, 12/15/25 | 10,000 | 10,604 |
| Endeavor Energy Resources LP/EER Finance, Inc. | | |
| 144A sr. unsec. bonds 5.75%, 1/30/28 | 45,000 | 48,542 |
| Endeavor Energy Resources LP/EER Finance, Inc. | | |
| 144A sr. unsec. notes 6.625%, 7/15/25 | 10,000 | 10,700 |
| Energy Transfer Operating LP company | | |
| guaranty sr. unsec. bonds 3.75%, 5/15/30 | 30,000 | 32,360 |
| Energy Transfer Operating LP company | | |
| guaranty sr. unsec. notes 5.875%, 1/15/24 | 12,000 | 13,489 |
| Energy Transfer Operating LP company | | |
| guaranty sr. unsec. notes 2.90%, 5/15/25 | 37,000 | 39,145 |
| Energy Transfer Operating LP jr. unsec. sub. FRB | | |
| Ser. B, 6.625%, perpetual maturity | 91,000 | 76,895 |
| Energy Transfer Operating LP sr. unsec. | | |
| unsub. bonds 6.125%, 12/15/45 | 6,000 | 7,088 |
| Energy Transfer Operating LP sr. unsec. | | |
| unsub. notes 5.20%, 2/1/22 | 25,000 | 25,906 |
| EnLink Midstream, LLC 144A company | | |
| guaranty sr. unsec. notes 5.625%, 1/15/28 | 5,000 | 5,101 |
| EOG Resources, Inc. sr. unsec. | | |
| unsub. notes 2.625%, 3/15/23 | 50,000 | 52,178 |
| | |
| CORPORATE BONDS | | |
| AND NOTES (15.8%)* cont. | Principal amount | Value |
| Energy cont. | | |
| Equinor ASA company guaranty sr. unsec. | | |
| notes 5.10%, 8/17/40 (Norway) | $40,000 | $55,966 |
| Exxon Mobil Corp. sr. unsec. unsub. notes | | |
| 2.222%, 3/1/21 | 115,000 | 115,165 |
| Hess Midstream Operations LP 144A company | | |
| guaranty sr. unsec. notes 5.125%, 6/15/28 | 10,000 | 10,453 |
| Hess Midstream Operations LP 144A company | | |
| guaranty sr. unsec. sub. notes 5.625%, 2/15/26 | 50,000 | 52,000 |
| Holly Energy Partners LP/Holly Energy | | |
| Finance Corp. 144A company guaranty sr. unsec. | | |
| notes 5.00%, 2/1/28 | 10,000 | 10,075 |
| Indigo Natural Resources, LLC 144A sr. unsec. | | |
| notes 6.875%, 2/15/26 | 10,000 | 10,225 |
| Marathon Petroleum Corp. sr. unsec. | | |
| unsub. notes 6.50%, 3/1/41 | 25,000 | 33,565 |
| MEG Energy Corp. 144A notes 6.50%, 1/15/25 | | |
| (Canada) | 17,000 | 17,511 |
| Nabors Industries, Inc. company | | |
| guaranty sr. unsec. notes 5.75%, 2/1/25 | 5,000 | 2,606 |
| Nabors Industries, Inc. 144A company | | |
| guaranty sr. unsec. notes 9.00%, 2/1/25 | 5,250 | 4,988 |
| Newfield Exploration Co. sr. unsec. | | |
| unsub. notes 5.625%, 7/1/24 | 5,000 | 5,350 |
| Noble Energy, Inc. sr. unsec. bonds 6.00%, 3/1/41 | 5,000 | 7,606 |
| Northriver Midstream Finance LP 144A | | |
| sr. notes 5.625%, 2/15/26 (Canada) | 5,000 | 5,163 |
| Occidental Petroleum Corp. sr. unsec. | | |
| bonds 6.625%, 9/1/30 | 5,000 | 5,429 |
| Occidental Petroleum Corp. sr. unsec. | | |
| bonds 6.125%, 1/1/31 | 5,000 | 5,351 |
| Occidental Petroleum Corp. sr. unsec. | | |
| sub. notes 6.45%, 9/15/36 | 10,000 | 10,470 |
| Occidental Petroleum Corp. sr. unsec. | | |
| sub. notes 4.85%, 3/15/21 | 5,000 | 5,000 |
| Occidental Petroleum Corp. sr. unsec. | | |
| unsub. notes 3.50%, 6/15/25 | 5,000 | 4,830 |
| Ovintiv, Inc. company guaranty sr. unsec. | | |
| bonds 6.50%, 8/15/34 | 5,000 | 5,790 |
| Ovintiv, Inc. company guaranty sr. unsec. | | |
| unsub. bonds 7.375%, 11/1/31 | 5,000 | 5,937 |
| Petrobras Global Finance BV company | | |
| guaranty sr. unsec. unsub. bonds 7.375%, 1/17/27 | | |
| (Brazil) | 39,000 | 48,266 |
| Petrobras Global Finance BV company | | |
| guaranty sr. unsec. unsub. notes 6.25%, 3/17/24 | | |
| (Brazil) | 40,000 | 45,500 |
| Petrobras Global Finance BV company | | |
| guaranty sr. unsec. unsub. notes 5.999%, 1/27/28 | | |
| (Brazil) | 8,000 | 9,350 |
| Petrobras Global Finance BV company | | |
| guaranty sr. unsec. unsub. notes 5.299%, 1/27/25 | | |
| (Brazil) | 2,000 | 2,260 |
| Petroleos de Venezuela SA 144A company | | |
| guaranty sr. unsec. notes 6.00%, 11/15/26 | | |
| (Venezuela) (In default) † | 40,000 | 1,500 |
| Petroleos Mexicanos company guaranty sr. unsec. | | |
| unsub. FRB 7.69%, 1/23/50 (Mexico) | 37,000 | 37,305 |
| Petroleos Mexicanos company guaranty sr. unsec. | | |
| unsub. notes 6.84%, 1/23/30 (Mexico) | 54,000 | 56,526 |
| Precision Drilling Corp. 144A company | | |
| guaranty sr. unsec. notes 7.125%, 1/15/26 | | |
| (Canada) | 15,000 | 13,050 |
| |
| 16 | Putnam VT Global Asset Allocation Fund |
| | |
| CORPORATE BONDS | | |
| AND NOTES (15.8%)* cont. | Principal amount | Value |
| Energy cont. | | |
| Rattler Midstream LP 144A company | | |
| guaranty sr. unsec. notes 5.625%, 7/15/25 | $10,000 | $10,563 |
| Regency Energy Partners LP/Regency Energy | | |
| Finance Corp. company guaranty sr. unsec. | | |
| unsub. notes 4.50%, 11/1/23 | 9,000 | 9,731 |
| Sabine Pass Liquefaction, LLC sr. notes | | |
| 5.00%, 3/15/27 | 14,000 | 16,507 |
| Shell International Finance BV company | | |
| guaranty sr. unsec. unsub. notes 2.875%, 5/10/26 | | |
| (Netherlands) | 70,000 | 77,417 |
| SM Energy Co. sr. unsec. sub. notes 5.00%, 1/15/24 | 10,000 | 8,550 |
| SM Energy Co. sr. unsec. unsub. notes | | |
| 6.75%, 9/15/26 | 10,000 | 8,050 |
| SM Energy Co. sr. unsec. unsub. notes | | |
| 6.125%, 11/15/22 | 4,000 | 3,860 |
| SM Energy Co. 144A company guaranty notes | | |
| 10.00%, 1/15/25 | 5,000 | 5,375 |
| Spectra Energy Partners LP sr. unsec. | | |
| notes 3.375%, 10/15/26 | 40,000 | 44,844 |
| Tallgrass Energy Partners LP/Tallgrass Energy | | |
| Finance Corp. 144A company guaranty sr. unsec. | | |
| notes 7.50%, 10/1/25 | 5,000 | 5,363 |
| Tallgrass Energy Partners LP/Tallgrass Energy | | |
| Finance Corp. 144A company guaranty sr. unsec. | | |
| notes 6.00%, 12/31/30 | 10,000 | 10,291 |
| Tallgrass Energy Partners LP/Tallgrass Energy | | |
| Finance Corp. 144A company guaranty sr. unsec. | | |
| notes 5.50%, 1/15/28 | 15,000 | 15,319 |
| Targa Resources Partners LP/Targa Resources | | |
| Partners Finance Corp. company | | |
| guaranty sr. unsec. notes 6.875%, 1/15/29 | 5,000 | 5,631 |
| Targa Resources Partners LP/Targa Resources | | |
| Partners Finance Corp. company | | |
| guaranty sr. unsec. notes 6.50%, 7/15/27 | 5,000 | 5,425 |
| Targa Resources Partners LP/Targa Resources | | |
| Partners Finance Corp. company | | |
| guaranty sr. unsec. notes 5.50%, 3/1/30 | 5,000 | 5,429 |
| Targa Resources Partners LP/Targa Resources | | |
| Partners Finance Corp. company | | |
| guaranty sr. unsec. unsub. notes 5.00%, 1/15/28 | 30,000 | 31,667 |
| Total Capital International SA company | | |
| guaranty sr. unsec. unsub. notes 2.75%, 6/19/21 | | |
| (France) | 115,000 | 116,341 |
| Transcanada Trust company guaranty jr. unsec. | | |
| sub. FRB 5.30%, 3/15/77 (Canada) | 10,000 | 10,600 |
| Transocean Pontus, Ltd. 144A company | | |
| guaranty sr. notes 6.125%, 8/1/25 | | |
| (Cayman Islands) | 3,900 | 3,666 |
| Transocean Poseidon, Ltd. 144A company | | |
| guaranty sr. notes 6.875%, 2/1/27 | 10,000 | 9,100 |
| USA Compression Partners LP/USA Compression | | |
| Finance Corp. company guaranty sr. unsec. | | |
| notes 6.875%, 4/1/26 | 10,000 | 10,450 |
| USA Compression Partners LP/USA Compression | | |
| Finance Corp. company guaranty sr. unsec. | | |
| unsub. notes 6.875%, 9/1/27 | 5,000 | 5,338 |
| Viper Energy Partners LP 144A company | | |
| guaranty sr. unsec. notes 5.375%, 11/1/27 | 5,000 | 5,225 |
| WPX Energy, Inc. sr. unsec. notes 8.25%, 8/1/23 | 10,000 | 11,381 |
| WPX Energy, Inc. sr. unsec. notes 4.50%, 1/15/30 | 5,000 | 5,300 |
| | |
| CORPORATE BONDS | | |
| AND NOTES (15.8%)* cont. | Principal amount | Value |
| Energy cont. | | |
| WPX Energy, Inc. sr. unsec. sub. notes | | |
| 5.875%, 6/15/28 | $10,000 | $10,900 |
| WPX Energy, Inc. sr. unsec. sub. notes | | |
| 5.25%, 10/15/27 | 40,000 | 42,385 |
| | | 1,816,549 |
| Financials (4.0%) | | |
| AG Issuer, LLC 144A sr. notes 6.25%, 3/1/28 | 10,000 | 10,113 |
| Air Lease Corp. sr. unsec. notes 2.50%, 3/1/21 | 50,000 | 50,152 |
| Air Lease Corp. sr. unsec. sub. bonds 4.625%, 10/1/28 | 23,000 | 26,421 |
| Air Lease Corp. sr. unsec. sub. notes 3.25%, 10/1/29 | 35,000 | 36,990 |
| Alliant Holdings Intermediate, LLC/Alliant | | |
| Holdings Co-Issuer 144A sr. unsec. notes | | |
| 6.75%, 10/15/27 | 10,000 | 10,700 |
| Ally Financial, Inc. company guaranty sr. unsec. | | |
| notes 8.00%, 11/1/31 | 29,000 | 42,568 |
| American Express Co. sr. unsec. notes | | |
| 2.65%, 12/2/22 | 96,000 | 100,209 |
| American International Group, Inc. jr. unsec. | | |
| sub. FRB 8.175%, 5/15/58 | 3,000 | 4,395 |
| Ares Capital Corp. sr. unsec. sub. notes | | |
| 3.875%, 1/15/26 | 25,000 | 27,090 |
| Bank of America Corp. jr. unsec. sub. FRN | | |
| Ser. AA, 6.10%, perpetual maturity | 74,000 | 83,805 |
| Bank of America Corp. jr. unsec. sub. FRN Ser. Z, | | |
| 6.50%, perpetual maturity | 5,000 | 5,713 |
| Bank of America Corp. sr. unsec. FRN Ser. MTN, | | |
| 2.496%, 2/13/31 | 5,000 | 5,310 |
| Bank of America Corp. sr. unsec. notes Ser. MTN, | | |
| 3.499%, 5/17/22 | 78,000 | 78,924 |
| Bank of America Corp. unsec. sub. notes 6.11%, | | |
| 1/29/37 | 195,000 | 283,518 |
| Bank of Montreal sr. unsec. unsub. notes Ser. D, | | |
| 3.10%, 4/13/21 (Canada) | 108,000 | 108,870 |
| Bank of Montreal unsec. sub. FRN 3.803%, 12/15/32 | | |
| (Canada) | 1,000 | 1,133 |
| Bank of Nova Scotia (The) sr. unsec. notes 2.00%, | | |
| 11/15/22 (Canada) | 78,000 | 80,549 |
| Berkshire Hathaway Finance Corp. company | | |
| guaranty sr. unsec. bonds 2.85%, 10/15/50 | 10,000 | 10,710 |
| Berkshire Hathaway Finance Corp. company | | |
| guaranty sr. unsec. notes 4.30%, 5/15/43 | 29,000 | 38,261 |
| Berkshire Hathaway Finance Corp. company | | |
| guaranty sr. unsec. unsub. notes 4.25%, 1/15/21 | 94,000 | 94,105 |
| Blackstone Holdings Finance Co., LLC 144A company | | |
| guaranty sr. unsec. unsub. bonds 1.60%, 3/30/31 | 10,000 | 9,944 |
| Camden Property Trust sr. unsec. | | |
| unsub. notes 4.875%, 6/15/23 R | 65,000 | 70,833 |
| Cantor Fitzgerald LP 144A unsec. notes | | |
| 6.50%, 6/17/22 | 14,000 | 15,127 |
| CIT Group, Inc. sr. unsec. sub. notes 5.00%, 8/1/23 | 10,000 | 10,913 |
| CIT Group, Inc. sr. unsec. unsub. notes 5.25%, 3/7/25 | 28,000 | 31,780 |
| CIT Group, Inc. sr. unsec. unsub. notes 5.00%, 8/15/22 | 2,000 | 2,120 |
| Citigroup, Inc. sr. unsec. FRB 3.668%, 7/24/28 | 204,000 | 231,680 |
| Citigroup, Inc. sr. unsec. unsub. FRB 3.887%, 1/10/28 | 50,000 | 57,304 |
| Citigroup, Inc. unsec. sub. bonds 4.75%, 5/18/46 | 10,000 | 13,360 |
| Citigroup, Inc. unsec. sub. bonds 4.45%, 9/29/27 | 50,000 | 59,107 |
| CNO Financial Group, Inc. sr. unsec. notes | | |
| 5.25%, 5/30/29 | 10,000 | 12,072 |
| CNO Financial Group, Inc. sr. unsec. | | |
| unsub. notes 5.25%, 5/30/25 | 10,000 | 11,608 |
| |
| Putnam VT Global Asset Allocation Fund | 17 |
| | |
| CORPORATE BONDS | | |
| AND NOTES (15.8%)* cont. | Principal amount | Value |
| Financials cont. | | |
| Commonwealth Bank of Australia 144A sr. unsec. | | |
| notes 3.15%, 9/19/27 (Australia) | $75,000 | $84,344 |
| Digital Realty Trust LP company | | |
| guaranty sr. unsec. bonds 4.45%, 7/15/28 R | 25,000 | 30,058 |
| Digital Realty Trust LP company | | |
| guaranty sr. unsec. notes 4.75%, 10/1/25 R | 60,000 | 70,238 |
| Diversified Healthcare Trust company | | |
| guaranty sr. unsec. notes 9.75%, 6/15/25 R | 20,000 | 22,713 |
| Empire Communities Corp. 144A sr. unsec. | | |
| notes 7.00%, 12/15/25 (Canada) | 5,000 | 5,250 |
| ESH Hospitality, Inc. 144A company | | |
| guaranty sr. unsec. notes 5.25%, 5/1/25 R | 10,000 | 10,250 |
| Fairfax Financial Holdings, Ltd. sr. unsec. | | |
| notes 4.85%, 4/17/28 (Canada) | 32,000 | 35,815 |
| Fairfax US, Inc. 144A company guaranty sr. unsec. | | |
| notes 4.875%, 8/13/24 | 30,000 | 32,913 |
| Fifth Third Bancorp jr. unsec. sub. FRB 5.10%, | | |
| perpetual maturity | 11,000 | 11,161 |
| Five Corners Funding Trust 144A sr. unsec. | | |
| bonds 4.419%, 11/15/23 | 135,000 | 149,671 |
| Freedom Mortgage Corp. 144A sr. unsec. | | |
| notes 8.25%, 4/15/25 | 15,000 | 15,675 |
| Freedom Mortgage Corp. 144A sr. unsec. | | |
| notes 8.125%, 11/15/24 | 5,000 | 5,216 |
| GLP Capital LP/GLP Financing II, Inc. company | | |
| guaranty sr. unsec. notes 5.25%, 6/1/25 | 10,000 | 11,251 |
| GLP Capital LP/GLP Financing II, Inc. company | | |
| guaranty sr. unsec. unsub. notes 5.375%, 4/15/26 | 20,000 | 22,953 |
| goeasy, Ltd. 144A company guaranty sr. unsec. | | |
| notes 5.375%, 12/1/24 (Canada) | 10,000 | 10,400 |
| Goldman Sachs Group, Inc. (The) sr. unsec. FRB | | |
| 4.223%, 5/1/29 | 87,000 | 103,214 |
| Goldman Sachs Group, Inc. (The) sr. unsec. | | |
| unsub. notes 2.60%, 2/7/30 | 20,000 | 21,388 |
| Goldman Sachs Group, Inc. (The) unsec. | | |
| sub. notes 6.75%, 10/1/37 | 24,000 | 36,393 |
| HUB International, Ltd. 144A sr. unsec. | | |
| notes 7.00%, 5/1/26 | 20,000 | 20,916 |
| Huntington Bancshares, Inc. unsec. notes | | |
| 4.35%, 2/4/23 | 40,000 | 42,888 |
| Icahn Enterprises LP/Icahn Enterprises | | |
| Finance Corp. company guaranty sr. unsec. | | |
| notes 6.75%, 2/1/24 | 10,000 | 10,170 |
| Icahn Enterprises LP/Icahn Enterprises | | |
| Finance Corp. company guaranty sr. unsec. | | |
| notes 6.25%, 5/15/26 | 10,000 | 10,589 |
| Icahn Enterprises LP/Icahn Enterprises | | |
| Finance Corp. company guaranty sr. unsec. | | |
| notes 5.25%, 5/15/27 | 5,000 | 5,360 |
| Icahn Enterprises LP/Icahn Enterprises | | |
| Finance Corp. company guaranty sr. unsec. | | |
| notes 4.75%, 9/15/24 | 5,000 | 5,194 |
| Intercontinental Exchange, Inc. sr. unsec. | | |
| bonds 2.65%, 9/15/40 | 48,000 | 49,264 |
| Intercontinental Exchange, Inc. sr. unsec. | | |
| bonds 1.85%, 9/15/32 | 18,000 | 18,155 |
| International Lease Finance Corp. sr. unsec. | | |
| unsub. notes 5.875%, 8/15/22 | 14,000 | 15,084 |
| iStar, Inc. sr. unsec. notes 5.50%, 2/15/26 R | 10,000 | 10,200 |
| iStar, Inc. sr. unsec. notes 4.75%, 10/1/24 R | 15,000 | 15,188 |
| iStar, Inc. sr. unsec. notes 4.25%, 8/1/25 R | 15,000 | 14,813 |
| | |
| CORPORATE BONDS | | |
| AND NOTES (15.8%)* cont. | Principal amount | Value |
| Financials cont. | | |
| JPMorgan Chase & Co. jr. unsec. bonds 6.10%, | | |
| perpetual maturity | $17,000 | $18,645 |
| JPMorgan Chase & Co. jr. unsec. sub. FRB Ser. HH, | | |
| 4.60%, perpetual maturity | 157,000 | 162,103 |
| JPMorgan Chase & Co. jr. unsec. sub. FRB Ser. W, | | |
| (BBA LIBOR USD 3 Month + 1.00%), 1.221%, 5/15/47 | 13,000 | 10,660 |
| JPMorgan Chase & Co. sr. unsec. unsub. FRB | | |
| 3.964%, 11/15/48 | 300,000 | 377,559 |
| JPMorgan Chase & Co. unsec. sub. FRB | | |
| 2.956%, 5/13/31 | 6,000 | 6,580 |
| JPMorgan Chase & Co. unsec. sub. notes | | |
| 3.375%, 5/1/23 | 165,000 | 176,352 |
| KKR Group Finance Co. III, LLC 144A company | | |
| guaranty sr. unsec. unsub. bonds 5.125%, 6/1/44 | 30,000 | 39,379 |
| Ladder Capital Finance Holdings, LLLP/Ladder | | |
| Capital Finance Corp. 144A company | | |
| guaranty sr. unsec. unsub. notes 5.25%, 10/1/25 R | 30,000 | 29,926 |
| Ladder Capital Finance Holdings, LLLP/Ladder | | |
| Capital Finance Corp. 144A sr. unsec. | | |
| notes 4.25%, 2/1/27 R | 10,000 | 9,788 |
| LPL Holdings, Inc. 144A company | | |
| guaranty sr. unsec. notes 5.75%, 9/15/25 | 20,000 | 20,688 |
| Marsh & McLennan Cos., Inc. sr. unsec. | | |
| sub. notes 4.375%, 3/15/29 | 22,000 | 26,786 |
| Morgan Stanley sr. unsec. unsub. notes | | |
| 4.375%, 1/22/47 | 40,000 | 54,454 |
| Morgan Stanley sr. unsec. unsub. notes | | |
| 3.625%, 1/20/27 | 185,000 | 211,865 |
| Morgan Stanley sr. unsec. unsub. notes Ser. GMTN, | | |
| 3.125%, 1/23/23 | 183,000 | 193,133 |
| Nationstar Mortgage Holdings, Inc. 144A company | | |
| guaranty sr. unsec. notes 6.00%, 1/15/27 | 10,000 | 10,613 |
| Nationstar Mortgage Holdings, Inc. 144A company | | |
| guaranty sr. unsec. notes 5.50%, 8/15/28 | 10,000 | 10,500 |
| Nationstar Mortgage Holdings, Inc. 144A company | | |
| guaranty sr. unsec. notes 5.125%, 12/15/30 | 5,000 | 5,226 |
| Neuberger Berman Group, LLC/Neuberger Berman | | |
| Finance Corp. 144A sr. unsec. notes 4.875%, 4/15/45 | 30,000 | 34,019 |
| OneMain Finance Corp. company guaranty sr. unsec. | | |
| notes 4.00%, 9/15/30 | 5,000 | 5,188 |
| PennyMac Financial Services, Inc. 144A company | | |
| guaranty sr. unsec. notes 5.375%, 10/15/25 | 10,000 | 10,575 |
| Prologis LP sr. unsec. unsub. notes 2.25%, 4/15/30 R | 10,000 | 10,716 |
| Prologis LP sr. unsec. unsub. notes 2.125%, 4/15/27 R | 4,000 | 4,292 |
| Provident Funding Associates LP/PFG Finance Corp. | | |
| 144A sr. unsec. notes 6.375%, 6/15/25 | 15,000 | 15,375 |
| Prudential Financial, Inc. jr. unsec. sub. FRN | | |
| 5.625%, 6/15/43 | 11,000 | 11,784 |
| Prudential Financial, Inc. jr. unsec. sub. FRN | | |
| 5.20%, 3/15/44 | 26,000 | 28,015 |
| Royal Bank of Canada sr. unsec. | | |
| unsub. notes Ser. GMTN, 2.80%, 4/29/22 (Canada) | 78,000 | 80,442 |
| Royal Bank of Canada unsec. sub. notes Ser. GMTN, | | |
| 4.65%, 1/27/26 (Canada) | 45,000 | 53,124 |
| Service Properties Trust company | | |
| guaranty sr. unsec. unsub. notes 7.50%, 9/15/25 R | 5,000 | 5,762 |
| Springleaf Finance Corp. company | | |
| guaranty sr. unsec. notes 8.875%, 6/1/25 | 5,000 | 5,656 |
| Springleaf Finance Corp. company | | |
| guaranty sr. unsec. sub. notes 7.125%, 3/15/26 | 35,000 | 41,388 |
| |
| 18 | Putnam VT Global Asset Allocation Fund |
| | |
| CORPORATE BONDS | | |
| AND NOTES (15.8%)* cont. | Principal amount | Value |
| Financials cont. | | |
| Springleaf Finance Corp. company | | |
| guaranty sr. unsec. sub. notes 6.625%, 1/15/28 | $5,000 | $5,938 |
| Springleaf Finance Corp. company | | |
| guaranty sr. unsec. unsub. notes 6.875%, 3/15/25 | 10,000 | 11,613 |
| Springleaf Finance Corp. company | | |
| guaranty sr. unsec. unsub. notes 5.375%, 11/15/29 | 15,000 | 16,875 |
| Starwood Property Trust, Inc. sr. unsec. | | |
| notes 4.75%, 3/15/25 R | 15,000 | 15,375 |
| Swiss Re Treasury US Corp. 144A company | | |
| guaranty sr. unsec. notes 4.25%, 12/6/42 | 90,000 | 113,353 |
| Toronto-Dominion Bank (The) sr. unsec. | | |
| unsub. notes Ser. MTN, 1.90%, 12/1/22 (Canada) | 78,000 | 80,440 |
| Toronto-Dominion Bank (The) unsec. sub. FRB | | |
| 3.625%, 9/15/31 (Canada) | 62,000 | 70,265 |
| Truist Financial Corp. jr. unsec. sub. FRB | | |
| Ser. N, 4.80%, 12/31/99 | 16,000 | 16,900 |
| UBS Group AG 144A sr. unsec. notes 3.491%, | | |
| 5/23/23 (Switzerland) | 400,000 | 417,000 |
| USIS Merger Sub, Inc. 144A sr. unsec. | | |
| notes 6.875%, 5/1/25 | 20,000 | 20,500 |
| Wells Fargo & Co. jr. unsec. sub. FRB Ser. U, | | |
| 5.875%, perpetual maturity | 9,000 | 10,136 |
| Westpac Banking Corp. unsec. sub. bonds 4.421%, | | |
| 7/24/39 (Australia) | 3,000 | 3,830 |
| Westpac Banking Corp. unsec. sub. bonds 2.963%, | | |
| 11/16/40 (Australia) | 41,000 | 43,660 |
| Willis Towers Watson PLC company | | |
| guaranty sr. unsec. unsub. notes 5.75%, 3/15/21 | 55,000 | 55,554 |
| | | 5,074,140 |
| Health care (1.2%) | | |
| AbbVie, Inc. sr. unsec. notes 3.20%, 11/21/29 | 167,000 | 187,156 |
| AbbVie, Inc. sr. unsec. sub. notes 3.80%, 3/15/25 | | |
| (acquired 5/12/20, cost $16,104) ∆∆ | 15,000 | 16,728 |
| Air Methods Corp. 144A sr. unsec. notes | | |
| 8.00%, 5/15/25 | 15,000 | 12,675 |
| Bausch Health Americas, Inc. 144A sr. unsec. | | |
| notes 8.50%, 1/31/27 | 15,000 | 16,688 |
| Bausch Health Cos., Inc. 144A company | | |
| guaranty sr. notes 5.50%, 11/1/25 | 10,000 | 10,363 |
| Bausch Health Cos., Inc. 144A company | | |
| guaranty sr. unsec. notes 7.25%, 5/30/29 | 10,000 | 11,241 |
| Bausch Health Cos., Inc. 144A company | | |
| guaranty sr. unsec. notes 7.00%, 1/15/28 | 5,000 | 5,496 |
| Bausch Health Cos., Inc. 144A company | | |
| guaranty sr. unsec. notes 6.25%, 2/15/29 | 10,000 | 10,863 |
| Bausch Health Cos., Inc. 144A company | | |
| guaranty sr. unsec. notes 6.125%, 4/15/25 | 40,000 | 41,226 |
| Bausch Health Cos., Inc. 144A company | | |
| guaranty sr. unsub. notes 7.00%, 3/15/24 | 15,000 | 15,431 |
| Becton Dickinson and Co. sr. unsec. notes | | |
| 2.823%, 5/20/30 | 7,000 | 7,694 |
| Bristol-Myers Squibb Co. sr. unsec. notes | | |
| 3.25%, 2/20/23 | 70,000 | 73,639 |
| Bristol-Myers Squibb Co. sr. unsec. notes | | |
| 2.90%, 7/26/24 | 81,000 | 87,906 |
| Bristol-Myers Squibb Co. sr. unsec. notes | | |
| 1.45%, 11/13/30 | 20,000 | 20,099 |
| Bristol-Myers Squibb Co. sr. unsec. | | |
| sub. notes 3.40%, 7/26/29 | 19,000 | 22,119 |
| Centene Corp. sr. unsec. bonds 3.00%, 10/15/30 | 5,000 | 5,300 |
| Centene Corp. sr. unsec. notes 4.625%, 12/15/29 | 25,000 | 27,750 |
| | |
| CORPORATE BONDS | | |
| AND NOTES (15.8%)* cont. | Principal amount | Value |
| Health care cont. | | |
| Centene Corp. 144A sr. unsec. notes | | |
| 5.375%, 8/15/26 | $10,000 | $10,563 |
| Centene Escrow I Corp. 144A sr. unsec. | | |
| notes 5.375%, 6/1/26 | 5,000 | 5,274 |
| CHS/Community Health Systems, Inc. 144A company | | |
| guaranty sr. notes 8.00%, 3/15/26 | 5,000 | 5,388 |
| CHS/Community Health Systems, Inc. 144A company | | |
| guaranty sr. notes 5.625%, 3/15/27 | 5,000 | 5,394 |
| CHS/Community Health Systems, Inc. 144A company | | |
| guaranty sub. notes 9.875%, 6/30/23 | 5,000 | 5,256 |
| CHS/Community Health Systems, Inc. 144A company | | |
| guaranty sub. notes 8.125%, 6/30/24 | 13,000 | 13,488 |
| CHS/Community Health Systems, Inc. 144A | | |
| sr. notes 6.625%, 2/15/25 | 10,000 | 10,525 |
| Cigna Corp. company guaranty sr. unsec. | | |
| unsub. notes 3.75%, 7/15/23 | 50,000 | 54,054 |
| CVS Health Corp. sr. unsec. unsub. notes | | |
| 4.78%, 3/25/38 | 99,000 | 125,431 |
| CVS Health Corp. sr. unsec. unsub. notes | | |
| 3.70%, 3/9/23 | 6,000 | 6,419 |
| CVS Pass-Through Trust 144A sr. mtge. | | |
| notes 4.704%, 1/10/36 | 39,397 | 44,697 |
| DH Europe Finance II Sarl company | | |
| guaranty sr. unsec. bonds 3.40%, 11/15/49 | | |
| (Luxembourg) | 15,000 | 17,757 |
| Elanco Animal Health, Inc. sr. unsec. | | |
| notes Ser. WI, 5.90%, 8/28/28 | 10,000 | 11,800 |
| Emergent BioSolutions, Inc. 144A company | | |
| guaranty sr. unsec. notes 3.875%, 8/15/28 | 5,000 | 5,178 |
| Global Medical Response, Inc. 144A | | |
| sr. notes 6.50%, 10/1/25 | 5,000 | 5,225 |
| HCA, Inc. company guaranty sr. bonds 5.25%, 6/15/26 | 15,000 | 17,753 |
| HCA, Inc. company guaranty sr. notes 4.125%, 6/15/29 | 5,000 | 5,800 |
| HCA, Inc. company guaranty sr. sub. bonds | | |
| 5.50%, 6/15/47 | 20,000 | 26,714 |
| HCA, Inc. company guaranty sr. unsec. | | |
| notes 5.375%, 9/1/26 | 25,000 | 28,735 |
| HCA, Inc. company guaranty sr. unsec. | | |
| notes 3.50%, 9/1/30 | 5,000 | 5,313 |
| Jaguar Holding Co. II/PPD Development LP 144A | | |
| company guaranty sr. unsec. notes 5.00%, 6/15/28 | 5,000 | 5,338 |
| Mallinckrodt International Finance | | |
| SA/Mallinckrodt CB, LLC 144A company | | |
| guaranty sub. notes 10.00%, 4/15/25 (Luxembourg) | 4,000 | 3,510 |
| Merck & Co., Inc. sr. unsec. notes 2.90%, 3/7/24 | 1,000 | 1,078 |
| Merck & Co., Inc. sr. unsec. unsub. notes | | |
| 3.70%, 2/10/45 | 50,000 | 62,310 |
| Merck & Co., Inc. sr. unsec. unsub. notes | | |
| 2.75%, 2/10/25 | 8,000 | 8,691 |
| Novartis Capital Corp. company | | |
| guaranty sr. unsec. unsub. bonds 4.00%, 11/20/45 | 80,000 | 104,798 |
| Ortho-Clinical Diagnostics, Inc./Ortho-Clinical | | |
| Diagnostics SA 144A sr. unsec. notes 7.375%, 6/1/25 | 5,000 | 5,325 |
| Pfizer, Inc. sr. unsec. unsub. notes 3.00%, 12/15/26 | 40,000 | 45,173 |
| Service Corp. International sr. unsec. | | |
| bonds 5.125%, 6/1/29 | 15,000 | 16,613 |
| Service Corp. International sr. unsec. | | |
| notes 4.625%, 12/15/27 | 11,000 | 11,715 |
| Service Corp. International sr. unsec. | | |
| notes 3.375%, 8/15/30 | 5,000 | 5,201 |
| |
| Putnam VT Global Asset Allocation Fund | 19 |
| | |
| CORPORATE BONDS | | |
| AND NOTES (15.8%)* cont. | Principal amount | Value |
| Health care cont. | | |
| Tenet Healthcare Corp. company | | |
| guaranty sr. notes 4.625%, 7/15/24 | $5,000 | $5,125 |
| Tenet Healthcare Corp. 144A company | | |
| guaranty notes 6.25%, 2/1/27 | 5,000 | 5,300 |
| Tenet Healthcare Corp. 144A company | | |
| guaranty sr. notes 7.50%, 4/1/25 | 5,000 | 5,463 |
| Tenet Healthcare Corp. 144A company | | |
| guaranty sr. notes 5.125%, 11/1/27 | 20,000 | 21,175 |
| Tenet Healthcare Corp. 144A company | | |
| guaranty sr. notes 4.875%, 1/1/26 | 35,000 | 36,614 |
| UnitedHealth Group, Inc. sr. unsec. | | |
| unsub. notes 2.75%, 2/15/23 | 90,000 | 94,163 |
| UnitedHealth Group, Inc. sr. unsec. | | |
| unsub. notes 2.00%, 5/15/30 | 25,000 | 26,517 |
| Viatris, Inc. 144A company guaranty sr. unsec. | | |
| notes 2.30%, 6/22/27 | 28,000 | 29,810 |
| Zoetis, Inc. sr. unsec. notes 3.90%, 8/20/28 | 35,000 | 41,234 |
| Zoetis, Inc. sr. unsec. sub. notes 2.00%, 5/15/30 | 18,000 | 18,638 |
| | | 1,536,929 |
| Technology (1.5%) | | |
| Alphabet, Inc. sr. unsec. bonds 2.25%, 8/15/60 | 30,000 | 29,009 |
| Alphabet, Inc. sr. unsec. notes 3.625%, 5/19/21 | 29,000 | 29,375 |
| Alphabet, Inc. sr. unsec. notes 1.998%, 8/15/26 | 35,000 | 37,528 |
| Analog Devices, Inc. sr. unsec. | | |
| unsub. notes 3.90%, 12/15/25 | 25,000 | 28,512 |
| Apple, Inc. sr. unsec. notes 3.45%, 5/6/24 | 40,000 | 44,032 |
| Apple, Inc. sr. unsec. notes 2.85%, 5/11/24 | 25,000 | 26,956 |
| Apple, Inc. sr. unsec. unsub. notes 4.375%, 5/13/45 | 80,000 | 109,637 |
| Apple, Inc. sr. unsec. unsub. notes 3.85%, 5/4/43 | 27,000 | 34,286 |
| Arches Buyer, Inc. 144A sr. notes 4.25%, 6/1/28 | 5,000 | 5,064 |
| Banff Merger Sub, Inc. 144A sr. unsec. | | |
| notes 9.75%, 9/1/26 | 10,000 | 10,802 |
| Black Knight InfoServ, LLC 144A company | | |
| guaranty sr. unsec. notes 3.625%, 9/1/28 | 5,000 | 5,119 |
| Boxer Parent Co., Inc. 144A company | | |
| guaranty sr. notes 7.125%, 10/2/25 | 5,000 | 5,427 |
| Boxer Parent Co., Inc. 144A notes 9.125%, 3/1/26 | 10,000 | 10,750 |
| Broadcom Corp./Broadcom Cayman Finance, Ltd. | | |
| company guaranty sr. unsec. unsub. notes | | |
| 3.50%, 1/15/28 | 90,000 | 99,199 |
| Broadcom, Inc. company guaranty sr. unsec. | | |
| bonds 4.15%, 11/15/30 | 71,000 | 82,201 |
| BY Crown Parent LLC/BY Bond Finance, Inc. 144A | | |
| company guaranty sr. notes 4.25%, 1/31/26 | 5,000 | 5,125 |
| Cisco Systems, Inc. sr. unsec. | | |
| unsub. bonds 5.90%, 2/15/39 | 5,000 | 7,710 |
| Cisco Systems, Inc. sr. unsec. | | |
| unsub. notes 2.50%, 9/20/26 | 35,000 | 38,461 |
| Cisco Systems, Inc. sr. unsec. | | |
| unsub. notes 2.20%, 2/28/21 | 75,000 | 75,233 |
| CommScope Finance, LLC 144A sr. notes | | |
| 6.00%, 3/1/26 | 5,000 | 5,268 |
| CommScope Finance, LLC 144A sr. notes | | |
| 5.50%, 3/1/24 | 5,000 | 5,155 |
| CommScope, Inc. 144A company guaranty sr. unsec. | | |
| notes 8.25%, 3/1/27 | 5,000 | 5,338 |
| Dell International, LLC/EMC Corp. 144A company | | |
| guaranty sr. notes 5.85%, 7/15/25 | 5,000 | 6,004 |
| Diamond 1 Finance Corp./Diamond 2 Finance Corp. | | |
| 144A company guaranty sr. notes 6.02%, 6/15/26 | 17,000 | 20,739 |
| | |
| CORPORATE BONDS | | |
| AND NOTES (15.8%)* cont. | Principal amount | Value |
| Technology cont. | | |
| Diamond 1 Finance Corp./Diamond 2 Finance Corp. | | |
| 144A company guaranty sr. unsec. notes 7.125%, | | |
| 6/15/24 | $10,000 | $10,371 |
| Diamond 1 Finance Corp./Diamond 2 Finance Corp. | | |
| 144A sr. bonds 8.35%, 7/15/46 | 7,000 | 10,590 |
| Diebold Nixdorf, Inc. company guaranty sr. unsec. | | |
| sub. notes 8.50%, 4/15/24 | 5,000 | 5,063 |
| Diebold Nixdorf, Inc. 144A company | | |
| guaranty sr. notes 9.375%, 7/15/25 | 5,000 | 5,600 |
| Dun & Bradstreet Corp. (The) 144A | | |
| sr. notes 6.875%, 8/15/26 | 3,000 | 3,225 |
| Fidelity National Information Services, Inc. | | |
| sr. unsec. notes 3.75%, 5/21/29 | 40,000 | 46,960 |
| Fidelity National Information Services, Inc. | | |
| sr. unsec. notes 3.00%, 8/15/26 | 11,000 | 12,240 |
| Fidelity National Information Services, Inc. | | |
| sr. unsec. sub. notes Ser. 10Y, 4.25%, 5/15/28 | 18,000 | 21,425 |
| Fiserv, Inc. sr. unsec. bonds 3.50%, 7/1/29 | 15,000 | 17,128 |
| Fiserv, Inc. sr. unsec. sub. bonds 4.20%, 10/1/28 | 55,000 | 65,576 |
| IBM Corp. sr. unsec. unsub. notes 1.875%, 8/1/22 | 140,000 | 143,624 |
| Microchip Technology, Inc. company | | |
| guaranty sr. notes 4.333%, 6/1/23 | 31,000 | 33,558 |
| Microchip Technology, Inc. 144A company | | |
| guaranty sr. unsec. notes 4.25%, 9/1/25 | 10,000 | 10,579 |
| Microsoft Corp. sr. unsec. unsub. bonds | | |
| 2.525%, 6/1/50 | 25,000 | 26,364 |
| Microsoft Corp. sr. unsec. unsub. notes | | |
| 1.55%, 8/8/21 | 160,000 | 161,101 |
| Oracle Corp. sr. unsec. unsub. bonds 4.00%, 11/15/47 | 35,000 | 43,221 |
| Oracle Corp. sr. unsec. unsub. notes 5.375%, 7/15/40 | 35,000 | 50,234 |
| Oracle Corp. sr. unsec. unsub. notes 3.625%, 7/15/23 | 144,000 | 156,091 |
| Oracle Corp. sr. unsec. unsub. notes 2.65%, 7/15/26 | 10,000 | 10,989 |
| Oracle Corp. sr. unsec. unsub. notes 2.50%, 10/15/22 | 80,000 | 83,153 |
| Plantronics, Inc. 144A company | | |
| guaranty sr. unsec. notes 5.50%, 5/31/23 | 25,000 | 25,063 |
| Qorvo, Inc. 144A company guaranty sr. unsec. | | |
| bonds 3.375%, 4/1/31 | 5,000 | 5,163 |
| Salesforce.com, Inc. sr. unsec. | | |
| unsub. notes 3.70%, 4/11/28 | 101,000 | 119,172 |
| ServiceNow, Inc. sr. unsec. notes 1.40%, 9/1/30 | 30,000 | 29,266 |
| Solera, LLC/Solera Finance, Inc. 144A | | |
| sr. unsec. notes 10.50%, 3/1/24 | 15,000 | 15,544 |
| SS&C Technologies, Inc. 144A company | | |
| guaranty sr. unsec. notes 5.50%, 9/30/27 | 5,000 | 5,344 |
| Tempo Acquisition, LLC/Tempo Acquisition | | |
| Finance Corp. 144A company | | |
| guaranty sr. notes 5.75%, 6/1/25 | 5,000 | 5,313 |
| Tempo Acquisition, LLC/Tempo Acquisition | | |
| Finance Corp. 144A sr. unsec. notes 6.75%, 6/1/25 | 30,000 | 31,007 |
| TTM Technologies, Inc. 144A company | | |
| guaranty sr. unsec. notes 5.625%, 10/1/25 | 20,000 | 20,475 |
| Western Digital Corp. company guaranty sr. unsec. | | |
| notes 4.75%, 2/15/26 | 5,000 | 5,525 |
| | | 1,905,894 |
| Transportation (0.1%) | | |
| CSX Corp. sr. unsec. unsub. notes 4.10%, 3/15/44 | 70,000 | 87,381 |
| Delta Air Lines Inc/SkyMiles IP, Ltd. 144A | | |
| company guaranty sr. notes 4.75%, 10/20/28 | 15,000 | 16,373 |
| FedEx Corp. company guaranty sr. unsec. | | |
| unsub. notes 2.625%, 8/1/22 | 12,000 | 12,431 |
| |
| 20 | Putnam VT Global Asset Allocation Fund |
| | |
| CORPORATE BONDS | | |
| AND NOTES (15.8%)* cont. | Principal amount | Value |
| Transportation cont. | | |
| Penske Truck Leasing Co. LP/PTL Finance Corp. | | |
| 144A sr. unsec. bonds 3.40%, 11/15/26 | $16,000 | $17,791 |
| Penske Truck Leasing Co. LP/PTL Finance Corp. | | |
| 144A sr. unsec. notes 3.90%, 2/1/24 | 20,000 | 21,795 |
| Watco Cos LLC/Watco Finance Corp. 144A sr. unsec. | | |
| notes 6.50%, 6/15/27 | 25,000 | 27,063 |
| | | 182,834 |
| Utilities and power (1.1%) | | |
| AES Corp. (The) 144A sr. unsec. bonds 2.45%, 1/15/31 | 50,000 | 50,674 |
| AES Corp. (The) 144A sr. unsec. notes 3.30%, 7/15/25 | 5,000 | 5,450 |
| American Electric Power Co., Inc. sr. unsec. | | |
| unsub. notes Ser. J, 4.30%, 12/1/28 | 55,000 | 65,735 |
| Buckeye Partners LP sr. unsec. notes 3.95%, 12/1/26 | 5,000 | 5,065 |
| Buckeye Partners LP 144A sr. unsec. notes | | |
| 4.50%, 3/1/28 | 5,000 | 5,150 |
| Calpine Corp. 144A company | | |
| guaranty sr. notes 5.25%, 6/1/26 | 7,000 | 7,242 |
| Calpine Corp. 144A company | | |
| guaranty sr. notes 4.50%, 2/15/28 | 35,000 | 36,400 |
| Colorado Interstate Gas Co., LLC company | | |
| guaranty sr. unsec. notes 6.85%, 6/15/37 | 8,000 | 9,858 |
| Commonwealth Edison Co. 1st mtge. bonds | | |
| 5.90%, 3/15/36 | 28,000 | 40,430 |
| Consolidated Edison Co. of New York, Inc. | | |
| sr. unsec. unsub. notes 4.20%, 3/15/42 | 45,000 | 54,573 |
| Duke Energy Corp. sr. unsec. bonds 4.20%, 6/15/49 | 70,000 | 88,646 |
| Duke Energy Corp. sr. unsec. notes 3.15%, 8/15/27 | 55,000 | 61,378 |
| Duke Energy Indiana LLC sr. bonds 6.45%, 4/1/39 | 5,000 | 7,769 |
| Enbridge, Inc. company guaranty sr. unsec. | | |
| unsub. bonds 4.50%, 6/10/44 (Canada) | 15,000 | 17,535 |
| Enbridge, Inc. sr. unsec. unsub. bonds 4.25%, | | |
| 12/1/26 (Canada) | 30,000 | 34,925 |
| Enterprise Products Operating, LLC company | | |
| guaranty sr. unsec. notes 2.80%, 1/31/30 | 4,000 | 4,335 |
| Enterprise Products Operating, LLC company | | |
| guaranty sr. unsec. unsub. bonds 4.25%, 2/15/48 | 90,000 | 104,952 |
| IPALCO Enterprises, Inc. sr. sub. notes 3.70%, 9/1/24 | 5,000 | 5,450 |
| Kinder Morgan Energy Partners LP company | | |
| guaranty sr. unsec. notes 5.40%, 9/1/44 | 12,000 | 14,689 |
| Kinder Morgan Energy Partners LP company | | |
| guaranty sr. unsec. notes 3.50%, 3/1/21 | 80,000 | 80,007 |
| Kinder Morgan Energy Partners LP company | | |
| guaranty sr. unsec. unsub. notes 3.45%, 2/15/23 | 25,000 | 26,311 |
| Kinder Morgan, Inc. company guaranty sr. unsec. | | |
| unsub. notes 3.15%, 1/15/23 | 105,000 | 110,430 |
| Kinder Morgan, Inc./DE company | | |
| guaranty sr. unsec. notes Ser. GMTN, 7.75%, 1/15/32 | 17,000 | 24,577 |
| NRG Energy, Inc. company guaranty sr. unsec. | | |
| notes 7.25%, 5/15/26 | 10,000 | 10,600 |
| NRG Energy, Inc. company guaranty sr. unsec. | | |
| notes 6.625%, 1/15/27 | 5,000 | 5,280 |
| NRG Energy, Inc. company guaranty sr. unsec. | | |
| notes 5.75%, 1/15/28 | 5,000 | 5,463 |
| NRG Energy, Inc. 144A company | | |
| guaranty sr. bonds 4.45%, 6/15/29 | 28,000 | 32,470 |
| NRG Energy, Inc. 144A company | | |
| guaranty sr. notes 3.75%, 6/15/24 | 21,000 | 22,872 |
| NRG Energy, Inc. 144A sr. unsec. bonds 5.25%, 6/15/29 | 5,000 | 5,500 |
| NSTAR Electric Co. sr. unsec. | | |
| unsub. notes 2.375%, 10/15/22 (Canada) | 75,000 | 77,261 |
| | |
| CORPORATE BONDS | | |
| AND NOTES (15.8%)* cont. | Principal amount | Value |
| Utilities and power cont. | | |
| Oncor Electric Delivery Co., LLC sr. notes | | |
| 3.75%, 4/1/45 | $75,000 | $91,608 |
| Pacific Gas and Electric Co. bonds 2.50%, 2/1/31 | 15,000 | 15,055 |
| Pacific Gas and Electric Co. company | | |
| guaranty sr. unsec. unsub. notes 2.95%, 3/1/26 | 10,000 | 10,581 |
| Pacific Gas and Electric Co. notes 2.10%, 8/1/27 | 5,000 | 5,088 |
| Pacific Gas and Electric Co. sr. notes 3.30%, 3/15/27 | 15,000 | 16,067 |
| PPL Capital Funding, Inc. company | | |
| guaranty sr. unsec. unsub. notes 4.20%, 6/15/22 | 60,000 | 62,702 |
| Public Service Electric & Gas Co. | | |
| sr. notes Ser. MTN, 5.50%, 3/1/40 | 25,000 | 36,063 |
| Texas Competitive Electric Holdings Co., LLC/TCEH | | |
| Finance, Inc. escrow company | | |
| guaranty sr. notes 11.50%, 10/1/21 F | 13,000 | 20 |
| Vistra Operations Co., LLC 144A company | | |
| guaranty sr. notes 4.30%, 7/15/29 | 36,000 | 40,860 |
| Vistra Operations Co., LLC 144A company | | |
| guaranty sr. notes 3.55%, 7/15/24 | 23,000 | 24,908 |
| Vistra Operations Co., LLC 144A company | | |
| guaranty sr. unsec. notes 5.625%, 2/15/27 | 10,000 | 10,636 |
| Vistra Operations Co., LLC 144A company | | |
| guaranty sr. unsec. notes 5.50%, 9/1/26 | 15,000 | 15,633 |
| Vistra Operations Co., LLC 144A company | | |
| guaranty sr. unsec. sub. notes 5.00%, 7/31/27 | 5,000 | 5,300 |
| | | 1,355,548 |
| Total corporate bonds and notes (cost $18,144,132) | $19,898,737 |
| |
| MORTGAGE-BACKED SECURITIES (2.9%)* Principal amount | Value |
| Agency collateralized mortgage obligations (0.1%) | |
| Federal Home Loan Mortgage Corporation | | |
| REMICs IFB Ser. 3408, Class EK, ((-4.024 x | | |
| 1 Month US LIBOR) + 25.79%), 25.155%, 4/15/37 | $6,975 | $12,904 |
| REMICs IFB Ser. 3072, Class SM, ((-3.667 x | | |
| 1 Month US LIBOR) + 23.80%), 23.215%, 11/15/35 | 9,412 | 16,753 |
| REMICs IFB Ser. 3249, Class PS, ((-3.3 x 1 Month | | |
| US LIBOR) + 22.28%), 21.752%, 12/15/36 | 7,118 | 11,602 |
| REMICs IFB Ser. 3065, Class DC, ((-3 x 1 Month | | |
| US LIBOR) + 19.86%), 19.384%, 3/15/35 | 18,745 | 26,243 |
| REMICs IFB Ser. 2990, Class LB, ((-2.556 x | | |
| 1 Month US LIBOR) + 16.95%), 16.54%, 6/15/34 | 7,764 | 9,472 |
| REMICs IFB Ser. 3829, Class AS, IO, ((-1 x | | |
| 1 Month US LIBOR) + 6.95%), 6.791%, 3/15/41 | 37,198 | 6,927 |
| Federal National Mortgage Association | | |
| REMICs IFB Ser. 06-8, Class HP, ((-3.667 x | | |
| 1 Month US LIBOR) + 24.57%), 24.024%, 3/25/36 | 12,387 | 21,910 |
| REMICs IFB Ser. 07-53, Class SP, ((-3.667 x | | |
| 1 Month US LIBOR) + 24.20%), 23.657%, 6/25/37 | 10,542 | 18,554 |
| REMICs IFB Ser. 05-75, Class GS, ((-3 x 1 Month | | |
| US LIBOR) + 20.25%), 19.806%, 8/25/35 | 4,285 | 5,976 |
| REMICs IFB Ser. 18-86, Class DS, IO, ((-1 x | | |
| 1 Month US LIBOR) + 6.10%), 5.952%, 12/25/48 | 122,137 | 12,672 |
| REMICs Ser. 06-46, Class OC, PO, zero %, 6/25/36 | 3,884 | 3,651 |
| Government National Mortgage Association | | |
| IFB Ser. 13-99, Class AS, IO, ((-1 x 1 Month | | |
| US LIBOR) + 6.05%), 5.898%, 6/20/43 | 59,072 | 11,442 |
| Ser. 10-9, Class UI, IO, 5.00%, 1/20/40 | 38,337 | 7,224 |
| Ser. 16-123, Class LI, IO, 3.50%, 3/20/44 | 83,126 | 6,213 |
| Ser. 13-14, IO, 3.50%, 12/20/42 | 125,674 | 10,388 |
| Ser. 12-141, Class WI, IO, 3.50%, 11/20/41 | 86,821 | 2,203 |
| Ser. 16-H16, Class EI, IO, 2.495%, 6/20/66 W | 166,000 | 15,056 |
| Ser. 15-H26, Class DI, IO, 1.884%, 10/20/65 W | 228,291 | 19,459 |
| | | 218,649 |
| |
| Putnam VT Global Asset Allocation Fund | 21 |
| | |
| MORTGAGE-BACKED | | |
| SECURITIES (2.9%)* cont. | Principal amount | Value |
| Commercial mortgage-backed securities (1.7%) | | |
| Banc of America Commercial Mortgage Trust FRB | | |
| Ser. 07-1, Class XW, IO, 0.425%, 1/15/49 W | $20,607 | $— |
| Bank FRB Ser. 17-BNK8, Class B, 3.927%, 11/15/50 W | 12,000 | 13,600 |
| Bear Stearns Commercial Mortgage Securities Trust | | |
| 144A FRB Ser. 06-PW14, Class X1, IO, | | |
| 0.557%, 12/11/38 W | 17,166 | 177 |
| Benchmark Mortgage Trust Ser. 18-B1, Class B, | | |
| 4.059%, 1/15/51 W | 15,000 | 16,940 |
| CD Commercial Mortgage Trust | | |
| FRB Ser. 17-CD6, Class B, 3.911%, 11/13/50 W | 27,000 | 29,447 |
| FRB Ser. 17-CD6, Class AM, 3.709%, 11/13/50 W | 73,000 | 81,698 |
| CFCRE Commercial Mortgage Trust FRB Ser. 17-C8, | | |
| Class B, 4.199%, 6/15/50 W | 29,000 | 32,083 |
| Citigroup Commercial Mortgage Trust | | |
| FRB Ser. 13-GC17, Class C, 5.109%, 11/10/46 W | 11,000 | 11,135 |
| Ser. 13-GC11, Class B, 3.732%, 4/10/46 W | 77,000 | 80,897 |
| FRB Ser. 18-C6, Class XA, IO, 0.782%, 11/10/51 W | 1,527,613 | 78,440 |
| Citigroup Commercial Mortgage Trust 144A FRB | | |
| Ser. 06-C5, Class XC, IO, 0.517%, 10/15/49 W | 412,047 | 4 |
| COMM Mortgage Trust | | |
| FRB Ser. 12-LC4, Class C, 5.535%, 12/10/44 W | 61,000 | 50,201 |
| FRB Ser. 13-CR13, Class C, 4.886%, 11/10/46 W | 27,000 | 29,160 |
| FRB Ser. 14-CR17, Class C, 4.783%, 5/10/47 W | 26,000 | 26,052 |
| Ser. 13-CR11, Class AM, 4.715%, 8/10/50 W | 20,000 | 21,871 |
| Ser. 14-CR19, Class B, 4.703%, 8/10/47 W | 16,000 | 17,376 |
| Ser. 14-UBS2, Class B, 4.701%, 3/10/47 | 75,000 | 81,000 |
| Ser. 13-CR13, Class AM, 4.449%, 11/10/46 W | 85,000 | 92,453 |
| FRB Ser. 14-UBS6, Class C, 4.446%, 12/10/47 W | 16,000 | 15,598 |
| Ser. 15-CR27, Class AM, 3.984%, 10/10/48 | 59,000 | 65,233 |
| 3.829%, 2/10/48 W | 18,000 | 19,260 |
| Ser. 12-CR2, Class AM, 3.791%, 8/15/45 | 77,000 | 79,196 |
| Ser. 15-DC1, Class AM, 3.724%, 2/10/48 | 74,000 | 80,460 |
| FRB Ser. 14-CR20, Class XA, IO, | | |
| 1.022%, 11/10/47 W | 278,424 | 8,812 |
| FRB Ser. 14-CR18, Class XA, IO, 1.007%, 7/15/47 W | 87,423 | 2,575 |
| FRB Ser. 14-CR17, Class XA, IO, 0.968%, 5/10/47 W | 556,389 | 15,097 |
| FRB Ser. 14-UBS6, Class XA, IO, | | |
| 0.887%, 12/10/47 W | 848,485 | 22,397 |
| FRB Ser. 14-LC17, Class XA, IO, 0.723%, 10/10/47 W | 504,490 | 10,992 |
| Credit Suisse Commercial Mortgage Trust 144A FRB | | |
| Ser. 07-C2, Class AX, IO, 0.014%, 1/15/49 W | 484,144 | 5 |
| CSAIL Commercial Mortgage Trust | | |
| Ser. 19-C15, Class B, 4.476%, 3/15/52 | 31,000 | 35,488 |
| FRB Ser. 20-C19, Class XA, IO, 1.121%, 3/15/53 W | 1,049,888 | 85,532 |
| CSMC Trust FRB Ser. 16-NXSR, Class C, | | |
| 4.357%, 12/15/49 W | 70,000 | 59,343 |
| Federal Home Loan Mortgage Corporation | | |
| Multifamily Structured Pass-Through Certificates | | |
| FRB Ser. K106, Class X1, IO, 1.355%, 1/25/30 W | 262,765 | 27,829 |
| Multifamily Structured Pass-Through Certificates | | |
| FRB Ser. K114, Class XAM, IO, 1.342%, 6/25/30 W | 174,000 | 19,662 |
| Multifamily Structured Pass-Through Certificates | | |
| FRB Ser. K118, Class X1, IO, 0.962%, 9/25/30 W | 943,695 | 76,085 |
| Multifamily Structured Pass-Through Certificates | | |
| FRB Ser. K740, Class X1, IO, 0.762%, 9/25/27 W | 383,924 | 17,314 |
| GS Mortgage Securities Corp., II 144A Ser. GC10, | | |
| Class B, 3.682%, 2/10/46 | 50,000 | 50,444 |
| GS Mortgage Securities Trust | | |
| FRB Ser. 15-GC32, Class B, 4.412%, 7/10/48 W | 73,000 | 80,300 |
| Ser. 15-GC32, Class AS, 4.018%, 7/10/48 W | 72,000 | 79,776 |
| Ser. 17-GS7, Class AS, 3.663%, 8/10/50 | 10,000 | 11,225 |
| | |
| MORTGAGE-BACKED | | |
| SECURITIES (2.9%)* cont. | Principal amount | Value |
| Commercial mortgage-backed securities cont. | | |
| GS Mortgage Securities Trust | | |
| Ser. 19-GC42, Class AS, 3.212%, 9/1/52 | $10,000 | $11,147 |
| Ser. 16-GS3, Class A4, 2.85%, 10/10/49 | 12,000 | 13,037 |
| FRB Ser. 15-GC30, Class XA, IO, 0.748%, 5/10/50 W | 374,551 | 10,240 |
| GS Mortgage Securities Trust 144A | | |
| FRB Ser. 13-GC14, Class B, 4.743%, 8/10/46 W | 13,000 | 14,038 |
| Ser. 12-GCJ9, Class C, 4.448%, 11/10/45 W | 17,000 | 17,403 |
| FRB Ser. 06-GG8, Class X, IO, 1.046%, 11/10/39 W | 783,966 | 8 |
| JPMBB Commercial Mortgage Securities Trust | | |
| FRB Ser. 13-C15, Class C, 5.197%, 11/15/45 W | 43,000 | 42,078 |
| FRB Ser. 14-C22, Class C, 4.554%, 9/15/47 W | 13,000 | 11,207 |
| FRB Ser. 13-C12, Class B, 4.099%, 7/15/45 W | 12,000 | 12,515 |
| JPMorgan Chase Commercial Mortgage | | |
| Securities Trust | | |
| Ser. 06-LDP9, Class AMS, 5.337%, 5/15/47 | 9,739 | 8,833 |
| Ser. 12-C6, Class AS, 4.117%, 5/15/45 | 16,000 | 16,547 |
| FRB Ser. 06-LDP8, Class X, IO, 0.286%, 5/15/45 W | 78,011 | 1 |
| FRB Ser. 07-LDPX, Class X, IO, 0.052%, 1/15/49 W | 217,642 | 2 |
| LB-UBS Commercial Mortgage Trust 144A FRB | | |
| Ser. 06-C6, Class XCL, IO, 0.689%, 9/15/39 W | 367,595 | 1,217 |
| Mezz Cap Commercial Mortgage Trust 144A FRB | | |
| Ser. 06-C4, Class X, IO, 5.694%, 7/15/45 W | 3,443 | — |
| Morgan Stanley Bank of America Merrill Lynch Trust | | |
| FRB Ser. 14-C14, Class C, 5.05%, 2/15/47 W | 10,000 | 10,807 |
| FRB Ser. 15-C24, Class B, 4.342%, 5/15/48 W | 10,000 | 10,766 |
| Ser. 13-C13, Class AS, 4.266%, 11/15/46 | 75,000 | 81,048 |
| FRB Ser. 14-C17, Class XA, IO, 1.076%, 8/15/47 W | 191,547 | 4,998 |
| FRB Ser. 15-C26, Class XA, IO, 1.017%, 10/15/48 W | 649,285 | 24,202 |
| FRB Ser. 13-C12, Class XA, IO, 0.589%, 10/15/46 W | 429,729 | 5,721 |
| Morgan Stanley Bank of America Merrill Lynch | | |
| Trust 144A FRB Ser. 12-C5, Class E, 4.675%, 8/15/45 W | 15,000 | 14,820 |
| Morgan Stanley Capital I Trust FRB Ser. 18-H3, | | |
| Class XA, IO, 0.829%, 7/15/51 W | 1,628,064 | 77,966 |
| UBS-Barclays Commercial Mortgage Trust 144A FRB | | |
| Ser. 12-C4, Class XA, IO, 1.603%, 12/10/45 W | 190,592 | 4,190 |
| Wells Fargo Commercial Mortgage Trust | | |
| Ser. 18-C46, Class B, 4.633%, 8/15/51 | 16,000 | 18,396 |
| FRB Ser. 13-LC12, Class AS, 4.275%, 7/15/46 W | 19,000 | 19,385 |
| FRB Ser. 13-LC12, Class C, 4.275%, 7/15/46 W | 24,000 | 21,265 |
| Ser. 15-NXS3, Class AS, 3.972%, 9/15/57 W | 16,000 | 17,584 |
| WF-RBS Commercial Mortgage Trust | | |
| FRB Ser. 13-C11, Class C, 4.20%, 3/15/45 W | 47,000 | 48,776 |
| Ser. 13-C12, Class AS, 3.56%, 3/15/48 | 33,000 | 34,543 |
| Ser. 13-C11, Class AS, 3.311%, 3/15/45 | 12,000 | 12,401 |
| WF-RBS Commercial Mortgage Trust 144A | | |
| FRB Ser. 11-C3, Class D, 5.642%, 3/15/44 W | 32,000 | 19,499 |
| FRB Ser. 11-C2, Class D, 5.523%, 2/15/44 W | 6,604 | 6,595 |
| FRB Ser. 13-C15, Class D, 4.49%, 8/15/46 W | 43,000 | 17,820 |
| FRB Ser. 11-C5, Class XA, IO, 1.673%, 11/15/44 W | 249,274 | 1,287 |
| FRB Ser. 12-C10, Class XA, IO, 1.523%, 12/15/45 W | 291,894 | 6,414 |
| | | 2,141,913 |
| Residential mortgage-backed securities (non-agency) (1.1%) | |
| Citigroup Mortgage Loan Trust, Inc. FRB | | |
| Ser. 05-2, Class 1A2A, 3.28%, 5/25/35 W | 16,270 | 16,682 |
| Countrywide Alternative Loan Trust | | |
| FRB Ser. 05-27, Class 1A1, 1.65%, 8/25/35 W | 21,420 | 17,925 |
| FRB Ser. 06-OA7, Class 1A2, (1 Month US LIBOR | | |
| + 0.94%), 1.549%, 6/25/46 | 76,484 | 67,548 |
| FRB Ser. 06-OA10, Class 4A1, (1 Month US LIBOR | | |
| + 0.19%), 0.528%, 8/25/46 | 92,979 | 89,795 |
| |
| 22 | Putnam VT Global Asset Allocation Fund |
| | |
| MORTGAGE-BACKED | | |
| SECURITIES (2.9%)* cont. | Principal amount | Value |
| Residential mortgage-backed securities (non-agency) cont. | |
| Ellington Financial Mortgage Trust 144A | | |
| Ser. 20-2, Class A2, 1.486%, 10/25/65 W | $113,085 | $113,085 |
| Federal Home Loan Mortgage Corporation 144A | |
| Structured Agency Credit Risk Trust REMICs FRB | |
| Ser. 20-DNA5, Class M1, (US 30 Day Average SOFR | |
| + 1.30%), 1.382%, 10/25/50 | 49,000 | 49,015 |
| Federal National Mortgage Association | | |
| Connecticut Avenue Securities FRB Ser. 16-C01, | |
| Class 2M2, (1 Month US LIBOR + 6.95%), | | |
| 7.098%, 8/25/28 | 7,821 | 8,362 |
| Connecticut Avenue Securities FRB Ser. 16-C01, | |
| Class 1M2, (1 Month US LIBOR + 6.75%), | | |
| 6.898%, 8/25/28 | 30,064 | 31,623 |
| Connecticut Avenue Securities FRB Ser. 16-C02, | |
| Class 1M2, (1 Month US LIBOR + 6.00%), | | |
| 6.148%, 9/25/28 | 27,982 | 29,551 |
| Connecticut Avenue Securities FRB Ser. 15-C04, | |
| Class 2M2, (1 Month US LIBOR + 5.55%), | | |
| 5.698%, 4/25/28 | 44,761 | 46,993 |
| Connecticut Avenue Securities FRB Ser. 15-C03, | |
| Class 2M2, (1 Month US LIBOR + 5.00%), | | |
| 5.148%, 7/25/25 | 6,874 | 7,016 |
| Connecticut Avenue Securities FRB Ser. 14-C04, | |
| Class 2M2, (1 Month US LIBOR + 5.00%), | | |
| 5.148%, 11/25/24 | 2,973 | 3,038 |
| Connecticut Avenue Securities FRB Ser. 14-C04, | |
| Class 1M2, (1 Month US LIBOR + 4.90%), | | |
| 5.048%, 11/25/24 | 4,795 | 4,917 |
| Connecticut Avenue Securities FRB Ser. 16-C05, | |
| Class 2M2, (1 Month US LIBOR + 4.45%), | | |
| 4.598%, 1/25/29 | 19,752 | 20,512 |
| Connecticut Avenue Securities FRB Ser. 16-C07, | |
| Class 2M2, (1 Month US LIBOR + 4.35%), | | |
| 4.498%, 5/25/29 | 27,858 | 28,916 |
| Connecticut Avenue Securities FRB Ser. 15-C01, | |
| Class 1M2, (1 Month US LIBOR + 4.30%), | | |
| 4.448%, 2/25/25 | 9,716 | 9,865 |
| Connecticut Avenue Securities FRB Ser. 16-C06, | |
| Class 1M2, (1 Month US LIBOR + 4.25%), 4.398%, | |
| 4/25/29 | 29,770 | 30,803 |
| Connecticut Avenue Securities FRB Ser. 16-C04, | |
| Class 1M2, (1 Month US LIBOR + 4.25%), | | |
| 4.398%, 1/25/29 | 124,857 | 129,705 |
| Connecticut Avenue Securities FRB Ser. 15-C02, | |
| Class 1M2, (1 Month US LIBOR + 4.00%), | | |
| 4.148%, 5/25/25 | 3,889 | 3,948 |
| Connecticut Avenue Securities FRB Ser. 17-C01, | |
| Class 1M2, (1 Month US LIBOR + 3.55%), | | |
| 3.698%, 7/25/29 | 98,003 | 100,818 |
| Connecticut Avenue Securities FRB Ser. 14-C03, | |
| Class 2M2, (1 Month US LIBOR + 2.90%), | | |
| 3.048%, 7/25/24 | 8,183 | 8,160 |
| Connecticut Avenue Securities FRB Ser. 17-C06, | |
| Class 1M2, (1 Month US LIBOR + 2.65%), | | |
| 2.798%, 2/25/30 | 74,446 | 74,749 |
| Connecticut Avenue Securities FRB Ser. 14-C02, | |
| Class 1M2, (1 Month US LIBOR + 2.60%), | | |
| 2.748%, 5/25/24 | 11,070 | 10,784 |
| Connecticut Avenue Securities FRB Ser. 17-C05, | |
| Class 1M2A, (1 Month US LIBOR + 2.20%), | | |
| 2.348%, 1/25/30 | 49,987 | 50,143 |
| Long Beach Mortgage Loan Trust FRB Ser. 04-1, | |
| Class A2, (1 Month US LIBOR + 0.80%), | | |
| 0.948%, 2/25/34 | 23,848 | 23,472 |
| | |
| MORTGAGE-BACKED | | |
| SECURITIES (2.9%)* cont. | Principal amount | Value |
| Residential mortgage-backed securities (non-agency) cont. | |
| New Century Home Equity Loan Trust FRB Ser. 03-4, | | |
| Class M1, (1 Month US LIBOR + 1.13%), | | |
| 1.273%, 10/25/33 | $45,965 | $46,334 |
| Park Place Securities, Inc. Asset-Backed | | |
| Pass-Through Certificates FRB Ser. 04-WCW2, | | |
| Class M3, (1 Month US LIBOR + 1.05%), | | |
| 1.198%, 10/25/34 | 30,000 | 29,202 |
| Structured Asset Investment Loan Trust FRB | | |
| Ser. 04-10, Class A10, (1 Month US LIBOR | | |
| + 0.90%), 1.048%, 11/25/34 | 16,786 | 16,781 |
| Verus Securitization Trust 144A Ser. 20-5, | | |
| Class A2, 1.578%, 5/25/65 | 111,875 | 111,963 |
| Visio Trust 144A Ser. 20-1, Class A3, 3.521%, 8/25/55 W | 117,000 | 122,277 |
| WaMu Mortgage Pass-Through Certificates Trust | | |
| FRB Ser. 05-AR12, Class 1A8, 2.917%, 10/25/35 W | 23,895 | 23,630 |
| FRB Ser. 05-AR9, Class A1C3, (1 Month US LIBOR | | |
| + 0.96%), 1.108%, 7/25/45 | 27,510 | 26,143 |
| | | 1,353,755 |
| Total mortgage-backed securities (cost $3,743,019) | $3,714,317 |
| |
| FOREIGN GOVERNMENT AND AGENCY | | |
| BONDS AND NOTES (0.6%)* | Principal amount | Value |
| |
| Dominican (Republic of) sr. unsec. | | |
| unsub. notes Ser. REGS, 5.50%, 1/27/25 | | |
| (Dominican Republic) | $130,000 | $146,088 |
| Indonesia (Republic of) sr. unsec. | | |
| unsub. notes Ser. REGS, 5.875%, 1/15/24 | | |
| (Indonesia) | 200,000 | 229,498 |
| Ivory Coast (Republic of) sr. unsec. | | |
| unsub. bonds Ser. REGS, 5.75%, 12/31/32 | | |
| (Ivory Coast) | 120,350 | 120,952 |
| Mexico (Government of) sr. unsec. bonds 5.55%, | | |
| 1/21/45 (Mexico) | 98,000 | 128,503 |
| Peru (Republic of) sr. unsec. | | |
| unsub. notes 2.392%, 1/23/26 (Peru) | 97,000 | 103,451 |
| Uruguay (Oriental Republic of) sr. unsec. | | |
| unsub. bonds 7.625%, 3/21/36 (Uruguay) | 10,000 | 16,188 |
| Venezuela (Republic of) sr. unsec. notes 9.00%, | | |
| 5/7/23 (Venezuela) (In default) † | 23,000 | 2,185 |
| Venezuela (Republic of) sr. unsec. | | |
| unsub. notes 8.25%, 10/13/24 | | |
| (Venezuela) (In default) † | 36,000 | 3,420 |
| Total foreign government and agency bonds | | |
| and notes (cost $734,532) | | $750,285 |
| |
| ASSET-BACKED SECURITIES (0.3%)* | Principal amount | Value |
| |
| Mello Warehouse Securitization Trust 144A | | |
| FRB Ser. 20-1, Class A, (1 Month US LIBOR | | |
| + 0.90%), 1.048%, 10/25/53 | $25,000 | $25,000 |
| FRB Ser. 20-2, Class A, (1 Month US LIBOR | | |
| + 0.80%), 0.953%, 11/25/53 | 25,000 | 25,000 |
| FRB Ser. 19-1, Class A, (1 Month US LIBOR | | |
| + 0.80%), 0.948%, 6/25/52 | 55,000 | 54,966 |
| RMF Buyout Issuance Trust 144A Ser. 20-HB1, | | |
| Class A1, 1.719%, 10/25/50 W | 119,986 | 119,986 |
| Station Place Securitization Trust 144A | | |
| FRB Ser. 20-6, Class A, (1 Month US LIBOR | | |
| + 1.75%), 1.893%, 9/7/21 | 25,000 | 25,000 |
| FRB Ser. 20-13, Class A, (1 Month US LIBOR | | |
| + 1.50%), 1.643%, 10/10/21 | 25,000 | 25,000 |
| FRB Ser. 20-15, Class A, (1 Month US LIBOR | | |
| + 1.37%), 1.513%, 12/10/21 | 25,000 | 25,000 |
| |
| Putnam VT Global Asset Allocation Fund | 23 |
| | |
| ASSET-BACKED SECURITIES (0.3%)* cont. | Principal amount | Value |
| Station Place Securitization Trust 144A | | |
| FRB Ser. 20-WL1, Class A, (1 Month US LIBOR | | |
| + 1.15%), 1.298%, 6/25/51 | $25,000 | $25,000 |
| FRB Ser. 20-2, Class A, (1 Month US LIBOR | | |
| + 0.83%), 0.978%, 3/26/21 | 38,000 | 38,000 |
| Towd Point Asset Trust 144A FRB Ser. 18-SL1, | | |
| Class A, (1 Month US LIBOR + 0.60%), 0.749%, 1/25/46 | 45,572 | 45,504 |
| Total asset-backed securities (cost $408,373) | | $408,456 |
| |
| SENIOR LOANS (0.3%)* c | Principal amount | Value |
| |
| American Axle and Manufacturing, Inc. bank term | | |
| loan FRN (BBA LIBOR USD 3 Month + 2.25%), | | |
| 3.00%, 4/6/24 | $4,579 | $4,504 |
| AppleCaramel Buyer, LLC bank term loan FRN | | |
| (BBA LIBOR USD 3 Month + 4.00%), 4.50%, 10/19/27 | 10,000 | 9,990 |
| Arches Buyer, Inc. bank term loan FRN | | |
| (1 Month US LIBOR + 4.00%), 4.50%, 11/24/27 | 15,000 | 14,989 |
| Brand Industrial Services, Inc. bank term loan | | |
| FRN (BBA LIBOR USD 3 Month + 4.25%), 5.25%, 6/21/24 | 4,923 | 4,796 |
| CP Atlas Buyer, Inc. bank term loan FRN | | |
| (BBA LIBOR USD 3 Month + 4.50%), 5.25%, 11/23/27 | 15,750 | 15,755 |
| CP Atlas Buyer, Inc. bank term loan FRN | | |
| (BBA LIBOR USD 3 Month + 4.50%), 5.25%, 11/23/27 | 5,250 | 5,252 |
| CPG International, Inc. bank term loan FRN | | |
| (BBA LIBOR USD 3 Month + 3.75%), 4.75%, 5/5/24 | 2,652 | 2,651 |
| Epicor Software Corp. bank term loan FRN | | |
| (1 Month US LIBOR + 7.75%), 8.75%, 7/30/28 | 5,000 | 5,194 |
| Epicor Software Corp. bank term loan FRN Ser. B, | | |
| (BBA LIBOR USD 3 Month + 4.25%), 5.25%, 7/30/27 | 39,900 | 40,100 |
| Gates Global, LLC bank term loan FRN Ser. B, | | |
| (BBA LIBOR USD 3 Month + 2.75%), 3.75%, 3/31/24 | 11,105 | 11,063 |
| Global Medical Response, Inc. bank term loan FRN | | |
| (BBA LIBOR USD 3 Month + 4.75%), 5.75%, 10/2/25 | 25,000 | 24,813 |
| Greeneden US Holdings II, LLC bank term loan FRN | | |
| (BBA LIBOR USD 3 Month + 4.00%), 4.75%, 10/8/27 | 10,000 | 10,009 |
| iHeartCommunications, Inc. bank term loan FRN | | |
| (BBA LIBOR USD 3 Month + 4.00%), 4.75%, 5/1/26 | 9,700 | 9,643 |
| IRB Holding Corp. bank term loan FRN Ser. B, | | |
| (BBA LIBOR USD 3 Month + 3.25%), 4.25%, 11/19/27 | 5,000 | 4,993 |
| Navistar, Inc. bank term loan FRN Ser. B, | | |
| (BBA LIBOR USD 3 Month + 3.50%), 3.66%, 11/6/24 | 27,018 | 26,959 |
| Ortho-Clinical Diagnostics, Inc. bank term loan | | |
| FRN Ser. B, (BBA LIBOR USD 3 Month + 3.25%), | | |
| 3.398%, 6/30/25 | 49,707 | 48,934 |
| Panther BF Aggregator 2 LP bank term loan FRN | | |
| Ser. B, (BBA LIBOR USD 3 Month + 3.50%), | | |
| 3.647%, 4/30/26 | 34,280 | 34,109 |
| Quorum Health Corp. bank term loan FRN (BBA LIBOR | | |
| USD 3 Month + 8.25%), 9.25%, 4/29/25 | 4,988 | 4,900 |
| Rackspace Hosting, Inc. bank term loan FRN | | |
| (BBA LIBOR USD 3 Month + 3.00%), 4.00%, 11/3/23 | 4,861 | 4,851 |
| Robertshaw Holdings Corp. bank term loan FRN | | |
| (BBA LIBOR USD 3 Month + 8.00%), 9.00%, 2/28/26 | 10,000 | 7,800 |
| Robertshaw Holdings Corp. bank term loan FRN | | |
| (BBA LIBOR USD 3 Month + 3.50%), 4.50%, 2/28/25 | 4,763 | 4,442 |
| Solenis International, LLC bank term loan FRN | | |
| (BBA LIBOR USD 3 Month + 8.50%), 8.733%, 6/26/26 | 5,000 | 4,896 |
| Solenis International, LLC bank term loan FRN | | |
| (BBA LIBOR USD 3 Month + 4.00%), 4.233%, 6/26/25 | 19,742 | 19,699 |
| Terrier Media Buyer, Inc. bank term loan FRN | | |
| Ser. B, (BBA LIBOR USD 3 Month + 4.25%), | | |
| 4.397%, 12/17/26 | 34,912 | 34,863 |
| | |
| SENIOR LOANS (0.3%)* c cont. | Principal amount | Value |
| Titan Acquisition, Ltd. (United Kingdom) bank | | |
| term loan FRN Ser. B, (BBA LIBOR USD 3 Month | | |
| + 3.00%), 3.267%, 3/28/25 | $19,401 | $18,892 |
| Vertiv Group Corp. bank term loan FRN Ser. B, | | |
| (1 Month US LIBOR + 3.00%), 3.153%, 3/2/27 | 29,775 | 29,562 |
| Zayo Group Holdings, Inc. bank term loan FRN | | |
| (1 Month US LIBOR + 3.00%), 3.147%, 3/9/27 | 4,454 | 4,419 |
| Total senior loans (cost $407,122) | | $408,078 |
| |
| PREFERRED STOCKS (—%)* | Shares | Value |
| GMAC Capital Trust I Ser. 2, $1.91 cum. ARP | 680 | $18,394 |
| Total preferred stocks (cost $17,000) | | $18,394 |
| |
| CONVERTIBLE BONDS AND NOTES (—%)* | Principal amount | Value |
| DISH Network Corp. cv. sr. unsec. notes | | |
| 3.375%, 8/15/26 | $15,000 | $14,298 |
| Total convertible bonds and notes (cost $14,521) | | $14,298 |
| |
| | Principal amount/ | |
| SHORT-TERM INVESTMENTS (13.0%)* | shares | Value |
| Putnam Cash Collateral Pool, LLC 0.14% d | Shares 895,250 | $895,250 |
| Putnam Short Term Investment Fund | | |
| Class P 0.17% L | Shares 14,566,068 | 14,566,068 |
| U.S. Treasury Bills 0.084%, 1/19/21 # § | $300,000 | 299,996 |
| U.S. Treasury Bills 0.079%, 3/18/21 # § | 600,000 | 599,915 |
| Total short-term investments (cost $16,361,208) | | $16,361,229 |
| | | |
| Total investments (cost $121,790,160) | | $148,014,632 |
Key to holding’s abbreviations
| |
| ARP | Adjustable Rate Preferred Stock: the rate shown is the current interest |
| | rate at the close of the reporting period |
| DAC | Designated Activity Company |
| FRB | Floating Rate Bonds: the rate shown is the current interest rate at the |
| | close of the reporting period. Rates may be subject to a cap or floor. |
| | For certain securities, the rate may represent a fixed rate currently in |
| | place at the close of the reporting period. |
| FRN | Floating Rate Notes: the rate shown is the current interest rate or |
| | yield at the close of the reporting period. Rates may be subject to a |
| | cap or floor. For certain securities, the rate may represent a fixed rate |
| | currently in place at the close of the reporting period. |
| IFB | Inverse Floating Rate Bonds, which are securities that pay interest |
| | rates that vary inversely to changes in the market interest rates. As |
| | interest rates rise, inverse floaters produce less current income. The |
| | rate shown is the current interest rate at the close of the reporting |
| | period. Rates may be subject to a cap or floor. |
| IO | Interest Only |
| PO | Principal Only |
| TBA | To Be Announced Commitments |
Notes to the fund’s portfolio
Unless noted otherwise, the notes to the fund’s portfolio are for the close of the fund’s reporting period, which ran from January 1, 2020 through December 31, 2020 (the reporting period). Within the following notes to the portfolio, references to “Putnam Management” represent Putnam Investment Management, LLC, the fund’s manager, an indirect wholly-owned subsidiary of Putnam Investments, LLC and references to “ASC 820” represent Accounting Standards Codification 820 Fair Value Measurements and Disclosures.
* Percentages indicated are based on net assets of $126,162,159.
† This security is non-income-producing.
∆∆ This security is restricted with regard to public resale. The total fair value of this security and any other restricted securities (excluding 144A securities), if any, held at the close of the reporting period was $94,548, or 0.1% of net assets.
‡‡ Income may be received in cash or additional securities at the discretion of the issuer. The rate shown in parenthesis is the rate paid in kind, if applicable.
| |
| 24 | Putnam VT Global Asset Allocation Fund |
# This security, in part or in entirety, was pledged and segregated with the broker to cover margin requirements for futures contracts at the close of the reporting period. Collateral at period end totaled $473,936 and is included in Investments in securities on the Statement of assets and liabilities (Notes 1 and 9).
§ This security, in part or in entirety, was pledged and segregated with the custodian for collateral on the initial margin on certain centrally cleared derivative contracts at the close of the reporting period. Collateral at period end totaled $245,978 and is included in Investments in securities on the Statement of assets and liabilities (Notes 1 and 9).
## Forward commitment, in part or in entirety (Note 1).
c Senior loans are exempt from registration under the Securities Act of 1933, as amended, but contain certain restrictions on resale and cannot be sold publicly. These loans pay interest at rates which adjust periodically. The interest rates shown for senior loans are the current interest rates at the close of the reporting period. Senior loans are also subject to mandatory and/or optional prepayment which cannot be predicted. As a result, the remaining maturity may be substantially less than the stated maturity shown (Notes 1 and 7).
d Affiliated company. See Notes 1 and 5 to the financial statements regarding securities lending. The rate quoted in the security description is the annualized 7-day yield of the fund at the close of the reporting period.
F This security is valued by Putnam Management at fair value following procedures approved by the Trustees. Securities are classified as Level 3 for ASC 820 based on the securities’ valuation inputs. At the close of the reporting period, fair value pricing was also used for certain foreign securities in the portfolio (Note 1).
L Affiliated company (Note 5). The rate quoted in the security description is the annualized 7-day yield of the fund at the close of the reporting period.
R Real Estate Investment Trust.
S Security on loan, in part or in entirety, at the close of the reporting period (Note 1).
W The rate shown represents the weighted average coupon associated with the underlying mortgage pools. Rates may be subject to a cap or floor.
At the close of the reporting period, the fund maintained liquid assets totaling $21,126,017 to cover certain derivative contracts and delayed delivery securities.
Unless otherwise noted, the rates quoted in Short-term investments security descriptions represent the weighted average yield to maturity.
Debt obligations are considered secured unless otherwise indicated.
144A after the name of an issuer represents securities exempt from registration under Rule 144A of the Securities Act of 1933, as amended. These securities may be resold in transactions exempt from registration, normally to qualified institutional buyers.
See Note 1 to the financial statements regarding TBA commitments.
The dates shown on debt obligations are the original maturity dates.
| | | | | | |
| FORWARD CURRENCY CONTRACTS at 12/31/20 (aggregate face value $24,613,964) | Unrealized |
| | | Contract | Delivery | | Aggregate | appreciation/ |
| Counterparty | Currency | type* | date | Value | face value | (depreciation) |
| Bank of America N.A. | | | | | | |
| | Australian Dollar | Sell | 1/20/21 | $40,174 | $34,777 | $(5,397) |
| | Canadian Dollar | Sell | 1/20/21 | 95,302 | 91,114 | (4,188) |
| | Chinese Yuan (Offshore) | Sell | 2/18/21 | 64,522 | 63,077 | (1,445) |
| | Euro | Buy | 3/17/21 | 950,276 | 946,066 | 4,210 |
| | Hong Kong Dollar | Sell | 2/17/21 | 65,073 | 65,054 | (19) |
| | Japanese Yen | Buy | 2/17/21 | 206,119 | 205,300 | 819 |
| | Mexican Peso | Sell | 1/20/21 | 7,510 | 5,663 | (1,847) |
| | New Zealand Dollar | Sell | 1/20/21 | 60,444 | 54,485 | (5,959) |
| | Swedish Krona | Buy | 3/17/21 | 200,749 | 197,317 | 3,432 |
| Barclays Bank PLC | | | | | | |
| | British Pound | Buy | 3/17/21 | 115,879 | 114,489 | 1,390 |
| | Canadian Dollar | Sell | 1/20/21 | 98,601 | 98,516 | (85) |
| | Euro | Sell | 3/17/21 | 395,846 | 393,986 | (1,860) |
| | Japanese Yen | Buy | 2/17/21 | 166,155 | 164,078 | 2,077 |
| | New Zealand Dollar | Sell | 1/20/21 | 18,997 | 24,467 | 5,470 |
| | Swedish Krona | Sell | 3/17/21 | 133,265 | 130,869 | (2,396) |
| Citibank, N.A. | | | | | | |
| | Australian Dollar | Sell | 1/20/21 | 32,694 | 31,057 | (1,637) |
| | British Pound | Sell | 3/17/21 | 148,167 | 146,775 | (1,392) |
| | Canadian Dollar | Buy | 1/20/21 | 171,983 | 168,733 | 3,250 |
| | Chilean Peso | Buy | 1/20/21 | 128,374 | 114,825 | 13,549 |
| | Chilean Peso | Sell | 1/20/21 | 122,948 | 117,082 | (5,866) |
| | Danish Krone | Buy | 3/17/21 | 145,460 | 144,782 | 678 |
| | Euro | Sell | 3/17/21 | 251,335 | 249,920 | (1,415) |
| | Hong Kong Dollar | Sell | 2/17/21 | 30,163 | 30,156 | (7) |
| | Japanese Yen | Buy | 2/17/21 | 480,903 | 475,113 | 5,790 |
| | New Zealand Dollar | Sell | 1/20/21 | 207,308 | 196,302 | (11,006) |
| | Swedish Krona | Sell | 3/17/21 | 63,178 | 62,034 | (1,144) |
| Credit Suisse International | | | | | | |
| | Australian Dollar | Buy | 1/20/21 | 125,612 | 114,873 | 10,739 |
| | British Pound | Sell | 3/17/21 | 133,802 | 131,797 | (2,005) |
| | Canadian Dollar | Sell | 1/20/21 | 26,320 | 25,033 | (1,287) |
| | Euro | Sell | 3/17/21 | 104,131 | 103,627 | (504) |
| |
| Putnam VT Global Asset Allocation Fund | 25 |
| | | | | | |
| FORWARD CURRENCY CONTRACTS at 12/31/20 (aggregate face value $24,613,964) cont. | Unrealized |
| | | Contract | Delivery | | Aggregate | appreciation/ |
| Counterparty | Currency | type* | date | Value | face value | (depreciation) |
| Credit Suisse International cont. | | | | | | |
| | New Zealand Dollar | Buy | 1/20/21 | $28,855 | $26,647 | $2,208 |
| | Swiss Franc | Sell | 3/17/21 | 127,005 | 126,438 | (567) |
| Goldman Sachs International | | | | | | |
| | Australian Dollar | Buy | 1/20/21 | 621,964 | 593,622 | 28,342 |
| | British Pound | Buy | 3/17/21 | 29,688 | 29,243 | 445 |
| | Canadian Dollar | Buy | 1/20/21 | 587,444 | 573,485 | 13,959 |
| | Chinese Yuan (Offshore) | Buy | 2/18/21 | 353,599 | 349,134 | 4,465 |
| | Euro | Sell | 3/17/21 | 22,148 | 22,041 | (107) |
| | Japanese Yen | Sell | 2/17/21 | 61,338 | 60,329 | (1,009) |
| | New Taiwan Dollar | Buy | 2/17/21 | 1,477 | 3,409 | (1,932) |
| | New Zealand Dollar | Sell | 1/20/21 | 649,195 | 628,039 | (21,156) |
| | Norwegian Krone | Buy | 3/17/21 | 82,972 | 81,580 | 1,392 |
| | Swedish Krona | Buy | 3/17/21 | 663,504 | 651,584 | 11,920 |
| | Swiss Franc | Sell | 3/17/21 | 253,556 | 252,716 | (840) |
| HSBC Bank USA, National Association | | | | | | |
| | Australian Dollar | Buy | 1/20/21 | 82,275 | 72,742 | 9,533 |
| | British Pound | Buy | 3/17/21 | 114,511 | 111,946 | 2,565 |
| | Canadian Dollar | Sell | 1/20/21 | 26,163 | 26,828 | 665 |
| | Chinese Yuan (Offshore) | Sell | 2/18/21 | 264,498 | 259,635 | (4,863) |
| | Euro | Buy | 3/17/21 | 298,690 | 297,346 | 1,344 |
| | Hong Kong Dollar | Sell | 2/17/21 | 259,337 | 259,230 | (107) |
| | Indian Rupee | Buy | 2/17/21 | 119,889 | 118,125 | 1,764 |
| | Indian Rupee | Sell | 2/17/21 | 120,883 | 117,782 | (3,101) |
| | Japanese Yen | Buy | 2/17/21 | 100,926 | 99,349 | 1,577 |
| | New Zealand Dollar | Sell | 1/20/21 | 83,974 | 82,505 | (1,469) |
| | Norwegian Krone | Buy | 3/17/21 | 52,446 | 51,700 | 746 |
| | South Korean Won | Buy | 2/17/21 | 127,499 | 119,446 | 8,053 |
| | South Korean Won | Sell | 2/17/21 | 124,815 | 122,267 | (2,548) |
| | Swedish Krona | Buy | 3/17/21 | 26,055 | 25,588 | 467 |
| | Swiss Franc | Sell | 3/17/21 | 203,072 | 201,618 | (1,454) |
| JPMorgan Chase Bank N.A. | | | | | | |
| | Australian Dollar | Buy | 1/20/21 | 239,502 | 229,142 | 10,360 |
| | British Pound | Buy | 3/17/21 | 489,785 | 483,048 | 6,737 |
| | Canadian Dollar | Sell | 1/20/21 | 174,733 | 170,096 | (4,637) |
| | Chinese Yuan (Offshore) | Buy | 2/18/21 | 1,580 | 1,891 | (311) |
| | Euro | Sell | 3/17/21 | 157,972 | 156,879 | (1,093) |
| | Indian Rupee | Buy | 2/17/21 | 119,889 | 118,077 | 1,812 |
| | Indian Rupee | Sell | 2/17/21 | 120,884 | 117,877 | (3,007) |
| | Japanese Yen | Buy | 2/17/21 | 161,312 | 160,370 | 942 |
| | New Taiwan Dollar | Buy | 2/17/21 | 1,339 | 2,169 | (830) |
| | New Zealand Dollar | Sell | 1/20/21 | 239,905 | 235,059 | (4,846) |
| | Norwegian Krone | Sell | 3/17/21 | 190,943 | 188,145 | (2,798) |
| | Singapore Dollar | Buy | 2/17/21 | 69,766 | 67,543 | 2,223 |
| | South Korean Won | Buy | 2/17/21 | 127,022 | 118,546 | 8,476 |
| | South Korean Won | Sell | 2/17/21 | 124,816 | 122,344 | (2,472) |
| | Swedish Krona | Buy | 3/17/21 | 155,075 | 152,287 | 2,788 |
| | Swiss Franc | Buy | 3/17/21 | 302,004 | 301,426 | 578 |
| Morgan Stanley & Co. International PLC | | | | | | |
| | Australian Dollar | Buy | 1/20/21 | 871,721 | 825,417 | 46,304 |
| | British Pound | Buy | 3/17/21 | 302,354 | 296,439 | 5,915 |
| | Canadian Dollar | Buy | 1/20/21 | 212,130 | 202,683 | 9,447 |
| | Euro | Sell | 3/17/21 | 204,592 | 204,207 | (385) |
| |
| 26 | Putnam VT Global Asset Allocation Fund |
| | | | | | |
| FORWARD CURRENCY CONTRACTS at 12/31/20 (aggregate face value $24,613,964) cont. | Unrealized |
| | | Contract | Delivery | | Aggregate | appreciation/ |
| Counterparty | Currency | type* | date | Value | face value | (depreciation) |
| Morgan Stanley & Co. International PLC cont. | | | | | |
| | Japanese Yen | Buy | 2/17/21 | $516,213 | $511,086 | $5,127 |
| | New Zealand Dollar | Buy | 1/20/21 | 225,009 | 209,031 | 15,978 |
| | Norwegian Krone | Buy | 3/17/21 | 26,608 | 26,223 | 385 |
| | Swedish Krona | Buy | 3/17/21 | 57,620 | 53,943 | 3,677 |
| | Swiss Franc | Sell | 3/17/21 | 157,115 | 157,193 | 78 |
| NatWest Markets PLC | | | | | | |
| | Australian Dollar | Buy | 1/20/21 | 616,874 | 592,162 | 24,712 |
| | British Pound | Buy | 3/17/21 | 172,519 | 168,455 | 4,064 |
| | Canadian Dollar | Buy | 1/20/21 | 76,838 | 74,181 | 2,657 |
| | Euro | Buy | 3/17/21 | 24,840 | 26,605 | (1,765) |
| | Japanese Yen | Buy | 2/17/21 | 258,057 | 255,543 | 2,514 |
| | New Zealand Dollar | Sell | 1/20/21 | 503,483 | 488,723 | (14,760) |
| | Norwegian Krone | Sell | 3/17/21 | 80,162 | 78,009 | (2,153) |
| | Swedish Krona | Sell | 3/17/21 | 16,361 | 14,472 | (1,889) |
| | Swiss Franc | Sell | 3/17/21 | 86,707 | 86,524 | (183) |
| State Street Bank and Trust Co. | | | | | | |
| | Australian Dollar | Buy | 1/20/21 | 106,642 | 113,426 | (6,784) |
| | British Pound | Sell | 3/17/21 | 282,789 | 279,433 | (3,356) |
| | Canadian Dollar | Sell | 1/20/21 | 89,409 | 89,427 | 18 |
| | Euro | Sell | 3/17/21 | 1,552,182 | 1,545,581 | (6,601) |
| | Hong Kong Dollar | Sell | 2/17/21 | 482,990 | 482,863 | (127) |
| | Japanese Yen | Sell | 2/17/21 | 215,183 | 215,238 | 55 |
| | New Zealand Dollar | Sell | 1/20/21 | 17,845 | 14,907 | (2,938) |
| | Norwegian Krone | Sell | 3/17/21 | 27,377 | 27,071 | (306) |
| | Swedish Krona | Buy | 3/17/21 | 56,840 | 57,015 | (175) |
| | Swiss Franc | Sell | 3/17/21 | 213,938 | 213,587 | (351) |
| Toronto-Dominion Bank | | | | | | |
| | Australian Dollar | Buy | 1/20/21 | 99,008 | 92,213 | 6,795 |
| | British Pound | Sell | 3/17/21 | 20,248 | 19,946 | (302) |
| | Canadian Dollar | Sell | 1/20/21 | 163,419 | 156,880 | (6,539) |
| | Euro | Sell | 3/17/21 | 465,349 | 462,576 | (2,773) |
| | Japanese Yen | Buy | 2/17/21 | 250,844 | 248,189 | 2,655 |
| | New Zealand Dollar | Sell | 1/20/21 | 32,956 | 30,433 | (2,523) |
| | Norwegian Krone | Buy | 3/17/21 | 159,753 | 156,942 | 2,811 |
| | Swedish Krona | Sell | 3/17/21 | 31,638 | 31,069 | (569) |
| | Swiss Franc | Sell | 3/17/21 | 105,045 | 104,672 | (373) |
| UBS AG | | | | | | |
| | Australian Dollar | Sell | 1/20/21 | 120,445 | 102,009 | (18,436) |
| | Australian Dollar | Buy | 3/15/21 | 163,614 | 151,978 | 11,636 |
| | Australian Dollar | Sell | 3/15/21 | 163,614 | 153,059 | (10,555) |
| | British Pound | Buy | 3/17/21 | 206,859 | 203,796 | 3,063 |
| | Canadian Dollar | Buy | 1/20/21 | 166,719 | 160,639 | 6,080 |
| | Euro | Buy | 3/17/21 | 498,142 | 495,564 | 2,578 |
| | Hong Kong Dollar | Sell | 2/17/21 | 158,025 | 157,999 | (26) |
| | Japanese Yen | Buy | 2/17/21 | 473,244 | 467,683 | 5,561 |
| | New Zealand Dollar | Sell | 1/20/21 | 420,661 | 423,268 | 2,607 |
| | Norwegian Krone | Sell | 3/17/21 | 8,862 | 8,729 | (133) |
| | Swedish Krona | Buy | 3/17/21 | 195,312 | 191,848 | 3,464 |
| | Swiss Franc | Buy | 3/17/21 | 79,350 | 79,415 | (65) |
| WestPac Banking Corp. | | | | | | |
| | Australian Dollar | Buy | 1/20/21 | 55,210 | 56,256 | (1,046) |
| | British Pound | Buy | 3/17/21 | 19,290 | 18,959 | 331 |
| |
| Putnam VT Global Asset Allocation Fund | 27 |
| | | | | | |
| FORWARD CURRENCY CONTRACTS at 12/31/20 (aggregate face value $24,613,964) cont. | Unrealized |
| | | Contract | Delivery | | Aggregate | appreciation/ |
| Counterparty | Currency | type* | date | Value | face value | (depreciation) |
| WestPac Banking Corp. cont. | | | | | | |
| | Canadian Dollar | Buy | 1/20/21 | $133,799 | $129,006 | $4,793 |
| | Chinese Yuan (Offshore) | Buy | 2/18/21 | 1,564 | 1,876 | (312) |
| | Euro | Sell | 3/17/21 | 95,321 | 95,283 | (38) |
| | Japanese Yen | Buy | 2/17/21 | 211,285 | 208,645 | 2,640 |
| | New Zealand Dollar | Sell | 1/20/21 | 211,050 | 204,948 | (6,102) |
| Unrealized appreciation | | | | | | 350,710 |
| Unrealized (depreciation) | | | | | | (200,171) |
| Total | | | | | | $150,539 |
* The exchange currency for all contracts listed is the United States Dollar.
| | | | | |
| FUTURES | | | | | |
| CONTRACTS | Number | | | | Unrealized |
| OUTSTANDING | of | Notional | | Expiration | appreciation/ |
| at 12/31/20 | contracts | amount | Value | date | (depreciation) |
| MSCI EAFE Index | | | | | |
| (Short) | 5 | $536,881 | $532,700 | Mar-21 | $(9,005) |
| Russell 2000 | | | | | |
| Index E-Mini | | | | | |
| (Long) | 56 | 5,529,594 | 5,529,440 | Mar-21 | 176,011 |
| S&P 500 Index | | | | | |
| E-Mini (Long) | 14 | 2,629,249 | 2,624,160 | Mar-21 | 58,911 |
| S&P 500 Index | | | | | |
| E-Mini (Short) | 50 | 9,390,175 | 9,372,000 | Mar-21 | (210,572) |
| U.S. Treasury | | | | | |
| Bond 30 yr | | | | | |
| (Long) | 8 | 1,385,500 | 1,385,500 | Mar-21 | (13,518) |
| U.S. Treasury | | | | | |
| Bond Ultra 30 yr | | | | | |
| (Long) | 13 | 2,776,313 | 2,776,313 | Mar-21 | (47,846) |
| | | | | |
| FUTURES | | | | | |
| CONTRACTS | Number | | | | Unrealized |
| OUTSTANDING | of | Notional | | Expiration | appreciation/ |
| at 12/31/20 cont. | contracts | amount | Value | date | (depreciation) |
| U.S. Treasury | | | | | |
| Note 2 yr (Long) | 24 | $5,303,437 | $5,303,437 | Mar-21 | $4,899 |
| U.S. Treasury | | | | | |
| Note 2 yr (Short) | 18 | 3,977,578 | 3,977,578 | Mar-21 | (3,837) |
| U.S. Treasury | | | | | |
| Note 5 yr (Long) | 43 | 5,425,055 | 5,425,055 | Mar-21 | 12,450 |
| U.S. Treasury | | | | | |
| Note 10 yr (Long) | 15 | 2,071,172 | 2,071,172 | Mar-21 | 2,427 |
| Unrealized appreciation | | | | 254,698 |
| Unrealized (depreciation) | | | | (284,778) |
| Total | | | | | $(30,080) |
| | | |
| TBA SALE COMMITMENTS OUTSTANDING at 12/31/20 | Principal | Settlement | |
| (proceeds receivable $10,407,246) | amount | date | Value |
| Government National Mortgage Association, 3.00%, 1/1/51 | $2,000,000 | 1/21/21 | $2,091,406 |
| Uniform Mortgage-Backed Securities, 3.00%, 1/1/51 | 1,000,000 | 1/14/21 | 1,047,813 |
| Uniform Mortgage-Backed Securities, 2.50%, 1/1/51 | 3,000,000 | 1/14/21 | 3,162,655 |
| Uniform Mortgage-Backed Securities, 2.00%, 1/1/51 | 3,000,000 | 1/14/21 | 3,117,188 |
| Uniform Mortgage-Backed Securities, 1.50%, 1/1/51 | 1,000,000 | 1/14/21 | 1,010,469 |
| Total | | | $10,429,531 |
CENTRALLY CLEARED INTEREST RATE SWAP CONTRACTS OUTSTANDING at 12/31/20
| | | | | | |
| | | Upfront | | | | Unrealized |
| | | premium | Termination | Payments | Payments | appreciation/ |
| Notional amount | Value | received (paid) | date | made by fund | received by fund | (depreciation) |
| $1,528,000 | $1,708 E | $(1,445) | 3/17/23 | 3 month USD-LIBOR-BBA — | 0.25% — Semiannually | $263 |
| | | | | Quarterly | | |
| 3,736,000 | 1,707 E | (5,997) | 3/17/26 | 0.45% — Semiannually | 3 month USD-LIBOR- | (4,291) |
| | | | | | BBA — Quarterly | |
| 1,208,000 | 552 E | 1,905 | 3/17/26 | 3 month USD-LIBOR-BBA — | 0.45% — Semiannually | 1,353 |
| | | | | Quarterly | | |
| 1,421,000 | 7,075 E | (10,734) | 3/17/31 | 0.90% — Semiannually | 3 month USD-LIBOR- | (3,659) |
| | | | | | BBA — Quarterly | |
| 1,350,000 | 6,722 E | 10,111 | 3/17/31 | 3 month USD-LIBOR-BBA — | 0.90% — Semiannually | 3,390 |
| | | | | Quarterly | | |
| 38,000 | 1,604 E | (1,828) | 3/17/51 | 1.25% — Semiannually | 3 month USD-LIBOR- | (224) |
| | | | | | BBA — Quarterly | |
| 617,000 | 26,043 E | 29,769 | 3/17/51 | 3 month USD-LIBOR-BBA — | 1.25% — Semiannually | 3,726 |
| | | | | Quarterly | | |
| 241,000 | 301 | (2) | 12/31/25 | 3 month USD-LIBOR-BBA — | 0.4515% — Semiannually | 297 |
| | | | | Quarterly | | |
| |
| 28 | Putnam VT Global Asset Allocation Fund |
CENTRALLY CLEARED INTEREST RATE SWAP CONTRACTS OUTSTANDING at 12/31/20 cont.
| | | | | | |
| | | Upfront | | | | Unrealized |
| | | premium | Termination | Payments | Payments | appreciation/ |
| Notional amount | Value | received (paid) | date | made by fund | received by fund | (depreciation) |
| $1,332,000 | $133 | $(5) | 1/5/23 | 0.201% — Semiannually | 3 month USD-LIBOR- | $(138) |
| | | | | | BBA — Quarterly | |
| 196,000 | 463 | (3) | 1/5/31 | 3 month USD-LIBOR-BBA — | 0.944% — Semiannually | 460 |
| | | | | Quarterly | | |
| Total | | $21,771 | | | | $1,177 |
E Extended effective date.
OTC TOTAL RETURN SWAP CONTRACTS OUTSTANDING at 12/31/20
| | | | | | |
| | | Upfront | | Payments | Total return | Unrealized |
| Swap counterparty/ | | premium | Termination | received (paid) | received by | appreciation/ |
| Notional amount | Value | received (paid) | date | by fund | or paid by fund | (depreciation) |
| Barclays Bank PLC | | | | | | |
| $92,547 | $92,547 | $— | 1/12/41 | 5.00% (1 month USD- | Synthetic MBX Index | $205 |
| | | | | LIBOR) — Monthly | 5.00% 30 year Fannie Mae | |
| | | | | | pools — Monthly | |
| 24,998 | 24,971 | — | 1/12/40 | 5.00% (1 month USD- | Synthetic MBX Index | 28 |
| | | | | LIBOR) — Monthly | 5.00% 30 year Fannie Mae | |
| | | | | | pools — Monthly | |
| 16,665 | 16,676 | — | 1/12/38 | (6.50%) 1 month USD- | Synthetic MBX Index | (56) |
| | | | | LIBOR — Monthly | 6.50% 30 year Fannie Mae | |
| | | | | | pools — Monthly | |
| 1,162 | 1,143 | — | 1/12/43 | 3.50% (1 month USD- | Synthetic TRS Index | (3) |
| | | | | LIBOR) — Monthly | 3.50% 30 year Fannie Mae | |
| | | | | | pools — Monthly | |
| 7,560 | 7,358 | — | 1/12/41 | 4.00% (1 month USD- | Synthetic TRS Index | (89) |
| | | | | LIBOR) — Monthly | 4.00% 30 year Fannie Mae | |
| | | | | | pools — Monthly | |
| 6,124 | 5,961 | — | 1/12/41 | 4.00% (1 month USD- | Synthetic TRS Index | (72) |
| | | | | LIBOR) — Monthly | 4.00% 30 year Fannie Mae | |
| | | | | | pools — Monthly | |
| 696 | 677 | — | 1/12/42 | 4.00% (1 month USD- | Synthetic TRS Index | (9) |
| | | | | LIBOR) — Monthly | 4.00% 30 year Fannie Mae | |
| | | | | | pools — Monthly | |
| 2,758 | 2,708 | — | 1/12/41 | (5.00%) 1 month USD- | Synthetic TRS Index | 6 |
| | | | | LIBOR — Monthly | 5.00% 30 year Fannie Mae | |
| | | | | | pools — Monthly | |
| Citibank, N.A. | | | | | | |
| 3,361 | 3,361 | — | 1/12/41 | 5.00% (1 month USD- | Synthetic MBX Index | 7 |
| | | | | LIBOR) — Monthly | 5.00% 30 year Fannie Mae | |
| | | | | | pools — Monthly | |
| Credit Suisse International | | | | | |
| 10,811 | 10,523 | — | 1/12/41 | (4.00%) 1 month USD- | Synthetic TRS Index | 127 |
| | | | | LIBOR — Monthly | 4.00% 30 year Fannie Mae | |
| | | | | | pools — Monthly | |
| Goldman Sachs International | | | | | |
| 1,541,140 | 1,553,680 | — | 12/15/25 | (1 month USD-LIBOR- | A basket (GSGLPHCL) | 12,464 |
| | | | | BBA plus 0.35%) — | of common stocks — | |
| | | | | Monthly | Monthly* | |
| 5,094,593 | 5,159,546 | — | 12/15/25 | (1 month USD-LIBOR- | A basket (GSGLPWDL) | 71,285 |
| | | | | BBA plus 0.50%) — | of common stocks — | |
| | | | | Monthly | Monthly* | |
| 5,150,657 | 5,196,964 | — | 12/15/25 | 1 month USD-LIBOR- | A basket (GSGLPWDS) | (51,255) |
| | | | | BBA minus 0.15% — | of common stocks — | |
| | | | | Monthly | Monthly* | |
| 1,718 | 1,671 | — | 1/12/42 | 4.00% (1 month USD- | Synthetic TRS Index | (22) |
| | | | | LIBOR) — Monthly | 4.00% 30 year Fannie Mae | |
| | | | | | pools — Monthly | |
| 1,718 | 1,671 | — | 1/12/42 | 4.00% (1 month USD- | Synthetic TRS Index | (22) |
| | | | | LIBOR) — Monthly | 4.00% 30 year Fannie Mae | |
| | | | | | pools — Monthly | |
| |
| Putnam VT Global Asset Allocation Fund | 29 |
OTC TOTAL RETURN SWAP CONTRACTS OUTSTANDING at 12/31/20 cont.
| | | | | | |
| | | Upfront | | Payments | Total return | Unrealized |
| Swap counterparty/ | | premium | Termination | received (paid) | received by | appreciation/ |
| Notional amount | Value | received (paid) | date | by fund | or paid by fund | (depreciation) |
| JPMorgan Securities LLC | | | | | |
| $2,872 | $2,796 | $— | 1/12/41 | (4.00%) 1 month USD- | Synthetic TRS Index | $34 |
| | | | | LIBOR — Monthly | 4.00% 30 year Fannie Mae | |
| | | | | | pools — Monthly | |
| 4,132 | 4,019 | — | 1/12/42 | (4.00%) 1 month USD- | Synthetic TRS Index | 52 |
| | | | | LIBOR — Monthly | 4.00% 30 year Fannie Mae | |
| | | | | | pools — Monthly | |
| Upfront premium received | — | | Unrealized appreciation | 84,208 |
| Upfront premium (paid) | — | | Unrealized (depreciation) | (51,528) |
| Total | | $— | | Total | | $32,680 |
* The 50 largest components, and any individual component greater than 1% of basket value, are shown below.
A BASKET (GSGLPHCL) OF COMMON STOCKS
| | | | |
| | | | | Percentage |
| Common stocks | Sector | Shares | Value | value |
| Merck KGaA (Germany) | Health care | 413 | $70,959 | 4.57% |
| PerkinElmer, Inc. | Health care | 484 | 69,473 | 4.47% |
| Mettler-Toledo International, Inc. | Health care | 60 | 68,591 | 4.41% |
| Waters Corp. | Health care | 259 | 64,033 | 4.12% |
| Agilent Technologies, Inc. | Technology | 538 | 63,739 | 4.10% |
| Thermo Fisher Scientific, Inc. | Health care | 135 | 62,690 | 4.03% |
| IQVIA Holdings, Inc. | Health care | 343 | 61,388 | 3.95% |
| Zoetis, Inc. | Health care | 348 | 57,551 | 3.70% |
| Pfizer, Inc. | Health care | 1,466 | 53,947 | 3.47% |
| Alexion Pharmaceuticals, Inc. | Health care | 332 | 51,900 | 3.34% |
| Viatris, Inc. | Health care | 2,757 | 51,671 | 3.33% |
| Merck & Co., Inc. | Health care | 623 | 50,941 | 3.28% |
| Illumina, Inc. | Health care | 131 | 48,420 | 3.12% |
| Ipsen SA (France) | Health care | 575 | 47,768 | 3.07% |
| Johnson & Johnson | Health care | 288 | 45,282 | 2.91% |
| GlaxoSmithKline PLC (United Kingdom) | Health care | 2,290 | 42,013 | 2.70% |
| AbbVie, Inc. | Health care | 387 | 41,448 | 2.67% |
| Sanofi (France) | Health care | 413 | 39,799 | 2.56% |
| Perrigo Co. PLC | Health care | 849 | 37,946 | 2.44% |
| Taisho Pharmaceutical Holdings Co., Ltd. (Japan) | Health care | 532 | 35,827 | 2.31% |
| Bayer AG (Germany) | Health care | 584 | 34,391 | 2.21% |
| Sumitomo Dainippon Pharma Co., Ltd. (Japan) | Health care | 2,221 | 32,764 | 2.11% |
| Bristol-Myers Squibb Co. | Health care | 504 | 31,261 | 2.01% |
| CSL, Ltd. (Australia) | Health care | 135 | 29,589 | 1.90% |
| Biogen, Inc. | Health care | 118 | 28,838 | 1.86% |
| AstraZeneca PLC (United Kingdom) | Health care | 278 | 27,859 | 1.79% |
| Sartorius Stedim Biotech (France) | Health care | 78 | 27,825 | 1.79% |
| Teva Pharmaceutical Industries, Ltd. ADR (Israel) | Health care | 2,614 | 25,226 | 1.62% |
| Amgen, Inc. | Health care | 107 | 24,616 | 1.58% |
| Galenica AG (Switzerland) | Health care | 151 | 23,781 | 1.53% |
| Gilead Sciences, Inc. | Health care | 371 | 21,608 | 1.39% |
| Hisamitsu Pharmaceutical Co., Inc. (Japan) | Health care | 361 | 21,405 | 1.38% |
| Takeda Pharmaceutical Co., Ltd. (Japan) | Health care | 512 | 18,630 | 1.20% |
| Eli Lilly and Co. | Health care | 104 | 17,574 | 1.13% |
| Galapagos NV (Belgium) | Health care | 165 | 16,234 | 1.04% |
| Eisai Co., Ltd. (Japan) | Health care | 207 | 14,748 | 0.95% |
| Shionogi & Co., Ltd. (Japan) | Health care | 246 | 13,409 | 0.86% |
| Hikma Pharmaceuticals PLC (United Kingdom) | Health care | 374 | 12,874 | 0.83% |
| H Lundbeck A/S (Denmark) | Health care | 318 | 10,910 | 0.70% |
| Astellas Pharma, Inc. (Japan) | Health care | 600 | 9,256 | 0.60% |
| UCB SA (Belgium) | Health care | 81 | 8,379 | 0.54% |
| |
| 30 | Putnam VT Global Asset Allocation Fund |
A BASKET (GSGLPHCL) OF COMMON STOCKS cont.
| | | | |
| | | | | Percentage |
| Common stocks | Sector | Shares | Value | value |
| Incyte Corp. | Health care | 87 | $7,537 | 0.49% |
| Grifols SA (Spain) | Health care | 236 | 6,890 | 0.44% |
| Eurofins Scientific (Luxembourg) | Health care | 64 | 5,413 | 0.35% |
| Novartis AG (Switzerland) | Health care | 46 | 4,321 | 0.28% |
| Daiichi Sankyo Co., Ltd. (Japan) | Health care | 124 | 4,263 | 0.27% |
| Regeneron Pharmaceuticals, Inc. | Health care | 8 | 3,989 | 0.26% |
| Recordati SpA (Italy) | Health care | 36 | 1,989 | 0.13% |
| Orion Oyj Class B (Finland) | Health care | 37 | 1,705 | 0.11% |
| Vertex Pharmaceuticals, Inc. | Health care | 6 | 1,498 | 0.10% |
A BASKET (GSGLPWDL) OF COMMON STOCKS
| | | | |
| | | | | Percentage |
| Common stocks | Sector | Shares | Value | value |
| Fortescue Metals Group, Ltd. (Australia) | Basic materials | 2,191 | $39,577 | 0.77% |
| Mitsubishi Heavy Industries, Ltd. (Japan) | Capital goods | 1,139 | 34,816 | 0.67% |
| Peugeot SA (France) | Consumer cyclicals | 1,196 | 32,692 | 0.63% |
| Citigroup, Inc. | Financials | 528 | 32,554 | 0.63% |
| Discovery, Inc. Class C | Consumer cyclicals | 1,228 | 32,164 | 0.62% |
| Cadence Design Systems, Inc. | Technology | 232 | 31,628 | 0.61% |
| Lincoln National Corp. | Financials | 621 | 31,242 | 0.61% |
| Woodside Petroleum, Ltd. (Australia) | Energy | 1,754 | 30,746 | 0.60% |
| Fujitsu, Ltd. (Japan) | Technology | 211 | 30,390 | 0.59% |
| Santos, Ltd. (Australia) | Energy | 6,237 | 30,146 | 0.58% |
| Allstate Corp. (The) | Financials | 273 | 29,970 | 0.58% |
| Ally Financial, Inc. | Financials | 833 | 29,721 | 0.58% |
| Arrow Electronics, Inc. | Technology | 305 | 29,689 | 0.58% |
| Toronto-Dominion Bank (Canada) | Financials | 525 | 29,664 | 0.57% |
| GVC Holdings PLC (Isle of Man) | Consumer cyclicals | 1,911 | 29,625 | 0.57% |
| ITOCHU Corp. (Japan) | Consumer staples | 1,029 | 29,542 | 0.57% |
| Annaly Capital Management, Inc. | Financials | 3,483 | 29,431 | 0.57% |
| Repsol SA (Spain) | Energy | 2,897 | 29,198 | 0.57% |
| Invesco, Ltd. | Financials | 1,673 | 29,164 | 0.57% |
| Nippon Telegraph & Telephone Corp. (Japan) | Communication services | 1,123 | 28,779 | 0.56% |
| NN Group NV (Netherlands) | Financials | 661 | 28,696 | 0.56% |
| Canadian Tire Corp., Ltd. (Canada) | Consumer cyclicals | 218 | 28,629 | 0.55% |
| Nomura Holdings, Inc. (Japan) | Financials | 5,409 | 28,551 | 0.55% |
| Fox Corp. Class A | Consumer cyclicals | 976 | 28,427 | 0.55% |
| Mitsubishi Chemical Holdings Corp. (Japan) | Basic materials | 4,691 | 28,359 | 0.55% |
| Royal Bank of Canada (Canada) | Financials | 345 | 28,332 | 0.55% |
| Pandora A/S (Denmark) | Consumer cyclicals | 253 | 28,225 | 0.55% |
| State Street Corp. | Financials | 385 | 27,991 | 0.54% |
| Aurizon Holdings, Ltd. (Australia) | Transportation | 9,300 | 27,962 | 0.54% |
| Principal Financial Group, Inc. | Financials | 561 | 27,826 | 0.54% |
| Canadian Imperial Bank of Commerce (Canada) | Financials | 325 | 27,751 | 0.54% |
| AGNC Investment Corp. | Financials | 1,777 | 27,719 | 0.54% |
| Hologic, Inc. | Health care | 380 | 27,649 | 0.54% |
| Logitech International SA (Switzerland) | Technology | 285 | 27,637 | 0.54% |
| Koninklijke Ahold Delhaize NV (Netherlands) | Consumer staples | 972 | 27,434 | 0.53% |
| MetLife, Inc. | Financials | 581 | 27,297 | 0.53% |
| Sumitomo Mitsui Trust Holdings, Inc. (Japan) | Financials | 887 | 27,280 | 0.53% |
| Lennar Corp. Class A | Consumer cyclicals | 358 | 27,267 | 0.53% |
| Givaudan SA (Switzerland) | Basic materials | 6 | 27,258 | 0.53% |
| PulteGroup, Inc. | Consumer cyclicals | 632 | 27,256 | 0.53% |
| Swisscom AG (Switzerland) | Communication services | 50 | 27,200 | 0.53% |
| Roche Holding AG (Switzerland) | Health care | 78 | 27,180 | 0.53% |
| Muenchener Rueckversicherungs-Gesellschaft AG in | Financials | 91 | 27,087 | 0.52% |
| Muenchen (Germany) | | | | |
| |
| Putnam VT Global Asset Allocation Fund | 31 |
A BASKET (GSGLPWDL) OF COMMON STOCKS cont.
| | | | |
| | | | | Percentage |
| Common stocks | Sector | Shares | Value | value |
| AMETEK, Inc. | Conglomerates | 224 | $27,033 | 0.52% |
| Knight-Swift Transportation Holdings, Inc. | Transportation | 646 | 26,998 | 0.52% |
| Church & Dwight Co., Inc. | Consumer staples | 309 | 26,981 | 0.52% |
| Ford Motor Co. | Consumer cyclicals | 3,065 | 26,944 | 0.52% |
| Deutsche Bank AG (Germany) | Financials | 2,461 | 26,907 | 0.52% |
| Paychex, Inc. | Technology | 288 | 26,829 | 0.52% |
| Copart, Inc. | Consumer staples | 210 | 26,697 | 0.52% |
A BASKET (GSGLPWDS) OF COMMON STOCKS
| | | | |
| | | | | Percentage |
| Common stocks | Sector | Shares | Value | value |
| Slack Technologies, Inc. Class A | Technology | 1,045 | $44,152 | 0.85% |
| Walt Disney Co. (The) | Consumer cyclicals | 185 | 33,555 | 0.65% |
| Renault SA (France) | Consumer cyclicals | 755 | 32,999 | 0.63% |
| Square, Inc. Class A | Consumer cyclicals | 151 | 32,894 | 0.63% |
| Sharp Corp./Japan (Japan) | Consumer cyclicals | 2,149 | 32,556 | 0.63% |
| Cameco Corp. (Canada) | Basic materials | 2,423 | 32,459 | 0.62% |
| Nissan Motor Co., Ltd. (Japan) | Consumer cyclicals | 5,925 | 32,132 | 0.62% |
| Twilio, Inc. Class A | Technology | 95 | 32,033 | 0.62% |
| Albemarle Corp. | Basic materials | 214 | 31,616 | 0.61% |
| ThyssenKrupp AG (Germany) | Basic materials | 3,169 | 31,452 | 0.61% |
| Hess Corp. | Energy | 588 | 31,046 | 0.60% |
| Suncor Energy, Inc. (Canada) | Energy | 1,831 | 30,707 | 0.59% |
| Hong Kong Exchanges and Clearing, Ltd. (Hong Kong) | Financials | 551 | 30,198 | 0.58% |
| Argenx SE (Netherlands) | Health care | 102 | 30,047 | 0.58% |
| ASML Holding NV (Netherlands) | Technology | 62 | 29,896 | 0.58% |
| MarketAxess Holdings, Inc. | Consumer cyclicals | 52 | 29,581 | 0.57% |
| WPP PLC (United Kingdom) | Consumer cyclicals | 2,680 | 29,321 | 0.56% |
| Bunge, Ltd. | Consumer staples | 446 | 29,281 | 0.56% |
| Panasonic Corp. (Japan) | Consumer cyclicals | 2,526 | 29,124 | 0.56% |
| Live Nation Entertainment, Inc. | Consumer cyclicals | 395 | 29,049 | 0.56% |
| First Republic Bank | Financials | 197 | 28,980 | 0.56% |
| Fast Retailing Co., Ltd. (Japan) | Consumer cyclicals | 32 | 28,946 | 0.56% |
| AIA Group, Ltd. (Hong Kong) | Financials | 2,356 | 28,869 | 0.56% |
| Exact Sciences Corp. | Health care | 217 | 28,801 | 0.55% |
| Zurich Insurance Group AG (Switzerland) | Financials | 68 | 28,778 | 0.55% |
| Arthur J. Gallagher & Co. | Financials | 229 | 28,335 | 0.55% |
| Intact Financial Corp. (Canada) | Financials | 239 | 28,248 | 0.54% |
| Marathon Petroleum Corp. | Energy | 682 | 28,208 | 0.54% |
| Caterpillar, Inc. | Capital goods | 153 | 27,936 | 0.54% |
| T-Mobile US, Inc. | Communication services | 207 | 27,849 | 0.54% |
| Tradeweb Markets, Inc. Class A | Financials | 445 | 27,813 | 0.54% |
| Jacobs Engineering Group, Inc. | Capital goods | 253 | 27,536 | 0.53% |
| Analog Devices, Inc. | Technology | 186 | 27,482 | 0.53% |
| James Hardie Industries PLC (CDI) (Australia) | Basic materials | 930 | 27,398 | 0.53% |
| Aon PLC | Financials | 130 | 27,360 | 0.53% |
| American Express Co. | Financials | 226 | 27,353 | 0.53% |
| Aeon Co., Ltd. | Consumer cyclicals | 834 | 27,335 | 0.53% |
| ABB, Ltd. (Switzerland) | Capital goods | 979 | 27,312 | 0.53% |
| Hang Seng Bank, Ltd. (Hong Kong) | Financials | 1,584 | 27,310 | 0.53% |
| Daiichi Sankyo Co., Ltd. (Japan) | Health care | 793 | 27,141 | 0.52% |
| Accor SA (France) | Consumer cyclicals | 744 | 26,894 | 0.52% |
| Archer-Daniels-Midland Co. | Basic materials | 532 | 26,826 | 0.52% |
| Emera, Inc. (Canada) | Utilities and power | 625 | 26,567 | 0.51% |
| Camden Property Trust | Financials | 264 | 26,421 | 0.51% |
| Cellnex Telecom, SA 144A (Spain) | Communication services | 437 | 26,252 | 0.51% |
| |
| 32 | Putnam VT Global Asset Allocation Fund |
A BASKET (GSGLPWDS) OF COMMON STOCKS cont.
| | | | |
| | | | | Percentage |
| Common stocks | Sector | Shares | Value | value |
| Prologis, Inc. | Financials | 263 | $26,211 | 0.50% |
| Markel Corp. | Financials | 25 | 26,058 | 0.50% |
| Equity Lifestyle Properties, Inc. | Financials | 411 | 26,020 | 0.50% |
| Edison International | Utilities and power | 413 | 25,919 | 0.50% |
| UDR, Inc. | Financials | 673 | 25,864 | 0.50% |
OTC CREDIT DEFAULT CONTRACTS OUTSTANDING — PROTECTION SOLD at 12/31/20
| | | | | | | |
| | | Upfront | | | | | |
| | | premium | | | Termi- | | Unrealized |
| Swap counterparty/ | | received | Notional | | nation | Payments | appreciation/ |
| Referenced debt* | Rating*** | (paid)** | amount | Value | date | received by fund | (depreciation) |
| Bank of America N.A. | | | | | | | |
| CMBX NA BBB–.6 Index | BB/P | $273 | $4,000 | $1,068 | 5/11/63 | 300 bp — Monthly | $(792) |
| CMBX NA BBB–.6 Index | BB/P | 482 | 8,000 | 2,136 | 5/11/63 | 300 bp — Monthly | (1,649) |
| CMBX NA BBB–.6 Index | BB/P | 926 | 15,000 | 4,005 | 5/11/63 | 300 bp — Monthly | (3,070) |
| CMBX NA BBB–.6 Index | BB/P | 912 | 16,000 | 4,272 | 5/11/63 | 300 bp — Monthly | (3,351) |
| Citigroup Global Markets, Inc. | | | | | | | |
| CMBX NA A.6 Index | A/P | 120 | 1,000 | 75 | 5/11/63 | 200 bp — Monthly | 45 |
| CMBX NA A.6 Index | A/P | 239 | 2,000 | 151 | 5/11/63 | 200 bp — Monthly | 89 |
| CMBX NA A.6 Index | A/P | 2,681 | 22,000 | 1,657 | 5/11/63 | 200 bp — Monthly | 1,033 |
| CMBX NA A.6 Index | A/P | 4,405 | 37,000 | 2,786 | 5/11/63 | 200 bp — Monthly | 1,634 |
| CMBX NA A.6 Index | A/P | 6,040 | 51,000 | 3,840 | 5/11/63 | 200 bp — Monthly | 2,220 |
| CMBX NA BB.11 Index | BB–/P | 1,130 | 2,000 | 469 | 11/18/54 | 500 bp — Monthly | 663 |
| CMBX NA BB.6 Index | B/P | 2,008 | 14,000 | 5,940 | 5/11/63 | 500 bp — Monthly | (3,918) |
| CMBX NA BB.7 Index | B+/P | 970 | 19,000 | 7,391 | 1/17/47 | 500 bp — Monthly | (6,403) |
| Credit Suisse International | | | | | | | |
| CMBX NA A.7 Index | A-/P | 37 | 1,000 | 84 | 1/17/47 | 200 bp — Monthly | (47) |
| CMBX NA A.7 Index | A-/P | 291 | 7,000 | 587 | 1/17/47 | 200 bp — Monthly | (293) |
| CMBX NA BB.7 Index | B+/P | 401 | 3,000 | 1,167 | 1/17/47 | 500 bp — Monthly | (763) |
| CMBX NA BBB–.6 Index | BB/P | 14,003 | 149,000 | 39,783 | 5/11/63 | 300 bp — Monthly | (25,699) |
| CMBX NA BBB–.7 Index | BB+/P | 237 | 3,000 | 596 | 1/17/47 | 300 bp — Monthly | (358) |
| CMBX NA BBB–.7 Index | BB+/P | 1,379 | 21,000 | 4,175 | 1/17/47 | 300 bp — Monthly | (2,783) |
| Goldman Sachs International | | | | | | | |
| CMBX NA A.6 Index | A/P | 51 | 1,000 | 75 | 5/11/63 | 200 bp — Monthly | (24) |
| CMBX NA A.6 Index | A/P | 63 | 2,000 | 151 | 5/11/63 | 200 bp — Monthly | (87) |
| CMBX NA A.6 Index | A/P | 61 | 2,000 | 151 | 5/11/63 | 200 bp — Monthly | (89) |
| CMBX NA A.6 Index | A/P | 152 | 3,000 | 226 | 5/11/63 | 200 bp — Monthly | (73) |
| CMBX NA A.6 Index | A/P | 1,085 | 18,000 | 1,355 | 5/11/63 | 200 bp — Monthly | (264) |
| CMBX NA A.6 Index | A/P | 3,136 | 51,000 | 3,840 | 5/11/63 | 200 bp — Monthly | (685) |
| CMBX NA BBB–.6 Index | BB/P | 122 | 1,000 | 267 | 5/11/63 | 300 bp — Monthly | (145) |
| CMBX NA BBB–.6 Index | BB/P | 79 | 1,000 | 267 | 5/11/63 | 300 bp — Monthly | (187) |
| CMBX NA BBB–.6 Index | BB/P | 68 | 1,000 | 267 | 5/11/63 | 300 bp — Monthly | (198) |
| CMBX NA BBB–.6 Index | BB/P | 104 | 2,000 | 534 | 5/11/63 | 300 bp — Monthly | (429) |
| CMBX NA BBB–.6 Index | BB/P | 173 | 2,000 | 534 | 5/11/63 | 300 bp — Monthly | (360) |
| CMBX NA BBB–.6 Index | BB/P | 145 | 3,000 | 801 | 5/11/63 | 300 bp — Monthly | (654) |
| CMBX NA BBB–.6 Index | BB/P | 325 | 3,000 | 801 | 5/11/63 | 300 bp — Monthly | (474) |
| CMBX NA BBB–.6 Index | BB/P | 248 | 5,000 | 1,335 | 5/11/63 | 300 bp — Monthly | (1,084) |
| CMBX NA BBB–.6 Index | BB/P | 772 | 7,000 | 1,869 | 5/11/63 | 300 bp — Monthly | (1,093) |
| CMBX NA BBB–.6 Index | BB/P | 2,157 | 23,000 | 6,141 | 5/11/63 | 300 bp — Monthly | (3,970) |
| CMBX NA BBB–.6 Index | BB/P | 3,157 | 42,000 | 11,214 | 5/11/63 | 300 bp — Monthly | (8,032) |
| CMBX NA BBB–.7 Index | BB+/P | 887 | 12,000 | 2,386 | 1/17/47 | 300 bp — Monthly | (1,492) |
| JPMorgan Securities LLC | | | | | | | |
| CMBX NA A.13 Index | A-/P | 403 | 5,000 | 152 | 12/16/72 | 200 bp — Monthly | 254 |
| CMBX NA BB.6 Index | B/P | 3,089 | 6,000 | 2,546 | 5/11/63 | 500 bp — Monthly | 549 |
| CMBX NA BBB– .13 Index | BBB–/P | 367 | 4,000 | 247 | 12/16/72 | 300 bp — Monthly | 122 |
| |
| Putnam VT Global Asset Allocation Fund | 33 |
OTC CREDIT DEFAULT CONTRACTS OUTSTANDING — PROTECTION SOLD at 12/31/20 cont.
| | | | | | | |
| | | Upfront | | | | | |
| | | premium | | | Termi- | | Unrealized |
| Swap counterparty/ | | received | Notional�� | | nation | Payments | appreciation/ |
| Referenced debt* | Rating*** | (paid)** | amount | Value | date | received by fund | (depreciation) |
| Morgan Stanley & Co. International PLC | | | | | | |
| CMBX NA BB.6 Index | B/P | $737 | $3,000 | $1,273 | 5/11/63 | 500 bp — Monthly | $(533) |
| CMBX NA BB.6 Index | B/P | 1,478 | 6,000 | 2,546 | 5/11/63 | 500 bp — Monthly | (1,062) |
| Upfront premium received | | 55,393 | Unrealized appreciation | | | 6,609 |
| Upfront premium (paid) | | — | Unrealized (depreciation) | | | (70,061) |
| Total | | $55,393 | Total | | | | $(63,452) |
* Payments related to the referenced debt are made upon a credit default event.
** Upfront premium is based on the difference between the original spread on issue and the market spread on day of execution.
*** Ratings for an underlying index represent the average of the ratings of all the securities included in that index. The Moody’s, Standard & Poor’s or Fitch ratings are believed to be the most recent ratings available at December 31, 2020. Securities rated by Fitch are indicated by “/F.” Securities rated by Putnam are indicated by “/P.” The Putnam rating categories are comparable to the Standard & Poor’s classifications.
OTC CREDIT DEFAULT CONTRACTS OUTSTANDING — PROTECTION PURCHASED at 12/31/20
| | | | | | |
| | Upfront | | | | | |
| | premium | | | Termi- | Payments | Unrealized |
| Swap counterparty/ | received | Notional | | nation | (paid) | appreciation/ |
| Referenced debt* | (paid)** | amount | Value | date | by fund | (depreciation) |
| Citigroup Global Markets, Inc. | | | | | | |
| CMBX NA BB.10 Index | $(219) | $2,000 | $694 | 11/17/59 | (500 bp) — Monthly | $473 |
| CMBX NA BB.10 Index | (209) | 2,000 | 694 | 11/17/59 | (500 bp) — Monthly | 484 |
| CMBX NA BB.11 Index | (777) | 6,000 | 1,408 | 11/18/54 | (500 bp) — Monthly | 624 |
| CMBX NA BB.11 Index | (189) | 2,000 | 469 | 11/18/54 | (500 bp) — Monthly | 279 |
| CMBX NA BB.11 Index | (69) | 1,000 | 235 | 11/18/54 | (500 bp) — Monthly | 165 |
| CMBX NA BB.12 Index | (1,631) | 5,000 | 1,054 | 8/17/61 | (500 bp) — Monthly | (582) |
| CMBX NA BB.8 Index | (248) | 2,000 | 795 | 10/17/57 | (500 bp) — Monthly | 545 |
| CMBX NA BB.9 Index | (1,445) | 14,000 | 4,732 | 9/17/58 | (500 bp) — Monthly | 3,273 |
| CMBX NA BB.9 Index | (258) | 4,000 | 1,352 | 9/17/58 | (500 bp) — Monthly | 1,090 |
| CMBX NA BB.9 Index | (258) | 4,000 | 1,352 | 9/17/58 | (500 bp) — Monthly | 1,090 |
| CMBX NA BB.9 Index | (121) | 3,000 | 1,014 | 9/17/58 | (500 bp) — Monthly | 890 |
| CMBX NA BBB– .10 Index | (1,735) | 11,000 | 1,360 | 11/17/59 | (300 bp) — Monthly | (382) |
| CMBX NA BBB– .10 Index | (437) | 2,000 | 247 | 11/17/59 | (300 bp) — Monthly | (191) |
| CMBX NA BBB– .12 Index | (204) | 1,000 | 79 | 8/17/61 | (300 bp) — Monthly | (125) |
| CMBX NA BBB– .12 Index | (226) | 1,000 | 79 | 8/17/61 | (300 bp) — Monthly | (147) |
| CMBX NA BBB– .6 Index | (2,545) | 8,000 | 2,136 | 5/11/63 | (300 bp) — Monthly | (414) |
| CMBX NA BBB–.10 Index | (1,192) | 4,000 | 494 | 11/17/59 | (300 bp) — Monthly | (700) |
| CMBX NA BBB–.12 Index | (1,892) | 6,000 | 474 | 8/17/61 | (300 bp) — Monthly | (1,422) |
| CMBX NA BBB–.12 Index | (1,025) | 3,000 | 237 | 8/17/61 | (300 bp) — Monthly | (790) |
| CMBX NA BBB–.12 Index | (705) | 2,000 | 158 | 8/17/61 | (300 bp) — Monthly | (548) |
| CMBX NA BBB–.12 Index | (668) | 2,000 | 158 | 8/17/61 | (300 bp) — Monthly | (511) |
| CMBX NA BBB–.12 Index | (169) | 1,000 | 79 | 8/17/61 | (300 bp) — Monthly | (91) |
| CMBX NA BBB–.12 Index | (352) | 1,000 | 79 | 8/17/61 | (300 bp) — Monthly | (273) |
| CMBX NA BBB–.12 Index | (190) | 1,000 | 79 | 8/17/61 | (300 bp) — Monthly | (112) |
| CMBX NA BBB–.6 Index | (700) | 11,000 | 2,937 | 5/11/63 | (300 bp) — Monthly | 2,230 |
| CMBX NA BBB–.9 Index | (237) | 1,000 | 119 | 9/17/58 | (300 bp) — Monthly | (118) |
| Credit Suisse International | | | | | | |
| CMBX NA BB.10 Index | (534) | 4,000 | 1,388 | 11/17/59 | (500 bp) — Monthly | 851 |
| CMBX NA BB.10 Index | (476) | 4,000 | 1,388 | 11/17/59 | (500 bp) — Monthly | 909 |
| CMBX NA BB.10 Index | (249) | 2,000 | 694 | 11/17/59 | (500 bp) — Monthly | 444 |
| CMBX NA BB.7 Index | (512) | 29,000 | 12,305 | 5/11/63 | (500 bp) — Monthly | 11,765 |
| CMBX NA BB.7 Index | (1,291) | 7,000 | 2,723 | 1/17/47 | (500 bp) — Monthly | 1,425 |
| CMBX NA BB.7 Index | (1,151) | 7,000 | 2,723 | 1/17/47 | (500 bp) — Monthly | 1,565 |
| CMBX NA BB.9 Index | (1,403) | 14,000 | 4,732 | 9/17/58 | (500 bp) — Monthly | 3,315 |
| Goldman Sachs International | | | | | | |
| CMBX NA BB.7 Index | (303) | 2,000 | 778 | 1/17/47 | (500 bp) — Monthly | 473 |
| CMBX NA BB.10 Index | (783) | 2,000 | 694 | 11/17/59 | (500 bp) — Monthly | (90) |
| CMBX NA BB.7 Index | (2,234) | 11,000 | 4,279 | 1/17/47 | (500 bp) — Monthly | 2,035 |
| |
| 34 | Putnam VT Global Asset Allocation Fund |
OTC CREDIT DEFAULT CONTRACTS OUTSTANDING — PROTECTION PURCHASED at 12/31/20 cont.
| | | | | | |
| | Upfront | | | | | |
| | premium | | | Termi- | Payments | Unrealized |
| Swap counterparty/ | received | Notional | | nation | (paid) | appreciation/ |
| Referenced debt* | (paid)** | amount | Value | date | by fund | (depreciation) |
| Goldman Sachs International cont. | | | | | | |
| CMBX NA BB.7 Index | $(983) | $6,000 | $2,334 | 1/17/47 | (500 bp) — Monthly | $1,345 |
| CMBX NA BB.8 Index | (113) | 1,000 | 397 | 10/17/57 | (500 bp) — Monthly | 283 |
| CMBX NA BB.9 Index | (108) | 1,000 | 338 | 9/17/58 | (500 bp) — Monthly | 229 |
| CMBX NA BBB– .10 Index | (1,312) | 6,000 | 742 | 11/17/59 | (300 bp) — Monthly | (574) |
| CMBX NA BBB– .10 Index | (624) | 4,000 | 494 | 11/17/59 | (300 bp) — Monthly | (132) |
| CMBX NA BBB– .12 Index | (1,170) | 6,000 | 474 | 8/17/61 | (300 bp) — Monthly | (699) |
| CMBX NA BBB–.12 Index | (338) | 1,000 | 79 | 8/17/61 | (300 bp) — Monthly | (259) |
| CMBX NA BBB–.6 Index | (400) | 8,000 | 2,136 | 5/11/63 | (300 bp) — Monthly | 1,731 |
| JPMorgan Securities LLC | | | | | | |
| CMBX NA A.7 Index | (169) | 8,000 | 670 | 1/17/47 | (200 bp) — Monthly | 499 |
| CMBX NA BB.11 Index | (4,908) | 9,000 | 2,111 | 11/18/54 | (500 bp) — Monthly | (2,806) |
| CMBX NA BB.12 Index | (1,648) | 3,000 | 632 | 8/17/61 | (500 bp) — Monthly | (1,018) |
| CMBX NA BB.17 Index | (979) | 2,000 | 778 | 1/17/47 | (500 bp) — Monthly | (203) |
| CMBX NA BBB– .10 Index | (165) | 1,000 | 124 | 11/17/59 | (300 bp) — Monthly | (42) |
| CMBX NA BBB–.10 Index | (563) | 2,000 | 247 | 11/17/59 | (300 bp) — Monthly | (317) |
| CMBX NA BBB–.10 Index | (298) | 1,000 | 124 | 11/17/59 | (300 bp) — Monthly | (175) |
| CMBX NA BBB–.11 Index | (806) | 4,000 | 305 | 11/18/54 | (300 bp) — Monthly | (504) |
| CMBX NA BBB–.11 Index | (314) | 1,000 | 76 | 11/18/54 | (300 bp) — Monthly | (239) |
| CMBX NA BBB–.6 Index | (15,346) | 48,000 | 12,816 | 5/11/63 | (300 bp) — Monthly | (2,558) |
| CMBX NA BBB–.7 Index | (6,573) | 28,000 | 5,566 | 1/17/47 | (300 bp) — Monthly | (1,023) |
| Merrill Lynch International | | | | | | |
| CMBX NA BB.10 Index | (228) | 4,000 | 1,388 | 11/17/59 | (500 bp) — Monthly | 1,157 |
| CMBX NA BB.11 Index | (1,977) | 4,000 | 938 | 11/18/54 | (500 bp) — Monthly | (1,042) |
| CMBX NA BB.9 Index | (117) | 3,000 | 1,014 | 9/17/58 | (500 bp) — Monthly | 894 |
| CMBX NA BBB– .10 Index | (217) | 1,000 | 124 | 11/17/59 | (300 bp) — Monthly | (94) |
| CMBX NA BBB–.7 Index | (328) | 4,000 | 795 | 1/17/47 | (300 bp) — Monthly | 465 |
| CMBX NA BBB–.9 Index | (185) | 1,000 | 119 | 9/17/58 | (300 bp) — Monthly | (67) |
| CMBX NA BBB–.9 Index | (185) | 1,000 | 119 | 9/17/58 | (300 bp) — Monthly | (67) |
| Morgan Stanley & Co. International PLC | | | | | | |
| CMBX NA BBB–.7 Index | (408) | 4,000 | 795 | 1/17/47 | (300 bp) — Monthly | 385 |
| CMBX NA BB.10 Index | (210) | 2,000 | 694 | 11/17/59 | (500 bp) — Monthly | 483 |
| CMBX NA BB.11 Index | (196) | 2,000 | 469 | 11/18/54 | (500 bp) — Monthly | 271 |
| CMBX NA BB.11 Index | (95) | 1,000 | 235 | 11/18/54 | (500 bp) — Monthly | 138 |
| CMBX NA BB.12 Index | (600) | 1,000 | 211 | 8/17/61 | (500 bp) — Monthly | (390) |
| CMBX NA BB.7 Index | (804) | 4,000 | 1,556 | 1/17/47 | (500 bp) — Monthly | 748 |
| CMBX NA BB.7 Index | (193) | 1,000 | 389 | 1/17/47 | (500 bp) — Monthly | 195 |
| CMBX NA BB.9 Index | (61) | 1,000 | 338 | 9/17/58 | (500 bp) — Monthly | 276 |
| CMBX NA BB.9 Index | (62) | 1,000 | 338 | 9/17/58 | (500 bp) — Monthly | 276 |
| CMBX NA BBB– .10 Index | (6,792) | 39,000 | 4,820 | 11/17/59 | (300 bp) — Monthly | (1,994) |
| CMBX NA BBB– .10 Index | (970) | 6,000 | 742 | 11/17/59 | (300 bp) — Monthly | (232) |
| CMBX NA BBB– .10 Index | (859) | 6,000 | 742 | 11/17/59 | (300 bp) — Monthly | (121) |
| CMBX NA BBB– .10 Index | (217) | 1,000 | 124 | 11/17/59 | (300 bp) — Monthly | (94) |
| CMBX NA BBB– .10 Index | (218) | 1,000 | 124 | 11/17/59 | (300 bp) — Monthly | (95) |
| CMBX NA BBB– .12 Index | (233) | 1,000 | 79 | 8/17/61 | (300 bp) — Monthly | (154) |
| Upfront premium received | — | | | Unrealized appreciation | 43,300 |
| Upfront premium (paid) | (78,609) | | | Unrealized (depreciation) | (21,395) |
| Total | $(78,609) | | | Total | $21,905 |
* Payments related to the referenced debt are made upon a credit default event.
** Upfront premium is based on the difference between the original spread on issue and the market spread on day of execution.
| |
| Putnam VT Global Asset Allocation Fund | 35 |
CENTRALLY CLEARED CREDIT DEFAULT CONTRACTS OUTSTANDING — PROTECTION SOLD at 12/31/20
| | | | | | | |
| | | Upfront | | | | | |
| | | premium | | | Termi- | Payments | Unrealized |
| | | received | Notional | | nation | received | appreciation/ |
| Referenced debt* | Rating*** | (paid)** | amount | Value | date | by fund | (depreciation) |
| NA HY Series 35 Index | B+/P | $(22,318) | $544,000 | $50,660 | 12/20/25 | 500 bp — | $29,173 |
| | | | | | | Quarterly | |
| NA IG Series 35 Index | BBB+/P | (114,294) | 5,350,000 | 130,904 | 12/20/25 | 100 bp — | 18,245 |
| | | | | | | Quarterly | |
| Total | | $(136,612) | | | | | $47,418 |
* Payments related to the referenced debt are made upon a credit default event.
** Upfront premium is based on the difference between the original spread on issue and the market spread on day of execution.
*** Ratings for an underlying index represent the average of the ratings of all the securities included in that index. The Moody’s, Standard & Poor’s or Fitch ratings are believed to be the most recent ratings available at December 31, 2020. Securities rated by Fitch are indicated by “/F.” Securities rated by Putnam are indicated by “/P.” The Putnam rating categories are comparable to the Standard & Poor’s classifications.
| |
| 36 | Putnam VT Global Asset Allocation Fund |
ASC 820 establishes a three-level hierarchy for disclosure of fair value measurements. The valuation hierarchy is based upon the transparency of inputs to the valuation of the fund’s investments. The three levels are defined as follows:
Level 1: Valuations based on quoted prices for identical securities in active markets.
Level 2: Valuations based on quoted prices in markets that are not active or for which all significant inputs are observable, either directly or indirectly.
Level 3: Valuations based on inputs that are unobservable and significant to the fair value measurement.
The following is a summary of the inputs used to value the fund’s net assets as of the close of the reporting period:
| | | |
| | | | Valuation inputs | |
| Investments in securities: | Level 1 | Level 2 | Level 3 |
| Common stocks*: | | | |
| Basic materials | $992,985 | $1,038,675 | $— |
| Capital goods | 5,083,662 | 675,595 | — |
| Communication services | 3,333,796 | 421,386 | — |
| Conglomerates | 219,506 | — | — |
| Consumer cyclicals | 6,858,902 | 1,934,366 | — |
| Consumer staples | 5,429,198 | 1,327,644 | — |
| Energy | 1,206,431 | 362,350 | 38 |
| Financials | 9,799,058 | 1,796,000 | — |
| Health care | 8,582,251 | 1,219,587 | — |
| Technology | 25,373,848 | 810,949 | — |
| Transportation | 789,402 | 355,483 | — |
| Utilities and power | 2,236,964 | 330,261 | — |
| Total common stocks | 69,906,003 | 10,272,296 | 38 |
| Asset-backed securities | — | 408,456 | — |
| Convertible bonds and notes | — | 14,298 | — |
| Corporate bonds and notes | — | 19,898,717 | 20 |
| Foreign government and agency bonds and notes | — | 750,285 | — |
| Mortgage-backed securities | — | 3,714,317 | — |
| Preferred stocks | — | 18,394 | — |
| Senior loans | — | 408,078 | — |
| U.S. government and agency mortgage obligations | — | 26,262,501 | — |
| Short-term investments | 14,566,068 | 1,795,161 | — |
| Totals by level | $84,472,071 | $63,542,503 | $58 |
| |
| | | | Valuation inputs | |
| Other financial instruments: | Level 1 | Level 2 | Level 3 |
| Forward currency contracts | $— | $150,539 | $— |
| Futures contracts | (30,080) | — | — |
| TBA sale commitments | — | (10,429,531) | — |
| Interest rate swap contracts | — | (20,594) | — |
| Total return swap contracts | — | 32,680 | — |
| Credit default contracts | — | 165,699 | — |
| Totals by level | $(30,080) | $(10,101,207) | $— |
* Common stock classifications are presented at the sector level, which may differ from the fund’s portfolio presentation.
At the start and close of the reporting period, Level 3 investments in securities represented less than 1% of the fund’s net assets and were not considered a significant portion of the fund’s portfolio.
The accompanying notes are an integral part of these financial statements.
| |
| Putnam VT Global Asset Allocation Fund | 37 |
Statement of assets and liabilities
12/31/20
| |
| Assets | |
| Investment in securities, at value, including $879,793 of securities on loan (Notes 1 and 9): | |
| Unaffiliated issuers (identified cost $106,328,842) | $132,553,314 |
| Affiliated issuers (identified cost $15,461,318) (Notes 1 and 5) | 15,461,318 |
| Cash | 14,293 |
| Foreign currency (cost $58,854) (Note 1) | 58,840 |
| Dividends, interest and other receivables | 435,342 |
| Foreign tax reclaim | 24,758 |
| Receivable for shares of the fund sold | 2,272 |
| Receivable for investments sold | 5,208 |
| Receivable for sales of TBA securities (Note 1) | 9,382,763 |
| Receivable for variation margin on futures contracts (Note 1) | 37,852 |
| Receivable for variation margin on centrally cleared swap contracts (Note 1) | 1,806 |
| Unrealized appreciation on forward currency contracts (Note 1) | 350,710 |
| Unrealized appreciation on OTC swap contracts (Note 1) | 134,117 |
| Premium paid on OTC swap contracts (Note 1) | 78,609 |
| Total assets | 158,541,202 |
| |
| Liabilities | |
| Payable for investments purchased | 70,921 |
| Payable for purchases of delayed delivery securities (Note 1) | 15,000 |
| Payable for purchases of TBA securities (Note 1) | 19,982,753 |
| Payable for shares of the fund repurchased | 121,046 |
| Payable for compensation of Manager (Note 2) | 61,983 |
| Payable for custodian fees (Note 2) | 73,612 |
| Payable for investor servicing fees (Note 2) | 14,440 |
| Payable for Trustee compensation and expenses (Note 2) | 115,770 |
| Payable for administrative services (Note 2) | 1,404 |
| Payable for distribution fees (Note 2) | 8,068 |
| Payable for variation margin on futures contracts (Note 1) | 66,858 |
| Payable for variation margin on centrally cleared swap contracts (Note 1) | 3,389 |
| Unrealized depreciation on OTC swap contracts (Note 1) | 142,984 |
| Premium received on OTC swap contracts (Note 1) | 55,393 |
| Unrealized depreciation on forward currency contracts (Note 1) | 200,171 |
| TBA sale commitments, at value (proceeds receivable $10,407,246) (Note 1) | 10,429,531 |
| Collateral on securities loaned, at value (Note 1) | 895,250 |
| Other accrued expenses | 120,470 |
| Total liabilities | 32,379,043 |
| | |
| Net assets | $126,162,159 |
| |
| Represented by | |
| Paid-in capital (Unlimited shares authorized) (Notes 1 and 4) | $96,226,146 |
| Total distributable earnings (Note 1) | 29,936,013 |
| Total — Representing net assets applicable to capital shares outstanding | $126,162,159 |
| | |
| Computation of net asset value Class IA | |
| Net assets | $87,731,623 |
| Number of shares outstanding | 4,818,412 |
| Net asset value, offering price and redemption price per share (net assets divided by number of shares outstanding) | $18.21 |
| | |
| Computation of net asset value Class IB | |
| Net assets | $38,430,536 |
| Number of shares outstanding | 2,080,984 |
| Net asset value, offering price and redemption price per share (net assets divided by number of shares outstanding) | $18.47 |
The accompanying notes are an integral part of these financial statements.
| |
| 38 | Putnam VT Global Asset Allocation Fund |
Statement of operations
Year ended 12/31/20
| |
| Investment income | |
| Dividends (net of foreign tax of $22,597) | $1,396,243 |
| Interest (net of foreign tax of $10 ) (including interest income of $144,247 from investments in affiliated issuers) (Note 5) | 1,173,852 |
| Securities lending (net of expenses) (Notes 1 and 5) | 8,260 |
| Total investment income | 2,578,355 |
| |
| Expenses | |
| Compensation of Manager (Note 2) | 696,700 |
| Investor servicing fees (Note 2) | 83,001 |
| Custodian fees (Note 2) | 69,128 |
| Trustee compensation and expenses (Note 2) | 5,585 |
| Distribution fees (Note 2) | 88,833 |
| Administrative services (Note 2) | 3,418 |
| Auditing and tax fees | 108,329 |
| Other | 50,820 |
| Total expenses | 1,105,814 |
| | |
| Expense reduction (Note 2) | (215) |
| Net expenses | 1,105,599 |
| | |
| Net investment income | 1,472,756 |
| | |
| Realized and unrealized gain (loss) | |
| Net realized gain (loss) on: | |
| Securities from unaffiliated issuers (Notes 1 and 3) | 1,246,367 |
| Foreign currency transactions (Note 1) | 2,259 |
| Forward currency contracts (Note 1) | 106,610 |
| Futures contracts (Note 1) | 1,938,481 |
| Swap contracts (Note 1) | (378,845) |
| Written options (Note 1) | (67,970) |
| Total net realized gain | 2,846,902 |
| | |
| Change in net unrealized appreciation (depreciation) on: | |
| Securities from unaffiliated issuers and TBA sale commitments | 9,345,056 |
| Assets and liabilities in foreign currencies | 2,168 |
| Forward currency contracts | 132,119 |
| Futures contracts | 171,274 |
| Swap contracts | 103,722 |
| Total change in net unrealized appreciation | 9,754,339 |
| | |
| Net gain on investments | 12,601,241 |
| | |
| Net increase in net assets resulting from operations | $14,073,997 |
The accompanying notes are an integral part of these financial statements.
| |
| Putnam VT Global Asset Allocation Fund | 39 |
Statement of changes in net assets
| | |
| | Year ended | Year ended |
| | 12/31/20 | 12/31/19 |
| Increase in net assets | | |
| Operations: | | |
| Net investment income | $1,472,756 | $2,410,101 |
| Net realized gain on investments and foreign currency transactions | 2,846,902 | 2,509,051 |
| Change in net unrealized appreciation of investments and assets and liabilities in foreign currencies | 9,754,339 | 15,319,658 |
| Net increase in net assets resulting from operations | 14,073,997 | 20,238,810 |
| Distributions to shareholders (Note 1): | | |
| From ordinary income | | |
| Net investment income | | |
| Class IA | (1,802,438) | (1,575,717) |
| Class IB | (649,646) | (544,903) |
| Net realized short-term gain on investments | | |
| Class IA | (140,974) | — |
| Class IB | (58,115) | — |
| From net realized long-term gain on investments | | |
| Class IA | (1,485,248) | (2,805,544) |
| Class IB | (612,287) | (1,160,190) |
| Decrease from capital share transactions (Note 4) | (8,657,923) | (12,277,650) |
| Total increase in net assets | 667,366 | 1,874,806 |
| Net assets: | | |
| Beginning of year | 125,494,793 | 123,619,987 |
| End of year | $126,162,159 | $125,494,793 |
The accompanying notes are an integral part of these financial statements.
| |
| 40 | Putnam VT Global Asset Allocation Fund |
Financial highlights (For a common share outstanding throughout the period)
| | | | | | | | | | | | | | |
| INVESTMENT OPERATIONS: | LESS DISTRIBUTIONS: | RATIOS AND SUPPLEMENTAL DATA: |
| Period ended | Net asset value, beginning of period | Net investment
income (loss)a | Net realized and unrealized gain (loss) on investments | Total from investment operations | From net investment income | From net realized gain on investments | Total distributions | Non-recurring reimbursements | Net asset value,
end of period | Total return at net asset value (%)b,c | Net assets, end of period (in thousands) | Ratio of expenses to average net assets (%)b,d | Ratio of net investment income (loss) to average net assets (%) | Portfolio turnover (%)e |
| Class IA | | | | | | | | | | | | | | |
| 12/31/20 | $16.95 | .22 | 1.72 | 1.94 | (.36) | (.32) | (.68) | — | $18.21 | 12.58 | $87,732 | .86 | 1.32 | 320 |
| 12/31/19 | 15.17 | .32 | 2.26 | 2.58 | (.29) | (.51) | (.80) | — | 16.95 | 17.42 | 88,722 | .86f | 1.98f | 164 |
| 12/31/18 | 18.14 | .33 | (1.53) | (1.20) | (.38) | (1.39) | (1.77) | — | 15.17 | (7.02) | 86,731 | .85 | 1.97 | 132 |
| 12/31/17 | 16.55 | .32 | 2.18 | 2.50 | (.30) | (.61) | (.91) | —g | 18.14 | 15.67 | 104,826 | .86 | 1.87 | 208 |
| 12/31/16 | 17.06 | .27 | .81 | 1.08 | (.38) | (1.21) | (1.59) | — | 16.55 | 6.98 | 103,689 | .87f,h | 1.66f,h | 384 |
| Class IB | | | | | | | | | | | | | | |
| 12/31/20 | $17.17 | .18 | 1.75 | 1.93 | (.31) | (.32) | (.63) | — | $18.47 | 12.31 | $38,431 | 1.11 | 1.06 | 320 |
| 12/31/19 | 15.35 | .28 | 2.29 | 2.57 | (.24) | (.51) | (.75) | — | 17.17 | 17.13 | 36,773 | 1.11f | 1.72f | 164 |
| 12/31/18 | 18.33 | .29 | (1.54) | (1.25) | (.34) | (1.39) | (1.73) | — | 15.35 | (7.26) | 36,889 | 1.10 | 1.71 | 132 |
| 12/31/17 | 16.72 | .28 | 2.20 | 2.48 | (.26) | (.61) | (.87) | —g | 18.33 | 15.34 | 46,701 | 1.11 | 1.61 | 208 |
| 12/31/16 | 17.21 | .23 | .82 | 1.05 | (.33) | (1.21) | (1.54) | — | 16.72 | 6.71 | 40,859 | 1.12f,h | 1.41f,h | 384 |
a Per share net investment income (loss) has been determined on the basis of weighted average number of shares outstanding during the period.
b The charges and expenses at the insurance company separate account level are not reflected.
c Total return assumes dividend reinvestment.
d Includes amounts paid through expense offset and/or brokerage/service arrangements, if any (Note 2). Also excludes acquired fund fees and expenses, if any.
e Portfolio turnover includes TBA purchase and sale commitments.
f Reflects an involuntary contractual expense limitation in effect during the period. As a result of such limitation, the expenses of each class reflect a reduction of the following amounts:
| | | |
| | Percentage of average | | |
| | net assets | | |
| December 31, 2019 | 0.01% | | |
| December 31, 2016 | 0.02 | | |
g Reflects a non-recurring reimbursement pursuant to a settlement between the Securities and Exchange Commission (the SEC) and Countrywide Financial which amounted to less than $0.01 per share outstanding on November 29, 2017.
h Reflects a voluntary waiver of certain fund expenses in effect during the period. As a result of such waivers, the expenses of each class reflect a reduction of less than 0.01% as a percentage of average net assets.
The accompanying notes are an integral part of these financial statements.
| |
| Putnam VT Global Asset Allocation Fund | 41 |
Notes to financial statements 12/31/20
Within the following Notes to financial statements, references to “State Street” represent State Street Bank and Trust Company, references to “the SEC” represent the Securities and Exchange Commission, references to “Putnam Management” represent Putnam Investment Management, LLC, the fund’s manager, an indirect wholly-owned subsidiary of Putnam Investments, LLC and references to “OTC”, if any, represent over-the-counter. Unless otherwise noted, the “reporting period” represents the period from January 1, 2020 through December 31, 2020.
Putnam VT Global Asset Allocation Fund (the fund) is a diversified series of Putnam Variable Trust (the Trust), a Massachusetts business trust registered under the Investment Company Act of 1940, as amended, as an open-end management investment company. The goal of the fund is to seek long-term return consistent with preservation of capital. The fund invests a majority of its assets in a diversified portfolio of equity securities (growth or value stocks or both) of both U.S. and foreign companies of any size. Putnam Management may consider, among other factors, a company’s valuation, financial strength, growth potential, competitive position in its industry, projected future earnings, cash flows and dividends when deciding whether to buy or sell equity investments. The fund also invests in a diversified portfolio of fixed-income investments, including both U.S. and foreign government obligations, corporate obligations and securitized debt instruments (such as mortgage-backed investments). Putnam Management may consider, among other factors, credit, interest rate and prepayment risks, as well as general market conditions, when deciding whether to buy or sell fixed-income investments. Putnam Management may also select other investments that do not fall within these asset classes. Putnam Management may also use to a significant extent derivatives, such as futures, options, certain foreign currency transactions, warrants and swap contracts, for both hedging and non-hedging purposes.
The fund offers class IA and class IB shares of beneficial interest. Class IA shares are offered at net asset value and are not subject to a distribution fee. Class IB shares are offered at net asset value and pay an ongoing distribution fee, which is identified in Note 2.
In the normal course of business, the fund enters into contracts that may include agreements to indemnify another party under given circumstances. The fund’s maximum exposure under these arrangements is unknown as this would involve future claims that may be, but have not yet been, made against the fund. However, the fund’s management team expects the risk of material loss to be remote.
The fund has entered into contractual arrangements with an investment adviser, administrator, distributor, shareholder servicing agent and custodian, who each provide services to the fund. Unless expressly stated otherwise, shareholders are not parties to, or intended beneficiaries of these contractual arrangements, and these contractual arrangements are not intended to create any shareholder right to enforce them against the service providers or to seek any remedy under them against the service providers, either directly or on behalf of the fund.
Under the fund’s Amended and Restated Agreement and Declaration of Trust, any claims asserted against or on behalf of the Putnam Funds, including claims against Trustees and Officers, must be brought in state and federal courts located within the Commonwealth of Massachusetts.
Note 1 — Significant accounting policies
The following is a summary of significant accounting policies consistently followed by the fund in the preparation of its financial statements. The preparation of financial statements is in conformity with accounting principles generally accepted in the United States of America and requires management to make estimates and assumptions that affect the reported amounts of assets and liabilities in the financial statements and the reported amounts of increases and decreases in net assets from operations. Actual results could differ from those estimates. Subsequent events after the Statement of assets and liabilities date through the date that the financial statements were issued have been evaluated in the preparation of the financial statements.
Investment income, realized and unrealized gains and losses and expenses of the fund are borne pro-rata based on the relative net assets of each class to the total net assets of the fund, except that each class bears expenses unique to that class (including the distribution fees applicable to such classes). Each class votes as a class only with respect to its own distribution plan or other matters on which a class vote is required by law or determined by the Trustees. If the fund were liquidated, shares of each class would receive their pro-rata share of the net assets of the fund. In addition, the Trustees declare separate dividends on each class of shares.
Security valuation Portfolio securities and other investments are valued using policies and procedures adopted by the Board of Trustees. The Trustees have formed a Pricing Committee to oversee the implementation of these procedures and have delegated responsibility for valuing the fund’s assets in accordance with these procedures to Putnam Management. Putnam Management has established an internal Valuation Committee that is responsible for making fair value determinations, evaluating the effectiveness of the pricing policies of the fund and reporting to the Pricing Committee.
Investments for which market quotations are readily available are valued at the last reported sales price on their principal exchange, or official closing price for certain markets, and are classified as Level 1 securities under Accounting Standards Codification 820 Fair Value Measurements and Disclosures (ASC 820). If no sales are reported, as in the case of some securities that are traded OTC, a security is valued at its last reported bid price and is generally categorized as a Level 2 security.
Investments in open-end investment companies (excluding exchange-traded funds), if any, which can be classified as Level 1 or Level 2 securities, are valued based on their net asset value. The net asset value of such investment companies equals the total value of their assets less their liabilities and divided by the number of their outstanding shares.
Market quotations are not considered to be readily available for certain debt obligations (including short-term investments with remaining maturities of 60 days or less) and other investments; such investments are valued on the basis of valuations furnished by an independent pricing service approved by the Trustees or dealers selected by Putnam Management. Such services or dealers determine valuations for normal institutional-size trading units of such securities using methods based on market transactions for comparable securities and various relationships, generally recognized by institutional traders, between securities (which consider such factors as security prices, yields, maturities and ratings). These securities will generally be categorized as Level 2.
Many securities markets and exchanges outside the U.S. close prior to the scheduled close of the New York Stock Exchange and therefore the closing prices for securities in such markets or on such exchanges may not fully reflect events that occur after such close but before the scheduled close of the New York Stock Exchange. Accordingly, on certain days, the fund will fair value certain foreign equity securities taking into account multiple factors including movements in the U.S. securities markets, currency valuations and comparisons to the valuation of American Depository Receipts, exchange-traded funds and futures contracts. The foreign equity securities, which would generally be classified as Level 1 securities, will be transferred to Level 2 of the fair value hierarchy when they are valued at fair value. The number of days on which fair value prices will be used will depend on market activity and it is possible that fair value prices will be used by the fund to a significant extent. At the close of the reporting period, fair value pricing was used for certain foreign securities in the portfolio. Securities quoted in foreign currencies, if any, are translated into U.S. dollars at the current exchange rate.
To the extent a pricing service or dealer is unable to value a security or provides a valuation that Putnam Management does not believe accurately reflects the security’s fair value, the security will be valued at fair value by Putnam Management in accordance with policies and procedures approved by the Trustees. Certain investments, including certain restricted and illiquid securities and derivatives, are also valued at fair value following procedures approved by the Trustees. These valuations consider such factors as significant market or specific security events such as interest rate or credit quality changes, various relationships with other securities, discount rates, U.S. Treasury, U.S. swap and credit yields, index levels, convexity exposures, recovery rates, sales and other multiples and resale restrictions. These securities are classified as Level 2 or as Level 3 depending on the priority of the significant inputs.
To assess the continuing appropriateness of fair valuations, the Valuation Committee reviews and affirms the reasonableness of such valuations on a regular basis after considering all relevant information that is reasonably available. Such valuations and procedures are reviewed periodically by the Trustees. Certain securities may be valued on the basis of a price provided by a single source. The fair value of securities is generally determined as the amount that the fund could reasonably expect to realize from an orderly disposition of such securities over a reasonable period of time. By its nature, a fair value price is a good faith estimate of the value of a security in a current sale and does not reflect an actual market price, which may be different by a material amount.
| |
| 42 | Putnam VT Global Asset Allocation Fund |
Security transactions and related investment income Security transactions are recorded on the trade date (the date the order to buy or sell is executed). Gains or losses on securities sold are determined on the identified cost basis.
Interest income, net of any applicable withholding taxes, if any, and including amortization and accretion of premiums and discounts on debt securities, is recorded on the accrual basis. Dividend income, net of any applicable withholding taxes, is recognized on the ex-dividend date except that certain dividends from foreign securities, if any, are recognized as soon as the fund is informed of the ex-dividend date. Non-cash dividends, if any, are recorded at the fair value of the securities received. Dividends representing a return of capital or capital gains, if any, are reflected as a reduction of cost and/or as a realized gain.
The fund may have earned certain fees in connection with its senior loan purchasing activities. These fees, if any, are treated as market discount and are amortized into income in the Statement of operations.
Securities purchased or sold on a forward commitment or delayed delivery basis may be settled at a future date beyond customary settlement time; interest income is accrued based on the terms of the securities. Losses may arise due to changes in the fair value of the underlying securities or if the counterparty does not perform under the contract.
Stripped securities The fund may invest in stripped securities which represent a participation in securities that may be structured in classes with rights to receive different portions of the interest and principal. Interest-only securities receive all of the interest and principal-only securities receive all of the principal. If the interest-only securities experience greater than anticipated prepayments of principal, the fund may fail to recoup fully its initial investment in these securities. Conversely, principal-only securities increase in value if prepayments are greater than anticipated and decline if prepayments are slower than anticipated. The fair value of these securities is highly sensitive to changes in interest rates.
Foreign currency translation The accounting records of the fund are maintained in U.S. dollars. The fair value of foreign securities, currency holdings, and other assets and liabilities is recorded in the books and records of the fund after translation to U.S. dollars based on the exchange rates on that day. The cost of each security is determined using historical exchange rates. Income and withholding taxes are translated at prevailing exchange rates when earned or incurred. The fund does not isolate that portion of realized or unrealized gains or losses resulting from changes in the foreign exchange rate on investments from fluctuations arising from changes in the market prices of the securities. Such gains and losses are included with the net realized and unrealized gain or loss on investments. Net realized gains and losses on foreign currency transactions represent net realized exchange gains or losses on disposition of foreign currencies, currency gains and losses realized between the trade and settlement dates on securities transactions and the difference between the amount of investment income and foreign withholding taxes recorded on the fund’s books and the U.S. dollar equivalent amounts actually received or paid. Net unrealized appreciation and depreciation of assets and liabilities in foreign currencies arise from changes in the value of assets and liabilities other than investments at the period end, resulting from changes in the exchange rate.
Options contracts The fund uses options contracts to hedge duration and convexity, to isolate prepayment risk, to gain exposure to interest rates, to hedge against changes in values of securities it owns, owned or expects to own, to hedge prepayment risk, to generate additional income for the portfolio, to enhance returns on securities owned, to enhance the return on a security owned, to gain exposure to securities and to manage downside risks.
The potential risk to the fund is that the change in value of options contracts may not correspond to the change in value of the hedged instruments. In addition, losses may arise from changes in the value of the underlying instruments if there is an illiquid secondary market for the contracts, if interest or exchange rates move unexpectedly or if the counterparty to the contract is unable to perform. Realized gains and losses on purchased options are included in realized gains and losses on investment securities. If a written call option is exercised, the premium originally received is recorded as an addition to sales proceeds. If a written put option is exercised, the premium originally received is recorded as a reduction to the cost of investments.
Exchange-traded options are valued at the last sale price or, if no sales are reported, the last bid price for purchased options and the last ask price for written options. OTC traded options are valued using prices supplied by dealers.
Options on swaps are similar to options on securities except that the premium paid or received is to buy or grant the right to enter into a previously agreed upon interest rate or credit default contract. Forward premium swap option contracts include premiums that have extended settlement dates. The delayed settlement of the premiums is factored into the daily valuation of the option contracts. In the case of interest rate cap and floor contracts, in return for a premium, ongoing payments between two parties are based on interest rates exceeding a specified rate, in the case of a cap contract, or falling below a specified rate in the case of a floor contract.
Written option contracts outstanding at period end, if any, are listed after the fund’s portfolio.
Futures contracts The fund uses futures contracts to manage exposure to market risk, to hedge prepayment risk, to hedge interest rate risk, to gain exposure to interest rates, and to equitize cash.
The potential risk to the fund is that the change in value of futures contracts may not correspond to the change in value of the hedged instruments. In addition, losses may arise from changes in the value of the underlying instruments, if there is an illiquid secondary market for the contracts, if interest or exchange rates move unexpectedly or if the counterparty to the contract is unable to perform. With futures, there is minimal counterparty credit risk to the fund since futures are exchange traded and the exchange’s clearinghouse, as counterparty to all exchange traded futures, guarantees the futures against default. Risks may exceed amounts recognized on the Statement of assets and liabilities. When the contract is closed, the fund records a realized gain or loss equal to the difference between the value of the contract at the time it was opened and the value at the time it was closed.
Futures contracts are valued at the quoted daily settlement prices established by the exchange on which they trade. The fund and the broker agree to exchange an amount of cash equal to the daily fluctuation in the value of the futures contract. Such receipts or payments are known as “variation margin.”
Futures contracts outstanding at period end, if any, are listed after the fund’s portfolio.
Forward currency contracts The fund buys and sells forward currency contracts, which are agreements between two parties to buy and sell currencies at a set price on a future date. These contracts are used to hedge foreign exchange risk and to gain exposure to currencies.
The U.S. dollar value of forward currency contracts is determined using current forward currency exchange rates supplied by a quotation service. The fair value of the contract will fluctuate with changes in currency exchange rates. The contract is marked to market daily and the change in fair value is recorded as an unrealized gain or loss. The fund records a realized gain or loss equal to the difference between the value of the contract at the time it was opened and the value at the time it was closed when the contract matures or by delivery of the currency. The fund could be exposed to risk if the value of the currency changes unfavorably, if the counterparties to the contracts are unable to meet the terms of their contracts or if the fund is unable to enter into a closing position. Risks may exceed amounts recognized on the Statement of assets and liabilities.
Forward currency contracts outstanding at period end, if any, are listed after the fund’s portfolio.
Interest rate swap contracts The fund entered into OTC and/or centrally cleared interest rate swap contracts, which are arrangements between two parties to exchange cash flows based on a notional principal amount, to hedge interest rate risk, to gain exposure on interest rates and to hedge prepayment risk.
An OTC and centrally cleared interest rate swap can be purchased or sold with an upfront premium. For OTC interest rate swap contracts, an upfront payment received by the fund is recorded as a liability on the fund’s books. An upfront payment made by the fund is recorded as an asset on the fund’s books. OTC and centrally cleared interest rate swap contracts are marked to market daily based upon quotations from an independent pricing service or market makers. Any change is recorded as an unrealized gain or loss on OTC interest rate swaps. Daily fluctuations in the value of centrally cleared interest rate swaps are settled through a central clearing agent and are recorded in variation margin on the Statement of assets and liabilities and recorded as unrealized gain or loss. Payments, including upfront premiums, received or made are recorded as realized gains or losses at the reset date or the closing of the contract. Certain OTC and centrally cleared interest rate swap contracts may include extended effective dates. Payments related to these swap contracts are accrued based on the terms of the contract.
The fund could be exposed to credit or market risk due to unfavorable changes in the fluctuation of interest rates or if the counterparty defaults, in the case of OTC interest rate contracts, or the central clearing agency or a clearing member defaults, in the case of centrally cleared interest rate swap contracts, on its respective obligation to perform under the contract. The fund’s maximum risk of loss from counterparty risk or central clearing risk is the fair value of the contract.
| |
| Putnam VT Global Asset Allocation Fund | 43 |
This risk may be mitigated for OTC interest rate swap contracts by having a master netting arrangement between the fund and the counterparty and for centrally cleared interest rate swap contracts through the daily exchange of variation margin. There is minimal counterparty risk with respect to centrally cleared interest rate swap contracts due to the clearinghouse guarantee fund and other resources that are available in the event of a clearing member default. Risk of loss may exceed amounts recognized on the Statement of assets and liabilities.
OTC and centrally cleared interest rate swap contracts outstanding, including their respective notional amounts at period end, if any, are listed after the fund’s portfolio.
Total return swap contracts The fund entered into OTC and/or centrally cleared total return swap contracts, which are arrangements to exchange a market-linked return for a periodic payment, both based on a notional principal amount, to hedge sector exposure, to manage exposure to specific sectors or industries, to manage exposure to specific securities, to gain exposure to a basket of securities, to gain exposure to specific markets or countries and to gain exposure to specific sectors or industries.
To the extent that the total return of the security, index or other financial measure underlying the transaction exceeds or falls short of the offsetting interest rate obligation, the fund will receive a payment from or make a payment to the counterparty. OTC and/or centrally cleared total return swap contracts are marked to market daily based upon quotations from an independent pricing service or market maker. Any change is recorded as an unrealized gain or loss on OTC total return swaps. Daily fluctuations in the value of centrally cleared total return swaps are settled through a central clearing agent and are recorded in variation margin on the Statement of assets and liabilities and recorded as unrealized gain or loss. Payments received or made are recorded as realized gains or losses. Certain OTC and/or centrally cleared total return swap contracts may include extended effective dates. Payments related to these swap contracts are accrued based on the terms of the contract. The fund could be exposed to credit or market risk due to unfavorable changes in the fluctuation of interest rates or in the price of the underlying security or index, the possibility that there is no liquid market for these agreements or that the counterparty may default on its obligation to perform. The fund’s maximum risk of loss from counterparty risk or central clearing risk is the fair value of the contract. This risk may be mitigated for OTC total return swap contracts by having a master netting arrangement between the fund and the counterparty and for centrally cleared total return swap contracts through the daily exchange of variation margin. There is minimal counterparty risk with respect to centrally cleared total return swap contracts due to the clearinghouse guarantee fund and other resources that are available in the event of a clearing member default. Risk of loss may exceed amounts recognized on the Statement of assets and liabilities.
OTC and/or centrally cleared total return swap contracts outstanding, including their respective notional amounts at period end, if any, are listed after the fund’s portfolio.
Credit default contracts The fund entered into OTC and/or centrally cleared credit default contracts to hedge credit risk, to hedge market risk and to gain exposure on individual names and/or baskets of securities.
In OTC and centrally cleared credit default contracts, the protection buyer typically makes a periodic stream of payments to a counterparty, the protection seller, in exchange for the right to receive a contingent payment upon the occurrence of a credit event on the reference obligation or all other equally ranked obligations of the reference entity. Credit events are contract specific but may include bankruptcy, failure to pay, restructuring and obligation acceleration. For OTC credit default contracts, an upfront payment received by the fund is recorded as a liability on the fund’s books. An upfront payment made by the fund is recorded as an asset on the fund’s books. Centrally cleared credit default contracts provide the same rights to the protection buyer and seller except the payments between parties, including upfront premiums, are settled through a central clearing agent through variation margin payments. Upfront and periodic payments received or paid by the fund for OTC and centrally cleared credit default contracts are recorded as realized gains or losses at the reset date or close of the contract. The OTC and centrally cleared credit default contracts are marked to market daily based upon quotations from an independent pricing service or market makers. Any change in value of OTC credit default contracts is recorded as an unrealized gain or loss. Daily fluctuations in the value of centrally cleared credit default contracts are recorded in variation margin on the Statement of assets and liabilities and recorded as unrealized gain or loss. Upon the occurrence of a credit event, the difference between the par value and fair value of the reference obligation, net of any proportional amount of the upfront payment, is recorded as a realized gain or loss.
In addition to bearing the risk that the credit event will occur, the fund could be exposed to market risk due to unfavorable changes in interest rates or in the price of the underlying security or index or the possibility that the fund may be unable to close out its position at the same time or at the same price as if it had purchased the underlying reference obligations. In certain circumstances, the fund may enter into offsetting OTC and centrally cleared credit default contracts which would mitigate its risk of loss. Risks of loss may exceed amounts recognized on the Statement of assets and liabilities. The fund’s maximum risk of loss from counterparty risk, either as the protection seller or as the protection buyer, is the fair value of the contract. This risk may be mitigated for OTC credit default contracts by having a master netting arrangement between the fund and the counterparty and for centrally cleared credit default contracts through the daily exchange of variation margin. Counterparty risk is further mitigated with respect to centrally cleared credit default swap contracts due to the clearinghouse guarantee fund and other resources that are available in the event of a clearing member default. Where the fund is a seller of protection, the maximum potential amount of future payments the fund may be required to make is equal to the notional amount.
OTC and centrally cleared credit default contracts outstanding, including their respective notional amounts at period end, if any, are listed after the fund’s portfolio.
TBA commitments The fund may enter into TBA (to be announced) commitments to purchase securities for a fixed unit price at a future date beyond customary settlement time. Although the unit price and par amount have been established, the actual securities have not been specified. However, it is anticipated that the amount of the commitments will not significantly differ from the principal amount. The fund holds, and maintains until settlement date, cash or high-grade debt obligations in an amount sufficient to meet the purchase price, or the fund may enter into offsetting contracts for the forward sale of other securities it owns. Income on the securities will not be earned until settlement date.
The fund may also enter into TBA sale commitments to hedge its portfolio positions, to sell mortgage-backed securities it owns under delayed delivery arrangements or to take a short position in mortgage-backed securities. Proceeds of TBA sale commitments are not received until the contractual settlement date. During the time a TBA sale commitment is outstanding, either equivalent deliverable securities or an offsetting TBA purchase commitment deliverable on or before the sale commitment date are held as “cover” for the transaction, or other liquid assets in an amount equal to the notional value of the TBA sale commitment are segregated. If the TBA sale commitment is closed through the acquisition of an offsetting TBA purchase commitment, the fund realizes a gain or loss. If the fund delivers securities under the commitment, the fund realizes a gain or a loss from the sale of the securities based upon the unit price established at the date the commitment was entered into.
TBA commitments, which are accounted for as purchase and sale transactions, may be considered securities themselves, and involve a risk of loss due to changes in the value of the security prior to the settlement date as well as the risk that the counterparty to the transaction will not perform its obligations. Counterparty risk is mitigated by having a master agreement between the fund and the counterparty.
Unsettled TBA commitments are valued at their fair value according to the procedures described under “Security valuation” above. The contract is marked to market daily and the change in fair value is recorded by the fund as an unrealized gain or loss. Based on market circumstances, Putnam Management will determine whether to take delivery of the underlying securities or to dispose of the TBA commitments prior to settlement.
TBA purchase commitments outstanding at period end, if any, are listed within the fund’s portfolio and TBA sale commitments outstanding at period end, if any, are listed after the fund’s portfolio.
Master agreements The fund is a party to ISDA (International Swaps and Derivatives Association, Inc.) Master Agreements that govern OTC derivative and foreign exchange contracts and Master Securities Forward Transaction Agreements that govern transactions involving mortgage-backed and other asset-backed securities that may result in delayed delivery (Master Agreements) with certain counterparties entered into from time to time. The Master Agreements may contain provisions regarding, among other things, the parties’ general obligations, representations, agreements, collateral requirements, events of default and early termination. With respect to certain counterparties, in accordance with the terms of the Master Agreements, collateral pledged to the fund is held in a segregated account by the fund’s custodian and, with respect to those amounts which can be sold or repledged, are presented in the fund’s portfolio.
Collateral pledged by the fund is segregated by the fund’s custodian and identified in the fund’s portfolio. Collateral can be in the form of cash or debt securities
| |
| 44 | Putnam VT Global Asset Allocation Fund |
issued by the U.S. Government or related agencies or other securities as agreed to by the fund and the applicable counterparty. Collateral requirements are determined based on the fund’s net position with each counterparty.
With respect to ISDA Master Agreements, termination events applicable to the fund may occur upon a decline in the fund’s net assets below a specified threshold over a certain period of time. Termination events applicable to counterparties may occur upon a decline in the counterparty’s long-term or short-term credit ratings below a specified level. In each case, upon occurrence, the other party may elect to terminate early and cause settlement of all derivative and foreign exchange contracts outstanding, including the payment of any losses and costs resulting from such early termination, as reasonably determined by the terminating party. Any decision by one or more of the fund’s counterparties to elect early termination could impact the fund’s future derivative activity.
At the close of the reporting period, the fund had a net liability position of $54,922 on open derivative contracts subject to the Master Agreements. There was no collateral pledged by the fund at period end for these agreements.
Securities lending The fund may lend securities, through its agent, to qualified borrowers in order to earn additional income. The loans are collateralized by cash in an amount at least equal to the fair value of the securities loaned. The fair value of securities loaned is determined daily and any additional required collateral is allocated to the fund on the next business day. The remaining maturities of the securities lending transactions are considered overnight and continuous. The risk of borrower default will be borne by the fund’s agent; the fund will bear the risk of loss with respect to the investment of the cash collateral. Income from securities lending, net of expenses, is included in investment income on the Statement of operations. Cash collateral is invested in Putnam Cash Collateral Pool, LLC, a limited liability company managed by an affiliate of Putnam Management. Investments in Putnam Cash Collateral Pool, LLC are valued at its closing net asset value each business day. There are no management fees charged to Putnam Cash Collateral Pool, LLC. At the close of the reporting period, the fund received cash collateral of $895,250 and the value of securities loaned amounted to $879,793.
Interfund lending The fund, along with other Putnam funds, may participate in an interfund lending program pursuant to an exemptive order issued by the SEC. This program allows the fund to borrow from or lend to other Putnam funds that permit such transactions. Interfund lending transactions are subject to each fund’s investment policies and borrowing and lending limits. Interest earned or paid on the interfund lending transaction will be based on the average of certain current market rates. During the reporting period, the fund did not utilize the program.
Lines of credit The fund participates, along with other Putnam funds, in a $317.5 million unsecured committed line of credit and a $235.5 million unsecured uncommitted line of credit, both provided by State Street. Borrowings may be made for temporary or emergency purposes, including the funding of shareholder redemption requests and trade settlements. Interest is charged to the fund based on the fund’s borrowing at a rate equal to 1.25% plus the higher of (1) the Federal Funds rate and (2) the Overnight Bank Funding Rate (overnight LIBOR prior to October 16, 2020) for the committed line of credit and 1.30% plus the higher of (1) the Federal Funds rate and (2) the Overnight Bank Funding Rate (1.30% prior to October 16, 2020) for the uncommitted line of credit. A closing fee equal to 0.04% of the committed line of credit and 0.04% of the uncommitted line of credit has been paid by the participating funds. In addition, a commitment fee of 0.21% per annum on any unutilized portion of the committed line of credit is allocated to the participating funds based on their relative net assets and paid quarterly. During the reporting period, the fund had no borrowings against these arrangements.
Federal taxes It is the policy of the fund to distribute all of its taxable income within the prescribed time period and otherwise comply with the provisions of the Internal Revenue Code of 1986, as amended (the Code), applicable to regulated investment companies.
The fund is subject to the provisions of Accounting Standards Codification 740 Income Taxes (ASC 740). ASC 740 sets forth a minimum threshold for financial statement recognition of the benefit of a tax position taken or expected to be taken in a tax return. The fund did not have a liability to record for any unrecognized tax benefits in the accompanying financial statements. No provision has been made for federal taxes on income, capital gains or unrealized appreciation on securities held nor for excise tax on income and capital gains. Each of the fund’s federal tax returns for the prior three fiscal years remains subject to examination by the Internal Revenue Service.
The fund may also be subject to taxes imposed by governments of countries in which it invests. Such taxes are generally based on either income or gains earned or repatriated. The fund accrues and applies such taxes to net investment income, net realized gains and net unrealized gains as income and/or capital gains are earned. In some cases, the fund may be entitled to reclaim all or a portion of such taxes, and such reclaim amounts, if any, are reflected as an asset on the fund’s books. In many cases, however, the fund may not receive such amounts for an extended period of time, depending on the country of investment.
Distributions to shareholders Distributions to shareholders from net investment income are recorded by the fund on the ex-dividend date. Distributions from capital gains, if any, are recorded on the ex-dividend date and paid at least annually. The amount and character of income and gains to be distributed are determined in accordance with income tax regulations, which may differ from generally accepted accounting principles. These differences include temporary and/or permanent differences from losses on wash sale transactions, from foreign currency gains and losses, from nontaxable dividends, from unrealized gains and losses on passive foreign investment companies, from income on swap contracts and from interest-only securities. Reclassifications are made to the fund’s capital accounts to reflect income and gains available for distribution (or available capital loss carryovers) under income tax regulations. At the close of the reporting period, the fund reclassified $569,679 to decrease undistributed net investment income and $569,679 to increase accumulated net realized gain.
Tax cost of investments includes adjustments to net unrealized appreciation (depreciation) which may not necessarily be final tax cost basis adjustments, but closely approximate the tax basis unrealized gains and losses that may be realized and distributed to shareholders. The tax basis components of distributable earnings and the federal tax cost as of the close of the reporting period were as follows:
| |
| Unrealized appreciation | $27,670,726 |
| Unrealized depreciation | (2,018,790) |
| Net unrealized appreciation | 25,651,936 |
| Undistributed ordinary income | 992,691 |
| Undistributed long-term gain | 1,437,353 |
| Undistributed short-term gain | 1,880,121 |
| Cost for federal income tax purposes | $112,231,409 |
Expenses of the Trust Expenses directly charged or attributable to any fund will be paid from the assets of that fund. Generally, expenses of the Trust will be allocated among and charged to the assets of each fund on a basis that the Trustees deem fair and equitable, which may be based on the relative assets of each fund or the nature of the services performed and relative applicability to each fund.
Beneficial interest At the close of the reporting period, insurance companies or their separate accounts were record owners of all but a de minimis number of the shares of the fund. Approximately 40.5% of the fund is owned by accounts of one insurance company.
Note 2 — Management fee, administrative services and other transactions
The fund pays Putnam Management a management fee (based on the fund’s average net assets and computed and paid monthly) at annual rates that may vary based on the average of the aggregate net assets of all open-end mutual funds sponsored by Putnam Management (excluding net assets of funds that are invested in, or that are invested in by, other Putnam funds to the extent necessary to avoid “double counting” of those assets). Such annual rates may vary as follows:
| |
| 0.750% | of the first $5 billion, |
| 0.700% | of the next $5 billion, |
| 0.650% | of the next $10 billion, |
| 0.600% | of the next $10 billion, |
| 0.550% | of the next $50 billion, |
| 0.530% | of the next $50 billion, |
| 0.520% | of the next $100 billion and |
| 0.515% | of any excess thereafter. |
For the reporting period, the management fee represented an effective rate (excluding the impact from any expense waivers in effect) of 0.588% of the fund’s average net assets.
Putnam Management has contractually agreed, through April 30, 2022, to waive fees and/or reimburse the fund’s expenses to the extent necessary to limit the cumulative expenses of the fund, exclusive of brokerage, interest, taxes, investment-related expenses, extraordinary expenses, acquired fund fees and expenses and payments under the fund’s investor servicing contract, investment management contract and distribution plan, on a fiscal year-to-date basis to an annual rate of 0.20% of the fund’s average net assets over such fiscal year-to-date period. During the reporting period, the fund’s expenses were not reduced as a result of this limit.
| |
| Putnam VT Global Asset Allocation Fund | 45 |
Putnam Investments Limited (PIL), an affiliate of Putnam Management, is authorized by the Trustees to manage a separate portion of the assets of the fund as determined by Putnam Management from time to time. PIL did not manage any portion of the assets of the fund during the reporting period. If Putnam Management were to engage the services of PIL, Putnam Management would pay a quarterly sub-management fee to PIL for its services at an annual rate of 0.35% of the average net assets of the portion of the fund managed by PIL.
The Putnam Advisory Company, LLC (PAC), an affiliate of Putnam Management, is authorized by the Trustees to manage a separate portion of the assets of the fund, as designated from time to time by Putnam Management or PIL. PAC did not manage any portion of the assets of the fund during the reporting period. If Putnam Management or PIL were to engage the services of PAC, Putnam Management or PIL, as applicable, would pay a quarterly sub-advisory fee to PAC for its services at the annual rate of 0.35% of the average net assets of the portion of the fund’s assets for which PAC is engaged as sub-adviser.
The fund reimburses Putnam Management an allocated amount for the compensation and related expenses of certain officers of the fund and their staff who provide administrative services to the fund. The aggregate amount of all such reimbursements is determined annually by the Trustees.
Custodial functions for the fund’s assets are provided by State Street. Custody fees are based on the fund’s asset level, the number of its security holdings and transaction volumes.
Putnam Investor Services, Inc., an affiliate of Putnam Management, provides investor servicing agent functions to the fund. Putnam Investor Services, Inc. was paid a monthly fee for investor servicing at an annual rate of 0.07% of the fund’s average daily net assets. During the reporting period, the expenses for each class of shares related to investor servicing fees were as follows:
| |
| Class IA | $58,126 |
| Class IB | 24,875 |
| Total | $83,001 |
The fund has entered into expense offset arrangements with Putnam Investor Services, Inc. and State Street whereby Putnam Investor Services, Inc.’s and State Street’s fees are reduced by credits allowed on cash balances. For the reporting period, the fund’s expenses were reduced by $215 under the expense offset arrangements.
Each Independent Trustee of the fund receives an annual Trustee fee, of which $82, as a quarterly retainer, has been allocated to the fund, and an additional fee for each Trustees meeting attended. Trustees also are reimbursed for expenses they incur relating to their services as Trustees.
The fund has adopted a Trustee Fee Deferral Plan (the Deferral Plan) which allows the Trustees to defer the receipt of all or a portion of Trustees fees payable on or after July 1, 1995. The deferred fees remain invested in certain Putnam funds until distribution in accordance with the Deferral Plan.
The fund has adopted an unfunded noncontributory defined benefit pension plan (the Pension Plan) covering all Trustees of the fund who have served as a Trustee for at least five years and were first elected prior to 2004. Benefits under the Pension Plan are equal to 50% of the Trustee’s average annual attendance and retainer fees for the three years ended December 31, 2005. The retirement benefit is payable during a Trustee’s lifetime, beginning the year following retirement, for the number of years of service through December 31, 2006. Pension expense for the fund is included in Trustee compensation and expenses in the Statement of operations. Accrued pension liability is included in Payable for Trustee compensation and expenses in the Statement of assets and liabilities. The Trustees have terminated the Pension Plan with respect to any Trustee first elected after 2003.
The fund has adopted a distribution plan (the Plan) with respect to its class IB shares pursuant to Rule 12b–1 under the Investment Company Act of 1940. The purpose of the Plan is to compensate Putnam Retail Management Limited Partnership, an indirect wholly-owned subsidiary of Putnam Investments, LLC, for services provided and expenses incurred in distributing shares of the fund. The Plan provides for payment by the fund to Putnam Retail Management Limited Partnership at an annual rate of up to 0.35% of the average net assets attributable to the fund’s class IB shares. The Trustees have approved payment by the fund at an annual rate of 0.25% of the average net assets attributable to the fund’s class IB shares. The expenses related to distribution fees during the reporting period are included in Distribution fees in the Statement of operations.
Note 3 — Purchases and sales of securities
During the reporting period, the cost of purchases and the proceeds from sales, excluding short-term investments, were as follows:
| | |
| | Cost of | Proceeds |
| | purchases | from sales |
| Investments in securities, including | | |
| TBA commitments (Long-term) | $345,229,015 | $343,093,351 |
| U.S. government securities | | |
| (Long-term) | — | — |
| Total | $345,229,015 | $343,093,351 |
The fund may purchase or sell investments from or to other Putnam funds in the ordinary course of business, which can reduce the fund’s transaction costs, at prices determined in accordance with SEC requirements and policies approved by the Trustees. During the reporting period, purchases or sales of long-term securities from or to other Putnam funds, if any, did not represent more than 5% of the fund’s total cost of purchases and/or total proceeds from sales.
Note 4 — Capital shares
At the close of the reporting period, there were an unlimited number of shares of beneficial interest authorized. Subscriptions and redemptions are presented at the omnibus level. Transactions in capital shares were as follows:
| | | | | | | | |
| | | Class IA shares | | | Class IB shares | |
| | Year ended 12/31/20 | Year ended 12/31/19 | Year ended 12/31/20 | Year ended 12/31/19 |
| | Shares | Amount | Shares | Amount | Shares | Amount | Shares | Amount |
| Shares sold | 18,982 | $304,927 | 19,042 | $306,064 | 178,196 | $2,872,126 | 81,422 | $1,331,979 |
| Shares issued in connection with | | | | | | | | |
| reinvestment of distributions | 241,285 | 3,428,660 | 279,239 | 4,381,261 | 91,416 | 1,320,048 | 107,037 | 1,705,093 |
| | 260,267 | 3,733,587 | 298,281 | 4,687,325 | 269,612 | 4,192,174 | 188,459 | 3,037,072 |
| Shares repurchased | (677,450) | (11,085,478) | (781,078) | (12,649,361) | (330,594) | (5,498,206) | (449,745) | (7,352,686) |
| Net decrease | (417,183) | $(7,351,891) | (482,797) | $(7,962,036) | (60,982) | $(1,306,032) | (261,286) | $(4,315,614) |
| |
| 46 | Putnam VT Global Asset Allocation Fund |
Note 5 — Affiliated transactions
Transactions during the reporting period with any company which is under common ownership or control were as follows:
| | | | | |
| | | | | | Shares outstanding |
| | Fair value as of | | | | and fair value as of |
| Name of affiliate | 12/31/19 | Purchase cost | Sale proceeds | Investment income | 12/31/20 |
| Short-term investments | | | | | |
| Putnam Cash Collateral Pool, LLC* | $419,428 | $10,097,273 | $9,621,451 | $2,399 | $895,250 |
| Putnam Short Term Investment | | | | | |
| Fund** | 22,059,848 | 18,302,458 | 25,796,238 | 144,247 | 14,566,068 |
| Total Short-term investments | $22,479,276 | $28,399,731 | $35,417,689 | $146,646 | $15,461,318 |
*No management fees are charged to Putnam Cash Collateral Pool, LLC (Note 1). Investment income shown is included in securities lending income on the Statement of operations. There were no realized or unrealized gains or losses during the period.
**Management fees charged to Putnam Short Term Investment Fund have been waived by Putnam Management. There were no realized or unrealized gains or losses during the period.
Note 6 — Market, credit and other risks
In the normal course of business, the fund trades financial instruments and enters into financial transactions where risk of potential loss exists due to changes in the market (market risk) or failure of the contracting party to the transaction to perform (credit risk). The fund may be exposed to additional credit risk that an institution or other entity with which the fund has unsettled or open transactions will default. Investments in foreign securities involve certain risks, including those related to economic instability, unfavorable political developments, and currency fluctuations. The fund may invest a significant portion of its assets in securitized debt instruments, including mortgage-backed and asset-backed investments. The yields and values of these investments are sensitive to changes in interest rates, the rate of principal payments on the underlying assets and the market’s perception of the issuers. The market for these investments may be volatile and limited, which may make them difficult to buy or sell.
On July 27, 2017, the United Kingdom’s Financial Conduct Authority (“FCA”), which regulates LIBOR, announced a desire to phase out the use of LIBOR by the end of 2021. LIBOR has historically been a common benchmark interest rate index used to make adjustments to variable-rate loans. It is used throughout global banking and financial industries to determine interest rates for a variety of financial instruments and borrowing arrangements. The transition process might lead to increased volatility and illiquidity in markets that currently rely on LIBOR to determine interest rates. It could also lead to a reduction in the value of some LIBOR-based investments and reduce the effectiveness of new hedges placed against existing LIBOR-based investments. While some LIBOR-based instruments may contemplate a scenario where LIBOR is no longer available by providing for an alternative rate-setting methodology, not all may have such provisions and there may be significant uncertainty regarding the effectiveness of any such alternative methodologies. Since the usefulness of LIBOR as a benchmark could deteriorate during the transition period, these effects could occur prior to the end of 2021.
Beginning in January 2020, global financial markets have experienced, and may continue to experience, significant volatility resulting from the spread of a virus known as COVID–19. The outbreak of COVID–19 has resulted in travel and border restrictions, quarantines, supply chain disruptions, lower consumer demand, and general market uncertainty. The effects of COVID–19 have adversely affected, and may continue to adversely affect, the global economy, the economies of certain nations, and individual issuers, all of which may negatively impact the fund’s performance.
Note 7 — Senior loan commitments
Senior loans are purchased or sold on a when-issued or delayed delivery basis and may be settled a month or more after the trade date, which from time to time can delay the actual investment of available cash balances; interest income is accrued based on the terms of the securities. Senior loans can be acquired through an agent, by assignment from another holder of the loan, or as a participation interest in another holder’s portion of the loan. When the fund invests in a loan or participation, the fund is subject to the risk that an intermediate participant between the fund and the borrower will fail to meet its obligations to the fund, in addition to the risk that the borrower under the loan may default on its obligations.
Note 8 — Summary of derivative activity
The volume of activity for the reporting period for any derivative type that was held during the period is listed below and was based on an average of the holdings at the end of each fiscal quarter:
| |
| Purchased currency option contracts (contract amount) | $6,100,000 |
| Written currency option contracts (contract amount) | $5,300,000 |
| Futures contracts (number of contracts) | 200 |
| Forward currency contracts (contract amount) | $25,100,000 |
| Centrally cleared interest rate swap contracts (notional) | $9,100,000 |
| OTC total return swap contracts (notional) | $19,300,000 |
| OTC credit default contracts (notional) | $1,100,000 |
| Centrally cleared credit default contracts (notional) | $5,200,000 |
| |
| Putnam VT Global Asset Allocation Fund | 47 |
The following is a summary of the fair value of derivative instruments as of the close of the reporting period:
Fair value of derivative instruments as of the close of the reporting period
| | | | |
| | Asset derivatives | Liability derivatives |
| Derivatives not accounted for as hedging | Statement of assets and | | Statement of assets and | |
| instruments under ASC 815 | liabilities location | Fair value | liabilities location | Fair value |
| | Receivables, Net assets — | | | |
| Credit contracts | Unrealized appreciation | $284,544* | Payables | $118,845 |
| Foreign exchange contracts | Receivables | 350,710 | Payables | 200,171 |
| | Receivables, Net assets — | | Payables, Net assets — | |
| Equity contracts | Unrealized appreciation | 318,671* | Unrealized depreciation | 270,832* |
| | Receivables, Net assets — | | Payables, Net assets — | |
| Interest rate contracts | Unrealized appreciation | 33,090* | Unrealized depreciation | 98,923* |
| Total | | $987,015 | | $688,771 |
*Includes cumulative appreciation/depreciation of futures contracts and/or centrally cleared swaps as reported in the fund’s portfolio. Only current day’s variation margin is reported within the Statement of assets and liabilities.
The following is a summary of realized and change in unrealized gains or losses of derivative instruments in the Statement of operations for the reporting period (Note 1):
Amount of realized gain or (loss) on derivatives recognized in net gain or (loss) on investments
| | | | | |
| Derivatives not accounted for as hedging | | | Forward currency | | |
| instruments under ASC 815 | Options | Futures | contracts | Swaps | Total |
| Credit contracts | $— | $— | $— | $293,647 | $293,647 |
| Foreign exchange contracts | (29,639) | — | 106,610 | — | $76,971 |
| Equity contracts | — | 665,226 | — | (639,509) | $25,717 |
| Interest rate contracts | — | 1,273,255 | — | (32,983) | $1,240,272 |
| Total | $(29,639) | $1,938,481 | $106,610 | $(378,845) | $1,636,607 |
Change in unrealized appreciation or (depreciation) on derivatives recognized in net gain or (loss) on investments
| | | | | |
| Derivatives not accounted for as hedging | | | Forward currency | | |
| instruments under ASC 815 | Options | Futures | contracts | Swaps | Total |
| Credit contracts | $— | $— | $— | $40,215 | $40,215 |
| Foreign exchange contracts | 42,150 | — | 132,119 | — | $174,269 |
| Equity contracts | — | 58,598 | — | 58,426 | $117,024 |
| Interest rate contracts | — | 112,676 | — | 5,081 | $117,757 |
| Total | $42,150 | $171,274 | $132,119 | $103,722 | $449,265 |
| |
| 48 | Putnam VT Global Asset Allocation Fund |
|
| This page intentionally left blank. |
| |
| Putnam VT Global Asset Allocation Fund | 49 |
Note 9 — Offsetting of financial and derivative assets and liabilities
The following table summarizes any derivatives, repurchase agreements and reverse repurchase agreements, at the end of the reporting period, that are subject to an enforceable master netting agreement or similar agreement. For securities lending transactions or borrowing transactions associated with securities sold short, if any, see Note 1. For financial reporting purposes, the fund does not offset financial assets and financial liabilities that are subject to the master netting agreements in the Statement of assets and liabilities.
| | | | | | | | | | | | | | | | | | | |
| | Bank of America N.A. | Barclays Bank PLC | Barclays Capital, Inc. (clearing broker) | BofA Securities, Inc. | Citibank, N.A. | Citigroup Global Markets, Inc. | Credit Suisse International | Goldman Sachs International | HSBC Bank USA, National Association | JPMorgan Chase Bank N.A. | JPMorgan Securities LLC | Merrill Lynch International | Morgan Stanley & Co. International PLC | NatWest Markets PLC | State Street Bank and Trust Co. | Toronto- Dominion Bank | UBS AG | WestPac Banking Corp. | Total |
| Assets: | | | | | | | | | | | | | | | | | | | |
| Centrally cleared interest rate | | | | | | | | | | | | | | | | | | | |
| swap contracts§ | $— | $— | $1,589 | $— | $— | $— | $— | $— | $— | $— | $— | $— | $— | $— | $— | $— | $— | $— | $1,589 |
| OTC Total return | | | | | | | | | | | | | | | | | | | |
| swap contracts*# | — | 239 | — | — | 7 | — | 127 | 83,749 | — | — | 86 | — | — | — | — | — | — | — | 84,208 |
| OTC Credit default contracts — | | | | | | | | | | | | | | | | | | | |
| protection sold*# | — | — | — | — | — | — | — | — | — | — | — | — | — | — | — | — | — | — | — |
| OTC Credit default contracts — | | | | | | | | | | | | | | | | | | | |
| protection purchased*# | — | — | — | — | — | 22,438 | 25,890 | 12,710 | — | — | 23,383 | 4,483 | 11,610 | — | — | — | — | — | 100,514 |
| Centrally cleared credit | | | | | | | | | | | | | | | | | | | |
| default contracts§ | — | — | 217 | — | — | — | — | — | — | — | — | — | — | — | — | — | — | — | 217 |
| Futures contracts§ | — | — | — | 21,520 | — | — | — | — | — | — | 16,332 | — | — | — | — | — | — | — | 37,852 |
| Forward currency contracts# | 8,461 | 8,937 | — | — | 23,267 | — | 12,947 | 60,523 | 26,714 | 33,916 | — | — | 86,911 | 33,947 | 73 | 12,261 | 34,989 | 7,764 | 350,710 |
| Total Assets | $8,461 | $9,176 | $1,806 | $21,520 | $23,274 | $22,438 | $38,964 | $156,982 | $26,714 | $33,916 | $39,801 | $4,483 | $98,521 | $33,947 | $73 | $12,261 | $34,989 | $7,764 | $575,090 |
| Liabilities: | | | | | | | | | | | | | | | | | | | |
| Centrally cleared interest rate | | | | | | | | | | | | | | | | | | | |
| swap contracts§ | — | — | 3,389 | — | — | — | — | — | — | — | — | — | — | — | — | — | — | — | 3,389 |
| OTC Total return | | | | | | | | | | | | | | | | | | | |
| swap contracts*# | — | 229 | — | — | — | — | — | 51,299 | — | — | — | — | — | — | — | — | — | — | 51,528 |
| OTC Credit default contracts — | | | | | | | | | | | | | | | | | | | |
| protection sold*# | 11,455 | — | — | — | — | 22,230 | 46,291 | 32,125 | — | — | 2,934 | — | 3,810 | — | — | — | — | — | 118,845 |
| OTC Credit default contracts — | | | | | | | | | | | | | | | | | | | |
| protection purchased*# | — | — | — | — | — | — | — | — | — | — | — | — | — | — | — | — | — | — | — |
| Centrally cleared credit | | | | | | | | | | | | | | | | | | | |
| default contracts§ | — | — | — | — | — | — | — | — | — | — | — | — | — | — | — | — | — | — | — |
| Futures contracts§ | — | — | — | 66,436 | — | — | — | — | — | — | 422 | — | — | — | — | — | — | — | 66,858 |
| Forward currency contracts# | 18,855 | 4,341 | — | — | 22,467 | — | 4,363 | 25,044 | 13,542 | 19,994 | — | — | 385 | 20,750 | 20,638 | 13,079 | 29,215 | 7,498 | 200,171 |
| Total Liabilities | $30,310 | $4,570 | $3,389 | $66,436 | $22,467 | $22,230 | $50,654 | $108,468 | $13,542 | $19,994 | $3,356 | $— | $4,195 | $20,750 | $20,638 | $13,079 | $29,215 | $7,498 | $440,791 |
| Total Financial and Derivative | | | | | | | | | | | | | | | | | | | |
| Net Assets | $(21,849) | $4,606 | $(1,583) | $(44,916) | $807 | $208 | $(11,690) | $48,514 | $13,172 | $13,922 | $36,445 | $4,483 | $94,326 | $13,197 | $(20,565) | $(818) | $5,774 | $266 | $134,299 |
| Total collateral | | | | | | | | | | | | | | | | | | | |
| received (pledged)†## | $— | $— | $— | $— | $— | $— | $— | $— | $— | $— | $— | $— | $— | $— | $— | $— | $— | $— | |
| Net amount | $(21,849) | $4,606 | $(1,583) | $(44,916) | $807 | $208 | $(11,690) | $48,514 | $13,172 | $13,922 | $36,445 | $4,483 | $94,326 | $13,197 | $(20,565) | $(818) | $5,774 | $266 | |
| Controlled collateral received | | | | | | | | | | | | | | | | | | | |
| (including TBA commitments)** | $— | $— | $— | $— | $— | $— | $— | $— | $— | $— | $— | $— | $— | $— | $— | $— | $— | $— | $— |
| Uncontrolled collateral received | $— | $— | $— | $— | $— | $— | $— | $— | $— | $— | $— | $— | $— | $— | $— | $— | $— | $— | $— |
| Collateral (pledged) (including | | | | | | | | | | | | | | | | | | | |
| TBA commitments)** | $— | $— | $— | $— | $— | $— | $— | $— | $— | $— | $— | $— | $— | $— | $— | $— | $— | $— | $— |
*Excludes premiums, if any. Included in unrealized appreciation and depreciation on OTC swap contracts on the Statement of assets and liabilities.
**Included with Investments in securities on the Statement of assets and liabilities.
†Additional collateral may be required from certain brokers based on individual agreements.
# Covered by master netting agreement (Note 1).
## Any over-collateralization of total financial and derivative net assets is not shown. Collateral may include amounts related to unsettled agreements.
§ Includes current day’s variation margin only as reported on the Statement of assets and liabilities, which is not collateralized. Cumulative appreciation/(depreciation) for futures contracts and centrally cleared swap contracts is represented in the tables listed after the fund’s portfolio. Collateral pledged for initial margin on futures contracts and centrally cleared swap contracts, which is not included in the table above, amounted to $473,936 and $245,978, respectively.
| | |
| 50 | Putnam VT Global Asset Allocation Fund | Putnam VT Global Asset Allocation Fund | 51 |
Note 10 — New accounting pronouncements
In March 2020, the Financial Accounting Standards Board issued Accounting Standards Update (ASU) 2020–04, Reference Rate Reform (Topic 848) — Facilitation of the Effects of Reference Rate Reform on Financial Reporting. The amendments in ASU 2020–04 provide optional temporary financial reporting relief from the effect of certain types of contract modifications due to the planned discontinuation of LIBOR and other interbank-offered based reference rates as of the end of 2021. ASU 2020–04 is effective for certain reference rate-related contract modifications that occur during the period March 12, 2020 through December 31, 2022. Management is currently evaluating the impact, if any, of applying this provision.
Federal tax information (Unaudited)
Pursuant to §852 of the Internal Revenue Code, as amended, the fund hereby designates $1,591,678 as a capital gain dividend with respect to the taxable year ended December 31, 2020, or, if subsequently determined to be different, the net capital gain of such year.
The fund designated 39.03% of ordinary income distributions as qualifying for the dividends received deduction for corporations.
| |
| 52 | Putnam VT Global Asset Allocation Fund |
| |
| Putnam VT Global Asset Allocation Fund | 53 |

*Mr. Reynolds is an “interested person” (as defined in the Investment Company Act of 1940) of the fund and Putnam Investments. He is President and Chief Executive Officer of Putnam Investments, as well as the President of your fund and each of the other Putnam funds.
The address of each Trustee is 100 Federal Street, Boston, MA 02110.
As of December 31, 2020, there were 97 Putnam funds. All Trustees serve as Trustees of all Putnam funds.
Each Trustee serves for an indefinite term, until his or her resignation, retirement at age 75, removal, or death.
Officers
In addition to Robert L. Reynolds, the other officers of the fund are shown below:
| | |
| Robert T. Burns (Born 1961) | Michael J. Higgins (Born 1976) | Denere P. Poulack (Born 1968) |
| Vice President and Chief Legal Officer | Vice President, Treasurer, and Clerk | Assistant Vice President, Assistant Clerk, and |
| Since 2011 | Since 2010 | Assistant Treasurer |
| General Counsel, Putnam Investments, Putnam | | Since 2004 |
| Management, and Putnam Retail Management | Jonathan S. Horwitz (Born 1955) | |
| | Executive Vice President, Principal Executive | Janet C. Smith (Born 1965) |
| James F. Clark (Born 1974) | Officer, and Compliance Liaison | Vice President, Principal Financial |
| Vice President and Chief Compliance Officer | Since 2004 | Officer, Principal Accounting Officer, and |
| Since 2016 | | Assistant Treasurer |
| Chief Compliance Officer and Chief Risk Officer, | Richard T. Kircher (Born 1962) | Since 2007 |
| Putnam Investments and Chief Compliance | Vice President and BSA Compliance Officer | Head of Fund Administration Services, Putnam |
| Officer, Putnam Management | Since 2019 | Investments and Putnam Management |
| Assistant Director, Operational Compliance, | |
| Nancy E. Florek (Born 1957) | Putnam Investments and Putnam | Mark C. Trenchard (Born 1962) |
| Vice President, Director of Proxy Voting and | Retail Management | Vice President |
| Corporate Governance, Assistant Clerk, and | | Since 2002 |
| Assistant Treasurer | Susan G. Malloy (Born 1957) | Director of Operational Compliance, Putnam |
| Since 2000 | Vice President and Assistant Treasurer | Investments and Putnam Retail Management |
| | Since 2007 | |
| Head of Accounting and Middle Office Services, | |
| Putnam Investments and Putnam Management | |
The principal occupations of the officers for the past five years have been with the employers as shown above, although in some cases they have held different positions with such employers. The address of each officer is 100 Federal Street, Boston, MA 02110.
| |
| 54 | Putnam VT Global Asset Allocation Fund |
|
| This page intentionally left blank. |
| |
| Putnam VT Global Asset Allocation Fund | 55 |
|
| This page intentionally left blank. |
| |
| 56 | Putnam VT Global Asset Allocation Fund |
Other important information
Proxy voting
Putnam is committed to managing our mutual funds in the best interests of our shareholders. The Putnam funds’ proxy voting guidelines and procedures, as well as information regarding how your fund voted proxies relating to portfolio securities during the 12-month period ended June 30, 2020, are available in the Individual Investors section of putnam.com and on the Securities and Exchange Commission’s (SEC) website at www.sec.gov. If you have questions about finding forms on the SEC’s website, you may call the SEC at 1-800-SEC-0330. You may also obtain the Putnam funds’ proxy voting guidelines and procedures at no charge by calling Putnam’s Shareholder Services at 1-800-225-1581.
Fund portfolio holdings
The fund will file a complete schedule of its portfolio holdings with the SEC for the first and third quarters of each fiscal year on Form N-PORT within 60 days of the end of such fiscal quarter. Shareholders may obtain the fund’s Form N-PORT from the SEC’s website at www.sec.gov.
Prior to its use of Form N-PORT, the fund filed its complete schedule of its portfolio holdings with the SEC on Form N-Q, which is available online at www.sec.gov.
Fund information
| | |
| Investment Manager | Investor Servicing Agent | Trustees |
| Putnam Investment Management, LLC | Putnam Investments | Kenneth R. Leibler, Chair |
| 100 Federal Street | Mailing address: | Liaquat Ahamed |
| Boston, MA 02110 | P.O. Box 219697 | Ravi Akhoury |
| Kansas City, MO 64121-9697 | Barbara M. Baumann |
| Investment Sub-Advisors | 1-800-225-1581 | Katinka Domotorffy |
| Putnam Investments Limited | | Catharine Bond Hill |
| 16 St James’s Street | Custodian | Paul L. Joskow |
| London, England SW1A 1ER | State Street Bank and Trust Company | George Putnam, III |
| | | Robert L. Reynolds |
| The Putnam Advisory Company, LLC | Legal Counsel | Manoj P. Singh |
| 100 Federal Street | Ropes & Gray LLP | Mona K. Sutphen |
| Boston, MA 02110 | | |
| Independent Registered | |
| Marketing Services | Public Accounting Firm | |
| Putnam Retail Management | PricewaterhouseCoopers LLP | |
| 100 Federal Street | | |
| Boston, MA 02110 | | |
The fund’s Statement of Additional Information contains additional information about the fund’s Trustees and is available without charge upon request by calling 1-800-225-1581.
| |
| Putnam VT Global Asset Allocation Fund | 57 |
| |
| This report has been prepared for the shareholders | |
| of Putnam VT Global Asset Allocation Fund. | VTAN062 324358 2/21 |
| |
| (a) The fund's principal executive, financial and accounting officers are employees of Putnam Investment Management, LLC, the Fund's investment manager. As such they are subject to a comprehensive Code of Ethics adopted and administered by Putnam Investments which is designed to protect the interests of the firm and its clients. The Fund has adopted a Code of Ethics which incorporates the Code of Ethics of Putnam Investments with respect to all of its officers and Trustees who are employees of Putnam Investment Management, LLC. For this reason, the Fund has not adopted a separate code of ethics governing its principal executive, financial and accounting officers. |
| |
| Item 3. Audit Committee Financial Expert: |
| |
| The Funds' Audit, Compliance and Risk Committee is comprised solely of Trustees who are “independent” (as such term has been defined by the Securities and Exchange Commission (“SEC”) in regulations implementing Section 407 of the Sarbanes-Oxley Act (the “Regulations”)). The Trustees believe that each member of the Audit, Compliance and Risk Committee also possesses a combination of knowledge and experience with respect to financial accounting matters, as well as other attributes, that qualifies him or her for service on the Committee. In addition, the Trustees have determined that each of Dr. Hill, Dr. Joskow, and Mr. Singh qualifies as an “audit committee financial expert” (as such term has been defined by the Regulations) based on their review of his or her pertinent experience and education; in the case of Dr. Joskow, including his experience serving on the audit committees of several public companies and institutions and his education and experience as an economist who studies companies and industries, routinely using public company financial statements in his research. The SEC has stated, and the funds' amended and restated agreement and Declaration of Trust provides, that the designation or identification of a person as an audit committee financial expert pursuant to this Item 3 of Form N-CSR does not impose on such person any duties, obligations or liability that are greater than the duties, obligations and liability imposed on such person as a member of the Audit, Compliance and Risk Committee and the Board of Trustees in the absence of such designation or identification. |
| |
| Item 4. Principal Accountant Fees and Services: |
| |
| The following table presents fees billed in each of the last two fiscal years for services rendered to the fund by the fund's independent auditor: |
| | | | | |
| Fiscal year ended | Audit Fees | Audit-Related Fees | Tax Fees | All Other Fees |
|
|
| | | | | |
| December 31, 2020 | $96,632 | $ — | $8,998 | $ — |
| December 31, 2019 | $111,279 | $ — | $13,247 | $ — |
| |
| For the fiscal years ended December 31, 2020 and December 31, 2019, the fund's independent auditor billed aggregate non-audit fees in the amounts of $622,692 and $170,922 respectively, to the fund, Putnam Management and any entity controlling, controlled by or under common control with Putnam Management that provides ongoing services to the fund. |
| |
| Audit Fees represent fees billed for the fund's last two fiscal years relating to the audit and review of the financial statements included in annual reports and registration statements, and other services that are normally provided in connection with statutory and regulatory filings or engagements. |
| |
| Audit-Related Fees represent fees billed in the fund's last two fiscal years for services traditionally performed by the fund's auditor, including accounting consultation for proposed transactions or concerning financial accounting and reporting standards and other audit or attest services not required by statute or regulation. |
| |
| Tax Fees represent fees billed in the fund's last two fiscal years for tax compliance, tax planning and tax advice services. Tax planning and tax advice services include assistance with tax audits, employee benefit plans and requests for rulings or technical advice from taxing authorities. |
| |
| Pre-Approval Policies of the Audit, Compliance and Risk Committee. The Audit, Compliance and Risk Committee of the Putnam funds has determined that, as a matter of policy, all work performed for the funds by the funds' independent auditors will be pre-approved by the Committee itself and thus will generally not be subject to pre-approval procedures. |
| |
| The Audit, Compliance and Risk Committee also has adopted a policy to pre-approve the engagement by Putnam Management and certain of its affiliates of the funds' independent auditors, even in circumstances where pre-approval is not required by applicable law. Any such requests by Putnam Management or certain of its affiliates are typically submitted in writing to the Committee and explain, among other things, the nature of the proposed engagement, the estimated fees, and why this work should be performed by that particular audit firm as opposed to another one. In reviewing such requests, the Committee considers, among other things, whether the provision of such services by the audit firm are compatible with the independence of the audit firm. |
| |
| The following table presents fees billed by the fund's independent auditor for services required to be approved pursuant to paragraph (c)(7)(ii) of Rule 2–01 of Regulation S-X. |
| | | | | |
| Fiscal year ended | Audit-Related Fees | Tax Fees | All Other Fees | Total Non-Audit Fees |
|
|
| December 31, 2020 | $ — | $613,694 | $ — | $ — |
| December 31, 2019 | $ — | $157,575 | $ — | $ — |
| |
| Item 5. Audit Committee of Listed Registrants |
| |
| Item 6. Schedule of Investments: |
| |
| The registrant's schedule of investments in unaffiliated issuers is included in the report to shareholders in Item 1 above. |
| |
| Item 7. Disclosure of Proxy Voting Policies and Procedures For Closed-End Management Investment Companies: |
| |
| Item 8. Portfolio Managers of Closed-End Investment Companies |
| |
| Item 9. Purchases of Equity Securities by Closed-End Management Investment Companies and Affiliated Purchasers: |
| |
| Item 10. Submission of Matters to a Vote of Security Holders: |
| |
| Item 11. Controls and Procedures: |
| |
| (a) The registrant's principal executive officer and principal financial officer have concluded, based on their evaluation of the effectiveness of the design and operation of the registrant's disclosure controls and procedures as of a date within 180 days of the filing date of this report, that the design and operation of such procedures are generally effective to provide reasonable assurance that information required to be disclosed by the registrant in this report is recorded, processed, summarized and reported within the time periods specified in the Commission's rules and forms. |
| |
| (b) Changes in internal control over financial reporting: Not applicable |
| |
| Item 12. Disclosures of Securities Lending Activities for Closed-End Management Investment Companies: |
| |
| (a)(1) The Code of Ethics of The Putnam Funds, which incorporates the Code of Ethics of Putnam Investments, is filed herewith. |
| |
| Pursuant to the requirements of the Securities Exchange Act of 1934 and the Investment Company Act of 1940, the registrant has duly caused this report to be signed on its behalf by the undersigned, thereunto duly authorized. |
| |
| By (Signature and Title): |
| |
| /s/ Janet C. Smith
Janet C. Smith
Principal Accounting Officer
|
| |
| Pursuant to the requirements of the Securities Exchange Act of 1934 and the Investment Company Act of 1940, this report has been signed below by the following persons on behalf of the registrant and in the capacities and on the dates indicated. |
| |
| By (Signature and Title): |
| |
| /s/ Jonathan S. Horwitz
Jonathan S. Horwitz
Principal Executive Officer
|
| |
| By (Signature and Title): |
| |
| /s/ Janet C. Smith
Janet C. Smith
Principal Financial Officer
|