| | |
| UNITED STATES
SECURITIES AND EXCHANGE COMMISSION |
| | |
| CERTIFIED SHAREHOLDER REPORT OF REGISTERED
MANAGEMENT INVESTMENT COMPANIES
|
| | |
| Investment Company Act file number: | (811-05346) |
| | |
| Exact name of registrant as specified in charter: | Putnam Variable Trust |
| | |
| Address of principal executive offices: | 100 Federal Street, Boston, Massachusetts 02110 |
| | |
| Name and address of agent for service: | Stephen Tate, Vice President
100 Federal Street
Boston, Massachusetts 02110 |
| | |
| Copy to: | Bryan Chegwidden, Esq.
Ropes & Gray LLP
1211 Avenue of the Americas
New York, New York 10036 |
| | |
| Registrant’s telephone number, including area code: | (617) 292-1000 |
| | |
| Date of fiscal year end: | December 31, 2021 |
| | |
| Date of reporting period: | January 1, 2021 – December 31, 2021 |
| | |
|
Item 1. Report to Stockholders: | |
| | |
| The following is a copy of the report transmitted to stockholders pursuant to Rule 30e-1 under the Investment Company Act of 1940: | |
Message from the Trustees
February 9, 2022
Dear Shareholder:
In 2021, most areas of the stock market had another above-average year as corporate earnings rose amid rapid gross domestic product growth. Bonds, on the other hand, had a subpar year, with inflation causing concern. Financial markets are now adjusting to a shift in monetary policy, as the U.S. Federal Reserve reduces its bond-purchasing program and considers raising interest rates.
In 2022, the evolving Covid-19 pandemic remains challenging. Still, companies have learned to adapt to unexpected hurdles. Trends in consumer spending, employment, and credit conditions have been encouraging. We believe economic conditions may remain supportive for financial markets this year.
As the economy shifts gears, Putnam’s investment professionals will be actively managing your fund and monitoring risks, as the firm has done for more than 80 years.
Thank you for investing with Putnam.
Performance summary (as of 12/31/21)
Investment objective
Long-term capital appreciation
Net asset value December 31, 2021
| |
| Class IA: $23.45 | Class IB: $23.25 |
| | | | |
| Total return at net asset value (as of 12/31/21) | |
| | | | | | MSCI EAFE |
| | | | | | Growth |
| | | | | | (ND) - MSCI |
| | | | | MSCI | | Emerging |
| | | Class IA | | Class IB | | Emerging | | Markets Index |
| | | shares | | shares | | Markets Index | | (ND) Linked |
| | | (1/2/97) | | (4/30/98) | | (ND)* | | Benchmark† |
| 1 year | –3.98% | –4.23% | –2.54% | –2.54% |
| 5 years | 70.30 | 68.17 | 60.14 | 76.92 |
| Annualized | 11.24 | 10.96 | 9.87 | 12.09 |
| 10 years | 125.94 | 120.46 | 70.62 | 144.38 |
| Annualized | 8.49 | 8.23 | 5.49 | 9.35 |
| Life | 285.26 | 263.87 | — | 256.20 |
| Annualized | 5.54 | 5.30 | — | 5.23 |
For a portion of the periods, the fund had expense limitations, without which returns would have been lower.
Before April 30, 2020, the fund was managed with a materially different investment strategy and may have achieved materially different performance results under its current investment strategy from that shown for periods before this date.
* The fund’s benchmark, the MSCI Emerging Markets Index (ND), was introduced on 1/1/01, which post-dates the inception of the fund’s class IA and IB shares.
† The MSCI EAFE Growth (ND) - MSCI Emerging Markets (ND) Linked Benchmark represents performance of the MSCI EAFE Growth Index (ND) from the inception date of the fund, January 2, 1997, through April 29, 2020, and performance of the MSCI Emerging Markets Index (ND) from April 30, 2020, and thereafter.
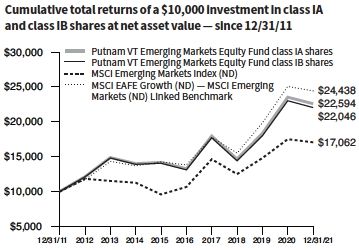
The MSCI Emerging Markets Index (ND) is a free float-adjusted market capitalization index that is designed to measure equity market performance in the global emerging markets. The MSCI EAFE Growth Index (ND) is an unmanaged index that measures the performance of equity securities in countries within Europe, Australasia, and the Far East with a greater-than-average growth orientation. Calculated with net dividends (ND), this total return index reflects the reinvestment of dividends after the deduction of withholding taxes, using a tax rate applicable to non-resident institutional investors who do not benefit from double taxation treaties.
Data represent past performance. Past performance does not guarantee future results. More recent returns may be less or more than those shown. Investment return and principal value will fluctuate, and you may have a gain or a loss when you sell your shares. Performance information does not reflect any deduction for taxes a shareholder may owe on fund distributions or on the redemption of fund shares. All total return figures are at net asset value and exclude contract charges and expenses, which are added to the variable annuity contracts to determine total return at unit value. Had these charges and expenses been reflected, performance would have been lower. Performance of class IB shares before their inception is derived from the historical performance of class IA shares, adjusted to reflect the higher operating expenses applicable to such shares. For more recent performance, contact your variable annuity provider who can provide you with performance that reflects the charges and expenses at your contract level.
A negative percentage reflects the effect of fund strategies that are designed to enhance performance if certain securities decline in value.
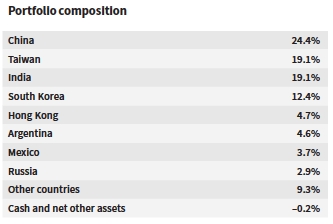
Allocations are shown as a percentage of the fund’s net assets. Cash and net other assets, if any, represent the market value weights of cash, derivatives, short-term securities, and other unclassified assets in the portfolio. Summary information may differ from the information in the portfolio schedule notes included in the financial statements due to the inclusion of derivative securities, any interest accruals, the exclusion of as-of trades, if any, and rounding. Holdings and allocations may vary over time.
| |
| Putnam VT Emerging Markets Equity Fund 1 |
Report from your fund’s manager
How was the investment environment for the 12-month reporting period ended December 31, 2021?
Overall, for the period, emerging market stocks fell. Market volatility was driven by concerns about rising inflation, an uneven global economic recovery, and the spread of the different variants of Covid-19. Other key global equity market indexes also seesawed during the quarter, with some managing to hold on to gains. The S&P 500 Index, a broad measure of U.S. stocks, rose 28.71%. The MSCI World Index [ND], a broad measure of equity securities from developed countries, gained 21.82% during the period.
For emerging market investors, a strong U.S. dollar, higher interest rates, and the Federal Reserve’s plans to accelerate the taper of its stimulus spending in a bid to combat rising inflation created some risks. Central banks in some developing countries, including Brazil, Chile, South Africa, and Russia, have started to raise interest rates. In addition, China — the world’s second-largest economy and a key trading partner — is starting to see slower economic activity. Despite some uncertainties during the year, our outlook remains bullish for emerging markets.
How did the fund perform during the reporting period?
Putnam VT Emerging Markets Equity Fund underperformed its primary benchmark, the MSCI Emerging Markets Index [ND], for the period. The fund’s class IA shares declined 3.98% versus the benchmark’s drop of 2.54%.
What stocks contributed to performance?
One of our top contributors for the period was Apollo Hospitals Enterprise, India’s largest private hospital chain and integrated health care provider. It operates 10,231 beds at 71 hospitals, 4,292 pharmacies, and the leading digital health care app in India. Public health care expenditure is low in India. In 2018, health care expenditure was just 4% of its gross domestic product [the global average was 9%] and the number of available hospital beds is only 12 per 1,000 people versus 81 per 1,000 in the United States. Apollo is improving the overall availability of private health care services in India and promoting better access to care in semiurban and rural geographies. Given the the company’s total addressable market and its expansion plans, our thesis was that a mid-teen top-line compound annual growth rate [CAGR] would be achievable for the next five years. We expect consensus to revise upward and stock outperformance to continue. The next catalyst, we believe, will be the announcement of fundraising and partnership on its Apollo 24/7 digital initiative.
Li-Ning was another top contributor for the period. Li-Ning is the most well-known Chinese sportwear brand and notably collaborates with ex-NBA superstar Dwyane Wade on the Way of Wade basketball shoes series. Since the appointment of co-CEO Kosaka Takeshi in 2019, Li-Ning has taken major strides in improving its channel mix and inventory management. Investments into e-commerce, higher-end sportswear, and new categories like yoga have all shown good traction. These strategic initiatives enabled Li-Ning to benefit from broader tailwinds such as the government’s renewed focus on sports and a shift in consumer preference toward local brands. We remain confident in the management’s ability to execute and have identified further room for earnings upside. Putting these together, we have conviction in Li-Ning’s ability to extend its recent streak of earnings and stock outperformance.
What stocks detracted from performance?
Alibaba, China’s leading e-commerce, fintech, and cloud service provider, was a top detractor for the period. Our initial thesis was that Alibaba’s core e-commerce business should continue to compound at an above-market growth rate. Further, we believed improving profitability in cloud, logistics, and other businesses should continue to help the group deliver more than 20% earnings growth. However, unprecedented regulatory intervention from the government dampened the valuation multiple, and there was a negative earnings revision due to the increase of strategic investments. We still like the long-term potential. However, with the lack of clear catalysts and macro weakness in the short term, we are now equal weight on the stock relative to the benchmark.
Another big detractor was Tencent, the largest internet company in China. Tencent runs the most extensive internet ecosystem in China with the two largest social platforms [WeChat and QQ], the largest video game portfolio, and significant interests in cloud, enterprise solutions, fintech, and media. The company started the year strongly, but the good start was reversed by an extended period of heightened regulatory scrutiny on the broader Chinese internet industry. Tencent has been proactively adjusting to the new regulatory boundaries, and its overall strategy remains aligned with the government’s goals. In addition, Tencent carried out several shareholder-friendly corporate actions such as buybacks and one-off dividends. With a long-term view, we remain confident that Tencent can expand its already huge importance to the Chinese society as digitization continues to proliferate. We expect that to translate to a CAGR of more than 15% over the long term. Coupled with what are, in our view, more than reasonable valuations [the stock is trading at a forward price/earnings ratio of 25, which is a 15% discount to its 10-year average], we believe Tencent is still an appealing long-term investment.
As the fund begins a new year, what is your outlook?
As we enter 2022, we remain attuned to macroeconomic issues such as rising inflation, higher interest rates, and mobility restrictions due to the spread of the Omicron variant. However, we also see many opportunities to find companies that are navigating these headwinds.
Emerging market company valuations remain attractive, in our view. Stocks in the United States trade at a price-to-earnings ratio of 23 compared with 12 in emerging markets. In terms of profits, many emerging market companies have had higher earnings growth than companies in the United States this past year. Yet, developing market equities have underperformed. Going forward, we believe earnings-per-share [EPS] growth for companies in developing markets will be driven by innovation and faster economic growth.
The setup for international equity outperformance is compelling, in our view, given discounted valuations and faster EPS growth. We
| |
| 2 Putnam VT Emerging Markets Equity Fund |
believe emerging market stocks can hold their multiples — estimated EPS growth of 15% and a dividend yield of 2%. We continue to believe that rapid innovation in Asia will transform the equity landscape in the 2020s and 2030s.
The views expressed in this report are exclusively those of Putnam Management and are subject to change. They are not meant as investment advice. Please note that the holdings discussed in this report may not have been held by the fund for the entire period. Portfolio composition is subject to review in accordance with the fund’s investment strategy and may vary in the future.
Consider these risks before investing: International investing involves currency, economic, and political risks. Emerging market securities carry illiquidity and volatility risks. Investments in small and/or midsize companies increase the risk of greater price fluctuations. From time to time, the fund may invest a significant portion of its assets in companies in one or more related industries or sectors, which would make the fund more vulnerable to adverse developments affecting those industries or sectors.
Growth stocks may be more susceptible to earnings disappointments, and value stocks may fail to rebound. Risks associated with derivatives include increased investment exposure (which may be considered leverage) and, in the case of over-the-counter instruments, the potential inability to terminate or sell derivatives positions and the potential failure of the other party to the instrument to meet its obligations. The value of investments in the fund’s portfolio may fall or fail to rise over extended periods of time for a variety of reasons, including general economic, political, or financial market conditions; investor sentiment and market perceptions; government actions; geopolitical events or changes; and factors related to a specific issuer, geography, industry, or sector. These and other factors may lead to increased volatility and reduced liquidity in the fund’s portfolio holdings.
Our investment techniques, analyses, and judgments may not produce the outcome we intend. The investments we select for the fund may not perform as well as other securities that we do not select for the fund. We, or the fund’s other service providers, may experience disruptions or operating errors that could have a negative effect on the fund. You can lose money by investing in the fund.

| |
| Putnam VT Emerging Markets Equity Fund 3 |
Understanding your fund’s expenses
As an investor in a variable annuity product that invests in a registered investment company, you pay ongoing expenses, such as management fees, distribution fees (12b-1 fees), and other expenses. In the most recent six-month period, your fund’s expenses were limited; had expenses not been limited, they would have been higher. Using the following information, you can estimate how these expenses affect your investment and compare them with the expenses of other funds. You may also pay onetime transaction expenses, which are not shown in this section and would result in higher total expenses. Charges and expenses at the insurance company separate account level are not reflected. For more information, see your fund’s prospectus or talk to your financial representative.
Review your fund’s expenses
The two left-hand columns of the Expenses per $1,000 table show the expenses you would have paid on a $1,000 investment in your fund from 7/1/21 to 12/31/21. They also show how much a $1,000 investment would be worth at the close of the period, assuming actual returns and expenses. To estimate the ongoing expenses you paid over the period, divide your account value by $1,000, then multiply the result by the number in the first line for the class of shares you own.
Compare your fund’s expenses with those of other funds
The two right-hand columns of the Expenses per $1,000 table show your fund’s expenses based on a $1,000 investment, assuming a hypothetical 5% annualized return. You can use this information to compare the ongoing expenses (but not transaction expenses or total costs) of investing in the fund with those of other funds. All shareholder reports of mutual funds and funds serving as variable annuity vehicles will provide this information to help you make this comparison. Please note that you cannot use this information to estimate your actual ending account balance and expenses paid during the period.
Expense ratios
| | |
| | Class IA | Class IB |
| Net expenses for the fiscal year ended | | |
| 12/31/20* | 1.10% | 1.35% |
| Total annual operating expenses for the fiscal | | |
| year ended 12/31/20 | 1.43% | 1.68% |
| Annualized expense ratio for the six-month | | |
| period ended 12/31/21† | 1.09% | 1.34% |
Fiscal year expense information in this table is taken from the most recent prospectus, is subject to change, and may differ from that shown for the annualized expense ratio and in the financial highlights of this report.
Expenses are shown as a percentage of average net assets.
*Reflects Putnam Management’s contractual obligation to limit certain fund expenses through 4/30/22.
†For the fund’s most recent fiscal half year; may differ from expense ratios based on one-year data in the financial highlights.
Expenses per $1,000
| | | | |
| | | | Expenses and value for a |
| | Expenses and value for a | $1,000 investment, assuming |
| | $1,000 investment, assuming | a hypothetical 5% annualized |
| | actual returns for the | return for the 6 months |
| | 6 months ended 12/31/21 | ended 12/31/21 | |
| | Class IA | Class IB | Class IA | Class IB |
| Expenses paid | | | | |
| per $1,000*† | $5.22 | $6.42 | $5.55 | $6.82 |
| Ending value | | | | |
| (after | | | | |
| expenses) | $900.50 | $899.40 | $1,019.71 | $1,018.45 |
*Expenses for each share class are calculated using the fund’s annualized expense ratio for each class, which represents the ongoing expenses as a percentage of average net assets for the six months ended 12/31/21. The expense ratio may differ for each share class.
†Expenses based on actual returns are calculated by multiplying the expense ratio by the average account value for the period; then multiplying the result by the number of days in the period (184); and then dividing that result by the number of days in the year (365). Expenses based on a hypothetical 5% return are calculated by multiplying the expense ratio by the average account value for the six-month period; then multiplying the result by the number of days in the six-month period (184); and then dividing that result by the number of days in the year (365).
| |
| 4 Putnam VT Emerging Markets Equity Fund |
Report of Independent Registered Public Accounting Firm
To the Board of Trustees of Putnam Variable Trust and Shareholders of
Putnam VT Emerging Markets Equity Fund:
Opinion on the Financial Statements
We have audited the accompanying statement of assets and liabilities, including the fund’s portfolio, of Putnam VT Emerging Markets Equity Fund (one of the funds constituting Putnam Variable Trust, referred to hereafter as the “Fund”) as of December 31, 2021, the related statement of operations for the year ended December 31, 2021, the statement of changes in net assets for each of the two years in the period ended December 31, 2021, including the related notes, and the financial highlights for each of the five years in the period ended December 31, 2021 (collectively referred to as the “financial statements”). In our opinion, the financial statements present fairly, in all material respects, the financial position of the Fund as of December 31, 2021, the results of its operations for the year then ended, the changes in its net assets for each of the two years in the period ended December 31, 2021 and the financial highlights for each of the five years in the period ended December 31, 2021 in conformity with accounting principles generally accepted in the United States of America.
Basis for Opinion
These financial statements are the responsibility of the Fund’s management. Our responsibility is to express an opinion on the Fund’s financial statements based on our audits. We are a public accounting firm registered with the Public Company Accounting Oversight Board (United States) (“PCAOB”) and are required to be independent with respect to the Fund in accordance with the U.S. federal securities laws and the applicable rules and regulations of the Securities and Exchange Commission and the PCAOB.
We conducted our audits of these financial statements in accordance with the standards of the PCAOB. Those standards require that we plan and perform the audit to obtain reasonable assurance about whether the financial statements are free of material misstatement, whether due to error or fraud.
Our audits included performing procedures to assess the risks of material misstatement of the financial statements, whether due to error or fraud, and performing procedures that respond to those risks. Such procedures included examining, on a test basis, evidence regarding the amounts and disclosures in the financial statements. Our audits also included evaluating the accounting principles used and significant estimates made by management, as well as evaluating the overall presentation of the financial statements. Our procedures included confirmation of securities owned as of December 31, 2021 by correspondence with the custodian, transfer agent and brokers; when replies were not received from brokers, we performed other auditing procedures. We believe that our audits provide a reasonable basis for our opinion.
PricewaterhouseCoopers LLP
Boston, Massachusetts
February 9, 2022
We have served as the auditor of one or more investment companies in the Putnam Investments family of funds since at least 1957. We have not been able to determine the specific year we began serving as auditor.
| |
| Putnam VT Emerging Markets Equity Fund 5 |
The fund’s portfolio 12/31/21
| | |
| COMMON STOCKS (99.6%)* | Shares | Value |
| | | |
| Airlines (1.2%) | | |
| Copa Holdings SA Class A (Panama) † S | 4,869 | $402,472 |
| | | 402,472 |
| Banks (9.0%) | | |
| Bank Central Asia Tbk PT (Indonesia) | 823,900 | 417,522 |
| HDFC Bank, Ltd. (India) | 22,609 | 448,193 |
| ICICI Bank, Ltd. (India) | 110,812 | 1,097,677 |
| Sberbank of Russia PJSC ADR (Russia) | 25,446 | 408,408 |
| TCS Group Holding PLC GDR 144A (Cyprus) | 6,656 | 561,234 |
| | | 2,933,034 |
| Capital markets (0.9%) | | |
| Hong Kong Exchanges and Clearing, Ltd. | | |
| (Hong Kong) | 5,200 | 303,936 |
| | | 303,936 |
| Chemicals (1.9%) | | |
| Asian Paints, Ltd. (India) | 13,499 | 612,322 |
| | | 612,322 |
| Electrical equipment (1.6%) | | |
| Contemporary Amperex Technology Co., Ltd. | | |
| Class A (China) | 5,500 | 507,251 |
| | | 507,251 |
| Electronic equipment, instruments, and components (0.6%) | |
| Sinbon Electronics Co., Ltd. (Taiwan) | 20,000 | 204,856 |
| | | 204,856 |
| Entertainment (2.2%) | | |
| Pearl Abyss Corp. (South Korea) † | 3,681 | 427,983 |
| Sea, Ltd. ADR (Singapore) † | 1,244 | 278,295 |
| | | 706,278 |
| Food and staples retail (5.1%) | | |
| Dino Polska SA (Poland) † | 4,959 | 452,066 |
| Wal-Mart de Mexico SAB de CV (Mexico) | 323,908 | 1,205,747 |
| | | 1,657,813 |
| Health-care equipment and supplies (1.1%) | | |
| Shenzhen Mindray Bio-Medical Electronics Co., | | |
| Ltd. Class A (China) | 6,200 | 370,420 |
| | | 370,420 |
| Health-care providers and services (3.1%) | | |
| Apollo Hospitals Enterprise, Ltd. (India) | 11,071 | 746,938 |
| Max Healthcare Institute, Ltd. (India) † | 45,890 | 273,194 |
| | | 1,020,132 |
| Hotels, restaurants, and leisure (2.4%) | | |
| Jubilant FoodWorks, Ltd. (India) | 10,551 | 509,779 |
| Yum China Holdings, Inc. (China) | 5,700 | 279,709 |
| | | 789,488 |
| Household durables (1.2%) | | |
| Dixon Technologies India, Ltd. (India) | 5,020 | 371,808 |
| HC Brillant Services GmbH (acquired 8/2/13, | | |
| cost $1) (Private) (Germany) † ∆∆ F | 2 | — |
| | | 371,808 |
| Insurance (1.5%) | | |
| AIA Group, Ltd. (Hong Kong) | 49,000 | 493,990 |
| | | 493,990 |
| Interactive media and services (13.7%) | | |
| AfreecaTV Co., Ltd. (South Korea) | 1,652 | 281,077 |
| Kakao Corp. (South Korea) | 4,851 | 457,533 |
| NAVER Corp. (South Korea) | 2,396 | 760,654 |
| Tencent Holdings, Ltd. (China) | 40,700 | 2,387,593 |
| Yandex NV Class A (Russia) † | 8,943 | 541,052 |
| | | 4,427,909 |
| Internet and direct marketing retail (7.2%) | | |
| Alibaba Group Holding, Ltd. (China) † | 59,016 | 883,585 |
| JD.com, Inc. ADR (China) † | 4,066 | 284,905 |
| | |
| COMMON STOCKS (99.6%)* cont. | Shares | Value |
| | | |
| Internet and direct marketing retail cont. | | |
| JD.com, Inc. Class A (China) † | 8,132 | $286,827 |
| MercadoLibre, Inc. (Argentina) † | 657 | 885,899 |
| | | 2,341,216 |
| IT Services (6.5%) | | |
| Globant SA (Argentina) † | 1,949 | 612,161 |
| Tata Consultancy Services, Ltd. (India) | 25,434 | 1,279,261 |
| Thoughtworks Holding, Inc. † | 7,748 | 207,724 |
| | | 2,099,146 |
| Life sciences tools and services (1.9%) | | |
| WuXi AppTec Co., Ltd. Class H (China) | 35,276 | 610,769 |
| | | 610,769 |
| Machinery (4.0%) | | |
| Shenzhen Inovance Technology Co., Ltd. | | |
| Class A (China) | 52,650 | 566,584 |
| Techtronic Industries Co., Ltd. (TTI) (Hong Kong) | 37,000 | 736,510 |
| | | 1,303,094 |
| Oil, gas, and consumable fuels (2.7%) | | |
| Reliance Industries, Ltd. (India) | 27,066 | 861,751 |
| | | 861,751 |
| Professional services (1.5%) | | |
| Centre Testing International Group Co., Ltd. | | |
| Class A (China) | 111,500 | 470,052 |
| | | 470,052 |
| Semiconductors and semiconductor equipment (20.2%) | |
| ASPEED Technology, Inc. (Taiwan) | 5,000 | 642,473 |
| MediaTek, Inc. (Taiwan) | 19,000 | 812,336 |
| Novatek Microelectronics Corp. (Taiwan) | 26,000 | 504,390 |
| Parade Technologies, Ltd. (Taiwan) | 8,000 | 608,943 |
| Silergy Corp. (China) | 3,000 | 542,045 |
| Taiwan Semiconductor Manufacturing Co., | | |
| Ltd. (Taiwan) | 155,000 | 3,432,127 |
| | | 6,542,314 |
| Software (1.4%) | | |
| Totvs SA (Brazil) | 90,545 | 465,567 |
| | | 465,567 |
| Technology hardware, storage, and peripherals (6.5%) | |
| Samsung Electronics Co., Ltd. (South Korea) | 31,886 | 2,093,321 |
| | | 2,093,321 |
| Textiles, apparel, and luxury goods (2.2%) | | |
| Li Ning Co., Ltd. (China) | 66,500 | 727,737 |
| | | 727,737 |
| | | |
| Total common stocks (cost $24,836,558) | | $32,316,676 |
| |
| INVESTMENT COMPANIES (0.3%)* | Shares | Value |
| | | |
| iShares Core MSCI Emerging Markets ETF | 1,829 | $109,484 |
| Total investment companies (cost $109,057) | | $109,484 |
| |
| SHORT-TERM INVESTMENTS (1.3%)* | Shares | Value |
| | | |
| Putnam Cash Collateral Pool, LLC 0.12% d | 302,400 | $302,400 |
| Putnam Short Term Investment Fund | | |
| Class P 0.13% L | 121,338 | 121,338 |
| Total short-term investments (cost $423,738) | | $423,738 |
| |
| Total investments (cost $25,369,353) | | $32,849,898 |
Key to holding’s abbreviations
| |
| ADR | American Depository Receipts: represents ownership of foreign securities on deposit with a custodian bank |
| ETF | Exchange Traded Fund |
| GDR | Global Depository Receipts: represents ownership of foreign securities on deposit with a custodian bank |
| PJSC | Public Joint Stock Company |
| |
| 6 Putnam VT Emerging Markets Equity Fund |
Notes to the fund’s portfolio
Unless noted otherwise, the notes to the fund’s portfolio are for the close of the fund’s reporting period, which ran from January 1, 2021 through December 31, 2021 (the reporting period). Within the following notes to the portfolio, references to “Putnam Management” represent Putnam Investment Management, LLC, the fund’s manager, an indirect wholly-owned subsidiary of Putnam Investments, LLC and references to “ASC 820” represent Accounting Standards Codification 820 Fair Value Measurements and Disclosures.
* Percentages indicated are based on net assets of $32,447,420.
† This security is non-income-producing.
∆∆ This security is restricted with regard to public resale. The total fair value of this security and any other restricted securities (excluding 144A securities), if any, held at the close of the reporting period was $—.
d Affiliated company. See Notes 1 and 5 to the financial statements regarding securities lending. The rate quoted in the security description is the annualized 7-day yield of the fund at the close of the reporting period.
F This security is valued by Putnam Management at fair value following procedures approved by the Trustees. Securities are classified as Level 3 for ASC 820 based on the securities’ valuation inputs. At the close of the reporting period, fair value pricing was also used for certain foreign securities in the portfolio (Note 1).
L Affiliated company (Note 5). The rate quoted in the security description is the annualized 7-day yield of the fund at the close of the reporting period.
S Security on loan, in part or in entirety, at the close of the reporting period (Note 1).
144A after the name of an issuer represents securities exempt from registration under Rule 144A of the Securities Act of 1933, as amended. These securities may be resold in transactions exempt from registration, normally to qualified institutional buyers.
|
| DIVERSIFICATION BY COUNTRY |
Distribution of investments by country of risk at the close of the reporting period, excluding collateral received, if any (as a percentage of Portfolio Value):
| | | | |
| China | 24.3% | | Brazil | 1.4% |
| Taiwan | 19.1 | | Poland | 1.4 |
| India | 19.1 | | United States | 1.3 |
| South Korea | 12.4 | | Indonesia | 1.3 |
| Hong Kong | 4.7 | | Panama | 1.2 |
| Argentina | 4.6 | | Singapore | 0.9 |
| Mexico | 3.7 | | Germany | 0.0 |
| Russia | 2.9 | | Total | 100.0% |
| Cyprus | 1.7 | | | |
ASC 820 establishes a three-level hierarchy for disclosure of fair value measurements. The valuation hierarchy is based upon the transparency of inputs to the valuation of the fund’s investments. The three levels are defined as follows:
Level 1: Valuations based on quoted prices for identical securities in active markets.
Level 2: Valuations based on quoted prices in markets that are not active or for which all significant inputs are observable, either directly or indirectly.
Level 3: Valuations based on inputs that are unobservable and significant to the fair value measurement.
The following is a summary of the inputs used to value the fund’s net assets as of the close of the reporting period:
| | | |
| | | Valuation inputs | |
| Investments in securities: | Level 1 | Level 2 | Level 3 |
| Common stocks*: | | | |
| Communication services | $819,347 | $4,314,840 | $— |
| Consumer discretionary | 1,170,804 | 3,059,445 | —** |
| Consumer staples | 1,657,813 | — | — |
| Energy | — | 861,751 | — |
| Financials | 969,642 | 2,761,318 | — |
| Health care | — | 2,001,321 | — |
| Industrials | 402,472 | 2,280,397 | — |
| Information technology | 1,285,452 | 10,119,752 | — |
| Materials | — | 612,322 | — |
| Total common stocks | 6,305,530 | 26,011,146 | — |
| Investment companies | 109,484 | — | — |
| Short-term investments | — | 423,738 | — |
| Totals by level | $6,415,014 | $26,434,884 | $— |
* Common stock classifications are presented at the sector level, which may differ from the fund’s portfolio presentation.
** Value of Level 3 security is $—.
At the start and close of the reporting period, Level 3 investments in securities represented less than 1% of the fund’s net assets and were not considered a significant portion of the fund’s portfolio.
The accompanying notes are an integral part of these financial statements.
| |
| Putnam VT Emerging Markets Equity Fund 7 |
Statement of assets and liabilities
12/31/21
| |
| Assets | |
| Investment in securities, at value, including $297,576 of securities on loan (Note 1): | |
| Unaffiliated issuers (identified cost $24,945,615) | $32,426,160 |
| Affiliated issuers (identified cost $423,738) (Notes 1 and 5) | 423,738 |
| Cash | 13,929 |
| Foreign currency (cost $9,029) (Note 1) | 9,221 |
| Dividends, interest and other receivables | 55,008 |
| Foreign tax reclaim | 30,661 |
| Receivable for shares of the fund sold | 16,388 |
| Receivable for investments sold | 132,719 |
| Total assets | 33,107,824 |
| |
| Liabilities | |
| Payable for shares of the fund repurchased | 47,650 |
| Payable for compensation of Manager (Note 2) | 7,695 |
| Payable for custodian fees (Note 2) | 10,545 |
| Payable for investor servicing fees (Note 2) | 3,880 |
| Payable for Trustee compensation and expenses (Note 2) | 54,484 |
| Payable for administrative services (Note 2) | 353 |
| Payable for distribution fees (Note 2) | 2,009 |
| Payable for auditing and tax fees | 38,707 |
| Payable for foreign capital gains taxes | 184,268 |
| Collateral on securities loaned, at value (Note 1) | 302,400 |
| Other accrued expenses | 8,413 |
| Total liabilities | 660,404 |
| | |
| Net assets | $32,447,420 |
| |
| Represented by | |
| Paid-in capital (Unlimited shares authorized) (Notes 1 and 4) | $22,526,655 |
| Total distributable earnings (Note 1) | 9,920,765 |
| Total — Representing net assets applicable to capital shares outstanding | $32,447,420 |
| | |
| Computation of net asset value Class IA | |
| Net assets | $22,916,470 |
| Number of shares outstanding | 977,096 |
| Net asset value, offering price and redemption price per share (net assets divided by number of shares outstanding) | $23.45 |
| | |
| Computation of net asset value Class IB | |
| Net assets | $9,530,950 |
| Number of shares outstanding | 409,911 |
| Net asset value, offering price and redemption price per share (net assets divided by number of shares outstanding) | $23.25 |
The accompanying notes are an integral part of these financial statements.
| |
| 8 Putnam VT Emerging Markets Equity Fund |
Statement of operations
Year ended 12/31/21
| |
| Investment income | |
| Dividends (net of foreign tax of $51,250) | $340,135 |
| Interest (including interest income of $97 from investments in affiliated issuers) (Note 5) | 230 |
| Securities lending (net of expenses) (Notes 1 and 5) | 1,044 |
| Total investment income | 341,409 |
| |
| Expenses | |
| Compensation of Manager (Note 2) | 331,033 |
| Investor servicing fees (Note 2) | 25,462 |
| Custodian fees (Note 2) | 52,730 |
| Trustee compensation and expenses (Note 2) | 1,459 |
| Distribution fees (Note 2) | 27,320 |
| Administrative services (Note 2) | 877 |
| Auditing and tax fees | 47,267 |
| Other | 20,830 |
| Fees waived and reimbursed by Manager (Note 2) | (82,416) |
| Total expenses | 424,562 |
| | |
| Expense reduction (Note 2) | (43) |
| Net expenses | 424,519 |
| | |
| Net investment loss | (83,110) |
| | |
| Realized and unrealized gain (loss) | |
| Net realized gain (loss) on: | |
| Securities from unaffiliated issuers (net of foreign tax of $118,215) (Notes 1 and 3) | 2,775,434 |
| Foreign currency transactions (Note 1) | (14,188) |
| Total net realized gain | 2,761,246 |
| Change in net unrealized depreciation on: | |
| Securities from unaffiliated issuers (net of foreign tax of $184,268) | (3,990,663) |
| Assets and liabilities in foreign currencies | (3,399) |
| Total change in net unrealized depreciation | (3,994,062) |
| | |
| Net loss on investments | (1,232,816) |
| | |
| Net decrease in net assets resulting from operations | $(1,315,926) |
The accompanying notes are an integral part of these financial statements.
| |
| Putnam VT Emerging Markets Equity Fund 9 |
Statement of changes in net assets
| | |
| | Year ended | Year ended |
| | 12/31/21 | 12/31/20 |
| Increase (decrease) in net assets | | |
| Operations: | | |
| Net investment income (loss) | $(83,110) | $195,768 |
| Net realized gain on investments and foreign currency transactions | 2,761,246 | 1,318,837 |
| Change in net unrealized appreciation (depreciation) of investments and assets and liabilities in foreign currencies | (3,994,062) | 6,686,588 |
| Net increase (decrease) in net assets resulting from operations | (1,315,926) | 8,201,193 |
| Distributions to shareholders (Note 1): | | |
| From ordinary income | | |
| Net investment income | | |
| Class IA | (180,517) | (62,479) |
| Class IB | (54,192) | (3,664) |
| Net realized short-term gain on investments | | |
| Class IA | (383,726) | — |
| Class IB | (167,997) | — |
| Decrease from capital share transactions (Note 4) | (2,908,538) | (4,490,147) |
| Total increase (decrease) in net assets | (5,010,896) | 3,644,903 |
| Net assets: | | |
| Beginning of year | 37,458,316 | 33,813,413 |
| End of year | $32,447,420 | $37,458,316 |
The accompanying notes are an integral part of these financial statements.
| |
| 10 Putnam VT Emerging Markets Equity Fund |
Financial highlights (For a common share outstanding throughout the period)
| | | | | | | | | | | | | |
| INVESTMENT OPERATIONS: | | | | | LESS DISTRIBUTIONS: | | | RATIOS AND SUPPLEMENTAL DATA: |
| Period ended | Net asset value, beginning of period | Net investment income (loss)a | Net realized and unrealized gain (loss) on investments | Total from investment operations | From net investment income | From net realized gain on investments | Total distributions | Net asset value, end of period | Total return at net asset value (%)b,c | Net assets, end of period (in thousands) | Ratio of expenses to average net assets (%)c,d,e | Ratio of net investment income (loss) to average net assets (%)e | Portfolio turnover (%) |
| Class IA | | | | | | | | | | | | | |
| 12/31/21 | $24.97 | (.04) | (.93) | (.97) | (.18) | (.37) | (.55) | $23.45 | (3.98) | $22,916 | 1.09 | (.16) | 78 |
| 12/31/20 | 19.54 | .14 | 5.35 | 5.49 | (.06) | — | (.06) | 24.97 | 28.25 | 25,960 | 1.09 | .69 | 146 |
| 12/31/19 | 17.66 | .12 | 4.04 | 4.16 | (.08) | (2.20) | (2.28) | 19.54 | 25.21 | 23,383 | 1.09 | .67 | 68 |
| 12/31/18 | 23.51 | .12 | (4.10) | (3.98) | (.03) | (1.84) | (1.87) | 17.66 | (18.40) | 20,832 | 1.16 | .55 | 89 |
| 12/31/17 | 17.61 | .16 | 6.00 | 6.16 | (.26) | — | (.26) | 23.51 | 35.37 | 29,496 | 1.20 | .77 | 105 |
| Class IB | | | | | | | | | | | | | |
| 12/31/21 | $24.77 | (.10) | (.93) | (1.03) | (.12) | (.37) | (.49) | $23.25 | (4.23) | $9,531 | 1.34 | (.40) | 78 |
| 12/31/20 | 19.37 | .09 | 5.32 | 5.41 | (.01) | — | (.01) | 24.77 | 27.94 | 11,498 | 1.34 | .45 | 146 |
| 12/31/19 | 17.56 | .08 | 4.01 | 4.09 | (.08) | (2.20) | (2.28) | 19.37 | 24.93 | 10,430 | 1.34 | .42 | 68 |
| 12/31/18 | 23.42 | .06 | (4.08) | (4.02) | — | (1.84) | (1.84) | 17.56 | (18.64) | 9,512 | 1.41 | .30 | 89 |
| 12/31/17 | 17.54 | .11 | 5.98 | 6.09 | (.21) | — | (.21) | 23.42 | 35.04 | 13,716 | 1.45 | .52 | 105 |
Before April 30, 2020, the fund was managed with a materially different investment strategy and may have achieved materially different performance results under its current investment strategy from that shown for periods before this date.
a Per share net investment income (loss) has been determined on the basis of the weighted average number of shares outstanding during the period.
b Total return assumes dividend reinvestment.
c The charges and expenses at the insurance company separate account level are not reflected.
d Includes amounts paid through expense offset and brokerage/service arrangements, if any (Note 2). Also excludes acquired fund fees and expenses, if any.
e Reflects an involuntary contractual expense limitation in effect during the period (Note 2). As a result of such limitation, the expenses of each class reflect a reduction of the following amounts:
| | | | |
| | Percentage of average | | | |
| | net assets | | | |
| 12/31/21 | 0.23% | | | |
| 12/31/20 | 0.33 | | | |
| 12/31/19 | 0.21 | | | |
| 12/31/18 | 0.14 | | | |
| 12/31/17 | 0.14 | | | |
The accompanying notes are an integral part of these financial statements.
| |
| Putnam VT Emerging Markets Equity Fund 11 |
Notes to financial statements 12/31/21
Within the following Notes to financial statements, references to “State Street” represent State Street Bank and Trust Company, references to “the SEC” represent the Securities and Exchange Commission, references to “Putnam Management” represent Putnam Investment Management, LLC, the fund’s manager, an indirect wholly-owned subsidiary of Putnam Investments, LLC and references to “OTC”, if any, represent over-the-counter. Unless otherwise noted, the “reporting period” represents the period from January 1, 2021 through December 31, 2021.
Putnam VT Emerging Markets Equity Fund (the fund) is a diversified series of Putnam Variable Trust (the Trust), a Massachusetts business trust registered under the Investment Company Act of 1940, as amended, as an open-end management investment company. The goal of the fund is to seek long-term capital appreciation. The fund invests mainly in common stocks (growth or value stocks or both) of emerging market companies that Putnam Management believes have favorable investment potential. For example, the fund may purchase stocks of companies with stock prices that reflect a value lower than that which Putnam Management places on the company. The fund may also consider other factors that Putnam Management believes will cause the stock price to rise. Under normal circumstances, the fund invests at least 80% of the fund’s net assets in equity securities of emerging market companies. This policy may be changed only after 60 days’ notice to shareholders. Emerging markets include countries in the MSCI Emerging Market Index or that Putnam Management considers to be emerging markets based on our evaluation of their level of economic development or the size and experience of their securities markets. The fund invests significantly in small and midsize companies. Putnam Management may consider, among other factors, a company’s valuation, financial strength, growth potential, competitive position in its industry, projected future earnings, cash flows and dividends when deciding whether to buy or sell investments. The fund may also use derivatives, such as futures, options, certain foreign currency transactions, warrants and swap contracts, for both hedging and non-hedging purposes.
The fund offers class IA and class IB shares of beneficial interest. Class IA shares are offered at net asset value and are not subject to a distribution fee. Class IB shares are offered at net asset value and pay an ongoing distribution fee, which is identified in Note 2.
In the normal course of business, the fund enters into contracts that may include agreements to indemnify another party under given circumstances. The fund’s maximum exposure under these arrangements is unknown as this would involve future claims that may be, but have not yet been, made against the fund. However, the fund’s management team expects the risk of material loss to be remote.
The fund has entered into contractual arrangements with an investment adviser, administrator, distributor, shareholder servicing agent and custodian, who each provide services to the fund. Unless expressly stated otherwise, shareholders are not parties to, or intended beneficiaries of these contractual arrangements, and these contractual arrangements are not intended to create any shareholder right to enforce them against the service providers or to seek any remedy under them against the service providers, either directly or on behalf of the fund.
Under the fund’s Amended and Restated Agreement and Declaration of Trust, any claims asserted against or on behalf of the Putnam Funds, including claims against Trustees and Officers, must be brought in state and federal courts located within the Commonwealth of Massachusetts.
Note 1 — Significant accounting policies
The following is a summary of significant accounting policies consistently followed by the fund in the preparation of its financial statements. The preparation of financial statements is in conformity with accounting principles generally accepted in the United States of America and requires management to make estimates and assumptions that affect the reported amounts of assets and liabilities in the financial statements and the reported amounts of increases and decreases in net assets from operations. Actual results could differ from those estimates. Subsequent events after the Statement of assets and liabilities date through the date that the financial statements were issued have been evaluated in the preparation of the financial statements.
Investment income, realized and unrealized gains and losses and expenses of the fund are borne pro-rata based on the relative net assets of each class to the total net assets of the fund, except that each class bears expenses unique to that class (including the distribution fees applicable to such classes). Each class votes as a class only with respect to its own distribution plan or other matters on which a class vote is required by law or determined by the Trustees. If the fund were liquidated, shares of each class would receive their pro-rata share of the net assets of the fund. In addition, the Trustees declare separate dividends on each class of shares.
Security valuation Portfolio securities and other investments are valued using policies and procedures adopted by the Board of Trustees. The Trustees have formed a Pricing Committee to oversee the implementation of these procedures and have delegated responsibility for valuing the fund’s assets in accordance with these procedures to Putnam Management. Putnam Management has established an internal Valuation Committee that is responsible for making fair value determinations, evaluating the effectiveness of the pricing policies of the fund and reporting to the Pricing Committee.
Investments for which market quotations are readily available are valued at the last reported sales price on their principal exchange, or official closing price for certain markets, and are classified as Level 1 securities under Accounting Standards Codification 820 Fair Value Measurements and Disclosures (ASC 820). If no sales are reported, as in the case of some securities that are traded OTC, a security is valued at its last reported bid price and is generally categorized as a Level 2 security.
Investments in open-end investment companies (excluding exchange-traded funds), if any, which can be classified as Level 1 or Level 2 securities, are valued based on their net asset value. The net asset value of such investment companies equals the total value of their assets less their liabilities and divided by the number of their outstanding shares.
Many securities markets and exchanges outside the U.S. close prior to the scheduled close of the New York Stock Exchange and therefore the closing prices for securities in such markets or on such exchanges may not fully reflect events that occur after such close but before the scheduled close of the New York Stock Exchange. Accordingly, on certain days, the fund will fair value certain foreign equity securities taking into account multiple factors including movements in the U.S. securities markets, currency valuations and comparisons to the valuation of American Depository Receipts, exchange-traded funds and futures contracts. The foreign equity securities, which would generally be classified as Level 1 securities, will be transferred to Level 2 of the fair value hierarchy when they are valued at fair value. The number of days on which fair value prices will be used will depend on market activity and it is possible that fair value prices will be used by the fund to a significant extent. At the close of the reporting period, fair value pricing was used for certain foreign securities in the portfolio. Securities quoted in foreign currencies, if any, are translated into U.S. dollars at the current exchange rate.
To the extent a pricing service or dealer is unable to value a security or provides a valuation that Putnam Management does not believe accurately reflects the security’s fair value, the security will be valued at fair value by Putnam Management in accordance with policies and procedures approved by the Trustees. Certain investments, including certain restricted and illiquid securities and derivatives, are also valued at fair value following procedures approved by the Trustees. These valuations consider such factors as significant market or specific security events such as interest rate or credit quality changes, various relationships with other securities, discount rates, U.S. Treasury, U.S. swap and credit yields, index levels, convexity exposures, recovery rates, sales and other multiples and resale restrictions. These securities are classified as Level 2 or as Level 3 depending on the priority of the significant inputs.
To assess the continuing appropriateness of fair valuations, the Valuation Committee reviews and affirms the reasonableness of such valuations on a regular basis after considering all relevant information that is reasonably available. Such valuations and procedures are reviewed periodically by the Trustees. The fair value of securities is generally determined as the amount that the fund could reasonably expect to realize from an orderly disposition of such securities over a reasonable period of time. By its nature, a fair value price is a good faith estimate of the value of a security in a current sale and does not reflect an actual market price, which may be different by a material amount.
Security transactions and related investment income Security transactions are recorded on the trade date (the date the order to buy or sell is executed). Gains or losses on securities sold are determined on the identified cost basis.
Interest income, net of any applicable withholding taxes, if any, is recorded on the accrual basis. Dividend income, net of any applicable withholding taxes, is recognized on the ex-dividend date except that certain dividends from foreign securities, if any, are recognized as soon as the fund is informed of the ex-dividend date. Non-cash dividends, if any, are recorded at the fair value of the securities received. Dividends representing a return of capital or capital gains, if any, are reflected as a reduction of cost and/or as a realized gain.
| |
| 12 Putnam VT Emerging Markets Equity Fund |
Foreign currency translation The accounting records of the fund are maintained in U.S. dollars. The fair value of foreign securities, currency holdings, and other assets and liabilities is recorded in the books and records of the fund after translation to U.S. dollars based on the exchange rates on that day. The cost of each security is determined using historical exchange rates. Income and withholding taxes are translated at prevailing exchange rates when earned or incurred. The fund does not isolate that portion of realized or unrealized gains or losses resulting from changes in the foreign exchange rate on investments from fluctuations arising from changes in the market prices of the securities. Such gains and losses are included with the net realized and unrealized gain or loss on investments. Net realized gains and losses on foreign currency transactions represent net realized exchange gains or losses on disposition of foreign currencies, currency gains and losses realized between the trade and settlement dates on securities transactions and the difference between the amount of investment income and foreign withholding taxes recorded on the fund’s books and the U.S. dollar equivalent amounts actually received or paid. Net unrealized appreciation and depreciation of assets and liabilities in foreign currencies arise from changes in the value of assets and liabilities other than investments at the period end, resulting from changes in the exchange rate.
Securities lending The fund may lend securities, through its agent, to qualified borrowers in order to earn additional income. The loans are collateralized by cash in an amount at least equal to the fair value of the securities loaned. The fair value of securities loaned is determined daily and any additional required collateral is allocated to the fund on the next business day. The remaining maturities of the securities lending transactions are considered overnight and continuous. The risk of borrower default will be borne by the fund’s agent; the fund will bear the risk of loss with respect to the investment of the cash collateral. Income from securities lending, net of expenses, is included in investment income on the Statement of operations. Cash collateral is invested in Putnam Cash Collateral Pool, LLC, a limited liability company managed by an affiliate of Putnam Management. Investments in Putnam Cash Collateral Pool, LLC are valued at its closing net asset value each business day. There are no management fees charged to Putnam Cash Collateral Pool, LLC. At the close of the reporting period, the fund received cash collateral of $302,400 and the value of securities loaned amounted to $297,576.
Interfund lending The fund, along with other Putnam funds, may participate in an interfund lending program pursuant to an exemptive order issued by the SEC. This program allows the fund to borrow from or lend to other Putnam funds that permit such transactions. Interfund lending transactions are subject to each fund’s investment policies and borrowing and lending limits. Interest earned or paid on the interfund lending transaction will be based on the average of certain current market rates. During the reporting period, the fund did not utilize the program.
Lines of credit The fund participates, along with other Putnam funds, in a $317.5 million unsecured committed line of credit and a $235.5 million unsecured uncommitted line of credit, both provided by State Street. Borrowings may be made for temporary or emergency purposes, including the funding of shareholder redemption requests and trade settlements. Interest is charged to the fund based on the fund’s borrowing at a rate equal to 1.25% plus the higher of (1) the Federal Funds rate and (2) the Overnight Bank Funding Rate for the committed line of credit and 1.30% plus the higher of (1) the Federal Funds rate and (2) the Overnight Bank Funding Rate for the uncommitted line of credit. A closing fee equal to 0.04% of the committed line of credit and 0.04% of the uncommitted line of credit has been paid by the participating funds. In addition, a commitment fee of 0.21% per annum on any unutilized portion of the committed line of credit is allocated to the participating funds based on their relative net assets and paid quarterly. During the reporting period, the fund had no borrowings against these arrangements.
Federal taxes It is the policy of the fund to distribute all of its taxable income within the prescribed time period and otherwise comply with the provisions of the Internal Revenue Code of 1986, as amended (the Code), applicable to regulated investment companies.
The fund is subject to the provisions of Accounting Standards Codification 740 Income Taxes (ASC 740). ASC 740 sets forth a minimum threshold for financial statement recognition of the benefit of a tax position taken or expected to be taken in a tax return. The fund did not have a liability to record for any unrecognized tax benefits in the accompanying financial statements. No provision has been made for federal taxes on income, capital gains or unrealized appreciation on securities held nor for excise tax on income and capital gains. Each of the fund’s federal tax returns for the prior three fiscal years remains subject to examination by the Internal Revenue Service.
The fund may also be subject to taxes imposed by governments of countries in which it invests. Such taxes are generally based on either income or gains earned or repatriated. The fund accrues and applies such taxes to net investment income, net realized gains and net unrealized gains as income and/or capital gains are earned. In some cases, the fund may be entitled to reclaim all or a portion of such taxes, and such reclaim amounts, if any, are reflected as an asset on the fund’s books. In many cases, however, the fund may not receive such amounts for an extended period of time, depending on the country of investment.
Distributions to shareholders Distributions to shareholders from net investment income are recorded by the fund on the ex-dividend date. Distributions from capital gains, if any, are recorded on the ex-dividend date and paid at least annually. The amount and character of income and gains to be distributed are determined in accordance with income tax regulations, which may differ from generally accepted accounting principles. These differences include temporary and/or permanent differences from losses on wash sale transactions, from foreign currency gains and losses, from foreign taxes paid on capital gains, from net operating loss and from a redesignation of taxable distributions. Reclassifications are made to the fund’s capital accounts to reflect income and gains available for distribution (or available capital loss carryovers) under income tax regulations. At the close of the reporting period, the fund reclassified $102,910 to decrease distributions in excess of net investment income and $102,910 to decrease accumulated net realized gain.
Tax cost of investments includes adjustments to net unrealized appreciation (depreciation) which may not necessarily be final tax cost basis adjustments, but closely approximate the tax basis unrealized gains and losses that may be realized and distributed to shareholders. The tax basis components of distributable earnings and the federal tax cost as of the close of the reporting period were as follows:
| |
| Unrealized appreciation | $8,563,563 |
| Unrealized depreciation | (1,181,754) |
| Net unrealized appreciation | 7,381,809 |
| Undistributed short-term gain | 558,723 |
| Undistributed long-term gain | 2,163,995 |
| Cost for federal income tax purposes | $25,468,089 |
Expenses of the Trust Expenses directly charged or attributable to any fund will be paid from the assets of that fund. Generally, expenses of the Trust will be allocated among and charged to the assets of each fund on a basis that the Trustees deem fair and equitable, which may be based on the relative assets of each fund or the nature of the services performed and relative applicability to each fund.
Beneficial interest At the close of the reporting period, insurance companies or their separate accounts were record owners of all but a de minimis number of the shares of the fund. Approximately 40.6% of the fund is owned by accounts of one insurance company.
Note 2 — Management fee, administrative services and other transactions
The fund pays Putnam Management a management fee (based on the fund’s average net assets and computed and paid monthly) at annual rates that may vary based on the average of the aggregate net assets of all open-end mutual funds sponsored by Putnam Management (excluding net assets of funds that are invested in, or that are invested in by, other Putnam funds to the extent necessary to avoid “double counting” of those assets). Such annual rates may vary as follows:
| |
| 1.080% | of the first $5 billion, |
| 1.030% | of the next $5 billion, |
| 0.980% | of the next $10 billion, |
| 0.930% | of the next $10 billion, |
| 0.880% | of the next $50 billion, |
| 0.860% | of the next $50 billion, |
| 0.850% | of the next $100 billion and |
| 0.845% | of any excess thereafter. |
For the reporting period, the management fee represented an effective rate (excluding the impact from any expense waivers in effect) of 0.912% of the fund’s average net assets.
Putnam Management has contractually agreed, through April 30, 2023, to waive fees and/or reimburse the fund’s expenses to the extent necessary to limit the cumulative expenses of the fund, exclusive of brokerage, interest, taxes, investment-related expenses, extraordinary expenses, acquired fund fees and expenses and payments under the fund’s investor servicing contract, investment management contract and distribution plans, on a fiscal year-to-date basis to an annual rate of 0.20% of the fund’s average net assets over such fiscal year-to-date period. During the reporting period, the fund’s expenses were reduced by $49,031 as a result of this limit.
| |
| Putnam VT Emerging Markets Equity Fund 13 |
Putnam Management has also contractually agreed to waive fees (and, to the extent necessary, bear other expenses) of the fund through April 30, 2023, to the extent that total expenses of the fund (excluding brokerage, interest, taxes, investment-related expenses, payments under distribution plans, extraordinary expenses and acquired fund fees and expenses) would exceed an annual rate of 1.09% of the fund’s average net assets. During the reporting period, the fund’s expenses were reduced by $33,385 as a result of this limit.
Putnam Investments Limited (PIL), an affiliate of Putnam Management, is authorized by the Trustees to manage a separate portion of the assets of the fund as determined by Putnam Management from time to time. PIL did not manage any portion of the assets of the fund during the reporting period. If Putnam Management were to engage the services of PIL, Putnam Management would pay a quarterly sub-management fee to PIL for its services at an annual rate of 0.35% of the average net assets of the portion of the fund managed by PIL.
The Putnam Advisory Company, LLC (PAC), an affiliate of Putnam Management, is authorized by the Trustees to manage a separate portion of the assets of the fund, as designated from time to time by Putnam Management or PIL. Putnam Management or PIL, as applicable, pays a quarterly sub-advisory fee to PAC for its services at the annual rate of 0.35% of the average net assets of the portion of the fund’s assets for which PAC is engaged as sub-adviser.
The fund reimburses Putnam Management an allocated amount for the compensation and related expenses of certain officers of the fund and their staff who provide administrative services to the fund. The aggregate amount of all such reimbursements is determined annually by the Trustees.
Custodial functions for the fund’s assets are provided by State Street. Custody fees are based on the fund’s asset level, the number of its security holdings and transaction volumes.
Putnam Investor Services, Inc., an affiliate of Putnam Management, provides investor servicing agent functions to the fund. Putnam Investor Services, Inc. was paid a monthly fee for investor servicing at an annual rate of 0.07% of the fund’s average daily net assets. During the reporting period, the expenses for each class of shares related to investor servicing fees were as follows:
| |
| Class IA | $17,804 |
| Class IB | 7,658 |
| Total | $25,462 |
The fund has entered into expense offset arrangements with Putnam Investor Services, Inc. and State Street whereby Putnam Investor Services, Inc.’s and State Street’s fees are reduced by credits allowed on cash balances. For the reporting period, the fund’s expenses were reduced by $43 under the expense offset arrangements.
Each Independent Trustee of the fund receives an annual Trustee fee, of which $22, as a quarterly retainer, has been allocated to the fund, and an additional fee for each Trustees meeting attended. Trustees also are reimbursed for expenses they incur relating to their services as Trustees.
The fund has adopted a Trustee Fee Deferral Plan (the Deferral Plan) which allows the Trustees to defer the receipt of all or a portion of Trustees fees payable on or after July 1, 1995. The deferred fees remain invested in certain Putnam funds until distribution in accordance with the Deferral Plan.
The fund has adopted an unfunded noncontributory defined benefit pension plan (the Pension Plan) covering all Trustees of the fund who have served as a Trustee for at least five years and were first elected prior to 2004. Benefits under the Pension Plan are equal to 50% of the Trustee’s average annual attendance and retainer fees for the three years ended December 31, 2005. The retirement benefit is payable during a Trustee’s lifetime, beginning the year following retirement, for the number of years of service through December 31, 2006. Pension expense for the fund is included in Trustee compensation and expenses in the Statement of operations. Accrued pension liability is included in Payable for Trustee compensation and expenses in the Statement of assets and liabilities. The Trustees have terminated the Pension Plan with respect to any Trustee first elected after 2003.
The fund has adopted a distribution plan (the Plan) with respect to its class IB shares pursuant to Rule 12b–1 under the Investment Company Act of 1940. The purpose of the Plan is to compensate Putnam Retail Management Limited Partnership, an indirect wholly-owned subsidiary of Putnam Investments, LLC, for services provided and expenses incurred in distributing shares of the fund. The Plan provides for payment by the fund to Putnam Retail Management Limited Partnership at an annual rate of up to 0.35% of the average net assets attributable to the fund’s class IB shares. The Trustees have approved payment by the fund at an annual rate of 0.25% of the average net assets attributable to the fund’s class IB shares. The expenses related to distribution fees during the reporting period are included in Distribution fees in the Statement of operations.
Note 3 — Purchases and sales of securities
During the reporting period, the cost of purchases and the proceeds from sales, excluding short-term investments, were as follows:
| | |
| | Cost of | Proceeds |
| | purchases | from sales |
| Investments in securities (Long-term) | $27,849,598 | $31,731,716 |
| U.S. government securities | | |
| (Long-term) | — | — |
| Total | $27,849,598 | $31,731,716 |
The fund may purchase or sell investments from or to other Putnam funds in the ordinary course of business, which can reduce the fund’s transaction costs, at prices determined in accordance with SEC requirements and policies approved by the Trustees. During the reporting period, purchases or sales of long-term securities from or to other Putnam funds, if any, did not represent more than 5% of the fund’s total cost of purchases and/or total proceeds from sales.
Note 4 — Capital shares
At the close of the reporting period, there were an unlimited number of shares of beneficial interest authorized. Subscriptions and redemptions are presented at the omnibus level. Transactions in capital shares were as follows:
| | | | | | | | |
| | | Class IA shares | | | Class IB shares | |
| | Year ended 12/31/21 | Year ended 12/31/20 | Year ended 12/31/21 | Year ended 12/31/20 |
| | Shares | Amount | Shares | Amount | Shares | Amount | Shares | Amount |
| Shares sold | 53,300 | $1,387,085 | 26,904 | $555,360 | 17,073 | $425,269 | 32,475 | $622,996 |
| Shares issued in connection with | | | | | | | | |
| reinvestment of distributions | 23,106 | 564,243 | 4,102 | 62,479 | 9,162 | 222,189 | 242 | 3,664 |
| | 76,406 | 1,951,328 | 31,006 | 617,839 | 26,235 | 647,458 | 32,717 | 626,660 |
| Shares repurchased | (138,842) | (3,507,871) | (187,949) | (3,595,015) | (80,549) | (1,999,453) | (106,930) | (2,139,631) |
| Net decrease | (62,436) | $(1,556,543) | (156,943) | $(2,977,176) | (54,314) | $(1,351,995) | (74,213) | $(1,512,971) |
| |
| 14 Putnam VT Emerging Markets Equity Fund |
Note 5 — Affiliated transactions
Transactions during the reporting period with any company which is under common ownership or control were as follows:
| | | | | |
| | | | | | Shares outstanding |
| | Fair value as of | | | | and fair value as of |
| Name of affiliate | 12/31/20 | Purchase cost | Sale proceeds | Investment income | 12/31/21 |
| Short-term investments | | | | | |
| Putnam Cash Collateral Pool, LLC* | $804,230 | $13,318,334 | $13,820,164 | $930 | $302,400 |
| Putnam Short Term Investment | | | | | |
| Fund** | 422,426 | 5,007,504 | 5,308,592 | 97 | 121,338 |
| Total Short-term investments | $1,226,656 | $18,325,838 | $19,128,756 | $1,027 | $423,738 |
*No management fees are charged to Putnam Cash Collateral Pool, LLC (Note 1). Investment income shown is included in securities lending income on the Statement of operations. There were no realized or unrealized gains or losses during the period.
**Management fees charged to Putnam Short Term Investment Fund have been waived by Putnam Management. There were no realized or unrealized gains or losses during the period.
Note 6 — Market, credit and other risks
In the normal course of business, the fund trades financial instruments and enters into financial transactions where risk of potential loss exists due to changes in the market (market risk) or failure of the contracting party to the transaction to perform (credit risk). The fund may be exposed to additional credit risk that an institution or other entity with which the fund has unsettled or open transactions will default. Investments in foreign securities involve certain risks, including those related to economic instability, unfavorable political developments, and currency fluctuations.
Beginning in January 2020, global financial markets have experienced, and may continue to experience, significant volatility resulting from the spread of a virus known as Covid–19. The outbreak of Covid–19 has resulted in travel and border restrictions, quarantines, supply chain disruptions, lower consumer demand, and general market uncertainty. The effects of Covid–19 have adversely affected, and may continue to adversely affect, the global economy, the economies of certain nations, and individual issuers, all of which may negatively impact the fund’s performance.
Federal tax information (Unaudited)
Pursuant to §852 of the Internal Revenue Code, as amended, the fund hereby designates $2,380,395 as a capital gain dividend with respect to the taxable year ended December 31, 2021, or, if subsequently determined to be different, the net capital gain of such year.
For the reporting period, total interest and dividend income from foreign countries were $388,194, or $0.28 per share (for all classes of shares). Taxes paid to foreign countries were $169,465, or $0.12 per share (for all classes of shares).
| |
| Putnam VT Emerging Markets Equity Fund 15 |
| |
| 16 Putnam VT Emerging Markets Equity Fund |
*Mr. Reynolds is an “interested person” (as defined in the Investment Company Act of 1940) of the fund and Putnam Investments. He is President and Chief Executive Officer of Putnam Investments, as well as the President of your fund and each of the other Putnam funds.
The address of each Trustee is 100 Federal Street, Boston, MA 02110.
As of December 31, 2021, there were 100 Putnam funds. All Trustees serve as Trustees of all Putnam funds.
Each Trustee serves for an indefinite term, until his or her resignation, retirement at age 75, removal, or death.
Officers
In addition to Robert L. Reynolds, the other officers of the fund are shown below:
| | |
| James F. Clark (Born 1974) | Richard T. Kircher (Born 1962) | Denere P. Poulack (Born 1968) |
| Vice President and Chief Compliance Officer | Vice President and BSA Compliance Officer | Assistant Vice President, Assistant Clerk, |
| Since 2016 | Since 2019 | and Assistant Treasurer |
| Chief Compliance Officer and Chief Risk Officer, | Assistant Director, Operational Compliance, | Since 2004 |
| Putnam Investments, and Chief Compliance | Putnam Investments and Putnam | |
| Officer, Putnam Management | Retail Management | Janet C. Smith (Born 1965) |
| | | Vice President, Principal Financial |
| Nancy E. Florek (Born 1957) | Martin Lemaire (Born 1984) | Officer, Principal Accounting Officer, |
| Vice President, Director of Proxy Voting | Vice President and Derivatives Risk Manager | and Assistant Treasurer |
| and Corporate Governance, Assistant Clerk, | Since 2022 | Since 2007 |
| and Assistant Treasurer | Risk Manager and Risk Analyst, | Head of Fund Administration Services, Putnam |
| Since 2000 | Putnam Investments | Investments and Putnam Management |
| | | |
| Michael J. Higgins (Born 1976) | Susan G. Malloy (Born 1957) | Stephen J. Tate (Born 1974) |
| Vice President, Treasurer, and Clerk | Vice President and Assistant Treasurer | Vice President and Chief Legal Officer |
| Since 2010 | Since 2007 | Since 2021 |
| | Head of Accounting and Middle Office Services, | General Counsel, Putnam Investments, Putnam |
| Jonathan S. Horwitz (Born 1955) | Putnam Investments and Putnam Management | Management, and Putnam Retail Management |
| Executive Vice President, Principal Executive | | |
| Officer, and Compliance Liaison | Alan G. McCormack (Born 1964) | Mark C. Trenchard (Born 1962) |
| Since 2004 | Vice President and Derivatives Risk Manager | Vice President |
| | Since 2022 | Since 2002 |
| | Head of Quantitative Equities and Risk, | Director of Operational Compliance, Putnam |
| | Putnam Investments | Investments and Putnam Retail Management |
The principal occupations of the officers for the past five years have been with the employers as shown above, although in some cases they have held different positions with such employers. The address of each officer is 100 Federal Street, Boston, MA 02110.
| | |
| Putnam VT Emerging Markets Equity Fund 17 |
Other important information
Proxy voting
Putnam is committed to managing our mutual funds in the best interests of our shareholders. The Putnam funds’ proxy voting guidelines and procedures, as well as information regarding how your fund voted proxies relating to portfolio securities during the 12-month period ended June 30, 2021, are available in the Individual Investors section of putnam.com and on the Securities and Exchange Commission’s (SEC) website at www.sec.gov. If you have questions about finding forms on the SEC’s website, you may call the SEC at 1-800-SEC-0330. You may also obtain the Putnam funds’ proxy voting guidelines and procedures at no charge by calling Putnam’s Shareholder Services at 1-800-225-1581.
Fund portfolio holdings
The fund will file a complete schedule of its portfolio holdings with the SEC for the first and third quarters of each fiscal year on Form N-PORT within 60 days of the end of such fiscal quarter. Shareholders may obtain the fund’s Form N-PORT from the SEC’s website at www.sec.gov.
Prior to its use of Form N-PORT, the fund filed its complete schedule of its portfolio holdings with the SEC on Form N-Q, which is available online at www.sec.gov.
Fund information
| | |
| Investment Manager | Investor Servicing Agent | Trustees |
| Putnam Investment Management, LLC | Putnam Investments | Kenneth R. Leibler, Chair |
| 100 Federal Street | Mailing address: | Liaquat Ahamed |
| Boston, MA 02110 | P.O. Box 219697 | Ravi Akhoury |
| | Kansas City, MO 64121-9697 | Barbara M. Baumann |
| Investment Sub-Advisors | 1-800-225-1581 | Katinka Domotorffy |
| Putnam Investments Limited | | Catharine Bond Hill |
| 16 St James’s Street | Custodian | Paul L. Joskow |
| London, England SW1A 1ER | State Street Bank and Trust Company | George Putnam, III |
| | | Robert L. Reynolds |
| The Putnam Advisory Company, LLC | Legal Counsel | Manoj P. Singh |
| 100 Federal Street | Ropes & Gray LLP | Mona K. Sutphen |
| Boston, MA 02110 | | |
| | Independent Registered | |
| Marketing Services | Public Accounting Firm | |
| Putnam Retail Management | PricewaterhouseCoopers LLP | |
| Limited Partnership | | |
| 100 Federal Street | | |
| Boston, MA 02110 | | |
The fund’s Statement of Additional Information contains additional information about the fund’s Trustees and is available without charge upon request by calling 1-800-225-1581.
| |
| This report has been prepared for the shareholders | |
| of Putnam VT Emerging Markets Equity Fund. | VTAN010 328330 2/22 |
| |
| (a) The fund’s principal executive, financial and accounting officers are employees of Putnam Investment Management, LLC, the Fund’s investment manager. As such they are subject to a comprehensive Code of Ethics adopted and administered by Putnam Investments which is designed to protect the interests of the firm and its clients. The Fund has adopted a Code of Ethics which incorporates the Code of Ethics of Putnam Investments with respect to all of its officers and Trustees who are employees of Putnam Investment Management, LLC. For this reason, the Fund has not adopted a separate code of ethics governing its principal executive, financial and accounting officers. |
| |
| (c) In April 2021, the Code of Ethics of Putnam Investments was amended. The key changes to the Code of Ethics are as follows: (i) Employees may invest in the Putnam Exchange Traded Funds (ETFs) with preclearing requirements for certain individuals (ii) All employees must hold Putnam ETFs in an approved Putnam broker (iii) All access persons must report Putnam ETF trades or holdings in the quarterly transaction report or annual holdings report. |
| |
| Item 3. Audit Committee Financial Expert: |
| |
| The Funds’ Audit, Compliance and Risk Committee is comprised solely of Trustees who are “independent” (as such term has been defined by the Securities and Exchange Commission (“SEC”) in regulations implementing Section 407 of the Sarbanes-Oxley Act (the “Regulations”)). The Trustees believe that each member of the Audit, Compliance and Risk Committee also possesses a combination of knowledge and experience with respect to financial accounting matters, as well as other attributes, that qualifies him or her for service on the Committee. In addition, the Trustees have determined that each of Dr. Hill, Dr. Joskow, and Mr. Singh qualifies as an “audit committee financial expert” (as such term has been defined by the Regulations) based on their review of his or her pertinent experience and education; in the case of Dr. Joskow, including his experience serving on the audit committees of several public companies and institutions and his education and experience as an economist who studies companies and industries, routinely using public company financial statements in his research. The SEC has stated, and the funds’ amended and restated agreement and Declaration of Trust provides, that the designation or identification of a person as an audit committee financial expert pursuant to this Item 3 of Form N-CSR does not impose on such person any duties, obligations or liability that are greater than the duties, obligations and liability imposed on such person as a member of the Audit, Compliance and Risk Committee and the Board of Trustees in the absence of such designation or identification. |
| |
| Item 4. Principal Accountant Fees and Services: |
| |
| The following table presents fees billed in each of the last two fiscal years for services rendered to the fund by the fund’s independent auditor: |
| | | | | |
| Fiscal year ended | Audit Fees | Audit-Related Fees | Tax Fees | All Other Fees |
|
|
| | | | | |
| December 31, 2021 | $32,783 | $ — | $11,786 | $ — |
| December 31, 2020 | $35,741 | $ — | $8,330 | $ — |
| |
| For the fiscal years ended December 31, 2021 and December 31, 2020, the fund’s independent auditor billed aggregate non-audit fees in the amounts of $305,206 and $622,024 respectively, to the fund, Putnam Management and any entity controlling, controlled by or under common control with Putnam Management that provides ongoing services to the fund. |
| |
| Audit Fees represent fees billed for the fund’s last two fiscal years relating to the audit and review of the financial statements included in annual reports and registration statements, and other services that are normally provided in connection with statutory and regulatory filings or engagements. |
| |
| Audit-Related Fees represent fees billed in the fund’s last two fiscal years for services traditionally performed by the fund’s auditor, including accounting consultation for proposed transactions or concerning financial accounting and reporting standards and other audit or attest services not required by statute or regulation. |
| |
| Tax Fees represent fees billed in the fund’s last two fiscal years for tax compliance, tax planning and tax advice services. Tax planning and tax advice services include assistance with tax audits, employee benefit plans and requests for rulings or technical advice from taxing authorities. |
| |
| Pre-Approval Policies of the Audit, Compliance and Risk Committee. The Audit, Compliance and Risk Committee of the Putnam funds has determined that, as a matter of policy, all work performed for the funds by the funds’ independent auditors will be pre-approved by the Committee itself and thus will generally not be subject to pre-approval procedures. |
| |
| The Audit, Compliance and Risk Committee also has adopted a policy to pre-approve the engagement by Putnam Management and certain of its affiliates of the funds’ independent auditors, even in circumstances where pre-approval is not required by applicable law. Any such requests by Putnam Management or certain of its affiliates are typically submitted in writing to the Committee and explain, among other things, the nature of the proposed engagement, the estimated fees, and why this work should be performed by that particular audit firm as opposed to another one. In reviewing such requests, the Committee considers, among other things, whether the provision of such services by the audit firm are compatible with the independence of the audit firm. |
| |
| The following table presents fees billed by the fund’s independent auditor for services required to be approved pursuant to paragraph (c)(7)(ii) of Rule 2–01 of Regulation S-X. |
| | | | | |
| Fiscal year ended | Audit-Related Fees | Tax Fees | All Other Fees | Total Non-Audit Fees |
|
|
| December 31, 2021 | $ — | $293,420 | $ — | $ — |
| December 31, 2020 | $ — | $613,694 | $ — | $ — |
| |
| Item 5. Audit Committee of Listed Registrants |
| |
| Item 6. Schedule of Investments: |
| |
| The registrant’s schedule of investments in unaffiliated issuers is included in the report to shareholders in Item 1 above. |
| |
| Item 7. Disclosure of Proxy Voting Policies and Procedures For Closed-End Management Investment Companies: |
| |
| Item 8. Portfolio Managers of Closed-End Investment Companies |
| |
| Item 9. Purchases of Equity Securities by Closed-End Management Investment Companies and Affiliated Purchasers: |
| |
| Item 10. Submission of Matters to a Vote of Security Holders: |
| |
| Item 11. Controls and Procedures: |
| |
| (a) The registrant’s principal executive officer and principal financial officer have concluded, based on their evaluation of the effectiveness of the design and operation of the registrant’s disclosure controls and procedures as of a date within 90 days of the filing date of this report, that the design and operation of such procedures are generally effective to provide reasonable assurance that information required to be disclosed by the registrant in this report is recorded, processed, summarized and reported within the time periods specified in the Commission’s rules and forms. |
| |
| (b) Changes in internal control over financial reporting: Not applicable |
| |
| Item 12. Disclosures of Securities Lending Activities for Closed-End Management Investment Companies: |
| |
| (a)(1) The Code of Ethics of The Putnam Funds, which incorporates the Code of Ethics of Putnam Investments, is filed herewith |
| |
| Pursuant to the requirements of the Securities Exchange Act of 1934 and the Investment Company Act of 1940, the registrant has duly caused this report to be signed on its behalf by the undersigned, thereunto duly authorized. |
| |
| By (Signature and Title): |
| |
| /s/ Janet C. Smith
Janet C. Smith
Principal Accounting Officer
|
| |
| Pursuant to the requirements of the Securities Exchange Act of 1934 and the Investment Company Act of 1940, this report has been signed below by the following persons on behalf of the registrant and in the capacities and on the dates indicated. |
| |
| By (Signature and Title): |
| |
| /s/ Jonathan S. Horwitz
Jonathan S. Horwitz
Principal Executive Officer
|
| |
| By (Signature and Title): |
| |
| /s/ Janet C. Smith
Janet C. Smith
Principal Financial Officer
|