| | |
| UNITED STATES
SECURITIES AND EXCHANGE COMMISSION |
| | |
| CERTIFIED SHAREHOLDER REPORT OF REGISTERED
MANAGEMENT INVESTMENT COMPANIES
|
| | |
| Investment Company Act file number: | (811-05346) |
| | |
| Exact name of registrant as specified in charter: | Putnam Variable Trust |
| | |
| Address of principal executive offices: | 100 Federal Street, Boston, Massachusetts 02110 |
| | |
| Name and address of agent for service: | Stephen Tate, Vice President
100 Federal Street
Boston, Massachusetts 02110 |
| | |
| Copy to: | Bryan Chegwidden, Esq.
Ropes & Gray LLP
1211 Avenue of the Americas
New York, New York 10036 |
| | |
| Registrant’s telephone number, including area code: | (617) 292-1000 |
| | |
| Date of fiscal year end: | December 31, 2022 |
| | |
| Date of reporting period: | January 1, 2022 – December 31, 2022 |
| | |
|
Item 1. Report to Stockholders: | |
| | |
| The following is a copy of the report transmitted to stockholders pursuant to Rule 30e-1 under the Investment Company Act of 1940: | |

Message from the Trustees
February 8, 2023
Dear Shareholder:
As an investor, you might be happy to see 2022 in the rearview mirror. High inflation and aggressive interest-rate increases from the U.S. Federal Reserve contributed to market volatility and negative returns for stocks and bonds. Fortunately, toward the end of the year, we saw both inflation levels and Fed actions begin to moderate somewhat.
Although we still face high inflation and uncertainty on how much the economy will slow because of higher interest rates, we believe financial market performance might be better in 2023 as compared with 2022. Historically, stocks and bonds have recovered from bear markets like the one we are experiencing. Be assured that our investment teams are actively researching securities with attractive potential and working to keep portfolio risks in check.
Thank you for investing with Putnam.
Performance summary (as of 12/31/22)
Investment objective
Capital appreciation
Net asset value December 31, 2022
| |
| Class IA: $14.58 | Class IB: $14.13 |
Annualized total return at net asset value (as of 12/31/22)
| | | |
| | Class IA shares | Class IB shares | Russell 2000 |
| | (5/1/03) | (5/1/03) | Growth Index |
| 1 year | –28.11% | –28.30% | –26.36% |
| 5 years | 7.74 | 7.48 | 3.51 |
| 10 years | 9.29 | 9.02 | 9.20 |
| Life of fund | 9.32 | 9.05 | 9.38 |
For a portion of the periods, the fund had expense limitations, without which returns would have been lower.
Before September 17, 2018, the fund was managed with a materially different investment strategy and may have achieved materially different performance results under its current investment strategy from that shown for periods before this date.
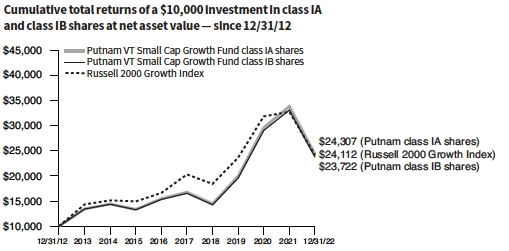
The Russell 2000® Growth Index is an unmanaged index of those companies in the small-cap Russell 2000 Index chosen for their growth orientation.
Frank Russell Company is the source and owner of the trademarks, service marks, and copyrights related to the Russell Indexes. Russell® is a trademark of Frank Russell Company.
Data represent past performance. Past performance does not guarantee future results. More recent returns may be less or more than those shown. Investment return and principal value will fluctuate, and you may have a gain or a loss when you sell your shares. Performance information does not reflect any deduction for taxes a shareholder may owe on fund distributions or on the redemption of fund shares. All total return figures are at net asset value and exclude contract charges and expenses, which are added to the variable annuity contracts to determine total return at unit value. Had these charges and expenses been reflected, performance would have been lower. For more recent performance, contact your variable annuity provider who can provide you with performance that reflects the charges and expenses at your contract level.
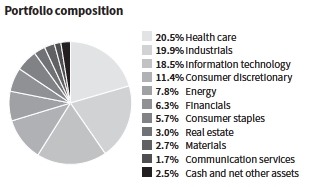
Allocations are shown as a percentage of the fund’s net assets. Cash and net other assets, if any, represent the market value weights of cash, derivatives, short-term securities, and other unclassified assets in the portfolio. Summary information may differ from the portfolio schedule included in the financial statements due to the inclusion of derivative securities, any interest accruals, the exclusion of as-of trades, if any, the use of different classifications of securities for presentation purposes, and rounding. Holdings and allocations may vary over time.
| |
| Putnam VT Small Cap Growth Fund | 1 |
Report from your fund’s manager
Bill, how were investing conditions during the 12 months ended December 31, 2022?
The year overall was challenging, characterized by macro-driven volatility, negative returns across most major asset classes, and broad-based underperformance for small-cap and growth stocks. Multiple measures of sentiment reached new or near-record bearish levels, encompassing consumers, businesses, and investors.
After the worst 9-month start on record for the Russell 2000 Growth Index [the fund’s benchmark], small-cap growth stocks had a better fourth quarter. The index’s quarterly advance peaked on December 2, before a significant sell-off into year-end as the hawkish Federal Reserve increased investor concerns about a recession. Within the fund’s benchmark, energy gained 42% for the year, while real estate and communication services fell 41% and 39%, respectively.
How did Putnam VT Small Cap Growth Fund perform for the reporting period?
The fund’s class IA shares returned –28.11% for the 12-month period, underperforming its benchmark return of –26.36%.
What were some holdings that detracted from performance during the reporting period?
The fund’s top detractor for the period was R1 RCM. The company, which has been a multiyear holding in the portfolio, is a provider of revenue-cycle management services for hospitals, health systems, and physician groups. R1 RCM’s stock price declined when the company announced execution issues on some long-term contracts that would impair unit economics through calendar 2023 and gave a mixed outlook on its recently announced acquisition of Cloudmed. This announcement and the abrupt departure of its long-time CEO added to our concerns. We subsequently sold the position and reallocated the proceeds into stocks with more attractive growth prospects, in our view.
TechTarget, which provides data-driven marketing services to business-to-business technology vendors, also struggled. As growth across the technology sector stalled in 2022, companies enacted layoffs and budget cuts that negatively affected TechTarget’s customer base. We continue to hold the stock given the company’s high-quality earnings, balance sheet strength, and valuation support. We believe this should allow the stock to outperform when the operating environment improves.
What were some holdings that contributed to performance during the reporting period?
The two top contributors for the period were WillScot Mobile Mini Holdings and Lantheus Holdings. WillScot Mobile Mini supplies rentable mobile facilities and storage containers to industrial and retail customers. Demand remained resilient during the reporting period. This allowed management to increase rental rates, which propelled profit margins and cash flow higher. Lantheus, a provider of innovative diagnostic imaging agents, targeted therapeutics, and artificial intelligence solutions, was another notable performer. Pylarify, Lantheus’s key asset, is used to detect prostate cancer. Pylarify generated over $500 million in sales in 2022, which boosted investors’ outlook for the stock.
What is your outlook as 2023 begins?
As we begin a new year, investors are faced with several lingering risks. Abroad, the Russia-Ukraine War continues to contribute to volatility in commodities. China’s reopening is causing a Covid-19 resurgence in the country, which we believe could lead to further supply chain disruptions. And the most critical risk for equities, in our view, may be persistent elevated inflation, as well as the rising interest rates that are meant to tame it. This brings the risk of profit margin erosion and demand destruction beyond traditional interest-rate-sensitive sectors, in our view. Furthermore, we believe higher interest rates for longer periods will keep pressure on equity multiples and will be particularly challenging for businesses that rely on capital markets to grow.
The fund enters fiscal 2023 with underweight positioning in what we believe are the most interest-rate-sensitive subindustries, including homebuilders, building products, autos, and capital markets. The fund’s exposure remains skewed toward higher-profitability companies with larger market capitalizations within the small-cap spectrum and lower volatility, in our view. We believe companies with higher-quality business models and stronger track records will prove more resilient in a wider array of market scenarios. While we are less certain of the arc of the broader markets this year, we are optimistic that our heightened focus on business fundamentals and stock analysis will help drive performance in 2023 and beyond.
The views expressed in this report are exclusively those of Putnam Management and are subject to change. They are not meant as investment advice. Please note that the holdings discussed in this report may not have been held by the fund for the entire period. Portfolio composition is subject to review in accordance with the fund’s investment strategy and may vary in the future. Current and future portfolio holdings are subject to risk.
Frank Russell Company is the source and owner of the trademarks, service marks, and copyrights related to the Russell Indexes. Russell® is a trademark of Frank Russell Company.
Consider these risks before investing: Investments in small and/ or midsize companies increase the risk of greater price fluctuations. Growth stocks may be more susceptible to earnings disappointments, and the market may not favor growth-style investing.
The value of investments in the fund’s portfolio may fall or fail to rise over extended periods of time for a variety of reasons, including general economic, political, or financial market conditions; investor sentiment and market perceptions; government actions; geopolitical events or changes; and factors related to a specific issuer, geography, industry, or sector. These and other factors may lead to increased volatility and reduced liquidity in the fund’s portfolio holdings. These risks are generally greater for small and midsize companies. From time to time, the fund may invest a significant portion of its assets in companies in one or more related industries or sectors, which would make the fund more vulnerable to adverse developments affecting those industries or sectors.
| |
| 2 | Putnam VT Small Cap Growth Fund |
Our investment techniques, analyses, and judgments may not produce the outcome we intend. The investments we select for the fund may not perform as well as other securities that we do not select for the fund. We, or the fund’s other service providers, may experience disruptions or operating errors that could have a negative effect on the fund. You can lose money by investing in the fund.
Your fund’s manager

Your fund’s manager also manages other accounts advised by Putnam Management or an affiliate, including retail mutual fund counterparts to the funds in Putnam Variable Trust.
| |
| Putnam VT Small Cap Growth Fund | 3 |
Understanding your fund’s expenses
As an investor in a variable annuity product that invests in a registered investment company, you pay ongoing expenses, such as management fees, distribution fees (12b-1 fees), and other expenses. In the most recent six-month period, your fund’s expenses were limited; had expenses not been limited, they would have been higher. Using the following information, you can estimate how these expenses affect your investment and compare them with the expenses of other funds. You may also pay onetime transaction expenses, which are not shown in this section and would result in higher total expenses. Charges and expenses at the insurance company separate account level are not reflected. For more information, see your fund’s prospectus or talk to your financial representative.
Review your fund’s expenses
The two left-hand columns of the Expenses per $1,000 table show the expenses you would have paid on a $1,000 investment in your fund from 7/1/22 to 12/31/22. They also show how much a $1,000 investment would be worth at the close of the period, assuming actual returns and expenses. To estimate the ongoing expenses you paid over the period, divide your account value by $1,000, then multiply the result by the number in the first line for the class of shares you own.
Compare your fund’s expenses with those of other funds
The two right-hand columns of the Expenses per $1,000 table show your fund’s expenses based on a $1,000 investment, assuming a hypothetical 5% annualized return. You can use this information to compare the ongoing expenses (but not transaction expenses or total costs) of investing in the fund with those of other funds. All shareholder reports of mutual funds and funds serving as variable annuity vehicles will provide this information to help you make this comparison. Please note that you cannot use this information to estimate your actual ending account balance and expenses paid during the period.
Expense ratios
| | |
| | Class IA | Class IB |
| Total annual operating expenses for the fiscal | | |
| year ended 12/31/21 | 0.85% | 1.10% |
| Total annual operating expenses for the fiscal | | |
| year ended 12/31/22* | 0.89% | 1.14% |
Fiscal year expense information in this table is taken from the most recent prospectus, is subject to change, and may differ from that shown for the annualized expense ratio and in the financial highlights of this report.
Expenses are shown as a percentage of average net assets.
*Expense ratios for each class are for the fund’s most recent fiscal half year. As a result of this, ratios may differ from expense ratios based on one-year data in the financial highlights.
Expenses per $1,000
| | | | | | | | |
| | | | | | | Expenses and value for a |
| | | Expenses and value for a | | $1,000 investment, assuming |
| | | $1,000 investment, assuming | | a hypothetical 5% annualized |
| | | actual returns for the | | return for the 6 months |
| | | 6 months ended 12/31/22 | | ended 12/31/22 | | |
| | | Class IA | | Class IB | | Class IA | | Class IB |
| Expenses paid | | | | | | | | |
| per $1,000*† | | $4.58 | | $5.86 | | $4.53 | | $5.80 |
| Ending value | | | | | | | | |
| (after | | | | | | | | |
| expenses) | | $1,041.40 | | $1,039.70 | | $1,020.72 | | $1,019.46 |
*Expenses for each share class are calculated using the fund’s annualized expense ratio for each class, which represents the ongoing expenses as a percentage of average net assets for the six months ended 12/31/22. The expense ratio may differ for each share class.
†Expenses based on actual returns are calculated by multiplying the expense ratio by the average account value for the period; then multiplying the result by the number of days in the period (184); and then dividing that result by the number of days in the year (365). Expenses based on a hypothetical 5% return are calculated by multiplying the expense ratio by the average account value for the six-month period; then multiplying the result by the number of days in the six-month period (184); and then dividing that result by the number of days in the year (365).
| |
| 4 | Putnam VT Small Cap Growth Fund |
Report of Independent Registered Public Accounting Firm
To the Board of Trustees of Putnam Variable Trust and Shareholders of
Putnam VT Small Cap Growth Fund:
Opinion on the Financial Statements
We have audited the accompanying statement of assets and liabilities, including the fund’s portfolio, of Putnam VT Small Cap Growth Fund (one of the funds constituting Putnam Variable Trust, referred to hereafter as the “Fund”) as of December 31, 2022, the related statement of operations for the year ended December 31, 2022, the statement of changes in net assets for each of the two years in the period ended December 31, 2022, including the related notes, and the financial highlights for each of the five years in the period ended December 31, 2022 (collectively referred to as the “financial statements”). In our opinion, the financial statements present fairly, in all material respects, the financial position of the Fund as of December 31, 2022, the results of its operations for the year then ended, the changes in its net assets for each of the two years in the period ended December 31, 2022 and the financial highlights for each of the five years in the period ended December 31, 2022 in conformity with accounting principles generally accepted in the United States of America.
Basis for Opinion
These financial statements are the responsibility of the Fund’s management. Our responsibility is to express an opinion on the Fund’s financial statements based on our audits. We are a public accounting firm registered with the Public Company Accounting Oversight Board (United States) (“PCAOB”) and are required to be independent with respect to the Fund in accordance with the U.S. federal securities laws and the applicable rules and regulations of the Securities and Exchange Commission and the PCAOB.
We conducted our audits of these financial statements in accordance with the standards of the PCAOB. Those standards require that we plan and perform the audit to obtain reasonable assurance about whether the financial statements are free of material misstatement, whether due to error or fraud.
Our audits included performing procedures to assess the risks of material misstatement of the financial statements, whether due to error or fraud, and performing procedures that respond to those risks. Such procedures included examining, on a test basis, evidence regarding the amounts and disclosures in the financial statements. Our audits also included evaluating the accounting principles used and significant estimates made by management, as well as evaluating the overall presentation of the financial statements. Our procedures included confirmation of securities owned as of December 31, 2022 by correspondence with the custodian, transfer agent and brokers; when replies were not received from brokers, we performed other auditing procedures. We believe that our audits provide a reasonable basis for our opinion.
PricewaterhouseCoopers LLP
Boston, Massachusetts
February 8, 2023
We have served as the auditor of one or more investment companies in the Putnam Investments family of funds since at least 1957. We have not been able to determine the specific year we began serving as auditor.
| |
| Putnam VT Small Cap Growth Fund | 5 |
The fund’s portfolio 12/31/22
| | |
| COMMON STOCKS (97.4%)* | Shares | Value |
| | | |
| Banks (2.4%) | | |
| Bancorp, Inc. (The) † | 12,785 | $362,838 |
| ServisFirst Bancshares, Inc. S | 3,540 | 243,941 |
| | | 606,779 |
| Beverages (1.1%) | | |
| Celsius Holdings, Inc. † S | 2,660 | 276,746 |
| | | 276,746 |
| Biotechnology (6.2%) | | |
| Apellis Pharmaceuticals, Inc. † | 2,720 | 140,651 |
| Ascendis Pharma A/S ADR (Denmark) † S | 1,475 | 180,142 |
| Cytokinetics, Inc. † S | 5,760 | 263,923 |
| Halozyme Therapeutics, Inc. † | 8,505 | 483,935 |
| Insmed, Inc. † | 7,290 | 145,654 |
| IVERIC bio, Inc. † | 4,015 | 85,961 |
| Prothena Corp. PLC (Ireland) † | 1,480 | 89,170 |
| Xenon Pharmaceuticals, Inc. (Canada) † | 4,255 | 167,775 |
| | | 1,557,211 |
| Capital markets (0.9%) | | |
| Hamilton Lane, Inc. Class A S | 3,550 | 226,774 |
| | | 226,774 |
| Chemicals (1.5%) | | |
| Livent Corp. † S | 5,235 | 104,019 |
| Perimeter Solutions SA (Luxembourg) † | 12,403 | 113,363 |
| Valvoline, Inc. | 4,795 | 156,557 |
| | | 373,939 |
| Commercial services and supplies (3.1%) | | |
| Casella Waste Systems, Inc. Class A † | 5,515 | 437,395 |
| Montrose Environmental Group, Inc. † | 7,428 | 329,729 |
| | | 767,124 |
| Communications equipment (0.6%) | | |
| Clearfield, Inc. † | 1,676 | 157,779 |
| | | 157,779 |
| Construction and engineering (5.5%) | | |
| Comfort Systems USA, Inc. | 1,585 | 182,402 |
| Dycom Industries, Inc. † | 1,515 | 141,804 |
| EMCOR Group, Inc. | 2,775 | 411,005 |
| WillScot Mobile Mini Holdings Corp. † | 14,402 | 650,538 |
| | | 1,385,749 |
| Construction materials (0.8%) | | |
| Eagle Materials, Inc. | 1,550 | 205,918 |
| | | 205,918 |
| Diversified telecommunication services (0.8%) | | |
| Iridium Communications, Inc. † | 3,795 | 195,063 |
| | | 195,063 |
| Electronic equipment, instruments, and components (1.7%) | |
| Napco Security Technologies, Inc. † | 2,185 | 60,044 |
| Novanta, Inc. † S | 2,755 | 374,322 |
| | | 434,366 |
| Energy equipment and services (2.3%) | | |
| ChampionX Corp. | 11,765 | 341,067 |
| Liberty Energy, Inc. | 15,246 | 244,088 |
| | | 585,155 |
| Equity real estate investment trusts (REITs) (1.3%) | | |
| Phillips Edison & Co., Inc. S | 3,895 | 124,017 |
| Ryman Hospitality Properties, Inc. | 2,505 | 204,859 |
| | | 328,876 |
| Food and staples retailing (3.2%) | | |
| BJ’s Wholesale Club Holdings, Inc. † | 4,550 | 301,028 |
| Chefs’ Warehouse, Inc. (The) † | 3,650 | 121,472 |
| Performance Food Group Co. † | 6,570 | 383,622 |
| | | 806,122 |
| | |
| COMMON STOCKS (97.4%)* cont. | Shares | Value |
| | | |
| Food products (0.6%) | | |
| Simply Good Foods Co. (The) † | 3,895 | $148,127 |
| | | 148,127 |
| Health-care equipment and supplies (7.5%) | | |
| AtriCure, Inc. † | 2,910 | 129,146 |
| Axonics, Inc. † | 3,815 | 238,552 |
| InMode, Ltd. (Israel) † | 13,819 | 493,338 |
| Lantheus Holdings, Inc. † | 8,070 | 411,247 |
| Merit Medical Systems, Inc. † | 6,575 | 464,327 |
| Shockwave Medical, Inc. † | 690 | 141,871 |
| | | 1,878,481 |
| Health-care providers and services (2.1%) | | |
| HealthEquity, Inc. † | 2,285 | 140,847 |
| Option Care Health, Inc. † | 12,650 | 380,639 |
| | | 521,486 |
| Health-care technology (0.5%) | | |
| Evolent Health, Inc. Class A † | 4,605 | 129,308 |
| | | 129,308 |
| Hotels, restaurants, and leisure (5.3%) | | |
| Churchill Downs, Inc. | 2,115 | 447,174 |
| Everi Holdings, Inc. † | 19,520 | 280,112 |
| Planet Fitness, Inc. Class A † | 5,950 | 468,860 |
| Texas Roadhouse, Inc. | 1,400 | 127,330 |
| | | 1,323,476 |
| Insurance (3.0%) | | |
| Kinsale Capital Group, Inc. | 2,095 | 547,884 |
| RLI Corp. | 1,570 | 206,094 |
| | | 753,978 |
| IT Services (2.8%) | | |
| Perficient, Inc. † | 4,038 | 281,974 |
| WNS Holdings, Ltd. ADR (India) † | 5,320 | 425,547 |
| | | 707,521 |
| Life sciences tools and services (2.2%) | | |
| Medpace Holdings, Inc. † | 2,555 | 542,708 |
| | | 542,708 |
| Machinery (3.3%) | | |
| Federal Signal Corp. | 8,295 | 385,469 |
| RBC Bearings, Inc. † S | 2,086 | 436,704 |
| | | 822,173 |
| Media (0.9%) | | |
| TechTarget, Inc. † | 5,414 | 238,541 |
| | | 238,541 |
| Metals and mining (0.4%) | | |
| MP Materials Corp. † S | 4,055 | 98,455 |
| | | 98,455 |
| Oil, gas, and consumable fuels (5.4%) | | |
| Chord Energy Corp. | 1,575 | 215,476 |
| Civitas Resources, Inc. | 3,705 | 214,631 |
| Denbury, Inc. † | 2,070 | 180,131 |
| Magnolia Oil & Gas Corp. Class A | 12,045 | 282,455 |
| Matador Resources Co. | 4,640 | 265,594 |
| SM Energy Co. | 5,990 | 208,632 |
| | | 1,366,919 |
| Personal products (0.7%) | | |
| BellRing Brands, Inc. † | 7,385 | 189,351 |
| | | 189,351 |
| Pharmaceuticals (2.2%) | | |
| Axsome Therapeutics, Inc. † S | 3,295 | 254,143 |
| Corcept Therapeutics, Inc. † | 4,450 | 90,380 |
| Harmony Biosciences Holdings, Inc. † | 3,795 | 209,105 |
| | | 553,628 |
| Professional services (2.9%) | | |
| ICF International, Inc. | 3,315 | 328,351 |
| KBR, Inc. | 7,770 | 410,256 |
| | | 738,607 |
| |
| 6 | Putnam VT Small Cap Growth Fund |
| | |
| COMMON STOCKS (97.4%)* cont. | Shares | Value |
| | | |
| Real estate management and development (1.7%) | | |
| Colliers International Group, Inc. (Canada) | 4,705 | $432,207 |
| | | 432,207 |
| Road and rail (3.3%) | | |
| Saia, Inc. † S | 1,050 | 220,164 |
| TFI International, Inc. (Canada) | 6,120 | 612,949 |
| | | 833,113 |
| Semiconductors and semiconductor equipment (3.8%) | |
| Axcelis Technologies, Inc. † | 795 | 63,091 |
| Nova, Ltd. (Israel) † | 5,215 | 425,961 |
| Onto Innovation, Inc. † | 3,695 | 251,593 |
| Ultra Clean Holdings, Inc. † | 6,372 | 211,232 |
| | | 951,877 |
| Software (9.5%) | | |
| Descartes Systems Group, Inc. (The) (Canada) † | 5,865 | 408,497 |
| Manhattan Associates, Inc. † | 3,600 | 437,040 |
| Progress Software Corp. | 4,971 | 250,787 |
| SPS Commerce, Inc. † | 3,185 | 409,050 |
| Tenable Holdings, Inc. † | 8,385 | 319,888 |
| Verra Mobility Corp. † | 31,273 | 432,506 |
| Vertex, Inc. Class A † | 8,610 | 124,931 |
| | | 2,382,699 |
| Specialty retail (4.5%) | | |
| Boot Barn Holdings, Inc. † | 6,743 | 421,572 |
| Five Below, Inc. † S | 2,610 | 461,631 |
| Murphy USA, Inc. | 865 | 241,802 |
| | | 1,125,005 |
| Textiles, apparel, and luxury goods (1.6%) | | |
| Crocs, Inc. † | 3,745 | 406,070 |
| | | 406,070 |
| Trading companies and distributors (1.8%) | | |
| Applied Industrial Technologies, Inc. | 3,525 | 444,254 |
| | | 444,254 |
| | | |
| Total common stocks (cost $20,266,527) | | $24,495,585 |
| | |
| SHORT-TERM INVESTMENTS (15.0%)* | Shares | Value |
| | | |
| Putnam Cash Collateral Pool, LLC 4.62% d | 3,045,043 | $3,045,043 |
| Putnam Short Term Investment Fund | | |
| Class P 4.53% L | 738,087 | 738,087 |
| Total short-term investments (cost $3,783,130) | | $3,783,130 |
| |
| Total investments (cost $24,049,657) | | $28,278,715 |
Key to holding’s abbreviations
| |
| ADR | American Depository Receipts: Represents ownership of foreign |
| | securities on deposit with a custodian bank. |
Notes to the fund’s portfolio
Unless noted otherwise, the notes to the fund’s portfolio are for the close of the fund’s reporting period, which ran from January 1, 2022 through December 31, 2022 (the reporting period). Within the following notes to the portfolio, references to “Putnam Management” represent Putnam Investment Management, LLC, the fund’s manager, an indirect wholly-owned subsidiary of Putnam Investments, LLC and references to “ASC 820” represent Accounting Standards Codification 820 Fair Value Measurements and Disclosures.
* Percentages indicated are based on net assets of $25,139,774.
† This security is non-income-producing.
d Affiliated company. See Notes 1 and 5 to the financial statements regarding securities lending. The rate quoted in the security description is the annualized 7-day yield of the fund at the close of the reporting period.
L Affiliated company (Note 5). The rate quoted in the security description is the annualized 7-day yield of the fund at the close of the reporting period.
S Security on loan, in part or in entirety, at the close of the reporting period (Note 1).
ASC 820 establishes a three-level hierarchy for disclosure of fair value measurements. The valuation hierarchy is based upon the transparency of inputs to the valuation of the fund’s investments. The three levels are defined as follows:
Level 1: Valuations based on quoted prices for identical securities in active markets.
Level 2: Valuations based on quoted prices in markets that are not active or for which all significant inputs are observable, either directly or indirectly.
Level 3: Valuations based on inputs that are unobservable and significant to the fair value measurement.
The following is a summary of the inputs used to value the fund’s net assets as of the close of the reporting period:
| | | |
| | | | Valuation inputs | | |
| Investments in securities: | Level 1 | Level 2 | Level 3 |
| Common stocks*: | | | |
| Communication services | $433,604 | $— | $— |
| Consumer discretionary | 2,854,551 | — | — |
| Consumer staples | 1,420,346 | — | — |
| Energy | 1,952,074 | — | — |
| Financials | 1,587,531 | — | — |
| Health care | 5,182,822 | — | — |
| Industrials | 4,991,020 | — | — |
| Information technology | 4,634,242 | — | — |
| Materials | 678,312 | — | — |
| Real estate | 761,083 | — | — |
| Total common stocks | 24,495,585 | — | — |
| Short-term investments | — | 3,783,130 | — |
| Totals by level | $24,495,585 | $3,783,130 | $— |
* Common stock classifications are presented at the sector level, which may differ from the fund’s portfolio presentation.
The accompanying notes are an integral part of these financial statements.
| |
| Putnam VT Small Cap Growth Fund | 7 |
Statement of assets and liabilities
12/31/22
| |
| Assets | |
| Investment in securities, at value, including $2,965,991 of securities on loan (Note 1): | |
| Unaffiliated issuers (identified cost $20,266,527) | $24,495,585 |
| Affiliated issuers (identified cost $3,783,130) (Notes 1 and 5) | 3,783,130 |
| Dividends, interest and other receivables | 65,401 |
| Receivable for shares of the fund sold | 24,836 |
| Total assets | 28,368,952 |
| |
| Liabilities | |
| Payable for investments purchased | 26,667 |
| Payable for shares of the fund repurchased | 19,359 |
| Payable for compensation of Manager (Note 2) | 10,456 |
| Payable for custodian fees (Note 2) | 19,361 |
| Payable for investor servicing fees (Note 2) | 3,025 |
| Payable for Trustee compensation and expenses (Note 2) | 67,850 |
| Payable for administrative services (Note 2) | 307 |
| Payable for distribution fees (Note 2) | 2,717 |
| Collateral on securities loaned, at value (Note 1) | 3,045,043 |
| Other accrued expenses | 34,393 |
| Total liabilities | 3,229,178 |
| | |
| Net assets | $25,139,774 |
| |
| Represented by | |
| Paid-in capital (Unlimited shares authorized) (Notes 1 and 4) | $24,196,496 |
| Total distributable earnings (Note 1) | 943,278 |
| Total — Representing net assets applicable to capital shares outstanding | $25,139,774 |
| Computation of net asset value Class IA | |
| Net assets | $12,539,758 |
| Number of shares outstanding | 860,136 |
| Net asset value, offering price and redemption price per share (net assets divided by number of shares outstanding) | $14.58 |
| | |
| Computation of net asset value Class IB | |
| Net assets | $12,600,016 |
| Number of shares outstanding | 891,923 |
| Net asset value, offering price and redemption price per share (net assets divided by number of shares outstanding) | $14.13 |
The accompanying notes are an integral part of these financial statements.
| |
| 8 | Putnam VT Small Cap Growth Fund |
Statement of operations
Year ended 12/31/22
| |
| Investment income | |
| Dividends (net of foreign tax of $1,555) | $135,362 |
| Interest (including interest income of $8,520 from investments in affiliated issuers) (Note 5) | 8,534 |
| Securities lending (net of expenses) (Notes 1 and 5) | 5,822 |
| Total investment income | 149,718 |
| |
| Expenses | |
| Compensation of Manager (Note 2) | 175,704 |
| Investor servicing fees (Note 2) | 19,915 |
| Custodian fees (Note 2) | 33,569 |
| Trustee compensation and expenses (Note 2) | 1,235 |
| Distribution fees (Note 2) | 35,591 |
| Administrative services (Note 2) | 872 |
| Auditing and tax fees | 32,898 |
| Other | 17,168 |
| Fees waived and reimbursed by Manager (Note 2) | (28,655) |
| Total expenses | 288,297 |
| Expense reduction (Note 2) | (136) |
| Net expenses | 288,161 |
| | |
| Net investment loss | (138,443) |
| | |
| Realized and unrealized gain (loss) | |
| Net realized gain (loss) on: | |
| Securities from unaffiliated issuers (Notes 1 and 3) | (1,516,528) |
| Foreign currency transactions (Note 1) | 101 |
| Total net realized loss | (1,516,427) |
| Change in net unrealized appreciation (depreciation) on: | |
| Securities from unaffiliated issuers | (9,109,099) |
| Total change in net unrealized depreciation | (9,109,099) |
| | |
| Net loss on investments | (10,625,526) |
| | |
| Net decrease in net assets resulting from operations | $(10,763,969) |
The accompanying notes are an integral part of these financial statements.
| |
| Putnam VT Small Cap Growth Fund | 9 |
Statement of changes in net assets
| | |
| | Year ended | Year ended |
| | 12/31/22 | 12/31/21 |
| Increase (decrease) in net assets | | |
| Operations: | | |
| Net investment loss | $(138,443) | $(299,644) |
| Net realized gain (loss) on investments and foreign currency transactions | (1,516,427) | 6,491,720 |
| Change in net unrealized depreciation of investments and assets and liabilities in foreign currencies | (9,109,099) | (1,133,603) |
| Net increase (decrease) in net assets resulting from operations | (10,763,969) | 5,058,473 |
| Distributions to shareholders (Note 1): | | |
| From ordinary income | | |
| Net realized short-term gain on investments | | |
| Class IA | (64,300) | (292,487) |
| Class IB | (66,462) | (305,797) |
| From net realized long-term gain on investments | | |
| Class IA | (2,679,137) | (1,131,362) |
| Class IB | (2,769,265) | (1,182,844) |
| From return of capital | | |
| Class IA | (29,938) | — |
| Class IB | (30,945) | — |
| Increase (decrease) from capital share transactions (Note 4) | 2,959,916 | (573,516) |
| Total increase (decrease) in net assets | (13,444,100) | 1,572,467 |
| Net assets: | | |
| Beginning of year | 38,583,874 | 37,011,407 |
| End of year | $25,139,774 | $38,583,874 |
The accompanying notes are an integral part of these financial statements.
| |
| 10 | Putnam VT Small Cap Growth Fund |
Financial highlights
(For a common share outstanding throughout the period)
| | | | | | | | | | | | | | |
| INVESTMENT OPERATIONS: | LESS DISTRIBUTIONS: | RATIOS AND SUPPLEMENTAL DATA: |
| Period ended | Net asset value,
beginning
of period | Net investment
income (loss)a | Net realized
and unrealized
gain (loss)
on investments | Total from
investment
operations | From net
investment
income | From net
realized gain
on investments | From return
of capital | Total
distributions | Net asset value,
end of period | Total return
at net asset value
(%)b,c | Net assets,
end of period
(in thousands) | Ratio of expenses
to average
net assets (%)c,d | Ratio
of net investment
income (loss)
to average
net assets (%) | Portfolio
turnover (%) |
| Class IA | | | | | | | | | | | | | | |
| 12/31/22 | $24.48 | (.06) | (6.25) | (6.31) | — | (3.55) | (.04) | (3.59) | $14.58 | (28.11) | $12,540 | .89 e | (.36)e | 58 |
| 12/31/21 | 23.26 | (.15) | 3.22 | 3.07 | — | (1.85) | — | (1.85) | 24.48 | 14.18 | 19,208 | .85 | (.65) | 53 |
| 12/31/20 | 16.43 | (.11) | 7.60 | 7.49 | — | (.66) | — | (.66) | 23.26 | 48.71 | 18,010 | .89 e | (.59)e | 59 |
| 12/31/19 | 13.58 | (.07) | 4.88 | 4.81 | (.01) | (1.95) | — | (1.96) | 16.43 | 37.73 | 13,123 | .89 e | (.48)e | 46 |
| 12/31/18 | 18.48 | .03 | (2.19) | (2.16) | (.04) | (2.70) | — | (2.74) | 13.58 | (13.64) | 9,859 | .89 e | .19e | 138 |
| Class IB | | | | | | | | | | | | | | |
| 12/31/22 | $23.91 | (.10) | (6.09) | (6.19) | — | (3.55) | (.04) | (3.59) | $14.13 | (28.30) | $12,600 | 1.14e | (.61)e | 58 |
| 12/31/21 | 22.81 | (.21) | 3.16 | 2.95 | — | (1.85) | — | (1.85) | 23.91 | 13.92 | 19,376 | 1.10 | (.90) | 53 |
| 12/31/20 | 16.17 | (.15) | 7.45 | 7.30 | — | (.66) | — | (.66) | 22.81 | 48.30 | 19,001 | 1.14e | (.84)e | 59 |
| 12/31/19 | 13.41 | (.11) | 4.82 | 4.71 | — | (1.95) | — | (1.95) | 16.17 | 37.45 | 14,940 | 1.14e | (.73)e | 46 |
| 12/31/18 | 18.28 | (.01) | (2.16) | (2.17) | — | (2.70) | — | (2.70) | 13.41 | (13.84) | 11,830 | 1.14e | (.06)e | 138 |
Before September 17, 2018, the fund was managed with a materially different investment strategy and may have achieved materially different performance results under its current investment strategy from that shown for periods before this date.
a Per share net investment income (loss) has been determined on the basis of the weighted average number of shares outstanding during the period.
b Total return assumes dividend reinvestment.
c The charges and expenses at the insurance company separate account level are not reflected.
d Includes amounts paid through expense offset and/or brokerage/service arrangements, if any (Note 2). Also excludes acquired fund fees and expenses, if any.
e Reflects an involuntary contractual expense limitation in effect during the period. As a result of such limitation, the expenses of each class reflect a reduction of the following amounts (Note 2):
| | | |
| | Percentage of average net assets | | |
| 12/31/22 | 0.10% | | |
| 12/31/20 | 0.01 | | |
| 12/31/19 | 0.03 | | |
| 12/31/18 | 0.14 | | |
The accompanying notes are an integral part of these financial statements.
| |
| Putnam VT Small Cap Growth Fund | 11 |
Notes to financial statements 12/31/22
Within the following Notes to financial statements, references to “State Street” represent State Street Bank and Trust Company, references to “the SEC” represent the Securities and Exchange Commission, references to “Putnam Management” represent Putnam Investment Management, LLC, the fund’s manager, an indirect wholly-owned subsidiary of Putnam Investments, LLC and references to “OTC”, if any, represent over-the-counter. Unless otherwise noted, the “reporting period” represents the period from January 1, 2022 through December 31, 2022.
Putnam VT Small Cap Growth Fund (the fund) is a diversified series of Putnam Variable Trust (the Trust), a Massachusetts business trust registered under the Investment Company Act of 1940, as amended, as an open-end management investment company. The goal of the fund is to seek capital appreciation. The fund invests mainly in common stocks of small U.S. companies, with a focus on growth stocks. Growth stocks are stocks of companies whose earnings are expected to grow faster than those of similar firms, and whose business growth and other characteristics may lead to an increase in stock price. Under normal circumstances, Putnam Management invests at least 80% of the fund’s net assets in companies of a size similar to those in the Russell 2000 Growth Index. This policy may be changed only after 60 days’ notice to shareholders. As of March 31, 2022, the index was composed of companies having market capitalizations of between approximately $21.6 million and $14.0 billion. Putnam Management may consider, among other factors, a company’s valuation, financial strength, growth potential, competitive position in its industry, projected future earnings, cash flows and dividends when deciding whether to buy or sell investments.
The fund offers class IA and class IB shares of beneficial interest. Class IA shares are offered at net asset value and are not subject to a distribution fee. Class IB shares are offered at net asset value and pay an ongoing distribution fee, which is identified in Note 2.
In the normal course of business, the fund enters into contracts that may include agreements to indemnify another party under given circumstances. The fund’s maximum exposure under these arrangements is unknown as this would involve future claims that may be, but have not yet been, made against the fund. However, the fund’s management team expects the risk of material loss to be remote.
The fund has entered into contractual arrangements with an investment adviser, administrator, distributor, shareholder servicing agent and custodian, who each provide services to the fund. Unless expressly stated otherwise, shareholders are not parties to, or intended beneficiaries of these contractual arrangements, and these contractual arrangements are not intended to create any shareholder right to enforce them against the service providers or to seek any remedy under them against the service providers, either directly or on behalf of the fund.
Under the fund’s Amended and Restated Agreement and Declaration of Trust, any claims asserted against or on behalf of the Putnam Funds, including claims against Trustees and Officers, must be brought in state and federal courts located within the Commonwealth of Massachusetts.
Note 1 — Significant accounting policies
The following is a summary of significant accounting policies consistently followed by the fund in the preparation of its financial statements. The preparation of financial statements is in conformity with accounting principles generally accepted in the United States of America and requires management to make estimates and assumptions that affect the reported amounts of assets and liabilities in the financial statements and the reported amounts of increases and decreases in net assets from operations. Actual results could differ from those estimates. Subsequent events after the Statement of assets and liabilities date through the date that the financial statements were issued have been evaluated in the preparation of the financial statements.
Investment income, realized and unrealized gains and losses and expenses of the fund are borne pro-rata based on the relative net assets of each class to the total net assets of the fund, except that each class bears expenses unique to that class (including the distribution fees applicable to such classes). Each class votes as a class only with respect to its own distribution plan or other matters on which a class vote is required by law or determined by the Trustees. If the fund were liquidated, shares of each class would receive their pro-rata share of the net assets of the fund. In addition, the Trustees declare separate dividends on each class of shares.
Security valuation Portfolio securities and other investments are valued using policies and procedures adopted by the Board of Trustees. The Trustees have formed a Pricing Committee to oversee the implementation of these procedures and have delegated responsibility for valuing the fund’s assets in accordance with these procedures to Putnam Management. Putnam Management has established an internal Valuation Committee that is responsible for making fair value determinations, evaluating the effectiveness of the pricing policies of the fund and reporting to the Pricing Committee.
Investments for which market quotations are readily available are valued at the last reported sales price on their principal exchange, or official closing price for certain markets, and are classified as Level 1 securities under Accounting Standards Codification 820 Fair Value Measurements and Disclosures (ASC 820). If no sales are reported, as in the case of some securities that are traded OTC, a security is valued at its last reported bid price and is generally categorized as a Level 2 security.
Investments in open-end investment companies (excluding exchange-traded funds), if any, which can be classified as Level 1 or Level 2 securities, are valued based on their net asset value. The net asset value of such investment companies equals the total value of their assets less their liabilities and divided by the number of their outstanding shares.
Many securities markets and exchanges outside the U.S. close prior to the scheduled close of the New York Stock Exchange and therefore the closing prices for securities in such markets or on such exchanges may not fully reflect events that occur after such close but before the scheduled close of the New York Stock Exchange. Accordingly, on certain days, the fund will fair value certain foreign equity securities taking into account multiple factors including movements in the U.S. securities markets, currency valuations and comparisons to the valuation of American Depository Receipts, exchange-traded funds and futures contracts. The foreign equity securities, which would generally be classified as Level 1 securities, will be transferred to Level 2 of the fair value hierarchy when they are valued at fair value. The number of days on which fair value prices will be used will depend on market activity and it is possible that fair value prices will be used by the fund to a significant extent. Securities quoted in foreign currencies, if any, are translated into U.S. dollars at the current exchange rate. Short-term securities with remaining maturities of 60 days or less are valued using an independent pricing service approved by the Trustees, and are classified as Level 2 securities.
To the extent a pricing service or dealer is unable to value a security or provides a valuation that Putnam Management does not believe accurately reflects the security’s fair value, the security will be valued at fair value by Putnam Management in accordance with policies and procedures approved by the Trustees. Certain investments, including certain restricted and illiquid securities and derivatives, are also valued at fair value following procedures approved by the Trustees. These valuations consider such factors as significant market or specific security events such as interest rate or credit quality changes, various relationships with other securities, discount rates, U.S. Treasury, U.S. swap and credit yields, index levels, convexity exposures, recovery rates, sales and other multiples and resale restrictions. These securities are classified as Level 2 or as Level 3 depending on the priority of the significant inputs.
To assess the continuing appropriateness of fair valuations, the Valuation Committee reviews and affirms the reasonableness of such valuations on a regular basis after considering all relevant information that is reasonably available. Such valuations and procedures are reviewed periodically by the Trustees. The fair value of securities is generally determined as the amount that the fund could reasonably expect to realize from an orderly disposition of such securities over a reasonable period of time. By its nature, a fair value price is a good faith estimate of the value of a security in a current sale and does not reflect an actual market price, which may be different by a material amount.
Joint trading account Pursuant to an exemptive order from the SEC, the fund may transfer uninvested cash balances into a joint trading account along with the cash of other registered investment companies and certain other accounts managed by Putnam Management. These balances may be invested in issues of short-term investments having maturities of up to 90 days.
Repurchase agreements The fund, or any joint trading account, through its custodian, receives delivery of the underlying securities, the fair value of which at the time of purchase is required to be in an amount at least equal to the resale price, including accrued interest. Collateral for certain tri-party repurchase agreements is held at the counterparty’s custodian in a segregated account for the benefit of the fund and the counterparty. Putnam Management is responsible for determining that the value of these underlying securities is at all times at least equal to the resale price, including accrued interest. In the event of default or bankruptcy by the other party to the agreement, retention of the collateral may be subject to legal proceedings.
| |
| 12 | Putnam VT Small Cap Growth Fund |
Security transactions and related investment income Security transactions are recorded on the trade date (the date the order to buy or sell is executed). Gains or losses on securities sold are determined on the identified cost basis.
Interest income, net of any applicable withholding taxes, if any, is recorded on the accrual basis. Amortization and accretion of premiums and discounts on debt securities, if any, is recorded on the accrual basis.
Dividend income, net of any applicable withholding taxes, is recognized on the ex-dividend date except that certain dividends from foreign securities, if any, are recognized as soon as the fund is informed of the ex-dividend date. Non-cash dividends, if any, are recorded at the fair value of the securities received. Dividends representing a return of capital or capital gains, if any, are reflected as a reduction of cost and/or as a realized gain.
Foreign currency translation The accounting records of the fund are maintained in U.S. dollars. The fair value of foreign securities, currency holdings, and other assets and liabilities is recorded in the books and records of the fund after translation to U.S. dollars based on the exchange rates on that day. The cost of each security is determined using historical exchange rates. Income and withholding taxes are translated at prevailing exchange rates when earned or incurred. The fund does not isolate that portion of realized or unrealized gains or losses resulting from changes in the foreign exchange rate on investments from fluctuations arising from changes in the market prices of the securities. Such gains and losses are included with the net realized and unrealized gain or loss on investments. Net realized gains and losses on foreign currency transactions represent net realized exchange gains or losses on disposition of foreign currencies, currency gains and losses realized between the trade and settlement dates on securities transactions and the difference between the amount of investment income and foreign withholding taxes recorded on the fund’s books and the U.S. dollar equivalent amounts actually received or paid. Net unrealized appreciation and depreciation of assets and liabilities in foreign currencies arise from changes in the value of assets and liabilities other than investments at the period end, resulting from changes in the exchange rate.
Securities lending The fund may lend securities, through its agent, to qualified borrowers in order to earn additional income. The loans are collateralized by cash in an amount at least equal to the fair value of the securities loaned. The fair value of securities loaned is determined daily and any additional required collateral is allocated to the fund on the next business day. The remaining maturities of the securities lending transactions are considered overnight and continuous. The risk of borrower default will be borne by the fund’s agent; the fund will bear the risk of loss with respect to the investment of the cash collateral. Income from securities lending, net of expenses, is included in investment income on the Statement of operations. Cash collateral is invested in Putnam Cash Collateral Pool, LLC, a limited liability company managed by an affiliate of Putnam Management. Investments in Putnam Cash Collateral Pool, LLC are valued at its closing net asset value each business day. There are no management fees charged to Putnam Cash Collateral Pool, LLC. At the close of the reporting period, the fund received cash collateral of $3,045,043 and the value of securities loaned amounted to $2,965,991.
Interfund lending The fund, along with other Putnam funds, may participate in an interfund lending program pursuant to an exemptive order issued by the SEC. This program allows the fund to borrow from or lend to other Putnam funds that permit such transactions. Interfund lending transactions are subject to each fund’s investment policies and borrowing and lending limits. Interest earned or paid on the interfund lending transaction will be based on the average of certain current market rates. During the reporting period, the fund did not utilize the program.
Lines of credit The fund participates, along with other Putnam funds, in a $100 million ($317.5 million prior to October 14, 2022) unsecured committed line of credit and a $235.5 million unsecured uncommitted line of credit, both provided by State Street. Borrowings may be made for temporary or emergency purposes, including the funding of shareholder redemption requests and trade settlements. Interest is charged to the fund based on the fund’s borrowing at a rate equal to 1.25% plus the higher of (1) the Federal Funds rate and (2) the Overnight Bank Funding Rate for the committed line of credit and 1.30% plus the higher of (1) the Federal Funds rate and (2) the Overnight Bank Funding Rate for the uncommitted line of credit. A closing fee equal to 0.04% of the committed line of credit and 0.04% of the uncommitted line of credit has been paid by the participating funds. In addition, a commitment fee of 0.21% per annum on any unutilized portion of the committed line of credit is allocated to the participating funds based on their relative net assets and paid quarterly. During the reporting period, the fund had no borrowings against these arrangements.
Federal taxes It is the policy of the fund to distribute all of its taxable income within the prescribed time period and otherwise comply with the provisions of the Internal Revenue Code of 1986, as amended (the Code), applicable to regulated investment companies.
The fund is subject to the provisions of Accounting Standards Codification 740 Income Taxes (ASC 740). ASC 740 sets forth a minimum threshold for financial statement recognition of the benefit of a tax position taken or expected to be taken in a tax return. The fund did not have a liability to record for any unrecognized tax benefits in the accompanying financial statements. No provision has been made for federal taxes on income, capital gains or unrealized appreciation on securities held nor for excise tax on income and capital gains. Each of the fund’s federal tax returns for the prior three fiscal years remains subject to examination by the Internal Revenue Service.
The fund may also be subject to taxes imposed by governments of countries in which it invests. Such taxes are generally based on either income or gains earned or repatriated. The fund accrues and applies such taxes to net investment income, net realized gains and net unrealized gains as income and/or capital gains are earned. In some cases, the fund may be entitled to reclaim all or a portion of such taxes, and such reclaim amounts, if any, are reflected as an asset on the fund’s books. In many cases, however, the fund may not receive such amounts for an extended period of time, depending on the country of investment.
Under the Regulated Investment Company Modernization Act of 2010, the fund will be permitted to carry forward capital losses incurred for an unlimited period and the carry forwards will retain their character as either short-term or long-term capital losses. At December 31, 2022, the fund had the following capital loss carryovers available, to the extent allowed by the Code, to offset future net capital gain, if any:
| | |
| | Loss carryover | |
| Short-term | Long-term | Total |
| $2,475,270 | $669,134 | $3,144,404 |
Distributions to shareholders Distributions to shareholders from net investment income are recorded by the fund on the ex-dividend date. Distributions from capital gains, if any, are recorded on the ex-dividend date and paid at least annually. The amount and character of income and gains to be distributed are determined in accordance with income tax regulations, which may differ from generally accepted accounting principles. These differences include temporary and/ or permanent differences from losses on wash sale transactions, from unrealized gains and losses on passive foreign investment companies and from net operating loss. Reclassifications are made to the fund’s capital accounts to reflect income and gains available for distribution (or available capital loss carryovers) under income tax regulations. At the close of the reporting period, the fund reclassified $138,443 to decrease accumulated net investment loss, $139,026 to decrease paid-in capital and $583 to decrease accumulated net realized loss.
Tax cost of investments includes adjustments to net unrealized appreciation (depreciation) which may not necessarily be final tax cost basis adjustments, but closely approximate the tax basis unrealized gains and losses that may be realized and distributed to shareholders. The tax basis components of distributable earnings and the federal tax cost as of the close of the reporting period were as follows:
| |
| Unrealized appreciation | $5,328,949 |
| Unrealized depreciation | (1,241,265) |
| Net unrealized appreciation | 4,087,684 |
| Capital loss carryforward | (3,144,404) |
| Cost for federal income tax purposes | $24,191,031 |
Expenses of the Trust Expenses directly charged or attributable to any fund will be paid from the assets of that fund. Generally, expenses of the Trust will be allocated among and charged to the assets of each fund on a basis that the Trustees deem fair and equitable, which may be based on the relative assets of each fund or the nature of the services performed and relative applicability to each fund.
Beneficial interest At the close of the reporting period, insurance companies or their separate accounts were record owners of all but a de minimis number of the shares of the fund. Approximately 59.3% of the fund is owned by accounts of one insurance company.
| |
| Putnam VT Small Cap Growth Fund | 13 |
Note 2 — Management fee, administrative services and other transactions
The fund pays Putnam Management a management fee (based on the fund’s average net assets and computed and paid monthly) at annual rates that may vary based on the average of the aggregate net assets of all open-end mutual funds sponsored by Putnam Management (excluding net assets of funds that are invested in, or that are invested in by, other Putnam funds to the extent necessary to avoid “double counting” of those assets). Such annual rates may vary as follows:
| |
| 0.780% | of the first $5 billion, |
| 0.730% | of the next $5 billion, |
| 0.680% | of the next $10 billion, |
| 0.630% | of the next $10 billion, |
| 0.580% | of the next $50 billion, |
| 0.560% | of the next $50 billion, |
| 0.550% | of the next $100 billion and |
| 0.545% | of any excess thereafter. |
For the reporting period, the management fee represented an effective rate (excluding the impact from any expense waivers in effect) of 0.618% of the fund’s average net assets.
Putnam Management has contractually agreed, through April 30, 2024, to waive fees and/or reimburse the fund’s expenses to the extent necessary to limit the cumulative expenses of the fund, exclusive of brokerage, interest, taxes, investment-related expenses, extraordinary expenses, acquired fund fees and expenses and payments under the fund’s investor servicing contract, investment management contract and distribution plan, on a fiscal year-to-date basis to an annual rate of 0.20% of the fund’s average net assets over such fiscal year-to-date period. During the reporting period, the fund’s expenses were reduced by $28,655 as a result of this limit.
Putnam Investments Limited (PIL), an affiliate of Putnam Management, is authorized by the Trustees to manage a separate portion of the assets of the fund as determined by Putnam Management from time to time. PIL did not manage any portion of the assets of the fund during the reporting period. If Putnam Management were to engage the services of PIL, Putnam Management would pay a quarterly sub-management fee to PIL for its services at an annual rate of 0.25% (prior to July 1, 2022, the annual rate was 0.35%) of the average net assets of the portion of the fund managed by PIL.
The fund reimburses Putnam Management an allocated amount for the compensation and related expenses of certain officers of the fund and their staff who provide administrative services to the fund. The aggregate amount of all such reimbursements is determined annually by the Trustees.
Custodial functions for the fund’s assets are provided by State Street. Custody fees are based on the fund’s asset level, the number of its security holdings and transaction volumes.
Putnam Investor Services, Inc., an affiliate of Putnam Management, provides investor servicing agent functions to the fund. Putnam Investor Services, Inc. was paid a monthly fee for investor servicing at an annual rate of 0.07% of the fund’s average daily net assets. During the reporting period, the expenses for each class of shares related to investor servicing fees were as follows:
| |
| Class IA | $9,941 |
| Class IB | 9,974 |
| Total | $19,915 |
The fund has entered into expense offset arrangements with Putnam Investor Services, Inc. and State Street whereby Putnam Investor Services, Inc.’s and State Street’s fees are reduced by credits allowed on cash balances. For the reporting period, the fund’s expenses were reduced by $136 under the expense offset arrangements.
Each Independent Trustee of the fund receives an annual Trustee fee, of which $22, as a quarterly retainer, has been allocated to the fund, and an additional fee for each Trustees meeting attended. Trustees also are reimbursed for expenses they incur relating to their services as Trustees.
The fund has adopted a Trustee Fee Deferral Plan (the Deferral Plan) which allows the Trustees to defer the receipt of all or a portion of Trustees fees payable on or after July 1, 1995. The deferred fees remain invested in certain Putnam funds until distribution in accordance with the Deferral Plan.
The fund has adopted an unfunded noncontributory defined benefit pension plan (the Pension Plan) covering all Trustees of the fund who have served as a Trustee for at least five years and were first elected prior to 2004. Benefits under the Pension Plan are equal to 50% of the Trustee’s average annual attendance and retainer fees for the three years ended December 31, 2005. The retirement benefit is payable during a Trustee’s lifetime, beginning the year following retirement, for the number of years of service through December 31, 2006. Pension expense for the fund is included in Trustee compensation and expenses in the Statement of operations. Accrued pension liability is included in Payable for Trustee compensation and expenses in the Statement of assets and liabilities. The Trustees have terminated the Pension Plan with respect to any Trustee first elected after 2003.
The fund has adopted a distribution plan (the Plan) with respect to its class IB shares pursuant to Rule 12b–1 under the Investment Company Act of 1940. The purpose of the Plan is to compensate Putnam Retail Management Limited Partnership, an indirect wholly-owned subsidiary of Putnam Investments, LLC, for services provided and expenses incurred in distributing shares of the fund. The Plan provides for payment by the fund to Putnam Retail Management Limited Partnership at an annual rate of up to 0.35% of the average net assets attributable to the fund’s class IB shares. The Trustees have approved payment by the fund at an annual rate of 0.25% of the average net assets attributable to the fund’s class IB shares. The expenses related to distribution fees during the reporting period are included in Distribution fees in the Statement of operations.
Note 3 — Purchases and sales of securities
During the reporting period, the cost of purchases and the proceeds from sales, excluding short-term investments, were as follows:
| | |
| | Cost of | Proceeds |
| | purchases | from sales |
| Investments in securities (Long-term) | $16,608,533 | $20,084,144 |
| U.S. government securities | | |
| (Long-term) | — | — |
| Total | $16,608,533 | $20,084,144 |
The fund may purchase or sell investments from or to other Putnam funds in the ordinary course of business, which can reduce the fund’s transaction costs, at prices determined in accordance with SEC requirements and policies approved by the Trustees. During the reporting period, purchases or sales of long-term securities from or to other Putnam funds, if any, did not represent more than 5% of the fund’s total cost of purchases and/or total proceeds from sales.
| |
| 14 | Putnam VT Small Cap Growth Fund |
Note 4 — Capital shares
At the close of the reporting period, there were an unlimited number of shares of beneficial interest authorized. Subscriptions and redemptions are presented at the omnibus level. Transactions in capital shares were as follows:
| | | | | | | | |
| | Class IA shares | Class IB shares |
| | Year ended 12/31/22 | Year ended 12/31/21 | Year ended 12/31/22 | Year ended 12/31/21 |
| | Shares | Amount | Shares | Amount | Shares | Amount | Shares | Amount |
| Shares sold | 23,811 | $402,657 | 129,928 | $3,247,578 | 21,423 | $324,123 | 9,782 | $220,230 |
| Shares issued in connection with | | | | | | | | |
| reinvestment of distributions | 160,126 | 2,773,375 | 65,525 | 1,423,849 | 170,534 | 2,866,672 | 70,021 | 1,488,641 |
| | 183,937 | 3,176,032 | 195,453 | 4,671,427 | 191,957 | 3,190,795 | 79,803 | 1,708,871 |
| Shares repurchased | (108,326) | (1,733,305) | (185,081) | (4,533,614) | (110,471) | (1,673,606) | (102,240) | (2,420,200) |
| Net increase (decrease) | 75,611 | $1,442,727 | 10,372 | $137,813 | 81,486 | $1,517,189 | (22,437) | $(711,329) |
Note 5 — Affiliated transactions
Transactions during the reporting period with any company which is under common ownership or control were as follows:
| | | | | |
| | | | | | Shares outstanding |
| | Fair value as of | | | | and fair value as of |
| Name of affiliate | 12/31/21 | Purchase cost | Sale proceeds | Investment income | 12/31/22 |
| Short-term investments | | | | | |
| Putnam Cash Collateral Pool, LLC* | $2,143,385 | $21,975,748 | $21,074,090 | $50,422 | $3,045,043 |
| Putnam Short Term Investment | | | | | |
| Fund** | 280,216 | 6,405,232 | 5,947,361 | 8,520 | 738,087 |
| Total Short-term investments | $2,423,601 | $28,380,980 | $27,021,451 | $58,942 | $3,783,130 |
*No management fees are charged to Putnam Cash Collateral Pool, LLC (Note 1). Investment income shown is included in securities lending income on the Statement of operations. There were no realized or unrealized gains or losses during the period.
**Management fees charged to Putnam Short Term Investment Fund have been waived by Putnam Management. There were no realized or unrealized gains or losses during the period.
Note 6 — Market, credit and other risks
In the normal course of business, the fund trades financial instruments and enters into financial transactions where risk of potential loss exists due to changes in the market (market risk) or failure of the contracting party to the transaction to perform (credit risk). The fund may be exposed to additional credit risk that an institution or other entity with which the fund has unsettled or open transactions will default. Investments in foreign securities involve certain risks, including those related to economic instability, unfavorable political developments, and currency fluctuations.
The Covid-19 pandemic and efforts to contain its spread have resulted in, among other effects, significant market volatility, exchange trading suspensions and closures, declines in global financial markets, higher default rates, significant changes in fiscal and monetary policies, and economic downturns and recessions. The effects of the Covid-19 pandemic have negatively affected, and may continue to negatively affect, the global economy, the economies of the United States and other individual countries, the financial performance of individual issuers, sectors, industries, asset classes, and markets, and the value, volatility, and liquidity of particular securities and other assets. The effects of the Covid-19 pandemic also are likely to exacerbate other risks that apply to the fund, which could negatively impact the fund’s performance and lead to losses on your investment in the fund. The duration of the Covid-19 pandemic and its effects cannot be determined with certainty.
| |
| Putnam VT Small Cap Growth Fund | 15 |
Federal tax information (Unaudited)
For the reporting period, a portion of the fund’s distribution represents a return of capital and is therefore not taxable to shareholders.
The fund designated 72.41% of ordinary income distributions as qualifying for the dividends received deduction for corporations.
| |
| 16 | Putnam VT Small Cap Growth Fund |

| |
| Putnam VT Small Cap Growth Fund | 17 |
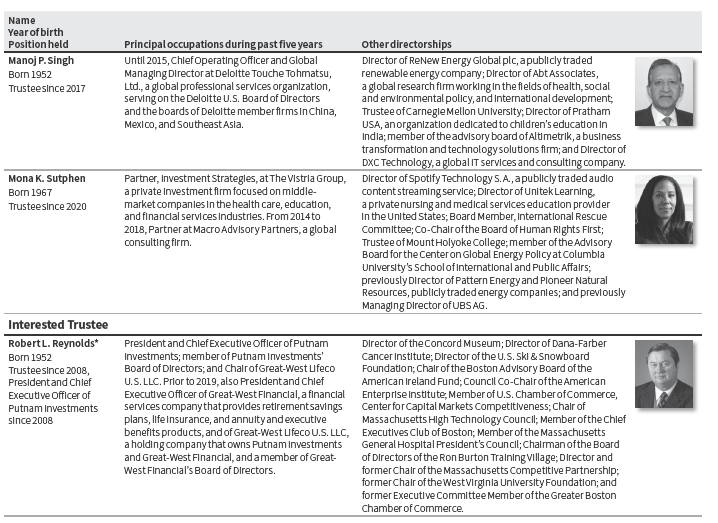
*Mr. Reynolds is an “interested person” (as defined in the Investment Company Act of 1940) of the fund and Putnam Investments. He is President and Chief Executive Officer of Putnam Investments, as well as the President of your fund and each of the other Putnam funds.
The address of each Trustee is 100 Federal Street, Boston, MA 02110.
As of December 31, 2022, there were 92 mutual funds, 4 closed-end funds, and 7 exchange-traded funds in the Putnam funds complex. Each Trustee serves as Trustee of all funds in the Putnam funds complex.
Each Trustee serves for an indefinite term, until his or her resignation, retirement at age 75, removal, or death.
| |
| 18 | Putnam VT Small Cap Growth Fund |
Officers
In addition to Robert L. Reynolds, the other officers of the fund are shown below:
| | |
| James F. Clark (Born 1974) | Richard T. Kircher (Born 1962) | Denere P. Poulack (Born 1968) |
| Vice President and Chief Compliance Officer | Vice President and BSA Compliance Officer | Assistant Vice President, Assistant Clerk, |
| Since 2016 | Since 2019 | and Assistant Treasurer |
| Chief Compliance Officer and Chief Risk Officer, | Assistant Director, Operational Compliance, | Since 2004 |
| Putnam Investments, and Chief Compliance | Putnam Investments and Putnam | |
| Officer, Putnam Management | Retail Management | Janet C. Smith (Born 1965) |
| | | Vice President, Principal Financial |
| Nancy E. Florek (Born 1957) | Martin Lemaire (Born 1984) | Officer, Principal Accounting Officer, |
| Vice President, Director of Proxy Voting | Vice President and Derivatives Risk Manager | and Assistant Treasurer |
| and Corporate Governance, Assistant Clerk, | Since 2022 | Since 2007 |
| and Assistant Treasurer | Risk Manager and Risk Analyst, | Head of Fund Administration Services, Putnam |
| Since 2000 | Putnam Investments | Investments and Putnam Management |
| |
| Michael J. Higgins (Born 1976) | Susan G. Malloy (Born 1957) | Stephen J. Tate (Born 1974) |
| Vice President, Treasurer, and Clerk | Vice President and Assistant Treasurer | Vice President and Chief Legal Officer |
| Since 2010 | Since 2007 | Since 2021 |
| | Head of Accounting and Middle Office Services, | General Counsel, Putnam Investments, Putnam |
| Jonathan S. Horwitz (Born 1955) | Putnam Investments and Putnam Management | Management, and Putnam Retail Management |
| Executive Vice President, Principal Executive | | |
| Officer, and Compliance Liaison | Alan G. McCormack (Born 1964) | Mark C. Trenchard (Born 1962) |
| Since 2004 | Vice President and Derivatives Risk Manager | Vice President |
| | Since 2022 | Since 2002 |
| | Head of Quantitative Equities and Risk, | Director of Operational Compliance, Putnam |
| | Putnam Investments | Investments and Putnam Retail Management |
The principal occupations of the officers for the past five years have been with the employers as shown above, although in some cases they have held different positions with such employers. The address of each officer is 100 Federal Street, Boston, MA 02110.
| |
| Putnam VT Small Cap Growth Fund | 19 |
|
| This page intentionally left blank. |
| |
| 20 | Putnam VT Small Cap Growth Fund |
Other important information
Proxy voting
Putnam is committed to managing our mutual funds in the best interests of our shareholders. The Putnam funds’ proxy voting guidelines and procedures, as well as information regarding how your fund voted proxies relating to portfolio securities during the 12-month period ended June 30, 2022, are available in the Individual Investors section of putnam.com and on the Securities and Exchange Commission’s (SEC) website at www.sec.gov. If you have questions about finding forms on the SEC’s website, you may call the SEC at 1-800-SEC-0330. You may also obtain the Putnam funds’ proxy voting guidelines and procedures at no charge by calling Putnam’s Shareholder Services at 1-800-225-1581.
Fund portfolio holdings
The fund will file a complete schedule of its portfolio holdings with the SEC for the first and third quarters of each fiscal year on Form N-PORT within 60 days of the end of such fiscal quarter. Shareholders may obtain the fund’s Form N-PORT from the SEC’s website at www.sec.gov.
Prior to its use of Form N-PORT, the fund filed its complete schedule of its portfolio holdings with the SEC on Form N-Q, which is available online at www.sec.gov.
Fund information
| | |
| Investment Manager | Investor Servicing Agent | Trustees |
| Putnam Investment Management, LLC | Putnam Investments | Kenneth R. Leibler, Chair |
| 100 Federal Street | Mailing address: | Barbara M. Baumann, Vice Chair |
| Boston, MA 02110 | P.O. Box 219697 | Liaquat Ahamed |
| | Kansas City, MO 64121-9697 | Katinka Domotorffy |
| Investment Sub-Advisor | 1-800-225-1581 | Catharine Bond Hill |
| Putnam Investments Limited | | Jennifer Williams Murphy |
| 16 St James’s Street | Custodian | Marie Pillai |
| London, England SW1A 1ER | State Street Bank and Trust Company | George Putnam III |
| | | Robert L. Reynolds |
| Marketing Services | Legal Counsel | Manoj P. Singh |
| Putnam Retail Management | Ropes & Gray LLP | Mona K. Sutphen |
| Limited Partnership | | |
| 100 Federal Street | Independent Registered | |
| Boston, MA 02110 | Public Accounting Firm | |
| | PricewaterhouseCoopers LLP | |
The fund’s Statement of Additional Information contains additional information about the fund’s Trustees and is available without charge upon request by calling 1-800-225-1581.
| |
| Putnam VT Small Cap Growth Fund | 21 |
| |
| This report has been prepared for the shareholders | |
| of Putnam VT Small Cap Growth Fund. | VTAN068 332110 2/23 |
| |
| (a) The fund’s principal executive, financial and accounting officers are employees of Putnam Investment Management, LLC, the Fund’s investment manager. As such they are subject to a comprehensive Code of Ethics adopted and administered by Putnam Investments which is designed to protect the interests of the firm and its clients. The Fund has adopted a Code of Ethics which incorporates the Code of Ethics of Putnam Investments with respect to all of its officers and Trustees who are employees of Putnam Investment Management, LLC. For this reason, the Fund has not adopted a separate code of ethics governing its principal executive, financial and accounting officers. |
| |
| (c) In January 2023, the Code of Ethics of Putnam Investments and Code of Ethics of Putnam Funds were amended. The key changes to the Putnam Investments Code of Ethics are as follows: (i) Prohibition on investments in a single stock ETFs and (ii) Revision to the 7-day blackout rule for Analysts. The key change to the Putnam Funds Code of Ethics was that the provisions of the Code of Ethics for employees of PanAgora Asset Management, inc. and any of its subsidiaries are excluded from the Putnam Funds’ Code of Ethics. |
| |
| Item 3. Audit Committee Financial Expert: |
| |
| The Funds’ Audit, Compliance and Risk Committee is comprised solely of Trustees who are “independent” (as such term has been defined by the Securities and Exchange Commission (“SEC”) in regulations implementing Section 407 of the Sarbanes-Oxley Act (the “Regulations”)). The Trustees believe that each member of the Audit, Compliance and Risk Committee also possesses a combination of knowledge and experience with respect to financial accounting matters, as well as other attributes, that qualifies him or her for service on the Committee. In addition, the Trustees have determined that each of Dr. Hill, Ms. Murphy and Mr. Singh qualifies as an “audit committee financial expert” (as such term has been defined by the Regulations) based on their review of his or her pertinent experience and education.The SEC has stated, and the funds’ amended and restated agreement and Declaration of Trust provides, that the designation or identification of a person as an audit committee financial expert pursuant to this Item 3 of Form N-CSR does not impose on such person any duties, obligations or liability that are greater than the duties, obligations and liability imposed on such person as a member of the Audit, Compliance and Risk Committee and the Board of Trustees in the absence of such designation or identification. |
| |
| Item 4. Principal Accountant Fees and Services: |
| |
| The following table presents fees billed in each of the last two fiscal years for services rendered to the fund by the fund’s independent auditor: |
| | | | | |
| Fiscal year ended | Audit Fees | Audit-Related Fees | Tax Fees | All Other Fees |
|
|
| | | | | |
| December 31, 2022 | $25,924 | $ — | $6,989 | $ — |
| December 31, 2021 | $24,522 | $ — | $4,827 | $ — |
| |
| For the fiscal years ended December 31, 2022 and December 31, 2021, the fund’s independent auditor billed aggregate non-audit fees in the amounts of $249,000 and $298,247 respectively, to the fund, Putnam Management and any entity controlling, controlled by or under common control with Putnam Management that provides ongoing services to the fund. |
| |
| Audit Fees represent fees billed for the fund’s last two fiscal years relating to the audit and review of the financial statements included in annual reports and registration statements, and other services that are normally provided in connection with statutory and regulatory filings or engagements. |
| |
| Audit-Related Fees represent fees billed in the fund’s last two fiscal years for services traditionally performed by the fund’s auditor, including accounting consultation for proposed transactions or concerning financial accounting and reporting standards and other audit or attest services not required by statute or regulation. |
| |
| Tax Fees represent fees billed in the fund’s last two fiscal years for tax compliance, tax planning and tax advice services. Tax planning and tax advice services include assistance with tax audits, employee benefit plans and requests for rulings or technical advice from taxing authorities. |
| |
| Pre-Approval Policies of the Audit, Compliance and Risk Committee. The Audit, Compliance and Risk Committee of the Putnam funds has determined that, as a matter of policy, all work performed for the funds by the funds’ independent auditors will be pre-approved by the Committee itself and thus will generally not be subject to pre-approval procedures. |
| |
| The Audit, Compliance and Risk Committee also has adopted a policy to pre-approve the engagement by Putnam Management and certain of its affiliates of the funds’ independent auditors, even in circumstances where pre-approval is not required by applicable law. Any such requests by Putnam Management or certain of its affiliates are typically submitted in writing to the Committee and explain, among other things, the nature of the proposed engagement, the estimated fees, and why this work should be performed by that particular audit firm as opposed to another one. In reviewing such requests, the Committee considers, among other things, whether the provision of such services by the audit firm are compatible with the independence of the audit firm. |
| |
| The following table presents fees billed by the fund’s independent auditor for services required to be approved pursuant to paragraph (c)(7)(ii) of Rule 2–01 of Regulation S-X. |
| | | | | |
| Fiscal year ended | Audit-Related Fees | Tax Fees | All Other Fees | Total Non-Audit Fees |
|
|
| December 31, 2022 | $ — | $242,011 | $ — | $ — |
| December 31, 2021 | $ — | $293,420 | $ — | $ — |
| |
| Item 5. Audit Committee of Listed Registrants |
| |
| Item 6. Schedule of Investments: |
| |
| The registrant’s schedule of investments in unaffiliated issuers is included in the report to shareholders in Item 1 above. |
| |
| Item 7. Disclosure of Proxy Voting Policies and Procedures For Closed-End Management Investment Companies: |
| |
| Item 8. Portfolio Managers of Closed-End Investment Companies |
| |
| Item 9. Purchases of Equity Securities by Closed-End Management Investment Companies and Affiliated Purchasers: |
| |
| Item 10. Submission of Matters to a Vote of Security Holders: |
| |
| Item 11. Controls and Procedures: |
| |
| (a) The registrant’s principal executive officer and principal financial officer have concluded, based on their evaluation of the effectiveness of the design and operation of the registrant’s disclosure controls and procedures as of a date within 90 days of the filing date of this report, that the design and operation of such procedures are generally effective to provide reasonable assurance that information required to be disclosed by the registrant in this report is recorded, processed, summarized and reported within the time periods specified in the Commission’s rules and forms. |
| |
| (b) Changes in internal control over financial reporting: Not applicable |
| |
| Item 12. Disclosures of Securities Lending Activities for Closed-End Management Investment Companies: |
| |
| (a)(1) The Code of Ethics of The Putnam Funds, which incorporates the Code of Ethics of Putnam Investments, is filed herewith. |
| |
| Pursuant to the requirements of the Securities Exchange Act of 1934 and the Investment Company Act of 1940, the registrant has duly caused this report to be signed on its behalf by the undersigned, thereunto duly authorized. |
| |
| By (Signature and Title): |
| |
| /s/ Janet C. Smith
Janet C. Smith
Principal Accounting Officer
|
| |
| Pursuant to the requirements of the Securities Exchange Act of 1934 and the Investment Company Act of 1940, this report has been signed below by the following persons on behalf of the registrant and in the capacities and on the dates indicated. |
| |
| By (Signature and Title): |
| |
| /s/ Jonathan S. Horwitz
Jonathan S. Horwitz
Principal Executive Officer
|
| |
| By (Signature and Title): |
| |
| /s/ Janet C. Smith
Janet C. Smith
Principal Financial Officer
|