| | |
| UNITED STATES
SECURITIES AND EXCHANGE COMMISSION |
| | |
| CERTIFIED SHAREHOLDER REPORT OF REGISTERED
MANAGEMENT INVESTMENT COMPANIES
|
| | |
| Investment Company Act file number: | (811-05346) |
| | |
| Exact name of registrant as specified in charter: | Putnam Variable Trust |
| | |
| Address of principal executive offices: | 100 Federal Street, Boston, Massachusetts 02110 |
| | |
| Name and address of agent for service: | Stephen Tate, Vice President
100 Federal Street
Boston, Massachusetts 02110 |
| | |
| Copy to: | Bryan Chegwidden, Esq.
Ropes & Gray LLP
1211 Avenue of the Americas
New York, New York 10036 |
| | |
| | James E. Thomas, Esq.
Ropes & Gray LLP
800 Boylston Street
Boston, Massachusetts 02199 |
| | |
| Registrant’s telephone number, including area code: | (617) 292-1000 |
| | |
| Date of fiscal year end: | December 31, 2023 |
| | |
| Date of reporting period: | January 1, 2023 – June 30, 2023 |
| | |
|
Item 1. Report to Stockholders: | |
| | |
| The following is a copy of the report transmitted to stockholders pursuant to Rule 30e-1 under the Investment Company Act of 1940: | |
Message from the Trustees
August 11, 2023
Dear Shareholder:
Stocks have generally advanced through the first half of 2023. Recently, a strong pulse of innovation has been gaining investors’ attention, and the technology sector has started to rebound from a difficult 2022. More broadly, international markets are performing well, even though the reopening of China’s economy lacked the dynamism many had anticipated.
Bond markets have experienced more ups and downs, but performance has improved compared with 2022. U.S. inflation has been trending downward, while the country’s economic growth has remained positive. Against this backdrop, investors are weighing the impact of high borrowing costs, stress in the banking system, and a weaker housing market.
As active managers, your investment team continues to research attractive opportunities for your fund while monitoring risks. This report offers an update on their efforts.
Thank you for investing with Putnam.
The views expressed in this report are exclusively those of Putnam Management and are subject to change. They are not meant as investment advice. Please note that the holdings discussed in this report may not have been held by the fund for the entire period. Portfolio composition is subject to review in accordance with the fund’s investment strategy and may vary in the future. Current and future portfolio holdings are subject to risk.
Consider these risks before investing: Allocation of assets among asset classes may hurt performance. The value of investments in the fund’s portfolio may fall or fail to rise over extended periods of time for a variety of reasons, including general economic, political, or financial market conditions; investor sentiment and market perceptions; government actions; geopolitical events or changes; and factors related to a specific issuer, asset class, geography, industry, or sector. These and other factors may lead to increased volatility and reduced liquidity in the fund’s portfolio holdings.
International investing involves currency, economic, and political risks. Emerging market securities carry illiquidity and volatility risks. Investments in small and/or midsize companies increase the risk of greater price fluctuations. Growth stocks may be more susceptible to earnings disappointments, and value stocks may fail to rebound. Funds that invest in government securities are not guaranteed. Mortgage-backed investments, unlike traditional debt investments, are also subject to prepayment risk, which means that they may increase in value less than other bonds when interest rates decline and decline in value more than other bonds when interest rates rise. Bond investments are subject to interest-rate risk (the risk of bond prices falling if interest rates rise) and credit risk (the risk of an issuer defaulting on interest or principal payments). Default risk is generally higher for non-qualified mortgages. Interest-rate risk is generally greater for longer-term bonds, and credit risk is generally greater for below-investment-grade bonds. Unlike bonds, funds that invest in bonds have fees and expenses. The use of derivatives may increase these risks by increasing investment exposure (which may be considered leverage) or, in the case of over-the-counter instruments, because of the potential inability to terminate or sell derivatives positions and the potential failure of the other party to the instrument to meet its obligations.
Our investment techniques, analyses, and judgments may not produce the outcome we intend. The investments we select for the fund may not perform as well as other securities that we do not select for the fund. We, or the fund’s other service providers, may experience disruptions or operating errors that could have a negative effect on the fund. You can lose money by investing in the fund.
Performance summary (as of 6/30/23)
Investment objective
Long-term return consistent with the preservation of capital
Net asset value June 30, 2023
| |
| Class IA: $16.34 | Class IB:$16.64 |
Annualized total return at net asset value (as of 6/30/23)
| | | | |
| | | | | | Putnam |
| | | Class IA | | Class IB | | | Balanced |
| | | shares | | shares | | Russell 3000 | | Blended |
| | | (2/1/88) | | (4/30/98) | | Index | | Benchmark |
| 6 months | 9.60% | 9.46% | 16.17% | 10.17% |
| 1 year | 10.55 | 10.24 | 18.95 | 11.43 |
| 5 years | 5.34 | 5.08 | 11.39 | 6.87 |
| 10 years | 7.09 | 6.82 | 12.34 | 7.64 |
| Life of fund | 7.42 | 7.23 | 10.70 | — |
Returns for periods of less than one year are not annualized.
For a portion of the periods, the fund had expense limitations, without which returns would have been lower.
The fund’s custom benchmark, the Putnam Balanced Blended Benchmark, was introduced on 12/31/94, which post-dates the inception of the fund.
The Russell 3000® Index is an unmanaged index of the 3,000 largest U.S. companies.
The Putnam Balanced Blended Benchmark is a blended benchmark administered by Putnam Management and comprises 50% the Russell 3000® Index, 35% the Bloomberg U.S. Aggregate Bond Index, 10% the MSCI EAFE Index (ND), and 5% the JPMorgan Developed High Yield Index. The Bloomberg U.S. Aggregate Bond Index is an unmanaged index of U.S. investment-grade fixed income securities. The MSCI EAFE Index (ND) is an unmanaged index of equity securities from developed countries in Western Europe, the Far East, and Australasia. Calculated with net dividends (ND), this total return index reflects the reinvestment of dividends after the deduction of withholding taxes, using a tax rate applicable to non-resident institutional investors who do not benefit from double taxation treaties. The JPMorgan Developed High Yield Index is an unmanaged index of high-yield fixed income securities issued in developed countries.
All Bloomberg indices are provided by Bloomberg Index Services Limited.
BLOOMBERG® is a trademark and service mark of Bloomberg Finance L.P. and its affiliates (collectively “Bloomberg”). Bloomberg or Bloomberg’s licensors own all proprietary rights in the Bloomberg Indices. Neither Bloomberg nor Bloomberg’s licensors approve or endorse this material, or guarantee the accuracy or completeness of any information herein, or make any warranty, express or implied, as to the results to be obtained therefrom, and to the maximum extent allowed by law, neither shall have any liability or responsibility for injury or damages arising in connection therewith.
Frank Russell Company is the source and owner of the trademarks, service marks, and copyrights related to the Russell Indexes. Russell® is a trademark of Frank Russell Company.
All MSCI indices are provided by MSCI.
Certain information contained herein (the “Information”) is sourced from/copyright of MSCI Inc., MSCI ESG Research LLC, or their affiliates (“MSCI”), or information providers (together the “MSCI Parties”) and may have been used to calculate scores, signals, or other indicators. The Information is for internal use only and may not be reproduced or disseminated in whole or part without prior written permission. The Information may not be used for, nor does it constitute, an offer to buy or sell, or a promotion or recommendation of, any security, financial instrument or product, trading strategy, or index, nor should it be taken as an indication or guarantee of any future performance. Some funds may be based on or linked to MSCI indexes, and MSCI may be compensated based on the fund’s assets under management or other measures. MSCI has established an information barrier between index research and certain Information. None of the Information in and of itself can be used to determine which securities to buy or sell or when to buy or sell them. The Information is provided “as is” and the user assumes the entire risk of any use it may make or permit to be made of the Information. No MSCI Party warrants or guarantees the originality, accuracy, and/or completeness of the Information, and each expressly disclaims all express or implied warranties. No MSCI Party shall have any liability for any errors or omissions in connection with any Information herein, or any liability for any direct, indirect, special, punitive, consequential, or any other damages (including lost profits) even if notified of the possibility of such damages.
Data represent past performance. Past performance does not guarantee future results. More recent returns may be less or more than those shown. Investment return and principal value will fluctuate, and you may have a gain or a loss when you sell your shares. Performance information does not reflect any deduction for taxes a shareholder may owe on fund distributions or on the redemption of fund shares. All total return figures are at net asset value and exclude contract charges and expenses, which are added to the variable annuity contracts to determine total return at unit value. Had these charges and expenses been reflected, performance would have been lower. Performance of class IB shares before their inception is derived from the historical performance of class IA shares, adjusted to reflect the higher operating expenses applicable to such shares. For more recent performance, contact your variable annuity provider who can provide you with performance that reflects the charges and expenses at your contract level.
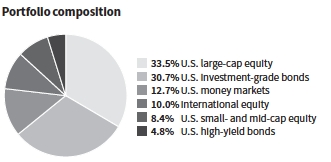
Allocations are shown as a percentage of the fund’s net assets. Cash and net other assets, if any, represent the market value weights of cash, derivatives, short-term securities, and other unclassified assets in the portfolio. Summary information may differ from the portfolio schedule included in the financial statements due to the inclusion of derivative securities, any interest accruals, the exclusion of as-of trades, if any, the use of different classifications of securities for presentation purposes, and rounding. Holdings and allocations may vary over time. Due to rounding, percentages may not equal 100%.
| |
| Putnam VT Global Asset Allocation Fund 1 |
Understanding your fund’s expenses
As an investor in a variable annuity product that invests in a registered investment company, you pay ongoing expenses, such as management fees, distribution fees (12b-1 fees), and other expenses. In the most recent six-month period, your fund’s expenses were limited; had expenses not been limited, they would have been higher. Using the following information, you can estimate how these expenses affect your investment and compare them with the expenses of other funds. You may also pay onetime transaction expenses, which are not shown in this section and would result in higher total expenses. Charges and expenses at the insurance company separate account level are not reflected. For more information, see your fund’s prospectus or talk to your financial representative.
Review your fund’s expenses
The two left-hand columns of the Expenses per $1,000 table show the expenses you would have paid on a $1,000 investment in your fund from 1/1/23 to 6/30/23. They also show how much a $1,000 investment would be worth at the close of the period, assuming actual returns and expenses. To estimate the ongoing expenses you paid over the period, divide your account value by $1,000, then multiply the result by the number in the first line for the class of shares you own.
Compare your fund’s expenses with those of other funds
The two right-hand columns of the Expenses per $1,000 table show your fund’s expenses based on a $1,000 investment, assuming a hypothetical 5% annualized return. You can use this information to compare the ongoing expenses (but not transaction expenses or total costs) of investing in the fund with those of other funds. All shareholder reports of mutual funds and funds serving as variable annuity vehicles will provide this information to help you make this comparison. Please note that you cannot use this information to estimate your actual ending account balance and expenses paid during the period.
Expense ratios
| | |
| | Class IA | Class IB |
| Net expenses for the fiscal year ended | | |
| 12/31/22*† | 0.86% | 1.11% |
| Total annual operating expenses for the fiscal | | |
| year ended 12/31/22† | 0.90% | 1.15% |
| Annualized expense ratio for the six-month | | |
| period ended 6/30/23 | 0.86% | 1.11% |
Fiscal year expense information in this table is taken from the most recent prospectus, is subject to change, and may differ from that shown for the annualized expense ratio and in the financial highlights of this report.
Expenses are shown as a percentage of average net assets.
*Reflects Putnam Management’s contractual obligation to limit certain fund expenses through 4/30/24.
†Restated to reflect current fees.
Expenses per $1,000
| | | | |
| | | | Expenses and value for a |
| | Expenses and value for a | $1,000 investment, assuming |
| | $1,000 investment, assuming | a hypothetical 5% annualized |
| | actual returns for the | return for the 6 months |
| | 6 months ended 6/30/23 | ended 6/30/23 | |
| | Class IA | Class IB | Class IA | Class IB |
| Expenses paid | | | | |
| per $1,000*† | $4.47 | $5.76 | $4.31 | $5.56 |
| Ending value | | | | |
| (after | | | | |
| expenses) | $1,096.00 | $1,094.60 | $1,020.53 | $1,019.29 |
*Expenses for each share class are calculated using the fund’s annualized expense ratio for each class, which represents the ongoing expenses as a percentage of average net assets for the six months ended 6/30/23. The expense ratio may differ for each share class.
†Expenses based on actual returns are calculated by multiplying the expense ratio by the average account value for the period; then multiplying the result by the number of days in the period (181); and then dividing that result by the number of days in the year (365). Expenses based on a hypothetical 5% return are calculated by multiplying the expense ratio by the average account value for the six-month period; then multiplying the result by the number of days in the six-month period (181); and then dividing that result by the number of days in the year (365).
| |
| 2 Putnam VT Global Asset Allocation Fund |
The fund’s portfolio 6/30/23 (Unaudited)
| | |
| COMMON STOCKS (76.1%)* | Shares | Value |
| | | |
| Advertising and marketing services (0.2%) | | |
| Trade Desk, Inc. (The) Class A † | 1,518 | $117,220 |
| | | 117,220 |
| Automotive (1.4%) | | |
| Dr. Ing. h.c. F. Porsche AG (Preference) | | |
| (Germany) † | 843 | 104,637 |
| Ford Motor Co. | 5,497 | 83,170 |
| General Motors Co. | 9,716 | 374,649 |
| Genuine Parts Co. | 385 | 65,154 |
| Stellantis NV (Italy) | 6,746 | 118,369 |
| Tesla, Inc. † | 2,234 | 584,794 |
| Volkswagen AG (Preference) (Germany) | 778 | 104,370 |
| | | 1,435,143 |
| Basic materials (3.2%) | | |
| Anglo American PLC (London Exchange) | | |
| (United Kingdom) | 2,632 | 74,641 |
| AptarGroup, Inc. | 554 | 64,186 |
| Archer-Daniels-Midland Co. | 887 | 67,022 |
| Arkema SA (France) | 318 | 29,946 |
| Ashland Global Holdings, Inc. | 705 | 61,272 |
| BHP Group, Ltd. (ASE Exchange) (Australia) | 3,239 | 96,642 |
| BHP Group, Ltd. (London Exchange) (Australia) | 463 | 13,759 |
| BlueScope Steel, Ltd. (Australia) | 3,945 | 54,425 |
| Builders FirstSource, Inc. † | 4,372 | 594,592 |
| CF Industries Holdings, Inc. | 908 | 63,033 |
| Compagnie de Saint-Gobain (France) | 1,963 | 119,375 |
| Corteva, Inc. | 6,133 | 351,421 |
| CRH PLC (Ireland) | 2,507 | 138,150 |
| Dow, Inc. | 1,230 | 65,510 |
| Eiffage SA (France) | 527 | 54,964 |
| Element Solutions, Inc. | 3,268 | 62,746 |
| Freeport-McMoRan, Inc. (Indonesia) | 1,916 | 76,640 |
| Glencore PLC (United Kingdom) | 13,543 | 76,452 |
| Holcim AG (Switzerland) | 543 | 36,522 |
| JFE Holdings, Inc. (Japan) | 500 | 7,175 |
| Linde PLC | 88 | 33,535 |
| Misumi Group, Inc. (Japan) | 400 | 8,006 |
| Nucor Corp. | 429 | 70,347 |
| Olin Corp. | 1,152 | 59,201 |
| PPG Industries, Inc. | 434 | 64,362 |
| Reliance Steel & Aluminum Co. | 260 | 70,613 |
| Rio Tinto PLC (United Kingdom) | 1,202 | 76,106 |
| Sealed Air Corp. | 1,612 | 64,480 |
| Sherwin-Williams Co. (The) | 269 | 71,425 |
| Shin-Etsu Chemical Co., Ltd. (Japan) | 4,200 | 139,595 |
| South32, Ltd. (Australia) | 8,764 | 22,103 |
| Steel Dynamics, Inc. | 651 | 70,913 |
| TopBuild Corp. † | 409 | 108,802 |
| WestRock Co. | 1,987 | 57,762 |
| Weyerhaeuser Co. R | 4,222 | 141,479 |
| Yara International ASA (Norway) | 1,013 | 35,769 |
| | | 3,202,971 |
| Building materials (0.1%) | | |
| Owens Corning | 600 | 78,300 |
| | | 78,300 |
| Capital goods (3.4%) | | |
| Allegion PLC (Ireland) | 531 | 63,731 |
| Allison Transmission Holdings, Inc. | 1,350 | 76,221 |
| Aptiv PLC † | 669 | 68,298 |
| | |
| COMMON STOCKS (76.1%)* cont. | Shares | Value |
| | | |
| Capital goods cont. | | |
| Axon Enterprise, Inc. † | 170 | $33,170 |
| BAE Systems PLC (United Kingdom) | 10,035 | 118,141 |
| Berry Global Group, Inc. | 1,055 | 67,879 |
| Boeing Co. (The) † | 290 | 61,236 |
| Caterpillar, Inc. | 700 | 172,235 |
| Cummins, Inc. | 267 | 65,458 |
| Dassault Aviation SA (France) | 154 | 30,819 |
| Deere & Co. | 163 | 66,046 |
| Donaldson Co., Inc. | 1,043 | 65,198 |
| Eaton Corp. PLC | 317 | 63,749 |
| Emerson Electric Co. | 792 | 71,589 |
| Enovis Corp. † | 1,118 | 71,686 |
| Fortive Corp. | 856 | 64,003 |
| GEA Group AG (Germany) | 1,394 | 58,275 |
| General Dynamics Corp. | 284 | 61,103 |
| HEICO Corp. | 389 | 68,830 |
| Honeywell International, Inc. | 323 | 67,023 |
| ITT, Inc. | 709 | 66,086 |
| Jacobs Solutions, Inc. | 1,801 | 214,121 |
| Johnson Controls International PLC | 3,065 | 208,849 |
| Legrand SA (France) | 580 | 57,467 |
| LKQ Corp. | 1,152 | 67,127 |
| Lockheed Martin Corp. | 141 | 64,914 |
| Mitsubishi Heavy Industries, Ltd. (Japan) | 2,100 | 98,246 |
| NGK Insulators, Ltd. (Japan) | 2,400 | 28,710 |
| Nordson Corp. | 265 | 65,768 |
| Otis Worldwide Corp. | 764 | 68,004 |
| Parker Hannifin Corp. | 168 | 65,527 |
| Prysmian SpA (Italy) | 2,726 | 113,868 |
| Raytheon Technologies Corp. | 669 | 65,535 |
| Republic Services, Inc. | 483 | 73,981 |
| Tetra Tech, Inc. | 420 | 68,771 |
| Textron, Inc. | 954 | 64,519 |
| TransDigm Group, Inc. | 84 | 75,110 |
| Valmont Industries, Inc. | 379 | 110,308 |
| Vertiv Holdings Co. | 4,064 | 100,665 |
| Vinci SA (France) | 1,045 | 121,306 |
| Waste Management, Inc. | 425 | 73,704 |
| WESCO International, Inc. | 517 | 92,574 |
| | | 3,379,850 |
| Commercial and consumer services (3.3%) | | |
| Automatic Data Processing, Inc. | 3,209 | 705,306 |
| Booking Holdings, Inc. † | 332 | 896,510 |
| Cintas Corp. | 180 | 89,474 |
| CoStar Group, Inc. † | 845 | 75,205 |
| Ecolab, Inc. | 365 | 68,142 |
| Expedia Group, Inc. † | 726 | 79,417 |
| Gartner, Inc. † | 180 | 63,056 |
| Global Payments, Inc. | 636 | 62,659 |
| Jardine Matheson Holdings, Ltd. (Hong Kong) | 500 | 25,360 |
| Mastercard, Inc. Class A | 890 | 350,037 |
| PayPal Holdings, Inc. † | 11,775 | 785,746 |
| Toast, Inc. Class A † | 2,816 | 63,557 |
| WEX, Inc. † | 363 | 66,091 |
| | | 3,330,560 |
| Communication services (1.5%) | | |
| American Tower Corp. R | 1,268 | 245,916 |
| AT&T, Inc. | 25,919 | 413,408 |
| Comcast Corp. Class A | 1,605 | 66,688 |
| Crown Castle, Inc. R | 552 | 62,895 |
| |
| Putnam VT Global Asset Allocation Fund 3 |
| | |
| COMMON STOCKS (76.1%)* cont. | Shares | Value |
| | | |
| Communication services cont. | | |
| KDDI Corp. (Japan) | 3,600 | $111,261 |
| SBA Communications Corp. R | 275 | 63,734 |
| Telstra Group, Ltd. (Australia) | 27,143 | 77,905 |
| Verizon Communications, Inc. | 11,894 | 442,338 |
| | | 1,484,145 |
| Communications equipment (0.1%) | | |
| Motorola Solutions, Inc. | 230 | 67,454 |
| | | 67,454 |
| Computers (7.7%) | | |
| Apple, Inc. | 26,752 | 5,189,085 |
| Cisco Systems, Inc./Delaware | 13,089 | 677,225 |
| Dropbox, Inc. Class A † | 2,828 | 75,423 |
| Elastic NV † | 945 | 60,593 |
| Fortinet, Inc. † | 1,034 | 78,160 |
| Fujitsu, Ltd. (Japan) | 800 | 103,142 |
| MongoDB, Inc. † | 296 | 121,653 |
| MSCI, Inc. | 130 | 61,008 |
| NetApp, Inc. | 952 | 72,733 |
| Pure Storage, Inc. Class A † | 2,751 | 101,292 |
| RingCentral, Inc. Class A † | 2,307 | 75,508 |
| Smartsheet, Inc. Class A † | 2,085 | 79,772 |
| Snowflake, Inc. Class A † | 378 | 66,520 |
| Synopsys, Inc. † | 2,050 | 892,591 |
| | | 7,654,705 |
| Conglomerates (0.9%) | | |
| AMETEK, Inc. | 3,492 | 565,285 |
| General Electric Co. | 591 | 64,921 |
| Marubeni Corp. (Japan) | 7,500 | 128,128 |
| Mitsui & Co., Ltd. (Japan) | 3,800 | 142,980 |
| | | 901,314 |
| Consumer (0.3%) | | |
| LVMH Moet Hennessy Louis Vuitton SA (France) | 260 | 244,844 |
| Pandora A/S (Denmark) | 662 | 59,103 |
| | | 303,947 |
| Consumer staples (6.5%) | | |
| Airbnb, Inc. Class A † | 553 | 70,872 |
| Albertsons Cos., Inc. Class A | 2,918 | 63,671 |
| Auto Trader Group PLC (United Kingdom) | 5,958 | 46,187 |
| Carlsberg A/S Class B (Denmark) | 97 | 15,502 |
| CK Hutchison Holdings, Ltd. (Hong Kong) | 10,500 | 64,270 |
| Coca-Cola Co. (The) | 17,874 | 1,076,372 |
| Coca-Cola HBC AG (Italy) | 2,921 | 86,992 |
| Coles Group, Ltd. (Australia) | 5,427 | 66,701 |
| Colgate-Palmolive Co. | 849 | 65,407 |
| Costco Wholesale Corp. | 120 | 64,606 |
| DoorDash, Inc. Class A † | 990 | 75,656 |
| Etsy, Inc. † | 730 | 61,765 |
| Hershey Co. (The) | 248 | 61,926 |
| Imperial Brands PLC (United Kingdom) | 5,109 | 112,801 |
| ITOCHU Corp. (Japan) | 1,100 | 43,745 |
| Keurig Dr Pepper, Inc. | 3,172 | 99,188 |
| Koninklijke Ahold Delhaize NV (Netherlands) | 3,495 | 119,218 |
| L’Oreal SA (France) | 378 | 176,168 |
| ManpowerGroup, Inc. | 816 | 64,790 |
| McDonald’s Corp. | 203 | 60,577 |
| McDonald’s Holdings Co. (Japan), Ltd. (Japan) | 1,100 | 42,780 |
| Mondelez International, Inc. Class A | 3,530 | 257,478 |
| Nestle SA (Switzerland) | 939 | 112,884 |
| Nissin Food Products Co., Ltd. (Japan) | 700 | 57,818 |
| PepsiCo, Inc. | 1,132 | 209,669 |
| | |
| COMMON STOCKS (76.1%)*cont. | Shares | Value |
| | | |
| Consumer staples cont. | | |
| Philip Morris International, Inc. | 9,681 | $945,059 |
| Procter & Gamble Co. (The) | 7,531 | 1,142,754 |
| Recruit Holdings Co., Ltd. (Japan) | 3,800 | 121,271 |
| Sodexo SA (France) | 350 | 38,517 |
| Uber Technologies, Inc. † | 16,850 | 727,415 |
| Unilever PLC (United Kingdom) | 2,558 | 133,114 |
| WH Group, Ltd. (Hong Kong) | 53,000 | 28,166 |
| Yakult Honsha Co., Ltd. (Japan) | 1,600 | 101,375 |
| ZOZO, Inc. (Japan) | 300 | 6,209 |
| | | 6,420,923 |
| Electronics (4.4%) | | |
| Agilent Technologies, Inc. | 270 | 32,468 |
| Broadcom, Inc. | 429 | 372,127 |
| Hamamatsu Photonics KK (Japan) | 600 | 29,454 |
| Hoya Corp. (Japan) | 1,000 | 119,289 |
| Keysight Technologies, Inc. † | 428 | 71,669 |
| Lattice Semiconductor Corp. † | 827 | 79,450 |
| nVent Electric PLC (United Kingdom) | 3,347 | 172,939 |
| NVIDIA Corp. | 5,470 | 2,313,919 |
| Qorvo, Inc. † | 647 | 66,013 |
| Qualcomm, Inc. | 6,396 | 761,380 |
| Shimadzu Corp. (Japan) | 1,300 | 40,247 |
| STMicroelectronics NV (France) | 2,336 | 116,147 |
| TDK Corp. (Japan) | 2,700 | 104,547 |
| Thales SA (France) | 593 | 88,780 |
| Trimble Inc. † | 621 | 32,876 |
| | | 4,401,305 |
| Energy (2.8%) | | |
| APA Corp. | 1,779 | 60,788 |
| BP PLC (United Kingdom) | 28,093 | 163,531 |
| Cheniere Energy, Inc. | 2,597 | 395,679 |
| Chevron Corp. | 446 | 70,178 |
| ConocoPhillips | 581 | 60,197 |
| Equinor ASA (Norway) | 3,146 | 91,476 |
| Exxon Mobil Corp. | 9,592 | 1,028,742 |
| Marathon Oil Corp. | 14,290 | 328,956 |
| Marathon Petroleum Corp. | 2,960 | 345,136 |
| OMV AG (Austria) | 557 | 23,607 |
| Repsol SA (Spain) | 6,710 | 97,602 |
| Schlumberger, Ltd. | 1,335 | 65,575 |
| Shell PLC (London Exchange) (United Kingdom) | 935 | 27,816 |
| Valero Energy Corp. | 537 | 62,990 |
| | | 2,822,273 |
| Entertainment (0.1%) | | |
| Dolby Laboratories, Inc. Class A | 776 | 64,936 |
| | | 64,936 |
| Financials (9.5%) | | |
| 3i Group PLC (United Kingdom) | 4,652 | 115,118 |
| Affiliated Managers Group, Inc. | 419 | 62,804 |
| Allianz SE (Germany) | 214 | 49,786 |
| Ally Financial, Inc. | 1,120 | 30,251 |
| American Express Co. | 621 | 108,178 |
| American Financial Group, Inc. | 549 | 65,194 |
| American International Group, Inc. | 9,579 | 551,176 |
| Ameriprise Financial, Inc. | 1,009 | 335,149 |
| Apartment Income REIT Corp. R | 1,696 | 61,209 |
| Apollo Global Management, Inc. | 825 | 63,368 |
| AvalonBay Communities, Inc. R | 335 | 63,405 |
| Aviva PLC (United Kingdom) | 11,240 | 56,414 |
| AXA SA (France) | 383 | 11,295 |
| |
| 4 Putnam VT Global Asset Allocation Fund |
| | |
| COMMON STOCKS (76.1%)* cont. | Shares | Value |
| | | |
| Financials cont. | | |
| Banco Bilbao Vizcaya Argentaria SA (Spain) | 18,002 | $138,135 |
| Bank Hapoalim MB (Israel) | 1,686 | 13,819 |
| Bank Leumi Le-Israel BM (Israel) | 9,598 | 71,444 |
| Bank of Ireland Group PLC (Ireland) | 4,757 | 45,358 |
| Bank of New York Mellon Corp. (The) | 1,485 | 66,112 |
| Berkshire Hathaway, Inc. Class B † | 624 | 212,784 |
| Brixmor Property Group, Inc. R | 5,015 | 110,330 |
| Camden Property Trust R | 541 | 58,899 |
| Capital One Financial Corp. | 557 | 60,919 |
| Charles Schwab Corp. (The) | 1,174 | 66,542 |
| Chubb, Ltd. | 319 | 61,427 |
| Citigroup, Inc. | 11,540 | 531,302 |
| Corebridge Financial, Inc. | 3,664 | 64,706 |
| DBS Group Holdings, Ltd. (Singapore) | 4,600 | 107,559 |
| Discover Financial Services | 3,786 | 442,394 |
| DNB Bank ASA (Norway) | 466 | 8,713 |
| East West Bancorp, Inc. | 1,269 | 66,991 |
| Equitable Holdings, Inc. | 9,333 | 253,484 |
| Equity Lifestyle Properties, Inc. R | 931 | 62,275 |
| Equity Residential R | 967 | 63,793 |
| Eurazeo SE (France) | 188 | 13,222 |
| Fifth Third Bancorp | 2,380 | 62,380 |
| First Industrial Realty Trust, Inc. R | 1,162 | 61,168 |
| Gaming and Leisure Properties, Inc. R | 1,262 | 61,157 |
| Gjensidige Forsikring ASA (Norway) | 612 | 9,796 |
| Goldman Sachs Group, Inc. (The) | 952 | 307,058 |
| Goodman Group (Australia) R | 7,002 | 93,796 |
| Healthpeak Properties, Inc. R | 9,664 | 194,246 |
| Hong Kong Exchanges and Clearing, Ltd. | | |
| (Hong Kong) | 300 | 11,409 |
| Intercontinental Exchange, Inc. | 591 | 66,830 |
| Investor AB Class B (Sweden) | 6,252 | 125,007 |
| Israel Discount Bank, Ltd. Class A (Israel) | 6,078 | 30,173 |
| Japan Post Holdings Co., Ltd. (Japan) | 13,300 | 95,634 |
| Jefferies Financial Group, Inc. | 4,551 | 150,957 |
| JPMorgan Chase & Co. | 7,293 | 1,060,694 |
| Julius Baer Group, Ltd. (Switzerland) | 1,254 | 78,935 |
| Lloyds Banking Group PLC (United Kingdom) | 205,537 | 113,784 |
| Marsh & McLennan Cos., Inc. | 363 | 68,273 |
| MetLife, Inc. | 7,796 | 440,708 |
| MGIC Investment Corp. | 6,146 | 97,045 |
| Mizrahi Tefahot Bank, Ltd. (Israel) | 987 | 32,833 |
| Muenchener Rueckversicherungs-Gesellschaft | | |
| AG in Muenchen (Germany) | 62 | 23,246 |
| Nasdaq, Inc. | 1,135 | 56,580 |
| National Australia Bank, Ltd. (Australia) | 6,407 | 113,088 |
| National Retail Properties, Inc. | 1,429 | 61,147 |
| NN Group NV (Netherlands) | 257 | 9,510 |
| Nordea Bank ABP (Finland) | 11,691 | 127,150 |
| Open House Co., Ltd. (Japan) | 300 | 10,822 |
| Prologis, Inc. R | 521 | 63,890 |
| Public Storage R | 217 | 63,338 |
| Regency Centers Corp. R | 1,036 | 63,994 |
| Reinsurance Group of America, Inc. | 1,111 | 154,085 |
| Rithm Capital Corp. R | 7,189 | 67,217 |
| Sampo Oyj Class A (Finland) | 2,096 | 94,048 |
| SEI Investments Co. | 492 | 29,333 |
| Sekisui Chemical Co., Ltd. (Japan) | 1,200 | 17,358 |
| Simon Property Group, Inc. R | 1,641 | 189,503 |
| SLM Corp. | 3,562 | 58,132 |
| | |
| COMMON STOCKS (76.1%)* cont. | Shares | Value |
| | | |
| Financials cont. | | |
| Synchrony Financial | 2,214 | $75,099 |
| UBS Group AG (Switzerland) | 6,600 | 133,431 |
| Unum Group | 1,441 | 68,736 |
| Vicinity, Ltd. (Australia) R | 26,103 | 32,088 |
| Virtu Financial, Inc. Class A | 3,818 | 65,250 |
| W.R. Berkley Corp. | 1,035 | 61,645 |
| Wells Fargo & Co. | 11,693 | 499,057 |
| Zurich Insurance Group AG (Switzerland) | 98 | 46,523 |
| | | 9,439,708 |
| Gaming and lottery (0.3%) | | |
| Aristocrat Leisure, Ltd. (Australia) | 4,192 | 108,550 |
| Boyd Gaming Corp. | 1,018 | 70,619 |
| DraftKings, Inc. Class A † | 2,550 | 67,754 |
| La Francaise des Jeux SAEM (France) | 402 | 15,809 |
| | | 262,732 |
| Health care (9.9%) | | |
| Abbott Laboratories | 9,132 | 995,571 |
| AbbVie, Inc. | 1,880 | 253,292 |
| Amgen, Inc. | 301 | 66,828 |
| AstraZeneca PLC (United Kingdom) | 331 | 47,401 |
| Becton, Dickinson and Co. | 262 | 69,171 |
| Bio-Rad Laboratories, Inc. Class A † | 158 | 59,901 |
| bioMerieux (France) | 207 | 21,711 |
| Boston Scientific Corp. † | 1,363 | 73,725 |
| Bristol-Myers Squibb Co. | 7,642 | 488,706 |
| Cardinal Health, Inc. | 5,198 | 491,575 |
| Cigna Corp. | 907 | 254,504 |
| CVS Health Corp. | 9,000 | 622,170 |
| Danaher Corp. | 268 | 64,320 |
| Edwards Lifesciences Corp. † | 809 | 76,313 |
| Elevance Health, Inc. | 640 | 284,346 |
| Eli Lilly and Co. | 2,648 | 1,241,859 |
| Exelixis, Inc. † | 3,195 | 61,056 |
| GE HealthCare Technologies, Inc. | 429 | 34,852 |
| GlaxoSmithKline PLC (United Kingdom) | 8,355 | 147,363 |
| HCA Healthcare, Inc. | 240 | 72,835 |
| Hologic, Inc. † | 805 | 65,181 |
| Humana, Inc. | 112 | 50,079 |
| Illumina, Inc. † | 155 | 29,061 |
| Incyte Corp. † | 1,113 | 69,284 |
| Ipsen SA (France) | 229 | 27,537 |
| IQVIA Holdings, Inc. † | 324 | 72,825 |
| Johnson & Johnson | 380 | 62,898 |
| McKesson Corp. | 163 | 69,652 |
| Medtronic PLC | 785 | 69,159 |
| Merck & Co., Inc. | 9,154 | 1,056,280 |
| Merck KGaA (Germany) | 186 | 30,759 |
| Mettler-Toledo International, Inc. † | 48 | 62,959 |
| Molina Healthcare, Inc. † | 211 | 63,562 |
| Novartis AG (Switzerland) | 2,294 | 230,669 |
| Novo Nordisk A/S Class B (Denmark) | 1,692 | 272,614 |
| Olympus Corp. (Japan) | 3,300 | 52,235 |
| Ono Pharmaceutical Co., Ltd. (Japan) | 2,600 | 47,143 |
| Pfizer, Inc. | 8,893 | 326,195 |
| Regeneron Pharmaceuticals, Inc. † | 78 | 56,046 |
| ResMed, Inc. | 300 | 65,550 |
| Roche Holding AG (Switzerland) | 720 | 220,010 |
| Sonic Healthcare, Ltd. (Australia) | 3,072 | 73,069 |
| Sonova Holding AG (Switzerland) | 110 | 29,274 |
| Teladoc Health, Inc. † | 2,524 | 63,908 |
| |
| Putnam VT Global Asset Allocation Fund 5 |
| | |
| COMMON STOCKS (76.1%)* cont. | Shares | Value |
| | | |
| Health care cont. | | |
| Thermo Fisher Scientific, Inc. | 119 | $62,088 |
| UnitedHealth Group, Inc. | 427 | 205,233 |
| Vertex Pharmaceuticals, Inc. † | 2,396 | 843,176 |
| Viatris, Inc. | 3,325 | 33,184 |
| Zimmer Biomet Holdings, Inc. | 481 | 70,034 |
| | | 9,807,163 |
| Homebuilding (0.6%) | | |
| NVR, Inc. † | 15 | 95,259 |
| PulteGroup, Inc. | 922 | 71,621 |
| Toll Brothers, Inc. | 4,932 | 389,973 |
| | | 556,853 |
| Household furniture and appliances (—%) | | |
| Rational AG (Germany) | 18 | 13,022 |
| | | 13,022 |
| Lodging/Tourism (0.2%) | | |
| Host Hotels & Resorts, Inc. R | 3,607 | 60,706 |
| Marriott International, Inc./MD Class A | 388 | 71,272 |
| MGM Resorts International | 1,539 | 67,593 |
| | | 199,571 |
| Media (1.2%) | | |
| FactSet Research Systems, Inc. | 164 | 65,707 |
| Informa PLC (United Kingdom) | 9,658 | 89,049 |
| Netflix, Inc. † | 2,287 | 1,007,401 |
| Walt Disney Co. (The) † | 692 | 61,782 |
| | | 1,223,939 |
| Publishing (—%) | | |
| Wolters Kluwer NV (Netherlands) | 156 | 19,797 |
| | | 19,797 |
| Retail (3.5%) | | |
| Amazon.com, Inc. † | 14,314 | 1,865,973 |
| AutoZone, Inc. † | 200 | 498,672 |
| Bath & Body Works, Inc. | 1,776 | 66,600 |
| Home Depot, Inc. (The) | 191 | 59,332 |
| Industria de Diseno Textil SA (Spain) | 3,548 | 137,286 |
| JD Sports Fashion PLC (United Kingdom) | 25,812 | 47,861 |
| Lowe’s Cos., Inc. | 316 | 71,321 |
| Lululemon Athletica, Inc. (Canada) † | 181 | 68,509 |
| O’Reilly Automotive, Inc. † | 98 | 93,619 |
| Tapestry, Inc. | 1,434 | 61,375 |
| TJX Cos., Inc. (The) | 783 | 66,391 |
| Walmart, Inc. | 2,631 | 413,541 |
| | | 3,450,480 |
| Semiconductor (0.4%) | | |
| Applied Materials, Inc. | 724 | 104,647 |
| ASML Holding NV (Netherlands) | 194 | 140,352 |
| KLA Corp. | 209 | 101,369 |
| Lam Research Corp. | 95 | 61,072 |
| | | 407,440 |
| Software (5.7%) | | |
| Adobe, Inc. † | 1,566 | 765,758 |
| Atlassian Corp. Class A † | 366 | 61,418 |
| Autodesk, Inc. † | 341 | 69,772 |
| Cadence Design Systems, Inc. † | 3,725 | 873,587 |
| HubSpot, Inc. † | 127 | 67,575 |
| Intuit, Inc. | 291 | 133,333 |
| Manhattan Associates, Inc. † | 395 | 78,953 |
| Microsoft Corp. | 9,623 | 3,277,016 |
| ROBLOX Corp. Class A † | 1,774 | 71,492 |
| Square Enix Holdings Co., Ltd. (Japan) | 1,400 | 65,187 |
| TIS, Inc. (Japan) | 800 | 20,044 |
| Wix.com, Ltd. (Israel) † | 1,880 | 147,091 |
| Workday, Inc. Class A † | 357 | 80,643 |
| | | 5,711,869 |
| | |
| COMMON STOCKS (76.1%)* cont. | Shares | Value |
| | | |
| Technology services (5.3%) | | |
| Alphabet, Inc. Class A † | 21,890 | $2,620,233 |
| DocuSign, Inc. † | 1,224 | 62,534 |
| eBay, Inc. | 12,551 | 560,904 |
| Fidelity National Information Services, Inc. | 5,497 | 300,686 |
| GoDaddy, Inc. Class A † | 836 | 62,809 |
| Leidos Holdings, Inc. | 2,827 | 250,133 |
| Meta Platforms, Inc. Class A † | 4,394 | 1,260,990 |
| Spotify Technology SA (Sweden) † | 414 | 66,468 |
| Western Union Co. (The) | 5,252 | 61,606 |
| Zebra Technologies Corp. Class A † | 243 | 71,887 |
| | | 5,318,250 |
| Textiles (0.2%) | | |
| Capri Holdings, Ltd. † | 1,670 | 59,936 |
| Hermes International (France) | 68 | 147,661 |
| | | 207,597 |
| Toys (0.2%) | | |
| Bandai Namco Holdings, Inc. (Japan) | 4,400 | 101,813 |
| Nintendo Co., Ltd. (Japan) | 2,900 | 131,915 |
| | | 233,728 |
| Transportation (1.1%) | | |
| A.P. Moeller-Maersck A/S Class B (Denmark) | 7 | 12,285 |
| CSX Corp. | 14,717 | 501,850 |
| Delta Air Lines, Inc. † | 1,715 | 81,531 |
| Deutsche Lufthansa AG (Germany) † | 2,668 | 27,305 |
| Deutsche Post AG (Germany) | 2,221 | 108,406 |
| FedEx Corp. | 266 | 65,941 |
| Kongsberg Gruppen ASA (Norway) | 304 | 13,827 |
| Nippon Yusen (Japan) | 2,100 | 46,667 |
| Norfolk Southern Corp. | 293 | 66,441 |
| Qantas Airways, Ltd. (voting rights) (Australia) † | 15,392 | 63,825 |
| SITC International Holdings Co., Ltd. (Hong Kong) | 3,000 | 5,506 |
| Union Pacific Corp. | 324 | 66,297 |
| | | 1,059,881 |
| Utilities and power (2.1%) | | |
| AES Corp. (The) | 3,012 | 62,439 |
| American Electric Power Co., Inc. | 714 | 60,119 |
| Constellation Energy Corp. | 3,884 | 355,580 |
| Dominion Energy, Inc. | 1,179 | 61,060 |
| DTE Energy Co. | 565 | 62,161 |
| Duke Energy Corp. | 676 | 60,664 |
| E.ON SE (Germany) | 9,469 | 120,684 |
| Edison International | 915 | 63,547 |
| Enel SpA (Italy) | 16,842 | 113,355 |
| Eversource Energy | 855 | 60,637 |
| Exelon Corp. | 1,460 | 59,480 |
| FirstEnergy Corp. | 1,628 | 63,297 |
| National Guel Gas co. | 1,146 | 58,859 |
| NextEra Energy, Inc. | 883 | 65,519 |
| NRG Energy, Inc. | 1,812 | 67,751 |
| PPL Corp. | 1,213 | 32,096 |
| Public Service Enterprise Group, Inc. | 984 | 61,608 |
| RWE AG (Germany) | 2,473 | 107,591 |
| Southern Co. (The) | 855 | 60,064 |
| Texas Competitive Electric Holdings Co., LLC/ | | |
| TCEH Finance, Inc. (Rights) † | 1,923 | 2,212 |
| Tokyo Gas Co., Ltd. (Japan) | 4,700 | 102,684 |
| Vistra Corp. | 9,468 | 248,535 |
| WEC Energy Group, Inc. | 716 | 63,180 |
| Xcel Energy, Inc. | 1,013 | 62,978 |
| | | 2,076,100 |
| | | |
| Total common stocks (cost $52,990,008) | | $75,653,176 |
| |
| 6 Putnam VT Global Asset Allocation Fund |
| | |
| U.S. GOVERNMENT AND AGENCY | Principal | |
| MORTGAGE OBLIGATIONS (22.1%)* | amount | Value |
| | |
| U.S. Government Guaranteed Mortgage Obligations (1.9%) | |
| Government National Mortgage Association | | |
| Pass-Through Certificates | | |
| 6.50%, with due dates from | | |
| 5/20/37 to 11/20/39 | $110,211 | $115,292 |
| 3.00%, TBA, 7/1/53 | 1,000,000 | 893,354 |
| 3.00%, with due dates from 8/20/49 to 4/20/51 | 986,668 | 888,514 |
| | | 1,897,160 |
| U.S. Government Agency Mortgage Obligations (20.2%) | |
| Federal Home Loan Mortgage Corporation | | |
| Pass-Through Certificates | | |
| 6.50%, 5/1/53 | 24,980 | 25,585 |
| 3.00%, 1/1/48 | 620,500 | 554,109 |
| Federal National Mortgage Association | | |
| Pass-Through Certificates | | |
| 5.00%, 9/1/52 | 958,196 | 942,764 |
| 4.00%, 1/1/57 | 34,384 | 32,481 |
| 4.00%, 1/1/49 | 96,337 | 91,486 |
| 3.00%, with due dates from 4/1/46 to 11/1/48 | 407,435 | 364,755 |
| 2.50%, with due dates from 5/1/51 to 7/1/51 | 1,646,638 | 1,396,314 |
| Uniform Mortgage-Backed Securities | | |
| 6.00%, TBA, 7/1/53 | 4,000,000 | 3,391,564 |
| 5.50%, TBA, 8/1/53 | 1,000,000 | 995,234 |
| 5.50%, TBA, 7/1/53 | 2,000,000 | 1,990,312 |
| 5.00%, TBA, 7/1/53 | 2,000,000 | 1,959,453 |
| 5.00%, TBA, 8/1/53 | 1,000,000 | 980,078 |
| 4.50%, TBA, 8/1/53 | 1,000,000 | 961,563 |
| 4.50%, TBA, 7/1/53 | 2,000,000 | 1,922,812 |
| 3.50%, TBA, 7/1/53 | 1,000,000 | 911,211 |
| 3.50%, TBA, 8/1/53 | 1,000,000 | 911,875 |
| 2.50%, TBA, 8/1/53 | 2,000,000 | 1,697,343 |
| 2.50%, TBA, 7/1/38 | 1,000,000 | 910,000 |
| | | 20,038,939 |
| Total U.S. government and agency mortgage obligations | |
| (cost $22,580,714) | | $21,936,099 |
| | |
| | Principal | |
| CORPORATE BONDS AND NOTES (12.4%)* | amount | Value |
| | | |
| Basic materials (0.9%) | | |
| ArcelorMittal SA sr. unsec. unsub. notes 7.00%, | | |
| 10/15/39 (France) | $20,000 | $20,873 |
| ATI, Inc. sr. unsec. notes 4.875%, 10/1/29 | 5,000 | 4,501 |
| ATI, Inc. sr. unsec. sub. notes 5.875%, 12/1/27 | 15,000 | 14,517 |
| Avient Corp. 144A sr. unsec. unsub. notes | | |
| 7.125%, 8/1/30 | 10,000 | 10,114 |
| Beacon Roofing Supply, Inc. 144A company | | |
| guaranty sr. notes 4.50%, 11/15/26 | 5,000 | 4,745 |
| Beacon Roofing Supply, Inc. 144A sr. unsec. | | |
| unsub. notes 4.125%, 5/15/29 | 10,000 | 8,850 |
| Big River Steel, LLC/BRS Finance Corp. 144A sr. | | |
| notes 6.625%, 1/31/29 | 13,000 | 12,842 |
| Boise Cascade Co. 144A company guaranty sr. | | |
| unsec. notes 4.875%, 7/1/30 | 15,000 | 13,560 |
| Builders FirstSource, Inc. 144A company | | |
| guaranty sr. unsec. bonds 6.375%, 6/15/32 | 5,000 | 4,968 |
| Builders FirstSource, Inc. 144A company | | |
| guaranty sr. unsec. bonds 4.25%, 2/1/32 | 5,000 | 4,351 |
| Cabot Corp. sr. unsec. bonds 5.00%, 6/30/32 | 15,000 | 14,358 |
| Celanese US Holdings, LLC company guaranty | | |
| sr. unsec. bonds 6.379%, 7/15/32 (Germany) | 15,000 | 15,130 |
| Celanese US Holdings, LLC company guaranty | | |
| sr. unsec. notes 6.33%, 7/15/29 (Germany) | 15,000 | 14,897 |
| | |
| | Principal | |
| CORPORATE BONDS AND NOTES (12.4%)* cont. | amount | Value |
| | | |
| Basic materials cont. | | |
| Celanese US Holdings, LLC company guaranty | | |
| sr. unsec. notes 6.165%, 7/15/27 (Germany) | $70,000 | $69,637 |
| Celanese US Holdings, LLC company guaranty | | |
| sr. unsec. notes 1.40%, 8/5/26 (Germany) | 15,000 | 12,998 |
| CF Industries, Inc. company guaranty sr. unsec. | | |
| bonds 4.95%, 6/1/43 | 50,000 | 43,283 |
| Commercial Metals Co. sr. unsec. notes | | |
| 4.375%, 3/15/32 | 5,000 | 4,321 |
| Commercial Metals Co. sr. unsec. notes | | |
| 4.125%, 1/15/30 | 10,000 | 8,900 |
| Compass Minerals International, Inc. | | |
| 144A company guaranty sr. unsec. notes | | |
| 6.75%, 12/1/27 | 10,000 | 9,641 |
| CP Atlas Buyer, Inc. 144A sr. unsec. notes | | |
| 7.00%, 12/1/28 | 5,000 | 3,925 |
| FMC Corp. sr. unsec. unsub. notes 5.65%, 5/18/33 | 20,000 | 19,560 |
| Freeport-McMoRan, Inc. company guaranty sr. | | |
| unsec. notes 4.375%, 8/1/28 (Indonesia) | 10,000 | 9,435 |
| Freeport-McMoRan, Inc. company guaranty sr. | | |
| unsec. unsub. notes 5.45%, 3/15/43 (Indonesia) | 10,000 | 9,324 |
| Glencore Funding, LLC 144A company guaranty | | |
| sr. unsec. notes 2.50%, 9/1/30 | 34,000 | 27,840 |
| Graphic Packaging International, LLC | | |
| 144A company guaranty sr. unsec. notes | | |
| 3.75%, 2/1/30 | 5,000 | 4,313 |
| Graphic Packaging International, LLC | | |
| 144A company guaranty sr. unsec. notes | | |
| 3.50%, 3/1/29 | 5,000 | 4,372 |
| HudBay Minerals, Inc. 144A company guaranty | | |
| sr. unsec. notes 6.125%, 4/1/29 (Canada) | 10,000 | 9,208 |
| Huntsman International, LLC sr. unsec. bonds | | |
| 2.95%, 6/15/31 | 15,000 | 11,975 |
| Ingevity Corp. 144A company guaranty sr. unsec. | | |
| notes 3.875%, 11/1/28 | 10,000 | 8,513 |
| Intelligent Packaging Holdco Issuer LP 144A sr. | | |
| unsec. notes 9.00%, 1/15/26 (Canada) ‡‡ | 5,000 | 3,769 |
| Intelligent Packaging, Ltd., Finco, Inc./Intelligent | | |
| Packaging, Ltd. Co-Issuer, LLC 144A sr. notes | | |
| 6.00%, 9/15/28 (Canada) | 10,000 | 8,486 |
| International Flavors & Fragrances, Inc. sr. unsec. | | |
| notes 4.45%, 9/26/28 | 20,000 | 18,748 |
| International Flavors & Fragrances, Inc. | | |
| 144A company guaranty sr. unsec. bonds | | |
| 3.468%, 12/1/50 | 5,000 | 3,340 |
| International Flavors & Fragrances, Inc. 144A sr. | | |
| unsec. notes 2.30%, 11/1/30 | 10,000 | 7,924 |
| International Flavors & Fragrances, Inc. 144A sr. | | |
| unsec. notes 1.832%, 10/15/27 | 5,000 | 4,216 |
| Louisiana-Pacific Corp. 144A sr. unsec. notes | | |
| 3.625%, 3/15/29 | 10,000 | 8,754 |
| LSF11 A5 HoldCo, LLC 144A sr. unsec. notes | | |
| 6.625%, 10/15/29 | 15,000 | 12,528 |
| Mauser Packaging Solutions Holding Co. 144A | | |
| company guaranty notes 9.25%, 4/15/27 | 10,000 | 9,230 |
| Mauser Packaging Solutions Holding Co. 144A sr. | | |
| notes 7.875%, 8/15/26 | 15,000 | 14,903 |
| Mercer International, Inc. sr. unsec. notes | | |
| 5.125%, 2/1/29 (Canada) | 10,000 | 7,782 |
| Novelis Corp. 144A company guaranty sr. unsec. | | |
| notes 4.75%, 1/30/30 | 35,000 | 31,105 |
| Nutrien, Ltd. sr. unsec. bonds 5.25%, | | |
| 1/15/45 (Canada) | 20,000 | 18,509 |
| |
| Putnam VT Global Asset Allocation Fund 7 |
| | |
| | Principal | |
| CORPORATE BONDS AND NOTES (12.4%)* cont. | amount | Value |
| | | |
| Basic materials cont. | | |
| Nutrien, Ltd. sr. unsec. bonds 4.125%, | | |
| 3/15/35 (Canada) | $25,000 | $21,944 |
| PMHC II, Inc. 144A sr. unsec. notes 9.00%, 2/15/30 | 10,000 | 7,663 |
| SCIH Salt Holdings, Inc. 144A sr. notes | | |
| 4.875%, 5/1/28 | 20,000 | 17,860 |
| SCIH Salt Holdings, Inc. 144A sr. unsec. notes | | |
| 6.625%, 5/1/29 | 15,000 | 12,568 |
| Sherwin-Williams Co. (The) sr. unsec. unsub. | | |
| bonds 3.45%, 6/1/27 | 35,000 | 32,989 |
| TMS International Holding Corp. 144A sr. unsec. | | |
| notes 6.25%, 4/15/29 | 15,000 | 12,600 |
| Trinseo Materials Operating SCA/Trinseo | | |
| Materials Finance, Inc. 144A company guaranty | | |
| sr. unsec. notes 5.125%, 4/1/29 (Luxembourg) | 10,000 | 4,625 |
| Tronox, Inc. 144A company guaranty sr. unsec. | | |
| notes 4.625%, 3/15/29 | 15,000 | 12,466 |
| Univar Solutions USA, Inc. 144A company | | |
| guaranty sr. unsec. notes 5.125%, 12/1/27 | 10,000 | 10,223 |
| Westlake Corp. sr. unsec. bonds 3.125%, 8/15/51 | 40,000 | 25,027 |
| Westlake Corp. sr. unsec. bonds 2.875%, 8/15/41 | 20,000 | 13,308 |
| Westlake Corp. sr. unsec. unsub. notes | | |
| 3.60%, 8/15/26 | 30,000 | 28,153 |
| WestRock MWV, LLC company guaranty sr. | | |
| unsec. unsub. notes 8.20%, 1/15/30 | 30,000 | 34,399 |
| WestRock MWV, LLC company guaranty sr. | | |
| unsec. unsub. notes 7.95%, 2/15/31 | 10,000 | 11,326 |
| WR Grace Holdings, LLC 144A company guaranty | | |
| sr. notes 4.875%, 6/15/27 | 5,000 | 4,637 |
| WR Grace Holdings, LLC 144A sr. notes | | |
| 7.375%, 3/1/31 | 15,000 | 14,700 |
| WR Grace Holdings, LLC 144A sr. unsec. notes | | |
| 5.625%, 8/15/29 | 15,000 | 12,290 |
| | | 827,023 |
| Capital goods (0.7%) | | |
| Adient Global Holdings, Ltd. 144A sr. notes | | |
| 7.00%, 4/15/28 | 5,000 | 5,050 |
| Allison Transmission, Inc. 144A company | | |
| guaranty sr. unsec. bonds 3.75%, 1/30/31 | 5,000 | 4,224 |
| Allison Transmission, Inc. 144A company | | |
| guaranty sr. unsec. notes 4.75%, 10/1/27 | 20,000 | 18,847 |
| Amsted Industries, Inc. 144A company guaranty | | |
| sr. unsec. sub. notes 5.625%, 7/1/27 | 10,000 | 9,672 |
| Amsted Industries, Inc. 144A sr. unsec. bonds | | |
| 4.625%, 5/15/30 | 5,000 | 4,460 |
| Ball Corp. company guaranty sr. unsec. notes | | |
| 3.125%, 9/15/31 | 10,000 | 8,213 |
| Berry Global Escrow Corp. 144A sr. notes | | |
| 4.875%, 7/15/26 | 2,000 | 1,923 |
| Berry Global, Inc. 144A company guaranty sr. | | |
| notes 1.65%, 1/15/27 | 25,000 | 21,565 |
| Berry Global, Inc. 144A company guaranty sr. | | |
| notes 1.57%, 1/15/26 | 44,000 | 39,676 |
| Bombardier, Inc. 144A sr. unsec. notes 7.125%, | | |
| 6/15/26 (Canada) | 15,000 | 14,899 |
| Chart Industries, Inc. 144A company guaranty sr. | | |
| notes 7.50%, 1/1/30 | 15,000 | 15,304 |
| Chart Industries, Inc. 144A company guaranty sr. | | |
| unsec. notes 9.50%, 1/1/31 | 10,000 | 10,610 |
| Clarios Global LP 144A company guaranty sr. | | |
| notes 6.75%, 5/15/25 | 9,000 | 9,006 |
| Clarios Global LP 144A sr. notes 6.75%, 5/15/28 | 5,000 | 4,983 |
| Clean Harbors, Inc. 144A company guaranty sr. | | |
| unsec. unsub. notes 6.375%, 2/1/31 | 5,000 | 5,031 |
| | |
| | Principal | |
| CORPORATE BONDS AND NOTES (12.4%)* cont. | amount | Value |
| | | |
| Capital goods cont. | | |
| Covanta Holding Corp. 144A company guaranty | | |
| sr. unsec. notes 4.875%, 12/1/29 | $15,000 | $12,975 |
| Crown Cork & Seal Co., Inc. company guaranty sr. | | |
| unsec. bonds 7.375%, 12/15/26 | 10,000 | 10,338 |
| Emerald Debt Merger Sub, LLC 144A sr. notes | | |
| 6.625%, 12/15/30 | 10,000 | 9,888 |
| GFL Environmental, Inc. 144A company guaranty | | |
| sr. notes 3.50%, 9/1/28 (Canada) | 5,000 | 4,450 |
| GFL Environmental, Inc. 144A company guaranty | | |
| sr. unsec. notes 4.75%, 6/15/29 (Canada) | 15,000 | 13,704 |
| GFL Environmental, Inc. 144A company guaranty | | |
| sr. unsec. notes 4.00%, 8/1/28 (Canada) | 5,000 | 4,470 |
| Great Lakes Dredge & Dock Corp. 144A company | | |
| guaranty sr. unsec. notes 5.25%, 6/1/29 | 25,000 | 20,881 |
| Honeywell International, Inc. sr. unsec. bonds | | |
| 3.812%, 11/21/47 | 55,000 | 46,811 |
| Howmet Aerospace, Inc. sr. unsec. unsub. bonds | | |
| 5.95%, 2/1/37 | 5,000 | 5,090 |
| Howmet Aerospace, Inc. sr. unsec. unsub. notes | | |
| 3.00%, 1/15/29 | 35,000 | 30,590 |
| Johnson Controls International PLC sr. unsec. | | |
| bonds 4.95%, 7/2/64 | 65,000 | 57,336 |
| Johnson Controls International PLC sr. unsec. | | |
| notes 3.90%, 2/14/26 | 6,000 | 5,769 |
| L3Harris Technologies, Inc. sr. unsec. bonds | | |
| 1.80%, 1/15/31 | 5,000 | 3,957 |
| L3Harris Technologies, Inc. sr. unsec. notes | | |
| 3.85%, 12/15/26 | 24,000 | 22,868 |
| L3Harris Technologies, Inc. sr. unsec. sub. notes | | |
| 4.40%, 6/15/28 | 18,000 | 17,300 |
| Madison IAQ, LLC 144A sr. notes 4.125%, 6/30/28 | 5,000 | 4,401 |
| Madison IAQ, LLC 144A sr. unsec. notes | | |
| 5.875%, 6/30/29 | 15,000 | 12,149 |
| MajorDrive Holdings IV, LLC 144A sr. unsec. notes | | |
| 6.375%, 6/1/29 | 25,000 | 19,851 |
| Oshkosh Corp. sr. unsec. sub. notes | | |
| 4.60%, 5/15/28 | 9,000 | 8,664 |
| Otis Worldwide Corp. sr. unsec. notes | | |
| 2.565%, 2/15/30 | 15,000 | 12,932 |
| Owens-Brockway Glass Container, Inc. | | |
| 144A company guaranty sr. unsec. notes | | |
| 7.25%, 5/15/31 | 15,000 | 15,188 |
| Panther BF Aggregator 2 LP/Panther Finance | | |
| Co., Inc. 144A company guaranty sr. unsec. notes | | |
| 8.50%, 5/15/27 | 15,000 | 15,025 |
| Raytheon Technologies Corp. sr. unsec. bonds | | |
| 4.875%, 10/15/40 | 20,000 | 19,045 |
| Raytheon Technologies Corp. sr. unsec. notes | | |
| 5.15%, 2/27/33 | 5,000 | 5,068 |
| Raytheon Technologies Corp. sr. unsec. unsub. | | |
| notes 4.125%, 11/16/28 | 5,000 | 4,816 |
| Ritchie Bros Holdings, Inc. 144A company | | |
| guaranty sr. notes 6.75%, 3/15/28 | 5,000 | 5,050 |
| Ritchie Bros Holdings, Inc. 144A company | | |
| guaranty sr. unsec. unsub. notes 7.75%, 3/15/31 | 5,000 | 5,200 |
| Roller Bearing Co. of America, Inc. 144A sr. notes | | |
| 4.375%, 10/15/29 | 15,000 | 13,439 |
| Staples, Inc. 144A sr. notes 7.50%, 4/15/26 | 10,000 | 8,259 |
| Terex Corp. 144A company guaranty sr. unsec. | | |
| notes 5.00%, 5/15/29 | 10,000 | 9,297 |
| TransDigm, Inc. company guaranty sr. unsec. | | |
| sub. notes 6.375%, 6/15/26 | 10,000 | 9,870 |
| |
| 8 Putnam VT Global Asset Allocation Fund |
| | |
| | Principal | |
| CORPORATE BONDS AND NOTES (12.4%)* cont. | amount | Value |
| | | |
| Capital goods cont. | | |
| TransDigm, Inc. company guaranty sr. unsec. | | |
| sub. notes 5.50%, 11/15/27 | $10,000 | $9,432 |
| TransDigm, Inc. company guaranty sr. unsec. | | |
| sub. notes 4.875%, 5/1/29 | 10,000 | 8,933 |
| TransDigm, Inc. company guaranty sr. unsec. | | |
| sub. notes 4.625%, 1/15/29 | 10,000 | 8,896 |
| TransDigm, Inc. 144A company guaranty sr. | | |
| notes 6.25%, 3/15/26 | 20,000 | 19,902 |
| TransDigm, Inc. 144A sr. notes 6.75%, 8/15/28 | 10,000 | 10,025 |
| Vertiv Group Corp. 144A company guaranty sr. | | |
| notes 4.125%, 11/15/28 | 15,000 | 13,515 |
| Waste Connections, Inc. sr. unsec. bonds | | |
| 3.20%, 6/1/32 | 2,000 | 1,743 |
| Waste Connections, Inc. sr. unsec. sub. bonds | | |
| 3.50%, 5/1/29 | 30,000 | 27,593 |
| Waste Pro USA, Inc. 144A sr. unsec. notes | | |
| 5.50%, 2/15/26 | 5,000 | 4,635 |
| WESCO Distribution, Inc. 144A company | | |
| guaranty sr. unsec. unsub. notes 7.25%, 6/15/28 | 20,000 | 20,401 |
| | | 733,219 |
| Communication services (1.2%) | | |
| American Tower Corp. sr. unsec. bonds | | |
| 2.70%, 4/15/31 R | 5,000 | 4,146 |
| American Tower Corp. sr. unsec. sub. notes | | |
| 2.75%, 1/15/27 R | 100,000 | 90,977 |
| AT&T, Inc. company guaranty sr. unsec. unsub. | | |
| notes 2.30%, 6/1/27 | 9,000 | 8,094 |
| AT&T, Inc. sr. unsec. bonds 3.55%, 9/15/55 | 41,000 | 28,703 |
| AT&T, Inc. sr. unsec. unsub. bonds 2.55%, 12/1/33 | 60,000 | 47,129 |
| AT&T, Inc. sr. unsec. unsub. notes 4.75%, 5/15/46 | 77,000 | 67,967 |
| AT&T, Inc. sr. unsec. unsub. notes 4.25%, 3/1/27 | 7,000 | 6,805 |
| CCO Holdings, LLC/CCO Holdings Capital Corp. | | |
| sr. unsec. bonds 4.50%, 5/1/32 | 10,000 | 7,985 |
| CCO Holdings, LLC/CCO Holdings Capital Corp. | | |
| 144A sr. unsec. bonds 5.375%, 6/1/29 | 8,000 | 7,233 |
| CCO Holdings, LLC/CCO Holdings Capital Corp. | | |
| 144A sr. unsec. bonds 4.75%, 3/1/30 | 45,000 | 38,479 |
| CCO Holdings, LLC/CCO Holdings Capital Corp. | | |
| 144A sr. unsec. notes 4.25%, 2/1/31 | 10,000 | 8,090 |
| Charter Communications Operating, | | |
| LLC/Charter Communications Operating | | |
| Capital Corp. company guaranty sr. notes | | |
| 2.25%, 1/15/29 | 27,000 | 22,482 |
| Charter Communications Operating, LLC/ | | |
| Charter Communications Operating Capital | | |
| Corp. company guaranty sr. sub. bonds | | |
| 4.80%, 3/1/50 | 10,000 | 7,545 |
| Charter Communications Operating, LLC/ | | |
| Charter Communications Operating Capital | | |
| Corp. company guaranty sr. sub. notes | | |
| 4.908%, 7/23/25 | 44,000 | 43,148 |
| Charter Communications Operating, LLC/ | | |
| Charter Communications Operating Capital | | |
| Corp. sr. bonds 3.70%, 4/1/51 | 110,000 | 69,507 |
| Comcast Corp. company guaranty sr. unsec. | | |
| notes 3.45%, 2/1/50 | 19,000 | 14,460 |
| Comcast Corp. company guaranty sr. unsec. | | |
| unsub. bonds 3.999%, 11/1/49 | 7,000 | 5,778 |
| Cox Communications, Inc. 144A sr. unsec. bonds | | |
| 3.50%, 8/15/27 | 35,000 | 32,546 |
| Crown Castle, Inc. sr. unsec. bonds | | |
| 3.80%, 2/15/28 R | 25,000 | 23,301 |
| | |
| | Principal | |
| CORPORATE BONDS AND NOTES (12.4%)* cont. | amount | Value |
| | | |
| Communication services cont. | | |
| Crown Castle, Inc. sr. unsec. bonds | | |
| 3.65%, 9/1/27 R | $34,000 | $31,779 |
| Crown Castle, Inc. sr. unsec. sub. notes | | |
| 1.05%, 7/15/26 R | 23,000 | 20,135 |
| Crown Castle, Inc. sr. unsec. unsub. bonds | | |
| 3.70%, 6/15/26 R | 12,000 | 11,399 |
| Deutsche Telekom International Finance | | |
| BV company guaranty sr. unsec. unsub. bonds | | |
| 8.75%, 6/15/30 (Netherlands) | 73,000 | 87,424 |
| DISH DBS Corp. company guaranty sr. unsec. | | |
| notes 7.75%, 7/1/26 | 5,000 | 3,065 |
| DISH DBS Corp. company guaranty sr. unsec. | | |
| unsub. notes 5.875%, 11/15/24 | 10,000 | 8,746 |
| DISH DBS Corp. company guaranty sr. unsec. | | |
| unsub. notes 5.125%, 6/1/29 | 10,000 | 4,643 |
| DISH DBS Corp. 144A company guaranty sr. | | |
| notes 5.75%, 12/1/28 | 10,000 | 7,438 |
| DISH DBS Corp. 144A company guaranty sr. | | |
| notes 5.25%, 12/1/26 | 5,000 | 4,011 |
| Embarq Corp. sr. unsec. unsub. bonds | | |
| 7.995%, 6/1/36 | 20,000 | 12,089 |
| Frontier Communications Corp. 144A company | | |
| guaranty sr. notes 5.875%, 10/15/27 | 15,000 | 13,766 |
| Frontier Communications Holdings, LLC 144A | | |
| company guaranty sr. notes 8.75%, 5/15/30 | 10,000 | 9,774 |
| Level 3 Financing, Inc. 144A company guaranty | | |
| sr. notes 10.50%, 5/15/30 | 5,500 | 5,580 |
| Level 3 Financing, Inc. 144A company guaranty | | |
| sr. unsec. notes 4.25%, 7/1/28 | 15,000 | 9,658 |
| Sprint Capital Corp. company guaranty sr. | | |
| unsec. unsub. notes 6.875%, 11/15/28 | 25,000 | 26,500 |
| T-Mobile USA, Inc. company guaranty sr. bonds | | |
| 2.25%, 11/15/31 | 60,000 | 48,002 |
| T-Mobile USA, Inc. company guaranty sr. notes | | |
| 3.875%, 4/15/30 | 7,000 | 6,449 |
| T-Mobile USA, Inc. company guaranty sr. notes | | |
| 3.75%, 4/15/27 | 78,000 | 73,835 |
| T-Mobile USA, Inc. company guaranty sr. unsec. | | |
| bonds 5.75%, 1/15/54 | 15,000 | 15,491 |
| T-Mobile USA, Inc. company guaranty sr. unsec. | | |
| bonds 5.05%, 7/15/33 | 15,000 | 14,730 |
| T-Mobile USA, Inc. company guaranty sr. unsec. | | |
| bonds 2.875%, 2/15/31 | 10,000 | 8,453 |
| T-Mobile USA, Inc. company guaranty sr. unsec. | | |
| notes 5.375%, 4/15/27 | 10,000 | 9,925 |
| TCI Communications, Inc. sr. unsec. unsub. | | |
| notes 7.125%, 2/15/28 | 65,000 | 70,857 |
| Verizon Communications, Inc. sr. unsec. bonds | | |
| 3.70%, 3/22/61 | 47,000 | 34,179 |
| Verizon Communications, Inc. sr. unsec. notes | | |
| 2.55%, 3/21/31 | 23,000 | 19,203 |
| Verizon Communications, Inc. sr. unsec. unsub. | | |
| notes 4.40%, 11/1/34 | 65,000 | 59,993 |
| Verizon Communications, Inc. sr. unsec. unsub. | | |
| notes 4.329%, 9/21/28 | 76,000 | 73,264 |
| Verizon Communications, Inc. sr. unsec. unsub. | | |
| notes 2.10%, 3/22/28 | 20,000 | 17,569 |
| | | 1,242,332 |
| Conglomerates (—%) | | |
| General Electric Co. jr. unsec. sub. FRN | | |
| (ICE LIBOR USD 3 Month + 3.33%), 8.882%, | | |
| perpetual maturity | 7,000 | 7,000 |
| | | 7,000 |
| |
| Putnam VT Global Asset Allocation Fund 9 |
| | |
| | Principal | |
| CORPORATE BONDS AND NOTES (12.4%)* cont. | amount | Value |
| | | |
| Consumer cyclicals (1.7%) | | |
| ADT Security Corp. 144A sr. notes 4.125%, 8/1/29 | $15,000 | $12,956 |
| Alimentation Couche-Tard, Inc. 144A | | |
| company guaranty sr. unsec. notes 3.55%, | | |
| 7/26/27 (Canada) | 25,000 | 23,125 |
| Alimentation Couche-Tard, Inc. 144A sr. unsec. | | |
| notes 2.95%, 1/25/30 (Canada) | 14,000 | 12,025 |
| AMC Entertainment Holdings, Inc. 144A | | |
| company guaranty sr. notes 7.50%, 2/15/29 | 5,000 | 3,516 |
| American Builders & Contractors Supply Co., Inc. | | |
| 144A sr. notes 4.00%, 1/15/28 | 15,000 | 13,670 |
| American Builders & Contractors Supply Co., Inc. | | |
| 144A sr. unsec. notes 3.875%, 11/15/29 | 10,000 | 8,537 |
| Asbury Automotive Group, Inc. 144A company | | |
| guaranty sr. unsec. notes 4.625%, 11/15/29 | 5,000 | 4,438 |
| Autonation, Inc. sr. unsec. bonds 2.40%, 8/1/31 | 14,000 | 10,621 |
| Bath & Body Works, Inc. company guaranty sr. | | |
| unsec. bonds 6.75%, perpetual maturity | 5,000 | 4,499 |
| Bath & Body Works, Inc. company guaranty sr. | | |
| unsec. notes 7.50%, perpetual maturity | 15,000 | 15,200 |
| Bath & Body Works, Inc. 144A company guaranty | | |
| sr. unsec. unsub. bonds 6.625%, 10/1/30 | 10,000 | 9,654 |
| BCPE Ulysses Intermediate, Inc. 144A sr. unsec. | | |
| notes 7.75%, 4/1/27 ‡‡ | 5,000 | 4,403 |
| Beasley Mezzanine Holdings, LLC 144A company | | |
| guaranty sr. notes 8.625%, 2/1/26 | 10,000 | 6,567 |
| Block, Inc. sr. unsec. notes 3.50%, 6/1/31 | 40,000 | 33,129 |
| BMW US Capital, LLC 144A company guaranty sr. | | |
| unsec. notes 3.95%, 8/14/28 | 35,000 | 33,309 |
| Booking Holdings, Inc. sr. unsec. sub. notes | | |
| 4.625%, 4/13/30 | 25,000 | 24,359 |
| Boyd Gaming Corp. 144A sr. unsec. bonds | | |
| 4.75%, 6/15/31 | 20,000 | 17,867 |
| Caesars Entertainment, Inc. 144A sr. notes | | |
| 7.00%, 2/15/30 | 15,000 | 15,064 |
| Caesars Entertainment, Inc. 144A sr. unsec. | | |
| notes 4.625%, 10/15/29 | 10,000 | 8,732 |
| Caesars Resort Collection, LLC/CRC Finco, Inc. | | |
| 144A company guaranty sr. notes 5.75%, 7/1/25 | 20,000 | 20,236 |
| Camelot Return Merger Sub, Inc. 144A sr. notes | | |
| 8.75%, 8/1/28 | 5,000 | 4,725 |
| Carnival Corp. 144A notes 10.50%, 2/1/26 | 5,000 | 5,256 |
| Carnival Corp. 144A notes 9.875%, 8/1/27 | 5,000 | 5,208 |
| Carnival Corp. 144A sr. unsec. notes | | |
| 5.75%, 3/1/27 | 30,000 | 27,618 |
| Carriage Services, Inc. 144A company guaranty | | |
| sr. unsec. notes 4.25%, 5/15/29 | 10,000 | 8,607 |
| CDI Escrow Issuer, Inc. 144A sr. unsec. notes | | |
| 5.75%, 4/1/30 | 15,000 | 13,931 |
| Cinemark USA, Inc. 144A company guaranty sr. | | |
| unsec. notes 5.875%, 3/15/26 | 5,000 | 4,744 |
| Cinemark USA, Inc. 144A company guaranty sr. | | |
| unsec. notes 5.25%, 7/15/28 | 15,000 | 13,194 |
| Clear Channel Outdoor Holdings, Inc. 144A | | |
| company guaranty sr. unsec. sub. notes | | |
| 7.75%, 4/15/28 | 10,000 | 7,850 |
| D.R. Horton, Inc. company guaranty sr. unsec. | | |
| unsub. notes 1.30%, 10/15/26 | 60,000 | 52,579 |
| Everi Holdings, Inc. 144A company guaranty sr. | | |
| unsec. notes 5.00%, 7/15/29 | 20,000 | 17,515 |
| Ford Motor Co. sr. unsec. unsub. bonds | | |
| 3.25%, 2/12/32 | 65,000 | 51,134 |
| | |
| | Principal | |
| CORPORATE BONDS AND NOTES (12.4%)* cont. | amount | Value |
| | | |
| Consumer cyclicals cont. | | |
| Full House Resorts, Inc. 144A company guaranty | | |
| sr. notes 8.25%, 2/15/28 | $20,000 | $18,720 |
| Garda World Security Corp. 144A sr. notes 7.75%, | | |
| 2/15/28 (Canada) | 5,000 | 4,963 |
| Garda World Security Corp. 144A sr. notes | | |
| 4.625%, 2/15/27 (Canada) | 5,000 | 4,575 |
| Garda World Security Corp. 144A sr. unsec. notes | | |
| 6.00%, 6/1/29 (Canada) | 5,000 | 4,097 |
| Gartner, Inc. 144A company guaranty sr. unsec. | | |
| bonds 3.75%, 10/1/30 | 15,000 | 13,064 |
| Global Payments, Inc. sr. unsec. notes | | |
| 2.15%, 1/15/27 | 6,000 | 5,333 |
| Gray Escrow II, Inc. 144A sr. unsec. bonds | | |
| 5.375%, 11/15/31 | 30,000 | 19,884 |
| GW B-CR Security Corp. 144A sr. unsec. notes | | |
| 9.50%, 11/1/27 (Canada) | 8,000 | 7,729 |
| Hanesbrands, Inc. 144A company guaranty sr. | | |
| unsec. unsub. notes 9.00%, perpetual maturity | 5,000 | 5,038 |
| Hilton Domestic Operating Co., Inc. company | | |
| guaranty sr. unsec. bonds 4.875%, 1/15/30 | 20,000 | 18,648 |
| Hilton Worldwide Finance, LLC/Hilton | | |
| Worldwide Finance Corp. company guaranty sr. | | |
| unsec. notes 4.875%, 4/1/27 | 10,000 | 9,701 |
| Hyatt Hotels Corp. sr. unsec. notes | | |
| 5.75%, 1/30/27 | 12,000 | 11,969 |
| Hyatt Hotels Corp. sr. unsec. unsub. notes | | |
| 4.85%, 3/15/26 | 47,000 | 46,028 |
| iHeartCommunications, Inc. company guaranty | | |
| sr. unsec. notes 8.375%, 5/1/27 | 17,189 | 11,451 |
| Interpublic Group of Cos., Inc. (The) sr. unsec. | | |
| sub. bonds 4.65%, 10/1/28 | 47,000 | 45,214 |
| Interpublic Group of Cos., Inc. (The) sr. unsec. | | |
| unsub. notes 2.40%, 3/1/31 | 10,000 | 8,140 |
| JELD-WEN, Inc. 144A company guaranty sr. sub. | | |
| notes 6.25%, 5/15/25 | 5,000 | 5,044 |
| JELD-WEN, Inc. 144A company guaranty sr. | | |
| unsec. notes 4.875%, 12/15/27 | 10,000 | 8,857 |
| Kontoor Brands, Inc. 144A company guaranty sr. | | |
| unsec. notes 4.125%, 11/15/29 | 15,000 | 12,525 |
| Las Vegas Sands Corp. sr. unsec. unsub. notes | | |
| 3.90%, 8/8/29 | 15,000 | 13,384 |
| LBM Acquisition, LLC 144A company guaranty sr. | | |
| unsec. notes 6.25%, 1/15/29 | 10,000 | 8,273 |
| Lennar Corp. company guaranty sr. unsec. | | |
| unsub. notes 4.75%, 11/29/27 | 38,000 | 36,870 |
| Levi Strauss & Co. 144A sr. unsec. sub. bonds | | |
| 3.50%, 3/1/31 | 25,000 | 20,688 |
| Live Nation Entertainment, Inc. 144A company | | |
| guaranty sr. unsec. sub. notes 5.625%, 3/15/26 | 10,000 | 9,768 |
| Live Nation Entertainment, Inc. 144A sr. notes | | |
| 6.50%, 5/15/27 | 5,000 | 5,027 |
| Macy’s Retail Holdings, LLC 144A company | | |
| guaranty sr. unsec. unsub. bonds | | |
| 6.125%, 3/15/32 | 5,000 | 4,374 |
| Masonite International Corp. 144A company | | |
| guaranty sr. unsec. notes 5.375%, 2/1/28 | 5,000 | 4,766 |
| Masonite International Corp. 144A company | | |
| guaranty sr. unsec. notes 3.50%, 2/15/30 | 10,000 | 8,400 |
| Mattamy Group Corp. 144A sr. unsec. notes | | |
| 4.625%, 3/1/30 (Canada) | 10,000 | 8,645 |
| Mattel, Inc. 144A company guaranty sr. unsec. | | |
| notes 3.75%, 4/1/29 | 10,000 | 8,798 |
| |
| 10 Putnam VT Global Asset Allocation Fund |
| | |
| | Principal | |
| CORPORATE BONDS AND NOTES (12.4%)* cont. | amount | Value |
| | | |
| Consumer cyclicals cont. | | |
| Mattel, Inc. 144A company guaranty sr. unsec. | | |
| notes 3.375%, 4/1/26 | $5,000 | $4,601 |
| McGraw-Hill Education, Inc. 144A sr. notes | | |
| 5.75%, 8/1/28 | 15,000 | 12,997 |
| McGraw-Hill Education, Inc. 144A sr. unsec. | | |
| notes 8.00%, 8/1/29 | 15,000 | 12,803 |
| Michaels Cos., Inc. (The) 144A sr. unsec. notes | | |
| 7.875%, 5/1/29 | 5,000 | 3,369 |
| MIWD Holdco II, LLC/MIWD Finance Corp. | | |
| 144A company guaranty sr. unsec. notes | | |
| 5.50%, 2/1/30 | 5,000 | 4,125 |
| Moody’s Corp. sr. unsec. notes 2.00%, 8/19/31 | 50,000 | 40,286 |
| NCL Corp., Ltd. 144A company guaranty sr. notes | | |
| 5.875%, 2/15/27 | 5,000 | 4,863 |
| NCL Corp., Ltd. 144A sr. unsec. unsub. notes | | |
| 7.75%, 2/15/29 | 5,000 | 4,738 |
| Neptune Bidco US, Inc. 144A sr. notes | | |
| 9.29%, 4/15/29 | 20,000 | 18,360 |
| Netflix, Inc. sr. unsec. unsub. notes | | |
| 5.875%, 11/15/28 | 10,000 | 10,328 |
| Netflix, Inc. sr. unsec. unsub. notes | | |
| 4.375%, 11/15/26 | 15,000 | 14,646 |
| Netflix, Inc. 144A sr. unsec. bonds | | |
| 5.375%, 11/15/29 | 53,000 | 53,196 |
| News Corp. 144A company guaranty sr. unsec. | | |
| unsub. bonds 5.125%, 2/15/32 | 4,000 | 3,649 |
| News Corp. 144A sr. unsec. notes | | |
| 3.875%, 5/15/29 | 10,000 | 8,778 |
| Omnicom Group, Inc. company guaranty sr. | | |
| unsec. unsub. notes 3.60%, 4/15/26 | 65,000 | 62,432 |
| Outfront Media Capital, LLC/Outfront Media | | |
| Capital Corp. 144A company guaranty sr. unsec. | | |
| notes 5.00%, 8/15/27 | 10,000 | 9,077 |
| Paramount Global sr. unsec. unsub. notes | | |
| 4.00%, 1/15/26 | 12,000 | 11,423 |
| Paramount Global sr. unsec. unsub. notes | | |
| 2.90%, 1/15/27 | 22,000 | 19,817 |
| Penn Entertainment, Inc. 144A sr. unsec. notes | | |
| 5.625%, 1/15/27 | 10,000 | 9,351 |
| Prime Security Services Borrower, LLC/Prime | | |
| Finance, Inc. 144A company guaranty sr. notes | | |
| 3.375%, 8/31/27 | 5,000 | 4,410 |
| Prime Security Services Borrower, LLC/Prime | | |
| Finance, Inc. 144A notes 6.25%, 1/15/28 | 15,000 | 14,052 |
| PulteGroup, Inc. company guaranty sr. unsec. | | |
| unsub. notes 7.875%, 6/15/32 | 15,000 | 16,997 |
| Raptor Acquisition Corp./Raptor Co-Issuer, LLC | | |
| 144A sr. notes 4.875%, 11/1/26 | 5,000 | 4,713 |
| Realogy Group, LLC/Realogy Co-Issuer Corp. | | |
| 144A company guaranty sr. unsec. notes | | |
| 5.75%, 1/15/29 | 15,000 | 11,223 |
| Royal Caribbean Cruises, Ltd. 144A company | | |
| guaranty sr. unsec. notes 7.25%, 1/15/30 | 5,000 | 5,064 |
| Royal Caribbean Cruises, Ltd. 144A company | | |
| guaranty sr. unsec. unsub. notes 9.25%, 1/15/29 | 10,000 | 10,654 |
| Royal Caribbean Cruises, Ltd. 144A sr. unsec. | | |
| notes 5.50%, 8/31/26 | 10,000 | 9,481 |
| Royal Caribbean Cruises, Ltd. 144A sr. unsec. | | |
| notes 4.25%, 7/1/26 | 5,000 | 4,590 |
| S&P Global, Inc. company guaranty sr. unsec. | | |
| bonds 2.50%, 12/1/29 | 30,000 | 26,144 |
| | |
| | Principal | |
| CORPORATE BONDS AND NOTES (12.4%)* cont. | amount | Value |
| | | |
| Consumer cyclicals cont. | | |
| S&P Global, Inc. company guaranty sr. unsec. | | |
| notes 1.25%, 8/15/30 | $9,000 | $7,088 |
| Scientific Games Holdings LP/Scientific | | |
| Games US FinCo., Inc. 144A sr. unsec. notes | | |
| 6.625%, 3/1/30 | 5,000 | 4,400 |
| Scientific Games International, Inc. | | |
| 144A company guaranty sr. unsec. notes | | |
| 7.25%, 11/15/29 | 15,000 | 15,019 |
| Scientific Games International, Inc. 144A sr. | | |
| unsec. notes 7.00%, 5/15/28 | 5,000 | 4,973 |
| Scotts Miracle-Gro Co. (The) company guaranty | | |
| sr. unsec. notes 4.50%, 10/15/29 | 25,000 | 21,482 |
| Scotts Miracle-Gro Co. (The) company guaranty | | |
| sr. unsec. unsub. bonds 4.375%, 2/1/32 | 5,000 | 3,937 |
| Scripps Escrow II, Inc. 144A sr. notes | | |
| 3.875%, 1/15/29 | 5,000 | 4,037 |
| Scripps Escrow, Inc. 144A company guaranty sr. | | |
| unsec. notes 5.875%, 7/15/27 | 5,000 | 4,047 |
| Shift4 Payments, LLC/Shift4 Payments Finance | | |
| Sub, Inc. 144A company guaranty sr. unsec. | | |
| notes 4.625%, 11/1/26 | 10,000 | 9,378 |
| Sirius XM Radio, Inc. 144A company guaranty sr. | | |
| unsec. bonds 3.875%, 9/1/31 | 15,000 | 11,599 |
| Sirius XM Radio, Inc. 144A company guaranty sr. | | |
| unsec. notes 4.00%, 7/15/28 | 10,000 | 8,689 |
| Spanish Broadcasting System, Inc. 144A sr. notes | | |
| 9.75%, 3/1/26 | 5,000 | 3,427 |
| Spectrum Brands, Inc. 144A company guaranty | | |
| sr. unsec. bonds 5.00%, 10/1/29 | 15,000 | 13,389 |
| Standard Industries, Inc. 144A sr. unsec. bonds | | |
| 3.375%, 1/15/31 | 5,000 | 4,025 |
| Standard Industries, Inc. 144A sr. unsec. notes | | |
| 5.00%, 2/15/27 | 10,000 | 9,531 |
| Standard Industries, Inc. 144A sr. unsec. notes | | |
| 4.375%, 7/15/30 | 10,000 | 8,661 |
| Station Casinos, LLC 144A sr. unsec. bonds | | |
| 4.625%, 12/1/31 | 5,000 | 4,213 |
| Station Casinos, LLC 144A sr. unsec. notes | | |
| 4.50%, 2/15/28 | 15,000 | 13,464 |
| SugarHouse HSP Gaming Prop. Mezz LP/ | | |
| SugarHouse HSP Gaming Finance Corp. | | |
| 144A company guaranty sr. unsub. notes | | |
| 5.875%, 5/15/25 | 10,000 | 9,650 |
| Taylor Morrison Communities, Inc. 144A sr. | | |
| unsec. bonds 5.125%, 8/1/30 | 10,000 | 9,233 |
| Taylor Morrison Communities, Inc. 144A sr. | | |
| unsec. notes 5.75%, 1/15/28 | 5,000 | 4,835 |
| Townsquare Media, Inc. 144A sr. notes | | |
| 6.875%, 2/1/26 | 10,000 | 9,563 |
| TRI Pointe Group, Inc./TRI Pointe Homes, Inc. | | |
| company guaranty sr. unsec. unsub. notes | | |
| 5.875%, 6/15/24 | 5,000 | 4,963 |
| Univision Communications, Inc. 144A company | | |
| guaranty sr. notes 6.625%, 6/1/27 | 15,000 | 14,498 |
| Univision Communications, Inc. 144A sr. notes | | |
| 7.375%, 6/30/30 | 5,000 | 4,761 |
| Urban One, Inc. 144A company guaranty sr. | | |
| notes 7.375%, 2/1/28 | 10,000 | 8,711 |
| Victoria’s Secret & Co. 144A sr. unsec. notes | | |
| 4.625%, 7/15/29 | 15,000 | 10,950 |
| Walt Disney Co. (The) company guaranty sr. | | |
| unsec. bonds 7.75%, 12/1/45 | 40,000 | 51,791 |
| |
| Putnam VT Global Asset Allocation Fund 11 |
| | |
| | Principal | |
| CORPORATE BONDS AND NOTES (12.4%)* cont. | amount | Value |
| | | |
| Consumer cyclicals cont. | | |
| Warnermedia Holdings, Inc. company guaranty | | |
| sr. unsec. notes 4.279%, 3/15/32 | $102,000 | $90,462 |
| Warnermedia Holdings, Inc. company guaranty | | |
| sr. unsec. notes 3.755%, 3/15/27 | 20,000 | 18,655 |
| White Cap Buyer, LLC 144A sr. unsec. notes | | |
| 6.875%, 10/15/28 | 10,000 | 9,063 |
| Wynn Las Vegas, LLC/Wynn Las Vegas Capital | | |
| Corp. 144A company guaranty sr. unsec. sub. | | |
| notes 5.25%, 5/15/27 | 15,000 | 14,209 |
| Wynn Resorts Finance, LLC/Wynn Resorts | | |
| Capital Corp. 144A company guaranty sr. unsec. | | |
| unsub. notes 7.125%, 2/15/31 | 10,000 | 9,950 |
| Wynn Resorts Finance, LLC/Wynn Resorts | | |
| Capital Corp. 144A sr. unsec. bonds | | |
| 5.125%, 10/1/29 | 10,000 | 8,962 |
| | | 1,732,023 |
| Consumer staples (0.5%) | | |
| 1011778 BC ULC/New Red Finance, Inc. 144A | | |
| bonds 4.00%, 10/15/30 (Canada) | 20,000 | 17,117 |
| 1011778 BC ULC/New Red Finance, Inc. | | |
| 144A company guaranty notes 4.375%, | | |
| 1/15/28 (Canada) | 15,000 | 13,848 |
| Albertsons Cos., Inc./Safeway, Inc./New | | |
| Albertsons LP/Albertsons, LLC 144A company | | |
| guaranty sr. unsec. notes 4.875%, 2/15/30 | 5,000 | 4,616 |
| Albertsons Cos., Inc./Safeway, Inc./New | | |
| Albertsons LP/Albertsons, LLC 144A company | | |
| guaranty sr. unsec. notes 4.625%, 1/15/27 | 30,000 | 28,425 |
| Albertsons Cos., LLC/Safeway, Inc./New | | |
| Albertsons LP/Albertsons, LLC 144A company | | |
| guaranty sr. unsec. notes 7.50%, 3/15/26 | 10,000 | 10,170 |
| Anheuser-Busch Cos., LLC/Anheuser-Busch | | |
| InBev Worldwide, Inc. company guaranty sr. | | |
| unsec. unsub. bonds 4.90%, 2/1/46 | 35,000 | 33,453 |
| Aramark Services, Inc. 144A company guaranty | | |
| sr. unsec. notes 5.00%, 2/1/28 | 17,000 | 16,023 |
| CDW, LLC/CDW Finance Corp. company | | |
| guaranty sr. unsec. notes 3.25%, 2/15/29 | 15,000 | 12,853 |
| ERAC USA Finance, LLC 144A company guaranty | | |
| sr. unsec. notes 7.00%, 10/15/37 | 50,000 | 57,138 |
| ERAC USA Finance, LLC 144A company guaranty | | |
| sr. unsec. notes 5.625%, 3/15/42 | 60,000 | 60,039�� |
| Fertitta Entertainment, LLC/Fertitta | | |
| Entertainment Finance Co., Inc. 144A company | | |
| guaranty sr. notes 4.625%, 1/15/29 | 5,000 | 4,388 |
| Fertitta Entertainment, LLC/Fertitta | | |
| Entertainment Finance Co., Inc. 144A company | | |
| guaranty sr. unsec. notes 6.75%, 1/15/30 | 10,000 | 8,510 |
| Herc Holdings, Inc. 144A company guaranty sr. | | |
| unsec. notes 5.50%, 7/15/27 | 10,000 | 9,581 |
| IRB Holding Corp. 144A company guaranty sr. | | |
| notes 7.00%, 6/15/25 | 5,000 | 5,025 |
| Kenvue, Inc. 144A company guaranty sr. unsec. | | |
| notes 4.90%, 3/22/33 | 26,000 | 26,307 |
| Kenvue, Inc. 144A company guaranty sr. unsec. | | |
| unsub. bonds 5.05%, 3/22/53 | 5,000 | 5,103 |
| Kenvue, Inc. 144A company guaranty sr. unsec. | | |
| unsub. notes 5.05%, 3/22/28 | 49,000 | 49,389 |
| Keurig Dr Pepper, Inc. company guaranty sr. | | |
| unsec. notes 2.25%, 3/15/31 | 40,000 | 32,902 |
| Keurig Dr Pepper, Inc. company guaranty sr. | | |
| unsec. unsub. notes 3.43%, 6/15/27 | 18,000 | 16,966 |
| | |
| | Principal | |
| CORPORATE BONDS AND NOTES (12.4%)* cont. | amount | Value |
| | | |
| Consumer staples cont. | | |
| Kraft Heinz Foods Co. company guaranty sr. | | |
| unsec. notes 3.00%, 6/1/26 | $19,000 | $17,928 |
| Lamb Weston Holdings, Inc. 144A company | | |
| guaranty sr. unsec. notes 4.125%, 1/31/30 | 15,000 | 13,406 |
| Match Group Holdings II, LLC 144A sr. unsec. | | |
| bonds 5.00%, 12/15/27 | 3,000 | 2,782 |
| Match Group Holdings II, LLC 144A sr. unsec. | | |
| bonds 3.625%, 10/1/31 | 5,000 | 4,110 |
| Match Group Holdings II, LLC 144A sr. unsec. | | |
| unsub. notes 4.625%, 6/1/28 | 40,000 | 36,744 |
| Newell Brands, Inc. sr. unsec. unsub. notes | | |
| 4.70%, 4/1/26 | 5,000 | 4,697 |
| PECF USS Intermediate Holding III Corp. 144A sr. | | |
| unsec. notes 8.00%, 11/15/29 | 20,000 | 11,250 |
| TripAdvisor, Inc. 144A company guaranty sr. | | |
| unsec. notes 7.00%, 7/15/25 | 10,000 | 10,000 |
| US Foods, Inc. 144A company guaranty sr. unsec. | | |
| notes 4.75%, 2/15/29 | 5,000 | 4,578 |
| Yum! Brands, Inc. sr. unsec. bonds | | |
| 5.375%, 4/1/32 | 5,000 | 4,752 |
| | | 522,100 |
| Energy (0.8%) | | |
| Antero Midstream Partners LP/Antero | | |
| Midstream Finance Corp. 144A company | | |
| guaranty sr. unsec. notes 7.875%, 5/15/26 | 10,000 | 10,142 |
| Antero Resources Corp. 144A company guaranty | | |
| sr. unsec. notes 7.625%, 2/1/29 | 4,000 | 4,058 |
| Apache Corp. sr. unsec. unsub. notes | | |
| 5.10%, 9/1/40 | 10,000 | 8,125 |
| Apache Corp. sr. unsec. unsub. notes | | |
| 4.375%, 10/15/28 | 10,000 | 9,133 |
| Callon Petroleum Co. 144A company guaranty sr. | | |
| unsec. notes 8.00%, 8/1/28 | 10,000 | 9,889 |
| Callon Petroleum Co. 144A company guaranty sr. | | |
| unsec. notes 7.50%, 6/15/30 | 20,000 | 18,877 |
| Cenovus Energy, Inc. sr. unsec. bonds 6.75%, | | |
| 11/15/39 (Canada) | 5,000 | 5,244 |
| Centennial Resource Production, LLC | | |
| 144A company guaranty sr. unsec. notes | | |
| 6.875%, 4/1/27 | 20,000 | 19,700 |
| Cheniere Corpus Christi Holdings, LLC company | | |
| guaranty sr. notes 5.125%, 6/30/27 | 16,000 | 15,729 |
| Cheniere Energy Partners LP company guaranty | | |
| sr. unsec. unsub. notes 4.00%, 3/1/31 | 10,000 | 8,805 |
| Chord Energy Corp. 144A company guaranty sr. | | |
| unsec. notes 6.375%, 6/1/26 | 10,000 | 9,914 |
| Civitas Resources, Inc. 144A company guaranty | | |
| sr. unsec. notes 8.375%, 7/1/28 | 5,000 | 5,057 |
| Civitas Resources, Inc. 144A company guaranty | | |
| sr. unsec. unsub. notes 8.75%, 7/1/31 | 10,000 | 10,138 |
| Comstock Resources, Inc. 144A company | | |
| guaranty sr. unsec. notes 5.875%, 1/15/30 | 10,000 | 8,682 |
| Comstock Resources, Inc. 144A sr. unsec. notes | | |
| 6.75%, 3/1/29 | 10,000 | 9,149 |
| Continental Resources, Inc. 144A company | | |
| guaranty sr. unsec. bonds 5.75%, 1/15/31 | 10,000 | 9,507 |
| DCP Midstream Operating LP 144A company | | |
| guaranty sr. unsec. unsub. bonds 6.75%, 9/15/37 | 15,000 | 15,919 |
| Devon Energy Corp. sr. unsec. unsub. bonds | | |
| 7.95%, 4/15/32 | 5,000 | 5,745 |
| Devon Energy Corp. sr. unsec. unsub. bonds | | |
| 7.875%, 9/30/31 | 5,000 | 5,674 |
| |
| 12 Putnam VT Global Asset Allocation Fund |
| | |
| | Principal | |
| CORPORATE BONDS AND NOTES (12.4%)* cont. | amount | Value |
| | | |
| Energy cont. | | |
| Diamondback Energy, Inc. company guaranty sr. | | |
| unsec. notes 3.25%, 12/1/26 | $15,000 | $14,093 |
| Encino Acquisition Partners Holdings, LLC | | |
| 144A company guaranty sr. unsec. notes | | |
| 8.50%, 5/1/28 | 15,000 | 13,614 |
| Endeavor Energy Resources LP/EER Finance, Inc. | | |
| 144A sr. unsec. bonds 5.75%, 1/30/28 | 55,000 | 53,800 |
| Energy Transfer LP/Regency Energy Finance | | |
| Corp. sr. unsec. unsub. notes 4.50%, 11/1/23 | 9,000 | 8,955 |
| EnLink Midstream, LLC 144A company guaranty | | |
| sr. unsec. notes 5.625%, 1/15/28 | 15,000 | 14,515 |
| EQT Corp. sr. unsec. notes 7.00%, 2/1/30 | 10,000 | 10,470 |
| Hess Midstream Operations LP 144A company | | |
| guaranty sr. unsec. notes 5.50%, 10/15/30 | 5,000 | 4,625 |
| Hess Midstream Operations LP 144A company | | |
| guaranty sr. unsec. notes 5.125%, 6/15/28 | 10,000 | 9,359 |
| Hess Midstream Operations LP 144A company | | |
| guaranty sr. unsec. notes 4.25%, 2/15/30 | 5,000 | 4,363 |
| Hess Midstream Operations LP 144A company | | |
| guaranty sr. unsec. sub. notes 5.625%, 2/15/26 | 10,000 | 9,838 |
| Kinetik Holdings LP 144A company guaranty sr. | | |
| unsec. notes 5.875%, 6/15/30 | 15,000 | 14,257 |
| Nabors Industries, Inc. company guaranty sr. | | |
| unsec. notes 5.75%, 2/1/25 | 10,000 | 9,677 |
| Nabors Industries, Inc. 144A company guaranty | | |
| sr. unsec. notes 7.375%, 5/15/27 | 10,000 | 9,515 |
| Occidental Petroleum Corp. sr. unsec. bonds | | |
| 6.125%, 1/1/31 | 5,000 | 5,077 |
| Occidental Petroleum Corp. sr. unsec. sub. | | |
| bonds 6.20%, 3/15/40 | 35,000 | 34,496 |
| Occidental Petroleum Corp. sr. unsec. sub. notes | | |
| 8.50%, 7/15/27 | 10,000 | 10,802 |
| Occidental Petroleum Corp. sr. unsec. sub. notes | | |
| 7.50%, 5/1/31 | 25,000 | 27,296 |
| Occidental Petroleum Corp. sr. unsec. sub. notes | | |
| 5.875%, 9/1/25 | 5,000 | 4,966 |
| Ovintiv, Inc. company guaranty sr. unsec. bonds | | |
| 6.25%, 7/15/33 | 5,000 | 4,932 |
| Ovintiv, Inc. company guaranty sr. unsec. notes | | |
| 5.65%, 5/15/28 | 30,000 | 29,405 |
| Ovintiv, Inc. company guaranty sr. unsec. unsub. | | |
| bonds 7.375%, 11/1/31 | 10,000 | 10,724 |
| Ovintiv, Inc. company guaranty sr. unsec. unsub. | | |
| bonds 6.625%, 8/15/37 | 5,000 | 4,935 |
| Patterson-UTI Energy, Inc. sr. unsec. sub. notes | | |
| 5.15%, 11/15/29 | 20,000 | 18,118 |
| Permian Resources Operating, LLC | | |
| 144A company guaranty sr. unsec. notes | | |
| 5.375%, 1/15/26 | 15,000 | 14,261 |
| Petrobras Global Finance BV company guaranty | | |
| sr. unsec. unsub. bonds 6.50%, 7/3/33 (Brazil) | 10,000 | 9,785 |
| Petroleos Mexicanos company guaranty sr. | | |
| unsec. unsub. notes 6.49%, 1/23/27 (Mexico) | 20,000 | 17,773 |
| Petroleos Mexicanos 144A sr. unsec. bonds | | |
| 10.00%, 2/7/33 (Mexico) | 20,000 | 18,300 |
| Precision Drilling Corp. 144A company guaranty | | |
| sr. unsec. notes 7.125%, 1/15/26 (Canada) | 20,000 | 19,749 |
| Rockcliff Energy II, LLC 144A sr. unsec. notes | | |
| 5.50%, 10/15/29 | 25,000 | 23,061 |
| Sabine Pass Liquefaction, LLC sr. notes | | |
| 5.00%, 3/15/27 | 14,000 | 13,780 |
| | |
| | Principal | |
| CORPORATE BONDS AND NOTES (12.4%)* cont. | amount | Value |
| | | |
| Energy cont. | | |
| SM Energy Co. sr. unsec. unsub. notes | | |
| 6.75%, 9/15/26 | $10,000 | $9,747 |
| SM Energy Co. sr. unsec. unsub. notes | | |
| 6.50%, 7/15/28 | 10,000 | 9,600 |
| SM Energy Co. sr. unsec. unsub. notes | | |
| 5.625%, 6/1/25 | 5,000 | 4,886 |
| Southwestern Energy Co. company guaranty sr. | | |
| unsec. notes 5.375%, 3/15/30 | 10,000 | 9,332 |
| Southwestern Energy Co. company guaranty sr. | | |
| unsec. notes 5.375%, 2/1/29 | 25,000 | 23,542 |
| Spectra Energy Partners LP sr. unsec. notes | | |
| 3.375%, 10/15/26 | 30,000 | 28,166 |
| Tallgrass Energy Partners LP/Tallgrass Energy | | |
| Finance Corp. 144A company guaranty sr. unsec. | | |
| notes 6.00%, 12/31/30 | 10,000 | 8,800 |
| Tallgrass Energy Partners LP/Tallgrass Energy | | |
| Finance Corp. 144A company guaranty sr. unsec. | | |
| notes 5.50%, 1/15/28 | 10,000 | 9,138 |
| Targa Resources Partners LP/Targa Resources | | |
| Partners Finance Corp. company guaranty sr. | | |
| unsec. unsub. notes 4.875%, 2/1/31 | 20,000 | 18,483 |
| Transocean Poseidon, Ltd. 144A company | | |
| guaranty sr. notes 6.875%, 2/1/27 | 8,125 | 8,013 |
| Transocean Titan Financing, Ltd. 144A | | |
| company guaranty sr. notes 8.375%, 2/1/28 | | |
| (Cayman Islands) | 5,000 | 5,106 |
| Transocean, Inc. 144A company guaranty sr. | | |
| notes 8.75%, 2/15/30 | 5,000 | 5,075 |
| Transocean, Inc. 144A company guaranty sr. | | |
| unsec. notes 11.50%, 1/30/27 | 10,000 | 10,363 |
| USA Compression Partners LP/USA | | |
| Compression Finance Corp. company guaranty | | |
| sr. unsec. notes 6.875%, 4/1/26 | 10,000 | 9,796 |
| USA Compression Partners LP/USA | | |
| Compression Finance Corp. company guaranty | | |
| sr. unsec. unsub. notes 6.875%, 9/1/27 | 5,000 | 4,774 |
| Venture Global Calcasieu Pass, LLC 144A | | |
| company guaranty sr. notes 3.875%, 8/15/29 | 10,000 | 8,736 |
| Venture Global LNG, Inc. 144A sr. notes | | |
| 8.375%, 6/1/31 | 10,000 | 10,082 |
| Venture Global LNG, Inc. 144A sr. notes | | |
| 8.125%, 6/1/28 | 5,000 | 5,078 |
| Viper Energy Partners LP 144A company | | |
| guaranty sr. unsec. notes 5.375%, 11/1/27 | 5,000 | 4,799 |
| | | 827,544 |
| Financials (3.4%) | | |
| AerCap Ireland Capital DAC/AerCap Global | | |
| Aviation Trust company guaranty sr. unsec. | | |
| notes 4.50%, 9/15/23 (Ireland) | 150,000 | 149,437 |
| AG Issuer, LLC 144A sr. notes 6.25%, 3/1/28 | 10,000 | 9,523 |
| Air Lease Corp. sr. unsec. notes 2.10%, 9/1/28 | 65,000 | 53,992 |
| Air Lease Corp. sr. unsec. sub. bonds | | |
| 4.625%, 10/1/28 | 23,000 | 21,617 |
| Air Lease Corp. sr. unsec. sub. notes | | |
| 3.25%, 10/1/29 | 3,000 | 2,595 |
| Alliant Holdings Intermediate, LLC/Alliant | | |
| Holdings Co-Issuer 144A sr. unsec. notes | | |
| 6.75%, 10/15/27 | 15,000 | 14,100 |
| Ally Financial, Inc. company guaranty sr. unsec. | | |
| notes 8.00%, 11/1/31 | 34,000 | 35,296 |
| Ally Financial, Inc. sr. unsec. notes 4.75%, 6/9/27 | 25,000 | 23,208 |
| AmWINS Group, Inc. 144A sr. unsec. notes | | |
| 4.875%, 6/30/29 | 5,000 | 4,515 |
| |
| Putnam VT Global Asset Allocation Fund 13 |
| | |
| | Principal | |
| CORPORATE BONDS AND NOTES (12.4%)* cont. | amount | Value |
| | | |
| Financials cont. | | |
| Ares Capital Corp. sr. unsec. notes | | |
| 2.875%, 6/15/27 | $50,000 | $43,322 |
| Ares Capital Corp. sr. unsec. sub. notes | | |
| 3.875%, 1/15/26 | 25,000 | 23,178 |
| Aretec Escrow Issuer, Inc. 144A sr. unsec. notes | | |
| 7.50%, 4/1/29 | 15,000 | 13,006 |
| Athene Global Funding 144A notes | | |
| 1.985%, 8/19/28 | 40,000 | 32,099 |
| Banco Santander SA unsec. sub. FRB 3.225%, | | |
| 11/22/32 (Spain) | 200,000 | 158,444 |
| Bank of America Corp. jr. unsec. sub. FRN Ser. AA, | | |
| 6.10%, perpetual maturity | 74,000 | 73,371 |
| Bank of America Corp. sr. unsec. FRN Ser. MTN, | | |
| 2.496%, 2/13/31 | 5,000 | 4,186 |
| Bank of America Corp. unsec. sub. FRB | | |
| 3.846%, 3/8/37 | 120,000 | 102,615 |
| Bank of America Corp. unsec. sub. notes | | |
| 6.11%, 1/29/37 | 195,000 | 205,650 |
| Berkshire Hathaway Finance Corp. company | | |
| guaranty sr. unsec. bonds 2.85%, 10/15/50 | 10,000 | 6,959 |
| Berkshire Hathaway Finance Corp. company | | |
| guaranty sr. unsec. notes 4.30%, 5/15/43 | 29,000 | 26,448 |
| Blackstone Holdings Finance Co., LLC 144A | | |
| company guaranty sr. unsec. unsub. bonds | | |
| 1.60%, 3/30/31 | 10,000 | 7,420 |
| Capital One Financial Corp. unsec. sub. FRB | | |
| 2.359%, 7/29/32 | 92,000 | 64,972 |
| Citigroup, Inc. jr. unsec. sub. FRN 3.875%, | | |
| perpetual maturity | 23,000 | 19,263 |
| Citigroup, Inc. sr. unsec. FRB 3.668%, 7/24/28 | 204,000 | 190,718 |
| Citigroup, Inc. sr. unsec. unsub. FRB | | |
| 3.887%, 1/10/28 | 50,000 | 47,380 |
| Citigroup, Inc. unsec. sub. bonds 4.75%, 5/18/46 | 10,000 | 8,556 |
| Citigroup, Inc. unsec. sub. bonds 4.45%, 9/29/27 | 50,000 | 47,741 |
| CNO Financial Group, Inc. sr. unsec. notes | | |
| 5.25%, 5/30/29 | 10,000 | 9,460 |
| Cobra AcquisitionCo, LLC 144A company | | |
| guaranty sr. unsec. notes 6.375%, 11/1/29 | 15,000 | 10,575 |
| Commonwealth Bank of Australia 144A sr. unsec. | | |
| notes 3.15%, 9/19/27 (Australia) | 75,000 | 69,516 |
| Corebridge Financial, Inc. sr. unsec. notes | | |
| 3.85%, 4/5/29 | 20,000 | 17,986 |
| Fairfax Financial Holdings, Ltd. sr. unsec. notes | | |
| 4.85%, 4/17/28 (Canada) | 10,000 | 9,624 |
| Fairfax US, Inc. 144A company guaranty sr. | | |
| unsec. notes 4.875%, 8/13/24 | 30,000 | 29,410 |
| First-Citizens Bank & Trust Co. unsec. sub. notes | | |
| 6.125%, 3/9/28 | 26,000 | 25,649 |
| Freedom Mortgage Corp. 144A sr. unsec. notes | | |
| 8.25%, 4/15/25 | 17,000 | 16,575 |
| Freedom Mortgage Corp. 144A sr. unsec. notes | | |
| 7.625%, 5/1/26 | 10,000 | 9,205 |
| Freedom Mortgage Corp. 144A sr. unsec. notes | | |
| 6.625%, 1/15/27 | 5,000 | 4,329 |
| General Motors Financial Co., Inc. company | | |
| guaranty sr. unsec. notes 4.00%, 10/6/26 | 79,000 | 74,916 |
| General Motors Financial Co., Inc. company | | |
| guaranty sr. unsec. unsub. notes 4.00%, 1/15/25 | 10,000 | 9,691 |
| General Motors Financial Co., Inc. sr. unsec. | | |
| notes 3.10%, 1/12/32 | 12,000 | 9,706 |
| General Motors Financial Co., Inc. sr. unsec. | | |
| notes 2.35%, 2/26/27 | 2,000 | 1,783 |
| | |
| | Principal | |
| CORPORATE BONDS AND NOTES (12.4%)* cont. | amount | Value |
| | | |
| Financials cont. | | |
| General Motors Financial Co., Inc. sr. unsec. | | |
| notes 1.25%, 1/8/26 | $22,000 | $19,629 |
| GLP Capital LP/GLP Financing II, Inc. company | | |
| guaranty sr. unsec. bonds 3.25%, 1/15/32 R | 15,000 | 12,111 |
| GLP Capital LP/GLP Financing II, Inc. company | | |
| guaranty sr. unsec. notes 5.25%, 6/1/25 R | 10,000 | 9,785 |
| GLP Capital LP/GLP Financing II, Inc. company | | |
| guaranty sr. unsec. unsub. notes 5.375%, 4/15/26 | 4,000 | 3,916 |
| goeasy, Ltd. 144A company guaranty sr. unsec. | | |
| notes 5.375%, 12/1/24 (Canada) | 5,000 | 4,851 |
| goeasy, Ltd. 144A company guaranty sr. unsec. | | |
| notes 4.375%, 5/1/26 (Canada) | 5,000 | 4,561 |
| Goldman Sachs Group, Inc. (The) jr. unsec. sub. | | |
| FRN 3.65%, 7/28/51 | 7,000 | 5,411 |
| Goldman Sachs Group, Inc. (The) sr. unsec. FRB | | |
| 4.223%, 5/1/29 | 117,000 | 110,505 |
| Goldman Sachs Group, Inc. (The) sr. unsec. | | |
| unsub. notes 2.60%, 2/7/30 | 13,000 | 11,072 |
| Goldman Sachs Group, Inc. (The) unsec. sub. | | |
| notes 6.75%, 10/1/37 | 24,000 | 25,813 |
| Goldman Sachs Group, Inc. (The) unsec. sub. | | |
| notes 5.95%, 1/15/27 | 5,000 | 5,069 |
| HUB International, Ltd. 144A sr. notes | | |
| 7.25%, 6/15/30 | 5,000 | 5,163 |
| HUB International, Ltd. 144A sr. unsec. notes | | |
| 7.00%, 5/1/26 | 20,000 | 19,947 |
| HUB International, Ltd. 144A sr. unsec. notes | | |
| 5.625%, 12/1/29 | 5,000 | 4,485 |
| Huntington Bancshares, Inc. unsec. sub. FRB | | |
| 2.487%, 8/15/36 | 41,000 | 28,906 |
| Icahn Enterprises LP/Icahn Enterprises Finance | | |
| Corp. company guaranty sr. unsec. notes | | |
| 6.25%, 5/15/26 | 10,000 | 9,101 |
| Icahn Enterprises LP/Icahn Enterprises Finance | | |
| Corp. company guaranty sr. unsec. notes | | |
| 5.25%, 5/15/27 | 10,000 | 8,624 |
| Icahn Enterprises LP/Icahn Enterprises Finance | | |
| Corp. company guaranty sr. unsec. sub. notes | | |
| 4.375%, 2/1/29 | 5,000 | 3,929 |
| Intercontinental Exchange, Inc. sr. unsec. bonds | | |
| 2.65%, 9/15/40 | 30,000 | 21,186 |
| Intercontinental Exchange, Inc. sr. unsec. bonds | | |
| 1.85%, 9/15/32 | 15,000 | 11,563 |
| JPMorgan Chase & Co. jr. unsec. bonds 6.10%, | | |
| perpetual maturity | 17,000 | 16,961 |
| JPMorgan Chase & Co. jr. unsec. sub. FRB | | |
| Ser. HH, 4.60%, perpetual maturity | 157,000 | 146,403 |
| JPMorgan Chase & Co. jr. unsec. sub. FRB | | |
| Ser. W, (ICE LIBOR USD 3 Month + 1.00%), | | |
| 6.321%, 5/15/47 | 13,000 | 10,899 |
| JPMorgan Chase & Co. jr. unsec. sub. FRN 3.65%, | | |
| perpetual maturity | 17,000 | 14,962 |
| JPMorgan Chase & Co. sr. unsec. unsub. FRB | | |
| 3.964%, 11/15/48 | 300,000 | 246,632 |
| JPMorgan Chase & Co. unsec. sub. notes | | |
| 4.125%, 12/15/26 | 6,000 | 5,776 |
| KKR Group Finance Co. III, LLC 144A company | | |
| guaranty sr. unsec. unsub. bonds 5.125%, 6/1/44 | 30,000 | 25,970 |
| Ladder Capital Finance Holdings, LLLP/Ladder | | |
| Capital Finance Corp. 144A company guaranty | | |
| sr. unsec. notes 4.75%, 6/15/29 R | 10,000 | 8,138 |
| |
| 14 Putnam VT Global Asset Allocation Fund |
| | |
| | Principal | |
| CORPORATE BONDS AND NOTES (12.4%)* cont. | amount | Value |
| | | |
| Financials cont. | | |
| Ladder Capital Finance Holdings, LLLP/Ladder | | |
| Capital Finance Corp. 144A sr. unsec. notes | | |
| 4.25%, 2/1/27 R | $15,000 | $13,034 |
| Marsh & McLennan Cos., Inc. sr. unsec. sub. notes | | |
| 4.375%, 3/15/29 | 22,000 | 21,370 |
| Morgan Stanley sr. unsec. unsub. FRN Ser. GMTN, | | |
| 3.772%, 1/24/29 | 185,000 | 172,711 |
| Morgan Stanley unsec. unsub. notes | | |
| 3.95%, 4/23/27 | 40,000 | 37,873 |
| Nasdaq, Inc. sr. unsec. bonds 5.95%, 8/15/53 | 5,000 | 5,119 |
| Nasdaq, Inc. sr. unsec. notes 5.35%, 6/28/28 | 10,000 | 10,014 |
| Nasdaq, Inc. sr. unsec. sub. bonds | | |
| 5.55%, 2/15/34 | 5,000 | 5,020 |
| Nationstar Mortgage Holdings, Inc. | | |
| 144A company guaranty sr. unsec. notes | | |
| 5.75%, 11/15/31 | 15,000 | 12,322 |
| Nationstar Mortgage Holdings, Inc. | | |
| 144A company guaranty sr. unsec. notes | | |
| 5.50%, 8/15/28 | 10,000 | 8,759 |
| Neuberger Berman Group, LLC/Neuberger | | |
| Berman Finance Corp. 144A sr. unsec. notes | | |
| 4.875%, 4/15/45 | 30,000 | 24,416 |
| OneMain Finance Corp. company guaranty sr. | | |
| unsec. sub. notes 7.125%, 3/15/26 | 35,000 | 34,387 |
| OneMain Finance Corp. company guaranty sr. | | |
| unsec. sub. notes 6.625%, 1/15/28 | 5,000 | 4,716 |
| OneMain Finance Corp. company guaranty sr. | | |
| unsec. unsub. notes 5.375%, 11/15/29 | 15,000 | 12,752 |
| PennyMac Financial Services, Inc. 144A | | |
| company guaranty sr. unsec. notes | | |
| 5.75%, 9/15/31 | 10,000 | 8,156 |
| PennyMac Financial Services, Inc. 144A | | |
| company guaranty sr. unsec. notes | | |
| 5.375%, 10/15/25 | 10,000 | 9,450 |
| PHH Mortgage Corp. 144A company guaranty sr. | | |
| notes 7.875%, 3/15/26 | 15,000 | 13,398 |
| PNC Financial Services Group, Inc. (The) unsec. | | |
| sub. FRB 4.626%, 6/6/33 | 70,000 | 64,392 |
| Prologis LP sr. unsec. unsub. notes | | |
| 2.25%, 4/15/30 R | 10,000 | 8,476 |
| Royal Bank of Canada unsec. sub. notes | | |
| Ser. GMTN, 4.65%, 1/27/26 (Canada) | 45,000 | 43,816 |
| Service Properties Trust company guaranty sr. | | |
| unsec. unsub. notes 7.50%, 9/15/25 R | 5,000 | 4,910 |
| Toronto-Dominion Bank (The) unsec. sub. FRB | | |
| 3.625%, 9/15/31 (Canada) | 55,000 | 50,745 |
| Truist Financial Corp. sr. unsec. unsub. FRN | | |
| Ser. MTN, 4.26%, 7/28/26 | 55,000 | 52,861 |
| US Bancorp unsec. sub. FRB 2.491%, 11/3/36 | 60,000 | 43,889 |
| USI, Inc./NY 144A sr. unsec. notes 6.875%, 5/1/25 | 20,000 | 19,850 |
| VICI Properties LP sr. unsec. unsub. notes | | |
| 4.75%, 2/15/28 R | 30,000 | 28,406 |
| VICI Properties LP/VICI Note Co., Inc. | | |
| 144A company guaranty sr. unsec. notes | | |
| 3.75%, 2/15/27 R | 10,000 | 9,174 |
| Wells Fargo & Co. jr. unsec. sub. FRN 3.90%, | | |
| perpetual maturity | 15,000 | 13,206 |
| Wells Fargo & Co. sr. unsec. unsub. FRB Ser. MTN, | | |
| 3.35%, 3/2/33 | 185,000 | 158,333 |
| Wells Fargo & Co. sr. unsec. unsub. FRN Ser. MTN, | | |
| 4.54%, 8/15/26 | 22,000 | 21,496 |
| Westpac Banking Corp. unsec. sub. bonds | | |
| 2.963%, 11/16/40 (Australia) | 25,000 | 16,759 |
| | | 3,419,214 |
| | |
| | Principal | |
| CORPORATE BONDS AND NOTES (12.4%)* cont. | amount | Value |
| | | |
| Health care (0.9%) | | |
| 1375209 BC, Ltd. 144A sr. notes 9.00%, | | |
| 1/30/28 (Canada) | $1,000 | $1,003 |
| Air Methods Corp. 144A sr. unsec. notes | | |
| 8.00%, 5/15/25 | 15,000 | 113 |
| Amgen, Inc. sr. unsec. unsub. bonds | | |
| 5.65%, 3/2/53 | 23,000 | 23,181 |
| Amgen, Inc. sr. unsec. unsub. notes | | |
| 5.25%, 3/2/30 | 47,000 | 47,147 |
| Amgen, Inc. sr. unsec. unsub. notes | | |
| 5.15%, 3/2/28 | 30,000 | 30,001 |
| Bausch Health Cos., Inc. 144A company guaranty | | |
| sr. notes 6.125%, 2/1/27 | 5,000 | 3,201 |
| Bausch Health Cos., Inc. 144A sr. notes | | |
| 4.875%, 6/1/28 | 10,000 | 5,952 |
| Becton, Dickinson and Co. sr. unsec. notes | | |
| 3.70%, 6/6/27 | 7,000 | 6,655 |
| Becton, Dickinson and Co. sr. unsec. sub. bonds | | |
| 1.957%, 2/11/31 | 50,000 | 40,509 |
| Centene Corp. sr. unsec. bonds 3.00%, 10/15/30 | 10,000 | 8,333 |
| Centene Corp. sr. unsec. notes 4.625%, 12/15/29 | 10,000 | 9,204 |
| Charles River Laboratories International, | | |
| Inc. 144A company guaranty sr. unsec. notes | | |
| 4.00%, 3/15/31 | 5,000 | 4,325 |
| Charles River Laboratories International, | | |
| Inc. 144A company guaranty sr. unsec. notes | | |
| 3.75%, 3/15/29 | 5,000 | 4,381 |
| CHS/Community Health Systems, Inc. 144A | | |
| company guaranty sr. notes 8.00%, 3/15/26 | 5,000 | 4,870 |
| CHS/Community Health Systems, Inc. 144A | | |
| company guaranty sr. notes 5.625%, 3/15/27 | 5,000 | 4,406 |
| CHS/Community Health Systems, Inc. 144A | | |
| company guaranty sr. unsec. sub. notes | | |
| 6.875%, 4/1/28 | 10,000 | 5,870 |
| CHS/Community Health Systems, Inc. 144A jr. | | |
| notes 6.875%, 4/15/29 | 10,000 | 6,245 |
| CHS/Community Health Systems, Inc. 144A sr. | | |
| notes 5.25%, 5/15/30 | 15,000 | 11,816 |
| Cigna Corp. company guaranty sr. unsec. unsub. | | |
| notes 3.75%, 7/15/23 | 27,000 | 26,976 |
| CVS Health Corp. sr. unsec. unsub. notes | | |
| 4.78%, 3/25/38 | 39,000 | 35,992 |
| CVS Pass-Through Trust sr. notes | | |
| 6.036%, 12/10/28 | 1,890 | 1,897 |
| CVS Pass-Through Trust 144A sr. mtge. notes | | |
| 4.704%, 1/10/36 | 34,634 | 31,966 |
| DH Europe Finance II SARL company guaranty sr. | | |
| unsec. bonds 3.40%, 11/15/49 (Luxembourg) | 15,000 | 11,660 |
| Elanco Animal Health, Inc. sr. unsec. notes | | |
| Ser. WI, 6.65%, 8/28/28 | 10,000 | 9,703 |
| Eli Lilly and Co. sr. unsec. unsub. bonds | | |
| 4.875%, 2/27/53 | 15,000 | 15,407 |
| HCA, Inc. company guaranty sr. notes | | |
| 4.50%, 2/15/27 | 22,000 | 21,223 |
| HCA, Inc. company guaranty sr. unsec. notes | | |
| 5.375%, 9/1/26 | 10,000 | 9,921 |
| HCA, Inc. company guaranty sr. unsec. notes | | |
| 3.50%, 9/1/30 | 5,000 | 4,383 |
| HCA, Inc. 144A company guaranty sr. unsec. sub. | | |
| notes 3.625%, 3/15/32 | 45,000 | 39,060 |
| Humana, Inc. sr. unsec. unsub. bonds | | |
| 5.50%, 3/15/53 | 5,000 | 4,974 |
| Humana, Inc. sr. unsec. unsub. notes | | |
| 5.75%, 3/1/28 | 25,000 | 25,437 |
| |
| Putnam VT Global Asset Allocation Fund 15 |
| | |
| | Principal | |
| CORPORATE BONDS AND NOTES (12.4%)* cont. | amount | Value |
| | | |
| Health care cont. | | |
| Mallinckrodt International Finance SA/ | | |
| Mallinckrodt CB, LLC 144A company guaranty | | |
| unsub. notes 10.00%, 4/15/25 (Luxembourg) | $9,000 | $1,518 |
| Merck & Co., Inc. sr. unsec. notes 2.90%, 3/7/24 | 1,000 | 982 |
| Merck & Co., Inc. sr. unsec. unsub. notes | | |
| 3.70%, 2/10/45 | 50,000 | 42,453 |
| Minerva Merger Sub, Inc. 144A sr. unsec. notes | | |
| 6.50%, 2/15/30 | 20,000 | 16,833 |
| Mozart Debt Merger Sub, Inc. 144A sr. notes | | |
| 3.875%, 4/1/29 | 30,000 | 26,072 |
| Mozart Debt Merger Sub, Inc. 144A sr. unsec. | | |
| notes 5.25%, 10/1/29 | 10,000 | 8,677 |
| Novartis Capital Corp. company guaranty sr. | | |
| unsec. unsub. bonds 4.00%, 11/20/45 | 80,000 | 72,173 |
| Option Care Health, Inc. 144A company guaranty | | |
| sr. unsec. notes 4.375%, 10/31/29 | 5,000 | 4,401 |
| Owens & Minor, Inc. 144A company guaranty sr. | | |
| unsec. notes 6.625%, 4/1/30 | 10,000 | 9,073 |
| Owens & Minor, Inc. 144A sr. unsec. notes | | |
| 4.50%, 3/31/29 | 5,000 | 4,152 |
| Pfizer Investment Enterprises PTE, Ltd. company | | |
| guaranty sr. unsec. notes 5.30%, 5/19/53 | | |
| (Singapore) | 8,000 | 8,317 |
| Pfizer Investment Enterprises PTE, Ltd. company | | |
| guaranty sr. unsec. notes 4.75%, 5/19/33 | | |
| (Singapore) | 11,000 | 10,959 |
| Pfizer Investment Enterprises PTE, Ltd. company | | |
| guaranty sr. unsec. notes 4.45%, 5/19/28 | | |
| (Singapore) | 36,000 | 35,384 |
| Service Corp. International sr. unsec. bonds | | |
| 5.125%, 6/1/29 | 15,000 | 14,133 |
| Service Corp. International sr. unsec. notes | | |
| 4.625%, 12/15/27 | 6,000 | 5,685 |
| Service Corp. International sr. unsec. notes | | |
| 3.375%, 8/15/30 | 5,000 | 4,182 |
| Service Corp. International sr. unsec. sub. notes | | |
| 4.00%, 5/15/31 | 10,000 | 8,560 |
| Tenet Healthcare Corp. company guaranty sr. | | |
| notes 5.125%, 11/1/27 | 25,000 | 23,867 |
| Tenet Healthcare Corp. company guaranty sr. | | |
| notes 4.875%, 1/1/26 | 20,000 | 19,480 |
| Tenet Healthcare Corp. company guaranty sr. | | |
| notes 4.25%, 6/1/29 | 10,000 | 9,034 |
| Tenet Healthcare Corp. company guaranty sr. | | |
| unsub. notes 6.125%, 6/15/30 | 15,000 | 14,786 |
| Viatris, Inc. company guaranty sr. unsec. notes | | |
| 2.30%, 6/22/27 | 25,000 | 21,841 |
| Zoetis, Inc. sr. unsec. notes 3.90%, 8/20/28 | 35,000 | 33,581 |
| | | 851,954 |
| Technology (1.1%) | | |
| Alphabet, Inc. sr. unsec. bonds 2.25%, 8/15/60 | 30,000 | 18,249 |
| Apple, Inc. sr. unsec. bonds 2.80%, 2/8/61 | 20,000 | 13,511 |
| Apple, Inc. sr. unsec. notes 4.00%, 5/10/28 | 40,000 | 39,350 |
| Apple, Inc. sr. unsec. unsub. notes | | |
| 4.375%, 5/13/45 | 80,000 | 75,972 |
| Apple, Inc. sr. unsec. unsub. notes 3.85%, 5/4/43 | 27,000 | 24,093 |
| Arches Buyer, Inc. 144A sr. notes 4.25%, 6/1/28 | 30,000 | 26,106 |
| Arches Buyer, Inc. 144A sr. unsec. notes | | |
| 6.125%, 12/1/28 | 5,000 | 4,309 |
| Boxer Parent Co., Inc. 144A company guaranty sr. | | |
| notes 7.125%, 10/2/25 | 5,000 | 5,004 |
| | |
| | Principal | |
| CORPORATE BONDS AND NOTES (12.4%)* cont. | amount | Value |
| | | |
| Technology cont. | | |
| Broadcom Corp./Broadcom Cayman Finance, | | |
| Ltd. company guaranty sr. unsec. unsub. notes | | |
| 3.875%, 1/15/27 | $73,000 | $69,612 |
| Broadcom Corp./Broadcom Cayman Finance, | | |
| Ltd. company guaranty sr. unsec. unsub. notes | | |
| 3.50%, 1/15/28 | 90,000 | 83,138 |
| Central Parent, Inc./CDK Global, Inc. 144A | | |
| company guaranty sr. notes 7.25%, 6/15/29 | 10,000 | 9,888 |
| Clarivate Science Holdings Corp. 144A sr. unsec. | | |
| notes 4.875%, 7/1/29 | 20,000 | 17,742 |
| Cloud Software Group, Inc. 144A notes | | |
| 9.00%, 9/30/29 | 15,000 | 12,975 |
| Cloud Software Group, Inc. 144A sr. notes. | | |
| 6.50%, 3/31/29 | 40,000 | 35,615 |
| CommScope Finance, LLC 144A sr. notes | | |
| 6.00%, 3/1/26 | 5,000 | 4,660 |
| CommScope Technologies, LLC 144A company | | |
| guaranty sr. unsec. notes 6.00%, 6/15/25 | 3,000 | 2,796 |
| CommScope, Inc. 144A company guaranty sr. | | |
| unsec. notes 8.25%, 3/1/27 | 10,000 | 8,000 |
| CrowdStrike Holdings, Inc. company guaranty sr. | | |
| unsec. notes 3.00%, 2/15/29 | 20,000 | 17,247 |
| Imola Merger Corp. 144A sr. notes 4.75%, 5/15/29 | 20,000 | 17,394 |
| Meta Platforms, Inc. sr. unsec. notes | | |
| 4.95%, 5/15/33 | 25,000 | 24,981 |
| Meta Platforms, Inc. sr. unsec. unsub. bonds | | |
| 4.45%, 8/15/52 | 21,000 | 18,260 |
| Meta Platforms, Inc. sr. unsec. unsub. notes | | |
| 3.50%, 8/15/27 | 12,000 | 11,393 |
| Microsoft Corp. sr. unsec. unsub. bonds | | |
| 2.525%, 6/1/50 | 25,000 | 17,294 |
| Microsoft Corp. sr. unsec. unsub. notes | | |
| 3.30%, 2/6/27 | 10,000 | 9,616 |
| MSCI, Inc. 144A company guaranty sr. unsec. | | |
| notes 3.625%, 9/1/30 | 12,000 | 10,348 |
| NortonLifeLock, Inc. 144A company guaranty sr. | | |
| unsec. unsub. notes 6.75%, 9/30/27 | 10,000 | 9,950 |
| Oracle Corp. sr. unsec. notes 2.95%, 4/1/30 | 45,000 | 39,279 |
| Oracle Corp. sr. unsec. unsub. bonds | | |
| 4.00%, 11/15/47 | 50,000 | 38,494 |
| Oracle Corp. sr. unsec. unsub. notes | | |
| 5.375%, 7/15/40 | 35,000 | 33,403 |
| Oracle Corp. sr. unsec. unsub. notes | | |
| 3.625%, 7/15/23 | 144,000 | 143,840 |
| Rocket Software, Inc. 144A sr. unsec. notes | | |
| 6.50%, 2/15/29 | 25,000 | 21,031 |
| salesforce.com, Inc. sr. unsec. bonds 3.05%, 7/15/61 | 30,000 | 20,347 |
| salesforce.com, Inc. sr. unsec. bonds | | |
| 2.90%, 7/15/51 | 30,000 | 21,090 |
| Sensata Technologies, Inc. 144A company | | |
| guaranty sr. unsec. notes 3.75%, 2/15/31 | 50,000 | 42,775 |
| ServiceNow, Inc. sr. unsec. notes 1.40%, 9/1/30 | 30,000 | 23,753 |
| TTM Technologies, Inc. 144A company guaranty | | |
| sr. unsec. notes 4.00%, 3/1/29 | 15,000 | 12,750 |
| Twilio, Inc. company guaranty sr. unsec. notes | | |
| 3.875%, 3/15/31 | 25,000 | 20,815 |
| Twilio, Inc. company guaranty sr. unsec. notes | | |
| 3.625%, 3/15/29 | 15,000 | 12,761 |
| Workday, Inc. sr. unsec. notes 3.70%, 4/1/29 | 10,000 | 9,247 |
| ZoomInfo Technologies, LLC/ZoomInfo Finance | | |
| Corp. 144A company guaranty sr. unsec. notes | | |
| 3.875%, 2/1/29 | 35,000 | 30,103 |
| | | 1,057,191 |
| |
| 16 Putnam VT Global Asset Allocation Fund |
| | |
| | Principal | |
| CORPORATE BONDS AND NOTES (12.4%)* cont. | amount | Value |
| | | |
| Transportation (0.2%) | | |
| American Airlines, Inc./AAdvantage Loyalty | | |
| IP, Ltd. 144A company guaranty sr. notes | | |
| 5.75%, 4/20/29 | $10,000 | $9,710 |
| American Airlines, Inc./AAdvantage Loyalty | | |
| IP, Ltd. 144A company guaranty sr. notes | | |
| 5.50%, 4/20/26 | 10,000 | 9,907 |
| CSX Corp. sr. unsec. unsub. notes 4.10%, 3/15/44 | 70,000 | 60,159 |
| Delta Air Lines, Inc./SkyMiles IP, Ltd. 144A | | |
| company guaranty sr. notes 4.75%, 10/20/28 | 15,000 | 14,560 |
| Penske Truck Leasing Co. LP/PTL Finance Corp. | | |
| 144A sr. unsec. bonds 3.40%, 11/15/26 | 16,000 | 14,747 |
| Penske Truck Leasing Co. LP/PTL Finance Corp. | | |
| 144A sr. unsec. notes 4.40%, 7/1/27 | 10,000 | 9,439 |
| Penske Truck Leasing Co. LP/PTL Finance Corp. | | |
| 144A sr. unsec. notes 3.90%, 2/1/24 | 20,000 | 19,738 |
| United Airlines, Inc. 144A company guaranty sr. | | |
| notes 4.625%, 4/15/29 | 5,000 | 4,556 |
| United Airlines, Inc. 144A company guaranty sr. | | |
| notes 4.375%, 4/15/26 | 5,000 | 4,751 |
| Watco Cos., LLC/Watco Finance Corp. 144A sr. | | |
| unsec. notes 6.50%, 6/15/27 | 25,000 | 23,757 |
| | | 171,324 |
| Utilities and power (1.0%) | | |
| AES Corp. (The) sr. unsec. notes 1.375%, 1/15/26 | 24,000 | 21,437 |
| AES Corp. (The) sr. unsec. unsub. notes | | |
| 2.45%, 1/15/31 | 25,000 | 20,207 |
| American Electric Power Co., Inc. sr. unsec. | | |
| unsub. notes Ser. J, 4.30%, 12/1/28 | 55,000 | 52,446 |
| American Transmission Systems, Inc. 144A sr. | | |
| unsec. bonds 2.65%, 1/15/32 | 10,000 | 8,269 |
| Boardwalk Pipelines LP company guaranty sr. | | |
| unsec. notes 3.60%, 9/1/32 | 5,000 | 4,245 |
| Buckeye Partners LP sr. unsec. notes | | |
| 3.95%, 12/1/26 | 5,000 | 4,514 |
| Buckeye Partners LP 144A sr. unsec. notes | | |
| 4.50%, 3/1/28 | 10,000 | 8,960 |
| Calpine Corp. 144A company guaranty sr. notes | | |
| 5.25%, 6/1/26 | 4,000 | 3,863 |
| Commonwealth Edison Co. 1st mtge. bonds | | |
| 5.90%, 3/15/36 | 28,000 | 29,185 |
| Consolidated Edison Co. of New York, Inc. sr. | | |
| unsec. unsub. notes 4.20%, 3/15/42 | 45,000 | 38,138 |
| Duke Energy Carolinas, LLC sr. notes | | |
| 4.95%, 1/15/33 | 10,000 | 9,926 |
| Duke Energy Corp. sr. unsec. bonds | | |
| 4.20%, 6/15/49 | 70,000 | 56,779 |
| Duke Energy Corp. sr. unsec. notes | | |
| 3.15%, 8/15/27 | 55,000 | 50,780 |
| Duke Energy Indiana LLC sr. bonds 6.45%, 4/1/39 | 5,000 | 5,451 |
| Enbridge, Inc. company guaranty sr. unsec. | | |
| unsub. bonds 4.50%, 6/10/44 (Canada) | 15,000 | 12,486 |
| Enbridge, Inc. sr. unsec. unsub. bonds 4.25%, | | |
| 12/1/26 (Canada) | 30,000 | 28,933 |
| Energy Transfer LP company guaranty sr. unsec. | | |
| bonds 3.75%, 5/15/30 | 30,000 | 27,069 |
| Energy Transfer LP company guaranty sr. unsec. | | |
| notes 5.50%, 6/1/27 | 6,000 | 5,967 |
| Energy Transfer LP company guaranty sr. unsec. | | |
| notes 2.90%, 5/15/25 | 37,000 | 35,057 |
| Energy Transfer LP jr. unsec. sub. FRN 6.625%, | | |
| perpetual maturity | 91,000 | 69,621 |
| Enterprise Products Operating, LLC company | | |
| guaranty sr. unsec. notes 2.80%, 1/31/30 | 4,000 | 3,502 |
| | |
| | Principal | |
| CORPORATE BONDS AND NOTES (12.4%)* cont. | amount | Value |
| | | |
| Utilities and power cont. | | |
| Enterprise Products Operating, LLC company | | |
| guaranty sr. unsec. unsub. bonds 4.25%, 2/15/48 | $90,000 | $76,237 |
| Evergy Kansas Central, Inc. sr. bonds | | |
| 5.70%, 3/15/53 | 15,000 | 15,445 |
| Evergy Missouri West, Inc. 144A sr. notes | | |
| 5.15%, 12/15/27 | 30,000 | 29,576 |
| Eversource Energy sr. unsec. unsub. notes | | |
| 5.45%, 3/1/28 | 5,000 | 5,034 |
| IPALCO Enterprises, Inc. sr. notes 4.25%, 5/1/30 | 25,000 | 22,618 |
| IPALCO Enterprises, Inc. sr. sub. notes | | |
| 3.70%, 9/1/24 | 5,000 | 4,834 |
| Kinder Morgan, Inc. company guaranty sr. unsec. | | |
| unsub. bonds 5.20%, 6/1/33 | 15,000 | 14,536 |
| Kinder Morgan, Inc. company guaranty sr. unsec. | | |
| unsub. notes 1.75%, 11/15/26 | 10,000 | 8,852 |
| NextEra Energy Capital Holdings, Inc. company | | |
| guaranty sr. unsec. unsub. notes 6.051%, 3/1/25 | 15,000 | 15,056 |
| NRG Energy, Inc. 144A company guaranty sr. | | |
| notes 3.75%, 6/15/24 | 21,000 | 20,293 |
| NRG Energy, Inc. 144A company guaranty sr. | | |
| unsec. bonds 3.875%, 2/15/32 | 30,000 | 23,115 |
| NRG Energy, Inc. 144A jr. unsec. sub. FRB | | |
| 10.25%, 3/9/53 | 5,000 | 4,715 |
| Oncor Electric Delivery Co., LLC sr. notes | | |
| 3.75%, 4/1/45 | 75,000 | 61,274 |
| Pacific Gas and Electric Co. company guaranty | | |
| sr. unsec. unsub. notes 2.95%, 3/1/26 | 5,000 | 4,580 |
| Pacific Gas and Electric Co. notes 2.10%, 8/1/27 | 5,000 | 4,271 |
| Pacific Gas and Electric Co. sr. notes | | |
| 6.10%, 1/15/29 | 50,000 | 49,196 |
| PG&E Corp. sr. sub. notes 5.25%, 7/1/30 | 15,000 | 13,444 |
| Public Service Electric & Gas Co. sr. notes | | |
| Ser. MTN, 5.50%, 3/1/40 | 25,000 | 25,629 |
| Puget Sound Energy, Inc. sr. bonds | | |
| 5.448%, 6/1/53 | 15,000 | 15,092 |
| Vistra Corp. 144A jr. unsec. sub. FRN | | |
| 8.00%, 10/15/51 | 5,000 | 4,675 |
| Vistra Corp. 144A jr. unsec. sub. FRN 7.00%, | | |
| perpetual maturity | 5,000 | 4,363 |
| Vistra Operations Co., LLC 144A company | | |
| guaranty sr. notes 4.30%, 7/15/29 | 17,000 | 15,065 |
| Vistra Operations Co., LLC 144A company | | |
| guaranty sr. notes 3.55%, 7/15/24 | 18,000 | 17,384 |
| Vistra Operations Co., LLC 144A company | | |
| guaranty sr. unsec. notes 5.50%, 9/1/26 | 10,000 | 9,622 |
| Vistra Operations Co., LLC 144A company | | |
| guaranty sr. unsec. sub. notes 5.00%, 7/31/27 | 5,000 | 4,680 |
| | | 966,421 |
| | |
| Total corporate bonds and notes (cost $13,677,437) | $12,357,345 |
| | |
| | Principal | |
| MORTGAGE-BACKED SECURITIES (3.0%)* | amount | Value |
| | | |
| Agency collateralized mortgage obligations (—%) | | |
| Federal Home Loan Mortgage Corporation | | |
| REMICs IFB Ser. 3408, Class EK, ((-4.024 | | |
| x ICE LIBOR USD 1 Month) + 25.79%), | | |
| 4.896%, 4/15/37 | $4,101 | $4,774 |
| REMICs IFB Ser. 3065, Class DC, ((-3 x ICE LIBOR | | |
| USD 1 Month) + 19.86%), 4.28%, 3/15/35 | 11,629 | 11,657 |
| Government National Mortgage Association | | |
| Ser. 10-9, Class UI, IO, 5.00%, 1/20/40 | 20,902 | 4,233 |
| Ser. 13-14, IO, 3.50%, 12/20/42 | 55,913 | 5,504 |
| |
| Putnam VT Global Asset Allocation Fund 17 |
| | |
| | Principal | |
| MORTGAGE-BACKED SECURITIES (3.0%)* cont. | amount | Value |
| | | |
| Agency collateralized mortgage obligations cont. | | |
| Government National Mortgage Association | | |
| Ser. 16-H16, Class EI, IO, 2.238%, 6/20/66 W | $106,240 | $3,676 |
| Ser. 15-H26, Class DI, IO, 0.077%, 10/20/65 W | 157,903 | 5,310 |
| | | 35,154 |
| Commercial mortgage-backed securities (1.4%) | | |
| ACRE Commercial Mortgage, Ltd. 144A | | |
| FRB Ser. 21-FL4, Class A, 6.035%, 12/18/37 | | |
| (Cayman Islands) | 13,577 | 13,222 |
| Banc of America Commercial Mortgage Trust | | |
| Ser. 15-UBS7, Class AS, 3.989%, 9/15/48 W | 14,000 | 13,037 |
| FRB Ser. 07-1, Class XW, IO, 0.508%, 1/15/49 W | 14,184 | 10 |
| BANK FRB Ser. 17-BNK8, Class B, | | |
| 4.088%, 11/15/50 W | 12,000 | 9,790 |
| Barclays Commercial Mortgage Trust Ser. 19-C3, | | |
| Class C, 4.178%, 5/15/52 | 32,000 | 25,698 |
| CD Commercial Mortgage Trust FRB Ser. 17-CD6, | | |
| Class B, 3.911%, 11/13/50 W | 14,000 | 11,390 |
| CFCRE Commercial Mortgage Trust FRB | | |
| Ser. 17-C8, Class B, 4.199%, 6/15/50 W | 14,000 | 11,821 |
| Citigroup Commercial Mortgage Trust | | |
| Ser. 14-GC21, Class B, 4.328%, 5/10/47 W | 44,000 | 40,889 |
| COMM Mortgage Trust | | |
| FRB Ser. 12-LC4, Class C, 5.477%, 12/10/44 W | 29,000 | 27,021 |
| FRB Ser. 13-CR13, Class C, 5.032%, 11/10/46 W | 27,000 | 24,670 |
| FRB Ser. 14-CR17, Class C, 4.942%, 5/10/47 W | 53,000 | 46,311 |
| Ser. 13-CR11, Class AM, 4.715%, 8/10/50 W | 20,000 | 19,941 |
| Ser. 14-CR19, Class B, 4.703%, 8/10/47 W | 16,000 | 15,126 |
| Ser. 14-UBS2, Class B, 4.701%, 3/10/47 | 75,000 | 71,478 |
| FRB Ser. 15-CR26, Class C, 4.615%, 10/10/48 W | 24,000 | 21,568 |
| FRB Ser. 14-UBS6, Class C, 4.582%, 12/10/47 W | 16,000 | 13,104 |
| FRB Ser. 16-COR1, Class C, 4.472%, 10/10/49 W | 19,000 | 16,188 |
| FRB Ser. 15-LC19, Class B, 3.829%, 2/10/48 W | 18,000 | 16,292 |
| FRB Ser. 14-CR20, Class XA, IO, | | |
| 1.076%, 11/10/47 W | 240,943 | 1,925 |
| FRB Ser. 14-UBS6, Class XA, IO, | | |
| 0.98%, 12/10/47 W | 706,898 | 5,588 |
| FRB Ser. 14-LC17, Class XA, IO, | | |
| 0.809%, 10/10/47 W | 382,873 | 2,183 |
| Credit Suisse Commercial Mortgage Trust 144A | | |
| FRB Ser. 07-C2, Class AX, IO, 0.047%, 1/15/49 W | 476,662 | — |
| CSAIL Commercial Mortgage Trust | | |
| Ser. 15-C1, Class B, 4.044%, 4/15/50 W | 30,000 | 26,674 |
| Ser. 16-C7, Class AS, 3.958%, 11/15/49 W | 15,000 | 13,661 |
| Ser. 19-C17, Class AS, 3.278%, 9/15/52 | 49,000 | 41,055 |
| FRB Ser. 20-C19, Class XA, IO, 1.224%, 3/15/53 W | 1,035,178 | 55,734 |
| CSMC Trust | | |
| FRB Ser. 16-NXSR, Class C, 4.575%, 12/15/49 W | 70,000 | 50,949 |
| FRB Ser. 16-NXSR, Class XA, IO, | | |
| 0.829%, 12/15/49 W | 877,563 | 15,376 |
| Federal Home Loan Mortgage Corporation | | |
| Multifamily Structured Pass-Through | | |
| Certificates FRB Ser. K740, Class X1, IO, | | |
| 0.833%, 9/25/27 W | 378,870 | 9,823 |
| GS Mortgage Securities Trust | | |
| FRB Ser. 14-GC22, Class C, 4.842%, 6/10/47 W | 14,000 | 11,287 |
| FRB Ser. 15-GC32, Class B, 4.548%, 7/10/48 W | 73,000 | 66,840 |
| FRB Ser. 15-GC30, Class C, 4.204%, 5/10/50 W | 37,000 | 32,899 |
| GS Mortgage Securities Trust 144A FRB | | |
| Ser. 13-GC14, Class B, 4.708%, 8/10/46 W | 13,000 | 12,450 |
| | |
| | Principal | |
| MORTGAGE-BACKED SECURITIES (3.0%)* cont. | amount | Value |
| | | |
| Commercial mortgage-backed securities cont. | | |
| JPMBB Commercial Mortgage Securities Trust | | |
| FRB Ser. 13-C15, Class C, 5.33%, 11/15/45 W | $43,000 | $40,911 |
| FRB Ser. 14-C22, Class C, 4.698%, 9/15/47 W | 13,000 | 10,856 |
| FRB Ser. 13-C12, Class B, 4.165%, 7/15/45 W | 1,725 | 1,667 |
| JPMDB Commercial Mortgage Securities Trust | | |
| FRB Ser. 18-C8, Class C, 4.971%, 6/15/51 W | 11,000 | 8,887 |
| FRB Ser. 18-C8, Class XA, IO, 0.826%, 6/15/51 W | 922,105 | 19,876 |
| JPMorgan Chase Commercial Mortgage | | |
| Securities Trust | | |
| Ser. 06-LDP9, Class AMS, 5.337%, 5/15/47 | 6,840 | 6,391 |
| FRB Ser. 13-C16, Class C, 5.182%, 12/15/46 W | 22,000 | 20,961 |
| LB-UBS Commercial Mortgage Trust 144A FRB | | |
| Ser. 06-C6, Class XCL, IO, 0.435%, 9/15/39 W | 216,572 | 29 |
| Morgan Stanley Bank of America Merrill | | |
| Lynch Trust | | |
| FRB Ser. 14-C14, Class C, 5.227%, 2/15/47 W | 33,000 | 32,159 |
| FRB Ser. 14-C14, Class B, 5.037%, 2/15/47 W | 13,000 | 12,736 |
| FRB Ser. 15-C24, Class B, 4.469%, 5/15/48 W | 10,000 | 9,291 |
| Ser. 13-C13, Class AS, 4.266%, 11/15/46 | 75,000 | 74,211 |
| FRB Ser. 13-C10, Class AS, 4.20%, 7/15/46 W | 8,908 | 8,641 |
| Ser. 14-C19, Class C, 4.00%, 12/15/47 | 20,000 | 18,041 |
| Ser. 16-C32, Class AS, 3.994%, 12/15/49 W | 22,000 | 19,404 |
| FRB Ser. 14-C17, Class XA, IO, 1.182%, 8/15/47 W | 149,380 | 651 |
| FRB Ser. 15-C26, Class XA, IO, 1.11%, 10/15/48 W | 557,052 | 6,979 |
| FRB Ser. 13-C12, Class XA, IO, 0.79%, 10/15/46 W | 208,221 | 3 |
| Morgan Stanley Bank of America Merrill | | |
| Lynch Trust 144A FRB Ser. 12-C5, Class E, | | |
| 4.769%, 8/15/45 W | 15,000 | 13,503 |
| Morgan Stanley Capital I Trust | | |
| Ser. 15-UBS8, Class B, 4.315%, 12/15/48 W | 16,000 | 13,757 |
| FRB Ser. 18-H3, Class XA, IO, 0.963%, 7/15/51 W | 1,369,887 | 42,173 |
| Ready Capital Mortgage Financing, LLC 144A | | |
| FRB Ser. 22-FL9, Class A, 7.556%, 6/25/37 | 15,252 | 15,211 |
| FRB Ser. 22-FL8, Class AS, 7.167%, 1/25/37 | 16,000 | 15,776 |
| FRB Ser. 21-FL7, Class A, 6.35%, 11/25/36 | 22,488 | 21,935 |
| Shelter Growth CRE Issuer, Ltd. 144A | | |
| FRB Ser. 21-FL3, Class A, 6.273%, 9/15/36 | | |
| (Cayman Islands) | 42,991 | 42,121 |
| Wells Fargo Commercial Mortgage Trust | | |
| FRB Ser. 16-NXS5, Class C, 5.144%, 1/15/59 W | 10,000 | 7,585 |
| FRB Ser. 15-SG1, Class B, 4.601%, 9/15/48 W | 18,000 | 15,615 |
| FRB Ser. 13-LC12, Class AS, 4.435%, 7/15/46 W | 19,000 | 18,569 |
| FRB Ser. 13-LC12, Class C, 4.435%, 7/15/46 W | 24,000 | 16,758 |
| FRB Ser. 20-C57, Class C, 4.157%, 8/15/53 W | 16,000 | 12,460 |
| Ser. 15-LC20, Class C, 4.056%, 4/15/50 W | 17,000 | 15,368 |
| WF-RBS Commercial Mortgage Trust | | |
| Ser. 14-LC14, Class C, 4.344%, 3/15/47 W | 13,000 | 11,665 |
| FRB Ser. 13-C11, Class C, 4.141%, 3/15/45 W | 47,000 | 37,717 |
| WF-RBS Commercial Mortgage Trust 144A | | |
| FRB Ser. 11-C3, Class D, 6.05%, 3/15/44 W | 8,056 | 1,803 |
| FRB Ser. 13-C15, Class D, 4.584%, 8/15/46 W | 43,000 | 10,780 |
| | | 1,348,490 |
| Residential mortgage-backed securities (non-agency) (1.6%) | |
| Citigroup Mortgage Loan Trust, Inc. FRB | | |
| Ser. 05-2, Class 1A2A, 4.439%, 5/25/35 W | 6,203 | 6,015 |
| Countrywide Alternative Loan Trust | | |
| FRB Ser. 06-OA10, Class 4A1, (ICE LIBOR USD | | |
| 1 Month + 0.38%), 5.53%, 8/25/46 | 65,859 | 54,405 |
| FRB Ser. 06-OA7, Class 1A2, (Federal Reserve | | |
| US 12 Month Cumulative Avg 1 yr CMT + 0.94%), | | |
| 4.916%, 6/25/46 | 45,034 | 38,174 |
| |
| 18 Putnam VT Global Asset Allocation Fund |
| | |
| | Principal | |
| MORTGAGE-BACKED SECURITIES (3.0%)* cont. | amount | Value |
| | |
| Residential mortgage-backed securities (non-agency) cont. | |
| Ellington Financial Mortgage Trust 144A | | |
| Ser. 20-2, Class A2, 1.486%, 10/25/65 W | $26,179 | $23,179 |
| Federal Home Loan Mortgage Corporation | | |
| Structured Agency Credit Risk Debt FRN | | |
| Ser. 16-DNA2, Class M3, (ICE LIBOR USD 1 Month | | |
| + 4.65%), 9.80%, 10/25/28 | 54,362 | 57,049 |
| Federal Home Loan Mortgage Corporation 144A | | |
| Structured Agency Credit Risk Trust REMICs | | |
| FRB Ser. 20-DNA5, Class B1, (US 30 Day Average | | |
| SOFR + 4.80%), 9.867%, 10/25/50 | 54,000 | 57,848 |
| Structured Agency Credit Risk Debt FRN | | |
| Ser. 22-DNA5, Class M1A, (US 30 Day Average | | |
| SOFR + 2.95%), 8.017%, 6/25/42 | 15,949 | 16,238 |
| Structured Agency Credit Risk Trust FRB | | |
| Ser. 18-HRP2, Class M3, (ICE LIBOR USD | | |
| 1 Month + 2.40%), 7.55%, 2/25/47 | 87,610 | 88,483 |
| Structured Agency Credit Risk Debt FRN | | |
| Ser. 21-DNA2, Class M2, (US 30 Day Average | | |
| SOFR + 2.30%), 7.367%, 8/25/33 | 107,607 | 107,675 |
| Structured Agency Credit Risk Trust REMICs | | |
| FRB Ser. 20-DNA6, Class M2, (US 30 Day | | |
| Average SOFR + 2.00%), 7.067%, 12/25/50 | 78,529 | 79,263 |
| Structured Agency Credit Risk Trust REMICs | | |
| FRB Ser. 22-DNA3, Class M1A, (US 30 Day | | |
| Average SOFR + 2.00%), 7.067%, 4/25/42 | 60,580 | 60,731 |
| Structured Agency Credit Risk Trust REMICs | | |
| FRB Ser. 22-DNA1, Class M1B, (US 30 Day | | |
| Average SOFR + 1.85%), 6.917%, 1/25/42 | 74,000 | 71,627 |
| Structured Agency Credit Risk Debt FRN | | |
| Ser. 22-DNA2, Class M1A, (US 30 Day Average | | |
| SOFR + 1.30%), 6.367%, 2/25/42 | 69,071 | 68,683 |
| Structured Agency Credit Risk Trust FRB | | |
| Ser. 18-HRP2, Class M3AS, (ICE LIBOR USD | | |
| 1 Month + 1.00%), 6.15%, 2/25/47 | 64,628 | 64,211 |
| Structured Agency Credit Risk Trust REMICs | | |
| FRB Ser. 21-HQA3, Class M1, (US 30 Day | | |
| Average SOFR + 0.85%), 5.917%, 9/25/41 | 28,747 | 27,913 |
| Seasoned Credit Risk Transfer Trust FRB | | |
| Ser. 17-2, Class 2, 4.00%, 8/25/56 W | 53,606 | 52,183 |
| Federal National Mortgage Association | | |
| Connecticut Avenue Securities FRB | | |
| Ser. 16-C01, Class 2M2, (ICE LIBOR USD 1 Month | | |
| + 6.95%), 12.10%, 8/25/28 | 27,884 | 29,411 |
| Connecticut Avenue Securities FRB | | |
| Ser. 16-C01, Class 1M2, (ICE LIBOR USD 1 Month | | |
| + 6.75%), 11.90%, 8/25/28 | 42,678 | 45,838 |
| Connecticut Avenue Securities FRB | | |
| Ser. 16-C03, Class 2M2, (ICE LIBOR USD 1 Month | | |
| + 5.90%), 11.05%, 10/25/28 | 5,121 | 5,454 |
| Connecticut Avenue Securities FRB | | |
| Ser. 13-C01, Class M2, (ICE LIBOR USD 1 Month | | |
| + 5.25%), 10.40%, 10/25/23 | 4,487 | 4,537 |
| Connecticut Avenue Securities FRB | | |
| Ser. 14-C04, Class 2M2, (ICE LIBOR USD 1 Month | | |
| + 5.00%), 10.15%, 11/25/24 | 109 | 110 |
| Connecticut Avenue Securities FRB | | |
| Ser. 16-C05, Class 2M2, (ICE LIBOR USD 1 Month | | |
| + 4.45%), 9.60%, 1/25/29 | 57,851 | 60,795 |
| Connecticut Avenue Securities FRB | | |
| Ser. 16-C07, Class 2M2, (ICE LIBOR USD 1 Month | | |
| + 4.35%), 9.50%, 5/25/29 | 85,373 | 90,002 |
| Connecticut Avenue Securities FRB | | |
| Ser. 16-C06, Class 1M2, (ICE LIBOR USD 1 Month | | |
| + 4.25%), 9.40%, 4/25/29 | 36,800 | 38,621 |
| | |
| | Principal | |
| MORTGAGE-BACKED SECURITIES (3.0%)* cont. | amount | Value |
| | |
| Residential mortgage-backed securities (non-agency) cont. | |
| Federal National Mortgage Association | | |
| Connecticut Avenue Securities FRB | | |
| Ser. 17-C02, Class 2M2C, (ICE LIBOR USD | | |
| 1 Month + 3.65%), 8.80%, 9/25/29 | $56,000 | $58,039 |
| Connecticut Avenue Securities FRB | | |
| Ser. 17-C01, Class 1M2, (ICE LIBOR USD 1 Month | | |
| + 3.55%), 8.70%, 7/25/29 | 69,777 | 72,363 |
| Connecticut Avenue Securities FRB | | |
| Ser. 14-C03, Class 2M2, (ICE LIBOR USD 1 Month | | |
| + 2.90%), 8.05%, 7/25/24 | 1,979 | 2,007 |
| Connecticut Avenue Securities Trust FRB | | |
| Ser. 18-C05, Class 1M2, (ICE LIBOR USD 1 Month | | |
| + 2.35%), 7.50%, 1/25/31 | 15,900 | 16,118 |
| Federal National Mortgage Association 144A | | |
| Connecticut Avenue Securities FRB | | |
| Ser. 21-R02, Class 2M1, (US 30 Day Average | | |
| SOFR + 0.90%), 5.967%, 11/25/41 | 11,239 | 11,197 |
| Connecticut Avenue Securities Trust FRB | | |
| Ser. 21-R01, Class 1M1, (US 30 Day Average | | |
| SOFR + 0.75%), 5.817%, 10/25/41 | 7,625 | 7,604 |
| Long Beach Mortgage Loan Trust FRB Ser. 04-1, | | |
| Class A2, (ICE LIBOR USD 1 Month + 0.80%), | | |
| 5.95%, 2/25/34 | 16,236 | 15,765 |
| New Century Home Equity Loan Trust FRB | | |
| Ser. 03-4, Class M1, (ICE LIBOR USD 1 Month | | |
| + 1.13%), 6.275%, 10/25/33 | 28,744 | 26,932 |
| Park Place Securities, Inc. Asset-Backed | | |
| Pass-Through Certificates FRB Ser. 04-WCW2, | | |
| Class M3, (ICE LIBOR USD 1 Month + 1.05%), | | |
| 6.20%, 10/25/34 | 16,919 | 16,224 |
| RMF Buyout Issuance Trust 144A Ser. 20-HB1, | | |
| Class A1, 1.719%, 10/25/50 W | 79,151 | 66,273 |
| Verus Securitization Trust 144A Ser. 20-5, | | |
| Class A2, 1.578%, 5/25/65 | 35,008 | 31,485 |
| Visio Trust 144A Ser. 20-1, Class A3, | | |
| 3.521%, 8/25/55 W | 117,000 | 104,051 |
| WaMu Mortgage Pass-Through Certificates Trust | | |
| FRB Ser. 05-AR9, Class A1C3, (ICE LIBOR USD | | |
| 1 Month + 0.96%), 6.11%, 7/25/45 | 16,124 | 14,637 |
| | | 1,591,140 |
| | |
| Total mortgage-backed securities (cost $3,214,819) | $2,974,784 |
| | |
| FOREIGN GOVERNMENT AND AGENCY | Principal | |
| BONDS AND NOTES (0.4%)* | amount | Value |
| | | |
| Dominican (Republic of) sr. unsec. | | |
| unsub. notes Ser. REGS, 5.50%, | | |
| 1/27/25 (Dominican Republic) | $130,000 | $127,792 |
| Indonesia (Republic of) sr. unsec. | | |
| unsub. notes 4.65%, 9/20/32 | | |
| (Indonesia) | 200,000 | 196,280 |
| Mexico (Government of) sr. unsec. | | |
| bonds 5.55%, 1/21/45 (Mexico) | 78,000 | 74,147 |
| Uruguay (Oriental Republic of) | | |
| sr. unsec. unsub. bonds 7.625%, | | |
| 3/21/36 (Uruguay) | 10,000 | 12,302 |
| Total foreign government and agency bonds and notes | |
| (cost $441,376) | | $410,521 |
| | |
| | Principal | |
| SENIOR LOANS (0.4%)*c | amount | Value |
| | | |
| Basic materials (—%) | | |
| CP Atlas Buyer, Inc. bank term loan FRN | | |
| Ser. B1, (ICE LIBOR USD 3 Month + 3.75%), | | |
| 8.953%, 11/23/27 | $10,648 | $9,998 |
| |
| Putnam VT Global Asset Allocation Fund 19 |
| | |
| | Principal | |
| SENIOR LOANS (0.4%)*c cont. | amount | Value |
| | | |
| Basic materials cont. | | |
| Klockner-Pentaplast of America, Inc. bank term | | |
| loan FRN (CME Term SOFR 6 Month + 4.73%), | | |
| 10.104%, 2/4/26 | $9,813 | $9,298 |
| LSF11 A5 HoldCo, LLC bank term loan FRN | | |
| Ser. B, (CME Term SOFR 1 Month + 4.25%), | | |
| 9.453%, 10/15/28 | 5,000 | 4,952 |
| Nouryon USA, LLC bank term loan FRN | | |
| Ser. B, (CME Term SOFR 1 Month + 4.00%), | | |
| 9.347%, 4/3/28 | 5,000 | 4,948 |
| Nouryon USA, LLC bank term loan FRN | | |
| Ser. B, (CME Term SOFR 1 Month + 4.00%), | | |
| 9.318%, 4/3/28 | 12,697 | 12,558 |
| | | 41,754 |
| Capital goods (0.1%) | | |
| Adient US, LLC bank term loan FRN Ser. B, (CME | | |
| Term SOFR 1 Month + 3.25%), 8.467%, 4/1/28 | 6,350 | 6,345 |
| Madison IAQ, LLC bank term loan FRN (CME Term | | |
| SOFR 1 Month + 3.25%), 8.334%, 6/15/28 | 9,975 | 9,758 |
| MajorDrive Holdings IV, LLC bank term loan FRN | | |
| (ICE LIBOR USD 3 Month + 4.00%), 9.50%, 6/1/28 | 14,688 | 14,306 |
| TK Elevator US Newco, Inc. bank term loan | | |
| FRN (ICE LIBOR USD 3 Month + 3.50%), | | |
| 8.602%, 7/31/27 | 4,910 | 4,862 |
| Vertiv Group Corp. bank term loan FRN | | |
| Ser. B, (CME Term SOFR 3 Month + 2.75%), | | |
| 8.019%, 3/2/27 | 14,295 | 14,228 |
| | | 49,499 |
| Communication services (—%) | | |
| Asurion, LLC bank term loan FRN Ser. B9, (ICE | | |
| LIBOR USD 1 Month + 3.25%), 8.788%, 7/31/27 | 4,900 | 4,628 |
| DIRECTV Financing, LLC bank term loan | | |
| FRN (CME Term SOFR 3 Month + 5.00%), | | |
| 10.217%, 7/22/27 | 17,683 | 17,268 |
| | | 21,896 |
| Consumer cyclicals (0.1%) | | |
| AMC Entertainment Holdings, Inc. bank term | | |
| loan FRN Ser. B, (ICE LIBOR USD 1 Month | | |
| + 3.00%), 8.218%, 4/22/26 | 9,758 | 7,598 |
| Clear Channel Outdoor Holdings, Inc. bank | | |
| term loan FRN Ser. B, (ICE LIBOR USD 3 Month | | |
| + 3.50%), 8.807%, 8/21/26 | 9,897 | 9,434 |
| Crocs, Inc. bank term loan FRN Ser. B, (CME Term | | |
| SOFR 1 Month + 3.50%), 8.703%, 2/20/29 | 4,214 | 4,221 |
| iHeartCommunications, Inc. bank term | | |
| loan FRN (CME Term SOFR 3 Month + 3.23%), | | |
| 8.447%, 5/1/26 | 8,916 | 7,695 |
| Mattress Firm, Inc. bank term loan FRN Ser. B, | | |
| (ICE LIBOR USD 3 Month + 4.25%), 9.95%, 9/21/28 | 9,947 | 9,715 |
| Michaels Cos., Inc. (The) bank term loan FRN | | |
| (US SOFR + 4.25%), 9.754%, 4/15/28 | 9,962 | 8,799 |
| Neptune Bidco US, Inc. bank term loan FRN | | |
| Class C, (CME Term SOFR 1 Month + 5.00%), | | |
| 10.004%, 4/11/29 | 5,000 | 4,390 |
| PetSmart, LLC bank term loan FRN Ser. B, (CME | | |
| Term SOFR 1 Month + 3.75%), 8.953%, 1/29/28 | 18,854 | 18,791 |
| Robertshaw US Holding Corp. bank term | | |
| loan FRN (CME Term SOFR 1 Month + 8.00%), | | |
| 13.342%, 2/28/27 | 5,000 | 1,100 |
| Sabre GLBL, Inc. bank term loan FRN (CME Term | | |
| SOFR 1 Month + 5.00%), 10.203%, 6/30/28 | 4,876 | 3,862 |
| White Cap Buyer, LLC bank term loan FRN | | |
| (CME Term SOFR 1 Month + 3.75%), | | |
| 8.853%, 10/19/27 | 9,752 | 9,651 |
| | | 85,256 |
| | |
| | Principal | |
| SENIOR LOANS (0.4%)*c | amount | Value |
| | | |
| Consumer staples (0.1%) | | |
| Ascend Learning, LLC bank term loan FRN (ICE | | |
| LIBOR USD 1 Month + 5.75%), 10.953%, 11/18/29 | $5,000 | $4,229 |
| Brand Industrial Services, Inc. bank term | | |
| loan FRN (CME Term SOFR 1 Month + 4.25%), | | |
| 9.417%, 6/21/24 | 19,560 | 19,287 |
| IRB Holding Corp. bank term loan FRN (CME | | |
| Term SOFR 3 Month Plus CSA + 3.00%), | | |
| 8.203%, 12/15/27 | 9,875 | 9,798 |
| PECF USS Intermediate Holding III Corp. bank | | |
| term loan FRN Ser. B, (ICE LIBOR USD 1 Month | | |
| + 4.25%), 9.523%, 12/17/28 | 19,638 | 16,005 |
| VM Consolidated, Inc. bank term loan FRN (CME | | |
| Term SOFR 1 Month + 3.25%), 8.467%, 3/19/28 | 14,837 | 14,837 |
| | | 64,156 |
| Energy (—%) | | |
| CQP Holdco LP bank term loan FRN (ICE LIBOR | | |
| USD 3 Month + 3.75%), 9.288%, 5/27/28 | 14,700 | 14,663 |
| | | 14,663 |
| Health care (—%) | | |
| One Call Corp. bank term loan FRN (ICE LIBOR | | |
| USD 3 Month + 5.50%), 10.829%, 4/22/27 | 4,863 | 3,453 |
| | | 3,453 |
| Technology (0.1%) | | |
| Cloud Software Group, Inc. bank term loan | | |
| FRN Ser. B, (CME Term SOFR 1 Month + 4.50%), | | |
| 9.842%, 3/30/29 | 4,988 | 4,657 |
| Epicor Software Corp. bank term loan FRN (ICE | | |
| LIBOR USD 1 Month + 7.75%), 12.834%, 7/31/28 | 5,000 | 4,989 |
| Epicor Software Corp. bank term loan FRN | | |
| Ser. B, (CME Term SOFR 3 Month + 3.25%), | | |
| 8.467%, 7/30/27 | 29,175 | 28,778 |
| Genesys Cloud Services Holdings, LLC bank | | |
| term loan FRN (CME Term SOFR 3 Month | | |
| + 4.00%), 9.269%, 12/1/27 | 9,775 | 9,740 |
| Polaris Newco, LLC bank term loan FRN Ser. B, | | |
| (ICE LIBOR USD 3 Month + 4.00%), 9.538%, 6/3/28 | 9,800 | 9,000 |
| Proofpoint, Inc. bank term loan FRN Ser. B, (ICE | | |
| LIBOR USD 3 Month + 6.25%), 11.467%, 8/31/29 | 10,000 | 9,675 |
| Rocket Software, Inc. bank term loan FRN (ICE | | |
| LIBOR USD 3 Month + 4.25%), 9.443%, 11/28/25 | 4,900 | 4,851 |
| UKG, Inc. bank term loan FRN (ICE LIBOR USD | | |
| 1 Month + 5.25%), 10.271%, 5/3/27 | 5,000 | 4,836 |
| Vision Solutions, Inc. bank term loan FRN (ICE | | |
| LIBOR USD 1 Month + 4.25%), 9.505%, 4/24/28 | 9,924 | 9,389 |
| | | 85,915 |
| Transportation (—%) | | |
| American Airlines, Inc. bank term loan FRN (CME | | |
| Term SOFR 3 Month + 4.75%), 10.019%, 4/20/28 | 5,000 | 5,100 |
| United Airlines, Inc. bank term loan FRN | | |
| Ser. B, (ICE LIBOR USD 3 Month + 3.75%), | | |
| 9.292%, 4/21/28 | 7,780 | 7,765 |
| | | 12,865 |
| | | |
| Total senior loans (cost $392,312) | | $379,457 |
| | |
| | Principal | |
| ASSET-BACKED SECURITIES (0.1%)* | amount | Value |
| | | |
| NewRez Warehouse Securitization Trust 144A | | |
| FRB Ser. 21-1, Class A, (ICE LIBOR USD 1 Month | | |
| + 0.75%), 5.90%, 5/7/24 | $39,867 | $39,556 |
| Station Place Securitization Trust 144A FRB | | |
| Ser. 23-2, Class A1, (CME Term SOFR 1 Month | | |
| + 0.95%), 6.103%, 6/29/24 | 35,000 | 34,954 |
| |
| 20 Putnam VT Global Asset Allocation Fund |
| | |
| | Principal | |
| ASSET-BACKED SECURITIES (0.1%)* cont. | amount | Value |
| | | |
| Towd Point Asset Trust 144A FRB Ser. 18-SL1, | | |
| Class A, (ICE LIBOR USD 1 Month + 0.60%), | | |
| 5.75%, 1/25/46 | $9,549 | $9,493 |
| Total asset-backed securities (cost $84,270) | | $84,003 |
| | |
| | Principal | |
| CONVERTIBLE BONDS AND NOTES (—%)* | amount | Value |
| | | |
| DISH Network Corp. cv. sr. unsec. notes | | |
| 3.375%, 8/15/26 | $5,000 | $2,538 |
| Nabors Industries, Inc. 144A company guaranty | | |
| cv. sr. unsec. unsub. notes 1.75%, 6/15/29 | 5,000 | 3,743 |
| Realogy Group, LLC/Realogy Co-Issuer | | |
| Corp. company guaranty cv. sr. unsec. notes | | |
| 0.25%, 6/15/26 | 11,000 | 8,212 |
| Total convertible bonds and notes (cost $18,042) | | $14,493 |
| | | |
| | | Principal | |
| | | amount/ | |
| SHORT-TERM INVESTMENTS (2.2%)* | | shares | Value |
| | | | |
| Putnam Short Term Investment Fund | | | |
| Class P 5.23% L | Shares | 541,620 | $541,620 |
| U.S. Treasury Bills 4.997%, 11/2/23 # | | $1,271,000 | 1,248,589 |
| U.S. Treasury Bills 5.269%, 11/16/23 # | | 205,000 | 200,988 |
| U.S. Treasury Bills 5.152%, 10/26/23 # | | 188,000 | 184,877 |
| Total short-term investments (cost $2,177,504) | | $2,176,074 |
| |
| Total investments (cost $95,576,482) | | | $115,985,952 |
Key to holding’s abbreviations
| |
| CME | Chicago Mercantile Exchange |
| DAC | Designated Activity Company |
| FRB | Floating Rate Bonds: The rate shown is the current interest rate |
| | at the close of the reporting period. Rates may be subject to a cap |
| | or floor. For certain securities, the rate may represent a fixed rate |
| | currently in place at the close of the reporting period. |
| FRN | Floating Rate Notes: The rate shown is the current interest rate or |
| | yield at the close of the reporting period. Rates may be subject to |
| | a cap or floor. For certain securities, the rate may represent a fixed |
| rate currently in place at the close of the reporting period. |
| ICE | Intercontinental Exchange |
| IFB | Inverse Floating Rate Bonds, which are securities that pay interest |
| | rates that vary inversely to changes in the market interest rates. As |
| | interest rates rise, inverse floaters produce less current income. The |
| | rate shown is the current interest rate at the close of the reporting |
| | period. Rates may be subject to a cap or floor. |
| IO | Interest Only |
| LIBOR | London Interbank Offered Rate |
| REMICs | Real Estate Mortgage Investment Conduits |
| SOFR | Secured Overnight Financing Rate |
| TBA | To Be Announced Commitments |
Notes to the fund’s portfolio
Unless noted otherwise, the notes to the fund’s portfolio are for the close of the fund’s reporting period, which ran from January 1, 2023 through June 30, 2023 (the reporting period). Within the following notes to the portfolio, references to “Putnam Management” represent Putnam Investment Management, LLC, the fund’s manager, an indirect wholly-owned subsidiary of Putnam Investments, LLC and references to “ASC 820” represent Accounting Standards Codification 820 Fair Value Measurements and Disclosures.
* Percentages indicated are based on net assets of $99,423,016.
† This security is non-income-producing.
‡‡ Income may be received in cash or additional securities at the discretion of the issuer. The rate shown in parenthesis is the rate paid in kind, if applicable.
# This security, in part or in entirety, was pledged and segregated with the broker to cover margin requirements for futures contracts at the close of the reporting period. Collateral at period end totaled $1,565,671 and is included in Investments in securities on the Statement of assets and liabilities (Notes 1 and 9).
c Senior loans are exempt from registration under the Securities Act of 1933, as amended, but contain certain restrictions on resale and cannot be sold publicly. These loans pay interest at rates which adjust periodically. The interest rates shown for senior loans are the current interest rates at the close of the reporting period. Senior loans are also subject to mandatory and/or optional prepayment which cannot be predicted. As a result, the remaining maturity may be substantially less than the stated maturity shown (Notes 1 and 7).
L Affiliated company (Note 5). The rate quoted in the security description is the annualized 7-day yield of the fund at the close of the reporting period.
R Real Estate Investment Trust.
W The rate shown represents the weighted average coupon associated with the underlying mortgage pools. Rates may be subject to a cap or floor.
Unless otherwise noted, the rates quoted in Short-term investments security descriptions represent the weighted average yield to maturity.
Debt obligations are considered secured unless otherwise indicated.
144A after the name of an issuer represents securities exempt from registration under Rule 144A of the Securities Act of 1933, as amended. These securities may be resold in transactions exempt from registration, normally to qualified institutional buyers.
See Note 1 to the financial statements regarding TBA commitments.
The dates shown on debt obligations are the original maturity dates.
| | | | | | |
| FORWARD CURRENCY CONTRACTS at 6/30/23 (aggregate face value $2,868,042) (Unaudited) | | | Unrealized |
| | | Contract | Delivery | | Aggregate | appreciation/ |
| Counterparty | Currency | type* | date | Value | face value | (depreciation) |
| Bank of America N.A. | | | | | | |
| | Canadian Dollar | Buy | 7/19/23 | $12,835 | $12,678 | $157 |
| | Canadian Dollar | Sell | 7/19/23 | 12,835 | 12,805 | (30) |
| | Canadian Dollar | Buy | 10/18/23 | 12,854 | 12,825 | 29 |
| Citibank, N.A. | | | | | | |
| | Danish Krone | Sell | 9/20/23 | 67,762 | 66,792 | (970) |
| Goldman Sachs International | | | | | | |
| | Israeli Shekel | Buy | 7/19/23 | 249,294 | 249,846 | (552) |
| | Israeli Shekel | Sell | 7/19/23 | 249,294 | 259,671 | 10,377 |
| | Israeli Shekel | Sell | 10/18/23 | 250,268 | 250,815 | 547 |
| |
| Putnam VT Global Asset Allocation Fund 21 |
| | | | | | |
| FORWARD CURRENCY CONTRACTS at 6/30/23 (aggregate face value $2,868,042) (Unaudited) cont. | | | Unrealized |
| | | Contract | Delivery | | Aggregate | appreciation/ |
| Counterparty | Currency | type* | date | Value | face value | (depreciation) |
| HSBC Bank USA, National Association | | | | | | |
| | Australian Dollar | Buy | 7/19/23 | $156,207 | $156,947 | $(740) |
| | Australian Dollar | Sell | 7/19/23 | 156,207 | 156,955 | 748 |
| | Hong Kong Dollar | Buy | 8/16/23 | 47,438 | 47,495 | (57) |
| JPMorgan Chase Bank N.A. | | | | | | |
| | British Pound | Sell | 9/20/23 | 178,346 | 173,873 | (4,473) |
| | Japanese Yen | Buy | 8/16/23 | 186,463 | 193,656 | (7,193) |
| | Norwegian Krone | Sell | 9/20/23 | 190,174 | 186,855 | (3,319) |
| | Swedish Krona | Sell | 9/20/23 | 10,813 | 10,953 | 140 |
| Morgan Stanley & Co. International PLC | | | | | | |
| | Canadian Dollar | Buy | 7/19/23 | 76 | 75 | 1 |
| | Canadian Dollar | Sell | 7/19/23 | 76 | 75 | (1) |
| | Canadian Dollar | Buy | 10/18/23 | 76 | 75 | 1 |
| | Euro | Sell | 9/20/23 | 188,623 | 186,691 | (1,932) |
| | Swiss Franc | Buy | 9/20/23 | 87,512 | 86,874 | 638 |
| NatWest Markets PLC | | | | | | |
| | Australian Dollar | Buy | 7/19/23 | 259,034 | 259,398 | (364) |
| | Australian Dollar | Sell | 7/19/23 | 259,034 | 263,373 | 4,339 |
| | Australian Dollar | Sell | 10/18/23 | 103,084 | 102,694 | (390) |
| State Street Bank and Trust Co. | | | | | | |
| | Singapore Dollar | Buy | 8/16/23 | 27,918 | 28,316 | (398) |
| WestPac Banking Corp. | | | | | | |
| | Canadian Dollar | Buy | 7/19/23 | 21,367 | 21,101 | 266 |
| | Canadian Dollar | Sell | 7/19/23 | 21,367 | 21,308 | (59) |
| | Canadian Dollar | Buy | 10/18/23 | 21,398 | 21,339 | 59 |
| | Japanese Yen | Sell | 8/16/23 | 79,820 | 84,557 | 4,737 |
| Unrealized appreciation | | | | | | 22,039 |
| Unrealized (depreciation) | | | | | | (20,478) |
| Total | | | | | | $1,561 |
* The exchange currency for all contracts listed is the United States Dollar.
| | | | | |
| | | | | | Unrealized |
| | Number of | Notional | | Expiration | appreciation/ |
| FUTURES CONTRACTS OUTSTANDING at 6/30/23 (Unaudited) | contracts | amount | Value | date | (depreciation) |
| Russell 2000 Index E-Mini (Long) | 34 | $3,210,848 | $3,236,290 | Sep-23 | $29,401 |
| S&P 500 Index E-Mini (Long) | 3 | 667,557 | 673,238 | Sep-23 | 20,911 |
| S&P 500 Index E-Mini (Short) | 127 | 28,259,913 | 28,500,388 | Sep-23 | (883,059) |
| U.S. Treasury Bond 30 yr (Long) | 11 | 1,395,969 | 1,395,969 | Sep-23 | 921 |
| U.S. Treasury Bond Ultra 30 yr (Long) | 15 | 2,043,281 | 2,043,281 | Sep-23 | 25,216 |
| U.S. Treasury Note 2 yr (Long) | 19 | 3,863,531 | 3,863,531 | Sep-23 | (48,285) |
| U.S. Treasury Note 5 yr (Long) | 41 | 4,390,844 | 4,390,844 | Sep-23 | (76,920) |
| U.S. Treasury Note 10 yr (Long) | 17 | 1,908,516 | 1,908,516 | Sep-23 | (32,179) |
| U.S. Treasury Note 10 yr (Short) | 35 | 3,929,297 | 3,929,297 | Sep-23 | 43,984 |
| Unrealized appreciation | | | | | 120,433 |
| Unrealized (depreciation) | | | | | (1,040,443) |
| Total | | | | | $(920,010) |
| | | | | |
| TBA SALE COMMITMENTS OUTSTANDING at 6/30/23 (Unaudited) | | | Principal | Settlement | |
| (proceeds receivable $11,067,969) | | | amount | date | Value |
| Uniform Mortgage-Backed Securities, 5.50%, 7/1/53 | | | $2,000,000 | 7/13/23 | $1,990,312 |
| Uniform Mortgage-Backed Securities, 5.00%, 7/1/53 | | | 2,000,000 | 7/13/23 | 1,959,453 |
| Uniform Mortgage-Backed Securities, 4.50%, 7/1/53 | | | 2,000,000 | 7/13/23 | 1,922,812 |
| Uniform Mortgage-Backed Securities, 3.50%, 7/1/53 | | | 1,000,000 | 7/13/23 | 911,211 |
| Uniform Mortgage-Backed Securities, 2.50%, 7/1/53 | | | 4,000,000 | 7/13/23 | 3,391,564 |
| Uniform Mortgage-Backed Securities, 2.50%, 8/1/53 | | | 1,000,000 | 8/14/23 | 848,672 |
| Total | | | | | $11,024,024 |
| |
| 22 Putnam VT Global Asset Allocation Fund |
| | | | | | |
| CENTRALLY CLEARED INTEREST RATE SWAP CONTRACTS OUTSTANDING at 6/30/23 (Unaudited) | | |
| | | Upfront | | | | Unrealized |
| | | premium | Termination | Payments | Payments | appreciation/ |
| Notional amount | Value | received (paid) | date | made by fund | received by fund | (depreciation) |
| $4,002,000 | $15,128 E | $(6,121) | 9/20/25 | 4.40% — Annually | US SOFR — Annually | $9,007 |
| 2,493,000 | 9,424 E | 3,818 | 9/20/25 | US SOFR — Annually | 4.40% — Annually | (4,230) |
| 273,000 | 2,364 E | (3,815) | 9/20/28 | US SOFR — Annually | 4.00% — Annually | (1,450) |
| 248,000 | 2,148 E | 3,459 | 9/20/28 | 4.00% — Annually | US SOFR — Annually | 1,311 |
| 926,000 | 7,306 E | (12,677) | 9/20/33 | US SOFR — Annually | 3.60% — Annually | (5,371) |
| 1,218,000 | 9,610 E | 16,645 | 9/20/33 | 3.60% — Annually | US SOFR — Annually | 7,035 |
| 587,000 | 5,154 E | (6,169) | 9/20/53 | US SOFR — Annually | 3.20% — Annually | (1,015) |
| Total | | $(4,860) | | | | $5,287 |
E Extended effective date.
| | | | | | |
| OTC TOTAL RETURN SWAP CONTRACTS OUTSTANDING at 6/30/23 (Unaudited) | | | |
| | | Upfront | | Payments | Total return | Unrealized |
| Swap counterparty/ | | premium | Termination | received (paid) | received by | appreciation/ |
| Notional amount | Value | received (paid) | date | by fund | or paid by fund | (depreciation) |
| Barclays Bank PLC | | | | | | |
| $2,912,480 | $3,164,169 | $— | 6/3/24 | (US SOFR plus 0.40%) — | A basket (BCPUDEAL) of | $243,196 |
| | | | | Monthly | common stocks — Monthly* | |
| 2,911,568 | 3,196,341 | — | 6/3/24 | US SOFR plus 0.25% — | A basket (BCPUDEAS) of | (277,784) |
| | | | | Monthly | common stocks — Monthly* | |
| Goldman Sachs International | | | | | | |
| 4,007,741 | 3,978,198 | — | 12/15/25 | (US SOFR plus 0.40%) — | A basket (GSGLPWDL) of | (30,770) |
| | | | | Monthly | common stocks — Monthly* | |
| 3,671,319 | 3,643,525 | — | 12/15/25 | US SOFR minus 0.25% — | A basket (GSGLPWDS) of | 29,402 |
| | | | | Monthly | common stocks — Monthly* | |
| Upfront premium received | | — | | Unrealized appreciation | | 272,598 |
| Upfront premium (paid) | | — | | Unrealized (depreciation) | | (308,554) |
| Total | | $— | | Total | | $(35,956) |
* The 50 largest components, and any individual component greater than 1% of basket value, are shown below.
| | | | |
| A BASKET (BCPUDEAL) OF COMMON STOCKS | | | | |
| | | | | Percentage |
| Common stocks | Sector | Shares | Value | value |
| Pure Storage, Inc. Class A | Technology | 1,243 | $45,783 | 1.45% |
| Autonation, Inc. | Consumer cyclicals | 278 | 45,767 | 1.45% |
| Allison Transmission Holdings, Inc. | Capital goods | 768 | 43,384 | 1.37% |
| Toll Brothers, Inc. | Consumer cyclicals | 538 | 42,513 | 1.34% |
| Apollo Global Management, Inc. | Financials | 544 | 41,822 | 1.32% |
| Uber Technologies, Inc. | Consumer staples | 960 | 41,429 | 1.31% |
| ON Semiconductor Corp. | Technology | 435 | 41,181 | 1.30% |
| Palo Alto Networks, Inc. | Technology | 161 | 41,022 | 1.30% |
| Manhattan Associates, Inc. | Technology | 201 | 40,105 | 1.27% |
| Constellation Energy Corp. | Utilities and power | 433 | 39,661 | 1.25% |
| General Motors Co. | Consumer cyclicals | 1,021 | 39,375 | 1.24% |
| Unum Group | Financials | 823 | 39,242 | 1.24% |
| ManpowerGroup, Inc. | Consumer staples | 489 | 38,798 | 1.23% |
| O’Reilly Automotive, Inc. | Consumer cyclicals | 40 | 38,086 | 1.20% |
| MGIC Investment Corp. | Financials | 2,407 | 38,013 | 1.20% |
| Penske Automotive Group, Inc. | Consumer cyclicals | 227 | 37,768 | 1.19% |
| Johnson Controls International PLC | Capital goods | 554 | 37,768 | 1.19% |
| Gartner, Inc. | Consumer cyclicals | 106 | 37,194 | 1.18% |
| Procore Technologies, Inc. | Technology | 569 | 37,057 | 1.17% |
| Cadence Design Systems, Inc. | Technology | 158 | 36,970 | 1.17% |
| Targa Resources Corp. | Energy | 482 | 36,649 | 1.16% |
| Booking Holdings, Inc. | Consumer cyclicals | 13 | 36,444 | 1.15% |
| Genuine Parts Co. | Consumer cyclicals | 211 | 35,725 | 1.13% |
| Textron, Inc. | Capital goods | 517 | 34,954 | 1.10% |
| Synopsys, Inc. | Technology | 80 | 34,832 | 1.10% |
| |
| Putnam VT Global Asset Allocation Fund 23 |
| | | | |
| A BASKET (BCPUDEAL) OF COMMON STOCKS cont. | | | | |
| | | | | Percentage |
| Common stocks | Sector | Shares | Value | value |
| Live Nation Entertainment, Inc. | Consumer cyclicals | 380 | $34,606 | 1.09% |
| Freeport-McMoRan, Inc. (Indonesia) | Basic materials | 843 | 33,722 | 1.07% |
| American International Group, Inc. | Financials | 585 | 33,634 | 1.06% |
| NVR, Inc. | Consumer cyclicals | 5 | 33,412 | 1.06% |
| Hologic, Inc. | Health care | 410 | 33,226 | 1.05% |
| Expedia Group, Inc. | Consumer cyclicals | 295 | 32,280 | 1.02% |
| Wyndham Hotels & Resorts, Inc. | Consumer cyclicals | 470 | 32,229 | 1.02% |
| Applied Materials, Inc. | Technology | 221 | 31,954 | 1.01% |
| Valero Energy Corp. | Energy | 271 | 31,731 | 1.00% |
| Ulta Beauty, Inc. | Consumer staples | 67 | 31,403 | 0.99% |
| General Dynamics Corp. | Capital goods | 145 | 31,118 | 0.98% |
| Boyd Gaming Corp. | Consumer cyclicals | 441 | 30,597 | 0.97% |
| NRG Energy, Inc. | Utilities and power | 810 | 30,295 | 0.96% |
| Tapestry, Inc. | Consumer cyclicals | 706 | 30,228 | 0.96% |
| Pinterest, Inc. Class A | Technology | 1,072 | 29,309 | 0.93% |
| Wix.com, Ltd. (Israel) | Technology | 372 | 29,078 | 0.92% |
| Marathon Oil Corp. | Energy | 1,225 | 28,196 | 0.89% |
| TransUnion | Consumer cyclicals | 359 | 28,113 | 0.89% |
| AMETEK, Inc. | Conglomerates | 173 | 27,979 | 0.88% |
| Wintrust Financial Corp. | Financials | 382 | 27,711 | 0.88% |
| Smartsheet, Inc. Class A | Technology | 710 | 27,153 | 0.86% |
| Molina Healthcare, Inc. | Health care | 88 | 26,471 | 0.84% |
| Apartment Income REIT Corp. | Financials | 718 | 25,901 | 0.82% |
| Bio-Rad Laboratories, Inc. Class A | Health care | 68 | 25,881 | 0.82% |
| East West Bancorp, Inc. | Financials | 489 | 25,834 | 0.82% |
| |
| A BASKET (BCPUDEAS) OF COMMON STOCKS | | | | |
| | | | | Percentage |
| Common stocks | Sector | Shares | Value | value |
| Carnival Corp. | Consumer cyclicals | 3,241 | $61,035 | 1.91% |
| Norwegian Cruise Line Holdings, Ltd. | Consumer cyclicals | 2,193 | 47,747 | 1.49% |
| Royal Caribbean Cruises, Ltd. | Consumer cyclicals | 421 | 43,648 | 1.37% |
| Exact Sciences Corp. | Health care | 446 | 41,898 | 1.31% |
| DoubleVerify Holdings, Inc. | Technology | 1,044 | 40,628 | 1.27% |
| Lithia Motors, Inc. | Consumer cyclicals | 133 | 40,532 | 1.27% |
| BWX Technologies, Inc. | Capital goods | 565 | 40,417 | 1.26% |
| Jack Henry & Associates, Inc. | Technology | 238 | 39,839 | 1.25% |
| Equifax, Inc. | Consumer cyclicals | 169 | 39,801 | 1.25% |
| New York Community Bancorp, Inc. | Financials | 3,461 | 38,900 | 1.22% |
| Take-Two Interactive Software, Inc. | Technology | 264 | 38,895 | 1.22% |
| Berkshire Hathaway, Inc. Class B | Financials | 113 | 38,660 | 1.21% |
| Wolfspeed, Inc. | Technology | 693 | 38,514 | 1.20% |
| NortonLifeLock, Inc. | Technology | 2,075 | 38,497 | 1.20% |
| Floor & Decor Holdings, Inc. Class A | Consumer cyclicals | 368 | 38,286 | 1.20% |
| IBM Corp. | Technology | 283 | 37,877 | 1.19% |
| Stanley Black & Decker, Inc. | Consumer cyclicals | 403 | 37,723 | 1.18% |
| ZoomInfo Technologies, Inc. Class A | Technology | 1,472 | 37,372 | 1.17% |
| Amdocs, Ltd. | Technology | 378 | 37,361 | 1.17% |
| Ball Corp. | Capital goods | 635 | 36,954 | 1.16% |
| Tyler Technologies, Inc. | Technology | 87 | 36,231 | 1.13% |
| DT Midstream, Inc. | Energy | 728 | 36,102 | 1.13% |
| Newell Brands, Inc. | Consumer staples | 4,129 | 35,920 | 1.12% |
| Cooper Cos., Inc. (The) | Health care | 93 | 35,739 | 1.12% |
| Texas Instruments, Inc. | Technology | 197 | 35,440 | 1.11% |
| Five Below, Inc. | Consumer cyclicals | 178 | 34,910 | 1.09% |
| Universal Health Services, Inc. Class B | Health care | 220 | 34,698 | 1.09% |
| |
| 24 Putnam VT Global Asset Allocation Fund |
| | | | |
| A BASKET (BCPUDEAS) OF COMMON STOCKS cont. | | | | |
| | | | | Percentage |
| Common stocks | Sector | Shares | Value | value |
| General Electric Co. | Conglomerates | 315 | $34,657 | 1.08% |
| Zoom Video Communications, Inc. Class A | Technology | 503 | 34,167 | 1.07% |
| Tesla, Inc. | Consumer cyclicals | 128 | 33,380 | 1.04% |
| Thor Industries, Inc. | Consumer cyclicals | 321 | 33,273 | 1.04% |
| Wynn Resorts, Ltd. | Consumer cyclicals | 315 | 33,235 | 1.04% |
| Polaris, Inc. | Consumer cyclicals | 275 | 33,202 | 1.04% |
| ICU Medical, Inc. | Health care | 185 | 33,007 | 1.03% |
| Ross Stores, Inc. | Consumer cyclicals | 292 | 32,697 | 1.02% |
| Bunge, Ltd. | Consumer staples | 340 | 32,099 | 1.00% |
| TD SYNNEX Corp. | Technology | 341 | 32,052 | 1.00% |
| T Rowe Price Group, Inc. | Financials | 286 | 32,023 | 1.00% |
| RPM International, Inc. | Basic materials | 352 | 31,619 | 0.99% |
| Welltower, Inc. | Financials | 386 | 31,220 | 0.98% |
| Cabot Oil & Gas Corp. | Energy | 1,203 | 30,436 | 0.95% |
| Ciena Corp. | Technology | 706 | 29,985 | 0.94% |
| CarMax, Inc. | Consumer cyclicals | 357 | 29,878 | 0.93% |
| Digital Realty Trust, Inc. | Financials | 251 | 28,634 | 0.90% |
| Domino’s Pizza, Inc. | Consumer staples | 84 | 28,297 | 0.89% |
| Paramount Global Class B | Consumer cyclicals | 1,766 | 28,097 | 0.88% |
| Boston Beer Co., Inc. (The) Class A | Consumer staples | 90 | 27,717 | 0.87% |
| BioMarin Pharmaceutical, Inc. | Health care | 316 | 27,361 | 0.86% |
| PTC, Inc. | Technology | 188 | 26,686 | 0.83% |
| Watsco, Inc. | Consumer staples | 67 | 25,616 | 0.80% |
| |
| A BASKET (GSGLPWDL) OF COMMON STOCKS | | | | |
| | | | | Percentage |
| Common stocks | Sector | Shares | Value | value |
| Panasonic Holdings Corp. (Japan) | Consumer cyclicals | 1,983 | $24,063 | 0.60% |
| Weyerhaeuser Co. | Basic materials | 711 | 23,827 | 0.60% |
| Ferrari NV (Italy) | Consumer cyclicals | 71 | 23,362 | 0.59% |
| Wolters Kluwer NV (Netherlands) | Consumer cyclicals | 178 | 22,619 | 0.57% |
| BlueScope Steel, Ltd. (Australia) | Basic materials | 1,612 | 22,053 | 0.55% |
| Keysight Technologies, Inc. | Technology | 131 | 21,966 | 0.55% |
| Exor NV (Netherlands) | Financials | 245 | 21,868 | 0.55% |
| Leidos Holdings, Inc. | Technology | 245 | 21,655 | 0.54% |
| Iberdrola SA (Spain) | Utilities and power | 1,654 | 21,563 | 0.54% |
| GoDaddy, Inc. Class A | Technology | 287 | 21,554 | 0.54% |
| E.ON SE (Germany) | Utilities and power | 1,684 | 21,461 | 0.54% |
| Lockheed Martin Corp. | Capital goods | 46 | 21,281 | 0.53% |
| Smiths Group PLC (United Kingdom) | Capital goods | 1,009 | 21,098 | 0.53% |
| Daiwa House Industry Co., Ltd. (Japan) | Consumer cyclicals | 804 | 21,095 | 0.53% |
| Toppan, Inc. (Japan) | Consumer cyclicals | 982 | 21,061 | 0.53% |
| Exxon Mobil Corp. | Energy | 195 | 20,924 | 0.53% |
| NetApp, Inc. | Technology | 274 | 20,915 | 0.53% |
| Chevron Corp. | Energy | 133 | 20,909 | 0.53% |
| PepsiCo, Inc. | Consumer staples | 113 | 20,862 | 0.52% |
| Cummins, Inc. | Capital goods | 85 | 20,842 | 0.52% |
| FactSet Research Systems, Inc. | Consumer cyclicals | 52 | 20,841 | 0.52% |
| Sekisui Chemical Co., Ltd. (Japan) | Financials | 1,453 | 20,835 | 0.52% |
| Garmin, Ltd. | Technology | 199 | 20,768 | 0.52% |
| VeriSign, Inc. | Technology | 92 | 20,750 | 0.52% |
| Secom Co., Ltd. (Japan) | Consumer cyclicals | 307 | 20,665 | 0.52% |
| 3M Co. | Conglomerates | 204 | 20,387 | 0.51% |
| Aristocrat Leisure, Ltd. (Australia) | Consumer cyclicals | 785 | 20,195 | 0.51% |
| Consolidated Edison, Inc. | Utilities and power | 221 | 20,024 | 0.50% |
| Philip Morris International, Inc. | Consumer staples | 204 | 19,890 | 0.50% |
| |
| Putnam VT Global Asset Allocation Fund 25 |
| | | | |
| A BASKET (GSGLPWDL) OF COMMON STOCKS cont. | | | | |
| | | | | Percentage |
| Common stocks | Sector | Shares | Value | value |
| Coles Group, Ltd. (Australia) | Consumer staples | 1,616 | $19,816 | 0.50% |
| Clariant AG (Switzerland) | Basic materials | 1,351 | 19,512 | 0.49% |
| Kirin Holdings Co., Ltd. (Japan) | Consumer staples | 1,331 | 19,357 | 0.49% |
| Carlsberg A/S Class B (Denmark) | Consumer staples | 121 | 19,296 | 0.49% |
| Deutsche Lufthansa AG (Germany) | Transportation | 1,872 | 19,160 | 0.48% |
| Loblaw Cos, Ltd. (Canada) | Consumer staples | 206 | 18,836 | 0.47% |
| Elisa Oyj (Finland) | Communication services | 352 | 18,801 | 0.47% |
| VMware, Inc. Class A | Technology | 131 | 18,799 | 0.47% |
| AT&T, Inc. | Communication services | 1,152 | 18,372 | 0.46% |
| Telefonica SA (Spain) | Communication services | 4,462 | 18,089 | 0.45% |
| Siemens AG (Germany) | Conglomerates | 108 | 18,029 | 0.45% |
| ConocoPhillips | Energy | 173 | 17,944 | 0.45% |
| Colgate-Palmolive Co. | Consumer staples | 233 | 17,932 | 0.45% |
| Repsol SA (Spain) | Energy | 1,227 | 17,837 | 0.45% |
| SSE PLC (United Kingdom) | Utilities and power | 758 | 17,741 | 0.45% |
| eBay, Inc. | Technology | 396 | 17,687 | 0.44% |
| Mondi PLC (Austria) | Basic materials | 1,154 | 17,592 | 0.44% |
| George weston, Ltd. (Canada) | Consumer staples | 148 | 17,470 | 0.44% |
| Empire Co., Ltd. (Canada) | Consumer staples | 604 | 17,186 | 0.43% |
| Metro, Inc. (Canada) | Consumer staples | 303 | 17,148 | 0.43% |
| Keurig Dr Pepper, Inc. | Consumer staples | 548 | 17,147 | 0.43% |
| |
| A BASKET (GSGLPWDS) OF COMMON STOCKS | | | | |
| | | | | Percentage |
| Common stocks | Sector | Shares | Value | value |
| Toyota Motor Corp. (Japan) | Consumer cyclicals | 1,405 | $22,470 | 0.62% |
| Equifax, Inc. | Consumer cyclicals | 90 | 21,177 | 0.58% |
| Magna International, Inc. (Canada) | Consumer cyclicals | 363 | 20,501 | 0.56% |
| Ingersoll Rand, Inc. | Capital goods | 312 | 20,395 | 0.56% |
| Visa, Inc. Class A | Financials | 85 | 20,277 | 0.56% |
| Air Liquide SA (France) | Basic materials | 111 | 19,951 | 0.55% |
| Waste Connections, Inc. | Capital goods | 139 | 19,856 | 0.54% |
| Allianz SE (Germany) | Financials | 84 | 19,601 | 0.54% |
| Southern Co. (The) | Utilities and power | 272 | 19,112 | 0.52% |
| Ferrovial SE | Basic materials | 605 | 19,112 | 0.52% |
| Realty Income Corp. | Financials | 320 | 19,106 | 0.52% |
| T-Mobile US, Inc. | Communication services | 137 | 19,025 | 0.52% |
| Oriental Land Co., Ltd. (Japan) | Consumer cyclicals | 490 | 19,001 | 0.52% |
| Aeon Co., Ltd. (Japan) | Consumer cyclicals | 929 | 18,943 | 0.52% |
| Duke Energy Corp. | Utilities and power | 211 | 18,925 | 0.52% |
| AXA SA (France) | Financials | 640 | 18,886 | 0.52% |
| Imperial Brands PLC (United Kingdom) | Consumer staples | 855 | 18,885 | 0.52% |
| Telus Corp. (Canada) | Communication services | 957 | 18,626 | 0.51% |
| Pernod Ricard SA (France) | Consumer staples | 84 | 18,603 | 0.51% |
| Davide Campari-Milano NV (Italy) | Consumer staples | 1,340 | 18,559 | 0.51% |
| Berkeley Group Holdings PLC (The) (United Kingdom) | Consumer cyclicals | 370 | 18,414 | 0.51% |
| Wilmar International, Ltd. (Singapore) | Basic materials | 6,536 | 18,365 | 0.50% |
| Masco Corp. | Consumer cyclicals | 316 | 18,151 | 0.50% |
| Keyence Corp. (Japan) | Technology | 39 | 18,126 | 0.50% |
| Heineken NV (Netherlands) | Consumer staples | 176 | 18,107 | 0.50% |
| Nexi SpA (Italy) | Consumer cyclicals | 2,299 | 18,015 | 0.49% |
| CMS Energy Corp. | Utilities and power | 306 | 18,002 | 0.49% |
| Orange SA (France) | Communication services | 1,541 | 18,001 | 0.49% |
| EssilorLuxottica SA (France) | Health care | 94 | 17,771 | 0.49% |
| Orica, Ltd. (Australia) | Basic materials | 1,798 | 17,767 | 0.49% |
| S&P Global, Inc. | Consumer cyclicals | 44 | 17,745 | 0.49% |
| |
| 26 Putnam VT Global Asset Allocation Fund |
| | | | |
| A BASKET (GSGLPWDS) OF COMMON STOCKS cont. | | | | |
| | | | | Percentage |
| Common stocks | Sector | Shares | Value | value |
| Dollar Tree, Inc. | Consumer cyclicals | 123 | $17,698 | 0.49% |
| Southwest Airlines Co. | Transportation | 486 | 17,598 | 0.48% |
| UPM-Kymmene OYJ (Finland) | Basic materials | 587 | 17,477 | 0.48% |
| Raytheon Technologies Corp. | Capital goods | 177 | 17,338 | 0.48% |
| Straumann Holding AG (Switzerland) | Health care | 107 | 17,335 | 0.48% |
| CGI Group, Inc. Class A (Canada) | Technology | 164 | 17,279 | 0.47% |
| Trend Micro, Inc. (Japan) | Technology | 354 | 17,032 | 0.47% |
| Target Corp. | Consumer cyclicals | 128 | 16,894 | 0.46% |
| CK Hutchison Holdings, Ltd. (Hong Kong) | Consumer staples | 2,743 | 16,749 | 0.46% |
| Ramsay Health Care, Ltd. (Australia) | Health care | 444 | 16,634 | 0.46% |
| ANA Holdings, Inc. (Japan) | Transportation | 690 | 16,384 | 0.45% |
| Verizon Communications, Inc. | Communication services | 435 | 16,180 | 0.44% |
| Kyocera Corp. (Japan) | Technology | 295 | 15,948 | 0.44% |
| Keppel Corp., Ltd. (Singapore) | Capital goods | 3,213 | 15,943 | 0.44% |
| Atmos Energy Corp. | Utilities and power | 135 | 15,654 | 0.43% |
| Enbridge, Inc. (Canada) | Utilities and power | 418 | 15,523 | 0.43% |
| Swisscom AG (Switzerland) | Communication services | 25 | 15,474 | 0.42% |
| Kubota Corp. (Japan) | Capital goods | 1,061 | 15,434 | 0.42% |
| Broadridge Financial Solutions, Inc. | Financials | 92 | 15,277 | 0.42% |
| | | | | | | |
| OTC CREDIT DEFAULT CONTRACTS OUTSTANDING — PROTECTION SOLD at 6/30/23 (Unaudited) | | | | |
| | | Upfront | | | | | |
| | | premium | | | Termi- | | Unrealized |
| Swap counterparty/ | | received | Notional | | nation | Payments | appreciation/ |
| Referenced debt* | Rating*** | (paid)** | amount | Value | date | received by fund | (depreciation) |
| Bank of America N.A. | | | | | | | |
| CMBX NA BBB–.6 Index | BB+/P | $273 | $2,280 | $494 | 5/11/63 | 300 bp — Monthly | $(219) |
| CMBX NA BBB–.6 Index | BB+/P | 482 | 4,560 | 987 | 5/11/63 | 300 bp — Monthly | (503) |
| CMBX NA BBB–.6 Index | BB+/P | 926 | 8,550 | 1,851 | 5/11/63 | 300 bp — Monthly | (921) |
| CMBX NA BBB–.6 Index | BB+/P | 912 | 9,120 | 1,974 | 5/11/63 | 300 bp — Monthly | (1,058) |
| Citigroup Global Markets, Inc. | | | | | | | |
| CMBX NA A.6 Index | A/P | 120 | 380 | 54 | 5/11/63 | 200 bp — Monthly | 66 |
| CMBX NA A.6 Index | A/P | 2,194 | 6,841 | 977 | 5/11/63 | 200 bp — Monthly | 1,219 |
| CMBX NA A.6 Index | A/P | 3,215 | 10,261 | 1,465 | 5/11/63 | 200 bp — Monthly | 1,753 |
| CMBX NA A.6 Index | A/P | 5,330 | 17,101 | 2,442 | 5/11/63 | 200 bp — Monthly | 2,893 |
| CMBX NA BB.11 Index | BB–/P | 1,130 | 2,000 | 806 | 11/18/54 | 500 bp — Monthly | 326 |
| CMBX NA BB.14 Index | BB/P | 329 | 3,000 | 1,301 | 12/16/72 | 500 bp — Monthly | (970) |
| CMBX NA BB.6 Index | B/P | 2,008 | 9,434 | 3,791 | 5/11/63 | 500 bp — Monthly | (1,774) |
| CMBX NA BB.7 Index | B-/P | 970 | 19,000 | 7,887 | 1/17/47 | 500 bp — Monthly | (6,901) |
| CMBX NA BB.9 Index | B/P | 817 | 4,000 | 1,668 | 9/17/58 | 500 bp — Monthly | (848) |
| CMBX NA BBB–.10 Index | BB+/P | 372 | 3,000 | 911 | 11/17/59 | 300 bp — Monthly | (537) |
| CMBX NA BBB–.10 Index | BB+/P | 545 | 5,000 | 1,519 | 11/17/59 | 300 bp — Monthly | (971) |
| CMBX NA BBB–.10 Index | BB+/P | 620 | 5,000 | 1,519 | 11/17/59 | 300 bp — Monthly | (896) |
| CMBX NA BBB–.11 Index | BBB–/P | 63 | 1,000 | 243 | 11/18/54 | 300 bp — Monthly | (179) |
| Credit Suisse International | | | | | | | |
| CMBX NA A.7 Index | BBB/P | 37 | 927 | 74 | 1/17/47 | 200 bp — Monthly | (36) |
| CMBX NA A.7 Index | BBB/P | 291 | 6,490 | 515 | 1/17/47 | 200 bp — Monthly | (222) |
| CMBX NA BB.7 Index | B-/P | 401 | 3,000 | 1,245 | 1/17/47 | 500 bp — Monthly | (842) |
| CMBX NA BBB–.7 Index | BB–/P | 237 | 3,000 | 600 | 1/17/47 | 300 bp — Monthly | (361) |
| CMBX NA BBB–.7 Index | BB–/P | 1,384 | 21,000 | 4,198 | 1/17/47 | 300 bp — Monthly | (2,806) |
| Goldman Sachs International | | | | | | | |
| CMBX NA A.13 Index | A-/P | (5) | 1,000 | 122 | 12/16/72 | 200 bp — Monthly | (127) |
| CMBX NA BBB–.7 Index | BB–/P | 887 | 12,000 | 2,399 | 1/17/47 | 300 bp — Monthly | (1,506) |
| JPMorgan Securities LLC | | | | | | | |
| CMBX NA BB.6 Index | B/P | 3,089 | 4,043 | 1,625 | 5/11/63 | 500 bp — Monthly | 1,468 |
| CMBX NA BBB–.13 Index | BBB–/P | 132 | 1,000 | 308 | 12/16/72 | 300 bp — Monthly | (176) |
| CMBX NA BBB–.8 Index | BB–/P | 156 | 1,000 | 200 | 10/17/57 | 300 bp — Monthly | (44) |
| |
| Putnam VT Global Asset Allocation Fund 27 |
| | | | | | | |
| OTC CREDIT DEFAULT CONTRACTS OUTSTANDING — PROTECTION SOLD at 6/30/23 (Unaudited) cont. | | | | |
| | | Upfront | | | | | |
| | | premium | | | Termi- | | Unrealized |
| Swap counterparty/ | | received | Notional | | nation | Payments | appreciation/ |
| Referenced debt* | Rating*** | (paid)** | amount | Value | date | received by fund | (depreciation) |
| Morgan Stanley & Co. International PLC | | | | | | |
| CMBX NA BB.6 Index | B/P | $737 | $2,022 | $812 | 5/11/63 | 500 bp — Monthly | $(74) |
| CMBX NA BB.6 Index | B/P | 1,478 | 4,043 | 1,625 | 5/11/63 | 500 bp — Monthly | (143) |
| Upfront premium received | | 29,135 | Unrealized appreciation | | | 7,725 |
| Upfront premium (paid) | | (5) | Unrealized (depreciation) | | (22,114) |
| Total | | $29,130 | Total | | | $(14,389) |
* Payments related to the referenced debt are made upon a credit default event.
** Upfront premium is based on the difference between the original spread on issue and the market spread on day of execution.
*** Ratings for an underlying index represent the average of the ratings of all the securities included in that index. The Moody’s, Standard & Poor’s or Fitch ratings are believed to be the most recent ratings available at June 30, 2023. Securities rated by Fitch are indicated by “/F.” Securities rated by Putnam are indicated by “/P.” The Putnam rating categories are comparable to the Standard & Poor’s classifications.
| | | | | | |
| OTC CREDIT DEFAULT CONTRACTS OUTSTANDING — PROTECTION PURCHASED at 6/30/23 (Unaudited) | | | |
| | Upfront | | | | | |
| | premium | | | Termi- | Payments | Unrealized |
| Swap counterparty/ | received | Notional | | nation | (paid) | appreciation/ |
| Referenced debt* | (paid)** | amount | Value | date | by fund | (depreciation) |
| Citigroup Global Markets, Inc. | | | | | | |
| CMBX NA A.6 Index | $(82) | $380 | $54 | 5/11/63 | (200 bp) — Monthly | $(28) |
| CMBX NA BB.10 Index | (1,688) | 7,000 | 3,198 | 11/17/59 | (500 bp) — Monthly | 1,504 |
| CMBX NA BB.10 Index | (1,785) | 7,000 | 3,198 | 11/17/59 | (500 bp) — Monthly | 1,407 |
| CMBX NA BB.10 Index | (219) | 2,000 | 914 | 11/17/59 | (500 bp) — Monthly | 693 |
| CMBX NA BB.10 Index | (209) | 2,000 | 914 | 11/17/59 | (500 bp) — Monthly | 703 |
| CMBX NA BB.9 Index | (81) | 2,000 | 834 | 9/17/58 | (500 bp) — Monthly | 752 |
| CMBX NA BB.9 Index | (103) | 1,000 | 417 | 9/17/58 | (500 bp) — Monthly | 313 |
| CMBX NA BBB–.10 Index | (437) | 2,000 | 607 | 11/17/59 | (300 bp) — Monthly | 170 |
| CMBX NA BBB–.12 Index | (352) | 1,000 | 319 | 8/17/61 | (300 bp) — Monthly | (34) |
| CMBX NA BBB–.12 Index | (60) | 1,000 | 319 | 8/17/61 | (300 bp) — Monthly | 259 |
| CMBX NA BBB–.6 Index | (700) | 6,270 | 1,357 | 5/11/63 | (300 bp) — Monthly | 654 |
| CMBX NA BBB–.6 Index | (2,545) | 4,560 | 987 | 5/11/63 | (300 bp) — Monthly | (1,560) |
| CMBX NA BBB–.6 Index | (556) | 1,140 | 247 | 5/11/63 | (300 bp) — Monthly | (309) |
| Credit Suisse International | | | | | | |
| CMBX NA BB.10 Index | (534) | 4,000 | 1,827 | 11/17/59 | (500 bp) — Monthly | 1,290 |
| CMBX NA BB.10 Index | (476) | 4,000 | 1,827 | 11/17/59 | (500 bp) — Monthly | 1,348 |
| CMBX NA BB.10 Index | (249) | 2,000 | 914 | 11/17/59 | (500 bp) — Monthly | 663 |
| CMBX NA BB.7 Index | (512) | 19,542 | 7,852 | 5/11/63 | (500 bp) — Monthly | 7,324 |
| CMBX NA BB.7 Index | (1,291) | 7,000 | 2,906 | 1/17/47 | (500 bp) — Monthly | 1,609 |
| CMBX NA BB.7 Index | (1,151) | 7,000 | 2,906 | 1/17/47 | (500 bp) — Monthly | 1,748 |
| Goldman Sachs International | | | | | | |
| CMBX NA A.6 Index | (667) | 3,040 | 434 | 5/11/63 | (200 bp) — Monthly | (233) |
| CMBX NA A.6 Index | (578) | 2,660 | 380 | 5/11/63 | (200 bp) — Monthly | (199) |
| CMBX NA A.6 Index | (578) | 2,660 | 380 | 5/11/63 | (200 bp) — Monthly | (199) |
| CMBX NA A.6 Index | (523) | 2,280 | 326 | 5/11/63 | (200 bp) — Monthly | (198) |
| CMBX NA A.6 Index | (430) | 1,900 | 271 | 5/11/63 | (200 bp) — Monthly | (159) |
| CMBX NA A.6 Index | (327) | 1,520 | 217 | 5/11/63 | (200 bp) — Monthly | (110) |
| CMBX NA A.6 Index | (236) | 1,140 | 163 | 5/11/63 | (200 bp) — Monthly | (74) |
| CMBX NA BB.7 Index | (819) | 5,000 | 2,076 | 1/17/47 | (500 bp) — Monthly | 1,252 |
| CMBX NA BB.7 Index | (812) | 4,000 | 1,660 | 1/17/47 | (500 bp) — Monthly | 845 |
| CMBX NA BBB–.12 Index | (2,509) | 14,000 | 4,472 | 8/17/61 | (300 bp) — Monthly | 1,955 |
| CMBX NA BBB–.12 Index | (780) | 4,000 | 1,278 | 8/17/61 | (300 bp) — Monthly | 496 |
| CMBX NA BBB–.12 Index | (373) | 2,000 | 639 | 8/17/61 | (300 bp) — Monthly | 265 |
| JPMorgan Securities LLC | | | | | | |
| CMBX NA A.6 Index | (243) | 1,140 | 163 | 5/11/63 | (200 bp) — Monthly | (80) |
| CMBX NA A.6 Index | (244) | 1,140 | 163 | 5/11/63 | (200 bp) — Monthly | (82) |
| CMBX NA A.7 Index | (169) | 7,417 | 589 | 1/17/47 | (200 bp) — Monthly | 418 |
| |
| 28 Putnam VT Global Asset Allocation Fund |
| | | | | | |
| OTC CREDIT DEFAULT CONTRACTS OUTSTANDING — PROTECTION PURCHASED at 6/30/23 (Unaudited) cont. | | | |
| | Upfront | | | | | |
| | premium | | | Termi- | Payments | Unrealized |
| Swap counterparty/ | received | Notional | | nation | (paid) | appreciation/ |
| Referenced debt* | (paid)** | amount | Value | date | by fund | (depreciation) |
| JPMorgan Securities LLC cont. | | | | | | |
| CMBX NA BBB–.10 Index | $(2,396) | $19,000 | $5,770 | 11/17/59 | (300 bp) — Monthly | $3,365 |
| CMBX NA BBB–.11 Index | (110) | 1,000 | 243 | 11/18/54 | (300 bp) — Monthly | 132 |
| CMBX NA BBB–.6 Index | (4,906) | 12,540 | 2,715 | 5/11/63 | (300 bp) — Monthly | (2,198) |
| CMBX NA BBB–.7 Index | (6,573) | 28,000 | 5,597 | 1/17/47 | (300 bp) — Monthly | (990) |
| Merrill Lynch International | | | | | | |
| CMBX NA BB.10 Index | (228) | 4,000 | 1,827 | 11/17/59 | (500 bp) — Monthly | 1,596 |
| CMBX NA BB.11 Index | (494) | 1,000 | 403 | 11/18/54 | (500 bp) — Monthly | (92) |
| CMBX NA BBB–.7 Index | (328) | 4,000 | 800 | 1/17/47 | (300 bp) — Monthly | 470 |
| CMBX NA BBB–.9 Index | (185) | 1,000 | 239 | 9/17/58 | (300 bp) — Monthly | 53 |
| Morgan Stanley & Co. International PLC | | | | | | |
| CMBX NA A.6 Index | (1,259) | 4,940 | 705 | 5/11/63 | (200 bp) — Monthly | (556) |
| CMBX NA A.6 Index | (980) | 4,560 | 651 | 5/11/63 | (200 bp) — Monthly | (330) |
| CMBX NA A.6 Index | (514) | 2,280 | 326 | 5/11/63 | (200 bp) — Monthly | (189) |
| CMBX NA A.6 Index | (574) | 2,280 | 326 | 5/11/63 | (200 bp) — Monthly | (249) |
| CMBX NA A.6 Index | (483) | 1,900 | 271 | 5/11/63 | (200 bp) — Monthly | (212) |
| CMBX NA A.6 Index | (168) | 760 | 109 | 5/11/63 | (200 bp) — Monthly | (59) |
| CMBX NA BB.10 Index | (470) | 2,000 | 914 | 11/17/59 | (500 bp) — Monthly | 442 |
| CMBX NA BB.10 Index | (304) | 1,000 | 457 | 11/17/59 | (500 bp) — Monthly | 152 |
| CMBX NA BB.7 Index | (193) | 1,000 | 415 | 1/17/47 | (500 bp) — Monthly | 221 |
| CMBX NA BB.9 Index | (61) | 1,000 | 417 | 9/17/58 | (500 bp) — Monthly | 355 |
| CMBX NA BBB–.10 Index | (6,792) | 39,000 | 11,844 | 11/17/59 | (300 bp) — Monthly | 5,033 |
| CMBX NA BBB–.10 Index | (240) | 2,000 | 607 | 11/17/59 | (300 bp) — Monthly | 367 |
| CMBX NA BBB–.10 Index | (286) | 2,000 | 607 | 11/17/59 | (300 bp) — Monthly | 320 |
| CMBX NA BBB–.12 Index | (3,125) | 24,000 | 7,666 | 8/17/61 | (300 bp) — Monthly | 4,528 |
| CMBX NA BBB–.13 Index | (62) | 1,000 | 308 | 12/16/72 | (300 bp) — Monthly | 246 |
| CMBX NA BBB–.7 Index | (408) | 4,000 | 800 | 1/17/47 | (300 bp) — Monthly | 390 |
| CMBX NA BBB–.8 Index | (127) | 1,000 | 200 | 10/17/57 | (300 bp) — Monthly | 73 |
| Upfront premium received | — | | Unrealized appreciation | 43,411 |
| Upfront premium (paid) | (53,584) | | Unrealized (depreciation) | (8,140) |
| Total | $(53,584) | | Total | | $35,271 |
* Payments related to the referenced debt are made upon a credit default event.
** Upfront premium is based on the difference between the original spread on issue and the market spread on day of execution.
| | | | | | | |
| CENTRALLY CLEARED CREDIT DEFAULT CONTRACTS OUTSTANDING — PROTECTION SOLD at 6/30/23 (Unaudited) | | |
| | | Upfront | | | | | |
| | | premium | | | Termi- | Payments | Unrealized |
| | | received | Notional | | nation | received | appreciation/ |
| Referenced debt* | Rating*** | (paid)** | amount | Value | date | by fund | (depreciation) |
| CDX NA HY Series 40 Index | B+/P | $2,216 | $684,000 | $19,077 | 6/20/28 | 500 bp — | $23,274 |
| | | | | | | Quarterly | |
| CDX NA IG Series 40 Index | BBB+/P | (28,582) | 3,050,000 | 45,476 | 6/20/28 | 100 bp — | 17,826 |
| | | | | | | Quarterly | |
| Total | | $(26,366) | | | | | $41,100 |
* Payments related to the referenced debt are made upon a credit default event.
** Upfront premium is based on the difference between the original spread on issue and the market spread on day of execution.
***Ratings for an underlying index represent the average of the ratings of all the securities included in that index. The Moody’s, Standard & Poor’s or Fitch ratings are believed to be the most recent ratings available at June 30, 2023. Securities rated by Fitch are indicated by “/F.” Securities rated by Putnam are indicated by “/P.” The Putnam rating categories are comparable to the Standard & Poor’s classifications.
| |
| Putnam VT Global Asset Allocation Fund 29 |
ASC 820 establishes a three-level hierarchy for disclosure of fair value measurements. The valuation hierarchy is based upon the transparency of inputs to the valuation of the fund’s investments. The three levels are defined as follows:
Level 1: Valuations based on quoted prices for identical securities in active markets.
Level 2: Valuations based on quoted prices in markets that are not active or for which all significant inputs are observable, either directly or indirectly.
Level 3: Valuations based on inputs that are unobservable and significant to the fair value measurement.
The following is a summary of the inputs used to value the fund’s net assets as of the close of the reporting period:
| | | |
| | | Valuation inputs | |
| Investments in securities: | Level 1 | Level 2 | Level 3 |
| Common stocks*: | | | |
| Basic materials | $2,875,025 | $327,946 | $— |
| Capital goods | 3,252,894 | 126,956 | — |
| Communication services | 1,232,084 | 252,061 | — |
| Conglomerates | 630,206 | 271,108 | — |
| Consumer cyclicals | 11,130,187 | 367,638 | — |
| Consumer staples | 5,888,588 | 532,335 | — |
| Energy | 2,822,273 | — | — |
| Financials | 8,957,954 | 481,754 | — |
| Health care | 9,634,716 | 172,447 | — |
| Technology | 23,079,113 | 481,910 | — |
| Transportation | 943,883 | 115,998 | — |
| Utilities and power | 1,971,204 | 104,896 | — |
| Total common stocks | 72,418,127 | 3,235,049 | — |
| Asset-backed securities | — | 84,003 | — |
| Convertible bonds and notes | — | 14,493 | — |
| Corporate bonds and notes | — | 12,357,345 | — |
| Foreign government and agency bonds and notes | — | 410,521 | — |
| Mortgage-backed securities | — | 2,974,784 | — |
| Senior loans | — | 379,457 | — |
| U.S. government and agency mortgage obligations | — | 21,936,099 | — |
| Short-term investments | — | 2,176,074 | — |
| Totals by level | $72,418,127 | $43,567,825 | $— |
| |
| | | Valuation inputs | |
| Other financial instruments: | Level 1 | Level 2 | Level 3 |
| Forward currency contracts | $— | $1,561 | $— |
| Futures contracts | (920,010) | — | — |
| TBA sale commitments | — | (11,024,024) | — |
| Interest rate swap contracts | — | 10,147 | — |
| Total return swap contracts | — | (35,956) | — |
| Credit default contracts | — | 112,802 | — |
| Totals by level | $(920,010) | $(10,935,470) | $— |
* Common stock classifications are presented at the sector level, which may differ from the fund’s portfolio presentation.
The accompanying notes are an integral part of these financial statements.
| |
| 30 Putnam VT Global Asset Allocation Fund |
Statement of assets and liabilities
6/30/23 (Unaudited)
| |
| Assets | |
| Investment in securities, at value (Notes 1 and 9): | |
| Unaffiliated issuers (identified cost $95,034,862) | $115,444,332 |
| Affiliated issuers (identified cost $541,620) (Note 5) | 541,620 |
| Cash | 11,292 |
| Foreign currency (cost $5,333) (Note 1) | 5,091 |
| Dividends, interest and other receivables | 335,991 |
| Foreign tax reclaim | 42,776 |
| Receivable for shares of the fund sold | 6,409 |
| Receivable for investments sold | 1,239,328 |
| Receivable for sales of TBA securities (Note 1) | 6,427,135 |
| Receivable for variation margin on futures contracts (Note 1) | 18,516 |
| Receivable for variation margin on centrally cleared swap contracts (Note 1) | 14,364 |
| Unrealized appreciation on forward currency contracts (Note 1) | 22,039 |
| Unrealized appreciation on OTC swap contracts (Note 1) | 323,734 |
| Premium paid on OTC swap contracts (Note 1) | 53,589 |
| Receivable from broker (Note 1) | 825 |
| Deposits with broker (Note 1) | 184,481 |
| Total assets | 124,671,522 |
| |
| Liabilities | |
| Payable for investments purchased | 233,265 |
| Payable for purchases of TBA securities (Note 1) | 12,976,916 |
| Payable for shares of the fund repurchased | 65,781 |
| Payable for compensation of Manager (Note 2) | 32,327 |
| Payable for custodian fees (Note 2) | 34,152 |
| Payable for investor servicing fees (Note 2) | 11,454 |
| Payable for Trustee compensation and expenses (Note 2) | 80,289 |
| Payable for administrative services (Note 2) | 382 |
| Payable for distribution fees (Note 2) | 6,416 |
| Payable for variation margin on futures contracts (Note 1) | 310,685 |
| Payable for variation margin on centrally cleared swap contracts (Note 1) | 727 |
| Unrealized depreciation on OTC swap contracts (Note 1) | 338,808 |
| Premium received on OTC swap contracts (Note 1) | 29,135 |
| Unrealized depreciation on forward currency contracts (Note 1) | 20,478 |
| TBA sale commitments, at value (proceeds receivable $11,067,969) (Note 1) | 11,024,024 |
| Other accrued expenses | 83,667 |
| Total liabilities | 25,248,506 |
| | |
| Net assets | $99,423,016 |
| |
| Represented by | |
| Paid-in capital (Unlimited shares authorized) (Notes 1 and 4) | $81,712,021 |
| Total distributable earnings (Note 1) | 17,710,995 |
| Total — Representing net assets applicable to capital shares outstanding | $99,423,016 |
| | |
| Computation of net asset value Class IA | |
| Net assets | $67,968,637 |
| Number of shares outstanding | 4,159,449 |
| Net asset value, offering price and redemption price per share (net assets divided by number of shares outstanding) | $16.34 |
| | |
| Computation of net asset value Class IB | |
| Net assets | $31,454,379 |
| Number of shares outstanding | 1,889,868 |
| Net asset value, offering price and redemption price per share (net assets divided by number of shares outstanding) | $16.64 |
The accompanying notes are an integral part of these financial statements.
| |
| Putnam VT Global Asset Allocation Fund 31 |
Statement of operations
Six months ended 6/30/23 (Unaudited)
| |
| Investment income | |
| Dividends (net of foreign tax of $30,809) | $752,543 |
| Interest (net of foreign tax of $46) (including interest income of $33,430 from investments in affiliated issuers) (Note 5) | 601,158 |
| Securities lending (net of expenses) (Notes 1 and 5) | 651 |
| Total investment income | 1,354,352 |
| |
| Expenses | |
| Compensation of Manager (Note 2) | 289,119 |
| Investor servicing fees (Note 2) | 34,531 |
| Custodian fees (Note 2) | 34,599 |
| Trustee compensation and expenses (Note 2) | 2,163 |
| Distribution fees (Note 2) | 39,020 |
| Administrative services (Note 2) | 1,179 |
| Auditing and tax fees | 65,689 |
| Other | 18,719 |
| Fees waived and reimbursed by Manager (Note 5) | (24,036) |
| Total expenses | 460,983 |
| | |
| Expense reduction (Note 2) | (225) |
| Net expenses | 460,758 |
| | |
| Net investment income | 893,594 |
| | |
| Realized and unrealized gain (loss) | |
| Net realized gain (loss) on: | |
| Securities from unaffiliated issuers (Notes 1 and 3) | (92,116) |
| Foreign currency transactions (Note 1) | (2,719) |
| Forward currency contracts (Note 1) | 66,443 |
| Futures contracts (Note 1) | (1,747,778) |
| Swap contracts (Note 1) | 167,459 |
| Total net realized loss | (1,608,711) |
| Change in net unrealized appreciation (depreciation) on: | |
| Securities from unaffiliated issuers and TBA sale commitments | 11,165,409 |
| Assets and liabilities in foreign currencies | 1,009 |
| Forward currency contracts | (15,868) |
| Futures contracts | (1,457,457) |
| Swap contracts | (13,073) |
| Total change in net unrealized appreciation | 9,680,020 |
| | |
| Net gain on investments | 8,071,309 |
| | |
| Net increase in net assets resulting from operations | $8,964,903 |
The accompanying notes are an integral part of these financial statements.
| |
| 32 Putnam VT Global Asset Allocation Fund |
Statement of changes in net assets
| | | |
| | | Six months | |
| | | ended | Year ended |
| | | 6/30/23* | 12/31/22 |
| Increase (decrease) in net assets | | | |
| Operations: | | | |
| Net investment income | | $893,594 | $1,606,900 |
| Net realized loss on investments and foreign currency transactions | | (1,608,711) | (582,815) |
| Change in net unrealized appreciation (depreciation) of investments and assets and liabilities in foreign currencies | | 9,680,020 | (21,103,218) |
| Net increase (decrease) in net assets resulting from operations | | 8,964,903 | (20,079,133) |
| Distributions to shareholders (Note 1): | | | |
| From ordinary income | | | |
| Net investment income | | | |
| Class IA | | (1,231,765) | (1,252,464) |
| Class IB | | (480,710) | (478,336) |
| Net realized short-term gain on investments | | | |
| Class IA | | — | (2,725,827) |
| Class IB | | — | (1,262,870) |
| From net realized long-term gain on investments | | | |
| Class IA | | — | (4,278,358) |
| Class IB | | — | (1,982,152) |
| Decrease from capital share transactions (Note 4) | | (4,908,245) | (935,371) |
| Total increase (decrease) in net assets | | 2,344,183 | (32,994,511) |
| Net assets: | | | |
| Beginning of period | | 97,078,833 | 130,073,344 |
| End of period | | $99,423,016 | $97,078,833 |
* Unaudited.
The accompanying notes are an integral part of these financial statements.
| |
| Putnam VT Global Asset Allocation Fund 33 |
Financial highlights
(For a common share outstanding throughout the period)
| | | | | | | | | | | | | |
| INVESTMENT OPERATIONS: | | | | | LESS DISTRIBUTIONS: | | | RATIOS AND SUPPLEMENTAL DATA: |
| Period ended | Net asset value, beginning of period | Net investment income (loss)a | Net realized and unrealized gain (loss) on investments | Total from investment operations | From net investment income | From net realized gain on investments | Total distributions | Net asset value, end of period | Total return at net asset value (%)b,c | Net assets, end of period (in thousands) | Ratio of expenses to average net assets (%)b,d | Ratio of net investment income (loss) to average net assets (%) | Portfolio turnover (%)e |
| Class IA | | | | | | | | | | | | | |
| 6/30/23 † | $15.19 | .15 | 1.29 | 1.44 | (.29) | — | (.29) | $16.34 | 9.60* | $67,969 | .43*f | .95*f | 164* |
| 12/31/22 | 20.05 | .25 | (3.20) | (2.95) | (.29) | (1.62) | (1.91) | 15.19 | (15.82) | 66,140 | .86f | 1.56f | 262 |
| 12/31/21 | 18.21 | .22 | 2.30 | 2.52 | (.18) | (.50) | (.68) | 20.05 | 14.25 | 89,120 | .84 | 1.13 | 306 |
| 12/31/20 | 16.95 | .22 | 1.72 | 1.94 | (.36) | (.32) | (.68) | 18.21 | 12.58 | 87,732 | .86 | 1.32 | 320 |
| 12/31/19 | 15.17 | .32 | 2.26 | 2.58 | (.29) | (.51) | (.80) | 16.95 | 17.42 | 88,722 | .86f | 1.98f | 164 |
| 12/31/18 | 18.14 | .33 | (1.53) | (1.20) | (.38) | (1.39) | (1.77) | 15.17 | (7.02) | 86,731 | .85 | 1.97 | 132 |
| Class IB | | | | | | | | | | | | | |
| 6/30/23† | $15.44 | .13 | 1.32 | 1.45 | (.25) | — | (.25) | $16.64 | 9.46* | $31,454 | .55*f | .82*f | 164* |
| 12/31/22 | 20.34 | .22 | (3.26) | (3.04) | (.24) | (1.62) | (1.86) | 15.44 | (16.03) | 30,939 | 1.11f | 1.30f | 262 |
| 12/31/21 | 18.47 | .17 | 2.34 | 2.51 | (.14) | (.50) | (.64) | 20.34 | 13.95 | 40,953 | 1.09 | .88 | 306 |
| 12/31/20 | 17.17 | .18 | 1.75 | 1.93 | (.31) | (.32) | (.63) | 18.47 | 12.31 | 38,431 | 1.11 | 1.06 | 320 |
| 12/31/19 | 15.35 | .28 | 2.29 | 2.57 | (.24) | (.51) | (.75) | 17.17 | 17.13 | 36,773 | 1.11f | 1.72f | 164 |
| 12/31/18 | 18.33 | .29 | (1.54) | (1.25) | (.34) | (1.39) | (1.73) | 15.35 | (7.26) | 36,889 | 1.10 | 1.71 | 132 |
* Not annualized.
† Unaudited.
a Per share net investment income (loss) has been determined on the basis of weighted average number of shares outstanding during the period.
b The charges and expenses at the insurance company separate account level are not reflected.
c Total return assumes dividend reinvestment.
d Includes amounts paid through expense offset and/or brokerage/service arrangements, if any (Note 2). Also excludes acquired fund fees and expenses, if any.
e Portfolio turnover includes TBA purchase and sale commitments.
f Reflects an involuntary contractual expense limitation in effect during the period. As a result of such limitation, the expenses of each class reflect a reduction of the following amounts:
| | | |
| | Percentage of average | | |
| | net assets | | |
| June 30, 2023 | 0.02% | | |
| December 31, 2022 | 0.05 | | |
| December 31, 2019 | 0.01 | | |
The accompanying notes are an integral part of these financial statements.
| |
| 34 Putnam VT Global Asset Allocation Fund |
Notes to financial statements 6/30/23 (Unaudited)
Unless otherwise noted, the “reporting period” represents the period from January 1, 2023 through June 30, 2023. The following table defines commonly used references within the Notes to financial statements:
| |
| References to | Represent |
| Putnam Management | Putnam Investment Management, LLC, the fund’s |
| | manager, an indirect wholly-owned subsidiary of |
| Putnam Investments, LLC |
| State Street | State Street Bank and Trust Company |
| JPMorgan | JPMorgan Chase Bank, N.A. |
| the SEC | the Securities and Exchange Commission |
| OTC | over-the-counter |
| PAC | The Putnam Advisory Company, LLC, an affiliate of |
| | Putnam Management |
| PIL | Putnam Investments Limited, an affiliate of Putnam |
| | Management |
Putnam VT Global Asset Allocation Fund (the fund) is a diversified series of Putnam Variable Trust (the Trust), a Massachusetts business trust registered under the Investment Company Act of 1940, as amended, as an open-end management investment company. The goal of the fund is to seek long-term return consistent with preservation of capital. The fund invests a majority of its assets in a diversified portfolio of equity securities (growth or value stocks or both) of both U.S. and foreign companies of any size. Putnam Management may consider, among other factors, a company’s valuation, financial strength, growth potential, competitive position in its industry, projected future earnings, cash flows and dividends when deciding whether to buy or sell equity investments. The fund also invests in a diversified portfolio of fixed-income investments, including both U.S. and foreign government obligations, corporate obligations and securitized debt instruments (such as mortgage-backed investments). Putnam Management may consider, among other factors, credit, interest rate and prepayment risks, as well as general market conditions, when deciding whether to buy or sell fixed-income investments. Putnam Management may also select other investments that do not fall within these asset classes. Putnam Management may also use to a significant extent derivatives, such as futures, options, certain foreign currency transactions, warrants and swap contracts, for both hedging and non-hedging purposes.
The fund offers class IA and class IB shares of beneficial interest. Class IA shares are offered at net asset value and are not subject to a distribution fee. Class IB shares are offered at net asset value and pay an ongoing distribution fee, which is identified in Note 2.
In the normal course of business, the fund enters into contracts that may include agreements to indemnify another party under given circumstances. The fund’s maximum exposure under these arrangements is unknown as this would involve future claims that may be, but have not yet been, made against the fund. However, the fund’s management team expects the risk of material loss to be remote.
The fund has entered into contractual arrangements with an investment adviser, administrator, distributor, shareholder servicing agent and custodian, who each provide services to the fund. Unless expressly stated otherwise, shareholders are not parties to, or intended beneficiaries of these contractual arrangements, and these contractual arrangements are not intended to create any shareholder right to enforce them against the service providers or to seek any remedy under them against the service providers, either directly or on behalf of the fund.
Under the fund’s Amended and Restated Agreement and Declaration of Trust, any claims asserted against or on behalf of the Putnam Funds, including claims against Trustees and Officers, must be brought in state and federal courts located within the Commonwealth of Massachusetts.
Note 1 — Significant accounting policies
The following is a summary of significant accounting policies consistently followed by the fund in the preparation of its financial statements. The preparation of financial statements is in conformity with accounting principles generally accepted in the United States of America and requires management to make estimates and assumptions that affect the reported amounts of assets and liabilities in the financial statements and the reported amounts of increases and decreases in net assets from operations. Actual results could differ from those estimates. Subsequent events after the Statement of assets and liabilities date through the date that the financial statements were issued have been evaluated in the preparation of the financial statements.
Investment income, realized and unrealized gains and losses and expenses of the fund are borne pro-rata based on the relative net assets of each class to the total net assets of the fund, except that each class bears expenses unique to that class (including the distribution fees applicable to such classes). Each class votes as a class only with respect to its own distribution plan or other matters on which a class vote is required by law or determined by the Trustees. If the fund were liquidated, shares of each class would receive their pro-rata share of the net assets of the fund. In addition, the Trustees declare separate dividends on each class of shares.
Security valuation Portfolio securities and other investments are valued using policies and procedures adopted by the Board of Trustees. The Trustees have formed a Pricing Committee to oversee the implementation of these procedures and have delegated responsibility for valuing the fund’s assets in accordance with these procedures to Putnam Management. Putnam Management has established an internal Valuation Committee that is responsible for making fair value determinations, evaluating the effectiveness of the pricing policies of the fund and reporting to the Pricing Committee.
Investments for which market quotations are readily available are valued at the last reported sales price on their principal exchange, or official closing price for certain markets, and are classified as Level 1 securities under Accounting Standards Codification 820 Fair Value Measurements and Disclosures (ASC 820). If no sales are reported, as in the case of some securities that are traded OTC, a security is valued at its last reported bid price and is generally categorized as a Level 2 security.
Investments in open-end investment companies (excluding exchange-traded funds), if any, which can be classified as Level 1 or Level 2 securities, are valued based on their net asset value. The net asset value of such investment companies equals the total value of their assets less their liabilities and divided by the number of their outstanding shares.
Market quotations are not considered to be readily available for certain debt obligations (including short-term investments with remaining maturities of 60 days or less) and other investments; such investments are valued on the basis of valuations furnished by an independent pricing service approved by the Trustees or dealers selected by Putnam Management. Such services or dealers determine valuations for normal institutional-size trading units of such securities using methods based on market transactions for comparable securities and various relationships, generally recognized by institutional traders, between securities (which consider such factors as security prices, yields, maturities and ratings). These securities will generally be categorized as Level 2.
Many securities markets and exchanges outside the U.S. close prior to the scheduled close of the New York Stock Exchange and therefore the closing prices for securities in such markets or on such exchanges may not fully reflect events that occur after such close but before the scheduled close of the New York Stock Exchange. Accordingly, on certain days, the fund will fair value certain foreign equity securities taking into account multiple factors including movements in the U.S. securities markets, currency valuations and comparisons to the valuation of American Depository Receipts, exchange-traded funds and futures contracts. The foreign equity securities, which would generally be classified as Level 1 securities, will be transferred to Level 2 of the fair value hierarchy when they are valued at fair value. The number of days on which fair value prices will be used will depend on market activity and it is possible that fair value prices will be used by the fund to a significant extent. At the close of the reporting period, fair value pricing was used for certain foreign securities in the portfolio. Securities quoted in foreign currencies, if any, are translated into U.S. dollars at the current exchange rate.
To the extent a pricing service or dealer is unable to value a security or provides a valuation that Putnam Management does not believe accurately reflects the security’s fair value, the security will be valued at fair value by Putnam Management, who has been designated as valuation designee pursuant to Rule 2a–5 under the Investment Company Act of 1940, in accordance with policies and procedures approved by the Trustees. Certain investments, including certain restricted and illiquid securities and derivatives, are also valued at fair value following procedures approved by the Trustees. These valuations consider such factors as significant market or specific security events such as interest rate or credit quality changes, various relationships with other securities, discount rates, U.S. Treasury, U.S. swap and credit yields, index levels, convexity exposures, recovery rates, sales and other multiples and resale restrictions. These securities are classified as Level 2 or as Level 3 depending on the priority of the significant inputs.
| |
| Putnam VT Global Asset Allocation Fund 35 |
To assess the continuing appropriateness of fair valuations, the Valuation Committee reviews and affirms the reasonableness of such valuations on a regular basis after considering all relevant information that is reasonably available. Such valuations and procedures are reviewed periodically by the Trustees. Certain securities may be valued on the basis of a price provided by a single source. The fair value of securities is generally determined as the amount that the fund could reasonably expect to realize from an orderly disposition of such securities over a reasonable period of time. By its nature, a fair value price is a good faith estimate of the value of a security in a current sale and does not reflect an actual market price, which may be different by a material amount.
Security transactions and related investment income Security transactions are recorded on the trade date (the date the order to buy or sell is executed). Gains or losses on securities sold are determined on the identified cost basis.
Interest income, net of any applicable withholding taxes, if any, is recorded on the accrual basis. Amortization and accretion of premiums and discounts on debt securities, if any, is recorded on the accrual basis.
Dividend income, net of any applicable withholding taxes, is recognized on the ex-dividend date except that certain dividends from foreign securities, if any, are recognized as soon as the fund is informed of the ex-dividend date. Non-cash dividends, if any, are recorded at the fair value of the securities received. Dividends representing a return of capital or capital gains, if any, are reflected as a reduction of cost and/or as a realized gain.
The fund may have earned certain fees in connection with its senior loan purchasing activities. These fees, if any, are treated as market discount and are amortized into income in the Statement of operations.
Securities purchased or sold on a delayed delivery basis may be settled at a future date beyond customary settlement time; interest income is accrued based on the terms of the securities. Losses may arise due to changes in the fair value of the underlying securities or if the counterparty does not perform under the contract.
Stripped securities The fund may invest in stripped securities which represent a participation in securities that may be structured in classes with rights to receive different portions of the interest and principal. Interest-only securities receive all of the interest and principal-only securities receive all of the principal. If the interest-only securities experience greater than anticipated prepayments of principal, the fund may fail to recoup fully its initial investment in these securities. Conversely, principal-only securities increase in value if prepayments are greater than anticipated and decline if prepayments are slower than anticipated. The fair value of these securities is highly sensitive to changes in interest rates.
Foreign currency translation The accounting records of the fund are maintained in U.S. dollars. The fair value of foreign securities, currency holdings, and other assets and liabilities is recorded in the books and records of the fund after translation to U.S. dollars based on the exchange rates on that day. The cost of each security is determined using historical exchange rates. Income and withholding taxes are translated at prevailing exchange rates when earned or incurred. The fund does not isolate that portion of realized or unrealized gains or losses resulting from changes in the foreign exchange rate on investments from fluctuations arising from changes in the market prices of the securities. Such gains and losses are included with the net realized and unrealized gain or loss on investments. Net realized gains and losses on foreign currency transactions represent net realized exchange gains or losses on disposition of foreign currencies, currency gains and losses realized between the trade and settlement dates on securities transactions and the difference between the amount of investment income and foreign withholding taxes recorded on the fund’s books and the U.S. dollar equivalent amounts actually received or paid. Net unrealized appreciation and depreciation of assets and liabilities in foreign currencies arise from changes in the value of assets and liabilities other than investments at the period end, resulting from changes in the exchange rate.
Futures contracts The fund uses futures contracts to manage exposure to market risk, to hedge prepayment risk, to hedge interest rate risk, to gain exposure to interest rates and to equitize cash.
The potential risk to the fund is that the change in value of futures contracts may not correspond to the change in value of the hedged instruments. In addition, losses may arise from changes in the value of the underlying instruments, if there is an illiquid secondary market for the contracts, if interest or exchange rates move unexpectedly or if the counterparty to the contract is unable to perform. With futures, there is minimal counterparty credit risk to the fund since futures are exchange traded and the exchange’s clearinghouse, as counterparty to all exchange traded futures, guarantees the futures against default. Risks may exceed amounts recognized on the Statement of assets and liabilities. When the contract is closed, the fund records a realized gain or loss equal to the difference between the value of the contract at the time it was opened and the value at the time it was closed.
Futures contracts are valued at the quoted daily settlement prices established by the exchange on which they trade. The fund and the broker agree to exchange an amount of cash equal to the daily fluctuation in the value of the futures contract. Such receipts or payments are known as “variation margin.”
Futures contracts outstanding at period end, if any, are listed after the fund’s portfolio.
Forward currency contracts The fund buys and sells forward currency contracts, which are agreements between two parties to buy and sell currencies at a set price on a future date. These contracts are used to hedge foreign exchange risk and to gain exposure to currencies.
The U.S. dollar value of forward currency contracts is determined using current forward currency exchange rates supplied by a quotation service. The fair value of the contract will fluctuate with changes in currency exchange rates. The contract is marked to market daily and the change in fair value is recorded as an unrealized gain or loss. The fund records a realized gain or loss equal to the difference between the value of the contract at the time it was opened and the value at the time it was closed when the contract matures or by delivery of the currency. The fund could be exposed to risk if the value of the currency changes unfavorably, if the counterparties to the contracts are unable to meet the terms of their contracts or if the fund is unable to enter into a closing position. Risks may exceed amounts recognized on the Statement of assets and liabilities.
Forward currency contracts outstanding at period end, if any, are listed after the fund’s portfolio.
Interest rate swap contracts The fund entered into OTC and/or centrally cleared interest rate swap contracts, which are arrangements between two parties to exchange cash flows based on a notional principal amount, to hedge interest rate risk, to gain exposure on interest rates and to hedge prepayment risk.
An OTC and centrally cleared interest rate swap can be purchased or sold with an upfront premium. For OTC interest rate swap contracts, an upfront payment received by the fund is recorded as a liability on the fund’s books. An upfront payment made by the fund is recorded as an asset on the fund’s books. OTC and centrally cleared interest rate swap contracts are marked to market daily based upon quotations from an independent pricing service or market makers. Any change is recorded as an unrealized gain or loss on OTC interest rate swaps. Daily fluctuations in the value of centrally cleared interest rate swaps are settled through a central clearing agent and are recorded in variation margin on the Statement of assets and liabilities and recorded as unrealized gain or loss. Payments, including upfront premiums, received or made are recorded as realized gains or losses at the reset date or the closing of the contract. Certain OTC and centrally cleared interest rate swap contracts may include extended effective dates. Payments related to these swap contracts are accrued based on the terms of the contract.
The fund could be exposed to credit or market risk due to unfavorable changes in the fluctuation of interest rates or if the counterparty defaults, in the case of OTC interest rate contracts, or the central clearing agency or a clearing member defaults, in the case of centrally cleared interest rate swap contracts, on its respective obligation to perform under the contract. The fund’s maximum risk of loss from counterparty risk or central clearing risk is the fair value of the contract. This risk may be mitigated for OTC interest rate swap contracts by having a master netting arrangement between the fund and the counterparty and for centrally cleared interest rate swap contracts through the daily exchange of variation margin. There is minimal counterparty risk with respect to centrally cleared interest rate swap contracts due to the clearinghouse guarantee fund and other resources that are available in the event of a clearing member default. Risk of loss may exceed amounts recognized on the Statement of assets and liabilities.
OTC and centrally cleared interest rate swap contracts outstanding, including their respective notional amounts at period end, if any, are listed after the fund’s portfolio.
At close of the reporting period, the fund has deposited cash valued at $46,710 in a segregated account to cover margin requirements on open centrally cleared interest rate swap contracts.
Total return swap contracts The fund entered into OTC and/or centrally cleared total return swap contracts, which are arrangements to exchange a market-linked return for a periodic payment, both based on a notional principal amount, to hedge sector exposure, to manage exposure to specific sectors or industries, to manage exposure to specific securities, to gain exposure to a basket of securities, to gain exposure to specific markets or countries and to gain exposure to specific sectors or industries.
To the extent that the total return of the security, index or other financial measure underlying the transaction exceeds or falls short of the offsetting interest rate
| |
| 36 Putnam VT Global Asset Allocation Fund |
obligation, the fund will receive a payment from or make a payment to the counterparty. OTC and/or centrally cleared total return swap contracts are marked to market daily based upon quotations from an independent pricing service or market maker. Any change is recorded as an unrealized gain or loss on OTC total return swaps. Daily fluctuations in the value of centrally cleared total return swaps are settled through a central clearing agent and are recorded in variation margin on the Statement of assets and liabilities and recorded as unrealized gain or loss. Payments received or made are recorded as realized gains or losses. Certain OTC and/or centrally cleared total return swap contracts may include extended effective dates. Payments related to these swap contracts are accrued based on the terms of the contract. The fund could be exposed to credit or market risk due to unfavorable changes in the fluctuation of interest rates or in the price of the underlying security or index, the possibility that there is no liquid market for these agreements or that the counterparty may default on its obligation to perform. The fund’s maximum risk of loss from counterparty risk or central clearing risk is the fair value of the contract. This risk may be mitigated for OTC total return swap contracts by having a master netting arrangement between the fund and the counterparty and for centrally cleared total return swap contracts through the daily exchange of variation margin. There is minimal counterparty risk with respect to centrally cleared total return swap contracts due to the clearinghouse guarantee fund and other resources that are available in the event of a clearing member default. Risk of loss may exceed amounts recognized on the Statement of assets and liabilities.
OTC and/or centrally cleared total return swap contracts outstanding, including their respective notional amounts at period end, if any, are listed after the fund’s portfolio.
Credit default contracts The fund entered into OTC and/or centrally cleared credit default contracts to hedge credit risk, to hedge market risk and to gain exposure on individual names and/or baskets of securities.
In OTC and centrally cleared credit default contracts, the protection buyer typically makes a periodic stream of payments to a counterparty, the protection seller, in exchange for the right to receive a contingent payment upon the occurrence of a credit event on the reference obligation or all other equally ranked obligations of the reference entity. Credit events are contract specific but may include bankruptcy, failure to pay, restructuring and obligation acceleration. For OTC credit default contracts, an upfront payment received by the fund is recorded as a liability on the fund’s books. An upfront payment made by the fund is recorded as an asset on the fund’s books. Centrally cleared credit default contracts provide the same rights to the protection buyer and seller except the payments between parties, including upfront premiums, are settled through a central clearing agent through variation margin payments. Upfront and periodic payments received or paid by the fund for OTC and centrally cleared credit default contracts are recorded as realized gains or losses at the reset date or close of the contract. The OTC and centrally cleared credit default contracts are marked to market daily based upon quotations from an independent pricing service or market makers. Any change in value of OTC credit default contracts is recorded as an unrealized gain or loss. Daily fluctuations in the value of centrally cleared credit default contracts are recorded in variation margin on the Statement of assets and liabilities and recorded as unrealized gain or loss. Upon the occurrence of a credit event, the difference between the par value and fair value of the reference obligation, net of any proportional amount of the upfront payment, is recorded as a realized gain or loss.
In addition to bearing the risk that the credit event will occur, the fund could be exposed to market risk due to unfavorable changes in interest rates or in the price of the underlying security or index or the possibility that the fund may be unable to close out its position at the same time or at the same price as if it had purchased the underlying reference obligations. In certain circumstances, the fund may enter into offsetting OTC and centrally cleared credit default contracts which would mitigate its risk of loss. Risks of loss may exceed amounts recognized on the Statement of assets and liabilities. The fund’s maximum risk of loss from counterparty risk, either as the protection seller or as the protection buyer, is the fair value of the contract. This risk may be mitigated for OTC credit default contracts by having a master netting arrangement between the fund and the counterparty and for centrally cleared credit default contracts through the daily exchange of variation margin. Counterparty risk is further mitigated with respect to centrally cleared credit default swap contracts due to the clearinghouse guarantee fund and other resources that are available in the event of a clearing member default. Where the fund is a seller of protection, the maximum potential amount of future payments the fund may be required to make is equal to the notional amount.
OTC and centrally cleared credit default contracts outstanding, including their respective notional amounts at period end, if any, are listed after the fund’s portfolio.
At close of the reporting period, the fund has deposited cash valued at $137,771 in a segregated account to cover margin requirements on open centrally cleared credit default contracts.
TBA commitments The fund may enter into TBA (to be announced) commitments to purchase securities for a fixed unit price at a future date beyond customary settlement time. Although the unit price and par amount have been established, the actual securities have not been specified. However, it is anticipated that the amount of the commitments will not significantly differ from the principal amount. The fund holds, and maintains until settlement date, cash or high-grade debt obligations in an amount sufficient to meet the purchase price, or the fund may enter into offsetting contracts for the forward sale of other securities it owns. Income on the securities will not be earned until settlement date.
The fund may also enter into TBA sale commitments to hedge its portfolio positions, to sell mortgage-backed securities it owns under delayed delivery arrangements or to take a short position in mortgage-backed securities. Proceeds of TBA sale commitments are not received until the contractual settlement date. During the time a TBA sale commitment is outstanding, either equivalent deliverable securities or an offsetting TBA purchase commitment deliverable on or before the sale commitment date are held as “cover” for the transaction, or other liquid assets in an amount equal to the notional value of the TBA sale commitment are segregated. If the TBA sale commitment is closed through the acquisition of an offsetting TBA purchase commitment, the fund realizes a gain or loss. If the fund delivers securities under the commitment, the fund realizes a gain or a loss from the sale of the securities based upon the unit price established at the date the commitment was entered into.
TBA commitments, which are accounted for as purchase and sale transactions, may be considered securities themselves, and involve a risk of loss due to changes in the value of the security prior to the settlement date as well as the risk that the counterparty to the transaction will not perform its obligations. Counterparty risk is mitigated by having a master agreement between the fund and the counterparty.
Unsettled TBA commitments are valued at their fair value according to the procedures described under “Security valuation” above. The contract is marked to market daily and the change in fair value is recorded by the fund as an unrealized gain or loss. Based on market circumstances, Putnam Management will determine whether to take delivery of the underlying securities or to dispose of the TBA commitments prior to settlement.
TBA purchase commitments outstanding at period end, if any, are listed within the fund’s portfolio and TBA sale commitments outstanding at period end, if any, are listed after the fund’s portfolio.
Master agreements The fund is a party to ISDA (International Swaps and Derivatives Association, Inc.) Master Agreements that govern OTC derivative and foreign exchange contracts and Master Securities Forward Transaction Agreements that govern transactions involving mortgage-backed and other asset-backed securities that may result in delayed delivery (Master Agreements) with certain counterparties entered into from time to time. The Master Agreements may contain provisions regarding, among other things, the parties’ general obligations, representations, agreements, collateral requirements, events of default and early termination. With respect to certain counterparties, in accordance with the terms of the Master Agreements, collateral pledged to the fund is held in a segregated account by the fund’s custodian and, with respect to those amounts which can be sold or repledged, are presented in the fund’s portfolio.
Collateral pledged by the fund is segregated by the fund’s custodian and identified in the fund’s portfolio. Collateral can be in the form of cash or debt securities issued by the U.S. Government or related agencies or other securities as agreed to by the fund and the applicable counterparty. Collateral requirements are determined based on the fund’s net position with each counterparty.
With respect to ISDA Master Agreements, termination events applicable to the fund may occur upon a decline in the fund’s net assets below a specified threshold over a certain period of time. Termination events applicable to counterparties may occur upon a decline in the counterparty’s long-term or short-term credit ratings below a specified level. In each case, upon occurrence, the other party may elect to terminate early and cause settlement of all derivative and foreign exchange contracts outstanding, including the payment of any losses and costs resulting from such early termination, as reasonably determined by the terminating party. Any decision by one or more of the fund’s counterparties to elect early termination could impact the fund’s future derivative activity.
At the close of the reporting period, the fund had a net liability position of $67,179 on open derivative contracts subject to the Master Agreements. There was no collateral pledged by the fund at period end for these agreements.
| |
| Putnam VT Global Asset Allocation Fund 37 |
Securities lending The fund may lend securities, through its agent, to qualified borrowers in order to earn additional income. The loans are collateralized by cash in an amount at least equal to the fair value of the securities loaned. The fair value of securities loaned is determined daily and any additional required collateral is allocated to the fund on the next business day. The remaining maturities of the securities lending transactions are considered overnight and continuous. The risk of borrower default will be borne by the fund’s agent; the fund will bear the risk of loss with respect to the investment of the cash collateral. Income from securities lending, net of expenses, is included in investment income on the Statement of operations. Cash collateral is invested in Putnam Cash Collateral Pool, LLC, a limited liability company managed by an affiliate of Putnam Management. Investments in Putnam Cash Collateral Pool, LLC are valued at its closing net asset value each business day. There are no management fees charged to Putnam Cash Collateral Pool, LLC. At the close of the reporting period, the fund had no securities out on loan.
Interfund lending The fund, along with other Putnam funds, may participate in an interfund lending program pursuant to an exemptive order issued by the SEC. This program allows the fund to borrow from or lend to other Putnam funds that permit such transactions. Interfund lending transactions are subject to each fund’s investment policies and borrowing and lending limits. Interest earned or paid on the interfund lending transaction will be based on the average of certain current market rates. During the reporting period, the fund did not utilize the program.
Lines of credit The fund participates, along with other Putnam funds, in a $320 million syndicated unsecured committed line of credit, provided by State Street ($160 million) and JPMorgan ($160 million), and a $235.5 million unsecured uncommitted line of credit, provided by State Street. Prior to May 2, 2023, the fund participated, along with other Putnam funds, in a $100 million unsecured committed line of credit and a $235.5 million unsecured uncommitted line of credit, both provided by State Street. Borrowings may be made for temporary or emergency purposes, including the funding of shareholder redemption requests and trade settlements. Interest is charged to the fund based on the fund’s borrowing at a rate equal to 1.25% plus the higher of (1) the Federal Funds rate and (2) the Overnight Bank Funding Rate for the committed line of credit and 1.30% plus the higher of (1) the Federal Funds rate and (2) the Overnight Bank Funding Rate for the uncommitted line of credit. A closing fee equal to 0.04% of the committed line of credit and 0.04% of the uncommitted line of credit has been paid by the participating funds and a $75,000 fee has been paid by the participating funds to State Street as agent of the syndicated committed line of credit. In addition, a commitment fee of 0.21% per annum on any unutilized portion of the committed line of credit is allocated to the participating funds based on their relative net assets and paid quarterly. During the reporting period, the fund had no borrowings against these arrangements.
Federal taxes It is the policy of the fund to distribute all of its taxable income within the prescribed time period and otherwise comply with the provisions of the Internal Revenue Code of 1986, as amended (the Code), applicable to regulated investment companies.
The fund is subject to the provisions of Accounting Standards Codification 740 Income Taxes (ASC 740). ASC 740 sets forth a minimum threshold for financial statement recognition of the benefit of a tax position taken or expected to be taken in a tax return. The fund did not have a liability to record for any unrecognized tax benefits in the accompanying financial statements. No provision has been made for federal taxes on income, capital gains or unrealized appreciation on securities held nor for excise tax on income and capital gains. Each of the fund’s federal tax returns for the prior three fiscal years remains subject to examination by the Internal Revenue Service.
The fund may also be subject to taxes imposed by governments of countries in which it invests. Such taxes are generally based on either income or gains earned or repatriated. The fund accrues and applies such taxes to net investment income, net realized gains and net unrealized gains as income and/or capital gains are earned. In some cases, the fund may be entitled to reclaim all or a portion of such taxes, and such reclaim amounts, if any, are reflected as an asset on the fund’s books. In many cases, however, the fund may not receive such amounts for an extended period of time, depending on the country of investment.
Tax cost of investments includes adjustments to net unrealized appreciation (depreciation) which may not necessarily be final tax cost basis adjustments, but closely approximate the tax basis unrealized gains and losses that may be realized and distributed to shareholders. The aggregate identified cost on a tax basis is $80,247,979, resulting in gross unrealized appreciation and depreciation of $29,157,907 and $5,275,414, respectively, or net unrealized appreciation of $23,882,493.
Distributions to shareholders Distributions to shareholders from net investment income, if any, are recorded by the fund on the ex-dividend date. Distributions from capital gains, if any, are recorded on the ex-dividend date and paid at least annually. The amount and character of income and gains to be distributed are determined in accordance with income tax regulations, which may differ from generally accepted accounting principles. Dividend sources are estimated at the time of declaration. Actual results may vary. Any non-taxable return of capital cannot be determined until final tax calculations are completed after the end of the fund’s fiscal year. Reclassifications are made to the fund’s capital accounts to reflect income and gains available for distribution (or available capital loss carryovers) under income tax regulations.
Expenses of the Trust Expenses directly charged or attributable to any fund will be paid from the assets of that fund. Generally, expenses of the Trust will be allocated among and charged to the assets of each fund on a basis that the Trustees deem fair and equitable, which may be based on the relative assets of each fund or the nature of the services performed and relative applicability to each fund.
Beneficial interest At the close of the reporting period, insurance companies or their separate accounts were record owners of all but a de minimis number of the shares of the fund. Approximately 40.5% of the fund is owned by accounts of one insurance company.
Note 2 — Management fee, administrative services and other transactions
The fund pays Putnam Management a management fee (based on the fund’s average net assets and computed and paid monthly) at annual rates that may vary based on the average of the aggregate net assets of all open-end mutual funds sponsored by Putnam Management (excluding net assets of funds that are invested in, or that are invested in by, other Putnam funds to the extent necessary to avoid “double counting” of those assets). Such annual rates may vary as follows:
| |
| 0.750% | of the first $5 billion, |
| 0.700% | of the next $5 billion, |
| 0.650% | of the next $10 billion, |
| 0.600% | of the next $10 billion, |
| 0.550% | of the next $50 billion, |
| 0.530% | of the next $50 billion, |
| 0.520% | of the next $100 billion and |
| 0.515% | of any excess thereafter. |
For the reporting period, the management fee represented an effective rate (excluding the impact from any expense waivers in effect) of 0.293% of the fund’s average net assets.
Putnam Management has contractually agreed, through April 30, 2025, to waive fees and/or reimburse the fund’s expenses to the extent necessary to limit the cumulative expenses of the fund, exclusive of brokerage, interest, taxes, investment-related expenses, extraordinary expenses, acquired fund fees and expenses and payments under the fund’s investor servicing contract, investment management contract and distribution plan, on a fiscal year-to-date basis to an annual rate of 0.20% of the fund’s average net assets over such fiscal year-to-date period. During the reporting period, the fund’s expenses were reduced by $24,036 as a result of this limit.
PIL is authorized by the Trustees to manage a separate portion of the assets of the fund as determined by Putnam Management from time to time. PIL did not manage any portion of the assets of the fund during the reporting period. If Putnam Management were to engage the services of PIL, Putnam Management would pay a quarterly sub-management fee to PIL for its services at an annual rate of 0.25% of the average net assets of the equity and asset allocation portion of the fund managed by PIL and 0.20% of the average net assets of the fixed-income portion of the fund managed by PIL.
PAC is authorized by the Trustees to manage a separate portion of the assets of the fund, as designated from time to time by Putnam Management or PIL. PAC did not manage any portion of the assets of the fund during the reporting period. If Putnam Management or PIL were to engage the services of PAC, Putnam Management or PIL, as applicable, would pay a quarterly sub-advisory fee to PAC for its services at the annual rate of 0.25% of the average net assets of the equity and asset allocation portion of the fund’s assets for which PAC is engaged as sub-advisor and 0.20% of the average net assets of the fixed-income portion of the fund’s assets for which PAC is engaged as sub-advisor.
The fund reimburses Putnam Management an allocated amount for the compensation and related expenses of certain officers of the fund and their staff who provide administrative services to the fund. The aggregate amount of all such reimbursements is determined annually by the Trustees.
Custodial functions for the fund’s assets are provided by State Street. Custody fees are based on the fund’s asset level, the number of its security holdings and transaction volumes.
| |
| 38 Putnam VT Global Asset Allocation Fund |
Putnam Investor Services, Inc., an affiliate of Putnam Management, provides investor servicing agent functions to the fund. Putnam Investor Services, Inc. was paid a monthly fee for investor servicing at an annual rate of 0.07% of the fund’s average daily net assets. During the reporting period, the expenses for each class of shares related to investor servicing fees were as follows:
| |
| Class IA | $23,513 |
| Class IB | 11,018 |
| Total | $34,531 |
The fund has entered into expense offset arrangements with Putnam Investor Services, Inc. and State Street whereby Putnam Investor Services, Inc.’s and State Street’s fees are reduced by credits allowed on cash balances. For the reporting period, the fund’s expenses were reduced by $225 under the expense offset arrangements.
Each Independent Trustee of the fund receives an annual Trustee fee, of which $87, as a quarterly retainer, has been allocated to the fund, and an additional fee for each Trustees meeting attended. Trustees also are reimbursed for expenses they incur relating to their services as Trustees.
The fund has adopted a Trustee Fee Deferral Plan (the Deferral Plan) which allows the Trustees to defer the receipt of all or a portion of Trustees fees payable on or after July 1, 1995. The deferred fees remain invested in certain Putnam funds until distribution in accordance with the Deferral Plan.
The fund has adopted an unfunded noncontributory defined benefit pension plan (the Pension Plan) covering all Trustees of the fund who have served as a Trustee for at least five years and were first elected prior to 2004. Benefits under the Pension Plan are equal to 50% of the Trustee’s average annual attendance and retainer fees for the three years ended December 31, 2005. The retirement benefit is payable during a Trustee’s lifetime, beginning the year following retirement, for the number of years of service through December 31, 2006. Pension expense for the fund is included in Trustee compensation and expenses in the Statement of operations. Accrued pension liability is included in Payable for Trustee compensation and expenses in the Statement of assets and liabilities. The Trustees have terminated the Pension Plan with respect to any Trustee first elected after 2003.
The fund has adopted a distribution plan (the Plan) with respect to its class IB shares pursuant to Rule 12b–1 under the Investment Company Act of 1940. The purpose of the Plan is to compensate Putnam Retail Management Limited Partnership, an indirect wholly-owned subsidiary of Putnam Investments, LLC, for services provided and expenses incurred in distributing shares of the fund. The Plan provides for payment by the fund to Putnam Retail Management Limited Partnership at an annual rate of up to 0.35% of the average net assets attributable to the fund’s class IB shares. The Trustees have approved payment by the fund at an annual rate of 0.25% of the average net assets attributable to the fund’s class IB shares. The expenses related to distribution fees during the reporting period are included in Distribution fees in the Statement of operations.
Note 3 — Purchases and sales of securities
During the reporting period, the cost of purchases and the proceeds from sales, excluding short-term investments, were as follows:
| | |
| | Cost of | Proceeds |
| | purchases | from sales |
| Investments in securities, including | | |
| TBA commitments (Long-term) | $168,677,923 | $171,725,990 |
| U.S. government securities | | |
| (Long-term) | — | — |
| Total | $168,677,923 | $171,725,990 |
The fund may purchase or sell investments from or to other Putnam funds in the ordinary course of business, which can reduce the fund’s transaction costs, at prices determined in accordance with SEC requirements and policies approved by the Trustees. During the reporting period, purchases or sales of long-term securities from or to other Putnam funds, if any, did not represent more than 5% of the fund’s total cost of purchases and/or total proceeds from sales.
Note 4 — Capital shares
At the close of the reporting period, there were an unlimited number of shares of beneficial interest authorized. Subscriptions and redemptions are presented at the omnibus level. Transactions in capital shares were as follows:
| | | | | | | | |
| | | Class IA shares | | | Class IB shares | |
| | Six months ended 6/30/23 | Year ended 12/31/22 | Six months ended 6/30/23 | Year ended 12/31/22 |
| | Shares | Amount | Shares | Amount | Shares | Amount | Shares | Amount |
| Shares sold | 20,866 | $332,565 | 25,017 | $416,761 | 70,016 | $1,126,167 | 109,349 | $1,865,038 |
| Shares issued in connection with | | | | | | | | |
| reinvestment of distributions | 79,264 | 1,231,765 | 479,480 | 8,256,649 | 30,348 | 480,710 | 212,278 | 3,723,358 |
| | 100,130 | 1,564,330 | 504,497 | 8,673,410 | 100,364 | 1,606,877 | 321,627 | 5,588,396 |
| Shares repurchased | (294,212) | (4,637,100) | (596,803) | (9,772,645) | (213,775) | (3,442,352) | (331,914) | (5,424,532) |
| Net increase (decrease) | (194,082) | $(3,072,770) | (92,306) | $(1,099,235) | (113,411) | $(1,835,475) | (10,287) | $163,864 |
Note 5 — Affiliated transactions
Transactions during the reporting period with any company which is under common ownership or control were as follows:
| | | | | |
| | | | | | Shares outstanding |
| | Fair value as of | | | | and fair value as of |
| Name of affiliate | 12/31/22 | Purchase cost | Sale proceeds | Investment income | 6/30/23 |
| Short-term investments | | | | | |
| Putnam Cash Collateral Pool, LLC* | $271,878 | $1,892,503 | $2,164,381 | $3,687 | $— |
| Putnam Short Term Investment | | | | | |
| Fund** | 2,067,499 | 13,172,504 | 14,698,383 | 33,430 | 541,620 |
| Total Short-term investments | $2,339,377 | $15,065,007 | $16,862,764 | $37,117 | $541,620 |
*No management fees are charged to Putnam Cash Collateral Pool, LLC (Note 1). Investment income shown is included in securities lending income on the Statement of operations. There were no realized or unrealized gains or losses during the period.
**Management fees charged to Putnam Short Term Investment Fund have been waived by Putnam Management. There were no realized or unrealized gains or losses during the period.
Note 6 — Market, credit and other risks
In the normal course of business, the fund trades financial instruments and enters into financial transactions where risk of potential loss exists due to changes in the market (market risk) or failure of the contracting party to the transaction to perform (credit risk). The fund may be exposed to additional credit risk that an institution or other entity with which the fund has unsettled or open transactions will default. Investments in foreign securities involve certain risks, including those related to economic instability, unfavorable political developments, and currency fluctuations. The fund may invest a significant portion of its assets in securitized debt instruments, including mortgage-backed and asset-backed investments. The yields and values of these investments are sensitive to changes in interest rates, the rate of principal payments on the underlying assets and the market’s perception of the issuers. The market for these investments may be volatile and limited, which may make them difficult to buy or sell.
| |
| Putnam VT Global Asset Allocation Fund 39 |
On July 27, 2017, the United Kingdom’s Financial Conduct Authority (“FCA”), which regulates LIBOR, announced its intention to cease compelling banks to provide the quotations needed to sustain LIBOR after 2021. ICE Benchmark Administration, the administrator of LIBOR, ceased publication of most LIBOR settings on a representative basis at the end of 2021 and is expected to cease publication of a majority of U.S. dollar LIBOR settings on a representative basis after June 30, 2023. In addition, global regulators have announced that, with limited exceptions, no new LIBOR-based contracts should be entered into after 2021. LIBOR has historically been a common benchmark interest rate index used to make adjustments to variable-rate loans. It is used throughout global banking and financial industries to determine interest rates for a variety of financial instruments and borrowing arrangements. Actions by regulators have resulted in the establishment of alternative reference rates to LIBOR in most major currencies. Various financial industry groups have been planning for the transition away from LIBOR, but there are obstacles to converting certain longer-term securities and transactions to new reference rates. Markets are developing slowly and questions around liquidity in these rates and how to appropriately adjust these rates to mitigate any economic value transfer at the time of transition remain a significant concern. Neither the effect of the transition process nor its ultimate success can yet be known. The transition process might lead to increased volatility and illiquidity in markets that rely on LIBOR to determine interest rates. It could also lead to a reduction in the value of some LIBOR-based investments and reduce the effectiveness of related transactions, such as hedges. While some LIBOR-based instruments may contemplate a scenario where LIBOR is no longer available by providing for an alternative rate-setting methodology, not all may have such provisions and there may be significant uncertainty regarding the effectiveness of any such alternative methodologies. Since the usefulness of LIBOR as a benchmark could deteriorate during the transition period, these effects could occur at any time.
Note 7 — Senior loan commitments
Senior loans are purchased or sold on a when-issued or delayed delivery basis and may be settled a month or more after the trade date, which from time to time can delay the actual investment of available cash balances; interest income is accrued based on the terms of the securities. Senior loans can be acquired through an agent, by assignment from another holder of the loan, or as a participation interest in another holder’s portion of the loan. When the fund invests in a loan or participation, the fund is subject to the risk that an intermediate participant between the fund and the borrower will fail to meet its obligations to the fund, in addition to the risk that the borrower under the loan may default on its obligations.
Note 8 — Summary of derivative activity
The volume of activity for the reporting period for any derivative type that was held during the period is listed below and was based on an average of the holdings at the end of each fiscal quarter:
| |
| Futures contracts (number of contracts) | 300 |
| Forward currency contracts (contract amount) | $2,500,000 |
| Centrally cleared interest rate swap contracts (notional) | $11,400,000 |
| OTC total return swap contracts (notional) | $13,500,000 |
| OTC credit default contracts (notional) | $500,000 |
| Centrally cleared credit default contracts (notional) | $3,500,000 |
The following is a summary of the fair value of derivative instruments as of the close of the reporting period:
Fair value of derivative instruments as of the close of the reporting period
| | | | |
| | Asset derivatives | Liability derivatives |
| Derivatives not accounted for as hedging | Statement of assets and | | Statement of assets and | |
| instruments under ASC 815 | liabilities location | Fair value | liabilities location | Fair value |
| | Receivables, Net assets — | | | |
| Credit contracts | Unrealized appreciation | $156,321* | Payables | $43,519 |
| Foreign exchange contracts | Receivables | 22,039 | Payables | 20,478 |
| | Receivables, Net assets — | | Payables, Net assets — | |
| Equity contracts | Unrealized appreciation | 322,910* | Unrealized depreciation | 1,191,613* |
| | Receivables, Net assets — | | Payables, Net assets — | |
| Interest rate contracts | Unrealized appreciation | 100,074* | Unrealized depreciation | 177,190* |
| Total | | $601,344 | | $1,432,800 |
*Includes cumulative appreciation/depreciation of futures contracts and/or centrally cleared swaps as reported in the fund’s portfolio. Only current day’s variation margin is reported within the Statement of assets and liabilities.
The following is a summary of realized and change in unrealized gains or losses of derivative instruments in the Statement of operations for the reporting period (Note 1):
Amount of realized gain or (loss) on derivatives recognized in net gain or (loss) on investments
| | | | |
| Derivatives not accounted for as hedging | | Forward currency | | |
| instruments under ASC 815 | Futures | contracts | Swaps | Total |
| Credit contracts | $— | $— | $62,510 | $62,510 |
| Foreign exchange contracts | — | 66,443 | — | $66,443 |
| Equity contracts | (1,779,163) | — | 83,635 | $(1,695,528) |
| Interest rate contracts | 31,385 | — | 21,314 | $52,699 |
| Total | $(1,747,778) | $66,443 | $167,459 | $(1,513,876) |
Change in unrealized appreciation or (depreciation) on derivatives recognized in net gain or (loss) on investments
| | | | |
| Derivatives not accounted for as hedging | | Forward currency | | |
| instruments under ASC 815 | Futures | contracts | Swaps | Total |
| Credit contracts | $— | $— | $15,681 | $15,681 |
| Foreign exchange contracts | — | (15,868) | — | $(15,868) |
| Equity contracts | (1,416,071) | — | (33,360) | $(1,449,431) |
| Interest rate contracts | (41,386) | — | 4,606 | $(36,780) |
| Total | $(1,457,457) | $(15,868) | $(13,073) | $(1,486,398) |
| |
| 40 Putnam VT Global Asset Allocation Fund |
|
| This page intentionally left blank. |
| |
| Putnam VT Global Asset Allocation Fund 41 |
Note 9 — Offsetting of financial and derivative assets and liabilities
The following table summarizes any derivatives, repurchase agreements and reverse repurchase agreements, at the end of the reporting period, that are subject to an enforceable master netting agreement or similar agreement. For securities lending transactions or borrowing transactions associated with securities sold short, if any, see Note 1. For financial reporting purposes, the fund does not offset financial assets and financial liabilities that are subject to the master netting agreements in the Statement of assets and liabilities.
| | | | | | | | | | | | | | | | | |
| | Bank of America N.A. | Barclays Bank PLC | Barclays Capital, Inc. (clearing broker) | BofA Securities, Inc. | Citibank, N.A. | Citigroup Global Markets, Inc. | Credit Suisse International | Goldman Sachs International | HSBC Bank USA, National Association | JPMorgan Chase Bank N.A. | JPMorgan Securities LLC | Merrill Lynch International | Morgan Stanley & Co. International PLC | NatWest Markets PLC | State Street Bank and Trust Co. | WestPac Banking Corp. | Total |
| Assets: | | | | | | | | | | | | | | | | | |
| Centrally cleared interest rate | | | | | | | | | | | | | | | | | |
| swap contracts§ | $— | $— | $5,723 | $— | $— | $— | $— | $— | $— | $— | $— | $— | $— | $— | $— | $— | $5,723 |
| OTC Total return | | | | | | | | | | | | | | | | | |
| swap contracts*# | — | 243,196 | — | — | — | — | — | 29,402 | — | — | — | — | — | — | — | — | 272,598 |
| OTC Credit default contracts — | | | | | | | | | | | | | | | | | |
| protection sold*# | — | — | — | — | — | — | — | — | — | — | — | — | — | — | — | — | — |
| OTC Credit default contracts — | | | | | | | | | | | | | | | | | |
| protection purchased*# | — | — | — | — | — | 13,341 | 18,195 | 12,273 | — | — | 15,206 | 3,262 | 26,578 | — | — | — | 88,855 |
| Centrally cleared credit | | | | | | | | | | | | | | | | | |
| default contracts§ | — | — | 8,641 | — | — | — | — | — | — | — | — | — | — | — | — | — | 8,641 |
| Futures contracts§ | — | — | — | 8,250 | — | — | — | — | — | — | 10,266 | — | — | — | — | — | 18,516 |
| Forward currency contracts# | 186 | — | — | — | — | — | — | 10,924 | 748 | 140 | — | — | 640 | 4,339 | — | 5,062 | 22,039 |
| Total Assets | $186 | $243,196 | $14,364 | $8,250 | $— | $13,341 | $18,195 | $52,599 | $748 | $140 | $25,472 | $3,262 | $27,218 | $4,339 | $— | $5,062 | $416,372 |
| Liabilities: | | | | | | | | | | | | | | | | | |
| Centrally cleared interest rate | | | | | | | | | | | | | | | | | |
| swap contracts§ | — | — | 727 | — | — | — | — | — | — | — | — | — | — | — | — | — | 727 |
| OTC Total return | | | | | | | | | | | | | | | | | |
| swap contracts*# | — | 277,784 | — | — | — | — | — | 30,770 | — | — | — | — | — | — | — | — | 308,554 |
| OTC Credit default contracts — | | | | | | | | | | | | | | | | | |
| protection sold*# | 5,294 | — | — | — | — | 24,532 | 6,617 | 2,515 | — | — | 2,129 | — | 2,432 | — | — | — | 43,519 |
| OTC Credit default contracts — | | | | | | | | | | | | | | | | | |
| protection purchased*# | — | — | — | — | — | — | — | — | — | — | — | — | — | — | — | — | — |
| Centrally cleared credit | | | | | | | | | | | | | | | | | |
| default contracts§ | — | — | — | — | — | — | — | — | — | — | — | — | — | — | — | — | — |
| Futures contracts§ | — | — | — | 305,169 | — | — | — | — | — | — | 5,516 | — | — | — | — | — | 310,685 |
| Forward currency contracts# | 30 | — | — | — | 970 | — | — | 552 | 797 | 14,985 | — | — | 1,933 | 754 | 398 | 59 | 20,478 |
| Total Liabilities | $5,324 | $277,784 | $727 | $305,169 | $970 | $24,532 | $6,617 | $33,837 | $797 | $14,985 | $7,645 | $— | $4,365 | $754 | $398 | $59 | $683,963 |
| Total Financial and Derivative | | | | | | | | | | | | | | | | | |
| Net Assets | $(5,138) | $(34,588) | $13,637 | $(296,919) | $(970) | $(11,191) | $11,578 | $18,762 | $(49) | $(14,845) | $17,827 | $3,262 | $22,853 | $3,585 | $(398) | $5,003 | $(267,591) |
| Total collateral | | | | | | | | | | | | | | | | | |
| received (pledged)†## | $— | $— | $— | $— | $— | $— | $— | $— | $— | $— | $— | $— | $— | $— | $— | $— | |
| Net amount | $(5,138) | $(34,588) | $13,637 | $(296,919) | $(970) | $(11,191) | $11,578 | $18,762 | $(49) | $(14,845) | $17,827 | $3,262 | $22,853 | $3,585 | $(398) | $5,003 | |
| Controlled collateral received | | | | | | | | | | | | | | | | | |
| (including TBA commitments)** | $— | $— | $— | $— | $— | $— | $— | $— | $— | $— | $— | $— | $— | $— | $— | $— | $— |
| Uncontrolled collateral received | $— | $— | $— | $— | $— | $— | $— | $— | $— | $— | $— | $— | $— | $— | $— | $— | $— |
| Collateral (pledged) (including | | | | | | | | | | | | | | | | | |
| TBA commitments)** | $— | $— | $— | $— | $— | $— | $— | $— | $— | $— | $— | $— | $— | $— | $— | $— | $— |
*Excludes premiums, if any. Included in unrealized appreciation and depreciation on OTC swap contracts on the Statement of assets and liabilities.
**Included with Investments in securities on the Statement of assets and liabilities.
†Additional collateral may be required from certain brokers based on individual agreements.
# Covered by master netting agreement (Note 1).
## Any over-collateralization of total financial and derivative net assets is not shown. Collateral may include amounts related to unsettled agreements.
§ Includes current day’s variation margin only as reported on the Statement of assets and liabilities, which is not collateralized. Cumulative appreciation/(depreciation) for futures contracts and centrally cleared swap contracts is represented in the tables listed after the fund’s portfolio. Collateral pledged for initial margin on futures contracts and centrally cleared swap contracts, which is not included in the table above, amounted to $1,565,671 and $184,481, respectively.
| | |
| 42 Putnam VT Global Asset Allocation Fund | Putnam VT Global Asset Allocation Fund 43 |
Note 10 — Of special note
On May 31, 2023, Franklin Resources, Inc. (“Franklin Resources”) and Great-West Lifeco Inc., the parent company of Putnam U.S. Holdings I, LLC (“Putnam Holdings”), announced that they have entered into a definitive agreement for a subsidiary of Franklin Resources to acquire Putnam Holdings in a stock and cash transaction.
As part of this transaction, Putnam Management, a wholly-owned subsidiary of Putnam Holdings and investment manager to the Putnam family of funds (the “Putnam Funds”), would become an indirect wholly-owned subsidiary of Franklin Resources.
The transaction is subject to customary closing conditions, including receipt of applicable regulatory approvals. Subject to such approvals and the satisfaction of these conditions, the transaction is currently expected to be consummated in the fourth quarter of 2023.
Under the Investment Company Act of 1940, as amended, consummation of the transaction will result in the automatic termination of the investment management contract between each Putnam Fund and Putnam Management and any related sub-management and sub-advisory contracts, where applicable. In anticipation of this automatic termination, on June 23, 2023, the Board of Trustees of the Putnam Funds approved a new investment management contract between each Putnam Fund and Putnam Management (and new sub-management and sub-advisory contracts, if applicable), which will be presented to the shareholders of each Putnam Fund for their approval at shareholder meetings currently expected to occur in October 2023. Proxy solicitation materials related to these meetings have been made available to shareholders that held shares of the fund at the close of business on July 24, 2023.
| |
| 44 Putnam VT Global Asset Allocation Fund |
Trustee approval of management contract
Consideration of your fund’s new and interim management, sub-management and sub-advisory contracts
At their meeting on June 23, 2023, the Board of Trustees of your fund, including all of the Trustees who are not “interested persons” (as this term is defined in the Investment Company Act of 1940, as amended (the “1940 Act”)) of the Putnam mutual funds, closed-end funds, and exchange-traded funds (collectively, the “funds”) (the “Independent Trustees”) approved, subject to approval by your fund’s shareholders, a new management contract with Putnam Investment Management (“Putnam Management”), a new sub-management contract between Putnam Management and its affiliate, Putnam Investments Limited (“PIL”), and a new sub-advisory contract among Putnam Management, PIL and another affiliate, The Putnam Advisory Company (“PAC”) (collectively, the “New Management Contracts”). The Trustees considered the proposed New Management Contracts in connection with the planned acquisition of Putnam U.S. Holdings I, LLC (“Putnam Holdings”) by a subsidiary of Franklin Resources, Inc. (“Franklin Templeton”). The Trustees considered that, on May 31, 2023, Franklin Templeton and Great-West Lifeco Inc., the parent company of Putnam Holdings, announced that they had entered into a definitive agreement for a subsidiary of Franklin Templeton to acquire Putnam Holdings in a stock and cash transaction (the “Transaction”). The Trustees noted that Putnam Holdings was the parent company of Putnam Management, PIL and PAC. The Trustees were advised that the Transaction would result in a “change of control” of Putnam Management, PIL and PAC and would cause your fund’s current Management Contract with Putnam Management, Sub-Management Contract with PIL and Sub-Advisory Contract with PAC (collectively, the “Current Management Contracts”) to terminate in accordance with the 1940 Act. The Trustees considered that the New Management Contracts would take effect upon the closing of the Transaction, which was expected to occur in the fourth quarter of 2023.
In addition to the New Management Contracts, the Trustees also approved interim management, sub-management and sub-advisory contracts with Putnam Management, PIL and PAC, respectively (the “Interim Management Contracts”), which would take effect in the event that for any reason shareholder approval of a New Management Contract was not received by the time of the Transaction closing. The Trustees considered that each Interim Management Contract that became effective would remain in effect until shareholders approved the proposed New Management Contract, or until 150 days elapse after the closing of the Transaction, whichever occurred first. The considerations and conclusions discussed in connection with the Trustees’ consideration of the New Management Contracts and the continuance of your fund’s Current Management Contracts also apply to the Trustees’ consideration of the Interim Management Contracts, supplemented by consideration of the terms, nature and reason for any Interim Management Contract.
The Independent Trustees met with their independent legal counsel, as defined in Rule 0-1(a)(6) under the 1940 Act (their “independent legal counsel”), and representatives of Putnam Management and its parent company, Power Corporation of Canada, to discuss the potential Transaction, including the timing and structure of the Transaction and its implications for Putnam Management and the funds, during their regular meeting on November 18, 2022, and the full Board of Trustees further discussed these matters with representatives of Putnam Management at its regular meeting on December 15, 2022. At a special meeting on December 20, 2022, the full Board of Trustees met with representatives of Putnam Management, Power Corporation of Canada and Franklin Templeton to further discuss the potential Transaction, including Franklin Templeton’s strategic plans for Putnam Management’s asset management business and the funds, potential sources of synergy between Franklin Templeton and Putnam Management, potential areas of partnership between Power Corporation of Canada and Franklin Templeton, Franklin Templeton’s distribution capabilities, Franklin Templeton’s existing service provider relationships and Franklin Templeton’s recent acquisitions of other asset management firms.
In order to assist the Independent Trustees in their consideration of the New Management Contracts and other anticipated impacts of the Transaction on the funds and their shareholders, independent legal counsel for the Independent Trustees furnished an initial information request to Franklin Templeton (the “Initial Franklin Request”). At a special meeting of the full Board of Trustees held on January 25, 2023, representatives of Franklin Templeton addressed the firm’s responses to the Initial Franklin Request. At the meeting, representatives of Franklin Templeton discussed, among other things, the business and financial condition of Franklin Templeton and its affiliates, Franklin Templeton’s U.S. registered fund operations, its recent acquisition history, Franklin Templeton’s intentions regarding the operation of Putnam Management and the funds following the completion of the potential Transaction and expected benefits to the funds and Putnam Management that might result from the Transaction.
The Board of Trustees actively monitored developments with respect to the potential Transaction throughout the period leading up to the public announcement of a final sale agreement on May 31, 2023. The Independent Trustees met to discuss these matters at their regular meetings on January 27, April 20 and May 19, 2023. The full Board of Trustees also discussed developments at their regular meeting on February 23, 2023. Following the public announcement of the Transaction on May 31, 2023, independent legal counsel for the Independent Trustees furnished a supplemental information request (the “Supplemental Franklin Request”) to Franklin Templeton. At the Board of Trustees’ regular in-person meeting held on June 22–23, 2023, representatives of Putnam Management and Power Corporation of Canada provided further information regarding, among other matters, the final terms of the Transaction and efforts undertaken to retain Putnam employees. The Contract Committee of the Board of Trustees also met on June 22, 2023 to discuss Franklin Templeton’s responses to the Supplemental Franklin Request. Mr. Reynolds, the only Trustee affiliated with Putnam Management, participated in portions of these meetings to provide the perspective of the Putnam organization, but did not otherwise participate in the deliberations of the Independent Trustees or the Contract Committee regarding the potential Transaction.
After the presentations and after reviewing the written materials provided, the Independent Trustees met at their in-person meeting on June 23, 2023 to consider the New Management Contracts for each fund, proposed to become effective upon the closing of the Transaction, and the filing of a preliminary proxy statement. At this meeting and throughout the process, the Independent Trustees also received advice from their independent legal counsel regarding their responsibilities in evaluating the potential Transaction and the New Management Contracts. The Independent Trustees reviewed the terms of the proposed New Management Contracts and the differences between the New
| | |
| | Putnam VT Global Asset Allocation Fund 45 |
Management Contracts and the Current Management Contracts. They noted that the terms of the proposed New Management Contracts were substantially identical to the Current Management Contracts, except for certain changes designed largely to address differences among various of the existing contracts, which had been developed and implemented at different times in the past.
In considering the approval of the proposed New Management Contracts, the Board of Trustees took into account a number of factors, including:1
(i) Franklin Templeton’s and Putnam Management’s belief that the Transaction would not adversely affect the funds or their shareholders and their belief that the Transaction was likely to result in certain benefits (described below) for the funds and their shareholders;
(ii) That Franklin Templeton did not intend to make any material change in Putnam Management’s senior investment professionals (other than certain changes related to reporting structure and organization of personnel discussed below), including the portfolio managers of the funds, or to the firm’s operating locations as a result of the Transaction;
(iii) That Franklin Templeton intended for Putnam Management’s equity investment professionals to continue to operate largely independently from Franklin Templeton, reporting to Franklin Templeton’s Head of Public Markets following the Transaction;
(iv) That, while Putnam Management’s organizational structure was not expected to change immediately following the Transaction, Franklin Templeton intended to revise Putnam Management’s reporting structure in order to include Putnam Management’s fixed income investment professionals in Franklin Templeton’s fixed income group and to include Putnam Management’s Global Asset Allocation (“GAA”) investment professionals in Franklin Templeton’s investment solutions group, with both Franklin Templeton groups reporting to Franklin Templeton’s Head of Public Markets;
(v) Franklin Templeton’s expectation that there would not be any changes in the investment objectives, strategies or portfolio holdings of the funds as a result of the Transaction;
(vi) That neither Franklin Templeton nor Putnam Management had any current plans to propose changes to the funds’ existing management fees or expense limitations, or current plans to make changes to the funds’ existing distribution arrangements;
(vii) Franklin Templeton’s and Putnam Management’s representations that, following the Transaction, there was not expected to be any diminution in the nature, quality and extent of services provided to the funds and their shareholders by Putnam Management, PIL and PAC, including compliance and other non-advisory services;
(viii) That Franklin Templeton did not currently plan to change the branding of the funds or to change the lineup of funds in connection with the Transaction but would continue to evaluate how best to position the funds in the market;
(ix) The possible benefits accruing to the funds and their shareholders as a result of the Transaction, including:
a. That the scale of Franklin Templeton’s investment operations platform would increase the investment and operational resources available to the funds;
b. That the Putnam open-end funds would benefit from Franklin Templeton’s large retail and institutional global distribution capabilities and significant network of intermediary relationships, which may provide additional opportunities for the funds to increase assets and reduce expenses by spreading expenses over a larger asset base; and
c. Potential benefits to shareholders of the Putnam open-end that could result from the alignment of certain fund features and shareholder benefits with those of other funds sponsored by Franklin Templeton and its affiliates and access to a broader array of investment opportunities;
(x) The financial strength, reputation, experience and resources of Franklin Templeton and its investment advisory subsidiaries;
(xi) Franklin Templeton’s expectation that the Transaction would not impact the capabilities or responsibilities of Putnam Management’s Investment Division (other than any impact related to reporting structure changes for Putnam Management’s equity, fixed income and GAA investment groups and to including Putnam Management’s fixed income and GAA investment professionals in existing Franklin Templeton investment groups, as discussed above) and that any changes to the Investment Division over the longer term would be made in order to achieve perceived operational efficiencies or improvements to the portfolio management process;
(xii) Franklin Templeton’s commitment to maintaining competitive compensation arrangements to allow Putnam Management to continue to attract and retain highly qualified personnel and Putnam Management’s and Franklin Templeton’s efforts to retain personnel, including efforts implemented since the Transaction was announced;
(xiii) That the current senior management teams at Putnam Management and Power Corporation of Canada had indicated their strong support of the Transaction and that Putnam Management had recommended that the Board of Trustees approve the New Management Contracts; and
(xiv) Putnam Management’s and Great-West Lifeco Inc.’s commitment to bear all expenses incurred by the funds in connection with the Transaction, including all costs associated with the proxy solicitation in connection with seeking shareholder approval of the New Management Contracts.
Finally, in considering the proposed New Management Contracts, the Board of Trustees also took into account their concurrent deliberations and conclusions, as described below, in connection with their annual review of the funds’ Current Management Contracts and the approval of their continuance, effective July 1, 2023, and the extensive materials that they had reviewed in connection with that review process.
Based upon the foregoing considerations, on June 23, 2023, the Board of Trustees, including all of the Independent Trustees, unanimously approved the proposed New Management Contracts and determined to recommend their approval to the shareholders of the funds.
General conclusions — Current Management Contracts
The Board of Trustees oversees the management of each fund and, as required by law, determines annually whether to approve the

1 All subsequent references to Putnam Management describing the Board of Trustees’ considerations should be deemed to include references to PIL and PAC as necessary or appropriate in the context.
| |
| 46 Putnam VT Global Asset Allocation Fund |
continuance of your fund’s management contract with Putnam Management, the sub-management contract with respect to your fund between Putnam Management and PIL and the sub-advisory contract among Putnam Management, PIL and PAC. (Because PIL and PAC are affiliates of Putnam Management and Putnam Management remains fully responsible for all services provided by PIL and PAC, the Trustees have not attempted to evaluate PIL or PAC as separate entities.) The Board of Trustees, with the assistance of its Contract Committee, requests and evaluates all information it deems reasonably necessary under the circumstances in connection with its annual contract review. The Contract Committee consists solely of Independent Trustees.
At the outset of the review process, members of the Board of Trustees’ independent staff and independent legal counsel considered any possible changes to the annual contract review materials furnished to the Contract Committee during the course of the previous year’s review and, as applicable, identified those changes to Putnam Management. Following these discussions and in consultation with the Contract Committee, the Independent Trustees’ independent legal counsel requested that Putnam Management and its affiliates furnish specified information, together with any additional information that Putnam Management considered relevant, to the Contract Committee. Over the course of several months ending in June 2023, the Contract Committee met on a number of occasions with representatives of Putnam Management, and separately in executive session, to consider the information that Putnam Management provided. Throughout this process, the Contract Committee was assisted by the members of the Board of Trustees’ independent staff and by independent legal counsel for the funds and the Independent Trustees.
At the Board of Trustees’ June 2023 meeting, the Contract Committee met in executive session to discuss and consider its recommendations with respect to the continuance of the contracts. At that meeting, the Contract Committee also met in executive session with the other Independent Trustees to review a summary of the key financial, performance and other data that the Contract Committee considered in the course of its review. The Contract Committee recommended, and the Independent Trustees approved, the continuance of your fund’s Current Management Contracts, effective July 1, 2023, and the approval of your fund’s New Management Contracts and Interim Management Contracts, as discussed above.
The Independent Trustees’ approvals were based on the following conclusions:
• That the fee schedule in effect for your fund represented reasonable compensation in light of the nature and quality of the services being provided to the fund, the fees paid by competitive funds, the costs incurred by Putnam Management in providing services to the fund and the application of certain reductions and waivers noted below; and
• That the fee schedule in effect for your fund represented an appropriate sharing between fund shareholders and Putnam Management of any economies of scale as may exist in the management of the fund at current asset levels.
These conclusions were based on a comprehensive consideration of all information provided to the Trustees and were not the result of any single factor. Some of the factors that figured particularly in the Trustees’ deliberations and how the Trustees considered these factors are described below, although individual Trustees may have evaluated the information presented differently, giving different weights to various factors. It is also important to recognize that the management arrangements for your fund and the other Putnam mutual funds and closed-end funds are the result of many years of review and discussion between the Independent Trustees and Putnam Management, that some aspects of the arrangements may receive greater scrutiny in some years than others and that the Trustees’ conclusions may be based, in part, on their consideration of fee arrangements in previous years. For example, with certain exceptions primarily involving newer funds (including the exchange-traded funds) or repositioned funds, the current fee arrangements under the vast majority of the funds’ management contracts were first implemented at the beginning of 2010 following extensive review by the Contract Committee and discussions with representatives of Putnam Management, as well as approval by shareholders. The Trustees also took into account their concurrent deliberations and conclusions, and the materials that they had reviewed, in connection with their approval on June 23, 2023 of the Interim Management Contracts and the New Management Contracts, which had been proposed in light of the Transaction (which would cause the fund’s Current Management Contracts to terminate in accordance with applicable law or the terms of each contract).
Management fee schedules and total expenses
The Trustees reviewed the management fee schedules in effect for all funds, including fee levels and breakpoints. Under its management contract, your fund has the benefit of breakpoints in its management fee schedule that provide shareholders with reduced fee levels as assets under management in the Putnam family of funds increase. The Trustees also reviewed the total expenses of each Putnam fund, recognizing that in most cases management fees represented the major, but not the sole, determinant of total costs to fund shareholders. (Two mutual funds and each of the exchange-traded funds have implemented so-called “all-in” or unitary management fees covering substantially all routine fund operating costs.)
In reviewing fees and expenses, the Trustees generally focus their attention on material changes in circumstances — for example, changes in assets under management, changes in a fund’s investment strategy, changes in Putnam Management’s operating costs or profitability, or changes in competitive practices in the fund industry — that suggest that consideration of fee changes might be warranted. The Trustees concluded that the circumstances did not indicate that changes to the management fee schedule for your fund would be appropriate at this time.
As in the past, the Trustees also focused on the competitiveness of each fund’s total expense ratio. The Trustees, Putnam Management and the funds’ investor servicing agent, Putnam Investor Services, Inc. (“PSERV”), have implemented expense limitations that were in effect during your fund’s fiscal year ending in 2022. These expense limitations were: (i) a contractual expense limitation applicable to specified mutual funds, including your fund, of 25 basis points on investor servicing fees and expenses and (ii) a contractual expense limitation applicable to specified mutual funds, including your fund, of 20 basis points on so-called “other expenses” (i.e., all expenses exclusive of management fees, distribution fees, investor servicing fees, investment-related expenses, interest, taxes, brokerage commissions, acquired fund fees and expenses and extraordinary expenses). These expense limitations attempt to maintain competitive expense levels for the funds. Most funds had sufficiently low expenses that these expense limitations were not operative during their fiscal years ending in 2022. However, in the case of your fund, the second expense limitation applied during its fiscal year ending in 2022. Putnam Management and PSERV have agreed to maintain these
| | |
| | Putnam VT Global Asset Allocation Fund 47 |
expense limitations until at least April 30, 2025. Putnam Management and PSERV’s commitment to these expense limitation arrangements, which were intended to support an effort to have the mutual fund expenses meet competitive standards, was an important factor in the Trustees’ decision to approve your fund’s New Management Contracts and Interim Management Contracts and the continuance of your fund’s Current Management Contracts.
The Trustees reviewed comparative fee and expense information for a custom group of competitive funds selected by Broadridge Financial Solutions, Inc. (“Broadridge”). This comparative information included your fund’s percentile ranking for effective management fees and total expenses (excluding any applicable 12b-1 fees), which provides a general indication of your fund’s relative standing. In the custom peer group, your fund ranked in the second quintile in effective management fees (determined for your fund and the other funds in the custom peer group based on fund asset size and the applicable contractual management fee schedule) and in the fourth quintile in total expenses (excluding any applicable 12b-1 fees) as of December 31, 2022. The first quintile represents the least expensive funds and the fifth quintile the most expensive funds. The fee and expense data reported by Broadridge as of December 31, 2022 reflected the most recent fiscal year-end data available in Broadridge’s database at that time.
In connection with their review of fund management fees and total expenses, the Trustees also reviewed the costs of the services provided and the profits realized by Putnam Management and its affiliates from their contractual relationships with the funds. This information included trends in revenues, expenses and profitability of Putnam Management and its affiliates relating to the investment management, investor servicing and distribution services provided to the funds, as applicable. In this regard, the Trustees also reviewed an analysis of the revenues, expenses and profitability of Putnam Management and its affiliates, allocated on a fund-by-fund basis, with respect to (as applicable) the funds’ management, distribution and investor servicing contracts. For each fund, the analysis presented information about revenues, expenses and profitability in 2022 for each of the applicable agreements separately and for the agreements taken together on a combined basis. The Trustees concluded that, at current asset levels, the fee schedules in place for each of the funds, including the fee schedule for your fund, represented reasonable compensation for the services being provided and represented an appropriate sharing between fund shareholders and Putnam Management of any economies of scale as may exist in the management of the funds at that time.
The information examined by the Trustees in connection with their annual contract review for the funds included information regarding services provided and fees charged by Putnam Management and its affiliates to other clients, including collective investment trusts offered in the defined contribution and defined benefit retirement plan markets, sub-advised mutual funds, private funds sponsored by affiliates of Putnam Management, model-only separately managed accounts and Putnam Management’s manager-traded separately managed account programs. This information included, in cases where a product’s investment strategy corresponds with a fund’s strategy, comparisons of those fees with fees charged to the funds, as well as an assessment of the differences in the services provided to these clients as compared to the services provided to the funds. The Trustees observed that the differences in fee rates between these clients and the funds are by no means uniform when examined by individual asset sectors, suggesting that differences in the pricing of investment management services to these types of clients may reflect, among other things, historical competitive forces operating in separate marketplaces. The Trustees considered the fact that in many cases fee rates across different asset classes are higher on average for 1940 Act-registered funds than for other clients, and the Trustees also considered the differences between the services that Putnam Management provides to the funds and those that it provides to its other clients. The Trustees did not rely on these comparisons to any significant extent in concluding that the management fees paid by your fund are reasonable.
Investment performance
The quality of the investment process provided by Putnam Management represented a major factor in the Trustees’ evaluation of the quality of services provided by Putnam Management under your fund’s management contract. The Trustees were assisted in their review of Putnam Management’s investment process and performance by the work of the investment oversight committees of the Trustees and the full Board of Trustees, which meet on a regular basis with individual portfolio managers and with senior management of Putnam Management’s Investment Division throughout the year. The Trustees concluded that Putnam Management generally provides a high-quality investment process — based on the experience and skills of the individuals assigned to the management of fund portfolios, the resources made available to them and in general Putnam Management’s ability to attract and retain high-quality personnel — but also recognized that this does not guarantee favorable investment results for every fund in every time period.
The Trustees considered that, in the aggregate, peer-relative and benchmark-relative Putnam fund performance was generally encouraging in 2022 against a backdrop of volatile equity and fixed income markets, driven by factors such as Russia’s invasion of Ukraine, increased tensions with China, disruptions in energy markets and broader supply chains, rising inflation and the significant tightening of monetary policy by the Board of Governors of the Federal Reserve in an effort to combat inflation. The Trustees further noted that, in the face of these numerous economic headwinds, corporate earnings and employment data had been generally robust throughout 2022. For the one-year period ended December 31, 2022, the Trustees noted that the Putnam funds, on an asset-weighted basis, ranked in the 41st percentile of their peers as determined by Lipper Inc. (“Lipper”) and, on an asset-weighted-basis, outperformed their benchmarks by 1.3% gross of fees over the one-year period. The Committee also noted that the funds’ aggregate performance over longer-term periods continued to be strong, with the funds, on an asset-weighted basis, ranking in the 34th, 27th and 22nd percentiles of their Lipper peers over the three-year, five-year and ten-year periods ended December 31, 2022, respectively. The Trustees further noted that the funds, in the aggregate, outperformed their benchmarks on a gross basis for each of the three-year, five-year and ten-year periods. The Trustees also considered the Morningstar Inc. ratings assigned to the funds and that 40 funds were rated four or five stars at the end of 2022, which represented an increase of 15 funds year-over-year. The Trustees also considered that seven funds were five-star rated at the end of 2022, which was a year-over-year decrease of two funds, and that 83% of the funds’ aggregate assets were in four- or five-star rated funds at year end.
In addition to the performance of the individual Putnam funds, the Trustees considered, as they had in prior years, the performance of The Putnam Fund complex versus competitor fund complexes, as reported in the Barron’s/Lipper Fund Families survey (the “Survey”). The Trustees noted that the Survey ranks mutual fund companies based on their performance across a variety of asset types, and that The Putnam Fund
| |
| 48 Putnam VT Global Asset Allocation Fund |
complex had performed exceptionally well in 2022. In this regard, the Trustees considered that the funds had ranked 9th out of 49 fund companies, 3rd out of 49 fund companies and 2nd out of 47 fund companies for the one-year, five-year and ten-year periods, respectively. The Trustees also noted that The Putnam Fund complex had been the only fund family to rank in the top ten in all three time periods. They also noted, however, the disappointing investment performance of some Putnam funds for periods ended December 31, 2022 and considered information provided by Putnam Management regarding the factors contributing to the underperformance and, where relevant, actions being taken to improve the performance of these particular funds. The Trustees indicated their intention to continue to monitor the performance of those funds.
For purposes of the Trustees’ evaluation of the Putnam funds’ investment performance, the Trustees generally focus on a competitive industry ranking of each fund’s total net return over a one-year, three-year and five-year period. For a number of Putnam funds with relatively unique investment mandates for which Putnam Management informed the Trustees that meaningful competitive performance rankings are not considered to be available, the Trustees evaluated performance based on their total gross and net returns and comparisons of those returns to the returns of selected investment benchmarks. In the case of your fund, the Trustees considered that its class IA share cumulative total return performance at net asset value was in the following quartiles of its Lipper peer group (Lipper VP (Underlying Funds) — Mixed-Asset Target Allocation Moderate Funds) for the one-year, three-year and five-year periods ended December 31, 2022 (the first quartile representing the best-performing funds and the fourth quartile the worst-performing funds):
| | |
| One-year period | Three-year period | Five-year period |
| 3rd | 1st | 2nd |
Over the one-year, three-year and five-year periods ended December 31, 2022, there were 285, 275 and 256 funds, respectively, in your fund’s Lipper peer group. (When considering performance information, shareholders should be mindful that past performance is not a guarantee of future results.)
The Trustees also considered Putnam Management’s continued efforts to support fund performance through certain initiatives, including structuring compensation for portfolio managers to enhance accountability for fund performance, emphasizing accountability in the portfolio management process and affirming its commitment to a fundamental-driven approach to investing.
Brokerage and soft-dollar allocations; distribution and investor servicing
The Trustees considered various potential benefits that Putnam Management may receive in connection with the services it provides under the management contract with your fund. These include benefits related to brokerage allocation and the use of soft dollars, whereby a portion of the commissions paid by a fund for brokerage may be used to acquire research services that are expected to be useful to Putnam Management in managing the assets of the fund and of other clients. Subject to policies established by the Trustees, soft dollars generated by these means are used predominantly to acquire brokerage and research services (including third-party research and market data) that enhance Putnam Management’s investment capabilities and supplement Putnam Management’s internal research efforts. The Trustees indicated their continued intent to monitor regulatory and industry developments in this area with the assistance of their Brokerage Committee. In addition, with the assistance of their Brokerage Committee, the Trustees indicated their continued intent to monitor the allocation of the funds’ brokerage in order to ensure that the principle of seeking best price and execution remains paramount in the portfolio trading process.
Putnam Management may also receive benefits from payments made to Putnam Management’s affiliates by the mutual funds for distribution services and investor services. In conjunction with the review of your fund’s management, sub-management and sub-advisory contracts, the Trustees reviewed your fund’s investor servicing agreement with PSERV and its distributor’s contract and distribution plans with Putnam Retail Management Limited Partnership (“PRM”), both of which are affiliates of Putnam Management. The Trustees concluded that the fees payable by the mutual funds to PSERV and PRM for such services were fair and reasonable in relation to the nature and quality of such services, the fees paid by competitive funds and the costs incurred by PSERV and PRM in providing such services. Furthermore, the Trustees were of the view that the investor services provided by PSERV were required for the operation of the mutual funds, and that they were of a quality at least equal to those provided by other providers.
| | |
| | Putnam VT Global Asset Allocation Fund 49 |
Other important information
Proxy voting
Putnam is committed to managing our mutual funds in the best interests of our shareholders. The Putnam funds’ proxy voting guidelines and procedures, as well as information regarding how your fund voted proxies relating to portfolio securities during the 12-month period ended June 30, 2022, are available in the Individual Investors section of putnam.com and on the Securities and Exchange Commission’s (SEC) website at www.sec.gov. If you have questions about finding forms on the SEC’s website, you may call the SEC at 1-800-SEC-0330. You may also obtain the Putnam funds’ proxy voting guidelines and procedures at no charge by calling Putnam’s Shareholder Services at 1-800-225-1581.
Fund portfolio holdings
The fund will file a complete schedule of its portfolio holdings with the SEC for the first and third quarters of each fiscal year on Form N-PORT within 60 days of the end of such fiscal quarter. Shareholders may obtain the fund��s Form N-PORT from the SEC’s website at www.sec.gov.
Liquidity risk management program
Putnam, as the administrator of the fund’s liquidity risk management program (appointed by the Board of Trustees), presented the most recent annual report on the program to the Trustees in May 2023. The report covered the structure of the program, including the program documents and related policies and procedures adopted to comply with Rule 22e-4 under the Investment Company Act of 1940, and reviewed the operation of the program from January 2022 through December 2022. The report included a description of the annual liquidity assessment of the fund that Putnam performed in November 2022. The report noted that there were no material compliance exceptions identified under Rule 22e-4 during the period. The report included a review of the governance of the program and the methodology for classification of the fund’s investments. Putnam concluded that the program has been operating effectively and adequately to ensure compliance with Rule 22e-4.
Fund information
| | |
| Investment Manager | Investor Servicing Agent | Trustees |
| Putnam Investment Management, LLC | Putnam Investments | Kenneth R. Leibler, Chair |
| 100 Federal Street | Mailing address: | Barbara M. Baumann, Vice Chair |
| Boston, MA 02110 | P.O. Box 219697 | Liaquat Ahamed |
| | Kansas City, MO 64121-9697 | Katinka Domotorffy |
| Investment Sub-Advisors | 1-800-225-1581 | Catharine Bond Hill |
| Putnam Investments Limited | | Jennifer Williams Murphy |
| 16 St James’s Street | Custodian | Marie Pillai |
| London, England SW1A 1ER | State Street Bank and Trust Company | George Putnam III |
| | | Robert L. Reynolds |
| The Putnam Advisory Company, LLC | Legal Counsel | Manoj P. Singh |
| 100 Federal Street | Ropes & Gray LLP | Mona K. Sutphen |
| Boston, MA 02110 | | |
| | | |
| Marketing Services | | |
| Putnam Retail Management | | |
| Limited Partnership | | |
| 100 Federal Street | | |
| Boston, MA 02110 | | |
The fund’s Statement of Additional Information contains additional information about the fund’s Trustees and is available without charge upon request by calling 1-800-225-1581.
| |
| This report has been prepared for the shareholders | |
| of Putnam VT Global Asset Allocation Fund. | SA83_VT 334250 8/23 |
| |
| Item 3. Audit Committee Financial Expert: |
| |
| Item 4. Principal Accountant Fees and Services: |
| |
| Item 5. Audit Committee of Listed Registrants |
| |
| Item 6. Schedule of Investments: |
| |
| The registrant’s schedule of investments in unaffiliated issuers is included in the report to shareholders in Item 1 above. |
| |
| Item 7. Disclosure of Proxy Voting Policies and Procedures For Closed-End Management Investment Companies: |
| |
| Item 8. Portfolio Managers of Closed-End Investment Companies |
| |
| Item 9. Purchases of Equity Securities by Closed-End Management Investment Companies and Affiliated Purchasers: |
| |
| Item 10. Submission of Matters to a Vote of Security Holders: |
| |
| Item 11. Controls and Procedures: |
| |
| (a) The registrant’s principal executive officer and principal financial officer have concluded, based on their evaluation of the effectiveness of the design and operation of the registrant’s disclosure controls and procedures as of a date within 90 days of the filing date of this report, that the design and operation of such procedures are generally effective to provide reasonable assurance that information required to be disclosed by the registrant in this report is recorded, processed, summarized and reported within the time periods specified in the Commission’s rules and forms. |
| |
| (b) Changes in internal control over financial reporting: Not applicable |
| |
| Item 12. Disclosures of Securities Lending Activities for Closed-End Investment Companies: |
| |
| Pursuant to the requirements of the Securities Exchange Act of 1934 and the Investment Company Act of 1940, the registrant has duly caused this report to be signed on its behalf by the undersigned, thereunto duly authorized. |
| |
| By (Signature and Title): |
| |
| /s/ Janet C. Smith
Janet C. Smith
Principal Accounting Officer
|
| |
| Pursuant to the requirements of the Securities Exchange Act of 1934 and the Investment Company Act of 1940, this report has been signed below by the following persons on behalf of the registrant and in the capacities and on the dates indicated. |
| |
| By (Signature and Title): |
| |
| /s/ Jonathan S. Horwitz
Jonathan S. Horwitz
Principal Executive Officer
|
| |
| By (Signature and Title): |
| |
| /s/ Janet C. Smith
Janet C. Smith
Principal Financial Officer
|