| | |
| UNITED STATES
SECURITIES AND EXCHANGE COMMISSION |
| | |
| CERTIFIED SHAREHOLDER REPORT OF REGISTERED
MANAGEMENT INVESTMENT COMPANIES
|
| | |
| Investment Company Act file number: | (811-05346) |
| | |
| Exact name of registrant as specified in charter: | Putnam Variable Trust |
| | |
| Address of principal executive offices: | 100 Federal Street, Boston, Massachusetts 02110 |
| | |
| Name and address of agent for service: | Stephen Tate, Vice President
100 Federal Street
Boston, Massachusetts 02110 |
| | |
| Copy to: | Bryan Chegwidden, Esq.
Ropes & Gray LLP
1211 Avenue of the Americas
New York, New York 10036 |
| | |
| | James E. Thomas, Esq.
Ropes & Gray LLP
800 Boylston Street
Boston, Massachusetts 02199 |
| | |
| Registrant’s telephone number, including area code: | (617) 292-1000 |
| | |
| Date of fiscal year end: | December 31, 2023 |
| | |
| Date of reporting period: | January 1 , 2023 – December 31, 2023 |
| | |
|
Item 1. Report to Stockholders: | |
| | |
| The following is a copy of the report transmitted to stockholders pursuant to Rule 30e-1 under the Investment Company Act of 1940: | |
Message from the Trustees
February 13, 2024
Dear Shareholder:
With the new year comes new beginnings. We are pleased to report that on January 1, 2024, Franklin Resources, Inc., a leading global asset management firm operating as Franklin Templeton, acquired Putnam Investments.
With complementary capabilities and an established infrastructure serving over 150 countries, Franklin Templeton enhances Putnam’s investment, risk management, operations, and technology platforms. Together, our firms are committed to delivering strong fund performance and more choices for our investors.
As we enter this new chapter, you can rest assured that your fund continues to be actively managed by the same experienced professionals. Your investment team is exploring new and attractive opportunities for your fund, while monitoring changing market conditions. The following pages provide an update on your fund.
Thank you for investing with Putnam.

Performance summary (as of 12/31/23)
Investment objective
Long-term return consistent with preservation of capital
Net asset value December 31, 2023
| |
| Class IA: $17.56 | Class IB: $17.86 |
Annualized total return at net asset value (as of 12/31/23)
| | | | |
| | | | | | Putnam |
| | | Class IA | | Class IB | | | Balanced |
| | | shares | | shares | | Russell 3000 | | Blended |
| | | (2/1/88) | | (4/30/98) | | Index | | Benchmark |
| 1 year | 17.78% | 17.48% | 25.96% | 17.21% |
| 5 years | 8.41 | 8.14 | 15.16 | 9.24 |
| 10 years | 6.61 | 6.35 | 11.48 | 7.22 |
| Life of fund | 7.53 | 7.33 | 10.80 | — |
For a portion of the periods, the fund had expense limitations, without which returns would have been lower.
The fund’s custom benchmark, the Putnam Balanced Blended Benchmark, was introduced on 12/31/94, which post-dates the inception of the fund.
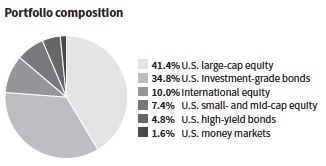
Allocations are shown as a percentage of the fund’s net assets. Cash and net other assets, if any, represent the market value weights of cash, derivatives, short-term securities, and other unclassified assets in the portfolio. Summary information may differ from the portfolio schedule included in the financial statements due to the inclusion of derivative securities, any interest accruals, the exclusion of as-of trades, if any, the use of different classifications of securities for presentation purposes, and rounding. Holdings and allocations may vary over time. Due to rounding, percentages may not equal 100%.
| |
| Putnam VT Global Asset Allocation Fund 1 |
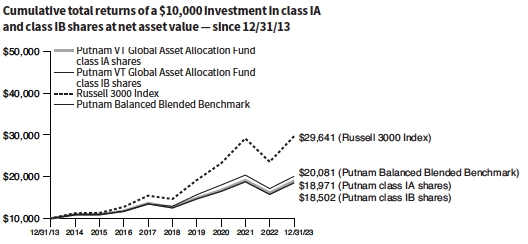
The Russell 3000® Index is an unmanaged index of the 3,000 largest U.S. companies.
The fund’s custom benchmark, the Putnam Balanced Blended Benchmark, was introduced on 12/31/94, which post-dates the inception of the fund.
The Putnam Balanced Blended Benchmark is an unmanaged index administered by Putnam Investment Management, LLC, 50% of which is the Russell 3000 Index, 35% of which is the Bloomberg U.S. Aggregate Bond Index, 10% of which is the MSCI EAFE Index (ND), and 5% of which is the JPMorgan Developed High Yield Index. The Bloomberg U.S. Aggregate Bond Index is an unmanaged index of U.S. investment-grade fixed-income securities. The MSCI EAFE Index (ND) is an unmanaged index of equity securities from developed countries in Western Europe, the Far East, and Australasia. Calculated with net dividends (ND), this total return index reflects the reinvestment of dividends after the deduction of withholding taxes, using a tax rate applicable to non-resident institutional investors who do not benefit from double taxation treaties. The JPMorgan Developed High Yield Index is an unmanaged index of high-yield fixed-income securities issued in developed countries.
All Bloomberg indices are provided by Bloomberg Index Services Limited.
BLOOMBERG® is a trademark and service mark of Bloomberg Finance L.P. and its affiliates (collectively “Bloomberg”). Bloomberg or Bloomberg’s licensors own all proprietary rights in the Bloomberg Indices. Neither Bloomberg nor Bloomberg’s licensors approve or endorse this material, or guarantee the accuracy or completeness of any information herein, or make any warranty, express or implied, as to the results to be obtained therefrom, and to the maximum extent allowed by law, neither shall have any liability or responsibility for injury or damages arising in connection therewith.
Frank Russell Company is the source and owner of the trademarks, service marks, and copyrights related to the Russell Indexes. Russell® is a trademark of Frank Russell Company.
All MSCI indices are provided by MSCI.
MSCI makes no warranties and shall have no liability with respect to any MSCI data reproduced herein. No further redistribution or use is permitted. This report is not prepared or endorsed by MSCI. Important data provider notices and terms available at www.franklintempletondatasources.com. You cannot invest directly in an index.
Data represent past performance. Past performance does not guarantee future results. More recent returns may be less or more than those shown. Investment return and principal value will fluctuate, and you may have a gain or a loss when you sell your shares. Performance information does not reflect any deduction for taxes a shareholder may owe on fund distributions or on the redemption of fund shares. All total return figures are at net asset value and exclude contract charges and expenses, which are added to the variable annuity contracts to determine total return at unit value. Had these charges and expenses been reflected, performance would have been lower. Performance of class IB shares before their inception is derived from the historical performance of class IA shares, adjusted to reflect the higher operating expenses applicable to such shares. For more recent performance, contact your variable annuity provider who can provide you with performance that reflects the charges and expenses at your contract level.
| |
| 2 Putnam VT Global Asset Allocation Fund |
Report from your fund’s managers
Please describe the investing environment for the 12-month reporting period ended December 31, 2023.
Stocks began 2023 on solid ground. In January, China shed the last of its Covid-19 restrictions. U.S. inflation declined for its sixth consecutive month, and the U.S. Federal Reserve continued to reduce the size and pace of its interest-rate hikes. A strong labor market kept the U.S. economy in expansion. Better-than-expected corporate earnings also improved investor sentiment.
In February, new risks emerged. A real-estate crisis in China overshadowed its highly anticipated economic reopening. In March, several regional U.S. bank failures, followed by government intervention, also cautioned investors. A months-long debate over the U.S. debt ceiling further concerned investors. A bipartisan resolution in May helped to calm investors’ nerves, and U.S. Treasury yields moved higher.
U.S. inflation continued to ease but remained above the Fed’s 2% target rate. The Fed skipped a rate increase in June, raised rates in July, and held interest rates steady through period-end. Optimism rose that the Fed would soon end its rate-hiking cycle. At its mid-December meeting, the Fed suggested it would make three rate cuts in calendar 2024. Dovish comments from policymakers caused Treasury yields to move lower and stocks to move higher.
For the 12-month reporting period, U.S. stocks, as measured by the S&P 500 Index, returned 26.29%. High-yield bonds, which performed well along with other risk assets, outperformed investment-grade [IG] corporate bonds for the period. The JPMorgan Developed High Yield Index returned 13.77% compared with 5.53% for the Bloomberg U.S. Aggregate Bond Index. The yield on the benchmark 10-year U.S. Treasury note began the period at 3.88%, rose to a high of 4.99% in October, and returned to 3.88% at period-end.
How did Putnam VT Global Asset Allocation Fund perform for the reporting period?
The fund’s class IA shares returned 17.78%, outperforming its primary benchmark, the Putnam Balanced Blended Benchmark, which returned 17.21% for the period. This custom blended index comprises 50% of the Russell 3000 Index, 35% of the Bloomberg U.S. Aggregate Bond Index, 10% of the MSCI EAFE Index [ND], and 5% of the JPMorgan Developed High Yield Index. The fund underperformed its secondary, all-stock benchmark, the Russell 3000 Index, which returned 25.96% for the period.
What strategies affected the fund’s performance relative to the primary benchmark for the reporting period?
Overall, tactical asset allocation decisions detracted slightly over the period. We adjusted the portfolio’s tactical allocation mix several times in calendar 2023. Relative to the primary benchmark, the fund maintained an underweight position to equity risk in the first half of the reporting period, which was a drag on fund performance as stocks moved higher. We changed to a modestly underweight position in late July 2023, which we retained through period-end.
An out-of-benchmark commodities position relative to the primary benchmark detracted from fund performance. Given the ongoing Russia-Ukraine War and reductions in Covid-19 restrictions, we anticipated global demand for commodities would pick up significantly. However, central bank monetary tightening, lower-than-expected demand from China, and recessionary concerns remained head-winds for commodities. We eliminated our modest long position in late March 2023.
In fixed income, our positioning within interest-rate risk remained tactical and was additive to fund returns. We held a neutral position at the start of the period. In early February, we shifted to a modest underweight position relative to the primary benchmark. By early March, we shifted back to a neutral position. In mid-June, we changed to a modest underweight position, and by late September, returned to a neutral position, which we held through period-end.
Overall, our security selection decisions benefited fund performance. Our quantitative U.S. large-cap core equity strategy benefited fund returns. In quantitative strategies, our team analyzes stock market history to identify characteristics of stocks [factors] that have excess risk-adjusted returns. During the period, our buyback and short interest factors performed well relative to the primary benchmark.
How were derivatives used during the reporting period?
We used futures to help manage the fund’s exposure to market risk, to equitize cash, to hedge interest-rate and prepayment risks, and to gain exposure to interest rates.
As the fund begins a new fiscal year, what is your outlook?
Our near-term outlook for equities is slightly bullish. Recent equity market strength has caused our breadth-thrust signal [a technical indicator that measures market momentum] to fire, which signals the start of a potential new equity bull market.
Our near-term outlook for interest-rate-sensitive fixed income is slightly bearish. The rapid drop in yields in November and December was excessive, in our opinion. The bond market appears to have fully embraced the Fed’s ability to raise rates and avoid a recession at the same time. Given the Fed’s dovish narrative, bond markets have priced in six interest-rate cuts from the Fed in calendar 2024, which we feel is overly aggressive.
Our view on commodities is neutral. Many physical markets remain tight, but the potential for recession and tighter financial conditions are downside risks, in our view. Commodity volatility has also increased significantly.
Against this backdrop, we continue to have conviction in our investment strategies and our ability to adapt the portfolio to changing market conditions.
The foregoing information reflects our views, which are subject to change. They are not meant as investment advice. Please note that the holdings discussed in this report may not have been held by the fund for the entire period. Portfolio composition is subject to review in accordance with the fund’s investment strategy and may vary in the future.
| |
| Putnam VT Global Asset Allocation Fund 3 |

Your fund’s managers also manage other accounts advised by Putnam Management or an affiliate, including retail mutual fund counterparts to the funds in Putnam Variable Trust.
| |
| 4 Putnam VT Global Asset Allocation Fund |
Understanding your fund’s expenses
As an investor in a variable annuity product that invests in a registered investment company, you pay ongoing expenses, such as management fees, distribution fees (12b-1 fees), and other expenses. In the most recent six-month period, your fund’s expenses were limited; had expenses not been limited, they would have been higher. Using the following information, you can estimate how these expenses affect your investment and compare them with the expenses of other funds. You may also pay one-time transaction expenses, which are not shown in this section and would result in higher total expenses. Charges and expenses at the insurance company separate account level are not reflected. For more information, see your fund’s prospectus or talk to your financial representative.
Review your fund’s expenses
The two left-hand columns of the Expenses per $1,000 table show the expenses you would have paid on a $1,000 investment in your fund from 7/1/23 to 12/31/23. They also show how much a $1,000 investment would be worth at the close of the period, assuming actual returns and expenses. To estimate the ongoing expenses you paid over the period, divide your account value by $1,000, then multiply the result by the number in the first line for the class of shares you own.
Compare your fund’s expenses with those of other funds
The two right-hand columns of the Expenses per $1,000 table show your fund’s expenses based on a $1,000 investment, assuming a hypothetical 5% annualized return. You can use this information to compare the ongoing expenses (but not transaction expenses or total costs) of investing in the fund with those of other funds. All shareholder reports of mutual funds and funds serving as variable annuity vehicles will provide this information to help you make this comparison. Please note that you cannot use this information to estimate your actual ending account balance and expenses paid during the period.
Expense ratios
| | |
| | Class IA | Class IB |
| Net expenses for the fiscal year ended | | |
| 12/31/22*† | 0.86% | 1.11% |
| Total annual operating expenses for the fiscal | | |
| year ended 12/31/22† | 0.90% | 1.15% |
| Annualized expense ratio for the six-month | | |
| period ended 12/31/23‡ | 0.86% | 1.11% |
Fiscal year expense information in this table is taken from the most recent prospectus, is subject to change, and may differ from that shown for the annualized expense ratio and in the financial highlights of this report.
Expenses are shown as a percentage of average net assets.
*Reflects Putnam Management’s contractual obligation to limit certain fund expenses through 4/30/24.
†Restated to reflect current fees.
‡Expense ratios for each class are for the fund’s most recent fiscal half year. As a result of this, ratios may differ from expense ratios based on one-year data in the financial highlights.
Expenses per $1,000
| | | | |
| | | | Expenses and value for a |
| | Expenses and value for a | $1,000 investment, assuming |
| | $1,000 investment, assuming | a hypothetical 5% annualized |
| | actual returns for the | return for the 6 months |
| | 6 months ended 12/31/23 | ended 12/31/23 | |
| | Class IA | Class IB | Class IA | Class IB |
| Expenses paid | | | | |
| per $1,000*† | $4.50 | $5.80 | $4.38 | $5.65 |
| Ending value | | | | |
| (after | | | | |
| expenses) | $1,074.70 | $1,073.30 | $1,020.87 | $1,019.61 |
*Expenses for each share class are calculated using the fund’s annualized expense ratio for each class, which represents the ongoing expenses as a percentage of average net assets for the six months ended 12/31/23. The expense ratio may differ for each share class.
†Expenses based on actual returns are calculated by multiplying the expense ratio by the average account value for the period; then multiplying the result by the number of days in the period (184); and then dividing that result by the number of days in the year (365). Expenses based on a hypothetical 5% return are calculated by multiplying the expense ratio by the average account value for the six-month period; then multiplying the result by the number of days in the six-month period (184); and then dividing that result by the number of days in the year (365).
| |
| Putnam VT Global Asset Allocation Fund 5 |
Report of Independent Registered Public Accounting Firm
To the Board of Trustees of Putnam Variable Trust and Shareholders of
Putnam VT Global Asset Allocation Fund:
Opinion on the Financial Statements
We have audited the accompanying statement of assets and liabilities, including the fund’s portfolio, of Putnam VT Global Asset Allocation Fund (one of the funds constituting Putnam Variable Trust, referred to hereafter as the “Fund”) as of December 31, 2023, the related statement of operations for the year ended December 31, 2023, the statement of changes in net assets for each of the two years in the period ended December 31, 2023, including the related notes, and the financial highlights for each of the five years in the period ended December 31, 2023 (collectively referred to as the “financial statements”). In our opinion, the financial statements present fairly, in all material respects, the financial position of the Fund as of December 31, 2023, the results of its operations for the year then ended, the changes in its net assets for each of the two years in the period ended December 31, 2023 and the financial highlights for each of the five years in the period ended December 31, 2023 in conformity with accounting principles generally accepted in the United States of America.
Basis for Opinion
These financial statements are the responsibility of the Fund’s management. Our responsibility is to express an opinion on the Fund’s financial statements based on our audits. We are a public accounting firm registered with the Public Company Accounting Oversight Board (United States) (“PCAOB”) and are required to be independent with respect to the Fund in accordance with the U.S. federal securities laws and the applicable rules and regulations of the Securities and Exchange Commission and the PCAOB.
We conducted our audits of these financial statements in accordance with the standards of the PCAOB. Those standards require that we plan and perform the audit to obtain reasonable assurance about whether the financial statements are free of material misstatement, whether due to error or fraud.
Our audits included performing procedures to assess the risks of material misstatement of the financial statements, whether due to error or fraud, and performing procedures that respond to those risks. Such procedures included examining, on a test basis, evidence regarding the amounts and disclosures in the financial statements. Our audits also included evaluating the accounting principles used and significant estimates made by management, as well as evaluating the overall presentation of the financial statements. Our procedures included confirmation of securities owned as of December 31, 2023 by correspondence with the custodian, transfer agent, agent banks and brokers; when replies were not received from brokers, we performed other auditing procedures. We believe that our audits provide a reasonable basis for our opinion.
PricewaterhouseCoopers LLP
Boston, Massachusetts
February 13, 2024
We have served as the auditor of one or more investment companies in the Putnam Funds family of funds since at least 1957. We have not been able to determine the specific year we began serving as auditor.
| |
| 6 Putnam VT Global Asset Allocation Fund |
The fund’s portfolio 12/31/23
| | |
| COMMON STOCKS (69.6%)* | Shares | Value |
| | | |
| Advertising and marketing services (0.1%) | | |
| Publicis Groupe SA (France) | 1,274 | $118,475 |
| Trade Desk, Inc. (The) Class A † | 850 | 61,166 |
| | | 179,641 |
| Automotive (0.8%) | | |
| Bayerische Motoren Werke AG (Germany) | 110 | 12,235 |
| Ford Motor Co. | 5,131 | 62,547 |
| Mazda Motor Corp. (Japan) | 3,500 | 37,126 |
| PACCAR, Inc. | 626 | 61,129 |
| Stellantis NV (Italy) | 5,744 | 134,654 |
| Subaru Corp. (Japan) | 5,700 | 104,018 |
| Tesla, Inc. † | 1,810 | 449,749 |
| Toyota Motor Corp. (Japan) | 1,600 | 29,371 |
| | | 890,829 |
| Basic materials (2.6%) | | |
| AptarGroup, Inc. | 461 | 56,989 |
| ArcelorMittal SA (France) | 4,013 | 113,806 |
| Archer-Daniels-Midland Co. | 818 | 59,076 |
| Arkema SA (France) | 437 | 49,710 |
| Axalta Coating Systems, Ltd. † | 1,842 | 62,573 |
| BHP Group, Ltd. (ASE Exchange) (Australia) | 3,148 | 107,915 |
| BHP Group, Ltd. (London Exchange) (Australia) | 463 | 15,842 |
| BlueScope Steel, Ltd. (Australia) | 4,643 | 73,892 |
| Builders FirstSource, Inc. † | 1,445 | 241,228 |
| CF Industries Holdings, Inc. | 767 | 60,977 |
| Cie de Saint-Gobain SA (France) | 1,748 | 129,258 |
| CRH PLC (Ireland) | 1,952 | 134,516 |
| Dow, Inc. | 1,133 | 62,134 |
| Eastman Chemical Co. | 712 | 63,952 |
| Fortune Brands Innovations, Inc. | 775 | 59,009 |
| Freeport-McMoRan, Inc. (Indonesia) | 1,615 | 68,751 |
| Glencore PLC (United Kingdom) | 13,162 | 78,962 |
| Holcim AG (Switzerland) | 546 | 42,876 |
| Huntsman Corp. | 2,424 | 60,915 |
| Linde PLC | 151 | 62,017 |
| LyondellBasell Industries NV Class A | 1,520 | 144,522 |
| Martin Marietta Materials, Inc. | 126 | 62,863 |
| Mobe Omdistroer AB | 1,748 | 62,456 |
| NewMarket Corp. | 96 | 52,400 |
| Nucor Corp. | 358 | 62,306 |
| PPG Industries, Inc. | 435 | 65,054 |
| Reliance Steel & Aluminum Co. | 220 | 61,530 |
| Rio Tinto PLC (United Kingdom) | 868 | 64,465 |
| Sherwin-Williams Co. (The) | 205 | 63,940 |
| Shin-Etsu Chemical Co., Ltd. (Japan) | 4,000 | 167,145 |
| Steel Dynamics, Inc. | 542 | 64,010 |
| TopBuild Corp. † | 194 | 72,606 |
| Weyerhaeuser Co. R | 3,502 | 121,765 |
| Yara International ASA (Norway) | 984 | 34,964 |
| | | 2,704,424 |
| Building materials (0.1%) | | |
| Owens Corning | 462 | 68,482 |
| | | 68,482 |
| Capital goods (2.7%) | | |
| A.O. Smith Corp. | 792 | 65,292 |
| Airbus SE (France) | 560 | 86,441 |
| Allison Transmission Holdings, Inc. | 1,016 | 59,080 |
| Aptiv PLC † | 763 | 68,456 |
| BAE Systems PLC (United Kingdom) | 4,672 | 66,099 |
| | |
| COMMON STOCKS (69.6%)* cont. | Shares | Value |
| | | |
| Capital goods cont. | | |
| Berry Global Group, Inc. | 972 | $65,503 |
| Boeing Co. (The) † | 1,306 | 340,422 |
| Caterpillar, Inc. | 226 | 66,821 |
| Curtiss-Wright Corp. | 264 | 58,817 |
| Dassault Aviation SA (France) | 150 | 29,681 |
| Deere & Co. | 169 | 67,578 |
| Donaldson Co., Inc. | 933 | 60,972 |
| Eaton Corp. PLC | 239 | 57,556 |
| Fortive Corp. | 798 | 58,757 |
| GEA Group AG (Germany) | 995 | 41,412 |
| Gentex Corp. | 1,856 | 60,617 |
| Hitachi, Ltd. (Japan) | 900 | 65,044 |
| Ingersoll Rand, Inc. | 753 | 58,237 |
| ITT, Inc. | 536 | 63,956 |
| Johnson Controls International PLC | 1,091 | 62,885 |
| Kone Oyj Class B (Finland) | 1,937 | 96,932 |
| Legrand SA (France) | 318 | 33,123 |
| LKQ Corp. | 1,310 | 62,605 |
| Lockheed Martin Corp. | 144 | 65,267 |
| Mitsubishi Heavy Industries, Ltd. (Japan) | 1,100 | 64,006 |
| Oshkosh Corp. | 582 | 63,095 |
| Otis Worldwide Corp. | 637 | 56,992 |
| Parker Hannifin Corp. | 103 | 47,452 |
| Prysmian SpA (Italy) | 2,426 | 110,605 |
| Republic Services, Inc. | 402 | 66,294 |
| Textron, Inc. | 719 | 57,822 |
| Vertiv Holdings Co. | 7,206 | 346,104 |
| Vinci SA (France) | 999 | 125,468 |
| | | 2,699,391 |
| Commercial and consumer services (3.5%) | | |
| Automatic Data Processing, Inc. | 3,613 | 841,721 |
| Booking Holdings, Inc. † | 232 | 822,955 |
| Cintas Corp. | 95 | 57,253 |
| Ecolab, Inc. | 337 | 66,844 |
| Expedia Group, Inc. † | 3,620 | 549,480 |
| Global Payments, Inc. | 487 | 61,849 |
| Mastercard, Inc. Class A | 729 | 310,926 |
| PayPal Holdings, Inc. † | 12,069 | 741,157 |
| WEX, Inc. † | 336 | 65,369 |
| | | 3,517,554 |
| Communication services (0.9%) | | |
| American Tower Corp. R | 288 | 62,173 |
| AT&T, Inc. | 21,492 | 360,636 |
| Comcast Corp. Class A | 1,333 | 58,452 |
| Crown Castle, Inc. R | 517 | 59,553 |
| Iridium Communications, Inc. | 1,993 | 82,032 |
| SBA Communications Corp. R | 255 | 64,691 |
| Spark NZ, Ltd. (New Zealand) | 3,872 | 12,683 |
| Telstra Group, Ltd. (Australia) | 26,361 | 71,029 |
| Verizon Communications, Inc. | 1,708 | 64,392 |
| Vodafone Group PLC (United Kingdom) | 121,467 | 105,515 |
| | | 941,156 |
| Communications equipment (0.1%) | | |
| arista Networks, Inc. † | 264 | 62,175 |
| Motorola Solutions, Inc. | 192 | 60,113 |
| | | 122,288 |
| Computers (6.1%) | | |
| Apple, Inc. | 23,289 | 4,483,831 |
| Cisco Systems, Inc. | 10,029 | 506,665 |
| CrowdStrike Holdings, Inc. Class A † | 234 | 59,745 |
| Dropbox, Inc. Class A † | 1,947 | 57,398 |
| |
| Putnam VT Global Asset Allocation Fund 7 |
| | |
| COMMON STOCKS (69.6%)* cont. | Shares | Value |
| | | |
| Computers cont. | | |
| Elastic NV † | 484 | $54,547 |
| Fortinet, Inc. † | 1,020 | 59,701 |
| MongoDB, Inc. † | 158 | 64,598 |
| MSCI, Inc. | 110 | 62,222 |
| NetApp, Inc. | 637 | 56,158 |
| Pure Storage, Inc. Class A † | 1,759 | 62,726 |
| RingCentral, Inc. Class A † | 1,939 | 65,829 |
| Smartsheet, Inc. Class A † | 1,731 | 82,776 |
| Snowflake, Inc. Class A † | 351 | 69,849 |
| Synopsys, Inc. † | 388 | 199,785 |
| Teradata Corp. † | 1,324 | 57,607 |
| Zoom Video Communications, Inc. Class A † | 832 | 59,829 |
| Zscaler, Inc. † | 277 | 61,372 |
| | | 6,064,638 |
| Conglomerates (1.4%) | | |
| 3M Co. | 7,830 | 855,976 |
| AMETEK, Inc. | 334 | 55,073 |
| General Electric Co. | 492 | 62,794 |
| Marubeni Corp. (Japan) | 6,600 | 103,851 |
| Mitsui & Co., Ltd. (Japan) | 3,400 | 126,681 |
| Siemens AG (Germany) | 852 | 159,810 |
| | | 1,364,185 |
| Consumer (0.2%) | | |
| Kimberly-Clark Corp. | 459 | 55,773 |
| LVMH Moet Hennessy Louis Vuitton SA (France) | 88 | 71,379 |
| Pandora A/S (Denmark) | 744 | 102,785 |
| | | 229,937 |
| Consumer staples (4.6%) | | |
| Auto Trader Group PLC (United Kingdom) | 7,434 | 68,261 |
| Boston Beer Co., Inc. (The) Class A † | 169 | 58,405 |
| Carlsberg A/S Class B (Denmark) | 157 | 19,678 |
| Chipotle Mexican Grill, Inc. † | 26 | 59,461 |
| CK Hutchison Holdings, Ltd. (Hong Kong) | 9,500 | 51,132 |
| Coca-Cola Co. (The) | 14,730 | 868,039 |
| Coca-Cola HBC AG (Italy) | 2,227 | 65,371 |
| Colgate-Palmolive Co. | 781 | 62,254 |
| Copart, Inc. † | 1,180 | 57,820 |
| Costco Wholesale Corp. | 101 | 66,668 |
| Coupang, Inc. † | 3,656 | 59,191 |
| DoorDash, Inc. Class A † | 681 | 67,344 |
| Etsy, Inc. † | 644 | 52,196 |
| Henkel AG & Co. KGaA Vorzug | | |
| (Preference) (Germany) | 719 | 57,831 |
| Imperial Brands PLC (United Kingdom) | 4,624 | 106,259 |
| Ingredion, Inc. | 550 | 59,692 |
| Jeronimo Martins SGPS SA (Portugal) | 2,116 | 53,802 |
| Kenvue, Inc. | 2,800 | 60,284 |
| Keurig Dr Pepper, Inc. | 1,778 | 59,243 |
| Koninklijke Ahold Delhaize NV (Netherlands) | 3,871 | 111,146 |
| L’Oreal SA (France) | 241 | 119,827 |
| McDonald’s Corp. | 579 | 171,679 |
| Molson Coors Beverage Co. Class B | 920 | 56,313 |
| Mondelez International, Inc. Class A | 823 | 59,610 |
| Monster Beverage Corp. † | 1,095 | 63,083 |
| Nestle SA (Switzerland) | 855 | 98,955 |
| Nissin Food Products Co., Ltd. (Japan) | 3,000 | 104,609 |
| PepsiCo, Inc. | 520 | 88,317 |
| Philip Morris International, Inc. | 1,116 | 104,993 |
| Procter & Gamble Co. (The) | 2,595 | 380,271 |
| Recruit Holdings Co., Ltd. (Japan) | 3,600 | 153,696 |
| | |
| COMMON STOCKS (69.6%)* cont. | Shares | Value |
| | | |
| Consumer staples cont. | | |
| Starbucks Corp. | 597 | $57,318 |
| Sysco Corp. | 824 | 60,259 |
| Toyota Tsusho Corp. (Japan) | 900 | 52,727 |
| Uber Technologies, Inc. † | 11,944 | 735,392 |
| Unilever PLC (United Kingdom) | 3,569 | 172,682 |
| WH Group, Ltd. (Hong Kong) | 45,500 | 29,348 |
| | | 4,573,156 |
| Electronics (3.9%) | | |
| Broadcom, Inc. | 276 | 308,085 |
| Hoya Corp. (Japan) | 1,100 | 136,806 |
| Keysight Technologies, Inc. † | 403 | 64,113 |
| NVIDIA Corp. | 4,366 | 2,162,131 |
| Qorvo, Inc. † | 541 | 60,922 |
| Qualcomm, Inc. | 6,754 | 976,831 |
| Shimadzu Corp. (Japan) | 2,200 | 61,305 |
| Vontier Corp. | 1,784 | 61,637 |
| Woodward, Inc. | 429 | 58,400 |
| | | 3,890,230 |
| Energy (2.8%) | | |
| BP PLC (United Kingdom) | 26,821 | 158,499 |
| Cabot Oil & Gas Corp. | 2,324 | 59,308 |
| Cheniere Energy, Inc. | 2,155 | 367,880 |
| Chevron Corp. | 451 | 67,271 |
| ConocoPhillips | 545 | 63,258 |
| Equinor ASA (Norway) | 3,728 | 118,102 |
| Exxon Mobil Corp. | 7,718 | 771,646 |
| INPEX Corp. (Japan) | 1,700 | 22,913 |
| Marathon Oil Corp. | 23,856 | 576,361 |
| Marathon Petroleum Corp. | 2,457 | 364,521 |
| Schlumberger, Ltd. | 1,145 | 59,586 |
| Shell PLC (United Kingdom) | 1,117 | 36,290 |
| Targa Resources Corp. | 726 | 63,068 |
| Valero Energy Corp. | 495 | 64,350 |
| | | 2,793,053 |
| Financials (10.0%) | | |
| 3i Group PLC (United Kingdom) | 3,985 | 122,667 |
| Affiliated Managers Group, Inc. | 415 | 62,839 |
| AIB Group PLC (Ireland) | 9,642 | 41,258 |
| Allianz SE (Germany) | 253 | 67,576 |
| Ally Financial, Inc. | 1,949 | 68,059 |
| American Express Co. | 517 | 96,855 |
| American International Group, Inc. | 7,945 | 538,274 |
| Ameriprise Financial, Inc. | 773 | 293,609 |
| Apartment Income REIT Corp. R | 1,737 | 60,326 |
| AvalonBay Communities, Inc. R | 311 | 58,225 |
| AXA SA (France) | 383 | 12,502 |
| Axis Capital Holdings, Ltd. | 1,240 | 68,659 |
| Banco Bilbao Vizcaya Argentaria SA (Spain) | 13,857 | 126,256 |
| Banco Santander SA (Spain) | 23,611 | 98,563 |
| Bank Hapoalim MB (Israel) | 10,004 | 89,639 |
| Bank of America Corp. | 5,667 | 190,808 |
| Bank of New York Mellon Corp. (The) | 8,006 | 416,712 |
| Berkshire Hathaway, Inc. Class B † | 468 | 166,917 |
| Brixmor Property Group, Inc. R | 2,618 | 60,921 |
| Capital One Financial Corp. | 568 | 74,476 |
| Chubb, Ltd. | 243 | 54,918 |
| Citigroup, Inc. | 14,556 | 748,761 |
| Corebridge Financial, Inc. | 3,040 | 65,846 |
| DBS Group Holdings, Ltd. (Singapore) | 4,500 | 113,691 |
| Discover Financial Services | 5,186 | 582,906 |
| East West Bancorp, Inc. | 874 | 62,884 |
| |
| 8 Putnam VT Global Asset Allocation Fund |
| | |
| COMMON STOCKS (69.6%)* cont. | Shares | Value |
| | | |
| Financials cont. | | |
| EPR Properties R | 1,269 | $61,483 |
| Equitable Holdings, Inc. | 7,740 | 257,742 |
| Equity Residential R | 2,586 | 158,160 |
| Erste Group Bank AG (Czech Republic) | 1,780 | 72,220 |
| Essex Property Trust, Inc. R | 249 | 61,737 |
| Eurazeo SE (France) | 188 | 14,948 |
| Everest Re Group, Ltd. | 148 | 52,330 |
| First Industrial Realty Trust, Inc. R | 1,311 | 69,050 |
| Globe Life, Inc. | 512 | 62,321 |
| Goldman Sachs Group, Inc. (The) | 399 | 153,922 |
| Goodman Group (Australia) R | 7,643 | 131,234 |
| Hong Kong Exchanges and Clearing, Ltd. | | |
| (Hong Kong) | 200 | 6,843 |
| HSBC Holdings PLC (United Kingdom) | 593 | 4,790 |
| Investor AB Class B (Sweden) | 5,624 | 130,533 |
| Japan Exchange Group, Inc. (Japan) | 4,300 | 90,724 |
| Jefferies Financial Group, Inc. | 1,578 | 63,767 |
| JPMorgan Chase & Co. | 6,049 | 1,028,935 |
| Julius Baer Group, Ltd. (Switzerland) | 1,944 | 109,234 |
| Klepierre SA (France) R | 1,636 | 44,734 |
| Loews Corp. | 824 | 57,342 |
| Marsh & McLennan Cos., Inc. | 275 | 52,104 |
| MetLife, Inc. | 6,466 | 427,597 |
| MGIC Investment Corp. | 5,790 | 111,689 |
| Mid-America Apartment Communities, Inc. R | 455 | 61,179 |
| Mizrahi Tefahot Bank, Ltd. (Israel) | 1,559 | 60,269 |
| Muenchener Rueckversicherungs-Gesellschaft | | |
| AG in Muenchen (Germany) | 320 | 132,511 |
| Nasdaq, Inc. | 1,054 | 61,280 |
| National Retail Properties, Inc. | 1,508 | 64,995 |
| Nordea Bank ABP (Finland) | 10,531 | 130,253 |
| NU Holdings, Ltd./Cayman Islands Class A | | |
| (Brazil) † | 7,794 | 64,924 |
| Old Republic International Corp. | 2,002 | 58,859 |
| Park Hotels & Resorts, Inc. | 3,779 | 57,819 |
| Regency Centers Corp. R | 863 | 57,821 |
| Reinsurance Group of America, Inc. | 1,116 | 180,546 |
| Rithm Capital Corp. R | 5,400 | 57,672 |
| SEI Investments Co. | 956 | 60,754 |
| Simon Property Group, Inc. R | 752 | 107,265 |
| SLM Corp. | 3,894 | 74,453 |
| State Street Corp. | 824 | 63,827 |
| Swiss Re AG (Switzerland) | 1,018 | 114,497 |
| Synchrony Financial | 1,675 | 63,968 |
| Tokio Marine Holdings, Inc. (Japan) | 2,600 | 64,910 |
| UDR, Inc. R | 1,616 | 61,877 |
| UniCredit SpA (Italy) | 4,544 | 123,268 |
| Unum Group | 1,329 | 60,097 |
| VICI Properties, Inc. R | 1,896 | 60,444 |
| Virtu Financial, Inc. Class A | 3,167 | 64,163 |
| Wells Fargo & Co. | 9,697 | 477,286 |
| Zurich Insurance Group AG (Switzerland) | 95 | 49,667 |
| | | 10,002,190 |
| Gaming and lottery (0.2%) | | |
| Aristocrat Leisure, Ltd. (Australia) | 4,101 | 113,705 |
| DraftKings, Inc. Class A † | 1,766 | 62,252 |
| La Francaise des Jeux SAEM (France) | 402 | 14,593 |
| | | 190,550 |
| Health care (9.0%) | | |
| 10x Genomics, Inc. Class A † | 1,198 | 67,040 |
| Abbott Laboratories | 7,573 | 833,560 |
| | |
| COMMON STOCKS (69.6%)* cont. | Shares | Value |
| | | |
| Health care cont. | | |
| AbbVie, Inc. | 2,368 | $366,969 |
| Alnylam Pharmaceuticals, Inc. † | 323 | 61,825 |
| Amgen, Inc. | 209 | 60,196 |
| AstraZeneca PLC (United Kingdom) | 218 | 29,361 |
| Bio-Rad Laboratories, Inc. Class A † | 92 | 29,706 |
| Boston Scientific Corp. † | 1,027 | 59,371 |
| Bristol-Myers Squibb Co. | 1,250 | 64,138 |
| Cardinal Health, Inc. | 4,451 | 448,661 |
| Cigna Group (The) | 754 | 225,785 |
| Cochlear, Ltd. (Australia) | 284 | 57,705 |
| CVS Health Corp. | 742 | 58,588 |
| Danaher Corp. | 276 | 63,850 |
| Elevance Health, Inc. | 533 | 251,341 |
| Eli Lilly and Co. | 2,189 | 1,276,012 |
| Exelixis, Inc. † | 6,126 | 146,963 |
| FUJIFILM Holdings Corp. (Japan) | 1,500 | 89,860 |
| GlaxoSmithKline PLC (United Kingdom) | 7,636 | 141,047 |
| HCA Healthcare, Inc. | 1,881 | 509,149 |
| Hologic, Inc. † | 820 | 58,589 |
| Humana, Inc. | 430 | 196,858 |
| Incyte Corp. † | 3,750 | 235,463 |
| Inspire Medical Systems, Inc. † | 328 | 66,725 |
| Ipsen SA (France) | 296 | 35,328 |
| Jazz Pharmaceuticals PLC † | 456 | 56,088 |
| Johnson & Johnson | 357 | 55,956 |
| M3, Inc. (Japan) | 3,200 | 52,698 |
| McKesson Corp. | 126 | 58,335 |
| Medpace Holdings, Inc. † | 214 | 65,597 |
| Medtronic PLC | 725 | 59,726 |
| Merck & Co., Inc. | 10,495 | 1,144,165 |
| Neurocrine Biosciences, Inc. † | 547 | 72,073 |
| Novartis AG (Switzerland) | 2,273 | 229,504 |
| Novo Nordisk A/S Class B (Denmark) | 3,055 | 315,993 |
| Pfizer, Inc. | 1,966 | 56,601 |
| Regeneron Pharmaceuticals, Inc. † | 75 | 65,872 |
| Roche Holding AG (Switzerland) | 767 | 222,301 |
| Shionogi & Co., Ltd. (Japan) | 900 | 43,331 |
| Sonic Healthcare, Ltd. (Australia) | 1,148 | 25,061 |
| Teladoc Health, Inc. † | 3,183 | 68,594 |
| Thermo Fisher Scientific, Inc. | 114 | 60,510 |
| UnitedHealth Group, Inc. | 108 | 56,859 |
| Vertex Pharmaceuticals, Inc. † | 1,988 | 808,897 |
| West Pharmaceutical Services, Inc. | 86 | 30,282 |
| | | 8,982,533 |
| Homebuilding (0.2%) | | |
| Lennar Corp. Class A | 467 | 69,602 |
| NVR, Inc. † | 10 | 70,005 |
| Taylor Wimpey PLC (United Kingdom) | 10,334 | 19,318 |
| Toll Brothers, Inc. | 595 | 61,160 |
| | | 220,085 |
| Lodging/Tourism (0.2%) | | |
| Hilton Worldwide Holdings, Inc. | 360 | 65,552 |
| Host Hotels & Resorts, Inc. R | 3,008 | 58,566 |
| Marriott International, Inc./MD Class A | 298 | 67,202 |
| MGM Resorts International † | 627 | 28,014 |
| | | 219,334 |
| Media (1.0%) | | |
| Informa PLC (United Kingdom) | 4,219 | 41,885 |
| Netflix, Inc. † | 1,897 | 923,611 |
| | | 965,496 |
| |
| Putnam VT Global Asset Allocation Fund 9 |
| | |
| COMMON STOCKS (69.6%)* cont. | Shares | Value |
| | | |
| Publishing (0.1%) | | |
| TOPPAN Holdings, Inc. (Japan) | 2,000 | $55,646 |
| Wolters Kluwer NV (Netherlands) | 115 | 16,342 |
| | | 71,988 |
| Retail (4.5%) | | |
| Amazon.com, Inc. † | 12,657 | 1,923,105 |
| Associated British Foods PLC (United Kingdom) | 2,410 | 72,647 |
| AutoZone, Inc. † | 23 | 59,469 |
| Fast Retailing Co., Ltd. (Japan) | 200 | 49,588 |
| Home Depot, Inc. (The) | 178 | 61,686 |
| Industria de Diseno Textil SA (Spain) | 3,059 | 133,423 |
| O’Reilly Automotive, Inc. † | 709 | 673,607 |
| Ross Stores, Inc. | 1,602 | 221,701 |
| Target Corp. | 514 | 73,204 |
| TJX Cos., Inc. (The) | 1,610 | 151,034 |
| Walmart, Inc. | 6,750 | 1,064,138 |
| | | 4,483,602 |
| Semiconductor (0.7%) | | |
| Applied Materials, Inc. | 679 | 110,046 |
| ASML Holding NV (Netherlands) | 362 | 273,315 |
| Disco Corp. (Japan) | 500 | 123,039 |
| KLA Corp. | 174 | 101,146 |
| Lam Research Corp. | 80 | 62,661 |
| | | 670,207 |
| Software (5.7%) | | |
| Adobe, Inc. † | 1,784 | 1,064,334 |
| Atlassian Corp. Class A † | 313 | 74,450 |
| Autodesk, Inc. † | 260 | 63,305 |
| Cadence Design Systems, Inc. † | 2,966 | 807,849 |
| F5 Networks, Inc. † | 315 | 56,379 |
| HubSpot, Inc. † | 130 | 75,470 |
| Manhattan Associates, Inc. † | 274 | 58,998 |
| Microsoft Corp. | 8,242 | 3,099,322 |
| Nexon Co., Ltd. (Japan) | 3,900 | 70,829 |
| Pegasystems, Inc. | 1,031 | 50,375 |
| ROBLOX Corp. Class A † | 1,431 | 65,425 |
| SAP SE (Germany) | 48 | 7,384 |
| Square Enix Holdings Co., Ltd. (Japan) | 2,500 | 89,585 |
| Veeva Systems, Inc. Class A † | 327 | 62,954 |
| Workday, Inc. Class A † | 232 | 64,046 |
| | | 5,710,705 |
| Technology services (5.0%) | | |
| Alphabet, Inc. Class A † | 18,017 | 2,516,795 |
| DocuSign, Inc. † | 3,151 | 187,327 |
| eBay, Inc. | 1,354 | 59,061 |
| Fidelity National Information Services, Inc. | 924 | 55,505 |
| Fiserv, Inc. † | 417 | 55,394 |
| GoDaddy, Inc. Class A † | 1,341 | 142,361 |
| Leidos Holdings, Inc. | 2,224 | 240,726 |
| Meta Platforms, Inc. Class A † | 3,730 | 1,320,271 |
| Prosus NV (China) | 2,317 | 69,086 |
| Roku, Inc. † | 644 | 59,029 |
| Salesforce, Inc. † | 226 | 59,470 |
| Scout24 SE (Germany) | 387 | 27,381 |
| SCSK Corp. (Japan) | 1,800 | 35,637 |
| Spotify Technology SA (Sweden) † | 279 | 52,427 |
| VeriSign, Inc. † | 269 | 55,403 |
| Western Union Co. (The) | 4,821 | 57,466 |
| | | 4,993,339 |
| Textiles (0.1%) | | |
| Hermes International (France) | 66 | 140,070 |
| | | 140,070 |
| | |
| COMMON STOCKS (69.6%)* cont. | Shares | Value |
| | | |
| Toys (0.1%) | | |
| Nintendo Co., Ltd. (Japan) | 2,700 | $141,092 |
| | | 141,092 |
| Transportation (1.0%) | | |
| CSX Corp. | 1,601 | 55,507 |
| Delta Air Lines, Inc. | 1,435 | 57,730 |
| Deutsche Lufthansa AG (Germany) † | 1,284 | 11,412 |
| Deutsche Post AG (Germany) | 1,439 | 71,282 |
| FedEx Corp. | 224 | 56,665 |
| Kirby Corp. † | 800 | 62,784 |
| Kuehne + Nagel International AG (Switzerland) | 70 | 24,130 |
| Norfolk Southern Corp. | 273 | 64,532 |
| Qantas Airways, Ltd. (voting rights) (Australia) † | 25,474 | 92,871 |
| SITC International Holdings Co., Ltd. | | |
| (Hong Kong) | 3,000 | 5,172 |
| Union Pacific Corp. | 1,681 | 412,887 |
| Westinghouse Air Brake Technologies Corp. | 471 | 59,770 |
| | | 974,742 |
| Utilities and power (2.0%) | | |
| American Electric Power Co., Inc. | 662 | 53,768 |
| Centrica PLC (United Kingdom) | 43,445 | 77,732 |
| Constellation Energy Corp. | 516 | 60,315 |
| Dominion Energy, Inc. | 1,210 | 56,870 |
| DTE Energy Co. | 521 | 57,445 |
| Duke Energy Corp. | 622 | 60,359 |
| E.ON SE (Germany) | 8,113 | 108,837 |
| Edison International | 4,149 | 296,612 |
| Enel SpA (Italy) | 11,893 | 88,522 |
| Eni SpA (Italy) | 1,592 | 27,022 |
| Entergy Corp. | 577 | 58,387 |
| Eversource Energy | 970 | 59,868 |
| Exelon Corp. | 1,490 | 53,491 |
| Iberdrola SA (Spain) | 461 | 6,029 |
| NextEra Energy, Inc. | 947 | 57,521 |
| PG&E Corp. † | 3,300 | 59,499 |
| Pinnacle West Capital Corp. | 366 | 26,293 |
| PPL Corp. | 1,015 | 27,507 |
| Public Service Enterprise Group, Inc. | 908 | 55,524 |
| RWE AG (Germany) | 1,410 | 64,106 |
| Southern Co. (The) | 790 | 55,395 |
| Texas Competitive Electric Holdings Co., LLC/ | | |
| TCEH Finance, Inc. (Rights) † | 1,923 | 2,212 |
| Tokyo Gas Co., Ltd. (Japan) | 4,100 | 93,990 |
| Vistra Corp. | 10,501 | 404,499 |
| Xcel Energy, Inc. | 934 | 57,824 |
| | | 1,969,627 |
| | | |
| Total common stocks (cost $44,767,444) | | $69,774,524 |
| | |
| | Principal | |
| CORPORATE BONDS AND NOTES (12.6%)* | amount | Value |
| | | |
| Basic materials (0.8%) | | |
| ArcelorMittal SA sr. unsec. unsub. notes 7.00%, | | |
| 10/15/39 (France) | $20,000 | $21,524 |
| ATI, Inc. sr. unsec. notes 7.25%, 8/15/30 | 10,000 | 10,404 |
| ATI, Inc. sr. unsec. notes 4.875%, 10/1/29 | 5,000 | 4,660 |
| ATI, Inc. sr. unsec. sub. notes 5.875%, 12/1/27 | 15,000 | 14,782 |
| Avient Corp. 144A sr. unsec. unsub. notes | | |
| 7.125%, 8/1/30 | 10,000 | 10,403 |
| Beacon Roofing Supply, Inc. 144A company | | |
| guaranty sr. notes 6.50%, 8/1/30 | 5,000 | 5,112 |
| Beacon Roofing Supply, Inc. 144A company | | |
| guaranty sr. notes 4.50%, 11/15/26 | 5,000 | 4,848 |
| |
| 10 Putnam VT Global Asset Allocation Fund |
| | |
| | Principal | |
| CORPORATE BONDS AND NOTES (12.6%)* cont. | amount | Value |
| | | |
| Basic materials cont. | | |
| Beacon Roofing Supply, Inc. 144A sr. unsec. | | |
| unsub. notes 4.125%, 5/15/29 | $10,000 | $9,117 |
| Big River Steel, LLC/BRS Finance Corp. 144A sr. | | |
| notes 6.625%, 1/31/29 | 13,000 | 13,255 |
| Boise Cascade Co. 144A company guaranty sr. | | |
| unsec. notes 4.875%, 7/1/30 | 15,000 | 14,084 |
| Builders FirstSource, Inc. 144A company | | |
| guaranty sr. unsec. bonds 6.375%, 6/15/32 | 5,000 | 5,106 |
| Builders FirstSource, Inc. 144A company | | |
| guaranty sr. unsec. bonds 4.25%, 2/1/32 | 5,000 | 4,510 |
| Celanese US Holdings, LLC company guaranty | | |
| sr. unsec. bonds 6.379%, 7/15/32 (Germany) | 15,000 | 15,856 |
| Celanese US Holdings, LLC company guaranty | | |
| sr. unsec. notes 6.33%, 7/15/29 (Germany) | 25,000 | 26,207 |
| Celanese US Holdings, LLC company guaranty | | |
| sr. unsec. notes 6.165%, 7/15/27 (Germany) | 53,000 | 54,344 |
| Celanese US Holdings, LLC company guaranty | | |
| sr. unsec. notes 1.40%, 8/5/26 (Germany) | 15,000 | 13,669 |
| CF Industries, Inc. company guaranty sr. unsec. | | |
| bonds 4.95%, 6/1/43 | 50,000 | 45,701 |
| Commercial Metals Co. sr. unsec. notes | | |
| 4.375%, 3/15/32 | 5,000 | 4,487 |
| Commercial Metals Co. sr. unsec. notes | | |
| 4.125%, 1/15/30 | 5,000 | 4,581 |
| CP Atlas Buyer, Inc. 144A sr. unsec. notes | | |
| 7.00%, 12/1/28 | 5,000 | 4,353 |
| FMC Corp. sr. unsec. unsub. notes 5.65%, 5/18/33 | 20,000 | 19,926 |
| FMG Resources August 2006 Pty, Ltd. 144A sr. | | |
| unsec. notes 6.125%, 4/15/32 (Australia) | 10,000 | 10,072 |
| Glencore Funding, LLC 144A company guaranty | | |
| sr. unsec. notes 2.50%, 9/1/30 | 34,000 | 29,171 |
| Graphic Packaging International, LLC | | |
| 144A company guaranty sr. unsec. notes | | |
| 3.75%, 2/1/30 | 5,000 | 4,501 |
| Graphic Packaging International, LLC | | |
| 144A company guaranty sr. unsec. notes | | |
| 3.50%, 3/1/29 | 5,000 | 4,502 |
| HudBay Minerals, Inc. 144A company guaranty | | |
| sr. unsec. notes 6.125%, 4/1/29 (Canada) | 15,000 | 14,707 |
| Huntsman International, LLC sr. unsec. bonds | | |
| 2.95%, 6/15/31 | 15,000 | 12,704 |
| Ingevity Corp. 144A company guaranty sr. unsec. | | |
| notes 3.875%, 11/1/28 | 10,000 | 8,938 |
| Intelligent Packaging Holdco Issuer LP 144A sr. | | |
| unsec. notes 9.00%, 1/15/26 (Canada) ‡‡ | 5,000 | 4,200 |
| Intelligent Packaging, Ltd., Finco, Inc./Intelligent | | |
| Packaging, Ltd. Co-Issuer, LLC 144A sr. notes | | |
| 6.00%, 9/15/28 (Canada) | 10,000 | 9,316 |
| International Flavors & Fragrances, Inc. sr. unsec. | | |
| notes 4.45%, 9/26/28 | 20,000 | 19,507 |
| International Flavors & Fragrances, Inc. | | |
| 144A company guaranty sr. unsec. bonds | | |
| 3.468%, 12/1/50 | 5,000 | 3,412 |
| International Flavors & Fragrances, Inc. 144A sr. | | |
| unsec. notes 2.30%, 11/1/30 | 10,000 | 8,269 |
| International Flavors & Fragrances, Inc. 144A sr. | | |
| unsec. notes 1.832%, 10/15/27 | 5,000 | 4,381 |
| Louisiana-Pacific Corp. 144A sr. unsec. notes | | |
| 3.625%, 3/15/29 | 10,000 | 8,955 |
| LSF11 A5 HoldCo, LLC 144A sr. unsec. notes | | |
| 6.625%, 10/15/29 | 15,000 | 12,685 |
| Mauser Packaging Solutions Holding Co. 144A | | |
| company guaranty notes 9.25%, 4/15/27 | 10,000 | 9,816 |
| | |
| | Principal | |
| CORPORATE BONDS AND NOTES (12.6%)* cont. | amount | Value |
| | | |
| Basic materials cont. | | |
| Mauser Packaging Solutions Holding Co. 144A sr. | | |
| notes 7.875%, 8/15/26 | $15,000 | $15,265 |
| Mercer International, Inc. sr. unsec. notes | | |
| 5.125%, 2/1/29 (Canada) | 10,000 | 8,589 |
| Mercer International, Inc. 144A sr. unsec. notes | | |
| 12.875%, 10/1/28 (Canada) | 5,000 | 5,465 |
| Novelis Corp. 144A company guaranty sr. unsec. | | |
| notes 4.75%, 1/30/30 | 15,000 | 14,107 |
| Nutrien, Ltd. sr. unsec. bonds 5.25%, | | |
| 1/15/45 (Canada) | 20,000 | 19,426 |
| Nutrien, Ltd. sr. unsec. bonds 4.125%, | | |
| 3/15/35 (Canada) | 25,000 | 23,108 |
| Pactiv Evergreen Group Issuer, LLC/Pactiv | | |
| Evergreen Group Issuer, Inc. 144A sr. notes | | |
| 4.375%, 10/15/28 | 5,000 | 4,674 |
| PMHC II, Inc. 144A sr. unsec. notes 9.00%, 2/15/30 | 10,000 | 7,929 |
| SCIH Salt Holdings, Inc. 144A sr. notes | | |
| 4.875%, 5/1/28 | 20,000 | 18,706 |
| SCIH Salt Holdings, Inc. 144A sr. unsec. notes | | |
| 6.625%, 5/1/29 | 15,000 | 13,998 |
| Sherwin-Williams Co. (The) sr. unsec. unsub. | | |
| bonds 3.45%, 6/1/27 | 35,000 | 33,784 |
| Smyrna Ready Mix Concrete, LLC 144A sr. notes | | |
| 8.875%, 11/15/31 | 10,000 | 10,513 |
| TMS International Holding Corp. 144A sr. unsec. | | |
| notes 6.25%, 4/15/29 | 15,000 | 12,375 |
| Trinseo Materials Operating SCA/Trinseo | | |
| Materials Finance, Inc. 144A company guaranty | | |
| sr. unsec. notes 5.125%, 4/1/29 (Luxembourg) | 5,000 | 2,037 |
| Tronox, Inc. 144A company guaranty sr. unsec. | | |
| notes 4.625%, 3/15/29 | 15,000 | 13,287 |
| Westlake Corp. sr. unsec. bonds 3.125%, 8/15/51 | 40,000 | 26,441 |
| Westlake Corp. sr. unsec. bonds 2.875%, 8/15/41 | 20,000 | 14,022 |
| Westlake Corp. sr. unsec. unsub. notes | | |
| 3.60%, 8/15/26 | 30,000 | 28,977 |
| WestRock MWV, LLC company guaranty sr. | | |
| unsec. unsub. notes 8.20%, 1/15/30 | 30,000 | 34,553 |
| WestRock MWV, LLC company guaranty sr. | | |
| unsec. unsub. notes 7.95%, 2/15/31 | 10,000 | 11,653 |
| WR Grace Holdings, LLC 144A company guaranty | | |
| sr. notes 4.875%, 6/15/27 | 5,000 | 4,811 |
| WR Grace Holdings, LLC 144A sr. notes | | |
| 7.375%, 3/1/31 | 15,000 | 14,963 |
| WR Grace Holdings, LLC 144A sr. unsec. notes | | |
| 5.625%, 8/15/29 | 15,000 | 13,199 |
| | | 823,947 |
| Capital goods (0.9%) | | |
| Amsted Industries, Inc. 144A company guaranty | | |
| sr. unsec. sub. notes 5.625%, 7/1/27 | 10,000 | 9,964 |
| Amsted Industries, Inc. 144A sr. unsec. bonds | | |
| 4.625%, 5/15/30 | 5,000 | 4,576 |
| Berry Global Escrow Corp. 144A sr. notes | | |
| 4.875%, 7/15/26 | 2,000 | 1,965 |
| Berry Global, Inc. 144A company guaranty sr. | | |
| notes 1.65%, 1/15/27 | 25,000 | 22,508 |
| Berry Global, Inc. 144A company guaranty sr. | | |
| notes 1.57%, 1/15/26 | 44,000 | 40,876 |
| Boeing Co. (The) sr. unsec. notes 2.70%, 2/1/27 | 13,000 | 12,258 |
| Boeing Co. (The) sr. unsec. unsub. notes | | |
| 6.125%, 2/15/33 | 90,000 | 97,040 |
| Bombardier, Inc. 144A sr. unsec. notes 7.125%, | | |
| 6/15/26 (Canada) | 12,000 | 11,944 |
| |
| Putnam VT Global Asset Allocation Fund 11 |
| | |
| | Principal | |
| CORPORATE BONDS AND NOTES (12.6%)* cont. | amount | Value |
| | | |
| Capital goods cont. | | |
| Bombardier, Inc. 144A sr. unsec. unsub. notes | | |
| 8.75%, 11/15/30 (Canada) | $10,000 | $10,647 |
| Chart Industries, Inc. 144A company guaranty sr. | | |
| notes 7.50%, 1/1/30 | 15,000 | 15,679 |
| Chart Industries, Inc. 144A company guaranty sr. | | |
| unsec. notes 9.50%, 1/1/31 | 10,000 | 10,862 |
| Clarios Global LP 144A company guaranty sr. | | |
| notes 6.75%, 5/15/25 | 9,000 | 9,079 |
| Clarios Global LP 144A sr. notes 6.75%, 5/15/28 | 5,000 | 5,101 |
| Clean Harbors, Inc. 144A company guaranty sr. | | |
| unsec. unsub. notes 6.375%, 2/1/31 | 5,000 | 5,080 |
| Covanta Holding Corp. 144A company guaranty | | |
| sr. unsec. notes 4.875%, 12/1/29 | 5,000 | 4,368 |
| Crown Cork & Seal Co., Inc. company guaranty sr. | | |
| unsec. bonds 7.375%, 12/15/26 | 10,000 | 10,500 |
| Emerald Debt Merger Sub, LLC 144A sr. notes | | |
| 6.625%, 12/15/30 | 15,000 | 15,300 |
| GFL Environmental, Inc. 144A company guaranty | | |
| sr. unsec. notes 4.75%, 6/15/29 (Canada) | 10,000 | 9,420 |
| GFL Environmental, Inc. 144A company guaranty | | |
| sr. unsec. notes 4.00%, 8/1/28 (Canada) | 5,000 | 4,622 |
| GFL Environmental, Inc. 144A sr. notes 6.75%, | | |
| 1/15/31 (Canada) | 5,000 | 5,151 |
| Great Lakes Dredge & Dock Corp. 144A company | | |
| guaranty sr. unsec. notes 5.25%, 6/1/29 | 25,000 | 21,255 |
| Honeywell International, Inc. sr. unsec. bonds | | |
| 3.812%, 11/21/47 | 55,000 | 47,191 |
| Howmet Aerospace, Inc. sr. unsec. unsub. bonds | | |
| 5.95%, 2/1/37 | 5,000 | 5,219 |
| Howmet Aerospace, Inc. sr. unsec. unsub. notes | | |
| 3.00%, 1/15/29 | 35,000 | 31,982 |
| Johnson Controls International PLC sr. unsec. | | |
| bonds 4.95%, 7/2/64 | 65,000 | 59,328 |
| Johnson Controls International PLC sr. unsec. | | |
| notes 3.90%, 2/14/26 | 6,000 | 5,862 |
| L3Harris Technologies, Inc. sr. unsec. notes | | |
| 3.85%, 12/15/26 | 24,000 | 23,523 |
| L3Harris Technologies, Inc. sr. unsec. sub. notes | | |
| 4.40%, 6/15/28 | 18,000 | 17,791 |
| L3Harris Technologies, Inc. sr. unsec. unsub. | | |
| notes 5.40%, 1/15/27 | 30,000 | 30,622 |
| Madison IAQ, LLC 144A sr. notes 4.125%, 6/30/28 | 10,000 | 9,091 |
| Madison IAQ, LLC 144A sr. unsec. notes | | |
| 5.875%, 6/30/29 | 15,000 | 13,216 |
| MajorDrive Holdings IV, LLC 144A sr. unsec. notes | | |
| 6.375%, 6/1/29 | 10,000 | 8,611 |
| Oshkosh Corp. sr. unsec. sub. notes | | |
| 4.60%, 5/15/28 | 9,000 | 8,868 |
| Otis Worldwide Corp. sr. unsec. notes | | |
| 2.565%, 2/15/30 | 15,000 | 13,338 |
| Owens-Brockway Glass Container, Inc. | | |
| 144A company guaranty sr. unsec. notes | | |
| 7.25%, 5/15/31 | 15,000 | 15,208 |
| Panther BF Aggregator 2 LP/Panther Finance | | |
| Co., Inc. 144A company guaranty sr. unsec. notes | | |
| 8.50%, 5/15/27 | 15,000 | 15,052 |
| Republic Services, Inc. sr. unsec. unsub. notes | | |
| 4.875%, 4/1/29 | 25,000 | 25,466 |
| Ritchie Bros Holdings, Inc. 144A company | | |
| guaranty sr. notes 6.75%, 3/15/28 | 5,000 | 5,150 |
| Ritchie Bros Holdings, Inc. 144A company | | |
| guaranty sr. unsec. unsub. notes 7.75%, 3/15/31 | 5,000 | 5,331 |
| | |
| | Principal | |
| CORPORATE BONDS AND NOTES (12.6%)* cont. | amount | Value |
| | | |
| Capital goods cont. | | |
| Roller Bearing Co. of America, Inc. 144A sr. notes | | |
| 4.375%, 10/15/29 | $15,000 | $13,881 |
| RTX Corp. sr. unsec. bonds 4.875%, 10/15/40 | 20,000 | 18,942 |
| RTX Corp. sr. unsec. notes 5.15%, 2/27/33 | 5,000 | 5,096 |
| RTX Corp. sr. unsec. unsub. notes | | |
| 4.125%, 11/16/28 | 5,000 | 4,885 |
| Spirit AeroSystems, Inc. 144A company guaranty | | |
| sr. notes 9.75%, 11/15/30 | 15,000 | 16,125 |
| Spirit AeroSystems, Inc. 144A sr. unsub. notes | | |
| 9.375%, 11/30/29 | 5,000 | 5,471 |
| Terex Corp. 144A company guaranty sr. unsec. | | |
| notes 5.00%, 5/15/29 | 10,000 | 9,425 |
| TransDigm, Inc. company guaranty sr. unsec. | | |
| sub. notes 5.50%, 11/15/27 | 10,000 | 9,797 |
| TransDigm, Inc. company guaranty sr. unsec. | | |
| sub. notes 4.875%, 5/1/29 | 10,000 | 9,347 |
| TransDigm, Inc. company guaranty sr. unsec. | | |
| sub. notes 4.625%, 1/15/29 | 10,000 | 9,389 |
| TransDigm, Inc. 144A company guaranty sr. | | |
| notes 6.25%, 3/15/26 | 20,000 | 19,965 |
| TransDigm, Inc. 144A sr. notes 6.875%, 12/15/30 | 10,000 | 10,300 |
| TransDigm, Inc. 144A sr. notes 6.75%, 8/15/28 | 10,000 | 10,250 |
| Waste Connections, Inc. sr. unsec. bonds | | |
| 3.20%, 6/1/32 | 2,000 | 1,797 |
| Waste Connections, Inc. sr. unsec. sub. bonds | | |
| 3.50%, 5/1/29 | 30,000 | 28,689 |
| Waste Management, Inc. company guaranty sr. | | |
| unsec. notes 4.875%, 2/15/29 | 33,000 | 33,772 |
| Waste Pro USA, Inc. 144A sr. unsec. notes | | |
| 5.50%, 2/15/26 | 5,000 | 4,813 |
| | | 880,988 |
| Communication services (1.3%) | | |
| American Tower Corp. sr. unsec. bonds | | |
| 2.70%, 4/15/31 R | 5,000 | 4,294 |
| American Tower Corp. sr. unsec. sub. notes | | |
| 2.75%, 1/15/27 R | 125,000 | 117,167 |
| AT&T, Inc. company guaranty sr. unsec. unsub. | | |
| notes 2.30%, 6/1/27 | 7,000 | 6,497 |
| AT&T, Inc. sr. unsec. bonds 3.55%, 9/15/55 | 41,000 | 29,478 |
| AT&T, Inc. sr. unsec. notes 4.10%, 2/15/28 | 15,000 | 14,659 |
| AT&T, Inc. sr. unsec. unsub. bonds 2.55%, 12/1/33 | 60,000 | 48,901 |
| AT&T, Inc. sr. unsec. unsub. notes 4.75%, 5/15/46 | 77,000 | 69,597 |
| AT&T, Inc. sr. unsec. unsub. notes 4.25%, 3/1/27 | 7,000 | 6,922 |
| CCO Holdings, LLC/CCO Holdings Capital Corp. | | |
| sr. unsec. bonds 4.50%, 5/1/32 | 10,000 | 8,565 |
| CCO Holdings, LLC/CCO Holdings Capital Corp. | | |
| 144A sr. unsec. bonds 5.375%, 6/1/29 | 8,000 | 7,541 |
| CCO Holdings, LLC/CCO Holdings Capital Corp. | | |
| 144A sr. unsec. bonds 4.75%, 3/1/30 | 60,000 | 54,826 |
| CCO Holdings, LLC/CCO Holdings Capital Corp. | | |
| 144A sr. unsec. notes 4.25%, 2/1/31 | 10,000 | 8,739 |
| CCO Holdings, LLC/CCO Holdings Capital Corp. | | |
| 144A sr. unsec. unsub. notes 4.75%, 2/1/32 | 20,000 | 17,639 |
| Charter Communications Operating, | | |
| LLC/Charter Communications Operating | | |
| Capital Corp. company guaranty sr. notes | | |
| 2.25%, 1/15/29 | 27,000 | 23,427 |
| Charter Communications Operating, LLC/ | | |
| Charter Communications Operating Capital | | |
| Corp. company guaranty sr. sub. bonds | | |
| 4.80%, 3/1/50 | 10,000 | 7,741 |
| |
| 12 Putnam VT Global Asset Allocation Fund |
| | |
| | Principal | |
| CORPORATE BONDS AND NOTES (12.6%)* cont. | amount | Value |
| | | |
| Communication services cont. | | |
| Charter Communications Operating, LLC/ | | |
| Charter Communications Operating Capital | | |
| Corp. company guaranty sr. sub. notes | | |
| 4.908%, 7/23/25 | $44,000 | $43,582 |
| Charter Communications Operating, LLC/ | | |
| Charter Communications Operating Capital sr. | | |
| bonds 3.70%, 4/1/51 | 110,000 | 71,547 |
| Comcast Corp. company guaranty sr. unsec. | | |
| notes 3.45%, 2/1/50 | 19,000 | 14,584 |
| Comcast Corp. company guaranty sr. unsec. | | |
| unsub. bonds 3.999%, 11/1/49 | 7,000 | 5,842 |
| Cox Communications, Inc. 144A sr. unsec. bonds | | |
| 3.50%, 8/15/27 | 35,000 | 33,305 |
| Crown Castle, Inc. sr. unsec. bonds | | |
| 3.80%, 2/15/28 R | 25,000 | 23,748 |
| Crown Castle, Inc. sr. unsec. bonds | | |
| 3.65%, 9/1/27 R | 34,000 | 32,320 |
| Crown Castle, Inc. sr. unsec. sub. notes | | |
| 1.05%, 7/15/26 R | 23,000 | 20,750 |
| Crown Castle, Inc. sr. unsec. unsub. bonds | | |
| 3.70%, 6/15/26 R | 12,000 | 11,580 |
| Deutsche Telekom International Finance | | |
| BV company guaranty sr. unsec. unsub. bonds | | |
| 8.75%, 6/15/30 (Netherlands) | 73,000 | 87,918 |
| DIRECTV Holdings, LLC/DIRECTV Financing Co., | | |
| Inc. 144A sr. notes 5.875%, 8/15/27 | 10,000 | 9,396 |
| DISH DBS Corp. company guaranty sr. unsec. | | |
| unsub. notes 5.875%, 11/15/24 | 10,000 | 9,378 |
| DISH DBS Corp. company guaranty sr. unsec. | | |
| unsub. notes 5.125%, 6/1/29 | 10,000 | 5,154 |
| DISH DBS Corp. 144A company guaranty sr. | | |
| notes 5.75%, 12/1/28 | 5,000 | 3,988 |
| DISH DBS Corp. 144A company guaranty sr. | | |
| notes 5.25%, 12/1/26 | 5,000 | 4,284 |
| Embarq Corp. sr. unsec. unsub. bonds | | |
| 7.995%, 6/1/36 | 20,000 | 12,500 |
| Frontier Communications Corp. 144A company | | |
| guaranty sr. notes 5.875%, 10/15/27 | 15,000 | 14,492 |
| Frontier Communications Holdings, LLC 144A | | |
| company guaranty sr. notes 8.75%, 5/15/30 | 10,000 | 10,287 |
| Level 3 Financing, Inc. 144A company guaranty | | |
| sr. notes 10.50%, 5/15/30 | 5,000 | 4,848 |
| Level 3 Financing, Inc. 144A company guaranty | | |
| sr. unsec. notes 4.25%, 7/1/28 | 15,000 | 7,425 |
| Sprint Capital Corp. company guaranty sr. | | |
| unsec. unsub. notes 6.875%, 11/15/28 | 21,000 | 22,754 |
| T-Mobile USA, Inc. company guaranty sr. bonds | | |
| 2.25%, 11/15/31 | 60,000 | 49,956 |
| T-Mobile USA, Inc. company guaranty sr. notes | | |
| 3.875%, 4/15/30 | 7,000 | 6,639 |
| T-Mobile USA, Inc. company guaranty sr. notes | | |
| 3.75%, 4/15/27 | 78,000 | 75,654 |
| T-Mobile USA, Inc. company guaranty sr. unsec. | | |
| bonds 5.75%, 1/15/54 | 15,000 | 15,871 |
| T-Mobile USA, Inc. company guaranty sr. unsec. | | |
| bonds 5.05%, 7/15/33 | 15,000 | 15,090 |
| T-Mobile USA, Inc. company guaranty sr. unsec. | | |
| bonds 2.875%, 2/15/31 | 10,000 | 8,811 |
| T-Mobile USA, Inc. company guaranty sr. unsec. | | |
| notes 3.375%, 4/15/29 | 15,000 | 13,937 |
| TCI Communications, Inc. sr. unsec. unsub. | | |
| notes 7.125%, 2/15/28 | 65,000 | 71,056 |
| | |
| | Principal | |
| CORPORATE BONDS AND NOTES (12.6%)* cont. | amount | Value |
| | | |
| Communication services cont. | | |
| Verizon Communications, Inc. sr. unsec. bonds | | |
| 3.70%, 3/22/61 | $47,000 | $35,906 |
| Verizon Communications, Inc. sr. unsec. unsub. | | |
| notes 4.40%, 11/1/34 | 65,000 | 62,535 |
| Verizon Communications, Inc. sr. unsec. unsub. | | |
| notes 4.329%, 9/21/28 | 76,000 | 75,183 |
| Verizon Communications, Inc. sr. unsec. unsub. | | |
| notes 2.10%, 3/22/28 | 20,000 | 18,092 |
| Viasat, Inc. 144A sr. unsec. notes 7.50%, 5/30/31 | 10,000 | 7,813 |
| | | 1,332,218 |
| Consumer cyclicals (1.7%) | | |
| ADT Security Corp. 144A sr. notes 4.125%, 8/1/29 | 15,000 | 13,804 |
| Alimentation Couche-Tard, Inc. 144A | | |
| company guaranty sr. unsec. notes 3.55%, | | |
| 7/26/27 (Canada) | 25,000 | 23,969 |
| Alimentation Couche-Tard, Inc. 144A sr. unsec. | | |
| notes 2.95%, 1/25/30 (Canada) | 14,000 | 12,532 |
| American Builders & Contractors Supply Co., Inc. | | |
| 144A sr. notes 4.00%, 1/15/28 | 15,000 | 14,194 |
| American Builders & Contractors Supply Co., Inc. | | |
| 144A sr. unsec. notes 3.875%, 11/15/29 | 10,000 | 8,915 |
| Anywhere Real Estate Group, LLC/Anywhere | | |
| Co-Issuer Corp. 144A company guaranty notes | | |
| 7.00%, 4/15/30 | 12,000 | 11,066 |
| Asbury Automotive Group, Inc. 144A company | | |
| guaranty sr. unsec. notes 4.625%, 11/15/29 | 5,000 | 4,628 |
| Bath & Body Works, Inc. company guaranty sr. | | |
| unsec. bonds 6.75%, perpetual maturity | 5,000 | 5,032 |
| Bath & Body Works, Inc. company guaranty sr. | | |
| unsec. notes 7.50%, perpetual maturity | 15,000 | 15,586 |
| Bath & Body Works, Inc. 144A company guaranty | | |
| sr. unsec. unsub. bonds 6.625%, 10/1/30 | 10,000 | 10,221 |
| BCPE Ulysses Intermediate, Inc. 144A sr. unsec. | | |
| notes 7.75%, 4/1/27 ‡‡ | 5,000 | 4,660 |
| Block, Inc. sr. unsec. notes 3.50%, 6/1/31 | 40,000 | 35,518 |
| BMW US Capital, LLC 144A company guaranty sr. | | |
| unsec. notes 3.95%, 8/14/28 | 35,000 | 33,989 |
| Booking Holdings, Inc. sr. unsec. sub. notes | | |
| 4.625%, 4/13/30 | 25,000 | 25,187 |
| Boyd Gaming Corp. 144A sr. unsec. bonds | | |
| 4.75%, 6/15/31 | 20,000 | 18,356 |
| Caesars Entertainment, Inc. 144A sr. notes | | |
| 7.00%, 2/15/30 | 20,000 | 20,509 |
| Caesars Entertainment, Inc. 144A sr. unsec. | | |
| notes 4.625%, 10/15/29 | 20,000 | 18,040 |
| Caesars Resort Collection, LLC/CRC Finco, Inc. | | |
| 144A company guaranty sr. notes 5.75%, 7/1/25 | 5,000 | 4,999 |
| Camelot Return Merger Sub, Inc. 144A sr. notes | | |
| 8.75%, 8/1/28 | 15,000 | 15,225 |
| Carnival Corp. 144A company guaranty sr. notes | | |
| 7.00%, 8/15/29 | 5,000 | 5,221 |
| Carnival Corp. 144A company guaranty sr. unsec. | | |
| unsub. notes 10.50%, 6/1/30 | 5,000 | 5,469 |
| Carnival Corp. 144A sr. unsec. notes | | |
| 5.75%, 3/1/27 | 30,000 | 29,263 |
| Carnival Holdings Bermuda, Ltd. 144A company | | |
| guaranty sr. unsec. unsub. notes 10.375%, | | |
| 5/1/28 (Bermuda) | 5,000 | 5,442 |
| Carriage Services, Inc. 144A company guaranty | | |
| sr. unsec. notes 4.25%, 5/15/29 | 10,000 | 8,881 |
| CDI Escrow Issuer, Inc. 144A sr. unsec. notes | | |
| 5.75%, 4/1/30 | 10,000 | 9,725 |
| |
| Putnam VT Global Asset Allocation Fund 13 |
| | |
| | Principal | |
| CORPORATE BONDS AND NOTES (12.6%)* cont. | amount | Value |
| | | |
| Consumer cyclicals cont. | | |
| Cinemark USA, Inc. 144A company guaranty sr. | | |
| unsec. notes 5.25%, 7/15/28 | $10,000 | $9,174 |
| Clear Channel Outdoor Holdings, Inc. 144A | | |
| company guaranty sr. unsec. sub. notes | | |
| 7.75%, 4/15/28 | 10,000 | 8,622 |
| Crocs, Inc. 144A company guaranty sr. unsec. | | |
| notes 4.25%, 3/15/29 | 10,000 | 8,957 |
| D.R. Horton, Inc. company guaranty sr. unsec. | | |
| unsub. notes 1.30%, 10/15/26 | 60,000 | 54,701 |
| Everi Holdings, Inc. 144A company guaranty sr. | | |
| unsec. notes 5.00%, 7/15/29 | 20,000 | 18,155 |
| Full House Resorts, Inc. 144A company guaranty | | |
| sr. notes 8.25%, 2/15/28 | 20,000 | 18,800 |
| Garda World Security Corp. 144A sr. notes 7.75%, | | |
| 2/15/28 (Canada) | 5,000 | 5,156 |
| Garda World Security Corp. 144A sr. notes | | |
| 4.625%, 2/15/27 (Canada) | 5,000 | 4,821 |
| Gartner, Inc. 144A company guaranty sr. unsec. | | |
| bonds 3.75%, 10/1/30 | 15,000 | 13,260 |
| Global Payments, Inc. sr. unsec. notes | | |
| 2.15%, 1/15/27 | 6,000 | 5,524 |
| Goodyear Tire & Rubber Co. (The) company | | |
| guaranty sr. unsec. notes 5.625%, 4/30/33 | 5,000 | 4,482 |
| Gray Escrow II, Inc. 144A sr. unsec. bonds | | |
| 5.375%, 11/15/31 | 30,000 | 22,635 |
| GW B-CR Security Corp. 144A sr. unsec. notes | | |
| 9.50%, 11/1/27 (Canada) | 8,000 | 8,065 |
| Hilton Domestic Operating Co., Inc. company | | |
| guaranty sr. unsec. bonds 4.875%, 1/15/30 | 10,000 | 9,692 |
| Hyatt Hotels Corp. sr. unsec. notes | | |
| 5.75%, 1/30/27 | 22,000 | 22,482 |
| Hyatt Hotels Corp. sr. unsec. unsub. notes | | |
| 4.85%, 3/15/26 | 47,000 | 46,625 |
| iHeartCommunications, Inc. company guaranty | | |
| sr. unsec. notes 8.375%, 5/1/27 | 12,189 | 7,912 |
| Interpublic Group of Cos., Inc. (The) sr. unsec. | | |
| sub. bonds 4.65%, 10/1/28 | 47,000 | 46,523 |
| Interpublic Group of Cos., Inc. (The) sr. unsec. | | |
| unsub. notes 2.40%, 3/1/31 | 10,000 | 8,449 |
| JELD-WEN, Inc. 144A company guaranty sr. | | |
| unsec. notes 4.875%, 12/15/27 | 15,000 | 14,175 |
| Kontoor Brands, Inc. 144A company guaranty sr. | | |
| unsec. notes 4.125%, 11/15/29 | 15,000 | 13,425 |
| Las Vegas Sands Corp. sr. unsec. unsub. notes | | |
| 3.90%, 8/8/29 | 15,000 | 13,821 |
| LBM Acquisition, LLC 144A company guaranty sr. | | |
| unsec. notes 6.25%, 1/15/29 | 10,000 | 8,930 |
| Lennar Corp. company guaranty sr. unsec. | | |
| unsub. notes 4.75%, 11/29/27 | 38,000 | 37,913 |
| Levi Strauss & Co. 144A sr. unsec. sub. bonds | | |
| 3.50%, 3/1/31 | 25,000 | 21,646 |
| LGI Homes, Inc. 144A company guaranty sr. | | |
| unsec. notes 8.75%, 12/15/28 | 15,000 | 15,956 |
| Light & Wonder International, Inc. 144A company | | |
| guaranty sr. unsec. notes 7.25%, 11/15/29 | 15,000 | 15,359 |
| Live Nation Entertainment, Inc. 144A company | | |
| guaranty sr. unsec. sub. notes 5.625%, 3/15/26 | 10,000 | 9,909 |
| Live Nation Entertainment, Inc. 144A sr. notes | | |
| 6.50%, 5/15/27 | 5,000 | 5,088 |
| Masonite International Corp. 144A company | | |
| guaranty sr. unsec. notes 5.375%, 2/1/28 | 5,000 | 4,800 |
| Masonite International Corp. 144A company | | |
| guaranty sr. unsec. notes 3.50%, 2/15/30 | 10,000 | 8,668 |
| | |
| | Principal | |
| CORPORATE BONDS AND NOTES (12.6%)* cont. | amount | Value |
| | | |
| Consumer cyclicals cont. | | |
| Mattamy Group Corp. 144A sr. unsec. notes | | |
| 4.625%, 3/1/30 (Canada) | $10,000 | $9,268 |
| Mattel, Inc. 144A company guaranty sr. unsec. | | |
| notes 3.75%, 4/1/29 | 10,000 | 9,134 |
| Mattel, Inc. 144A company guaranty sr. unsec. | | |
| notes 3.375%, 4/1/26 | 5,000 | 4,755 |
| McGraw-Hill Education, Inc. 144A sr. notes | | |
| 5.75%, 8/1/28 | 10,000 | 9,643 |
| McGraw-Hill Education, Inc. 144A sr. unsec. | | |
| notes 8.00%, 8/1/29 | 15,000 | 13,950 |
| Michaels Cos., Inc. (The) 144A sr. unsec. notes | | |
| 7.875%, 5/1/29 | 5,000 | 3,148 |
| MIWD Holdco II, LLC/MIWD Finance Corp. | | |
| 144A company guaranty sr. unsec. notes | | |
| 5.50%, 2/1/30 | 5,000 | 4,425 |
| Moody’s Corp. sr. unsec. notes 2.00%, 8/19/31 | 50,000 | 41,490 |
| NCL Corp., Ltd. 144A company guaranty sr. notes | | |
| 8.125%, 1/15/29 | 10,000 | 10,450 |
| NCL Corp., Ltd. 144A sr. unsec. unsub. notes | | |
| 7.75%, 2/15/29 | 10,000 | 10,088 |
| Neptune Bidco US, Inc. 144A sr. notes | | |
| 9.29%, 4/15/29 | 20,000 | 18,650 |
| Netflix, Inc. sr. unsec. unsub. notes | | |
| 5.875%, 11/15/28 | 10,000 | 10,528 |
| Netflix, Inc. sr. unsec. unsub. notes | | |
| 4.375%, 11/15/26 | 15,000 | 14,929 |
| Netflix, Inc. 144A sr. unsec. bonds | | |
| 5.375%, 11/15/29 | 53,000 | 54,755 |
| News Corp. 144A company guaranty sr. unsec. | | |
| unsub. bonds 5.125%, 2/15/32 | 4,000 | 3,798 |
| News Corp. 144A sr. unsec. notes | | |
| 3.875%, 5/15/29 | 10,000 | 9,195 |
| Nexstar Media, Inc. 144A company guaranty sr. | | |
| unsec. notes 4.75%, 11/1/28 | 5,000 | 4,607 |
| Omnicom Group, Inc. company guaranty sr. | | |
| unsec. unsub. notes 3.60%, 4/15/26 | 65,000 | 63,345 |
| Outfront Media Capital, LLC/Outfront Media | | |
| Capital Corp. 144A company guaranty sr. notes | | |
| 7.375%, 2/15/31 | 10,000 | 10,501 |
| Outfront Media Capital, LLC/Outfront Media | | |
| Capital Corp. 144A company guaranty sr. unsec. | | |
| notes 5.00%, 8/15/27 | 10,000 | 9,666 |
| Paramount Global sr. unsec. unsub. notes | | |
| 2.90%, 1/15/27 | 12,000 | 11,105 |
| Penn Entertainment, Inc. 144A sr. unsec. notes | | |
| 5.625%, 1/15/27 | 10,000 | 9,695 |
| Prime Security Services Borrower, LLC/Prime | | |
| Finance, Inc. 144A company guaranty sr. notes | | |
| 3.375%, 8/31/27 | 5,000 | 4,636 |
| Prime Security Services Borrower, LLC/Prime | | |
| Finance, Inc. 144A notes 6.25%, 1/15/28 | 10,000 | 9,942 |
| PulteGroup, Inc. company guaranty sr. unsec. | | |
| unsub. notes 7.875%, 6/15/32 | 15,000 | 17,620 |
| Royal Caribbean Cruises, Ltd. 144A company | | |
| guaranty sr. unsec. notes 7.25%, 1/15/30 | 5,000 | 5,222 |
| Royal Caribbean Cruises, Ltd. 144A company | | |
| guaranty sr. unsec. unsub. notes 9.25%, 1/15/29 | 15,000 | 16,134 |
| Royal Caribbean Cruises, Ltd. 144A sr. unsec. | | |
| notes 5.50%, 8/31/26 | 10,000 | 9,901 |
| Royal Caribbean Cruises, Ltd. 144A sr. unsec. | | |
| notes 4.25%, 7/1/26 | 5,000 | 4,829 |
| S&P Global, Inc. company guaranty sr. unsec. | | |
| bonds 2.50%, 12/1/29 | 30,000 | 27,003 |
| |
| 14 Putnam VT Global Asset Allocation Fund |
| | |
| | Principal | |
| CORPORATE BONDS AND NOTES (12.6%)* cont. | amount | Value |
| | | |
| Consumer cyclicals cont. | | |
| S&P Global, Inc. company guaranty sr. unsec. | | |
| notes 1.25%, 8/15/30 | $9,000 | $7,367 |
| Scientific Games Holdings LP/Scientific | | |
| Games US FinCo., Inc. 144A sr. unsec. notes | | |
| 6.625%, 3/1/30 | 20,000 | 18,909 |
| Scripps Escrow II, Inc. 144A sr. notes | | |
| 3.875%, 1/15/29 | 5,000 | 4,422 |
| Scripps Escrow, Inc. 144A company guaranty sr. | | |
| unsec. notes 5.875%, 7/15/27 | 5,000 | 4,442 |
| Shift4 Payments, LLC/Shift4 Payments Finance | | |
| Sub, Inc. 144A company guaranty sr. unsec. | | |
| notes 4.625%, 11/1/26 | 10,000 | 9,724 |
| Sirius XM Radio, Inc. 144A company guaranty sr. | | |
| unsec. bonds 3.875%, 9/1/31 | 15,000 | 12,832 |
| Sirius XM Radio, Inc. 144A company guaranty sr. | | |
| unsec. notes 4.00%, 7/15/28 | 10,000 | 9,248 |
| Spectrum Brands, Inc. 144A company guaranty | | |
| sr. unsec. bonds 5.00%, 10/1/29 | 15,000 | 14,312 |
| Standard Industries, Inc. 144A sr. unsec. bonds | | |
| 3.375%, 1/15/31 | 5,000 | 4,301 |
| Standard Industries, Inc. 144A sr. unsec. notes | | |
| 5.00%, 2/15/27 | 10,000 | 9,749 |
| Standard Industries, Inc. 144A sr. unsec. notes | | |
| 4.375%, 7/15/30 | 10,000 | 9,184 |
| Station Casinos, LLC 144A sr. unsec. bonds | | |
| 4.625%, 12/1/31 | 5,000 | 4,508 |
| Station Casinos, LLC 144A sr. unsec. notes | | |
| 4.50%, 2/15/28 | 15,000 | 14,142 |
| SugarHouse HSP Gaming Prop. Mezz LP/ | | |
| SugarHouse HSP Gaming Finance Corp. | | |
| 144A company guaranty sr. unsub. notes | | |
| 5.875%, 5/15/25 | 15,000 | 14,901 |
| Tapestry, Inc. company guaranty sr. unsec. notes | | |
| 7.70%, 11/27/30 | 5,000 | 5,264 |
| Taylor Morrison Communities, Inc. 144A | | |
| company guaranty sr. unsec. notes | | |
| 5.875%, 6/15/27 | 5,000 | 5,025 |
| Taylor Morrison Communities, Inc. 144A sr. | | |
| unsec. bonds 5.125%, 8/1/30 | 10,000 | 9,674 |
| Taylor Morrison Communities, Inc. 144A sr. | | |
| unsec. notes 5.75%, 1/15/28 | 5,000 | 5,023 |
| Townsquare Media, Inc. 144A sr. notes | | |
| 6.875%, 2/1/26 | 10,000 | 9,796 |
| Univision Communications, Inc. 144A company | | |
| guaranty sr. notes 6.625%, 6/1/27 | 10,000 | 9,973 |
| Univision Communications, Inc. 144A sr. notes | | |
| 8.00%, 8/15/28 | 10,000 | 10,316 |
| Univision Communications, Inc. 144A sr. notes | | |
| 7.375%, 6/30/30 | 5,000 | 4,986 |
| Victoria’s Secret & Co. 144A sr. unsec. notes | | |
| 4.625%, 7/15/29 | 15,000 | 12,469 |
| Walt Disney Co. (The) company guaranty sr. | | |
| unsec. bonds 7.75%, 12/1/45 | 40,000 | 53,384 |
| Warnermedia Holdings, Inc. company guaranty | | |
| sr. unsec. notes 4.279%, 3/15/32 | 102,000 | 93,351 |
| Warnermedia Holdings, Inc. company guaranty | | |
| sr. unsec. notes 3.755%, 3/15/27 | 20,000 | 19,164 |
| White Cap Buyer, LLC 144A sr. unsec. notes | | |
| 6.875%, 10/15/28 | 15,000 | 14,520 |
| Wynn Las Vegas, LLC/Wynn Las Vegas Capital | | |
| Corp. 144A company guaranty sr. unsec. sub. | | |
| notes 5.25%, 5/15/27 | 15,000 | 14,597 |
| | |
| | Principal | |
| CORPORATE BONDS AND NOTES (12.6%)* cont. | amount | Value |
| | | |
| Consumer cyclicals cont. | | |
| Wynn Resorts Finance, LLC/Wynn Resorts | | |
| Capital Corp. 144A company guaranty sr. unsec. | | |
| unsub. notes 7.125%, 2/15/31 | $10,000 | $10,363 |
| Wynn Resorts Finance, LLC/Wynn Resorts | | |
| Capital Corp. 144A sr. unsec. bonds | | |
| 5.125%, 10/1/29 | 10,000 | 9,438 |
| | | 1,711,952 |
| Consumer staples (0.5%) | | |
| 1011778 BC ULC/New Red Finance, Inc. 144A | | |
| bonds 4.00%, 10/15/30 (Canada) | 20,000 | 17,938 |
| Albertsons Cos., Inc./Safeway, Inc./New | | |
| Albertsons LP/Albertsons, LLC 144A company | | |
| guaranty sr. unsec. notes 4.875%, 2/15/30 | 5,000 | 4,787 |
| Albertsons Cos., Inc./Safeway, Inc./New | | |
| Albertsons LP/Albertsons, LLC 144A company | | |
| guaranty sr. unsec. notes 4.625%, 1/15/27 | 30,000 | 29,166 |
| Albertsons Cos., LLC/Safeway, Inc./New | | |
| Albertsons LP/Albertsons, LLC 144A company | | |
| guaranty sr. unsec. notes 7.50%, 3/15/26 | 10,000 | 10,186 |
| Aramark Services, Inc. 144A company guaranty | | |
| sr. unsec. notes 5.00%, 2/1/28 | 17,000 | 16,491 |
| CDW, LLC/CDW Finance Corp. company | | |
| guaranty sr. unsec. notes 3.25%, 2/15/29 | 15,000 | 13,716 |
| Coty, Inc. 144A company guaranty sr. notes | | |
| 4.75%, 1/15/29 | 15,000 | 14,307 |
| Coty, Inc./HFC Prestige Products, Inc./HFC | | |
| Prestige International US, LLC 144A company | | |
| guaranty sr. notes 6.625%, 7/15/30 | 5,000 | 5,137 |
| ERAC USA Finance, LLC 144A company guaranty | | |
| sr. unsec. notes 7.00%, 10/15/37 | 50,000 | 58,430 |
| ERAC USA Finance, LLC 144A company guaranty | | |
| sr. unsec. notes 5.625%, 3/15/42 | 60,000 | 62,251 |
| Fertitta Entertainment, LLC/Fertitta | | |
| Entertainment Finance Co., Inc. 144A company | | |
| guaranty sr. notes 4.625%, 1/15/29 | 5,000 | 4,537 |
| Fertitta Entertainment, LLC/Fertitta | | |
| Entertainment Finance Co., Inc. 144A company | | |
| guaranty sr. unsec. notes 6.75%, 1/15/30 | 10,000 | 8,780 |
| Herc Holdings, Inc. 144A company guaranty sr. | | |
| unsec. notes 5.50%, 7/15/27 | 10,000 | 9,873 |
| Hertz Corp. (The) 144A company guaranty sr. | | |
| unsec. notes 5.00%, 12/1/29 | 20,000 | 16,406 |
| IRB Holding Corp. 144A company guaranty sr. | | |
| notes 7.00%, 6/15/25 | 5,000 | 5,000 |
| JBS USA LUX SA/JBS USA Food Co./JBS USA | | |
| Finance, Inc. company guaranty sr. unsec. notes | | |
| 3.00%, 2/2/29 | 7,000 | 6,157 |
| Kenvue, Inc. company guaranty sr. unsec. notes | | |
| Ser. REGS, 4.90%, 3/22/33 | 26,000 | 26,801 |
| Kenvue, Inc. company guaranty sr. unsec. unsub. | | |
| notes Ser. REGS, 5.05%, 3/22/53 | 5,000 | 5,173 |
| Kenvue, Inc. company guaranty sr. unsec. unsub. | | |
| notes Ser. REGS, 5.05%, 3/22/28 | 49,000 | 50,198 |
| Keurig Dr Pepper, Inc. company guaranty sr. | | |
| unsec. unsub. notes 3.43%, 6/15/27 | 18,000 | 17,336 |
| Kraft Heinz Foods Co. company guaranty sr. | | |
| unsec. notes 3.00%, 6/1/26 | 19,000 | 18,253 |
| Lamb Weston Holdings, Inc. 144A company | | |
| guaranty sr. unsec. notes 4.125%, 1/31/30 | 15,000 | 13,829 |
| Match Group Holdings II, LLC 144A sr. unsec. | | |
| bonds 5.00%, 12/15/27 | 3,000 | 2,929 |
| Match Group Holdings II, LLC 144A sr. unsec. | | |
| bonds 3.625%, 10/1/31 | 5,000 | 4,320 |
| |
| Putnam VT Global Asset Allocation Fund 15 |
| | |
| | Principal | |
| CORPORATE BONDS AND NOTES (12.6%)* cont. | amount | Value |
| | | |
| Consumer staples cont. | | |
| Match Group Holdings II, LLC 144A sr. unsec. | | |
| unsub. notes 4.625%, 6/1/28 | $40,000 | $38,300 |
| McCormick & Co., Inc. sr. unsec. notes | | |
| 1.85%, 2/15/31 | 2,000 | 1,635 |
| McDonald’s Corp. sr. unsec. unsub. bonds | | |
| Ser. MTN, 6.30%, 10/15/37 | 35,000 | 39,634 |
| PECF USS Intermediate Holding III Corp. 144A sr. | | |
| unsec. notes 8.00%, 11/15/29 | 15,000 | 7,650 |
| TripAdvisor, Inc. 144A company guaranty sr. | | |
| unsec. notes 7.00%, 7/15/25 | 10,000 | 10,024 |
| US Foods, Inc. 144A company guaranty sr. unsec. | | |
| notes 7.25%, 1/15/32 | 5,000 | 5,214 |
| US Foods, Inc. 144A company guaranty sr. unsec. | | |
| notes 4.75%, 2/15/29 | 5,000 | 4,749 |
| | | 529,207 |
| Energy (0.9%) | | |
| Antero Midstream Partners LP/Antero | | |
| Midstream Finance Corp. 144A company | | |
| guaranty sr. unsec. notes 7.875%, 5/15/26 | 10,000 | 10,242 |
| Antero Resources Corp. 144A company guaranty | | |
| sr. unsec. notes 7.625%, 2/1/29 | 4,000 | 4,105 |
| Apache Corp. sr. unsec. unsub. notes | | |
| 5.10%, 9/1/40 | 10,000 | 8,568 |
| Callon Petroleum Co. 144A company guaranty sr. | | |
| unsec. notes 8.00%, 8/1/28 | 10,000 | 10,213 |
| Callon Petroleum Co. 144A company guaranty sr. | | |
| unsec. notes 7.50%, 6/15/30 | 20,000 | 20,170 |
| Cenovus Energy, Inc. sr. unsec. bonds 6.75%, | | |
| 11/15/39 (Canada) | 2,000 | 2,187 |
| Centennial Resource Production, LLC | | |
| 144A company guaranty sr. unsec. notes | | |
| 6.875%, 4/1/27 | 20,000 | 19,986 |
| Cheniere Energy Partners LP company guaranty | | |
| sr. unsec. notes 4.50%, 10/1/29 | 80,000 | 76,518 |
| Chord Energy Corp. 144A company guaranty sr. | | |
| unsec. notes 6.375%, 6/1/26 | 10,000 | 10,000 |
| Civitas Resources, Inc. 144A company guaranty | | |
| sr. unsec. notes 8.375%, 7/1/28 | 5,000 | 5,220 |
| Civitas Resources, Inc. 144A company guaranty | | |
| sr. unsec. unsub. notes 8.75%, 7/1/31 | 10,000 | 10,645 |
| Columbia Pipelines Operating Co., LLC 144A sr. | | |
| unsec. notes 5.927%, 8/15/30 | 10,000 | 10,359 |
| Comstock Resources, Inc. 144A company | | |
| guaranty sr. unsec. notes 5.875%, 1/15/30 | 10,000 | 8,673 |
| Comstock Resources, Inc. 144A sr. unsec. notes | | |
| 6.75%, 3/1/29 | 10,000 | 9,145 |
| Continental Resources, Inc. 144A company | | |
| guaranty sr. unsec. bonds 5.75%, 1/15/31 | 10,000 | 9,955 |
| Devon Energy Corp. sr. unsec. unsub. bonds | | |
| 7.95%, 4/15/32 | 5,000 | 5,813 |
| Devon Energy Corp. sr. unsec. unsub. bonds | | |
| 7.875%, 9/30/31 | 5,000 | 5,821 |
| Diamondback Energy, Inc. company guaranty sr. | | |
| unsec. notes 3.25%, 12/1/26 | 15,000 | 14,527 |
| Encino Acquisition Partners Holdings, LLC | | |
| 144A company guaranty sr. unsec. notes | | |
| 8.50%, 5/1/28 | 15,000 | 14,775 |
| Endeavor Energy Resources LP/EER Finance, Inc. | | |
| 144A sr. unsec. bonds 5.75%, 1/30/28 | 55,000 | 55,052 |
| EnLink Midstream, LLC 144A company guaranty | | |
| sr. unsec. notes 5.625%, 1/15/28 | 15,000 | 14,830 |
| EQT Corp. sr. unsec. notes 7.00%, 2/1/30 | 10,000 | 10,732 |
| | |
| | Principal | |
| CORPORATE BONDS AND NOTES (12.6%)* cont. | amount | Value |
| | | |
| Energy cont. | | |
| Hess Midstream Operations LP 144A company | | |
| guaranty sr. unsec. notes 5.50%, 10/15/30 | $5,000 | $4,839 |
| Hess Midstream Operations LP 144A company | | |
| guaranty sr. unsec. notes 5.125%, 6/15/28 | 10,000 | 9,648 |
| Hess Midstream Operations LP 144A company | | |
| guaranty sr. unsec. notes 4.25%, 2/15/30 | 5,000 | 4,600 |
| Hess Midstream Operations LP 144A company | | |
| guaranty sr. unsec. sub. notes 5.625%, 2/15/26 | 10,000 | 9,927 |
| Kinetik Holdings LP 144A company guaranty sr. | | |
| unsec. notes 5.875%, 6/15/30 | 15,000 | 14,716 |
| Nabors Industries, Inc. company guaranty sr. | | |
| unsec. notes 5.75%, 2/1/25 | 10,000 | 9,997 |
| Nabors Industries, Inc. 144A company guaranty | | |
| sr. unsec. notes 7.375%, 5/15/27 | 10,000 | 9,797 |
| Occidental Petroleum Corp. sr. unsec. sub. | | |
| bonds 6.20%, 3/15/40 | 35,000 | 36,138 |
| Occidental Petroleum Corp. sr. unsec. sub. notes | | |
| 8.50%, 7/15/27 | 10,000 | 10,908 |
| Occidental Petroleum Corp. sr. unsec. sub. notes | | |
| 7.50%, 5/1/31 | 25,000 | 28,034 |
| Ovintiv, Inc. company guaranty sr. unsec. bonds | | |
| 6.25%, 7/15/33 | 5,000 | 5,169 |
| Ovintiv, Inc. company guaranty sr. unsec. notes | | |
| 5.65%, 5/15/28 | 46,000 | 46,936 |
| Ovintiv, Inc. company guaranty sr. unsec. unsub. | | |
| bonds 7.375%, 11/1/31 | 10,000 | 11,016 |
| Ovintiv, Inc. company guaranty sr. unsec. unsub. | | |
| bonds 6.625%, 8/15/37 | 5,000 | 5,177 |
| Patterson-UTI Energy, Inc. sr. unsec. sub. notes | | |
| 5.15%, 11/15/29 | 10,000 | 9,539 |
| Permian Resources Operating, LLC | | |
| 144A company guaranty sr. unsec. notes | | |
| 5.375%, 1/15/26 | 10,000 | 9,867 |
| Petrobras Global Finance BV company guaranty | | |
| sr. unsec. unsub. bonds 6.50%, 7/3/33 (Brazil) | 10,000 | 10,147 |
| Petroleos Mexicanos company guaranty sr. | | |
| unsec. unsub. notes 6.49%, 1/23/27 (Mexico) | 20,000 | 18,765 |
| Precision Drilling Corp. 144A company guaranty | | |
| sr. unsec. notes 7.125%, 1/15/26 (Canada) | 9,000 | 8,959 |
| Precision Drilling Corp. 144A company guaranty | | |
| sr. unsec. notes 6.875%, 1/15/29 (Canada) | 10,000 | 9,643 |
| Rockcliff Energy II, LLC 144A sr. unsec. notes | | |
| 5.50%, 10/15/29 | 15,000 | 14,177 |
| Sitio Royalties Operating Partnership LP/ | | |
| Sitio Finance Corp. 144A sr. unsec. notes | | |
| 7.875%, 11/1/28 | 15,000 | 15,543 |
| SM Energy Co. sr. unsec. unsub. notes | | |
| 6.75%, 9/15/26 | 10,000 | 9,974 |
| SM Energy Co. sr. unsec. unsub. notes | | |
| 6.50%, 7/15/28 | 10,000 | 10,005 |
| Southwestern Energy Co. company guaranty sr. | | |
| unsec. notes 5.375%, 3/15/30 | 10,000 | 9,765 |
| Southwestern Energy Co. company guaranty sr. | | |
| unsec. notes 5.375%, 2/1/29 | 25,000 | 24,397 |
| Spectra Energy Partners LP sr. unsec. notes | | |
| 3.375%, 10/15/26 | 30,000 | 28,882 |
| Tallgrass Energy Partners LP/Tallgrass Energy | | |
| Finance Corp. 144A company guaranty sr. unsec. | | |
| notes 6.00%, 12/31/30 | 10,000 | 9,300 |
| Tallgrass Energy Partners LP/Tallgrass Energy | | |
| Finance Corp. 144A company guaranty sr. unsec. | | |
| notes 5.50%, 1/15/28 | 5,000 | 4,738 |
| |
| 16 Putnam VT Global Asset Allocation Fund |
| | |
| | Principal | |
| CORPORATE BONDS AND NOTES (12.6%)* cont. | amount | Value |
| | | |
| Energy cont. | | |
| Targa Resources Partners LP/Targa Resources | | |
| Partners Finance Corp. company guaranty sr. | | |
| unsec. unsub. notes 4.875%, 2/1/31 | $20,000 | $19,428 |
| Transocean Aquila, Ltd. 144A company guaranty | | |
| sr. notes 8.00%, 9/30/28 | 5,000 | 5,075 |
| Transocean Poseidon, Ltd. 144A company | | |
| guaranty sr. notes 6.875%, 2/1/27 | 7,500 | 7,463 |
| Transocean Titan Financing, Ltd. 144A | | |
| company guaranty sr. notes 8.375%, 2/1/28 | | |
| (Cayman Islands) | 5,000 | 5,187 |
| Transocean, Inc. 144A company guaranty sr. | | |
| notes 8.75%, 2/15/30 | 4,750 | 4,963 |
| Transocean, Inc. 144A company guaranty sr. | | |
| unsec. notes 11.50%, 1/30/27 | 10,000 | 10,450 |
| USA Compression Partners LP/USA | | |
| Compression Finance Corp. company guaranty | | |
| sr. unsec. notes 6.875%, 4/1/26 | 10,000 | 9,958 |
| USA Compression Partners LP/USA | | |
| Compression Finance Corp. company guaranty | | |
| sr. unsec. unsub. notes 6.875%, 9/1/27 | 5,000 | 4,941 |
| Venture Global Calcasieu Pass, LLC 144A | | |
| company guaranty sr. notes 3.875%, 8/15/29 | 10,000 | 9,073 |
| Venture Global LNG, Inc. 144A sr. notes | | |
| 9.875%, 2/1/32 | 15,000 | 15,625 |
| Venture Global LNG, Inc. 144A sr. notes | | |
| 9.50%, 2/1/29 | 15,000 | 15,873 |
| Venture Global LNG, Inc. 144A sr. notes | | |
| 8.375%, 6/1/31 | 10,000 | 9,995 |
| Venture Global LNG, Inc. 144A sr. notes | | |
| 8.125%, 6/1/28 | 5,000 | 5,049 |
| Viper Energy Partners LP 144A company | | |
| guaranty sr. unsec. notes 7.375%, 11/1/31 | 10,000 | 10,350 |
| Viper Energy Partners LP 144A company | | |
| guaranty sr. unsec. notes 5.375%, 11/1/27 | 5,000 | 4,909 |
| | | 876,478 |
| Financials (3.5%) | | |
| AG Issuer, LLC 144A sr. notes 6.25%, 3/1/28 | 10,000 | 9,941 |
| Air Lease Corp. sr. unsec. notes 2.10%, 9/1/28 | 65,000 | 56,884 |
| Air Lease Corp. sr. unsec. sub. bonds | | |
| 4.625%, 10/1/28 | 23,000 | 22,471 |
| Air Lease Corp. sr. unsec. sub. notes | | |
| 5.85%, 12/15/27 | 15,000 | 15,388 |
| Air Lease Corp. sr. unsec. sub. notes | | |
| 3.25%, 10/1/29 | 3,000 | 2,710 |
| Aircastle, Ltd. 144A sr. unsec. notes | | |
| 6.50%, 7/18/28 | 15,000 | 15,296 |
| Aircastle, Ltd. 144A sr. unsec. notes | | |
| 5.25%, 8/11/25 | 25,000 | 24,641 |
| Alliant Holdings Intermediate, LLC/Alliant | | |
| Holdings Co-Issuer 144A sr. unsec. notes | | |
| 6.75%, 10/15/27 | 15,000 | 14,947 |
| Ally Financial, Inc. company guaranty sr. unsec. | | |
| notes 8.00%, 11/1/31 | 34,000 | 37,248 |
| Ally Financial, Inc. sr. unsec. notes 4.75%, 6/9/27 | 25,000 | 24,124 |
| AmWINS Group, Inc. 144A sr. unsec. notes | | |
| 4.875%, 6/30/29 | 5,000 | 4,566 |
| Ares Capital Corp. sr. unsec. notes | | |
| 2.875%, 6/15/27 | 26,000 | 23,755 |
| Ares Capital Corp. sr. unsec. notes 2.15%, 7/15/26 | 24,000 | 21,878 |
| Ares Capital Corp. sr. unsec. sub. notes | | |
| 7.00%, 1/15/27 | 5,000 | 5,143 |
| Ares Capital Corp. sr. unsec. sub. notes | | |
| 3.875%, 1/15/26 | 25,000 | 24,016 |
| | |
| | Principal | |
| CORPORATE BONDS AND NOTES (12.6%)* cont. | amount | Value |
| | | |
| Financials cont. | | |
| Aretec Escrow Issuer 2, Inc. 144A company | | |
| guaranty sr. unsec. notes 10.00%, 8/15/30 | $10,000 | $10,627 |
| Aretec Escrow Issuer, Inc. 144A sr. unsec. notes | | |
| 7.50%, 4/1/29 | 15,000 | 13,502 |
| Athene Global Funding 144A notes | | |
| 1.985%, 8/19/28 | 40,000 | 34,526 |
| Banco Santander SA unsec. sub. FRB 3.225%, | | |
| 11/22/32 (Spain) | 200,000 | 167,476 |
| Bank of America Corp. jr. unsec. sub. FRN Ser. AA, | | |
| 6.10%, perpetual maturity | 74,000 | 73,298 |
| Bank of America Corp. sr. unsec. FRN Ser. MTN, | | |
| 2.496%, 2/13/31 | 5,000 | 4,294 |
| Bank of America Corp. unsec. sub. FRB | | |
| 3.846%, 3/8/37 | 120,000 | 105,361 |
| Bank of America Corp. unsec. sub. notes | | |
| 6.11%, 1/29/37 | 195,000 | 207,907 |
| Bank of Nova Scotia (The) sr. unsec. unsub. notes | | |
| 5.35%, 12/7/26 (Canada) | 15,000 | 15,251 |
| Berkshire Hathaway Finance Corp. company | | |
| guaranty sr. unsec. bonds 2.85%, 10/15/50 | 10,000 | 7,002 |
| Berkshire Hathaway Finance Corp. company | | |
| guaranty sr. unsec. notes 4.30%, 5/15/43 | 29,000 | 27,136 |
| Blackstone Holdings Finance Co., LLC 144A | | |
| company guaranty sr. unsec. unsub. bonds | | |
| 1.60%, 3/30/31 | 10,000 | 7,813 |
| Capital One Financial Corp. unsec. sub. FRB | | |
| 2.359%, 7/29/32 | 92,000 | 69,700 |
| Citigroup, Inc. jr. unsec. sub. FRN 3.875%, | | |
| perpetual maturity | 23,000 | 20,362 |
| Citigroup, Inc. sr. unsec. FRB 3.668%, 7/24/28 | 204,000 | 194,418 |
| Citigroup, Inc. sr. unsec. unsub. FRB | | |
| 3.887%, 1/10/28 | 50,000 | 48,349 |
| Citigroup, Inc. unsec. sub. bonds 4.75%, 5/18/46 | 10,000 | 8,943 |
| Citigroup, Inc. unsec. sub. bonds 4.45%, 9/29/27 | 50,000 | 48,850 |
| CNO Financial Group, Inc. sr. unsec. notes | | |
| 5.25%, 5/30/29 | 10,000 | 9,872 |
| Cobra AcquisitionCo, LLC 144A company | | |
| guaranty sr. unsec. notes 6.375%, 11/1/29 | 15,000 | 11,561 |
| Commonwealth Bank of Australia 144A sr. unsec. | | |
| notes 3.15%, 9/19/27 (Australia) | 75,000 | 71,031 |
| Corebridge Financial, Inc. sr. unsec. notes | | |
| 3.85%, 4/5/29 | 20,000 | 18,846 |
| Credit Acceptance Corp. 144A company | | |
| guaranty sr. unsec. notes 9.25%, 12/15/28 | 15,000 | 15,989 |
| Fairfax Financial Holdings, Ltd. sr. unsec. notes | | |
| 4.85%, 4/17/28 (Canada) | 10,000 | 9,845 |
| Fairfax US, Inc. 144A company guaranty sr. | | |
| unsec. notes 4.875%, 8/13/24 | 30,000 | 29,940 |
| First-Citizens Bank & Trust Co. unsec. sub. notes | | |
| 6.125%, 3/9/28 | 26,000 | 26,452 |
| Freedom Mortgage Corp. 144A sr. unsec. notes | | |
| 12.25%, 10/1/30 | 5,000 | 5,438 |
| Freedom Mortgage Corp. 144A sr. unsec. notes | | |
| 7.625%, 5/1/26 | 10,000 | 9,869 |
| Freedom Mortgage Corp. 144A sr. unsec. sub. | | |
| notes 6.625%, 1/15/27 | 5,000 | 4,772 |
| General Motors Financial Co., Inc. company | | |
| guaranty sr. unsec. notes 4.00%, 10/6/26 | 79,000 | 76,857 |
| General Motors Financial Co., Inc. company | | |
| guaranty sr. unsec. unsub. notes 4.00%, 1/15/25 | 10,000 | 9,836 |
| General Motors Financial Co., Inc. sr. unsec. | | |
| notes 3.10%, 1/12/32 | 12,000 | 10,216 |
| |
| Putnam VT Global Asset Allocation Fund 17 |
| | |
| | Principal | |
| CORPORATE BONDS AND NOTES (12.6%)* cont. | amount | Value |
| | | |
| Financials cont. | | |
| General Motors Financial Co., Inc. sr. unsec. | | |
| notes 2.35%, 2/26/27 | $2,000 | $1,841 |
| General Motors Financial Co., Inc. sr. unsec. | | |
| notes 1.25%, 1/8/26 | 22,000 | 20,355 |
| GGAM Finance, Ltd. 144A company guaranty sr. | | |
| unsec. notes 8.00%, 2/15/27 (Ireland) | 5,000 | 5,125 |
| GLP Capital LP/GLP Financing II, Inc. company | | |
| guaranty sr. unsec. bonds 3.25%, 1/15/32 R | 15,000 | 12,664 |
| GLP Capital LP/GLP Financing II, Inc. | | |
| company guaranty sr. unsec. unsub. notes | | |
| 5.375%, 4/15/26 R | 4,000 | 3,975 |
| goeasy, Ltd. 144A company guaranty sr. unsec. | | |
| notes 9.25%, 12/1/28 (Canada) | 5,000 | 5,340 |
| goeasy, Ltd. 144A company guaranty sr. unsec. | | |
| notes 4.375%, 5/1/26 (Canada) | 5,000 | 4,814 |
| Goldman Sachs Group, Inc. (The) jr. unsec. sub. | | |
| FRN 3.65%, 7/28/51 | 7,000 | 6,207 |
| Goldman Sachs Group, Inc. (The) sr. unsec. FRB | | |
| 4.223%, 5/1/29 | 117,000 | 113,177 |
| Goldman Sachs Group, Inc. (The) sr. unsec. | | |
| unsub. notes 2.60%, 2/7/30 | 13,000 | 11,424 |
| Goldman Sachs Group, Inc. (The) unsec. sub. | | |
| notes 5.95%, 1/15/27 | 5,000 | 5,142 |
| HUB International, Ltd. 144A sr. notes | | |
| 7.25%, 6/15/30 | 5,000 | 5,281 |
| HUB International, Ltd. 144A sr. unsec. notes | | |
| 7.00%, 5/1/26 | 20,000 | 20,077 |
| HUB International, Ltd. 144A sr. unsec. notes | | |
| 5.625%, 12/1/29 | 5,000 | 4,770 |
| Huntington Bancshares, Inc. unsec. sub. FRB | | |
| 2.487%, 8/15/36 | 41,000 | 30,985 |
| Icahn Enterprises LP/Icahn Enterprises Finance | | |
| Corp. company guaranty sr. unsec. notes | | |
| 6.25%, 5/15/26 | 10,000 | 9,541 |
| Icahn Enterprises LP/Icahn Enterprises Finance | | |
| Corp. company guaranty sr. unsec. sub. notes | | |
| 4.375%, 2/1/29 | 5,000 | 4,175 |
| Intercontinental Exchange, Inc. sr. unsec. bonds | | |
| 2.65%, 9/15/40 | 30,000 | 22,327 |
| Intercontinental Exchange, Inc. sr. unsec. bonds | | |
| 1.85%, 9/15/32 | 15,000 | 11,996 |
| JPMorgan Chase & Co. jr. unsec. bonds 6.10%, | | |
| perpetual maturity | 8,000 | 7,956 |
| JPMorgan Chase & Co. jr. unsec. sub. FRB | | |
| Ser. HH, 4.60%, perpetual maturity | 157,000 | 151,398 |
| JPMorgan Chase & Co. jr. unsec. sub. FRB | | |
| Ser. W, (CME Term SOFR 3 Month + 1.26%), | | |
| 6.641%, 5/15/47 | 13,000 | 11,122 |
| JPMorgan Chase & Co. jr. unsec. sub. FRN 3.65%, | | |
| perpetual maturity | 17,000 | 15,557 |
| JPMorgan Chase & Co. sr. unsec. unsub. FRB | | |
| 3.964%, 11/15/48 | 150,000 | 125,580 |
| JPMorgan Chase & Co. unsec. sub. FRB | | |
| 2.956%, 5/13/31 | 150,000 | 131,816 |
| JPMorgan Chase & Co. unsec. sub. notes | | |
| 4.125%, 12/15/26 | 6,000 | 5,881 |
| KKR Group Finance Co. III, LLC 144A company | | |
| guaranty sr. unsec. unsub. bonds 5.125%, 6/1/44 | 30,000 | 27,428 |
| Ladder Capital Finance Holdings, LLLP/Ladder | | |
| Capital Finance Corp. 144A company guaranty | | |
| sr. unsec. notes 4.75%, 6/15/29 R | 10,000 | 9,017 |
| | |
| | Principal | |
| CORPORATE BONDS AND NOTES (12.6%)* cont. | amount | Value |
| | | |
| Financials cont. | | |
| Ladder Capital Finance Holdings, LLLP/Ladder | | |
| Capital Finance Corp. 144A sr. unsec. notes | | |
| 4.25%, 2/1/27 R | $15,000 | $14,133 |
| LPL Holdings, Inc. company guaranty sr. unsec. | | |
| notes 6.75%, 11/17/28 | 16,000 | 17,056 |
| Marsh & McLennan Cos., Inc. sr. unsec. sub. notes | | |
| 4.375%, 3/15/29 | 22,000 | 21,891 |
| Morgan Stanley sr. unsec. notes 5.123%, 2/1/29 | 25,000 | 25,114 |
| Morgan Stanley sr. unsec. unsub. FRN Ser. GMTN, | | |
| 3.772%, 1/24/29 | 185,000 | 176,431 |
| Morgan Stanley unsec. unsub. notes | | |
| 3.95%, 4/23/27 | 40,000 | 38,828 |
| Morgan Stanley unsec.sub. notes | | |
| 5.297%, 4/20/37 | 24,000 | 23,354 |
| Mutual of Omaha Cos. Global Funding 144A | | |
| notes 5.80%, 7/27/26 | 15,000 | 15,285 |
| Nasdaq, Inc. sr. unsec. bonds 5.95%, 8/15/53 | 5,000 | 5,371 |
| Nasdaq, Inc. sr. unsec. notes 5.35%, 6/28/28 | 10,000 | 10,299 |
| Nasdaq, Inc. sr. unsec. sub. bonds | | |
| 5.55%, 2/15/34 | 5,000 | 5,194 |
| Nationstar Mortgage Holdings, Inc. | | |
| 144A company guaranty sr. unsec. notes | | |
| 5.75%, 11/15/31 | 15,000 | 13,986 |
| Nationstar Mortgage Holdings, Inc. | | |
| 144A company guaranty sr. unsec. notes | | |
| 5.50%, 8/15/28 | 10,000 | 9,616 |
| Neuberger Berman Group, LLC/Neuberger | | |
| Berman Finance Corp. 144A sr. unsec. notes | | |
| 4.875%, 4/15/45 | 30,000 | 24,762 |
| OneMain Finance Corp. company guaranty sr. | | |
| unsec. sub. notes 7.125%, 3/15/26 | 5,000 | 5,094 |
| OneMain Finance Corp. company guaranty sr. | | |
| unsec. sub. notes 6.625%, 1/15/28 | 5,000 | 5,048 |
| OneMain Finance Corp. company guaranty sr. | | |
| unsec. unsub. notes 5.375%, 11/15/29 | 15,000 | 14,046 |
| PennyMac Financial Services, Inc. 144A | | |
| company guaranty sr. unsec. notes | | |
| 7.875%, 12/15/29 | 10,000 | 10,294 |
| PennyMac Financial Services, Inc. 144A | | |
| company guaranty sr. unsec. notes | | |
| 5.375%, 10/15/25 | 5,000 | 4,941 |
| PHH Mortgage Corp. 144A company guaranty sr. | | |
| notes 7.875%, 3/15/26 | 15,000 | 13,434 |
| PNC Financial Services Group, Inc. (The) unsec. | | |
| sub. FRB 4.626%, 6/6/33 | 70,000 | 66,006 |
| Prologis LP sr. unsec. unsub. notes | | |
| 2.25%, 4/15/30 R | 10,000 | 8,742 |
| Royal Bank of Canada sr. unsec. notes | | |
| Ser. GMTN, 5.20%, 8/1/28 (Canada) | 30,000 | 30,577 |
| Royal Bank of Canada unsec. sub. notes | | |
| Ser. GMTN, 4.65%, 1/27/26 (Canada) | 45,000 | 44,619 |
| Toronto-Dominion Bank (The) unsec. sub. FRB | | |
| 3.625%, 9/15/31 (Canada) | 55,000 | 52,767 |
| Truist Financial Corp. sr. unsec. unsub. FRN | | |
| Ser. MTN, 4.26%, 7/28/26 | 55,000 | 53,858 |
| US Bancorp unsec. sub. FRB 2.491%, 11/3/36 | 60,000 | 46,532 |
| USI, Inc./NY 144A sr. unsec. notes 7.50%, 1/15/32 | 5,000 | 5,106 |
| VICI Properties LP sr. unsec. unsub. notes | | |
| 4.75%, 2/15/28 R | 30,000 | 29,368 |
| VICI Properties LP/VICI Note Co., Inc. | | |
| 144A company guaranty sr. unsec. notes | | |
| 3.75%, 2/15/27 R | 10,000 | 9,440 |
| |
| 18 Putnam VT Global Asset Allocation Fund |
| | |
| | Principal | |
| CORPORATE BONDS AND NOTES (12.6%)* cont. | amount | Value |
| | | |
| Financials cont. | | |
| Wells Fargo & Co. sr. unsec. unsub. FRB Ser. MTN, | | |
| 3.35%, 3/2/33 | $185,000 | $161,582 |
| Wells Fargo & Co. sr. unsec. unsub. FRN Ser. MTN, | | |
| 5.574%, 7/25/29 | 15,000 | 15,316 |
| Wells Fargo & Co. sr. unsec. unsub. FRN Ser. MTN, | | |
| 4.54%, 8/15/26 | 22,000 | 21,765 |
| Westpac Banking Corp. unsec. sub. bonds | | |
| 2.963%, 11/16/40 (Australia) | 25,000 | 17,309 |
| | | 3,480,482 |
| Health care (0.9%) | | |
| 1375209 BC, Ltd. 144A sr. notes 9.00%, | | |
| 1/30/28 (Canada) | 1,000 | 975 |
| Amgen, Inc. sr. unsec. unsub. bonds | | |
| 5.75%, 3/2/63 | 10,000 | 10,491 |
| Amgen, Inc. sr. unsec. unsub. bonds | | |
| 5.65%, 3/2/53 | 23,000 | 24,185 |
| Amgen, Inc. sr. unsec. unsub. notes | | |
| 5.25%, 3/2/30 | 47,000 | 48,247 |
| Amgen, Inc. sr. unsec. unsub. notes | | |
| 5.15%, 3/2/28 | 30,000 | 30,690 |
| Bausch & Lomb Escrow Corp. 144A sr. notes | | |
| 8.375%, 10/1/28 (Canada) | 15,000 | 15,824 |
| Bausch Health Cos., Inc. 144A company guaranty | | |
| sr. notes 6.125%, 2/1/27 | 5,000 | 3,375 |
| Bausch Health Cos., Inc. 144A sr. notes | | |
| 4.875%, 6/1/28 | 10,000 | 6,022 |
| Becton, Dickinson and Co. sr. unsec. notes | | |
| 3.70%, 6/6/27 | 7,000 | 6,783 |
| Becton, Dickinson and Co. sr. unsec. notes | | |
| 2.823%, 5/20/30 | 50,000 | 44,688 |
| Centene Corp. sr. unsec. bonds 3.00%, 10/15/30 | 10,000 | 8,660 |
| Centene Corp. sr. unsec. notes 4.625%, 12/15/29 | 10,000 | 9,587 |
| Charles River Laboratories International, | | |
| Inc. 144A company guaranty sr. unsec. notes | | |
| 4.00%, 3/15/31 | 5,000 | 4,513 |
| Charles River Laboratories International, | | |
| Inc. 144A company guaranty sr. unsec. notes | | |
| 3.75%, 3/15/29 | 5,000 | 4,588 |
| CHS/Community Health Systems, Inc. 144A | | |
| company guaranty sr. notes 10.875%, 1/15/32 | 5,000 | 5,226 |
| CHS/Community Health Systems, Inc. 144A | | |
| company guaranty sr. notes 8.00%, 3/15/26 | 3,000 | 2,990 |
| CHS/Community Health Systems, Inc. 144A | | |
| company guaranty sr. notes 5.625%, 3/15/27 | 5,000 | 4,646 |
| CHS/Community Health Systems, Inc. 144A | | |
| company guaranty sr. unsec. sub. notes | | |
| 6.875%, 4/1/28 | 10,000 | 6,138 |
| CHS/Community Health Systems, Inc. 144A sr. | | |
| notes 5.25%, 5/15/30 | 15,000 | 12,545 |
| CVS Health Corp. sr. unsec. unsub. notes | | |
| 4.78%, 3/25/38 | 39,000 | 36,948 |
| CVS Pass-Through Trust sr. notes | | |
| 6.036%, 12/10/28 | 1,738 | 1,746 |
| CVS Pass-Through Trust 144A sr. mtge. notes | | |
| 4.704%, 1/10/36 | 33,613 | 31,211 |
| DH Europe Finance II SARL company guaranty sr. | | |
| unsec. bonds 3.40%, 11/15/49 (Luxembourg) | 15,000 | 11,805 |
| Elanco Animal Health, Inc. sr. unsec. notes | | |
| Ser. WI, 6.65%, 8/28/28 | 10,000 | 10,362 |
| Eli Lilly and Co. sr. unsec. unsub. bonds | | |
| 4.875%, 2/27/53 | 15,000 | 15,514 |
| HCA, Inc. company guaranty sr. notes | | |
| 4.50%, 2/15/27 | 22,000 | 21,741 |
| | |
| | Principal | |
| CORPORATE BONDS AND NOTES (12.6%)* cont. | amount | Value |
| | | |
| Health care cont. | | |
| HCA, Inc. company guaranty sr. unsec. notes | | |
| 3.50%, 9/1/30 | $5,000 | $4,533 |
| HCA, Inc. company guaranty sr. unsec. sub. | | |
| notes 3.625%, 3/15/32 | 45,000 | 40,238 |
| Humana, Inc. sr. unsec. unsub. bonds | | |
| 5.50%, 3/15/53 | 5,000 | 5,185 |
| Humana, Inc. sr. unsec. unsub. notes | | |
| 5.75%, 3/1/28 | 25,000 | 25,978 |
| Merck & Co., Inc. sr. unsec. notes 2.90%, 3/7/24 | 1,000 | 995 |
| Merck & Co., Inc. sr. unsec. unsub. notes | | |
| 3.70%, 2/10/45 | 50,000 | 42,500 |
| Minerva Merger Sub, Inc. 144A sr. unsec. notes | | |
| 6.50%, 2/15/30 | 20,000 | 18,144 |
| Mozart Debt Merger Sub, Inc. 144A sr. notes | | |
| 3.875%, 4/1/29 | 30,000 | 27,124 |
| Mozart Debt Merger Sub, Inc. 144A sr. unsec. | | |
| notes 5.25%, 10/1/29 | 10,000 | 9,426 |
| Novartis Capital Corp. company guaranty sr. | | |
| unsec. unsub. bonds 4.00%, 11/20/45 | 80,000 | 71,857 |
| Option Care Health, Inc. 144A company guaranty | | |
| sr. unsec. notes 4.375%, 10/31/29 | 5,000 | 4,519 |
| Owens & Minor, Inc. 144A company guaranty sr. | | |
| unsec. notes 6.625%, 4/1/30 | 10,000 | 9,548 |
| Owens & Minor, Inc. 144A sr. unsec. notes | | |
| 4.50%, 3/31/29 | 5,000 | 4,410 |
| Pfizer Investment Enterprises PTE, Ltd. company | | |
| guaranty sr. unsec. notes 5.30%, 5/19/53 | | |
| (Singapore) | 8,000 | 8,167 |
| Pfizer Investment Enterprises PTE, Ltd. company | | |
| guaranty sr. unsec. notes 4.75%, 5/19/33 | | |
| (Singapore) | 11,000 | 11,025 |
| Pfizer Investment Enterprises PTE, Ltd. company | | |
| guaranty sr. unsec. notes 4.45%, 5/19/28 | | |
| (Singapore) | 36,000 | 35,982 |
| Service Corp. International sr. unsec. bonds | | |
| 5.125%, 6/1/29 | 15,000 | 14,700 |
| Service Corp. International sr. unsec. notes | | |
| 4.625%, 12/15/27 | 6,000 | 5,805 |
| Service Corp. International sr. unsec. notes | | |
| 3.375%, 8/15/30 | 5,000 | 4,360 |
| Service Corp. International sr. unsec. sub. notes | | |
| 4.00%, 5/15/31 | 10,000 | 8,955 |
| Tenet Healthcare Corp. company guaranty sr. | | |
| notes 5.125%, 11/1/27 | 25,000 | 24,439 |
| Tenet Healthcare Corp. company guaranty sr. | | |
| notes 4.875%, 1/1/26 | 20,000 | 19,775 |
| Tenet Healthcare Corp. company guaranty sr. | | |
| notes 4.25%, 6/1/29 | 10,000 | 9,310 |
| Tenet Healthcare Corp. company guaranty sr. | | |
| unsub. notes 6.125%, 6/15/30 | 15,000 | 15,166 |
| Thermo Fisher Scientific, Inc. sr. unsec. notes | | |
| 5.00%, 1/31/29 | 25,000 | 25,661 |
| Viatris, Inc. company guaranty sr. unsec. notes | | |
| 2.30%, 6/22/27 | 25,000 | 22,673 |
| Zoetis, Inc. sr. unsec. notes 3.90%, 8/20/28 | 26,000 | 25,441 |
| Zoetis, Inc. sr. unsec. sub. notes 2.00%, 5/15/30 | 9,000 | 7,750 |
| | | 883,166 |
| Technology (0.9%) | | |
| Ahead DB Holdings, LLC 144A company guaranty | | |
| sr. unsec. notes 6.625%, 5/1/28 | 5,000 | 4,356 |
| Apple, Inc. sr. unsec. bonds 2.80%, 2/8/61 | 20,000 | 13,597 |
| Apple, Inc. sr. unsec. notes 3.00%, 11/13/27 | 40,000 | 38,385 |
| |
| Putnam VT Global Asset Allocation Fund 19 |
| | |
| | Principal | |
| CORPORATE BONDS AND NOTES (12.6%)* cont. | amount | Value |
| | | |
| Technology cont. | | |
| Apple, Inc. sr. unsec. unsub. notes | | |
| 4.375%, 5/13/45 | $80,000 | $75,861 |
| Apple, Inc. sr. unsec. unsub. notes 3.85%, 5/4/43 | 27,000 | 24,035 |
| Arches Buyer, Inc. 144A sr. notes 4.25%, 6/1/28 | 30,000 | 27,169 |
| Arches Buyer, Inc. 144A sr. unsec. notes | | |
| 6.125%, 12/1/28 | 5,000 | 4,325 |
| Boxer Parent Co., Inc. 144A company guaranty sr. | | |
| notes 7.125%, 10/2/25 | 5,000 | 5,027 |
| Broadcom Corp./Broadcom Cayman Finance, | | |
| Ltd. company guaranty sr. unsec. unsub. notes | | |
| 3.875%, 1/15/27 | 73,000 | 71,241 |
| Broadcom Corp./Broadcom Cayman Finance, | | |
| Ltd. company guaranty sr. unsec. unsub. notes | | |
| 3.50%, 1/15/28 | 90,000 | 86,310 |
| Central Parent, Inc./CDK Global, Inc. 144A | | |
| company guaranty sr. notes 7.25%, 6/15/29 | 10,000 | 10,199 |
| Clarivate Science Holdings Corp. 144A sr. unsec. | | |
| notes 4.875%, 7/1/29 | 10,000 | 9,383 |
| Cloud Software Group, Inc. 144A notes | | |
| 9.00%, 9/30/29 | 15,000 | 14,250 |
| Cloud Software Group, Inc. 144A sr. notes. | | |
| 6.50%, 3/31/29 | 40,000 | 38,098 |
| CommScope Finance, LLC 144A sr. notes | | |
| 6.00%, 3/1/26 | 5,000 | 4,457 |
| CommScope Technologies, LLC 144A company | | |
| guaranty sr. unsec. notes 6.00%, 6/15/25 | 3,000 | 2,445 |
| CrowdStrike Holdings, Inc. company guaranty sr. | | |
| unsec. notes 3.00%, 2/15/29 | 20,000 | 18,075 |
| Gen Digital, Inc. 144A company guaranty sr. | | |
| unsec. unsub. notes 6.75%, 9/30/27 | 10,000 | 10,138 |
| Imola Merger Corp. 144A sr. notes 4.75%, 5/15/29 | 20,000 | 19,002 |
| Meta Platforms, Inc. sr. unsec. bonds | | |
| 5.60%, 5/15/53 | 17,000 | 18,425 |
| Meta Platforms, Inc. sr. unsec. notes | | |
| 4.95%, 5/15/33 | 25,000 | 25,803 |
| Meta Platforms, Inc. sr. unsec. unsub. bonds | | |
| 4.45%, 8/15/52 | 21,000 | 19,295 |
| Meta Platforms, Inc. sr. unsec. unsub. notes | | |
| 3.50%, 8/15/27 | 42,000 | 40,898 |
| Microsoft Corp. sr. unsec. unsub. bonds | | |
| 2.525%, 6/1/50 | 25,000 | 17,067 |
| Microsoft Corp. sr. unsec. unsub. notes | | |
| 3.30%, 2/6/27 | 10,000 | 9,739 |
| MSCI, Inc. 144A company guaranty sr. unsec. | | |
| notes 3.625%, 9/1/30 | 12,000 | 10,858 |
| Oracle Corp. sr. unsec. notes 2.95%, 4/1/30 | 45,000 | 40,615 |
| Oracle Corp. sr. unsec. unsub. bonds | | |
| 4.00%, 11/15/47 | 50,000 | 39,604 |
| Oracle Corp. sr. unsec. unsub. notes | | |
| 5.375%, 7/15/40 | 35,000 | 34,390 |
| RingCentral, Inc. 144A sr. unsec. notes | | |
| 8.50%, 8/15/30 | 15,000 | 15,319 |
| Rocket Software, Inc. 144A sr. unsec. notes | | |
| 6.50%, 2/15/29 | 25,000 | 21,750 |
| salesforce.com, Inc. sr. unsec. bonds | | |
| 3.05%, 7/15/61 | 30,000 | 21,046 |
| salesforce.com, Inc. sr. unsec. bonds | | |
| 2.90%, 7/15/51 | 30,000 | 21,451 |
| Seagate HDD Cayman company guaranty sr. | | |
| unsec. notes 9.625%, 12/1/32 (Cayman Islands) | 5,000 | 5,718 |
| Sensata Technologies, Inc. 144A company | | |
| guaranty sr. unsec. notes 3.75%, 2/15/31 | 20,000 | 17,615 |
| ServiceNow, Inc. sr. unsec. notes 1.40%, 9/1/30 | 30,000 | 24,663 |
| | |
| | Principal | |
| CORPORATE BONDS AND NOTES (12.6%)* cont. | amount | Value |
| | | |
| Technology cont. | | |
| TTM Technologies, Inc. 144A company guaranty | | |
| sr. unsec. notes 4.00%, 3/1/29 | $15,000 | $13,613 |
| Twilio, Inc. company guaranty sr. unsec. notes | | |
| 3.875%, 3/15/31 | 25,000 | 22,263 |
| Twilio, Inc. company guaranty sr. unsec. notes | | |
| 3.625%, 3/15/29 | 15,000 | 13,684 |
| ZoomInfo Technologies, LLC/ZoomInfo Finance | | |
| Corp. 144A company guaranty sr. unsec. notes | | |
| 3.875%, 2/1/29 | 25,000 | 22,675 |
| | | 932,844 |
| Transportation (0.2%) | | |
| American Airlines, Inc./AAdvantage Loyalty | | |
| IP, Ltd. 144A company guaranty sr. notes | | |
| 5.75%, 4/20/29 | 10,000 | 9,748 |
| American Airlines, Inc./AAdvantage Loyalty | | |
| IP, Ltd. 144A company guaranty sr. notes | | |
| 5.50%, 4/20/26 | 8,333 | 8,273 |
| CSX Corp. sr. unsec. unsub. notes 4.10%, 3/15/44 | 70,000 | 61,165 |
| Penske Truck Leasing Co. LP/PTL Finance Corp. | | |
| 144A sr. unsec. bonds 3.40%, 11/15/26 | 16,000 | 15,162 |
| Penske Truck Leasing Co. LP/PTL Finance Corp. | | |
| 144A sr. unsec. notes 4.40%, 7/1/27 | 10,000 | 9,750 |
| Penske Truck Leasing Co. LP/PTL Finance Corp. | | |
| 144A sr. unsec. notes 3.90%, 2/1/24 | 20,000 | 19,960 |
| United Airlines, Inc. 144A company guaranty sr. | | |
| notes 4.625%, 4/15/29 | 5,000 | 4,676 |
| United Airlines, Inc. 144A company guaranty sr. | | |
| notes 4.375%, 4/15/26 | 5,000 | 4,872 |
| Watco Cos., LLC/Watco Finance Corp. 144A sr. | | |
| unsec. notes 6.50%, 6/15/27 | 25,000 | 25,000 |
| | | 158,606 |
| Utilities and power (1.0%) | | |
| AES Corp. (The) sr. unsec. notes 1.375%, 1/15/26 | 24,000 | 22,207 |
| AES Corp. (The) sr. unsec. unsub. notes | | |
| 2.45%, 1/15/31 | 25,000 | 21,001 |
| Ameren Corp. sr. unsec. unsub. notes | | |
| 5.00%, 1/15/29 | 10,000 | 10,045 |
| American Electric Power Co., Inc. sr. unsec. | | |
| unsub. notes Ser. J, 4.30%, 12/1/28 | 55,000 | 53,773 |
| American Transmission Systems, Inc. 144A sr. | | |
| unsec. bonds 2.65%, 1/15/32 | 10,000 | 8,460 |
| Buckeye Partners LP sr. unsec. notes | | |
| 3.95%, 12/1/26 | 5,000 | 4,725 |
| Buckeye Partners LP 144A sr. unsec. notes | | |
| 4.50%, 3/1/28 | 10,000 | 9,422 |
| Calpine Corp. 144A company guaranty sr. notes | | |
| 5.25%, 6/1/26 | 4,000 | 3,947 |
| Calpine Corp. 144A sr. unsec. notes | | |
| 5.00%, 2/1/31 | 10,000 | 9,167 |
| Calpine Corp. 144A sr. unsec. notes | | |
| 4.625%, 2/1/29 | 5,000 | 4,644 |
| Commonwealth Edison Co. 1st mtge. bonds | | |
| 5.90%, 3/15/36 | 28,000 | 30,255 |
| Consolidated Edison Co. of New York, Inc. sr. | | |
| unsec. unsub. notes 4.20%, 3/15/42 | 45,000 | 38,888 |
| Duke Energy Carolinas, LLC sr. notes | | |
| 4.95%, 1/15/33 | 10,000 | 10,185 |
| Duke Energy Corp. sr. unsec. bonds | | |
| 4.20%, 6/15/49 | 70,000 | 56,934 |
| Duke Energy Corp. sr. unsec. notes | | |
| 3.15%, 8/15/27 | 55,000 | 51,978 |
| Duke Energy Indiana LLC sr. bonds 6.45%, 4/1/39 | 5,000 | 5,603 |
| |
| 20 Putnam VT Global Asset Allocation Fund |
| | |
| | Principal | |
| CORPORATE BONDS AND NOTES (12.6%)* cont. | amount | Value |
| | | |
| Utilities and power cont. | | |
| Enbridge, Inc. company guaranty sr. unsec. | | |
| unsub. bonds 4.50%, 6/10/44 (Canada) | $15,000 | $12,806 |
| Enbridge, Inc. sr. unsec. unsub. bonds 4.25%, | | |
| 12/1/26 (Canada) | 30,000 | 29,596 |
| Energy Transfer LP company guaranty sr. unsec. | | |
| bonds 3.75%, 5/15/30 | 30,000 | 27,859 |
| Energy Transfer LP company guaranty sr. unsec. | | |
| notes 5.50%, 6/1/27 | 6,000 | 6,073 |
| Energy Transfer LP company guaranty sr. unsec. | | |
| notes 2.90%, 5/15/25 | 37,000 | 35,851 |
| Energy Transfer LP jr. unsec. sub. FRN 6.625%, | | |
| perpetual maturity | 91,000 | 75,985 |
| Enterprise Products Operating, LLC company | | |
| guaranty sr. unsec. notes 2.80%, 1/31/30 | 4,000 | 3,617 |
| Enterprise Products Operating, LLC company | | |
| guaranty sr. unsec. unsub. bonds 4.25%, 2/15/48 | 90,000 | 79,036 |
| Evergy Kansas Central, Inc. sr. bonds | | |
| 5.70%, 3/15/53 | 15,000 | 15,747 |
| Evergy Missouri West, Inc. 144A sr. notes | | |
| 5.15%, 12/15/27 | 30,000 | 30,179 |
| Eversource Energy sr. unsec. unsub. notes | | |
| 5.45%, 3/1/28 | 5,000 | 5,139 |
| IPALCO Enterprises, Inc. sr. notes 4.25%, 5/1/30 | 25,000 | 23,098 |
| IPALCO Enterprises, Inc. sr. sub. notes | | |
| 3.70%, 9/1/24 | 5,000 | 4,921 |
| Kinder Morgan, Inc. company guaranty sr. unsec. | | |
| notes Ser. GMTN, 7.75%, 1/15/32 | 15,000 | 17,053 |
| Kinder Morgan, Inc. company guaranty sr. unsec. | | |
| unsub. notes 1.75%, 11/15/26 | 10,000 | 9,199 |
| NextEra Energy Capital Holdings, Inc. company | | |
| guaranty sr. unsec. unsub. notes 6.051%, 3/1/25 | 15,000 | 15,134 |
| NextEra Energy Capital Holdings, Inc. company | | |
| guaranty sr. unsec. unsub. notes 5.749%, 9/1/25 | 50,000 | 50,473 |
| NRG Energy, Inc. 144A company guaranty sr. | | |
| notes 3.75%, 6/15/24 | 21,000 | 20,756 |
| NRG Energy, Inc. 144A jr. unsec. sub. FRB 10.25%, | | |
| perpetual maturity | 5,000 | 5,205 |
| Oncor Electric Delivery Co., LLC sr. notes | | |
| 3.75%, 4/1/45 | 75,000 | 62,165 |
| Pacific Gas and Electric Co. company guaranty | | |
| sr. unsec. unsub. notes 2.95%, 3/1/26 | 5,000 | 4,736 |
| Pacific Gas and Electric Co. notes 2.10%, 8/1/27 | 5,000 | 4,506 |
| Pacific Gas and Electric Co. sr. notes | | |
| 6.10%, 1/15/29 | 50,000 | 51,740 |
| PG&E Corp. sr. sub. notes 5.25%, 7/1/30 | 15,000 | 14,468 |
| Public Service Electric & Gas Co. sr. notes | | |
| Ser. MTN, 5.50%, 3/1/40 | 25,000 | 25,828 |
| Puget Sound Energy, Inc. sr. bonds | | |
| 5.448%, 6/1/53 | 15,000 | 15,570 |
| Vistra Corp. 144A jr. unsec. sub. FRN | | |
| 8.00%, 10/15/51 | 5,000 | 4,978 |
| Vistra Corp. 144A jr. unsec. sub. FRN 7.00%, | | |
| perpetual maturity | 5,000 | 4,925 |
| Vistra Operations Co., LLC 144A company | | |
| guaranty sr. notes 4.30%, 7/15/29 | 17,000 | 15,906 |
| Vistra Operations Co., LLC 144A company | | |
| guaranty sr. notes 3.55%, 7/15/24 | 18,000 | 17,747 |
| Vistra Operations Co., LLC 144A company | | |
| guaranty sr. unsec. sub. notes 5.00%, 7/31/27 | 5,000 | 4,868 |
| Vistra Operations Co., LLC 144A sr. bonds | | |
| 6.95%, 10/15/33 | 5,000 | 5,262 |
| Vistra Operations Co., LLC 144A sr. unsec. notes | | |
| 7.75%, 10/15/31 | 5,000 | 5,193 |
| | | 1,046,853 |
| | |
| Total corporate bonds and notes (cost $13,395,694) | $12,656,741 |
| | |
| U.S. GOVERNMENT AND AGENCY | Principal | |
| MORTGAGE OBLIGATIONS (10.7%)* | amount | Value |
| | |
| U.S. Government Guaranteed Mortgage Obligations (2.7%) | |
| Government National Mortgage Association | | |
| Pass-Through Certificates | | |
| 6.50%, with due dates from | | |
| 5/20/37 to 11/20/39 | $104,231 | $109,861 |
| 5.50%, with due dates from 6/20/53 to 7/20/53 | 786,646 | 798,962 |
| 3.00%, TBA, 1/1/54 | 1,000,000 | 905,968 |
| 3.00%, with due dates from 8/20/49 to 4/20/51 | 932,162 | 850,136 |
| | | 2,664,927 |
| U.S. Government Agency Mortgage Obligations (8.0%) | |
| Federal Home Loan Mortgage Corporation | | |
| Pass-Through Certificates | | |
| 6.50%, 5/1/53 | 24,846 | 25,543 |
| 3.00%, 1/1/48 | 595,428 | 537,970 |
| Federal National Mortgage Association | | |
| Pass-Through Certificates | | |
| 5.00%, 9/1/52 | 913,835 | 907,583 |
| 4.00%, 1/1/57 | 33,421 | 31,429 |
| 4.00%, 1/1/49 | 91,319 | 87,731 |
| 3.00%, with due dates from 4/1/46 to 11/1/48 | 388,765 | 351,866 |
| 2.50%, 7/1/51 | 830,789 | 707,558 |
| Uniform Mortgage-Backed Securities | | |
| 5.00%, TBA, 1/1/54 | 1,000,000 | 990,000 |
| 3.50%, TBA, 1/1/54 | 1,000,000 | 917,969 |
| 2.50%, TBA, 1/1/54 | 3,000,000 | 2,555,156 |
| 2.50%, TBA, 1/1/39 | 1,000,000 | 921,953 |
| | | 8,034,758 |
| Total U.S. government and agency mortgage obligations | |
| (cost $10,830,406) | | $10,699,685 |
| | |
| | Principal | |
| MORTGAGE-BACKED SECURITIES (2.4%)* | amount | Value |
| | | |
| Agency collateralized mortgage obligations (—%) | | |
| Federal Home Loan Mortgage Corporation | | |
| REMICs IFB Ser. 3408, Class EK, ((-4.024 | | |
| x US 30 Day Average SOFR) + 25.33%), | | |
| 3.851%, 4/15/37 | $3,740 | $4,398 |
| REMICs IFB Ser. 3065, Class DC, ((-3 x US 30 Day | | |
| Average SOFR) + 19.52%), 3.501%, 3/15/35 | 10,477 | 10,853 |
| Government National Mortgage Association | | |
| Ser. 10-9, Class UI, IO, 5.00%, 1/20/40 | 19,759 | 4,106 |
| Ser. 13-14, IO, 3.50%, 12/20/42 | 52,326 | 6,247 |
| Ser. 16-H16, Class EI, IO, 0.693%, 6/20/66 W | 90,082 | 3,414 |
| Ser. 15-H26, Class DI, IO, 0.468%, 10/20/65 W | 138,914 | 5,680 |
| | | 34,698 |
| Commercial mortgage-backed securities (1.1%) | | |
| ACRE Commercial Mortgage, Ltd. 144A | | |
| FRB Ser. 21-FL4, Class A, 6.303%, 12/18/37 | | |
| (Cayman Islands) | 16,379 | 16,092 |
| Banc of America Commercial Mortgage Trust | | |
| Ser. 15-UBS7, Class AS, 3.989%, 9/15/48 W | 14,000 | 13,105 |
| FRB Ser. 07-1, Class XW, IO, 0.313%, 1/15/49 W | 14,184 | 39 |
| BANK FRB Ser. 17-BNK8, Class B, | | |
| 3.95%, 11/15/50 W | 12,000 | 9,919 |
| Barclays Commercial Mortgage Trust Ser. 19-C3, | | |
| Class C, 4.178%, 5/15/52 | 22,000 | 16,607 |
| CD Commercial Mortgage Trust FRB Ser. 17-CD6, | | |
| Class B, 3.911%, 11/13/50 W | 14,000 | 11,550 |
| CFCRE Commercial Mortgage Trust FRB | | |
| Ser. 17-C8, Class B, 4.199%, 6/15/50 W | 14,000 | 12,312 |
| Citigroup Commercial Mortgage Trust | | |
| Ser. 14-GC21, Class B, 4.328%, 5/10/47 W | 44,000 | 40,756 |
| Ser. 16-C3, Class A4, 3.154%, 11/15/49 | 21,000 | 19,646 |
| |
| Putnam VT Global Asset Allocation Fund 21 |
| | |
| | Principal | |
| MORTGAGE-BACKED SECURITIES (2.4%)* cont. | amount | Value |
| | | |
| Commercial mortgage-backed securities cont. | | |
| COMM Mortgage Trust | | |
| FRB Ser. 12-LC4, Class C, 5.294%, 12/10/44 W | $29,000 | $23,250 |
| FRB Ser. 13-CR13, Class C, 4.991%, 11/10/46 W | 27,000 | 24,734 |
| FRB Ser. 14-CR17, Class C, 4.732%, 5/10/47 W | 33,000 | 27,575 |
| Ser. 14-UBS2, Class B, 4.701%, 3/10/47 | 75,000 | 71,249 |
| Ser. 14-CR19, Class B, 4.629%, 8/10/47 W | 16,000 | 15,376 |
| FRB Ser. 15-CR26, Class C, 4.465%, 10/10/48 W | 24,000 | 22,204 |
| FRB Ser. 14-UBS6, Class C, 4.433%, 12/10/47 W | 16,000 | 13,538 |
| FRB Ser. 16-COR1, Class C, 4.326%, 10/10/49 W | 19,000 | 14,979 |
| FRB Ser. 15-LC19, Class B, 3.829%, 2/10/48 W | 18,000 | 16,183 |
| FRB Ser. 14-CR20, Class XA, IO, | | |
| 0.924%, 11/10/47 W | 238,077 | 743 |
| FRB Ser. 14-UBS6, Class XA, IO, | | |
| 0.819%, 12/10/47 W | 672,381 | 2,527 |
| FRB Ser. 14-LC17, Class XA, IO, | | |
| 0.646%, 10/10/47 W | 373,932 | 831 |
| Credit Suisse Commercial Mortgage Trust 144A | | |
| FRB Ser. 07-C2, Class AX, IO, 0.013%, 1/15/49 W | 476,662 | 3 |
| CSAIL Commercial Mortgage Trust | | |
| Ser. 15-C1, Class B, 4.044%, 4/15/50 W | 30,000 | 27,973 |
| Ser. 16-C7, Class AS, 3.958%, 11/15/49 W | 15,000 | 13,919 |
| Ser. 19-C17, Class AS, 3.278%, 9/15/52 | 49,000 | 41,574 |
| FRB Ser. 20-C19, Class XA, IO, | | |
| 1.099%, 3/15/53 W | 1,031,210 | 52,415 |
| CSMC Trust | | |
| FRB Ser. 16-NXSR, Class C, 4.425%, 12/15/49 W | 28,000 | 21,103 |
| FRB Ser. 16-NXSR, Class XA, IO, | | |
| 0.678%, 12/15/49 W | 871,904 | 12,754 |
| GS Mortgage Securities Trust | | |
| FRB Ser. 14-GC22, Class C, 4.685%, 6/10/47 W | 14,000 | 8,764 |
| FRB Ser. 15-GC32, Class B, 4.39%, 7/10/48 W | 73,000 | 69,345 |
| FRB Ser. 15-GC30, Class C, 4.068%, 5/10/50 W | 37,000 | 28,428 |
| JPMBB Commercial Mortgage Securities Trust | | |
| FRB Ser. 14-C22, Class C, 4.559%, 9/15/47 W | 13,000 | 9,930 |
| FRB Ser. 14-C19, Class B, 4.394%, 4/15/47 W | 28,000 | 27,524 |
| JPMDB Commercial Mortgage Securities Trust | | |
| FRB Ser. 18-C8, Class C, 4.764%, 6/15/51 W | 11,000 | 8,772 |
| FRB Ser. 18-C8, Class XA, IO, 0.605%, 6/15/51 W | 900,439 | 17,359 |
| JPMorgan Chase Commercial Mortgage | | |
| Securities Trust | | |
| Ser. 06-LDP9, Class AMS, 5.337%, 5/15/47 | 6,187 | 5,941 |
| FRB Ser. 13-C16, Class C, 4.854%, 12/15/46 W | 22,000 | 19,324 |
| LB-UBS Commercial Mortgage Trust 144A FRB | | |
| Ser. 06-C6, Class XCL, IO, 0.435%, 9/15/39 W | 216,572 | 805 |
| Morgan Stanley Bank of America Merrill | | |
| Lynch Trust | | |
| FRB Ser. 14-C14, Class C, 5.037%, 2/15/47 W | 33,000 | 32,274 |
| FRB Ser. 14-C14, Class B, 4.847%, 2/15/47 W | 13,000 | 12,891 |
| FRB Ser. 15-C24, Class B, 4.323%, 5/15/48 W | 10,000 | 9,486 |
| FRB Ser. 15-C22, Class C, 4.20%, 4/15/48 W | 20,000 | 17,960 |
| Ser. 14-C19, Class C, 4.00%, 12/15/47 | 20,000 | 18,508 |
| FRB Ser. 13-C10, Class AS, 3.997%, 7/15/46 W | 2,919 | 2,789 |
| Ser. 16-C32, Class AS, 3.994%, 12/15/49 W | 22,000 | 20,227 |
| FRB Ser. 15-C26, Class XA, IO, | | |
| 0.963%, 10/15/48 W | 551,189 | 4,842 |
| FRB Ser. 14-C17, Class XA, IO, 0.875%, 8/15/47 W | 109,393 | 104 |
| Morgan Stanley Bank of America Merrill | | |
| Lynch Trust 144A FRB Ser. 12-C5, Class E, | | |
| 4.633%, 8/15/45 W | 15,000 | 13,521 |
| | |
| | Principal | |
| MORTGAGE-BACKED SECURITIES (2.4%)* cont. | amount | Value |
| | | |
| Commercial mortgage-backed securities cont. | | |
| Morgan Stanley Capital I Trust | | |
| Ser. 15-UBS8, Class B, 4.315%, 12/15/48 W | $16,000 | $13,386 |
| FRB Ser. 18-H3, Class XA, IO, 0.80%, 7/15/51 W | 1,358,602 | 37,615 |
| Ready Capital Mortgage Financing, LLC 144A | | |
| FRB Ser. 22-FL9, Class A, 7.823%, 6/25/37 | 20,198 | 20,183 |
| FRB Ser. 22-FL8, Class AS, 7.437%, 1/25/37 | 16,000 | 16,000 |
| FRB Ser. 21-FL7, Class A, 6.67%, 11/25/36 | 17,292 | 17,148 |
| Shelter Growth CRE Issuer, Ltd. 144A FRB | | |
| Ser. 21-FL3, Class A, 6.556%, 9/15/36 | | |
| (Cayman Islands) | 16,894 | 16,845 |
| Wells Fargo Commercial Mortgage Trust | | |
| FRB Ser. 16-NXS5, Class C, 4.977%, 1/15/59 W | 10,000 | 7,929 |
| FRB Ser. 15-SG1, Class B, 4.452%, 9/15/48 W | 18,000 | 16,155 |
| Ser. 15-LC20, Class C, 4.056%, 4/15/50 W | 17,000 | 15,373 |
| FRB Ser. 20-C57, Class C, 4.023%, 8/15/53 W | 16,000 | 13,162 |
| FRB Ser. 13-LC12, Class C, 3.954%, 7/15/46 W | 14,000 | 9,644 |
| WF-RBS Commercial Mortgage Trust | | |
| Ser. 14-LC14, Class C, 4.344%, 3/15/47 W | 13,000 | 11,770 |
| FRB Ser. 13-C11, Class C, 3.998%, 3/15/45 W | 47,000 | 38,621 |
| WF-RBS Commercial Mortgage Trust 144A | | |
| FRB Ser. 11-C3, Class D, 5.855%, 3/15/44 | | |
| (In default) † W | 8,056 | 2,335 |
| FRB Ser. 13-C15, Class D, 4.204%, 8/15/46 W | 43,000 | 10,223 |
| | | 1,118,139 |
| Residential mortgage-backed securities (non-agency) (1.3%) | |
| Citigroup Mortgage Loan Trust, Inc. FRB | | |
| Ser. 05-2, Class 1A2A, 5.31%, 5/25/35 W | 5,415 | 5,257 |
| Countrywide Alternative Loan Trust | | |
| FRB Ser. 06-OA7, Class 1A2, (Federal Reserve | | |
| US 12 Month Cumulative Avg 1 yr CMT + 0.94%), | | |
| 5.952%, 6/25/46 | 41,022 | 34,312 |
| FRB Ser. 06-OA10, Class 4A1, (CME Term SOFR | | |
| 1 Month + 0.49%), 5.85%, 8/25/46 | 63,892 | 54,011 |
| Ellington Financial Mortgage Trust 144A | | |
| Ser. 20-2, Class A2, 1.486%, 10/25/65 W | 24,032 | 21,469 |
| Federal Home Loan Mortgage Corporation | | |
| Structured Agency Credit Risk Debt FRN | | |
| Ser. 16-DNA2, Class M3, (US 30 Day Average SOFR | | |
| + 4.76%), 10.102%, 10/25/28 | 48,277 | 50,723 |
| Federal Home Loan Mortgage Corporation 144A | | |
| Structured Agency Credit Risk Trust REMICs | | |
| FRB Ser. 20-DNA5, Class B1, (US 30 Day Average | | |
| SOFR + 4.80%), 10.137%, 10/25/50 | 54,000 | 60,514 |
| Structured Agency Credit Risk Debt FRN | | |
| Ser. 22-DNA5, Class M1A, (US 30 Day Average | | |
| SOFR + 2.95%), 8.287%, 6/25/42 | 14,000 | 14,334 |
| Structured Agency Credit Risk Debt FRN | | |
| Ser. 21-DNA2, Class M2, (US 30 Day Average | | |
| SOFR + 2.30%), 7.637%, 8/25/33 | 97,774 | 98,693 |
| Structured Agency Credit Risk Trust REMICs | | |
| FRB Ser. 20-DNA6, Class M2, (US 30 Day | | |
| Average SOFR + 2.00%), 7.337%, 12/25/50 | 69,514 | 70,464 |
| Structured Agency Credit Risk Trust REMICs | | |
| FRB Ser. 22-DNA3, Class M1A, (US 30 Day | | |
| Average SOFR + 2.00%), 7.337%, 4/25/42 | 52,815 | 53,295 |
| Structured Agency Credit Risk Trust REMICs | | |
| FRB Ser. 22-DNA1, Class M1B, (US 30 Day | | |
| Average SOFR + 1.85%), 7.187%, 1/25/42 | 74,000 | 73,980 |
| Structured Agency Credit Risk Debt FRN | | |
| Ser. 22-DNA2, Class M1A, (US 30 Day Average | | |
| SOFR + 1.30%), 6.637%, 2/25/42 | 57,717 | 57,717 |
| |
| 22 Putnam VT Global Asset Allocation Fund |
| | |
| | Principal | |
| MORTGAGE-BACKED SECURITIES (2.4%)* cont. | amount | Value |
| | |
| Residential mortgage-backed securities (non-agency) cont. | |
| Federal Home Loan Mortgage Corporation 144A | | |
| Structured Agency Credit Risk Trust REMICs | | |
| FRB Ser. 21-HQA3, Class M1, (US 30 Day | | |
| Average SOFR + 0.85%), 6.187%, 9/25/41 | $25,681 | $25,440 |
| Seasoned Credit Risk Transfer Trust FRB | | |
| Ser. 17-2, Class 2, 4.00%, 8/25/56 W | 43,505 | 42,398 |
| Federal National Mortgage Association | | |
| Connecticut Avenue Securities FRB | | |
| Ser. 16-C01, Class 2M2, (US 30 Day Average | | |
| SOFR + 7.06%), 12.402%, 8/25/28 | 22,403 | 23,523 |
| Connecticut Avenue Securities FRB | | |
| Ser. 16-C01, Class 1M2, (US 30 Day Average | | |
| SOFR + 6.86%), 12.202%, 8/25/28 | 35,324 | 37,772 |
| Connecticut Avenue Securities FRB | | |
| Ser. 16-C03, Class 2M2, (US 30 Day Average | | |
| SOFR + 6.01%), 11.352%, 10/25/28 | 4,233 | 4,508 |
| Connecticut Avenue Securities FRB | | |
| Ser. 16-C05, Class 2M2, (US 30 Day Average | | |
| SOFR + 4.56%), 9.902%, 1/25/29 | 49,606 | 51,977 |
| Connecticut Avenue Securities FRB | | |
| Ser. 16-C07, Class 2M2, (US 30 Day Average | | |
| SOFR + 4.46%), 9.802%, 5/25/29 | 75,461 | 79,631 |
| Connecticut Avenue Securities FRB | | |
| Ser. 16-C06, Class 1M2, (US 30 Day Average | | |
| SOFR + 4.36%), 9.702%, 4/25/29 | 32,554 | 34,137 |
| Connecticut Avenue Securities FRB | | |
| Ser. 17-C02, Class 2M2C, (US 30 Day Average | | |
| SOFR + 3.76%), 9.102%, 9/25/29 | 56,000 | 58,435 |
| Connecticut Avenue Securities FRB | | |
| Ser. 17-C01, Class 1M2, (US 30 Day Average | | |
| SOFR + 3.66%), 9.002%, 7/25/29 | 61,264 | 63,499 |
| Connecticut Avenue Securities FRB | | |
| Ser. 14-C03, Class 2M2, (US 30 Day Average | | |
| SOFR + 3.01%), 8.352%, 7/25/24 | 1,630 | 1,642 |
| Connecticut Avenue Securities Trust FRB | | |
| Ser. 18-C05, Class 1M2, (US 30 Day Average | | |
| SOFR + 2.46%), 7.802%, 1/25/31 | 14,360 | 14,710 |
| Federal National Mortgage Association 144A | | |
| Connecticut Avenue Securities FRB | | |
| Ser. 21-R02, Class 2M1, (US 30 Day Average | | |
| SOFR + 0.90%), 6.237%, 11/25/41 | 8,438 | 8,415 |
| Connecticut Avenue Securities Trust FRB | | |
| Ser. 21-R01, Class 1M1, (US 30 Day Average | | |
| SOFR + 0.75%), 6.087%, 10/25/41 | 2,681 | 2,688 |
| Long Beach Mortgage Loan Trust FRB Ser. 04-1, | | |
| Class A2, (CME Term SOFR 1 Month + 0.91%), | | |
| 6.27%, 2/25/34 | 15,455 | 15,185 |
| New Century Home Equity Loan Trust FRB | | |
| Ser. 03-4, Class M1, (CME Term SOFR 1 Month | | |
| + 1.24%), 6.595%, 10/25/33 | 26,660 | 25,497 |
| Park Place Securities, Inc. Asset-Backed | | |
| Pass-Through Certificates FRB Ser. 04-WCW2, | | |
| Class M3, (CME Term SOFR 1 Month + 1.16%), | | |
| 6.52%, 10/25/34 | 13,971 | 13,614 |
| RMF Buyout Issuance Trust 144A Ser. 20-HB1, | | |
| Class A1, 1.719%, 10/25/50 W | 58,862 | 49,655 |
| Verus Securitization Trust 144A Ser. 20-5, | | |
| Class A2, 1.578%, 5/25/65 | 31,080 | 28,826 |
| Visio Trust 144A Ser. 20-1, Class A3, | | |
| 3.521%, 8/25/55 W | 117,000 | 104,689 |
| WaMu Mortgage Pass-Through Certificates Trust | | |
| FRB Ser. 05-AR9, Class A1C3, (CME Term SOFR | | |
| 1 Month + 1.07%), 6.43%, 7/25/45 | 15,318 | 14,527 |
| | | 1,295,537 |
| | |
| Total mortgage-backed securities (cost $2,628,353) | $2,448,374 |
| | |
| FOREIGN GOVERNMENT AND AGENCY | Principal | |
| BONDS AND NOTES (0.4%)* | amount | Value |
| | | |
| Dominican (Republic of) sr. unsec. | | |
| unsub. notes Ser. REGS, 5.50%, | | |
| 1/27/25 (Dominican Republic) | $130,000 | $129,350 |
| Indonesia (Republic of) sr. unsec. | | |
| unsub. notes 4.65%, 9/20/32 | | |
| (Indonesia) | 200,000 | 199,750 |
| Mexico (Government of) sr. unsec. | | |
| bonds 5.55%, 1/21/45 (Mexico) | 78,000 | 74,341 |
| Uruguay (Oriental Republic of) | | |
| sr. unsec. unsub. bonds 7.625%, | | |
| 3/21/36 (Uruguay) | 10,000 | 12,432 |
| Total foreign government and agency bonds and notes | |
| (cost $439,293) | | $415,873 |
| | |
| | Principal | |
| SENIOR LOANS (0.3%)*c | amount | Value |
| | | |
| AMC Entertainment Holdings, Inc. bank term | | |
| loan FRN Ser. B, (CME Term SOFR 1 Month | | |
| + 3.00%), 8.23%, 4/22/26 | $9,707 | $8,087 |
| American Airlines, Inc. bank term loan FRN (CME | | |
| Term SOFR 3 Month + 4.75%), 10.427%, 4/20/28 | 19,500 | 20,006 |
| AppleCaramel Buyer, LLC bank term loan | | |
| FRN (CME Term SOFR 1 Month + 3.75%), | | |
| 9.106%, 10/19/27 | 9,702 | 9,718 |
| Ascend Learning, LLC bank term loan FRN (CME | | |
| Term SOFR 1 Month + 5.75%), 10.98%, 11/18/29 | 5,000 | 4,273 |
| Asurion, LLC bank term loan FRN Ser. B9, (CME | | |
| Term SOFR 1 Month + 3.25%), 8.579%, 7/31/27 | 4,875 | 4,832 |
| Clear Channel Outdoor Holdings, Inc. bank | | |
| term loan FRN Ser. B, (CME Term SOFR 3 Month | | |
| + 3.50%), 8.81%, 8/21/26 | 9,897 | 9,782 |
| Cloud Software Group, Inc. bank term loan | | |
| FRN Ser. B, (CME Term SOFR 1 Month + 4.50%), | | |
| 9.99%, 3/30/29 | 4,963 | 4,838 |
| CP Atlas Buyer, Inc. bank term loan FRN | | |
| Ser. B1, (CME Term SOFR 1 Month + 3.75%), | | |
| 8.952%, 11/23/27 | 10,595 | 10,402 |
| CQP Holdco LP bank term loan FRN Ser. B, (CME | | |
| Term SOFR 1 Month + 3.00%), 8.36%, 12/31/30 | 13,298 | 13,315 |
| Crocs, Inc. bank term loan FRN Ser. B, (CME Term | | |
| SOFR 1 Month + 3.00%), 8.498%, 2/19/29 | 2,929 | 2,936 |
| DIRECTV Financing, LLC bank term loan | | |
| FRN (CME Term SOFR 3 Month + 5.00%), | | |
| 10.65%, 7/22/27 | 7,273 | 7,265 |
| Genesys Cloud Services Holdings, LLC bank | | |
| term loan FRN (CME Term SOFR 3 Month | | |
| + 4.00%), 9.47%, 12/1/27 | 9,725 | 9,756 |
| iHeartCommunications, Inc. bank term loan FRN | | |
| (CME Term SOFR 3 Month + 3.25%), 8.72%, 5/1/26 | 8,916 | 7,595 |
| IRB Holding Corp. bank term loan FRN (CME | | |
| Term SOFR 3 Month Plus CSA + 3.00%), | | |
| 8.456%, 12/15/27 | 9,825 | 9,832 |
| Klockner-Pentaplast of America, Inc. bank term | | |
| loan FRN (CME Term SOFR 6 Month + 4.73%), | | |
| 10.476%, 2/4/26 | 9,763 | 9,159 |
| Madison IAQ, LLC bank term loan FRN (CME Term | | |
| SOFR 1 Month + 3.25%), 8.334%, 6/15/28 | 4,936 | 4,914 |
| Mattress Firm, Inc. bank term loan FRN | | |
| Ser. B, (CME Term SOFR 3 Month + 4.25%), | | |
| 9.86%, 9/21/28 | 9,895 | 9,794 |
| Michaels Cos., Inc. (The) bank term loan | | |
| FRN (CME Term SOFR 3 Month + 4.25%), | | |
| 9.86%, 4/15/28 | 9,911 | 8,196 |
| |
| Putnam VT Global Asset Allocation Fund 23 |
| | |
| | Principal | |
| SENIOR LOANS (0.3%)*c cont. | amount | Value |
| | | |
| Neptune Bidco US, Inc. bank term loan FRN | | |
| Class C, (CME Term SOFR 1 Month + 5.00%), | | |
| 10.507%, 4/11/29 | $4,975 | $4,533 |
| Nouryon USA, LLC bank term loan FRN | | |
| Ser. B, (CME Term SOFR 1 Month + 4.00%), | | |
| 9.467%, 4/3/28 | 12,633 | 12,669 |
| Nouryon USA, LLC bank term loan FRN | | |
| Ser. B, (CME Term SOFR 1 Month + 4.00%), | | |
| 9.441%, 4/3/28 | 4,975 | 4,986 |
| One Call Corp. bank term loan FRN (CME Term | | |
| SOFR 3 Month + 5.50%), 10.81%, 4/22/27 | 4,838 | 4,161 |
| PECF USS Intermediate Holding III Corp. bank | | |
| term loan FRN Ser. B, (CME Term SOFR 1 Month | | |
| + 4.25%), 9.427%, 12/17/28 | 19,538 | 15,112 |
| PetSmart, LLC bank term loan FRN Ser. B, (CME | | |
| Term SOFR 1 Month + 3.75%), 9.206%, 1/29/28 | 13,758 | 13,586 |
| Proofpoint, Inc. bank term loan FRN Ser. B, (CME | | |
| Term SOFR 3 Month + 6.25%), 11.56%, 8/31/29 | 10,000 | 10,075 |
| Robertshaw US Holding Corp. bank term | | |
| loan FRN (CME Term SOFR 1 Month + 8.00%), | | |
| 13.448%, 2/28/27 | 5,000 | 600 |
| TK Elevator US Newco, Inc. bank term loan | | |
| FRN (CME Term SOFR 3 Month + 3.50%), | | |
| 8.871%, 7/31/27 | 4,876 | 4,883 |
| UKG, Inc. bank term loan FRN (CME Term SOFR | | |
| 3 Month + 5.25%), 10.56%, 5/3/27 | 5,000 | 5,001 |
| United Airlines, Inc. bank term loan FRN | | |
| Ser. B, (CME Term SOFR 3 Month + 3.75%), | | |
| 9.22%, 4/21/28 | 7,740 | 7,757 |
| Vertiv Group Corp. bank term loan FRN | | |
| Ser. B1, (CME Term SOFR 1 Month + 2.50%), | | |
| 7.974%, 3/2/27 | 14,223 | 14,264 |
| VM Consolidated, Inc. bank term loan FRN (CME | | |
| Term SOFR 1 Month + 3.25%), 8.72%, 3/19/28 | 12,920 | 12,966 |
| Total senior loans (cost $275,678) | | $265,293 |
| | | | |
| PURCHASED OPTIONS | | | | |
| OUTSTANDING (0.2%)* | Expiration date/ | Notional | Contract | |
| Counterparty | strike | amount | amount | Value |
| | | | | |
| Citibank, N.A. | | | | |
| S&P 500 Index (Put) | Dec-24/$4500.00 | $3,133,778 | $657 | $100,570 |
| S&P 500 Index (Put) | Jun-24/4500.00 | 3,133,778 | 657 | 50,410 |
| Total purchased options outstanding (cost $267,465) | | $150,980 |
| | |
| | Principal | |
| ASSET-BACKED SECURITIES (0.1%)* | amount | Value |
| | | |
| NewRez Warehouse Securitization Trust 144A | | |
| FRB Ser. 21-1, Class A, (CME Term SOFR 1 Month | | |
| + 0.86%), 6.22%, 5/7/24 | $39,867 | $39,792 |
| Station Place Securitization Trust 144A FRB | | |
| Ser. 23-2, Class A1, (CME Term SOFR 1 Month | | |
| + 0.95%), 6.306%, 6/29/24 | 35,000 | 34,988 |
| Towd Point Asset Trust 144A FRB Ser. 18-SL1, | | |
| Class A, (CME Term SOFR 1 Month + 0.71%), | | |
| 6.07%, 1/25/46 | 3,294 | 3,286 |
| Total asset-backed securities (cost $78,040) | | $78,066 |
| | |
| | Principal | |
| CONVERTIBLE BONDS AND NOTES (—%)* | amount | Value |
| | | |
| Nabors Industries, Inc. 144A company guaranty | | |
| cv. sr. unsec. unsub. notes 1.75%, 6/15/29 | $5,000 | $3,610 |
| Realogy Group, LLC/Realogy Co-Issuer | | |
| Corp. company guaranty cv. sr. unsec. notes | | |
| 0.25%, 6/15/26 | 11,000 | 8,622 |
| Total convertible bonds and notes (cost $13,629) | | $12,232 |
| | |
| CONVERTIBLE PREFERRED STOCKS (—%)* | Shares | Value |
| | | |
| Apollo Global Management, Inc. $3.38 cv. pfd. | 196 | $11,015 |
| Total convertible preferred stocks (cost $9,800) | | $11,015 |
| | | |
| | | Principal | |
| | | amount/ | |
| SHORT-TERM INVESTMENTS (9.1%)* | | shares | Value |
| | | | |
| Putnam Short Term Investment Fund | | | |
| Class P 5.53% L | Shares | 7,887,915 | $7,887,915 |
| State Street Institutional U.S. Government | | |
| Money Market Fund, Premier Class 5.32% P Shares | 170,000 | 170,000 |
| U.S. Treasury Bills 5.454%, 1/23/24 # | | $900,000 | 897,235 |
| U.S. Treasury Bills 5.394%, 2/22/24 # | | 200,000 | 198,513 |
| Total short-term investments (cost $9,153,485) | | $9,153,663 |
| |
| Total investments (cost $81,859,287) | | | $105,666,446 |
Key to holding’s abbreviations
| |
| CME | Chicago Mercantile Exchange |
| FRB | Floating Rate Bonds: The rate shown is the current interest rate |
| | at the close of the reporting period. Rates may be subject to a cap |
| | or floor. For certain securities, the rate may represent a fixed rate |
| | currently in place at the close of the reporting period. |
| FRN | Floating Rate Notes: The rate shown is the current interest rate or |
| | yield at the close of the reporting period. Rates may be subject to |
| | a cap or floor. For certain securities, the rate may represent a fixed |
| rate currently in place at the close of the reporting period. |
| IFB | Inverse Floating Rate Bonds, which are securities that pay interest |
| | rates that vary inversely to changes in the market interest rates. As |
| | interest rates rise, inverse floaters produce less current income. The |
| | rate shown is the current interest rate at the close of the reporting |
| | period. Rates may be subject to a cap or floor. |
| IO | Interest Only |
| REMICs | Real Estate Mortgage Investment Conduits |
| SOFR | Secured Overnight Financing Rate |
| TBA | To Be Announced Commitments |
Notes to the fund’s portfolio
Unless noted otherwise, the notes to the fund’s portfolio are for the close of the fund’s reporting period, which ran from January 1, 2023 through December 31, 2023 (the reporting period). Within the following notes to the portfolio, references to “Putnam Management” represent Putnam Investment Management, LLC, the fund’s manager, an indirect wholly-owned subsidiary of Franklin Resources, Inc., and references to “ASC 820” represent Accounting Standards Codification 820 Fair Value Measurements and Disclosures.
* Percentages indicated are based on net assets of $100,235,118.
† This security is non-income-producing.
‡‡ Income may be received in cash or additional securities at the discretion of the issuer. The rate shown in parenthesis is the rate paid in kind, if applicable.
# This security, in part or in entirety, was pledged and segregated with the broker to cover margin requirements for futures contracts at the close of the reporting period. Collateral at period end totaled $1,071,139 and is included in Investments in securities on the Statement of assets and liabilities (Notes 1 and 9).
c Senior loans are exempt from registration under the Securities Act of 1933, as amended, but contain certain restrictions on resale and cannot be sold publicly. These loans pay interest at rates which adjust periodically. The interest rates shown for senior loans are the current interest rates at the close of the reporting period. Senior loans are also subject to mandatory and/or optional prepayment which cannot be predicted. As a result, the remaining maturity may be substantially less than the stated maturity shown (Notes 1 and 7).
L Affiliated company (Note 5). The rate quoted in the security description is the annualized 7-day yield of the fund at the close of the reporting period.
| |
| 24 Putnam VT Global Asset Allocation Fund |
P This security was pledged, or purchased with cash that was pledged, to the fund for collateral on certain derivative contracts. The rate quoted in the security description is the annualized 7-day yield of the fund at the close of the reporting period.
R Real Estate Investment Trust.
W The rate shown represents the weighted average coupon associated with the underlying mortgage pools. Rates may be subject to a cap or floor.
Unless otherwise noted, the rates quoted in Short-term investments security descriptions represent the weighted average yield to maturity.
Debt obligations are considered secured unless otherwise indicated.
144A after the name of an issuer represents securities exempt from registration under Rule 144A of the Securities Act of 1933, as amended. These securities may be resold in transactions exempt from registration, normally to qualified institutional buyers.
See Note 1 to the financial statements regarding TBA commitments.
The dates shown on debt obligations are the original maturity dates.
| | | | | | |
| FORWARD CURRENCY CONTRACTS at 12/31/23 (aggregate face value $1,794,404) | | | | Unrealized |
| | | Contract | Delivery | | Aggregate | appreciation/ |
| Counterparty | Currency | type* | date | Value | face value | (depreciation) |
| Bank of America N.A. | | | | | | |
| | Canadian Dollar | Buy | 1/17/24 | $12,833 | $12,385 | $448 |
| Citibank, N.A. | | | | | | |
| | Australian Dollar | Buy | 1/17/24 | 199,482 | 187,317 | 12,165 |
| | Danish Krone | Sell | 3/20/24 | 68,419 | 66,881 | (1,538) |
| Goldman Sachs International | | | | | | |
| | Euro | Sell | 3/20/24 | 255,132 | 249,889 | (5,243) |
| | Israeli Shekel | Sell | 1/17/24 | 255,183 | 240,453 | (14,730) |
| HSBC Bank USA, National Association | | | | | | |
| | Hong Kong Dollar | Buy | 2/21/24 | 47,617 | 47,553 | 64 |
| JPMorgan Chase Bank N.A. | | | | | | |
| | Japanese Yen | Buy | 2/21/24 | 109,240 | 103,614 | 5,626 |
| | Norwegian Krone | Sell | 3/20/24 | 200,717 | 188,872 | (11,845) |
| Morgan Stanley & Co. International PLC | | | | | | |
| | British Pound | Buy | 3/20/24 | 91,555 | 90,540 | 1,015 |
| | Canadian Dollar | Buy | 1/17/24 | 75 | 73 | 2 |
| | Euro | Sell | 3/20/24 | 190,685 | 186,747 | (3,938) |
| | Swedish Krona | Buy | 3/20/24 | 191,037 | 184,004 | 7,033 |
| | Swiss Franc | Buy | 3/20/24 | 93,111 | 89,931 | 3,180 |
| NatWest Markets PLC | | | | | | |
| | Australian Dollar | Sell | 1/17/24 | 105,194 | 97,728 | (7,466) |
| State Street Bank and Trust Co. | | | | | | |
| | Singapore Dollar | Buy | 2/21/24 | 28,630 | 27,803 | 827 |
| WestPac Banking Corp. | | | | | | |
| | Canadian Dollar | Buy | 1/17/24 | 21,362 | 20,614 | 748 |
| Unrealized appreciation | | | | | | 31,108 |
| Unrealized (depreciation) | | | | | | (44,760) |
| Total | | | | | | $(13,652) |
* The exchange currency for all contracts listed is the United States Dollar.
| | | | | |
| | | | | | Unrealized |
| | Number of | Notional | | Expiration | appreciation/ |
| FUTURES CONTRACTS OUTSTANDING at 12/31/23 | contracts | amount | Value | date | (depreciation) |
| Russell 2000 Index E-Mini (Long) | 31 | $3,141,965 | $3,173,935 | Mar-24 | $223,867 |
| S&P 500 Index E-Mini (Long) | 1 | 238,492 | 241,000 | Mar-24 | 35 |
| S&P 500 Index E-Mini (Short) | 55 | 13,117,033 | 13,255,000 | Mar-24 | (440,168) |
| S&P Mid Cap 400 Index E-Mini (Long) | 1 | 278,154 | 280,950 | Mar-24 | 11 |
| U.S. Treasury Bond 30 yr (Long) | 12 | 1,499,250 | 1,499,250 | Mar-24 | 105,911 |
| U.S. Treasury Bond Ultra 30 yr (Long) | 15 | 2,003,906 | 2,003,906 | Mar-24 | 179,763 |
| U.S. Treasury Note 2 yr (Long) | 22 | 4,530,109 | 4,530,109 | Mar-24 | 42,044 |
| U.S. Treasury Note 5 yr (Long) | 38 | 4,133,391 | 4,133,391 | Mar-24 | 94,915 |
| U.S. Treasury Note 10 yr (Long) | 20 | 2,257,813 | 2,257,813 | Mar-24 | 74,127 |
| Unrealized appreciation | | | | | 720,673 |
| Unrealized (depreciation) | | | | | (440,168) |
| Total | | | | | $280,505 |
| |
| Putnam VT Global Asset Allocation Fund 25 |
| | | | |
| WRITTEN OPTIONS OUTSTANDING at 12/31/23 (premiums $48,125) | Expiration | Notional | Contract | |
| Counterparty | date/strike | amount | amount | Value |
| Citibank, N.A. | | | | |
| S&P 500 Index (Put) | Dec-24/$3500.00 | $3,133,778 | $657 | $26,066 |
| Total | | | | $26,066 |
| | | |
| TBA SALE COMMITMENTS OUTSTANDING at 12/31/23 | Principal | Settlement | |
| (proceeds receivable $1,019,297) | amount | date | Value |
| Uniform Mortgage-Backed Securities, 6.50%, 1/1/54 | $1,000,000 | 1/16/24 | $1,024,531 |
| Total | | | $1,024,531 |
| | | | | | |
| CENTRALLY CLEARED INTEREST RATE SWAP CONTRACTS OUTSTANDING at 12/31/23 | | |
| | | Upfront | | | | Unrealized |
| | | premium | Termination | Payments | Payments | appreciation/ |
| Notional amount | Value | received (paid) | date | made by fund | received by fund | (depreciation) |
| $3,942,000 | $43,244 E | $(32,241) | 3/20/26 | US SOFR — Annually | 4.40% — Annually | $11,002 |
| 2,894,000 | 31,747 E | 23,657 | 3/20/26 | 4.40% — Annually | US SOFR — Annually | (8,089) |
| 1,170,000 | 35,697 E | 30,450 | 3/20/29 | 4.10% — Annually | US SOFR — Annually | (5,247) |
| 1,375,000 | 44,083 E | (38,953) | 3/20/34 | US SOFR — Annually | 3.80% — Annually | 5,130 |
| 1,346,000 | 43,153 E | 38,111 | 3/20/34 | 3.80% — Annually | US SOFR — Annually | (5,042) |
| 380,000 | 15,595 E | (15,052) | 3/20/54 | US SOFR — Annually | 3.50% — Annually | 543 |
| 32,000 | 1,313 E | 1,266 | 3/20/54 | 3.50% — Annually | US SOFR — Annually | (47) |
| Total | | $7,238 | | | | $(1,750) |
E Extended effective date.
| | | | | | |
| OTC TOTAL RETURN SWAP CONTRACTS OUTSTANDING at 12/31/23 | | | | |
| | | Upfront | | Payments | Total return | Unrealized |
| Swap counterparty/ | | premium | Termination | received (paid) | received by | appreciation/ |
| Notional amount | Value | received (paid) | date | by fund | or paid by fund | (depreciation) |
| Barclays Bank PLC | | | | | | |
| $2,986,285 | $3,051,494 | $— | 12/16/24 | (US SOFR plus 0.40%) — | A basket (BCPUDEAL) of | $60,476 |
| | | | | Monthly | common stocks — Monthly* | |
| 2,986,004 | 3,063,165 | — | 12/16/24 | US SOFR plus 0.25% — | A basket (BCPUDEAS) of | (70,494) |
| | | | | Monthly | common stocks — Monthly* | |
| Goldman Sachs International | | | | | | |
| 4,011,673 | 4,075,216 | — | 12/15/25 | (US SOFR plus 0.40%) — | A basket (GSGLPWDL) of | 58,531 |
| | | | | Monthly | common stocks — Monthly* | |
| 3,732,334 | 3,792,928 | — | 12/15/25 | US SOFR minus 0.25% — | A basket (GSGLPWDS) of | (56,933) |
| | | | | Monthly | common stocks — Monthly* | |
| Upfront premium received | | — | | Unrealized appreciation | | 119,007 |
| Upfront premium (paid) | | — | | Unrealized (depreciation) | | (127,427) |
| Total | | $— | | Total | | $(8,420) |
* The 50 largest components, and any individual component greater than 1% of basket value, are shown below.
| | | | |
| A BASKET (BCPUDEAL) OF COMMON STOCKS | | | | |
| | | | | Percentage |
| Common stocks | Sector | Shares | Value | value |
| Toll Brothers, Inc. | Consumer cyclicals | 387 | $39,750 | 1.30% |
| Expedia Group, Inc. | Consumer cyclicals | 255 | 38,766 | 1.27% |
| Booking Holdings, Inc. | Consumer cyclicals | 11 | 38,369 | 1.26% |
| Smartsheet, Inc. Class A | Technology | 780 | 37,276 | 1.22% |
| MGIC Investment Corp. | Financials | 1,930 | 37,239 | 1.22% |
| Uber Technologies, Inc. | Consumer staples | 602 | 37,059 | 1.21% |
| Pinterest, Inc. Class A | Technology | 993 | 36,768 | 1.20% |
| NRG Energy, Inc. | Utilities and power | 701 | 36,259 | 1.19% |
| Gartner, Inc. | Consumer cyclicals | 80 | 36,111 | 1.18% |
| Vornado Realty Trust | Financials | 1,277 | 36,075 | 1.18% |
| Applied Materials, Inc. | Technology | 222 | 35,947 | 1.18% |
| Valero Energy Corp. | Energy | 272 | 35,355 | 1.16% |
| Cadence Design Systems, Inc. | Technology | 130 | 35,310 | 1.16% |
| Vertiv Holdings Co. | Capital goods | 732 | 35,171 | 1.15% |
| Targa Resources Corp. | Energy | 399 | 34,698 | 1.14% |
| American International Group, Inc. | Financials | 506 | 34,277 | 1.12% |
| |
| 26 Putnam VT Global Asset Allocation Fund |
| | | | |
| A BASKET (BCPUDEAL) OF COMMON STOCKS cont. | | | | |
| | | | | Percentage |
| Common stocks | Sector | Shares | Value | value |
| Textron, Inc. | Capital goods | 425 | $34,202 | 1.12% |
| Allison Transmission Holdings, Inc. | Capital goods | 585 | 34,027 | 1.12% |
| Procore Technologies, Inc. | Technology | 491 | 33,981 | 1.11% |
| MGM Resorts International | Consumer cyclicals | 759 | 33,892 | 1.11% |
| O’Reilly Automotive, Inc. | Consumer cyclicals | 35 | 33,624 | 1.10% |
| Manhattan Associates, Inc. | Technology | 156 | 33,519 | 1.10% |
| Synopsys, Inc. | Technology | 65 | 33,515 | 1.10% |
| Constellation Energy Corp. | Utilities and power | 282 | 33,017 | 1.08% |
| Marathon Oil Corp. | Energy | 1,356 | 32,764 | 1.07% |
| General Motors Co. | Consumer cyclicals | 904 | 32,488 | 1.06% |
| Pure Storage, Inc. Class A | Technology | 903 | 32,218 | 1.06% |
| NVR, Inc. | Consumer cyclicals | 5 | 31,882 | 1.04% |
| Freeport-McMoRan, Inc. (Indonesia) | Basic materials | 730 | 31,066 | 1.02% |
| Live Nation Entertainment, Inc. | Consumer cyclicals | 329 | 30,769 | 1.01% |
| Wintrust Financial Corp. | Financials | 330 | 30,637 | 1.00% |
| East West Bancorp, Inc. | Financials | 424 | 30,479 | 1.00% |
| Unum Group | Financials | 671 | 30,347 | 0.99% |
| Autonation, Inc. | Consumer cyclicals | 199 | 29,900 | 0.98% |
| ON Semiconductor Corp. | Technology | 357 | 29,853 | 0.98% |
| Coinbase Global, Inc. Class A | Financials | 171 | 29,758 | 0.98% |
| Jacobs Solutions, Inc. | Capital goods | 227 | 29,521 | 0.97% |
| Roku, Inc. | Technology | 318 | 29,155 | 0.96% |
| Apartment Income REIT Corp. | Financials | 827 | 28,726 | 0.94% |
| Johnson Controls International PLC | Capital goods | 497 | 28,632 | 0.94% |
| Ulta Beauty, Inc. | Consumer staples | 58 | 28,313 | 0.93% |
| Equitable Holdings, Inc. | Financials | 849 | 28,261 | 0.93% |
| Molina Healthcare, Inc. | Health care | 76 | 27,494 | 0.90% |
| Curtiss-Wright Corp. | Capital goods | 119 | 26,592 | 0.87% |
| J. M. Smucker Co. (The) | Consumer staples | 206 | 26,001 | 0.85% |
| Regeneron Pharmaceuticals, Inc. | Health care | 29 | 25,778 | 0.84% |
| Hologic, Inc. | Health care | 355 | 25,382 | 0.83% |
| Genuine Parts Co. | Consumer cyclicals | 183 | 25,310 | 0.83% |
| Paycom Software, Inc. | Technology | 122 | 25,276 | 0.83% |
| Boyd Gaming Corp. | Consumer cyclicals | 382 | 23,903 | 0.78% |
| | | | |
| A BASKET (BCPUDEAS) OF COMMON STOCKS | | | | |
| | | | | Percentage |
| Common stocks | Sector | Shares | Value | value |
| Royal Caribbean Cruises, Ltd. | Consumer cyclicals | 310 | $40,092 | 1.31% |
| D.R. Horton, Inc. | Consumer cyclicals | 257 | 39,114 | 1.28% |
| Tesla, Inc. | Consumer cyclicals | 154 | 38,238 | 1.25% |
| Equifax, Inc. | Consumer cyclicals | 154 | 38,124 | 1.24% |
| NortonLifeLock, Inc. | Technology | 1,656 | 37,797 | 1.23% |
| IBM Corp. | Technology | 226 | 36,950 | 1.21% |
| Lithia Motors, Inc. | Consumer cyclicals | 110 | 36,353 | 1.19% |
| Jack Henry & Associates, Inc. | Technology | 222 | 36,243 | 1.18% |
| Take-Two Interactive Software, Inc. | Technology | 224 | 36,048 | 1.18% |
| Floor & Decor Holdings, Inc. Class A | Consumer cyclicals | 318 | 35,493 | 1.16% |
| Ross Stores, Inc. | Consumer cyclicals | 255 | 35,264 | 1.15% |
| New Fortress Energy, Inc. | Energy | 923 | 34,821 | 1.14% |
| Stanley Black & Decker, Inc. | Consumer cyclicals | 352 | 34,508 | 1.13% |
| Berkshire Hathaway, Inc. Class B | Financials | 97 | 34,456 | 1.12% |
| RPM International, Inc. | Basic materials | 308 | 34,368 | 1.12% |
| DT Midstream, Inc. | Energy | 613 | 33,586 | 1.10% |
| BWX Technologies, Inc. | Capital goods | 437 | 33,560 | 1.10% |
| Carnival Corp. | Consumer cyclicals | 1,805 | 33,465 | 1.09% |
| |
| Putnam VT Global Asset Allocation Fund 27 |
| | | | |
| A BASKET (BCPUDEAS) OF COMMON STOCKS cont. | | | | |
| | | | | Percentage |
| Common stocks | Sector | Shares | Value | value |
| Thor Industries, Inc. | Consumer cyclicals | 281 | $33,221 | 1.08% |
| Five Below, Inc. | Consumer cyclicals | 155 | 33,081 | 1.08% |
| DoubleVerify Holdings, Inc. | Technology | 895 | 32,906 | 1.07% |
| Tyler Technologies, Inc. | Technology | 76 | 31,782 | 1.04% |
| TD SYNNEX Corp. | Technology | 295 | 31,736 | 1.04% |
| Watsco, Inc. | Consumer staples | 73 | 31,331 | 1.02% |
| Norwegian Cruise Line Holdings, Ltd. | Consumer cyclicals | 1,530 | 30,664 | 1.00% |
| Welltower, Inc. | Financials | 337 | 30,411 | 0.99% |
| Domino’s Pizza, Inc. | Consumer staples | 73 | 30,246 | 0.99% |
| Bunge Global SA | Basic materials | 297 | 30,013 | 0.98% |
| Digital Realty Trust, Inc. | Financials | 220 | 29,569 | 0.97% |
| Texas Instruments, Inc. | Technology | 172 | 29,324 | 0.96% |
| Universal Health Services, Inc. Class B | Health care | 192 | 29,293 | 0.96% |
| Amdocs, Ltd. | Technology | 330 | 29,025 | 0.95% |
| New York Community Bancorp, Inc. | Financials | 2,807 | 28,719 | 0.94% |
| PTC, Inc. | Technology | 164 | 28,669 | 0.94% |
| Healthcare Realty Trust, Inc. | Financials | 1,638 | 28,222 | 0.92% |
| Ciena Corp. | Technology | 617 | 27,754 | 0.91% |
| Exact Sciences Corp. | Health care | 367 | 27,154 | 0.89% |
| Kinsale Capital Group, Inc. | Financials | 81 | 27,060 | 0.88% |
| T Rowe Price Group, Inc. | Financials | 250 | 26,899 | 0.88% |
| Generac Holdings, Inc. | Capital goods | 208 | 26,874 | 0.88% |
| Cabot Oil & Gas Corp. | Energy | 1,051 | 26,827 | 0.88% |
| BioMarin Pharmaceutical, Inc. | Health care | 276 | 26,594 | 0.87% |
| Cooper Cos., Inc. (The) | Health care | 70 | 26,580 | 0.87% |
| Boeing Co. (The) | Capital goods | 98 | 25,441 | 0.83% |
| Wynn Resorts, Ltd. | Consumer cyclicals | 275 | 25,053 | 0.82% |
| Unity Software, Inc. | Technology | 606 | 24,799 | 0.81% |
| CarMax, Inc. | Consumer cyclicals | 312 | 23,936 | 0.78% |
| ZoomInfo Technologies, Inc. Class A | Technology | 1,286 | 23,782 | 0.78% |
| agilon health, Inc. | Health care | 1,876 | 23,540 | 0.77% |
| Zoom Video Communications, Inc. Class A | Technology | 323 | 23,245 | 0.76% |
| | | | |
| A BASKET (GSGLPWDL) OF COMMON STOCKS | | | | |
| | | | | Percentage |
| Common stocks | Sector | Shares | Value | value |
| ArcelorMittal SA (France) | Basic materials | 822 | $23,327 | 0.57% |
| Weyerhaeuser Co. | Basic materials | 668 | 23,243 | 0.57% |
| Meta Platforms, Inc. Class A | Technology | 65 | 23,152 | 0.57% |
| SS&C Technologies Holdings, Inc. | Technology | 371 | 22,645 | 0.56% |
| TOPPAN Holdings, Inc. (Japan) | Consumer cyclicals | 810 | 22,612 | 0.55% |
| 3M Co. | Conglomerates | 205 | 22,457 | 0.55% |
| Aristocrat Leisure, Ltd. (Australia) | Consumer cyclicals | 800 | 22,295 | 0.55% |
| Holcim AG (Switzerland) | Basic materials | 282 | 22,159 | 0.54% |
| Rio Tinto, Ltd. (Australia) | Basic materials | 239 | 22,153 | 0.54% |
| RWE AG (Germany) | Utilities and power | 482 | 21,933 | 0.54% |
| Iberdrola SA (Spain) | Utilities and power | 1,664 | 21,820 | 0.54% |
| Central Japan Railway Co. (Japan) | Transportation | 846 | 21,503 | 0.53% |
| Amadeus IT Holding SA (Spain) | Consumer cyclicals | 299 | 21,448 | 0.53% |
| E.ON SE (Germany) | Utilities and power | 1,592 | 21,369 | 0.52% |
| Exor NV (Netherlands) | Financials | 213 | 21,285 | 0.52% |
| ConocoPhillips | Energy | 183 | 21,226 | 0.52% |
| ENGIE SA (France) | Utilities and power | 1,205 | 21,193 | 0.52% |
| Wolters Kluwer NV (Netherlands) | Consumer cyclicals | 149 | 21,145 | 0.52% |
| Sandvik AB (Sweden) | Capital goods | 975 | 21,105 | 0.52% |
| PepsiCo, Inc. | Consumer staples | 124 | 21,039 | 0.52% |
| |
| 28 Putnam VT Global Asset Allocation Fund |
| | | | |
| A BASKET (GSGLPWDL) OF COMMON STOCKS cont. | | | | |
| | | | | Percentage |
| Common stocks | Sector | Shares | Value | value |
| Automatic Data Processing, Inc. | Consumer cyclicals | 90 | $21,020 | 0.52% |
| SSE PLC (United Kingdom) | Utilities and power | 888 | 21,001 | 0.52% |
| Consolidated Edison, Inc. | Utilities and power | 229 | 20,860 | 0.51% |
| Electronic Arts, Inc. | Technology | 152 | 20,798 | 0.51% |
| Smiths Group PLC (United Kingdom) | Capital goods | 925 | 20,789 | 0.51% |
| Sekisui Chemical Co., Ltd. (Japan) | Financials | 1,430 | 20,623 | 0.51% |
| Leidos Holdings, Inc. | Technology | 190 | 20,562 | 0.50% |
| Globe Life, Inc. | Financials | 169 | 20,520 | 0.50% |
| Deutsche Telekom AG (Germany) | Communication services | 854 | 20,512 | 0.50% |
| Endesa SA (Spain) | Utilities and power | 992 | 20,235 | 0.50% |
| Siemens AG (Germany) | Conglomerates | 106 | 19,984 | 0.49% |
| TE Connectivity, Ltd. | Technology | 141 | 19,848 | 0.49% |
| Alphabet, Inc. Class A | Technology | 142 | 19,819 | 0.49% |
| Norsk Hydro ASA (Norway) | Energy | 2,934 | 19,761 | 0.48% |
| Verisk Analytics, Inc. | Consumer cyclicals | 83 | 19,707 | 0.48% |
| NetApp, Inc. | Technology | 221 | 19,516 | 0.48% |
| Oversea-Chinese Banking Corp., Ltd. (Singapore) | Financials | 1,970 | 19,419 | 0.48% |
| MSCI, Inc. | Technology | 34 | 19,354 | 0.47% |
| Garmin, Ltd. | Technology | 150 | 19,338 | 0.47% |
| Tokyo Gas Co., Ltd. (Japan) | Utilities and power | 842 | 19,337 | 0.47% |
| FactSet Research Systems, Inc. | Consumer cyclicals | 40 | 19,221 | 0.47% |
| Kirin Holdings Co., Ltd. (Japan) | Consumer staples | 1,272 | 18,642 | 0.46% |
| Veralto Corp. | Capital goods | 226 | 18,607 | 0.46% |
| Keysight Technologies, Inc. | Technology | 117 | 18,589 | 0.46% |
| Repsol SA (Spain) | Energy | 1,247 | 18,533 | 0.45% |
| Colgate-Palmolive Co. | Consumer staples | 232 | 18,472 | 0.45% |
| Hershey Co. (The) | Consumer staples | 98 | 18,329 | 0.45% |
| Arkema SA (France) | Basic materials | 161 | 18,291 | 0.45% |
| Mondi PLC (Austria) | Basic materials | 929 | 18,217 | 0.45% |
| Lockheed Martin Corp. | Capital goods | 40 | 18,145 | 0.45% |
| | | | |
| A BASKET (GSGLPWDS) OF COMMON STOCKS | | | | |
| | | | | Percentage |
| Common stocks | Sector | Shares | Value | value |
| Straumann Holding AG (Switzerland) | Health care | 138 | $22,182 | 0.58% |
| Entegris, Inc. | Technology | 182 | 21,845 | 0.58% |
| Commonwealth Bank of Australia (Australia) | Financials | 280 | 21,334 | 0.56% |
| Heineken NV (Netherlands) | Consumer staples | 210 | 21,330 | 0.56% |
| Equifax, Inc. | Consumer cyclicals | 86 | 21,307 | 0.56% |
| Westlake Corp. | Basic materials | 149 | 20,797 | 0.55% |
| Aeon Co., Ltd. (Japan) | Consumer cyclicals | 926 | 20,684 | 0.55% |
| Honeywell International, Inc. | Capital goods | 98 | 20,604 | 0.54% |
| Southwest Airlines Co. | Transportation | 711 | 20,542 | 0.54% |
| Ingersoll Rand, Inc. | Capital goods | 266 | 20,541 | 0.54% |
| Keppel Corp., Ltd. (Singapore) | Capital goods | 3,818 | 20,455 | 0.54% |
| Magna International, Inc. (Canada) | Consumer cyclicals | 346 | 20,424 | 0.54% |
| T-Mobile US, Inc. | Communication services | 126 | 20,279 | 0.53% |
| Ferrovial SE (Netherlands) | Basic materials | 552 | 20,140 | 0.53% |
| Realty Income Corp. | Financials | 347 | 19,920 | 0.53% |
| Visa, Inc. Class A | Financials | 76 | 19,805 | 0.52% |
| Duke Energy Corp. | Utilities and power | 202 | 19,629 | 0.52% |
| Diamondback Energy, Inc. | Energy | 126 | 19,585 | 0.52% |
| Cellnex Telecom, SA 144A (Spain) | Communication services | 497 | 19,567 | 0.52% |
| RELX PLC (United Kingdom) | Consumer cyclicals | 491 | 19,453 | 0.51% |
| CMS Energy Corp. | Utilities and power | 334 | 19,411 | 0.51% |
| Pernod Ricard SA (France) | Consumer staples | 109 | 19,188 | 0.51% |
| |
| Putnam VT Global Asset Allocation Fund 29 |
| | | | |
| A BASKET (GSGLPWDS) OF COMMON STOCKS cont. | | | | |
| | | | | Percentage |
| Common stocks | Sector | Shares | Value | value |
| Wilmar International, Ltd. (Singapore) | Basic materials | 7,063 | $19,105 | 0.50% |
| Waste Connections, Inc. | Capital goods | 127 | 18,953 | 0.50% |
| Toyota Motor Corp. (Japan) | Consumer cyclicals | 1,027 | 18,861 | 0.50% |
| WEC Energy Group, Inc. | Utilities and power | 223 | 18,804 | 0.50% |
| REA Group, Ltd. (Australia) | Technology | 150 | 18,499 | 0.49% |
| Orange SA (France) | Communication services | 1,594 | 18,135 | 0.48% |
| Antofagasta PLC (Chile) | Basic materials | 844 | 18,076 | 0.48% |
| Davide Campari-Milano NV (Italy) | Consumer staples | 1,590 | 17,926 | 0.47% |
| Imperial Brands PLC (United Kingdom) | Consumer staples | 775 | 17,854 | 0.47% |
| CenterPoint Energy, Inc. | Utilities and power | 620 | 17,713 | 0.47% |
| Waste Management, Inc. | Capital goods | 99 | 17,702 | 0.47% |
| Kering SA (France) | Consumer cyclicals | 40 | 17,455 | 0.46% |
| Oriental Land Co., Ltd. (Japan) | Consumer cyclicals | 464 | 17,294 | 0.46% |
| Williams Cos., Inc. (The) | Energy | 487 | 16,962 | 0.45% |
| Edison International | Utilities and power | 237 | 16,957 | 0.45% |
| Kyocera Corp. (Japan) | Technology | 1,161 | 16,946 | 0.45% |
| FirstEnergy Corp. | Utilities and power | 461 | 16,889 | 0.45% |
| Henkel AG & Co. KGaA Vorzug (Preference) (Germany) | Consumer staples | 209 | 16,819 | 0.44% |
| Sempra | Utilities and power | 223 | 16,648 | 0.44% |
| SIG Combibloc Group AG (Switzerland) | Basic materials | 712 | 16,390 | 0.43% |
| Masco Corp. | Consumer cyclicals | 244 | 16,357 | 0.43% |
| Air Liquide SA (France) | Basic materials | 83 | 16,083 | 0.42% |
| Hermes International (France) | Consumer cyclicals | 7 | 15,736 | 0.41% |
| Volkswagen AG (Preference) (Germany) | Consumer cyclicals | 126 | 15,500 | 0.41% |
| Orica, Ltd. (Australia) | Basic materials | 1,427 | 15,499 | 0.41% |
| Allianz SE (Germany) | Financials | 57 | 15,350 | 0.40% |
| PG&E Corp. | Utilities and power | 851 | 15,338 | 0.40% |
| Ashtead Group PLC (United Kingdom) | Consumer staples | 220 | 15,328 | 0.40% |
| | | | | | | |
| OTC CREDIT DEFAULT CONTRACTS OUTSTANDING — PROTECTION SOLD at 12/31/23 | | | | |
| | | Upfront | | | | | |
| | | premium | | | Termi- | | Unrealized |
| Swap counterparty/ | | received | Notional | | nation | Payments | appreciation/ |
| Referenced debt* | Rating*** | (paid)** | amount | Value | date | received by fund | (depreciation) |
| Bank of America N.A. | | | | | | | |
| CMBX NA BBB–.6 Index | BB/P | $273 | $1,856 | $241 | 5/11/63 | 300 bp — Monthly | $33 |
| CMBX NA BBB–.6 Index | BB/P | 482 | 3,712 | 483 | 5/11/63 | 300 bp — Monthly | 1 |
| CMBX NA BBB–.6 Index | BB/P | 926 | 6,960 | 905 | 5/11/63 | 300 bp — Monthly | 25 |
| CMBX NA BBB–.6 Index | BB/P | 912 | 7,424 | 966 | 5/11/63 | 300 bp — Monthly | (49) |
| Citigroup Global Markets, Inc. | | | | | | | |
| CMBX NA BB.11 Index | B+/P | 803 | 2,000 | 723 | 11/18/54 | 500 bp — Monthly | 83 |
| CMBX NA BB.14 Index | BB–/P | 110 | 1,000 | 370 | 12/16/72 | 500 bp — Monthly | (259) |
| CMBX NA BB.6 Index | B+/P | 2,434 | 8,338 | 2,449 | 5/11/63 | 500 bp — Monthly | (6) |
| CMBX NA BB.7 Index | B-/P | 5,345 | 14,626 | 5,211 | 1/17/47 | 500 bp — Monthly | 151 |
| CMBX NA BB.9 Index | B/P | 421 | 1,000 | 382 | 9/17/58 | 500 bp — Monthly | 40 |
| CMBX NA BBB–.10 Index | BB/P | 3,907 | 13,000 | 3,117 | 11/17/59 | 300 bp — Monthly | 798 |
| CMBX NA BBB–.11 Index | BBB–/P | 210 | 1,000 | 166 | 11/18/54 | 300 bp — Monthly | 45 |
| Credit Suisse International | | | | | | | |
| CMBX NA A.7 Index | A-/P | 37 | 454 | 54 | 1/17/47 | 200 bp — Monthly | (17) |
| CMBX NA A.7 Index | A-/P | 291 | 3,175 | 378 | 1/17/47 | 200 bp — Monthly | (85) |
| CMBX NA BB.7 Index | B-/P | 401 | 2,438 | 869 | 1/17/47 | 500 bp — Monthly | (465) |
| CMBX NA BBB–.7 Index | BB/P | 237 | 1,783 | 339 | 1/17/47 | 300 bp — Monthly | (100) |
| CMBX NA BBB–.7 Index | BB/P | 1,379 | 12,478 | 2,371 | 1/17/47 | 300 bp — Monthly | (982) |
| Goldman Sachs International | | | | | | | |
| CMBX NA A.13 Index | A-/P | (5) | 1,000 | 96 | 12/16/72 | 200 bp — Monthly | (101) |
| CMBX NA BBB–.7 Index | BB/P | 1,463 | 7,130 | 1,355 | 1/17/47 | 300 bp — Monthly | 112 |
| |
| 30 Putnam VT Global Asset Allocation Fund |
| | | | | | | |
| OTC CREDIT DEFAULT CONTRACTS OUTSTANDING — PROTECTION SOLD at 12/31/23 cont. | | | | |
| | | Upfront | | | | | |
| | | premium | | | Termi- | | Unrealized |
| Swap counterparty/ | | received | Notional | | nation | Payments | appreciation/ |
| Referenced debt* | Rating*** | (paid)** | amount | Value | date | received by fund | (depreciation) |
| JPMorgan Securities LLC | | | | | | | |
| CMBX NA BB.6 Index | B+/P | $3,089 | $3,573 | $1,050 | 5/11/63 | 500 bp — Monthly | $2,043 |
| CMBX NA BBB–.13 Index | BBB–/P | 132 | 1,000 | 241 | 12/16/72 | 300 bp — Monthly | (109) |
| CMBX NA BBB–.8 Index | BB–/P | 156 | 1,000 | 150 | 10/17/57 | 300 bp — Monthly | 6 |
| Morgan Stanley & Co. International PLC | | | | | | |
| CMBX NA BB.6 Index | B+/P | 1,602 | 5,360 | 1,574 | 5/11/63 | 500 bp — Monthly | 33 |
| Upfront premium received | | 24,610 | Unrealized appreciation | | 3,370 |
| Upfront premium (paid) | | (5) | Unrealized (depreciation) | | (2,173) |
| Total | | $24,605 | Total | | $1,197 |
* Payments related to the referenced debt are made upon a credit default event.
** Upfront premium is based on the difference between the original spread on issue and the market spread on day of execution.
*** Ratings for an underlying index represent the average of the ratings of all the securities included in that index. The Moody’s, Standard & Poor’s or Fitch ratings are believed to be the most recent ratings available at December 31, 2023. Securities rated by Fitch are indicated by “/F.” Securities rated by Putnam are indicated by “/P.” The Putnam rating categories are comparable to the Standard & Poor’s classifications.
| | | | | | |
| OTC CREDIT DEFAULT CONTRACTS OUTSTANDING — PROTECTION PURCHASED at 12/31/23 | | | | |
| | Upfront | | | | | |
| | premium | | | Termi- | Payments | Unrealized |
| Swap counterparty/ | received | Notional | | nation | (paid) | appreciation/ |
| Referenced debt* | (paid)** | amount | Value | date | by fund | (depreciation) |
| Citigroup Global Markets, Inc. | | | | | | |
| CMBX NA BB.10 Index | $(8,353) | $18,000 | $7,688 | 11/17/59 | (500 bp) — Monthly | $(683) |
| CMBX NA BBB–.6 Index | (700) | 5,104 | 664 | 5/11/63 | (300 bp) — Monthly | (40) |
| CMBX NA BBB–.6 Index | (2,545) | 3,712 | 483 | 5/11/63 | (300 bp) — Monthly | (2,064) |
| CMBX NA BBB–.6 Index | (556) | 928 | 121 | 5/11/63 | (300 bp) — Monthly | (435) |
| Credit Suisse International | | | | | | |
| CMBX NA BB.10 Index | (534) | 4,000 | 1,708 | 11/17/59 | (500 bp) — Monthly | 1,171 |
| CMBX NA BB.10 Index | (476) | 4,000 | 1,708 | 11/17/59 | (500 bp) — Monthly | 1,229 |
| CMBX NA BB.10 Index | (249) | 2,000 | 854 | 11/17/59 | (500 bp) — Monthly | 604 |
| CMBX NA BB.7 Index | (512) | 17,271 | 5,073 | 5/11/63 | (500 bp) — Monthly | 4,544 |
| CMBX NA BB.7 Index | (1,291) | 5,688 | 2,027 | 1/17/47 | (500 bp) — Monthly | 729 |
| CMBX NA BB.7 Index | (1,151) | 5,688 | 2,027 | 1/17/47 | (500 bp) — Monthly | 869 |
| Goldman Sachs International | | | | | | |
| CMBX NA BB.7 Index | (2,571) | 7,313 | 2,606 | 1/17/47 | (500 bp) — Monthly | 27 |
| CMBX NA BBB–.12 Index | (527) | 2,000 | 468 | 8/17/61 | (300 bp) — Monthly | (60) |
| JPMorgan Securities LLC | | | | | | |
| CMBX NA A.7 Index | (169) | 3,629 | 431 | 1/17/47 | (200 bp) — Monthly | 261 |
| CMBX NA BBB–.11 Index | (110) | 1,000 | 166 | 11/18/54 | (300 bp) — Monthly | 55 |
| CMBX NA BBB–.6 Index | (4,906) | 10,208 | 1,328 | 5/11/63 | (300 bp) — Monthly | (3,584) |
| CMBX NA BBB–.7 Index | (6,573) | 16,637 | 3,161 | 1/17/47 | (300 bp) — Monthly | (3,425) |
| Merrill Lynch International | | | | | | |
| CMBX NA BB.10 Index | (228) | 4,000 | 1,708 | 11/17/59 | (500 bp) — Monthly | 1,477 |
| CMBX NA BB.11 Index | (494) | 1,000 | 361 | 11/18/54 | (500 bp) — Monthly | (134) |
| CMBX NA BBB–.7 Index | (328) | 2,377 | 452 | 1/17/47 | (300 bp) — Monthly | 122 |
| CMBX NA BBB–.9 Index | (185) | 1,000 | 175 | 9/17/58 | (300 bp) — Monthly | (11) |
| |
| Putnam VT Global Asset Allocation Fund 31 |
| | | | | | |
| OTC CREDIT DEFAULT CONTRACTS OUTSTANDING — PROTECTION PURCHASED at 12/31/23 cont. | | | | |
| | Upfront | | | | | |
| | premium | | | Termi- | Payments | Unrealized |
| Swap counterparty/ | received | Notional | | nation | (paid) | appreciation/ |
| Referenced debt* | (paid)** | amount | Value | date | by fund | (depreciation) |
| Morgan Stanley & Co. International PLC | | | | | | |
| CMBX NA BB.10 Index | $(1,424) | $3,000 | $1,281 | 11/17/59 | (500 bp) — Monthly | $(145) |
| CMBX NA BB.7 Index | (302) | 813 | 290 | 1/17/47 | (500 bp) — Monthly | (14) |
| CMBX NA BB.9 Index | (424) | 1,000 | 382 | 9/17/58 | (500 bp) — Monthly | (43) |
| CMBX NA BBB–.10 Index | (7,760) | 24,000 | 5,755 | 11/17/59 | (300 bp) — Monthly | (2,022) |
| CMBX NA BBB–.12 Index | (6,998) | 22,000 | 5,152 | 8/17/61 | (300 bp) — Monthly | (1,858) |
| CMBX NA BBB–.13 Index | (318) | 1,000 | 241 | 12/16/72 | (300 bp) — Monthly | (77) |
| CMBX NA BBB–.7 Index | (527) | 2,377 | 452 | 1/17/47 | (300 bp) — Monthly | (78) |
| CMBX NA BBB–.8 Index | (206) | 1,000 | 150 | 10/17/57 | (300 bp) — Monthly | (56) |
| Upfront premium received | — | | Unrealized appreciation | 11,088 |
| Upfront premium (paid) | (50,417) | | Unrealized (depreciation) | (14,729) |
| Total | $(50,417) | | Total | $(3,641) |
* Payments related to the referenced debt are made upon a credit default event.
** Upfront premium is based on the difference between the original spread on issue and the market spread on day of execution.
| | | | | | | |
| CENTRALLY CLEARED CREDIT DEFAULT CONTRACTS OUTSTANDING — PROTECTION SOLD at 12/31/23 | | | |
| | | Upfront | | | | | |
| | | premium | | | Termi- | Payments | Unrealized |
| | | received | Notional | | nation | received | appreciation/ |
| Referenced debt* | Rating*** | (paid)** | amount | Value | date | by fund | (depreciation) |
| CDX NA HY Series 41 Index | B+/P | $(739) | $1,049,400 | $61,390 | 12/20/28 | 500 bp — | $63,335 |
| | | | | | | Quarterly | |
| CDX NA IG Series 41 Index | BBB+/P | (47,743) | 3,550,000 | 69,190 | 12/20/28 | 100 bp — | 22,629 |
| | | | | | | Quarterly | |
| Total | | $(48,482) | | | | | $85,964 |
* Payments related to the referenced debt are made upon a credit default event.
** Upfront premium is based on the difference between the original spread on issue and the market spread on day of execution.
*** Ratings for an underlying index represent the average of the ratings of all the securities included in that index. The Moody’s, Standard & Poor’s or Fitch ratings are believed to be the most recent ratings available at December 31, 2023. Securities rated by Fitch are indicated by “/F.” Securities rated by Putnam are indicated by “/P.” The Putnam rating categories are comparable to the Standard & Poor’s classifications.
| |
| 32 Putnam VT Global Asset Allocation Fund |
ASC 820 establishes a three-level hierarchy for disclosure of fair value measurements. The valuation hierarchy is based upon the transparency of inputs to the valuation of the fund’s investments. The three levels are defined as follows:
Level 1: Valuations based on quoted prices for identical securities in active markets.
Level 2: Valuations based on quoted prices in markets that are not active or for which all significant inputs are observable, either directly or indirectly.
Level 3: Valuations based on inputs that are unobservable and significant to the fair value measurement.
The following is a summary of the inputs used to value the fund’s net assets as of the close of the reporting period:
| | | |
| | | Valuation inputs | |
| Investments in securities: | Level 1 | Level 2 | Level 3 |
| Common stocks*: | | | |
| Basic materials | $1,691,073 | $1,013,351 | $— |
| Capital goods | 1,980,580 | 718,811 | — |
| Communication services | 692,376 | 248,780 | — |
| Conglomerates | 973,843 | 390,342 | — |
| Consumer cyclicals | 9,910,308 | 1,408,352 | — |
| Consumer staples | 3,307,832 | 1,265,324 | — |
| Energy | 2,457,249 | 335,804 | — |
| Financials | 8,049,403 | 1,952,787 | — |
| Health care | 7,740,344 | 1,242,189 | — |
| Technology | 20,499,433 | 951,974 | — |
| Transportation | 769,875 | 204,867 | — |
| Utilities and power | 1,501,177 | 468,450 | — |
| Total common stocks | 59,573,493 | 10,201,031 | — |
| Asset-backed securities | — | 78,066 | — |
| Convertible bonds and notes | — | 12,232 | — |
| Convertible preferred stocks | — | 11,015 | — |
| Corporate bonds and notes | — | 12,656,741 | — |
| Foreign government and agency bonds and notes | — | 415,873 | — |
| Mortgage-backed securities | — | 2,448,374 | — |
| Purchased options outstanding | — | 150,980 | — |
| Senior loans | — | 265,293 | — |
| U.S. government and agency mortgage obligations | — | 10,699,685 | — |
| Short-term investments | 170,000 | 8,983,663 | — |
| Totals by level | $59,743,493 | $45,922,953 | $— |
| |
| | | Valuation inputs | |
| Other financial instruments: | Level 1 | Level 2 | Level 3 |
| Forward currency contracts | $— | $(13,652) | $— |
| Futures contracts | 280,505 | — | — |
| Written options outstanding | — | (26,066) | — |
| TBA sale commitments | — | (1,024,531) | — |
| Interest rate swap contracts | — | (8,988) | — |
| Total return swap contracts | — | (8,420) | — |
| Credit default contracts | — | 157,814 | — |
| Totals by level | $280,505 | $(923,843) | $— |
* Common stock classifications are presented at the sector level, which may differ from the fund’s portfolio presentation.
The accompanying notes are an integral part of these financial statements.
| |
| Putnam VT Global Asset Allocation Fund 33 |
Statement of assets and liabilities
12/31/23
| |
| Assets | |
| Investment in securities, at value, (Notes 1 and 9): | |
| Unaffiliated issuers (identified cost $73,971,372) | $97,778,531 |
| Affiliated issuers (identified cost $7,887,915) (Note 5) | 7,887,915 |
| Cash | 1,873 |
| Foreign currency (cost $3,701) (Note 1) | 3,449 |
| Dividends, interest and other receivables | 381,721 |
| Foreign tax reclaim | 41,283 |
| Receivable for shares of the fund sold | 23,720 |
| Receivable for investments sold | 771,733 |
| Receivable for sales of TBA securities (Note 1) | 1,022,005 |
| Receivable for variation margin on futures contracts (Note 1) | 39,720 |
| Receivable for variation margin on centrally cleared swap contracts (Note 1) | 617 |
| Unrealized appreciation on forward currency contracts (Note 1) | 31,108 |
| Unrealized appreciation on OTC swap contracts (Note 1) | 133,465 |
| Premium paid on OTC swap contracts (Note 1) | 50,422 |
| Deposits with broker (Note 1) | 185,785 |
| Receivable from broker (Note 1) | 52 |
| Total assets | 108,353,399 |
| |
| Liabilities | |
| Payable for investments purchased | 16,914 |
| Payable for purchases of TBA securities (Note 1) | 6,078,484 |
| Payable for shares of the fund repurchased | 205,308 |
| Payable for compensation of Manager (Note 2) | 48,730 |
| Payable for custodian fees (Note 2) | 24,045 |
| Payable for investor servicing fees (Note 2) | 11,349 |
| Payable for Trustee compensation and expenses (Note 2) | 82,034 |
| Payable for administrative services (Note 2) | 1,399 |
| Payable for distribution fees (Note 2) | 6,673 |
| Payable for variation margin on futures contracts (Note 1) | 59,199 |
| Payable for variation margin on centrally cleared swap contracts (Note 1) | 4,154 |
| Unrealized depreciation on OTC swap contracts (Note 1) | 144,329 |
| Premium received on OTC swap contracts (Note 1) | 24,610 |
| Unrealized depreciation on forward currency contracts (Note 1) | 44,760 |
| Written options outstanding, at value (premiums $48,125) (Note 1) | 26,066 |
| TBA sale commitments, at value (proceeds receivable $1,019,297) (Note 1) | 1,024,531 |
| Collateral on certain derivative contracts, at value (Notes 1 and 9) | 170,000 |
| Other accrued expenses | 145,696 |
| Total liabilities | 8,118,281 |
| | |
| Net assets | $100,235,118 |
| |
| Represented by | |
| Paid-in capital (Unlimited shares authorized) (Notes 1 and 4) | $75,592,366 |
| Total distributable earnings (Note 1) | 24,642,752 |
| Total — Representing net assets applicable to capital shares outstanding | $100,235,118 |
| | |
| Computation of net asset value Class IA | |
| Net assets | $68,402,697 |
| Number of shares outstanding | 3,895,487 |
| Net asset value, offering price and redemption price per share (net assets divided by number of shares outstanding) | $17.56 |
| | |
| Computation of net asset value Class IB | |
| Net assets | $31,832,421 |
| Number of shares outstanding | 1,782,083 |
| Net asset value, offering price and redemption price per share (net assets divided by number of shares outstanding) | $17.86 |
The accompanying notes are an integral part of these financial statements.
| |
| 34 Putnam VT Global Asset Allocation Fund |
Statement of operations
Year ended 12/31/23
| |
| Investment income | |
| Interest (net of foreign tax of $46) (including interest income of $240,750 from investments in affiliated issuers) (Note 5) | $1,370,765 |
| Dividends (net of foreign tax of $37,914) | 1,295,740 |
| Securities lending (net of expenses) (Notes 1 and 5) | 1,303 |
| Total investment income | 2,667,808 |
| |
| Expenses | |
| Compensation of Manager (Note 2) | 577,065 |
| Investor servicing fees (Note 2) | 68,475 |
| Custodian fees (Note 2) | 84,531 |
| Trustee compensation and expenses (Note 2) | 4,287 |
| Distribution fees (Note 2) | 77,778 |
| Administrative services (Note 2) | 3,151 |
| Auditing and tax fees | 134,052 |
| Other | 38,508 |
| Fees waived and reimbursed by Manager (Note 5) | (68,082) |
| Total expenses | 919,765 |
| | |
| Expense reduction (Note 2) | (1,571) |
| Net expenses | 918,194 |
| | |
| Net investment income | 1,749,614 |
| | |
| Realized and unrealized gain (loss) | |
| Net realized gain (loss) on: | |
| Securities from unaffiliated issuers (Notes 1 and 3) | 2,954,807 |
| Foreign currency transactions (Note 1) | (3,180) |
| Forward currency contracts (Note 1) | 104,381 |
| Futures contracts (Note 1) | (3,631,225) |
| Swap contracts (Note 1) | 442,576 |
| Total net realized loss | (132,641) |
| Change in net unrealized appreciation (depreciation) on: | |
| Securities from unaffiliated issuers and TBA sale commitments | 14,513,919 |
| Assets and liabilities in foreign currencies | 2,768 |
| Forward currency contracts | (31,081) |
| Futures contracts | (256,942) |
| Swap contracts | 28,964 |
| Written options | 22,059 |
| Total change in net unrealized appreciation | 14,279,687 |
| | |
| Net gain on investments | 14,147,046 |
| | |
| Net increase in net assets resulting from operations | $15,896,660 |
The accompanying notes are an integral part of these financial statements.
| |
| Putnam VT Global Asset Allocation Fund 35 |
Statement of changes in net assets
| | |
| | Year ended | Year ended |
| | 12/31/23 | 12/31/22 |
| Increase (decrease) in net assets | | |
| Operations: | | |
| Net investment income | $1,749,614 | $1,606,900 |
| Net realized loss on investments and foreign currency transactions | (132,641) | (582,815) |
| Change in net unrealized appreciation (depreciation) of investments and assets and liabilities in foreign currencies | 14,279,687 | (21,103,218) |
| Net increase (decrease) in net assets resulting from operations | 15,896,660 | (20,079,133) |
| Distributions to shareholders (Note 1): | | |
| From ordinary income | | |
| Net investment income | | |
| Class IA | (1,231,765) | (1,252,464) |
| Class IB | (480,710) | (478,336) |
| Net realized short-term gain on investments | | |
| Class IA | — | (2,725,827) |
| Class IB | — | (1,262,870) |
| From capital gain on investments | | |
| Net realized long-term gain on investments | | |
| Class IA | — | (4,278,358) |
| Class IB | — | (1,982,152) |
| Decrease from capital share transactions (Note 4) | (11,027,900) | (935,371) |
| Total increase (decrease) in net assets | 3,156,285 | (32,994,511) |
| Net assets: | | |
| Beginning of year | 97,078,833 | 130,073,344 |
| End of year | $100,235,118 | $97,078,833 |
The accompanying notes are an integral part of these financial statements.
| |
| 36 Putnam VT Global Asset Allocation Fund |
Financial highlights
(For a common share outstanding throughout the period)
| | | | | | | | | | | | | |
| INVESTMENT OPERATIONS: | | | | | LESS DISTRIBUTIONS: | | | RATIOS AND SUPPLEMENTAL DATA: |
| Period ended | Net asset value, beginning of period | Net investment income (loss)a | Net realized and unrealized gain (loss) on investments | Total from investment operations | From net investment income | From net realized gain on investments | Total distributions | Net asset value, end of period | Total return at net asset value (%)b,c | Net assets, end of period (in thousands) | Ratio of expenses to average net assets (%)b,d | Ratio of net investment income (loss) to average net assets (%) | Portfolio turnover (%)e |
| Class IA | | | | | | | | | | | | | |
| 12/31/23 | $15.19 | .30 | 2.36 | 2.66 | (.29) | — | (.29) | $17.56 | 17.78 | $68,403 | .86f | 1.87f | 262 |
| 12/31/22 | 20.05 | .25 | (3.20) | (2.95) | (.29) | (1.62) | (1.91) | 15.19 | (15.82) | 66,140 | .86f | 1.56f | 262 |
| 12/31/21 | 18.21 | .22 | 2.30 | 2.52 | (.18) | (.50) | (.68) | 20.05 | 14.25 | 89,120 | .84 | 1.13 | 306 |
| 12/31/20 | 16.95 | .22 | 1.72 | 1.94 | (.36) | (.32) | (.68) | 18.21 | 12.58 | 87,732 | .86 | 1.32 | 320 |
| 12/31/19 | 15.17 | .32 | 2.26 | 2.58 | (.29) | (.51) | (.80) | 16.95 | 17.42 | 88,722 | .86f | 1.98f | 164 |
| Class IB | | | | | | | | | | | | | |
| 12/31/23 | $15.44 | .26 | 2.41 | 2.67 | (.25) | — | (.25) | $17.86 | 17.48 | $31,832 | 1.11f | 1.62f | 262 |
| 12/31/22 | 20.34 | .22 | (3.26) | (3.04) | (.24) | (1.62) | (1.86) | 15.44 | (16.03) | 30,939 | 1.11f | 1.30f | 262 |
| 12/31/21 | 18.47 | .17 | 2.34 | 2.51 | (.14) | (.50) | (.64) | 20.34 | 13.95 | 40,953 | 1.09 | .88 | 306 |
| 12/31/20 | 17.17 | .18 | 1.75 | 1.93 | (.31) | (.32) | (.63) | 18.47 | 12.31 | 38,431 | 1.11 | 1.06 | 320 |
| 12/31/19 | 15.35 | .28 | 2.29 | 2.57 | (.24) | (.51) | (.75) | 17.17 | 17.13 | 36,773 | 1.11f | 1.72f | 164 |
a Per share net investment income (loss) has been determined on the basis of weighted average number of shares outstanding during the period.
b The charges and expenses at the insurance company separate account level are not reflected.
c Total return assumes dividend reinvestment.
d Includes amounts paid through expense offset and/or brokerage/service arrangements, if any (Note 2). Also excludes acquired fund fees and expenses, if any.
e Portfolio turnover includes TBA purchase and sale commitments.
f Reflects an involuntary contractual expense limitation in effect during the period. As a result of such limitation, the expenses of each class reflect a reduction of the following amounts:
| | | |
| | Percentage of average | | |
| | net assets | | |
| December 31, 2023 | 0.07% | | |
| December 31, 2022 | 0.05 | | |
| December 31, 2019 | 0.01 | | |
The accompanying notes are an integral part of these financial statements.
| |
| Putnam VT Global Asset Allocation Fund 37 |
Notes to financial statements 12/31/23
Unless otherwise noted, the “reporting period” represents the period from January 1, 2023 through December 31, 2023. The following table defines commonly used references within the Notes to financial statements:
| |
| References to | Represent |
| Franklin Templeton | Franklin Resources, Inc. |
| JPMorgan | JPMorgan Chase Bank, N.A. |
| OTC | over-the-counter |
| PAC | The Putnam Advisory Company, LLC, an affiliate of |
| | Putnam Management |
| PIL | Putnam Investments Limited, an affiliate of Putnam |
| | Management |
| Putnam Management | Putnam Investment Management, LLC, the fund’s |
| | manager, an indirect wholly-owned subsidiary of |
| | Franklin Templeton |
| SEC | Securities and Exchange Commission |
| State Street | State Street Bank and Trust Company |
Putnam VT Global Asset Allocation Fund (the fund) is a diversified series of Putnam Variable Trust (the Trust), a Massachusetts business trust registered under the Investment Company Act of 1940, as amended, as an open-end management investment company. The goal of the fund is to seek long-term return consistent with preservation of capital. The fund invests a majority of its assets in a diversified portfolio of equity securities (growth or value stocks or both) of both U.S. and foreign companies of any size. Putnam Management may consider, among other factors, a company’s valuation, financial strength, growth potential, competitive position in its industry, projected future earnings, cash flows and dividends when deciding whether to buy or sell equity investments. The fund also invests in a diversified portfolio of fixed-income investments, including both U.S. and foreign government obligations, corporate obligations and securitized debt instruments (such as mortgage-backed investments). Putnam Management may consider, among other factors, credit, interest rate and prepayment risks, as well as general market conditions, when deciding whether to buy or sell fixed-income investments. Putnam Management may also select other investments that do not fall within these asset classes. Putnam Management may also use to a significant extent derivatives, such as futures, options, certain foreign currency transactions, warrants and swap contracts, for both hedging and non-hedging purposes.
The fund offers class IA and class IB shares of beneficial interest. Class IA shares are offered at net asset value and are not subject to a distribution fee. Class IB shares are offered at net asset value and pay an ongoing distribution fee, which is identified in Note 2.
In the normal course of business, the fund enters into contracts that may include agreements to indemnify another party under given circumstances. The fund’s maximum exposure under these arrangements is unknown as this would involve future claims that may be, but have not yet been, made against the fund. However, the fund’s management team expects the risk of material loss to be remote.
The fund has entered into contractual arrangements with an investment adviser, administrator, distributor, shareholder servicing agent and custodian, who each provide services to the fund. Unless expressly stated otherwise, shareholders are not parties to, or intended beneficiaries of these contractual arrangements, and these contractual arrangements are not intended to create any shareholder right to enforce them against the service providers or to seek any remedy under them against the service providers, either directly or on behalf of the fund.
Under the Trust’s Amended and Restated Agreement and Declaration of Trust, any claims asserted by a shareholder against or on behalf of the Trust (or its series), including claims against Trustees and Officers, must be brought in state and federal courts located within the Commonwealth of Massachusetts.
Note 1 — Significant accounting policies
The fund follows the accounting and reporting guidance in Financial Accounting Standards Board (FASB) Accounting Standards Codification Topic 946, Financial Services – Investment Companies (ASC 946) and applies the specialized accounting and reporting guidance in U.S. Generally Accepted Accounting Principles (U.S. GAAP), including, but not limited to, ASC 946. The following is a summary of significant accounting policies consistently followed by the fund in the preparation of its financial statements. The preparation of financial statements is in conformity with accounting principles generally accepted in the United States of America and requires management to make estimates and assumptions that affect the reported amounts of assets and liabilities in the financial statements and the reported amounts of increases and decreases in net assets from operations. Actual results could differ from those estimates. Subsequent events after the Statement of assets and liabilities date through the date that the financial statements were issued have been evaluated in the preparation of the financial statements.
Investment income, realized and unrealized gains and losses and expenses of the fund are borne pro-rata based on the relative net assets of each class to the total net assets of the fund, except that each class bears expenses unique to that class (including the distribution fees applicable to such classes). Each class votes as a class only with respect to its own distribution plan or other matters on which a class vote is required by law or determined by the Trustees. If the fund were liquidated, shares of each class would receive their pro-rata share of the net assets of the fund. In addition, the Trustees declare separate dividends on each class of shares.
Security valuation Portfolio securities and other investments are valued using policies and procedures adopted by the Board of Trustees. The Trustees have formed a Pricing Committee to oversee the implementation of these procedures and have delegated responsibility for valuing the fund’s assets in accordance with these procedures to Putnam Management. Putnam Management has established an internal Valuation Committee that is responsible for making fair value determinations, evaluating the effectiveness of the pricing policies of the fund and reporting to the Pricing Committee.
Investments for which market quotations are readily available are valued at the last reported sales price on their principal exchange, or official closing price for certain markets, and are classified as Level 1 securities under Accounting Standards Codification 820 Fair Value Measurements and Disclosures (ASC 820). If no sales are reported, as in the case of some securities that are traded OTC, a security is valued at its last reported bid price and is generally categorized as a Level 2 security.
Investments in open-end investment companies (excluding exchange-traded funds), if any, which can be classified as Level 1 or Level 2 securities, are valued based on their net asset value. The net asset value of such investment companies equals the total value of their assets less their liabilities and divided by the number of their outstanding shares.
Market quotations are not considered to be readily available for certain debt obligations (including short-term investments with remaining maturities of 60 days or less) and other investments; such investments are valued on the basis of valuations furnished by an independent pricing service approved by the Trustees or dealers selected by Putnam Management. Such services or dealers determine valuations for normal institutional-size trading units of such securities using methods based on market transactions for comparable securities and various relationships, generally recognized by institutional traders, between securities (which consider such factors as security prices, yields, maturities and ratings). These securities will generally be categorized as Level 2.
Many securities markets and exchanges outside the U.S. close prior to the scheduled close of the New York Stock Exchange and therefore the closing prices for securities in such markets or on such exchanges may not fully reflect events that occur after such close but before the scheduled close of the New York Stock Exchange. Accordingly, on certain days, the fund will fair value certain foreign equity securities taking into account multiple factors including movements in the U.S. securities markets, currency valuations and comparisons to the valuation of American Depository Receipts, exchange-traded funds and futures contracts. The foreign equity securities, which would generally be classified as Level 1 securities, will be transferred to Level 2 of the fair value hierarchy when they are valued at fair value. The number of days on which fair value prices will be used will depend on market activity and it is possible that fair value prices will be used by the fund to a significant extent. At the close of the reporting period, fair value pricing was used for certain foreign securities in the portfolio. Securities quoted in foreign currencies, if any, are translated into U.S. dollars at the current exchange rate.
To the extent a pricing service or dealer is unable to value a security or provides a valuation that Putnam Management does not believe accurately reflects the security’s fair value, the security will be valued at fair value by Putnam Management, which has been designated as valuation designee pursuant to Rule 2a–5 under the Investment Company Act of 1940, in accordance with policies and procedures approved by the Trustees. Certain investments, including certain restricted and illiquid securities and derivatives, are also valued at fair value following procedures approved by the Trustees. These valuations consider such factors as significant
| |
| 38 Putnam VT Global Asset Allocation Fund |
market or specific security events such as interest rate or credit quality changes, various relationships with other securities, discount rates, U.S. Treasury, U.S. swap and credit yields, index levels, convexity exposures, recovery rates, sales and other multiples and resale restrictions. These securities are classified as Level 2 or as Level 3 depending on the priority of the significant inputs.
To assess the continuing appropriateness of fair valuations, the Valuation Committee reviews and affirms the reasonableness of such valuations on a regular basis after considering all relevant information that is reasonably available. Such valuations and procedures are reviewed periodically by the Trustees. Certain securities may be valued on the basis of a price provided by a single source. The fair value of securities is generally determined as the amount that the fund could reasonably expect to realize from an orderly disposition of such securities over a reasonable period of time. By its nature, a fair value price is a good faith estimate of the value of a security in a current sale and does not reflect an actual market price, which may be different by a material amount.
Security transactions and related investment income Security transactions are recorded on the trade date (the date the order to buy or sell is executed). Gains or losses on securities sold are determined on the identified cost basis.
Interest income, net of any applicable withholding taxes, if any, is recorded on the accrual basis. Amortization and accretion of premiums and discounts on debt securities, if any, is recorded on the accrual basis.
Dividend income, net of any applicable withholding taxes, is recognized on the ex-dividend date except that certain dividends from foreign securities, if any, are recognized as soon as the fund is informed of the ex-dividend date. Non-cash dividends, if any, are recorded at the fair value of the securities received. Dividends representing a return of capital or capital gains, if any, are reflected as a reduction of cost and/or as a realized gain.
The fund may have earned certain fees in connection with its senior loan purchasing activities. These fees, if any, are treated as market discount and are amortized into income in the Statement of operations.
Securities purchased or sold on a delayed delivery basis may be settled at a future date beyond customary settlement time; interest income is accrued based on the terms of the securities. Losses may arise due to changes in the fair value of the underlying securities or if the counterparty does not perform under the contract.
Stripped securities The fund may invest in stripped securities which represent a participation in securities that may be structured in classes with rights to receive different portions of the interest and principal. Interest-only securities receive all of the interest and principal-only securities receive all of the principal. If the interest-only securities experience greater than anticipated prepayments of principal, the fund may fail to recoup fully its initial investment in these securities. Conversely, principal-only securities increase in value if prepayments are greater than anticipated and decline if prepayments are slower than anticipated. The fair value of these securities is highly sensitive to changes in interest rates.
Foreign currency translation The accounting records of the fund are maintained in U.S. dollars. The fair value of foreign securities, currency holdings, and other assets and liabilities is recorded in the books and records of the fund after translation to U.S. dollars based on the exchange rates on that day. The cost of each security is determined using historical exchange rates. Income and withholding taxes are translated at prevailing exchange rates when earned or incurred. The fund does not isolate that portion of realized or unrealized gains or losses resulting from changes in the foreign exchange rate on investments from fluctuations arising from changes in the market prices of the securities. Such gains and losses are included with the net realized and unrealized gain or loss on investments. Net realized gains and losses on foreign currency transactions represent net realized exchange gains or losses on disposition of foreign currencies, currency gains and losses realized between the trade and settlement dates on securities transactions and the difference between the amount of investment income and foreign withholding taxes recorded on the fund’s books and the U.S. dollar equivalent amounts actually received or paid. Net unrealized appreciation and depreciation of assets and liabilities in foreign currencies arise from changes in the value of assets and liabilities other than investments at the period end, resulting from changes in the exchange rate.
Options contracts The fund uses options contracts to hedge duration and convexity, to isolate prepayment risk, to gain exposure to interest rates, to hedge against changes in values of securities it owns, owned or expects to own, to hedge prepayment risk, to generate additional income for the portfolio, to enhance returns on securities owned, to enhance the return on a security owned, to gain exposure to securities and to manage downside risks.
The potential risk to the fund is that the change in value of options contracts may not correspond to the change in value of the hedged instruments. In addition, losses may arise from changes in the value of the underlying instruments if there is an illiquid secondary market for the contracts, if interest or exchange rates move unexpectedly or if the counterparty to the contract is unable to perform. Realized gains and losses on purchased options are included in realized gains and losses on investment securities. If a written call option is exercised, the premium originally received is recorded as an addition to sales proceeds. If a written put option is exercised, the premium originally received is recorded as a reduction to the cost of investments.
Exchange-traded options are valued at the last sale price or, if no sales are reported, the last bid price for purchased options and the last ask price for written options. OTC traded options are valued using prices supplied by dealers.
Options on swaps are similar to options on securities except that the premium paid or received is to buy or grant the right to enter into a previously agreed upon interest rate or credit default contract. Forward premium swap option contracts include premiums that have extended settlement dates. The delayed settlement of the premiums is factored into the daily valuation of the option contracts. In the case of interest rate cap and floor contracts, in return for a premium, ongoing payments between two parties are based on interest rates exceeding a specified rate, in the case of a cap contract, or falling below a specified rate in the case of a floor contract.
Written option contracts outstanding at period end, if any, are listed after the fund’s portfolio.
Futures contracts The fund uses futures contracts to manage exposure to market risk, to hedge prepayment risk, to hedge interest rate risk, to gain exposure to interest rates and to equitize cash.
The potential risk to the fund is that the change in value of futures contracts may not correspond to the change in value of the hedged instruments. In addition, losses may arise from changes in the value of the underlying instruments, if there is an illiquid secondary market for the contracts, if interest or exchange rates move unexpectedly or if the counterparty to the contract is unable to perform. With futures, there is minimal counterparty credit risk to the fund since futures are exchange traded and the exchange’s clearinghouse, as counterparty to all exchange traded futures, guarantees the futures against default. Risks may exceed amounts recognized on the Statement of assets and liabilities. When the contract is closed, the fund records a realized gain or loss equal to the difference between the value of the contract at the time it was opened and the value at the time it was closed.
Futures contracts are valued at the quoted daily settlement prices established by the exchange on which they trade. The fund and the broker agree to exchange an amount of cash equal to the daily fluctuation in the value of the futures contract. Such receipts or payments are known as “variation margin.”
Futures contracts outstanding at period end, if any, are listed after the fund’s portfolio.
Forward currency contracts The fund buys and sells forward currency contracts, which are agreements between two parties to buy and sell currencies at a set price on a future date. These contracts are used to hedge foreign exchange risk and to gain exposure to currencies.
The U.S. dollar value of forward currency contracts is determined using current forward currency exchange rates supplied by a quotation service. The fair value of the contract will fluctuate with changes in currency exchange rates. The contract is marked to market daily and the change in fair value is recorded as an unrealized gain or loss. The fund records a realized gain or loss equal to the difference between the value of the contract at the time it was opened and the value at the time it was closed when the contract matures or by delivery of the currency. The fund could be exposed to risk if the value of the currency changes unfavorably, if the counterparties to the contracts are unable to meet the terms of their contracts or if the fund is unable to enter into a closing position. Risks may exceed amounts recognized on the Statement of assets and liabilities.
Forward currency contracts outstanding at period end, if any, are listed after the fund’s portfolio.
Interest rate swap contracts The fund entered into OTC and/or centrally cleared interest rate swap contracts, which are arrangements between two parties to exchange cash flows based on a notional principal amount, to hedge interest rate risk, to gain exposure on interest rates and to hedge prepayment risk.
An OTC and centrally cleared interest rate swap can be purchased or sold with an upfront premium. For OTC interest rate swap contracts, an upfront payment received by the fund is recorded as a liability on the fund’s books. An upfront payment made by the fund is recorded as an asset on the fund’s books. OTC and centrally cleared interest rate swap contracts are marked to market daily based
| |
| Putnam VT Global Asset Allocation Fund 39 |
upon quotations from an independent pricing service or market makers. Any change is recorded as an unrealized gain or loss on OTC interest rate swaps. Daily fluctuations in the value of centrally cleared interest rate swaps are settled through a central clearing agent and are recorded in variation margin on the Statement of assets and liabilities and recorded as unrealized gain or loss. Payments, including upfront premiums, received or made are recorded as realized gains or losses at the reset date or the closing of the contract. Certain OTC and centrally cleared interest rate swap contracts may include extended effective dates. Payments related to these swap contracts are accrued based on the terms of the contract.
The fund could be exposed to credit or market risk due to unfavorable changes in the fluctuation of interest rates or if the counterparty defaults, in the case of OTC interest rate contracts, or the central clearing agency or a clearing member defaults, in the case of centrally cleared interest rate swap contracts, on its respective obligation to perform under the contract. The fund’s maximum risk of loss from counterparty risk or central clearing risk is the fair value of the contract. This risk may be mitigated for OTC interest rate swap contracts by having a master netting arrangement between the fund and the counterparty and for centrally cleared interest rate swap contracts through the daily exchange of variation margin. There is minimal counterparty risk with respect to centrally cleared interest rate swap contracts due to the clearinghouse guarantee fund and other resources that are available in the event of a clearing member default. Risk of loss may exceed amounts recognized on the Statement of assets and liabilities.
OTC and centrally cleared interest rate swap contracts outstanding, including their respective notional amounts at period end, if any, are listed after the fund’s portfolio.
At the close of the reporting period, the fund has deposited cash valued at $22,121 in a segregated account to cover margin requirements on open centrally cleared interest rate swap contracts.
Total return swap contracts The fund entered into OTC and/or centrally cleared total return swap contracts, which are arrangements to exchange a market-linked return for a periodic payment, both based on a notional principal amount, to hedge sector exposure, to manage exposure to specific sectors or industries, to manage exposure to specific securities, to gain exposure to a basket of securities, to gain exposure to specific markets or countries and to gain exposure to specific sectors or industries.
To the extent that the total return of the security, index or other financial measure underlying the transaction exceeds or falls short of the offsetting interest rate obligation, the fund will receive a payment from or make a payment to the counterparty. OTC and/or centrally cleared total return swap contracts are marked to market daily based upon quotations from an independent pricing service or market maker. Any change is recorded as an unrealized gain or loss on OTC total return swaps. Daily fluctuations in the value of centrally cleared total return swaps are settled through a central clearing agent and are recorded in variation margin on the Statement of assets and liabilities and recorded as unrealized gain or loss. Payments received or made are recorded as realized gains or losses. Certain OTC and/or centrally cleared total return swap contracts may include extended effective dates. Payments related to these swap contracts are accrued based on the terms of the contract. The fund could be exposed to credit or market risk due to unfavorable changes in the fluctuation of interest rates or in the price of the underlying security or index, the possibility that there is no liquid market for these agreements or that the counterparty may default on its obligation to perform. The fund’s maximum risk of loss from counterparty risk or central clearing risk is the fair value of the contract. This risk may be mitigated for OTC total return swap contracts by having a master netting arrangement between the fund and the counterparty and for centrally cleared total return swap contracts through the daily exchange of variation margin. There is minimal counterparty risk with respect to centrally cleared total return swap contracts due to the clearinghouse guarantee fund and other resources that are available in the event of a clearing member default. Risk of loss may exceed amounts recognized on the Statement of assets and liabilities.
OTC and/or centrally cleared total return swap contracts outstanding, including their respective notional amounts at period end, if any, are listed after the fund’s portfolio.
Credit default contracts The fund entered into OTC and/or centrally cleared credit default contracts to hedge credit risk, to hedge market risk and to gain exposure on individual names and/or baskets of securities.
In OTC and centrally cleared credit default contracts, the protection buyer typically makes a periodic stream of payments to a counterparty, the protection seller, in exchange for the right to receive a contingent payment upon the occurrence of a credit event on the reference obligation or all other equally ranked obligations of the reference entity. Credit events are contract specific but may include bankruptcy, failure to pay, restructuring and obligation acceleration. For OTC credit default contracts, an upfront payment received by the fund is recorded as a liability on the fund’s books. An upfront payment made by the fund is recorded as an asset on the fund’s books. Centrally cleared credit default contracts provide the same rights to the protection buyer and seller except the payments between parties, including upfront premiums, are settled through a central clearing agent through variation margin payments. Upfront and periodic payments received or paid by the fund for OTC and centrally cleared credit default contracts are recorded as realized gains or losses at the reset date or close of the contract. The OTC and centrally cleared credit default contracts are marked to market daily based upon quotations from an independent pricing service or market makers. Any change in value of OTC credit default contracts is recorded as an unrealized gain or loss. Daily fluctuations in the value of centrally cleared credit default contracts are recorded in variation margin on the Statement of assets and liabilities and recorded as unrealized gain or loss. Upon the occurrence of a credit event, the difference between the par value and fair value of the reference obligation, net of any proportional amount of the upfront payment, is recorded as a realized gain or loss.
In addition to bearing the risk that the credit event will occur, the fund could be exposed to market risk due to unfavorable changes in interest rates or in the price of the underlying security or index or the possibility that the fund may be unable to close out its position at the same time or at the same price as if it had purchased the underlying reference obligations. In certain circumstances, the fund may enter into offsetting OTC and centrally cleared credit default contracts which would mitigate its risk of loss. Risks of loss may exceed amounts recognized on the Statement of assets and liabilities. The fund’s maximum risk of loss from counterparty risk, either as the protection seller or as the protection buyer, is the fair value of the contract. This risk may be mitigated for OTC credit default contracts by having a master netting arrangement between the fund and the counterparty and for centrally cleared credit default contracts through the daily exchange of variation margin. Counterparty risk is further mitigated with respect to centrally cleared credit default swap contracts due to the clearinghouse guarantee fund and other resources that are available in the event of a clearing member default. Where the fund is a seller of protection, the maximum potential amount of future payments the fund may be required to make is equal to the notional amount.
OTC and centrally cleared credit default contracts outstanding, including their respective notional amounts at period end, if any, are listed after the fund’s portfolio.
At the close of the reporting period, the fund has deposited cash valued at $163,664 in a segregated account to cover margin requirements on open centrally cleared credit default contracts.
TBA commitments The fund may enter into TBA (to be announced) commitments to purchase securities for a fixed unit price at a future date beyond customary settlement time. Although the unit price and par amount have been established, the actual securities have not been specified. However, it is anticipated that the amount of the commitments will not significantly differ from the principal amount. The fund holds, and maintains until settlement date, cash or high-grade debt obligations in an amount sufficient to meet the purchase price, or the fund may enter into offsetting contracts for the forward sale of other securities it owns. Income on the securities will not be earned until settlement date.
The fund may also enter into TBA sale commitments to hedge its portfolio positions, to sell mortgage-backed securities it owns under delayed delivery arrangements or to take a short position in mortgage-backed securities. Proceeds of TBA sale commitments are not received until the contractual settlement date. During the time a TBA sale commitment is outstanding, either equivalent deliverable securities or an offsetting TBA purchase commitment deliverable on or before the sale commitment date are held as “cover” for the transaction, or other liquid assets in an amount equal to the notional value of the TBA sale commitment are segregated. If the TBA sale commitment is closed through the acquisition of an offsetting TBA purchase commitment, the fund realizes a gain or loss. If the fund delivers securities under the commitment, the fund realizes a gain or a loss from the sale of the securities based upon the unit price established at the date the commitment was entered into.
TBA commitments, which are accounted for as purchase and sale transactions, may be considered securities themselves, and involve a risk of loss due to changes in the value of the security prior to the settlement date as well as the risk that the counterparty to the transaction will not perform its obligations. Counterparty risk is mitigated by having a master agreement between the fund and the counterparty.
Unsettled TBA commitments are valued at their fair value according to the procedures described under “Security valuation” above. The contract is marked to
| |
| 40 Putnam VT Global Asset Allocation Fund |
market daily and the change in fair value is recorded by the fund as an unrealized gain or loss. Based on market circumstances, Putnam Management will determine whether to take delivery of the underlying securities or to dispose of the TBA commitments prior to settlement.
TBA purchase commitments outstanding at period end, if any, are listed within the fund’s portfolio and TBA sale commitments outstanding at period end, if any, are listed after the fund’s portfolio.
Master agreements The fund is a party to ISDA (International Swaps and Derivatives Association, Inc.) Master Agreements that govern OTC derivative and foreign exchange contracts and Master Securities Forward Transaction Agreements that govern transactions involving mortgage-backed and other asset-backed securities that may result in delayed delivery (Master Agreements) with certain counterparties entered into from time to time. The Master Agreements may contain provisions regarding, among other things, the parties’ general obligations, representations, agreements, collateral requirements, events of default and early termination. With respect to certain counterparties, in accordance with the terms of the Master Agreements, collateral pledged to the fund is held in a segregated account by the fund’s custodian and, with respect to those amounts which can be sold or repledged, are presented in the fund’s portfolio.
Collateral pledged by the fund is segregated by the fund’s custodian and identified in the fund’s portfolio. Collateral can be in the form of cash or debt securities issued by the U.S. Government or related agencies or other securities as agreed to by the fund and the applicable counterparty. Collateral requirements are determined based on the fund’s net position with each counterparty.
With respect to ISDA Master Agreements, termination events applicable to the fund may occur upon a decline in the fund’s net assets below a specified threshold over a certain period of time. Termination events applicable to counterparties may occur upon a decline in the counterparty’s long-term or short-term credit ratings below a specified level. In each case, upon occurrence, the other party may elect to terminate early and cause settlement of all derivative and foreign exchange contracts outstanding, including the payment of any losses and costs resulting from such early termination, as reasonably determined by the terminating party. Any decision by one or more of the fund’s counterparties to elect early termination could impact the fund’s future derivative activity.
At the close of the reporting period, the fund had a net liability position of $46,041 on open derivative contracts subject to the Master Agreements. There was no collateral pledged by the fund at period end for these agreements.
Securities lending The fund may lend securities, through its agent, to qualified borrowers in order to earn additional income. The loans are collateralized by cash in an amount at least equal to the fair value of the securities loaned. The fair value of securities loaned is determined daily and any additional required collateral is allocated to the fund on the next business day. The remaining maturities of the securities lending transactions are considered overnight and continuous. The risk of borrower default will be borne by the fund’s agent; the fund will bear the risk of loss with respect to the investment of the cash collateral. Income from securities lending, if any, is net of expenses and is included in investment income on the Statement of operations. Cash collateral is invested in Putnam Cash Collateral Pool, LLC, a limited liability company managed by an affiliate of Putnam Management. Investments in Putnam Cash Collateral Pool, LLC are valued at its closing net asset value each business day. There are no management fees charged to Putnam Cash Collateral Pool, LLC. At the close of the reporting period, the fund had no securities out on loan.
Interfund lending The fund, along with other Putnam funds, may participate in an interfund lending program pursuant to an exemptive order issued by the SEC. This program allows the fund to borrow from or lend to other Putnam funds that permit such transactions. Interfund lending transactions are subject to each fund’s investment policies and borrowing and lending limits. Interest earned or paid on the interfund lending transaction will be based on the average of certain current market rates. During the reporting period, the fund did not utilize the program.
Lines of credit The fund participates, along with other Putnam funds, in a $320 million syndicated unsecured committed line of credit, provided by State Street ($160 million) and JPMorgan ($160 million), and a $235.5 million unsecured uncommitted line of credit, provided by State Street. Borrowings may be made for temporary or emergency purposes, including the funding of shareholder redemption requests and trade settlements. Interest is charged to the fund based on the fund’s borrowing at a rate equal to 1.25% plus the higher of (1) the Federal Funds rate and (2) the Overnight Bank Funding Rate for the committed line of credit and 1.30% plus the higher of (1) the Federal Funds rate and (2) the Overnight Bank Funding Rate for the uncommitted line of credit. A closing fee equal to 0.04% of the committed line of credit and 0.04% of the uncommitted line of credit has been paid by the participating funds and a $75,000 fee has been paid by the participating funds to State Street as agent of the syndicated committed line of credit. In addition, a commitment fee of 0.21% per annum on any unutilized portion of the committed line of credit is allocated to the participating funds based on their relative net assets and paid quarterly. During the reporting period, the fund had no borrowings against these arrangements.
Federal taxes It is the policy of the fund to distribute all of its taxable income within the prescribed time period and otherwise comply with the provisions of the Internal Revenue Code of 1986, as amended (the Code), applicable to regulated investment companies.
The fund is subject to the provisions of Accounting Standards Codification 740 Income Taxes (ASC 740). ASC 740 sets forth a minimum threshold for financial statement recognition of the benefit of a tax position taken or expected to be taken in a tax return. The fund did not have a liability to record for any unrecognized tax benefits in the accompanying financial statements. No provision has been made for federal taxes on income, capital gains or unrealized appreciation on securities held nor for excise tax on income and capital gains. Each of the fund’s federal tax returns for the prior three fiscal years remains subject to examination by the Internal Revenue Service.
The fund may also be subject to taxes imposed by governments of countries in which it invests. Such taxes are generally based on either income or gains earned or repatriated. The fund accrues and applies such taxes to net investment income, net realized gains and net unrealized gains as income and/or capital gains are earned. In some cases, the fund may be entitled to reclaim all or a portion of such taxes, and such reclaim amounts, if any, are reflected as an asset on the fund’s books. In many cases, however, the fund may not receive such amounts for an extended period of time, depending on the country of investment.
Under the Regulated Investment Company Modernization Act of 2010, the fund will be permitted to carry forward capital losses incurred for an unlimited period and the carry forwards will retain their character as either short-term or long-term capital losses. At December 31, 2023, the fund had the following capital loss carryovers available, to the extent allowed by the Code, to offset future net capital gain, if any:
| | |
| | Loss carryover | |
| Short-term | Long-term | Total |
| $867,173 | $— | $867,173 |
Distributions to shareholders Distributions to shareholders from net investment income, if any, are recorded by the fund on the ex-dividend date. Distributions from capital gains, if any, are recorded on the ex-dividend date and paid at least annually. The amount and character of income and gains to be distributed are determined in accordance with income tax regulations, which may differ from generally accepted accounting principles. These differences include temporary and/or permanent differences from losses on wash sale transactions, from foreign currency gains and losses, from unrealized gains and losses on certain futures contracts, from realized gains and losses on passive investment companies, from unrealized gains and losses on passive investment companies, from income on swap contracts and from interest-only securities. Reclassifications are made to the fund’s capital accounts to reflect income and gains available for distribution (or available capital loss carryovers) under income tax regulations. At the close of the reporting period, the fund reclassified $655,198 to increase undistributed net investment income and $655,198 to increase accumulated net realized loss.
Tax cost of investments includes adjustments to net unrealized appreciation (depreciation) which may not necessarily be final tax cost basis adjustments, but closely approximate the tax basis unrealized gains and losses that may be realized and distributed to shareholders. The tax basis components of distributable earnings and the federal tax cost as of the close of the reporting period were as follows:
| |
| Unrealized appreciation | $26,297,966 |
| Unrealized depreciation | (3,083,595) |
| Net unrealized appreciation | 23,214,371 |
| Undistributed ordinary income | 2,294,297 |
| Capital loss carryforward | (867,173) |
| Cost for federal income tax purposes | $81,808,737 |
Expenses of the Trust Expenses directly charged or attributable to any fund will be paid from the assets of that fund. Generally, expenses of the Trust will be allocated among and charged to the assets of each fund on a basis that the Trustees deem fair and equitable, which may be based on the relative assets of
| |
| Putnam VT Global Asset Allocation Fund 41 |
each fund or the nature of the services performed and relative applicability to each fund.
Beneficial interest At the close of the reporting period, insurance companies or their separate accounts were record owners of all but a de minimis number of the shares of the fund. Approximately 40.5% of the fund is owned by accounts of one insurance company.
Note 2 — Management fee, administrative services and other transactions
The fund pays Putnam Management a management fee (based on the fund’s average net assets and computed and paid monthly) at annual rates that may vary based on the average of the aggregate net assets of all open-end mutual funds sponsored by Putnam Management (excluding net assets of funds that are invested in, or that are invested in by, other Putnam funds to the extent necessary to avoid “double counting” of those assets). Such annual rates may vary as follows:
| |
| 0.750% | of the first $5 billion, |
| 0.700% | of the next $5 billion, |
| 0.650% | of the next $10 billion, |
| 0.600% | of the next $10 billion, |
| 0.550% | of the next $50 billion, |
| 0.530% | of the next $50 billion, |
| 0.520% | of the next $100 billion and |
| 0.515% | of any excess thereafter. |
For the reporting period, the management fee represented an effective rate (excluding the impact from any expense waivers in effect) of 0.590% of the fund’s average net assets.
Putnam Management has contractually agreed, through April 30, 2025, to waive fees and/or reimburse the fund’s expenses to the extent necessary to limit the cumulative expenses of the fund, exclusive of brokerage, interest, taxes, investment-related expenses, extraordinary expenses, acquired fund fees and expenses and payments under the fund’s investor servicing contract, investment management contract and distribution plan, on a fiscal year-to-date basis to an annual rate of 0.20% of the fund’s average net assets over such fiscal year-to-date period. During the reporting period, the fund’s expenses were reduced by $68,082 as a result of this limit.
PIL is authorized by the Trustees to manage a separate portion of the assets of the fund as determined by Putnam Management from time to time. PIL did not manage any portion of the assets of the fund during the reporting period. If Putnam Management were to engage the services of PIL, Putnam Management would pay a quarterly sub-management fee to PIL for its services at an annual rate of 0.25% of the average net assets of the equity and asset allocation portion of the fund managed by PIL and 0.20% of the average net assets of the fixed-income portion of the fund managed by PIL.
PAC is authorized by the Trustees to manage a separate portion of the assets of the fund, as designated from time to time by Putnam Management or PIL. PAC did not manage any portion of the assets of the fund during the reporting period. If Putnam Management or PIL were to engage the services of PAC, Putnam Management or PIL, as applicable, would pay a quarterly sub-advisory fee to PAC for its services at the annual rate of 0.25% of the average net assets of the equity and asset allocation portion of the fund’s assets for which PAC is engaged as sub-advisor and 0.20% of the average net assets of the fixed-income portion of the fund’s assets for which PAC is engaged as sub-advisor.
On January 1, 2024, a subsidiary of Franklin Templeton acquired Putnam U.S. Holdings I, LLC (“Putnam Holdings”), the parent company of Putnam Management, PIL, and PAC, in a stock and cash transaction (the “Transaction”). As a result of the Transaction, Putnam Management (the investment manager to the fund and a wholly-owned subsidiary of Putnam Holdings), PIL (a sub-adviser to the fund and an indirect, wholly-owned subsidiary of Putnam Holdings), and PAC (a sub-adviser to the fund and an indirect, wholly-owned subsidiary of Putnam Holdings) became indirect, wholly owned subsidiaries of Franklin Templeton. The Transaction also resulted in the automatic termination of the investment management contract between the fund and Putnam Management, the sub-management contract for the fund between Putnam Management and PIL, and the sub-advisory contract for the fund among Putnam Management, PIL, and PAC that were in place for the fund before the Transaction. However, Putnam Management, PIL, and PAC continue to provide uninterrupted services with respect to the fund pursuant to new investment management, sub-management, and sub-advisory contracts that were approved by fund shareholders at a shareholder meeting held in connection with the Transaction and that took effect on January 1, 2024. The terms of the new investment management, sub-management, and sub-advisory contracts are substantially similar to those of the previous investment management, sub-management, and sub-advisory contracts, and the fee rates payable under the new investment management, sub-management, and sub-advisory contracts are the same as the fee rates under the previous investment management, sub-management, and sub-advisory contracts.
The fund reimburses Putnam Management an allocated amount for the compensation and related expenses of certain officers of the fund and their staff who provide administrative services to the fund. The aggregate amount of all such reimbursements is determined annually by the Trustees.
Custodial functions for the fund’s assets are provided by State Street. Custody fees are based on the fund’s asset level, the number of its security holdings and transaction volumes.
Putnam Investor Services, Inc., an affiliate of Putnam Management, provides investor servicing agent functions to the fund. Putnam Investor Services, Inc. was paid a monthly fee for investor servicing at an annual rate of 0.07% of the fund’s average daily net assets. During the reporting period, the expenses for each class of shares related to investor servicing fees were as follows:
| |
| Class IA | $46,695 |
| Class IB | 21,780 |
| Total | $68,475 |
The fund has entered into expense offset arrangements with Putnam Investor Services, Inc. and State Street whereby Putnam Investor Services, Inc.’s and State Street’s fees are reduced by credits allowed on cash balances. For the reporting period, the fund’s expenses were reduced by $1,571 under the expense offset arrangements.
Each Independent Trustee of the fund receives an annual Trustee fee, of which $82, as a quarterly retainer, has been allocated to the fund, and an additional fee for each Trustees meeting attended. Trustees also are reimbursed for expenses they incur relating to their services as Trustees.
The fund has adopted a Trustee Fee Deferral Plan (the Deferral Plan) which allows the Trustees to defer the receipt of all or a portion of Trustees fees payable from July 1, 1995 through December 31, 2023. The deferred fees remain invested in certain Putnam funds until distribution in accordance with the Deferral Plan.
The fund has adopted an unfunded noncontributory defined benefit pension plan (the Pension Plan) covering all Trustees of the fund who have served as a Trustee for at least five years and were first elected prior to 2004. Benefits under the Pension Plan are equal to 50% of the Trustee’s average annual attendance and retainer fees for the three years ended December 31, 2005. The retirement benefit is payable during a Trustee’s lifetime, beginning the year following retirement, for the number of years of service through December 31, 2006. Pension expense for the fund is included in Trustee compensation and expenses in the Statement of operations. Accrued pension liability is included in Payable for Trustee compensation and expenses in the Statement of assets and liabilities. The Trustees have terminated the Pension Plan with respect to any Trustee first elected after 2003.
The fund has adopted a distribution plan (the Plan) with respect to its class IB shares pursuant to Rule 12b–1 under the Investment Company Act of 1940. The purpose of the Plan is to compensate Putnam Retail Management Limited Partnership, an indirect wholly-owned subsidiary of Franklin Templeton, for services provided and expenses incurred in distributing shares of the fund. The Plan provides for payment by the fund to Putnam Retail Management Limited Partnership at an annual rate of up to 0.35% of the average net assets attributable to the fund’s class IB shares. The Trustees have approved payment by the fund at an annual rate of 0.25% of the average net assets attributable to the fund’s class IB shares. The expenses related to distribution fees during the reporting period are included in Distribution fees in the Statement of operations.
| |
| 42 Putnam VT Global Asset Allocation Fund |
Note 3 — Purchases and sales of securities
During the reporting period, the cost of purchases and the proceeds from sales, excluding short-term investments, were as follows:
| | |
| | Cost of | Proceeds |
| | purchases | from sales |
| Investments in securities, including | | |
| TBA commitments | | |
| (Long-term) | $256,844,253 | $264,224,480 |
| U.S. government securities | | |
| (Long-term) | — | — |
| Total | $256,844,253 | $264,224,480 |
The fund may purchase or sell investments from or to other Putnam funds in the ordinary course of business, which can reduce the fund’s transaction costs, at prices determined in accordance with SEC requirements and policies approved by the Trustees. During the reporting period, purchases or sales of long-term securities from or to other Putnam funds, if any, did not represent more than 5% of the fund’s total cost of purchases and/or total proceeds from sales.
Note 4 — Capital shares
At the close of the reporting period, there were an unlimited number of shares of beneficial interest authorized. Subscriptions and redemptions are presented at the omnibus level. Transactions in capital shares were as follows:
| | | | | | | | |
| | | Class IA shares | | | Class IB shares | |
| | Year ended 12/31/23 | Year ended 12/31/22 | Year ended 12/31/23 | Year ended 12/31/22 |
| | Shares | Amount | Shares | Amount | Shares | Amount | Shares | Amount |
| Shares sold | 42,329 | $683,912 | 25,017 | $416,761 | 127,924 | $2,109,385 | 109,349 | $1,865,038 |
| Shares issued in connection with | | | | | | | | |
| reinvestment of distributions | 79,264 | 1,231,765 | 479,480 | 8,256,649 | 30,348 | 480,710 | 212,278 | 3,723,358 |
| | 121,593 | 1,915,677 | 504,497 | 8,673,410 | 158,272 | 2,590,095 | 321,627 | 5,588,396 |
| Shares repurchased | (579,637) | (9,323,982) | (596,803) | (9,772,645) | (379,468) | (6,209,690) | (331,914) | (5,424,532) |
| Net increase (decrease) | (458,044) | $(7,408,305) | (92,306) | $(1,099,235) | (221,196) | $(3,619,595) | (10,287) | $163,864 |
Note 5 — Affiliated transactions
Transactions during the reporting period with any company which is under common ownership or control were as follows:
| | | | | |
| | | | | | Shares outstanding |
| | Fair value as of | | | | and fair value as of |
| Name of affiliate | 12/31/22 | Purchase cost | Sale proceeds | Investment income | 12/31/23 |
| Short-term investments | | | | | |
| Putnam Cash Collateral Pool, LLC* | $271,878 | $2,855,032 | $3,126,910 | $4,414 | $— |
| Putnam Short Term Investment Fund | | | | | |
| Class P** | 2,067,499 | 30,440,726 | 24,620,310 | 240,750 | 7,887,915 |
| Total Short-term investments | $2,339,377 | $33,295,758 | $27,747,220 | $245,164 | $7,887,915 |
* No management fees are charged to Putnam Cash Collateral Pool, LLC (Note 1). Investment income shown is included in securities lending income on the Statement of operations. There were no realized or unrealized gains or losses during the period.
** Management fees charged to Putnam Short Term Investment Fund have been waived by Putnam Management. There were no realized or unrealized gains or losses during the period.
Note 6 — Market, credit and other risks
In the normal course of business, the fund trades financial instruments and enters into financial transactions where risk of potential loss exists due to changes in the market (market risk) or failure of the contracting party to the transaction to perform (credit risk). The fund may be exposed to additional credit risk that an institution or other entity with which the fund has unsettled or open transactions will default. Investments in foreign securities involve certain risks, including those related to economic instability, unfavorable political developments, and currency fluctuations. The fund may invest a significant portion of its assets in securitized debt instruments, including mortgage-backed and asset-backed investments. The yields and values of these investments are sensitive to changes in interest rates, the rate of principal payments on the underlying assets and the market’s perception of the issuers. The market for these investments may be volatile and limited, which may make them difficult to buy or sell.
Note 7 — Senior loan commitments
Senior loans are purchased or sold on a when-issued or delayed delivery basis and may be settled a month or more after the trade date, which from time to time can delay the actual investment of available cash balances; interest income is accrued based on the terms of the securities. Senior loans can be acquired through an agent, by assignment from another holder of the loan, or as a participation interest in another holder’s portion of the loan. When the fund invests in a loan or participation, the fund is subject to the risk that an intermediate participant between the fund and the borrower will fail to meet its obligations to the fund, in addition to the risk that the borrower under the loan may default on its obligations.
| |
| Putnam VT Global Asset Allocation Fund 43 |
Note 8 — Summary of derivative activity
The volume of activity for the reporting period for any derivative type that was held during the period is listed below and was based on an average of the holdings at the end of each fiscal quarter:
| |
| Purchased equity option contracts (contract amount) | $600 |
| Written equity option contracts (contract amount) | $300 |
| Futures contracts (number of contracts) | 200 |
| Forward currency contracts (contract amount) | $2,200,000 |
| Centrally cleared interest rate swap contracts (notional) | $11,600,000 |
| OTC total return swap contracts (notional) | $13,500,000 |
| OTC credit default contracts (notional) | $420,000 |
| Centrally cleared credit default contracts (notional) | $3,900,000 |
The following is a summary of the fair value of derivative instruments as of the close of the reporting period:
Fair value of derivative instruments as of the close of the reporting period
| | | | |
| | Asset derivatives | Liability derivatives |
| Derivatives not accounted for as hedging | Statement of assets and | | Statement of assets and | |
| instruments under ASC 815 | liabilities location | Fair value | liabilities location | Fair value |
| Credit contracts | Receivables | $181,222 | Payables | $23,408 |
| Foreign exchange contracts | Receivables | 31,108 | Payables | 44,760 |
| | Investments, Receivables, | | | |
| | Net assets — Unrealized | | | |
| Equity contracts | appreciation | 493,900* | Payables | 593,661 |
| | | | Payables, Net assets — | |
| | Receivables, Net assets — | | Unrealized | |
| Interest rate contracts | Unrealized appreciation | 599,681* | depreciation | 111,909* |
| Total | | $1,305,911 | | $773,738 |
*Includes cumulative appreciation/depreciation of futures contracts and/or centrally cleared swaps as reported in the fund’s portfolio. Only current day’s variation margin is reported within the Statement of assets and liabilities.
The following is a summary of realized and change in unrealized gains or losses of derivative instruments in the Statement of operations for the reporting period (Note 1):
Amount of realized gain or (loss) on derivatives recognized in net gain or (loss) on investments
| | | | |
| Derivatives not accounted for as hedging | | Forward currency | | |
| instruments under ASC 815 | Futures | contracts | Swaps | Total |
| Credit contracts | $— | $— | $127,266 | $127,266 |
| Foreign exchange contracts | — | 104,381 | — | $104,381 |
| Equity contracts | (3,171,287) | — | 323,090 | $(2,848,197) |
| Interest rate contracts | (459,938) | — | (7,780) | $(467,718) |
| Total | $(3,631,225) | $104,381 | $442,576 | $(3,084,268) |
Change in unrealized appreciation or (depreciation) on derivatives recognized in net gain or (loss) on investments
| | | | | |
| Derivatives not accounted for as hedging | | | Forward currency | | |
| instruments under ASC 815 | Options | Futures | contracts | Swaps | Total |
| Credit contracts | $— | $— | $— | $37,219 | $37,219 |
| Foreign exchange contracts | — | — | (31,081) | — | $(31,081) |
| Equity contracts | (94,426) | (799,579) | — | (5,824) | $(899,829) |
| Interest rate contracts | — | 542,637 | — | (2,431) | $540,206 |
| Total | $(94,426) | $(256,942) | $(31,081) | $28,964 | $(353,485) |
| |
| 44 Putnam VT Global Asset Allocation Fund |
|
| This page intentionally left blank. |
| |
| Putnam VT Global Asset Allocation Fund 45 |
Note 9 — Offsetting of financial and derivative assets and liabilities
The following table summarizes any derivatives, repurchase agreements and reverse repurchase agreements, at the end of the reporting period, that are subject to an enforceable master netting agreement or similar agreement. For securities lending transactions or borrowing transactions associated with securities sold short, if any, see Note 1. For financial reporting purposes, the fund does not offset financial assets and financial liabilities that are subject to the master netting agreements in the Statement of assets and liabilities.
| | | | | | | | | | | | | | | | | |
| | Bank of America N.A. | Barclays Bank PLC | Barclays Capital, Inc. (clearing broker) | BofA Securities, Inc. | Citibank, N.A. | Citigroup Global Markets, Inc. | Credit Suisse International | Goldman Sachs International | HSBC Bank USA, National Association | JPMorgan Chase Bank N.A. | JPMorgan Securities LLC | Merrill Lynch International | Morgan Stanley & Co. International PLC | NatWest Markets PLC | State Street Bank and Trust Co. | WestPac Banking Corp. | Total |
| Assets: | | | | | | | | | | | | | | | | | |
| Centrally cleared interest rate | | | | | | | | | | | | | | | | | |
| swap contracts§ | $— | $— | $617 | $— | $— | $— | $— | $— | $— | $— | $— | $— | $— | $— | $— | $— | $617 |
| OTC Total return | | | | | | | | | | | | | | | | | |
| swap contracts*# | — | 60,476 | — | — | — | — | — | 58,531 | — | — | — | — | — | — | — | — | 119,007 |
| OTC Credit default contracts — | | | | | | | | | | | | | | | | | |
| protection sold*# | — | — | — | — | — | — | — | — | — | — | — | — | — | — | — | — | — |
| OTC Credit default contracts — | | | | | | | | | | | | | | | | | |
| protection purchased*# | — | — | — | — | — | 8,932 | 13,359 | 3,065 | — | — | 5,065 | 2,689 | 13,666 | — | — | — | 46,776 |
| Centrally cleared credit | | | | | | | | | | | | | | | | | |
| default contracts§ | — | — | — | — | — | — | — | — | — | — | — | — | — | — | — | — | — |
| Futures contracts§ | — | — | — | 33,704 | — | — | — | — | — | — | 6,016 | — | — | — | — | — | 39,720 |
| Forward currency contracts# | 448 | — | — | — | 12,165 | — | — | — | 64 | 5,626 | — | — | 11,230 | — | 827 | 748 | 31,108 |
| Purchased options**# | — | — | — | — | 150,980 | — | — | — | — | — | — | — | — | — | — | — | 150,980 |
| Total Assets | $448 | $60,476 | $617 | $33,704 | $163,145 | $8,932 | $13,359 | $61,596 | $64 | $5,626 | $11,081 | $2,689 | $24,896 | $— | $827 | $748 | $388,208 |
| Liabilities: | | | | | | | | | | | | | | | | | |
| Centrally cleared interest rate | | | | | | | | | | | | | | | | | |
| swap contracts§ | — | — | 2,301 | — | — | — | — | — | — | — | — | — | — | — | — | — | 2,301 |
| OTC Total return | | | | | | | | | | | | | | | | | |
| swap contracts*# | — | 70,494 | — | — | — | — | — | 56,933 | — | — | — | — | — | — | — | — | 127,427 |
| OTC Credit default contracts — | | | | | | | | | | | | | | | | | |
| protection sold*# | 2,583 | — | — | — | — | 12,378 | 3,994 | 1,447 | — | — | 1,437 | — | 1,569 | — | — | — | 23,408 |
| OTC Credit default contracts — | | | | | | | | | | | | | | | | | |
| protection purchased*# | — | — | — | — | — | — | — | — | — | — | — | — | — | — | — | — | — |
| Centrally cleared credit | | | | | | | | | | | | | | | | | |
| default contracts§ | — | — | 1,853 | — | — | — | — | — | — | — | — | — | — | — | — | — | 1,853 |
| Futures contracts§ | — | — | — | 48,980 | — | — | — | — | — | — | 10,219 | — | — | — | — | — | 59,199 |
| Forward currency contracts# | — | — | — | — | 1,538 | — | — | 19,973 | — | 11,845 | — | — | 3,938 | 7,466 | — | — | 44,760 |
| Written options# | — | — | — | — | 26,066 | — | — | — | — | — | — | — | — | — | — | — | 26,066 |
| Total Liabilities | $2,583 | $70,494 | $4,154 | $48,980 | $27,604 | $12,378 | $3,994 | $78,353 | $— | $11,845 | $11,656 | $— | $5,507 | $7,466 | $— | $— | $285,014 |
| Total Financial and Derivative | | | | | | | | | | | | | | | | | |
| Net Assets | $(2,135) | $(10,018) | $(3,537) | $(15,276) | $135,541 | $(3,446) | $9,365 | $(16,757) | $64 | $(6,219) | $(575) | $2,689 | $19,389 | $(7,466) | $827 | $748 | $103,194 |
| Total collateral received | | | | | | | | | | | | | | | | | |
| (pledged)†## | $— | $— | $— | $— | $135,541 | $— | $— | $— | $— | $— | $— | $— | $— | $— | $— | $— | |
| Net amount | $(2,135) | $(10,018) | $(3,537) | $(15,276) | $— | $(3,446) | $9,365 | $(16,757) | $64 | $(6,219) | $(575) | $2,689 | $19,389 | $(7,466) | $827 | $748 | |
| Controlled collateral received | | | | | | | | | | | | | | | | | |
| (including TBA commitments)** | $— | $— | $— | $— | $170,000 | $— | $— | $— | $— | $— | $— | $— | $— | $— | $— | $— | $170,000 |
| Uncontrolled collateral received | $— | $— | $— | $— | $— | $— | $— | $— | $— | $— | $— | $— | $— | $— | $— | $— | $— |
| Collateral (pledged) (including | | | | | | | | | | | | | | | | | |
| TBA commitments)** | $— | $— | $— | $— | $— | $— | $— | $— | $— | $— | $— | $— | $— | $— | $— | $— | $— |
*Excludes premiums, if any. Included in unrealized appreciation and depreciation on OTC swap contracts on the Statement of assets and liabilities.
**Included with Investments in securities on the Statement of assets and liabilities.
†Additional collateral may be required from certain brokers based on individual agreements.
#Covered by master netting agreement (Note 1).
##Any over-collateralization of total financial and derivative net assets is not shown. Collateral may include amounts related to unsettled agreements.
§Includes current day’s variation margin only as reported on the Statement of assets and liabilities, which is not collateralized. Cumulative appreciation/(depreciation) for futures contracts and centrally cleared swap contracts is represented in the tables listed after the fund’s portfolio. Collateral pledged for initial margin on futures contracts and centrally cleared swap contracts, which is not included in the table above, amounted to $1,071,139 and $185,785, respectively.
| |
| 46 Putnam VT Global Asset Allocation Fund | Putnam VT Global Asset Allocation Fund 47 |
Federal tax information (Unaudited)
The fund designated 50.83% of ordinary income distributions as qualifying for the dividends received deduction for corporations.
| |
| 48 Putnam VT Global Asset Allocation Fund |
Shareholder meeting results (Unaudited)
October 20, 2023 special meeting
At the meeting, a new Management Contract for your fund with Putnam Investment Management, LLC was approved, as follows:
| | |
| Votes for | Votes against | Abstentions/Votes withheld |
| 5,204,707 | 276,194 | 458,858 |
At the meeting, a new Sub-Management Contract for your fund between Putnam Investment Management, LLC and Putnam Investments Limited was approved, as follows:
| | |
| Votes for | Votes against | Abstentions/Votes withheld |
| 5,184,652 | 277,129 | 477,978 |
At the meeting, a new Sub-Advisory Contract for your fund between Putnam Investment Management, LLC, Putnam Investments Limited and The Putnam Advisory Company, LLC was approved, as follows:
| | |
| Votes for | Votes against | Abstentions/Votes withheld |
| 5,198,124 | 275,761 | 465,874 |
All tabulations are rounded to the nearest whole number.
| |
| Putnam VT Global Asset Allocation Fund 49 |
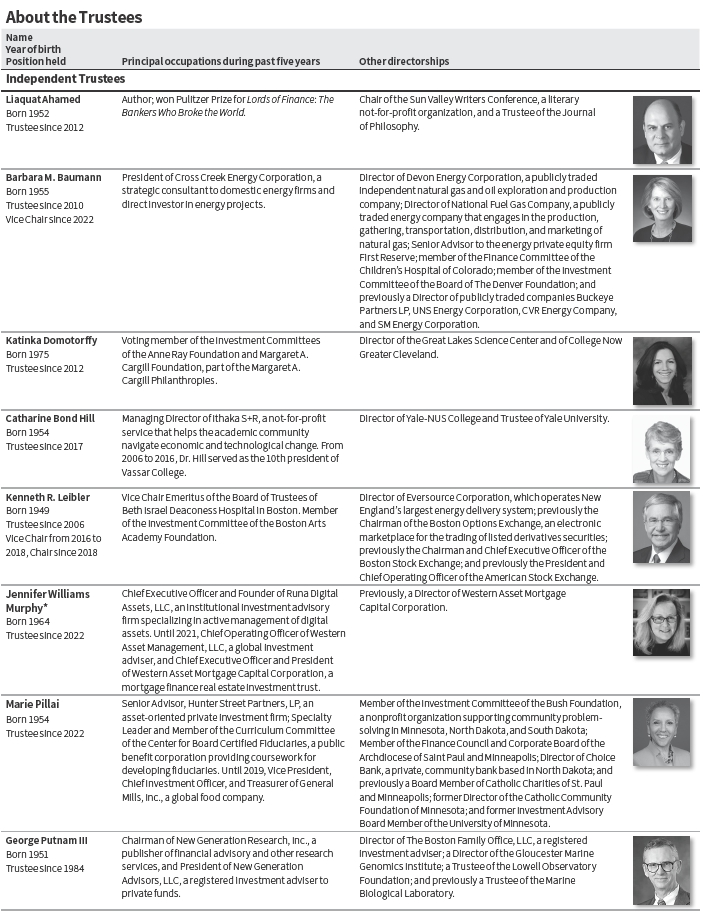
| |
| 50 Putnam VT Global Asset Allocation Fund |
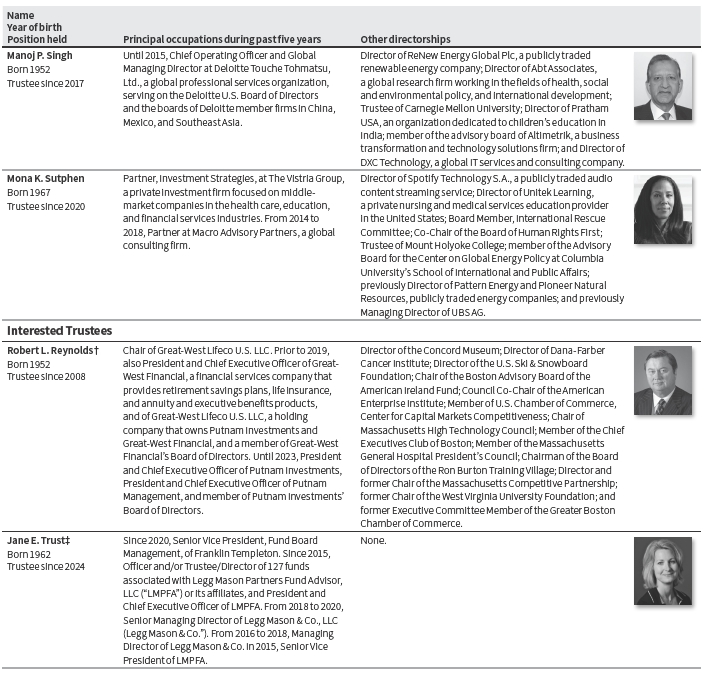
*Ms. Murphy is the founder, controlling member, and Chief Executive Officer of Runa Digital Assets, LLC (“RDA”), the investment manager of Runa Digital Partners, LP (“RDP”), a private investment fund. Ms. Murphy also holds a controlling interest in RDP’s general partner and is a limited partner in RDP. A subsidiary of Franklin Templeton and certain individuals employed by Franklin Templeton or its affiliates have made passive investments as limited partners in RDP (one of whom serves on the advisory board for RDA, which has no governance or oversight authority over RDA), representing in the aggregate approximately 33% of RDP as of October 31, 2023. In addition, if certain conditions are met, Franklin Templeton will be entitled to receive a portion of any incentive compensation allocable to RDP’s general partner. For so long as Franklin Templeton maintains its investment in RDP, Ms. Murphy also has agreed upon request to advise and consult with Franklin Templeton and its affiliates on the market for digital assets. Ms. Murphy provides similar service to other limited partners in RDP that request her advice. Ms. Murphy also is entitled to receive deferred cash compensation in connection with her prior employment by an affiliate of Franklin Templeton, which employment ended at the end of 2021. With regard to Ms. Murphy, the relationships described above may give rise to a potential conflict of interest with respect to the Funds.
†Mr. Reynolds is an “interested person” (as defined in the Investment Company Act of 1940) of the fund and Putnam Management. He is President of your fund and each of the other Putnam funds and holds direct beneficial interest in shares of Franklin Templeton, of which Putnam Management is an indirect wholly-owned subsidiary.
‡Ms. Trust is an “interested person” (as defined in the Investment Company Act of 1940) of the fund and Putnam Management by virtue of her positions with certain affiliates of Putnam Management.
The address of each Trustee is 100 Federal Street, Boston, MA 02110.
As of December 31, 2023, there were 105 funds in the Putnam family of funds, including 89 mutual funds, 4 closed-end funds, and 12 exchange-traded funds. Each Trustee serves as Trustee of the 105 funds in the Putnam family of funds. Ms. Trust also serves as Trustee of 127 other funds that are advised by one or more affiliates of Putnam Management.
Each Trustee serves for an indefinite term, until his or her resignation, retirement at age 75, removal, or death.
| | |
| Putnam VT Global Asset Allocation Fund 51 |
Officers
In addition to Robert L. Reynolds, the other officers of the fund are shown below:
| | |
| Kevin R. Blatchford (Born 1967) | Kelley Hunt (Born 1984) | Denere P. Poulack (Born 1968) |
| Vice President and Assistant Treasurer | AML Compliance Officer | Assistant Vice President, Assistant Clerk, |
| Since 2023 | Since 2023 | and Assistant Treasurer |
| Director, Financial Reporting, Putnam Holdings | Manager, U.S. Financial Crime Compliance, | Since 2004 |
| | Franklin Templeton | |
| James F. Clark (Born 1974) | | Janet C. Smith (Born 1965) |
| Vice President and Chief Compliance Officer | Martin Lemaire (Born 1984) | Vice President, Principal Financial |
| Since 2016 | Vice President and Derivatives Risk Manager | Officer, Principal Accounting Officer, |
| Chief Compliance Officer, Putnam Management | Since 2022 | and Assistant Treasurer |
| and Putnam Holdings | Risk Manager and Risk Analyst, | Since 2007 |
| | Putnam Management | Head of Fund Administration Services, Putnam |
| Michael J. Higgins (Born 1976) | | Holdings and Putnam Management |
| Vice President, Treasurer, and Clerk | Alan G. McCormack (Born 1964) | |
| Since 2010 | Vice President and Derivatives Risk Manager | Stephen J. Tate (Born 1974) |
| | Since 2022 | Vice President and Chief Legal Officer |
| Jonathan S. Horwitz (Born 1955) | Head of Quantitative Equities and Risk, | Since 2021 |
| Executive Vice President, Principal Executive | Putnam Management | General Counsel, Putnam Holdings, Putnam |
| Officer, and Compliance Liaison | | Management, and Putnam Retail Management |
| Since 2004 | | |
The principal occupations of the officers for the past five years have been with the employers as shown above, although in some cases they have held different positions with such employers. The address of each officer, other than Ms. Hunt, is 100 Federal Street, Boston, MA 02110. Ms. Hunt’s address is 100 Fountain Parkway, St. Petersburg, FL 33716.
| |
| 52 Putnam VT Global Asset Allocation Fund |
Other important information
Proxy voting
The Putnam funds’ proxy voting guidelines and procedures, as well as information regarding how your fund voted proxies relating to portfoliosecurities during the 12-month period ended June 30, 2023, are available in the Individual Investors section of putnam.com and on the Securities and Exchange Commission’s (SEC) website at www.sec.gov. If you have questions about finding forms on the SEC’s website, you may call the SEC at 1-800-SEC-0330. You may also obtain the Putnam funds’ proxy voting guidelines and procedures at no charge by calling 1-800-225-1581.
Fund portfolio holdings
The fund will file a complete schedule of its portfolio holdings with the SEC for the first and third quarters of each fiscal year on Form N-PORT within 60 days of the end of such fiscal quarter. Shareholders may obtain the fund’s Form N-PORT from the SEC’s website at www.sec.gov.
Fund information
| | |
| Investment Manager | Investor Servicing Agent | Trustees |
| Putnam Investment Management, LLC | Putnam Investments | Kenneth R. Leibler, Chair |
| 100 Federal Street | Mailing address: | Barbara M. Baumann, Vice Chair |
| Boston, MA 02110 | P.O. Box 219697 | Liaquat Ahamed |
| | Kansas City, MO 64121-9697 | Katinka Domotorffy |
| Investment Sub-Advisors | 1-800-225-1581 | Catharine Bond Hill |
| Putnam Investments Limited | | Jennifer Williams Murphy |
| 16 St James’s Street | Custodian | Marie Pillai |
| London, England SW1A 1ER | State Street Bank and Trust Company | George Putnam III |
| | | Robert L. Reynolds |
| The Putnam Advisory Company, LLC | Legal Counsel | Manoj P. Singh |
| 100 Federal Street | Ropes & Gray LLP | Mona K. Sutphen |
| Boston, MA 02110 | | Jane E. Trust |
| | Independent Registered | |
| Marketing Services | Public Accounting Firm | |
| Putnam Retail Management | PricewaterhouseCoopers LLP | |
| Limited Partnership | | |
| 100 Federal Street | | |
| Boston, MA 02110 | | |
The fund’s Statement of Additional Information contains additional information about the fund’s Trustees and is available without charge upon request by calling 1-800-225-1581.
| |
| Putnam VT Global Asset Allocation Fund 53 |
| |
| This report has been prepared for the shareholders | |
| of Putnam VT Global Asset Allocation Fund. | ANVT83 335889 2/24 |
| |
| (a) The fund’s principal executive, financial and accounting officers are employees of Putnam Investment Management, LLC, the Fund’s investment manager. As such they are subject to a comprehensive Code of Ethics adopted and administered by Putnam Investments which is designed to protect the interests of the firm and its clients. The Fund has adopted a Code of Ethics which incorporates the Code of Ethics of Putnam Investments with respect to all of its officers and Trustees who are employees of Putnam Investment Management, LLC. For this reason, the Fund has not adopted a separate code of ethics governing its principal executive, financial and accounting officers. |
| |
| (c) In connection with the acquisition of Putnam Investments by Franklin Templeton, the Putnam Investments Code of Ethics was amended effective January 1, 2024 to reflect revised compliance processes, including: (i) Compliance with the Putnam Investments Code of Ethics will be viewed as compliance with the Franklin Templeton Code for certain Putnam employees who are dual-hatted in Franklin Templeton advisory entities (ii) Certain Franklin Templeton employees are required to hold shares of Putnam mutual funds at Putnam Investor Services, Inc. and (iii) Certain provisions of the Putnam Investments Code of Ethics are amended that are no longer needed due to organizational changes. |
| |
| Item 3. Audit Committee Financial Expert: |
| |
| The Funds’ Audit, Compliance and Risk Committee is comprised solely of Trustees who are “independent” (as such term has been defined by the Securities and Exchange Commission (“SEC”) in regulations implementing Section 407 of the Sarbanes-Oxley Act (the “Regulations”)). The Trustees believe that each member of the Audit, Compliance and Risk Committee also possesses a combination of knowledge and experience with respect to financial accounting matters, as well as other attributes, that qualifies him or her for service on the Committee. In addition, the Trustees have determined that each of Dr. Hill, Ms. Murphy and Mr. Singh qualifies as an “audit committee financial expert” (as such term has been defined by the Regulations) based on their review of his or her pertinent experience and education.The SEC has stated, and the funds’ amended and restated agreement and Declaration of Trust provides, that the designation or identification of a person as an audit committee financial expert pursuant to this Item 3 of Form N-CSR does not impose on such person any duties, obligations or liability that are greater than the duties, obligations and liability imposed on such person as a member of the Audit, Compliance and Risk Committee and the Board of Trustees in the absence of such designation or identification. |
| |
| Item 4. Principal Accountant Fees and Services: |
| |
| The following table presents fees billed in each of the last two fiscal years for services rendered to the fund by the fund’s independent auditor: |
| | | | | |
| Fiscal year ended | Audit Fees | Audit-Related Fees | Tax Fees | All Other Fees |
|
|
| | | | | |
| December 31, 2023 | $120,835 | $ — | $10,636 | $ — |
| December 31, 2022 | $99,786 | $ — | $11,840 | $ — |
| |
| For the fiscal years ended December31, 2023 and December 31, 2022, the fund’s independent auditor billed aggregate non-audit fees in the amounts of $370,768 and $253,851 respectively, to the fund, Putnam Management and any entity controlling, controlled by or under common control with Putnam Management that provides ongoing services to the fund. |
| |
| Audit Fees represent fees billed for the fund’s last two fiscal years relating to the audit and review of the financial statements included in annual reports and registration statements, and other services that are normally provided in connection with statutory and regulatory filings or engagements. |
| |
| Audit-Related Fees represent fees billed in the fund’s last two fiscal years for services traditionally performed by the fund’s auditor, including accounting consultation for proposed transactions or concerning financial accounting and reporting standards and other audit or attest services not required by statute or regulation. |
| |
| Tax Fees represent fees billed in the fund’s last two fiscal years for tax compliance, tax planning and tax advice services. Tax planning and tax advice services include assistance with tax audits, employee benefit plans and requests for rulings or technical advice from taxing authorities. |
| |
| Pre-Approval Policies of the Audit, Compliance and Risk Committee. The Audit, Compliance and Risk Committee of the Putnam funds has determined that, as a matter of policy, all work performed for the funds by the funds’ independent auditors will be pre-approved by the Committee itself and thus will generally not be subject to pre-approval procedures. |
| |
| The Audit, Compliance and Risk Committee also has adopted a policy to pre-approve the engagement by Putnam Management and certain of its affiliates of the funds’ independent auditors, even in circumstances where pre-approval is not required by applicable law. Any such requests by Putnam Management or certain of its affiliates are typically submitted in writing to the Committee and explain, among other things, the nature of the proposed engagement, the estimated fees, and why this work should be performed by that particular audit firm as opposed to another one. In reviewing such requests, the Committee considers, among other things, whether the provision of such services by the audit firm are compatible with the independence of the audit firm. |
| |
| The following table presents fees billed by the fund’s independent auditor for services required to be approved pursuant to paragraph (c)(7)(ii) of Rule 2–01 of Regulation S-X. |
| | | | | |
| Fiscal year ended | Audit-Related Fees | Tax Fees | All Other Fees | Total Non-Audit Fees |
|
|
| December 31, 2023 | $ — | $360,132 | $ — | $ — |
| December 31, 2022 | $ — | $242,011 | $ — | $ — |
| |
| Item 5. Audit Committee of Listed Registrants |
| |
| Item 6. Schedule of Investments: |
| |
| The registrant’s schedule of investments in unaffiliated issuers is included in the report to shareholders in Item 1 above. |
| |
| Item 7. Disclosure of Proxy Voting Policies and Procedures For Closed-End Management Investment Companies: |
| |
| Item 8. Portfolio Managers of Closed-End Investment Companies |
| |
| Item 9. Purchases of Equity Securities by Closed-End Management Investment Companies and Affiliated Purchasers: |
| |
| Item 10. Submission of Matters to a Vote of Security Holders: |
| |
| Item 11. Controls and Procedures: |
| |
| (a) The registrant’s principal executive officer and principal financial officer have concluded, based on their evaluation of the effectiveness of the design and operation of the registrant’s disclosure controls and procedures as of a date within 90 days of the filing date of this report, that the design and operation of such procedures are generally effective to provide reasonable assurance that information required to be disclosed by the registrant in this report is recorded, processed, summarized and reported within the time periods specified in the Commission’s rules and forms. |
| |
| (b) Changes in internal control over financial reporting: Not applicable |
| |
| Item 12. Disclosures of Securities Lending Activities for Closed-End Management Investment Companies: |
| |
| Item 13. Recovery of Erroneously Awarded Compensation. |
| |
| (a)(1) The Code of Ethics of The Putnam Funds, which incorporates the Code of Ethics of Putnam Investments, is filed herewith |
| |
| (a)(2) Any policy required by the listing standards adopted pursuant to Rule 10D-1 under the Exchange Act (17 CFR 240.10D-1) by the registered national securities exchange or registered national securities association upon which the registrant’s securities are listed. Not Applicable |
| |
| Pursuant to the requirements of the Securities Exchange Act of 1934 and the Investment Company Act of 1940, the registrant has duly caused this report to be signed on its behalf by the undersigned, thereunto duly authorized. |
| |
| By (Signature and Title): |
| |
| /s/ Janet C. Smith
Janet C. Smith
Principal Accounting Officer
|
| |
| Pursuant to the requirements of the Securities Exchange Act of 1934 and the Investment Company Act of 1940, this report has been signed below by the following persons on behalf of the registrant and in the capacities and on the dates indicated. |
| |
| By (Signature and Title): |
| |
| /s/ Jonathan S. Horwitz
Jonathan S. Horwitz
Principal Executive Officer
|
| |
| By (Signature and Title): |
| |
| /s/ Janet C. Smith
Janet C. Smith
Principal Financial Officer
|